
UNITED STATES
SECURITIES AND EXCHANGE COMMISSION
Washington, D.C. 20549
FORM N-CSRS
CERTIFIED SHAREHOLDER REPORT OF REGISTERED
MANAGEMENT INVESTMENT COMPANIES
Investment Company Act file number: 811-09253
Wells Fargo Funds Trust
(Exact name of registrant as specified in charter)
525 Market St., San Francisco, CA 94105
(Address of principal executive offices) (Zip code)
C. David Messman
Wells Fargo Funds Management, LLC
525 Market St., San Francisco, CA 94105
(Name and address of agent for service)
Registrant’s telephone number, including area code: 800-222-8222
Date of fiscal year end: June 30
Registrant is making a filing for 16 of its series:
Wells Fargo Alternative Strategies Fund, Wells Fargo Global Long/Short Fund, Wells Fargo California Limited-Term Tax-Free Fund, Wells Fargo California Tax-Free Fund, Wells Fargo Colorado Tax-Free Fund, Wells Fargo High Yield Municipal Bond Fund, Wells Fargo Intermediate Tax/AMT-Free Fund, Wells Fargo Minnesota Tax-Free Fund, Wells Fargo Municipal Bond Fund, Wells Fargo North Carolina Tax-Free Fund, Wells Fargo Pennsylvania Tax-Free Fund, Wells Fargo Short-Term Municipal Bond Fund, Wells Fargo Small Cap Core Fund, Wells Fargo Strategic Municipal Bond Fund, Wells Fargo Ultra Short-Term Municipal Income Fund, and Wells Fargo Wisconsin Tax-Free Fund.
Date of reporting period: December 31, 2016
ITEM 1. REPORT TO STOCKHOLDERS
Semi-Annual Report
December 31, 2016

Wells Fargo Alternative Strategies Fund


Reduce clutter. Save trees.
Sign up for electronic delivery of prospectuses and shareholder reports at wellsfargo.com/advantagedelivery
Contents
The views expressed and any forward-looking statements are as of December 31, 2016, unless otherwise noted, and are those of the Fund managers and/or Wells Fargo Funds Management, LLC. Discussions of individual securities, or the markets generally, or any Wells Fargo Fund are not intended as individual recommendations. Future events or results may vary significantly from those expressed in any forward-looking statements. The views expressed are subject to change at any time in response to changing circumstances in the market. Wells Fargo Funds Management, LLC and the Fund disclaim any obligation to publicly update or revise any views expressed or forward-looking statements.
NOT FDIC INSURED ◾ NO BANK GUARANTEE ◾ MAY LOSE VALUE
| | | | |
| 2 | | Wells Fargo Alternative Strategies Fund | | Letter to shareholders (unaudited) |

Andrew Owen
President
Wells Fargo Funds
Stocks drifted somewhat lower in the fall as the U.S. presidential campaign wore on toward the election.
Throughout the period, economic and business data, while sometimes uneven, appeared to be strengthening overall.
Dear Shareholder:
As the new president of Wells Fargo Funds now that Karla Rabusch is retiring from that position after nearly 14 years, I am pleased to offer you this semi-annual report for the Wells Fargo Alternative Strategies Fund for the six-month period that ended December 31, 2016. During much of the period, positive economic data influenced global stock, bond, and commodity markets. Late in the period, stocks in the U.S. moved higher while they drifted lower in most international markets in reaction to the U.S. presidential election, production-cut agreements among Organization of the Petroleum Exporting Countries (OPEC) members intended to support higher oil prices, and an interest-rate increase in December announced by the U.S. Federal Reserve (the Fed). As interest rates increased and sentiment for stock investments—particularly in the U.S.—improved, bond values globally fell.
The surprise Brexit vote rattled markets briefly before stocks rebounded.
A round of investment market volatility and losses followed the U.K. Brexit vote to leave the European Union (E.U.) at the end of June 2016. The equity sell-off proved temporary. During July 2016, better-than-expected corporate earnings, economic data, consumer confidence, and industrial output sent stocks higher.
Stocks drifted somewhat lower in the fall as the U.S. presidential campaign wore on toward the election. At the same time, political circumstances in countries outside of the U.S. challenged investor sentiment. In the U.K., a new prime minister took office following the Brexit vote and began setting the ground rules for the country’s exit from the E.U. In Brazil, the Senate removed the president from office, and the possibility of presidential impeachment emerged in South Korea due to a corruption scandal. The French president lost a primary election and endorsed his rival. An attempted coup in Turkey, continued escalation of conflicts in Syria and Iraq, and North Korea’s testing of nuclear weapons capabilities also caused uncertainty.
Investors sensed improving economic and business data as the period advanced.
Throughout the period, economic and business data, while sometimes uneven, appeared to be strengthening overall. After generating concern early in 2016, China’s economic growth demonstrated strength. The prime minister’s reelection in Japan offered the potential for new economic stimulus. India appointed a new central-bank governor who many expected would continue the outgoing governor’s policies, which were considered effective. OPEC members agreed to production cuts intended to support increased prices for oil, which could benefit commodities markets that are economically important to many international developed and emerging markets. In the U.S., the S&P 500 Index1 recorded a 7.8% return for the six-month period that ended December 31, 2016. Developed international markets, as measured by the Morgan Stanley Capital International (MSCI) All Country World Index (ACWI) ex USA Index (Net),2 ended the period 5.6% higher. Stocks in emerging markets delivered a 4.5% gain for the period, as measured by the MSCI Emerging Markets Index (Net).3
| 1 | The S&P 500 Index consists of 500 stocks chosen for market size, liquidity, and industry group representation. It is a market-value-weighted index with each stock’s weight in the index proportionate to its market value. You cannot invest directly in an index. |
| 2 | The Morgan Stanley Capital International (MSCI) All Country World Index (ACWI) ex USA Index (Net) is a free-float-adjusted market-capitalization-weighted index that is designed to measure the equity market performance of developed markets, excluding the United States and Canada. You cannot invest directly in an index. Source: MSCI. MSCI makes no express or implied warranties or representations and shall have no liability whatsoever with respect to any MSCI data contained herein. The MSCI data may not be further redistributed or used as a basis for other indexes or any securities or financial products. This report is not approved, reviewed, or produced by MSCI. |
| 3 | The Morgan Stanley Capital International (MSCI) Emerging Markets (EM) Index (Net) is a free-float-adjusted market-capitalization-weighted index that is designed to measure the equity market performance of emerging markets. The MSCI EM Index (Net) consists of the following 23 emerging markets country indexes: Brazil, Chile, China, Colombia, Czech Republic, Egypt, Greece, Hungary, India, Indonesia, Korea, Malaysia, Mexico, Peru, the Philippines, Poland, Qatar, Russia, South Africa, Taiwan, Thailand, Turkey, and United Arab Emirates. You cannot invest directly in an index. |
| | | | | | |
| Letter to shareholders (unaudited) | | Wells Fargo Alternative Strategies Fund | | | 3 | |
Fixed-income markets were volatile before the U.S. election and declined postelection.
Global fixed-income markets were volatile during the period, particularly following the U.S. election. Investors appeared to be anticipating U.S. interest-rate increases and waiting for clarity from central-bank policymakers outside of the U.S. When the Fed increased interest rates in December 2016, investors tended to favor equities and high-yield bonds, over investment-grade bonds.
Currency values in several European and Asian countries fell relative to the U.S. dollar during the period, restraining investor interest in foreign bond markets. While the Bloomberg Barclays U.S. Aggregate Bond Index4 lost 2.5% during the period, a 9.3% loss for the Bloomberg Barclays Global Aggregate ex U.S. Dollar Bond Index5 reflected relatively more difficult conditions for bonds outside of the U.S.
Don’t let short-term uncertainty derail long-term investment goals.
Periods of investment uncertainty can present challenges, but experience has taught us that maintaining long-term investment goals can be an effective way to plan for the future. To help you create a sound strategy based on your personal goals and risk tolerance, Wells Fargo Funds offers more than 100 mutual funds spanning a wide range of asset classes and investment styles. Although diversification cannot guarantee an investment profit or prevent losses, we believe it can be an effective way to manage investment risk and potentially smooth out overall portfolio performance. We encourage investors to know their investments and to understand that appropriate levels of risk-taking may unlock opportunities.
Thank you for choosing to invest with Wells Fargo Funds. We appreciate your confidence in us and remain committed to helping you meet your financial needs.
Sincerely,

Andrew Owen
President
Wells Fargo Funds
For further information about your Fund, contact your investment professional, visit our website at wellsfargofunds.com, or call us directly at 1-800-222-8222. We are available 24 hours a day, 7 days a week.
| 4 | The Bloomberg Barclays U.S. Aggregate Bond Index (formerly known as Barclays U.S. Aggregate Bond Index) is a broad-based benchmark that measures the investment-grade, U.S. dollar–denominated, fixed-rate taxable bond market, including Treasuries, government-related and corporate securities, mortgage-backed securities (agency fixed-rate and hybrid adjustable-rate mortgage pass-throughs), asset-backed securities, and commercial mortgage-backed securities. You cannot invest directly in an index. |
| 5 | The Bloomberg Barclays Global Aggregate ex U.S. Dollar Bond Index (formerly known as Barclays Global Aggregate ex U.S. Dollar Bond Index) tracks an international basket of government, corporate, agency, and mortgage-related bonds. You cannot invest directly in an index. |
| | | | |
| 4 | | Wells Fargo Alternative Strategies Fund | | Performance highlights (unaudited) |
Investment objective
The Fund seeks long-term capital appreciation.
Manager
Wells Fargo Funds Management, LLC
Subadvisers
The Rock Creek Group, LP
Chilton Investment Company, LLC
Ellington Global Asset Management Corporation
Mellon Capital Management Corporation
Passport Capital, LLC
Pine River Capital Management L.P.
River Canyon Fund Management LLC
Sirios Capital Management, L.P.
Wellington Management Company LLP
Portfolio managers
Joseph Bishop
John F. Brennan, Jr.
John Burbank
Richard L. Chilton, Jr.
Vassilis Dagioglu
George Jikovski
Robert Kinderman
Sudhir Krisnamurthi
Kenneth LaPlace
Soon Pho
Kent M. Stahl, CFA®
James Stavena
Gregg R. Thomas, CFA®
Ronald van der Wouden
Torrey Zaches
Aaron Zimmerman
Average annual total returns (%) as of December 31, 2016
| | | | | | | | | | | | | | | | | | | | | | | | | | |
| | | | | Including sales charge | | | Excluding sales charge | | | Expense ratios1 (%) | |
| | | Inception date | | 1 year | | | Since inception | | | 1 year | | | Since inception | | | Gross | | | Net2 | |
| Class A (WALTX) | | 4-30-2014 | | | (8.29 | ) | | | (1.14 | ) | | | (2.73 | ) | | | 1.08 | | | | 3.46 | | | | 3.05 | |
| Class C (WACTX) | | 4-30-2014 | | | (4.46 | ) | | | 0.32 | | | | (3.46 | ) | | | 0.32 | | | | 4.21 | | | | 3.80 | |
| Administrator Class (WADTX) | | 4-30-2014 | | | – | | | | – | | | | (1.95 | ) | | | 1.45 | | | | 3.38 | | | | 2.90 | |
| Institutional Class (WAITX) | | 4-30-2014 | | | – | | | | – | | | | (2.43 | ) | | | 1.34 | | | | 3.13 | | | | 2.80 | |
| Bloomberg Barclays U.S. Aggregate Bond Index3 | | – | | | – | | | | – | | | | 2.65 | | | | 2.38 | | | | – | | | | – | |
| HFRI Fund of Funds Composite Index4 | | – | | | – | | | | – | | | | 0.48 | | | | 1.36 | | | | – | | | | – | |
Figures quoted represent past performance, which is no guarantee of future results, and do not reflect taxes that a shareholder may pay on fund distributions or the redemption of fund shares. Investment return and principal value of an investment will fluctuate so that an investor’s shares, when redeemed, may be worth more or less than their original cost. Performance shown without sales charges would be lower if sales charges were reflected. Current performance may be lower or higher than the performance data quoted, which assumes the reinvestment of dividends and capital gains. Current month-end performance is available on the Fund’s website, wellsfargofunds.com.
Index returns do not include transaction costs associated with buying and selling securities, any mutual fund fees or expenses, or any taxes. It is not possible to invest directly in an index.
For Class A shares, the maximum front-end sales charge is 5.75%. For Class C shares, the maximum contingent deferred sales charge is 1.00%. Performance including a contingent deferred sales charge assumes the sales charge for the corresponding time period. Administrator Class and Institutional Class shares are sold without a front-end sales charge or contingent deferred sales charge.
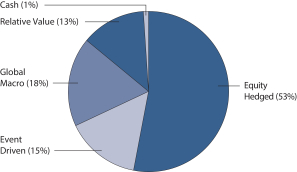
The Fund does not invest directly in hedge funds but pursues similar strategies to those typically used by hedge funds. The Fund invests using alternative investment strategies such as equity hedged, event driven, global macro, and relative value, which are speculative and entail a high degree of risk. Stock values fluctuate in response to the activities of individual companies and general market and economic conditions. Bond values fluctuate in response to the financial condition of individual issuers, general market and economic conditions, and changes in interest rates. Changes in market conditions and government policies may lead to periods of heightened volatility in the bond market and reduced liquidity for certain bonds held by the Fund. In general, when interest rates rise, bond values fall and investors may lose principal value. Interest-rate changes and their impact on the Fund and its share price can be sudden and unpredictable. Foreign investments are especially volatile and can rise or fall dramatically due to differences in the political and economic conditions of the host country. These risks are generally intensified in emerging markets. The use of derivatives may reduce returns and/or increase volatility. Borrowing money to purchase securities or cover short positions magnifies losses and incurs expenses. Short selling is generally considered speculative, has the potential for unlimited loss, and may involve leverage. Certain investment strategies tend to increase the total risk of an investment (relative to the broader market). Securities issued by U.S. government agencies or government-sponsored entities may not be guaranteed by the U.S. Treasury. The Fund is exposed to high-yield securities risk, mortgage- and asset-backed securities risk, convertible securities risk, loan risk, regulatory risk, and smaller-company securities risk. Consult a Fund’s prospectus for additional information on these and other risks.
Please see footnotes on page 6.
| | | | | | |
| Performance highlights (unaudited) | | Wells Fargo Alternative Strategies Fund | | | 5 | |
| | | | |
| Top ten long positions (%) as of December 31, 20165 | |
AQR Managed Futures Strategy Fund Class I | | | 5.10 | |
The Sherwin-Williams Company | | | 1.81 | |
Halliburton Company | | | 1.36 | |
The Home Depot Incorporated | | | 1.25 | |
Microsoft Corporation | | | 1.20 | |
Yahoo! Incorporated | | | 1.13 | |
Credit-Based Asset Servicing and Securitization LLC Series 07-CB4 Class A1B, 0.71%, 4-25-2037 | | | 1.08 | |
Carrington Mortgage Loan Trust Series 06-NC4 Class A3, 0.75%, 10-25-2036 | | | 1.07 | |
HSBC Bank plc (Alinma AB) | | | 0.94 | |
Western Digital Corporation | | | 0.94 | |
| | | | |
| Top ten short positions (%) as of December 31, 20165 | |
SPDR S&P 500 ETF | | | (4.46) | |
Consumer Staples Select Sector SPDR Fund ETF | | | (1.21) | |
Schlumberger Limited | | | (0.91) | |
National Oilwell Varco Incorporated | | | (0.73) | |
iShares MSCI Emerging Markets ETF | | | (0.71) | |
Corning Incorporated | | | (0.67) | |
Infosys Limited ADR | | | (0.65) | |
Occidental Petroleum Corporation | | | (0.64) | |
Electronic Arts Incorporated | | | (0.62) | |
Toyota Motor Corporation ADR | | | (0.61) | |
| | | | | | | | |
| Sector allocation as of December 31, 20166 | |
| | | Gross exposure(%) | | | Net exposure(%) | |
Consumer Discretionary | | | 13 | | | | 16 | |
Consumer Staples | | | 8 | | | | 10 | |
Energy | | | 8 | | | | 5 | |
Financials | | | 11 | | | | 15 | |
Health Care | | | 8 | | | | 11 | |
Industrials | | | 10 | | | | 9 | |
Information Technology | | | 15 | | | | 13 | |
Materials | | | 7 | | | | 10 | |
Real Estate | | | 1 | | | | 1 | |
Telecommunication Services | | | 2 | | | | 3 | |
Utilities | | | 1 | | | | 1 | |
Other | | | 16 | | | | 6 | |
| | | | 100 | | | | 100 | |
|
| Strategy allocation as of December 31, 20167 |
|
 |
Please see footnotes on page 6.
| | | | |
| 6 | | Wells Fargo Alternative Strategies Fund | | Performance highlights (unaudited) |
| 1 | Reflects the expense ratios as stated in the most recent prospectuses, which include the impact of 0.12% in acquired fund fees and expenses and 0.81% in dividend expense on securities sold short and prime broker fees. The expense ratios shown are subject to change and may differ from the annualized expense ratios shown in the financial highlights of this report, which do not include acquired fund fees and expenses. |
| 2 | The manager has contractually committed through October 31, 2017, to waive fees and/or reimburse expenses to the extent necessary to cap the Fund’s Total Annual Fund Operating Expenses After Fee Waiver at 2.22% for Class A, 2.97% for Class C, 2.07% for Administrator Class, and 1.97% for Institutional Class. After this time, the cap may be increased or the commitment to maintain the cap may be terminated only with the approval of the Board of Trustees. Brokerage commissions, stamp duty fees, interest, taxes, acquired fund fees and expenses, prime broker fees, dividend and interest expenses on securities sold short, and extraordinary expenses are excluded from the expense cap. Acquired fund fees and expenses incurred by investments made by The Rock Creek Group, LP, a subadviser of the Fund, are included in the expense cap. Without this cap, the Fund’s returns would have been lower. |
| 3 | The Bloomberg Barclays U.S. Aggregate Bond Index (formerly known as Barclays U.S. Aggregate Bond Index) is a broad-based benchmark that measures the investment-grade, U.S. dollar–denominated, fixed-rate taxable bond market, including Treasuries, government-related and corporate securities, mortgage-backed securities (agency fixed-rate and hybrid adjustable-rate mortgage pass-throughs), asset-backed securities, and commercial mortgage-backed securities. You cannot invest directly in an index. |
| 4 | The Hedge Fund Research Incorporated (HFRI) Fund of Funds Composite Index is a global, equally-weighted index of hedge funds that invest with multiple managers in a broad range of strategies. You cannot invest directly in an index. |
| 5 | The ten largest long and short position holdings, excluding cash and cash equivalents, are calculated based on the value of the investments divided by total net assets of the Fund. Holdings are subject to change and may have changed since the date specified. |
| 6 | The chart shows the percentage of Fund holdings within a particular sector that was held long (securities owned by the Fund) or sold short (sale of borrowed securities). Gross exposure is the absolute value of the long positions and short positions combined. Net exposure is the percentage of long positions minus the percentage of positions sold short. |
| 7 | Strategy allocation is calculated based on the market value of total investments. Cash shown is the sweep cash position of the Fund, and excludes any cash or cash equivalents that may be pledged as collateral for other investments of the Fund. Strategy allocation is subject to change and may have changed since the date specified. |
| | | | | | |
| Fund expenses (unaudited) | | Wells Fargo Alternative Strategies Fund | | | 7 | |
As a shareholder of the Fund, you incur two types of costs: (1) transaction costs, including sales charges (loads) on purchase payments and contingent deferred sales charges (if any) on redemptions and (2) ongoing costs, including management fees, distribution (12b-1) and/or shareholder servicing fees, and other Fund expenses. This example is intended to help you understand your ongoing costs (in dollars) of investing in the Fund and to compare these costs with the ongoing costs of investing in other mutual funds.
The example is based on an investment of $1,000 invested at the beginning of the six-month period and held for the entire period from July 1, 2016 to December 31, 2016.
Actual expenses
The “Actual” line of the table below provides information about actual account values and actual expenses. You may use the information in this line, together with the amount you invested, to estimate the expenses that you paid over the period. Simply divide your account value by $1,000 (for example, an $8,600 account value divided by $1,000 = 8.6), then multiply the result by the number in the “Actual” line under the heading entitled “Expenses paid during period” for your applicable class of shares to estimate the expenses you paid on your account during this period.
Hypothetical example for comparison purposes
The “Hypothetical” line of the table below provides information about hypothetical account values and hypothetical expenses based on the Fund’s actual expense ratio and an assumed rate of return of 5% per year before expenses, which is not the Fund’s actual return. The hypothetical account values and expenses may not be used to estimate the actual ending account balance or expenses you paid for the period. You may use this information to compare the ongoing costs of investing in the Fund and other funds. To do so, compare this 5% hypothetical example with the 5% hypothetical examples that appear in the shareholder reports of the other funds.
Please note that the expenses shown in the table are meant to highlight your ongoing costs only and do not reflect any transactional costs, such as sales charges (loads) and contingent deferred sales charges. Therefore, the “Hypothetical” line of the table is useful in comparing ongoing costs only and will not help you determine the relative total costs of owning different funds. In addition, if these transactional costs were included, your costs would have been higher.
| | | | | | | | | | | | | | | | |
| | | Beginning
account value
7-1-2016 | | | Ending
account value
12-31-2016 | | | Expenses
paid during
the period¹ | | | Annualized net
expense ratio | |
Class A | | | | | | | | | | | | | | | | |
Actual | | $ | 1,000.00 | | | $ | 1,025.00 | | | $ | 14.56 | | | | 2.86 | % |
Hypothetical (5% return before expenses) | | $ | 1,000.00 | | | $ | 1,010.76 | | | $ | 14.46 | | | | 2.86 | % |
Class C | | | | | | | | | | | | | | | | |
Actual | | $ | 1,000.00 | | | $ | 1,026.70 | | | $ | 18.34 | | | | 3.60 | % |
Hypothetical (5% return before expenses) | | $ | 1,000.00 | | | $ | 1,007.40 | | | $ | 18.16 | | | | 3.60 | % |
Administrator Class | | | | | | | | | | | | | | | | |
Actual | | $ | 1,000.00 | | | $ | 1,021.40 | | | $ | 13.36 | | | | 2.63 | % |
Hypothetical (5% return before expenses) | | $ | 1,000.00 | | | $ | 1,011.91 | | | $ | 13.30 | | | | 2.63 | % |
Institutional Class | | | | | | | | | | | | | | | | |
Actual | | $ | 1,000.00 | | | $ | 1,020.40 | | | $ | 13.36 | | | | 2.63 | % |
Hypothetical (5% return before expenses) | | $ | 1,000.00 | | | $ | 1,011.91 | | | $ | 13.30 | | | | 2.63 | % |
| 1 | Expenses paid is equal to the annualized net expense ratio of each class multiplied by the average account value over the period, multiplied by the number of days in the most recent fiscal half-year divided by the number of days in the fiscal year (to reflect the one-half-year period). |
| | | | |
| 8 | | Wells Fargo Alternative Strategies Fund | | Portfolio of investments—December 31, 2016 (unaudited) |
| | | | | | | | | | | | | | | | |
| Security name | | | | | | | | Shares | | | Value | |
| | | | |
Common Stocks: 57.10% | | | | | | | | | | | | | | | | |
| | | | |
Consumer Discretionary: 9.12% | | | | | | | | | | | | | | | | |
| | | | |
| Auto Components: 0.12% | | | | | | | | | | | | | | | | |
Bridgestone Corporation | | | | | | | | | | | 1,030 | | | $ | 37,137 | |
Delphi Automotive plc | | | | | | | | | | | 345 | | | | 23,236 | |
Nifco Incorporated | | | | | | | | | | | 282 | | | | 14,887 | |
Stanley Electric Company Limited | | | | | | | | | | | 739 | | | | 20,202 | |
Tokai Rika Company Limited | | | | | | | | | | | 1,190 | | | | 23,876 | |
Toyo Tire & Rubber Company Limited | | | | | | | | | | | 4,768 | | | | 59,358 | |
Toyota Boshoku Corporation | | | | | | | | | | | 433 | | | | 9,955 | |
Toyota Industries Corporation | | | | | | | | | | | 870 | | | | 41,462 | |
TS Tech Company Limited | | | | | | | | | | | 910 | | | | 23,436 | |
| | | | |
| | | | | | | | | | | | | | | 253,549 | |
| | | | | | | | | | | | | | | | |
| | | | |
| Automobiles: 0.11% | | | | | | | | | | | | | | | | |
Chongqing Changchun Automobile Class B | | | | | | | | | | | 34,665 | | | | 49,576 | |
Fuji Heavy Industries Limited | | | | | | | | | | | 1,815 | | | | 74,106 | |
Isuzu Motors Limited | | | | | | | | | | | 2,535 | | | | 32,123 | |
Mazda Motor Corporation | | | | | | | | | | | 1,105 | | | | 18,077 | |
Renault SA | | | | | | | | | | | 365 | | | | 32,470 | |
Suzuki Motor Corporation | | | | | | | | | | | 700 | | | | 24,640 | |
| | | | |
| | | | | | | | | | | | | | | 230,992 | |
| | | | | | | | | | | | | | | | |
| | | | |
| Distributors: 0.01% | | | | | | | | | | | | | | | | |
Paltac Corporation | | | | | | | | | | | 800 | | | | 18,906 | |
| | | | | | | | | | | | | | | | |
| | | | |
| Diversified Consumer Services: 0.13% | | | | | | | | | | | | | | | | |
Kroton Educacional SA | | | | | | | | | | | 15,148 | | | | 62,040 | |
New Oriental Education & Technology Group Incorporated † | | | | | | | | | | | 1,482 | | | | 62,392 | |
Service Corporation International | | | | | | | | | | | 5,452 | | | | 154,837 | |
| | | | |
| | | | | | | | | | | | | | | 279,269 | |
| | | | | | | | | | | | | | | | |
| | | | |
| Hotels, Restaurants & Leisure: 1.72% | | | | | | | | | | | | | | | | |
Caesars Acquisition Company Class A † | | | | | | | | | | | 2,045 | | �� | | 27,608 | |
Caesars Entertainment Corporation † | | | | | | | | | | | 2,571 | | | | 21,854 | |
Chipotle Mexican Grill Incorporated † | | | | | | | | | | | 185 | | | | 69,804 | |
ClubCorp Holdings Incorporated | | | | | | | | | | | 5,171 | | | | 74,204 | |
Compass Group plc | | | | | | | | | | | 3,780 | | | | 69,924 | |
Domino’s Pizza Group plc | | | | | | | | | | | 7,758 | | | | 34,496 | |
Domino’s Pizza Incorporated | | | | | | | | | | | 2,914 | | | | 464,025 | |
Dunkin Brands Group Incorporated (b) | | | | | | | | | | | 9,074 | | | | 475,841 | |
Genting Singapore plc | | | | | | | | | | | 44,270 | | | | 27,666 | |
H.I.S. Company Limited | | | | | | | | | | | 1,816 | | | | 47,779 | |
Hilton Worldwide Holdings Incorporated | | | | | | | | | | | 2,687 | | | | 73,086 | |
Hyatt Hotels Corporation Class A † | | | | | | | | | | | 1,225 | | | | 67,694 | |
Ladbrokes Coral Group plc | | | | | | | | | | | 14,410 | | | | 20,600 | |
Las Vegas Sands Corporation | | | | | | | | | | | 2,006 | | | | 107,140 | |
Mandarin Oriental International Limited | | | | | | | | | | | 20,185 | | | | 25,736 | |
McDonald’s Corporation (b) | | | | | | | | | | | 5,790 | | | | 704,759 | |
The accompanying notes are an integral part of these financial statements.
| | | | | | |
| Portfolio of investments—December 31, 2016 (unaudited) | | Wells Fargo Alternative Strategies Fund | | | 9 | |
| | | | | | | | | | | | | | | | |
| Security name | | | | | | | | Shares | | | Value | |
| | | | |
| Hotels, Restaurants & Leisure (continued) | | | | | | | | | | | | | | | | |
MGM Resorts International †(b) | | | | | | | | | | | 27,619 | | | $ | 796,256 | |
OPAP SA | | | | | | | | | | | 6,698 | | | | 59,225 | |
Panera Bread Company Class A † | | | | | | | | | | | 336 | | | | 68,910 | |
Sands China Limited | | | | | | | | | | | 5,870 | | | | 25,510 | |
Tosho Company Limited | | | | | | | | | | | 227 | | | | 10,449 | |
TUI AG | | | | | | | | | | | 4,085 | | | | 57,256 | |
Yum! Brands Incorporated | | | | | | | | | | | 6,790 | | | | 430,011 | |
| | | | |
| | | | | | | | | | | | | | | 3,759,833 | |
| | | | | | | | | | | | | | | | |
| | | | |
| Household Durables: 0.38% | | | | | | | | | | | | | | | | |
Alpine Electronics Incorporated | | | | | | | | | | | 1,370 | | | | 17,852 | |
Cairn Homes plc † | | | | | | | | | | | 120,679 | | | | 171,494 | |
Casio Computer Company Limited | | | | | | | | | | | 1,280 | | | | 18,103 | |
Panahome Corporation | | | | | | | | | | | 2,625 | | | | 21,247 | |
Sekisui Chemical Company Limited | | | | | | | | | | | 2,187 | | | | 34,880 | |
Whirlpool Corporation | | | | | | | | | | | 3,063 | | | | 556,762 | |
| | | | |
| | | | | | | | | | | | | | | 820,338 | |
| | | | | | | | | | | | | | | | |
| | | | |
| Internet & Direct Marketing Retail: 0.45% | | | | | | | | | | | | | | | | |
Amazon.com Incorporated † | | | | | | | | | | | 62 | | | | 46,492 | |
Netflix Incorporated † | | | | | | | | | | | 1,086 | | | | 134,447 | |
Qliro Group AB † | | | | | | | | | | | 11,366 | | | | 10,791 | |
Start Today Company Limited | | | | | | | | | | | 1,604 | | | | 27,709 | |
The Priceline Group Incorporated † | | | | | | | | | | | 49 | | | | 71,837 | |
Wayfair Incorporated Class A † | | | | | | | | | | | 19,457 | | | | 681,968 | |
| | | | |
| | | | | | | | | | | | | | | 973,244 | |
| | | | | | | | | | | | | | | | |
| | | | |
| Leisure Products: 0.04% | | | | | | | | | | | | | | | | |
Bandai Namco Holdings Incorporated | | | | | | | | | | | 700 | | | | 19,316 | |
Sankyo Company Limited | | | | | | | | | | | 627 | | | | 20,252 | |
Sega Sammy Holdings Incorporated | | | | | | | | | | | 2,635 | | | | 39,207 | |
Yamaha Corporation | | | | | | | | | | | 629 | | | | 19,213 | |
| | | | |
| | | | | | | | | | | | | | | 97,988 | |
| | | | | | | | | | | | | | | | |
| | | | |
| Media: 2.83% | | | | | | | | | | | | | | | | |
Clear Channel Outdoor Holdings Incorporated Class A | | | | | | | | | | | 3,388 | | | | 17,109 | |
Comcast Corporation Class A (b) | | | | | | | | | | | 20,877 | | | | 1,441,557 | |
Discovery Communications Incorporated Class A †(b) | | | | | | | | | | | 14,318 | | | | 392,456 | |
DISH Network Corporation Class A †(b) | | | | | | | | | | | 15,428 | | | | 893,744 | |
Grupo Televisa SA | | | | | | | | | | | 6,950 | | | | 28,987 | |
M6 Metropole Television SA | | | | | | | | | | | 1,535 | | | | 28,552 | |
Nippon Television Network Corporation (b) | | | | | | | | | | | 4,395 | | | | 79,796 | |
Septeni Holdings Company Limited | | | | | | | | | | | 6,005 | | | | 20,552 | |
SES SA | | | | | | | | | | | 8,393 | | | | 184,870 | |
Societe Television Francaise 1 SA | | | | | | | | | | | 5,387 | | | | 53,593 | |
The Walt Disney Company | | | | | | | | | | | 10,664 | | | | 1,111,402 | |
Time Warner Incorporated (b) | | | | | | | | | | | 18,953 | | | | 1,829,533 | |
TV Asahi Corporation | | | | | | | | | | | 1,375 | | | | 27,165 | |
Wolters Kluwer NV | | | | | | | | | | | 1,580 | | | | 57,247 | |
| | | | |
| | | | | | | | | | | | | | | 6,166,563 | |
| | | | | | | | | | | | | | | | |
The accompanying notes are an integral part of these financial statements.
| | | | |
| 10 | | Wells Fargo Alternative Strategies Fund | | Portfolio of investments—December 31, 2016 (unaudited) |
| | | | | | | | | | | | | | | | |
| Security name | | | | | | | | Shares | | | Value | |
| | | | |
| Multiline Retail: 0.02% | | | | | | | | | | | | | | | | |
Marks & Spencer Group plc | | | | | | | | | | | 9,356 | | | $ | 40,356 | |
Seria Company Limited | | | | | | | | | | | 235 | | | | 15,985 | |
| | | | |
| | | | | | | | | | | | | | | 56,341 | |
| | | | | | | | | | | | | | | | |
| | | | |
| Specialty Retail: 3.07% | | | | | | | | | | | | | | | | |
Advance Auto Parts Incorporated | | | | | | | | | | | 639 | | | | 108,068 | |
Aoyama Trading Company Limited | | | | | | | | | | | 1,025 | | | | 35,694 | |
AutoNation Incorporated † | | | | | | | | | | | 28,343 | | | | 1,378,887 | |
AutoZone Incorporated † | | | | | | | | | | | 1,555 | | | | 1,228,123 | |
CarMax Incorporated †(b) | | | | | | | | | | | 6,043 | | | | 389,109 | |
Halfords Group plc | | | | | | | | | | | 2,081 | | | | 9,374 | |
Hikari Tsushin Incorporated | | | | | | | | | | | 292 | | | | 27,208 | |
Joyful Honda Company Limited | | | | | | | | | | | 798 | | | | 21,454 | |
Lowe’s Companies Incorporated | | | | | | | | | | | 9,348 | | | | 664,830 | |
Shimamura Company Limited | | | | | | | | | | | 266 | | | | 33,206 | |
The Home Depot Incorporated (b) | | | | | | | | | | | 20,388 | | | | 2,733,624 | |
The TJX Companies Incorporated | | | | | | | | | | | 1,015 | | | | 76,257 | |
| | | | |
| | | | | | | | | | | | | | | 6,705,834 | |
| | | | | | | | | | | | | | | | |
| | | | |
| Textiles, Apparel & Luxury Goods: 0.24% | | | | | | | | | | | | | | | | |
Brunello Cucinelli SpA | | | | | | | | | | | 1,122 | | | | 24,023 | |
Crocs Incorporated † | | | | | | | | | | | 6,021 | | | | 41,304 | |
Deckers Outdoor Corporation † | | | | | | | | | | | 3,366 | | | | 186,443 | |
Geox SpA | | | | | | | | | | | 12,157 | | | | 28,282 | |
Global Brands Group Holding Limited † | | | | | | | | | | | 202,335 | | | | 26,875 | |
Nike Incorporated Class B | | | | | | | | | | | 3,234 | | | | 164,384 | |
Ralph Lauren Corporation | | | | | | | | | | | 280 | | | | 25,290 | |
VF Corporation | | | | | | | | | | | 685 | | | | 36,545 | |
| | | | |
| | | | | | | | | | | | | | | 533,146 | |
| | | | | | | | | | | | | | | | |
| | | | |
Consumer Staples: 5.63% | | | | | | | | | | | | | | | | |
| | | | |
| Beverages: 2.43% | | | | | | | | | | | | | | | | |
Asahi Breweries Limited | | | | | | | | | | | 720 | | | | 22,732 | |
Brown-Forman Corporation Class B | | | | | | | | | | | 15,190 | | | | 682,335 | |
C&C Group plc | | | | | | | | | | | 11,345 | | | | 45,978 | |
Coca-Cola HBC AG | | | | | | | | | | | 1,453 | | | | 31,695 | |
Constellation Brands Incorporated Class A | | | | | | | | | | | 11,648 | | | | 1,785,755 | |
Davide Campari-Milano SpA | | | | | | | | | | | 59,951 | | | | 586,268 | |
Diageo plc | | | | | | | | | | | 3,780 | | | | 98,294 | |
Heineken NV | | | | | | | | | | | 5,187 | | | | 389,087 | |
Molson Coors Brewing Company Class B | | | | | | | | | | | 14,027 | | | | 1,364,967 | |
Monster Beverage Corporation † | | | | | | | | | | | 1,817 | | | | 80,566 | |
PepsiCo Incorporated | | | | | | | | | | | 671 | | | | 70,207 | |
The Coca-Cola Company | | | | | | | | | | | 2,243 | | | | 92,995 | |
Vina Concha y Toro SA | | | | | | | | | | | 10,435 | | | | 16,748 | |
Yantai Changyu Pioneer Wine Company Limited Class B | | | | | | | | | | | 12,800 | | | | 34,251 | |
| | | | |
| | | | | | | | | | | | | | | 5,301,878 | |
| | | | | | | | | | | | | | | | |
The accompanying notes are an integral part of these financial statements.
| | | | | | |
| Portfolio of investments—December 31, 2016 (unaudited) | | Wells Fargo Alternative Strategies Fund | | | 11 | |
| | | | | | | | | | | | | | | | |
| Security name | | | | | | | | Shares | | | Value | |
| | | | |
| Food & Staples Retailing: 1.52% | | | | | | | | | | | | | | | | |
Casey’s General Stores Incorporated | | | | | | | | | | | 9,792 | | | $ | 1,164,073 | |
Costco Wholesale Corporation | | | | | | | | | | | 8,795 | | | | 1,408,167 | |
J Sainsbury plc | | | | | | | | | | | 25,442 | | | | 78,167 | |
Metro AG | | | | | | | | | | | 1,766 | | | | 58,716 | |
The Kroger Company (b) | | | | | | | | | | | 14,505 | | | | 500,568 | |
Walgreens Boots Alliance Incorporated | | | | | | | | | | | 880 | | | | 72,829 | |
Welcia Holdings Company | | | | | | | | | | | 393 | | | | 24,009 | |
| | | | |
| | | | | | | | | | | | | | | 3,306,529 | |
| | | | | | | | | | | | | | | | |
| | | | |
| Food Products: 1.25% | | | | | | | | | | | | | | | | |
Chocoladefabriken Lindt & Sprungli AG | | | | | | | | | | | 20 | | | | 1,215,752 | |
CJ Cheiljedang Corporation | | | | | | | | | | | 117 | | | | 34,631 | |
Mondelez International Incorporated Class A | | | | | | | | | | | 848 | | | | 37,592 | |
Morinaga & Company Limited | | | | | | | | | | | 725 | | | | 30,241 | |
Nestle SA | | | | | | | | | | | 12,395 | | | | 889,183 | |
The Hershey Company | | | | | | | | | | | 5,066 | | | | 523,976 | |
| | | | |
| | | | | | | | | | | | | | | 2,731,375 | |
| | | | | | | | | | | | | | | | |
| | | | |
| Household Products: 0.12% | | | | | | | | | | | | | | | | |
Colgate-Palmolive Company | | | | | | | | | | | 1,893 | | | | 123,878 | |
Lion Corporation | | | | | | | | | | | 1,909 | | | | 31,361 | |
Reckitt Benckiser Group plc | | | | | | | | | | | 849 | | | | 72,049 | |
The Procter & Gamble Company | | | | | | | | | | | 503 | | | | 42,292 | |
| | | | |
| | | | | | | | | | | | | | | 269,580 | |
| | | | | | | | | | | | | | | | |
| | | | |
| Personal Products: 0.08% | | | | | | | | | | | | | | | | |
Coty Incorporated Class A | | | | | | | | | | | 3,717 | | | | 68,058 | |
Unilever NV ADR | | | | | | | | | | | 2,338 | | | | 95,998 | |
| | | | |
| | | | | | | | | | | | | | | 164,056 | |
| | | | | | | | | | | | | | | | |
| | | | |
| Tobacco: 0.23% | | | | | | | | | | | | | | | | |
Altria Group Incorporated | | | | | | | | | | | 272 | | | | 18,393 | |
British American Tobacco plc | | | | | | | | | | | 1,079 | | | | 61,455 | |
Japan Tobacco Incorporated | | | | | | | | | | | 775 | | | | 25,490 | |
Reynolds American Incorporated (b) | | | | | | | | | | | 6,924 | | | | 388,021 | |
| | | | |
| | | | | | | | | | | | | | | 493,359 | |
| | | | | | | | | | | | | | | | |
| | | | |
Energy: 5.87% | | | | | | | | | | | | | | | | |
| | | | |
| Energy Equipment & Services: 1.47% | | | | | | | | | | | | | | | | |
Baker Hughes Incorporated | | | | | | | | | | | 2,056 | | | | 133,578 | |
Ensco plc Class A | | | | | | | | | | | 2,631 | | | | 25,573 | |
Halliburton Company (b) | | | | | | | | | | | 54,746 | | | | 2,961,212 | |
Helmerich & Payne Incorporated | | | | | | | | | | | 348 | | | | 26,935 | |
Hilong Holding Limited | | | | | | | | | | | 93,995 | | | | 27,273 | |
Saipem SpA † | | | | | | | | | | | 38,534 | | | | 21,701 | |
Trican Well Service Limited † | | | | | | | | | | | 3,690 | | | | 12,642 | |
| | | | |
| | | | | | | | | | | | | | | 3,208,914 | |
| | | | | | | | | | | | | | | | |
The accompanying notes are an integral part of these financial statements.
| | | | |
| 12 | | Wells Fargo Alternative Strategies Fund | | Portfolio of investments—December 31, 2016 (unaudited) |
| | | | | | | | | | | | | | | | |
| Security name | | | | | | | | Shares | | | Value | |
| | | | |
| Oil, Gas & Consumable Fuels: 4.40% | | | | | | | | | | | | | | | | |
Anadarko Petroleum Corporation | | | | | | | | | | | 19,826 | | | $ | 1,382,467 | |
BP plc | | | | | | | | | | | 25,879 | | | | 162,528 | |
Cabot Oil & Gas Corporation | | | | | | | | | | | 976 | | | | 22,799 | |
Canadian Natural Resources Limited | | | | | | | | | | | 8,891 | | | | 283,445 | |
Cobalt International Energy Incorporated † | | | | | | | | | | | 2,942 | | | | 3,589 | |
Concho Resources Incorporated †(b) | | | | | | | | | | | 8,483 | | | | 1,124,845 | |
Continental Resources Incorporated † | | | | | | | | | | | 11,645 | | | | 600,183 | |
Devon Energy Corporation (b) | | | | | | | | | | | 12,523 | | | | 571,925 | |
Diamondback Energy Incorporated † | | | | | | | | | | | 323 | | | | 32,642 | |
Eni SpA | | | | | | | | | | | 8,200 | | | | 133,533 | |
EOG Resources Incorporated | | | | | | | | | | | 858 | | | | 86,744 | |
Exxon Mobil Corporation | | | | | | | | | | | 6,520 | | | | 588,495 | |
Hess Corporation | | | | | | | | | | | 338 | | | | 21,054 | |
Imperial Oil Limited | | | | | | | | | | | 1,995 | | | | 69,405 | |
Japan Petroleum Exploration Company | | | | | | | | | | | 1,140 | | | | 25,351 | |
Kinder Morgan Incorporated | | | | | | | | | | | 78,138 | | | | 1,618,238 | |
Marathon Oil Corporation | | | | | | | | | | | 1,081 | | | | 18,712 | |
Newfield Exploration Company † | | | | | | | | | | | 364 | | | | 14,742 | |
Nippon Gas Company Limited | | | | | | | | | | | 580 | | | | 16,674 | |
Parsley Energy Incorporated Class A †(b) | | | | | | | | | | | 23,543 | | | | 829,655 | |
Petroleo Brasileiro SA ADR † | | | | | | | | | | | 3,200 | | | | 32,352 | |
Pioneer Natural Resources Company (b) | | | | | | | | | | | 7,585 | | | | 1,365,831 | |
Plains All American Pipeline LP | | | | | | | | | | | 8,143 | | | | 262,937 | |
Royal Dutch Shell plc Class B | | | | | | | | | | | 3,957 | | | | 114,795 | |
Southwestern Energy Company † | | | | | | | | | | | 1,547 | | | | 16,739 | |
Statoil ASA | | | | | | | | | | | 1,748 | | | | 32,064 | |
Total SA | | | | | | | | | | | 2,934 | | | | 150,471 | |
TransCanada Corporation | | | | | | | | | | | 185 | | | | 8,342 | |
| | | | |
| | | | | | | | | | | | | | | 9,590,557 | |
| | | | | | | | | | | | | | | | |
| | | | |
Financials: 6.26% | | | | | | | | | | | | | | | | |
| | | | |
| Banks: 3.44% | | | | | | | | | | | | | | | | |
Banca Popolare dell’Emilia Romagna Scarl | | | | | | | | | | | 10,071 | | | | 53,642 | |
Banco Popular Espanol SA | | | | | | | | | | | 39,508 | | | | 38,178 | |
Bank of America Corporation | | | | | | | | | | | 71,544 | | | | 1,581,122 | |
Bank of Ireland † | | | | | | | | | | | 164,800 | | | | 40,594 | |
Bank of Nova Scotia | | | | | | | | | | | 779 | | | | 43,375 | |
Bank of the Ozarks Incorporated (b) | | | | | | | | | | | 10,475 | | | | 550,880 | |
BNP Paribas SA | | | | | | | | | | | 3,658 | | | | 233,154 | |
CaixaBank SA | | | | | | | | | | | 30,420 | | | | 100,548 | |
Citigroup Incorporated | | | | | | | | | | | 4,015 | | | | 238,611 | |
Citizens Financial Group Incorporated | | | | | | | | | | | 1,272 | | | | 45,321 | |
DBS Group Holdings Limited | | | | | | | | | | | 1,235 | | | | 14,788 | |
Eurobank Ergasias SA † | | | | | | | | | | | 16,233 | | | | 11,022 | |
FinecoBank SpA | | | | | | | | | | | 10,494 | | | | 58,878 | |
HDFC Bank Limited ADR | | | | | | | | | | | 1,061 | | | | 64,381 | |
HSBC Holdings plc | | | | | | | | | | | 20,046 | | | | 162,285 | |
ICICI Bank Limited ADR | | | | | | | | | | | 8,448 | | | | 63,276 | |
ING Group NV | | | | | | | | | | | 5,612 | | | | 78,983 | |
JPMorgan Chase & Company (b) | | | | | | | | | | | 13,207 | | | | 1,139,632 | |
The accompanying notes are an integral part of these financial statements.
| | | | | | |
| Portfolio of investments—December 31, 2016 (unaudited) | | Wells Fargo Alternative Strategies Fund | | | 13 | |
| | | | | | | | | | | | | | | | |
| Security name | | | | | | | | Shares | | | Value | |
| | | | |
| Banks (continued) | | | | | | | | | | | | | | | | |
Mitsubishi UFJ Financial Group Incorporated (b) | | | | | | | | | | | 20,258 | | | $ | 124,833 | |
PNC Financial Services Group Incorporated | | | | | | | | | | | 1,678 | | | | 196,259 | |
Regions Financial Corporation (b) | | | | | | | | | | | 57,239 | | | | 821,952 | |
Sberbank of Russia (a) | | | | | | | | | | | 18,058 | | | | 50,827 | |
Sberbank ADR | | | | | | | | | | | 5,100 | | | | 59,058 | |
Signature Bank †(b) | | | | | | | | | | | 4,753 | | | | 713,901 | |
Societe Generale SA | | | | | | | | | | | 2,092 | | | | 102,939 | |
Standard Chartered plc † | | | | | | | | | | | 8,499 | | | | 69,507 | |
SunTrust Banks Incorporated | | | | | | | | | | | 9,622 | | | | 527,767 | |
The San-in Godo Bank Limited | | | | | | | | | | | 2,580 | | | | 21,523 | |
Tokyo TY Financial Group Incorporated | | | | | | | | | | | 449 | | | | 15,655 | |
UniCredit SpA | | | | | | | | | | | 13,523 | | | | 38,918 | |
Western Alliance Bancorp † | | | | | | | | | | | 5,099 | | | | 248,372 | |
| | | | |
| | | | | | | | | | | | | | | 7,510,181 | |
| | | | | | | | | | | | | | | | |
| | | | |
| Capital Markets: 1.45% | | | | | | | | | | | | | | | | |
Affiliated Managers Group Incorporated † | | | | | | | | | | | 7,130 | | | | 1,035,989 | |
ANIMA Holding SpA 144A | | | | | | | | | | | 9,935 | | | | 53,964 | |
GAM Holding AG | | | | | | | | | | | 2,235 | | | | 25,899 | |
Hellenic Exchanges SA Holding | | | | | | | | | | | 6,177 | | | | 31,796 | |
Ichiyoshi Securities Company Limited | | | | | | | | | | | 4,100 | | | | 31,467 | |
Intercontinental Exchange Incorporated | | | | | | | | | | | 5,281 | | | | 297,954 | |
Japan Exchange Group Incorporated | | | | | | | | | | | 2,044 | | | | 29,206 | |
Julius Baer Group Limited | | | | | | | | | | | 2,039 | | | | 90,567 | |
Moody’s Corporation | | | | | | | | | | | 8,759 | | | | 825,711 | |
Nomura Holdings Incorporated | | | | | | | | | | | 3,645 | | | | 21,491 | |
OM Asset Management plc | | | | | | | | | | | 15,728 | | | | 228,056 | |
Raymond James Financial Incorporated | | | | | | | | | | | 397 | | | | 27,500 | |
SEI Investments Company | | | | | | | | | | | 4,982 | | | | 245,912 | |
UBS Group AG | | | | | | | | | | | 13,442 | | | | 210,547 | |
| | | | |
| | | | | | | | | | | | | | | 3,156,059 | |
| | | | | | | | | | | | | | | | |
| | | | |
| Consumer Finance: 0.18% | | | | | | | | | | | | | | | | |
Ally Financial Incorporated | | | | | | | | | | | 12,337 | | | | 234,650 | |
Capital One Financial Corporation | | | | | | | | | | | 919 | | | | 80,174 | |
Santander Consumer USA Holdings Incorporated † | | | | | | | | | | | 5,460 | | | | 73,710 | |
| | | | |
| | | | | | | | | | | | | | | 388,534 | |
| | | | | | | | | | | | | | | | |
| | | | |
| Diversified Financial Services: 0.07% | | | | | | | | | | | | | | | | |
Amundi SA | | | | | | | | | | | 1,603 | | | | 83,906 | |
Berkshire Hathaway Incorporated Class B † | | | | | | | | | | | 469 | | | | 76,438 | |
| | | | |
| | | | | | | | | | | | | | | 160,344 | |
| | | | | | | | | | | | | | | | |
| | | | |
| Insurance: 1.11% | | | | | | | | | | | | | | | | |
Ageas NV | | | | | | | | | | | 2,022 | | | | 80,051 | |
Ambac Financial Group Incorporated † | | | | | | | | | | | 295 | | | | 6,638 | |
American International Group Incorporated | | | | | | | | | | | 9,030 | | | | 589,750 | |
Assicurazioni Generali SpA | | | | | | | | | | | 8,825 | | | | 131,170 | |
Chubb Limited | | | | | | | | | | | 703 | | | | 92,880 | |
The accompanying notes are an integral part of these financial statements.
| | | | |
| 14 | | Wells Fargo Alternative Strategies Fund | | Portfolio of investments—December 31, 2016 (unaudited) |
| | | | | | | | | | | | | | | | |
| Security name | | | | | | | | Shares | | | Value | |
| | | | |
| Insurance (continued) | | | | | | | | | | | | | | | | |
Coface SA | | | | | | | | | | | 5,448 | | | $ | 35,556 | |
Dai Ichi Mutual Life Insurance | | | | | | | | | | | 1,780 | | | | 29,637 | |
Delta Lloyd NV | | | | | | | | | | | 4,567 | | | | 25,561 | |
Japan Post Insurance Company Limited | | | | | | | | | | | 1,476 | | | | 31,610 | |
MetLife Incorporated | | | | | | | | | | | 1,539 | | | | 82,937 | |
MS&AD Insurance Group Holdings Incorporated | | | | | | | | | | | 1,720 | | | | 53,333 | |
Principal Financial Group Incorporated | | | | | | | | | | | 567 | | | | 32,807 | |
Prudential Financial Incorporated | | | | | | | | | | | 3,819 | | | | 397,405 | |
Saga plc | | | | | | | | | | | 19,508 | | | | 46,905 | |
Sony Financial Holdings Incorporated | | | | | | | | | | | 1,650 | | | | 25,751 | |
Storebrand ASA † | | | | | | | | | | | 9,779 | | | | 52,002 | |
T&D Holdings Incorporated | | | | | | | | | | | 3,059 | | | | 40,451 | |
Tokio Marine Holdings Incorporated | | | | | | | | | | | 1,691 | | | | 69,391 | |
Unum Group | | | | | | | | | | | 680 | | | | 29,872 | |
W.R. Berkley Corporation | | | | | | | | | | | 6,506 | | | | 432,714 | |
Willis Towers Watson plc | | | | | | | | | | | 613 | | | | 74,958 | |
Zurich Insurance Group AG | | | | | | | | | | | 218 | | | | 60,029 | |
| | | | |
| | | | | | | | | | | | | | | 2,421,408 | |
| | | | | | | | | | | | | | | | |
| | | | |
| Thrifts & Mortgage Finance: 0.01% | | | | | | | | | | | | | | | | |
Genworth Mortgage Insurance | | | | | | | | | | | 8,070 | | | | 19,044 | |
| | | | | | | | | | | | | | | | |
| | | | |
Health Care: 5.19% | | | | | | | | | | | | | | | | |
| | | | |
| Biotechnology: 0.21% | | | | | | | | | | | | | | | | |
Alder Biopharmaceuticals Incorporated † | | | | | | | | | | | 795 | | | | 16,536 | |
Biogen Incorporated † | | | | | | | | | | | 528 | | | | 149,731 | |
Incyte Corporation † | | | | | | | | | | | 1,480 | | | | 148,400 | |
Regeneron Pharmaceuticals Incorporated † | | | | | | | | | | | 143 | | | | 52,494 | |
Tesaro Incorporated † | | | | | | | | | | | 126 | | | | 16,944 | |
Vertex Pharmaceuticals Incorporated † | | | | | | | | | | | 800 | | | | 58,936 | |
| | | | |
| | | | | | | | | | | | | | | 443,041 | |
| | | | | | | | | | | | | | | | |
| | | | |
| Health Care Equipment & Supplies: 2.02% | | | | | | | | | | | | | | | | |
Align Technology Incorporated † | | | | | | | | | | | 720 | | | | 69,214 | |
Becton Dickinson & Company | | | | | | | | | | | 11,333 | | | | 1,876,178 | |
Dentsply Sirona Incorporated | | | | | | | | | | | 7,200 | | | | 415,656 | |
IDEXX Laboratories Incorporated † | | | | | | | | | | | 4,245 | | | | 497,811 | |
Medtronic plc | | | | | | | | | | | 1,287 | | | | 91,673 | |
Shandong Weigao Group Medical Polymer Company Limited H Shares | | | | | | | | | | | 45,490 | | | | 30,387 | |
St. Jude Medical Incorporated | | | | | | | | | | | 17,812 | | | | 1,428,344 | |
| | | | |
| | | | | | | | | | | | | | | 4,409,263 | |
| | | | | | | | | | | | | | | | |
| | | | |
| Health Care Providers & Services: 1.57% | | | | | | | | | | | | | | | | |
Acadia Healthcare Company Incorporated † | | | | | | | | | | | 764 | | | | 25,288 | |
Aetna Incorporated | | | | | | | | | | | 4,936 | | | | 612,113 | |
Cardinal Health Incorporated | | | | | | | | | | | 1,299 | | | | 93,489 | |
Envision Healthcare Corporation † | | | | | | | | | | | 581 | | | | 36,771 | |
McKesson Corporation | | | | | | | | | | | 361 | | | | 50,702 | |
Medipal Holdings Corporation | | | | | | | | | | | 1,955 | | | | 30,828 | |
The accompanying notes are an integral part of these financial statements.
| | | | | | |
| Portfolio of investments—December 31, 2016 (unaudited) | | Wells Fargo Alternative Strategies Fund | | | 15 | |
| | | | | | | | | | | | | | | | |
| Security name | | | | | | | | Shares | | | Value | |
| | | | |
| Health Care Providers & Services (continued) | | | | | | | | | | | | | | | | |
UnitedHealth Group Incorporated | | | | | | | | | | | 11,935 | | | $ | 1,910,078 | |
Universal Health Services Incorporated Class B (b) | | | | | | | | | | | 6,279 | | | | 667,960 | |
| | | | |
| | | | | | | | | | | | | | | 3,427,229 | |
| | | | | | | | | | | | | | | | |
| | | | |
| Health Care Technology: 0.01% | | | | | | | | | | | | | | | | |
Agfa-Gevaert NV † | | | | | | | | | | | 6,396 | | | | 24,729 | |
| | | | | | | | | | | | | | | | |
| | | | |
| Life Sciences Tools & Services: 0.52% | | | | | | | | | | | | | | | | |
Mettler-Toledo International Incorporated † | | | | | | | | | | | 539 | | | | 225,604 | |
Thermo Fisher Scientific Incorporated | | | | | | | | | | | 6,430 | | | | 907,273 | |
| | | | |
| | | | | | | | | | | | | | | 1,132,877 | |
| | | | | | | | | | | | | | | | |
| | | | |
| Pharmaceuticals: 0.86% | | | | | | | | | | | | | | | | |
Allergan plc † | | | | | | | | | | | 3,463 | | | | 727,265 | |
Almirall SA | | | | | | | | | | | 2,385 | | | | 37,056 | |
Astellas Pharma Incorporated | | | | | | | | | | | 2,839 | | | | 39,436 | |
AstraZeneca plc | | | | | | | | | | | 4,191 | | | | 229,196 | |
AstraZeneca plc ADR | | | | | | | | | | | 3,523 | | | | 96,248 | |
Bristol-Myers Squibb Company | | | | | | | | | | | 3,205 | | | | 187,300 | |
H. Lundbeck AS † | | | | | | | | | | | 813 | | | | 33,073 | |
Johnson & Johnson | | | | | | | | | | | 807 | | | | 92,974 | |
Kaken Pharmaceutical Company Limited | | | | | | | | | | | 496 | | | | 26,312 | |
Merck & Company Incorporated | | | | | | | | | | | 1,476 | | | | 86,892 | |
Mylan NV † | | | | | | | | | | | 1,635 | | | | 62,375 | |
Novartis AG | | | | | | | | | | | 1,587 | | | | 115,483 | |
Ono Pharmaceutical Company Limited | | | | | | | | | | | 2,521 | | | | 55,122 | |
Roche Holding AG | | | | | | | | | | | 210 | | | | 47,968 | |
Teva Pharmaceutical Industries Limited ADR | | | | | | | | | | | 503 | | | | 18,234 | |
UCB SA | | | | | | | | | | | 423 | | | | 27,121 | |
| | | | |
| | | | | | | | | | | | | | | 1,882,055 | |
| | | | | | | | | | | | | | | | |
| | | | |
Industrials: 6.72% | | | | | | | | | | | | | | | | |
| | | | |
| Aerospace & Defense: 0.92% | | | | | | | | | | | | | | | | |
Airbus Group NV | | | | | | | | | | | 7,453 | | | | 493,005 | |
Cobham plc | | | | | | | | | | | 52,904 | | | | 106,731 | |
Leonardo-Finmeccanica SpA † | | | | | | | | | | | 6,886 | | | | 96,696 | |
Lockheed Martin Corporation (b) | | | | | | | | | | | 2,521 | | | | 630,099 | |
Qinetiq Group plc | | | | | | | | | | | 21,893 | | | | 70,906 | |
Raytheon Company | | | | | | | | | | | 3,356 | | | | 476,552 | |
Thales SA | | | | | | | | | | | 173 | | | | 16,778 | |
Ultra Electronics Holdings plc | | | | | | | | | | | 2,367 | | | | 56,621 | |
United Technologies Corporation | | | | | | | | | | | 512 | | | | 56,125 | |
| | | | |
| | | | | | | | | | | | | | | 2,003,513 | |
| | | | | | | | | | | | | | | | |
| | | | |
| Air Freight & Logistics: 0.75% | | | | | | | | | | | | | | | | |
FedEx Corporation | | | | | | | | | | | 7,938 | | | | 1,478,056 | |
PostNL † | | | | | | | | | | | 17,383 | | | | 74,876 | |
United Parcel Service Incorporated Class B | | | | | | | | | | | 805 | | | | 92,285 | |
| | | | |
| | | | | | | | | | | | | | | 1,645,217 | |
| | | | | | | | | | | | | | | | |
The accompanying notes are an integral part of these financial statements.
| | | | |
| 16 | | Wells Fargo Alternative Strategies Fund | | Portfolio of investments—December 31, 2016 (unaudited) |
| | | | | | | | | | | | | | | | |
| Security name | | | | | | | | Shares | | | Value | |
| | | | |
| Airlines: 0.09% | | | | | | | | | | | | | | | | |
Air France-KLM † | | | | | | | | | | | 9,989 | | | $ | 54,404 | |
Air New Zealand Limited | | | | | | | | | | | 18,110 | | | | 27,615 | |
Deutsche Lufthansa AG | | | | | | | | | | | 5,773 | | | | 74,564 | |
Japan Airlines Company Limited | | | | | | | | | | | 1,080 | | | | 31,557 | |
| | | | |
| | | | | | | | | | | | | | | 188,140 | |
| | | | | | | | | | | | | | | | |
| | | | |
| Building Products: 0.94% | | | | | | | | | | | | | | | | |
Compagnie de Saint-Gobain SA | | | | | | | | | | | 5,302 | | | | 246,994 | |
Fortune Brands Home & Security Incorporated | | | | | | | | | | | 4,491 | | | | 240,089 | |
Johnson Controls International plc (b) | | | | | | | | | | | 35,120 | | | | 1,446,593 | |
Owens Corning Incorporated | | | | | | | | | | | 402 | | | | 20,727 | |
Sanwa Holdings Corporation | | | | | | | | | | | 8,020 | | | | 76,512 | |
TOTO Limited | | | | | | | | | | | 252 | | | | 9,972 | |
| | | | |
| | | | | | | | | | | | | | | 2,040,887 | |
| | | | | | | | | | | | | | | | |
| | | | |
| Commercial Services & Supplies: 0.06% | | | | | | | | | | | | | | | | |
Aeon Delight Company Limited | | | | | | | | | | | 963 | | | | 26,902 | |
Atento SA † | | | | | | | | | | | 2,705 | | | | 20,558 | |
Nippon Kanzai Company Limited | | | | | | | | | | | 1,960 | | | | 30,404 | |
Spotless Group Holdings Limited | | | | | | | | | | | 57,566 | | | | 41,127 | |
| | | | |
| | | | | | | | | | | | | | | 118,991 | |
| | | | | | | | | | | | | | | | |
| | | | |
| Construction & Engineering: 0.11% | | | | | | | | | | | | | | | | |
Balfour Beatty plc | | | | | | | | | | | 10,182 | | | | 33,742 | |
Hazama Ando Corporation | | | | | | | | | | | 6,845 | | | | 45,155 | |
JGC Corporation | | | | | | | | | | | 1,206 | | | | 21,917 | |
Kandenko Company Limited | | | | | | | | | | | 1,393 | | | | 12,574 | |
Kinden Corporation | | | | | | | | | | | 2,385 | | | | 29,753 | |
Nippo Corporation | | | | | | | | | | | 1,281 | | | | 23,905 | |
Taisei Corporation | | | | | | | | | | | 3,090 | | | | 21,627 | |
Vinci SA | | | | | | | | | | | 841 | | | | 57,278 | |
| | | | |
| | | | | | | | | | | | | | | 245,951 | |
| | | | | | | | | | | | | | | | |
| | | | |
| Electrical Equipment: 0.81% | | | | | | | | | | | | | | | | |
Denyo Company Limited | | | | | | | | | | | 2,255 | | | | 30,562 | |
Eaton Corporation plc | | | | | | | | | | | 270 | | | | 18,114 | |
Legrand SA | | | | | | | | | | | 1,569 | | | | 89,104 | |
Mabuchi Motor Company Limited | | | | | | | | | | | 275 | | | | 14,353 | |
Mitsubishi Electric Corporation | | | | | | | | | | | 2,250 | | | | 31,370 | |
Rockwell Automation Incorporated | | | | | | | | | | | 10,930 | | | | 1,468,992 | |
Schneider Electric SE | | | | | | | | | | | 749 | | | | 52,123 | |
Ushio Incorporated | | | | | | | | | | | 1,340 | | | | 17,095 | |
Zumtobel Group AG | | | | | | | | | | | 2,471 | | | | 44,193 | |
| | | | |
| | | | | | | | | | | | | | | 1,765,906 | |
| | | | | | | | | | | | | | | | |
| | | | |
| Industrial Conglomerates: 0.13% | | | | | | | | | | | | | | | | |
Beijing Enterprises Holdings Limited | | | | | | | | | | | 6,110 | | | | 28,878 | |
Honeywell International Incorporated | | | | | | | | | | | 377 | | | | 43,675 | |
The accompanying notes are an integral part of these financial statements.
| | | | | | |
| Portfolio of investments—December 31, 2016 (unaudited) | | Wells Fargo Alternative Strategies Fund | | | 17 | |
| | | | | | | | | | | | | | | | |
| Security name | | | | | | | | Shares | | | Value | |
| | | | |
| Industrial Conglomerates (continued) | | | | | | | | | | | | | | | | |
Koninklijke Philips NV | | | | | | | | | | | 1,476 | | | $ | 45,058 | |
Rheinmetall AG | | | | | | | | | | | 2,317 | | | | 155,852 | |
| | | | |
| | | | | | | | | | | | | | | 273,463 | |
| | | | | | | | | | | | | | | | |
| | | | |
| Machinery: 0.28% | | | | | | | | | | | | | | | | |
Alstom SA † | | | | | | | | | | | 5,899 | | | | 162,536 | |
Atlas Copco AB Class A | | | | | | | | | | | 1,281 | | | | 39,018 | |
Daifuku Company Limited | | | | | | | | | | | 1,500 | | | | 31,996 | |
Hino Motors Limited | | | | | | | | | | | 3,425 | | | | 34,873 | |
IHI Corporation † | | | | | | | | | | | 9,575 | | | | 24,905 | |
Kawasaki Heavy Industries Limited | | | | | | | | | | | 9,913 | | | | 31,128 | |
Makita Corporation | | | | | | | | | | | 486 | | | | 32,559 | |
Mitsubishi Heavy Industries Limited | | | | | | | | | | | 8,945 | | | | 40,762 | |
NGK Insulators Limited | | | | | | | | | | | 1,875 | | | | 36,369 | |
Shinmaywa Industries Limited | | | | | | | | | | | 1,131 | | | | 10,171 | |
SMC Corporation | | | | | | | | | | | 116 | | | | 27,696 | |
Takuma Company Limited | | | | | | | | | | | 3,195 | | | | 27,310 | |
The Middleby Corporation † | | | | | | | | | | | 737 | | | | 94,933 | |
Toshiba Machine Company Limited | | | | | | | | | | | 4,015 | | | | 16,112 | |
| | | | |
| | | | | | | | | | | | | | | 610,368 | |
| | | | | | | | | | | | | | | | |
| | | | |
| Marine: 0.03% | | | | | | | | | | | | | | | | |
DS Norden AS † | | | | | | | | | | | 2,247 | | | | 35,157 | |
Kuehne & Nagel International AG | | | | | | | | | | | 268 | | | | 35,425 | |
| | | | |
| | | | | | | | | | | | | | | 70,582 | |
| | | | | | | | | | | | | | | | |
| | | | |
| Professional Services: 0.77% | | | | | | | | | | | | | | | | |
Adecco SA | | | | | | | | | | | 765 | | | | 50,071 | |
Experian Group Limited | | | | | | | | | | | 4,089 | | | | 79,318 | |
Hays plc | | | | | | | | | | | 28,740 | | | | 52,845 | |
IHS Markit Limited † | | | | | | | | | | | 1,193 | | | | 42,244 | |
Nielsen Holdings plc | | | | | | | | | | | 24,656 | | | | 1,034,319 | |
Recruit Holdings Company Limited | | | | | | | | | | | 663 | | | | 26,605 | |
Robert Half International Incorporated | | | | | | | | | | | 7,593 | | | | 370,387 | |
SThree plc | | | | | | | | | | | 2,626 | | | | 10,037 | |
TechnoPro Holdings Incorporated | | | | | | | | | | | 606 | | | | 19,444 | |
| | | | |
| | | | | | | | | | | | | | | 1,685,270 | |
| | | | | | | | | | | | | | | | |
| | | | |
| Road & Rail: 1.70% | | | | | | | | | | | | | | | | |
Avis Budget Group Incorporated †(b) | | | | | | | | | | | 2,361 | | | | 86,601 | |
Canadian National Railway Company | | | | | | | | | | | 1,305 | | | | 87,826 | |
CSX Corporation (b) | | | | | | | | | | | 40,749 | | | | 1,464,112 | |
DSV AS | | | | | | | | | | | 1,494 | | | | 66,466 | |
Genesee & Wyoming Incorporated Class A † | | | | | | | | | | | 722 | | | | 50,114 | |
Hitachi Transport System Limited | | | | | | | | | | | 1,110 | | | | 22,537 | |
J.B. Hunt Transport Services Incorporated | | | | | | | | | | | 982 | | | | 95,323 | |
Kansas City Southern | | | | | | | | | | | 400 | | | | 33,940 | |
Knight Transportation Incorporated | | | | | | | | | | | 1,606 | | | | 53,078 | |
The accompanying notes are an integral part of these financial statements.
| | | | |
| 18 | | Wells Fargo Alternative Strategies Fund | | Portfolio of investments—December 31, 2016 (unaudited) |
| | | | | | | | | | | | | | | | |
| Security name | | | | | | | | Shares | | | Value | |
| | | | |
| Road & Rail (continued) | | | | | | | | | | | | | | | | |
Old Dominion Freight Line Incorporated † | | | | | | | | | | | 4,813 | | | $ | 412,907 | |
Union Pacific Corporation (b) | | | | | | | | | | | 12,846 | | | | 1,331,873 | |
| | | | |
| | | | | | | | | | | | | | | 3,704,777 | |
| | | | | | | | | | | | | | | | |
| | | | |
| Trading Companies & Distributors: 0.12% | | | | | | | | | | | | | | | | |
Fastenal Company | | | | | | | | | | | 1,449 | | | | 68,074 | |
Itochu Corporation | | | | | | | | | | | 3,618 | | | | 48,044 | |
Rexel SA | | | | | | | | | | | 6,810 | | | | 112,080 | |
SIG plc | | | | | | | | | | | 30,932 | | | | 39,340 | |
| | | | |
| | | | | | | | | | | | | | | 267,538 | |
| | | | | | | | | | | | | | | | |
| | | | |
| Transportation Infrastructure: 0.01% | | | | | | | | | | | | | | | | |
Hamburger Hafen Und Logistik AG | | | | | | | | | | | 1,227 | | | | 22,861 | |
| | | | | | | | | | | | | | | | |
| | | | |
Information Technology: 11.04% | | | | | | | | | | | | | | | | |
| | | | |
| Communications Equipment: 0.40% | | | | | | | | | | | | | | | | |
ARRIS International plc † | | | | | | | | | | | 907 | | | | 27,328 | |
Cisco Systems Incorporated | | | | | | | | | | | 956 | | | | 28,890 | |
Juniper Networks Incorporated (b) | | | | | | | | | | | 17,399 | | | | 491,696 | |
Motorola Solutions Incorporated | | | | | | | | | | | 404 | | | | 33,488 | |
Nokia Oyj | | | | | | | | | | | 22,566 | | | | 108,984 | |
Radware Limited † | | | | | | | | | | | 7,277 | | | | 106,099 | |
Telefonaktiebolaget LM Ericsson Class B | | | | | | | | | | | 12,287 | | | | 72,153 | |
| | | | |
| | | | | | | | | | | | | | | 868,638 | |
| | | | | | | | | | | | | | | | |
| | | | |
| Electronic Equipment, Instruments & Components: 0.34% | | | | | | | | | | | | | | | | |
Alps Electric Company Limited | | | | | | | | | | | 1,442 | | | | 34,867 | |
Amano Corporation | | | | | | | | | | | 1,529 | | | | 26,858 | |
Flextronics International Limited †(b) | | | | | | | | | | | 38,616 | | | | 554,912 | |
Hosiden Corporation | | | | | | | | | | | 2,305 | | | | 18,657 | |
Largan Precision Company Limited | | | | | | | | | | | 380 | | | | 44,686 | |
Siix Corporation | | | | | | | | | | | 652 | | | | 22,008 | |
Spectris plc | | | | | | | | | | | 700 | | | | 19,954 | |
WPG Holdings Company Limited | | | | | | | | | | | 22,130 | | | | 26,093 | |
| | | | |
| | | | | | | | | | | | | | | 748,035 | |
| | | | | | | | | | | | | | | | |
| | | | |
| Internet Software & Services: 3.43% | | | | | | | | | | | | | | | | |
Alibaba Group Holding Limited ADR † | | | | | | | | | | | 1,500 | | | | 131,715 | |
Alphabet Incorporated Class A † | | | | | | | | | | | 1,515 | | | | 1,200,562 | |
Alphabet Incorporated Class C †(b) | | | | | | | | | | | 2,105 | | | | 1,624,681 | |
Baidu Incorporated ADR † | | | | | | | | | | | 687 | | | | 112,950 | |
Dena Company Limited | | | | | | | | | | | 1,831 | | | | 40,012 | |
Envestnet Incorporated † | | | | | | | | | | | 812 | | | | 28,623 | |
Facebook Incorporated Class A †(b) | | | | | | | | | | | 13,948 | | | | 1,604,718 | |
GMO Internet Incorporated | | | | | | | | | | | 749 | | | | 9,574 | |
Just Eat plc † | | | | | | | | | | | 8,319 | | | | 59,822 | |
Mimecast Limited † | | | | | | | | | | | 1,670 | | | | 29,893 | |
SMS Company Limited | | | | | | | | | | | 698 | | | | 15,474 | |
Tencent Holdings Limited | | | | | | | | | | | 2,123 | | | | 51,935 | |
The accompanying notes are an integral part of these financial statements.
| | | | | | |
| Portfolio of investments—December 31, 2016 (unaudited) | | Wells Fargo Alternative Strategies Fund | | | 19 | |
| | | | | | | | | | | | | | | | |
| Security name | | | | | | | | Shares | | | Value | |
| | | | |
| Internet Software & Services (continued) | | | | | | | | | | | | | | | | |
Yahoo! Incorporated † | | | | | | | | | | | 63,560 | | | $ | 2,457,865 | |
Yandex NV Class A † | | | | | | | | | | | 5,902 | | | | 118,807 | |
| | | | |
| | | | | | | | | | | | | | | 7,486,631 | |
| | | | | | | | | | | | | | | | |
| | | | |
| IT Services: 1.00% | | | | | | | | | | | | | | | | |
Accenture plc Class A | | | | | | | | | | | 747 | | | | 87,496 | |
Alliance Data Systems Corporation | | | | | | | | | | | 316 | | | | 72,206 | |
Automatic Data Processing Incorporated | | | | | | | | | | | 741 | | | | 76,160 | |
Cerved Information Solutions SpA | | | | | | | | | | | 11,369 | | | | 94,424 | |
Cognizant Technology Solutions Corporation Class A †(b) | | | | | | | | | | | 11,600 | | | | 649,948 | |
CSRA Incorporated (b) | | | | | | | | | | | 10,005 | | | | 318,559 | |
MasterCard Incorporated Class A | | | | | | | | | | | 7,451 | | | | 769,316 | |
Sopra Steria Group | | | | | | | | | | | 394 | | | | 44,730 | |
Visa Incorporated Class A | | | | | | | | | | | 861 | | | | 67,175 | |
| | | | |
| | | | | | | | | | | | | | | 2,180,014 | |
| | | | | | | | | | | | | | | | |
| | | | |
| Semiconductors & Semiconductor Equipment: 0.73% | | | | | | | | | | | | | | | | |
Intel Corporation | | | | | | | | | | | 5,114 | | | | 185,485 | |
Kontron AG † | | | | | | | | | | | 5,039 | | | | 15,117 | |
Marvell Technology Group Limited (b) | | | | | | | | | | | 76,185 | | | | 1,056,686 | |
Micron Technology Incorporated † | | | | | | | | | | | 3,139 | | | | 68,807 | |
Silicon Motion Technology Corporation | | | | | | | | | | | 440 | | | | 18,691 | |
Skyworks Solutions Incorporated | | | | | | | | | | | 725 | | | | 54,129 | |
STMicroelectronics NV | | | | | | | | | | | 6,734 | | | | 76,556 | |
Taiwan Semiconductor Manufacturing Company Limited | | | | | | | | | | | 6,400 | | | | 36,042 | |
Tokyo Electron Limited | | | | | | | | | | | 420 | | | | 39,691 | |
Tokyo Seimitsu Company Limited | | | | | | | | | | | 1,265 | | | | 37,504 | |
| | | | |
| | | | | | | | | | | | | | | 1,588,708 | |
| | | | | | | | | | | | | | | | |
| | | | |
| Software: 2.92% | | | | | | | | | | | | | | | | |
Dell Technologies Incorporated Class V † | | | | | | | | | | | 879 | | | | 48,319 | |
Microsoft Corporation (b) | | | | | | | | | | | 42,168 | | | | 2,620,320 | |
Nintendo Company Limited | | | | | | | | | | | 479 | | | | 100,575 | |
Nuance Communications Incorporated † | | | | | | | | | | | 12,382 | | | | 184,492 | |
Oracle Corporation (b) | | | | | | | | | | | 17,930 | | | | 689,409 | |
PTC Incorporated †(b) | | | | | | | | | | | 18,221 | | | | 843,086 | |
ServiceNow Incorporated † | | | | | | | | | | | 540 | | | | 40,144 | |
SS&C Technologies Holdings Incorporated | | | | | | | | | | | 742 | | | | 21,221 | |
Symantec Corporation (b) | | | | | | | | | | | 15,250 | | | | 364,323 | |
The Descartes Systems Group Incorporated † | | | | | | | | | | | 1,755 | | | | 37,423 | |
Verint Systems Incorporated †(b) | | | | | | | | | | | 19,623 | | | | 691,711 | |
VMware Incorporated Class A †(b) | | | | | | | | | | | 8,186 | | | | 644,484 | |
Workday Incorporated Class A † | | | | | | | | | | | 1,307 | | | | 86,380 | |
| | | | |
| | | | | | | | | | | | | | | 6,371,887 | |
| | | | | | | | | | | | | | | | |
| | | | |
| Technology Hardware, Storage & Peripherals: 2.22% | | | | | | | | | | | | | | | | |
Apple Incorporated | | | | | | | | | | | 382 | | | | 44,243 | |
Catcher Technology Company Limited | | | | | | | | | | | 5,535 | | | | 38,470 | |
The accompanying notes are an integral part of these financial statements.
| | | | |
| 20 | | Wells Fargo Alternative Strategies Fund | | Portfolio of investments—December 31, 2016 (unaudited) |
| | | | | | | | | | | | | | | | |
| Security name | | | | | | | | Shares | | | Value | |
| | | | |
| Technology Hardware, Storage & Peripherals (continued) | | | | | | | | | | | | | | | | |
Hewlett Packard Enterprise Company | | | | | | | | | | | 10,461 | | | $ | 242,068 | |
HP Incorporated (b) | | | | | | | | | | | 87,849 | | | | 1,303,679 | |
NetApp Incorporated | | | | | | | | | | | 29,605 | | | | 1,044,168 | |
Samsung Electronics Company Limited | | | | | | | | | | | 68 | | | | 101,454 | |
Western Digital Corporation (b) | | | | | | | | | | | 30,216 | | | | 2,053,177 | |
| | | | |
| | | | | | | | | | | | | | | 4,827,259 | |
| | | | | | | | | | | | | | | | |
| | | | |
Materials: 4.86% | | | | | | | | | | | | | | | | |
| | | | |
| Chemicals: 2.56% | | | | | | | | | | | | | | | | |
Akzo Nobel NV | | | | | | | | | | | 1,215 | | | | 75,958 | |
Albemarle Corporation | | | | | | | | | | | 3,259 | | | | 280,535 | |
Celanese Corporation Series A | | | | | | | | | | | 661 | | | | 52,047 | |
CF Industries Holdings Incorporated | | | | | | | | | | | 1,087 | | | | 34,219 | |
Ingevity Corporation † | | | | | | | | | | | 10,375 | | | | 569,173 | |
JSR Corporation | | | | | | | | | | | 1,832 | | | | 28,889 | |
LG Chem Limited | | | | | | | | | | | 104 | | | | 22,474 | |
Mitsui Chemicals Incorporated | | | | | | | | | | | 3,128 | | | | 14,051 | |
Nissan Chemical Industries Limited | | | | | | | | | | | 737 | | | | 24,624 | |
Platform Specialty Products Corporation † | | | | | | | | | | | 7,058 | | | | 69,239 | |
Praxair Incorporated | | | | | | | | | | | 601 | | | | 70,431 | |
The Sherwin-Williams Company | | | | | | | | | | | 14,721 | | | | 3,956,122 | |
The Valspar Corporation | | | | | | | | | | | 1,857 | | | | 192,404 | |
Valvoline Incorporated | | | | | | | | | | | 9,037 | | | | 194,296 | |
| | | | |
| | | | | | | | | | | | | | | 5,584,462 | |
| | | | | | | | | | | | | | | | |
| | | | |
| Construction Materials: 1.25% | | | | | | | | | | | | | | | | |
Boral Limited | | | | | | | | | | | 6,555 | | | | 25,592 | |
BRAAS Monier Building Group SA | | | | | | | | | | | 3,267 | | | | 86,577 | |
Buzzi Unicem SpA | | | | | | | | | | | 4,567 | | | | 108,216 | |
CRH plc | | | | | | | | | | | 2,412 | | | | 83,673 | |
CRH plc - London Exchange | | | | | | | | | | | 3,120 | | | | 108,816 | |
Ibstock plc 144A | | | | | | | | | | | 23,082 | | | | 52,995 | |
LafargeHolcim Limited - BATS Exchange | | | | | | | | | | | 4,976 | | | | 262,165 | |
Martin Marietta Materials Incorporated | | | | | | | | | | | 1,866 | | | | 413,375 | |
Sumitomo Osaka Cement Company | | | | | | | | | | | 8,910 | | | | 33,620 | |
Taiheiyo Cement Corporation | | | | | | | | | | | 9,085 | | | | 28,761 | |
Vicat SA | | | | | | | | | | | 607 | | | | 36,842 | |
Vulcan Materials Company (b) | | | | | | | | | | | 11,366 | | | | 1,422,455 | |
Wienerberger AG | | | | | | | | | | | 3,830 | | | | 66,502 | |
| | | | |
| | | | | | | | | | | | | | | 2,729,589 | |
| | | | | | | | | | | | | | | | |
| | | | |
| Containers & Packaging: 0.56% | | | | | | | | | | | | | | | | |
Ball Corporation | | | | | | | | | | | 8,929 | | | | 670,300 | |
Berry Plastics Group Incorporated †(b) | | | | | | | | | | | 6,709 | | | | 326,930 | |
International Paper Company | | | | | | | | | | | 1,380 | | | | 73,223 | |
Smurfit Kappa Group plc | | | | | | | | | | | 4,130 | | | | 94,753 | |
WestRock Company | | | | | | | | | | | 919 | | | | 46,658 | |
| | | | |
| | | | | | | | | | | | | | | 1,211,864 | |
| | | | | | | | | | | | | | | | |
The accompanying notes are an integral part of these financial statements.
| | | | | | |
| Portfolio of investments—December 31, 2016 (unaudited) | | Wells Fargo Alternative Strategies Fund | | | 21 | |
| | | | | | | | | | | | | | | | |
| Security name | | | | | | | | Shares | | | Value | |
| | | | |
| Metals & Mining: 0.49% | | | | | | | | | | | | | | | | |
Anglo American plc † | | | | | | | | | | | 4,167 | | | $ | 59,571 | |
BHP Billiton Limited ADR | | | | | | | | | | | 638 | | | | 22,828 | |
Centerra Gold Incorporated | | | | | | | | | | | 700 | | | | 3,279 | |
Constellium NV Class A † | | | | | | | | | | | 1,751 | | | | 10,331 | |
Franco-Nevada Corporation | | | | | | | | | | | 197 | | | | 11,773 | |
Freeport-McMoRan Incorporated † | | | | | | | | | | | 18,047 | | | | 238,040 | |
Glencore International plc † | | | | | | | | | | | 25,469 | | | | 87,055 | |
Klondex Mines Limited † | | | | | | | | | | | 2,000 | | | | 9,310 | |
Lonmin plc † | | | | | | | | | | | 3,474 | | | | 6,058 | |
Randgold Resources Limited ADR | | | | | | | | | | | 315 | | | | 24,047 | |
Reliance Steel & Aluminum Company | | | | | | | | | | | 555 | | | | 44,145 | |
Rio Tinto plc ADR | | | | | | | | | | | 575 | | | | 22,115 | |
Salzgitter AG | | | | | | | | | | | 1,326 | | | | 46,830 | |
Sanyo Special Steel Company Limited | | | | | | | | | | | 3,410 | | | | 16,164 | |
Steel Dynamics Incorporated | | | | | | | | | | | 11,364 | | | | 404,331 | |
Vale SA ADR | | | | | | | | | | | 6,028 | | | | 45,933 | |
Yamato Kogyo Company Limited | | | | | | | | | | | 960 | | | | 26,901 | |
| | | | |
| | | | | | | | | | | | | | | 1,078,711 | |
| | | | | | | | | | | | | | | | |
| | | | |
Real Estate: 0.72% | | | | | | | | | | | | | | | | |
| | | | |
| Equity REITs: 0.28% | | | | | | | | | | | | | | | | |
Columbia Property Trust Incorporated | | | | | | | | | | | 1,083 | | | | 23,393 | |
National Storage REIT NPV | | | | | | | | | | | 33,666 | | | | 36,321 | |
Hibernia REIT plc | | | | | | | | | | | 72,021 | | | | 93,326 | |
Irish Residential Properties REIT plc | | | | | | | | | | | 55,688 | | | | 68,585 | |
Public Storage Incorporated | | | | | | | | | | | 342 | | | | 76,437 | |
Equinix Incorporated | | | | | | | | | | | 176 | | | | 62,904 | |
LaSalle Logiport REIT | | | | | | | | | | | 38 | | | | 35,992 | |
American Tower Corporation | | | | | | | | | | | 917 | | | | 96,909 | |
Grivalia Properties Real Estate Investment Company | | | | | | | | | | | 8,660 | | | | 69,828 | |
Host Hotels & Resorts Incorporated | | | | | | | | | | | 2,018 | | | | 38,019 | |
| | | | |
| | | | | | | | | | | | | | | 601,714 | |
| | | | | | | | | | | | | | | | |
| | | | |
| Real Estate Management & Development: 0.44% | | | | | | | | | | | | | | | | |
CBRE Group Incorporated Class A † | | | | | | | | | | | 15,844 | | | | 498,928 | |
Daito Trust Construction Company Limited | | | | | | | | | | | 226 | | | | 33,994 | |
LEG Immobilien AG | | | | | | | | | | | 781 | | | | 60,672 | |
Corporacion Inmobiliaria Vesta SAB de CV | | | | | | | | | | | 25,510 | | | | 30,642 | |
BR Malls Participacoes SA † | | | | | | | | | | | 11,700 | | | | 42,958 | |
Grand City Properties SA | | | | | | | | | | | 10,162 | | | | 184,952 | |
Daiwa House Industry Company Limited | | | | | | | | | | | 1,705 | | | | 46,624 | |
Sumitomo Real Estate Sales Company Limited | | | | | | | | | | | 2,564 | | | | 59,781 | |
| | | | |
| | | | | | | | | | | | | | | 958,551 | |
| | | | | | | | | | | | | | | | |
| | | | |
Telecommunication Services: 1.39% | | | | | | | | | | | | | | | | |
| | | | |
| Diversified Telecommunication Services: 1.23% | | | | | | | | | | | | | | | | |
Cellnex Telecom SA | | | | | | | | | | | 26,348 | | | | 379,002 | |
Hellenic Telecommunications Organization SA | | | | | | | | | | | 8,222 | | | | 77,288 | |
The accompanying notes are an integral part of these financial statements.
| | | | |
| 22 | | Wells Fargo Alternative Strategies Fund | | Portfolio of investments—December 31, 2016 (unaudited) |
| | | | | | | | | | | | | | | | |
| Security name | | | | | | | | Shares | | | Value | |
| | | | |
| Diversified Telecommunication Services (continued) | | | | | | | | | | | | | | | | |
Nippon Telegraph & Telephone Corporation | | | | | | | | | | | 3,254 | | | $ | 136,758 | |
Sunrise Communications Group AG 144A | | | | | | | | | | | 4,988 | | | | 328,190 | |
Telecom Italia SpA † | | | | | | | | | | | 31,802 | | | | 28,020 | |
Telecom Italia RSP | | | | | | | | | | | 38,978 | | | | 28,188 | |
Telefonica SA | | | | | | | | | | | 4,642 | | | | 43,098 | |
Verizon Communications Incorporated (b) | | | | | | | | | | | 31,282 | | | | 1,669,833 | |
| | | | |
| | | | | | | | | | | | | | | 2,690,377 | |
| | | | | | | | | | | | | | | | |
| | | | |
| Wireless Telecommunication Services: 0.16% | | | | | | | | | | | | | | | | |
KDDI Corporation | | | | | | | | | | | 3,095 | | | | 78,371 | |
Orange Belgium SA † | | | | | | | | | | | 1,691 | | | | 35,343 | |
VimpelCom Limited ADR | | | | | | | | | | | 58,300 | | | | 224,455 | |
| | | | |
| | | | | | | | | | | | | | | 338,169 | |
| | | | | | | | | | | | | | | | |
| | | | |
Utilities: 0.30% | | | | | | | | | | | | | | | | |
| | | | |
| Electric Utilities: 0.05% | | | | | | | | | | | | | | | | |
Iberdrola SA | | | | | | | | | | | 9,395 | | | | 61,652 | |
Power Assets Holdings Limited | | | | | | | | | | | 5,625 | | | | 49,580 | |
| | | | |
| | | | | | | | | | | | | | | 111,232 | |
| | | | | | | | | | | | | | | | |
| | | | |
| Gas Utilities: 0.04% | | | | | | | | | | | | | | | | |
ENN Energy Holdings Limited | | | | | | | | | | | 11,250 | | | | 46,280 | |
Infraestructura Energetica Nova SAB de CV | | | | | | | | | | | 5,025 | | | | 21,889 | |
UGI Corporation | | | | | | | | | | | 320 | | | | 14,746 | |
| | | | |
| | | | | | | | | | | | | | | 82,915 | |
| | | | | | | | | | | | | | | | |
| | | | |
| Independent Power & Renewable Electricity Producers: 0.03% | | | | | | | | | | | | | | | | |
China Longyuan Power Group Corporation H Shares | | | | | | | | | | | 47,000 | | | | 36,730 | |
Huadian Fuxin Energy Corporation Limited H Shares | | | | | | | | | | | 28,261 | | | | 6,268 | |
Huaneng Renewables Corporation Limited H Shares | | | | | | | | | | | 63,845 | | | | 20,748 | |
| | | | |
| | | | | | | | | | | | | | | 63,746 | |
| | | | | | | | | | | | | | | | |
| | | | |
| Multi-Utilities: 0.17% | | | | | | | | | | | | | | | | |
E.ON SE | | | | | | | | | | | 25,285 | | | | 178,329 | |
Engie SA | | | | | | | | | | | 4,405 | | | | 56,200 | |
National Grid plc | | | | | | | | | | | 6,366 | | | | 74,657 | |
RWE AG † | | | | | | | | | | | 2,307 | | | | 28,692 | |
Veolia Environnement SA | | | | | | | | | | | 2,488 | | | | 42,362 | |
| | | | |
| | | | | | | | | | | | | | | 380,240 | |
| | | | | | | | | | | | | | | | |
| | | | |
| Water Utilities: 0.01% | | | | | | | | | | | | | | | | |
Guangdong Investment Limited | | | | | | | | | | | 16,380 | | | | 21,630 | |
| | | | | | | | | | | | | | | | |
| | | | |
Total Common Stocks (Cost $112,672,800) | | | | | | | | | | | | | | | 124,504,851 | |
| | | | | | | | | | | | | | | | |
The accompanying notes are an integral part of these financial statements.
| | | | | | |
| Portfolio of investments—December 31, 2016 (unaudited) | | Wells Fargo Alternative Strategies Fund | | | 23 | |
| | | | | | | | | | | | | | | | |
| Security name | | Interest rate | | | Maturity date | | | Principal | | | Value | |
| | | | |
Corporate Bonds and Notes: 1.39% | | | | | | | | | | | | | | | | |
| | | | |
Consumer Discretionary: 0.53% | | | | | | | | | | | | | | | | |
| | | | |
| Hotels, Restaurants & Leisure: 0.07% | | | | | | | | | | | | | | | | |
Caesars Entertainment Operating Company Incorporated (s) | | | 9.00 | % | | | 2-15-2020 | | | $ | 83,602 | | | $ | 86,737 | |
Caesars Entertainment Operating Company Incorporated (s) | | | 10.00 | | | | 12-15-2018 | | | | 35,000 | | | | 25,113 | |
Caesars Entertainment Operating Company Incorporated (s) | | | 11.25 | | | | 6-1-2017 | | | | 49,197 | | | | 50,058 | |
| | | | |
| | | | | | | | | | | | | | | 161,908 | |
| | | | | | | | | | | | | | | | |
| | | | |
| Multiline Retail: 0.04% | | | | | | | | | | | | | | | | |
Neiman Marcus Group Limited 144A | | | 8.00 | | | | 10-15-2021 | | | | 90,000 | | | | 66,825 | |
Neiman Marcus Group Limited (PIK at 9.50%) 144A¥ | | | 8.75 | | | | 10-15-2021 | | | | 15,000 | | | | 10,613 | |
| | | | |
| | | | | | | | | | | | | | | 77,438 | |
| | | | | | | | | | | | | | | | |
| | | | |
| Specialty Retail: 0.42% | | | | | | | | | | | | | | | | |
Guitar Center Incorporated 144A | | | 6.50 | | | | 4-15-2019 | | | | 195,000 | | | | 176,963 | |
New Albertsons Incorporated (i) | | | 6.52 | | | | 4-10-2028 | | | | 100,000 | | | | 78,875 | |
New Albertsons Incorporated (i) | | | 6.57 | | | | 2-23-2028 | | | | 545,000 | | | | 478,919 | |
New Albertsons Incorporated | | | 6.63 | | | | 6-1-2028 | | | | 20,000 | | | | 17,900 | |
New Albertsons Incorporated (i) | | | 7.15 | | | | 7-23-2027 | | | | 15,000 | | | | 12,450 | |
New Albertsons Incorporated | | | 7.75 | | | | 6-15-2026 | | | | 25,000 | | | | 24,750 | |
New Albertsons Incorporated | | | 8.00 | | | | 5-1-2031 | | | | 100,000 | | | | 95,750 | |
New Albertsons Incorporated | | | 8.70 | | | | 5-1-2030 | | | | 25,000 | | | | 25,125 | |
| | | | |
| | | | | | | | | | | | | | | 910,732 | |
| | | | | | | | | | | | | | | | |
| | | | |
Financials: 0.46% | | | | | | | | | | | | | | | | |
| | | | |
| Insurance: 0.46% | | | | | | | | | | | | | | | | |
Ambac Assurance Corporation 144A | | | 5.10 | | | | 6-7-2020 | | | | 839,654 | | | | 1,015,981 | |
| | | | | | | | | | | | | | | | |
| | | | |
Health Care: 0.25% | | | | | | | | | | | | | | | | |
| | | | |
| Health Care Equipment & Supplies: 0.25% | | | | | | | | | | | | | | | | |
Community Health Systems Incorporated | | | 5.13 | | | | 8-1-2021 | | | | 585,000 | | | | 542,588 | |
| | | | | | | | | | | | | | | | |
| | | | |
Industrials: 0.15% | | | | | | | | | | | | | | | | |
| | | | |
| Aerospace & Defense: 0.15% | | | | | | | | | | | | | | | | |
DynCorp International Incorporated | | | 11.88 | | | | 11-30-2020 | | | | 352,769 | | | | 328,075 | |
| | | | | | | | | | | | | | | | |
| | | | |
Total Corporate Bonds and Notes (Cost $2,922,762) | | | | | | | | | | | | | | | 3,036,722 | |
| | | | | | | | | | | | | | | | |
| | | | |
| | | | | | | | | Shares | | | | |
| Exchange-Traded Funds: 0.01% | | | | | | | | | | | | | | | | |
TOPIX ETF | | | | | | | | | | | 1,470 | | | | 19,571 | |
| | | | | | | | | | | | | | | | |
| | | | |
Total Exchange-Traded Funds (Cost $19,626) | | | | | | | | | | | | | | | 19,571 | |
| | | | | | | | | | | | | | | | |
The accompanying notes are an integral part of these financial statements.
| | | | |
| 24 | | Wells Fargo Alternative Strategies Fund | | Portfolio of investments—December 31, 2016 (unaudited) |
| | | | | | | | | | | | | | | | |
| Security name | | Interest rate | | | Maturity date | | | Principal | | | Value | |
| | | | |
Foreign Corporate Bonds and Notes @: 0.08% | | | | | | | | | | | | | | | | |
| | | | |
Consumer Discretionary: 0.08% | | | | | | | | | | | | | | | | |
| | | | |
| Textiles, Apparel & Luxury Goods: 0.08% | | | | | | | | | | | | | | | | |
Boardriders SA (EUR) | | | 9.50 | % | | | 12-15-2020 | | | | 193,000 | | | $ | 170,656 | |
| | | | | | | | | | | | | | | | |
| | | | |
Total Foreign Corporate Bonds and Notes (Cost $190,055) | | | | | | | | | | | | | | | 170,656 | |
| | | | | | | | | | | | | | | | |
| | | | | | | | | Shares | | | | |
| Investment Companies: 5.10% | | | | | | | | | | | | | | | | |
| | | | |
| Alternative Investment Funds: 5.10% | | | | | | | | | | | | | | | | |
AQR Managed Futures Strategy Fund Class I | | | | | | | | | | | 1,192,899 | | | | 11,117,816 | |
| | | | | | | | | | | | | | | | |
| | | | |
Total Investment Companies (Cost $12,153,102) | | | | | | | | | | | | | | | 11,117,816 | |
| | | | | | | | | | | | | | | | |
| | | | |
| | | | | | | | | Principal | | | | |
| Municipal Obligations: 0.35% | | | | | | | | | | | | | | | | |
| | | | |
| Puerto Rico: 0.35% | | | | | | | | | | | | | | | | |
Puerto Rico Commonwealth Public Improvement Series A (GO Revenue) (i)(s) | | | 5.75 | | | | 7-1-2041 | | | $ | 5,000 | | | | 3,075 | |
Puerto Rico Commonwealth Refunding Bond Public Improvement Series A (GO Revenue) (i)(s) | | | 5.00 | | | | 7-1-2041 | | | | 10,000 | | | | 6,050 | |
Puerto Rico Commonwealth Refunding Bond Public Improvement Series A (GO Revenue) (i)(s) | | | 5.13 | | | | 7-1-2037 | | | | 95,000 | | | | 58,781 | |
Puerto Rico Commonwealth Unrefunded Balance Bond Public Improvement Series A (GO Revenue) (i)(s) | | | 5.00 | | | | 7-1-2033 | | | | 80,000 | | | | 49,800 | |
Puerto Rico Commonwealth Unrefunded Balance Bond Public Improvement Series A (GO Revenue) (i)(s) | | | 5.00 | | | | 7-1-2034 | | | | 10,000 | | | | 6,238 | |
Puerto Rico Commonwealth Unrefunded Balance Bond Public Improvement Series A (Tax Revenue) (i)(s) | | | 5.13 | | | | 7-1-2031 | | | | 10,000 | | | | 6,288 | |
Puerto Rico Commonwealth Unrefunded Balance Bond Public Improvement Series B (GO Revenue) (i)(s) | | | 5.25 | | | | 7-1-2032 | | | | 5,000 | | | | 3,088 | |
Puerto Rico Public Buildings Authority Government Facilities Series T (Miscellaneous Revenue) (i)(s) | | | 5.60 | | | | 7-1-2030 | | | | 646,000 | | | | 423,130 | |
Puerto Rico Sales Tax Financing Corporation Series B (Tax Revenue) (i) | | | 6.05 | | | | 8-1-2036 | | | | 110,000 | | | | 77,296 | |
Puerto Rico Sales Tax Financing Corporation Series B (Tax Revenue) (i) | | | 6.05 | | | | 8-1-2037 | | | | 90,000 | | | | 63,231 | |
Puerto Rico Sales Tax Financing Corporation Series B (Tax Revenue) (i) | | | 6.05 | | | | 8-1-2038 | | | | 65,000 | | | | 45,678 | |
Puerto Rico Sales Tax Financing Corporation Series B (Tax Revenue) (i) | | | 6.05 | | | | 8-1-2039 | | | | 15,000 | | | | 10,538 | |
Puerto Rico Sales Tax Financing Corporation Series C (Tax Revenue) (i) | | | 6.00 | | | | 8-1-2038 | | | | 10,000 | | | | 7,027 | |
| | | | |
Total Municipal Obligations (Cost $810,324) | | | | | | | | | | | | | | | 760,220 | |
| | | | | | | | | | | | | | | | |
| | | | |
| Non-Agency Mortgage-Backed Securities: 5.75% | | | | | | | | | | | | | | | | |
American Home Mortgage Investment Corporation Series 2006-1 Class A2 ± | | | 0.91 | | | | 3-25-2046 | | | | 2,656,916 | | | | 1,087,638 | |
Bear Stearns Alternative A-paper Trust Series 2006-3 Class 34A1 ± | | | 3.10 | | | | 5-25-2036 | | | | 1,889,172 | | | | 1,144,883 | |
BNC Mortgage Loan Trust Series 2007-4 Class A2 ± | | | 2.09 | | | | 11-25-2037 | | | | 2,500,000 | | | | 1,090,781 | |
Carrington Mortgage Loan Trust Series 06-NC4 Class A3 ± | | | 0.75 | | | | 10-25-2036 | | | | 3,250,000 | | | | 2,335,585 | |
Citi Held for Asset Issuance Series 16-MP1 Class A 144A | | | 4.65 | | | | 4-15-2025 | | | | 764,031 | | | | 777,005 | |
Citi Held for Asset Issuance Series 16-MP1 Class B 144A | | | 7.67 | | | | 4-15-2025 | | | | 915,000 | | | | 964,627 | |
Credit-Based Asset Servicing and Securitization LLC Series 07-CB4 Class A1B ± | | | 0.71 | | | | 4-25-2037 | | | | 8,000,000 | | | | 2,357,228 | |
JPMorgan Chase Real Estate Mortgage Investment Conduit Series 2015-4 Class 1A7 144A± | | | 0.72 | | | | 6-26-2047 | | | | 3,285,191 | | | | 996,305 | |
The accompanying notes are an integral part of these financial statements.
| | | | | | |
| Portfolio of investments—December 31, 2016 (unaudited) | | Wells Fargo Alternative Strategies Fund | | | 25 | |
| | | | | | | | | | | | | | | | |
| Security name | | Interest rate | | | Maturity date | | | Principal | | | Value | |
| | | | |
| Non-Agency Mortgage-Backed Securities (continued) | | | | | | | | | | | | | | | | |
Lehman Mortgage Trust Series 2008-4 Class A1 ± | | | 1.14 | % | | | 1-25-2037 | | | $ | 929,120 | | | $ | 445,995 | |
Merrill Lynch Alternative Note Series 2007-OAR2 Class A2 ± | | | 0.80 | | | | 4-25-2037 | | | | 2,382,377 | | | | 1,329,865 | |
| | | | |
Total Non-Agency Mortgage-Backed Securities (Cost $12,526,228) | | | | | | | | | | | | | | | 12,529,912 | |
| | | | | | | | | | | | | | | | |
| | | | |
| | | | | | Expiration date | | | Shares | | | | |
| | | | |
Participation Notes: 1.50% | | | | | | | | | | | | | | | | |
| | | | |
Financials: 0.94% | | | | | | | | | | | | | | | | |
| | | | |
| Banks: 0.94% | | | | | | | | | | | | | | | | |
HSBC Bank plc (Alinma AB) † | | | | | | | 1-22-2018 | | | | 511,465 | | | | 2,054,476 | |
| | | | | | | | | | | | | | | | |
| | | | |
Materials: 0.56% | | | | | | | | | | | | | | | | |
| | | | |
| Chemicals: 0.56% | | | | | | | | | | | | | | | | |
Merrill Lynch International & Company CV (Saudi Basic Industries Corporation) † | | | | | | | 3-2-2017 | | | | 50,295 | | | | 1,226,508 | |
| | | | | | | | | | | | | | | | |
| | | | |
Total Participation Notes (Cost $2,910,731) | | | | | | | | | | | | | | | 3,280,984 | |
| | | | | | | | | | | | | | | | |
| | | | |
| | | Dividend yield | | | | | | | | | | |
| Preferred Stocks: 0.28% | | | | | | | | | | | | | | | | |
| | | | |
Financials: 0.01% | | | | | | | | | | | | | | | | |
| | | | |
| Thrifts & Mortgage Finance: 0.01% | | | | | | | | | | | | | | | | |
FHLMC † | | | 0.00 | | | | | | | | 450 | | | | 3,420 | |
FHLMC † | | | 0.00 | | | | | | | | 219 | | | | 1,303 | |
FHLMC † | | | 0.00 | | | | | | | | 443 | | | | 2,798 | |
FNMA † | | | 0.00 | | | | | | | | 400 | | | | 3,200 | |
FNMA † | | | 0.00 | | | | | | | | 484 | | | | 3,340 | |
| | | | |
| | | | | | | | | | | | | | | 14,061 | |
| | | | | | | | | | | | | | | | |
| | | | |
Health Care: 0.22% | | | | | | | | | | | | | | | | |
| | | | |
| Pharmaceuticals: 0.22% | | | | | | | | | | | | | | | | |
Allergan plc ± | | | 7.21 | | | | | | | | 621 | | | | 473,488 | |
| | | | | | | | | | | | | | | | |
| | | | |
Industrials: 0.03% | | | | | | | | | | | | | | | | |
| | | | |
| Transportation Infrastructure: 0.03% | | | | | | | | | | | | | | | | |
Uber Technologies Incorporated †(a)(i) | | | 0.00 | | | | | | | | 1,216 | | | | 59,307 | |
| | | | | | | | | | | | | | | | |
| | | | |
Utilities: 0.02% | | | | | | | | | | | | | | | | |
| | | | |
| Water Utilities: 0.02% | | | | | | | | | | | | | | | | |
Companhia de Saneamento do Parana ± | | | 3.09 | | | | | | | | 16,800 | | | | 55,489 | |
| | | | | | | | | | | | | | | | |
| | | | |
Total Preferred Stocks (Cost $700,057) | | | | | | | | | | | | | | | 602,345 | |
| | | | | | | | | | | | | | | | |
| | | | |
| | | Strike price | | | | | | Contracts | | | | |
| Purchased Put Options: 0.26% | | | | | | | | | | | | | | | | |
Corning Incorporated | | $ | 24 | | | | 2-17-2017 | | | | 30,300 | | | | 23,331 | |
Electronic Arts Incorporated | | | 78 | | | | 1-20-2017 | | | | 9,600 | | | | 14,112 | |
iShares MSCI Emerging Markets ETF | | | 35 | | | | 2-17-2017 | | | | 180,300 | | | | 149,649 | |
The accompanying notes are an integral part of these financial statements.
| | | | |
| 26 | | Wells Fargo Alternative Strategies Fund | | Portfolio of investments—December 31, 2016 (unaudited) |
| | | | | | | | | | | | | | | | |
| Security name | | Strike price | | | Expiration date | | | Contracts | | | Value | |
| | | | |
| Purchased Put Options (continued) | | | | | | | | | | | | | | | | |
S&P 500 Index | | $ | 1,875 | | | | 3-17-2017 | | | | 2,100 | | | $ | 11,760 | |
S&P 500 Index | | | 1,875 | | | | 6-16-2017 | | | | 2,100 | | | | 44,940 | |
S&P 500 Index | | | 1,975 | | | | 12-15-2017 | | | | 1,700 | | | | 116,450 | |
S&P 500 Index | | | 2,025 | | | | 9-15-2017 | | | | 1,700 | | | | 101,150 | |
SPDR S&P 500 ETF | | | 223 | | | | 2-17-2017 | | | | 27,700 | | | | 105,260 | |
| | | | |
Total Purchased Put Options (Cost $894,663) | | | | | | | | | | | | | | | 566,652 | |
| | | | | | | | | | | | | | | | |
| | | | |
| | | | | | | | | Shares | | | | |
| Warrants: 0.00% | | | | | | | | | | | | | | | | |
| | | | |
Industrials: 0.00% | | | | | | | | | | | | | | | | |
| | | | |
| Trading Companies & Distributors: 0.00% | | | | | | | | | | | | | | | | |
Nexeo Solutions Incorporated † | | | | | | | 6-9-2021 | | | | 14,855 | | | | 10,399 | |
| | | | | | | | | | | | | | | | |
| | | | |
Total Warrants (Cost $11,201) | | | | | | | | | | | | | | | 10,399 | |
| | | | | | | | | | | | | | | | |
| | | | |
| | | Interest rate | | | Maturity date | | | Principal | | | | |
| Yankee Corporate Bonds and Notes: 0.51% | | | | | | | | | | | | | | | | |
| | | | |
Energy: 0.26% | | | | | | | | | | | | | | | | |
| | | | |
| Oil, Gas & Consumable Fuels: 0.26% | | | | | | | | | | | | | | | | |
Weatherford International Limited | | | 7.00 | % | | | 3-15-2038 | | | $ | 675,000 | | | | 561,938 | |
| | | | | | | | | | | | | | | | |
| | | | |
Health Care: 0.25% | | | | | | | | | | | | | | | | |
| | | | |
| Pharmaceuticals: 0.25% | | | | | | | | | | | | | | | | |
Valeant Pharmaceuticals International Incorporated 144A | | | 6.13 | | | | 4-15-2025 | | | | 360,000 | | | | 270,450 | |
Valeant Pharmaceuticals International Incorporated 144A | | | 6.38 | | | | 10-15-2020 | | | | 315,000 | | | | 270,604 | |
| | | | |
| | | | | | | | | | | | | | | 541,054 | |
| | | | | | | | | | | | | | | | |
| | | | |
Total Yankee Corporate Bonds and Notes (Cost $1,085,415) | | | | | | | | | | | | | | | 1,102,992 | |
| | | | | | | | | | | | | | | | |
| | | | |
| | | Yield | | | | | | Shares | | | | |
| Short-Term Investments: 19.99% | | | | | | | | | | | | | | | | |
| | | | |
| Investment Companies: 18.52% | | | | | | | | | | | | | | | | |
Wells Fargo Government Money Market Fund Select Class (l)(u) | | | 0.43 | | | | | | | | 40,395,204 | | | | 40,395,204 | |
| | | | | | | | | | | | | | | | |
| | | | |
| | | | | | | | | Principal | | | | |
| | | | |
| U.S. Treasury Securities: 1.47% | | | | | | | | | | | | | | | | |
U.S. Treasury Bill #(z) | | | 0.51 | | | | 3-16-2017 | | | $ | 3,210,000 | | | | 3,206,790 | |
| | | | | | | | | | | | | | | | |
| | | | |
Total Short-Term Investments (Cost $43,601,801) | | | | | | | | | | | | | | | 43,601,994 | |
| | | | | | | | | | | | | | | | |
| | | | |
| | | | | | | | | Shares | | | | |
| | | | |
Securities Sold Short: (22.68%) | | | | | | | | | | | | | | | | |
| | | | |
Common Stocks: (13.95%) | | | | | | | | | | | | | | | | |
| | | | |
Consumer Discretionary: (1.73%) | | | | | | | | | | | | | | | | |
| | | | |
| Auto Components: (0.11%) | | | | | | | | | | | | | | | | |
Delphi Automotive plc | | | | | | | | | | | (3,687 | ) | | | (248,319 | ) |
| | | | | | | | | | | | | | | | |
The accompanying notes are an integral part of these financial statements.
| | | | | | |
| Portfolio of investments—December 31, 2016 (unaudited) | | Wells Fargo Alternative Strategies Fund | | | 27 | |
| | | | | | | | | | | | | | | | |
| Security name | | | | | | | | Shares | | | Value | |
| | | | |
| Automobiles: (0.93%) | | | | | | | | | | | | | | | | |
Ford Motor Company | | | | | | | | | | | (15,694 | ) | | $ | (190,368 | ) |
General Motors Company | | | | | | | | | | | (7,847 | ) | | | (273,389 | ) |
Tesla Motors Incorporated † | | | | | | | | | | | (1,108 | ) | | | (236,769 | ) |
Toyota Motor Corporation ADR | | | | | | | | | | | (11,274 | ) | | | (1,321,313 | ) |
| | | | |
| | | | | | | | | | | | | | | (2,021,839 | ) |
| | | | | | | | | | | | | | | | |
| | | | |
| Hotels, Restaurants & Leisure: (0.18%) | | | | | | | | | | | | | | | | |
Darden Restaurants Incorporated | | | | | | | | | | | (5,287 | ) | | | (384,471 | ) |
Domino’s Pizza Incorporated | | | | | | | | | | | (74 | ) | | | (11,784 | ) |
| | | | |
| | | | | | | | | | | | | | | (396,255 | ) |
| | | | | | | | | | | | | | | | |
| | | | |
| Household Durables: (0.15%) | | | | | | | | | | | | | | | | |
Electrolux AB Series B | | | | | | | | | | | (12,881 | ) | | | (319,954 | ) |
| | | | | | | | | | | | | | | | |
| | | | |
| Internet & Direct Marketing Retail: (0.15%) | | | | | | | | | | | | | | | | |
The Priceline Group Incorporated † | | | | | | | | | | | (222 | ) | | | (325,465 | ) |
| | | | | | | | | | | | | | | | |
| | | | |
| Multiline Retail: (0.01%) | | | | | | | | | | | | | | | | |
Dollar Tree Incorporated † | | | | | | | | | | | (149 | ) | | | (11,500 | ) |
| | | | | | | | | | | | | | | | |
| | | | |
| Specialty Retail: (0.01%) | | | | | | | | | | | | | | | | |
Burlington Stores Incorporated † | | | | | | | | | | | (151 | ) | | | (12,797 | ) |
Ross Stores Incorporated | | | | | | | | | | | (263 | ) | | | (17,253 | ) |
| | | | |
| | | | | | | | | | | | | | | (30,050 | ) |
| | | | | | | | | | | | | | | | |
| | | | |
| Textiles, Apparel & Luxury Goods: (0.19%) | | | | | | | | | | | | | | | | |
Compagnie Financière Richemont SA | | | | | | | | | | | (3,058 | ) | | | (202,555 | ) |
The Swatch Group AG | | | | | | | | | | | (670 | ) | | | (208,376 | ) |
| | | | |
| | | | | | | | | | | | | | | (410,931 | ) |
| | | | | | | | | | | | | | | | |
| | | | |
Consumer Staples: (0.72%) | | | | | | | | | | | | | | | | |
| | | | |
| Food & Staples Retailing: (0.34%) | | | | | | | | | | | | | | | | |
Costco Wholesale Corporation | | | | | | | | | | | (4,012 | ) | | | (642,361 | ) |
Wal-Mart Stores Incorporated | | | | | | | | | | | (1,262 | ) | | | (87,229 | ) |
| | | | |
| | | | | | | | | | | | | | | (729,590 | ) |
| | | | | | | | | | | | | | | | |
| | | | |
| Household Products: (0.28%) | | | | | | | | | | | | | | | | |
The Procter & Gamble Company | | | | | | | | | | | (7,324 | ) | | | (615,802 | ) |
| | | | | | | | | | | | | | | | |
| | | | |
| Tobacco: (0.10%) | | | | | | | | | | | | | | | | |
British American Tobacco plc | | | | | | | | | | | (1,907 | ) | | | (214,862 | ) |
| | | | | | | | | | | | | | | | |
| | | | |
Energy: (3.47%) | | | | | | | | | | | | | | | | |
| | | | |
| Energy Equipment & Services: (1.64%) | | | | | | | | | | | | | | | | |
National Oilwell Varco Incorporated | | | | | | | | | | | (42,470 | ) | | | (1,590,077 | ) |
Schlumberger Limited | | | | | | | | | | | (23,711 | ) | | | (1,990,538 | ) |
| | | | |
| | | | | | | | | | | | | | | (3,580,615 | ) |
| | | | | | | | | | | | | | | | |
The accompanying notes are an integral part of these financial statements.
| | | | |
| 28 | | Wells Fargo Alternative Strategies Fund | | Portfolio of investments—December 31, 2016 (unaudited) |
| | | | | | | | | | | | | | | | |
| Security name | | | | | | | | Shares | | | Value | |
| | | | |
| Oil, Gas & Consumable Fuels: (1.83%) | | | | | | | | | | | | | | | | |
Apache Corporation | | | | | | | | | | | (17,417 | ) | | $ | (1,105,457 | ) |
Chevron Corporation | | | | | | | | | | | (10,107 | ) | | | (1,189,594 | ) |
EOG Resources Incorporated | | | | | | | | | | | (1,188 | ) | | | (120,107 | ) |
Marathon Oil Corporation | | | | | | | | | | | (10,525 | ) | | | (182,188 | ) |
Occidental Petroleum Corporation | | | | | | | | | | | (19,465 | ) | | | (1,386,492 | ) |
| | | | |
| | | | | | | | | | | | | | | (3,983,838 | ) |
| | | | | | | | | | | | | | | | |
| | | | |
Financials: (0.09%) | | | | | | | | | | | | | | | | |
| | | | |
| Banks: (0.09%) | | | | | | | | | | | | | | | | |
DBS Group Holdings Limited | | | | | | | | | | | (16,662 | ) | | | (199,509 | ) |
| | | | | | | | | | | | | | | | |
| | | | |
Health Care: (0.50%) | | | | | | | | | | | | | | | | |
| | | | |
| Health Care Equipment & Supplies: (0.39%) | | | | | | | | | | | | | | | | |
Abbott Laboratories | | | | | | | | | | | (15,513 | ) | | | (595,854 | ) |
Intuitive Surgical Incorporated † | | | | | | | | | | | (402 | ) | | | (254,936 | ) |
| | | | |
| | | | | | | | | | | | | | | (850,790 | ) |
| | | | | | | | | | | | | | | | |
| | | | |
| Health Care Technology: (0.11%) | | | | | | | | | | | | | | | | |
Cerner Corporation † | | | | | | | | | | | (5,160 | ) | | | (244,429 | ) |
| | | | | | | | | | | | | | | | |
| | | | |
Industrials: (2.34%) | | | | | | | | | | | | | | | | |
| | | | |
| Aerospace & Defense: (0.68%) | | | | | | | | | | | | | | | | |
The Boeing Company | | | | | | | | | | | (1,027 | ) | | | (159,883 | ) |
United Technologies Corporation | | | | | | | | | | | (11,974 | ) | | | (1,312,590 | ) |
| | | | |
| | | | | | | | | | | | | | | (1,472,473 | ) |
| | | | | | | | | | | | | | | | |
| | | | |
| Industrial Conglomerates: (0.70%) | | | | | | | | | | | | | | | | |
3M Company | | | | | | | | | | | (1,557 | ) | | | (278,033 | ) |
General Electric Company | | | | | | | | | | | (39,621 | ) | | | (1,252,023 | ) |
| | | | |
| | | | | | | | | | | | | | | (1,530,056 | ) |
| | | | | | | | | | | | | | | | |
| | | | |
| Machinery: (0.15%) | | | | | | | | | | | | | | | | |
Caterpillar Incorporated | | | | | | | | | | | (3,609 | ) | | | (334,699 | ) |
| | | | | | | | | | | | | | | | |
| | | | |
| Road & Rail: (0.68%) | | | | | | | | | | | | | | | | |
Kansas City Southern | | | | | | | | | | | (2,952 | ) | | | (250,477 | ) |
Union Pacific Corporation | | | | | | | | | | | (11,771 | ) | | | (1,220,417 | ) |
| | | | |
| | | | | | | | | | | | | | | (1,470,894 | ) |
| | | | | | | | | | | | | | | | |
| | | | |
| Trading Companies & Distributors: (0.13%) | | | | | | | | | | | | | | | | |
W.W. Grainger Incorporated | | | | | | | | | | | (1,237 | ) | | | (287,293 | ) |
| | | | | | | | | | | | | | | | |
| | | | |
Information Technology: (4.48%) | | | | | | | | | | | | | | | | |
| | | | |
| Electronic Equipment, Instruments & Components: (0.88%) | | | | | | | | | | | | | | | | |
Amphenol Corporation Class A | | | | | | | | | | | (6,801 | ) | | | (457,027 | ) |
Corning Incorporated | | | | | | | | | | | (60,284 | ) | | | (1,463,093 | ) |
| | | | |
| | | | | | | | | | | | | | | (1,920,120 | ) |
| | | | | | | | | | | | | | | | |
The accompanying notes are an integral part of these financial statements.
| | | | | | |
| Portfolio of investments—December 31, 2016 (unaudited) | | Wells Fargo Alternative Strategies Fund | | | 29 | |
| | | | | | | | | | | | | | | | |
| Security name | | | | | | | | Shares | | | Value | |
| | | | |
| Internet Software & Services: (0.50%) | | | | | | | | | | | | | | | | |
Alibaba Group Holding Limited ADR † | | | | | | | | | | | (9,254 | ) | | $ | (812,594 | ) |
MercadoLibre Incorporated | | | | | | | | | | | (1,637 | ) | | | (255,601 | ) |
Yahoo! Incorporated | | | | | | | | | | | (8,200 | ) | | | (31,502 | ) |
| | | | |
| | | | | | | | | | | | | | | (1,099,697 | ) |
| | | | | | | | | | | | | | | | |
| | | | |
| IT Services: (1.40%) | | | | | | | | | | | | | | | | |
Accenture plc Class A | | | | | | | | | | | (4,313 | ) | | | (505,182 | ) |
Infosys Limited ADR | | | | | | | | | | | (95,739 | ) | | | (1,419,810 | ) |
International Business Machines Corporation | | | | | | | | | | | (6,781 | ) | | | (1,125,578 | ) |
| | | | |
| | | | | | | | | | | | | | | (3,050,570 | ) |
| | | | | | | | | | | | | | | | |
| | | | |
| Software: (1.51%) | | | | | | | | | | | | | | | | |
Activision Blizzard Incorporated | | | | | | | | | | | (26,404 | ) | | | (953,448 | ) |
Electronic Arts Incorporated † | | | | | | | | | | | (17,103 | ) | | | (1,347,032 | ) |
Oracle Corporation | | | | | | | | | | | (12,785 | ) | | | (491,583 | ) |
Workday Incorporated Class A † | | | | | | | | | | | (7,729 | ) | | | (510,810 | ) |
| | | | |
| | | | | | | | | | | | | | | (3,302,873 | ) |
| | | | | | | | | | | | | | | | |
| | | | |
| Technology Hardware, Storage & Peripherals: (0.19%) | | | | | | | | | | | | | | | | |
Apple Incorporated | | | | | | | | | | | (3,506 | ) | | | (406,065 | ) |
| | | | | | | | | | | | | | | | |
| | | | |
Materials: (0.13%) | | | | | | | | | | | | | | | | |
| | | | |
| Metals & Mining: (0.13%) | | | | | | | | | | | | | | | | |
Barrick Gold Corporation | | | | | | | | | | | (17,600 | ) | | | (281,248 | ) |
| | | | | | | | | | | | | | | | |
| | | | |
Real Estate: (0.35%) | | | | | | | | | | | | | | | | |
| | | | |
| Equity REITs: (0.35%) | | | | | | | | | | | | | | | | |
AvalonBay Communities Incorporated | | | | | | | | | | | (1,504 | ) | | | (266,434 | ) |
Equinix Incorporated | | | | | | | | | | | (1,368 | ) | | | (488,937 | ) |
| | | | |
| | | | | | | | | | | | | | | (755,371 | ) |
| | | | | | | | | | | | | | | | |
| | | | |
Telecommunication Services: (0.03%) | | | | | | | | | | | | | | | | |
| | | | |
| Diversified Telecommunication Services: (0.03%) | | | | | | | | | | | | | | | | |
AT&T Incorporated | | | | | | | | | | | (1,741 | ) | | | (74,045 | ) |
| | | | | | | | | | | | | | | | |
| | | | |
Utilities: (0.11%) | | | | | | | | | | | | | | | | |
| | | | |
| Multi-Utilities: (0.11%) | | | | | | | | | | | | | | | | |
Consolidated Edison Incorporated | | | | | | | | | | | (3,310 | ) | | | (243,882 | ) |
| | | | | | | | | | | | | | | | |
| | | | |
Total Common Stocks - Securities Sold Short (Proceeds $(30,270,219)) | | | | | | | | | | | | | | | (30,413,034 | ) |
| | | | | | | | | | | | | | | | |
| | | | |
Exchange-Traded Funds: (8.73%) | | | | | | | | | | | | | | | | |
Consumer Discretionary Select Sector SPDR Fund ETF | | | | | | | | | | | (6,660 | ) | | | (542,124 | ) |
Consumer Staples Select Sector SPDR Fund ETF | | | | | | | | | | | (51,231 | ) | | | (2,649,157 | ) |
Health Care Select Sector SPDR Fund ETF | | | | | | | | | | | (3,345 | ) | | | (230,604 | ) |
Industrial Select Sector SPDR Fund ETF | | | | | | | | | | | (10,563 | ) | | | (657,230 | ) |
iShares iBoxx $ High Yield Corporate Bond ETF | | | | | | | | | | | (9,017 | ) | | | (780,421 | ) |
iShares MSCI Brazil Capped ETF | | | | | | | | | | | (23,142 | ) | | | (771,554 | ) |
The accompanying notes are an integral part of these financial statements.
| | | | |
| 30 | | Wells Fargo Alternative Strategies Fund | | Portfolio of investments—December 31, 2016 (unaudited) |
| | | | | | | | | | | | | | | | |
| Security name | | | | | | | | Shares | | | Value | |
| | | | |
Exchange-Traded Funds (continued) | | | | | | | | | | | | | | | | |
iShares MSCI China ETF | | | | | | | | | | | (22,166 | ) | | $ | (969,319 | ) |
iShares MSCI Emerging Markets ETF | | | | | | | | | | | (43,945 | ) | | | (1,538,514 | ) |
SPDR S&P 500 ETF | | | | | | | | | | | (43,516 | ) | | | (9,727,131 | ) |
SPDR S&P Regional Banking ETF | | | | | | | | | | | (11,267 | ) | | | (626,107 | ) |
Technology Select Sector SPDR Fund ETF | | | | | | | | | | | (11,238 | ) | | | (543,470 | ) |
| | | | |
Total Exchange-Traded Funds - Securities Sold Short (Proceeds $(18,883,968)) | | | | | | | | | | | | | | | (19,035,631 | ) |
| | | | | | | | | | | | | | | | |
| | | | |
Total Securities Sold Short (Proceeds $(49,154,187)) | | | | | | | | | | | | | | | (49,448,665 | ) |
| | | | | | | | | | | | | | | | |
| | | | | | | | |
| Total investments in securities (excluding securities sold short) (Cost $190,498,765) * | | | 92.32 | % | | | 201,305,114 | |
Total securities sold short (Proceeds $(49,154,187)) | | | (22.68 | ) | | | (49,448,665 | ) |
Other assets and liabilities, net | | | 30.36 | | | | 66,200,616 | |
| | | | | | | | |
| Total net assets | | | 100.00 | % | | $ | 218,057,065 | |
| | | | | | | | |
| † | Non-income-earning security |
| (b) | All or a portion of this security is segregated as collateral for securities sold short. |
| (a) | The security is fair valued in accordance with procedures approved by the Board of Trustees. |
| 144A | The security may be resold in transactions exempt from registration, normally to qualified institutional buyers, pursuant to Rule 144A under the Securities Act of 1933. |
| (s) | The security is currently in default with regards to scheduled interest and/or principal payments. |
| ¥ | A payment-in-kind (PIK) security is a security in which the issuer may make interest or dividend payments in cash or additional securities. These additional securities generally have the same terms as the original holdings. |
| @ | Foreign bond principal is denominated in the local currency of the issuer. |
| ± | Variable rate investment. The rate shown is the rate in effect at period end. |
| (l) | The issuer of the security is an affiliated person of the Fund as defined in the Investment Company Act of 1940. |
| (u) | The rate represents the 7-day annualized yield at period end. |
| # | All or a portion of this security is segregated as collateral for investments in derivative instruments. |
| (z) | Zero coupon security. The rate represents the current yield to maturity. |
| * | Cost for federal income tax purposes is $192,585,907 and unrealized gains (losses) consists of: |
| | | | | | |
Gross unrealized gains | | $ | 14,759,963 | | | |
Gross unrealized losses | | | (6,040,756 | ) | | |
| | | | | | |
Net unrealized gains | | $ | 8,719,207 | | | |
The accompanying notes are an integral part of these financial statements.
| | | | | | |
| Statement of assets and liabilities—December 31, 2016 (unaudited) | | Wells Fargo Alternative Strategies Fund | | | 31 | |
| | | | |
| | | | |
| |
Assets | | | | |
Investments | | | | |
In unaffiliated securities, at value (cost $150,103,561) | | $ | 160,909,910 | |
In affiliated securities, at value (cost $40,395,204) | | | 40,395,204 | |
| | | | |
Total investments, at value (cost $190,498,765) | | | 201,305,114 | |
Cash at prime broker for securities sold short | | | 47,514,845 | |
Cash at prime broker for derivatives | | | 1,544,643 | |
Foreign currency, at value (cost $14,745,976) | | | 14,478,734 | |
Receivable for investments sold | | | 4,143,452 | |
Principal paydown receivable | | | 11,386 | |
Receivable for Fund shares sold | | | 734,296 | |
Receivable for dividends and interest | | | 254,621 | |
Receivable for daily variation margin on open futures contracts | | | 164,335 | |
Unrealized gains on forward foreign currency contracts | | | 131,896 | |
Unrealized gains on total return swap transactions | | | 151,829 | |
Prepaid expenses and other assets | | | 46,347 | |
| | | | |
Total assets | | | 270,481,498 | |
| | | | |
| |
Liabilities | | | | |
Dividends payable on securities sold short | | | 99,625 | |
Payable for investments purchased | | | 291,386 | |
Payable for Fund shares redeemed | | | 1,518,183 | |
Due to custodian bank | | | 40,490 | |
Unrealized losses on total return swap transactions | | | 615 | |
Unrealized losses on forward foreign currency contracts | | | 14,264 | |
Payable for daily variation margin on open futures contracts | | | 186,982 | |
Written options, at value (premiums received $339,311) | | | 149,639 | |
Payable for securities sold short, at value (proceeds $49,154,187) | | | 49,448,665 | |
Management fee payable | | | 279,609 | |
Distribution fee payable | | | 5,563 | |
Administration fees payable | | | 28,453 | |
Accrued expenses and other liabilities | | | 360,959 | |
| | | | |
Total liabilities | | | 52,424,433 | |
| | | | |
Total net assets | | $ | 218,057,065 | |
| | | | |
| |
NET ASSETS CONSIST OF | | | | |
Paid-in capital | | $ | 222,185,125 | |
Accumulated net investment loss | | | (2,461,900 | ) |
Accumulated net realized losses on investments | | | (12,115,869 | ) |
Net unrealized gains on investments | | | 10,449,709 | |
| | | | |
Total net assets | | $ | 218,057,065 | |
| | | | |
| |
COMPUTATION OF NET ASSET VALUE AND OFFERING PRICE PER SHARE | | | | |
Net assets – Class A | | $ | 14,558,036 | |
Shares outstanding – Class A1 | | | 1,460,984 | |
Net asset value per share – Class A | | | $9.96 | |
Maximum offering price per share – Class A2 | | | $10.57 | |
Net assets – Class C | | $ | 7,343,373 | |
Shares outstanding – Class C1 | | | 752,066 | |
Net asset value per share – Class C | | | $9.76 | |
Net assets – Administrator Class | | $ | 2,642,157 | |
Shares outstanding – Administrator Class1 | | | 262,739 | |
Net asset value per share – Administrator Class | | | $10.06 | |
Net assets – Institutional Class | | $ | 193,513,499 | |
Shares outstanding – Institutional Class1 | | | 19,288,884 | |
Net asset value per share – Institutional Class | | | $10.03 | |
| 1 | The Fund has an unlimited number of authorized shares. |
| 2 | Maximum offering price is computed as 100/94.25 of net asset value. On investments of $50,000 or more, the offering price is reduced. |
The accompanying notes are an integral part of these financial statements.
| | | | |
| 32 | | Wells Fargo Alternative Strategies Fund | | Statement of operations—six months ended December 31, 2016 (unaudited) |
| | | | |
| | | | |
| |
Investment income | | | | |
Interest | | $ | 1,041,130 | |
Dividends (net of foreign withholding taxes of $14,919) | | | 994,109 | |
Income from affiliated securities | | | 88,266 | |
| | | | |
Total investment income | | | 2,123,505 | |
| | | | |
| |
Expenses | | | | |
Management fee | | | 2,151,272 | |
Administration fees | | | | |
Class A | | | 17,903 | |
Class C | | | 11,092 | |
Administrator Class | | | 18,116 | |
Institutional Class | | | 123,744 | |
Shareholder servicing fees | | | | |
Class A | | | 21,314 | |
Class C | | | 13,204 | |
Administrator Class | | | 34,838 | |
Distribution fee | | | | |
Class C | | | 39,613 | |
Custody and accounting fees | | | 276,631 | |
Professional fees | | | 33,225 | |
Registration fees | | | 45,987 | |
Shareholder report expenses | | | 45,287 | |
Trustees’ fees and expenses | | | 15,285 | |
Dividend expense on securities sold short | | | 627,924 | |
Prime broker fees | | | 282,324 | |
Other fees and expenses | | | 55,193 | |
| | | | |
Total expenses | | | 3,812,952 | |
Less: Fee waivers and/or expense reimbursements | | | (506,250 | ) |
| | | | |
Net expenses | | | 3,306,702 | |
| | | | |
Net investment loss | | | (1,183,197 | ) |
| | | | |
| |
REALIZED AND UNREALIZED GAINS (LOSSES) ON INVESTMENTS | | | | |
| |
Net realized gains (losses) on: | | | | |
Unaffiliated securities | | | 890,553 | |
Securities sold short | | | (4,319,247 | ) |
Futures transactions | | | 594,812 | |
Forward foreign currency contract transactions | | | 701,698 | |
Foreign currency and foreign currency translations | | | 87,919 | |
Written options | | | 187,878 | |
Credit default swap transactions | | | 998 | |
Total return swap transactions | | | (149,227 | ) |
| | | | |
Net realized losses on investments | | | (2,004,616 | ) |
| | | | |
| |
Net change in unrealized gains (losses) on: | | | | |
Unaffiliated securities | | | 3,479,042 | |
Securities sold short | | | 239,794 | |
Futures transactions | | | (1,045,464 | ) |
Forward foreign currency contract transactions | | | 10,865 | |
Foreign currency and foreign currency translations | | | (594,301 | ) |
Written options | | | 85,100 | |
Credit default swap transactions | | | (385 | ) |
Total return swap transactions | | | 277,470 | |
| | | | |
Net change in unrealized gains (losses) on investments | | | 2,452,121 | |
| | | | |
Net realized and unrealized gains (losses) on investments | | | 447,505 | |
| | | | |
Net decrease in net assets resulting from operations | | $ | (735,692 | ) |
| | | | |
The accompanying notes are an integral part of these financial statements.
| | | | | | |
| Statement of changes in net assets | | Wells Fargo Alternative Strategies Fund | | | 33 | |
| | | | | | | | | | | | | | | | |
| | | Six months ended
December 31, 2016
(unaudited) | | | Year ended
June 30, 2016 | |
| | | | |
Operations | | | | | | | | | | | | | | | | |
Net investment loss | | | | | | $ | (1,183,197 | ) | | | | | | $ | (1,733,443 | ) |
Net realized losses on investments | | | | | | | (2,004,616 | ) | | | | | | | (7,419,092 | ) |
Net change in unrealized gains (losses) on investments | | | | | | | 2,452,121 | | | | | | | | 2,956,492 | |
| | | | |
Net decrease in net assets resulting from operations | | | | | | | (735,692 | ) | | | | | | | (6,196,043 | ) |
| | | | |
| | | | |
Distributions to shareholders from | | | | | | | | | | | | | | | | |
Net realized gains | | | | | | | | | | | | | | | | |
Class A | | | | | | | 0 | | | | | | | | (223,836 | ) |
Class C | | | | | | | 0 | | | | | | | | (188,485 | ) |
Administrator Class | | | | | | | 0 | | | | | | | | (361,883 | ) |
Institutional Class | | | | | | | 0 | | | | | | | | (3,490,785 | ) |
| | | | |
Total distributions to shareholders | | | | | | | 0 | | | | | | | | (4,264,989 | ) |
| | | | |
| | | | |
Capital share transactions | | | Shares | | | | | | | | Shares | | | | | |
Proceeds from shares sold | | | | | | | | | | | | | | | | |
Class A | | | 232,940 | | | | 2,350,193 | | | | 1,817,481 | | | | 18,623,286 | |
Class C | | | 57,703 | | | | 568,200 | | | | 1,350,979 | | | | 13,802,561 | |
Administrator Class | | | 907,306 | | | | 9,143,597 | | | | 6,586,679 | | | | 67,641,035 | |
Institutional Class | | | 4,898,676 | | | | 49,241,343 | | | | 16,461,170 | | | | 170,134,081 | |
| | | | |
| | | | | | | 61,303,333 | | | | | | | | 270,200,963 | |
| | | | |
Reinvestment of distributions | | | | | | | | | | | | | | | | |
Class A | | | 0 | | | | 0 | | | | 22,001 | | | | 223,789 | |
Class C | | | 0 | | | | 0 | | | | 18,330 | | | | 184,236 | |
Administrator Class | | | 0 | | | | 0 | | | | 35,306 | | | | 360,174 | |
Institutional Class | | | 0 | | | | 0 | | | | 238,285 | | | | 2,433,253 | |
| | | | |
| | | | | | | 0 | | | | | | | | 3,201,452 | |
| | | | |
Payment for shares redeemed | | | | | | | | | | | | | | | | |
Class A | | | (532,004 | ) | | | (5,337,000 | ) | | | (470,113 | ) | | | (4,738,024 | ) |
Class C | | | (592,697 | ) | | | (5,829,471 | ) | | | (310,737 | ) | | | (3,077,186 | ) |
Administrator Class | | | (4,148,165 | ) | | | (41,525,785 | ) | | | (3,715,198 | ) | | | (38,113,736 | ) |
Institutional Class | | | (4,044,849 | ) | | | (40,827,922 | ) | | | (10,183,562 | ) | | | (105,316,859 | ) |
| | | | |
| | | | | | | (93,520,178 | ) | | | | | | | (151,245,805 | ) |
| | | | |
Net increase (decrease) in net assets resulting from capital share transactions | | | | | | | (32,216,845 | ) | | | | | | | 122,156,610 | |
| | | | |
Total increase (decrease) in net assets | | | | | | | (32,952,537 | ) | | | | | | | 111,695,578 | |
| | | | |
| | | | |
Net assets | | | | | | | | | | | | | | | | |
Beginning of period | | | | | | | 251,009,602 | | | | | | | | 139,314,024 | |
| | | | |
End of period | | | | | | $ | 218,057,065 | | | | | | | $ | 251,009,602 | |
| | | | |
Accumulated net investment loss | | | | | | $ | (2,461,900 | ) | | | | | | $ | (1,278,703 | ) |
| | | | |
The accompanying notes are an integral part of these financial statements.
| | | | |
| 34 | | Wells Fargo Alternative Strategies Fund | | Financial highlights |
(For a share outstanding throughout each period)
| | | | | | | | | | | | | | | | |
| | | Six months ended
December 31, 2016
(unaudited) | | | Year ended June 30 | | | Year ended
July 31, 20142 | |
| CLASS A | | | 2016 | | | 20151 | | |
Net asset value, beginning of period | | | $10.01 | | | | $10.58 | | | | $10.08 | | | | $10.00 | |
Net investment loss | | | (0.06 | )3 | | | (0.10 | )3 | | | (0.06 | )3 | | | (0.04 | ) |
Net realized and unrealized gains (losses) on investments | | | 0.01 | | | | (0.28 | ) | | | 0.71 | | | | 0.12 | |
| | | | | | | | | | | | | | | | |
Total from investment operations | | | (0.05 | ) | | | (0.38 | ) | | | 0.65 | | | | 0.08 | |
Distributions to shareholders from | | | | | | | | | | | | | | | | |
Net realized gains | | | 0.00 | | | | (0.19 | ) | | | (0.15 | ) | | | 0.00 | |
Net asset value, end of period | | | $9.96 | | | | $10.01 | | | | $10.58 | | | | $10.08 | |
Total return4 | | | (0.50 | )% | | | (3.65 | )% | | | 6.49 | % | | | 0.80 | % |
Ratios to average net assets (annualized) | | | | | | | | | | | | | | | | |
Gross expenses5 | | | 3.33 | % | | | 3.36 | % | | | 3.40 | % | | | 3.77 | % |
Net expenses5 | | | 2.86 | % | | | 2.95 | % | | | 2.93 | % | | | 3.00 | % |
Net investment loss5 | | | (1.14 | )% | | | (0.96 | )% | | | (0.64 | )% | | | (1.70 | )% |
Supplemental data | | | | | | | | | | | | | | | | |
Portfolio turnover rate | | | 122 | % | | | 284 | % | | | 237 | % | | | 92 | % |
Net assets, end of period (000s omitted) | | | $14,558 | | | | $17,616 | | | | $4,133 | | | | $1,571 | |
| 1 | For the eleven months ended June 30, 2015. The Fund changed its fiscal year end from July 31 to June 30, effective June 30, 2015. |
| 2 | For the period from April 30, 2014 (commencement of class operations) to July 31, 2014 |
| 3 | Calculated based upon average shares outstanding |
| 4 | Total return calculations do not include any sales charges. Returns for periods of less than one year are not annualized. |
| 5 | Ratios include prime broker fees and dividend expense on securities sold short as follows: |
| | | | |
Six months ended December 31, 2016 (unaudited) | | | 0.74 | % |
Year ended June 30, 2016 | | | 0.83 | % |
Year ended June 30, 20151 | | | 0.64 | % |
Year ended July 31, 20142 | | | 0.58 | % |
The accompanying notes are an integral part of these financial statements.
| | | | | | |
| Financial highlights | | Wells Fargo Alternative Strategies Fund | | | 35 | |
(For a share outstanding throughout each period)
| | | | | | | | | | | | | | | | |
| | | Six months ended
December 31, 2016
(unaudited) | | | Year ended June 30 | | | Year ended
July 31, 20142 | |
| CLASS C | | | 2016 | | | 20151 | | |
Net asset value, beginning of period | | | $9.84 | | | | $10.49 | | | | $10.06 | | | | $10.00 | |
Net investment loss | | | (0.10 | )3 | | | (0.17 | )3 | | | (0.13 | )3 | | | (0.06 | ) |
Net realized and unrealized gains (losses) on investments | | | 0.02 | | | | (0.29 | ) | | | 0.71 | | | | 0.12 | |
| | | | | | | | | | | | | | | | |
Total from investment operations | | | (0.08 | ) | | | (0.46 | ) | | | 0.58 | | | | 0.06 | |
Distributions to shareholders from | | | | | | | | | | | | | | | | |
Net realized gains | | | 0.00 | | | | (0.19 | ) | | | (0.15 | ) | | | 0.00 | |
Net asset value, end of period | | | $9.76 | | | | $9.84 | | | | $10.49 | | | | $10.06 | |
Total return4 | | | (0.81 | )% | | | (4.46 | )% | | | 5.80 | % | | | 0.60 | % |
Ratios to average net assets (annualized) | | | | | | | | | | | | | | | | |
Gross expenses5 | | | 4.06 | % | | | 4.10 | % | | | 4.14 | % | | | 4.49 | % |
Net expenses5 | | | 3.60 | % | | | 3.70 | % | | | 3.70 | % | | | 3.75 | % |
Net investment loss5 | | | (1.89 | )% | | | (1.73 | )% | | | (1.35 | )% | | | (2.45 | )% |
Supplemental data | | | | | | | | | | | | | | | | |
Portfolio turnover rate | | | 122 | % | | | 284 | % | | | 237 | % | | | 92 | % |
Net assets, end of period (000s omitted) | | | $7,343 | | | | $12,670 | | | | $2,396 | | | | $1,133 | |
| 1 | For the eleven months ended June 30, 2015. The Fund changed its fiscal year end from July 31 to June 30, effective June 30, 2015. |
| 2 | For the period from April 30, 2014 (commencement of class operations) to July 31, 2014 |
| 3 | Calculated based upon average shares outstanding |
| 4 | Total return calculations do not include any sales charges. Returns for periods of less than one year are not annualized. |
| 5 | Ratios include prime broker fees and dividend expense on securities sold short as follows: |
| | | | |
Six months ended December 31, 2016 (unaudited) | | | 0.72 | % |
Year ended June 30, 2016 | | | 0.83 | % |
Year ended June 30, 20151 | | | 0.64 | % |
Year ended July 31, 20142 | | | 0.58 | % |
The accompanying notes are an integral part of these financial statements.
| | | | |
| 36 | | Wells Fargo Alternative Strategies Fund | | Financial highlights |
(For a share outstanding throughout each period)
| | | | | | | | | | | | | | | | |
| | | Six months ended
December 31, 2016
(unaudited) | | | Year ended June 30 | | | Year ended
July 31, 20142 | |
| ADMINISTRATOR CLASS | | | 2016 | | | 20151 | | |
Net asset value, beginning of period | | | $10.04 | | | | $10.60 | | | | $10.08 | | | | $10.00 | |
Net investment loss | | | (0.05 | )3 | | | (0.09 | )3 | | | (0.05 | )3 | | | (0.04 | ) |
Net realized and unrealized gains (losses) on investments | | | 0.07 | | | | (0.28 | ) | | | 0.72 | | | | 0.12 | |
| | | | | | | | | | | | | | | | |
Total from investment operations | | | 0.02 | | | | (0.37 | ) | | | 0.67 | | | | 0.08 | |
Distributions to shareholders from | | | | | | | | | | | | | | | | |
Net realized gains | | | 0.00 | | | | (0.19 | ) | | | (0.15 | ) | | | 0.00 | |
Net asset value, end of period | | | $10.06 | | | | $10.04 | | | | $10.60 | | | | $10.08 | |
Total return4 | | | 0.20 | % | | | (3.55 | )% | | | 6.58 | % | | | 0.90 | % |
Ratios to average net assets (annualized) | | | | | | | | | | | | | | | | |
Gross expenses5 | | | 3.17 | % | | | 3.28 | % | | | 3.25 | % | | | 3.57 | % |
Net expenses5 | | | 2.63 | % | | | 2.79 | % | | | 2.78 | % | | | 2.84 | % |
Net investment loss5 | | | (0.93 | )% | | | (0.85 | )% | | | (0.51 | )% | | | (1.54 | )% |
Supplemental data | | | | | | | | | | | | | | | | |
Portfolio turnover rate | | | 122 | % | | | 284 | % | | | 237 | % | | | 92 | % |
Net assets, end of period (000s omitted) | | | $2,642 | | | | $35,189 | | | | $6,326 | | | | $1,119 | |
| 1 | For the eleven months ended June 30, 2015. The Fund changed its fiscal year end from July 31 to June 30, effective June 30, 2015. |
| 2 | For the period from April 30, 2014 (commencement of class operations) to July 31, 2014 |
| 3 | Calculated based upon average shares outstanding |
| 4 | Returns for periods of less than one year are not annualized. |
| 5 | Ratios include prime broker fees and dividend expense on securities sold short as follows: |
| | | | |
Six months ended December 31, 2016 (unaudited) | | | 0.66 | % |
Year ended June 30, 2016 | | | 0.81 | % |
Year ended June 30, 20151 | | | 0.66 | % |
Year ended July 31, 20142 | | | 0.58 | % |
The accompanying notes are an integral part of these financial statements.
| | | | | | |
| Financial highlights | | Wells Fargo Alternative Strategies Fund | | | 37 | |
(For a share outstanding throughout each period)
| | | | | | | | | | | | | | | | |
| | | Six months ended
December 31, 2016
(unaudited) | | | Year ended June 30 | | | Year ended
July 31, 20142 | |
| INSTITUTIONAL CLASS | | | 2016 | | | 20151 | | |
Net asset value, beginning of period | | | $10.06 | | | | $10.61 | | | | $10.09 | | | | $10.00 | |
Net investment loss | | | (0.04 | ) | | | (0.06 | ) | | | (0.03 | ) | | | (0.04 | ) |
Net realized and unrealized gains (losses) on investments | | | 0.01 | | | | (0.30 | ) | | | 0.70 | | | | 0.13 | |
| | | | | | | | | | | | | | | | |
Total from investment operations | | | (0.03 | ) | | | (0.36 | ) | | | 0.67 | | | | 0.09 | |
Distributions to shareholders from | | | | | | | | | | | | | | | | |
Net realized gains | | | 0.00 | | | | (0.19 | ) | | | (0.15 | ) | | | 0.00 | |
Net asset value, end of period | | | $10.03 | | | | $10.06 | | | | $10.61 | | | | $10.09 | |
Total return3 | | | (0.40 | )% | | | (3.45 | )% | | | 6.68 | % | | | 0.90 | % |
Ratios to average net assets (annualized) | | | | | | | | | | | | | | | | |
Gross expenses4 | | | 3.02 | % | | | 3.00 | % | | | 2.95 | % | | | 3.29 | % |
Net expenses4 | | | 2.63 | % | | | 2.69 | % | | | 2.69 | % | | | 2.74 | % |
Net investment loss4 | | | (0.90 | )% | | | (0.72 | )% | | | (0.36 | )% | | | (1.44 | )% |
Supplemental data | | | | | | | | | | | | | | | | |
Portfolio turnover rate | | | 122 | % | | | 284 | % | | | 237 | % | | | 92 | % |
Net assets, end of period (000s omitted) | | | $193,513 | | | | $185,535 | | | | $126,459 | | | | $97,838 | |
| 1 | For the eleven months ended June 30, 2015. The Fund changed its fiscal year end from July 31 to June 30, effective June 30, 2015. |
| 2 | For the period from April 30, 2014 (commencement of class operations) to July 31, 2014 |
| 3 | Returns for periods of less than one year are not annualized. |
| 4 | Ratios include prime broker fees and dividend expense on securities sold short as follows: |
| | | | |
Six months ended December 31, 2016 (unaudited) | | | 0.75 | % |
Year ended June 30, 2016 | | | 0.81 | % |
Year ended June 30, 20151 | | | 0.62 | % |
Year ended July 31, 20142 | | | 0.58 | % |
The accompanying notes are an integral part of these financial statements.
| | | | |
| 38 | | Wells Fargo Alternative Strategies Fund | | Notes to financial statements (unaudited) |
1. ORGANIZATION
Wells Fargo Funds Trust (the “Trust”), a Delaware statutory trust organized on March 10, 1999, is an open-end management investment company registered under the Investment Company Act of 1940, as amended (the “1940 Act”). As an investment company, the Trust follows the accounting and reporting guidance in Financial Accounting Standards Board (“FASB”) Accounting Standards Codification Topic 946, Financial Services – Investment Companies. These financial statements report on the Wells Fargo Alternative Strategies Fund (the “Fund”) which is a diversified series of the Trust.
2. SIGNIFICANT ACCOUNTING POLICIES
The following significant accounting policies, which are consistently followed in the preparation of the financial statements of the Fund, are in conformity with U.S. generally accepted accounting principles which require management to make estimates and assumptions that affect the reported amounts of assets and liabilities, disclosure of contingent assets and liabilities at the date of the financial statements, and the reported amounts of revenues and expenses during the reporting period. Actual results could differ from those estimates.
Securities valuation
All investments are valued each business day as of the close of regular trading on the New York Stock Exchange (generally 4 p.m. Eastern Time), although the Fund may deviate from this calculation time under unusual or unexpected circumstances.
Equity securities, options and futures that are listed on a foreign or domestic exchange or market are valued at the official closing price or, if none, the last sales price. If no sale occurs on the principal exchange or market that day, the prior day’s price will be deemed “stale” and a fair value price will be determined in accordance with the Fund’s Valuation Procedures.
Non-listed options and swaps are valued at the evaluated price provided by an independent pricing service or, if a reliable price is not available, the quoted bid price from an independent broker-dealer.
The values of securities denominated in foreign currencies are translated into U.S. dollars at rates provided by an independent foreign currency pricing source at a time each business day specified by the Management Valuation Team of Wells Fargo Funds Management, LLC (“Funds Management”)
Many securities markets and exchanges outside the U.S. close prior to the close of the New York Stock Exchange and therefore may not fully reflect trading or events that occur after the close of the principal exchange in which the foreign securities are traded, but before the close of the New York Stock Exchange. If such trading or events are expected to materially affect the value of such securities, then fair value pricing procedures approved by the Board of Trustees of the Fund are applied. These procedures take into account multiple factors including movements in U.S. securities markets after foreign exchanges close. Foreign securities that are fair valued under these procedures are categorized as Level 2 and the application of these procedures may result in transfers between Level 1 and Level 2. Depending on market activity, such fair valuations may be frequent. Such fair value pricing may result in net asset values that are higher or lower than net asset values based on the last reported sales price or latest quoted bid price. On December 31, 2016, such fair value pricing was not used in pricing foreign securities.
Debt securities are valued at the evaluated bid price provided by an independent pricing service or, if a reliable price is not available, the quoted bid price from an independent broker-dealer.
Investments in registered open-end investment companies are valued at net asset value.
Investments which are not valued using any of the methods discussed above are valued at their fair value, as determined in good faith by the Board of Trustees. The Board of Trustees has established a Valuation Committee comprised of the Trustees and has delegated to it the authority to take any actions regarding the valuation of portfolio securities that the Valuation Committee deems necessary or appropriate, including determining the fair value of portfolio securities, unless the determination has been delegated to the Management Valuation Team. The Board of Trustees retains the authority to make or ratify any valuation decisions or approve any changes to the Valuation Procedures as it deems appropriate. On a quarterly basis, the Board of Trustees receives reports on any valuation actions taken by the Valuation Committee or the Management Valuation Team which may include items for ratification.
Valuations of fair valued securities are compared to the next actual sales price when available, or other appropriate market values, to assess the continued appropriateness of the fair valuation methodologies used. These securities are fair valued on a day-to-day basis, taking into consideration changes to appropriate market information and any significant changes to the inputs considered in the valuation process until there is a readily available price provided on an exchange
| | | | | | |
| Notes to financial statements (unaudited) | | Wells Fargo Alternative Strategies Fund | | | 39 | |
or by an independent pricing service. Valuations received from an independent pricing service or independent broker-dealer quotes are periodically validated by comparisons to most recent trades and valuations provided by other independent pricing services in addition to the review of prices by the manager and/or subadviser. Unobservable inputs used in determining fair valuations are identified based on the type of security, taking into consideration factors utilized by market participants in valuing the investment, knowledge about the issuer and the current market environment.
Foreign currency translation
The accounting records of the Fund are maintained in U.S. dollars. The values of other assets and liabilities denominated in foreign currencies are translated into U.S. dollars at rates provided by an independent foreign currency pricing source at a time each business day specified by the Management Valuation Team. Purchases and sales of securities, and income and expenses are converted at the rate of exchange on the respective dates of such transactions. Net realized foreign exchange gains or losses arise from sales of foreign currencies, currency gains or losses realized between the trade and settlement dates on securities transactions, and the difference between the amounts of dividends, interest and foreign withholding taxes recorded and the U.S. dollar equivalent of the amounts actually paid or received. Net unrealized foreign exchange gains and losses arise from changes in the fair value of assets and liabilities other than investments in securities resulting from changes in exchange rates. The changes in net assets arising from changes in exchange rates and the changes in net assets resulting from changes in market prices of securities are not separately presented. Such changes are included in net realized and unrealized gains or losses from investments.
Participation notes
The Fund may invest in participation notes to gain exposure to securities in certain foreign markets. Participation notes are issued by banks or broker-dealers and are designed to offer a return linked to a particular underlying foreign security. Participation notes involve transaction costs, which may be higher than those applicable to the underlying foreign security. The holder of the participation note is entitled to receive from the bank or broker-dealer, an amount equal to the dividend paid by the issuer of the underlying foreign security; however, the holder is not entitled to the same rights (i.e. dividends, voting rights) as an owner of the underlying foreign security. Investments in participation notes involve risks beyond those normally associated with a direct investment in an underlying security. The Fund has no rights against the issuer of the underlying foreign security and participation notes expose the Fund to counterparty risk in the event the counterparty does not perform. There is also no assurance there will be a secondary trading market for the participation note or that the trading price of the participation note will equal the underlying value of the foreign security that it seeks to replicate.
Forward foreign currency contracts
The Fund is subject to foreign currency risk in the normal course of pursuing its investment objectives. A forward foreign currency contract is an agreement between two parties to purchase or sell a specific currency for an agreed-upon price at a future date. The Fund enters into forward foreign currency contracts to facilitate transactions in foreign-denominated securities and to attempt to minimize the risk to the Fund from adverse changes in the relationship between currencies. Forward foreign currency contracts are recorded at the forward rate and marked-to-market daily. When the contracts are closed, realized gains and losses arising from such transactions are recorded as realized gains or losses on forward foreign currency contract transactions. The Fund could be exposed to risks if the counterparties to the contracts are unable to meet the terms of their contracts or if the value of the foreign currency changes unfavorably. The Fund’s maximum risk of loss from counterparty credit risk is the unrealized gains on the contracts. This risk may be mitigated if there is a master netting arrangement between the Fund and the counterparty.
When-issued transactions
The Fund may purchase securities on a forward commitment or when-issued basis. The Fund records a when-issued transaction on the trade date and will segregate assets in an amount at least equal in value to the Fund’s commitment to purchase when-issued securities. Securities purchased on a when-issued basis are marked-to-market daily and the Fund begins earning interest on the settlement date. Losses may arise due to changes in the market value of the underlying securities or if the counterparty does not perform under the contract.
Futures contracts
The Fund is subject to interest rate risk, equity price risk and foreign currency risk in the normal course of pursuing its investment objectives. The Fund may buy and sell futures contracts in order to gain exposure to, or protect against, changes in security values and interest rates. The primary risks associated with the use of futures contracts are the imperfect correlation between changes in market values of securities held by the Fund and the prices of futures contracts, and the possibility of an illiquid market.
| | | | |
| 40 | | Wells Fargo Alternative Strategies Fund | | Notes to financial statements (unaudited) |
The aggregate principal amounts of the contracts are not recorded in the financial statements. Fluctuations in the value of the contracts are recorded in the Statement of Assets and Liabilities as an asset or liability and in the Statement of Operations as unrealized gains or losses until the contracts are closed, at which point they are recorded as net realized gains or losses on futures contracts. With futures contracts, there is minimal counterparty risk to the Fund since futures are exchange traded and the exchange’s clearinghouse, as counterparty to all exchange traded futures, guarantees the futures against default.
Options
The Fund is subject to equity price risk in the normal course of pursuing its investment objectives. The Fund may write covered call options or secured put options on individual securities and/or indexes. When the Fund writes an option, an amount equal to the premium received is recorded as a liability and is subsequently adjusted to the current market value of the written option. Premiums received from written options that expire unexercised are recognized as realized gains on the expiration date. For exercised options, the difference between the premium received and the amount paid on effecting a closing purchase transaction, including brokerage commissions, is treated as a realized gain or loss. If a call option is exercised, the premium is added to the proceeds from the sale of the underlying security in calculating the realized gain or loss on the sale. If a put option is exercised, the premium reduces the cost of the security purchased. The Fund, as a writer of an option, bears the market risk of an unfavorable change in the price of the security and/or index underlying the written option.
The Fund may also purchase call or put options. Premiums paid are included in the Statement of Assets and Liabilities as investments, the values of which are subsequently adjusted based on the current market values of the options. Premiums paid for purchased options that expire are recognized as realized losses on the expiration date. Premiums paid for purchased options that are exercised or closed are added to the amount paid or offset against the proceeds received for the underlying security to determine the realized gain or loss. The risk of loss associated with purchased options is limited to the premium paid.
Options traded on an exchange are regulated and terms of the options are standardized. Purchased options traded over-the-counter expose the Fund to counterparty risk in the event the counterparty does not perform. This risk can be mitigated by having a master netting arrangement between the Fund and the counterparty and by having the counterparty post collateral to cover the Fund’s exposure to the counterparty.
Short sales
The Fund may sell a security it does not own in anticipation of a decline in the market value of that security (short sale). When the Fund makes a short sale, it must borrow the security sold short and deliver it to the buyer. The Fund is then obligated to replace the security borrowed by purchasing the security at the market price at the time of replacement.
The Fund records the proceeds as a liability which is marked-to-market daily based upon quotations from an independent pricing service or an independent broker-dealer and any change in value is recorded as an unrealized gain or loss. Any interest or dividends accrued on such borrowed securities during the period of the loan are recorded as an expense on the Statement of Operations. To borrow the security, the Fund may be required to pay a premium, which would decrease the proceeds of the security sold. A gain, limited to the price at which the Fund sold the security short, or a loss, unlimited in size, will be recognized upon the closing of a short sale if the market price at the closing is less than or greater than, respectively, the proceeds originally received. Until the short sale is closed or the borrowed security is replaced, the Fund maintains a segregated account of cash or liquid securities, the dollar value of which is at least equal to the market value of the security at the time of the short sale.
Credit default swaps
The Fund is subject to credit risk in the normal course of pursuing its investment objectives. The Fund may enter into credit default swap contracts for hedging or speculative purposes to provide or receive a measure of protection against default on a referenced entity, obligation or index or for investment gains. Credit default swaps involve an exchange of a stream of payments for protection against the loss in value of an underlying security or index. Under the terms of the swap, one party acts as a guarantor (referred to as the seller of protection) and receives a periodic stream of payments, provided that there is no credit event, from another party (referred to as the buyer of protection) that is a fixed percentage applied to a notional principal amount over the term of the swap. An index credit default swap references all the names in the index, and if a credit event is triggered, the credit event is settled based on that name’s weight in the index. A credit event includes bankruptcy, failure to pay, obligation default, obligation acceleration, repudiation/moratorium, and restructuring. The Fund may enter into credit default swaps as either the seller of protection or the buyer of protection. As the seller of protection, the Fund is subject to investment exposure on the notional amount of the swap and has assumed the risk of default of the underlying security or index. As the buyer of protection, the Fund could
| | | | | | |
| Notes to financial statements (unaudited) | | Wells Fargo Alternative Strategies Fund | | | 41 | |
be exposed to risks if the seller of the protection defaults on its obligation to perform, or if there are unfavorable changes in the fluctuation of interest rates. The maximum potential amount of future payments (undiscounted) that the Fund as the seller of protection could be required to make under the credit default swap contract would be an amount equal to the notional amount of the swap contract. The Fund’s maximum risk of loss from counterparty risk, either as the protection seller or as the protection buyer, is the fair value of the contract. This risk is mitigated by having a master netting arrangement between the Fund and the counterparty and by having the counterparty post collateral to cover the Fund’s exposure to the counterparty.
If the Fund is the seller of protection and a credit event occurs, as defined under the terms of that particular swap agreement, the Fund will pay to the buyer of protection the notional amount of the swap and take delivery of the referenced obligation or underlying securities comprising the referenced index. If the Fund is the buyer of protection and a credit event occurs, as defined under the terms of that particular swap agreement, the Fund will receive from the seller of protection the notional amount of the swap and deliver the referenced obligation or underlying securities comprising the referenced index.
Any premiums paid or received on the transactions are recorded as an asset or liability on the Statement of Assets and Liabilities and amortized. The value of the swap contract is marked-to-market daily based on quotations from an independent pricing service or an independent broker-dealer and any change in value is recorded as an unrealized gain or loss. Periodic payments made or received are recorded as realized gains or losses. In addition, payments received or made as a result of a credit event or termination of the contract are recognized as realized gains or losses.
Certain credit default swap contracts entered into by the Fund provide for conditions that result in events of default or termination that enable the counterparty to the agreement to cause an early termination of the transactions under those agreements.
Total return swaps
The Fund is subject to interest rate risk in the normal course of pursuing its investment objectives. The Fund may enter into total return swap contracts for hedging or speculative purposes. Total return swaps involve commitments to pay interest in exchange for a market-linked return, both based on notional amounts. To the extent the total return of the security or index underlying the transaction exceeds or falls short of the offsetting interest rate obligation, the Fund will receive a payment from, or make a payment to, the counterparty.
The value of the swap contract is marked-to-market daily based upon quotations from an independent pricing service or an independent broker-dealer and any change in value is recorded as an unrealized gain or loss. Periodic payments made or received are recorded as realized gains or losses. The Fund could be exposed to risks if the counterparty defaults on its obligation to perform, or if there are unfavorable changes in the fluctuation of interest rates or in the price of the underlying security or index. The Fund’s maximum risk of loss from counterparty risk is the fair value of the contract. This risk is mitigated by having a master netting arrangement between the Fund and the counterparty and by having the counterparty post collateral to cover the Fund’s exposure to the counterparty.
Certain total return swap contracts entered into by the Fund provide for conditions that result in events of default or termination that enable the counterparty to the agreement to cause an early termination of the transactions under those agreements. Any election by the counterparty to terminate early may impact the amounts reported on the financial statements.
Security transactions and income recognition
Securities transactions are recorded on a trade date basis. Realized gains or losses are recorded on the basis of identified cost.
Dividend income is recognized on the ex-dividend date, except for certain dividends from foreign securities, which are recorded as soon as the custodian verifies the ex-dividend date. Dividend income from foreign securities is recorded net of foreign taxes withheld where recovery of such taxes is not assured.
Interest income is accrued daily and bond discounts are accreted and premiums are amortized daily based on the effective interest method. To the extent debt obligations are placed on non-accrual status, any related interest income may be reduced by writing off interest receivables when the collection of all or a portion of interest has become doubtful based on consistently applied procedures. If the issuer subsequently resumes interest payments or when the collectability of interest is reasonably assured, the debt obligation is removed from non-accrual status.
| | | | |
| 42 | | Wells Fargo Alternative Strategies Fund | | Notes to financial statements (unaudited) |
Distributions to shareholders
Distributions to shareholders from net investment income and net realized gains, if any, are recorded on the ex-dividend date. Such distributions are determined in conformity with federal income tax regulations, which may differ in amount or character from net investment income and realized gains recognized for purposes of U.S. generally accepted accounting principles.
Federal and other taxes
The Fund intends to continue to qualify as a regulated investment company by distributing substantially all of its investment company taxable income and any net realized capital gains (after reduction for capital loss carryforwards) sufficient to relieve it from all, or substantially all, federal income taxes. Accordingly, no provision for federal income taxes was required.
The Fund’s income and federal excise tax returns and all financial records supporting those returns for the prior three fiscal years are subject to examination by the federal and Delaware revenue authorities. Management has analyzed the Fund’s tax positions taken on federal, state, and foreign tax returns for all open tax years and does not believe that there are any uncertain tax positions that require recognition of a tax liability.
As of June 30, 2016, the Fund had current year deferred post-October capital losses and a qualified late-year ordinary loss which were recognized on the first day of the current fiscal year in the following amounts:
| | | | |
Deferred post-October capital losses | | Late-year ordinary losses deferred |
| Short-term | | Long-term | |
| $(1,239,705) | | $(621,036) | | $(1,283,264) |
Class allocations
The separate classes of shares offered by the Fund differ principally in applicable sales charges, distribution, shareholder servicing, and administration fees. Class specific expenses are charged directly to that share class. Investment income, common expenses, and realized and unrealized gains (losses) on investments are allocated daily to each class of shares based on the relative proportion of net assets of each class.
3. FAIR VALUATION MEASUREMENTS
Fair value measurements of investments are determined within a framework that has established a fair value hierarchy based upon the various data inputs utilized in determining the value of the Fund’s investments. The three-level hierarchy gives the highest priority to unadjusted quoted prices in active markets for identical assets or liabilities (Level 1) and the lowest priority to significant unobservable inputs (Level 3). The Fund’s investments are classified within the fair value hierarchy based on the lowest level of input that is significant to the fair value measurement. The inputs are summarized into three broad levels as follows:
| ∎ | | Level 1 – quoted prices in active markets for identical securities |
| ∎ | | Level 2 – other significant observable inputs (including quoted prices for similar securities, interest rates, prepayment speeds, credit risk, use of amortized cost, etc.) |
| ∎ | | Level 3 – significant unobservable inputs (including the Fund’s own assumptions in determining the fair value of investments) |
The inputs or methodologies used for valuing investments in securities are not necessarily an indication of the risk associated with investing in those securities.
| | | | | | |
| Notes to financial statements (unaudited) | | Wells Fargo Alternative Strategies Fund | | | 43 | |
The following is a summary of the inputs used in valuing the Fund’s assets and liabilities as of December 31, 2016:
| | | | | | | | | | | | | | | | |
| | | Quoted prices
(Level 1) | | | Other significant
observable inputs
(Level 2) | | | Significant
unobservable inputs
(Level 3) | | | Total | |
Assets | | | | | | | | | | | | | | | | |
Investments in: | | | | | | | | | | | | | | | | |
| | | | |
Common stocks | | | | | | | | | | | | | | | | |
Consumer discretionary | | $ | 19,896,003 | | | $ | 0 | | | $ | 0 | | | $ | 19,896,003 | |
Consumer staples | | | 12,266,777 | | | | 0 | | | | 0 | | | | 12,266,777 | |
Energy | | | 12,799,471 | | | | 0 | | | | 0 | | | | 12,799,471 | |
Financials | | | 13,604,743 | | | | 50,827 | | | | 0 | | | | 13,655,570 | |
Health care | | | 11,319,194 | | | | 0 | | | | 0 | | | | 11,319,194 | |
Industrials | | | 14,643,464 | | | | 0 | | | | 0 | | | | 14,643,464 | |
Information technology | | | 24,071,172 | | | | 0 | | | | 0 | | | | 24,071,172 | |
Materials | | | 10,604,626 | | | | 0 | | | | 0 | | | | 10,604,626 | |
Real estate | | | 1,560,265 | | | | 0 | | | | 0 | | | | 1,560,265 | |
Telecommunication services | | | 3,028,546 | | | | 0 | | | | 0 | | | | 3,028,546 | |
Utilities | | | 659,763 | | | | 0 | | | | 0 | | | | 659,763 | |
| | | | |
Corporate bonds and notes | | | 0 | | | | 3,036,722 | | | | 0 | | | | 3,036,722 | |
| | | | |
Exchange-traded funds | | | 19,571 | | | | 0 | | | | 0 | | | | 19,571 | |
| | | | |
Foreign corporate bonds and notes | | | 0 | | | | 170,656 | | | | 0 | | | | 170,656 | |
| | | | |
Investment companies | | | 11,117,816 | | | | 0 | | | | 0 | | | | 11,117,816 | |
| | | | |
Municipal obligations | | | 0 | | | | 760,220 | | | | 0 | | | | 760,220 | |
| | | | |
Non-agency mortgage-backed securities | | | 0 | | | | 12,529,912 | | | | 0 | | | | 12,529,912 | |
| | | | |
Participation notes | | | | | | | | | | | | | | | | |
Financials | | | 0 | | | | 2,054,476 | | | | 0 | | | | 2,054,476 | |
Materials | | | 0 | | | | 1,226,508 | | | | 0 | | | | 1,226,508 | |
| | | | |
Preferred stocks | | | | | | | | | | | | | | | | |
Financials | | | 0 | | | | 14,061 | | | | 0 | | | | 14,061 | |
Health care | | | 473,488 | | | | 0 | | | | 0 | | | | 473,488 | |
Industrials | | | 0 | | | | 0 | | | | 59,307 | | | | 59,307 | |
Utilities | | | 55,489 | | | | 0 | | | | 0 | | | | 55,489 | |
| | | | |
Purchased put options | | | 0 | | | | 566,652 | | | | 0 | | | | 566,652 | |
| | | | |
Warrants | | | | | | | | | | | | | | | | |
Industrials | | | 0 | | | | 10,399 | | | | 0 | | | | 10,399 | |
| | | | |
Yankee corporate bonds and notes | | | 0 | | | | 1,102,992 | | | | 0 | | | | 1,102,992 | |
| | | | |
Short-term investments | | | | | | | | | | | | | | | | |
Investment companies | | | 40,395,204 | | | | 0 | | | | 0 | | | | 40,395,204 | |
U.S. Treasury securities | | | 3,206,790 | | | | 0 | | | | 0 | | | | 3,206,790 | |
| | | 179,722,382 | | | | 21,523,425 | | | | 59,307 | | | | 201,305,114 | |
| | | | |
Forward foreign currency contracts | | | 0 | | | | 131,896 | | | | 0 | | | | 131,896 | |
| | | | |
Futures contracts | | | 164,335 | | | | 0 | | | | 0 | | | | 164,335 | |
Total return swap contracts | | | 0 | | | | 151,829 | | | | 0 | | | | 151,829 | |
Total assets | | $ | 179,886,717 | | | $ | 21,807,150 | | | $ | 59,307 | | | $ | 201,753,174 | |
| | | | |
| 44 | | Wells Fargo Alternative Strategies Fund | | Notes to financial statements (unaudited) |
| | | | | | | | | | | | | | | | |
| | | Quoted prices
(Level 1) | | | Other significant
observable inputs
(Level 2) | | | Significant
unobservable inputs
(Level 3) | | | Total | |
Liabilities | | | | | | | | | | | | | | | | |
Securities sold short | | | | | | | | | | | | | | | | |
| | | | |
Common stocks | | | | | | | | | | | | | | | | |
Consumer discretionary | | $ | 3,764,313 | | | $ | 0 | | | $ | 0 | | | $ | 3,764,313 | |
Consumer staples | | | 1,560,254 | | | | 0 | | | | 0 | | | | 1,560,254 | |
Energy | | | 7,564,453 | | | | 0 | | | | 0 | | | | 7,564,453 | |
Financials | | | 199,509 | | | | 0 | | | | 0 | | | | 199,509 | |
Health care | | | 1,095,219 | | | | 0 | | | | 0 | | | | 1,095,219 | |
Industrials | | | 5,095,415 | | | | 0 | | | | 0 | | | | 5,095,415 | |
Information technology | | | 9,779,325 | | | | 0 | | | | 0 | | | | 9,779,325 | |
Materials | | | 281,248 | | | | 0 | | | | 0 | | | | 281,248 | |
Real estate | | | 755,371 | | | | 0 | | | | 0 | | | | 755,371 | |
Telecommunication services | | | 74,045 | | | | 0 | | | | 0 | | | | 74,045 | |
Utilities | | | 243,882 | | | | 0 | | | | 0 | | | | 243,882 | |
| | | | |
Exchange-traded funds | | | 19,035,631 | | | | 0 | | | | 0 | | | | 19,035,631 | |
| | | | |
Forward foreign currency contracts | | | 0 | | | | 14,264 | | | | 0 | | | | 14,264 | |
| | | | |
Futures contracts | | | 186,982 | | | | 0 | | | | 0 | | | | 186,982 | |
| | | | |
Total return swap contracts | | | 0 | | | | 615 | | | | 0 | | | | 615 | |
Written options | | | 0 | | | | 149,639 | | | | 0 | | | | 149,639 | |
Total liabilities | | $ | 49,635,647 | | | $ | 164,518 | | | $ | 0 | | | $ | 49,800,165 | |
Forward foreign currency contracts are reported at their unrealized gains (losses) at measurement date, which represents the change in the contract’s value from trade date. Futures contracts are reported at their variation margin at measurement date, which represents the amount due to/from the Fund at that date. Swap contracts consists of unrealized gains (losses) and premiums paid or received on swap contracts, which represents the change in the contract’s value from trade date. All other assets and liabilities are reported at their market value at measurement date.
The Fund recognizes transfers between levels within the fair value hierarchy at the end of the reporting period. Fair value pricing was used in pricing certain foreign securities at the previous period end but was not used at December 31, 2016. As a result, long positions valued at $14,671,913 and securities in short positions valued at $610,440 were transferred from Level 2 to Level 1. The Fund did not have any transfers into/out of Level 3.
4. TRANSACTIONS WITH AFFILIATES AND OTHER EXPENSES
Management fee
Funds Management, an indirect wholly owned subsidiary of Wells Fargo & Company (“Wells Fargo”), is the manager of the Fund and provides advisory and fund-level administrative services under an investment management agreement. Under the investment management agreement, Funds Management is responsible for, among other services, implementing the investment objectives and strategies of the Fund, supervising the applicable subadvisers, providing fund-level administrative services in connection with the Fund’s operations, and providing any other fund-level administrative services reasonably necessary for the operation of the Fund. As compensation for its services under the investment management agreement, Funds Management is entitled to receive an annual management fee starting at 1.75% and declining to 1.63% as the average daily net assets of the Fund increase. For the six months ended December 31, 2016, the management fee was equivalent to an annual rate of 1.75% of the Fund’s average daily net assets.
Funds Management has engaged The Rock Creek Group, LP, Chilton Investment Company, LLC, Ellington Global Asset Management Corporation, Mellon Capital Management Corporation, Passport Capital, LLC, Pine River Capital Management L.P., River Canyon Fund Management LLC, Sirios Capital Management, L.P., and Wellington Management Company, LLP to serve as sub-advisers to the Fund. The fee for subadvisory services is borne by Funds Management. The subadvisers are each entitled to receive from Funds Management an annual subadvisory fee.
| | | | | | |
| Notes to financial statements (unaudited) | | Wells Fargo Alternative Strategies Fund | | | 45 | |
The Rock Creek Group, LP, an indirect majority owned subsidiary of Wells Fargo and an affiliate of Funds Management, is entitled to receive a fee at an annual rate starting at 0.60% and declining to 0.55% as the average daily net assets of the Fund increase. For the six months ended December 31, 2016, the subadvisory fees paid to the remaining unaffiliated subadvisors was equivalent to an annual rate of 0.97% of the Fund’s average daily net assets.
Administration fees
Under a class-level administration agreement, Funds Management provides class-level administrative services to the Fund, which includes paying fees and expenses for services provided by the transfer agent, sub-transfer agents, omnibus account servicers and record-keepers. As compensation for its services under the class-level administration agreement, Funds Management receives an annual fee which is calculated based on the average daily net assets of each class as follows:
| | | | |
| | | Class-level
administration fee | |
Class A, Class C | | | 0.21 | % |
Administrator Class, Institutional Class | | | 0.13 | |
Funds Management has contractually waived and/or reimbursed management and administration fees to the extent necessary to maintain certain net operating expense ratios for the Fund. Waiver of fees and/or reimbursement of expenses by Funds Management were made first from fund level expenses on a proportionate basis and then from class specific expenses. Funds Management has committed through October 31, 2017 to waive fees and/or reimburse expenses to the extent necessary to cap the Fund’s expenses at 2.22% for Class A shares, 2.97% for Class C shares, 2.07% for Administrator Class shares, and 1.97% for Institutional Class shares. After this time, the cap may be increased or the commitment to maintain the cap may be terminated only with the approval of the Board of Trustees. Prime broker fees
and dividend and interest expense on securities sold short are excluded from the expense caps.
During the six months ended December 31, 2016, State Street Bank and Trust Company, the Fund’s custodian, reimbursed the Fund $82.73 for certain out-of-pocket expenses that were billed to the Fund in error from 1998-2015. This amount is included in dividend income on the Statement of Operations. In addition, Funds Management was also reimbursed $33,311 for waivers/reimbursements it made to the Fund during the period the Fund was erroneously billed.
Distribution fee
The Trust has adopted a distribution plan for Class C shares of the Fund pursuant to Rule 12b-1 under the 1940 Act. A distribution fee is charged to Class C shares and paid to Wells Fargo Funds Distributor, LLC (“Funds Distributor”), the principal underwriter, at an annual rate of 0.75% of the average daily net assets of Class C shares.
In addition, Funds Distributor is entitled to receive the front-end sales charge from the purchase of Class A shares and a contingent deferred sales charge on the redemption of certain Class A shares. Funds Distributor is also entitled to receive the contingent deferred sales charges from redemptions of Class C shares. For the six months ended December 31, 2016, Funds Distributor received $1,473 from the sale of Class A shares and $1,000 and $205 in contingent deferred sales charges from redemptions of Class A and Class C shares, respectively.
Shareholder servicing fees
The Trust has entered into contracts with one or more shareholder servicing agents, whereby Class A, Class C, and Administrator Class of the Fund are charged a fee at an annual rate of 0.25% of the average daily net assets of each respective class.
A portion of these total shareholder servicing fees were paid to affiliates of Wells Fargo.
5. INVESTMENT PORTFOLIO TRANSACTIONS
Purchases and sales of investments, excluding U.S. government obligations (if any) and short-term securities, for the six months ended December 31, 2016 were $262,762,022 and $265,715,906, respectively.
The Fund may purchase or sell investment securities to other Wells Fargo funds under procedures adopted by the Board of Trustees. The procedures have been designed to ensure that these interfund transactions, which generally do not incur broker commissions, are effected at current market prices. Interfund trades are included within the respective purchases and sales amounts shown.
| | | | |
| 46 | | Wells Fargo Alternative Strategies Fund | | Notes to financial statements (unaudited) |
6. DERIVATIVE TRANSACTIONS
During the six months ended December 31, 2016, the Fund entered into futures contracts for speculative purposes.
At December 31, 2016, the Fund had long and short futures contracts outstanding as follows:
| | | | | | | | | | | | | | |
| Expiration date | | Contracts | | Counterparty | | Type | | Contract
value at
December 31, 2016 | | | Unrealized
gains
(losses) | |
| 1-20-2017 | | 1 Long | | Morgan Stanley | | Amsterdam Index | | $ | 101,707 | | | $ | 2,124 | |
| 1-20-2017 | | 4 Long | | Morgan Stanley | | CAC 40 Index | | | 204,762 | | | | 3,556 | |
| 1-20-2017 | | 3 Long | | Morgan Stanley | | IBEX 35 Index | | | 294,113 | | | | 3,044 | |
| 1-26-2017 | | 4 Short | | Morgan Stanley | | Hang Seng Index | | | 566,432 | | | | (11,765 | ) |
| 3-8-2017 | | 66 Short | | Morgan Stanley | | Euro-Bund Futures | | | 11,404,309 | | | | (161,905 | ) |
| 3-9-2017 | | 17 Long | | Morgan Stanley | | TOPIX Index | | | 2,208,000 | | | | 58,514 | |
| 3-9-2017 | | 10 Short | | Morgan Stanley | | TOPIX Index | | | 1,298,824 | | | | (23,608 | ) |
| 3-13-2017 | | 129 Short | | Morgan Stanley | | British Pound Futures | | | 9,963,638 | | | | 58,037 | |
| 3-13-2017 | | 91 Short | | Morgan Stanley | | Euro FX Futures | | | 12,027,925 | | | | (139,622 | ) |
| 3-13-2017 | | 20 Short | | Morgan Stanley | | Japanese Yen Futures | | | 2,149,250 | | | | (28,311 | ) |
| 3-14-2017 | | 40 Short | | Morgan Stanley | | Canadian Dollar Futures | | | 2,976,600 | | | | (2,878 | ) |
| 3-15-2017 | | 128 Long | | Morgan Stanley | | 10-Year Australian Treasury Bonds | | | 11,799,734 | | | | 57,646 | |
| 3-16-2017 | | 3 Short | | Morgan Stanley | | S&P/TSX 60 Index | | | 400,804 | | | | 1,785 | |
| 3-16-2017 | | 26 Long | | Morgan Stanley | | SPI 200 Index | | | 2,641,348 | | | | 49,934 | |
| 3-17-2017 | | 7 Long | | Morgan Stanley | | DAX Index | | | 2,112,011 | | | | 39,454 | |
| 3-17-2017 | | 105 Short | | Morgan Stanley | | Euro STOXX 50 Index | | | 3,622,012 | | | | (75,353 | ) |
| 3-17-2017 | | 38 Long | | Morgan Stanley | | FTSE 100 Index | | | 3,301,599 | | | | 106,777 | |
| 3-17-2017 | | 13 Short | | Morgan Stanley | | FTSE 100 Index | | | 1,129,494 | | | | (28,858 | ) |
| 3-17-2017 | | 21 Short | | Morgan Stanley | | MSCI EAFE Index | | | 1,759,380 | | | | 2,721 | |
| 3-17-2017 | | 27 Short | | Morgan Stanley | | MSCI Emerging Markets Index | | | 1,159,515 | | | | 19,122 | |
| 3-17-2017 | | 21 Short | | Morgan Stanley | | Russell 2000 Index | | | 1,424,745 | | | | 17,285 | |
| 3-17-2017 | | 63 Short | | Morgan Stanley | | S&P 500 E-Mini Index | | | 7,044,030 | | | | 59,750 | |
| 3-17-2017 | | 12 Short | | Morgan Stanley | | S&P 500 E-Mini Index | | | 1,341,720 | | | | 9,346 | |
| 3-22-2017 | | 21 Long | | Morgan Stanley | | 10-Year Canadian Treasury Bonds | | | 2,151,067 | | | | (3,037 | ) |
| 3-22-2017 | | 145 Long | | Morgan Stanley | | 10-Year U.S. Treasury Notes | | | 18,020,781 | | | | (81,056 | ) |
| 3-29-2017 | | 62 Short | | Morgan Stanley | | Long Gilt Bonds | | | 9,614,518 | | | | (185,893 | ) |
The Fund had an average notional amount of $46,546,290 in long and $81,454,689 in short futures contracts during the six months ended December 31, 2016. As of December 31, 2016, the Fund had segregated $683,359 as cash collateral for open futures contracts.
During the six months ended December 31, 2016, the Fund entered into forward foreign currency contracts for speculative purposes.
At December 31, 2016, the Fund had forward foreign currency contracts outstanding as follows:
Forward foreign currency contracts to buy:
| | | | | | | | | | | | | | | | | | |
| Exchange date | | Counterparty | | Contracts to
receive | | | U.S. value at
December 31, 2016 | | | In exchange
for U.S. $ | | | Unrealized
gains
(losses) | |
| 3-15-2017 | | Morgan Stanley | | | 37,000 | EUR | | $ | 39,084 | | | $ | 39,822 | | | $ | (738 | ) |
| 3-15-2017 | | Morgan Stanley | | | 49,000 | EUR | | | 51,760 | | | | 53,112 | | | | (1,352 | ) |
| 3-15-2017 | | Morgan Stanley | | | 75,000 | EUR | | | 79,224 | | | | 80,381 | | | | (1,157 | ) |
| 3-15-2017 | | Morgan Stanley | | | 96,000 | EUR | | | 101,406 | | | | 102,670 | | | | (1,264 | ) |
| 3-15-2017 | | Morgan Stanley | | | 1,261,000 | SEK | | | 138,980 | | | | 139,303 | | | | (323 | ) |
| 3-15-2017 | | Morgan Stanley | | | 1,475,000 | SEK | | | 162,566 | | | | 161,874 | | | | 692 | |
| | | | | | |
| Notes to financial statements (unaudited) | | Wells Fargo Alternative Strategies Fund | | | 47 | |
Forward foreign currency contracts to sell:
| | | | | | | | | | | | | | | | | | |
| Exchange date | | Counterparty | | Contracts to
deliver | | | U.S. value at
December 31, 2016 | | | In exchange
for U.S. $ | | | Unrealized
gains
(losses) | |
| 1-17-2017 | | Morgan Stanley | | | 175,000 | EUR | | $ | 184,358 | | | $ | 186,811 | | | $ | 2,453 | |
| 3-15-2017 | | Citibank | | | 211,305,000 | JPY | | | 1,814,172 | | | | 1,847,387 | | | | 33,215 | |
| 3-15-2017 | | Citibank | | | 3,017,000 | EUR | | | 3,186,908 | | | | 3,225,342 | | | | 38,434 | |
| 3-15-2017 | | HSBC Bank | | | 756,000 | GBP | | | 933,306 | | | | 962,670 | | | | 29,364 | |
| 3-15-2017 | | Morgan Stanley | | | 13,000 | CHF | | | 12,822 | | | | 13,001 | | | | 179 | |
| 3-15-2017 | | Morgan Stanley | | | 22,000 | CHF | | | 21,699 | | | | 21,677 | | | | (22 | ) |
| 3-15-2017 | | Morgan Stanley | | | 252,000 | CHF | | | 248,557 | | | | 254,503 | | | | 5,946 | |
| 3-15-2017 | | Morgan Stanley | | | 829,000 | CHF | | | 817,676 | | | | 808,930 | | | | (8,746 | ) |
| 3-15-2017 | | Morgan Stanley | | | 31,000 | CHF | | | 30,576 | | | | 30,696 | | | | 120 | |
| 3-15-2017 | | Morgan Stanley | | | 64,000 | EUR | | | 67,604 | | | | 66,942 | | | | (662 | ) |
| 3-15-2017 | | Morgan Stanley | | | 123,000 | EUR | | | 129,927 | | | | 130,522 | | | | 595 | |
| 3-15-2017 | | Morgan Stanley | | | 898,000 | EUR | | | 948,574 | | | | 969,472 | | | | 20,898 | |
The Fund had average contract amounts of $1,914,297 and $11,914,325 in forward foreign currency contracts to buy and forward foreign currency contracts to sell, respectively, during the six months ended December 31, 2016.
During the six months ended December 31, 2016, the Fund entered into written options for speculative purposes.
During the six months ended December 31, 2016, the Fund had written option activities as follows:
| | | | | | | | | | | | | | | | |
| | | Call options | | | Put options | |
| | | Number of
contracts | | | Premiums
received | | | Number of
contracts | | | Premiums
received | |
Options outstanding at June 30, 2016 | | | 22 | | | $ | 3,826 | | | | 68 | | | $ | 354,074 | |
Options written | | | 8 | | | | 7,175 | | | | 1,259 | | | | 189,493 | |
Options expired | | | (12 | ) | | | (1,380 | ) | | | (1,225 | ) | | | (56,657 | ) |
Options closed | | | 0 | | | | 0 | | | | (26 | ) | | | (157,220 | ) |
Options exercised | | | 0 | | | | 0 | | | | 0 | | | | 0 | |
Options outstanding at December 31, 2016 | | | 18 | | | $ | 9,621 | | | | 76 | | | $ | 329,690 | |
Open put/call options written at December 31, 2016 were as follows:
| | | | | | | | | | | | | | | | | | | | |
| Expiration date | | Counterparty | | Description | | Number of
contracts | | | Call/Put | | | Strike
price | | | Value | |
| 1-20-2017 | | Morgan Stanley | | Avis Budget Group Incorporated | | | 5 | | | | Call | | | $ | 38 | | | $ | (485 | ) |
| 1-20-2017 | | Morgan Stanley | | Avis Budget Group Incorporated | | | 5 | | | | Call | | | | 40 | | | | (237 | ) |
| 3-17-2017 | | Morgan Stanley | | S&P 500 Index | | | 21 | | | | Put | | | | 1,725 | | | | (4,830 | ) |
| 4-21-2017 | | Morgan Stanley | | Vertex Pharmaceuticals Incorporated | | | 8 | | | | Call | | | | 80 | | | | (4,487 | ) |
| 6-16-2017 | | Morgan Stanley | | S&P 500 Index | | | 21 | | | | Put | | | | 1,725 | | | | (23,443 | ) |
| 9-15-2017 | | Morgan Stanley | | S&P 500 Index | | | 17 | | | | Put | | | | 1,800 | | | | (51,391 | ) |
| 12-15-2017 | | Morgan Stanley | | S&P 500 Index | | | 17 | | | | Put | | | | 1,750 | | | | (64,766 | ) |
The Fund had an average of 19 written call options and 219 written put options during the six months ended December 31, 2016. As of December 31, 2016, the Fund had $445,740 on deposit at the prime broker for written options.
During the six months ended December 31, 2016, the Fund entered into purchased option contracts for speculative purposes and had an average of 943 purchased put options.
| | | | |
| 48 | | Wells Fargo Alternative Strategies Fund | | Notes to financial statements (unaudited) |
During the six months ended December 31, 2016, the Fund entered into total return swap contracts for speculative purposes. At December 31, 2016, the Fund had the following total return swap contracts outstanding:
| | | | | | | | | | |
| Expiration | | Notional amount | | Counterparty | | Swap description | | Unrealized gains
(losses) | |
| 2-10-2017 | | $141,689 | | Morgan Stanley | | In an agreement dated 5-16-2016, the Fund makes monthly payments of 1 Month EUR LIBOR +60. At expiration, the Fund will receive the positive return or pay the negative return of the referenced entity Ryanair Holdings plc. | | $ | (18 | ) |
| 9-3-2018 | | 266,029 | | Morgan Stanley | | In an agreement dated 9-1-2016, the Fund makes monthly payments of 1 Day JPY MUTSCALM -40. At expiration, the Fund will receive the positive return or pay the negative return of the referenced entity Taisei Corporation. | | | 17,543 | |
| 9-3-2018 | | 241,714 | | Morgan Stanley | | In an agreement dated 9-1-2016, the Fund makes monthly payments of 1 Day JPY MUTSCALM -40. At expiration, the Fund will receive the positive return or pay the negative return of the referenced entity Komatsu Limited. | | | 27,053 | |
| 9-3-2018 | | 231,429 | | Morgan Stanley | | In an agreement dated 9-1-2016, the Fund makes monthly payments of 1 Day JPY MUTSCALM -40. At expiration, the Fund will receive the positive return or pay the negative return of the referenced entity Hitachi Limited. | | | 40,931 | |
| 9-3-2018 | | 248,675 | | Morgan Stanley | | In an agreement dated 9-1-2016, the Fund makes monthly payments of 1 Day JPY MUTSCALM -40. At expiration, the Fund will receive the positive return or pay the negative return of the referenced entity Mitsubishi Heavy Industries Limited. | | | 33,079 | |
| 9-3-2018 | | 248,956 | | Morgan Stanley | | In an agreement dated 11-15-2016, the Fund makes monthly payments of 1 Day JPY MUTSCALM -40. At expiration, the Fund will receive the positive return or pay the negative return of the referenced entity Mitsubishi Heavy Industries Limited. | | | 23,744 | |
| 10-22-2018 | | 152,927 | | Morgan Stanley | | In an agreement dated 10-17-2016, the Fund makes monthly payments of 1 Month USD LIBOR +50. At expiration, the Fund will receive the positive return or pay the negative return of the referenced entity Comcast Corporation Class A. | | | 9,479 | |
| 10-22-2018 | | 37,056 | | Morgan Stanley | | In an agreement dated 10-17-2016, the Fund makes monthly payments of 1 Month USD LIBOR +50. At expiration, the Fund will receive the positive return or pay the negative return of the referenced entity Ally Financial Incorporated. | | | (597 | ) |
The Fund had an average notional balance on total return swaps of $586,921, during the six months ended December 31, 2016. As of December 31, 2016, the Fund had $415,544 on deposit at the prime broker for total return swaps.
As of December 31, 2016, the Fund did not have any open credit default swaps. The Fund had an average notional balance of $42,967 during the six months ended December 31, 2016.
| | | | | | |
| Notes to financial statements (unaudited) | | Wells Fargo Alternative Strategies Fund | | | 49 | |
A summary of derivative instruments by primary risk exposure is outlined in the following tables.
The fair value of derivative instruments as of December 31, 2016 was as follows for the Fund:
| | | | | | | | | | | | |
| | | Asset derivatives | | | Liability derivatives | |
| | | Statement of Assets and
Liabilities location | | Fair value | | | Statement of Assets and
Liabilities location | | Fair value | |
Equity risk | | Investments in unaffiliated
securities, at value | | $ | 566,652 | * | | Payable for written options | | $ | 149,639 | |
| | Receivable for daily variation
margin on open futures contracts | | | 61,609 | ** | | Payable for daily variation margin on open futures contracts | | | 49,369 | ** |
Foreign currency risk | | Unrealized gains on forward
foreign currency | | | 131,896 | | | Unrealized losses on forward foreign currency contracts | | | 14,264 | |
| | Receivable for daily variation
margin on open futures contracts | | | 875 | ** | | Payable for daily variation margin on open futures contracts | | | 137,613 | ** |
Interest rate risk | | Receivable for daily variation
margin on open futures contracts | | | 101,851 | ** | | Payable for daily variation margin on open futures contracts | | | 0 | ** |
| | | Unrealized gains on total
return swap transactions | | | 151,829 | | | Unrealized losses on total return swap transactions | | | 615 | |
| | | | $ | 1,014,712 | | | | | $ | 351,500 | |
| * | Amount relates to purchased options |
| ** | Only the current day’s variation margin as of December 31, 2016 is reported separately on the Statement of Assets and Liabilities. |
The effect of derivative instruments on the Statement of Operations for the six months ended December 31, 2016 was as follows for the Fund:
| | | | | | | | | | | | | | | | | | | | | | | | | | | | |
| | | Amount of realized gains (losses) on derivatives | |
| | | Unaffiliated
securities* | | | Futures contracts | | | Forward
foreign currency
contracts | | | Written options | | | Credit
default
swaps | | | Total
return
Swaps | | | Total | |
Interest rate risk | | $ | 0 | | | $ | (1,049,122 | ) | | $ | 0 | | | $ | 0 | | | $ | 0 | | | $ | (149,227 | ) | | $ | (1,198,349 | ) |
Equity risk | | | (808,239 | ) | | | (1,016,435 | ) | | | 0 | | | | 187,878 | | | | 0 | | | | 0 | | | | (1,636,796 | ) |
Foreign currency risk | | | 0 | | | | 2,660,369 | | | | 701,698 | | | | 0 | | | | 0 | | | | 0 | | | | 3,362,067 | |
Credit risk | | | 0 | | | | 0 | | | | 0 | | | | 0 | | | | 998 | | | | 0 | | | | 998 | |
| | | $ | (808,239 | ) | | $ | 594,812 | | | $ | 701,698 | | | $ | 187,878 | | | $ | 998 | | | $ | (149,227 | ) | | $ | 527,920 | |
| |
| | | Change in unrealized gains (losses) on derivatives | |
| | | Unaffiliated
securities* | | | Futures contracts | | | Forward foreign currency
contracts | | | Written
options | | | Credit
default
swaps | | | Total
return
Swaps | | | Total | |
Interest rate risk | | $ | 0 | | | $ | (734,721 | ) | | $ | 0 | | | $ | 0 | | | $ | 0 | | | $ | 277,470 | | | $ | (457,251 | ) |
Equity risk | | | (41,067 | ) | | | 707,157 | | | | 0 | | | | 85,100 | | | | 0 | | | | 0 | | | | 751,190 | |
Foreign currency risk | | | 0 | | | | (1,017,900 | ) | | | 10,865 | | | | 0 | | | | 0 | | | | 0 | | | | (1,007,035 | ) |
Credit risk | | | 0 | | | | 0 | | | | 0 | | | | 0 | | | | (385 | ) | | | 0 | | | | (385 | ) |
| | | $ | (41,067 | ) | | $ | (1,045,464 | ) | | $ | 10,865 | | | $ | 85,100 | | | $ | (385 | ) | | $ | 277,470 | | | $ | (713,481 | ) |
| *Amount | relates to purchased options |
For certain types of derivative transactions, the Fund has entered into International Swaps and Derivatives Association, Inc. master agreements (“ISDA Master Agreements”) or similar agreements with approved counterparties. The ISDA Master Agreements or similar agreements may have requirements to deliver/deposit securities or cash to/with an exchange or broker-dealer as collateral and allows the Fund to offset, with each counterparty, certain derivative financial instrument’s assets and/or liabilities with collateral held or pledged. Collateral requirements differ by type of derivative. Collateral or margin requirements are set by the broker or exchange clearing house for exchange traded derivatives while collateral terms are contract specific for over-the-counter traded derivatives. Cash collateral that has been pledged to cover obligations of the Fund under ISDA Master Agreements or similar agreements, if any, are reported separately in the
| | | | |
| 50 | | Wells Fargo Alternative Strategies Fund | | Notes to financial statements (unaudited) |
Statement of Assets and Liabilities. Securities pledged as collateral, if any, are noted in the Portfolio of Investments. With respect to balance sheet offsetting, absent an event of default by the counterparty or a termination of the agreement, the reported amounts of financial assets and financial liabilities in the Statement of Assets and Liabilities are not offset across transactions between the Fund and the applicable counterparty. A reconciliation of the gross amounts on the Statement of Assets and Liabilities to the net amounts by derivative type, including any collateral exposure, is as follows:
| | | | | | | | | | | | | | | | |
| Derivative type | | Counterparty | | Gross amounts
of assets in the
Statement of
Assets and
Liabilities | | Amounts
subject
to netting
agreements | | | Collateral
received | | | Net amount
of assets | |
Futures - variation margin | | Morgan Stanley | | $164,335 | | $ | (164,335 | ) | | $ | 0 | | | $ | 0 | |
Forward foreign currency contracts | | Citibank | | 71,649* | | | 0 | | | | 0 | | | | 71,649 | |
Forward foreign currency contracts | | HSBC Bank | | 29,364* | | | 0 | | | | 0 | | | | 29,364 | |
Forward foreign currency contracts | | Morgan Stanley | | 30,883* | | | (14,264 | ) | | | 0 | | | | 16,619 | |
Total return swaps | | Morgan Stanley | | 151,829* | | | (615 | ) | | | 0 | | | | 151,214 | |
| * | Amount represents net unrealized gains. |
| | | | | | | | | | | | | | | | |
| Derivative type | | Counterparty | | Gross amounts
of liabilities in the
Statement of
Assets and
Liabilities | | Amounts
subject
to netting
agreements | | | Collateral
pledged1 | | | Net amount
of liabilities | |
Futures - variation margin | | Morgan Stanley | | $186,982 | | $ | (164,335 | ) | | $ | (22,647 | ) | | $ | 0 | |
Forward foreign currency contracts | | Morgan Stanley | | 14,264* | | | (14,264 | ) | | | 0 | | | | 0 | |
Written options | | Morgan Stanley | | 149,639 | | | 0 | | | | (149,639 | ) | | | 0 | |
Total return swaps | | Morgan Stanley | | 615* | | | (615 | ) | | | 0 | | | | 0 | |
| 1 | Collateral pledged within this table is limited to the collateral for the net transaction with the counterparty by derivative type. |
| * | Amount represents net unrealized losses. |
7. BANK BORROWINGS
The Trust (excluding the money market funds and certain other funds) and Wells Fargo Variable Trust are parties to a $250,000,000 revolving credit agreement whereby the Fund is permitted to use bank borrowings for temporary or emergency purposes, such as to fund shareholder redemption requests. Interest under the credit agreement is charged to the Fund based on a borrowing rate equal to the higher of the Federal Funds rate in effect on that day plus 1.25% or the overnight LIBOR rate in effect on that day plus 1.25%. In addition, an annual commitment fee equal to 0.25% of the unused balance is allocated to each participating fund. Prior to August 30, 2016, the revolving credit agreement amount was $200,000,000 and the annual commitment fee was equal to 0.20% of the unused balance which was allocated to each participating fund.
For the six months ended December 31, 2016, there were no borrowings by the Fund under the agreement.
8. INDEMNIFICATION
Under the Trust’s organizational documents, the officers and Trustees have been granted certain indemnification rights against certain liabilities that may arise out of performance of their duties to the Trust. Additionally, in the normal course of business, the Trust may enter into contracts with service providers that contain a variety of indemnification clauses. The Trust’s maximum exposure under these arrangements is dependent on future claims that may be made against the Fund and, therefore, cannot be estimated.
9. REGULATORY CHANGES
In October 2016, the Securities and Exchange Commission (“SEC”) adopted new rules and forms and amended existing rules and forms (together, “final rules”) intended to modernize and enhance the reporting and disclosure of information by registered investment companies and to enhance liquidity risk management by open-end mutual funds and exchange-traded funds. The final rules will enhance the quality of information available to investors and will allow the SEC to more effectively collect and use data reported by funds. In part, the final rules amend Regulation S-X and require standardized, enhanced disclosure about derivatives in the Fund’s financial statements, as well as other amendments. The compliance date for the amendments to Regulation S-X is August 1, 2017 while the compliance date for the new form types is June 1, 2018 and the compliance date for the liquidity risk management program requirements is December 1, 2018. Management is currently assessing the potential impact of these enhancements and their impact on the financial statement disclosures and reporting requirements.
| | | | | | |
| Other information (unaudited) | | Wells Fargo Alternative Strategies Fund | | | 51 | |
PROXY VOTING INFORMATION
A description of the policies and procedures that the Fund uses to determine how to vote proxies relating to portfolio securities is available, upon request, by calling 1-800-222-8222, visiting our website at wellsfargofunds.com, or visiting the SEC website at sec.gov. Information regarding how the Fund voted proxies relating to portfolio securities during the most recent 12-month period ended June 30 is available on the Fund’s website at wellsfargofunds.com or by visiting the SEC website at sec.gov.
PORTFOLIO HOLDINGS INFORMATION
The complete portfolio holdings for the Fund are publicly available at each fiscal quarter end on the Fund’s website (wellsfargofunds.com), on a one-month delayed basis. As of each month end other than a month end that coincides with a fiscal quarter end, the Fund makes publicly available on the Fund’s website, on a one-month delayed basis (i) all portfolio holdings held long other than any put options on equity securities; (ii) portfolio holdings held short other than short positions in equity securities of single issuers; and (iii) the aggregate dollar value of equity securities of single issuers held short, and any put options on equity securities held long. In addition, top ten holdings information (excluding derivative positions and short positions) for the Fund is publicly available on the Fund’s website on a monthly, seven-day or more delayed basis. The Fund files its complete schedule of portfolio holdings with the SEC for the first and third quarters of each fiscal year on Form N-Q, which is available by visiting the SEC website at sec.gov. In addition, the Fund’s Form N-Q may be reviewed and copied at the SEC’s Public Reference Room in Washington, DC, and at regional offices in New York City, at 233 Broadway, and in Chicago, at 175 West Jackson Boulevard, Suite 900. Information about the Public Reference Room may be obtained by calling 1-800-SEC-0330.
| | | | |
| 52 | | Wells Fargo Alternative Strategies Fund | | Other information (unaudited) |
BOARD OF TRUSTEES AND OFFICERS
Each of the Trustees and Officers1 listed in the table below acts in identical capacities for each fund in the Wells Fargo family of funds, which consists of 139 mutual funds comprising the Wells Fargo Funds Trust, Wells Fargo Variable Trust, Wells Fargo Master Trust and four closed-end funds (collectively the “Fund Complex”). This table should be read in conjunction with the Prospectus and the Statement of Additional Information2. The mailing address of each Trustee and Officer is 525 Market Street, 12th Floor, San Francisco, CA 94105. Each Trustee and Officer serves an indefinite term, however, each Trustee serves such term until reaching the mandatory retirement age established by the Trustees.
Independent Trustees
| | | | | | |
Name and
year of birth | | Position held and
length of service* | | Principal occupations during past five years or longer | | Current other
public company or
investment company
directorships |
| William R. Ebsworth (Born 1957) | | Trustee, since 2015 | | Retired. From 1984 to 2013, equities analyst, portfolio manager, research director and chief financial officer at Fidelity Management and Research Company in Boston, Tokyo, and Hong Kong and retired in 2013 as Chief Investment Officer of Fidelity Strategic Advisers, Inc. where he lead a team of investment professionals managing client assets. Prior thereto, Board member of Hong Kong Securities Clearing Co., Hong Kong Options Clearing Corp., the Thailand International Fund, Ltd., Fidelity Investments Life Insurance Company, and Empire Fidelity Investments Life Insurance Company. Board member of the Fonté Foundation (non-profit organization) and the Vincent Memorial Hospital Endowment (non-profit organization), where he serves on the Investment Committee and as a Chair of the Audit Committee. Mr. Ebsworth is a CFA® charterholder and an Adjunct Lecturer, Finance, at Babson College. | | Asset Allocation Trust |
| Jane A. Freeman (Born 1953) | | Trustee, since 2015 | | Retired. From 2012 to 2014 and 1999 to 2008, Chief Financial Officer of Scientific Learning Corporation. From 2008 to 2012, Ms. Freeman provided consulting services related to strategic business projects. Prior to 1999, Portfolio Manager at Rockefeller & Co. and Scudder, Stevens & Clark. Board member of the Harding Loevner Funds from 1996 to 2014, serving as both Lead Independent Director and chair of the Audit Committee. Board member of the Russell Exchange Traded Funds Trust from 2011 to 2012 and the chair of the Audit Committee. Ms. Freeman is Chair of Taproot Foundation (non-profit organization), a Board Member of Ruth Bancroft Garden (non-profit organization) and an inactive chartered financial analyst. | | Asset Allocation Trust |
| Peter G. Gordon** (Born 1942) | | Trustee, since 1998; Chairman, since 2005 | | Co-Founder, Retired Chairman, President and CEO of Crystal Geyser Water Company. Trustee Emeritus, Colby College. | | Asset Allocation Trust |
| Isaiah Harris, Jr. (Born 1952) | | Trustee, since 2009 | | Retired. Chairman of the Board of CIGNA Corporation since 2009, and Director since 2005. From 2003 to 2011, Director of Deluxe Corporation. Prior thereto, President and CEO of BellSouth Advertising and Publishing Corp. from 2005 to 2007, President and CEO of BellSouth Enterprises from 2004 to 2005 and President of BellSouth Consumer Services from 2000 to 2003. Emeritus member of the Iowa State University Foundation Board of Governors. Emeritus Member of the Advisory Board of Iowa State University School of Business. Advisory Board Member, Palm Harbor Academy (charter school). Advisory Board Member, Child Evangelism Fellowship (non-profit). Mr. Harris is a certified public accountant (inactive status). | | CIGNA Corporation; Asset Allocation Trust |
| Judith M. Johnson (Born 1949) | | Trustee, since 2008; Audit Committee Chairman, since 2008 | | Retired. Prior thereto, Chief Executive Officer and Chief Investment Officer of Minneapolis Employees Retirement Fund from 1996 to 2008. Ms. Johnson is an attorney, certified public accountant and a certified managerial accountant. | | Asset Allocation Trust |
| David F. Larcker (Born 1950) | | Trustee, since 2009 | | James Irvin Miller Professor of Accounting at the Graduate School of Business, Stanford University, Director of the Corporate Governance Research Initiative and Senior Faculty of The Rock Center for Corporate Governance since 2006. From 2005 to 2008, Professor of Accounting at the Graduate School of Business, Stanford University. Prior thereto, Ernst & Young Professor of Accounting at The Wharton School, University of Pennsylvania from 1985 to 2005. | | Asset Allocation Trust |
| | | | | | |
| Other information (unaudited) | | Wells Fargo Alternative Strategies Fund | | | 53 | |
| | | | | | |
Name and
year of birth | | Position held and
length of service* | | Principal occupations during past five years or longer | | Current other
public company or
investment company
directorships |
| Olivia S. Mitchell (Born 1953) | | Trustee, since 2006 | | International Foundation of Employee Benefit Plans Professor, Wharton School of the University of Pennsylvania since 1993. Director of Wharton’s Pension Research Council and Boettner Center on Pensions & Retirement Research, and Research Associate at the National Bureau of Economic Research. Previously, Cornell University Professor from 1978 to 1993. | | Asset Allocation Trust |
| Timothy J. Penny (Born 1951) | | Trustee, since 1996 | | President and Chief Executive Officer of Southern Minnesota Initiative Foundation, a non-profit organization, since 2007 and Senior Fellow at the Humphrey Institute Policy Forum at the University of Minnesota since 1995. Member of the Board of Trustees of NorthStar Education Finance, Inc., a non-profit organization, since 2007. | | Asset Allocation Trust |
| Michael S. Scofield (Born 1943) | | Trustee, since 2010 | | Served on the Investment Company Institute’s Board of Governors and Executive Committee from 2008-2011 as well the Governing Council of the Independent Directors Council from 2006-2011 and the Independent Directors Council Executive Committee from 2008-2011. Chairman of the IDC from 2008-2010. Institutional Investor (Fund Directions) Trustee of Year in 2007. Trustee of the Evergreen Funds complex (and its predecessors) from 1984 to 2010. Chairman of the Evergreen Funds from 2000-2010. Former Trustee of the Mentor Funds. Retired Attorney, Law Offices of Michael S. Scofield. | | Asset Allocation Trust |
| * | Length of service dates reflect the Trustee’s commencement of service with the Trust’s predecessor entities, where applicable. |
| ** | Peter Gordon is expected to retire on December 31, 2017. |
Officers
| | | | | | |
Name and
year of birth | | Position held and
length of service | | Principal occupations during past five years or longer | | |
| Andrew Owen3 (Born 1960) | | President, since 2017 | | Executive Vice President of Wells Fargo Bank, N.A. and President of Wells Fargo & Company and Head of Affiliated Managaers, Wells Fargo Asset Management, since 2014. Executive Vice President responsible for marketing, investments and product development for Wells Fargo Funds Management, LLC, from 2009 to 2014. | | |
| Jeremy DePalma1 (Born 1974) | | Treasurer, since 2012 | | Senior Vice President of Wells Fargo Funds Management, LLC since 2009. Senior Vice President of Evergreen Investment Management Company, LLC from 2008 to 2010 and head of the Fund Reporting and Control Team within Fund Administration from 2005 to 2010. | | |
| C. David Messman (Born 1960) | | Secretary, since 2000; Chief Legal Officer, since 2003 | | Senior Vice President and Secretary of Wells Fargo Funds Management, LLC since 2001. Assistant General Counsel of Wells Fargo Bank, N.A. since 2013 and Vice President and Managing Counsel of Wells Fargo Bank, N.A. from 1996 to 2013. | | |
| Michael Whitaker (Born 1967) | | Chief Compliance Officer, since 2016 | | Executive Vice President of Wells Fargo Funds Management, LLC since 2016. Chief Compliance Officer of Fidelity’s Fixed Income Funds and Asset Allocation Funds from 2008 to 2016, Compliance Officer of FMR Co., Inc. from 2014 to 2016, Fidelity Investments Money Management, Inc. from 2014 to 2016, Fidelity Investments from 2007 to 2016. | | |
| David Berardi (Born 1975) | | Assistant Treasurer, since 2009 | | Vice President of Wells Fargo Funds Management, LLC since 2009. Vice President of Evergreen Investment Management Company, LLC from 2008 to 2010. Manager of Fund Reporting and Control for Evergreen Investment Management Company, LLC from 2004 to 2010. | | |
| 1 | Jeremy DePalma acts as Treasurer of 69 funds and Assistant Treasurer of 70 funds in the Fund Complex. |
| 2 | The Statement of Additional Information includes additional information about the Trustees and is available, without charge, upon request, by calling 1-800-222-8222 or by visiting the website at wellsfargofunds.com. |
| 3 | Andrew Owen became President on January 1, 2017. |
| | | | |
| 54 | | Wells Fargo Alternative Strategies Fund | | List of abbreviations |
The following is a list of common abbreviations for terms and entities that may have appeared in this report.
| ACA | — ACA Financial Guaranty Corporation |
| ADR | — American depositary receipt |
| ADS | — American depositary shares |
| AGC | — Assured Guaranty Corporation |
| AGM | — Assured Guaranty Municipal |
| Ambac | — Ambac Financial Group Incorporated |
| AMT | — Alternative minimum tax |
| BAN | — Bond anticipation notes |
| BHAC | — Berkshire Hathaway Assurance Corporation |
| CAB | — Capital appreciation bond |
| CCAB | — Convertible capital appreciation bond |
| CDA | — Community Development Authority |
| CDO | — Collateralized debt obligation |
| DRIVER | — Derivative inverse tax-exempt receipts |
| DW&P | — Department of Water & Power |
| DWR | — Department of Water Resources |
| ECFA | — Educational & Cultural Facilities Authority |
| EDA | — Economic Development Authority |
| EDFA | — Economic Development Finance Authority |
| ETF | — Exchange-traded fund |
| FDIC | — Federal Deposit Insurance Corporation |
| FFCB | — Federal Farm Credit Banks |
| FGIC | — Financial Guaranty Insurance Corporation |
| FHA | — Federal Housing Administration |
| FHLB | — Federal Home Loan Bank |
| FHLMC | — Federal Home Loan Mortgage Corporation |
| FICO | — The Financing Corporation |
| FNMA | — Federal National Mortgage Association |
| GDR | — Global depositary receipt |
| GNMA | — Government National Mortgage Association |
| HCFR | — Healthcare facilities revenue |
| HEFA | — Health & Educational Facilities Authority |
| HEFAR | — Higher education facilities authority revenue |
| HFA | — Housing Finance Authority |
| HFFA | — Health Facilities Financing Authority |
| HUD | — Department of Housing and Urban Development |
| IDA | — Industrial Development Authority |
| IDAG | — Industrial Development Agency |
| KRW | — Republic of Korea won |
| LIBOR | — London Interbank Offered Rate |
| LIFER | — Long Inverse Floating Exempt Receipts |
| LLC | — Limited liability company |
| LLLP | — Limited liability limited partnership |
| LLP | — Limited liability partnership |
| MBIA | — Municipal Bond Insurance Association |
| MFHR | — Multifamily housing revenue |
| MSTR | — Municipal securities trust receipts |
| MUD | — Municipal Utility District |
| National | — National Public Finance Guarantee Corporation |
| PCFA | — Pollution Control Financing Authority |
| PCL | — Public Company Limited |
| PCR | — Pollution control revenue |
| PFA | — Public Finance Authority |
| PFFA | — Public Facilities Financing Authority |
| PFOTER | — Puttable floating option tax-exempt receipts |
| plc | — Public limited company |
| PUTTER | — Puttable tax-exempt receipts |
| R&D | — Research & development |
| Radian | — Radian Asset Assurance |
| RAN | — Revenue anticipation notes |
| RDA | — Redevelopment Authority |
| RDFA | — Redevelopment Finance Authority |
| REIT | — Real estate investment trust |
| ROC | — Reset option certificates |
| SAVRS | — Select auction variable rate securities |
| SBA | — Small Business Authority |
| SDR | — Swedish depositary receipt |
| SFHR | — Single-family housing revenue |
| SFMR | — Single-family mortgage revenue |
| SPA | — Standby purchase agreement |
| SPDR | — Standard & Poor’s Depositary Receipts |
| SPEAR | — Short Puttable Exempt Adjustable Receipts |
| STRIPS | — Separate trading of registered interest and |
| TAN | — Tax anticipation notes |
| TIPS | — Treasury inflation-protected securities |
| TRAN | — Tax revenue anticipation notes |
| TTFA | — Transportation Trust Fund Authority |
| TVA | — Tennessee Valley Authority |
This page is intentionally left blank.
This page is intentionally left blank.

For more information
More information about Wells Fargo Funds is available free upon request. To obtain literature, please write, email, visit the Fund’s website, or call:
Wells Fargo Funds
P.O. Box 8266
Boston, MA 02266-8266
Email: fundservice@wellsfargo.com
Website: wellsfargofunds.com
Individual investors: 1-800-222-8222
Retail investment professionals: 1-888-877-9275
Institutional investment professionals: 1-866-765-0778
This report and the financial statements contained herein are submitted for the general information of the shareholders of the Fund. If this report is used for promotional purposes, distribution of the report must be accompanied or preceded by a current prospectus. Before investing, please consider the investment objectives, risks, charges, and expenses of the investment. For a current prospectus and, if available, a summary prospectus, containing this information, call 1-800-222-8222 or visit the Fund’s website at wellsfargofunds.com. Read the prospectus carefully before you invest or send money.
Wells Fargo Asset Management (WFAM) is a trade name used by the asset management businesses of Wells Fargo & Company. Wells Fargo Funds Management, LLC, a wholly owned subsidiary of Wells Fargo & Company, provides investment advisory and administrative services for Wells Fargo Funds. Other affiliates of Wells Fargo & Company provide subadvisory and other services for the funds. The funds are distributed by Wells Fargo Funds Distributor, LLC, Member FINRA, an affiliate of Wells Fargo & Company. Neither Wells Fargo Funds Management nor Wells Fargo Funds Distributor has Fund customer accounts/assets, and neither provides investment advice/recommendations or acts as an investment advice fiduciary to any investor.
NOT FDIC INSURED ◾ NO BANK GUARANTEE ◾ MAY LOSE VALUE
© 2016 Wells Fargo Funds Management, LLC. All rights reserved.
| | |
 | | 300474 02-17 SA267/SAR267 12-16 |
Semi-Annual Report
December 31, 2016

Wells Fargo Global Long/Short Fund


Reduce clutter. Save trees.
Sign up for electronic delivery of prospectuses and shareholder reports at wellsfargo.com/advantagedelivery
Contents
The views expressed and any forward-looking statements are as of December 31, 2016, unless otherwise noted, and are those of the Fund managers and/or Wells Fargo Funds Management, LLC. Discussions of individual securities, or the markets generally, or any Wells Fargo Fund are not intended as individual recommendations. Future events or results may vary significantly from those expressed in any forward-looking statements. The views expressed are subject to change at any time in response to changing circumstances in the market. Wells Fargo Funds Management, LLC and the Fund disclaim any obligation to publicly update or revise any views expressed or forward-looking statements.
NOT FDIC INSURED ◾ NO BANK GUARANTEE ◾ MAY LOSE VALUE
| | | | |
| 2 | | Wells Fargo Global Long/Short Fund | | Letter to shareholders (unaudited) |

Andrew Owen
President
Wells Fargo Funds
Stocks drifted somewhat lower in the fall as the U.S. presidential campaign wore on toward the election.
Throughout the period, economic and business data, while sometimes uneven, appeared to be strengthening overall.
Dear Shareholder:
As the new president of Wells Fargo Funds now that Karla Rabusch is retiring from that position after nearly 14 years, I am pleased to offer you this semi-annual report for the Wells Fargo Global Long/Short Fund for the six-month period that ended December 31, 2016. During much of the period, positive economic data influenced global stock, bond, and commodity markets. Late in the period, stocks in the U.S. moved higher while they drifted lower in most international markets in reaction to the U.S. presidential election, production-cut agreements among Organization of the Petroleum Exporting Countries (OPEC) members intended to support higher oil prices, and an interest-rate increase in December announced by the U.S. Federal Reserve (the Fed). As interest rates increased and sentiment for stock investments—particularly in the U.S.—improved, bond values globally fell.
The surprise Brexit vote rattled markets briefly before stocks rebounded.
A round of investment market volatility and losses followed the U.K. Brexit vote to leave the European Union (E.U.) at the end of June 2016. The equity sell-off proved temporary. During July 2016, better-than-expected corporate earnings, economic data, consumer confidence, and industrial output sent stocks higher.
Stocks drifted somewhat lower in the fall as the U.S. presidential campaign wore on toward the election. At the same time, political circumstances in countries outside of the U.S. challenged investor sentiment. In the U.K., a new prime minister took office following the Brexit vote and began setting the ground rules for the country’s exit from the E.U. In Brazil, the Senate removed the president from office, and the possibility of presidential impeachment emerged in South Korea due to a corruption scandal. The French president lost a primary election and endorsed his rival. An attempted coup in Turkey, continued escalation of conflicts in Syria and Iraq, and North Korea’s testing of nuclear weapons capabilities also caused uncertainty.
Investors sensed improving economic and business data as the period advanced.
Throughout the period, economic and business data, while sometimes uneven, appeared to be strengthening overall. After generating concern early in 2016, China’s economic growth demonstrated strength. The prime minister’s reelection in Japan offered the potential for new economic stimulus. India appointed a new central-bank governor who many expected would continue the outgoing governor’s policies, which were considered effective. OPEC members agreed to production cuts intended to support increased prices for oil, which could benefit commodities markets that are economically important to many international developed and emerging markets. In the U.S., the S&P 500 Index1 recorded a 7.8% return for the six-month period that ended December 31, 2016. Developed international markets, as measured by the Morgan Stanley Capital International (MSCI) All Country World Index (ACWI) ex USA Index (Net),2 ended the period 5.6% higher. Stocks in emerging markets delivered a 4.5% gain for the period, as measured by the MSCI Emerging Markets Index (Net).3
| 1 | The S&P 500 Index consists of 500 stocks chosen for market size, liquidity, and industry group representation. It is a market-value-weighted index with each stock’s weight in the index proportionate to its market value. You cannot invest directly in an index. |
| 2 | The Morgan Stanley Capital International (MSCI) All Country World Index (ACWI) ex USA Index (Net) is a free-float-adjusted market-capitalization-weighted index that is designed to measure the equity market performance of developed markets, excluding the United States and Canada. Source: MSCI. MSCI makes no express or implied warranties or representations and shall have no liability whatsoever with respect to any MSCI data contained herein. The MSCI data may not be further redistributed or used as a basis for other indexes or any securities or financial products. This report is not approved, reviewed, or produced by MSCI. You cannot invest directly in an index. |
| 3 | The Morgan Stanley Capital International (MSCI) Emerging Markets (EM) Index (Net) is a free-float-adjusted market-capitalization-weighted index that is designed to measure the equity market performance of emerging markets. The MSCI EM Index (Net) consists of the following 23 emerging markets country indexes: Brazil, Chile, China, Colombia, Czech Republic, Egypt, Greece, Hungary, India, Indonesia, Korea, Malaysia, Mexico, Peru, the Philippines, Poland, Qatar, Russia, South Africa, Taiwan, Thailand, Turkey, and United Arab Emirates. You cannot invest directly in an index. |
| | | | | | |
| Letter to shareholders (unaudited) | | Wells Fargo Global Long/Short Fund | | | 3 | |
Fixed-income markets were volatile before the U.S. election and declined postelection.
Global fixed-income markets were volatile during the period, particularly following the U.S. election. Investors appeared to be anticipating U.S. interest-rate increases and waiting for clarity from central-bank policymakers outside of the U.S. When the Fed increased interest rates in December 2016, investors tended to favor equities and high-yield bonds, over investment-grade bonds.
Currency values in several European and Asian countries fell relative to the U.S. dollar during the period, restraining investor interest in foreign bond markets. While the Bloomberg Barclays U.S. Aggregate Bond Index4 lost 2.5% during the period, a 9.3% loss for the Bloomberg Barclays Global Aggregate ex U.S. Dollar Bond Index5 reflected relatively more difficult conditions for bonds outside of the U.S.
Don’t let short-term uncertainty derail long-term investment goals.
Periods of investment uncertainty can present challenges, but experience has taught us that maintaining long-term investment goals can be an effective way to plan for the future. To help you create a sound strategy based on your personal goals and risk tolerance, Wells Fargo Funds offers more than 100 mutual funds spanning a wide range of asset classes and investment styles. Although diversification cannot guarantee an investment profit or prevent losses, we believe it can be an effective way to manage investment risk and potentially smooth out overall portfolio performance. We encourage investors to know their investments and to understand that appropriate levels of risk-taking may unlock opportunities.
Thank you for choosing to invest with Wells Fargo Funds. We appreciate your confidence in us and remain committed to helping you meet your financial needs.
Sincerely,

Andrew Owen
President
Wells Fargo Funds
For further information about your Fund, contact your investment professional, visit our website at wellsfargofunds.com, or call us directly at 1-800-222-8222. We are available 24 hours a day, 7 days a week.
| 4 | The Bloomberg Barclays U.S. Aggregate Bond Index (formerly known as Barclays U.S. Aggregate Bond Index) is a broad-based benchmark that measures the investment-grade, U.S. dollar–denominated, fixed-rate taxable bond market, including Treasuries, government-related and corporate securities, mortgage-backed securities (agency fixed-rate and hybrid adjustable-rate mortgage pass-throughs), asset-backed securities, and commercial mortgage-backed securities. You cannot invest directly in an index. |
| 5 | The Bloomberg Barclays Global Aggregate ex U.S. Dollar Bond Index (formerly known as Barclays Global Aggregate ex U.S. Dollar Bond Index) tracks an international basket of government, corporate, agency, and mortgage-related bonds. You cannot invest directly in an index. |
| | | | |
| 4 | | Wells Fargo Global Long/Short Fund | | Performance highlights (unaudited) |
Investment objective
The Fund seeks long-term capital appreciation.
Manager
Wells Fargo Funds Management, LLC
Subadviser
Wells Capital Management Incorporated
Portfolio manager
Dale A. Winner, CFA®
Average annual total returns (%) as of December 31, 2016
| | | | | | | | | | | | | | | | | | | | | | | | | | |
| | | | | Including sales charge | | | Excluding sales charge | | | Expense ratios1 (%) | |
| | | Inception date | | 1 year | | | Since
inception | | | 1 year | | | Since
inception | | | Gross | | | Net2 | |
| Class A (WGLAX) | | 11-28-2014 | | | (3.43 | ) | | | (2.94 | ) | | | 2.50 | | | | (0.15 | ) | | | 4.80 | | | | 2.51 | |
| Class C (WGLCX) | | 11-28-2014 | | | 0.68 | | | | (0.94 | ) | | | 1.68 | | | | (0.94 | ) | | | 5.55 | | | | 3.26 | |
| Administrator Class (WGLDX) | | 11-28-2014 | | | – | | | | – | | | | 2.60 | | | | (0.03 | ) | | | 4.72 | | | | 2.41 | |
| Institutional Class (WGLSX) | | 11-28-2014 | | | – | | | | – | | | | 2.80 | | | | 0.14 | | | | 4.47 | | | | 2.21 | |
| Global Long/Short Composite Index3 | | – | | | – | | | | – | | | | 4.15 | | | | 1.02 | | | | – | | | | – | |
| Bloomberg Barclays U.S. 1-3 Month Treasury Bill Index4 | | – | | | – | | | | – | | | | 0.26 | | | | 0.14 | | | | – | | | | – | |
| MSCI ACWI Index (Net)5 | | – | | | – | | | | – | | | | 7.86 | | | | 1.56 | | | | – | | | | – | |
Figures quoted represent past performance, which is no guarantee of future results, and do not reflect taxes that a shareholder may pay on fund distributions or the redemption of fund shares. Investment return and principal value of an investment will fluctuate so that an investor’s shares, when redeemed, may be worth more or less than their original cost. Performance shown without sales charges would be lower if sales charges were reflected. Current performance may be lower or higher than the performance data quoted, which assumes the reinvestment of dividends and capital gains. Current month-end performance is available on the Fund’s website, wellsfargofunds.com.
Index returns do not include transaction costs associated with buying and selling securities, any mutual fund fees or expenses, or any taxes. It is not possible to invest directly in an index.
For Class A shares, the maximum front-end sales charge is 5.75%. For Class C shares, the maximum contingent deferred sales charge is 1.00%. Performance including a contingent deferred sales charge assumes the sales charge for the corresponding time period. Administrator Class and Institutional Class shares are sold without a front-end sales charge or contingent deferred sales charge.
Stock values fluctuate in response to the activities of individual companies and general market and economic conditions. Foreign investments are especially volatile and can rise or fall dramatically due to differences in the political and economic conditions of the host country. These risks are generally intensified in emerging markets. The use of derivatives may reduce returns and/or increase volatility. There are numerous risks associated with transactions in options on securities. Borrowing money to purchase securities or cover short positions magnifies losses and incurs expenses. Short selling is generally considered speculative, has the potential for unlimited loss, and may involve leverage. Certain investment strategies tend to increase the total risk of an investment (relative to the broader market). The Fund is exposed to regulatory and smaller-company securities risk. Consult the Fund’s prospectus for additional information on these and other risks.
Please see footnotes on page 6.
| | | | | | |
| Performance highlights (unaudited) | | Wells Fargo Global Long/Short Fund | | | 5 | |
| | | | |
| Top ten long positions (%) as of December 31, 20166 | |
Compagnie de Saint-Gobain SA | | | 2.80 | |
Metro AG | | | 2.76 | |
Lundin Mining Corporation | | | 2.60 | |
Novartis AG | | | 2.49 | |
Coach Incorporated | | | 2.31 | |
Koninklijke Philips NV | | | 2.23 | |
Mitsubishi UFJ Financial Group Incorporated | | | 2.17 | |
Hitachi Limited | | | 2.14 | |
SAP SE | | | 2.12 | |
American International Group Incorporated | | | 2.07 | |
| | | | |
| Top ten short positions (%) as of December 31, 20166 | |
iShares MSCI EAFE ETF | | | (1.83) | |
Nestle SA | | | (1.38) | |
Wisdomtree Japan Hedged Equity ETF | | | (1.32) | |
iShares MSCI Switzerland Capped ETF | | | (1.04) | |
iShares MSCI Thailand Capped ETF | | | (0.99) | |
Unilever NV | | | (0.98) | |
Schindler Holding AG | | | (0.94) | |
Peugeot SA | | | (0.87) | |
iShares MSCI Philippines ETF | | | (0.56) | |
iShares Europe ETF | | | (0.55) | |
| | | | | | | | |
| Sector allocation as of December 31, 20167 | |
| | | Gross exposure(%) | | | Net exposure(%) | |
Consumer Discretionary | | | 8 | | | | 7 | |
Consumer Staples | | | 9 | | | | 6 | |
Energy | | | 3 | | | | 4 | |
Financials | | | 24 | | | | 30 | |
Health Care | | | 9 | | | | 11 | |
Industrials | | | 20 | | | | 24 | |
Information Technology | | | 11 | | | | 14 | |
Materials | | | 5 | | | | 6 | |
Real Estate | | | 2 | | | | 2 | |
Telecommunication Services | | | 9 | | | | 11 | |
Other | | | 0 | | | | (15) | |
| | | | 100 | | | | 100 | |
| | | | | | | | |
| Country allocation as of December 31, 20167 | |
| | | Gross exposure(%) | | | Net exposure(%) | |
Canada | | | 4 | | | | 6 | |
China | | | 8 | | | | 10 | |
France | | | 5 | | | | 4 | |
Germany | | | 16 | | | | 21 | |
Hong Kong | | | 1 | | | | 2 | |
Italy | | | 4 | | | | 5 | |
Japan | | | 18 | | | | 20 | |
Netherlands | | | 7 | | | | 6 | |
Russia | | | 3 | | | | 4 | |
South Korea | | | 1 | | | | 2 | |
Switzerland | | | 6 | | | | 3 | |
Thailand | | | 0 | | | | (1) | |
United Kingdom | | | 13 | | | | 16 | |
United States | | | 14 | | | | 2 | |
| | | | 100 | | | | 100 | |
Please see footnotes on page 6.
| | | | |
| 6 | | Wells Fargo Global Long/Short Fund | | Performance highlights (unaudited) |
| 1 | Reflects the expense ratios as stated in the most recent prospectuses, which include the impact of 0.05% in acquired fund fees and expenses and 0.71% in dividend expense on securities sold short and prime broker fees. The expense ratios shown are subject to change and may differ from the annualized expense ratios shown in the financial highlights of this report, which do not include acquired fund fees and expenses. |
| 2 | The manager has contractually committed through October 31, 2017, to waive fees and/or reimburse expenses to the extent necessary to cap the Fund’s Total Annual Fund Operating Expenses After Fee Waiver at 1.75% for Class A, 2.50% for Class C, 1.65% for Administrator Class, and 1.45% for Institutional Class. After this time, the cap may be increased or the commitment to maintain the cap may be terminated only with the approval of the Board of Trustees. Brokerage commissions, stamp duty fees, interest, taxes, acquired fund fees and expenses, prime broker fees, dividend and interest expenses on securities sold short, and extraordinary expenses are excluded from the expense cap. Without this cap, the Fund’s returns would have been lower. |
| 3 | Source: Wells Fargo Funds Management, LLC. The Global Long/Short Composite Index is weighted 50% in the MSCI ACWI Index (Net) and 50% in the Bloomberg Barclays U.S. 1-3 Month Treasury Bill Index. You cannot invest directly in an index. |
| 4 | The Bloomberg Barclays U.S. 1-3 Month Treasury Bill Index (formerly known as Barclays U.S. 1-3 Month Treasury Bill Index) includes all publicly issued zero-coupon U.S. Treasury bills that have a remaining maturity of less than 3 months and more than 1 month, are rated investment grade, and have $250 million or more of outstanding face value. You cannot invest directly in an index. |
| 5 | The Morgan Stanley Capital International (MSCI) All Country World Index (ACWI) Index (Net) is a free-float-adjusted market-capitalization-weighted index that is designed to measure the equity market performance of developed and emerging markets. The MSCI ACWI Index (Net) consists of 46 country indexes comprising 23 developed and 23 emerging markets country indexes. The developed markets country indexes included are Australia, Austria, Belgium, Canada, Denmark, Finland, France, Germany, Hong Kong, Ireland, Israel, Italy, Japan, the Netherlands, New Zealand, Norway, Portugal, Singapore, Spain, Sweden, Switzerland, the United Kingdom, and the United States. The emerging markets country indexes included are Brazil, Chile, China, Colombia, Czech Republic, Egypt, Greece, Hungary, India, Indonesia, Korea, Malaysia, Mexico, Peru, the Philippines, Poland, Qatar, Russia, South Africa, Taiwan, Thailand, Turkey, and United Arab Emirates. Source: MSCI. MSCI makes no express or implied warranties or representations and shall have no liability whatsoever with respect to any MSCI data contained herein. The MSCI data may not be further redistributed or used as a basis for other indexes or any securities or financial products. This report is not approved, reviewed, or produced by MSCI. You cannot invest directly in an index. |
| 6 | The ten largest long and short position holdings, excluding cash and cash equivalents, are calculated based on the value of the investments divided by total net assets of the Fund. Holdings are subject to change and may have changed since the date specified. |
| 7 | The chart shows the percentage of Fund holdings within a particular sector or country that was held long (securities owned by the Fund) or sold short (sale of borrowed securities). Gross exposure is the absolute value of the long positions and short positions combined. Net exposure is the percentage of long positions minus the percentage of positions sold short. Short positions are represented by negative numbers. |
| | | | | | |
| Fund expenses (unaudited) | | Wells Fargo Global Long/Short Fund | | | 7 | |
As a shareholder of the Fund, you incur two types of costs: (1) transaction costs, including sales charges (loads) on purchase payments and contingent deferred sales charges (if any) on redemptions and (2) ongoing costs, including management fees, distribution (12b-1) and/or shareholder servicing fees, and other Fund expenses. This example is intended to help you understand your ongoing costs (in dollars) of investing in the Fund and to compare these costs with the ongoing costs of investing in other mutual funds.
The example is based on an investment of $1,000 invested at the beginning of the six-month period and held for the entire period from July 1, 2016 to December 31, 2016.
Actual expenses
The “Actual” line of the table below provides information about actual account values and actual expenses. You may use the information in this line, together with the amount you invested, to estimate the expenses that you paid over the period. Simply divide your account value by $1,000 (for example, an $8,600 account value divided by $1,000 = 8.6), then multiply the result by the number in the “Actual” line under the heading entitled “Expenses paid during period” for your applicable class of shares to estimate the expenses you paid on your account during this period.
Hypothetical example for comparison purposes
The “Hypothetical” line of the table below provides information about hypothetical account values and hypothetical expenses based on the Fund’s actual expense ratio and an assumed rate of return of 5% per year before expenses, which is not the Fund’s actual return. The hypothetical account values and expenses may not be used to estimate the actual ending account balance or expenses you paid for the period. You may use this information to compare the ongoing costs of investing in the Fund and other funds. To do so, compare this 5% hypothetical example with the 5% hypothetical examples that appear in the shareholder reports of the other funds.
Please note that the expenses shown in the table are meant to highlight your ongoing costs only and do not reflect any transactional costs, such as sales charges (loads) and contingent deferred sales charges. Therefore, the “Hypothetical” line of the table is useful in comparing ongoing costs only and will not help you determine the relative total costs of owning different funds. In addition, if these transactional costs were included, your costs would have been higher.
| | | | | | | | | | | | | | | | |
| | | Beginning
account value
7-1-2016 | | | Ending
account value
12-31-2016 | | | Expenses
paid during
the period¹ | | | Annualized net
expense ratio | |
Class A | | | | | | | | | | | | | | | | |
Actual | | $ | 1,000.00 | | | $ | 1,075.33 | | | $ | 11.16 | | | | 2.14 | % |
Hypothetical (5% return before expenses) | | $ | 1,000.00 | | | $ | 1,014.38 | | | $ | 10.84 | | | | 2.14 | % |
Class C | | | | | | | | | | | | | | | | |
Actual | | $ | 1,000.00 | | | $ | 1,070.64 | | | $ | 15.04 | | | | 2.89 | % |
Hypothetical (5% return before expenses) | | $ | 1,000.00 | | | $ | 1,010.61 | | | $ | 14.61 | | | | 2.89 | % |
Administrator Class | | | | | | | | | | | | | | | | |
Actual | | $ | 1,000.00 | | | $ | 1,076.25 | | | $ | 10.65 | | | | 2.04 | % |
Hypothetical (5% return before expenses) | | $ | 1,000.00 | | | $ | 1,014.88 | | | $ | 10.33 | | | | 2.04 | % |
Institutional Class | | | | | | | | | | | | | | | | |
Actual | | $ | 1,000.00 | | | $ | 1,076.09 | | | $ | 9.60 | | | | 1.84 | % |
Hypothetical (5% return before expenses) | | $ | 1,000.00 | | | $ | 1,015.89 | | | $ | 9.32 | | | | 1.84 | % |
| 1 | Expenses paid is equal to the annualized net expense ratio of each class multiplied by the average account value over the period, multiplied by the number of days in the most recent fiscal half-year divided by the number of days in the fiscal year (to reflect the one-half-year period). |
| | | | |
| 8 | | Wells Fargo Global Long/Short Fund | | Portfolio of investments—December 31, 2016 (unaudited) |
| | | | | | | | | | | | | | | | |
| Security name | | | | | | | | Shares | | | Value | |
| | | | |
Common Stocks: 59.99% | | | | | | | | | | | | | | | | |
| | | | |
| Brazil: 0.10% | | | | | | | | | | | | | | | | |
Cosan Limited Class A (Energy, Oil, Gas & Consumable Fuels) (b) | | | | | | | | | | | 1,386 | | | $ | 10,409 | |
| | | | | | | | | | | | | | | | |
| | | | |
| Canada: 2.60% | | | | | | | | | | | | | | | | |
Lundin Mining Corporation (Materials, Metals & Mining) † | | | | | | | | | | | 56,477 | | | | 269,209 | |
| | | | | | | | | | | | | | | | |
| | | | |
| China: 4.70% | | | | | | | | | | | | | | | | |
China Everbright Limited (Financials, Capital Markets) | | | | | | | | | | | 40,000 | | | | 76,136 | |
China Mobile Limited (Telecommunication Services, Wireless Telecommunication Services) | | | | | | | | | | | 18,500 | | | | 196,105 | |
Industrial & Commercial Bank of China Limited H Shares (Financials, Banks) | | | | | | | | | | | 163,000 | | | | 97,743 | |
Shanghai Pharmaceuticals Holding Company Limited H Shares (Health Care, Health Care Providers & Services) | | | | | | | | | | | 26,700 | | | | 61,219 | |
YY Incorporated (Information Technology, Internet Software & Services) †(b) | | | | | | | | | | | 1,377 | | | | 54,281 | |
| | | | |
| | | | | | | | | | | | | | | 485,484 | |
| | | | | | | | | | | | | | | | |
| | | | |
| France: 2.80% | | | | | | | | | | | | | | | | |
Compagnie de Saint-Gobain SA (Industrials, Building Products) | | | | | | | | | | | 6,224 | | | | 289,945 | |
| | | | | | | | | | | | | | | | |
| | | | |
| Germany: 10.05% | | | | | | | | | | | | | | | | |
Metro AG (Consumer Staples, Food & Staples Retailing) | | | | | | | | | | | 8,575 | | | | 285,101 | |
Muenchener Rueckversicherungs Gesellschaft AG (Financials, Insurance) | | | | | | | | | | | 830 | | | | 156,960 | |
Rheinmetall AG (Industrials, Industrial Conglomerates) | | | | | | | | | | | 3,163 | | | | 212,757 | |
SAP SE (Information Technology, Software) | | | | | | | | | | | 2,512 | | | | 218,971 | |
Siemens AG (Industrials, Industrial Conglomerates) | | | | | | | | | | | 1,343 | | | | 165,121 | |
| | | | |
| | | | | | | | | | | | | | | 1,038,910 | |
| | | | | | | | | | | | | | | | |
| | | | |
| Hong Kong: 0.83% | | | | | | | | | | | | | | | | |
Xinyi Automobile Glass Hong Kong Enterprises Limited (Consumer Discretionary, Auto Components) † | | | | | | | | | | | 12,750 | | | | 2,466 | |
Xinyi Glass Holdings Limited (Consumer Discretionary, Auto Components) | | | | | | | | | | | 102,000 | | | | 83,394 | |
| | | | |
| | | | | | | | | | | | | | | 85,860 | |
| | | | | | | | | | | | | | | | |
| | | | |
| Italy: 2.38% | | | | | | | | | | | | | | | | |
Eni SpA (Energy, Oil, Gas & Consumable Fuels) | | | | | | | | | | | 10,356 | | | | 168,642 | |
Prysmian SpA (Industrials, Electrical Equipment) | | | | | | | | | | | 3,004 | | | | 77,157 | |
| | | | |
| | | | | | | | | | | | | | | 245,799 | |
| | | | | | | | | | | | | | | | |
| | | | |
| Japan: 10.90% | | | | | | | | | | | | | | | | |
Coca-Cola East Japan Company Limited (Consumer Staples, Beverages) | | | | | | | | | | | 9,000 | | | | 198,366 | |
Daiwa Securities Group Incorporated (Financials, Capital Markets) (b) | | | | | | | | | | | 33,000 | | | | 203,379 | |
Hitachi Limited (Information Technology, Electronic Equipment, Instruments & Components) (b) | | | | | | | | | | | 41,000 | | | | 221,707 | |
Mitsubishi UFJ Financial Group Incorporated (Financials, Banks) (b) | | | | | | | | | | | 36,400 | | | | 224,302 | |
Mitsui Fudosan Company Limited (Real Estate, Real Estate Management & Development) (b) | | | | | | | | | | | 5,000 | | | | 115,722 | |
Nomura Holdings Incorporated (Financials, Capital Markets) (b) | | | | | | | | | | | 27,700 | | | | 163,320 | |
| | | | |
| | | | | | | | | | | | | | | 1,126,796 | |
| | | | | | | | | | | | | | | | |
| | | | |
| Netherlands: 4.00% | | | | | | | | | | | | | | | | |
Koninklijke Philips NV (Industrials, Industrial Conglomerates) | | | | | | | | | | | 7,550 | | | | 230,478 | |
NN Group NV (Financials, Insurance) | | | | | | | | | | | 5,401 | | | | 183,040 | |
| | | | |
| | | | | | | | | | | | | | | 413,518 | |
| | | | | | | | | | | | | | | | |
The accompanying notes are an integral part of these financial statements.
| | | | | | |
| Portfolio of investments—December 31, 2016 (unaudited) | | Wells Fargo Global Long/Short Fund | | | 9 | |
| | | | | | | | | | | | | | | | |
| Security name | | | | | | | | Shares | | | Value | |
| | | | |
| Russia: 1.69% | | | | | | | | | | | | | | | | |
Mobile Telesystems ADR (Telecommunication Services, Wireless Telecommunication Services) | | | | | | | | | | | 19,200 | | | $ | 174,912 | |
| | | | | | | | | | | | | | | | |
| | | | |
| South Korea: 0.91% | | | | | | | | | | | | | | | | |
Hana Financial Group Incorporated (Financials, Banks) | | | | | | | | | | | 3,620 | | | | 93,662 | |
| | | | | | | | | | | | | | | | |
| | | | |
| Switzerland: 3.50% | | | | | | | | | | | | | | | | |
Novartis AG (Health Care, Pharmaceuticals) | | | | | | | | | | | 3,533 | | | | 257,091 | |
Zurich Insurance Group AG (Financials, Insurance) | | | | | | | | | | | 382 | | | | 105,188 | |
| | | | |
| | | | | | | | | | | | | | | 362,279 | |
| | | | | | | | | | | | | | | | |
| | | | |
| United Kingdom: 6.69% | | | | | | | | | | | | | | | | |
Capita plc (Industrials, Professional Services) | | | | | | | | | | | 5,471 | | | | 35,802 | |
Smiths Group plc (Industrials, Industrial Conglomerates) | | | | | | | | | | | 12,262 | | | | 213,981 | |
United Business Media plc (Consumer Discretionary, Media) | | | | | | | | | | | 17,914 | | | | 161,495 | |
Vodafone Group plc (Telecommunication Services, Wireless Telecommunication Services) | | | | | | | | | | | 84,290 | | | | 207,602 | |
Wolseley plc (Industrials, Trading Companies & Distributors) (b) | | | | | | | | | | | 1,197 | | | | 73,199 | |
| | | | |
| | | | | | | | | | | | | | | 692,079 | |
| | | | | | | | | | | | | | | | |
| | | | |
| United States: 8.84% | | | | | | | | | | | | | | | | |
Agilent Technologies Incorporated (Health Care, Life Sciences Tools & Services) (b) | | | | | | | | | | | 1,574 | | | | 71,711 | |
American International Group Incorporated (Financials, Insurance) (b) | | | | | | | | | | | 3,278 | | | | 214,086 | |
Apple Incorporated (Information Technology, Technology Hardware, Storage & Peripherals) (b) | | | | | | | | | | | 1,793 | | | | 207,665 | |
Coach Incorporated (Consumer Discretionary, Textiles, Apparel & Luxury Goods) (b) | | | | | | | | | | | 6,808 | | | | 238,416 | |
Mead Johnson Nutrition Company (Consumer Staples, Food Products) (b) | | | | | | | | | | | 314 | | | | 22,219 | |
Merck & Company Incorporated (Health Care, Pharmaceuticals) (b) | | | | | | | | | | | 1,087 | | | | 63,992 | |
Pfizer Incorporated (Health Care, Pharmaceuticals) (b) | | | | | | | | | | | 2,951 | | | | 95,852 | |
| | | | |
| | | | | | | | | | | | | | | 913,941 | |
| | | | | | | | | | | | | | | | |
| | | | |
Total Common Stocks (Cost $6,151,523) | | | | | | | | | | | | | | | 6,202,803 | |
| | | | | | | | | | | | | | | | |
| | | | |
| | | | | | Expiration date | | | | | | | |
| Participation Notes: 0.97% | | | | | | | | | | | | | | | | |
| | | | |
| China: 0.97% | | | | | | | | | | | | | | | | |
HSBC Bank plc (Kweichow Moutai Company Limited Class A) (Consumer Staples, Beverages) † | | | | | | | 12/4/2024 | | | | 2,090 | | | | 100,572 | |
| | | | | | | | | | | | | | | | |
| | | | |
Total Participation Notes (Cost $53,236) | | | | | | | | | | | | | | | 100,572 | |
| | | | | | | | | | | | | | | | |
| | | | |
| | | Strike price | | | | | | Contracts | | | | |
| Purchased Put Options: 0.05% | | | | | | | | | | | | | | | | |
iShares MSCI EMU ETF | | $ | 35 | | | | 1-20-2017 | | | | 80 | | | | 5,200 | |
| | | | | | | | | | | | | | | | |
| | | | |
Total Purchased Put Options (Cost $5,520) | | | | | | | | | | | | | | | 5,200 | |
| | | | | | | | | | | | | | | | |
| | | | |
| | | Yield | | | | | | Shares | | | | |
| Short-Term Investments: 37.49% | | | | | | | | | | | | | | | | |
| | | | |
| Investment Companies: 37.49% | | | | | | | | | | | | | | | | |
Wells Fargo Government Money Market Fund Select Class (l)(u) | | | 0.43 | % | | | | | | | 3,875,744 | | | | 3,875,744 | |
| | | | | | | | | | | | | | | | |
| | | | |
Total Short-Term Investments (Cost $3,875,744) | | | | | | | | | | | | | | | 3,875,744 | |
| | | | | | | | | | | | | | | | |
The accompanying notes are an integral part of these financial statements.
| | | | |
| 10 | | Wells Fargo Global Long/Short Fund | | Portfolio of investments—December 31, 2016 (unaudited) |
| | | | | | | | | | | | | | | | |
| Security name | | | | | | | | Shares | | | Value | |
| | | | |
Securities Sold Short: (13.93%) | | | | | | | | | | | | | | | | |
| | | | |
Common Stocks: (6.73%) | | | | | | | | | | | | | | | | |
| | | | |
| France: (0.87%) | | | | | | | | | | | | | | | | |
Peugeot SA (Consumer Discretionary, Automobiles) �� | | | | | | | | | | | (5,489 | ) | | $ | (89,530 | ) |
| | | | | | | | | | | | | | | | |
| | | | |
| Japan: (1.62%) | | | | | | | | | | | | | | | | |
Isetan Mitsukoshi Holdings Limited (Consumer Discretionary, Multiline Retail) | | | | | | | | | | | (1,200 | ) | | | (12,937 | ) |
Lawson Incorporated (Consumer Staples, Food & Staples Retailing) | | | | | | | | | | | (750 | ) | | | (52,684 | ) |
Marubeni Corporation (Industrials, Trading Companies & Distributors) | | | | | | | | | | | (5,500 | ) | | | (31,191 | ) |
McDonalds Holdings Company (Consumer Discretionary, Hotels, Restaurants & Leisure) | | | | | | | | | | | (1,000 | ) | | | (26,182 | ) |
Odakyu Electric Railway Company (Industrials, Road & Rail) | | | | | | | | | | | (1,000 | ) | | | (19,790 | ) |
Takashimaya Company Limited (Consumer Discretionary, Multiline Retail) | | | | | | | | | | | (3,000 | ) | | | (24,744 | ) |
| | | | |
| | | | | | | | | | | | | | | (167,528 | ) |
| | | | | | | | | | | | | | | | |
| | | | |
| Netherlands: (0.98%) | | | | | | | | | | | | | | | | |
Unilever NV (Consumer Staples, Personal Products) | | | | | | | | | | | (2,453 | ) | | | (101,001 | ) |
| | | | | | | | | | | | | | | | |
| | | | |
| Philippines: (0.15%) | | | | | | | | | | | | | | | | |
PLDT Incorporated (Telecommunication Services, Wireless Telecommunication Services) | | | | | | | | | | | (580 | ) | | | (15,979 | ) |
| | | | | | | | | | | | | | | | |
| | | | |
| Switzerland: (2.32%) | | | | | | | | | | | | | | | | |
Nestle SA (Consumer Staples, Food Products) | | | | | | | | | | | (1,986 | ) | | | (142,470 | ) |
Schindler Holding AG (Industrials, Machinery) | | | | | | | | | | | (553 | ) | | | (97,534 | ) |
| | | | |
| | | | | | | | | | | | | | | (240,004 | ) |
| | | | | | | | | | | | | | | | |
| | | | |
| Thailand: (0.30%) | | | | | | | | | | | | | | | | |
Charoen Pokphand Foods PCL (Consumer Staples, Food Products) | | | | | | | | | | | (37,300 | ) | | | (30,727 | ) |
| | | | | | | | | | | | | | | | |
| | | | |
| United States: (0.49%) | | | | | | | | | | | | | | | | |
Eaton Vance Corporation (Financials, Capital Markets) | | | | | | | | | | | (1,018 | ) | | | (42,634 | ) |
Franklin Resources Incorporated (Financials, Capital Markets) | | | | | | | | | | | (208 | ) | | | (8,234 | ) |
| | | | |
| | | | | | | | | | | | | | | (50,868 | ) |
| | | | | | | | | | | | | | | | |
| Exchange-Traded Funds: (7.20%) | | | | | | | | | | | | | | | | |
| | | | |
| United States: (7.20%) | | | | | | | | | | | | | | | | |
iShares Europe ETF | | | | | | | | | | | (1,470 | ) | | | (57,051 | ) |
iShares MSCI EAFE ETF | | | | | | | | | | | (3,282 | ) | | | (189,470 | ) |
iShares MSCI EMU ETF | | | | | | | | | | | (1,426 | ) | | | (49,340 | ) |
iShares MSCI Philippines ETF | | | | | | | | | | | (1,782 | ) | | | (57,772 | ) |
iShares MSCI Singapore Capped ETF | | | | | | | | | | | (2,251 | ) | | | (44,862 | ) |
iShares MSCI Switzerland Capped ETF | | | | | | | | | | | (3,633 | ) | | | (107,028 | ) |
iShares MSCI Thailand Capped ETF | | | | | | | | | | | (1,414 | ) | | | (101,935 | ) |
WisdomTree Japan Hedged Equity ETF | | | | | | | | | | | (2,762 | ) | | | (136,829 | ) |
| | | | |
| | | | | | | | | | | | | | | (744,287 | ) |
| | | | | | | | | | | | | | | | |
| | | | |
Total Securities Sold Short (Proceeds $(1,540,134)) | | | | | | | | | | | | | | | (1,439,924 | ) |
| | | | | | | | | | | | | | | | |
| | | | | | | | |
| Total investments in securities (excluding securities sold short) (Cost $10,086,023) * | | | 98.50 | % | | | 10,184,319 | |
Total securities sold short (Proceeds ($1,540,134)) | | | (13.93 | ) | | | (1,439,924 | ) |
Other assets and liabilities, net | | | 15.43 | | | | 1,595,038 | |
| | | | | | | | |
| Total net assets | | | 100.00 | % | | $ | 10,339,433 | |
| | | | | | | | |
The accompanying notes are an integral part of these financial statements.
| | | | | | |
| Portfolio of investments—December 31, 2016 (unaudited) | | Wells Fargo Global Long/Short Fund | | | 11 | |
| (b) | All or a portion of this security is segregated as collateral for securities sold short. |
| † | Non-income-earning security |
| (l) | The issuer of the security is an affiliated person of the Fund as defined in the Investment Company Act of 1940. |
| (u) | The rate represents the 7-day annualized yield at period end. |
| * | Cost for federal income tax purposes is $10,086,566 and unrealized gains (losses) consists of: |
| | | | |
Gross unrealized gains | | $ | 512,687 | |
Gross unrealized losses | | | (414,934 | ) |
| | | | |
Net unrealized gains | | $ | 97,753 | |
The accompanying notes are an integral part of these financial statements.
| | | | |
| 12 | | Wells Fargo Global Long/Short Fund | | Statement of assets and liabilities—December 31, 2016 (unaudited) |
| | | | |
| | | | |
| |
Assets | | | | |
Investments | | | | |
In unaffiliated securities, at value (cost $6,210,279) | | $ | 6,308,575 | |
In affiliated securities, at value (cost $3,875,744) | | | 3,875,744 | |
| | | | |
Total investments, at value (cost $10,086,023) | | | 10,184,319 | |
Cash | | | 9,808 | |
Segregated cash for securities sold short | | | 1,536,294 | |
Receivable for dividends | | | 14,028 | |
Unrealized gains on forward foreign currency contracts | | | 13,321 | |
Receivable from manager | | | 7,118 | |
Prepaid expenses and other assets | | | 51,692 | |
| | | | |
Total assets | | | 11,816,580 | |
| | | | |
| |
Liabilities | | | | |
Dividends payable on securities sold short | | | 297 | |
Payable for securities sold short, at value (proceeds $1,540,134) | | | 1,439,924 | |
Distribution fee payable | | | 98 | |
Administration fees payable | | | 1,251 | |
Accrued expenses and other liabilities | | | 35,577 | |
| | | | |
Total liabilities | | | 1,477,147 | |
| | | | |
Total net assets | | $ | 10,339,433 | |
| | | | |
| |
NET ASSETS CONSIST OF | | | | |
Paid-in capital | | $ | 10,449,106 | |
Accumulated net investment loss | | | (65,958 | ) |
Accumulated net realized losses on investments | | | (255,035 | ) |
Net unrealized gains on investments | | | 211,320 | |
| | | | |
Total net assets | | $ | 10,339,433 | |
| | | | |
| |
COMPUTATION OF NET ASSET VALUE AND OFFERING PRICE PER SHARE | | | | |
Net assets – Class A | | $ | 357,302 | |
Shares outstanding – Class A1 | | | 36,269 | |
Net asset value per share – Class A | | | $9.85 | |
Maximum offering price per share – Class A2 | | | $10.45 | |
Net assets – Class C | | $ | 144,605 | |
Shares outstanding – Class C1 | | | 14,905 | |
Net asset value per share – Class C | | | $9.70 | |
Net assets – Administrator Class | | $ | 104,918 | |
Shares outstanding – Administrator Class1 | | | 10,621 | |
Net asset value per share – Administrator Class | | | $9.88 | |
Net assets – Institutional Class | | $ | 9,732,608 | |
Shares outstanding – Institutional Class1 | | | 982,683 | |
Net asset value per share – Institutional Class | | | $9.90 | |
| 1 | The Fund has an unlimited number of authorized shares. |
| 2 | Maximum offering price is computed as 100/94.25 of net asset value. On investments of $50,000 or more, the offering price is reduced. |
The accompanying notes are an integral part of these financial statements.
| | | | | | |
| Statement of operations—six months ended December 31, 2016 (unaudited) | | Wells Fargo Global Long/Short Fund | | | 13 | |
| | | | |
| | | | |
| |
Investment income | | | | |
Dividends (net of foreign withholding taxes of $3,109) | | $ | 56,647 | |
Income from affiliated securities | | | 6,339 | |
| | | | |
Total investment income | | | 62,986 | |
| | | | |
| |
Expenses | | | | |
Management fee | | | 66,836 | |
Administration fees | | | | |
Class A | | | 390 | |
Class C | | | 151 | |
Administrator Class | | | 65 | |
Institutional Class | | | 6,284 | |
Shareholder servicing fees | | | | |
Class A | | | 464 | |
Class C | | | 180 | |
Administrator Class | | | 124 | |
Distribution fee | | | | |
Class C | | | 540 | |
Custody and accounting fees | | | 9,547 | |
Professional fees | | | 28,996 | |
Registration fees | | | 30,227 | |
Shareholder report expenses | | | 20,082 | |
Trustees’ fees and expenses | | | 12,884 | |
Dividends on securities sold short | | | 12,578 | |
Prime broker fees | | | 7,477 | |
Other fees and expenses | | | 7,803 | |
| | | | |
Total expenses | | | 204,628 | |
Less: Fee waivers and/or expense reimbursements | | | (108,613 | ) |
| | | | |
Net expenses | | | 96,015 | |
| | | | |
Net investment loss | | | (33,029 | ) |
| | | | |
| |
REALIZED AND UNREALIZED GAINS (LOSSES) ON INVESTMENTS | | | | |
| |
Net realized gains (losses) on: | | | | |
Unaffiliated securities | | | (25,846 | ) |
Securities sold short | | | (2,199 | ) |
Forward foreign currency contract transactions | | | 106,207 | |
| | | | |
Net realized gains on investments | | | 78,162 | |
| | | | |
| |
Net change in unrealized gains (losses) on: | | | | |
Unaffiliated securities | | | 736,151 | |
Securities sold short | | | (24,592 | ) |
Forward foreign currency contract transactions | | | (19,269 | ) |
| | | | |
Net change in unrealized gains (losses) on investments | | | 692,290 | |
| | | | |
Net realized and unrealized gains (losses) on investments | | | 770,452 | |
| | | | |
Net increase in net assets resulting from operations | | $ | 737,423 | |
| | | | |
The accompanying notes are an integral part of these financial statements.
| | | | |
| 14 | | Wells Fargo Global Long/Short Fund | | Statement of changes in net assets |
| | | | | | | | | | | | | | | | |
| | | Six months ended
December 31, 2016
(unaudited) | | | Year ended
June 30, 2016 | |
| | | | |
Operations | | | | | | | | | | | | | | | | |
Net investment loss | | | | | | $ | (33,029 | ) | | | | | | $ | (28,128 | ) |
Net realized gains (losses) on investments | | | | | | | 78,162 | | | | | | | | (363,926 | ) |
Net change in unrealized gains (losses) on investments | | | | | | | 692,290 | | | | | | | | (694,344 | ) |
| | | | |
Net increase (decrease) in net assets resulting from operations | | | | | | | 737,423 | | | | | | | | (1,086,398 | ) |
| | | | |
| | | | |
Distributions to shareholders from | | | | | | | | | | | | | | | | |
Net investment income | | | | | | | | | | | | | | | | |
Class A | | | | | | | 0 | | | | | | | | (499 | ) |
Administrator Class | | | | | | | 0 | | | | | | | | (76 | ) |
Institutional Class | | | | | | | 0 | | | | | | | | (23,095 | ) |
Net realized gains | | | | | | | | | | | | | | | | |
Class A | | | | | | | 0 | | | | | | | | (3,385 | ) |
Class C | | | | | | | 0 | | | | | | | | (1,461 | ) |
Administrator Class | | | | | | | 0 | | | | | | | | (1,017 | ) |
Institutional Class | | | | | | | 0 | | | | | | | | (98,879 | ) |
| | | | |
Total distributions to shareholders | | | | | | | 0 | | | | | | | | (128,412 | ) |
| | | | |
| | | | |
Capital share transactions | | | Shares | | | | | | | | Shares | | | | | |
Proceeds from shares sold | | | | | | | | | | | | | | | | |
Class A | | | 352 | | | | 3,420 | | | | 14,706 | | | | 143,822 | |
Class C | | | 0 | | | | 0 | | | | 3,035 | | | | 28,407 | |
Administrator Class | | | 507 | | | | 5,000 | | | | 0 | | | | 0 | |
| | | | |
| | | | | | | 8,420 | | | | | | | | 172,229 | |
| | | | |
Reinvestment of distributions | | | | | | | | | | | | | | | | |
Class A | | | 0 | | | | 0 | | | | 406 | | | | 3,884 | |
Class C | | | 0 | | | | 0 | | | | 154 | | | | 1,461 | |
Administrator Class | | | 0 | | | | 0 | | | | 114 | | | | 1,093 | |
Institutional Class | | | 0 | | | | 0 | | | | 12,710 | | | | 121,974 | |
| | | | |
| | | | | | | 0 | | | | | | | | 128,412 | |
| | | | |
Payment for shares redeemed | | | | | | | | | | | | | | | | |
Class A | | | (2,824 | ) | | | (27,345 | ) | | | (4,908 | ) | | | (46,365 | ) |
Class C | | | 0 | | | | 0 | | | | (2,874 | ) | | | (26,632 | ) |
Institutional Class | | | (498 | ) | | | (4,856 | ) | | | (1,596 | ) | | | (14,698 | ) |
| | | | |
| | | | | | | (32,201 | ) | | | | | | | (87,695 | ) |
| | | | |
Net increase (decrease) in net assets resulting from capital share transactions | | | | | | | (23,781 | ) | | | | | | | 212,946 | |
| | | | |
Total increase (decrease) in net assets | | | | | | | 713,642 | | | | | | | | (1,001,864 | ) |
| | | | |
| | | | |
Net assets | | | | | | | | | | | | | | | | |
Beginning of period | | | | | | | 9,625,791 | | | | | | | | 10,627,655 | |
| | | | |
End of period | | | | | | $ | 10,339,433 | | | | | | | $ | 9,625,791 | |
| | | | |
Accumulated net investment loss | | | | | | $ | (65,958 | ) | | | | | | $ | (32,929 | ) |
| | | | |
The accompanying notes are an integral part of these financial statements.
| | | | | | |
| Financial highlights | | Wells Fargo Global Long/Short Fund | | | 15 | |
(For a share outstanding throughout each period)
| | | | | | | | | | | | |
| | | Six months ended December 31, 2016 (unaudited) | | | Year ended June 30 | |
| CLASS A | | | 2016 | | | 20151 | |
Net asset value, beginning of period | | | $9.16 | | | | $10.35 | | | | $10.00 | |
Net investment loss | | | (0.05 | ) | | | (0.04 | ) | | | (0.04 | )2 |
Net realized and unrealized gains (losses) on investments | | | 0.74 | | | | (1.04 | ) | | | 0.39 | |
| | | | | | | | | | | | |
Total from investment operations | | | 0.69 | | | | (1.08 | ) | | | 0.35 | |
Distributions to shareholders from | | | | | | | | | | | | |
Net investment income | | | 0.00 | | | | (0.01 | ) | | | 0.00 | |
Net realized gains | | | 0.00 | | | | (0.10 | ) | | | 0.00 | |
| | | | | | | | | | | | |
Total distributions to shareholders | | | 0.00 | | | | (0.11 | ) | | | 0.00 | |
Net asset value, end of period | | | $9.85 | | | | $9.16 | | | | $10.35 | |
Total return3 | | | 7.53 | % | | | (10.43 | )% | | | 3.50 | % |
Ratios to average net assets (annualized) | | | | | | | | | | | | |
Gross expenses | | | 4.28 | %4 | | | 4.77 | %4 | | | 5.40 | %4 |
Net expenses | | | 2.14 | %4 | | | 2.47 | %4 | | | 2.96 | %4 |
Net investment loss | | | (0.90 | )%4 | | | (0.41 | )%4 | | | (0.59 | )%4 |
Supplemental data | | | | | | | | | | | | |
Portfolio turnover rate | | | 31 | % | | | 37 | % | | | 62 | % |
Net assets, end of period (000s omitted) | | | $357 | | | | $355 | | | | $295 | |
| 1 | For the period from November 28, 2014 (commencement of class operations) to June 30, 2015 |
| 2 | Calculated based upon average shares outstanding. |
| 3 | Total return calculations do not include any sales charges. Returns for periods of less than one year are not annualized. |
| 4 | Ratios include fees for the prime broker and expense from dividends on securities sold short as follows: |
| | | | |
Six months ended December 31, 2016 (unaudited) | | | 0.39 | % |
Year ended June 30, 2016 | | | 0.72 | % |
Year ended June 30, 20151 | | | 1.21 | % |
The accompanying notes are an integral part of these financial statements.
| | | | |
| 16 | | Wells Fargo Global Long/Short Fund | | Financial highlights |
(For a share outstanding throughout each period)
| | | | | | | | | | | | |
| | | Six months ended December 31, 2016 (unaudited) | | | Year ended June 30 | |
| CLASS C | | | 2016 | | | 20151 | |
Net asset value, beginning of period | | | $9.06 | | | | $10.31 | | | | $10.00 | |
Net investment loss | | | (0.08 | ) | | | (0.12 | ) | | | (0.07 | ) |
Net realized and unrealized gains (losses) on investments | | | 0.72 | | | | (1.03 | ) | | | 0.38 | |
| | | | | | | | | | | | |
Total from investment operations | | | 0.64 | | | | (1.15 | ) | | | 0.31 | |
Distributions to shareholders from | | | | | | | | | | | | |
Net realized gains | | | 0.00 | | | | (0.10 | ) | | | 0.00 | |
Net asset value, end of period | | | $9.70 | | | | $9.06 | | | | $10.31 | |
Total return2 | | | 7.06 | % | | | (11.18 | )% | | | 3.10 | % |
Ratios to average net assets (annualized) | | | | | | | | | | | | |
Gross expenses | | | 5.03 | %3 | | | 5.50 | %3 | | | 6.12 | %3 |
Net expenses | | | 2.89 | %3 | | | 3.20 | %3 | | | 3.54 | %3 |
Net investment loss | | | (1.66 | )%3 | | | (1.24 | )%3 | | | (1.64 | )%3 |
Supplemental data | | | | | | | | | | | | |
Portfolio turnover rate | | | 31 | % | | | 37 | % | | | 62 | % |
Net assets, end of period (000s omitted) | | | $145 | | | | $135 | | | | $150 | |
| 1 | For the period from November 28, 2014 (commencement of class operations) to June 30, 2015 |
| 2 | Total return calculations do not include any sales charges. Returns for periods of less than one year are not annualized. |
| 3 | Ratios include fees for the prime broker and expense from dividends on securities sold short as follows: |
| | | | |
Six months ended December 31, 2016 (unaudited) | | | 0.39 | % |
Year ended June 30, 2016 | | | 0.70 | % |
Year ended June 30, 20151 | | | 1.04 | % |
The accompanying notes are an integral part of these financial statements.
| | | | | | |
| Financial highlights | | Wells Fargo Global Long/Short Fund | | | 17 | |
(For a share outstanding throughout each period)
| | | | | | | | | | | | |
| | | Six months ended December 31, 2016 (unaudited) | | | Year ended June 30 | |
| ADMINISTRATOR CLASS | | | 2016 | | | 20151 | |
Net asset value, beginning of period | | | $9.18 | | | | $10.36 | | | | $10.00 | |
Net investment loss | | | (0.04 | ) | | | (0.04 | ) | | | (0.05 | ) |
Net realized and unrealized gains (losses) on investments | | | 0.74 | | | | (1.03 | ) | | | 0.41 | |
| | | | | | | | | | | | |
Total from investment operations | | | 0.70 | | | | (1.07 | ) | | | 0.36 | |
Distributions to shareholders from | | | | | | | | | | | | |
Net investment income | | | 0.00 | | | | (0.01 | ) | | | 0.00 | |
Net realized gains | | | 0.00 | | | | (0.10 | ) | | | 0.00 | |
| | | | | | | | | | | | |
Total distributions to shareholders | | | 0.00 | | | | (0.11 | ) | | | 0.00 | |
Net asset value, end of period | | | $9.88 | | | | $9.18 | | | | $10.36 | |
Total return2 | | | 7.63 | % | | | (10.38 | )% | | | 3.60 | % |
Ratios to average net assets (annualized) | | | | | | | | | | | | |
Gross expenses | | | 4.21 | %3 | | | 4.68 | %3 | | | 5.22 | %3 |
Net expenses | | | 2.04 | %3 | | | 2.35 | %3 | | | 2.70 | %3 |
Net investment loss | | | (0.81 | )%3 | | | (0.40 | )%3 | | | (0.83 | )%3 |
Supplemental data | | | | | | | | | | | | |
Portfolio turnover rate | | | 31 | % | | | 37 | % | | | 62 | % |
Net assets, end of period (000s omitted) | | | $105 | | | | $93 | | | | $104 | |
| 1 | For the period from November 28, 2014 (commencement of class operations) to June 30, 2015 |
| 2 | Returns for periods of less than one year are not annualized. |
| 3 | Ratios include fees for the prime broker and expense from dividends on securities sold short as follows: |
| | | | |
Six months ended December 31, 2016 (unaudited) | | | 0.39 | % |
Year ended June 30, 2016 | | | 0.70 | % |
Year ended June 30, 20151 | | | 1.05 | % |
The accompanying notes are an integral part of these financial statements.
| | | | |
| 18 | | Wells Fargo Global Long/Short Fund | | Financial highlights |
(For a share outstanding throughout each period)
| | | | | | | | | | | | |
| | | Six months ended December 31, 2016 (unaudited) | | | Year ended June 30 | |
| INSTITUTIONAL CLASS | | | 2016 | | | 20151 | |
Net asset value, beginning of period | | | $9.20 | | | | $10.37 | | | | $10.00 | |
Net investment loss | | | (0.03 | ) | | | (0.02 | ) | | | (0.04 | ) |
Net realized and unrealized gains (losses) on investments | | | 0.73 | | | | (1.03 | ) | | | 0.41 | |
| | | | | | | | | | | | |
Total from investment operations | | | 0.70 | | | | (1.05 | ) | | | 0.37 | |
Distributions to shareholders from | | | | | | | | | | | | |
Net investment income | | | 0.00 | | | | (0.02 | ) | | | 0.00 | |
Net realized gains | | | 0.00 | | | | (0.10 | ) | | | 0.00 | |
| | | | | | | | | | | | |
Total distributions to shareholders | | | 0.00 | | | | (0.12 | ) | | | 0.00 | |
Net asset value, end of period | | | $9.90 | | | | $9.20 | | | | $10.37 | |
Total return2 | | | 7.61 | % | | | (10.12 | )% | | | 3.70 | % |
Ratios to average net assets (annualized) | | | | | | | | | | | | |
Gross expenses | | | 3.95 | %3 | | | 4.42 | %3 | | | 4.95 | %3 |
Net expenses | | | 1.84 | %3 | | | 2.15 | %3 | | | 2.49 | %3 |
Net investment loss | | | (0.61 | )%3 | | | (0.20 | )%3 | | | (0.63 | )%3 |
Supplemental data | | | | | | | | | | | | |
Portfolio turnover rate | | | 31 | % | | | 37 | % | | | 62 | % |
Net assets, end of period (000s omitted) | | | $9,733 | | | | $9,043 | | | | $10,078 | |
| 1 | For the period from November 28, 2014 (commencement of class operations) to June 30, 2015 |
| 2 | Returns for periods of less than one year are not annualized. |
| 3 | Ratios include fees for the prime broker and expense from dividends on securities sold short as follows: |
| | | | |
Six months ended December 31, 2016 (unaudited) | | | 0.39 | % |
Year ended June 30, 2016 | | | 0.70 | % |
Year ended June 30, 20151 | | | 1.04 | % |
The accompanying notes are an integral part of these financial statements.
| | | | | | |
| Notes to financial statements (unaudited) | | Wells Fargo Global Long/Short Fund | | | 19 | |
1. ORGANIZATION
Wells Fargo Funds Trust (the “Trust”), a Delaware statutory trust organized on March 10, 1999, is an open-end management investment company registered under the Investment Company Act of 1940, as amended (the “1940 Act”). As an investment company, the Trust follows the accounting and reporting guidance in Financial Accounting Standards Board (“FASB”) Accounting Standards Codification Topic 946, Financial Services – Investment Companies. These financial statements report on the Wells Fargo Global Long/Short Fund (the “Fund”) which is a diversified series of the Trust.
2. SIGNIFICANT ACCOUNTING POLICIES
The following significant accounting policies, which are consistently followed in the preparation of the financial statements of the Fund, are in conformity with U.S. generally accepted accounting principles which require management to make estimates and assumptions that affect the reported amounts of assets and liabilities, disclosure of contingent assets and liabilities at the date of the financial statements, and the reported amounts of revenues and expenses during the reporting period. Actual results could differ from those estimates.
Securities valuation
All investments are valued each business day as of the close of regular trading on the New York Stock Exchange (generally 4 p.m. Eastern Time), although the Fund may deviate from this calculation time under unusual or unexpected circumstances.
Equity securities and options that are listed on a foreign or domestic exchange or market are valued at the official closing price or, if none, the last sales price. If no sale occurs on the principal exchange or market that day, the prior day’s price will be deemed “stale” and a fair value price will be determined in accordance with the Fund’s Valuation Procedures.
Non-listed options are valued at the evaluated price provided by an independent pricing service or, if a reliable price is not available, the quoted bid price from an independent broker-dealer.
The values of securities denominated in foreign currencies are translated into U.S. dollars at rates provided by an independent foreign currency pricing source at a time each business day specified by the Management Valuation Team of Wells Fargo Funds Management, LLC (“Funds Management”).
Many securities markets and exchanges outside the U.S. close prior to the close of the New York Stock Exchange and therefore may not fully reflect trading or events that occur after the close of the principal exchange in which the foreign securities are traded, but before the close of the New York Stock Exchange. If such trading or events are expected to materially affect the value of such securities, then fair value pricing procedures approved by the Board of Trustees of the Fund are applied. These procedures take into account multiple factors including movements in U.S. securities markets after foreign exchanges close. Foreign securities that are fair valued under these procedures are categorized as Level 2 and the application of these procedures may result in transfers between Level 1 and Level 2. Depending on market activity, such fair valuations may be frequent. Such fair value pricing may result in net asset values that are higher or lower than net asset values based on the last reported sales price or latest quoted bid price. On December 31, 2016 such fair value pricing was not used in pricing foreign securities.
Investments in registered open-end investment companies are valued at net asset value.
Investments which are not valued using any of the methods discussed above are valued at their fair value, as determined in good faith by the Board of Trustees. The Board of Trustees has established a Valuation Committee comprised of the Trustees and has delegated to it the authority to take any actions regarding the valuation of portfolio securities that the Valuation Committee deems necessary or appropriate, including determining the fair value of portfolio securities, unless the determination has been delegated to the Management Valuation Team. The Board of Trustees retains the authority to make or ratify any valuation decisions or approve any changes to the Valuation Procedures as it deems appropriate. On a quarterly basis, the Board of Trustees receives reports on any valuation actions taken by the Valuation Committee or the Management Valuation Team which may include items for ratification.
Valuations of fair valued securities are compared to the next actual sales price when available, or other appropriate market values, to assess the continued appropriateness of the fair valuation methodologies used. These securities are fair valued on a day-to-day basis, taking into consideration changes to appropriate market information and any significant changes to the inputs considered in the valuation process until there is a readily available price provided on an exchange or by an independent pricing service. Valuations received from an independent pricing service or independent broker-dealer quotes are periodically validated by comparisons to most recent trades and valuations provided by other independent pricing services in addition to the review of prices by the manager and/or subadviser. Unobservable inputs
| | | | |
| 20 | | Wells Fargo Global Long/Short Fund | | Notes to financial statements (unaudited) |
used in determining fair valuations are identified based on the type of security, taking into consideration factors utilized by market participants in valuing the investment, knowledge about the issuer and the current market environment.
Foreign currency translation
The accounting records of the Fund are maintained in U.S. dollars. The values of other assets and liabilities denominated in foreign currencies are translated into U.S. dollars at rates provided by an independent foreign currency pricing source at a time each business day specified by the Management Valuation Team. Purchases and sales of securities, and income and expenses are converted at the rate of exchange on the respective dates of such transactions. Net realized foreign exchange gains or losses arise from sales of foreign currencies, currency gains or losses realized between the trade and settlement dates on securities transactions, and the difference between the amounts of dividends, interest and foreign withholding taxes recorded and the U.S. dollar equivalent of the amounts actually paid or received. Net unrealized foreign exchange gains and losses arise from changes in the fair value of assets and liabilities other than investments in securities resulting from changes in exchange rates. The changes in net assets arising from changes in exchange rates and the changes in net assets resulting from changes in market prices of securities are not separately presented. Such changes are included in net realized and unrealized gains or losses from investments.
Forward foreign currency contracts
The Fund is subject to foreign currency exchange rate risk in the normal course of pursuing its investment objectives. A forward foreign currency contract is an agreement between two parties to purchase or sell a specific currency for an agreed-upon price at a future date. The Fund enters into forward foreign currency contracts to facilitate transactions in foreign-denominated securities and to attempt to minimize the risk to the Fund from adverse changes in the relationship between currencies. Forward foreign currency contracts are recorded at the forward rate and marked-to-market daily. When the contracts are closed, realized gains and losses arising from such transactions are recorded as realized gains or losses on forward foreign currency contract transactions. The Fund could be exposed to risks if the counterparties to the contracts are unable to meet the terms of their contracts or if the value of the foreign currency changes unfavorably. The Fund’s maximum risk of loss from counterparty credit risk is the unrealized gains on the contracts. This risk may be mitigated if there is a master netting arrangement between the Fund and the counterparty.
Options
The Fund is subject to equity price risk in the normal course of pursuing its investment objectives. The Fund may write covered call options or secured put options on individual securities and/or indexes. When the Fund writes an option, an amount equal to the premium received is recorded as a liability and is subsequently adjusted to the current market value of the written option. Premiums received from written options that expire unexercised are recognized as realized gains on the expiration date. For exercised options, the difference between the premium received and the amount paid on effecting a closing purchase transaction, including brokerage commissions, is treated as a realized gain or loss. If a call option is exercised, the premium is added to the proceeds from the sale of the underlying security in calculating the realized gain or loss on the sale. If a put option is exercised, the premium reduces the cost of the security purchased. The Fund, as a writer of an option, bears the market risk of an unfavorable change in the price of the security and/or index underlying the written option.
The Fund may also purchase call or put options. Premiums paid are included in the Statement of Assets and Liabilities as investments, the values of which are subsequently adjusted based on the current market values of the options. Premiums paid for purchased options that expire are recognized as realized losses on the expiration date. Premiums paid for purchased options that are exercised or closed are added to the amount paid or offset against the proceeds received for the underlying security to determine the realized gain or loss. The risk of loss associated with purchased options is limited to the premium paid.
Options traded on an exchange are regulated and terms of the options are standardized. Purchased options traded over-the-counter expose the Fund to counterparty risk in the event the counterparty does not perform. This risk can be mitigated by having a master netting arrangement between the Fund and the counterparty and by having the counterparty post collateral to cover the Fund’s exposure to the counterparty.
Participation notes
The Fund may invest in participation notes to gain exposure to securities in certain foreign markets. Participation notes are issued by banks or broker-dealers and are designed to offer a return linked to a particular underlying foreign security. Participation notes involve transaction costs, which may be higher than those applicable to the underlying foreign security. The holder of the participation note is entitled to receive from the bank or broker-dealer, an amount equal to the dividend paid by the issuer of the underlying foreign security; however, the holder is not entitled to the same rights (i.e. dividends, voting rights) as an owner of the underlying foreign security. Investments in participation notes involve risks
| | | | | | |
| Notes to financial statements (unaudited) | | Wells Fargo Global Long/Short Fund | | | 21 | |
beyond those normally associated with a direct investment in an underlying security. The Fund has no rights against the issuer of the underlying foreign security and participation notes expose the Fund to counterparty risk in the event the counterparty does not perform. There is also no assurance there will be a secondary trading market for the participation note or that the trading price of the participation note will equal the underlying value of the foreign security that it seeks to replicate.
Short sales
The Fund may sell a security it does not own in anticipation of a decline in the market value of that security (short sale). When the Fund makes a short sale, it must borrow the security sold short and deliver it to the buyer. The Fund is then obligated to replace the security borrowed by purchasing the security at the market price at the time of replacement.
The Fund records the proceeds as a liability which is marked-to-market daily based upon quotations from an independent pricing service or from brokers, which use prices provided by market makers, and any change in value is recorded as an unrealized gain or loss. Any interest or dividends accrued on such borrowed securities during the period of the loan are recorded as an expense on the Statement of Operations. To borrow the security, the Fund may be required to pay a premium, which would decrease the proceeds of the security sold. A gain, limited to the price at which the Fund sold the security short, or a loss, unlimited in size, will be recognized upon the closing of a short sale if the market price at the closing is less than or greater than, respectively, the proceeds originally received. Until the short sale is closed or the borrowed security is replaced, the Fund maintains a segregated account of cash or liquid securities, the dollar value of which is at least equal to the market value of the security at the time of the short sale.
Security transactions and income recognition
Securities transactions are recorded on a trade date basis. Realized gains or losses are recorded on the basis of identified cost.
Dividend income is recognized on the ex-dividend date, except for certain dividends from foreign securities, which are recorded as soon as the custodian verifies the ex-dividend date. Dividend income from foreign securities is recorded net of foreign taxes withheld where recovery of such taxes is not assured.
Distributions to shareholders
Distributions to shareholders from net investment income and net realized gains, if any, are recorded on the ex-dividend date. Such distributions are determined in conformity with federal income tax regulations, which may differ in amount or character from net investment income and realized gains recognized for purposes of U.S. generally accepted accounting principles.
Federal and other taxes
The Fund intends to qualify as a regulated investment company by distributing substantially all of its investment company taxable income and any net realized capital gains (after reduction for capital loss carryforwards) sufficient to relieve it from all, or substantially all, federal income taxes. Accordingly, no provision for federal income taxes was required.
The Fund’s income and federal excise tax returns and all financial records supporting those returns for the fiscal years since commencement of operations are subject to examination by the federal and Delaware revenue authorities. Management has analyzed the Fund’s tax positions taken on federal, state, and foreign tax returns for all open tax years and does not believe that there are any uncertain tax positions that require recognition of a tax liability.
As of June 30, 2016, the Fund had capital loss carryforwards which consisted of $97,711 in short-term capital losses and $234,944 in long-term capital losses.
As of June 30, 2016, the Fund had a qualified late-year ordinary loss of $325 which was recognized on the first day of the current fiscal year.
Class allocations
The separate classes of shares offered by the Fund differ principally in applicable sales charges, distribution, shareholder servicing, and administration fees. Class specific expenses are charged directly to that share class. Investment income, common expenses, and realized and unrealized gains (losses) on investments are allocated daily to each class of shares based on the relative proportion of net assets of each class.
3. FAIR VALUATION MEASUREMENTS
Fair value measurements of investments are determined within a framework that has established a fair value hierarchy based upon the various data inputs utilized in determining the value of the Fund’s investments. The three-level hierarchy gives the highest priority to unadjusted quoted prices in active markets for identical assets or liabilities (Level 1) and the lowest priority to significant unobservable inputs (Level 3). The Fund’s investments are classified within the fair value hierarchy based on the lowest level of input that is significant to the fair value measurement. The inputs are summarized into three broad levels as follows:
| | | | |
| 22 | | Wells Fargo Global Long/Short Fund | | Notes to financial statements (unaudited) |
| ∎ | | Level 1 – quoted prices in active markets for identical securities |
| ∎ | | Level 2 – other significant observable inputs (including quoted prices for similar securities, interest rates, prepayment speeds, credit risk, use of amortized cost, etc.) |
| ∎ | | Level 3 – significant unobservable inputs (including the Fund’s own assumptions in determining the fair value of investments) |
The inputs or methodologies used for valuing investments in securities are not necessarily an indication of the risk associated with investing in those securities.
The following is a summary of the inputs used in valuing the Fund’s assets and liabilities as of December 31, 2016:
| | | | | | | | | | | | | | | | |
| | | Quoted prices
(Level 1) | | | Other significant
observable inputs
(Level 2) | | | Significant
unobservable inputs (Level 3) | | | Total | |
Assets | | | | | | | | | | | | | | | | |
Investments in: | | | | | | | | | | | | | | | | |
| | | | |
Common stocks | | | | | | | | | | | | | | | | |
Brazil | | $ | 10,409 | | | $ | 0 | | | $ | 0 | | | $ | 10,409 | |
Canada | | | 269,209 | | | | 0 | | | | 0 | | | | 269,209 | |
China | | | 485,484 | | | | 0 | | | | 0 | | | | 485,484 | |
France | | | 289,945 | | | | 0 | | | | 0 | | | | 289,945 | |
Germany | | | 1,038,910 | | | | 0 | | | | 0 | | | | 1,038,910 | |
Hong Kong | | | 85,860 | | | | 0 | | | | 0 | | | | 85,860 | |
Italy | | | 245,799 | | | | 0 | | | | 0 | | | | 245,799 | |
Japan | | | 1,126,796 | | | | 0 | | | | 0 | | | | 1,126,796 | |
Netherlands | | | 413,518 | | | | 0 | | | | 0 | | | | 413,518 | |
Russia | | | 174,912 | | | | 0 | | | | 0 | | | | 174,912 | |
South Korea | | | 93,662 | | | | 0 | | | | 0 | | | | 93,662 | |
Switzerland | | | 362,279 | | | | 0 | | | | 0 | | | | 362,279 | |
United Kingdom | | | 692,079 | | | | 0 | | | | 0 | | | | 692,079 | |
United States | | | 913,941 | | | | 0 | | | | 0 | | | | 913,941 | |
| | | | |
Participation notes | | | | | | | | | | | | | | | | |
China | | | 0 | | | | 100,572 | | | | 0 | | | | 100,572 | |
| | | | |
Purchased put options | | | 0 | | | | 5,200 | | | | 0 | | | | 5,200 | |
| | | | |
Short-term investments | | | | | | | | | | | | | | | | |
Investment companies | | | 3,875,744 | | | | 0 | | | | 0 | | | | 3,875,744 | |
| | | 10,078,547 | | | | 105,772 | | | | 0 | | | | 10,184,319 | |
Forward foreign currency contracts | | | 0 | | | | 13,321 | | | | 0 | | | | 13,321 | |
Total assets | | $ | 10,078,547 | | | $ | 119,093 | | | $ | 0 | | | $ | 10,197,640 | |
Liabilities | | | | | | | | | | | | | | | | |
Securities sold short | | | | | | | | | | | | | | | | |
| | | | |
Common stocks | | | | | | | | | | | | | | | | |
France | | $ | 89,530 | | | $ | 0 | | | $ | 0 | | | $ | 89,530 | |
Japan | | | 167,528 | | | | 0 | | | | 0 | | | | 167,528 | |
Netherlands | | | 101,001 | | | | 0 | | | | 0 | | | | 101,001 | |
Philippines | | | 15,979 | | | | 0 | | | | 0 | | | | 15,979 | |
Switzerland | | | 240,004 | | | | 0 | | | | 0 | | | | 240,004 | |
Thailand | | | 30,727 | | | | 0 | | | | 0 | | | | 30,727 | |
United States | | | 50,868 | | | | 0 | | | | 0 | | | | 50,868 | |
| | | | |
Exchange-traded funds | | | | | | | | | | | | | | | | |
United States | | | 744,287 | | | | 0 | | | | 0 | | | | 744,287 | |
Total liabilities | | $ | 1,439,924 | | | $ | 0 | | | $ | 0 | | | $ | 1,439,924 | |
| | | | | | |
| Notes to financial statements (unaudited) | | Wells Fargo Global Long/Short Fund | | | 23 | |
Forward foreign currency contracts are reported at their unrealized gains at measurement date, which represents the change in the contract’s value from trade date. All other assets and liabilities are reported at their market value at measurement date.
The Fund recognizes transfers between levels within the fair value hierarchy at the end of the reporting period. Fair value pricing was used in pricing certain foreign securities at the previous period end but was not used at December 31, 2016. As a result, long positions valued at $4,363,534 and securities in short positions valued at $497,062 were transferred from Level 2 to Level 1. The Fund did not have any transfers into/out of Level 3.
4. TRANSACTIONS WITH AFFILIATES AND OTHER EXPENSES
Management fee
Funds Management, an indirect wholly owned subsidiary of Wells Fargo & Company (“Wells Fargo”), is the manager of the Fund and provides advisory and fund-level administrative services under an investment management agreement. Under the investment management agreement, Funds Management is responsible for, among other services, implementing the investment objectives and strategies of the Fund, supervising the subadviser, providing fund-level administrative services in connection with the Fund’s operations, and providing any other fund-level administrative services reasonably necessary for the operation of the Fund. As compensation for its services under the investment management agreement, Funds Management is entitled to receive an annual management fee starting at 1.30% and declining to 1.13% as the average daily net assets of the Fund increase. For the six months ended December 31, 2016, the management fee was equivalent to an annual rate of 1.30% of the Fund’s average daily net assets.
Funds Management has retained the services of a subadviser to provide daily portfolio management to the Fund. The fee for subadvisory services is borne by Funds Management. Wells Capital Management Incorporated, an affiliate of Funds Management and an indirect wholly owned subsidiary of Wells Fargo, is the subadviser to the Fund and is entitled to receive a fee from Funds Management at an annual rate starting at 1.00% and declining to 0.90% as the average daily net assets of the Fund increase.
Administration fees
Under a class-level administration agreement, Funds Management provides class-level administrative services to the Fund, which includes paying fees and expenses for services provided by the transfer agent, sub-transfer agents, omnibus account servicers and record-keepers. As compensation for its services under the class-level administration agreement, Funds Management receives an annual fee which is calculated based on the average daily net assets of each class as follows:
| | | | |
| | | Class-level
administration fee | |
Class A, Class C | | | 0.21 | % |
Administrator Class, Institutional Class | | | 0.13 | |
Funds Management has contractually waived and/or reimbursed management and administration fees to the extent necessary to maintain certain net operating expense ratios for the Fund. Waiver of fees and/or reimbursement of expenses by Funds Management were made first from fund level expenses on a proportionate basis and then from class specific expenses. Funds Management has committed through October 31, 2017 to waive fees and/or reimburse expenses to the extent necessary to cap the Fund’s expenses at 1.75% for Class A shares, 2.50% for Class C shares, 1.65% for Administrator Class shares, and 1.45% for Institutional Class shares. After this time, the cap may be increased or the commitment to maintain the cap may be terminated only with the approval of the Board of Trustees. Prime broker fees and dividend expense on securities sold short are excluded from the expense caps.
During the six months ended December 31, 2016, State Street Bank and Trust Company, the Fund’s custodian, reimbursed the Fund $3 for certain out-of-pocket expenses that were billed to the Fund in error from 1998-2015. This amount is included in dividend income on the Statement of Operations. In addition, Funds Management was also reimbursed $1,034 for waivers/reimbursements it made to the Fund during the period the Fund was erroneously billed.
Distribution fee
The Trust has adopted a distribution plan for Class C shares of the Fund pursuant to Rule 12b-1 under the 1940 Act. A distribution fee is charged to Class C shares and paid to Wells Fargo Funds Distributor, LLC (“Funds Distributor”), the principal underwriter, at an annual rate of 0.75% of the average daily net assets of Class C shares.
In addition, Funds Distributor is entitled to receive the front-end sales charge from the purchase of Class A shares and a contingent deferred sales charge on the redemption of certain Class A shares. Funds Distributor is also entitled to receive the contingent deferred sales charges from redemptions of Class C shares.
| | | | |
| 24 | | Wells Fargo Global Long/Short Fund | | Notes to financial statements (unaudited) |
Shareholder servicing fees
The Trust has entered into contracts with one or more shareholder servicing agents, whereby Class A, Class C, and Administrator Class of the Fund are charged a fee at an annual rate of 0.25% of the average daily net assets of each respective class.
A portion of these total shareholder servicing fees were paid to affiliates of Wells Fargo.
5. INVESTMENT PORTFOLIO TRANSACTIONS
Purchases and sales of investments, excluding U.S. government obligations (if any) and short-term securities, for the six months ended December 31, 2016 were $1,503,220 and $1,446,045, respectively.
The Fund may purchase or sell investment securities to other Wells Fargo funds under procedures adopted by the Board of Trustees. The procedures have been designed to ensure that these interfund transactions, which generally do not incur broker commissions, are effected at current market prices. Interfund trades are included within the respective purchases and sales amounts shown.
6. DERIVATIVE TRANSACTIONS
During the six months ended December 31, 2016, the Fund entered into forward foreign currency contracts for economic hedging purposes.
At December 31, 2016, the Fund had forward foreign currency contracts outstanding as follows:
Forward foreign currency contracts to sell:
| | | | | | | | | | | | | | | | | | |
| Exchange date | | Counterparty | | Contracts to deliver | | | U.S. value at December 31, 2016 | | | In exchange for U.S. $ | | | Unrealized gains | |
| 2-28-2017 | | Morgan Stanley | | | 269,000 | EUR | | $ | 283,916 | | | $ | 286,314 | | | $ | 2,398 | |
| 2-28-2017 | | Morgan Stanley | | | 305,000 | EUR | | | 321,913 | | | | 324,441 | | | | 2,528 | |
| 3-15-2017 | | Morgan Stanley | | | 618,800 | EUR | | | 653,649 | | | | 661,346 | | | | 7,698 | |
| 3-22-2017 | | Morgan Stanley | | | 184,400 | GBP | | | 227,694 | | | | 228,391 | | | | 697 | |
The Fund had average contract amounts of $25,271 and $1,112,796 in forward foreign currency contracts to buy and forward foreign currency contracts to sell, respectively, during the six months ended December 31, 2016.
During the six months ended December 31, 2016, the Fund entered into purchased options contracts for hedging purposes and had an average of 28 purchased options.
A summary of derivative instruments by primary risk exposure is outlined in the following tables.
The fair value of derivative instruments as of December 31, 2016 was as follows for the Fund:
| | | | | | |
| | | Asset derivatives | |
| | | Statement of Assets and
Liabilities location | | Fair value | |
Equity risk | | Investments in unaffiliated securities, at value | | $ | 5,200 | * |
Foreign currency risk | | Unrealized gains on forward foreign currency contracts | | | 13,321 | |
| | | | | $ | 18,521 | |
| * | Amount relates to purchased options. |
The effect of derivative instruments on the Statement of Operations for the six months ended December 31, 2016 was as follows for the Fund:
| | | | | | | | | | | | | | | | |
| | | Amount of realized gains (losses) on derivatives | | | Change in unrealized gains (losses) on derivatives | |
| | | Unaffiliated
securities* | | | Forward currency contracts | | | Unaffiliated
securities* | | | Forward currency contracts | |
Equity risk | | $ | (16,753 | ) | | $ | 0 | | | $ | (320 | ) | | $ | 0 | |
Foreign currency risk | | | 0 | | | | 106,207 | | | | 0 | | | | (19,269 | ) |
| | | $ | (16,753 | ) | | $ | 106,207 | | | $ | (320 | ) | | $ | (19,269 | ) |
| * | Amount relates to purchased options |
| | | | | | |
| Notes to financial statements (unaudited) | | Wells Fargo Global Long/Short Fund | | | 25 | |
For certain types of derivative transactions, the Fund has entered into International Swaps and Derivatives Association, Inc. master agreements (“ISDA Master Agreements”) or similar agreements with approved counterparties. The ISDA Master Agreements or similar agreements may have requirements to deliver/deposit securities or cash to/with an exchange or broker-dealer as collateral and allows the Fund to offset, with each counterparty, certain derivative financial instrument’s assets and/or liabilities with collateral held or pledged. Collateral requirements differ by type of derivative. Collateral or margin requirements are set by the broker or exchange clearing house for exchange traded derivatives while collateral terms are contract specific for over-the-counter traded derivatives. Cash collateral that has been pledged to cover obligations of the Fund under ISDA Master Agreements or similar agreements, if any, are reported separately in the Statement of Assets and Liabilities. Securities pledged as collateral, if any, are noted in the Portfolio of Investments. With respect to balance sheet offsetting, absent an event of default by the counterparty or a termination of the agreement, the reported amounts of financial assets and financial liabilities in the Statement of Assets and Liabilities are not offset across transactions between the Fund and the applicable counterparty. A reconciliation of the gross amounts on the Statement of Assets and Liabilities to the net amounts by derivative type, including any collateral exposure, is as follows:
| | | | | | | | | | | | | | | | |
| Derivative type | | Counterparty | | Gross amounts of assets in the Statement of Assets and Liabilities | | Amounts subject to netting agreements | | | Collateral received | | | Net amount of assets | |
Forward foreign currency contracts | | Morgan Stanley | | $13,321* | | $ | 0 | | | $ | 0 | | | $ | 13,321 | |
| | * | Amount represents net unrealized gains. | |
7. BANK BORROWINGS
The Fund has a uncommitted credit facility to provide leverage for investment purposes or to meet unanticipated redemptions. The Fund’s borrowings under the facility are charged interest at a rate to be determined at the time of the borrowing.
For the six months ended December 31, 2016, there were no borrowings by the Fund under the agreement.
8. INDEMNIFICATION
Under the Trust’s organizational documents, the officers and Trustees have been granted certain indemnification rights against certain liabilities that may arise out of performance of their duties to the Trust. Additionally, in the normal course of business, the Trust may enter into contracts with service providers that contain a variety of indemnification clauses. The Trust’s maximum exposure under these arrangements is dependent on future claims that may be made against the Fund and, therefore, cannot be estimated.
9. REGULATORY CHANGES
In October 2016, the Securities and Exchange Commission (“SEC”) adopted new rules and forms and amended existing rules and forms (together, “final rules”) intended to modernize and enhance the reporting and disclosure of information by registered investment companies and to enhance liquidity risk management by open-end mutual funds and exchange-traded funds. The final rules will enhance the quality of information available to investors and will allow the SEC to more effectively collect and use data reported by funds. In part, the final rules amend Regulation S-X and require standardized, enhanced disclosure about derivatives in the Fund’s financial statements, as well as other amendments. The compliance date for the amendments to Regulation S-X is August 1, 2017 while the compliance date for the new form types is June 1, 2018 and the compliance date for the liquidity risk management program requirements is December 1, 2018. Management is currently assessing the potential impact of these enhancements and their impact on the financial statement disclosures and reporting requirements.
| | | | |
| 26 | | Wells Fargo Global Long/Short Fund | | Other information (unaudited) |
PROXY VOTING INFORMATION
A description of the policies and procedures that the Fund uses to determine how to vote proxies relating to portfolio securities is available, upon request, by calling 1-800-222-8222, visiting our website at wellsfargofunds.com, or visiting the SEC website at sec.gov. Information regarding how the Fund voted proxies relating to portfolio securities during the most recent 12-month period ended June 30 is available on the Fund’s website at wellsfargofunds.com or by visiting the SEC website at sec.gov.
PORTFOLIO HOLDINGS INFORMATION
The complete portfolio holdings for the Fund are publicly available at each fiscal quarter end on the Fund’s website (wellsfargofunds.com), on a one-month delayed basis. As of each month end other than a month end that coincides with a fiscal quarter end, the Fund makes publicly available on the Fund’s website, on a one-month delayed basis (i) all portfolio holdings held long other than any put options on equity securities; (ii) portfolio holdings held short other than short positions in equity securities of single issuers; and (iii) the aggregate dollar value of equity securities of single issuers held short, and any put options on equity securities held long. In addition, top ten holdings information (excluding derivative positions and short positions) for the Fund is publicly available on the Fund’s website on a monthly, seven-day or more delayed basis. The Fund files its complete schedule of portfolio holdings with the SEC for the first and third quarters of each fiscal year on Form N-Q, which is available by visiting the SEC website at sec.gov. In addition, the Fund’s Form N-Q may be reviewed and copied at the SEC’s Public Reference Room in Washington, DC, and at regional offices in New York City, at 233 Broadway, and in Chicago, at 175 West Jackson Boulevard, Suite 900. Information about the Public Reference Room may be obtained by calling 1-800-SEC-0330.
| | | | | | |
| Other information (unaudited) | | Wells Fargo Global Long/Short Fund | | | 27 | |
BOARD OF TRUSTEES AND OFFICERS
Each of the Trustees and Officers1 listed in the table below acts in identical capacities for each fund in the Wells Fargo family of funds, which consists of 139 mutual funds comprising the Wells Fargo Funds Trust, Wells Fargo Variable Trust, Wells Fargo Master Trust and four closed-end funds (collectively the “Fund Complex”). This table should be read in conjunction with the Prospectus and the Statement of Additional Information2. The mailing address of each Trustee and Officer is 525 Market Street, 12th Floor, San Francisco, CA 94105. Each Trustee and Officer serves an indefinite term, however, each Trustee serves such term until reaching the mandatory retirement age established by the Trustees.
Independent Trustees
| | | | | | |
Name and
year of birth | | Position held and
length of service* | | Principal occupations during past five years or longer | | Current other
public company or
investment company
directorships |
William R. Ebsworth (Born 1957) | | Trustee, since 2015 | | Retired. From 1984 to 2013, equities analyst, portfolio manager, research director and chief financial officer at Fidelity Management and Research Company in Boston, Tokyo, and Hong Kong and retired in 2013 as Chief Investment Officer of Fidelity Strategic Advisers, Inc. where he lead a team of investment professionals managing client assets. Prior thereto, Board member of Hong Kong Securities Clearing Co., Hong Kong Options Clearing Corp., the Thailand International Fund, Ltd., Fidelity Investments Life Insurance Company, and Empire Fidelity Investments Life Insurance Company. Board member of the Fonté Foundation (non-profit organization) and the Vincent Memorial Hospital Endowment (non-profit organization), where he serves on the Investment Committee and as a Chair of the Audit Committee. Mr. Ebsworth is a CFA® charterholder and an Adjunct Lecturer, Finance, at Babson College. | | Asset Allocation Trust |
Jane A. Freeman (Born 1953) | | Trustee, since 2015 | | Retired. From 2012 to 2014 and 1999 to 2008, Chief Financial Officer of Scientific Learning Corporation. From 2008 to 2012, Ms. Freeman provided consulting services related to strategic business projects. Prior to 1999, Portfolio Manager at Rockefeller & Co. and Scudder, Stevens & Clark. Board member of the Harding Loevner Funds from 1996 to 2014, serving as both Lead Independent Director and chair of the Audit Committee. Board member of the Russell Exchange Traded Funds Trust from 2011 to 2012 and the chair of the Audit Committee. Ms. Freeman is Chair of Taproot Foundation (non-profit organization), a Board Member of Ruth Bancroft Garden (non-profit organization) and an inactive chartered financial analyst. | | Asset Allocation Trust |
Peter G. Gordon** (Born 1942) | | Trustee, since 1998; Chairman, since 2005 | | Co-Founder, Retired Chairman, President and CEO of Crystal Geyser Water Company. Trustee Emeritus, Colby College. | | Asset Allocation Trust |
Isaiah Harris, Jr. (Born 1952) | | Trustee, since 2009 | | Retired. Chairman of the Board of CIGNA Corporation since 2009, and Director since 2005. From 2003 to 2011, Director of Deluxe Corporation. Prior thereto, President and CEO of BellSouth Advertising and Publishing Corp. from 2005 to 2007, President and CEO of BellSouth Enterprises from 2004 to 2005 and President of BellSouth Consumer Services from 2000 to 2003. Emeritus member of the Iowa State University Foundation Board of Governors. Emeritus Member of the Advisory Board of Iowa State University School of Business. Advisory Board Member, Palm Harbor Academy (charter school). Advisory Board Member, Child Evangelism Fellowship (non-profit). Mr. Harris is a certified public accountant (inactive status). | | CIGNA Corporation; Asset Allocation Trust |
Judith M. Johnson (Born 1949) | | Trustee, since 2008; Audit Committee Chairman, since 2008 | | Retired. Prior thereto, Chief Executive Officer and Chief Investment Officer of Minneapolis Employees Retirement Fund from 1996 to 2008. Ms. Johnson is an attorney, certified public accountant and a certified managerial accountant. | | Asset Allocation Trust |
David F. Larcker (Born 1950) | | Trustee, since 2009 | | James Irvin Miller Professor of Accounting at the Graduate School of Business, Stanford University, Director of the Corporate Governance Research Initiative and Senior Faculty of The Rock Center for Corporate Governance since 2006. From 2005 to 2008, Professor of Accounting at the Graduate School of Business, Stanford University. Prior thereto, Ernst & Young Professor of Accounting at The Wharton School, University of Pennsylvania from 1985 to 2005. | | Asset Allocation Trust |
| | | | |
| 28 | | Wells Fargo Global Long/Short Fund | | Other information (unaudited) |
| | | | | | |
Name and
year of birth | | Position held and
length of service* | | Principal occupations during past five years or longer | | Current other
public company or
investment company
directorships |
Olivia S. Mitchell (Born 1953) | | Trustee, since 2006 | | International Foundation of Employee Benefit Plans Professor, Wharton School of the University of Pennsylvania since 1993. Director of Wharton’s Pension Research Council and Boettner Center on Pensions & Retirement Research, and Research Associate at the National Bureau of Economic Research. Previously, Cornell University Professor from 1978 to 1993. | | Asset Allocation Trust |
Timothy J. Penny (Born 1951) | | Trustee, since 1996 | | President and Chief Executive Officer of Southern Minnesota Initiative Foundation, a non-profit organization, since 2007 and Senior Fellow at the Humphrey Institute Policy Forum at the University of Minnesota since 1995. Member of the Board of Trustees of NorthStar Education Finance, Inc., a non-profit organization, since 2007. | | Asset Allocation Trust |
Michael S. Scofield (Born 1943) | | Trustee, since 2010 | | Served on the Investment Company Institute’s Board of Governors and Executive Committee from 2008-2011 as well the Governing Council of the Independent Directors Council from 2006-2011 and the Independent Directors Council Executive Committee from 2008-2011. Chairman of the IDC from 2008-2010. Institutional Investor (Fund Directions) Trustee of Year in 2007. Trustee of the Evergreen Funds complex (and its predecessors) from 1984 to 2010. Chairman of the Evergreen Funds from 2000-2010. Former Trustee of the Mentor Funds. Retired Attorney, Law Offices of Michael S. Scofield. | | Asset Allocation Trust |
| * | Length of service dates reflect the Trustee’s commencement of service with the Trust’s predecessor entities, where applicable. |
| ** | Peter Gordon is expected to retire on December 31, 2017. |
Officers
| | | | | | |
Name and
year of birth | | Position held and
length of service | | Principal occupations during past five years or longer | | |
Andrew Owen3 (Born 1960) | | President, since 2017 | | Executive Vice President of Wells Fargo Bank, N.A. and President of Wells Fargo & Company and Head of Affiliated Managaers, Wells Fargo Asset Management, since 2014. Executive Vice President responsible for marketing, investments and product development for Wells Fargo Funds Management, LLC, from 2009 to 2014. | | |
Jeremy DePalma1 (Born 1974) | | Treasurer, since 2012 | | Senior Vice President of Wells Fargo Funds Management, LLC since 2009. Senior Vice President of Evergreen Investment Management Company, LLC from 2008 to 2010 and head of the Fund Reporting and Control Team within Fund Administration from 2005 to 2010. | | |
C. David Messman (Born 1960) | | Secretary, since 2000; Chief Legal Officer, since 2003 | | Senior Vice President and Secretary of Wells Fargo Funds Management, LLC since 2001. Assistant General Counsel of Wells Fargo Bank, N.A. since 2013 and Vice President and Managing Counsel of Wells Fargo Bank, N.A. from 1996 to 2013. | | |
Michael Whitaker (Born 1967) | | Chief Compliance Officer, since 2016 | | Executive Vice President of Wells Fargo Funds Management, LLC since 2016. Chief Compliance Officer of Fidelity’s Fixed Income Funds and Asset Allocation Funds from 2008 to 2016, Compliance Officer of FMR Co., Inc. from 2014 to 2016, Fidelity Investments Money Management, Inc. from 2014 to 2016, Fidelity Investments from 2007 to 2016. | | |
David Berardi (Born 1975) | | Assistant Treasurer, since 2009 | | Vice President of Wells Fargo Funds Management, LLC since 2009. Vice President of Evergreen Investment Management Company, LLC from 2008 to 2010. Manager of Fund Reporting and Control for Evergreen Investment Management Company, LLC from 2004 to 2010. | | |
| 1 | Jeremy DePalma acts as Treasurer of 69 funds and Assistant Treasurer of 70 funds in the Fund Complex. |
| 2 | The Statement of Additional Information includes additional information about the Trustees and is available, without charge, upon request, by calling
1-800-222-8222 or by visiting the website at wellsfargofunds.com. |
| 3 | Andrew Owen became President on January 1, 2017. |
| | | | | | |
| List of abbreviations | | Wells Fargo Global Long/Short Fund | | | 29 | |
The following is a list of common abbreviations for terms and entities that may have appeared in this report.
| ACA | — ACA Financial Guaranty Corporation |
| ADR | — American depositary receipt |
| ADS | — American depositary shares |
| AGC | — Assured Guaranty Corporation |
| AGM | — Assured Guaranty Municipal |
| Ambac | — Ambac Financial Group Incorporated |
| AMT | — Alternative minimum tax |
| BAN | — Bond anticipation notes |
| BHAC | — Berkshire Hathaway Assurance Corporation |
| CAB | — Capital appreciation bond |
| CCAB | — Convertible capital appreciation bond |
| CDA | — Community Development Authority |
| CDO | — Collateralized debt obligation |
| DRIVER | — Derivative inverse tax-exempt receipts |
| DW&P | — Department of Water & Power |
| DWR | — Department of Water Resources |
| ECFA | — Educational & Cultural Facilities Authority |
| EDA | — Economic Development Authority |
| EDFA | — Economic Development Finance Authority |
| ETF | — Exchange-traded fund |
| FDIC | — Federal Deposit Insurance Corporation |
| FFCB | — Federal Farm Credit Banks |
| FGIC | — Financial Guaranty Insurance Corporation |
| FHA | — Federal Housing Administration |
| FHLB | — Federal Home Loan Bank |
| FHLMC | — Federal Home Loan Mortgage Corporation |
| FICO | — The Financing Corporation |
| FNMA | — Federal National Mortgage Association |
| GDR | — Global depositary receipt |
| GNMA | — Government National Mortgage Association |
| HCFR | — Healthcare facilities revenue |
| HEFA | — Health & Educational Facilities Authority |
| HEFAR | — Higher education facilities authority revenue |
| HFA | — Housing Finance Authority |
| HFFA | — Health Facilities Financing Authority |
| HUD | — Department of Housing and Urban Development |
| IDA | — Industrial Development Authority |
| IDAG | — Industrial Development Agency |
| KRW | — Republic of Korea won |
| LIBOR | — London Interbank Offered Rate |
| LIFER | — Long Inverse Floating Exempt Receipts |
| LLC | — Limited liability company |
| LLLP | — Limited liability limited partnership |
| LLP | — Limited liability partnership |
| MBIA | — Municipal Bond Insurance Association |
| MFHR | — Multifamily housing revenue |
| MSTR | — Municipal securities trust receipts |
| MUD | — Municipal Utility District |
| National | — National Public Finance Guarantee Corporation |
| PCFA | — Pollution Control Financing Authority |
| PCL | — Public Company Limited |
| PCR | — Pollution control revenue |
| PFA | — Public Finance Authority |
| PFFA | — Public Facilities Financing Authority |
| PFOTER | — Puttable floating option tax-exempt receipts |
| plc | — Public limited company |
| PUTTER | — Puttable tax-exempt receipts |
| R&D | — Research & development |
| Radian | — Radian Asset Assurance |
| RAN | — Revenue anticipation notes |
| RDA | — Redevelopment Authority |
| RDFA | — Redevelopment Finance Authority |
| REIT | — Real estate investment trust |
| ROC | — Reset option certificates |
| SAVRS | — Select auction variable rate securities |
| SBA | — Small Business Authority |
| SDR | — Swedish depositary receipt |
| SFHR | — Single-family housing revenue |
| SFMR | — Single-family mortgage revenue |
| SPA | — Standby purchase agreement |
| SPDR | — Standard & Poor’s Depositary Receipts |
| SPEAR | — Short Puttable Exempt Adjustable Receipts |
| STRIPS | — Separate trading of registered interest and |
| TAN | — Tax anticipation notes |
| TIPS | — Treasury inflation-protected securities |
| TRAN | — Tax revenue anticipation notes |
| TTFA | — Transportation Trust Fund Authority |
| TVA | — Tennessee Valley Authority |
This page is intentionally left blank.
This page is intentionally left blank.
This page is intentionally left blank.

For more information
More information about Wells Fargo Funds is available free upon request. To obtain literature, please write, email, visit the Fund’s website, or call:
Wells Fargo Funds
P.O. Box 8266
Boston, MA 02266-8266
Email: fundservice@wellsfargo.com
Website: wellsfargofunds.com
Individual investors: 1-800-222-8222
Retail investment professionals: 1-888-877-9275
Institutional investment professionals: 1-866-765-0778
This report and the financial statements contained herein are submitted for the general information of the shareholders of the Fund. If this report is used for promotional purposes, distribution of the report must be accompanied or preceded by a current prospectus. Before investing, please consider the investment objectives, risks, charges, and expenses of the investment. For a current prospectus and, if available, a summary prospectus, containing this information, call 1-800-222-8222 or visit the Fund’s website at wellsfargofunds.com. Read the prospectus carefully before you invest or send money.
Wells Fargo Asset Management (WFAM) is a trade name used by the asset management businesses of Wells Fargo & Company. Wells Fargo Funds Management, LLC, a wholly owned subsidiary of Wells Fargo & Company, provides investment advisory and administrative services for Wells Fargo Funds. Other affiliates of Wells Fargo & Company provide subadvisory and other services for the funds. The funds are distributed by Wells Fargo Funds Distributor, LLC, Member FINRA, an affiliate of Wells Fargo & Company. Neither Wells Fargo Funds Management nor Wells Fargo Funds Distributor has Fund customer accounts/assets, and neither provides investment advice/recommendations or acts as an investment advice fiduciary to any investor.
NOT FDIC INSURED ◾ NO BANK GUARANTEE ◾ MAY LOSE VALUE
© 2016 Wells Fargo Funds Management, LLC. All rights reserved.
| | |
 | | 300475 02-17 SA268/SAR268 12-16 |
Semi-Annual Report
December 31, 2016

Wells Fargo
California Limited-Term Tax-Free Fund


Reduce clutter. Save trees.
Sign up for electronic delivery of prospectuses and shareholder reports at wellsfargo.com/advantagedelivery
Contents
The views expressed and any forward-looking statements are as of December 31, 2016, unless otherwise noted, and are those of the Fund managers and/or Wells Fargo Funds Management, LLC. Discussions of individual securities, or the markets generally, or any Wells Fargo Fund are not intended as individual recommendations. Future events or results may vary significantly from those expressed in any forward-looking statements. The views expressed are subject to change at any time in response to changing circumstances in the market. Wells Fargo Funds Management, LLC and the Fund disclaim any obligation to publicly update or revise any views expressed or forward-looking statements.
NOT FDIC INSURED ◾ NO BANK GUARANTEE ◾ MAY LOSE VALUE
| | | | |
| 2 | | Wells Fargo California Limited-Term Tax-Free Fund | | Letter to shareholders (unaudited) |

Andrew Owen
President
Wells Fargo Funds
The Bloomberg Barclays Municipal Bond Index,1 a broad measure tracking investment-grade municipal bonds, lost 3.91% during the six-month reporting period.
Dear Shareholder:
As the new president of Wells Fargo Funds now that Karla Rabusch is retiring from that position after nearly 14 years, I am pleased to offer you this semi-annual report for the Wells Fargo California Limited-Term Tax-Free Fund for the six-month period that ended December 31, 2016. The Federal Reserve (Fed) raised the federal funds rate in December by 0.25%. Municipal bond yields rose sharply in the fourth quarter. The Bloomberg Barclays Municipal Bond Index,1 a broad measure tracking investment-grade municipal bonds, lost 3.91% during the six-month reporting period.
Municipal bond yields rose during the reporting period.
The municipal market reversed course in the second half of 2016, with yields increasing and prices declining. Initially the sell-off was driven by negative supply and demand trends, also known as technical factors. By the fourth quarter, fund flows turned negative (reversing a trend of 54 weeks of positive flows) and municipal bond supply increased. These deteriorating technical factors, along with the expectation of an expansionary fiscal policy and lower tax rates under the new administration, drove market volatility; credit spreads widened and the yield curve steepened as the market sold-off.
Stronger economic indicators drove monetary policy.
On December 14, the Fed hiked the short-term interest rate by 0.25% to reach a target range of 0.50% to 0.75%. This was the second rate increase in more than 10 years, with the Fed citing job gains and lower than expected unemployment of 4.6%. The Fed confirmed the continuation of an accommodative monetary policy to support a stronger labor market and reiterated its long-term objective of a 2% inflation rate, which increased slightly during the fourth quarter but fell short of the benchmark. The Fed expressed confidence in the economy’s progress and expects this positive trajectory to continue. Both sentiments helped to bolster the Fed’s expectation of three additional rate increases during 2017.
Meanwhile, the Bank of England continued its quantitative-easing program and lowered the official bank rate to 0.25% in August 2016. The Bank of Japan maintained its negative interest rate put in place earlier in the year, and in September announced an interest rate target for 10-year government bonds—keeping the yield at zero—as it struggles to accelerate economic growth. In December, the European Central Bank announced that it will extend its quantitative-easing program and continue purchasing large amounts of eurozone corporate and government debt each month through December 2017.
U.S. economic data released during the fourth quarter showed that U.S. real gross domestic product increased at an annual 3.5% rate in the third quarter, the largest increase since mid-2014. Business investment by U.S. companies was mixed, with a 12.0% increase in structures and 4.5% decrease in equipment over the prior quarter on an annualized basis. Consumer confidence hit pre-recession levels for the first time in November, and increased again in December. The dollar strengthened during the quarter’s post-election period.
Supply and demand trends reflected volatility of municipals.
Demand for municipal debt, as measured by cash flows to municipal bond mutual funds, was negative for the reporting period. There were $19 billion of inflows from July through October, but a sharp reversal occurred post-election, with $26 billion of redemptions in the last two months of the year. This followed a
| 1 | The Bloomberg Barclays Municipal Bond Index (formerly known as Barclays Municipal Bond Index) is an unmanaged index composed of long-term tax-exempt bonds with a minimum credit rating of Baa. You cannot invest directly in an index. |
| | | | | | |
| Letter to shareholders (unaudited) | | Wells Fargo California Limited-Term Tax-Free Fund | | | 3 | |
noteworthy 54 consecutive weeks of inflows. On the supply side, August through October saw 30-year record-breaking volumes each month; both refundings and new issuance were up. These levels were attributed to deals pulled forward in anticipation of higher interest rates. Not surprisingly, December volume was down 25% year-over-year to $19 billion. Total municipal bond issuance for the period was $219 billion; new issuance outpaced refundings by $18 billion.
Municipal credit fundamentals were solid.
Overall, municipal credit was sound for the period. The most significant development was the election of Ricardo Rossello as governor of the Commonwealth of Puerto Rico. In the past, prices of Puerto Rico bonds reflected negative credit considerations, including defaults on its securities in 2015 and early 2016, but recent events point to a potentially more positive fiscal environment. Rossello campaigned, in part, on a platform that included promises to ultimately pay 100% of interest due on Puerto Rico’s outstanding municipal debt, negotiate with bondholders, and ration government expenditures. This stance is a major shift from his predecessor who focused on a bankruptcy mechanism.
Since the end of the financial crisis, structural changes in the fixed-income markets have reduced trading liquidity (the degree to which assets can be bought or sold without affecting the price). New regulations and capital requirements have caused traditional liquidity suppliers (banks and broker/dealers) to be more risk averse and hold less inventory. Meanwhile, corporate debt issuance has spiked as companies finance themselves at record-low yields, bond mutual funds hold larger amounts of this new debt supply, trading volumes are lower, and large-size trades are more difficult to execute. However, fixed-income markets appeared to function well over the past year with sufficient liquidity.
Don’t let short-term uncertainty derail long-term investment goals.
Periods of uncertainty can present challenges, but experience has taught us that maintaining long-term investment goals can be an effective way to plan for the future. To help you create a sound strategy based on your personal goals and risk tolerance, Wells Fargo Funds offers more than 100 mutual funds spanning a wide range of asset classes and investment styles. Although diversification cannot guarantee an investment profit or prevent losses, we believe it can be an effective way to manage investment risk and potentially smooth out overall portfolio performance. We encourage investors to know their investments and to understand that appropriate levels of risk-taking may unlock opportunities.
Thank you for choosing to invest in Wells Fargo Funds. We appreciate your confidence in us and remain committed to helping you meet your financial needs.
Sincerely,

Andrew Owen
President
Wells Fargo Funds
Periods of uncertainty can present challenges, but experience has taught us that maintaining long-term investment goals can be an effective way to plan for the future.
For further information about your Fund, contact your investment professional, visit our website at wellsfargofunds.com, or call us directly at 1-800-222-8222. We are available 24 hours a day, 7 days a week.
| | | | |
| 4 | | Wells Fargo California Limited-Term Tax-Free Fund | | Performance highlights (unaudited) |
Investment objective
The Fund seeks current income exempt from federal income tax and California individual income tax, consistent with capital preservation.
Manager
Wells Fargo Funds Management, LLC
Subadviser
Wells Capital Management Incorporated
Portfolio managers
Terry J. Goode
Adrian Van Poppel
Average annual total returns (%) as of December 31, 20161
| | | | | | | | | | | | | | | | | | | | | | | | | | | | | | | | | | |
| | | | | Including sales charge | | | Excluding sales charge | | | Expense ratios2 (%) | |
| | | Inception date | | 1 year | | | 5 year | | | 10 year | | | 1 year | | | 5 year | | | 10 year | | | Gross | | | Net3 | |
| Class A (SFCIX) | | 11-18-1992 | | | (2.43 | ) | | | 1.44 | | | | 2.50 | | | | (0.46 | ) | | | 1.86 | | | | 2.70 | | | | 0.83 | | | | 0.80 | |
| Class C (SFCCX) | | 8-30-2002 | | | (2.29 | ) | | | 1.08 | | | | 1.93 | | | | (1.29 | ) | | | 1.08 | | | | 1.93 | | | | 1.58 | | | | 1.55 | |
| Administrator Class (SCTIX) | | 9-6-1996 | | | – | | | | – | | | | – | | | | (0.29 | ) | | | 2.05 | | | | 2.92 | | | | 0.77 | | | | 0.60 | |
| Institutional Class (SFCNX) | | 10-31-2014 | | | – | | | | – | | | | – | | | | (0.19 | ) | | | 2.09 | | | | 2.94 | | | | 0.50 | | | | 0.50 | |
Bloomberg Barclays Municipal Bond
1-5 Year Blend Index4 | | – | | | – | | | | – | | | | – | | | | 0.00 | | | | 1.25 | | | | 2.86 | | | | – | | | | – | |
| Bloomberg Barclays California Municipal Bond 1-5 Year Blend Index5 | | – | | | – | | | | – | | | | – | | | | (0.17 | ) | | | 1.32 | | | | 2.90 | | | | – | | | | – | |
Figures quoted represent past performance, which is no guarantee of future results, and do not reflect taxes that a shareholder may pay on fund distributions or the redemption of fund shares. Investment return and principal value of an investment will fluctuate so that an investor’s shares, when redeemed, may be worth more or less than their original cost. Performance shown without sales charges would be lower if sales charges were reflected. Current performance may be lower or higher than the performance data quoted, which assumes the reinvestment of dividends and capital gains. Current month-end performance is available on the Fund’s website, wellsfargofunds.com.
Index returns do not include transaction costs associated with buying and selling securities, any mutual fund fees or expenses, or any taxes. It is not possible to invest directly in an index.
For Class A shares, the maximum front-end sales charge is 2.00%. For Class C shares, the maximum contingent deferred sales charge is 1.00%. Performance including a contingent deferred sales charge assumes the sales charge for the corresponding time period. Administrator Class and Institutional Class shares are sold without a front-end sales charge or contingent deferred sales charge.
Bond values fluctuate in response to the financial condition of individual issuers, general market and economic conditions, and changes in interest rates. Changes in market conditions and government policies may lead to periods of heightened volatility in the bond market and reduced liquidity for certain bonds held by the Fund. In general, when interest rates rise, bond values fall and investors may lose principal value. Interest-rate changes and their impact on the Fund and its share price can be sudden and unpredictable. The use of derivatives may reduce returns and/or increase volatility. Certain investment strategies tend to increase the total risk of an investment (relative to the broader market). The Fund is exposed to California municipal securities risk and high-yield securities risk. Consult the Fund’s prospectus for additional information on these and other risks. A portion of the Fund’s income may be subject to federal, state, and/or local income taxes or the Alternative Minimum Tax (AMT). Any capital gains distributions may be taxable.
Please see footnotes on page 5.
| | | | | | |
| Performance highlights (unaudited) | | Wells Fargo California Limited-Term Tax-Free Fund | | | 5 | |
|
| Effective maturity distribution as of December 31, 20166 |
|
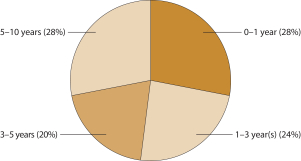
|
|
| Credit quality as of December 31, 20167 |
|
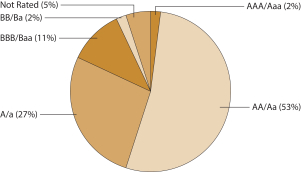 |
| 1 | Historical performance shown for the Institutional Class shares prior to their inception reflects the performance of the Administrator Class shares, and is not adjusted to reflect the Institutional Class expenses. If these expenses had been included, returns for the Institutional Class would be higher. |
| 2 | Reflects the expense ratios as stated in the most recent prospectuses. The expense ratios shown are subject to change and may differ from the annualized expense ratios shown in the financial highlights of this report. |
| 3 | The manager has contractually committed through October 31, 2017, to waive fees and/or reimburse expenses to the extent necessary to cap the Fund’s Total Annual Fund Operating Expenses After Fee Waiver at the amounts shown. After this time, the cap may be increased or the commitment to maintain the cap may be terminated only with the approval of the Board of Trustees. Brokerage commissions, stamp duty fees, interest, taxes, acquired fund fees and expenses, and extraordinary expenses are excluded from the expense cap. Without this cap, the Fund’s returns would have been lower. |
| 4 | The Bloomberg Barclays Municipal Bond 1–5 Year Blend Index (formerly known as Barclays Municipal Bond 1–5 Year Blend Index) is the 1–5 Year Blend component of the Bloomberg Barclays Municipal Bond Index (formerly known as Barclays Municipal Bond Index). The Bloomberg Barclays Municipal Bond Index is an unmanaged index composed of long-term tax-exempt bonds with a minimum credit rating of Baa. You cannot invest directly in an index. |
| 5 | The Bloomberg Barclays California Municipal Bond 1-5 Year Blend Index (formerly known as Barclays California Municipal Bond 1-5 Year Blend Index) is the 1-5 Year Blend Component of the Bloomberg Barclays California Municipal Bond Index (formerly known as Barclays California Municipal Bond Index). You cannot invest directly in an index. |
| 6 | Amounts are calculated based on the total investments of the Fund. These amounts are subject to change and may have changed since the date specified. |
| 7 | The credit quality distribution of portfolio holdings reflected in the chart is based on ratings from Standard & Poor’s, Moody’s Investors Service, and/ or Fitch Ratings Ltd. Credit quality ratings apply to the underlying holdings of the Fund and not to the Fund itself. The percentages of the Fund’s portfolio with the ratings depicted in the chart are calculated based on the total market value of fixed income securities held by the Fund. If a security was rated by all three rating agencies, the middle rating was utilized. If rated by two of three rating agencies, the lower rating was utilized, and if rated by one of the rating agencies, that rating was utilized. Standard & Poor’s rates the creditworthiness of bonds, ranging from AAA (highest) to D (lowest). Ratings from A to CCC may be modified by the addition of a plus (+) or minus (-) sign to show relative standing within the rating categories. Standard & Poor’s rates the creditworthiness of short-term notes from SP-1 (highest) to SP-3 (lowest). Moody’s rates the creditworthiness of bonds, ranging from Aaa (highest) to C (lowest). Ratings Aa to B may be modified by the addition of a number 1 (highest) to 3 (lowest) to show relative standing within the ratings categories. Moody’s rates the creditworthiness of short-term U.S. tax-exempt municipal securities from MIG 1/VMIG 1 (highest) to SG (lowest). Fitch rates the creditworthiness of bonds, ranging from AAA (highest) to D (lowest). Credit quality distribution is subject to change and may have changed since the date specified. |
| | | | |
| 6 | | Wells Fargo California Limited-Term Tax-Free Fund | | Fund expenses (unaudited) |
As a shareholder of the Fund, you incur two types of costs: (1) transaction costs, including sales charges (loads) on purchase payments and contingent deferred sales charges (if any) on redemptions and (2) ongoing costs, including management fees, distribution (12b-1) and/or shareholder servicing fees, and other Fund expenses. This example is intended to help you understand your ongoing costs (in dollars) of investing in the Fund and to compare these costs with the ongoing costs of investing in other mutual funds.
The example is based on an investment of $1,000 invested at the beginning of the six-month period and held for the entire period from July 1, 2016 to December 31, 2016.
Actual expenses
The “Actual” line of the table below provides information about actual account values and actual expenses. You may use the information in this line, together with the amount you invested, to estimate the expenses that you paid over the period. Simply divide your account value by $1,000 (for example, an $8,600 account value divided by $1,000 = 8.6), then multiply the result by the number in the “Actual” line under the heading entitled “Expenses paid during period” for your applicable class of shares to estimate the expenses you paid on your account during this period.
Hypothetical example for comparison purposes
The “Hypothetical” line of the table below provides information about hypothetical account values and hypothetical expenses based on the Fund’s actual expense ratio and an assumed rate of return of 5% per year before expenses, which is not the Fund’s actual return. The hypothetical account values and expenses may not be used to estimate the actual ending account balance or expenses you paid for the period. You may use this information to compare the ongoing costs of investing in the Fund and other funds. To do so, compare this 5% hypothetical example with the 5% hypothetical examples that appear in the shareholder reports of the other funds.
Please note that the expenses shown in the table are meant to highlight your ongoing costs only and do not reflect any transactional costs, such as sales charges (loads) and contingent deferred sales charges. Therefore, the “Hypothetical” line of the table is useful in comparing ongoing costs only and will not help you determine the relative total costs of owning different funds. In addition, if these transactional costs were included, your costs would have been higher.
| | | | | | | | | | | | | | | | |
| | | Beginning
account value
7-1-2016 | | | Ending
account value
12-31-2016 | | | Expenses
paid during
the period¹ | | | Annualized net
expense ratio | |
Class A | | | | | | | | | | | | | | | | |
Actual | | $ | 1,000.00 | | | $ | 975.23 | | | $ | 3.97 | | | | 0.80 | % |
Hypothetical (5% return before expenses) | | $ | 1,000.00 | | | $ | 1,021.11 | | | $ | 4.06 | | | | 0.80 | % |
Class C | | | | | | | | | | | | | | | | |
Actual | | $ | 1,000.00 | | | $ | 970.63 | | | $ | 7.68 | | | | 1.55 | % |
Hypothetical (5% return before expenses) | | $ | 1,000.00 | | | $ | 1,017.34 | | | $ | 7.86 | | | | 1.55 | % |
Administrator Class | | | | | | | | | | | | | | | | |
Actual | | $ | 1,000.00 | | | $ | 975.70 | | | $ | 2.98 | | | | 0.60 | % |
Hypothetical (5% return before expenses) | | $ | 1,000.00 | | | $ | 1,022.12 | | | $ | 3.05 | | | | 0.60 | % |
Institutional Class | | | | | | | | | | | | | | | | |
Actual | | $ | 1,000.00 | | | $ | 977.10 | | | $ | 2.48 | | | | 0.50 | % |
Hypothetical (5% return before expenses) | | $ | 1,000.00 | | | $ | 1,022.62 | | | $ | 2.54 | | | | 0.50 | % |
| 1 | Expenses paid is equal to the annualized net expense ratio of each class multiplied by the average account value over the period, multiplied by the number of days in the most recent fiscal half-year divided by the number of days in the fiscal year (to reflect the one-half-year period). |
| | | | | | |
| Portfolio of investments—December 31, 2016 (unaudited) | | Wells Fargo California Limited-Term Tax-Free Fund | | | 7 | |
| | | | | | | | | | | | | | | | |
| Security name | | Interest rate | | | Maturity date | | | Principal | | | Value | |
| | | | |
Municipal Obligations: 97.23% | | | | | | | | | | | | | | | | |
| | | | |
| California: 94.22% | | | | | | | | | | | | | | | | |
Adelanto CA School District CAB Series B (GO Revenue, National Insured) ¤ | | | 0.00 | % | | | 9-1-2018 | | | $ | 1,225,000 | | | $ | 1,150,863 | |
Alameda County CA Corridor Transportation Authority CAB Subordinate Lien Series A (Transportation Revenue, Ambac Insured) ¤ | | | 0.00 | | | | 10-1-2019 | | | | 3,000,000 | | | | 2,858,487 | |
Alameda County CA Corridor Transportation Authority Refunding Subordinate Lien Series A (Airport Revenue) | | | 5.00 | | | | 10-1-2025 | | | | 750,000 | | | | 869,378 | |
Alameda County CA Joint Powers Authority Multiple Capital Projects Series A (Miscellaneous Revenue) | | | 4.00 | | | | 12-1-2019 | | | | 1,000,000 | | | | 1,068,170 | |
Alameda County CA Joint Powers Authority Multiple Capital Projects Series A (Miscellaneous Revenue) | | | 5.00 | | | | 12-1-2021 | | | | 1,000,000 | | | | 1,142,050 | |
Albany CA Limited Obligation Improvement Bond Act of 1915 (Miscellaneous Revenue, Ambac Insured) | | | 4.75 | | | | 9-2-2019 | | | | 1,305,000 | | | | 1,312,882 | |
Alvord CA Unified School District Election of 2007 Series B (GO Revenue, AGM Insured) | | | 6.50 | | | | 8-1-2017 | | | | 155,000 | | | | 159,833 | |
Alvord CA Unified School District Election of 2007 Series B (GO Revenue, AGM Insured) | | | 6.50 | | | | 8-1-2018 | | | | 475,000 | | | | 512,644 | |
Alvord CA Unified School District Election of 2007 Series B (GO Revenue, AGM Insured) | | | 6.50 | | | | 8-1-2020 | | | | 1,605,000 | | | | 1,860,933 | |
Anaheim CA PFA CAB Sub Lien Public Improvements Project Series C (Miscellaneous Revenue, AGM Insured) ¤ | | | 0.00 | | | | 9-1-2018 | | | | 3,245,000 | | | | 3,150,019 | |
Anaheim CA PFA Refunding Bond Series A (Miscellaneous Revenue) | | | 5.00 | | | | 5-1-2017 | | | | 1,250,000 | | | | 1,266,563 | |
Anaheim CA Redevelopment Agency Merged Project Area Series A (Tax Revenue, AGM Insured) | | | 4.50 | | | | 2-1-2018 | | | | 875,000 | | | | 905,056 | |
Association of Bay Area Governments Finance Authority For Nonprofit Corporations Jackson Laboratory (Miscellaneous Revenue) | | | 5.00 | | | | 7-1-2019 | | | | 730,000 | | | | 789,159 | |
Association of Bay Area Governments Finance Authority For Nonprofit Corporations O’Connor Woods (Health Revenue) | | | 4.00 | | | | 1-1-2019 | | | | 955,000 | | | | 1,003,867 | |
Association of Bay Area Governments Finance Authority For Nonprofit Corporations Sharp Healthcare Series A (Health Revenue) | | | 5.00 | | | | 8-1-2019 | | | | 500,000 | | | | 543,440 | |
Banning CA Unified School District Refunding (GO Revenue, AGM Insured) | | | 5.00 | | | | 8-1-2027 | | | | 510,000 | | | | 602,376 | |
Bassett CA Unified School District Refunding Bond Series B (GO Revenue, Build America Mutual Assurance Company Insured) | | | 5.00 | | | | 8-1-2019 | | | | 420,000 | | | | 456,023 | |
Bassett CA Unified School District Refunding Bond Series B (GO Revenue, Build America Mutual Assurance Company Insured) | | | 5.00 | | | | 8-1-2021 | | | | 550,000 | | | | 621,858 | |
Bassett CA Unified School District Refunding Bond Series B (GO Revenue, Build America Mutual Assurance Company Insured) | | | 5.00 | | | | 8-1-2023 | | | | 725,000 | | | | 843,994 | |
Bay Area Toll Authority California San Francisco Bay Area Toll Bridge Series B (Transportation Revenue) ± | | | 1.50 | | | | 4-1-2047 | | | | 14,000,000 | | | | 14,005,040 | |
Bay Area Toll Authority California San Francisco Bay Area Toll Bridge Series C (Transportation Revenue) ± | | | 1.37 | | | | 4-1-2045 | | | | 5,000,000 | | | | 5,000,800 | |
Bay Area Toll Authority California San Francisco Bay Area Toll Bridge Series C (Transportation Revenue) ± | | | 1.88 | | | | 4-1-2047 | | | | 10,500,000 | | | | 10,555,125 | |
Bay Area Toll Authority California San Francisco Bay Area Toll Bridge Series E (Transportation Revenue) ± | | | 2.00 | | | | 4-1-2034 | | | | 5,000,000 | | | | 5,005,400 | |
Brentwood CA Infrastructure Financing Authority Sub Series A (Miscellaneous Revenue, AGM Insured) | | | 4.00 | | | | 9-2-2017 | | | | 1,950,000 | | | | 1,986,407 | |
Brentwood CA Infrastructure Financing Authority Sub Series B (Miscellaneous Revenue) | | | 3.00 | | | | 9-2-2017 | | | | 995,000 | | | | 1,004,552 | |
Brentwood CA Infrastructure Financing Authority Sub Series B (Miscellaneous Revenue) | | | 3.00 | | | | 9-2-2018 | | | | 1,030,000 | | | | 1,049,529 | |
Brentwood CA Infrastructure Financing Authority Sub Series B (Miscellaneous Revenue) | | | 4.00 | | | | 9-2-2021 | | | | 1,135,000 | | | | 1,206,471 | |
The accompanying notes are an integral part of these financial statements.
| | | | |
| 8 | | Wells Fargo California Limited-Term Tax-Free Fund | | Portfolio of investments—December 31, 2016 (unaudited) |
| | | | | | | | | | | | | | | | |
| Security name | | Interest rate | | | Maturity date | | | Principal | | | Value | |
| | | | |
| California (continued) | | | | | | | | | | | | | | | | |
California (GO Revenue) ± | | | 4.00 | % | | | 12-1-2027 | | | $ | 9,015,000 | | | $ | 9,129,491 | |
California (GO Revenue) | | | 5.00 | | | | 10-1-2021 | | | | 6,795,000 | | | | 7,767,636 | |
California (GO Revenue) | | | 5.00 | | | | 9-1-2022 | | | | 2,240,000 | | | | 2,599,274 | |
California (GO Revenue) | | | 5.00 | | | | 11-1-2022 | | | | 2,500,000 | | | | 2,909,350 | |
California (GO Revenue) | | | 5.00 | | | | 9-1-2023 | | | | 10,730,000 | | | | 12,620,304 | |
California (GO Revenue) | | | 5.00 | | | | 10-1-2023 | | | | 8,400,000 | | | | 9,892,680 | |
California (GO Revenue) | | | 5.25 | | | | 10-1-2022 | | | | 2,750,000 | | | | 3,232,900 | |
California Communities Transportation Total Road Improvement Certificate of Participation Series B (Tax Revenue) | | | 3.00 | | | | 6-1-2017 | | | | 380,000 | | | | 382,945 | |
California Communities Transportation Total Road Improvement Certificate of Participation Series B (Tax Revenue) | | | 4.00 | | | | 6-1-2018 | | | | 390,000 | | | | 404,216 | |
California Community College Financing Authority Shasta-Tehama-Trinity Joint District Series A (Miscellaneous Revenue) | | | 2.25 | | | | 5-1-2017 | | | | 435,000 | | | | 436,640 | |
California Department of Veterans Affairs Home Purchase Series A (Housing Revenue) | | | 3.50 | | | | 12-1-2021 | | | | 855,000 | | | | 909,840 | |
California Department of Water Resources Central Valley Project Water System Series AM (Water & Sewer Revenue) | | | 5.00 | | | | 12-1-2017 | | | | 6,595,000 | | | | 6,838,751 | |
California Economic Recovery Refunding Series A (Tax Revenue) | | | 5.00 | | | | 7-1-2018 | | | | 2,950,000 | | | | 3,118,740 | |
California Economic Recovery Refunding Series A (Tax Revenue) | | | 5.00 | | | | 7-1-2018 | | | | 850,000 | | | | 898,620 | |
California Health Facilities Financing Refunding Lucile Packard Stanford Hospital Series A (Health Revenue) | | | 5.00 | | | | 8-15-2027 | | | | 450,000 | | | | 536,054 | |
California HFA AMT Home Mortgage Series G (Housing Revenue) | | | 5.50 | | | | 8-1-2042 | | | | 60,000 | | | | 60,220 | |
California HFA Home Mortgage Series A (Housing Revenue, GNMA/FNMA/FHLMC Insured) | | | 3.75 | | | | 8-1-2020 | | | | 630,000 | | | | 664,707 | |
California HFFA Catholic Healthcare West Series A (Health Revenue) | | | 5.00 | | | | 3-1-2019 | | | | 700,000 | | | | 752,724 | |
California HFFA Catholic Healthcare West Series A (Health Revenue) | | | 5.25 | | | | 3-1-2023 | | | | 4,000,000 | | | | 4,465,400 | |
California HFFA Chinese Hospital Associates (Health Revenue) | | | 5.00 | | | | 6-1-2019 | | | | 200,000 | | | | 215,230 | |
California HFFA Fellowship Homes Incorporated (Health Revenue) | | | 5.00 | | | | 9-1-2019 | | | | 1,135,000 | | | | 1,196,540 | |
California HFFA Memorial Health Services Series A (Health Revenue) | | | 5.00 | | | | 10-1-2023 | | | | 2,475,000 | | | | 2,841,696 | |
California HFFA St. Joseph Health System Series B (Health Revenue) ± | | | 5.00 | | | | 7-1-2043 | | | | 2,000,000 | | | | 2,059,780 | |
California Infrastructure & Economic Development Bank Goodwill Industries of Sacramento Valley & Northern Nevada Project Series A (Industrial Development Revenue) 144A | | | 4.13 | | | | 1-1-2027 | | | | 1,380,000 | | | | 1,339,442 | |
California Municipal Finance Authority Charter School Albert Einstein Academies Project Series A (Miscellaneous Revenue) | | | 6.00 | | | | 8-1-2023 | | | | 805,000 | | | | 852,439 | |
California Municipal Finance Authority Community Medical Centers Series A (Health Revenue) | | | 5.00 | | | | 2-1-2023 | | | | 735,000 | | | | 832,829 | |
California Municipal Finance Authority Community Medical Centers Series A (Health Revenue) | | | 5.00 | | | | 2-1-2024 | | | | 500,000 | | | | 572,370 | |
California Municipal Finance Authority Mobile Senior Caritas Affordable Housing Incorporated Projects Series A (Housing Revenue) | | | 5.00 | | | | 8-15-2019 | | | | 515,000 | | | | 555,819 | |
California Municipal Finance Authority Palmdale Aerospace Academy Project (Education Revenue) 144A | | | 4.00 | | | | 7-1-2026 | | | | 2,000,000 | | | | 1,938,420 | |
California Municipal Finance Authority Peppertree Senior Apartments Series A (Housing Revenue, FHLMC Insured, FHLMC LIQ) | | | 2.80 | | | | 6-1-2023 | | | | 2,500,000 | | | | 2,587,825 | |
California Municipal Finance Authority Village Grove Apartments Series A (Housing Revenue, FHLMC Insured, FHLMC LIQ) | | | 3.10 | | | | 12-1-2021 | | | | 1,000,000 | | | | 1,039,040 | |
California Municipal Financing Authority BAN Open Door Community Health Centers (Health Revenue) | | | 2.80 | | | | 9-15-2018 | | | | 3,000,000 | | | | 3,025,410 | |
California PCFA Republic Services Incorporated Project Series C (Resource Recovery Revenue) ± | | | 5.25 | | | | 6-1-2023 | | | | 3,245,000 | | | | 3,339,202 | |
The accompanying notes are an integral part of these financial statements.
| | | | | | |
| Portfolio of investments—December 31, 2016 (unaudited) | | Wells Fargo California Limited-Term Tax-Free Fund | | | 9 | |
| | | | | | | | | | | | | | | | |
| Security name | | Interest rate | | | Maturity date | | | Principal | | | Value | |
| | | | |
| California (continued) | | | | | | | | | | | | | | | | |
California PFOTER Series DCL-010 (GO Revenue, Dexia Credit Local LOC, AGM Insured) 144Aø | | | 0.90 | % | | | 8-1-2027 | | | $ | 6,000,000 | | | $ | 6,000,000 | |
California Public Works Board Capital Project Series G (Miscellaneous Revenue) | | | 5.00 | | | | 11-1-2020 | | | | 3,000,000 | | | | 3,356,940 | |
California Public Works Board Department of Corrections & Rehabilitation Series A (Miscellaneous Revenue) | | | 6.50 | | | | 9-1-2017 | | | | 430,000 | | | | 445,850 | |
California Public Works Board Department of Corrections & Rehabilitation Series C (Miscellaneous Revenue) | | | 4.00 | | | | 6-1-2018 | | | | 1,625,000 | | | | 1,687,433 | |
California Public Works Board Department of Corrections & Rehabilitation Series C (Miscellaneous Revenue) | | | 5.00 | | | | 10-1-2022 | | | | 1,500,000 | | | | 1,736,055 | |
California Public Works Board Judicial Council Projects Series B (Miscellaneous Revenue) | | | 5.00 | | | | 10-1-2022 | | | | 500,000 | | | | 578,685 | |
California Public Works Board Judicial Council Projects Series D (Miscellaneous Revenue) | | | 5.00 | | | | 12-1-2019 | | | | 1,000,000 | | | | 1,095,880 | |
California Public Works Board Various Capital Projects Series I (Miscellaneous Revenue) | | | 5.00 | | | | 11-1-2020 | | | | 1,250,000 | | | | 1,398,725 | |
California Refunding Various Purpose Bidding Group C (GO Revenue) | | | 5.00 | | | | 9-1-2027 | | | | 8,500,000 | | | | 10,233,915 | |
California School Finance Authority Coastal Academy Project Series A (Education Revenue) | | | 5.00 | | | | 10-1-2022 | | | | 350,000 | | | | 370,944 | |
California School Finance Authority Refunding Aspire Public School (Education Revenue) 144A | | | 5.00 | | | | 8-1-2022 | | | | 1,545,000 | | | | 1,693,629 | |
California School Finance Authority Refunding Aspire Public School (Education Revenue) 144A | | | 5.00 | | | | 8-1-2023 | | | | 800,000 | | | | 880,392 | |
California School Finance Authority Refunding Aspire Public School (Education Revenue) 144A | | | 5.00 | | | | 8-1-2024 | | | | 350,000 | | | | 386,421 | |
California School Finance Authority Rocketship Education Series A (Education Revenue) 144A | | | 5.00 | | | | 6-1-2021 | | | | 400,000 | | | | 418,352 | |
California School Finance Authority Rocketship Education Series A (Education Revenue) 144A | | | 5.00 | | | | 6-1-2026 | | | | 500,000 | | | | 515,925 | |
California School Infrastructure Financing Agency Refunding (Tax Revenue, AGM Insured) | | | 5.00 | | | | 9-1-2021 | | | | 1,300,000 | | | | 1,464,528 | |
California State Index Floating Rate Series E (GO Revenue) ± | | | 1.27 | | | | 12-1-2029 | | | | 5,000,000 | | | | 5,004,500 | |
California Statewide CDA Adventist Health Systems West Series A (Health Revenue) | | | 5.00 | | | | 3-1-2024 | | | | 800,000 | | | | 930,704 | |
California Statewide CDA American Baptist Homes West Series B-3 (Health Revenue) | | | 2.10 | | | | 10-1-2019 | | | | 2,930,000 | | | | 2,930,176 | |
California Statewide CDA California Baptist University Series A (Education Revenue) | | | 5.13 | | | | 11-1-2023 | | | | 715,000 | | | | 751,522 | |
California Statewide CDA California Baptist University Series B (Education Revenue) | | | 3.50 | | | | 11-1-2018 | | | | 520,000 | | | | 523,297 | |
California Statewide CDA Episcopal Communities and Services (Health Revenue) | | | 4.00 | | | | 5-15-2017 | | | | 450,000 | | | | 454,721 | |
California Statewide CDA Health Facilities Catholic Series F (Health Revenue, AGM Insured) ±(m) | | | 0.99 | | | | 7-1-2040 | | | | 1,000,000 | | | | 1,000,000 | |
California Statewide CDA Henry Mayo Newhall Memorial Hospital Series A (Health Revenue, AGM Insured) | | | 5.00 | | | | 10-1-2021 | | | | 500,000 | | | | 558,995 | |
California Statewide CDA Henry Mayo Newhall Memorial Hospital Series A (Health Revenue, AGM Insured) | | | 5.00 | | | | 10-1-2022 | | | | 395,000 | | | | 447,535 | |
California Statewide CDA Henry Mayo Newhall Memorial Hospital Series A (Health Revenue, AGM Insured) | | | 5.00 | | | | 10-1-2023 | | | | 500,000 | | | | 570,785 | |
California Statewide CDA Kaiser Permanente Series E (Health Revenue) ± | | | 5.00 | | | | 4-1-2044 | | | | 4,000,000 | | | | 4,052,480 | |
California Statewide CDA Redwoods Project (Health Revenue) | | | 3.00 | | | | 11-15-2018 | | | | 400,000 | | | | 412,760 | |
California Statewide CDA Refunding Bond (Miscellaneous Revenue, AGM Insured) | | | 5.00 | | | | 11-15-2019 | | | | 250,000 | | | | 273,050 | |
California Statewide CDA Refunding Bond (Miscellaneous Revenue, AGM Insured) | | | 5.00 | | | | 11-15-2020 | | | | 210,000 | | | | 234,394 | |
California Statewide CDA Refunding Bond (Miscellaneous Revenue, AGM Insured) | | | 5.00 | | | | 11-15-2021 | | | | 200,000 | | | | 227,136 | |
California Statewide CDA Refunding Bond (Miscellaneous Revenue, AGM Insured) | | | 5.00 | | | | 11-15-2022 | | | | 200,000 | | | | 230,538 | |
California Statewide CDA School Facilities (Education Revenue) | | | 5.88 | | | | 7-1-2022 | | | | 1,735,000 | | | | 1,884,210 | |
The accompanying notes are an integral part of these financial statements.
| | | | |
| 10 | | Wells Fargo California Limited-Term Tax-Free Fund | | Portfolio of investments—December 31, 2016 (unaudited) |
| | | | | | | | | | | | | | | | |
| Security name | | Interest rate | | | Maturity date | | | Principal | | | Value | |
| | | | |
| California (continued) | | | | | | | | | | | | | | | | |
California Statewide CDA Senior Living Health Facilities Los Angeles Jewish Home for the Aging Series B (Health Revenue) | | | 3.00 | % | | | 8-1-2021 | | | $ | 5,200,000 | | | $ | 5,204,628 | |
California Statewide CDA Senior Living Health Facilities Los Angeles Jewish Home for the Aging Series D (Health Revenue) | | | 4.75 | | | | 8-1-2020 | | | | 2,000,000 | | | | 2,000,660 | |
California Statewide CDA St. Joseph Hospital (Health Revenue, AGM Insured) | | | 4.50 | | | | 7-1-2018 | | | | 400,000 | | | | 411,968 | |
California Statewide CDA University of California Irvine East Campus Apartments Phase I (Housing Revenue) | | | 5.00 | | | | 5-15-2017 | | | | 1,000,000 | | | | 1,012,150 | |
California Statewide Community Refunding Lancer Educational Student Housing (Housing Revenue) 144A | | | 4.00 | | | | 6-1-2017 | | | | 500,000 | | | | 501,990 | |
California Statewide HFFA Casa Colina Obligated Group (Health Revenue) | | | 4.00 | | | | 4-1-2017 | | | | 400,000 | | | | 401,984 | |
California Statewide HFFA Casa Colina Obligated Group (Health Revenue) | | | 5.00 | | | | 4-1-2018 | | | | 400,000 | | | | 413,376 | |
California Statewide Index Floating Rate Series B (GO Revenue) ± | | | 1.19 | | | | 12-1-2031 | | | | 2,500,000 | | | | 2,466,250 | |
Campbell CA Union High School Capital Projects and Refinancing (Miscellaneous Revenue) | | | 5.00 | | | | 8-1-2024 | | | | 350,000 | | | | 357,627 | |
Campbell CA Union High School Capital Projects and Refinancing (Miscellaneous Revenue) | | | 5.00 | | | | 8-1-2025 | | | | 350,000 | | | | 357,606 | |
Campbell CA Union High School Capital Projects and Refinancing (Miscellaneous Revenue) | | | 5.00 | | | | 8-1-2026 | | | | 375,000 | | | | 383,149 | |
Campbell CA Union High School Capital Projects and Refinancing (Miscellaneous Revenue) | | | 5.00 | | | | 8-1-2027 | | | | 300,000 | | | | 306,429 | |
Carlsbad CA Improvement Bond Act of 1915 (Miscellaneous Revenue) | | | 3.00 | | | | 9-2-2017 | | | | 415,000 | | | | 418,872 | |
Carlsbad CA Improvement Bond Act of 1915 (Miscellaneous Revenue) | | | 3.00 | | | | 9-2-2018 | | | | 300,000 | | | | 305,538 | |
Carlsbad CA Improvement Bond Act of 1915 (Miscellaneous Revenue) | | | 3.00 | | | | 9-2-2019 | | | | 540,000 | | | | 551,524 | |
Carson CA RDA Project Area #1 Series A (Tax Revenue, AGM Insured) | | | 5.00 | | | | 10-1-2020 | | | | 775,000 | | | | 859,072 | |
Carson CA RDA Project Area #1 Series A (Tax Revenue, AGM Insured) | | | 5.00 | | | | 10-1-2021 | | | | 855,000 | | | | 964,500 | |
Carson CA RDA Project Area #1 Series A (Tax Revenue, AGM Insured) | | | 5.00 | | | | 10-1-2022 | | | | 600,000 | | | | 687,414 | |
Cathedral City CA Redevelopment Agency Refunding Merged Redevelopment Project Series A (Tax Revenue) | | | 5.00 | | | | 8-1-2020 | | | | 2,295,000 | | | | 2,527,461 | |
Cathedral City CA Redevelopment Agency Refunding Merged Redevelopment Project Series A (Tax Revenue) | | | 5.00 | | | | 8-1-2021 | | | | 2,425,000 | | | | 2,713,599 | |
Cathedral City CA Redevelopment Agency Refunding Merged Redevelopment Project Series A (Tax Revenue) | | | 5.00 | | | | 8-1-2022 | | | | 2,550,000 | | | | 2,894,633 | |
Cathedral City CA Redevelopment Agency Refunding Merged Redevelopment Project Series A (Tax Revenue) | | | 5.00 | | | | 8-1-2023 | | | | 1,735,000 | | | | 1,993,463 | |
Cathedral City CA Redevelopment Agency Refunding Merged Redevelopment Project Series A (Tax Revenue, AGM Insured) | | | 5.00 | | | | 8-1-2024 | | | | 1,770,000 | | | | 2,081,467 | |
Cathedral City CA Redevelopment Agency Refunding Merged Redevelopment Project Series B (Tax Revenue) | | | 4.00 | | | | 8-1-2017 | | | | 435,000 | | | | 442,047 | |
Central California Unified School District Refunding (GO Revenue, AGM Insured) | | | 4.00 | | | | 7-1-2020 | | | | 500,000 | | | | 537,355 | |
Central California Unified School District Refunding (GO Revenue, AGM Insured) | | | 5.00 | | | | 7-1-2021 | | | | 400,000 | | | | 451,612 | |
Central California Unified School District Refunding (GO Revenue, AGM Insured) | | | 5.00 | | | | 7-1-2022 | | | | 750,000 | | | | 860,385 | |
Centralia CA School District (GO Revenue, AGM Insured) | | | 4.00 | | | | 8-1-2018 | | | | 375,000 | | | | 390,788 | |
Chino CA PFA Local Agency Series A (Tax Revenue, AGM Insured) | | | 5.00 | | | | 9-1-2022 | | | | 1,830,000 | | | | 2,093,959 | |
Chino CA PFA Local Agency Series A (Tax Revenue, AGM Insured) | | | 5.00 | | | | 9-1-2024 | | | | 660,000 | | | | 770,293 | |
Chula Vista CA Certificate of Participation Refunding Bond Police Facility Project (Miscellaneous Revenue) | | | 5.00 | | | | 10-1-2021 | | | | 720,000 | | | | 810,130 | |
Chula Vista CA Elementary School District (Miscellaneous Revenue, AGM Insured) | | | 5.00 | | | | 9-1-2024 | | | | 1,370,000 | | | | 1,612,504 | |
Coachella Valley CA Unified School District (GO Revenue, Build America Mutual Assurance Company Insured) | | | 4.00 | | | | 8-1-2020 | | | | 2,455,000 | | | | 2,639,493 | |
Coachella Valley CA Unified School District (GO Revenue, Build America Mutual Assurance Company Insured) | | | 4.00 | | | | 8-1-2021 | | | | 2,230,000 | | | | 2,423,096 | |
The accompanying notes are an integral part of these financial statements.
| | | | | | |
| Portfolio of investments—December 31, 2016 (unaudited) | | Wells Fargo California Limited-Term Tax-Free Fund | | | 11 | |
| | | | | | | | | | | | | | | | |
| Security name | | Interest rate | | | Maturity date | | | Principal | | | Value | |
| | | | |
| California (continued) | | | | | | | | | | | | | | | | |
Coachella Valley CA Unified School District (GO Revenue, Build America Mutual Assurance Company Insured) | | | 4.00 | % | | | 8-1-2022 | | | $ | 1,000,000 | | | $ | 1,095,450 | |
Colton CA PFA Series A (Utilities Revenue) | | | 4.00 | | | | 4-1-2019 | | | | 415,000 | | | | 436,709 | |
Commerce CA Community Development Commission Refunding Series A (Tax Revenue, AGM Insured) | | | 5.00 | | | | 8-1-2026 | | | | 1,710,000 | | | | 2,042,988 | |
Commerce CA Community Development Commission Refunding Series A (Tax Revenue, AGM Insured) | | | 5.00 | | | | 8-1-2027 | | | | 1,760,000 | | | | 2,078,789 | |
Commerce CA RDA CAB Project #1 (Tax Revenue) ¤ | | | 0.00 | | | | 8-1-2021 | | | | 1,690,000 | | | | 1,354,062 | |
Compton CA Community College District (GO Revenue) | | | 5.00 | | | | 7-1-2017 | | | | 1,225,000 | | | | 1,248,508 | |
Compton CA PFA Refunding Bond (Miscellaneous Revenue) 144A | | | 4.00 | | | | 9-1-2027 | | | | 2,000,000 | | | | 1,921,640 | |
Compton CA Public Finance Authority Lease (Miscellaneous Revenue) 144A | | | 4.00 | | | | 9-1-2022 | | | | 2,000,000 | | | | 1,990,980 | |
Compton CA Unified School District CAB Election of 2002 Series D (GO Revenue, Ambac Insured) ¤ | | | 0.00 | | | | 6-1-2017 | | | | 3,075,000 | | | | 3,056,858 | |
Corcoran CA Unified School District Certificate of Participation (Miscellaneous Revenue, AGM Insured) ± | | | 2.70 | | | | 12-1-2039 | | | | 4,500,000 | | | | 4,515,885 | |
Cotati Rohnert Park CA Unified School District Series B (GO Revenue, AGM Insured) | | | 5.00 | | | | 8-1-2020 | | | | 2,275,000 | | | | 2,524,568 | |
Culver City CA Redevelopment Agency CAB Tax Allocation Series A (Tax Revenue) ¤ | | | 0.00 | | | | 11-1-2019 | | | | 2,575,000 | | | | 2,367,532 | |
Cypress CA Elementary School District (Miscellaneous Revenue) | | | 2.00 | | | | 5-1-2017 | | | | 335,000 | | | | 335,985 | |
Cypress CA Elementary School District (Miscellaneous Revenue) | | | 2.25 | | | | 5-1-2018 | | | | 455,000 | | | | 460,264 | |
Delano CA Certificate of Participation Delano Regional Medical Center (Health Revenue) | | | 4.00 | | | | 1-1-2017 | | | | 1,305,000 | | | | 1,305,091 | |
Desert Sands CA Unified School District Certification of Participation (Miscellaneous Revenue, Build America Mutual Assurance Company Insured) | | | 5.00 | | | | 3-1-2024 | | | | 1,500,000 | | | | 1,758,870 | |
Dinuba CA RDA Successor Agency Merged City Project #2 (Tax Revenue, Build America Mutual Assurance Company Insured) | | | 4.00 | | | | 9-1-2019 | | | | 210,000 | | | | 222,375 | |
Dinuba CA RDA Successor Agency Merged City Project #2 (Tax Revenue, Build America Mutual Assurance Company Insured) | | | 5.00 | | | | 9-1-2021 | | | | 250,000 | | | | 282,948 | |
Dinuba CA RDA Successor Agency Merged City Project #2 (Tax Revenue, Build America Mutual Assurance Company Insured) | | | 5.00 | | | | 9-1-2022 | | | | 250,000 | | | | 287,303 | |
Dixon CA Unified School District (GO Revenue, AGM Insured) | | | 5.00 | | | | 8-1-2021 | | | | 1,210,000 | | | | 1,367,530 | |
Dixon CA Unified School District (GO Revenue, AGM Insured) | | | 5.00 | | | | 8-1-2022 | | | | 1,285,000 | | | | 1,474,897 | |
El Centro CA Financing Authority Series A (Water & Sewer Revenue, AGM Insured) | | | 2.50 | | | | 10-1-2017 | | | | 475,000 | | | | 479,878 | |
El Centro CA Financing Authority Series A (Water & Sewer Revenue, AGM Insured) | | | 2.50 | | | | 10-1-2018 | | | | 485,000 | | | | 494,157 | |
El Dorado CA Community Facilities District #19-1 (Tax Revenue) | | | 4.00 | | | | 9-1-2018 | | | | 1,000,000 | | | | 1,041,830 | |
El Dorado CA Community Facilities District #92-1 (Tax Revenue) | | | 4.00 | | | | 9-1-2017 | | | | 1,135,000 | | | | 1,156,111 | |
El Monte CA Union High School Refunding (GO Revenue) | | | 5.00 | | | | 6-1-2021 | | | | 1,315,000 | | | | 1,481,242 | |
Encinitas CA Community Facilities District Ranch Public Improvements Project (Tax Revenue) | | | 4.00 | | | | 9-1-2017 | | | | 1,180,000 | | | | 1,200,025 | |
Fairfield CA RDA Successor Agency Refunding (Tax Revenue) | | | 5.00 | | | | 8-1-2020 | | | | 1,000,000 | | | | 1,110,440 | |
Fairfield CA RDA Successor Agency Refunding (Tax Revenue) | | | 5.00 | | | | 8-1-2021 | | | | 3,170,000 | | | | 3,584,161 | |
Fairfield CA RDA Successor Agency Refunding (Tax Revenue) | | | 5.00 | | | | 8-1-2022 | | | | 2,395,000 | | | | 2,751,089 | |
Fairfield CA RDA Successor Agency Refunding (Tax Revenue) | | | 5.00 | | | | 8-1-2023 | | | | 1,025,000 | | | | 1,193,233 | |
Florin CA Resource Conservation District Series A (Water & Sewer Revenue, National Insured) | | | 5.00 | | | | 9-1-2019 | | | | 1,000,000 | | | | 1,084,900 | |
Florin CA Resource Conservation District Series A (Water & Sewer Revenue, National Insured) | | | 5.00 | | | | 9-1-2020 | | | | 1,000,000 | | | | 1,106,710 | |
Florin CA Resource Conservation District Series A (Water & Sewer Revenue, National Insured) | | | 5.00 | | | | 9-1-2021 | | | | 1,250,000 | | | | 1,408,200 | |
Florin CA Resource Conservation District Series A (Water & Sewer Revenue, National Insured) | | | 5.00 | | | | 9-1-2022 | | | | 1,250,000 | | | | 1,430,300 | |
Folsom CA Redevelopment Agency Successor Tax Allocation Refinancing Series A (Tax Revenue, Build America Mutual Assurance Company Insured) | | | 4.00 | | | | 8-1-2027 | | | | 765,000 | | | | 830,354 | |
The accompanying notes are an integral part of these financial statements.
| | | | |
| 12 | | Wells Fargo California Limited-Term Tax-Free Fund | | Portfolio of investments—December 31, 2016 (unaudited) |
| | | | | | | | | | | | | | | | |
| Security name | | Interest rate | | | Maturity date | | | Principal | | | Value | |
| | | | |
| California (continued) | | | | | | | | | | | | | | | | |
Foothill-Eastern CA Transportation Corridor Agency Series B1 (Transportation Revenue) ± | | | 5.00 | % | | | 1-15-2053 | | | $ | 8,750,000 | | | $ | 8,903,825 | |
Fowler CA Unified School District School Facilities Improvement District #1 (GO Revenue, National Insured) | | | 5.20 | | | | 7-1-2020 | | | | 1,195,000 | | | | 1,253,077 | |
Fremont CA Community Facilities District (Tax Revenue) | | | 5.00 | | | | 9-1-2024 | | | | 1,000,000 | | | | 1,123,180 | |
Fresno County CA Financing Authority Lease Series A (Miscellaneous Revenue, AGM Insured) | | | 3.00 | | | | 8-1-2019 | | | | 970,000 | | | | 1,004,251 | |
Fullerton CA Community Facilities District (Tax Revenue) | | | 3.50 | | | | 9-1-2017 | | | | 565,000 | | | | 572,311 | |
Fullerton CA Community Facilities District (Tax Revenue) | | | 4.00 | | | | 9-1-2018 | | | | 610,000 | | | | 632,125 | |
Fullerton CA Community Facilities District (Tax Revenue) | | | 4.00 | | | | 9-1-2019 | | | | 665,000 | | | | 698,669 | |
Fullerton CA School District Financing Authority Series A (Tax Revenue, AGM Insured) | | | 4.00 | | | | 9-1-2018 | | | | 400,000 | | | | 416,732 | |
Fullerton CA School District Financing Authority Series A (Tax Revenue, AGM Insured) | | | 3.00 | | | | 9-1-2017 | | | | 450,000 | | | | 455,378 | |
Garden Grove CA Agency Community Refunding Garden Grove Community Project (Tax Revenue, Build America Mutual Assurance Company Insured) | | | 4.00 | | | | 10-1-2021 | | | | 770,000 | | | | 838,006 | |
Garden Grove CA Agency Community Refunding Garden Grove Community Project (Tax Revenue, Build America Mutual Assurance Company Insured) | | | 5.00 | | | | 10-1-2022 | | | | 3,015,000 | | | | 3,469,180 | |
Goleta CA Water District Certificate of Participation Series A (Water & Sewer Revenue, AGM Insured) | | | 5.00 | | | | 12-1-2019 | | | | 125,000 | | | | 136,773 | |
Goleta CA Water District Certificate of Participation Series A (Water & Sewer Revenue, AGM Insured) | | | 5.00 | | | | 12-1-2020 | | | | 140,000 | | | | 156,512 | |
Hawthorne CA School District CAB Election of 2008 Series A (GO Revenue, AGC Insured) ¤ | | | 0.00 | | | | 8-1-2017 | | | | 165,000 | | | | 163,629 | |
Hayward CA Unified School District Certificate of Participation (Miscellaneous Revenue, AGM Insured) | | | 3.00 | | | | 6-1-2017 | | | | 705,000 | | | | 710,464 | |
Hayward CA Unified School District Certificate of Participation (Miscellaneous Revenue, AGM Insured) | | | 3.00 | | | | 6-1-2018 | | | | 725,000 | | | | 741,276 | |
Hayward CA Unified School District Certificate of Participation (Miscellaneous Revenue, AGM Insured) | | | 3.00 | | | | 6-1-2019 | | | | 750,000 | | | | 773,670 | |
Hayward CA Unified School District Certificate of Participation (GO Revenue, AGM Insured) | | | 5.00 | | | | 8-1-2022 | | | | 500,000 | | | | 573,890 | |
Hayward CA Unified School District Certificate of Participation (GO Revenue, AGM Insured) | | | 5.00 | | | | 8-1-2023 | | | | 805,000 | | | | 936,585 | |
Huntington Beach CA City School District Election of 2002 (GO Revenue) | | | 4.00 | | | | 8-1-2019 | | | | 2,875,000 | | | | 3,063,399 | |
Huntington Beach CA City School District Election of 2002 (GO Revenue) | | | 4.00 | | | | 8-1-2021 | | | | 505,000 | | | | 552,672 | |
Huntington Beach CA City School District Election of 2002 (GO Revenue) | | | 5.00 | | | | 8-1-2020 | | | | 3,150,000 | | | | 3,514,928 | |
Imperial Beach CA RDA Palm Avenue Commercial Redevelopment Project (Tax Revenue, Build America Mutual Assurance Company Insured) | | | 4.00 | | | | 6-1-2020 | | | | 775,000 | | | | 827,956 | |
Irvine CA Limited Obligation Improvement Bonds Reassessment District #12-1 (Miscellaneous Revenue) | | | 4.00 | | | | 9-2-2018 | | | | 1,325,000 | | | | 1,377,881 | |
Irvine CA Limited Obligation Improvement Bonds Reassessment District #15-2 (Miscellaneous Revenue) | | | 5.00 | | | | 9-2-2023 | | | | 800,000 | | | | 898,952 | |
Irvine CA Limited Obligation Improvement Bonds Reassessment District #15-2 (Miscellaneous Revenue) | | | 5.00 | | | | 9-2-2024 | | | | 850,000 | | | | 956,344 | |
Irwindale CA CDA City Industrial Development Project (Tax Revenue, AGM Insured) | | | 5.00 | | | | 7-15-2020 | | | | 320,000 | | | | 356,531 | |
Irwindale CA CDA City Industrial Development Project (Tax Revenue, AGM Insured) | | | 5.00 | | | | 7-15-2021 | | | | 340,000 | | | | 386,825 | |
Irwindale CA CDA City Industrial Development Project (Tax Revenue, AGM Insured) | | | 5.00 | | | | 7-15-2022 | | | | 365,000 | | | | 422,604 | |
Irwindale CA CDA City Industrial Development Project (Tax Revenue, AGM Insured) | | | 5.00 | | | | 7-15-2023 | | | | 375,000 | | | | 441,788 | |
Jurupa CA PFA Series A (Tax Revenue) | | | 5.00 | | | | 9-1-2020 | | | | 550,000 | | | | 607,184 | |
La Habra CA School District Refunding Bond (GO Revenue) | | | 5.00 | | | | 8-1-2019 | | | | 950,000 | | | | 1,035,785 | |
La Habra CA School District Refunding Bond (GO Revenue) | | | 5.00 | | | | 8-1-2020 | | | | 1,045,000 | | | | 1,164,903 | |
La Habra CA School District Refunding Bond (GO Revenue) | | | 5.00 | | | | 8-1-2021 | | | | 805,000 | | | | 915,100 | |
The accompanying notes are an integral part of these financial statements.
| | | | | | |
| Portfolio of investments—December 31, 2016 (unaudited) | | Wells Fargo California Limited-Term Tax-Free Fund | | | 13 | |
| | | | | | | | | | | | | | | | |
| Security name | | Interest rate | | | Maturity date | | | Principal | | | Value | |
| | | | |
| California (continued) | | | | | | | | | | | | | | | | |
La Quinta CA Redevelopment Agency Project Areas #1 & 2 Series A (Tax Revenue) | | | 5.00 | % | | | 9-1-2019 | | | $ | 1,150,000 | | | $ | 1,247,635 | |
La Quinta CA Redevelopment Agency Project Areas #1 & 2 Series A (Tax Revenue) | | | 5.00 | | | | 9-1-2020 | | | | 1,045,000 | | | | 1,156,512 | |
La Quinta CA Redevelopment Agency Project Areas #1 & 2 Series A (Tax Revenue) | | | 5.00 | | | | 9-1-2021 | | | | 565,000 | | | | 638,467 | |
La Quinta CA Redevelopment Agency Project Areas #1 & 2 Series A (Tax Revenue) | | | 5.00 | | | | 9-1-2022 | | | | 615,000 | | | | 703,708 | |
Lee Lake CA Public Financing Authority Senior Lien Series A (Tax Revenue) | | | 4.00 | | | | 9-1-2017 | | | | 1,620,000 | | | | 1,645,855 | |
Los Angeles CA Convention & Exhibit Center Authority Series A (Miscellaneous Revenue) | | | 5.00 | | | | 8-15-2020 | | | | 2,000,000 | | | | 2,122,680 | |
Los Angeles CA Public Works Series D (Miscellaneous Revenue) | | | 5.00 | | | | 12-1-2027 | | | | 1,605,000 | | | | 1,940,268 | |
Los Angeles CA Unified School District Certificate of Participation Headquarters Building Projects Series B (Miscellaneous Revenue) | | | 5.00 | | | | 10-1-2025 | | | | 1,875,000 | | | | 2,128,950 | |
Los Angeles CA Unified School District Refunding Bond Series D (GO Revenue) | | | 5.00 | | | | 7-1-2023 | | | | 6,180,000 | | | | 7,286,838 | |
Los Angeles County CA Certificate of Participation CAB Disney Package Project (Miscellaneous Revenue) ¤ | | | 0.00 | | | | 3-1-2017 | | | | 675,000 | | | | 673,873 | |
Los Angeles County CA Community Facilities District #5 Rowland Heights Area (Tax Revenue, AGM Insured) | | | 5.00 | | | | 9-1-2019 | | | | 475,000 | | | | 478,069 | |
Los Angeles County CA Public Works Multiple Capital Projects II (Miscellaneous Revenue) | | | 5.00 | | | | 8-1-2020 | | | | 500,000 | | | | 555,955 | |
Los Angeles County CA Redevelopment Refunding Authority Hollywood Redevelopment Project (Tax Revenue) | | | 5.00 | | | | 7-1-2019 | | | | 1,780,000 | | | | 1,927,437 | |
Los Angeles County CA Redevelopment Refunding Authority Series D (Tax Revenue) | | | 5.00 | | | | 9-1-2018 | | | | 2,570,000 | | | | 2,716,798 | |
Los Angeles County CA Redevelopment Refunding Authority Series D (Tax Revenue) | | | 5.00 | | | | 9-1-2019 | | | | 2,545,000 | | | | 2,752,061 | |
Los Angeles County CA Regional MonteCedro Incorporated Project Series B1 (Health Revenue) | | | 3.00 | | | | 11-15-2021 | | | | 1,045,000 | | | | 1,046,306 | |
Los Angeles County CA Schools Regionalized Business Services Corporation Series A (Miscellaneous Revenue, AGM Insured) | | | 3.00 | | | | 9-1-2017 | | | | 595,000 | | | | 602,110 | |
Los Angeles County CA Schools Regionalized Business Services Corporation Series B (Miscellaneous Revenue, National Insured) | | | 5.00 | | | | 6-1-2017 | | | | 1,010,000 | | | | 1,025,928 | |
Lynwood CA Unified School District BAN Series A (GO Revenue) | | | 5.00 | | | | 8-1-2017 | | | | 3,000,000 | | | | 3,068,790 | |
Mendocino County CA Certificate of Participation Series A (Miscellaneous Revenue, AGM Insured) | | | 3.25 | | | | 6-1-2018 | | | | 1,115,000 | | | | 1,143,934 | |
Mendocino County CA Certificate of Participation Series A (Miscellaneous Revenue, AGM Insured) | | | 3.00 | | | | 6-1-2017 | | | | 1,085,000 | | | | 1,093,409 | |
Menifee CA Union School District Public Series A (Tax Revenue) | | | 4.00 | | | | 9-1-2022 | | | | 540,000 | | | | 574,609 | |
Merced CA Union High School CAB Series A (GO Revenue, National Insured) ¤ | | | 0.00 | | | | 8-1-2019 | | | | 2,190,000 | | | | 2,087,158 | |
Modesto CA Community Facilities District #2004-1 Village One #2 (Tax Revenue) | | | 4.00 | | | | 9-1-2018 | | | | 595,000 | | | | 616,182 | |
Modesto CA Community Facilities District #2004-1 Village One #2 (Tax Revenue) | | | 4.50 | | | | 9-1-2019 | | | | 605,000 | | | | 642,800 | |
Modesto CA Irrigation District Electric Refunding Bond Series A (Utilities Revenue) | | | 5.00 | | | | 7-1-2020 | | | | 500,000 | | | | 554,440 | |
Monrovia CA RDA Subordinated Central Project #1 (Tax Revenue) | | | 4.00 | | | | 8-1-2017 | | | | 755,000 | | | | 768,213 | |
Monrovia CA RDA Subordinated Central Project #1 (Tax Revenue) | | | 4.00 | | | | 8-1-2018 | | | | 785,000 | | | | 817,421 | |
Monrovia CA RDA Subordinated Central Project #1 (Tax Revenue) | | | 4.00 | | | | 8-1-2019 | | | | 815,000 | | | | 864,169 | |
Montclair CA PFA Public Facilities Projects (Miscellaneous Revenue, AGM Insured) | | | 4.00 | | | | 10-1-2017 | | | | 500,000 | | | | 510,375 | |
Murrieta CA PFA (Tax Revenue) | | | 5.00 | | | | 9-1-2017 | | | | 870,000 | | | | 889,653 | |
Natomas CA Unified School District (GO Revenue, AGM Insured) | | | 3.00 | | | | 9-1-2017 | | | | 955,000 | | | | 967,291 | |
Natomas CA Unified School District (GO Revenue, AGM Insured) | | | 3.00 | | | | 9-1-2018 | | | | 1,025,000 | | | | 1,052,521 | |
Natomas CA Unified School District (GO Revenue, AGM Insured) | | | 3.00 | | | | 9-1-2019 | | | | 1,000,000 | | | | 1,035,880 | |
Newhall CA School District BAN School Facilities Improvement (GO Revenue) ¤ | | | 0.00 | | | | 8-1-2017 | | | | 9,000,000 | | | | 8,946,900 | |
Newhall CA School District CAB BAN (Miscellaneous Revenue) ¤ | | | 0.00 | | | | 8-1-2018 | | | | 14,680,000 | | | | 14,383,170 | |
North City CA West School Facilities Financing Authority Series C (Tax Revenue, Ambac Insured) | | | 5.00 | | | | 9-1-2018 | | | | 1,125,000 | | | | 1,190,543 | |
Norwalk CA Community Facilities Financing Series A (Miscellaneous Revenue, AGM Insured) | | | 4.00 | | | | 6-1-2019 | | | | 280,000 | | | | 295,448 | |
The accompanying notes are an integral part of these financial statements.
| | | | |
| 14 | | Wells Fargo California Limited-Term Tax-Free Fund | | Portfolio of investments—December 31, 2016 (unaudited) |
| | | | | | | | | | | | | | | | |
| Security name | | Interest rate | | | Maturity date | | | Principal | | | Value | |
| | | | |
| California (continued) | | | | | | | | | | | | | | | | |
Norwalk CA Community Facilities Financing Series A (Miscellaneous Revenue, AGM Insured) | | | 4.00 | % | | | 6-1-2020 | | | $ | 350,000 | | | $ | 373,916 | |
Norwalk CA Community Facilities Financing Series B (Miscellaneous Revenue, AGM Insured) | | | 4.00 | | | | 6-1-2018 | | | | 610,000 | | | | 632,235 | |
Norwalk CA Community Facilities Financing Series B (Miscellaneous Revenue, AGM Insured) | | | 4.00 | | | | 6-1-2019 | | | | 625,000 | | | | 659,481 | |
Norwalk CA Community Facilities Financing Series B (Miscellaneous Revenue, AGM Insured) | | | 4.00 | | | | 6-1-2020 | | | | 650,000 | | | | 694,415 | |
Oak Valley CA Hospital District Refunding (GO Revenue) | | | 4.00 | | | | 7-1-2020 | | | | 500,000 | | | | 534,540 | |
Oak Valley CA Hospital District Refunding (GO Revenue) | | | 5.00 | | | | 7-1-2021 | | | | 950,000 | | | | 1,066,470 | |
Oak Valley CA Hospital District Refunding (GO Revenue) | | | 5.00 | | | | 7-1-2022 | | | | 750,000 | | | | 855,158 | |
Oak Valley CA Hospital District Refunding (GO Revenue) | | | 5.00 | | | | 7-1-2023 | | | | 755,000 | | | | 872,554 | |
Oakland CA Joint Powers Financing Authority Series A1 (Miscellaneous Revenue, AGC Insured) | | | 5.25 | | | | 1-1-2017 | | | | 1,885,000 | | | | 1,885,226 | |
Oakland CA Successor Agency Refunding Sub Lien Central District Redevelopment Project (Tax Revenue) | | | 4.00 | | | | 9-1-2018 | | | | 3,215,000 | | | | 3,345,851 | |
Oakland CA Unified School District Alameda County Election of 2012 (GO Revenue) | | | 5.00 | | | | 8-1-2017 | | | | 2,250,000 | | | | 2,302,605 | |
Oakland CA Unified School District Alameda County Election of 2012 Series A (GO Revenue) | | | 5.00 | | | | 8-1-2022 | | | | 750,000 | | | | 861,578 | |
Oakland CA Unified School District Alameda County Election of 2012 Series A (GO Revenue) | | | 5.00 | | | | 8-1-2024 | | | | 600,000 | | | | 707,670 | |
Orange County CA Community Facilities #2015-1 Esencia Village Series A (Tax Revenue) | | | 5.00 | | | | 8-15-2023 | | | | 375,000 | | | | 423,424 | |
Orange County CA Community Facilities #2015-1 Esencia Village Series A (Tax Revenue) | | | 5.00 | | | | 8-15-2025 | | | | 335,000 | | | | 377,347 | |
Orange County CA Development Agency Santa Ana Heights Project (Tax Revenue) | | | 5.00 | | | | 9-1-2018 | | | | 200,000 | | | | 211,766 | |
Orange County CA Development Agency Santa Ana Heights Project (Tax Revenue) | | | 5.00 | | | | 9-1-2019 | | | | 1,085,000 | | | | 1,178,115 | |
Orange County CA Development Agency Santa Ana Heights Project (Tax Revenue) | | | 5.00 | | | | 3-1-2020 | | | | 1,110,000 | | | | 1,213,785 | |
Orange County CA Development Agency Santa Ana Heights Project (Tax Revenue) | | | 5.00 | | | | 9-1-2020 | | | | 1,140,000 | | | | 1,258,526 | |
Orange Cove CA Irrigation District (Water & Sewer Revenue) | | | 3.15 | | | | 2-1-2019 | | | | 660,000 | | | | 661,102 | |
Oxnard CA Financing Authority Refunding Bond (Water & Sewer Revenue, AGM Insured) | | | 5.00 | | | | 6-1-2021 | | | | 735,000 | | | | 828,308 | |
Oxnard CA Harbor District Series A (Airport Revenue) | | | 5.00 | | | | 8-1-2018 | | | | 2,275,000 | | | | 2,387,249 | |
Palm Springs CA Financing Authority Convention Center Project Series A (Miscellaneous Revenue) | | | 3.00 | | | | 11-1-2017 | | | | 1,280,000 | | | | 1,298,662 | |
Palo Alto CA Improvement Bond Act of 1915 University Area Off-Street Parking Assessment District (Miscellaneous Revenue) | | | 3.00 | | | | 9-2-2018 | | | | 415,000 | | | | 422,462 | |
Palo Alto CA Improvement Bond Act of 1915 University Area Off-Street Parking Assessment District (Miscellaneous Revenue) | | | 4.00 | | | | 9-2-2021 | | | | 450,000 | | | | 476,771 | |
Palo Verde CA Unified School District FlexFund Program (Education Revenue) | | | 4.80 | | | | 9-1-2027 | | | | 712,031 | | | | 739,857 | |
Palomar CA Community College District Election of 2006 Series B (GO Revenue) ¤ | | | 0.00 | | | | 8-1-2017 | | | | 880,000 | | | | 874,298 | |
Palomar Health Refunding Bond (Health Revenue) | | | 5.00 | | | | 11-1-2027 | | | | 2,005,000 | | | | 2,212,076 | |
Palomar Pomerado Health California Health System CAB (GO Revenue, National Insured) ¤ | | | 0.00 | | | | 8-1-2017 | | | | 2,000,000 | | | | 1,985,200 | |
Palos Verdes Peninsula CA Refunding Series B (GO Revenue) | | | 5.00 | | | | 11-1-2023 | | | | 740,000 | | | | 881,421 | |
Perris CA Community Facilities District Refunding #01-2 Series A (Tax Revenue) | | | 2.00 | | | | 9-1-2017 | | | | 670,000 | | | | 671,059 | |
Pioneers Memorial Healthcare District California Refunding (GO Revenue) | | | 4.00 | | | | 10-1-2017 | | | | 810,000 | | | | 824,653 | |
Pittsburg CA Successor Agency Los Medanos Community Development (Tax Revenue, AGM Insured) | | | 5.00 | | | | 8-1-2021 | | | | 1,885,000 | | | | 2,130,408 | |
Pittsburg CA Successor Agency Los Medanos Community Development (Tax Revenue, AGM Insured) | | | 5.00 | | | | 9-1-2021 | | | | 2,000,000 | | | | 2,253,120 | |
Pittsburg CA Successor Agency Los Medanos Community Development (Tax Revenue, AGM Insured) | | | 5.00 | | | | 8-1-2022 | | | | 1,305,000 | | | | 1,497,853 | |
The accompanying notes are an integral part of these financial statements.
| | | | | | |
| Portfolio of investments—December 31, 2016 (unaudited) | | Wells Fargo California Limited-Term Tax-Free Fund | | | 15 | |
| | | | | | | | | | | | | | | | |
| Security name | | Interest rate | | | Maturity date | | | Principal | | | Value | |
| | | | |
| California (continued) | | | | | | | | | | | | | | | | |
Pittsburg CA Successor Agency Los Medanos Community Development (Tax Revenue, AGM Insured) | | | 5.00 | % | | | 8-1-2023 | | | $ | 780,000 | | | $ | 907,499 | |
Pittsburg CA Successor Agency Los Medanos Community Development (Tax Revenue, AGM Insured) | | | 5.00 | | | | 9-1-2025 | | | | 3,500,000 | | | | 4,116,385 | |
Placentia CA Redevelopment Agency Project (Tax Revenue, Build America Mutual Assurance Company Insured) | | | 4.00 | | | | 8-1-2019 | | | | 580,000 | | | | 613,524 | |
Placentia CA Redevelopment Agency Project (Tax Revenue, Build America Mutual Assurance Company Insured) | | | 5.00 | | | | 8-1-2020 | | | | 600,000 | | | | 662,964 | |
Placentia Yorba Linda CA Refunding Project Series A (Miscellaneous Revenue, AGM Insured) | | | 5.00 | | | | 10-1-2026 | | | | 400,000 | | | | 464,672 | |
Pomona CA Public Financing Authority Unrefunded Balance Merfed Redevelopment - Series AH (Tax Revenue, Ambac Insured) | | | 5.25 | | | | 2-1-2018 | | | | 725,000 | | | | 727,407 | |
Pomona Valley CA Educational Joint Powers Authority Refunding Bond (Miscellaneous Revenue, Build America Mutual Assurance Company Insured) | | | 4.00 | | | | 8-1-2017 | | | | 1,635,000 | | | | 1,661,830 | |
Poway CA Unified School District PFA (Tax Revenue) | | | 3.00 | | | | 9-15-2017 | | | | 625,000 | | | | 631,119 | |
Poway CA Unified School District PFA (Tax Revenue) | | | 3.00 | | | | 9-15-2018 | | | | 755,000 | | | | 769,730 | |
Poway CA Unified School District PFA (Tax Revenue) | | | 4.00 | | | | 9-15-2020 | | | | 335,000 | | | | 354,494 | |
Poway CA Unified School District PFA (Tax Revenue, Build America Mutual Assurance Company Insured) | | | 4.00 | | | | 10-1-2020 | | | | 300,000 | | | | 321,747 | |
Poway CA Unified School District PFA (Tax Revenue, Build America Mutual Assurance Company Insured) | | | 4.00 | | | | 10-1-2021 | | | | 185,000 | | | | 200,377 | |
Poway CA Unified School District PFA Series B (Tax Revenue, Build America Mutual Assurance Company Insured) | | | 5.00 | | | | 9-1-2024 | | | | 1,115,000 | | | | 1,301,328 | |
Poway CA Unified School District PFA Series B (Tax Revenue, Build America Mutual Assurance Company Insured) | | | 5.00 | | | | 9-1-2025 | | | | 775,000 | | | | 911,485 | |
Poway CA Unified School District Special Community Facilities District #6-4S Ranch (Tax Revenue) | | | 4.00 | | | | 9-1-2017 | | | | 495,000 | | | | 502,900 | |
Poway CA Unified School District Special Community Facilities District #6-4S Ranch (Tax Revenue) | | | 4.00 | | | | 9-1-2018 | | | | 445,000 | | | | 460,842 | |
Redondo Beach CA Unified School District CAB Election of 2008 Series E (GO Revenue) ¤ | | | 0.00 | | | | 8-1-2018 | | | | 345,000 | | | | 336,606 | |
Redondo Beach CA Unified School District CAB Election of 2008 Series E (GO Revenue) ¤ | | | 0.00 | | | | 8-1-2020 | | | | 460,000 | | | | 426,264 | |
Riverside CA Community College District Election of 2004 Series D (GO Revenue) ¤ | | | 0.00 | | | | 8-1-2020 | | | | 535,000 | | | | 497,176 | |
Riverside CA PFA Local Measure Certificate of Participation Riverside Pavement Rehabilitation Project (Tax Revenue, AGM Insured) | | | 5.00 | | | | 6-1-2023 | | | | 845,000 | | | | 974,124 | |
Riverside CA Unified School District Financing Authority Superior Lien Series A (Miscellaneous Revenue) | | | 4.00 | | | | 9-1-2018 | | | | 1,735,000 | | | | 1,797,928 | |
Riverside County CA Asset Leasing Corporation County Administrative Center Refunding Project (Miscellaneous Revenue) | | | 4.00 | | | | 11-1-2017 | | | | 490,000 | | | | 501,206 | |
Riverside County CA Asset Leasing Corporation Riverside Hospital Project (Miscellaneous Revenue, National Insured) ¤ | | | 0.00 | | | | 6-1-2019 | | | | 1,000,000 | | | | 951,960 | |
Riverside County CA PFA Indian Wells Project Series A (Tax Revenue, AGM Insured) | | | 5.00 | | | | 9-1-2020 | | | | 1,610,000 | | | | 1,789,660 | |
Riverside County CA Public Financing County Facilities Projects (Miscellaneous Revenue) | | | 4.00 | | | | 5-1-2018 | | | | 810,000 | | | | 836,244 | |
Riverside County CA Public Financing County Facilities Projects (Miscellaneous Revenue) | | | 4.00 | | | | 5-1-2020 | | | | 795,000 | | | | 842,088 | |
Riverside County CA Public Financing County Facilities Projects (Miscellaneous Revenue) | | | 5.00 | | | | 5-1-2019 | | | | 840,000 | | | | 901,673 | |
Robla CA School District Series B (GO Revenue, National Insured) ¤ | | | 0.00 | | | | 8-1-2018 | | | | 320,000 | | | | 300,918 | |
Romoland CA School District Community Facilities District #2004-1 (Tax Revenue) | | | 4.00 | | | | 9-1-2019 | | | | 850,000 | | | | 892,662 | |
Roseville CA Special Tax Refunding Community Facilities District (Tax Revenue) | | | 4.00 | | | | 9-1-2019 | | | | 875,000 | | | | 916,353 | |
The accompanying notes are an integral part of these financial statements.
| | | | |
| 16 | | Wells Fargo California Limited-Term Tax-Free Fund | | Portfolio of investments—December 31, 2016 (unaudited) |
| | | | | | | | | | | | | | | | |
| Security name | | Interest rate | | | Maturity date | | | Principal | | | Value | |
| | | | |
| California (continued) | | | | | | | | | | | | | | | | |
Roseville CA Special Tax Refunding Community Facilities District (Tax Revenue) | | | 5.00 | % | | | 9-1-2020 | | | $ | 1,050,000 | | | $ | 1,144,647 | |
Roseville CA Special Tax Refunding Community Facilities District (Tax Revenue) | | | 5.00 | | | | 9-1-2021 | | | | 500,000 | | | | 552,110 | |
Sacramento CA City Financing Refunding Master Lease Program Facilities (Miscellaneous Revenue, Build America Mutual Assurance Company Insured) | | | 5.00 | | | | 12-1-2022 | | | | 800,000 | | | | 922,752 | |
Sacramento CA City Schools Joint Powers Financing Authority Series A (Miscellaneous Revenue, Build America Mutual Assurance Company Insured) | | | 5.00 | | | | 3-1-2019 | | | | 1,050,000 | | | | 1,125,506 | |
Sacramento CA City Schools Joint Powers Financing Authority Series A (Miscellaneous Revenue, Build America Mutual Assurance Company Insured) | | | 5.00 | | | | 3-1-2020 | | | | 1,185,000 | | | | 1,298,227 | |
Sacramento CA City Schools Joint Powers Financing Authority Series A (Miscellaneous Revenue, Build America Mutual Assurance Company Insured) | | | 5.00 | | | | 3-1-2021 | | | | 830,000 | | | | 925,018 | |
Sacramento CA City Schools Joint Powers Financing Authority Series A (Miscellaneous Revenue, Build America Mutual Assurance Company Insured) | | | 5.00 | | | | 3-1-2022 | | | | 775,000 | | | | 877,440 | |
Sacramento CA City Schools Joint Powers Financing Authority Series A (Miscellaneous Revenue, Build America Mutual Assurance Company Insured) | | | 5.00 | | | | 3-1-2023 | | | | 815,000 | | | | 936,427 | |
Sacramento CA Regional Transportation District Farebox (Transportation Revenue) | | | 5.00 | | | | 3-1-2019 | | | | 500,000 | | | | 534,000 | |
Salinas CA Union High School District CAB (GO Revenue) ¤ | | | 0.00 | | | | 8-1-2020 | | | | 5,000,000 | | | | 4,655,150 | |
San Bernardino County CA Certificate of Participation Arrowhead Project Series A (Miscellaneous Revenue) | | | 5.50 | | | | 8-1-2020 | | | | 1,000,000 | | | | 1,093,110 | |
San Bernardino County CA Certificate of Participation Medical Centre Financing Project (Miscellaneous Revenue, National Insured) | | | 5.50 | | | | 8-1-2017 | | | | 300,000 | | | | 307,692 | |
San Buenaventura CA Community Mental Health System (Health Revenue) | | | 6.00 | | | | 12-1-2019 | | | | 2,000,000 | | | | 2,179,900 | |
San Buenaventura CA Community Mental Health System (Health Revenue) | | | 6.50 | | | | 12-1-2021 | | | | 2,585,000 | | | | 2,973,293 | |
San Diego CA Public Facilities Financing Authority Refunding Ballpark (Miscellaneous Revenue) | | | 5.00 | | | | 10-15-2026 | | | | 500,000 | | | | 588,120 | |
San Diego CA RDA CAB Tax Allocation Center Series A (Tax Revenue, AGM Insured) ¤ | | | 0.00 | | | | 9-1-2018 | | | | 635,000 | | | | 616,109 | |
San Diego CA RDA Naval Training Center Series A (Tax Revenue) | | | 4.50 | | | | 9-1-2017 | | | | 345,000 | | | | 351,883 | |
San Francisco City & County CA RDA Successor Agency Community Facilities District #6 Series A (Tax Revenue) | | | 3.00 | | | | 8-1-2017 | | | | 205,000 | | | | 206,702 | |
San Francisco City & County CA RDA Successor Agency Community Facilities District #6 Series A (Tax Revenue) | | | 4.00 | | | | 8-1-2017 | | | | 885,000 | | | | 898,001 | |
San Francisco City & County CA RDA Successor Agency Community Facilities District #6 Series A (Tax Revenue) | | | 5.00 | | | | 8-1-2018 | | | | 500,000 | | | | 525,215 | |
San Francisco City & County CA RDA Successor Agency Community Facilities District #6 Series A (Tax Revenue) | | | 5.00 | | | | 8-1-2019 | | | | 555,000 | | | | 596,264 | |
San Francisco City & County CA RDFA Mission Bay South Redevelopment Project-Sub Series D (Tax Revenue) 144A | | | 3.00 | | | | 8-1-2021 | | | | 4,000,000 | | | | 3,982,640 | |
San Francisco City & County CA RDFA Mission Bay South Redevelopment Series A (Tax Revenue) | | | 5.00 | | | | 8-1-2020 | | | | 500,000 | | | | 553,320 | |
San Francisco City & County CA RDFA Mission Bay South Redevelopment Series A (Tax Revenue) | | | 5.00 | | | | 8-1-2022 | | | | 375,000 | | | | 428,723 | |
San Francisco City & County CA RDFA San Francisco Redevelopment Project Series B (Tax Revenue, National Insured) | | | 5.25 | | | | 8-1-2018 | | | | 1,155,000 | | | | 1,160,925 | |
San Gorgonio CA Memorial Healthcare Refunding (GO Revenue) | | | 5.00 | | | | 8-1-2021 | | | | 275,000 | | | | 308,492 | |
San Gorgonio CA Memorial Healthcare Refunding (GO Revenue) | | | 5.00 | | | | 8-1-2022 | | | | 500,000 | | | | 569,420 | |
San Gorgonio CA Memorial Healthcare Refunding (GO Revenue) | | | 5.00 | | | | 8-1-2023 | | | | 1,000,000 | | | | 1,149,620 | |
San Joaquin Hills County CA Transportation Corridor Agency Series A (Transportation Revenue) | | | 5.00 | | | | 1-15-2017 | | | | 1,500,000 | | | | 1,501,830 | |
San Jose CA Airport Series A (Airport Revenue, Ambac Insured) | | | 5.50 | | | | 3-1-2018 | | | | 4,350,000 | | | | 4,545,924 | |
San Jose CA Airport Series A (Airport Revenue, AGM/Ambac Insured) | | | 5.50 | | | | 3-1-2019 | | | | 5,220,000 | | | | 5,258,471 | |
San Jose CA Convention Center Expansion & Renovation Project (Tax Revenue) | | | 5.25 | | | | 5-1-2023 | | | | 1,465,000 | | | | 1,635,511 | |
San Jose CA Libraries & Parks Project (GO Revenue) | | | 5.00 | | | | 9-1-2017 | | | | 715,000 | | | | 717,402 | |
The accompanying notes are an integral part of these financial statements.
| | | | | | |
| Portfolio of investments—December 31, 2016 (unaudited) | | Wells Fargo California Limited-Term Tax-Free Fund | | | 17 | |
| | | | | | | | | | | | | | | | |
| Security name | | Interest rate | | | Maturity date | | | Principal | | | Value | |
| | | | |
| California (continued) | | | | | | | | | | | | | | | | |
San Jose CA Redevelopment Agency Tax Refunding Merged Area Redevelopment Project Series A (Tax Revenue, National Insured) | | | 4.54 | % | | | 8-1-2018 | | | $ | 1,035,000 | | | $ | 1,037,712 | |
San Jose CA Redevelopment Agency Tax Refunding Merged Area Redevelopment Project Series A (Tax Revenue, National Insured) | | | 5.00 | | | | 8-1-2017 | | | | 2,000,000 | | | | 2,006,400 | |
San Jose CA Redevelopment Agency Tax Refunding Merged Area Redevelopment Project Series A (Tax Revenue, National Insured) | | | 5.25 | | | | 8-1-2019 | | | | 1,125,000 | | | | 1,128,735 | |
San Jose CA Redevelopment Agency Tax Refunding Merged Area Redevelopment Project Series A-1 (Tax Revenue) | | | 5.00 | | | | 8-1-2022 | | | | 800,000 | | | | 879,240 | |
San Jose CA Redevelopment Agency Tax Refunding Merged Area Redevelopment Project Series D (Tax Revenue, Ambac Insured) | | | 5.00 | | | | 8-1-2021 | | | | 2,635,000 | | | | 2,693,023 | |
San Jose CA Union Elementary School District Series B (GO Revenue) | | | 3.00 | | | | 9-1-2017 | | | | 1,000,000 | | | | 1,013,860 | |
San Luis & Delta-Mendota CA Water Authority Delta Habitat Conservation & Conveyance Program Development Project Series A (Water & Sewer Revenue, Build America Mutual Assurance Company Insured) | | | 5.00 | | | | 3-1-2019 | | | | 100,000 | | | | 107,191 | |
San Luis & Delta-Mendota CA Water Authority Delta Habitat Conservation & Conveyance Program Development Project Series A (Water & Sewer Revenue, Build America Mutual Assurance Company Insured) | | | 5.00 | | | | 3-1-2020 | | | | 100,000 | | | | 109,555 | |
San Marcos CA PFA Series B (Tax Revenue) | | | 3.00 | | | | 9-1-2017 | | | | 455,000 | | | | 459,245 | |
San Marcos CA PFA Series B (Tax Revenue) | | | 4.00 | | | | 9-1-2018 | | | | 1,000,000 | | | | 1,036,270 | |
San Marcos CA Unified School District Community Facilities District #5 (Tax Revenue, Build America Mutual Assurance Company Insured) | | | 5.00 | | | | 9-1-2020 | | | | 220,000 | | | | 244,550 | |
San Marcos CA Unified School District Community Facilities District #5 (Tax Revenue, Build America Mutual Assurance Company Insured) | | | 5.00 | | | | 9-1-2021 | | | | 270,000 | | | | 305,583 | |
San Marcos CA Unified School District Community Facilities District #5 (Tax Revenue, Build America Mutual Assurance Company Insured) | | | 5.00 | | | | 9-1-2022 | | | | 250,000 | | | | 287,303 | |
San Mateo County CA Transportation Authority Series A (Tax Revenue, National Insured) ¤ | | | 0.00 | | | | 12-1-2018 | | | | 270,000 | | | | 260,234 | |
San Mateo Foster City CA School District (GO Revenue) | | | 5.00 | | | | 8-15-2020 | | | | 2,000,000 | | | | 2,235,740 | |
San Pablo CA Redevelopment Agency Series B (Tax Revenue, AGM Insured) | | | 5.00 | | | | 6-15-2021 | | | | 1,775,000 | | | | 2,001,685 | |
San Pablo CA Redevelopment Agency Series B (Tax Revenue, AGM Insured) | | | 5.00 | | | | 6-15-2022 | | | | 1,865,000 | | | | 2,136,432 | |
San Pablo CA Redevelopment Agency Series B (Tax Revenue, AGM Insured) | | | 5.00 | | | | 6-15-2023 | | | | 1,945,000 | | | | 2,259,195 | |
Santa Ana CA Community Redevelopment Agency Merged Project Area Series A (Tax Revenue) | | | 5.25 | | | | 9-1-2019 | | | | 1,000,000 | | | | 1,091,390 | |
Santa Ana CA Unified School District CAB Election of 2008 Series A (GO Revenue) ¤ | | | 0.00 | | | | 8-1-2020 | | | | 1,815,000 | | | | 1,684,883 | |
Santa Clara County CA Financing Authority Capital Projects Series A (Miscellaneous Revenue) | | | 4.00 | | | | 2-1-2024 | | | | 6,000,000 | | | | 6,511,320 | |
Santa Cruz County CA Capital Financing Public Facilities Project (Miscellaneous Revenue, AGM Insured) | | | 4.00 | | | | 8-1-2020 | | | | 150,000 | | | | 161,273 | |
Santa Cruz County CA Capital Financing Public Facilities Project (Miscellaneous Revenue, AGM Insured) | | | 5.00 | | | | 8-1-2021 | | | | 125,000 | | | | 141,274 | |
Santa Cruz County CA Capital Financing Public Facilities Project (Miscellaneous Revenue, AGM Insured) | | | 5.00 | | | | 8-1-2022 | | | | 165,000 | | | | 189,384 | |
Santa Cruz County CA Redevelopment Agency Live Oak Soquel Community Series A (Tax Revenue, National Insured) | | | 5.25 | | | | 9-1-2017 | | | | 495,000 | | | | 507,791 | |
Santa Cruz County CA Redevelopment Successor Agency Tax Allocation Refunding (Tax Revenue, Build America Mutual Assurance Company Insured) | | | 5.00 | | | | 9-1-2019 | | | | 625,000 | | | | 679,775 | |
Santa Cruz County CA Redevelopment Successor Agency Tax Allocation Refunding (Tax Revenue, Build America Mutual Assurance Company Insured) | | | 5.00 | | | | 9-1-2020 | | | | 1,000,000 | | | | 1,112,340 | |
Santa Fe Springs CA Community Development Commission Consolidated Redevelopment Project Series A (Tax Revenue, National Insured) | | | 5.00 | | | | 9-1-2017 | | | | 750,000 | | | | 768,930 | |
Sierra Kings CA Health Care Refunding (GO Revenue) | | | 4.00 | | | | 8-1-2017 | | | | 220,000 | | | | 223,368 | |
Sierra Kings CA Health Care Refunding (GO Revenue) | | | 4.00 | | | | 8-1-2018 | | | | 230,000 | | | | 238,344 | |
The accompanying notes are an integral part of these financial statements.
| | | | |
| 18 | | Wells Fargo California Limited-Term Tax-Free Fund | | Portfolio of investments—December 31, 2016 (unaudited) |
| | | | | | | | | | | | | | | | |
| Security name | | Interest rate | | | Maturity date | | | Principal | | | Value | |
| | | | |
| California (continued) | | | | | | | | | | | | | | | | |
Sierra Kings CA Health Care Refunding (GO Revenue) | | | 4.00 | % | | | 8-1-2019 | | | $ | 225,000 | | | $ | 236,408 | |
Sierra Kings CA Health Care Refunding (GO Revenue) | | | 4.00 | | | | 8-1-2021 | | | | 345,000 | | | | 368,312 | |
Sierra Kings CA Health Care Refunding (GO Revenue) | | | 4.00 | | | | 8-1-2022 | | | | 425,000 | | | | 456,335 | |
Sierra Kings CA Health Care Refunding (GO Revenue) | | | 4.00 | | | | 8-1-2023 | | | | 405,000 | | | | 435,051 | |
Sierra Kings CA Health Care Refunding (GO Revenue) | | | 4.00 | | | | 8-1-2024 | | | | 420,000 | | | | 451,891 | |
Simi Valley CA Unified School District Refunding and Capital Improvement Project (Miscellaneous Revenue, Ambac Insured) | | | 5.25 | | | | 8-1-2017 | | | | 200,000 | | | | 204,162 | |
Solana Beach CA School District Special Tax PFA (Tax Revenue) | | | 4.00 | | | | 9-1-2018 | | | | 330,000 | | | | 341,969 | |
Solana Beach CA School District Special Tax PFA (Tax Revenue) | | | 4.00 | | | | 9-1-2019 | | | | 735,000 | | | | 772,213 | |
South Monterey County CA Joint Union High School District (GO Revenue) | | | 3.00 | | | | 8-1-2017 | | | | 1,485,000 | | | | 1,499,197 | |
South San Francisco CA Unified School District BAN Series D (GO Revenue) ¤ | | | 0.00 | | | | 5-15-2017 | | | | 3,000,000 | | | | 2,988,900 | |
South Western CA Community College District Refunding (GO Revenue) | | | 5.00 | | | | 8-1-2020 | | | | 1,250,000 | | | | 1,394,813 | |
South Western CA Community College District Refunding (GO Revenue) | | | 5.00 | | | | 8-1-2021 | | | | 2,710,000 | | | | 3,083,194 | |
Southern CA Mono Healthcare District (GO Revenue) | | | 3.00 | | | | 8-1-2017 | | | | 300,000 | | | | 302,091 | |
Southern CA Mono Healthcare District (GO Revenue) | | | 4.00 | | | | 8-1-2019 | | | | 845,000 | | | | 881,969 | |
Southern CA Public Power Authority Refunding Bond Canyon Power Project Series A (Utilities Revenue) | | | 5.00 | | | | 7-1-2026 | | | | 1,000,000 | | | | 1,126,740 | |
Southern CA Public Power Authority Refunding Bond Canyon Power Project Series A (Utilities Revenue) | | | 5.00 | | | | 7-1-2027 | | | | 1,000,000 | | | | 1,123,530 | |
Stanton CA Redevelopment Agency Consolidated Project Series A (Tax Revenue, AGM Insured) | | | 4.00 | | | | 12-1-2017 | | | | 400,000 | | | | 409,984 | |
Stanton CA Redevelopment Agency Consolidated Project Series A (Tax Revenue, AGM Insured) | | | 4.00 | | | | 12-1-2018 | | | | 410,000 | | | | 429,291 | |
Successor Agency to the Morgan Hill CA Redevelopment Agency Series A (Tax Revenue) | | | 5.00 | | | | 9-1-2021 | | | | 1,055,000 | | | | 1,197,562 | |
Successor Agency to the Rancho Mirage CA Redevelopment Agency Refunding Sub Lien Series A (Tax Revenue, Build America Mutual Assurance Company Insured) | | | 4.00 | | | | 4-1-2017 | | | | 460,000 | | | | 463,349 | |
Successor Agency to the Rancho Mirage CA Redevelopment Agency Refunding Sub Lien Series A (Tax Revenue, Build America Mutual Assurance Company Insured) | | | 5.00 | | | | 4-1-2018 | | | | 400,000 | | | | 418,068 | |
Successor Agency to the Rancho Mirage CA Redevelopment Agency Refunding Sub Lien Series A (Tax Revenue, Build America Mutual Assurance Company Insured) | | | 5.00 | | | | 4-1-2019 | | | | 580,000 | | | | 623,053 | |
Successor Agency to the Rancho Mirage CA Redevelopment Agency Series A (Tax Revenue, Build America Mutual Assurance Company Insured) | | | 4.00 | | | | 4-1-2018 | | | | 750,000 | | | | 774,600 | |
Successor Agency to the Rancho Mirage CA Redevelopment Agency Series A (Tax Revenue, Build America Mutual Assurance Company Insured) | | | 5.00 | | | | 4-1-2018 | | | | 550,000 | | | | 574,844 | |
Successor Agency to the Rancho Mirage CA Redevelopment Agency Series A (Tax Revenue, Build America Mutual Assurance Company Insured) | | | 5.00 | | | | 4-1-2019 | | | | 850,000 | | | | 913,096 | |
Successor Agency to the Rancho Mirage CA Redevelopment Agency Series A (Tax Revenue, Build America Mutual Assurance Company Insured) | | | 5.00 | | | | 4-1-2019 | | | | 600,000 | | | | 644,538 | |
Successor Agency to the Richmond CA Community Redevelopment Agency Series A (Tax Revenue, Build America Mutual Assurance Company Insured) | | | 4.50 | | | | 9-1-2025 | | | | 160,000 | | | | 179,746 | |
Successor Agency to the Richmond CA Community Redevelopment Agency Series A (Tax Revenue, Build America Mutual Assurance Company Insured) | | | 5.00 | | | | 9-1-2021 | | | | 310,000 | | | | 349,234 | |
Successor Agency to the Richmond CA Community Redevelopment Agency Series A (Tax Revenue, Build America Mutual Assurance Company Insured) | | | 5.00 | | | | 9-1-2022 | | | | 300,000 | | | | 343,272 | |
Successor Agency to the Richmond CA Community Redevelopment Agency Series A (Tax Revenue, Build America Mutual Assurance Company Insured) | | | 5.00 | | | | 9-1-2023 | | | | 265,000 | | | | 306,454 | |
Successor Agency to the Richmond CA Community Redevelopment Agency Series A (Tax Revenue, Build America Mutual Assurance Company Insured) | | | 5.00 | | | | 9-1-2025 | | | | 150,000 | | | | 173,787 | |
Successor Agency to the Riverside County CA Redevelopment Agency Desert Communities Project Area Series D (Tax Revenue) | | | 5.00 | | | | 10-1-2020 | | | | 405,000 | | | | 449,554 | |
The accompanying notes are an integral part of these financial statements.
| | | | | | |
| Portfolio of investments—December 31, 2016 (unaudited) | | Wells Fargo California Limited-Term Tax-Free Fund | | | 19 | |
| | | | | | | | | | | | | | | | |
| Security name | | Interest rate | | | Maturity date | | | Principal | | | Value | |
| | | | |
| California (continued) | | | | | | | | | | | | | | | | |
Successor Agency to the Riverside County CA Redevelopment Agency Desert Communities Project Area Series D (Tax Revenue) | | | 5.00 | % | | | 10-1-2022 | | | $ | 445,000 | | | $ | 509,187 | |
Successor Agency to the Riverside County CA Redevelopment Agency Desert Communities Project Area Series D (Tax Revenue) | | | 5.00 | | | | 10-1-2023 | | | | 470,000 | | | | 544,157 | |
Successor Agency to the Riverside County CA Redevelopment Agency Project Area #1 Series A (Tax Revenue) | | | 5.00 | | | | 10-1-2020 | | | | 365,000 | | | | 405,154 | |
Successor Agency to the Riverside County CA Redevelopment Agency Project Area #1 Series A (Tax Revenue) | | | 5.00 | | | | 10-1-2022 | | | | 240,000 | | | | 274,618 | |
Successor Agency to the Riverside County CA Redevelopment Agency Project Area #1 Series A (Tax Revenue) | | | 5.00 | | | | 10-1-2023 | | | | 460,000 | | | | 532,579 | |
Sulphur Springs CA Union School CAB Anticipation Notes Series A (Miscellaneous Revenue) ¤ | | | 0.00 | | | | 1-1-2018 | | | | 2,750,000 | | | | 2,716,945 | |
Sulphur Springs CA Union School District Prerefunded Community Facilities District #2002-1 Series A (Tax Revenue) | | | 3.00 | | | | 9-1-2017 | | | | 150,000 | | | | 152,087 | |
Sulphur Springs CA Union School District Prerefunded Community Facilities District #2002-1 Series A (Tax Revenue) | | | 3.00 | | | | 9-1-2018 | | | | 275,000 | | | | 283,231 | |
Sulphur Springs CA Union School District Prerefunded Community Facilities District #2002-1 Series A (Tax Revenue) | | | 3.00 | | | | 9-1-2019 | | | | 295,000 | | | | 307,030 | |
Sulphur Springs CA Union School District Unrefunded Community Facilities District #2002-1 Series A (Tax Revenue) | | | 3.00 | | | | 9-1-2017 | | | | 150,000 | | | | 151,400 | |
Sulphur Springs CA Union School District Unrefunded Community Facilities District #2002-1 Series A (Tax Revenue) | | | 3.00 | | | | 9-1-2018 | | | | 280,000 | | | | 285,384 | |
Sulphur Springs CA Union School District Unrefunded Community Facilities District #2002-1 Series A (Tax Revenue) | | | 3.00 | | | | 9-1-2019 | | | | 300,000 | | | | 307,119 | |
Sutter Butte CA Flood Agency Assessment (Miscellaneous Revenue, Build America Mutual Assurance Company Insured) | | | 5.00 | | | | 10-1-2023 | | | | 1,280,000 | | | | 1,492,352 | |
Sutter Butte CA Flood Agency Assessment (Miscellaneous Revenue, Build America Mutual Assurance Company Insured) | | | 5.00 | | | | 10-1-2024 | | | | 715,000 | | | | 842,306 | |
Sutter Butte CA Flood Agency Assessment (Miscellaneous Revenue, Build America Mutual Assurance Company Insured) | | | 5.00 | | | | 10-1-2025 | | | | 1,575,000 | | | | 1,870,171 | |
Sweetwater CA Union High School District Public Financing Authority Refunding Bond (Miscellaneous Revenue, Build America Mutual Assurance Company Insured) | | | 5.00 | | | | 9-1-2018 | | | | 2,500,000 | | | | 2,645,650 | |
Sweetwater CA Union High School District Public Financing Authority Refunding Bond (Miscellaneous Revenue, Build America Mutual Assurance Company Insured) | | | 5.00 | | | | 9-1-2019 | | | | 1,000,000 | | | | 1,084,900 | |
Sweetwater CA Union High School District Refunding Bond (GO Revenue, Build America Mutual Assurance Company Insured) | | | 5.00 | | | | 8-1-2021 | | | | 620,000 | | | | 701,003 | |
Temecula CA PFA Crown Hill Community Facilities District #3-1 (Tax Revenue) | | | 3.00 | | | | 9-1-2017 | | | | 395,000 | | | | 398,950 | |
Temecula CA PFA Crown Hill Community Facilities District #3-1 (Tax Revenue) | | | 3.00 | | | | 9-1-2018 | | | | 405,000 | | | | 413,598 | |
Temecula CA PFA Wolf Creek Community Facilities District #3-3 (Tax Revenue) | | | 3.00 | | | | 9-1-2018 | | | | 870,000 | | | | 886,043 | |
Temecula Valley CA Unified School District Community Facilities District #89-1 (Tax Revenue) | | | 3.00 | | | | 9-1-2017 | | | | 1,250,000 | | | | 1,262,025 | |
Torrance CA RDA Referendum Senior Lien Series C (Tax Revenue, National Insured) | | | 5.45 | | | | 9-1-2018 | | | | 575,000 | | | | 576,794 | |
Tracy CA Community Development Agency Refunding (Tax Revenue, AGM Insured) | | | 5.00 | | | | 8-1-2024 | | | | 400,000 | | | | 469,484 | |
Tracy CA Community Development Agency Refunding (Tax Revenue, AGM Insured) | | | 5.00 | | | | 8-1-2026 | | | | 750,000 | | | | 880,613 | |
Tracy CA Community Development Agency Refunding (Tax Revenue, AGM Insured) | | | 5.00 | | | | 8-1-2027 | | | | 1,000,000 | | | | 1,164,430 | |
Tustin CA Community Facilities District #6-1 Legacy Columbus Villages Series A (Tax Revenue) | | | 5.00 | | | | 9-1-2025 | | | | 1,000,000 | | | | 1,146,970 | |
Twin Rivers CA Unified School District Series A (GO Revenue, Build America Mutual Assurance Company Insured) | | | 4.00 | | | | 8-1-2019 | | | | 385,000 | | | | 408,108 | |
Twin Rivers CA Unified School District Series A (GO Revenue, Build America Mutual Assurance Company Insured) | | | 5.00 | | | | 8-1-2020 | | | | 510,000 | | | | 565,947 | |
University of California Series AK (Education Revenue) ± | | | 5.00 | | | | 5-15-2048 | | | | 10,000,000 | | | | 11,741,000 | |
The accompanying notes are an integral part of these financial statements.
| | | | |
| 20 | | Wells Fargo California Limited-Term Tax-Free Fund | | Portfolio of investments—December 31, 2016 (unaudited) |
| | | | | | | | | | | | | | | | |
| Security name | | Interest rate | | | Maturity date | | | Principal | | | Value | |
| | | | |
| California (continued) | | | | | | | | | | | | | | | | |
Upland CA Successor Agency Merged Project Tax Allocation (Tax Revenue, AGM Insured) | | | 5.00 | % | | | 9-1-2023 | | | $ | 1,000,000 | | | $ | 1,156,430 | |
Vacaville CA Redevelopment Agency Tax Allocation Refunding Sub Redevelopment Projects (Tax Revenue) | | | 5.00 | | | | 9-1-2020 | | | | 600,000 | | | | 664,026 | |
Vacaville CA Redevelopment Agency Tax Allocation Refunding Sub Redevelopment Projects (Tax Revenue) | | | 5.00 | | | | 9-1-2021 | | | | 600,000 | | | | 675,936 | |
Vacaville CA Redevelopment Agency Tax Allocation Refunding Sub Redevelopment Projects (Tax Revenue) | | | 5.00 | | | | 9-1-2022 | | | | 1,050,000 | | | | 1,201,452 | |
Vacaville CA Unified School District Series C (GO Revenue, Build America Mutual Assurance Company Insured) | | | 5.00 | | | | 8-1-2022 | | | | 675,000 | | | | 781,198 | |
Val Verde CA Unified School District (Tax Revenue, Build America Mutual Assurance Company Insured) | | | 4.00 | | | | 10-1-2020 | | | | 350,000 | | | | 375,372 | |
Val Verde CA Unified School District (Tax Revenue, Build America Mutual Assurance Company Insured) | | | 4.00 | | | | 10-1-2021 | | | | 375,000 | | | | 406,170 | |
Val Verde CA Unified School District (Tax Revenue, Build America Mutual Assurance Company Insured) | | | 5.00 | | | | 10-1-2022 | | | | 665,000 | | | | 761,884 | |
Vallejo CA Refunding Bond (Water & Sewer Revenue, National Insured) | | | 5.00 | | | | 5-1-2019 | | | | 790,000 | | | | 792,054 | |
Vallejo CA Refunding Bond (Water & Sewer Revenue, National Insured) | | | 5.00 | | | | 5-1-2021 | | | | 1,500,000 | | | | 1,502,940 | |
Vallejo CA Unified School District Series A (GO Revenue, National Insured) | | | 5.90 | | | | 2-1-2018 | | | | 2,065,000 | | | | 2,162,964 | |
Ventura County CA Public Financing Authority Series B (Miscellaneous Revenue) | | | 5.00 | | | | 11-1-2019 | | | | 375,000 | | | | 410,089 | |
Ventura County CA Public Financing Authority Series B (Miscellaneous Revenue) | | | 5.00 | | | | 11-1-2020 | | | | 250,000 | | | | 279,548 | |
Visalia CA Certificate of Participation (Miscellaneous Revenue, AGM Insured) | | | 4.00 | | | | 12-1-2020 | | | | 250,000 | | | | 269,883 | |
Visalia CA Certificate of Participation (Miscellaneous Revenue, AGM Insured) | | | 4.00 | | | | 12-1-2021 | | | | 250,000 | | | | 272,493 | |
Visalia CA Certificate of Participation (Miscellaneous Revenue, AGM Insured) | | | 5.00 | | | | 12-1-2022 | | | | 335,000 | | | | 386,402 | |
Walnut CA Energy Center Authority Refunding Series A (Utilities Revenue) | | | 5.00 | | | | 1-1-2021 | | | | 500,000 | | | | 561,525 | |
Walnut CA Improvement Agency Refunding Walnut Improvement Project (Tax Revenue, Build America Mutual Assurance Company Insured) | | | 4.00 | | | | 3-1-2017 | | | | 850,000 | | | | 854,182 | |
Washington Township CA Health Care District Series A (Health Revenue) | | | 5.00 | | | | 7-1-2017 | | | | 1,125,000 | | | | 1,145,509 | |
Washington Township CA Health Refunding Series A (Health Revenue) | | | 5.00 | | | | 7-1-2023 | | | | 600,000 | | | | 672,684 | |
West Covina CA Unified School District (GO Revenue, AGM Insured) | | | 4.00 | | | | 8-1-2017 | | | | 325,000 | | | | 330,590 | |
West Covina CA Unified School District (GO Revenue, AGM Insured) | | | 4.00 | | | | 8-1-2018 | | | | 575,000 | | | | 598,840 | |
West Sacramento CA Flood Control Agency (Miscellaneous Revenue) | | | 2.25 | | | | 9-1-2017 | | | | 270,000 | | | | 271,882 | |
West Sacramento CA Flood Control Agency (Miscellaneous Revenue) | | | 2.50 | | | | 9-1-2018 | | | | 275,000 | | | | 279,725 | |
West Sacramento CA Flood Control Agency (Miscellaneous Revenue) | | | 2.75 | | | | 9-1-2019 | | | | 285,000 | | | | 292,541 | |
West Sacramento CA Flood Control Agency (Miscellaneous Revenue) | | | 5.00 | | | | 9-1-2020 | | | | 290,000 | | | | 320,946 | |
Western Riverside County CA Regional Wastewater Authority Series A-1 (Tax Revenue) | | | 4.00 | | | | 9-1-2017 | | | | 570,000 | | | | 579,097 | |
Western Riverside County CA Regional Wastewater Authority Series A-1 (Tax Revenue) | | | 4.00 | | | | 9-1-2019 | | | | 1,830,000 | | | | 1,920,713 | |
Windsor CA Redevelopment Successor Agency Windsor Redevelopment Project (Tax Revenue, Build America Mutual Assurance Company Insured) | | | 3.00 | | | | 9-1-2017 | | | | 615,000 | | | | 622,239 | |
Yuba City CA Redevelopment Agency Refunding (Tax Revenue, AGM Insured) | | | 5.00 | | | | 9-1-2025 | | | | 750,000 | | | | 889,943 | |
| | | | |
| | | | | | | | | | | | | | | 636,441,449 | |
| | | | | | | | | | | | | | | | |
| | | | |
| Guam: 0.67% | | | | | | | | | | | | | | | | |
Guam Government Limited Refinancing Section 30 Series A (Tax Revenue) | | | 5.00 | | | | 12-1-2027 | | | | 2,000,000 | | | | 2,298,960 | |
Guam Government Waterworks Authority (Water & Sewer Revenue) | | | 5.00 | | | | 7-1-2022 | | | | 400,000 | | | | 441,484 | |
Guam Power Authority Series A (Utilities Revenue, AGM Insured) | | | 5.00 | | | | 10-1-2019 | | | | 1,640,000 | | | | 1,766,034 | |
| | | | |
| | | | | | | | | | | | | | | 4,506,478 | |
| | | | | | | | | | | | | | | | |
| | | | |
| New York: 0.37% | | | | | | | | | | | | | | | | |
New York NY HFA 605 West 42nd Street Series A (Housing Revenue, Bank of China LOC) ø | | | 0.90 | | | | 5-1-2048 | | | | 2,500,000 | | | | 2,500,000 | |
| | | | | | | | | | | | | | | | |
The accompanying notes are an integral part of these financial statements.
| | | | | | |
| Portfolio of investments—December 31, 2016 (unaudited) | | Wells Fargo California Limited-Term Tax-Free Fund | | | 21 | |
| | | | | | | | | | | | | | | | |
| Security name | | Interest rate | | | Maturity date | | | Principal | | | Value | |
| | | | |
| Puerto Rico: 0.66% | | | | | | | | | | | | | | | | |
Puerto Rico HFA Subordinated Capital Fund Modernization Program Refunding Bond (Housing Revenue, HUD Insured) | | | 5.50 | % | | | 12-1-2017 | | | $ | 2,045,000 | | | $ | 2,114,326 | |
Puerto Rico HFA Subordinated Capital Fund Modernization Program Refunding Bond (Housing Revenue, HUD Insured) | | | 5.50 | | | | 12-1-2018 | | | | 1,250,000 | | | | 1,336,363 | |
Puerto Rico HFA Unrefunded Balance Capital Funding Program (Housing Revenue) | | | 5.00 | | | | 12-1-2019 | | | | 1,000,000 | | | | 1,041,340 | |
| | | | |
| | | | | | | | | | | | | | | 4,492,029 | |
| | | | | | | | | | | | | | | | |
| | | | |
| Texas: 1.18% | | | | | | | | | | | | | | | | |
Port Arthur TX Navigation District Jefferson County Environmental Facilities Motiva Enterprises LLC Project Series A (Resource Recovery Revenue) ø | | | 0.85 | | | | 12-1-2039 | | | | 8,000,000 | | | | 8,000,000 | |
| | | | | | | | | | | | | | | | |
| | | | |
| Virgin Islands: 0.13% | | | | | | | | | | | | | | | | |
Virgin Islands PFA Matching Fund Loan Note Senior Lien Series A (Tobacco Revenue) | | | 5.00 | | | | 10-1-2025 | | | | 1,000,000 | | | | 849,560 | |
| | | | | | | | | | | | | | | | |
| | | | |
Total Municipal Obligations (Cost $648,696,243) | | | | | | | | | | | | | | | 656,789,516 | |
| | | | | | | | | | | | | | | | |
| | | | |
| | | Yield | | | | | | Shares | | | | |
| Short-Term Investments: 0.67% | | | | | | | | | | | | | | | | |
| | | | |
| Investment Companies: 0.67% | | | | | | | | | | | | | | | | |
Wells Fargo Municipal Cash Management Fund Institutional Class (l)(u) | | | 0.67 | | | | | | | | 4,493,875 | | | | 4,496,572 | |
| | | | | | | | | | | | | | | | |
| | | | |
Total Short-Term Investments (Cost $4,495,998) | | | | | | | | | | | | | | | 4,496,572 | |
| | | | | | | | | | | | | | | | |
| | | | | | | | |
| Total investments in securities (Cost $653,192,241) * | | | 97.90 | % | | | 661,286,088 | |
Other assets and liabilities, net | | | 2.10 | | | | 14,195,848 | |
| | | | | | | | |
| Total net assets | | | 100.00 | % | | $ | 675,481,936 | |
| | | | | | | | |
| ¤ | The security is issued in zero coupon form with no periodic interest payments. |
| ± | Variable rate investment. The rate shown is the rate in effect at period end. |
| 144A | The security may be resold in transactions exempt from registration, normally to qualified institutional buyers, pursuant to Rule 144A under the Securities Act of 1933. |
| ø | Variable rate demand notes are subject to a demand feature which reduces the effective maturity. The maturity date shown represents the final maturity date of the security. The interest rate is determined and reset by the issuer daily, weekly, or monthly depending upon the terms of the security. The rate shown is the rate in effect at period end. |
| (m) | The security is an auction-rate security which has an interest rate that resets at predetermined short-term intervals through a Dutch auction. The rate shown is the rate in effect at period end. |
| (l) | The issuer of the security is an affiliated person of the Fund as defined in the Investment Company Act of 1940. |
| (u) | The rate represents the 7-day annualized yield at period end. |
| * | Cost for federal income tax purposes is $653,191,938 and unrealized gains (losses) consists of: |
| | | | |
Gross unrealized gains | | $ | 10,706,107 | |
Gross unrealized losses | | | (2,611,957 | ) |
| | | | |
Net unrealized gains | | $ | 8,094,150 | |
The accompanying notes are an integral part of these financial statements.
| | | | |
| 22 | | Wells Fargo California Limited-Term Tax-Free Fund | | Statement of assets and liabilities—December 31, 2016 (unaudited) |
| | | | |
| | | | |
| |
Assets | | | | |
Investments | | | | |
In unaffiliated securities, at value (cost $648,696,243) | | $ | 656,789,516 | |
In affiliated securities, at value (cost $4,495,998) | | | 4,496,572 | |
| | | | |
Total investments, at value (cost $653,192,241) | | | 661,286,088 | |
Receivable for investments sold | | | 10,966,747 | |
Receivable for Fund shares sold | | | 3,115,338 | |
Receivable for interest | | | 7,515,323 | |
Prepaid expenses and other assets | | | 58,426 | |
| | | | |
Total assets | | | 682,941,922 | |
| | | | |
| |
Liabilities | | | | |
Dividends payable | | | 539,539 | |
Payable for Fund shares redeemed | | | 6,477,872 | |
Management fee payable | | | 223,633 | |
Distribution fee payable | | | 26,398 | |
Administration fees payable | | | 68,159 | |
Accrued expenses and other liabilities | | | 124,385 | |
| | | | |
Total liabilities | | | 7,459,986 | |
| | | | |
Total net assets | | $ | 675,481,936 | |
| | | | |
| |
NET ASSETS CONSIST OF | | | | |
Paid-in capital | | $ | 670,327,111 | |
Undistributed net investment income | | | 414,304 | |
Accumulated net realized losses on investments | | | (3,353,326 | ) |
Net unrealized gains on investments | | | 8,093,847 | |
| | | | |
Total net assets | | $ | 675,481,936 | |
| | | | |
| |
COMPUTATION OF NET ASSET VALUE AND OFFERING PRICE PER SHARE | | | | |
Net assets – Class A | | $ | 157,598,651 | |
Shares outstanding – Class A1 | | | 14,761,638 | |
Net asset value per share – Class A | | | $10.68 | |
Maximum offering price per share – Class A2 | | | $10.90 | |
Net assets – Class C | | $ | 38,560,085 | |
Shares outstanding – Class C1 | | | 3,612,342 | |
Net asset value per share – Class C | | | $10.67 | |
Net assets – Administrator Class | | $ | 123,538,440 | |
Shares outstanding – Administrator Class1 | | | 11,749,045 | |
Net asset value per share – Administrator Class | | | $10.51 | |
Net assets – Institutional Class | | $ | 355,784,760 | |
Shares outstanding – Institutional Class1 | | | 33,858,297 | |
Net asset value per share – Institutional Class | | | $10.51 | |
| 1 | The Fund has an unlimited number of authorized shares. |
| 2 | Maximum offering price is computed as 100/98 of net asset value. On investments of $50,000 or more, the offering price is reduced. |
The accompanying notes are an integral part of these financial statements.
| | | | | | |
| Statement of operations—six months ended December 31, 2016 (unaudited) | | Wells Fargo California Limited-Term Tax-Free Fund | | | 23 | |
| | | | |
| | | | |
| |
Investment income | | | | |
Interest | | $ | 9,522,868 | |
Income from affiliated securities | | | 14,712 | |
| | | | |
Total investment income | | | 9,537,580 | |
| | | | |
| |
Expenses | | | | |
Management fee | | | 1,557,390 | |
Administration fees | | | | |
Class A | | | 154,402 | |
Class C | | | 33,225 | |
Administrator Class | | | 100,420 | |
Institutional Class | | | 144,505 | |
Shareholder servicing fees | | | | |
Class A | | | 241,253 | |
Class C | | | 51,914 | |
Administrator Class | | | 250,269 | |
Distribution fee | | | | |
Class C | | | 155,742 | |
Custody and accounting fees | | | 23,487 | |
Professional fees | | | 20,756 | |
Registration fees | | | 28,711 | |
Shareholder report expenses | | | 15,060 | |
Trustees’ fees and expenses | | | 11,884 | |
Other fees and expenses | | | 8,606 | |
| | | | |
Total expenses | | | 2,797,624 | |
Less: Fee waivers and/or expense reimbursements | | | (201,978 | ) |
| | | | |
Net expenses | | | 2,595,646 | |
| | | | |
Net investment income | | | 6,941,934 | |
| | | | |
| |
REALIZED AND UNREALIZED GAINS (LOSSES) ON INVESTMENTS | | | | |
| |
Net realized gains (losses) on: | | | | |
Unaffiliated securities | | | (2,512,437 | ) |
Affiliated securities | | | 4,879 | |
| | | | |
Net realized losses on investments | | | (2,507,558 | ) |
| | | | |
| |
Net change in unrealized gains (losses) on: | | | | |
Unaffiliated securities | | | (23,534,006 | ) |
Affiiliated securities | | | 574 | |
| | | | |
Net change in unrealized gains (losses) on investments | | | (23,533,432 | ) |
| | | | |
Net realized and unrealized gains (losses) on investments | | | (26,040,990 | ) |
| | | | |
Net decrease in net assets resulting from operations | | $ | (19,099,056 | ) |
| | | | |
The accompanying notes are an integral part of these financial statements.
| | | | |
| 24 | | Wells Fargo California Limited-Term Tax-Free Fund | | Statement of changes in net assets |
| | | | | | | | | | | | | | | | |
| | | Six months ended
December 31, 2016
(unaudited) | | | Year ended
June 30, 2016 | |
| | | |
Operations | | | | | | | | | | | | |
Net investment income | | | | | | $ | 6,941,934 | | | | | | | $ | 13,668,017 | |
Net realized gains (losses) on investments | | | | | | | (2,507,558 | ) | | | | | | | 307,165 | |
Net change in unrealized gains (losses) on investments | | | | | | | (23,533,432 | ) | | | | | | | 15,198,116 | |
| | | | |
Net increase (decrease) in net assets resulting from operations | | | | | | | (19,099,056 | ) | | | | | | | 29,173,298 | |
| | | | |
| | | |
Distributions to shareholders from | | | | | | | | | | | | |
Net investment income | | | | | | | | |
Class A | | | | | | | (1,540,821 | ) | | | | | | | (3,106,736 | ) |
Class C | | | | | | | (175,941 | ) | | | | | | | (293,867 | ) |
Administrator Class | | | | | | | (1,794,531 | ) | | | | | | | (4,753,577 | ) |
Institutional Class | | | | | | | (3,430,641 | ) | | | | | | | (5,513,837 | ) |
| | | | |
Total distributions to shareholders | | | | | | | (6,941,934 | ) | | | | | | | (13,668,017 | ) |
| | | | |
| | | | |
Capital share transactions | | | Shares | | | | | | | | Shares | | | | | |
Proceeds from shares sold | | | | | | | | |
Class A | | | 2,568,550 | | | | 28,037,975 | | | | 3,717,168 | | | | 40,622,538 | |
Class C | | | 542,614 | | | | 5,944,775 | | | | 1,111,875 | | | | 12,161,519 | |
Administrator Class | | | 1,723,866 | | | | 18,584,481 | | | | 7,716,091 | | | | 82,975,726 | |
Institutional Class | | | 15,405,363 | | | | 164,296,461 | | | | 18,822,453 | | | | 202,617,124 | |
| | | | |
| | | | | | | 216,863,692 | | | | | | | | 338,376,907 | |
| | | | |
Reinvestment of distributions | | | | | | | | |
Class A | | | 124,248 | | | | 1,352,233 | | | | 255,259 | | | | 2,791,230 | |
Class C | | | 14,672 | | | | 159,443 | | | | 24,387 | | | | 266,691 | |
Administrator Class | | | 163,975 | | | | 1,760,246 | | | | 392,993 | | | | 4,230,319 | |
Institutional Class | | | 55,248 | | | | 588,621 | | | | 36,473 | | | | 393,272 | |
| | | | |
| | | | | | | 3,860,543 | | | | | | | | 7,681,512 | |
| | | | |
Payment for shares redeemed | | | | | | | | |
Class A | | | (5,743,735 | ) | | | (62,106,108 | ) | | | (4,482,841 | ) | | | (49,048,097 | ) |
Class C | | | (578,062 | ) | | | (6,271,762 | ) | | | (643,275 | ) | | | (7,027,894 | ) |
Administrator Class | | | (10,983,194 | ) | | | (116,852,938 | ) | | | (16,255,503 | ) | | | (174,866,159 | ) |
Institutional Class | | | (13,918,274 | ) | | | (148,358,836 | ) | | | (12,821,779 | ) | | | (137,811,298 | ) |
| | | | |
| | | | | | | (333,589,644 | ) | | | | | | | (368,753,448 | ) |
| | | | |
Net decrease in net assets resulting from capital share transactions | | | | | | | (112,865,409 | ) | | | | | | | (22,695,029 | ) |
| | | | |
Total decrease in net assets | | | | | | | (138,906,399 | ) | | | | | | | (7,189,748 | ) |
| | | | |
| | |
Net assets | | | | | | | | |
Beginning of period | | | | | | | 814,388,335 | | | | | | | | 821,578,083 | |
| | | | |
End of period | | | | | | $ | 675,481,936 | | | | | | | $ | 814,388,335 | |
| | | | |
Undistributed net investment income | | | | | | $ | 414,304 | | | | | | | $ | 414,304 | |
| | | | |
The accompanying notes are an integral part of these financial statements.
| | | | | | |
| Financial highlights | | Wells Fargo California Limited-Term Tax-Free Fund | | | 25 | |
(For a share outstanding throughout each period)
| | | | | | | | | | | | | | | | | | | | | | | | |
| | | Six months ended
December 31, 2016 (unaudited) | | | Year ended June 30 | |
| CLASS A | | | 2016 | | | 2015 | | | 2014 | | | 2013 | | | 2012 | |
Net asset value, beginning of period | | | $11.04 | | | | $10.83 | | | | $10.86 | | | | $10.66 | | | | $10.70 | | | | $10.51 | |
Net investment income | | | 0.09 | | | | 0.17 | | | | 0.16 | | | | 0.18 | | | | 0.21 | | | | 0.27 | |
Net realized and unrealized gains (losses) on investments | | | (0.36 | ) | | | 0.21 | | | | (0.03 | ) | | | 0.20 | | | | (0.04 | ) | | | 0.19 | |
| | | | | | | | | | | | | | | | | | | | | | | | |
Total from investment operations | | | (0.27 | ) | | | 0.38 | | | | 0.13 | | | | 0.38 | | | | 0.17 | | | | 0.46 | |
Distributions to shareholders from | | | | | | | | | | | | | | | | | | | | | | | | |
Net investment income | | | (0.09 | ) | | | (0.17 | ) | | | (0.16 | ) | | | (0.18 | ) | | | (0.21 | ) | | | (0.27 | ) |
Net asset value, end of period | | | $10.68 | | | | $11.04 | | | | $10.83 | | | | $10.86 | | | | $10.66 | | | | $10.70 | |
Total return1 | | | (2.48 | )% | | | 3.54 | % | | | 1.22 | % | | | 3.61 | % | | | 1.59 | % | | | 4.41 | % |
Ratios to average net assets (annualized) | | | | | | | | | | | | | | | | | | | | | | | | |
Gross expenses | | | 0.83 | % | | | 0.83 | % | | | 0.82 | % | | | 0.83 | % | | | 0.83 | % | | | 0.84 | % |
Net expenses | | | 0.80 | % | | | 0.80 | % | | | 0.80 | % | | | 0.80 | % | | | 0.80 | % | | | 0.80 | % |
Net investment income | | | 1.60 | % | | | 1.56 | % | | | 1.49 | % | | | 1.70 | % | | | 1.95 | % | | | 2.51 | % |
Supplemental data | | | | | | | | | | | | | | | | | | | | | | | | |
Portfolio turnover rate | | | 7 | % | | | 21 | % | | | 31 | % | | | 31 | % | | | 32 | % | | | 56 | % |
Net assets, end of period (000s omitted) | | | $157,599 | | | | $196,629 | | | | $198,402 | | | | $203,306 | | | | $156,366 | | | | $162,381 | |
| 1 | Total return calculations do not include any sales charges. Returns for periods of less than one year are not annualized. |
The accompanying notes are an integral part of these financial statements.
| | | | |
| 26 | | Wells Fargo California Limited-Term Tax-Free Fund | | Financial highlights |
(For a share outstanding throughout each period)
| | | | | | | | | | | | | | | | | | | | | | | | |
| | | Six months ended
December 31, 2016 (unaudited) | | | Year ended June 30 | |
| CLASS C | | | 2016 | | | 2015 | | | 2014 | | | 2013 | | | 2012 | |
Net asset value, beginning of period | | | $11.04 | | | | $10.83 | | | | $10.86 | | | | $10.65 | | | | $10.70 | | | | $10.51 | |
Net investment income | | | 0.05 | | | | 0.09 | | | | 0.08 | | | | 0.10 | | | | 0.13 | | | | 0.19 | |
Net realized and unrealized gains (losses) on investments | | | (0.37 | ) | | | 0.21 | | | | (0.03 | ) | | | 0.21 | | | | (0.05 | ) | | | 0.19 | |
| | | | | | | | | | | | | | | | | | | | | | | | |
Total from investment operations | | | (0.32 | ) | | | 0.30 | | | | 0.05 | | | | 0.31 | | | | 0.08 | | | | 0.38 | |
Distributions to shareholders from | | | | | | | | | | | | | | | | | | | | | | | | |
Net investment income | | | (0.05 | ) | | | (0.09 | ) | | | (0.08 | ) | | | (0.10 | ) | | | (0.13 | ) | | | (0.19 | ) |
Net asset value, end of period | | | $10.67 | | | | $11.04 | | | | $10.83 | | | | $10.86 | | | | $10.65 | | | | $10.70 | |
Total return1 | | | (2.94 | )% | | | 2.76 | % | | | 0.47 | % | | | 2.94 | % | | | 0.73 | % | | | 3.63 | % |
Ratios to average net assets (annualized) | | | | | | | | | | | | | | | | | | | | | | | | |
Gross expenses | | | 1.58 | % | | | 1.58 | % | | | 1.57 | % | | | 1.58 | % | | | 1.58 | % | | | 1.59 | % |
Net expenses | | | 1.55 | % | | | 1.55 | % | | | 1.55 | % | | | 1.55 | % | | | 1.55 | % | | | 1.55 | % |
Net investment income | | | 0.85 | % | | | 0.81 | % | | | 0.74 | % | | | 0.95 | % | | | 1.19 | % | | | 1.77 | % |
Supplemental data | | | | | | | | | | | | | | | | | | | | | | | | |
Portfolio turnover rate | | | 7 | % | | | 21 | % | | | 31 | % | | | 31 | % | | | 32 | % | | | 56 | % |
Net assets, end of period (000s omitted) | | | $38,560 | | | | $40,098 | | | | $33,996 | | | | $34,920 | | | | $35,309 | | | | $33,414 | |
| 1 | Total return calculations do not include any sales charges. Returns for periods of less than one year are not annualized. |
The accompanying notes are an integral part of these financial statements.
| | | | | | |
| Financial highlights | | Wells Fargo California Limited-Term Tax-Free Fund | | | 27 | |
(For a share outstanding throughout each period)
| | | | | | | | | | | | | | | | | | | | | | | | |
| | | Six months ended
December 31, 2016
(unaudited) | | | Year ended June 30 | |
| ADMINISTRATOR CLASS | | | 2016 | | | 2015 | | | 2014 | | | 2013 | | | 2012 | |
Net asset value, beginning of period | | | $10.87 | | | | $10.66 | | | | $10.70 | | | | $10.49 | | | | $10.53 | | | | $10.34 | |
Net investment income | | | 0.10 | 1 | | | 0.19 | | | | 0.18 | | | | 0.20 | | | | 0.23 | | | | 0.29 | |
Net realized and unrealized gains (losses) on investments | | | (0.36 | ) | | | 0.21 | | | | (0.04 | ) | | | 0.21 | | | | (0.04 | ) | | | 0.19 | |
| | | | | | | | | | | | | | | | | | | | | | | | |
Total from investment operations | | | (0.26 | ) | | | 0.40 | | | | 0.14 | | | | 0.41 | | | | 0.19 | | | | 0.48 | |
Distributions to shareholders from | | | | | | | | | | | | | | | | | | | | | | | | |
Net investment income | | | (0.10 | ) | | | (0.19 | ) | | | (0.18 | ) | | | (0.20 | ) | | | (0.23 | ) | | | (0.29 | ) |
Net asset value, end of period | | | $10.51 | | | | $10.87 | | | | $10.66 | | | | $10.70 | | | | $10.49 | | | | $10.53 | |
Total return2 | | | (2.43 | )% | | | 3.78 | % | | | 1.33 | % | | | 3.95 | % | | | 1.79 | % | | | 4.65 | % |
Ratios to average net assets (annualized) | | | | | | | | | | | | | | | | | | | | | | | | |
Gross expenses | | | 0.77 | % | | | 0.77 | % | | | 0.76 | % | | | 0.77 | % | | | 0.77 | % | | | 0.77 | % |
Net expenses | | | 0.60 | % | | | 0.60 | % | | | 0.60 | % | | | 0.60 | % | | | 0.60 | % | | | 0.60 | % |
Net investment income | | | 1.79 | % | | | 1.75 | % | | | 1.69 | % | | | 1.90 | % | | | 2.14 | % | | | 2.72 | % |
Supplemental data | | | | | | | | | | | | | | | | | | | | | | | | |
Portfolio turnover rate | | | 7 | % | | | 21 | % | | | 31 | % | | | 31 | % | | | 32 | % | | | 56 | % |
Net assets, end of period (000s omitted) | | | $123,538 | | | | $226,581 | | | | $309,120 | | | | $550,156 | | | | $388,872 | | | | $269,980 | |
| 1 | Calculated based upon average shares outstanding |
| 2 | Returns for periods of less than one year are not annualized. |
The accompanying notes are an integral part of these financial statements.
| | | | |
| 28 | | Wells Fargo California Limited-Term Tax-Free Fund | | Financial highlights |
(For a share outstanding throughout each period)
| | | | | | | | | | | | |
| | | Six months ended
December 31, 2016
(unaudited) | | | Year ended June 30 | |
| INSTITUTIONAL CLASS | | | 2016 | | | 20151 | |
Net asset value, beginning of period | | | $10.86 | | | | $10.66 | | | | $10.75 | |
Net investment income | | | 0.10 | | | | 0.20 | | | | 0.13 | |
Net realized and unrealized gains (losses) on investments | | | (0.35 | ) | | | 0.20 | | | | (0.09 | ) |
| | | | | | | | | | | | |
Total from investment operations | | | (0.25 | ) | | | 0.40 | | | | 0.04 | |
Distributions to shareholders from | | | | | | | | | | | | |
Net investment income | | | (0.10 | ) | | | (0.20 | ) | | | (0.13 | ) |
Net asset value, end of period | | | $10.51 | | | | $10.86 | | | | $10.66 | |
Total return2 | | | (2.29 | )% | | | 3.79 | % | | | 0.35 | % |
Ratios to average net assets (annualized) | | | | | | | | | | | | |
Gross expenses | | | 0.50 | % | | | 0.50 | % | | | 0.50 | % |
Net expenses | | | 0.50 | % | | | 0.50 | % | | | 0.50 | % |
Net investment income | | | 1.90 | % | | | 1.86 | % | | | 1.82 | % |
Supplemental data | | | | | | | | | | | | |
Portfolio turnover rate | | | 7 | % | | | 21 | % | | | 31 | % |
Net assets, end of period (000s omitted) | | | $355,785 | | | | $351,080 | | | | $280,061 | |
| 1 | For the period from October 31, 2014 (commencement of class operations) to June 30, 2015 |
| 2 | Returns for periods of less than one year are not annualized. |
The accompanying notes are an integral part of these financial statements.
| | | | | | |
| Notes to financial statements (unaudited) | | Wells Fargo California Limited-Term Tax-Free Fund | | | 29 | |
1. ORGANIZATION
Wells Fargo Funds Trust (the “Trust”), a Delaware statutory trust organized on March 10, 1999, is an open-end management investment company registered under the Investment Company Act of 1940, as amended (the “1940 Act”). As an investment company, the Trust follows the accounting and reporting guidance in Financial Accounting Standards Board (“FASB”) Accounting Standards Codification Topic 946, Financial Services – Investment Companies. These financial statements report on the Wells Fargo California Limited-Term Tax-Free Fund (the “Fund”) which is a diversified series of the Trust.
2. SIGNIFICANT ACCOUNTING POLICIES
The following significant accounting policies, which are consistently followed in the preparation of the financial statements of the Fund, are in conformity with U.S. generally accepted accounting principles which require management to make estimates and assumptions that affect the reported amounts of assets and liabilities, disclosure of contingent assets and liabilities at the date of the financial statements, and the reported amounts of revenues and expenses during the reporting period. Actual results could differ from those estimates.
Securities valuation
All investments are valued each business day as of the close of regular trading on the New York Stock Exchange (generally 4 p.m. Eastern Time), although the Fund may deviate from this calculation time under unusual or unexpected circumstances.
Debt securities are valued at the evaluated bid price provided by an independent pricing service or, if a reliable price is not available, the quoted bid price from an independent broker-dealer.
Investments in registered open-end investment companies are valued at net asset value.
Investments which are not valued using any of the methods discussed above are valued at their fair value, as determined in good faith by the Board of Trustees of the Fund. The Board of Trustees has established a Valuation Committee comprised of the Trustees and has delegated to it the authority to take any actions regarding the valuation of portfolio securities that the Valuation Committee deems necessary or appropriate, including determining the fair value of portfolio securities, unless the determination has been delegated to the Management Valuation Team of Wells Fargo Funds Management, LLC (“Funds Management”). The Board of Trustees retains the authority to make or ratify any valuation decisions or approve any changes to the Valuation Procedures as it deems appropriate. On a quarterly basis, the Board of Trustees receives reports on any valuation actions taken by the Valuation Committee or the Management Valuation Team which may include items for ratification.
Valuations of fair valued securities are compared to the next actual sales price when available, or other appropriate market values, to assess the continued appropriateness of the fair valuation methodologies used. These securities are fair valued on a day-to-day basis, taking into consideration changes to appropriate market information and any significant changes to the inputs considered in the valuation process until there is a readily available price provided on an exchange or by an independent pricing service. Valuations received from an independent pricing service or independent broker-dealer quotes are periodically validated by comparisons to most recent trades and valuations provided by other independent pricing services in addition to the review of prices by the manager and/or subadviser. Unobservable inputs used in determining fair valuations are identified based on the type of security, taking into consideration factors utilized by market participants in valuing the investment, knowledge about the issuer and the current market environment.
When-issued transactions
The Fund may purchase securities on a forward commitment or when-issued basis. The Fund records a when-issued transaction on the trade date and will segregate assets in an amount at least equal in value to the Fund’s commitment to purchase when-issued securities. Securities purchased on a when-issued basis are marked-to-market daily and the Fund begins earning interest on the settlement date. Losses may arise due to changes in the market value of the underlying securities or if the counterparty does not perform under the contract.
Security transactions and income recognition
Securities transactions are recorded on a trade date basis. Realized gains or losses are recorded on the basis of identified cost.
Interest income is accrued daily and bond discounts are accreted and premiums are amortized daily based on the effective interest method. To the extent debt obligations are placed on non-accrual status, any related interest income may be reduced by writing off interest receivables when the collection of all or a portion of interest has become doubtful based on consistently applied procedures. If the issuer subsequently resumes interest payments or when the collectability of interest is reasonably assured, the debt obligation is removed from non-accrual status.
| | | | |
| 30 | | Wells Fargo California Limited-Term Tax-Free Fund | | Notes to financial statements (unaudited) |
Distributions to shareholders
Distributions to shareholders from net investment income are accrued daily and paid monthly. Distributions from net realized gains, if any, are recorded on the ex-dividend date. Such distributions are determined in conformity with federal income tax regulations, which may differ in amount or character from net investment income and realized gains recognized for purposes of U.S. generally accepted accounting principles.
Federal and other taxes
The Fund intends to continue to qualify as a regulated investment company by distributing substantially all of its investment company taxable and tax-exempt income and any net realized capital gains (after reduction for capital loss carryforwards) sufficient to relieve it from all, or substantially all, federal income taxes. Accordingly, no provision for federal income taxes was required.
The Fund’s income and federal excise tax returns and all financial records supporting those returns for the prior three fiscal years are subject to examination by the federal and Delaware revenue authorities. Management has analyzed the Fund’s tax positions taken on federal, state, and foreign tax returns for all open tax years and does not believe that there are any uncertain tax positions that require recognition of a tax liability.
As of June 30, 2016, the Fund had capital loss carryforwards available to offset future net realized capital gains in the amount of $844,942 with $734,586 expiring in 2018; $110,356 expiring in 2019.
Class allocations
The separate classes of shares offered by the Fund differ principally in applicable sales charges, distribution, shareholder servicing, and administration fees. Class specific expenses are charged directly to that share class. Investment income, common expenses, and realized and unrealized gains (losses) on investments are allocated daily to each class of shares based on the relative proportion of net assets of each class.
3. FAIR VALUATION MEASUREMENTS
Fair value measurements of investments are determined within a framework that has established a fair value hierarchy based upon the various data inputs utilized in determining the value of the Fund’s investments. The three-level hierarchy gives the highest priority to unadjusted quoted prices in active markets for identical assets or liabilities (Level 1) and the lowest priority to significant unobservable inputs (Level 3). The Fund’s investments are classified within the fair value hierarchy based on the lowest level of input that is significant to the fair value measurement. The inputs are summarized into three broad levels as follows:
| ∎ | | Level 1 – quoted prices in active markets for identical securities |
| ∎ | | Level 2 – other significant observable inputs (including quoted prices for similar securities, interest rates, prepayment speeds, credit risk, use of amortized cost, etc.) |
| ∎ | | Level 3 – significant unobservable inputs (including the Fund’s own assumptions in determining the fair value of investments) |
The inputs or methodologies used for valuing investments in securities are not necessarily an indication of the risk associated with investing in those securities.
The following is a summary of the inputs used in valuing the Fund’s assets and liabilities as of December 31, 2016:
| | | | | | | | | | | | | | | | |
| | | Quoted prices
(Level 1) | | | Other significant
observable inputs
(Level 2) | | | Significant
unobservable inputs
(Level 3) | | | Total | |
Assets | | | | | | | | | | | | | | | | |
Investments in: | | | | | | | | | | | | | | | | |
| | | | |
Municipal obligations | | $ | 0 | | | $ | 656,789,516 | | | $ | 0 | | | $ | 656,789,516 | |
| | | | |
Short-term investments | | | | | | | | | | | | | | | | |
Investment companies | | | 4,496,572 | | | | 0 | | | | 0 | | | | 4,496,572 | |
Total assets | | $ | 4,496,572 | | | $ | 656,789,516 | | | $ | 0 | | | $ | 661,286,088 | |
The Fund recognizes transfers between levels within the fair value hierarchy at the end of the reporting period. At December 31, 2016, the Fund did not have any transfers into/out of Level 1, Level 2, or Level 3.
| | | | | | |
| Notes to financial statements (unaudited) | | Wells Fargo California Limited-Term Tax-Free Fund | | | 31 | |
4. TRANSACTIONS WITH AFFILIATES AND OTHER EXPENSES
Management fee
Funds Management, an indirect wholly owned subsidiary of Wells Fargo & Company (“Wells Fargo”), is the manager of the Fund and provides advisory and fund-level administrative services under an investment management agreement. Under the investment management agreement, Funds Management is responsible for, among other services, implementing the investment objectives and strategies of the Fund, supervising the subadviser, providing fund-level administrative services in connection with the Fund’s operations, and providing any other fund-level administrative services reasonably necessary for the operation of the Fund. As compensation for its services under the investment management agreement, Funds Management is entitled to receive an annual management fee starting at 0.40% and declining to 0.28% as the average daily net assets of the Fund increase. For the six months ended December 31, 2016, the management fee was equivalent to an annual rate of 0.39% of the Fund’s average daily net assets.
Funds Management has retained the services of a subadviser to provide daily portfolio management to the Fund. The fee for subadvisory services is borne by Funds Management. Wells Capital Management Incorporated, an affiliate of Funds Management and an indirect wholly owned subsidiary of Wells Fargo, is the subadviser to the Fund and is entitled to receive a fee from Funds Management at an annual rate starting at 0.15% and declining to 0.05% as the average daily net assets of the Fund increase.
Administration fees
Under a class-level administration agreement, Funds Management provides class-level administrative services to the Fund, which includes paying fees and expenses for services provided by the transfer agent, sub-transfer agents, omnibus account servicers and record-keepers. As compensation for its services under the class-level administration agreement, Funds Management receives an annual fee which is calculated based on the average daily net assets of each class as follows:
| | | | |
| | | Class-level
administration fee | |
Class A, Class C | | | 0.16 | % |
Administrator Class | | | 0.10 | |
Institutional Class | | | 0.08 | |
Funds Management has contractually waived and/or reimbursed management and administration fees to the extent necessary to maintain certain net operating expense ratios for the Fund. Waiver of fees and/or reimbursement of expenses by Funds Management were made first from fund level expenses on a proportionate basis and then from class specific expenses. Funds Management has committed through October 31, 2017 to waive fees and/or reimburse expenses to the extent necessary to cap the Fund’s expenses at 0.80% for Class A shares, 1.55% for Class C shares, 0.60% for Administrator Class shares, and 0.50% for Institutional Class shares. After this time, the cap may be increased or the commitment to maintain the cap may be terminated only with the approval of the Board of Trustees.
During the six months ended December 31, 2016, State Street Bank and Trust Company, the Fund’s custodian, reimbursed the Fund $7 for certain out-of-pocket expenses that were billed to the Fund in error from 1998-2015. This amount is included in interest income on the Statement of Operations. In addition, Funds Management was also reimbursed $3,059 for waivers/reimbursements it made to the Fund during the period the Fund was erroneously billed.
Distribution fee
The Trust has adopted a distribution plan for Class C shares of the Fund pursuant to Rule 12b-1 under the 1940 Act. A distribution fee is charged to Class C shares and paid to Wells Fargo Funds Distributor, LLC (“Funds Distributor”), the principal underwriter, at an annual rate of 0.75% of the average daily net assets of Class C shares.
In addition, Funds Distributor is entitled to receive the front-end sales charge from the purchase of Class A shares and a contingent deferred sales charge on the redemption of certain Class A shares. Funds Distributor is also entitled to receive the contingent deferred sales charges from redemptions of Class C shares. For the six months ended December 31, 2016, Funds Distributor received $1,062 from the sale of Class A shares.
Shareholder servicing fees
The Trust has entered into contracts with one or more shareholder servicing agents, whereby Class A, Class C, and Administrator Class of the Fund are charged a fee at an annual rate of 0.25% of the average daily net assets of each respective class.
A portion of these total shareholder servicing fees were paid to affiliates of Wells Fargo.
| | | | |
| 32 | | Wells Fargo California Limited-Term Tax-Free Fund | | Notes to financial statements (unaudited) |
5. INVESTMENT PORTFOLIO TRANSACTIONS
Purchases and sales of investments, excluding U.S. government obligations (if any) and short-term securities, for the six months ended December 31, 2016 were $48,469,899 and $152,610,492, respectively.
The Fund may purchase or sell investment securities to other Wells Fargo funds under procedures adopted by the Board of Trustees. The procedures have been designed to ensure that these interfund transactions, which generally do not incur broker commissions, are effected at current market prices. Interfund trades are included within the respective purchases and sales amounts shown.
6. BANK BORROWINGS
The Trust (excluding the money market funds and certain other funds) and Wells Fargo Variable Trust are parties to a $250,000,000 revolving credit agreement whereby the Fund is permitted to use bank borrowings for temporary or emergency purposes, such as to fund shareholder redemption requests. Interest under the credit agreement is charged to the Fund based on a borrowing rate equal to the higher of the Federal Funds rate in effect on that day plus 1.25% or the overnight LIBOR rate in effect on that day plus 1.25%. In addition, an annual commitment fee equal to 0.25% of the unused balance is allocated to each participating fund. Prior to August 30, 2016, the revolving credit agreement amount was $200,000,000 and the annual commitment fee was equal to 0.20% of the unused balance which was allocated to each participating fund.
For the six month ended December 31, 2016, there were no borrowings by the Fund under the agreement.
7. CONCENTRATION RISK
The Fund invests a substantial portion of its assets in issuers of municipal debt securities located in a single state or territories of the U.S. Therefore, it may be more affected by economic and political developments in that state or region than would be a comparable general tax-exempt fund.
8. INDEMNIFICATION
Under the Trust’s organizational documents, the officers and Trustees have been granted certain indemnification rights against certain liabilities that may arise out of performance of their duties to the Trust. Additionally, in the normal course of business, the Trust may enter into contracts with service providers that contain a variety of indemnification clauses. The Trust’s maximum exposure under these arrangements is dependent on future claims that may be made against the Fund and, therefore, cannot be estimated.
9. REGULATORY CHANGES
In October 2016, the Securities and Exchange Commission (“SEC”) adopted new rules and forms and amended existing rules and forms (together, “final rules”) intended to modernize and enhance the reporting and disclosure of information by registered investment companies and to enhance liquidity risk management by open-end mutual funds and exchange-traded funds. The final rules will enhance the quality of information available to investors and will allow the SEC to more effectively collect and use data reported by funds. In part, the final rules amend Regulation S-X and require standardized, enhanced disclosure about derivatives in the Fund’s financial statements, as well as other amendments. The compliance date for the amendments to Regulation S-X is August 1, 2017 while the compliance date for the new form types is June 1, 2018 and the compliance date for the liquidity risk management program requirements is December 1, 2018. Management is currently assessing the potential impact of these enhancements and their impact on the financial statement disclosures and reporting requirements.
| | | | | | |
| Other information (unaudited) | | Wells Fargo California Limited-Term Tax-Free Fund | | | 33 | |
PROXY VOTING INFORMATION
A description of the policies and procedures that the Fund uses to determine how to vote proxies relating to portfolio securities is available, upon request, by calling 1-800-222-8222, visiting our website at wellsfargofunds.com, or visiting the SEC website at sec.gov. Information regarding how the Fund voted proxies relating to portfolio securities during the most recent 12-month period ended June 30 is available on the Fund’s website at wellsfargofunds.com or by visiting the SEC website at sec.gov.
PORTFOLIO HOLDINGS INFORMATION
The complete portfolio holdings for the Fund are publicly available monthly on the Fund’s website (wellsfargofunds.com), on a one-month delayed basis. In addition, top ten holdings information (excluding derivative positions) for the Fund is publicly available on the Fund’s website on a monthly, seven-day or more delayed basis. The Fund files its complete schedule of portfolio holdings with the SEC for the first and third quarters of each fiscal year on Form N-Q, which is available by visiting the SEC website at sec.gov. In addition, the Fund’s Form N-Q may be reviewed and copied at the SEC’s Public Reference Room in Washington, DC, and at regional offices in New York City, at 233 Broadway, and in Chicago, at 175 West Jackson Boulevard, Suite 900. Information about the Public Reference Room may be obtained by calling 1-800-SEC-0330.
| | | | |
| 34 | | Wells Fargo California Limited-Term Tax-Free Fund | | Other information (unaudited) |
BOARD OF TRUSTEES AND OFFICERS
Each of the Trustees and Officers1 listed in the table below acts in identical capacities for each fund in the Wells Fargo family of funds, which consists of 139 mutual funds comprising the Wells Fargo Funds Trust, Wells Fargo Variable Trust, Wells Fargo Master Trust and four closed-end funds (collectively the “Fund Complex”). This table should be read in conjunction with the Prospectus and the Statement of Additional Information2. The mailing address of each Trustee and Officer is 525 Market Street, 12th Floor, San Francisco, CA 94105. Each Trustee and Officer serves an indefinite term, however, each Trustee serves such term until reaching the mandatory retirement age established by the Trustees.
Independent Trustees
| | | | | | |
Name and
year of birth | | Position held and
length of service* | | Principal occupations during past five years or longer | | Current other
public company or
investment company
directorships |
William R. Ebsworth (Born 1957) | | Trustee, since 2015 | | Retired. From 1984 to 2013, equities analyst, portfolio manager, research director and chief financial officer at Fidelity Management and Research Company in Boston, Tokyo, and Hong Kong and retired in 2013 as Chief Investment Officer of Fidelity Strategic Advisers, Inc. where he lead a team of investment professionals managing client assets. Prior thereto, Board member of Hong Kong Securities Clearing Co., Hong Kong Options Clearing Corp., the Thailand International Fund, Ltd., Fidelity Investments Life Insurance Company, and Empire Fidelity Investments Life Insurance Company. Board member of the Fonté Foundation (non-profit organization) and the Vincent Memorial Hospital Endowment (non-profit organization), where he serves on the Investment Committee and as a Chair of the Audit Committee. Mr. Ebsworth is a CFA® charterholder and an Adjunct Lecturer, Finance, at Babson College. | | Asset Allocation Trust |
Jane A. Freeman (Born 1953) | | Trustee, since 2015 | | Retired. From 2012 to 2014 and 1999 to 2008, Chief Financial Officer of Scientific Learning Corporation. From 2008 to 2012, Ms. Freeman provided consulting services related to strategic business projects. Prior to 1999, Portfolio Manager at Rockefeller & Co. and Scudder, Stevens & Clark. Board member of the Harding Loevner Funds from 1996 to 2014, serving as both Lead Independent Director and chair of the Audit Committee. Board member of the Russell Exchange Traded Funds Trust from 2011 to 2012 and the chair of the Audit Committee. Ms. Freeman is a Board Member of Ruth Bancroft Garden (non-profit organization) and an inactive chartered financial analyst. | | Asset Allocation Trust |
Peter G. Gordon** (Born 1942) | | Trustee, since 1998; Chairman, since 2005 | | Co-Founder, Retired Chairman, President and CEO of Crystal Geyser Water Company. Trustee Emeritus, Colby College. | | Asset Allocation Trust |
Isaiah Harris, Jr. (Born 1952) | | Trustee, since 2009 | | Retired. Chairman of the Board of CIGNA Corporation since 2009, and Director since 2005. From 2003 to 2011, Director of Deluxe Corporation. Prior thereto, President and CEO of BellSouth Advertising and Publishing Corp. from 2005 to 2007, President and CEO of BellSouth Enterprises from 2004 to 2005 and President of BellSouth Consumer Services from 2000 to 2003. Emeritus member of the Iowa State University Foundation Board of Governors. Emeritus Member of the Advisory Board of Iowa State University School of Business. Advisory Board Member, Palm Harbor Academy (charter school). Advisory Board Member, Child Evangelism Fellowship (non-profit). Mr. Harris is a certified public accountant (inactive status). | | CIGNA Corporation; Asset Allocation Trust |
Judith M. Johnson (Born 1949) | | Trustee, since 2008; Audit Committee Chairman, since 2008 | | Retired. Prior thereto, Chief Executive Officer and Chief Investment Officer of Minneapolis Employees Retirement Fund from 1996 to 2008. Ms. Johnson is an attorney, certified public accountant and a certified managerial accountant. | | Asset Allocation Trust |
David F. Larcker (Born 1950) | | Trustee, since 2009 | | James Irvin Miller Professor of Accounting at the Graduate School of Business, Stanford University, Director of the Corporate Governance Research Initiative and Senior Faculty of The Rock Center for Corporate Governance since 2006. From 2005 to 2008, Professor of Accounting at the Graduate School of Business, Stanford University. Prior thereto, Ernst & Young Professor of Accounting at The Wharton School, University of Pennsylvania from 1985 to 2005. | | Asset Allocation Trust |
| | | | | | |
| Other information (unaudited) | | Wells Fargo California Limited-Term Tax-Free Fund | | | 35 | |
| | | | | | |
Name and
year of birth | | Position held and
length of service* | | Principal occupations during past five years or longer | | Current other
public company or
investment company
directorships |
Olivia S. Mitchell (Born 1953) | | Trustee, since 2006 | | International Foundation of Employee Benefit Plans Professor, Wharton School of the University of Pennsylvania since 1993. Director of Wharton’s Pension Research Council and Boettner Center on Pensions & Retirement Research, and Research Associate at the National Bureau of Economic Research. Previously, Cornell University Professor from 1978 to 1993. | | Asset Allocation Trust |
Timothy J. Penny (Born 1951) | | Trustee, since 1996 | | President and Chief Executive Officer of Southern Minnesota Initiative Foundation, a non-profit organization, since 2007 and Senior Fellow at the Humphrey Institute Policy Forum at the University of Minnesota since 1995. Member of the Board of Trustees of NorthStar Education Finance, Inc., a non-profit organization, since 2007. | | Asset Allocation Trust |
Michael S. Scofield (Born 1943) | | Trustee, since 2010 | | Served on the Investment Company Institute’s Board of Governors and Executive Committee from 2008-2011 as well the Governing Council of the Independent Directors Council from 2006-2011 and the Independent Directors Council Executive Committee from 2008-2011. Chairman of the IDC from 2008-2010. Institutional Investor (Fund Directions) Trustee of Year in 2007. Trustee of the Evergreen Funds complex (and its predecessors) from 1984 to 2010. Chairman of the Evergreen Funds from 2000-2010. Former Trustee of the Mentor Funds. Retired Attorney, Law Offices of Michael S. Scofield. | | Asset Allocation Trust |
| * | Length of service dates reflect the Trustee’s commencement of service with the Trust’s predecessor entities, where applicable. |
| ** | Peter Gordon is expected to retire on December 31, 2017. |
Officers
| | | | | | |
Name and
year of birth | | Position held and
length of service | | Principal occupations during past five years or longer | | |
Andrew Owen3 (Born 1960) | | President, since 2017 | | Executive Vice President of Wells Fargo Bank, N.A. and President of Wells Fargo & Company and Head of Affiliated Managaers, Wells Fargo Asset Management, since 2014. Executive Vice President responsible for marketing, investments and product development for Wells Fargo Funds Management, LLC, from 2009 to 2014. | | |
Nancy Wiser1 (Born 1967) | | Treasurer, since 2012 | | Executive Vice President of Wells Fargo Funds Management, LLC since 2011. Chief Operating Officer and Chief Compliance Officer at LightBox Capital Management LLC, from 2008 to 2011. | | |
C. David Messman (Born 1960) | | Secretary, since 2000; Chief Legal Officer, since 2003 | | Senior Vice President and Secretary of Wells Fargo Funds Management, LLC since 2001. Assistant General Counsel of Wells Fargo Bank, N.A. since 2013 and Vice President and Managing Counsel of Wells Fargo Bank, N.A. from 1996 to 2013. | | |
Michael Whitaker (Born 1967) | | Chief Compliance Officer, since 2016 | | Executive Vice President of Wells Fargo Funds Management, LLC since 2016. Chief Compliance Officer of Fidelity’s Fixed Income Funds and Asset Allocation Funds from 2008 to 2016, Compliance Officer of FMR Co., Inc. from 2014 to 2016, Fidelity Investments Money Management, Inc. from 2014 to 2016, Fidelity Investments from 2007 to 2016. | | |
David Berardi
(Born 1975) | | Assistant Treasurer, since 2009 | | Vice President of Wells Fargo Funds Management, LLC since 2009. Vice President of Evergreen Investment Management Company, LLC from 2008 to 2010. Manager of Fund Reporting and Control for Evergreen Investment Management Company, LLC from 2004 to 2010. | | |
Jeremy DePalma1 (Born 1974) | | Assistant Treasurer, since 2009 | | Senior Vice President of Wells Fargo Funds Management, LLC since 2009. Senior Vice President of Evergreen Investment Management Company, LLC from 2008 to 2010 and head of the Fund Reporting and Control Team within Fund Administration from 2005 to 2010. | | |
| 1 | Nancy Wiser acts as Treasurer of 70 funds in the Fund Complex. Jeremy DePalma acts as Treasurer of 69 funds and Assistant Treasurer of 70 funds in the Fund Complex. |
| 2 | The Statement of Additional Information includes additional information about the Trustees and is available, without charge, upon request, by calling 1-800-222-8222 or by visiting the website at wellsfargofunds.com. |
| 3 | Andrew Owen became President on January 1, 2017. |
| | | | |
| 36 | | Wells Fargo California Limited-Term Tax-Free Fund | | List of abbreviations |
The following is a list of common abbreviations for terms and entities that may have appeared in this report.
| ACA | — ACA Financial Guaranty Corporation |
| ADR | — American depositary receipt |
| ADS | — American depositary shares |
| AGC | — Assured Guaranty Corporation |
| AGM | — Assured Guaranty Municipal |
| Ambac | — Ambac Financial Group Incorporated |
| AMT | — Alternative minimum tax |
| BAN | — Bond anticipation notes |
| BHAC | — Berkshire Hathaway Assurance Corporation |
| CAB | — Capital appreciation bond |
| CCAB | — Convertible capital appreciation bond |
| CDA | — Community Development Authority |
| CDO | — Collateralized debt obligation |
| DRIVER | — Derivative inverse tax-exempt receipts |
| DW&P | — Department of Water & Power |
| DWR | — Department of Water Resources |
| ECFA | — Educational & Cultural Facilities Authority |
| EDA | — Economic Development Authority |
| EDFA | — Economic Development Finance Authority |
| ETF | — Exchange-traded fund |
| FDIC | — Federal Deposit Insurance Corporation |
| FFCB | — Federal Farm Credit Banks |
| FGIC | — Financial Guaranty Insurance Corporation |
| FHA | — Federal Housing Administration |
| FHLB | — Federal Home Loan Bank |
| FHLMC | — Federal Home Loan Mortgage Corporation |
| FICO | — The Financing Corporation |
| FNMA | — Federal National Mortgage Association |
| GDR | — Global depositary receipt |
| GNMA | — Government National Mortgage Association |
| HCFR | — Healthcare facilities revenue |
| HEFA | — Health & Educational Facilities Authority |
| HEFAR | — Higher education facilities authority revenue |
| HFA | — Housing Finance Authority |
| HFFA | — Health Facilities Financing Authority |
| HUD | — Department of Housing and Urban Development |
| IDA | — Industrial Development Authority |
| IDAG | — Industrial Development Agency |
| KRW | — Republic of Korea won |
| LIBOR | — London Interbank Offered Rate |
| LIFER | — Long Inverse Floating Exempt Receipts |
| LLC | — Limited liability company |
| LLLP | — Limited liability limited partnership |
| LLP | — Limited liability partnership |
| MBIA | — Municipal Bond Insurance Association |
| MFHR | — Multifamily housing revenue |
| MSTR | — Municipal securities trust receipts |
| MUD | — Municipal Utility District |
| National | — National Public Finance Guarantee Corporation |
| PCFA | — Pollution Control Financing Authority |
| PCL | — Public Company Limited |
| PCR | — Pollution control revenue |
| PFA | — Public Finance Authority |
| PFFA | — Public Facilities Financing Authority |
| PFOTER | — Puttable floating option tax-exempt receipts |
| plc | — Public limited company |
| PUTTER | — Puttable tax-exempt receipts |
| R&D | — Research & development |
| Radian | — Radian Asset Assurance |
| RAN | — Revenue anticipation notes |
| RDA | — Redevelopment Authority |
| RDFA | — Redevelopment Finance Authority |
| REIT | — Real estate investment trust |
| ROC | — Reset option certificates |
| SAVRS | — Select auction variable rate securities |
| SBA | — Small Business Authority |
| SDR | — Swedish depositary receipt |
| SFHR | — Single-family housing revenue |
| SFMR | — Single-family mortgage revenue |
| SPA | — Standby purchase agreement |
| SPDR | — Standard & Poor’s Depositary Receipts |
| SPEAR | — Short Puttable Exempt Adjustable Receipts |
| STRIPS | — Separate trading of registered interest and |
| TAN | — Tax anticipation notes |
| TIPS | — Treasury inflation-protected securities |
| TRAN | — Tax revenue anticipation notes |
| TTFA | — Transportation Trust Fund Authority |
| TVA | — Tennessee Valley Authority |

For more information
More information about Wells Fargo Funds is available free upon request. To obtain literature, please write, email, visit the Fund’s website, or call:
Wells Fargo Funds
P.O. Box 8266
Boston, MA 02266-8266
Email: fundservice@wellsfargo.com
Website: wellsfargofunds.com
Individual investors: 1-800-222-8222
Retail investment professionals: 1-888-877-9275
Institutional investment professionals: 1-866-765-0778
This report and the financial statements contained herein are submitted for the general information of the shareholders of the Fund. If this report is used for promotional purposes, distribution of the report must be accompanied or preceded by a current prospectus. Before investing, please consider the investment objectives, risks, charges, and expenses of the investment. For a current prospectus and, if available, a summary prospectus, containing this information, call 1-800-222-8222 or visit the Fund’s website at wellsfargofunds.com. Read the prospectus carefully before you invest or send money.
Wells Fargo Asset Management (WFAM) is a trade name used by the asset management businesses of Wells Fargo & Company. Wells Fargo Funds Management, LLC, a wholly owned subsidiary of Wells Fargo & Company, provides investment advisory and administrative services for Wells Fargo Funds. Other affiliates of Wells Fargo & Company provide subadvisory and other services for the funds. The funds are distributed by Wells Fargo Funds Distributor, LLC, Member FINRA, an affiliate of Wells Fargo & Company. Neither Wells Fargo Funds Management nor Wells Fargo Funds Distributor has Fund customer accounts/assets, and neither provides investment advice/recommendations or acts as an investment advice fiduciary to any investor.
NOT FDIC INSURED ◾ NO BANK GUARANTEE ◾ MAY LOSE VALUE
© 2016 Wells Fargo Funds Management, LLC. All rights reserved.
| | |
 | | 300476 02-17 SA248/SAR248 12-16 |
Semi-Annual Report
December 31, 2016

Wells Fargo California Tax-Free Fund


Reduce clutter. Save trees.
Sign up for electronic delivery of prospectuses and shareholder reports at wellsfargo.com/advantagedelivery
Contents
The views expressed and any forward-looking statements are as of December 31, 2016, unless otherwise noted, and are those of the Fund managers and/or Wells Fargo Funds Management, LLC. Discussions of individual securities, or the markets generally, or any Wells Fargo Fund are not intended as individual recommendations. Future events or results may vary significantly from those expressed in any forward-looking statements. The views expressed are subject to change at any time in response to changing circumstances in the market. Wells Fargo Funds Management, LLC and the Fund disclaim any obligation to publicly update or revise any views expressed or forward-looking statements.
NOT FDIC INSURED ◾ NO BANK GUARANTEE ◾ MAY LOSE VALUE
| | | | |
| 2 | | Wells Fargo California Tax-Free Fund | | Letter to shareholders (unaudited) |

Andrew Owen
President
Wells Fargo Funds
The Bloomberg Barclays Municipal Bond Index,1 a broad measure tracking investment-grade municipal bonds, lost 3.91% during the six-month reporting period.
Dear Shareholder:
As the new president of Wells Fargo Funds now that Karla Rabusch is retiring from that position after nearly 14 years, I am pleased to offer you this semi-annual report for the Wells Fargo California Tax-Free Fund for the six-month period that ended December 31, 2016. The Federal Reserve (Fed) raised the federal funds rate in December by 0.25%. Municipal bond yields rose sharply in the fourth quarter. The Bloomberg Barclays Municipal Bond Index,1 a broad measure tracking investment-grade municipal bonds, lost 3.91% during the six-month reporting period.
Municipal bond yields rose during the reporting period.
The municipal market reversed course in the second half of 2016, with yields increasing and prices declining. Initially the sell-off was driven by negative supply and demand trends, also known as technical factors. By the fourth quarter, fund flows turned negative (reversing a trend of 54 weeks of positive flows) and municipal bond supply increased. These deteriorating technical factors, along with the expectation of an expansionary fiscal policy and lower tax rates under the new administration, drove market volatility; credit spreads widened and the yield curve steepened as the market sold-off.
Stronger economic indicators drove monetary policy.
On December 14, the Fed hiked the short-term interest rate by 0.25% to reach a target range of 0.50% to 0.75%. This was the second rate increase in more than 10 years, with the Fed citing job gains and lower than expected unemployment of 4.6%. The Fed confirmed the continuation of an accommodative monetary policy to support a stronger labor market and reiterated its long-term objective of a 2% inflation rate, which increased slightly during the fourth quarter but fell short of the benchmark. The Fed expressed confidence in the economy’s progress and expects this positive trajectory to continue. Both sentiments helped to bolster the Fed’s expectation of three additional rate increases during 2017.
Meanwhile, the Bank of England continued its quantitative-easing program and lowered the official bank rate to 0.25% in August 2016. The Bank of Japan maintained its negative interest rate put in place earlier in the year, and in September announced an interest rate target for 10-year government bonds—keeping the yield at zero—as it struggles to accelerate economic growth. In December, the European Central Bank announced that it will extend its quantitative-easing program and continue purchasing large amounts of eurozone corporate and government debt each month through December 2017.
U.S. economic data released during the fourth quarter showed that U.S. real gross domestic product increased at an annual 3.5% rate in the third quarter, the largest increase since mid-2014. Business investment by U.S. companies was mixed, with a 12.0% increase in structures and 4.5% decrease in equipment over the prior quarter on an annualized basis. Consumer confidence hit pre-recession levels for the first time in November, and increased again in December. The dollar strengthened during the quarter’s post-election period.
Supply and demand trends reflected volatility of municipals.
Demand for municipal debt, as measured by cash flows to municipal bond mutual funds, was negative for the reporting period. There were $19 billion of inflows from July through October, but a sharp reversal occurred post-election, with $26 billion of redemptions in the last two months of the year. This followed a
| 1 | The Bloomberg Barclays Municipal Bond Index (formerly known as Barclays Municipal Bond Index) is an unmanaged index composed of long-term tax-exempt bonds with a minimum credit rating of Baa. You cannot invest directly in an index. |
| | | | | | |
| Letter to shareholders (unaudited) | | Wells Fargo California Tax-Free Fund | | | 3 | |
noteworthy 54 consecutive weeks of inflows. On the supply side, August through October saw 30-year record-breaking volumes each month; both refundings and
new issuance were up. These levels were attributed to deals pulled forward in anticipation of higher interest rates. Not surprisingly, December volume was down 25% year-over-year to $19 billion. Total municipal bond issuance for the period was $219 billion; new issuance outpaced refundings by $18 billion.
Municipal credit fundamentals were solid.
Overall, municipal credit was sound for the period. The most significant development was the election of Ricardo Rossello as governor of the Commonwealth of Puerto Rico. In the past, prices of Puerto Rico bonds reflected negative credit considerations, including defaults on its securities in 2015 and early 2016, but recent events point to a potentially more positive fiscal environment. Rossello campaigned, in part, on a platform that included promises to ultimately pay 100% of interest due on Puerto Rico’s outstanding municipal debt, negotiate with bondholders, and ration government expenditures. This stance is a major shift from his predecessor who focused on a bankruptcy mechanism.
Since the end of the financial crisis, structural changes in the fixed-income markets have reduced trading liquidity (the degree to which assets can be bought or sold without affecting the price). New regulations and capital requirements have caused traditional liquidity suppliers (banks and broker/dealers) to be more risk averse and hold less inventory. Meanwhile, corporate debt issuance has spiked as companies finance themselves at record-low yields, bond mutual funds hold larger amounts of this new debt supply, trading volumes are lower, and large-size trades are more difficult to execute. However, fixed-income markets appeared to function well over the past year with sufficient liquidity.
Don’t let short-term uncertainty derail long-term investment goals.
Periods of uncertainty can present challenges, but experience has taught us that maintaining long-term investment goals can be an effective way to plan for the future. To help you create a sound strategy based on your personal goals and risk tolerance, Wells Fargo Funds offers more than 100 mutual funds spanning a wide range of asset classes and investment styles. Although diversification cannot guarantee an investment profit or prevent losses, we believe it can be an effective way to manage investment risk and potentially smooth out overall portfolio performance. We encourage investors to know their investments and to understand that appropriate levels of risk-taking may unlock opportunities.
Thank you for choosing to invest in Wells Fargo Funds. We appreciate your confidence in us and remain committed to helping you meet your financial needs.
Sincerely,

Andrew Owen
President
Wells Fargo Funds
Periods of uncertainty can present challenges, but experience has taught us that maintaining long-term investment goals can be an effective way to plan for the future.
For further information about your Fund, contact your investment professional, visit our website at wellsfargofunds.com, or call us directly at 1-800-222-8222. We are available 24 hours a day, 7 days a week.
| | | | |
| 4 | | Wells Fargo California Tax-Free Fund | | Performance highlights (unaudited) |
Investment objective
The Fund seeks current income exempt from federal income tax and California individual income tax.
Manager
Wells Fargo Funds Management, LLC
Subadviser
Wells Capital Management Incorporated
Portfolio managers
Terry J. Goode
Robert J. Miller
Adrian Van Poppel
Average annual total returns (%) as of December 31, 20161
| | | | | | | | | | | | | | | | | | | | | | | | | | | | | | | | | | |
| | | | | Including sales charge | | | Excluding sales charge | | | Expense ratios2 (%) | |
| | | Inception date | | 1 year | | | 5 year | | | 10 year | | | 1 year | | | 5 year | | | 10 year | | | Gross | | | Net3 | |
| Class A (SCTAX) | | 10-6-1988 | | | (4.73 | ) | | | 3.58 | | | | 3.88 | | | | (0.21 | ) | | | 4.54 | | | | 4.36 | | | | 0.82 | | | | 0.75 | |
| Class C (SCTCX) | | 7-1-1993 | | | (1.98 | ) | | | 3.76 | | | | 3.58 | | | | (0.98 | ) | | | 3.76 | | | | 3.58 | | | | 1.57 | | | | 1.50 | |
| Administrator Class (SGCAX) | | 12-15-1997 | | | – | | | | – | | | | – | | | | (0.09 | ) | | | 4.75 | | | | 4.58 | | | | 0.76 | | | | 0.55 | |
| Institutional Class (SGTIX) | | 10-31-2014 | | | – | | | | – | | | | – | | | | (0.02 | ) | | | 4.78 | | | | 4.60 | | | | 0.49 | | | | 0.48 | |
| Bloomberg Barclays Municipal Bond Index4 | | – | | | – | | | | – | | | | – | | | | 0.25 | | | | 3.28 | | | | 4.25 | | | | – | | | | – | |
| Bloomberg Barclays California Municipal Bond Index5 | | – | | | – | | | | – | | | | – | | | | (0.14 | ) | | | 3.85 | | | | 4.44 | | | | – | | | | – | |
Figures quoted represent past performance, which is no guarantee of future results, and do not reflect taxes that a shareholder may pay on fund distributions or the redemption of fund shares. Investment return and principal value of an investment will fluctuate so that an investor’s shares, when redeemed, may be worth more or less than their original cost. Performance shown without sales charges would be lower if sales charges were reflected. Current performance may be lower or higher than the performance data quoted, which assumes the reinvestment of dividends and capital gains. Current month-end performance is available on the Fund’s website, wellsfargofunds.com.
Index returns do not include transaction costs associated with buying and selling securities, any mutual fund fees or expenses, or any taxes. It is not possible to invest directly in an index.
For Class A shares, the maximum front-end sales charge is 4.50%. For Class C shares, the maximum contingent deferred sales charge is 1.00%. Performance including a contingent deferred sales charge assumes the sales charge for the corresponding time period. Administrator Class and Institutional Class shares are sold without a front-end sales charge or contingent deferred sales charge.
Bond values fluctuate in response to the financial condition of individual issuers, general market and economic conditions, and changes in interest rates. Changes in market conditions and government policies may lead to periods of heightened volatility in the bond market and reduced liquidity for certain bonds held by the Fund. In general, when interest rates rise, bond values fall and investors may lose principal value. Interest-rate changes and their impact on the Fund and its share price can be sudden and unpredictable. The use of derivatives may reduce returns and/or increase volatility. Certain investment strategies tend to increase the total risk of an investment (relative to the broader market). The Fund is exposed to California municipal securities risk, high-yield securities risk, and non-diversification risk. Consult the Fund’s prospectus for additional information on these and other risks. A portion of the Fund’s income may be subject to federal, state, and/or local income taxes or the Alternative Minimum Tax (AMT). Any capital gains distributions may be taxable.
Please see footnotes on page 5.
| | | | | | |
| Performance highlights (unaudited) | | Wells Fargo California Tax-Free Fund | | | 5 | |
|
| Effective maturity distribution as of December 31, 20166 |
|
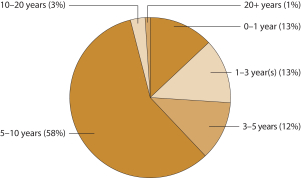 |
|
| Credit quality as of December 31, 20167 |
|
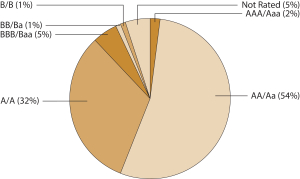 |
| 1 | Historical performance shown for the Institutional Class shares prior to their inception reflects the performance of the Administrator Class shares, and is not adjusted to reflect the Institutional Class expenses. If these expenses had been included, returns for the Institutional Class would be higher. |
| 2 | Reflects the expense ratios as stated in the most recent prospectuses. The expense ratios shown are subject to change and may differ from the annualized expense ratios shown in the financial highlights of this report. |
| 3 | The manager has contractually committed through October 31, 2017, to waive fees and/or reimburse expenses to the extent necessary to cap the Fund’s Total Annual Fund Operating Expenses After Fee Waiver at the amounts shown. After this time, the cap may be increased or the commitment to maintain the cap may be terminated only with the approval of the Board of Trustees. Brokerage commissions, stamp duty fees, interest, taxes, acquired fund fees and expenses, and extraordinary expenses are excluded from the expense cap. Without this cap, the Fund’s returns would have been lower. |
| 4 | The Bloomberg Barclays Municipal Bond Index (formerly known as Barclays Municipal Bond Index) is an unmanaged index composed of long-term tax-exempt bonds with a minimum credit rating of Baa. You cannot invest directly in an index. |
| 5 | The Bloomberg Barclays California Municipal Bond Index (formerly known as Barclays California Municipal Bond Index) is the California component of the Bloomberg Barclays Municipal Bond Index. You cannot invest directly in an index. |
| 6 | Amounts are calculated based on the total investments of the Fund. These amounts are subject to change and may have changed since the date specified. |
| 7 | The credit quality distribution of portfolio holdings reflected in the chart is based on ratings from Standard & Poor’s, Moody’s Investors Service, and/ or Fitch Ratings Ltd. Credit quality ratings apply to the underlying holdings of the Fund and not to the Fund itself. The percentages of the Fund’s portfolio with the ratings depicted in the chart are calculated based on the total market value of fixed income securities held by the Fund. If a security was rated by all three rating agencies, the middle rating was utilized. If rated by two of three rating agencies, the lower rating was utilized, and if rated by one of the rating agencies, that rating was utilized. Standard & Poor’s rates the creditworthiness of bonds, ranging from AAA (highest) to D (lowest). Ratings from A to CCC may be modified by the addition of a plus (+) or minus (-) sign to show relative standing within the rating categories. Standard & Poor’s rates the creditworthiness of short-term notes from SP-1 (highest) to SP-3 (lowest). Moody’s rates the creditworthiness of bonds, ranging from Aaa (highest) to C (lowest). Ratings Aa to B may be modified by the addition of a number 1 (highest) to 3 (lowest) to show relative standing within the ratings categories. Moody’s rates the creditworthiness of short-term U.S. tax-exempt municipal securities from MIG 1/VMIG 1 (highest) to SG (lowest). Fitch rates the creditworthiness of bonds, ranging from AAA (highest) to D (lowest). Credit quality distribution is subject to change and may have changed since the date specified. |
| | | | |
| 6 | | Wells Fargo California Tax-Free Fund | | Fund expenses (unaudited) |
As a shareholder of the Fund, you incur two types of costs: (1) transaction costs, including sales charges (loads) on purchase payments and contingent deferred sales charges (if any) on redemptions and (2) ongoing costs, including management fees, distribution (12b-1) and/or shareholder servicing fees, and other Fund expenses. This example is intended to help you understand your ongoing costs (in dollars) of investing in the Fund and to compare these costs with the ongoing costs of investing in other mutual funds.
The example is based on an investment of $1,000 invested at the beginning of the six-month period and held for the entire period from July 1, 2016 to December 31, 2016.
Actual expenses
The “Actual” line of the table below provides information about actual account values and actual expenses. You may use the information in this line, together with the amount you invested, to estimate the expenses that you paid over the period. Simply divide your account value by $1,000 (for example, an $8,600 account value divided by $1,000 = 8.6), then multiply the result by the number in the “Actual” line under the heading entitled “Expenses paid during period” for your applicable class of shares to estimate the expenses you paid on your account during this period.
Hypothetical example for comparison purposes
The “Hypothetical” line of the table below provides information about hypothetical account values and hypothetical expenses based on the Fund’s actual expense ratio and an assumed rate of return of 5% per year before expenses, which is not the Fund’s actual return. The hypothetical account values and expenses may not be used to estimate the actual ending account balance or expenses you paid for the period. You may use this information to compare the ongoing costs of investing in the Fund and other funds. To do so, compare this 5% hypothetical example with the 5% hypothetical examples that appear in the shareholder reports of the other funds.
Please note that the expenses shown in the table are meant to highlight your ongoing costs only and do not reflect any transactional costs, such as sales charges (loads) and contingent deferred sales charges. Therefore, the “Hypothetical” line of the table is useful in comparing ongoing costs only and will not help you determine the relative total costs of owning different funds. In addition, if these transactional costs were included, your costs would have been higher.
| | | | | | | | | | | | | | | | |
| | | Beginning
account value
7-1-2016 | | | Ending
account value
12-31-2016 | | | Expenses
paid during
the period¹ | | | Annualized net
expense ratio | |
Class A | | | | | | | | | | | | | | | | |
Actual | | $ | 1,000.00 | | | $ | 949.53 | | | $ | 3.68 | | | | 0.75 | % |
Hypothetical (5% return before expenses) | | $ | 1,000.00 | | | $ | 1,021.37 | | | $ | 3.81 | | | | 0.75 | % |
Class C | | | | | | | | | | | | | | | | |
Actual | | $ | 1,000.00 | | | $ | 945.62 | | | $ | 7.34 | | | | 1.50 | % |
Hypothetical (5% return before expenses) | | $ | 1,000.00 | | | $ | 1,017.60 | | | $ | 7.61 | | | | 1.50 | % |
Administrator Class | | | | | | | | | | | | | | | | |
Actual | | $ | 1,000.00 | | | $ | 949.84 | | | $ | 2.70 | | | | 0.55 | % |
Hypothetical (5% return before expenses) | | $ | 1,000.00 | | | $ | 1,022.37 | | | $ | 2.80 | | | | 0.55 | % |
Institutional Class | | | | | | | | | | | | | | | | |
Actual | | $ | 1,000.00 | | | $ | 950.18 | | | $ | 2.35 | | | | 0.48 | % |
Hypothetical (5% return before expenses) | | $ | 1,000.00 | | | $ | 1,022.72 | | | $ | 2.44 | | | | 0.48 | % |
| 1 | Expenses paid is equal to the annualized net expense ratio of each class multiplied by the average account value over the period, multiplied by the number of days in the most recent fiscal half-year divided by the number of days in the fiscal year (to reflect the one-half-year period). |
| | | | | | |
| Portfolio of investments—December 31, 2016 (unaudited) | | Wells Fargo California Tax-Free Fund | | | 7 | |
| | | | | | | | | | | | | | | | |
| Security name | | Interest rate | | | Maturity date | | | Principal | | | Value | |
| | | | |
Municipal Obligations: 97.87% | | | | | | | | | | | | | | | | |
| | | | |
| California: 95.95% | | | | | | | | | | | | | | | | |
ABC Unified School District CAB Election of 1997 Series B (GO Revenue, National Insured) ¤ | | | 0.00 | % | | | 8-1-2018 | | | $ | 1,500,000 | | | $ | 1,465,275 | |
Alameda County CA Corridor Transportation Authority CAB Subordinated Lien Series A (Transportation Revenue, Ambac Insured) ¤ | | | 0.00 | | | | 10-1-2018 | | | | 2,955,000 | | | | 2,881,095 | |
Alameda County CA Corridor Transportation Authority CAB Subordinated Lien Series A (Transportation Revenue, Ambac Insured) ¤ | | | 0.00 | | | | 10-1-2018 | | | | 940,000 | | | | 910,296 | |
Alameda County CA Corridor Transportation Authority CAB Subordinated Lien Series A (Transportation Revenue, Ambac Insured) ¤ | | | 0.00 | | | | 10-1-2019 | | | | 2,780,000 | | | | 2,650,869 | |
Alameda County CA Corridor Transportation Authority CAB Subordinated Lien Series A (Transportation Revenue, Ambac Insured) ¤ | | | 0.00 | | | | 10-1-2019 | | | | 220,000 | | | | 207,618 | |
Alameda County CA Corridor Transportation Authority CAB Subordinated Lien Series A (Transportation Revenue, Ambac Insured) | | | 5.25 | | | | 10-1-2021 | | | | 3,000,000 | | | | 3,095,220 | |
Alameda County CA Corridor Transportation Authority CAB Subordinated Lien Series B (Transportation Revenue, AGM Insured) | | | 4.00 | | | | 10-1-2037 | | | | 2,215,000 | | | | 2,229,132 | |
Alameda County CA Corridor Transportation Authority CAB Subordinated Lien Series B (Transportation Revenue) | | | 5.00 | | | | 10-1-2037 | | | | 1,500,000 | | | | 1,631,430 | |
Alameda CA Joint Powers Authority Multiple Capital Projects Series A (Miscellaneous Revenue) | | | 5.00 | | | | 12-1-2034 | | | | 1,005,000 | | | | 1,138,454 | |
Alhambra CA Unified School District Election of 2008 Series B (GO Revenue, AGM Insured) | | | 6.00 | | | | 8-1-2029 | | | | 4,100,000 | | | | 4,856,614 | |
Alisal CA Unified School District CAB Election of 2006 Series A (GO Revenue, AGC Insured) ¤ | | | 0.00 | | | | 8-1-2017 | | | | 1,105,000 | | | | 1,097,320 | |
Alvord CA Unified School District Election of 2012 Series A (GO Revenue, AGM Insured) | | | 5.25 | | | | 8-1-2037 | | | | 1,620,000 | | | | 1,841,503 | |
Anaheim CA Housing & Public Improvements Authority Series A (Water & Sewer Revenue) | | | 5.00 | | | | 10-1-2046 | | | | 2,250,000 | | | | 2,476,598 | |
Anaheim CA PFA CAB Sub Lien Public Improvements Project Series C (Miscellaneous Revenue, AGM Insured) ¤ | | | 0.00 | | | | 9-1-2018 | | | | 4,455,000 | | | | 4,324,602 | |
Anaheim CA PFA CAB Sub Lien Public Improvements Project Series C (Miscellaneous Revenue, AGM Insured) ¤ | | | 0.00 | | | | 9-1-2025 | | | | 10,000,000 | | | | 7,559,500 | |
Anaheim CA PFA Convention Center Expansion Project Series A (Miscellaneous Revenue) | | | 5.00 | | | | 5-1-2039 | | | | 3,000,000 | | | | 3,315,360 | |
Anaheim CA PFA Convention Center Expansion Project Series A (Miscellaneous Revenue) | | | 5.00 | | | | 5-1-2046 | | | | 3,000,000 | | | | 3,282,690 | |
Antelope Valley CA Healthcare District Refunding Bond Series A (Health Revenue) | | | 5.25 | | | | 3-1-2036 | | | | 3,000,000 | | | | 3,011,910 | |
Banning CA Financing Authority Refunding Bond Electric System Project (Utilities Revenue, AGM Insured) | | | 5.00 | | | | 6-1-2037 | | | | 5,000,000 | | | | 5,558,100 | |
Bassett CA Unified School District Refunding Bond Series B (GO Revenue, Build America Mutual Assurance Company Insured) | | | 5.00 | | | | 8-1-2027 | | | | 1,050,000 | | | | 1,228,395 | |
Bay Area CA Toll Authority Toll Bridge Series S-4 (Transportation Revenue) | | | 5.00 | | | | 4-1-2030 | | | | 2,000,000 | | | | 2,276,520 | |
Bay Area CA Water Supply & Conservation Agency Series A (Water & Sewer Revenue) | | | 5.00 | | | | 10-1-2034 | | | | 6,000,000 | | | | 6,774,120 | |
Belmont CA Community Facilities Special Tax District #2000-1 Library Project Series A (Tax Revenue, Ambac Insured) | | | 5.75 | | | | 8-1-2030 | | | | 3,190,000 | | | | 4,004,088 | |
Cabrillo CA Unified School District CAB Series A (GO Revenue, Ambac Insured) ¤ | | | 0.00 | | | | 8-1-2021 | | | | 1,500,000 | | | | 1,336,380 | |
California (GO Revenue) | | | 5.00 | | | | 8-1-2025 | | | | 30,000 | | | | 30,108 | |
California (GO Revenue) | | | 5.00 | | | | 8-1-2025 | | | | 4,970,000 | | | | 4,987,147 | |
California (GO Revenue) | | | 5.25 | | | | 8-1-2038 | | | | 1,925,000 | | | | 2,031,183 | |
California (GO Revenue) | | | 5.25 | | | | 11-1-2040 | | | | 3,000,000 | | | | 3,334,530 | |
California AMT Department of Veterans Affairs Series BZ (GO Revenue, National Insured) | | | 5.35 | | | | 12-1-2021 | | | | 5,000 | | | | 5,012 | |
The accompanying notes are an integral part of these financial statements.
| | | | |
| 8 | | Wells Fargo California Tax-Free Fund | | Portfolio of investments—December 31, 2016 (unaudited) |
| | | | | | | | | | | | | | | | |
| Security name | | Interest rate | | | Maturity date | | | Principal | | | Value | |
| | | | |
| California (continued) | | | | | | | | | | | | | | | | |
California Association of Bay Area Governments Finance Authority for Nonprofit Corporations O’Connor Woods Project (Health Revenue) | | | 5.00 | % | | | 1-1-2043 | | | $ | 5,000,000 | | | $ | 5,605,000 | |
California Association of Bay Area Governments Finance Authority for Nonprofit Corporations Odd Fellows Home Project Series A (Health Revenue) | | | 5.00 | | | | 4-1-2042 | | | | 1,100,000 | | | | 1,229,184 | |
California Educational Facilities Authority Pepperdine University Refunding Bond (Education Revenue) | | | 5.00 | | | | 10-1-2046 | | | | 8,000,000 | | | | 9,090,080 | |
California Financial Authority Charter School Rocketship Education Series A (Education Revenue) 144A | | | 5.00 | | | | 6-1-2036 | | | | 945,000 | | | | 916,404 | |
California Financial Authority Charter School Rocketship Education Series A (Education Revenue) 144A | | | 5.00 | | | | 6-1-2046 | | | | 2,100,000 | | | | 1,973,853 | |
California Health Facilities Financing Authority Refunding Bond Cedars Sinai Medical Center Series B (Health Revenue) | | | 4.00 | | | | 8-15-2039 | | | | 10,500,000 | | | | 10,574,865 | |
California Health Facilities Financing Authority Refunding Bond Sutter Health Project Series B (Health Revenue) | | | 5.00 | | | | 11-15-2035 | | | | 1,000,000 | | | | 1,135,920 | |
California HFA AMT Home Mortgage Series G (Housing Revenue) | | | 5.50 | | | | 8-1-2042 | | | | 165,000 | | | | 165,606 | |
California HFA AMT Home Mortgage Series K (Housing Revenue) | | | 5.30 | | | | 8-1-2023 | | | | 2,520,000 | | | | 2,541,319 | |
California HFFA Catholic Healthcare West Series A (Health Revenue) | | | 5.25 | | | | 3-1-2023 | | | | 3,000,000 | | | | 3,349,050 | |
California HFFA Catholic Healthcare West Series A (Health Revenue) | | | 6.00 | | | | 7-1-2029 | | | | 4,000,000 | | | | 4,446,800 | |
California HFFA Nevada Methodist Homes (Health Revenue, California Mortgage Insured) | | | 5.00 | | | | 7-1-2030 | | | | 1,830,000 | | | | 2,085,212 | |
California HFFA Nevada Methodist Homes (Health Revenue, California Mortgage Insured) | | | 5.00 | | | | 7-1-2035 | | | | 1,000,000 | | | | 1,111,050 | |
California HFFA Nevada Methodist Homes (Health Revenue, California Mortgage Insured) | | | 5.00 | | | | 7-1-2045 | | | | 4,500,000 | | | | 4,923,450 | |
California HFFA Prerefunded Bond Providence Health Services Series C (Health Revenue) | | | 6.50 | | | | 10-1-2038 | | | | 100,000 | | | | 109,080 | |
California HFFA Sutter Health Series A (Health Revenue) | | | 5.00 | | | | 8-15-2043 | | | | 1,250,000 | | | | 1,375,800 | |
California HFFA Sutter Health Series D (Health Revenue) | | | 5.25 | | | | 8-15-2031 | | | | 3,100,000 | | | | 3,556,165 | |
California Infrastructure & Economic Development King City Joint Union High School (Miscellaneous Revenue) | | | 5.75 | | | | 8-15-2029 | | | | 2,150,000 | | | | 2,399,938 | |
California Municipal Finance Authority California Baptist University Series A (Education Revenue) 144A | | | 5.00 | | | | 11-1-2025 | | | | 1,025,000 | | | | 1,064,996 | |
California Municipal Finance Authority Charter School Albert Einstein Academies Project Series A (Miscellaneous Revenue) | | | 6.75 | | | | 8-1-2033 | | | | 1,525,000 | | | | 1,649,135 | |
California Municipal Finance Authority Charter School Albert Einstein Academies Project Series A (Miscellaneous Revenue) | | | 7.13 | | | | 8-1-2043 | | | | 1,000,000 | | | | 1,096,800 | |
California Municipal Finance Authority NorthBay Healthcare Group Series A (Health Revenue) | | | 5.00 | | | | 11-1-2027 | | | | 1,000,000 | | | | 1,093,470 | |
California Municipal Finance Authority NorthBay Healthcare Group Series A (Health Revenue) | | | 5.00 | | | | 11-1-2028 | | | | 500,000 | | | | 547,240 | |
California Municipal Financing Authority BAN Open Door Community Health Centers (Health Revenue) | | | 2.80 | | | | 9-15-2018 | | | | 3,000,000 | | | | 3,025,410 | |
California Municipal Financing Authority California Baptist University Series A (Education Revenue) 144A | | | 4.00 | | | | 11-1-2021 | | | | 850,000 | | | | 853,307 | |
California Municipal Financing Authority Certificate of Participation Community Hospitals of Central California (Health Revenue) | | | 5.00 | | | | 2-1-2020 | | | | 415,000 | | | | 416,461 | |
California Municipal Financing Authority Certificate of Participation Community Hospitals of Central California (Health Revenue) | | | 5.00 | | | | 2-1-2020 | | | | 585,000 | | | | 586,591 | |
California Municipal Financing Authority Charter School Palmdale Aerospace Academy Project (Education Revenue) 144A | | | 5.00 | | | | 7-1-2041 | | | | 1,250,000 | | | | 1,225,775 | |
California Municipal Financing Authority University of the Pacific Program (Education Revenue) | | | 5.00 | | | | 11-1-2048 | | | | 1,750,000 | | | | 1,886,395 | |
The accompanying notes are an integral part of these financial statements.
| | | | | | |
| Portfolio of investments—December 31, 2016 (unaudited) | | Wells Fargo California Tax-Free Fund | | | 9 | |
| | | | | | | | | | | | | | | | |
| Security name | | Interest rate | | | Maturity date | | | Principal | | | Value | |
| | | | |
| California (continued) | | | | | | | | | | | | | | | | |
California PFOTER Series DCL-009 (GO Revenue, Dexia Credit Local LOC, AGM Insured) 144Aø | | | 0.90 | % | | | 8-1-2027 | | | $ | 15,335,000 | | | $ | 15,335,000 | |
California PFOTER Series DCL-010 (GO Revenue, Dexia Credit Local LOC, AGM Insured) 144Aø | | | 0.90 | | | | 8-1-2027 | | | | 21,220,000 | | | | 21,220,000 | |
California PFOTER Series DCL-011 (GO Revenue, Dexia Credit Local LOC, AGM Insured) 144Aø | | | 0.90 | | | | 8-1-2027 | | | | 14,525,000 | | | | 14,525,000 | |
California Public Works Board California State University Projects Series B-1 (Miscellaneous Revenue) | | | 5.70 | | | | 3-1-2035 | | | | 2,210,000 | | | | 2,469,388 | |
California Public Works Board Judicial Council Projects Series A (Miscellaneous Revenue) | | | 5.00 | | | | 3-1-2038 | | | | 7,000,000 | | | | 7,712,390 | |
California Public Works Board Judicial Council Projects Series D (Miscellaneous Revenue) | | | 5.25 | | | | 12-1-2025 | | | | 4,000,000 | | | | 4,573,480 | |
California Public Works Board Various Capital Projects Series A (Miscellaneous Revenue) | | | 5.00 | | | | 4-1-2037 | | | | 4,925,000 | | | | 5,455,718 | |
California Public Works Board Various Capital Projects Series G (Miscellaneous Revenue) | | | 5.00 | | | | 11-1-2037 | | | | 23,000,000 | | | | 25,732,400 | |
California Public Works Board Various Capital Projects Series I (Miscellaneous Revenue) | | | 5.50 | | | | 11-1-2033 | | | | 2,000,000 | | | | 2,366,680 | |
California Public Works University of California Board of Regents Series G (Miscellaneous Revenue) | | | 5.00 | | | | 12-1-2030 | | | | 9,850,000 | | | | 11,282,387 | |
California Refunding Bond (GO Revenue) | | | 5.00 | | | | 9-1-2034 | | | | 1,975,000 | | | | 2,288,156 | |
California Refunding Bond Bid Group C (GO Revenue) | | | 5.00 | | | | 8-1-2033 | | | | 2,000,000 | | | | 2,327,420 | |
California School Finance Authority Green Dot Public Schools Projects (Education Revenue) 144A | | | 4.00 | | | | 8-1-2025 | | | | 475,000 | | | | 491,402 | |
California School Finance Authority Green Dot Public Schools Projects (Education Revenue) 144A | | | 5.00 | | | | 8-1-2035 | | | | 2,525,000 | | | | 2,686,120 | |
California School Finance Authority KIPP Louisiana School Projects Series A (Education Revenue) 144A | | | 5.00 | | | | 7-1-2035 | | | | 1,000,000 | | | | 1,039,300 | |
California Special District Association Finance Corporation Program Series MM (Miscellaneous Revenue) | | | 5.50 | | | | 6-1-2021 | | | | 615,000 | | | | 616,722 | |
California Statewide CDA Adventist Health System Series A (Health Revenue) | | | 5.00 | | | | 3-1-2045 | | | | 2,500,000 | | | | 2,724,250 | |
California Statewide CDA Catholic Healthcare West Series A (Health Revenue) | | | 5.50 | | | | 7-1-2030 | | | | 2,940,000 | | | | 3,007,385 | |
California Statewide CDA Certificate of Participation Internext Group (Health Revenue) | | | 5.38 | | | | 4-1-2017 | | | | 100,000 | | | | 100,387 | |
California Statewide CDA Enloe Medical Center (Health Revenue, Ambac Insured) | | | 5.00 | | | | 8-15-2033 | | | | 1,650,000 | | | | 1,863,857 | |
California Statewide CDA Enloe Medical Center (Health Revenue, Ambac Insured) | | | 5.00 | | | | 8-15-2035 | | | | 1,000,000 | | | | 1,117,930 | |
California Statewide CDA Enloe Medical Center (Health Revenue, Ambac Insured) | | | 5.00 | | | | 8-15-2038 | | | | 3,000,000 | | | | 3,321,630 | |
California Statewide CDA Loma Linda University Medical Center Refunding Bond Series A (Health Revenue) | | | 5.25 | | | | 12-1-2044 | | | | 5,150,000 | | | | 5,283,900 | |
California Statewide CDA Poway Retirement Housing Foundation Housing Incorporated Series A (Housing Revenue) | | | 5.25 | | | | 11-15-2035 | | | | 1,500,000 | | | | 1,732,380 | |
California Statewide CDA Redwoods Projects (Health Revenue) | | | 5.13 | | | | 11-15-2035 | | | | 1,500,000 | | | | 1,713,660 | |
California Statewide CDA School Facility Alliance for College-Ready Public Schools (Education Revenue) | | | 6.75 | | | | 7-1-2031 | | | | 1,625,000 | | | | 1,825,980 | |
California Statewide CDA School Facility Aspire Public Schools (Education Revenue) | | | 5.00 | | | | 7-1-2020 | | | | 1,275,000 | | | | 1,330,016 | |
California Statewide CDA School Facility Aspire Public Schools (Education Revenue) | | | 5.20 | | | | 7-1-2020 | | | | 270,000 | | | | 282,442 | |
California Statewide CDA Senior Living Health Facilities Los Angeles Jewish Home for the Aging Series D (Health Revenue) | | | 4.75 | | | | 8-1-2020 | | | | 1,000,000 | | | | 1,000,330 | |
California Statewide CDA St. Joseph Health System (Health Revenue, AGM Insured) | | | 5.25 | | | | 7-1-2021 | | | | 1,775,000 | | | | 1,883,115 | |
The accompanying notes are an integral part of these financial statements.
| | | | |
| 10 | | Wells Fargo California Tax-Free Fund | | Portfolio of investments—December 31, 2016 (unaudited) |
| | | | | | | | | | | | | | | | |
| Security name | | Interest rate | | | Maturity date | | | Principal | | | Value | |
| | | | |
| California (continued) | | | | | | | | | | | | | | | | |
California Statewide CDA Student Housing CHF-Irvine LLC Refunding Bond (Housing Revenue) | | | 5.00 | % | | | 5-15-2032 | | | $ | 1,250,000 | | | $ | 1,362,175 | |
California Statewide CDA Water & Wastewater Pooled Financing Program Series B (Water & Sewer Revenue, AGM Insured) | | | 5.25 | | | | 10-1-2027 | | | | 1,040,000 | | | | 1,043,526 | |
California Statewide Index Floating Rate Bonds Series B (GO Revenue) ± | | | 1.19 | | | | 12-1-2031 | | | | 2,500,000 | | | | 2,466,250 | |
California University Systemwide Refunding Bond Series A (Education Revenue) | | | 4.00 | | | | 11-1-2038 | | | | 8,000,000 | | | | 8,194,080 | |
California University Systemwide Refunding Bond Series A (Education Revenue) | | | 5.00 | | | | 11-1-2045 | | | | 6,400,000 | | | | 7,256,832 | |
California Various Purpose Refunding Bond (GO Revenue) | | | 4.00 | | | | 9-1-2035 | | | | 10,000,000 | | | | 10,381,800 | |
California Various Purpose Refunding Bond (GO Revenue) | | | 5.00 | | | | 9-1-2035 | | | | 35,000,000 | | | | 40,391,400 | |
California Various Purposes (GO Revenue) | | | 4.00 | | | | 9-1-2045 | | | | 1,500,000 | | | | 1,533,780 | |
California Various Purposes (GO Revenue) | | | 5.00 | | | | 9-1-2029 | | | | 1,475,000 | | | | 1,665,806 | |
California Various Purposes (GO Revenue) | | | 5.00 | | | | 10-1-2029 | | | | 7,000,000 | | | | 7,593,880 | |
California Various Purposes (GO Revenue) | | | 5.00 | | | | 9-1-2032 | | | | 5,100,000 | | | | 5,808,033 | |
California Various Purposes (GO Revenue) | | | 5.00 | | | | 6-1-2037 | | | | 4,215,000 | | | | 4,288,130 | |
California Various Purposes (GO Revenue) | | | 5.00 | | | | 2-1-2038 | | | | 5,000,000 | | | | 5,573,000 | |
California Various Purposes (GO Revenue) | | | 5.13 | | | | 4-1-2033 | | | | 6,735,000 | | | | 7,021,978 | |
California Various Purposes (GO Revenue) | | | 5.25 | | | | 9-1-2028 | | | | 5,000,000 | | | | 5,706,950 | |
California Various Purposes (GO Revenue) | | | 5.25 | | | | 10-1-2029 | | | | 800,000 | | | | 873,664 | |
California Various Purposes (GO Revenue) | | | 5.25 | | | | 4-1-2035 | | | | 12,640,000 | | | | 14,255,013 | |
California Various Purposes (GO Revenue) | | | 5.25 | | | | 3-1-2038 | | | | 2,300,000 | | | | 2,395,795 | |
California Various Purposes (GO Revenue) | | | 5.60 | | | | 3-1-2036 | | | | 8,715,000 | | | | 9,708,249 | |
California Various Purposes (GO Revenue) | | | 5.75 | | | | 4-1-2029 | | | | 1,600,000 | | | | 1,742,032 | |
California Various Purposes (GO Revenue) | | | 5.75 | | | | 4-1-2031 | | | | 3,380,000 | | | | 3,689,473 | |
California Various Purposes (GO Revenue) | | | 6.00 | | | | 4-1-2035 | | | | 2,140,000 | | | | 2,338,250 | |
California Various Purposes (GO Revenue) | | | 6.00 | | | | 4-1-2038 | | | | 23,465,000 | | | | 25,611,578 | |
Cathedral City CA Redevelopment Agency Successor Agency Tax Allocation Merged Redevelopment Project Area Series A (Tax Revenue, AGM Insured) | | | 5.00 | | | | 8-1-2032 | | | | 1,450,000 | | | | 1,607,006 | |
Cathedral City CA Redevelopment Agency Successor Agency Tax Allocation Merged Redevelopment Project Area Series A (Tax Revenue, AGM Insured) | | | 5.00 | | | | 8-1-2033 | | | | 880,000 | | | | 970,957 | |
Center California Unified School District CAB Series C (GO Revenue, National Insured) ¤ | | | 0.00 | | | | 9-1-2021 | | | | 5,000,000 | | | | 4,479,000 | |
Centinela Valley CA Union High School District Election of 2008 Series B (GO Revenue) | | | 6.00 | | | | 8-1-2036 | | | | 2,500,000 | | | | 3,103,275 | |
Centinela Valley CA Union High School District Election of 2008 Series C (GO Revenue) | | | 5.00 | | | | 8-1-2035 | | | | 2,000,000 | | | | 2,259,400 | |
Central Valley CA School District Financing Authority Series A (Miscellaneous Revenue, National Insured) | | | 6.45 | | | | 2-1-2018 | | | | 660,000 | | | | 675,649 | |
Cerritos CA Community College CAB Election of 2004 (GO Revenue) ¤ | | | 0.00 | | | | 8-1-2029 | | | | 1,750,000 | | | | 1,102,710 | |
Cerritos CA Community College CAB Election of 2004 (GO Revenue) ¤ | | | 0.00 | | | | 8-1-2033 | | | | 1,500,000 | | | | 785,310 | |
Chico CA PFA Redevelopment Project Area (Tax Revenue, National Insured) | | | 5.13 | | | | 4-1-2021 | | | | 3,000,000 | | | | 3,029,880 | |
Chula Vista CA Redevelopment Agency (Tax Revenue, AGM Insured) | | | 5.00 | | | | 10-1-2027 | | | | 1,480,000 | | | | 1,750,944 | |
College of the Sequoias Tulare Area Improvement District #3 California CAB Election of 2008 Series A (GO Revenue, AGC Insured) ¤ | | | 0.00 | | | | 8-1-2024 | | | | 1,000,000 | | | | 802,090 | |
Compton CA Community College CAB Election of 2002 Series C (GO Revenue) ¤ | | | 0.00 | | | | 8-1-2035 | | | | 3,445,000 | | | | 1,514,801 | |
Compton CA Community College RDA Project 2nd Lien Series A (Tax Revenue) | | | 5.00 | | | | 8-1-2020 | | | | 1,140,000 | | | | 1,208,822 | |
Compton CA PFA Refunding Bond (Miscellaneous Revenue) 144A | | | 4.00 | | | | 9-1-2027 | | | | 3,800,000 | | | | 3,651,116 | |
Compton CA PFA Refunding Bond (Miscellaneous Revenue) 144A | | | 4.50 | | | | 9-1-2032 | | | | 2,000,000 | | | | 1,941,400 | |
Contra Costa County CA Community College District Election of 2006 (GO Revenue) | | | 5.00 | | | | 8-1-2038 | | | | 3,250,000 | | | | 3,681,405 | |
The accompanying notes are an integral part of these financial statements.
| | | | | | |
| Portfolio of investments—December 31, 2016 (unaudited) | | Wells Fargo California Tax-Free Fund | | | 11 | |
| | | | | | | | | | | | | | | | |
| Security name | | Interest rate | | | Maturity date | | | Principal | | | Value | |
| | | | |
| California (continued) | | | | | | | | | | | | | | | | |
Contra Costa County CA Home GNMA Mortgage-Backed Securities Program (Housing Revenue, GNMA Insured) | | | 7.75 | % | | | 5-1-2022 | | | $ | 150,000 | | | $ | 173,115 | |
Delano CA Union High School Election of 2010 Series B (GO Revenue, AGM Insured) | | | 5.75 | | | | 8-1-2035 | | | | 4,510,000 | | | | 5,084,033 | |
Dinuba CA Redevelopment Agency Merged City Redevelopment Project (Tax Revenue, Build America Mutual Assurance Company Insured) | | | 5.00 | | | | 9-1-2033 | | | | 1,500,000 | | | | 1,692,060 | |
East Bay CA Municipal Utility District Water System Series B (Water & Sewer Revenue) | | | 4.00 | | | | 6-1-2045 | | | | 2,160,000 | | | | 2,231,755 | |
El Dorado CA Irrigation District Refunding Bond Series A (Water & Sewer Revenue, AGM Insured) | | | 5.25 | | | | 3-1-2039 | | | | 2,000,000 | | | | 2,270,320 | |
Elk Grove CA Financing Authority Special Tax Refunding Bond (Tax Revenue, Build America Mutual Assurance Company Insured) | | | 5.00 | | | | 9-1-2038 | | | | 1,500,000 | | | | 1,670,490 | |
Elsinore Valley CA Municipal Water District Financing Authority Refunding Bond Series A (Water & Sewer Revenue) | | | 5.00 | | | | 7-1-2027 | | | | 2,500,000 | | | | 3,008,900 | |
Emeryville CA PFA Assessment Distribution Refinancing (Miscellaneous Revenue) | | | 5.90 | | | | 9-2-2021 | | | | 1,440,000 | | | | 1,443,672 | |
Escondido CA Union High School CAB Election of 2008 Series A (GO Revenue, AGC Insured) ¤ | | | 0.00 | | | | 8-1-2027 | | | | 8,385,000 | | | | 5,834,702 | |
Florin CA Resource Conservation Refunding Bond Second Senior Lien Series A (Water & Sewer Revenue, National Insured) | | | 5.00 | | | | 9-1-2032 | | | | 2,000,000 | | | | 2,245,920 | |
Fontana CA RDA Jurupa Hills Redevelopment Project Series A (Tax Revenue) | | | 5.50 | | | | 10-1-2017 | | | | 665,000 | | | | 671,963 | |
Fontana CA RDA Jurupa Hills Redevelopment Project Series A (Tax Revenue) | | | 5.60 | | | | 10-1-2027 | | | | 4,785,000 | | | | 4,833,998 | |
Foothill-Eastern Corridor CA Transportation Agency Sub Series B-3 (Transportation Revenue) ± | | | 5.50 | | | | 1-15-2053 | | | | 8,000,000 | | | | 9,091,520 | |
Fremont CA Community Facilities District #1 Refunding Bond (Tax Revenue) | | | 5.00 | | | | 9-1-2040 | | | | 2,700,000 | | | | 2,853,441 | |
Fullerton CA Joint Union High School Project Certificate of Participation (Miscellaneous Revenue, Build America Mutual Assurance Company Insured) | | | 5.00 | | | | 9-1-2035 | | | | 1,385,000 | | | | 1,546,810 | |
Garden Grove CA Unified School District Election of 2010 Series C (GO Revenue) | | | 5.25 | | | | 8-1-2037 | | | | 2,000,000 | | | | 2,292,800 | |
Gilroy CA Unified School District Election of 2008 Series A (GO Revenue, AGC Insured) | | | 6.00 | | | | 8-1-2027 | | | | 1,000,000 | | | | 1,115,920 | |
Golden Empire Schools California Financing Authority Kern High School District Projects (Miscellaneous Revenue) ± | | | 1.22 | | | | 5-1-2017 | | | | 5,000,000 | | | | 4,999,450 | |
Hayward CA Unified School District Refunding Bond (GO Revenue) | | | 5.00 | | | | 8-1-2038 | | | | 6,000,000 | | | | 6,637,020 | |
Hollister CA Joint Powers Financing Authority Wastewater Refunding Bond (Water & Sewer Revenue, AGM Insured) | | | 5.00 | | | | 6-1-2036 | | | | 1,270,000 | | | | 1,442,441 | |
Hollister CA Joint Powers Financing Authority Wastewater Refunding Bond (Water & Sewer Revenue, AGM Insured) | | | 5.00 | | | | 6-1-2037 | | | | 5,000,000 | | | | 5,576,750 | |
Imperial CA Irrigation District Electric System Refunding Bond Series A (Utilities Revenue) | | | 5.00 | | | | 11-1-2040 | | | | 3,715,000 | | | | 4,195,461 | |
Imperial CA Irrigation District Electric System Refunding Bond Series A (Utilities Revenue) | | | 5.00 | | | | 11-1-2045 | | | | 1,060,000 | | | | 1,191,906 | |
Imperial CA Irrigation District Electric System Refunding Bond Series C (Utilities Revenue) | | | 5.00 | | | | 11-1-2038 | | | | 4,300,000 | | | | 4,864,590 | |
Independent Cities California Finance Refunding Bond Sanitary Juan Mobile Estates (Housing Revenue) | | | 5.00 | | | | 8-15-2030 | | | | 1,000,000 | | | | 1,105,310 | |
Inland Valley CA Development Agency Series A (Tax Revenue) | | | 5.25 | | | | 9-1-2037 | | | | 4,000,000 | | | | 4,467,120 | |
Irvine CA Improvement Bond Act 1915 Limited Obligation Reassessment District #15-2 (Miscellaneous Revenue) | | | 5.00 | | | | 9-2-2025 | | | | 725,000 | | | | 812,580 | |
Irvine CA Improvement Bond Act 1915 Limited Obligation Reassessment District #15-2 (Miscellaneous Revenue) | | | 5.00 | | | | 9-2-2026 | | | | 400,000 | | | | 445,152 | |
Irvine CA Improvement Bond Act 1915 Limited Obligation Reassessment District #15-2 (Miscellaneous Revenue) | | | 5.00 | | | | 9-2-2042 | | | | 1,500,000 | | | | 1,583,040 | |
Jefferson CA Union High School CAB Election of 2006 Series D (GO Revenue) ¤ | | | 0.00 | | | | 8-1-2033 | | | | 7,000,000 | | | | 2,383,080 | |
Jefferson CA Union High School CAB Election of 2006 Series D (GO Revenue) ¤ | | | 0.00 | | | | 8-1-2034 | | | | 6,915,000 | | | | 2,164,879 | |
The accompanying notes are an integral part of these financial statements.
| | | | |
| 12 | | Wells Fargo California Tax-Free Fund | | Portfolio of investments—December 31, 2016 (unaudited) |
| | | | | | | | | | | | | | | | |
| Security name | | Interest rate | | | Maturity date | | | Principal | | | Value | |
| | | | |
| California (continued) | | | | | | | | | | | | | | | | |
Jefferson CA Union High School CAB Election of 2006 Series D (GO Revenue) ¤ | | | 0.00 | % | | | 8-1-2034 | | | $ | 2,990,000 | | | $ | 936,079 | |
Jefferson CA Union High School CAB Election of 2006 Series D (GO Revenue) ¤ | | | 0.00 | | | | 8-1-2036 | | | | 11,130,000 | | | | 2,956,017 | |
Lafayette CA Redevelopment Agency Refunding Bond Lafayette Redevelopment Project (Tax Revenue, AGM Insured) | | | 5.00 | | | | 8-1-2033 | | | | 1,500,000 | | | | 1,677,330 | |
Lafayette CA Redevelopment Agency Refunding Bond Lafayette Redevelopment Project (Tax Revenue, AGM Insured) | | | 5.00 | | | | 8-1-2038 | | | | 1,635,000 | | | | 1,806,283 | |
Lancaster CA RDA Tax Allocation Combined Redevelopment Project Areas (Tax Revenue) | | | 6.50 | | | | 8-1-2029 | | | | 2,000,000 | | | | 2,224,720 | |
Lodi CA Unified School District School Facility Election of 2006 (GO Revenue, AGM Insured) | | | 5.00 | | | | 8-1-2030 | | | | 2,000,000 | | | | 2,047,920 | |
Long Beach CA Financing Authority Refunding Bond (Miscellaneous Revenue, Ambac Insured) | | | 6.00 | | | | 11-1-2017 | | | | 250,000 | | | | 257,628 | |
Long Beach CA Unified School District CAB Election of 2008 Series B (GO Revenue) ¤ | | | 0.00 | | | | 8-1-2035 | | | | 2,000,000 | | | | 948,680 | |
Long Beach CA Unified School District Election of 2008 Series A (GO Revenue) | | | 5.50 | | | | 8-1-2026 | | | | 1,435,000 | | | | 1,583,192 | |
Long Beach CA Unified School District Election of 2008 Series A (GO Revenue) | | | 5.50 | | | | 8-1-2026 | | | | 95,000 | | | | 104,658 | |
Los Angeles CA Certificate of Participation Sonneblick del Rio Project (Miscellaneous Revenue, Ambac Insured) | | | 6.00 | | | | 11-1-2019 | | | | 1,540,000 | | | | 1,546,376 | |
Los Angeles CA Community College District Refunding Bond (GO Revenue) | | | 4.00 | | | | 8-1-2038 | | | | 10,000,000 | | | | 10,346,200 | |
Los Angeles CA Community Redevelopment Vermont Manchester Social Services Project (Miscellaneous Revenue, Ambac Insured) | | | 5.00 | | | | 9-1-2025 | | | | 2,310,000 | | | | 2,330,074 | |
Los Angeles CA Department of Water and Power Series E (Utilities Revenue) | | | 5.00 | | | | 7-1-2044 | | | | 12,475,000 | | | | 13,997,574 | |
Los Angeles CA Harbor Department (Airport Revenue) | | | 7.60 | | | | 10-1-2018 | | | | 30,000 | | | | 32,188 | |
Los Angeles CA Public Works Financing Authority Series A (Miscellaneous Revenue) | | | 5.00 | | | | 12-1-2039 | | | | 2,860,000 | | | | 3,215,412 | |
Los Angeles County CA Public Works Financial Authority Series D (Miscellaneous Revenue) | | | 4.00 | | | | 12-1-2040 | | | | 2,000,000 | | | | 2,028,460 | |
Los Angeles County CA Public Works Financial Authority Series D (Miscellaneous Revenue) | | | 5.00 | | | | 12-1-2045 | | | | 7,400,000 | | | | 8,334,546 | |
Lynwood CA Unified School District Election of 2012 Series A (GO Revenue, AGM Insured) | | | 5.00 | | | | 8-1-2033 | | | | 5,000 | | | | 5,559 | |
M-S-R California Energy Authority Gas Series B (Utilities Revenue) | | | 7.00 | | | | 11-1-2034 | | | | 4,000,000 | | | | 5,475,720 | |
M-S-R California Energy Authority Gas Series C (Utilities Revenue) | | | 6.13 | | | | 11-1-2029 | | | | 1,060,000 | | | | 1,308,453 | |
Merced CA City School District Election of 2014 (GO Revenue) | | | 5.00 | | | | 8-1-2045 | | | | 1,000,000 | | | | 1,121,410 | |
Merced CA Irrigation District Water & Hydroelectric System Series A (Water & Sewer Revenue, AGM Insured) | | | 5.00 | | | | 10-1-2038 | | | | 4,000,000 | | | | 4,490,680 | |
Merced CA Union High School District CAB Series A (GO Revenue, National Insured) ¤ | | | 0.00 | | | | 8-1-2018 | | | | 2,135,000 | | | | 2,083,055 | |
Merced CA Union High School District CAB Series C (GO Revenue) ¤ | | | 0.00 | | | | 8-1-2032 | | | | 3,380,000 | | | | 1,837,165 | |
Modesto CA Irrigation District Financing Authority Series A (Utilities Revenue) | | | 5.00 | | | | 10-1-2040 | | | | 3,500,000 | | | | 3,901,065 | |
Montclair CA PFA Lease Refunding Bond (Miscellaneous Revenue, AGM Insured) | | | 5.00 | | | | 10-1-2035 | | | | 2,400,000 | | | | 2,670,024 | |
Morongo Band of Mission Indians California Enterprise Casino Series B (Miscellaneous Revenue) 144A | | | 6.50 | | | | 3-1-2028 | | | | 2,100,000 | | | | 2,198,469 | |
Mount San Antonio CA Community College District CAB Election of 2008 Series A (GO Revenue) ¤ | | | 0.00 | | | | 8-1-2024 | | | | 1,610,000 | | | | 1,291,365 | |
Natomas CA Unified School District Series 1999 (GO Revenue, National Insured) | | | 5.95 | | | | 9-1-2021 | | | | 740,000 | | | | 792,614 | |
Northern California Power Agency Public Power Prerefunded Bond (Utilities Revenue, Ambac Insured) | | | 7.50 | | | | 7-1-2023 | | | | 50,000 | | | | 58,622 | |
Norwalk-La Mirada CA Unified School District CAB Election of 2002 Series D (GO Revenue, AGM Insured) ¤ | | | 0.00 | | | | 8-1-2023 | | | | 1,500,000 | | | | 1,244,400 | |
Oakland CA Redevelopment Successor Agency Refunding Bond Subordinated Series TE (Tax Revenue, AGM Insured) | | | 5.00 | | | | 9-1-2035 | | | | 2,545,000 | | | | 2,838,286 | |
Oakland CA Redevelopment Successor Agency Refunding Bond Subordinated Series TE (Tax Revenue, AGM Insured) | | | 5.00 | | | | 9-1-2036 | | | | 4,000,000 | | | | 4,448,320 | |
The accompanying notes are an integral part of these financial statements.
| | | | | | |
| Portfolio of investments—December 31, 2016 (unaudited) | | Wells Fargo California Tax-Free Fund | | | 13 | |
| | | | | | | | | | | | | | | | |
| Security name | | Interest rate | | | Maturity date | | | Principal | | | Value | |
| | | | |
| California (continued) | | | | | | | | | | | | | | | | |
Oakland CA Unified School District Election of 2012 (GO Revenue) | | | 5.50 | % | | | 8-1-2023 | | | $ | 500,000 | | | $ | 580,550 | |
Oakland CA Unified School District Election of 2012 (GO Revenue) | | | 6.63 | | | | 8-1-2038 | | | | 7,750,000 | | | | 9,225,988 | |
Oakland CA Unified School District Election of 2012 Series A (GO Revenue) | | | 5.00 | | | | 8-1-2040 | | | | 3,500,000 | | | | 3,900,085 | |
Orange County CA Community Facilities District #2015-1 Esencia Village Series A (Tax Revenue) | | | 5.25 | | | | 8-15-2045 | | | | 2,000,000 | | | | 2,147,540 | |
Oxnard CA School District Election of 2012 Series D (GO Revenue, AGM Insured) | | | 5.00 | | | | 8-1-2034 | | | | 1,695,000 | | | | 1,912,926 | |
Pajaro Valley CA Unified School District Election of 2012 Series A (GO Revenue) | | | 5.00 | | | | 8-1-2038 | | | | 1,700,000 | | | | 1,895,330 | |
Palm Springs CA Palm Springs International Airport (Airport Revenue) | | | 6.00 | | | | 7-1-2018 | | | | 125,000 | | | | 125,148 | |
Palm Springs CA Palm Springs International Airport (Airport Revenue) | | | 6.40 | | | | 7-1-2023 | | | | 500,000 | | | | 500,655 | |
Palo Verde CA Unified School District FlexFund Program (Education Revenue) | | | 4.80 | | | | 9-1-2027 | | | | 1,352,340 | | | | 1,405,189 | |
Palomar Health Refunding Bond (Health Revenue) | | | 5.00 | | | | 11-1-2027 | | | | 2,000,000 | | | | 2,206,560 | |
Palomar Health Refunding Bond (Health Revenue) | | | 5.00 | | | | 11-1-2039 | | | | 2,000,000 | | | | 2,091,120 | |
Paramount CA Unified School District CAB Election of 2006 (GO Revenue) ¤ | | | 0.00 | | | | 8-1-2033 | | | | 2,500,000 | | | | 1,269,050 | |
Pasadena CA Old Pasadena Parking Facilities Project (Miscellaneous Revenue) | | | 6.25 | | | | 1-1-2018 | | | | 195,000 | | | | 199,419 | |
Pico Rivera CA Water Authority Series A (Water & Sewer Revenue, National Insured) | | | 5.50 | | | | 5-1-2019 | | | | 1,265,000 | | | | 1,318,661 | |
Pico Rivera CA Water Authority Series A (Water & Sewer Revenue) | | | 6.25 | | | | 12-1-2032 | | | | 4,575,000 | | | | 4,629,946 | |
Pomona CA Unified School District Series A (GO Revenue, National Insured) | | | 6.55 | | | | 8-1-2029 | | | | 1,480,000 | | | | 1,894,592 | |
Poway CA Unified School District CAB Election of 2008 Improvement District 07-1-A (GO Revenue) ¤ | | | 0.00 | | | | 8-1-2024 | | | | 1,800,000 | | | | 1,456,776 | |
Rancho Cucamonga CA Redevelopment Agency Rancho Redevelopment Project Area (Tax Revenue, AGM Insured) | | | 5.00 | | | | 9-1-2032 | | | | 1,870,000 | | | | 2,103,993 | |
Redding CA Joint Powers Financing Authority Election System Series A (Utilities Revenue) | | | 5.00 | | | | 6-1-2032 | | | | 440,000 | | | | 495,202 | |
Redwood City CA RDA CAB Redevelopment Project Area Series 2-A (Tax Revenue, Ambac Insured) ¤ | | | 0.00 | | | | 7-15-2030 | | | | 3,505,000 | | | | 2,002,897 | |
Rialto CA Unified School District CAB Election of 2010 Series A (GO Revenue, AGM Insured) ¤ | | | 0.00 | | | | 8-1-2026 | | | | 3,320,000 | | | | 2,388,109 | |
Richmond CA Joint Powers Financing Authority Civic Center Project Series A (Miscellaneous Revenue, AGC Insured) | | | 5.88 | | | | 8-1-2037 | | | | 5,000,000 | | | | 5,419,750 | |
Richmond CA Joint Powers Financing Authority Point Potrero Series A (Miscellaneous Revenue) | | | 6.25 | | | | 7-1-2024 | | | | 7,500,000 | | | | 8,282,175 | |
Riverside County CA Asset Leasing Corporation Riverside County Hospital Project (Miscellaneous Revenue, National Insured) ¤ | | | 0.00 | | | | 6-1-2026 | | | | 10,000,000 | | | | 7,477,000 | |
Riverside County CA Palm Desert Financing Authority Series A (Miscellaneous Revenue) | | | 6.00 | | | | 5-1-2022 | | | | 4,105,000 | | | | 4,368,377 | |
Riverside County CA Southwest California Community Finance Authority (Miscellaneous Revenue) | | | 6.38 | | | | 5-1-2033 | | | | 3,065,000 | | | | 3,251,475 | |
Roseville CA Natural Gas Financing Authority (Utilities Revenue) | | | 5.00 | | | | 2-15-2025 | | | | 1,930,000 | | | | 2,124,525 | |
Sacramento CA Airport System AMT Senior Series B (Airport Revenue, AGM Insured) | | | 5.75 | | | | 7-1-2024 | | | | 2,000,000 | | | | 2,126,920 | |
Sacramento CA Certificate of Participation Animal Care & Youth Detention Facilities (Miscellaneous Revenue, Ambac Insured) | | | 5.00 | | | | 10-1-2025 | | | | 1,085,000 | | | | 1,112,982 | |
Sacramento CA City Financing Authority Series A (Miscellaneous Revenue, Ambac Insured) | | | 5.40 | | | | 11-1-2020 | | | | 1,750,000 | | | | 1,894,218 | |
Sacramento CA City Financing Refunding Bond Master Lease Program Facilities (Miscellaneous Revenue, Build America Mutual Assurance Company Insured) | | | 5.00 | | | | 12-1-2035 | | | | 1,300,000 | | | | 1,465,243 | |
Sacramento CA City School Joint Refunding Bond Series A (Miscellaneous Revenue, Build America Mutual Assurance Company Insured) | | | 5.00 | | | | 3-1-2040 | | | | 2,165,000 | | | | 2,377,884 | |
Sacramento CA Unified School District Election of 2012 Series A (GO Revenue, Build America Mutual Assurance Company Insured) | | | 5.25 | | | | 8-1-2033 | | | | 1,000,000 | | | | 1,145,100 | |
Sacramento CA Unified School District Election of 2012 Series C (GO Revenue, AGM Insured) | | | 5.00 | | | | 8-1-2033 | | | | 2,735,000 | | | | 3,115,192 | |
The accompanying notes are an integral part of these financial statements.
| | | | |
| 14 | | Wells Fargo California Tax-Free Fund | | Portfolio of investments—December 31, 2016 (unaudited) |
| | | | | | | | | | | | | | | | |
| Security name | | Interest rate | | | Maturity date | | | Principal | | | Value | |
| | | | |
| California (continued) | | | | | | | | | | | | | | | | |
Salinas CA Economic Development Monterey County Public Building Project Series A (Industrial Development Revenue) | | | 5.00 | % | | | 7-1-2027 | | | $ | 1,750,000 | | | $ | 2,017,995 | |
San Bernardino County CA Certificate of Participation Arrowhead Project Series A (Miscellaneous Revenue) | | | 5.50 | | | | 8-1-2020 | | | | 6,000,000 | | | | 6,558,660 | |
San Bernardino County CA Certificate of Participation Medical Center Financing Project (Miscellaneous Revenue, National Insured) | | | 5.00 | | | | 8-1-2028 | | | | 5,815,000 | | | | 5,830,642 | |
San Bernardino County CA Community Election of 2008 Series D (GO Revenue) | | | 5.00 | | | | 8-1-2045 | | | | 2,000,000 | | | | 2,242,820 | |
San Bernardino County CA Unified School District Election of 2012 Series C (GO Revenue, AGM Insured) | | | 5.00 | | | | 8-1-2040 | | | | 8,000,000 | | | | 8,908,160 | |
San Buenaventura CA Public Facilities Financing Authority Series B (Water & Sewer Revenue) | | | 5.00 | | | | 7-1-2042 | | | | 4,000,000 | | | | 4,439,440 | |
San Clemente CA Special Tax Community Facilities District #2006-1 (Tax Revenue) | | | 5.00 | | | | 9-1-2040 | | | | 1,000,000 | | | | 1,051,140 | |
San Clemente CA Special Tax Community Facilities District #2006-1 (Tax Revenue) | | | 5.00 | | | | 9-1-2046 | | | | 1,200,000 | | | | 1,257,528 | |
San Diego CA Community College Election of 2002 (GO Revenue) | | | 5.00 | | | | 8-1-2031 | | | | 4,000,000 | | | | 4,653,800 | |
San Diego CA PFFA Ballpark Project Series A (Miscellaneous Revenue, Ambac Insured) | | | 5.25 | | | | 2-15-2026 | | | | 4,950,000 | | | | 4,977,473 | |
San Diego CA PFFA Ballpark Project Series A (Miscellaneous Revenue, Ambac Insured) | | | 5.25 | | | | 2-15-2032 | | | | 3,825,000 | | | | 3,846,229 | |
San Diego CA RDA CAB Tax Allocation Centre (Tax Revenue, AGM Insured) ¤ | | | 0.00 | | | | 9-1-2023 | | | | 885,000 | | | | 727,337 | |
San Diego CA RDA Centre City Sub Parking Series B (Transportation Revenue) | | | 5.30 | | | | 9-1-2020 | | | | 1,060,000 | | | | 1,063,477 | |
San Diego CA RDA Naval Training Center Series A (Tax Revenue) | | | 5.00 | | | | 9-1-2025 | | | | 575,000 | | | | 621,023 | |
San Diego California Community College Refunding Bond (GO Revenue) | | | 5.00 | | | | 8-1-2041 | | | | 15,000,000 | | | | 17,334,000 | |
San Diego California Public Facilities Financing Refunding Bond Subordinated Series B (Water & Sewer Revenue) | | | 5.00 | | | | 8-1-2038 | | | | 12,555,000 | | | | 14,363,046 | |
San Diego County CA Water Authority Refunding Bond Series B (Water & Sewer Revenue) | | | 5.00 | | | | 5-1-2037 | | | | 3,750,000 | | | | 4,340,063 | |
San Francisco CA Municipal Transportation (Transportation Revenue) | | | 5.00 | | | | 3-1-2039 | | | | 3,000,000 | | | | 3,361,740 | |
San Francisco City & County CA CAB Redevelopment Agency Successor Agency Mission Bay South Redevelopment Project Sub-Series D (Tax Revenue) 144A¤(i) | | | 0.00 | | | | 8-1-2023 | | | | 2,000,000 | | | | 1,389,100 | |
San Francisco City & County CA CAB Redevelopment Agency Successor Agency Mission Bay South Redevelopment Project Sub-Series D (Tax Revenue) 144A¤(i) | | | 0.00 | | | | 8-1-2026 | | | | 2,000,000 | | | | 1,141,680 | |
San Francisco City & County CA Certificate of Participation Multiple Capital Improvement Projects Series A (Miscellaneous Revenue) | | | 5.20 | | | | 4-1-2026 | | | | 3,000,000 | | | | 3,229,740 | |
San Francisco City & County CA International Airport Second Series C (Airport Revenue) | | | 5.00 | | | | 5-1-2046 | | | | 6,000,000 | | | | 6,741,720 | |
San Francisco City & County CA Redevelopment Agency Mission Bay South Redevelopment Project Series A (Tax Revenue) | | | 5.00 | | | | 8-1-2043 | | | | 2,500,000 | | | | 2,737,425 | |
San Gorgonio CA Memorial Healthcare Election of 2006 Series C (GO Revenue) | | | 7.10 | | | | 8-1-2033 | | | | 3,000,000 | | | | 3,108,630 | |
San Gorgonio CA Memorial Healthcare Refunding Bond (GO Revenue) | | | 5.00 | | | | 8-1-2032 | | | | 1,750,000 | | | | 1,937,023 | |
San Gorgonio CA Memorial Healthcare Refunding Bond (GO Revenue) | | | 5.50 | | | | 8-1-2028 | | | | 2,525,000 | | | | 2,958,795 | |
San Joaquin Delta CA Community College District Election of 2004 Series C (GO Revenue) | | | 5.00 | | | | 8-1-2033 | | | | 3,195,000 | | | | 3,637,220 | |
San Joaquin Delta CA Community College District Election of 2004 Series C (GO Revenue) | | | 5.00 | | | | 8-1-2034 | | | | 3,315,000 | | | | 3,756,956 | |
San Jose CA Libraries & Parks Project (GO Revenue) | | | 5.13 | | | | 9-1-2031 | | | | 2,040,000 | | | | 2,046,528 | |
San Jose CA RDA Tax Allocation Refunding Bond Merged Area Redevelopment Project Series C (Tax Revenue, National Insured) | | | 5.00 | | | | 8-1-2025 | | | | 1,845,000 | | | | 1,885,406 | |
San Jose CA RDA Tax Allocation Refunding Bond Merged Area Redevelopment Project Series C (Tax Revenue, National Insured) | | | 5.00 | | | | 8-1-2026 | | | | 950,000 | | | | 970,701 | |
San Jose CA Unified School District CAB (Miscellaneous Revenue, AGM Insured) ¤ | | | 0.00 | | | | 1-1-2021 | | | | 1,205,000 | | | | 1,109,215 | |
San Jose CA Unified School District CAB (Miscellaneous Revenue, AGM Insured) ¤ | | | 0.00 | | | | 1-1-2026 | | | | 3,175,000 | | | | 2,493,931 | |
San Marcos CA Unified School District Special Tax Community Facilities District #4 (Tax Revenue, Build America Mutual Assurance Company Insured) | | | 5.00 | | | | 9-1-2034 | | | | 1,710,000 | | | | 1,920,262 | |
The accompanying notes are an integral part of these financial statements.
| | | | | | |
| Portfolio of investments—December 31, 2016 (unaudited) | | Wells Fargo California Tax-Free Fund | | | 15 | |
| | | | | | | | | | | | | | | | |
| Security name | | Interest rate | | | Maturity date | | | Principal | | | Value | |
| | | | |
| California (continued) | | | | | | | | | | | | | | | | |
San Marcos CA Unified School District Special Tax Community Facilities District #5 (Tax Revenue, Build America Mutual Assurance Company Insured) | | | 5.00 | % | | | 9-1-2028 | | | $ | 1,290,000 | | | $ | 1,473,116 | |
San Marcos CA Unified School District Special Tax Community Facilities District #5 (Tax Revenue, Build America Mutual Assurance Company Insured) | | | 5.00 | | | | 9-1-2029 | | | | 1,345,000 | | | | 1,529,655 | |
San Rafael CA City High School District CAB Election of 2002 Series B (GO Revenue, National Insured) ¤ | | | 0.00 | | | | 8-1-2023 | | | | 1,260,000 | | | | 1,049,845 | |
Sanger CA Unified School District Refunding Bond (GO Revenue, National Insured) | | | 5.60 | | | | 8-1-2023 | | | | 1,640,000 | | | | 1,764,279 | |
Santa Ana CA Community Redevelopment Merged Project Area Series A (Tax Revenue) | | | 6.00 | | | | 9-1-2022 | | | | 2,000,000 | | | | 2,289,960 | |
Santa Ana CA Unified School District CAB Election of 2008 Series B (GO Revenue, AGC Insured) ¤ | | | 0.00 | | | | 8-1-2038 | | | | 15,000,000 | | | | 5,877,300 | |
Santa Cruz County CA RDA Live Oak Soquel Community Improvement Project (Tax Revenue) | | | 6.63 | | | | 9-1-2029 | | | | 2,100,000 | | | | 2,383,668 | |
Santa Rosa CA High School District (GO Revenue) | | | 5.00 | | | | 8-1-2024 | | | | 1,005,000 | | | | 1,155,087 | |
Sierra Kings CA Health Care District (GO Revenue) | | | 5.00 | | | | 8-1-2028 | | | | 1,000,000 | | | | 1,134,580 | |
Sierra Kings CA Health Care District (GO Revenue) | | | 5.00 | | | | 8-1-2032 | | | | 1,500,000 | | | | 1,667,925 | |
Sierra Kings CA Health Care District (GO Revenue) | | | 5.00 | | | | 8-1-2037 | | | | 1,750,000 | | | | 1,903,895 | |
Simi Valley CA Unified School District Capital Improvement Projects (Miscellaneous Revenue, Ambac Insured) | | | 5.25 | | | | 8-1-2022 | | | | 1,970,000 | | | | 2,139,696 | |
Sonoma CA CDA Successor Agency Tax Allocation Sonoma Redevelopment Project (Tax Revenue, National Insured) | | | 5.00 | | | | 6-1-2033 | | | | 1,325,000 | | | | 1,522,253 | |
Sonoma Valley CA Unified School District CAB Election of 2010 Series A (GO Revenue) ¤ | | | 0.00 | | | | 8-1-2027 | | | | 1,020,000 | | | | 723,313 | |
South Pasadena CA Unified School District Series A (GO Revenue, FGIC Insured) | | | 5.55 | | | | 11-1-2020 | | | | 410,000 | | | | 450,967 | |
Southern California Public Power Authority Natural Gas Project #1 Series A (Utilities Revenue) | | | 5.25 | | | | 11-1-2025 | | | | 1,000,000 | | | | 1,156,660 | |
Stockton CA Unified School District Election of 2012 Series A (GO Revenue, AGM Insured) | | | 5.00 | | | | 8-1-2038 | | | | 1,025,000 | | | | 1,138,160 | |
Sutter Butte CA Flood Control Agency (Miscellaneous Revenue, Build America Mutual Assurance Company Insured) | | | 5.00 | | | | 10-1-2040 | | | | 3,545,000 | | | | 3,937,077 | |
Sweetwater CA Union High School District Refunding Bond (GO Revenue) | | | 4.00 | | | | 8-1-2042 | | | | 10,000,000 | | | | 10,121,500 | |
Torrance CA Certificate of Participation (Miscellaneous Revenue) | | | 5.25 | | | | 6-1-2039 | | | | 5,385,000 | | | | 6,124,037 | |
Tracy CA Operating Partnership Joint Powers Authority Capital Improvement Projects (Miscellaneous Revenue, AGC Insured) | | | 6.25 | | | | 10-1-2033 | | | | 1,000,000 | | | | 1,075,730 | |
Tulare CA PFFA Capital Facilities Project (Miscellaneous Revenue, AGC Insured) | | | 5.25 | | | | 4-1-2027 | | | | 3,000,000 | | | | 3,140,850 | |
Tulare CA Sewer Refunding Bond (Water & Sewer Revenue, AGM Insured) | | | 5.00 | | | | 11-15-2041 | | | | 1,500,000 | | | | 1,678,815 | |
Turlock CA Irrigation District Refunding Bond Subordinated First Priority (Utilities Revenue) | | | 5.50 | | | | 1-1-2041 | | | | 2,000,000 | | | | 2,219,940 | |
Tustin CA Community Facilities District Special Tax #2014-1 Legacy/Standard Pacific Series A (Tax Revenue) | | | 5.00 | | | | 9-1-2040 | | | | 750,000 | | | | 792,623 | |
Tustin CA Community Facilities District Special Tax #2014-1 Legacy/Standard Pacific Series A (Tax Revenue) | | | 5.00 | | | | 9-1-2045 | | | | 1,000,000 | | | | 1,053,110 | |
Union City CA Community RDA (Tax Revenue, AGC Insured) | | | 5.25 | | | | 10-1-2033 | | | | 8,000,000 | | | | 9,018,640 | |
Union City CA Community Redevelopment Agency Successor Agency Tax Allocation Community Redevelopment Project Series A (Tax Revenue) | | | 5.00 | | | | 10-1-2035 | | | | 1,250,000 | | | | 1,399,250 | |
Union City CA Community Redevelopment Agency Successor Agency Tax Allocation Community Redevelopment Project Series A (Tax Revenue) | | | 5.00 | | | | 10-1-2036 | | | | 1,000,000 | | | | 1,119,400 | |
University of California Regents Medical Center Series J (Health Revenue) | | | 5.00 | | | | 5-15-2033 | | | | 2,265,000 | | | | 2,578,114 | |
University of California Regents Medical Center Series J (Health Revenue) | | | 5.25 | | | | 5-15-2038 | | | | 10,000,000 | | | | 11,458,700 | |
University of California Series AI (Education Revenue) | | | 5.00 | | | | 5-15-2038 | | | | 2,000,000 | | | | 2,251,460 | |
Vacaville CA Unified School District (Miscellaneous Revenue, AGC Insured) | | | 6.50 | | | | 12-1-2034 | | | | 1,260,000 | | | | 1,386,113 | |
Vallejo CA Refunding Bond (Water & Sewer Revenue) | | | 5.25 | | | | 5-1-2031 | | | | 1,000,000 | | | | 1,130,150 | |
The accompanying notes are an integral part of these financial statements.
| | | | |
| 16 | | Wells Fargo California Tax-Free Fund | | Portfolio of investments—December 31, 2016 (unaudited) |
| | | | | | | | | | | | | | | | |
| Security name | | Interest rate | | | Maturity date | | | Principal | | | Value | |
| | | | |
| California (continued) | | | | | | | | | | | | | | | | |
Vallejo CA Unified School District Refunding Bond Series A (GO Revenue, National Insured) | | | 5.90 | % | | | 2-1-2017 | | | $ | 1,000,000 | | | $ | 1,004,090 | |
Ventura County CA PFA Series A (Miscellaneous Revenue) | | | 5.00 | | | | 11-1-2038 | | | | 4,250,000 | | | | 4,697,015 | |
Walnut CA Energy Center Authority Series A (Utilities Revenue) | | | 5.00 | | | | 1-1-2034 | | | | 3,115,000 | | | | 3,548,733 | |
Washington Township CA Health Care District Election of 2004 Series B (GO Revenue) | | | 5.50 | | | | 8-1-2038 | | | | 1,500,000 | | | | 1,718,745 | |
Washington Township CA Health Care District Series A (Health Revenue) | | | 5.00 | | | | 7-1-2026 | | | | 1,190,000 | | | | 1,337,072 | |
West Contra Costa CA Unified School District (GO Revenue, AGM Insured) | | | 5.25 | | | | 8-1-2024 | | | | 1,350,000 | | | | 1,535,085 | |
West Contra Costa CA Unified School District CAB Election of 2005 Series B (GO Revenue) | | | 6.00 | | | | 8-1-2027 | | | | 1,080,000 | | | | 1,414,476 | |
West Contra Costa CA Unified School District CAB Election of 2005 Series C-1 (GO Revenue, AGC Insured) ¤ | | | 0.00 | | | | 8-1-2021 | | | | 6,000,000 | | | | 5,357,207 | |
Wiseburn CA School District CAB (GO Revenue, AGC Insured) ¤ | | | 0.00 | | | | 8-1-2027 | | | | 1,525,000 | | | | 1,061,171 | |
Yorba Linda CA RDA CAB Series A (Tax Revenue, National Insured) ¤ | | | 0.00 | | | | 9-1-2019 | | | | 2,010,000 | | | | 1,826,507 | |
| | | | |
| | | | | | | | | | | | | | | 1,012,333,882 | |
| | | | | | | | | | | | | | | | |
| | | | |
| Colorado: 0.22% | | | | | | | | | | | | | | | | |
Tender Option Bond Trust Receipts/Certificates HCFR Series 2015-XF1001 (Health Revenue, Deutsche Bank LIQ) 144Aø | | | 0.81 | | | | 1-1-2045 | | | | 2,360,000 | | | | 2,360,000 | |
| | | | | | | | | | | | | | | | |
| | | | |
| Guam: 0.71% | | | | | | | | | | | | | | | | |
Guam Government Business Privilege Tax Series A (Tax Revenue) | | | 5.00 | | | | 1-1-2031 | | | | 1,000,000 | | | | 1,062,630 | |
Guam Government Limited Section 30 Series A (Tax Revenue) | | | 5.00 | | | | 12-1-2046 | | | | 1,250,000 | | | | 1,367,563 | |
Guam Government Waterworks Authority (Water & Sewer Revenue) | | | 5.25 | | | | 7-1-2033 | | | | 1,500,000 | | | | 1,640,535 | |
Guam Government Waterworks Authority (Water & Sewer Revenue) | | | 5.50 | | | | 7-1-2043 | | | | 3,125,000 | | | | 3,419,125 | |
| | | | |
| | | | | | | | | | | | | | | 7,489,853 | |
| | | | | | | | | | | | | | | | |
| | | | |
| Illinois: 0.50% | | | | | | | | | | | | | | | | |
Illinois (GO Revenue, AGM Insured) | | | 5.00 | | | | 2-1-2027 | | | | 5,000,000 | | | | 5,294,600 | |
| | | | | | | | | | | | | | | | |
| | | | |
| Virgin Islands: 0.49% | | | | | | | | | | | | | | | | |
Virgin Islands PFA Matching Fund Loan Note Senior Lien Series A (Tobacco Revenue) | | | 5.00 | | | | 10-1-2025 | | | | 1,000,000 | | | | 849,560 | |
Virgin Islands PFA Matching Fund Loan Note Senior Lien Series A (Tobacco Revenue, AGM Insured) | | | 5.00 | | | | 10-1-2029 | | | | 4,000,000 | | | | 4,302,360 | |
| | | | |
| | | | | | | | | | | | | | | 5,151,920 | |
| | | | | | | | | | | | | | | | |
| | | | |
Total Municipal Obligations (Cost $974,773,705) | | | | | | | | | | | | | | | 1,032,630,255 | |
| | | | | | | | | | | | | | | | |
| | | | |
| | | Yield | | | | | | Shares | | | | |
| Short-Term Investments: 1.21% | | | | | | | | | | | | | | | | |
| | | | |
| Investment Companies: 1.21% | | | | | | | | | | | | | | | | |
Wells Fargo Municipal Cash Management Fund Institutional Class (l)(u) | | | 0.67 | | | | | | | | 12,792,756 | | | | 12,800,432 | |
| | | | | | | | | | | | | | | | |
| | | | |
Total Short-Term Investments (Cost $12,798,145) | | | | | | | | | | | | | | | 12,800,432 | |
| | | | | | | | | | | | | | | | |
| | | | | | | | |
| Total investments in securities (Cost $987,571,850) * | | | 99.08 | % | | | 1,045,430,687 | |
Other assets and liabilities, net | | | 0.92 | | | | 9,682,983 | |
| | | | | | | | |
| Total net assets | | | 100.00 | % | | $ | 1,055,113,670 | |
| | | | | | | | |
The accompanying notes are an integral part of these financial statements.
| | | | | | |
| Portfolio of investments—December 31, 2016 (unaudited) | | Wells Fargo California Tax-Free Fund | | | 17 | |
| ¤ | The security is issued in zero coupon form with no periodic interest payments. |
| 144A | The security may be resold in transactions exempt from registration, normally to qualified institutional buyers, pursuant to Rule 144A under the Securities Act of 1933. |
| ø | Variable rate demand notes are subject to a demand feature which reduces the effective maturity. The maturity date shown represents the final maturity date of the security. The interest rate is determined and reset by the issuer daily, weekly, or monthly depending upon the terms of the security. The rate shown is the rate in effect at period end. |
| ± | Variable rate investment. The rate shown is the rate in effect at period end. |
| (l) | The issuer of the security is an affiliated person of the Fund as defined in the Investment Company Act of 1940. |
| (u) | The rate represents the 7-day annualized yield at period end. |
| * | Cost for federal income tax purposes is $987,494,495 and unrealized gains (losses) consists of: |
| | | | |
Gross unrealized gains | | $ | 61,473,800 | |
Gross unrealized losses | | | (3,537,608 | ) |
| | | | |
Net unrealized gains | | $ | 57,936,192 | |
The accompanying notes are an integral part of these financial statements.
| | | | |
| 18 | | Wells Fargo California Tax-Free Fund | | Statement of assets and liabilities—December 31, 2016 (unaudited) |
| | | | |
| | | | |
| |
Assets | | | | |
Investments | | | | |
In unaffiliated securities, at value (cost $974,773,705) | | $ | 1,032,630,255 | |
In affiliated securities, at value (cost $12,798,145) | | | 12,800,432 | |
| | | | |
Total investments, at value (cost $987,571,850) | | | 1,045,430,687 | |
Receivable for investments sold | | | 1,331,756 | |
Receivable for Fund shares sold | | | 3,829,207 | |
Receivable for interest | | | 12,897,201 | |
Prepaid expenses and other assets | | | 75,998 | |
| | | | |
Total assets | | | 1,063,564,849 | |
| | | | |
| |
Liabilities | | | | |
Dividends payable | | | 864,988 | |
Payable for investments purchased | | | 1,128,743 | |
Payable for Fund shares redeemed | | | 5,782,541 | |
Management fee payable | | | 295,104 | |
Distribution fees payable | | | 42,615 | |
Administration fees payable | | | 120,481 | |
Accrued expenses and other liabilities | | | 216,707 | |
| | | | |
Total liabilities | | | 8,451,179 | |
| | | | |
Total net assets | | $ | 1,055,113,670 | |
| | | | |
| |
NET ASSETS CONSIST OF | | | | |
Paid-in capital | | $ | 1,020,993,945 | |
Undistributed net investment income | | | 61,800 | |
Accumulated net realized losses on investments | | | (23,800,912 | ) |
Net unrealized gains on investments | | | 57,858,837 | |
| | | | |
Total net assets | | $ | 1,055,113,670 | |
| | | | |
| |
COMPUTATION OF NET ASSET VALUE AND OFFERING PRICE PER SHARE | | | | |
Net assets – Class A | | $ | 469,143,721 | |
Shares outstanding – Class A1 | | | 40,273,112 | |
Net asset value per share – Class A | | | $11.65 | |
Maximum offering price per share – Class A2 | | | $12.20 | |
Net assets – Class C | | $ | 62,069,932 | |
Shares outstanding – Class C1 | | | 5,224,797 | |
Net asset value per share – Class C | | | $11.88 | |
Net assets – Administrator Class | | $ | 218,077,723 | |
Shares outstanding – Administrator Class1 | | | 18,682,893 | |
Net asset value per share – Administrator Class | | | $11.67 | |
Net assets – Institutional Class | | $ | 305,822,294 | |
Shares outstanding – Institutional Class1 | | | 26,200,545 | |
Net asset value per share – Institutional Class | | | $11.67 | |
| 1 | The Fund has an unlimited number of authorized shares. |
| 2 | Maximum offering price is computed as 100/95.50 of net asset value. On investments of $50,000 or more, the offering price is reduced. |
The accompanying notes are an integral part of these financial statements.
| | | | | | |
| Statement of operations—six months ended December 31, 2016 (unaudited) | | Wells Fargo California Tax-Free Fund | | | 19 | |
| | | | |
| | | | |
| |
Investment income | | | | |
Interest | | $ | 21,196,348 | |
Income from affiliated securities | | | 26,131 | |
| | | | |
Total investment income | | | 21,222,479 | |
| | | | |
| |
Expenses | | | | |
Management fee | | | 2,231,810 | |
Administration fees | | | | |
Class A | | | 418,834 | |
Class B | | | 81 | 1 |
Class C | | | 54,829 | |
Administrator Class | | | 160,378 | |
Institutional Class | | | 101,274 | |
Shareholder servicing fees | | | | |
Class A | | | 654,428 | |
Class B | | | 127 | 1 |
Class C | | | 85,671 | |
Administrator Class | | | 400,455 | |
Distribution fees | | | | |
Class B | | | 381 | 1 |
Class C | | | 257,013 | |
Custody and accounting fees | | | 31,849 | |
Professional fees | | | 27,344 | |
Registration fees | | | 45,951 | |
Shareholder report expenses | | | 7,615 | |
Trustees’ fees and expenses | | | 11,686 | |
Other fees and expenses | | | 8,404 | |
| | | | |
Total expenses | | | 4,498,130 | |
Less: Fee waivers and/or expense reimbursements | | | (530,502 | ) |
| | | | |
Net expenses | | | 3,967,628 | |
| | | | |
Net investment income | | | 17,254,851 | |
| | | | |
| |
REALIZED AND UNREALIZED GAINS (LOSSES) ON INVESTMENTS | | | | |
| |
Net realized gains (losses) on: | | | | |
Unaffiliated securities | | | (15,185,774 | ) |
Affiiliated securities | | | (1,486 | ) |
Futures transactions | | | 524,200 | |
| | | | |
Net realized losses on investments | | | (14,663,060 | ) |
| | | | |
| |
Net change in unrealized gains (losses) on: | | | | |
Unaffiliated securities | | | (63,194,080 | ) |
Affiiliated securities | | | 2,287 | |
| | | | |
Net change in unrealized gains (losses) on investments | | | (63,191,793 | ) |
| | | | |
Net realized and unrealized gains (losses) on investments | | | (77,854,853 | ) |
| | | | |
Net decrease in net assets resulting from operations | | $ | (60,600,002 | ) |
| | | | |
| 1 | For the period from July 1, 2016 to December 5, 2016. At the close of business on December 5, 2016, existing Class B shareholders were converted to Class A shareholders. Effective December 6, 2016, Class B shares are no longer offered by the Fund. |
The accompanying notes are an integral part of these financial statements.
| | | | |
| 20 | | Wells Fargo California Tax-Free Fund | | Statement of changes in net assets |
| | | | | | | | | | | | | | | | |
| | | Six months ended
December 31, 2016
(unaudited) | | | Year ended
June 30, 2016 | |
| | | | |
Operations | | | | | | | | | | | | | | | | |
Net investment income | | | | | | $ | 17,254,851 | | | | | | | $ | 29,991,986 | |
Net realized gains (losses) on investments | | | | | | | (14,663,060 | ) | | | | | | | 1,334,393 | |
Net change in unrealized gains (losses) on investments | | | | | | | (63,191,793 | ) | | | | | | | 55,001,083 | |
| | | | |
Net increase (decrease) in net assets resulting from operations | | | | | | | (60,600,002 | ) | | | | | | | 86,327,462 | |
| | | | |
| | | | |
Distributions to shareholders from | | | | | | | | | | | | | | | | |
Net investment income | | | | | | | | | | | | | | | | |
Class A | | | | | | | (7,554,291 | ) | | | | | | | (14,775,252 | ) |
Class B | | | | | | | (1,071 | )1 | | | | | | | (3,113 | ) |
Class C | | | | | | | (732,495 | ) | | | | | | | (1,242,347 | ) |
Administrator Class | | | | | | | (4,932,316 | ) | | | | | | | (8,542,089 | ) |
Institutional Class | | | | | | | (4,034,649 | ) | | | | | | | (5,429,185 | ) |
| | | | |
Total distributions to shareholders | | | | | | | (17,254,822 | ) | | | | | | | (29,991,986 | ) |
| | | | |
| | | | |
Capital share transactions | | | Shares | | | | | | | | Shares | | | | | |
Proceeds from shares sold | | | | | | | | | | | | | | | | |
Class A | | | 2,413,568 | | | | 29,429,666 | | | | 7,403,254 | | | | 89,174,570 | |
Class C | | | 786,527 | | | | 9,822,182 | | | | 1,564,126 | | | | 19,286,269 | |
Administrator Class | | | 3,169,912 | | | | 38,399,026 | | | | 15,429,582 | | | | 186,582,017 | |
Institutional Class | | | 19,595,584 | | | | 233,032,337 | | | | 6,601,583 | | | | 79,772,864 | |
| | | | |
| | | | | | | 310,683,211 | | | | | | | | 374,815,720 | |
| | | | |
Reinvestment of distributions | | | | | | | | | | | | | | | | |
Class A | | | 576,089 | | | | 6,940,427 | | | | 1,127,394 | | | | 13,600,711 | |
Class B | | | 84 | 1 | | | 1,036 | 1 | | | 231 | | | | 2,839 | |
Class C | | | 53,540 | | | | 657,294 | | | | 90,135 | | | | 1,109,354 | |
Administrator Class | | | 393,453 | | | | 4,762,125 | | | | 634,427 | | | | 7,682,854 | |
Institutional Class | | | 63,369 | | | | 752,391 | | | | 40,832 | | | | 495,242 | |
| | | | |
| | | | | | | 13,113,273 | | | | | | | | 22,891,000 | |
| | | | |
Payment for shares redeemed | | | | | | | | | | | | | | | | |
Class A | | | (5,129,090 | ) | | | (61,020,261 | ) | | | (6,028,808 | ) | | | (72,871,296 | ) |
Class B | | | (9,509 | )1 | | | (111,781 | )1 | | | (4,785 | ) | | | (58,475 | ) |
Class C | | | (845,099 | ) | | | (10,271,738 | ) | | | (650,067 | ) | | | (7,959,797 | ) |
Administrator Class | | | (12,450,327 | ) | | | (146,787,249 | ) | | | (6,300,064 | ) | | | (76,074,940 | ) |
Institutional Class | | | (8,936,067 | ) | | | (104,666,575 | ) | | | (3,813,661 | ) | | | (46,003,940 | ) |
| | | | |
| | | | | | | (322,857,604 | ) | | | | | | | (202,968,448 | ) |
| | | | |
Net increase in net assets resulting from capital share transactions | | | | | | | 938,880 | | | | | | | | 194,738,272 | |
| | | | |
Total increase (decrease) in net assets | | | | | | | (76,915,944 | ) | | | | | | | 251,073,748 | |
| | | | |
| | | | |
Net assets | | | | | | | | | | | | | | | | |
Beginning of period | | | | | | | 1,132,029,614 | | | | | | | | 880,955,866 | |
| | | | |
End of period | | | | | | $ | 1,055,113,670 | | | | | | | $ | 1,132,029,614 | |
| | | | |
Undistributed net investment income | | | | | | $ | 61,800 | | | | | | | $ | 61,771 | |
| | | | |
| 1 | For the period from July 1, 2016 to December 5, 2016. At the close of business on December 5, 2016, existing Class B shareholders were converted to Class A shareholders. Effective December 6, 2016, Class B shares are no longer offered by the Fund. |
The accompanying notes are an integral part of these financial statements.
| | | | | | |
| Financial highlights | | Wells Fargo California Tax-Free Fund | | | 21 | |
(For a share outstanding throughout each period)
| | | | | | | | | | | | | | | | | | | | | | | | |
| | | Six months ended December 31, 2016 (unaudited) | | | Year ended June 30 | |
| CLASS A | | | 2016 | | | 2015 | | | 2014 | | | 2013 | | | 2012 | |
Net asset value, beginning of period | | | $12.45 | | | | $11.79 | | | | $11.73 | | | | $11.21 | | | | $11.37 | | | | $10.53 | |
Net investment income | | | 0.18 | | | | 0.36 | | | | 0.38 | | | | 0.42 | | | | 0.40 | | | | 0.45 | |
Net realized and unrealized gains (losses) on investments | | | (0.80 | ) | | | 0.66 | | | | 0.06 | | | | 0.52 | | | | (0.16 | ) | | | 0.84 | |
| | | | | | | | | | | | | | | | | | | | | | | | |
Total from investment operations | | | (0.62 | ) | | | 1.02 | | | | 0.44 | | | | 0.94 | | | | 0.24 | | | | 1.29 | |
Distributions to shareholders from | | | | | | | | | | | | | | | | | | | | | | | | |
Net investment income | | | (0.18 | ) | | | (0.36 | ) | | | (0.38 | ) | | | (0.42 | ) | | | (0.40 | ) | | | (0.45 | ) |
Net asset value, end of period | | | $11.65 | | | | $12.45 | | | | $11.79 | | | | $11.73 | | | | $11.21 | | | | $11.37 | |
Total return1 | | | (5.05 | )% | | | 8.77 | % | | | 3.74 | % | | | 8.58 | % | | | 2.06 | % | | | 12.46 | % |
Ratios to average net assets (annualized) | | | | | | | | | | | | | | | | | | | | | | | | |
Gross expenses | | | 0.82 | % | | | 0.82 | % | | | 0.83 | % | | | 0.83 | % | | | 0.83 | % | | | 0.83 | % |
Net expenses | | | 0.75 | % | | | 0.75 | % | | | 0.75 | % | | | 0.75 | % | | | 0.75 | % | | | 0.75 | % |
Net investment income | | | 2.89 | % | | | 2.96 | % | | | 3.17 | % | | | 3.71 | % | | | 3.46 | % | | | 4.08 | % |
Supplemental data | | | | | | | | | | | | | | | | | | | | | | | | |
Portfolio turnover rate | | | 33 | % | | | 17 | % | | | 30 | % | | | 41 | % | | | 23 | % | | | 41 | % |
Net assets, end of period (000s omitted) | | | $469,144 | | | | $528,238 | | | | $470,368 | | | | $466,411 | | | | $506,770 | | | | $512,957 | |
| 1 | Total return calculations do not include any sales charges. Returns for periods of less than one year are not annualized. |
The accompanying notes are an integral part of these financial statements.
| | | | |
| 22 | | Wells Fargo California Tax-Free Fund | | Financial highlights |
(For a share outstanding throughout each period)
| | | | | | | | | | | | | | | | | | | | | | | | |
| | | Six months ended
December 31, 2016 (unaudited) | | | Year ended June 30 | |
| CLASS C | | | 2016 | | | 2015 | | | 2014 | | | 2013 | | | 2012 | |
Net asset value, beginning of period | | | $12.70 | | | | $12.02 | | | | $11.96 | | | | $11.43 | | | | $11.59 | | | | $10.74 | |
Net investment income | | | 0.13 | | | | 0.27 | | | | 0.29 | | | | 0.34 | | | | 0.32 | | | | 0.38 | |
Net realized and unrealized gains (losses) on investments | | | (0.82 | ) | | | 0.68 | | | | 0.06 | | | | 0.53 | | | | (0.16 | ) | | | 0.85 | |
| | | | | | | | | | | | | | | | | | | | | | | | |
Total from investment operations | | | (0.69 | ) | | | 0.95 | | | | 0.35 | | | | 0.87 | | | | 0.16 | | | | 1.23 | |
Distributions to shareholders from | | | | | | | | | | | | | | | | | | | | | | | | |
Net investment income | | | (0.13 | ) | | | (0.27 | ) | | | (0.29 | ) | | | (0.34 | ) | | | (0.32 | ) | | | (0.38 | ) |
Net asset value, end of period | | | $11.88 | | | | $12.70 | | | | $12.02 | | | | $11.96 | | | | $11.43 | | | | $11.59 | |
Total return1 | | | (5.44 | )% | | | 8.02 | % | | | 2.96 | % | | | 7.77 | % | | | 1.33 | % | | | 11.56 | % |
Ratios to average net assets (annualized) | | | | | | | | | | | | | | | | | | | | | | | | |
Gross expenses | | | 1.57 | % | | | 1.57 | % | | | 1.58 | % | | | 1.58 | % | | | 1.58 | % | | | 1.58 | % |
Net expenses | | | 1.50 | % | | | 1.50 | % | | | 1.50 | % | | | 1.50 | % | | | 1.50 | % | | | 1.50 | % |
Net investment income | | | 2.14 | % | | | 2.21 | % | | | 2.42 | % | | | 2.96 | % | | | 2.70 | % | | | 3.31 | % |
Supplemental data | | | | | | | | | | | | | | | | | | | | | | | | |
Portfolio turnover rate | | | 33 | % | | | 17 | % | | | 30 | % | | | 41 | % | | | 23 | % | | | 41 | % |
Net assets, end of period (000s omitted) | | | $62,070 | | | | $66,427 | | | | $50,787 | | | | $45,934 | | | | $46,050 | | | | $44,920 | |
| 1 | Total return calculations do not include any sales charges. Returns for periods of less than one year are not annualized. |
The accompanying notes are an integral part of these financial statements.
| | | | | | |
| Financial highlights | | Wells Fargo California Tax-Free Fund | | | 23 | |
(For a share outstanding throughout each period)
| | | | | | | | | | | | | | | | | | | | | | | | |
| | | Six months ended
December 31, 2016 (unaudited) | | | Year ended June 30 | |
| ADMINISTRATOR CLASS | | | 2016 | | | 2015 | | | 2014 | | | 2013 | | | 2012 | |
Net asset value, beginning of period | | | $12.48 | | | | $11.81 | | | | $11.75 | | | | $11.23 | | | | $11.39 | | | | $10.55 | |
Net investment income | | | 0.19 | | | | 0.38 | | | | 0.40 | | | | 0.44 | | | | 0.43 | | | | 0.48 | |
Net realized and unrealized gains (losses) on investments | | | (0.81 | ) | | | 0.67 | | | | 0.06 | | | | 0.52 | | | | (0.16 | ) | | | 0.84 | |
| | | | | | | | | | | | | | | | | | | | | | | | |
Total from investment operations | | | (0.62 | ) | | | 1.05 | | | | 0.46 | | | | 0.96 | | | | 0.27 | | | | 1.32 | |
Distributions to shareholders from | | | | | | | | | | | | | | | | | | | | | | | | |
Net investment income | | | (0.19 | ) | | | (0.38 | ) | | | (0.40 | ) | | | (0.44 | ) | | | (0.43 | ) | | | (0.48 | ) |
Net asset value, end of period | | | $11.67 | | | | $12.48 | | | | $11.81 | | | | $11.75 | | | | $11.23 | | | | $11.39 | |
Total return1 | | | (5.02 | )% | | | 9.06 | % | | | 3.95 | % | | | 8.79 | % | | | 2.27 | % | | | 12.67 | % |
Ratios to average net assets (annualized) | | | | | | | | | | | | | | | | | | | | | | | | |
Gross expenses | | | 0.76 | % | | | 0.76 | % | | | 0.77 | % | | | 0.77 | % | | | 0.77 | % | | | 0.76 | % |
Net expenses | | | 0.55 | % | | | 0.55 | % | | | 0.55 | % | | | 0.55 | % | | | 0.55 | % | | | 0.55 | % |
Net investment income | | | 3.08 | % | | | 3.16 | % | | | 3.39 | % | | | 3.91 | % | | | 3.65 | % | | | 4.26 | % |
Supplemental data | | | | | | | | | | | | | | | | | | | | | | | | |
Portfolio turnover rate | | | 33 | % | | | 17 | % | | | 30 | % | | | 41 | % | | | 23 | % | | | 41 | % |
Net assets, end of period (000s omitted) | | | $218,078 | | | | $344,090 | | | | $210,265 | | | | $273,026 | | | | $231,383 | | | | $179,670 | |
| 1 | Returns for periods of less than one year are not annualized. |
The accompanying notes are an integral part of these financial statements.
| | | | |
| 24 | | Wells Fargo California Tax-Free Fund | | Financial highlights |
(For a share outstanding throughout each period)
| | | | | | | | | | | | |
| | | Six months ended
December 31, 2016 (unaudited) | | | Year ended June 30 | |
| INSTITUTIONAL CLASS | | | 2016 | | | 20151 | |
Net asset value, beginning of period | | | $12.48 | | | | $11.81 | | | | $11.99 | |
Net investment income | | | 0.20 | | | | 0.39 | | | | 0.27 | |
Net realized and unrealized gains (losses) on investments | | | (0.81 | ) | | | 0.67 | | | | (0.18 | ) |
| | | | | | | | | | | | |
Total from investment operations | | | (0.61 | ) | | | 1.06 | | | | 0.09 | |
Distributions to shareholders from | | | | | | | | | | | | |
Net investment income | | | (0.20 | ) | | | (0.39 | ) | | | (0.27 | ) |
Net asset value, end of period | | | $11.67 | | | | $12.48 | | | | $11.81 | |
Total return2 | | | (4.98 | )% | | | 9.14 | % | | | 0.72 | % |
Ratios to average net assets (annualized) | | | | | | | | | | | | |
Gross expenses | | | 0.49 | % | | | 0.49 | % | | | 0.50 | % |
Net expenses | | | 0.48 | % | | | 0.48 | % | | | 0.48 | % |
Net investment income | | | 3.19 | % | | | 3.24 | % | | | 3.35 | % |
Supplemental data | | | | | | | | | | | | |
Portfolio turnover rate | | | 33 | % | | | 17 | % | | | 30 | % |
Net assets, end of period (000s omitted) | | | $305,822 | | | | $193,154 | | | | $149,368 | |
| 1 | For the period from October 31, 2014 (commencement of class operations) to June 30, 2015 |
| 2 | Returns for periods of less than one year are not annualized. |
The accompanying notes are an integral part of these financial statements.
| | | | | | |
| Notes to financial statements (unaudited) | | Wells Fargo California Tax-Free Fund | | | 25 | |
1. ORGANIZATION
Wells Fargo Funds Trust (the “Trust”), a Delaware statutory trust organized on March 10, 1999, is an open-end management investment company registered under the Investment Company Act of 1940, as amended (the “1940 Act”). As an investment company, the Trust follows the accounting and reporting guidance in Financial Accounting Standards Board (“FASB”) Accounting Standards Codification Topic 946, Financial Services – Investment Companies. These financial statements report on the Wells Fargo California Tax-Free Fund (the “Fund”) which is a non-diversified series of the Trust.
Effective December 6, 2016, Class B shares of the Fund are no longer offered. Information for Class B shares reflected in the financial statements represents activity through December 5, 2016.
2. SIGNIFICANT ACCOUNTING POLICIES
The following significant accounting policies, which are consistently followed in the preparation of the financial statements of the Fund, are in conformity with U.S. generally accepted accounting principles which require management to make estimates and assumptions that affect the reported amounts of assets and liabilities, disclosure of contingent assets and liabilities at the date of the financial statements, and the reported amounts of revenues and expenses during the reporting period. Actual results could differ from those estimates.
Securities valuation
All investments are valued each business day as of the close of regular trading on the New York Stock Exchange (generally 4 p.m. Eastern Time), although the Fund may deviate from this calculation time under unusual or unexpected circumstances.
Debt securities are valued at the evaluated bid price provided by an independent pricing service or, if a reliable price is not available, the quoted bid price from an independent broker-dealer.
Futures that are listed on a foreign or domestic exchange or market are valued at the official closing price or, if none, the last sales price.
Investments in registered open-end investment companies are valued at net asset value.
Investments which are not valued using any of the methods discussed above are valued at their fair value, as determined in good faith by the Board of Trustees of the Fund. The Board of Trustees has established a Valuation Committee comprised of the Trustees and has delegated to it the authority to take any actions regarding the valuation of portfolio securities that the Valuation Committee deems necessary or appropriate, including determining the fair value of portfolio securities, unless the determination has been delegated to the Management Valuation Team of Wells Fargo Funds Management, LLC (“Funds Management”). The Board of Trustees retains the authority to make or ratify any valuation decisions or approve any changes to the Valuation Procedures as it deems appropriate. On a quarterly basis, the Board of Trustees receives reports on any valuation actions taken by the Valuation Committee or the Management Valuation Team which may include items for ratification.
Valuations of fair valued securities are compared to the next actual sales price when available, or other appropriate market values, to assess the continued appropriateness of the fair valuation methodologies used. These securities are fair valued on a day-to-day basis, taking into consideration changes to appropriate market information and any significant changes to the inputs considered in the valuation process until there is a readily available price provided on an exchange or by an independent pricing service. Valuations received from an independent pricing service or independent broker-dealer quotes are periodically validated by comparisons to most recent trades and valuations provided by other independent pricing services in addition to the review of prices by the manager and/or subadviser. Unobservable inputs used in determining fair valuations are identified based on the type of security, taking into consideration factors utilized by market participants in valuing the investment, knowledge about the issuer and the current market environment.
When-issued transactions
The Fund may purchase securities on a forward commitment or when-issued basis. The Fund records a when-issued transaction on the trade date and will segregate assets in an amount at least equal in value to the Fund’s commitment to purchase when-issued securities. Securities purchased on a when-issued basis are marked-to-market daily and the Fund begins earning interest on the settlement date. Losses may arise due to changes in the market value of the underlying securities or if the counterparty does not perform under the contract.
Futures contracts
The Fund is subject to interest rate risk in the normal course of pursuing its investment objectives. The Fund may buy and sell futures contracts in order to gain exposure to, or protect against, changes in security values and interest rates. The primary risks associated with the use of futures contracts are the imperfect correlation between changes in market values of securities held by the Fund and the prices of futures contracts, and the possibility of an illiquid market.
| | | | |
| 26 | | Wells Fargo California Tax-Free Fund | | Notes to financial statements (unaudited) |
The aggregate principal amounts of the contracts are not recorded in the financial statements. Fluctuations in the value of the contracts are recorded in the Statement of Assets and Liabilities as an asset or liability and in the Statement of Operations as unrealized gains or losses until the contracts are closed, at which point they are recorded as net realized gains or losses on futures contracts. With futures contracts, there is minimal counterparty risk to the Fund since futures are exchange traded and the exchange’s clearinghouse, as counterparty to all exchange traded futures, guarantees the futures against default.
Security transactions and income recognition
Securities transactions are recorded on a trade date basis. Realized gains or losses are recorded on the basis of identified cost.
Interest income is accrued daily and bond discounts are accreted and premiums are amortized daily based on the effective interest method. To the extent debt obligations are placed on non-accrual status, any related interest income may be reduced by writing off interest receivables when the collection of all or a portion of interest has become doubtful based on consistently applied procedures. If the issuer subsequently resumes interest payments or when the collectability of interest is reasonably assured, the debt obligation is removed from non-accrual status.
Distributions to shareholders
Distributions to shareholders from net investment income are accrued daily and paid monthly. Distributions from net realized gains, if any, are recorded on the ex-dividend date. Such distributions are determined in conformity with federal income tax regulations, which may differ in amount or character from net investment income and realized gains recognized for purposes of U.S. generally accepted accounting principles.
Federal and other taxes
The Fund intends to continue to qualify as a regulated investment company by distributing substantially all of its investment company taxable and tax-exempt income and any net realized capital gains (after reduction for capital loss carryforwards) sufficient to relieve it from all, or substantially all, federal income taxes. Accordingly, no provision for federal income taxes was required.
The Fund’s income and federal excise tax returns and all financial records supporting those returns for the prior three fiscal years are subject to examination by the federal and Delaware revenue authorities. Management has analyzed the Fund’s tax positions taken on federal, state, and foreign tax returns for all open tax years and does not believe that there are any uncertain tax positions that require recognition of a tax liability.
Capital loss carryforwards that do not expire are required to be utilized prior to capital loss carryforwards that expire. As of June 30, 2016, capital loss carryforwards available to offset future net realized capital gains were as follows through the indicated expiration dates:
| | |
| | | No expiration |
| 2018 | | Short-term |
| $4,667,645 | | $4,375,648 |
Class allocations
The separate classes of shares offered by the Fund differ principally in applicable sales charges, distribution, shareholder servicing, and administration fees. Class specific expenses are charged directly to that share class. Investment income, common expenses, and realized and unrealized gains (losses) on investments are allocated daily to each class of shares based on the relative proportion of net assets of each class.
3. FAIR VALUATION MEASUREMENTS
Fair value measurements of investments are determined within a framework that has established a fair value hierarchy based upon the various data inputs utilized in determining the value of the Fund’s investments. The three-level hierarchy gives the highest priority to unadjusted quoted prices in active markets for identical assets or liabilities (Level 1) and the lowest priority to significant unobservable inputs (Level 3). The Fund’s investments are classified within the fair value hierarchy based on the lowest level of input that is significant to the fair value measurement. The inputs are summarized into three broad levels as follows:
| ∎ | | Level 1 – quoted prices in active markets for identical securities |
| ∎ | | Level 2 – other significant observable inputs (including quoted prices for similar securities, interest rates, prepayment speeds, credit risk, use of amortized cost, etc.) |
| ∎ | | Level 3 – significant unobservable inputs (including the Fund’s own assumptions in determining the fair value of investments) |
| | | | | | |
| Notes to financial statements (unaudited) | | Wells Fargo California Tax-Free Fund | | | 27 | |
The inputs or methodologies used for valuing investments in securities are not necessarily an indication of the risk associated with investing in those securities.
The following is a summary of the inputs used in valuing the Fund’s assets and liabilities as of December 31, 2016:
| | | | | | | | | | | | | | | | |
| | | Quoted prices
(Level 1) | | | Other significant
observable inputs
(Level 2) | | | Significant
unobservable inputs (Level 3) | | | Total | |
Assets | | | | | | | | | | | | | | | | |
Investments in: | | | | | | | | | | | | | | | | |
| | | | |
Municipal obligations | | $ | 0 | | | $ | 1,032,630,255 | | | $ | 0 | | | $ | 1,032,630,255 | |
| | | | |
Short-term investments | | | | | | | | | | | | | | | | |
Investment companies | | | 12,800,432 | | | | 0 | | | | 0 | | | | 12,800,432 | |
Total assets | | $ | 12,800,432 | | | $ | 1,032,630,255 | | | $ | 0 | | | $ | 1,045,430,687 | |
The Fund recognizes transfers between levels within the fair value hierarchy at the end of the reporting period. At December 31, 2016, the Fund did not have any transfers into/out of Level 1, Level 2, or Level 3.
4. TRANSACTIONS WITH AFFILIATES AND OTHER EXPENSES
Management fee
Funds Management, an indirect wholly owned subsidiary of Wells Fargo & Company (“Wells Fargo”), is the manager of the Fund and provides advisory and fund-level administrative services under an investment management agreement. Under the investment management agreement, Funds Management is responsible for, among other services, implementing the investment objectives and strategies of the Fund, supervising the subadviser, providing fund-level administrative services in connection with the Fund’s operations, and providing any other fund-level administrative services reasonably necessary for the operation of the Fund. As compensation for its services under the investment management agreement, Funds Management is entitled to receive an annual management fee starting at 0.40% and declining to 0.28% as the average daily net assets of the Fund increase. For the six months ended December 31, 2016, the management fee was equivalent to an annual rate of 0.38% of the Fund’s average daily net assets.
Funds Management has retained the services of a subadviser to provide daily portfolio management to the Fund. The fee for subadvisory services is borne by Funds Management. Wells Capital Management Incorporated, an affiliate of Funds Management and an indirect wholly owned subsidiary of Wells Fargo, is the subadviser to the Fund and is entitled to receive a fee from Funds Management at an annual rate starting at 0.20% and declining to 0.10% as the average daily net assets of the Fund increase.
Administration fees
Under a class-level administration agreement, Funds Management provides class-level administrative services to the Fund, which includes paying fees and expenses for services provided by the transfer agent, sub-transfer agents, omnibus account servicers and record-keepers. As compensation for its services under the class-level administration agreement, Funds Management receives an annual fee which is calculated based on the average daily net assets of each class as follows:
| | | | |
| | | Class-level
administration fee | |
Class A, Class B, Class C | | | 0.16 | % |
Administrator Class | | | 0.10 | |
Institutional Class | | | 0.08 | |
Funds Management has contractually waived and/or reimbursed management and administration fees to the extent necessary to maintain certain net operating expense ratios for the Fund. Waiver of fees and/or reimbursement of expenses by Funds Management were made first from fund level expenses on a proportionate basis and then from class specific expenses. Funds Management has committed through October 31, 2017 to waive fees and/or reimburse expenses to the extent necessary to cap the Fund’s expenses at 0.75% for Class A shares, 1.50% for Class C shares, 0.55% for Administrator Class shares, and 0.48% for Institutional Class shares. After this time, the cap may be increased or the commitment to maintain the cap may be terminated only with the approval of the Board of Trustees.
| | | | |
| 28 | | Wells Fargo California Tax-Free Fund | | Notes to financial statements (unaudited) |
During the six months ended December 31, 2016, State Street Bank and Trust Company, the Fund’s custodian, reimbursed the Fund $6,340 for certain out-of-pocket expenses that were billed to the Fund in error from 1998-2015. This amount is included in interest income on the Statement of Operations. In addition, Funds Management was also reimbursed $3,153 for waivers/reimbursements it made to the Fund during the period the Fund was erroneously billed.
Distribution fees
The Trust has adopted a distribution plan for Class B and Class C shares of the Fund pursuant to Rule 12b-1 under the 1940 Act. Distribution fees are charged to Class B and Class C shares and paid to Wells Fargo Funds Distributor, LLC (“Funds Distributor”), the principal underwriter, at an annual rate of 0.75% of the average daily net assets of Class B and Class C shares.
In addition, Funds Distributor is entitled to receive the front-end sales charge from the purchase of Class A shares and a contingent deferred sales charge on the redemption of certain Class A shares. Funds Distributor is also entitled to receive the contingent deferred sales charges from redemptions of Class B and Class C shares. For the six months ended December 31, 2016, Funds Distributor received $12,109 from the sale of Class A shares and $10,000 in contingent deferred sales charges from redemptions of Class A shares.
Shareholder servicing fees
The Trust has entered into contracts with one or more shareholder servicing agents, whereby Class A, Class B, Class C, and Administrator Class of the Fund are charged a fee at an annual rate of 0.25% of the average daily net assets of each respective class.
A portion of these total shareholder servicing fees were paid to affiliates of Wells Fargo.
5. INVESTMENT PORTFOLIO TRANSACTIONS
Purchases and sales of investments, excluding U.S. government obligations (if any) and short-term securities, for the six months ended December 31, 2016 were $367,581,894 and $342,129,439, respectively.
The Fund may purchase or sell investment securities to other Wells Fargo funds under procedures adopted by the Board of Trustees. The procedures have been designed to ensure that these interfund transactions, which generally do not incur broker commissions, are effected at current market prices. Interfund trades are included within the respective purchases and sales amounts shown.
6. DERIVATIVE TRANSACTIONS
During the six months ended December 31, 2016, the Fund entered into futures contracts to take advantage of the differences between municipal and treasury yields and to help manage the duration of the portfolio.
As of December 31, 2016, the Fund did not have any open futures contracts. The Fund had an average notional amount of $5,230,694 in short futures contracts during the six months ended December 31, 2016.
The realized gains and change in unrealized gains (losses) on futures contracts, if any, are reflected in the Statement of Operations.
7. BANK BORROWINGS
The Trust (excluding the money market funds and certain other funds) and Wells Fargo Variable Trust are parties to a $250,000,000 revolving credit agreement whereby the Fund is permitted to use bank borrowings for temporary or emergency purposes, such as to fund shareholder redemption requests. Interest under the credit agreement is charged to the Fund based on a borrowing rate equal to the higher of the Federal Funds rate in effect on that day plus 1.25% or the overnight LIBOR rate in effect on that day plus 1.25%. In addition, an annual commitment fee equal to 0.25% of the unused balance is allocated to each participating fund. Prior to August 30, 2016, the revolving credit agreement amount was $200,000,000 and the annual commitment fee was equal to 0.20% of the unused balance which was allocated to each participating fund.
For the six months ended December 31, 2016, there were no borrowings by the Fund under the agreement.
8. CONCENTRATION RISK
The Fund invests a substantial portion of its assets in issuers of municipal debt securities located in a single state or territories of the U.S. Therefore, it may be more affected by economic and political developments in that state or region than would be a comparable general tax-exempt fund.
| | | | | | |
| Notes to financial statements (unaudited) | | Wells Fargo California Tax-Free Fund | | | 29 | |
9. INDEMNIFICATION
Under the Trust’s organizational documents, the officers and Trustees have been granted certain indemnification rights against certain liabilities that may arise out of performance of their duties to the Trust. Additionally, in the normal course of business, the Trust may enter into contracts with service providers that contain a variety of indemnification clauses. The Trust’s maximum exposure under these arrangements is dependent on future claims that may be made against the Fund and, therefore, cannot be estimated.
10. REGULATORY CHANGES
In October 2016, the Securities and Exchange Commission (“SEC”) adopted new rules and forms and amended existing rules and forms (together, “final rules”) intended to modernize and enhance the reporting and disclosure of information by registered investment companies and to enhance liquidity risk management by open-end mutual funds and exchange-traded funds. The final rules will enhance the quality of information available to investors and will allow the SEC to more effectively collect and use data reported by funds. In part, the final rules amend Regulation S-X and require standardized, enhanced disclosure about derivatives in the Fund’s financial statements, as well as other amendments. The compliance date for the amendments to Regulation S-X is August 1, 2017 while the compliance date for the new form types is June 1, 2018 and the compliance date for the liquidity risk management program requirements is December 1, 2018. Management is currently assessing the potential impact of these enhancements and their impact on the financial statement disclosures and reporting requirements.
| | | | |
| 30 | | Wells Fargo California Tax-Free Fund | | Other information (unaudited) |
PROXY VOTING INFORMATION
A description of the policies and procedures that the Fund uses to determine how to vote proxies relating to portfolio securities is available, upon request, by calling 1-800-222-8222, visiting our website at wellsfargofunds.com, or visiting the SEC website at sec.gov. Information regarding how the Fund voted proxies relating to portfolio securities during the most recent 12-month period ended June 30 is available on the Fund’s website at wellsfargofunds.com or by visiting the SEC website at sec.gov.
PORTFOLIO HOLDINGS INFORMATION
The complete portfolio holdings for the Fund are publicly available monthly on the Fund’s website (wellsfargofunds.com), on a one-month delayed basis. In addition, top ten holdings information (excluding derivative positions) for the Fund is publicly available on the Fund’s website on a monthly, seven-day or more delayed basis. The Fund files its complete schedule of portfolio holdings with the SEC for the first and third quarters of each fiscal year on Form N-Q, which is available by visiting the SEC website at sec.gov. In addition, the Fund’s Form N-Q may be reviewed and copied at the SEC’s Public Reference Room in Washington, DC, and at regional offices in New York City, at 233 Broadway, and in Chicago, at 175 West Jackson Boulevard, Suite 900. Information about the Public Reference Room may be obtained by calling 1-800-SEC-0330.
| | | | | | |
| Other information (unaudited) | | Wells Fargo California Tax-Free Fund | | | 31 | |
BOARD OF TRUSTEES AND OFFICERS
Each of the Trustees and Officers1 listed in the table below acts in identical capacities for each fund in the Wells Fargo family of funds, which consists of 139 mutual funds comprising the Wells Fargo Funds Trust, Wells Fargo Variable Trust, Wells Fargo Master Trust and four closed-end funds (collectively the “Fund Complex”). This table should be read in conjunction with the Prospectus and the Statement of Additional Information2. The mailing address of each Trustee and Officer is 525 Market Street, 12th Floor, San Francisco, CA 94105. Each Trustee and Officer serves an indefinite term, however, each Trustee serves such term until reaching the mandatory retirement age established by the Trustees.
Independent Trustees
| | | | | | |
Name and year of birth | | Position held and length of service* | | Principal occupations during past five years or longer | | Current other public company or
investment company
directorships |
| William R. Ebsworth (Born 1957) | | Trustee, since 2015 | | Retired. From 1984 to 2013, equities analyst, portfolio manager, research director and chief financial officer at Fidelity Management and Research Company in Boston, Tokyo, and Hong Kong and retired in 2013 as Chief Investment Officer of Fidelity Strategic Advisers, Inc. where he lead a team of investment professionals managing client assets. Prior thereto, Board member of Hong Kong Securities Clearing Co., Hong Kong Options Clearing Corp., the Thailand International Fund, Ltd., Fidelity Investments Life Insurance Company, and Empire Fidelity Investments Life Insurance Company. Board member of the Fonté Foundation (non-profit organization) and the Vincent Memorial Hospital Endowment (non-profit organization), where he serves on the Investment Committee and as a Chair of the Audit Committee. Mr. Ebsworth is a CFA® charterholder and an Adjunct Lecturer, Finance, at Babson College. | | Asset Allocation Trust |
| Jane A. Freeman (Born 1953) | | Trustee, since 2015 | | Retired. From 2012 to 2014 and 1999 to 2008, Chief Financial Officer of Scientific Learning Corporation. From 2008 to 2012, Ms. Freeman provided consulting services related to strategic business projects. Prior to 1999, Portfolio Manager at Rockefeller & Co. and Scudder, Stevens & Clark. Board member of the Harding Loevner Funds from 1996 to 2014, serving as both Lead Independent Director and chair of the Audit Committee. Board member of the Russell Exchange Traded Funds Trust from 2011 to 2012 and the chair of the Audit Committee. Ms. Freeman is a Board Member of Ruth Bancroft Garden (non-profit organization) and an inactive chartered financial analyst. | | Asset Allocation Trust |
| Peter G. Gordon** (Born 1942) | | Trustee, since 1998; Chairman, since 2005 | | Co-Founder, Retired Chairman, President and CEO of Crystal Geyser Water Company. Trustee Emeritus, Colby College. | | Asset Allocation Trust |
| Isaiah Harris, Jr. (Born 1952) | | Trustee, since 2009 | | Retired. Chairman of the Board of CIGNA Corporation since 2009, and Director since 2005. From 2003 to 2011, Director of Deluxe Corporation. Prior thereto, President and CEO of BellSouth Advertising and Publishing Corp. from 2005 to 2007, President and CEO of BellSouth Enterprises from 2004 to 2005 and President of BellSouth Consumer Services from 2000 to 2003. Emeritus member of the Iowa State University Foundation Board of Governors. Emeritus Member of the Advisory Board of Iowa State University School of Business. Advisory Board Member, Palm Harbor Academy (charter school). Advisory Board Member, Child Evangelism Fellowship (non-profit). Mr. Harris is a certified public accountant (inactive status). | | CIGNA Corporation; Asset Allocation Trust |
| Judith M. Johnson (Born 1949) | | Trustee, since 2008; Audit Committee Chairman, since 2008 | | Retired. Prior thereto, Chief Executive Officer and Chief Investment Officer of Minneapolis Employees Retirement Fund from 1996 to 2008. Ms. Johnson is an attorney, certified public accountant and a certified managerial accountant. | | Asset Allocation Trust |
| David F. Larcker (Born 1950) | | Trustee, since 2009 | | James Irvin Miller Professor of Accounting at the Graduate School of Business, Stanford University, Director of the Corporate Governance Research Initiative and Senior Faculty of The Rock Center for Corporate Governance since 2006. From 2005 to 2008, Professor of Accounting at the Graduate School of Business, Stanford University. Prior thereto, Ernst & Young Professor of Accounting at The Wharton School, University of Pennsylvania from 1985 to 2005. | | Asset Allocation Trust |
| | | | |
| 32 | | Wells Fargo California Tax-Free Fund | | Other information (unaudited) |
| | | | | | |
Name and year of birth | | Position held and length of service* | | Principal occupations during past five years or longer | | Current other public company or
investment company
directorships |
| Olivia S. Mitchell (Born 1953) | | Trustee, since 2006 | | International Foundation of Employee Benefit Plans Professor, Wharton School of the University of Pennsylvania since 1993. Director of Wharton’s Pension Research Council and Boettner Center on Pensions & Retirement Research, and Research Associate at the National Bureau of Economic Research. Previously, Cornell University Professor from 1978 to 1993. | | Asset Allocation Trust |
| Timothy J. Penny (Born 1951) | | Trustee, since 1996 | | President and Chief Executive Officer of Southern Minnesota Initiative Foundation, a non-profit organization, since 2007 and Senior Fellow at the Humphrey Institute Policy Forum at the University of Minnesota since 1995. Member of the Board of Trustees of NorthStar Education Finance, Inc., a non-profit organization, since 2007. | | Asset Allocation Trust |
| Michael S. Scofield (Born 1943) | | Trustee, since 2010 | | Served on the Investment Company Institute’s Board of Governors and Executive Committee from 2008-2011 as well the Governing Council of the Independent Directors Council from 2006-2011 and the Independent Directors Council Executive Committee from 2008-2011. Chairman of the IDC from 2008-2010. Institutional Investor (Fund Directions) Trustee of Year in 2007. Trustee of the Evergreen Funds complex (and its predecessors) from 1984 to 2010. Chairman of the Evergreen Funds from 2000-2010. Former Trustee of the Mentor Funds. Retired Attorney, Law Offices of Michael S. Scofield. | | Asset Allocation Trust |
| * | Length of service dates reflect the Trustee’s commencement of service with the Trust’s predecessor entities, where applicable. |
| ** | Peter Gordon is expected to retire on December 31, 2017. |
Officers
| | | | | | |
Name and year of birth | | Position held and length of service | | Principal occupations during past five years or longer |
Andrew Owen3
(Born 1960) | | President, since 2017 | | Executive Vice President of Wells Fargo Bank, N.A. and President of Wells Fargo & Company and Head of Affiliated Managaers, Wells Fargo Asset Management, since 2014. Executive Vice President responsible for marketing, investments and product development for Wells Fargo Funds Management, LLC, from 2009 to 2014. | | |
Nancy Wiser1
(Born 1967) | | Treasurer, since 2012 | | Executive Vice President of Wells Fargo Funds Management, LLC since 2011. Chief Operating Officer and Chief Compliance Officer at LightBox Capital Management LLC, from 2008 to 2011. | | |
| C. David Messman (Born 1960) | | Secretary, since 2000; Chief Legal Officer, since 2003 | | Senior Vice President and Secretary of Wells Fargo Funds Management, LLC since 2001. Assistant General Counsel of Wells Fargo Bank, N.A. since 2013 and Vice President and Managing Counsel of Wells Fargo Bank, N.A. from 1996 to 2013. | | |
Michael Whitaker (Born 1967) | | Chief Compliance Officer, since 2016 | | Executive Vice President of Wells Fargo Funds Management, LLC since 2016. Chief Compliance Officer of Fidelity’s Fixed Income Funds and Asset Allocation Funds from 2008 to 2016, Compliance Officer of FMR Co., Inc. from 2014 to 2016, Fidelity Investments Money Management, Inc. from 2014 to 2016, Fidelity Investments from 2007 to 2016. | | |
David Berardi
(Born 1975) | | Assistant Treasurer, since 2009 | | Vice President of Wells Fargo Funds Management, LLC since 2009. Vice President of Evergreen Investment Management Company, LLC from 2008 to 2010. Manager of Fund Reporting and Control for Evergreen Investment Management Company, LLC from 2004 to 2010. | | |
| Jeremy DePalma1 (Born 1974) | | Assistant Treasurer, since 2009 | | Senior Vice President of Wells Fargo Funds Management, LLC since 2009. Senior Vice President of Evergreen Investment Management Company, LLC from 2008 to 2010 and head of the Fund Reporting and Control Team within Fund Administration from 2005 to 2010. | | |
| 1 | Nancy Wiser acts as Treasurer of 70 funds in the Fund Complex. Jeremy DePalma acts as Treasurer of 69 funds and Assistant Treasurer of 70 funds in the Fund Complex. |
| 2 | The Statement of Additional Information includes additional information about the Trustees and is available, without charge, upon request, by calling
1-800-222-8222 or by visiting the website at wellsfargofunds.com. |
| 3 | Andrew Owen became President on January 1, 2017. |
| | | | | | |
| List of abbreviations | | Wells Fargo California Tax-Free Fund | | | 33 | |
The following is a list of common abbreviations for terms and entities that may have appeared in this report.
| ACA | — ACA Financial Guaranty Corporation |
| ADR | — American depositary receipt |
| ADS | — American depositary shares |
| AGC | — Assured Guaranty Corporation |
| AGM | — Assured Guaranty Municipal |
| Ambac | — Ambac Financial Group Incorporated |
| AMT | — Alternative minimum tax |
| BAN | — Bond anticipation notes |
| BHAC | — Berkshire Hathaway Assurance Corporation |
| CAB | — Capital appreciation bond |
| CCAB | — Convertible capital appreciation bond |
| CDA | — Community Development Authority |
| CDO | — Collateralized debt obligation |
| DRIVER | — Derivative inverse tax-exempt receipts |
| DW&P | — Department of Water & Power |
| DWR | — Department of Water Resources |
| ECFA | — Educational & Cultural Facilities Authority |
| EDA | — Economic Development Authority |
| EDFA | — Economic Development Finance Authority |
| ETF | — Exchange-traded fund |
| FDIC | — Federal Deposit Insurance Corporation |
| FFCB | — Federal Farm Credit Banks |
| FGIC | — Financial Guaranty Insurance Corporation |
| FHA | — Federal Housing Administration |
| FHLB | — Federal Home Loan Bank |
| FHLMC | — Federal Home Loan Mortgage Corporation |
| FICO | — The Financing Corporation |
| FNMA | — Federal National Mortgage Association |
| GDR | — Global depositary receipt |
| GNMA | — Government National Mortgage Association |
| HCFR | — Healthcare facilities revenue |
| HEFA | — Health & Educational Facilities Authority |
| HEFAR | — Higher education facilities authority revenue |
| HFA | — Housing Finance Authority |
| HFFA | — Health Facilities Financing Authority |
| HUD | — Department of Housing and Urban Development |
| IDA | — Industrial Development Authority |
| IDAG | — Industrial Development Agency |
| KRW | — Republic of Korea won |
| LIBOR | — London Interbank Offered Rate |
| LIFER | — Long Inverse Floating Exempt Receipts |
| LLC | — Limited liability company |
| LLLP | — Limited liability limited partnership |
| LLP | — Limited liability partnership |
| MBIA | — Municipal Bond Insurance Association |
| MFHR | — Multifamily housing revenue |
| MSTR | — Municipal securities trust receipts |
| MUD | — Municipal Utility District |
| National | — National Public Finance Guarantee Corporation |
| PCFA | — Pollution Control Financing Authority |
| PCL | — Public Company Limited |
| PCR | — Pollution control revenue |
| PFA | — Public Finance Authority |
| PFFA | — Public Facilities Financing Authority |
| PFOTER | — Puttable floating option tax-exempt receipts |
| plc | — Public limited company |
| PUTTER | — Puttable tax-exempt receipts |
| R&D | — Research & development |
| Radian | — Radian Asset Assurance |
| RAN | — Revenue anticipation notes |
| RDA | — Redevelopment Authority |
| RDFA | — Redevelopment Finance Authority |
| REIT | — Real estate investment trust |
| ROC | — Reset option certificates |
| SAVRS | — Select auction variable rate securities |
| SBA | — Small Business Authority |
| SDR | — Swedish depositary receipt |
| SFHR | — Single-family housing revenue |
| SFMR | — Single-family mortgage revenue |
| SPA | — Standby purchase agreement |
| SPDR | — Standard & Poor’s Depositary Receipts |
| SPEAR | — Short Puttable Exempt Adjustable Receipts |
| STRIPS | — Separate trading of registered interest and |
| TAN | — Tax anticipation notes |
| TIPS | — Treasury inflation-protected securities |
| TRAN | — Tax revenue anticipation notes |
| TTFA | — Transportation Trust Fund Authority |
| TVA | — Tennessee Valley Authority |
This page is intentionally left blank.
This page is intentionally left blank.
This page is intentionally left blank.

For more information
More information about Wells Fargo Funds is available free upon request. To obtain literature, please write, email, visit the Fund’s website, or call:
Wells Fargo Funds
P.O. Box 8266
Boston, MA 02266-8266
Email: fundservice@wellsfargo.com
Website: wellsfargofunds.com
Individual investors: 1-800-222-8222
Retail investment professionals: 1-888-877-9275
Institutional investment professionals: 1-866-765-0778
This report and the financial statements contained herein are submitted for the general information of the shareholders of the Fund. If this report is used for promotional purposes, distribution of the report must be accompanied or preceded by a current prospectus. Before investing, please consider the investment objectives, risks, charges, and expenses of the investment. For a current prospectus and, if available, a summary prospectus, containing this information, call 1-800-222-8222 or visit the Fund’s website at wellsfargofunds.com. Read the prospectus carefully before you invest or send money.
Wells Fargo Asset Management (WFAM) is a trade name used by the asset management businesses of Wells Fargo & Company. Wells Fargo Funds Management, LLC, a wholly owned subsidiary of Wells Fargo & Company, provides investment advisory and administrative services for Wells Fargo Funds. Other affiliates of Wells Fargo & Company provide subadvisory and other services for the funds. The funds are distributed by Wells Fargo Funds Distributor, LLC, Member FINRA, an affiliate of Wells Fargo & Company. Neither Wells Fargo Funds Management nor Wells Fargo Funds Distributor has Fund customer accounts/assets, and neither provides investment advice/recommendations or acts as an investment advice fiduciary to any investor.
NOT FDIC INSURED ◾ NO BANK GUARANTEE ◾ MAY LOSE VALUE
© 2016 Wells Fargo Funds Management, LLC. All rights reserved.
| | |
 | | 300477 02-17 SA249/SAR249 12-16 |
Semi-Annual Report
December 31, 2016

Wells Fargo Colorado Tax-Free Fund


Reduce clutter. Save trees.
Sign up for electronic delivery of prospectuses and shareholder reports at wellsfargo.com/advantagedelivery
Contents
The views expressed and any forward-looking statements are as of December 31, 2016, unless otherwise noted, and are those of the Fund managers and/or Wells Fargo Funds Management, LLC. Discussions of individual securities, or the markets generally, or any Wells Fargo Fund are not intended as individual recommendations. Future events or results may vary significantly from those expressed in any forward-looking statements. The views expressed are subject to change at any time in response to changing circumstances in the market. Wells Fargo Funds Management, LLC and the Fund disclaim any obligation to publicly update or revise any views expressed or forward-looking statements.
NOT FDIC INSURED ◾ NO BANK GUARANTEE ◾ MAY LOSE VALUE
| | | | |
| 2 | | Wells Fargo Colorado Tax-Free Fund | | Letter to shareholders (unaudited) |

Andrew Owen
President
Wells Fargo Funds
The Bloomberg Barclays Municipal Bond Index,1 a broad measure tracking investment-grade municipal bonds, lost 3.91% during the six-month reporting period.
Dear Shareholder:
As the new president of Wells Fargo Funds now that Karla Rabusch is retiring from that position after nearly 14 years, I am pleased to offer you this semi-annual report for the Wells Fargo Colorado Tax-Free Fund for the six-month period that ended December 31, 2016. The Federal Reserve (Fed) raised the federal funds rate in December by 0.25%. Municipal bond yields rose sharply in the fourth quarter. The Bloomberg Barclays Municipal Bond Index,1 a broad measure tracking investment-grade municipal bonds, lost 3.91% during the six-month reporting period.
Municipal bond yields rose during the reporting period.
The municipal market reversed course in the second half of 2016, with yields increasing and prices declining. Initially the sell-off was driven by negative supply and demand trends, also known as technical factors. By the fourth quarter, fund flows turned negative (reversing a trend of 54 weeks of positive flows) and municipal bond supply increased. These deteriorating technical factors, along with the expectation of an expansionary fiscal policy and lower tax rates under the new administration, drove market volatility; credit spreads widened and the yield curve steepened as the market sold-off.
Stronger economic indicators drove monetary policy.
On December 14, the Fed hiked the short-term interest rate by 0.25% to reach a target range of 0.50% to 0.75%. This was the second rate increase in more than 10 years, with the Fed citing job gains and lower than expected unemployment of 4.6%. The Fed confirmed the continuation of an accommodative monetary policy to support a stronger labor market and reiterated its long-term objective of a 2% inflation rate, which increased slightly during the fourth quarter but fell short of the benchmark. The Fed expressed confidence in the economy’s progress and expects this positive trajectory to continue. Both sentiments helped to bolster the Fed’s expectation of three additional rate increases during 2017.
Meanwhile, the Bank of England continued its quantitative-easing program and lowered the official bank rate to 0.25% in August 2016. The Bank of Japan maintained its negative interest rate put in place earlier in the year, and in September announced an interest rate target for 10-year government bonds—keeping the yield at zero—as it struggles to accelerate economic growth. In December, the European Central Bank announced that it will extend its quantitative-easing program and continue purchasing large amounts of eurozone corporate and government debt each month through December 2017.
U.S. economic data released during the fourth quarter showed that U.S. real gross domestic product increased at an annual 3.5% rate in the third quarter, the largest increase since mid-2014. Business investment by U.S. companies was mixed, with a 12.0% increase in structures and 4.5% decrease in equipment over the prior quarter on an annualized basis. Consumer confidence hit pre-recession levels for the first time in November, and increased again in December. The dollar strengthened during the quarter’s post-election period.
Supply and demand trends reflected volatility of municipals.
Demand for municipal debt, as measured by cash flows to municipal bond mutual funds, was negative for the reporting period. There were $19 billion of inflows from July through October, but a sharp reversal occurred post-election, with $26 billion of redemptions in the last two months of the year. This followed a
| 1 | The Bloomberg Barclays Municipal Bond Index (formerly known as Barclays Municipal Bond Index) is an unmanaged index composed of long-term tax-exempt bonds with a minimum credit rating of Baa. You cannot invest directly in an index. |
| | | | | | |
| Letter to shareholders (unaudited) | | Wells Fargo Colorado Tax-Free Fund | | | 3 | |
noteworthy 54 consecutive weeks of inflows. On the supply side, August through October saw 30-year record-breaking volumes each month; both refundings and new issuance were up. These levels were attributed to deals pulled forward in anticipation of higher interest rates. Not surprisingly, December volume was down 25% year-over-year to $19 billion. Total municipal bond issuance for the period was $219 billion; new issuance outpaced refundings by $18 billion.
Municipal credit fundamentals were solid.
Overall, municipal credit was sound for the period. The most significant development was the election of Ricardo Rossello as governor of the Commonwealth of Puerto Rico. In the past, prices of Puerto Rico bonds reflected negative credit considerations, including defaults on its securities in 2015 and early 2016, but recent events point to a potentially more positive fiscal environment. Rossello campaigned, in part, on a platform that included promises to ultimately pay 100% of interest due on Puerto Rico’s outstanding municipal debt, negotiate with bondholders, and ration government expenditures. This stance is a major shift from his predecessor who focused on a bankruptcy mechanism.
Since the end of the financial crisis, structural changes in the fixed-income markets have reduced trading liquidity (the degree to which assets can be bought or sold without affecting the price). New regulations and capital requirements have caused traditional liquidity suppliers (banks and broker/dealers) to be more risk averse and hold less inventory. Meanwhile, corporate debt issuance has spiked as companies finance themselves at record-low yields, bond mutual funds hold larger amounts of this new debt supply, trading volumes are lower, and large-size trades are more difficult to execute. However, fixed-income markets appeared to function well over the past year with sufficient liquidity.
Don’t let short-term uncertainty derail long-term investment goals.
Periods of uncertainty can present challenges, but experience has taught us that maintaining long-term investment goals can be an effective way to plan for the future. To help you create a sound strategy based on your personal goals and risk tolerance, Wells Fargo Funds offers more than 100 mutual funds spanning a wide range of asset classes and investment styles. Although diversification cannot guarantee an investment profit or prevent losses, we believe it can be an effective way to manage investment risk and potentially smooth out overall portfolio performance. We encourage investors to know their investments and to understand that appropriate levels of risk-taking may unlock opportunities.
Thank you for choosing to invest in Wells Fargo Funds. We appreciate your confidence in us and remain committed to helping you meet your financial needs.
Sincerely,

Andrew Owen
President
Wells Fargo Funds
Periods of uncertainty can present challenges, but experience has taught us that maintaining long-term investment goals can be an effective way to plan for the future.
For further information about your Fund, contact your investment professional, visit our website at wellsfargofunds.com, or call us directly at 1-800-222-8222. We are available 24 hours a day, 7 days a week.
| | | | |
| 4 | | Wells Fargo Colorado Tax-Free Fund | | Performance highlights (unaudited) |
Investment objective
The Fund seeks current income exempt from federal income tax and Colorado individual income tax.
Manager
Wells Fargo Funds Management, LLC
Subadviser
Wells Capital Management Incorporated
Portfolio managers
Terry J. Goode
Adrian Van Poppel
Average annual total returns (%) as of December 31, 20161
| | | | | | | | | | | | | | | | | | | | | | | | | | | | | | | | | | |
| | | | | Including sales charge | | | Excluding sales charge | | | Expense ratios2 (%) | |
| | | Inception date | | 1 year | | | 5 year | | | 10 year | | | 1 year | | | 5 year | | | 10 year | | | Gross | | | Net3 | |
| Class A (NWCOX) | | 7-31-1995 | | | (4.44 | ) | | | 2.90 | | | | 3.32 | | | | 0.07 | | | | 3.86 | | | | 3.79 | | | | 0.93 | | | | 0.85 | |
| Class C (WCOTX) | | 3-31-2008 | | | (1.68 | ) | | | 3.08 | | | | 3.01 | | | | (0.68 | ) | | | 3.08 | | | | 3.01 | | | | 1.68 | | | | 1.60 | |
| Administrator Class (NCOTX) | | 8-23-1993 | | | – | | | | – | | | | – | | | | 0.32 | | | | 4.12 | | | | 4.05 | | | | 0.87 | | | | 0.60 | |
| Institutional Class (WCITX) | | 10-31-2016 | | | – | | | | – | | | | – | | | | 0.33 | | | | 4.12 | | | | 4.05 | | | | 0.60 | | | | 0.52 | |
| Bloomberg Barclays Municipal Bond Index4 | | – | | | – | | | | – | | | | – | | | | 0.25 | | | | 3.28 | | | | 4.25 | | | | – | | | | – | |
| Bloomberg Barclays Colorado Municipal Bond Index5 | | – | | | – | | | | – | | | | – | | | | 0.87 | | | | 4.16 | | | | 4.72 | | | | – | | | | – | |
Figures quoted represent past performance, which is no guarantee of future results, and do not reflect taxes that a shareholder may pay on fund distributions or the redemption of fund shares. Investment return and principal value of an investment will fluctuate so that an investor’s shares, when redeemed, may be worth more or less than their original cost. Performance shown without sales charges would be lower if sales charges were reflected. Current performance may be lower or higher than the performance data quoted, which assumes the reinvestment of dividends and capital gains. Current month-end performance is available on the Fund’s website, wellsfargofunds.com.
Index returns do not include transaction costs associated with buying and selling securities, any mutual fund fees or expenses, or any taxes. It is not possible to invest directly in an index.
For Class A shares, the maximum front-end sales charge is 4.50%. For Class C shares, the maximum contingent deferred sales charge is 1.00%. Performance including a contingent deferred sales charge assumes the sales charge for the corresponding time period. Administrator Class and Institutional Class shares are sold without a front-end sales charge or contingent deferred sales charge.
Bond values fluctuate in response to the financial condition of individual issuers, general market and economic conditions, and changes in interest rates. Changes in market conditions and government policies may lead to periods of heightened volatility in the bond market and reduced liquidity for certain bonds held by the Fund. In general, when interest rates rise, bond values fall and investors may lose principal value. Interest-rate changes and their impact on the Fund and its share price can be sudden and unpredictable. The use of derivatives may reduce returns and/or increase volatility. Certain investment strategies tend to increase the total risk of an investment (relative to the broader market). The Fund is exposed to Colorado municipal securities risk, high-yield securities risk, and non-diversification risk. Consult the Fund’s prospectus for additional information on these and other risks. A portion of the Fund’s income may be subject to federal, state, and/or local income taxes or the Alternative Minimum Tax (AMT). Any capital gains distributions may be taxable.
Please see footnotes on page 5.
| | | | | | |
| Performance highlights (unaudited) | | Wells Fargo Colorado Tax-Free Fund | | | 5 | |
|
| Effective maturity distribution as of December 31, 20166 |
|
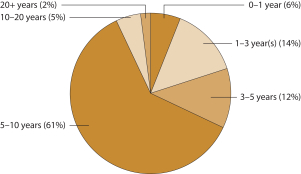
|
|
| Credit quality as of December 31, 20167 |
|
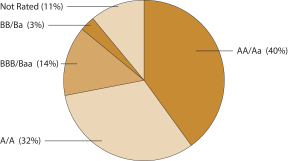
|
| 1 | Historical performance shown for Class C shares prior to their inception reflects the performance of Class A shares, adjusted to reflect the higher expenses applicable to Class C shares. Historical performance shown for the Institutional Class shares prior to their inception reflects the performance of the Administrator Class shares, and is not adjusted to reflect Institutional Class expenses. If these expenses had been included, returns for Institutional Class would be higher. |
| 2 | Reflects the expense ratios as stated in the most recent prospectuses. The expense ratios shown are subject to change and may differ from the annualized expense ratios shown in the financial highlights of this report. |
| 3 | The manager has contractually committed through October 31, 2017, to waive fees and/or reimburse expenses to the extent necessary to cap the Fund’s Total Annual Fund Operating Expenses After Fee Waiver at the amounts shown. After this time, the cap may be increased or the commitment to maintain the cap may be terminated only with the approval of the Board of Trustees. Brokerage commissions, stamp duty fees, interest, taxes, acquired fund fees and expenses, and extraordinary expenses are excluded from the expense cap. Without this cap, the Fund’s returns would have been lower. |
| 4 | The Bloomberg Barclays Municipal Bond Index (formerly known as Barclays Municipal Bond Index) is an unmanaged index composed of long-term tax-exempt bonds with a minimum credit rating of Baa. You cannot invest directly in an index. |
| 5 | The Bloomberg Barclays Colorado Municipal Bond Index (formerly known as Barclays Colorado Municipal Bond Index) is the Colorado component of the Bloomberg Barclays Municipal Bond Index. You cannot invest directly in an index. |
| 6 | Amounts are calculated based on the total investments of the Fund. These amounts are subject to change and may have changed since the date specified. |
| 7 | The credit quality distribution of portfolio holdings reflected in the chart is based on ratings from Standard & Poor’s, Moody’s Investors Service, and/ or Fitch Ratings Ltd. Credit quality ratings apply to the underlying holdings of the Fund and not to the Fund itself. The percentages of the Fund’s portfolio with the ratings depicted in the chart are calculated based on the total market value of fixed income securities held by the Fund. If a security was rated by all three rating agencies, the middle rating was utilized. If rated by two of three rating agencies, the lower rating was utilized, and if rated by one of the rating agencies, that rating was utilized. Standard & Poor’s rates the creditworthiness of bonds, ranging from AAA (highest) to D (lowest). Ratings from A to CCC may be modified by the addition of a plus (+) or minus (-) sign to show relative standing within the rating categories. Standard & Poor’s rates the creditworthiness of short-term notes from SP-1 (highest) to SP-3 (lowest). Moody’s rates the creditworthiness of bonds, ranging from Aaa (highest) to C (lowest). Ratings Aa to B may be modified by the addition of a number 1 (highest) to 3 (lowest) to show relative standing within the ratings categories. Moody’s rates the creditworthiness of short-term U.S. tax-exempt municipal securities from MIG 1/VMIG 1 (highest) to SG (lowest). Fitch rates the creditworthiness of bonds, ranging from AAA (highest) to D (lowest). Credit quality distribution is subject to change and may have changed since the date specified. |
| | | | |
| 6 | | Wells Fargo Colorado Tax-Free Fund | | Fund expenses (unaudited) |
As a shareholder of the Fund, you incur two types of costs: (1) transaction costs, including sales charges (loads) on purchase payments and contingent deferred sales charges (if any) on redemptions and (2) ongoing costs, including management fees, distribution (12b-1) and/or shareholder servicing fees, and other Fund expenses. This example is intended to help you understand your ongoing costs (in dollars) of investing in the Fund and to compare these costs with the ongoing costs of investing in other mutual funds.
The example is based on an investment of $1,000 invested at the beginning of the six-month period and held for the entire period from July 1, 2016 to December 31, 2016.
Actual expenses
The “Actual” line of the table below provides information about actual account values and actual expenses. You may use the information in this line, together with the amount you invested, to estimate the expenses that you paid over the period. Simply divide your account value by $1,000 (for example, an $8,600 account value divided by $1,000 = 8.6), then multiply the result by the number in the “Actual” line under the heading entitled “Expenses paid during period” for your applicable class of shares to estimate the expenses you paid on your account during this period.
Hypothetical example for comparison purposes
The “Hypothetical” line of the table below provides information about hypothetical account values and hypothetical expenses based on the Fund’s actual expense ratio and an assumed rate of return of 5% per year before expenses, which is not the Fund’s actual return. The hypothetical account values and expenses may not be used to estimate the actual ending account balance or expenses you paid for the period. You may use this information to compare the ongoing costs of investing in the Fund and other funds. To do so, compare this 5% hypothetical example with the 5% hypothetical examples that appear in the shareholder reports of the other funds.
Please note that the expenses shown in the table are meant to highlight your ongoing costs only and do not reflect any transactional costs, such as sales charges (loads) and contingent deferred sales charges. Therefore, the “Hypothetical” line of the table is useful in comparing ongoing costs only and will not help you determine the relative total costs of owning different funds. In addition, if these transactional costs were included, your costs would have been higher.
| | | | | | | | | | | | | | | | |
| | | Beginning
account value
7-1-2016 | | | Ending
account value
12-31-2016 | | | Expenses
paid during
the period¹ | | | Annualized net
expense ratio | |
Class A | | | | | | | | | | | | | | | | |
Actual | | $ | 1,000.00 | | | $ | 952.39 | | | $ | 4.17 | | | | 0.85 | % |
Hypothetical (5% return before expenses) | | $ | 1,000.00 | | | $ | 1,020.86 | | | $ | 4.32 | | | | 0.85 | % |
Class C | | | | | | | | | | | | | | | | |
Actual | | $ | 1,000.00 | | | $ | 948.83 | | | $ | 7.84 | | | | 1.60 | % |
Hypothetical (5% return before expenses) | | $ | 1,000.00 | | | $ | 1,017.09 | | | $ | 8.11 | | | | 1.60 | % |
Administrator Class | | | | | | | | | | | | | | | | |
Actual | | $ | 1,000.00 | | | $ | 953.59 | | | $ | 2.95 | | | | 0.60 | % |
Hypothetical (5% return before expenses) | | $ | 1,000.00 | | | $ | 1,022.12 | | | $ | 3.05 | | | | 0.60 | % |
Institutional Class | | | | | | | | | | | | | | | | |
Actual | | $ | 1,000.00 | | | $ | 953.72 | | | $ | 2.55 | | | | 0.52 | % |
Hypothetical (5% return before expenses) | | $ | 1,000.00 | | | $ | 1,022.52 | | | $ | 2.64 | | | | 0.52 | % |
| 1 | Expenses paid is equal to the annualized net expense ratio of each class multiplied by the average account value over the period, multiplied by the number of days in the most recent fiscal half-year divided by the number of days in the fiscal year (to reflect the one-half-year period). |
| | | | | | |
| Portfolio of investments—December 31, 2016 (unaudited) | | Wells Fargo Colorado Tax-Free Fund | | | 7 | |
| | | | | | | | | | | | | | | | |
| Security name | | Interest rate | | | Maturity date | | | Principal | | | Value | |
| | | | |
Municipal Obligations: 96.21% | | | | | | | | | | | | | | | | |
| | | | |
| Arizona: 1.01% | | | | | | | | | | | | | | | | |
Phoenix AZ IDA Rowan University Project (Education Revenue) | | | 5.25 | % | | | 6-1-2034 | | | $ | 1,000,000 | | | $ | 1,102,280 | |
| | | | | | | | | | | | | | | | |
| | | | |
| California: 2.19% | | | | | | | | | | | | | | | | |
Inglewood CA Unified School District (Tax Revenue, AGM Insured) | | | 5.25 | | | | 10-15-2021 | | | | 1,000,000 | | | | 1,137,160 | |
Norco CA Redevelopment Agency Project Area No. 1 (Tax Revenue) | | | 6.00 | | | | 3-1-2036 | | | | 1,120,000 | | | | 1,251,096 | |
| | | | |
| | | | | | | | | | | | | | | 2,388,256 | |
| | | | | | | | | | | | | | | | |
| | | | |
| Colorado: 88.64% | | | | | | | | | | | | | | | | |
Adams County CO 12 Five Star Schools Certificate of Participation Refunding Bonds (Miscellaneous Revenue) | | | 5.00 | | | | 12-15-2027 | | | | 1,200,000 | | | | 1,441,692 | |
Adams County CO Certificate of Participation Refunding Bonds (Miscellaneous Revenue) | | | 5.00 | | | | 12-1-2034 | | | | 500,000 | | | | 562,730 | |
Adams County CO North Range Metropolitan District No. 1 (GO Revenue) | | | 5.00 | | | | 12-1-2038 | | | | 1,000,000 | | | | 1,091,610 | |
Adams County CO Rangeview Library District Certificate of Participation Series 2015 (Miscellaneous Revenue, AGM Insured) | | | 5.00 | | | | 12-15-2029 | | | | 1,000,000 | | | | 1,153,720 | |
Arapahoe County CO Copperleaf Metropolitan District (GO Revenue) | | | 5.75 | | | | 12-1-2045 | | | | 500,000 | | | | 508,930 | |
Arapahoe County CO Water & Wastewater Authority (Water & Sewer Revenue, AGM Insured) | | | 5.00 | | | | 12-1-2033 | | | | 500,000 | | | | 514,380 | |
Arvada CO Jefferson Center Metropolitan District No. 1 (Tax Revenue) | | | 4.75 | | | | 12-1-2026 | | | | 1,000,000 | | | | 982,440 | |
Arvada CO Leyden Rock Metropolitan District No. 10 (GO Revenue) | | | 5.00 | | | | 12-1-2045 | | | | 650,000 | | | | 600,626 | |
Aspen Valley Hospital District Refunding Bonds Series 2012 (Health Revenue) | | | 5.00 | | | | 10-15-2033 | | | | 600,000 | | | | 644,826 | |
Aurora CO Certificate of Participation Refunding Bonds Series 2009A (Miscellaneous Revenue) | | | 5.00 | | | | 12-1-2027 | | | | 2,000,000 | | | | 2,181,100 | |
Aurora CO E-470 Public Highway Authority Colorado CAB Series A (Miscellaneous Revenue, National Insured) ¤ | | | 0.00 | | | | 9-1-2034 | | | | 4,000,000 | | | | 1,932,440 | |
Aurora CO Eagle Bend Metropolitan District No. 2 Refunding Bonds (GO Revenue, Build America Mutual Assurance Company Insured) | | | 5.00 | | | | 12-1-2037 | | | | 1,000,000 | | | | 1,124,770 | |
Aurora CO First Lien Water Improvement Bonds Series 2007A (Water & Sewer Revenue, Ambac Insured) | | | 5.00 | | | | 8-1-2039 | | | | 1,000,000 | | | | 1,023,830 | |
Broomfield CO Great Western Park Metropolitan District No. 2 (GO Revenue) | | | 5.00 | | | | 12-1-2046 | | | | 825,000 | | | | 766,351 | |
Canon City CO Finance Authority Certificate of Participation Series 2008 (Miscellaneous Revenue, AGC Insured) | | | 5.00 | | | | 12-1-2032 | | | | 150,000 | | | | 157,803 | |
Centennial CO Southglenn Metropolitan District (GO Revenue) | | | 5.00 | | | | 12-1-2030 | | | | 750,000 | | | | 760,598 | |
Colorado Board of Governors State University System Enterprise Bonds Series 2013C (Education Revenue) | | | 5.25 | | | | 3-1-2033 | | | | 725,000 | | | | 827,617 | |
Colorado Board of Governors State University System Enterprise Bonds Series E1 (Education Revenue) | | | 5.00 | | | | 3-1-2040 | | | | 2,000,000 | | | | 2,243,160 | |
Colorado ECFA Alexander Dawson School LLC Project (Education Revenue) | | | 5.00 | | | | 2-15-2040 | | | | 1,000,000 | | | | 1,059,200 | |
Colorado ECFA Charter School American Academy Project (Education Revenue) | | | 7.25 | | | | 12-1-2028 | | | | 1,000,000 | | | | 1,130,100 | |
Colorado ECFA Charter School American Academy Project (Education Revenue) | | | 7.38 | | | | 12-1-2028 | | | | 1,000,000 | | | | 1,132,460 | |
Colorado ECFA Charter School Aspen Ridge School Project Series 2015A (Education Revenue) 144A | | | 4.13 | | | | 7-1-2026 | | | | 625,000 | | | | 611,294 | |
Colorado ECFA Charter School Banning Lewis Ranch Academy Project Series A (Education Revenue) | | | 6.00 | | | | 12-15-2037 | | | | 500,000 | | | | 455,640 | |
Colorado ECFA Charter School Ben Franklin Academy Project (Education Revenue) | | | 5.00 | | | | 7-1-2036 | | | | 750,000 | | | | 804,728 | |
Colorado ECFA Charter School Collegiate Project (Education Revenue, Syncora Guarantee Incorporated Insured) | | | 5.00 | | | | 6-15-2019 | | | | 660,000 | | | | 662,013 | |
Colorado ECFA Charter School Collegiate Project (Education Revenue, Syncora Guarantee Incorporated Insured) | | | 5.25 | | | | 6-15-2024 | | | | 1,140,000 | | | | 1,143,545 | |
The accompanying notes are an integral part of these financial statements.
| | | | |
| 8 | | Wells Fargo Colorado Tax-Free Fund | | Portfolio of investments—December 31, 2016 (unaudited) |
| | | | | | | | | | | | | | | | |
| Security name | | Interest rate | | | Maturity date | | | Principal | | | Value | |
| | | | |
| Colorado (continued) | | | | | | | | | | | | | | | | |
Colorado ECFA Charter School District Montessori Charter School Project (Education Revenue) | | | 5.00 | % | | | 7-15-2037 | | | $ | 1,150,000 | | | $ | 1,204,890 | |
Colorado ECFA Charter School Pinnacle High School Project (Education Revenue) | | | 5.13 | | | | 12-1-2039 | | | | 500,000 | | | | 511,185 | |
Colorado ECFA Charter School Refunding and Improvement Bonds Flagstaff Academy Project 2015 (Education Revenue) | | | 5.00 | | | | 8-1-2036 | | | | 335,000 | | | | 362,001 | |
Colorado ECFA Charter School Refunding and Improvement Bonds Frontier Academy Project 2015 (Education Revenue) | | | 5.00 | | | | 6-1-2036 | | | | 540,000 | | | | 582,898 | |
Colorado ECFA Charter School Refunding and Improvement Bonds Skyview Academy Project 2014 (Education Revenue) 144A | | | 4.13 | | | | 7-1-2024 | | | | 500,000 | | | | 499,040 | |
Colorado ECFA Charter School Refunding and Improvement Bonds University Laboratory School Project 2015 (Education Revenue) 144A | | | 5.00 | | | | 12-15-2028 | | | | 600,000 | | | | 610,392 | |
Colorado ECFA Charter School Refunding and Improvement Bonds University Laboratory School Project 2015 (Education Revenue) 144A | | | 4.00 | | | | 12-15-2025 | | | | 535,000 | | | | 518,517 | |
Colorado ECFA Cheyenne Mountain Charter School Project Series A (Education Revenue) | | | 5.25 | | | | 6-15-2029 | | | | 590,000 | | | | 601,405 | |
Colorado ECFA Refunding Bonds Regis University Project (Education Revenue) | | | 5.00 | | | | 10-1-2034 | | | | 2,000,000 | | | | 2,149,420 | |
Colorado ECFA Refunding Bonds The University Corporation for Atmosphere Research Project Series 2010 (Education Revenue) | | | 5.00 | | | | 9-1-2032 | | | | 1,265,000 | | | | 1,366,251 | |
Colorado ECFA Refunding Bonds The University Corporation for Atmosphere Research Project Series B (Education Revenue) | | | 5.00 | | | | 9-1-2030 | | | | 1,770,000 | | | | 1,969,815 | |
Colorado ECFA Student Housing Campus Village Apartment Project (Miscellaneous Revenue) | | | 5.50 | | | | 6-1-2033 | | | | 1,735,000 | | | | 1,814,047 | |
Colorado ECFA Twin Peaks Charter Academy (Education Revenue) | | | 6.75 | | | | 11-15-2028 | | | | 750,000 | | | | 825,713 | |
Colorado EDFA Charter School Refunding and Improvement Bonds Eagle Ridge Academy Project (Education Revenue) 144A | | | 5.00 | | | | 11-1-2036 | | | | 1,000,000 | | | | 968,150 | |
Colorado Fort Lewis College Board of Trustees Series B (Education Revenue) | | | 5.00 | | | | 10-1-2036 | | | | 1,735,000 | | | | 1,972,955 | |
Colorado Health Facilities Authority Adventist Health Sunbelt Series A (Health Revenue) | | | 4.00 | | | | 11-15-2046 | | | | 1,000,000 | | | | 1,006,190 | |
Colorado Health Facilities Authority Adventist Health Sunbelt Series C (Health Revenue) ± | | | 5.00 | | | | 11-15-2036 | | | | 500,000 | | | | 591,475 | |
Colorado Health Facilities Authority Catholic Health Initiatives Series D-1 (Health Revenue) | | | 6.25 | | | | 10-1-2033 | | | | 1,000,000 | | | | 1,071,910 | |
Colorado Health Facilities Authority Children’s Hospital Project Series A (Health Revenue) | | | 5.00 | | | | 12-1-2044 | | | | 2,000,000 | | | | 2,188,480 | |
Colorado Health Facilities Authority Covenant Retirement Communities Series 2012C (Health Revenue) | | | 5.00 | | | | 12-1-2022 | | | | 1,000,000 | | | | 1,113,390 | |
Colorado Health Facilities Authority Evangelical Lutheran Good Samaritan Society Series 2015A (Health Revenue) | | | 5.00 | | | | 6-1-2040 | | | | 1,000,000 | | | | 1,018,240 | |
Colorado Health Facilities Authority Sisters of Charity Leavenworth Health System Series 2013A (Health Revenue) | | | 5.50 | | | | 1-1-2035 | | | | 1,000,000 | | | | 1,143,270 | |
Colorado Health Facilities Authority Sunny Vista Living Center Series A (Health Revenue) 144A | | | 5.00 | | | | 12-1-2025 | | | | 670,000 | | | | 656,995 | |
Colorado HFA Waste Management Incorporated Project (Miscellaneous Revenue) | | | 5.70 | | | | 7-1-2018 | | | | 500,000 | | | | 530,860 | |
Colorado High Performance Transportation Enterprise U.S. 36 and I-25 Managed Lanes (Transportation Revenue) | | | 5.75 | | | | 1-1-2044 | | | | 1,200,000 | | | | 1,266,012 | |
Colorado International Center Metropolitan District No. 3 Refunding Bonds (GO Revenue) | | | 4.63 | | | | 12-1-2031 | | | | 635,000 | | | | 590,848 | |
Colorado Park 70 Metropolitan District Refunding and Improvement Bonds (GO Revenue) | | | 5.00 | | | | 12-1-2036 | | | | 1,000,000 | | | | 1,054,490 | |
Colorado Park Creek Metropolitan District Refunding Bonds Series A (Tax Revenue) | | | 5.00 | | | | 12-1-2045 | | | | 500,000 | | | | 531,015 | |
Colorado Parker Homestead Metropolitan District Refunding and Improvement Bonds (GO Revenue) | | | 5.63 | | | | 12-1-2044 | | | | 1,000,000 | | | | 1,030,530 | |
The accompanying notes are an integral part of these financial statements.
| | | | | | |
| Portfolio of investments—December 31, 2016 (unaudited) | | Wells Fargo Colorado Tax-Free Fund | | | 9 | |
| | | | | | | | | | | | | | | | |
| Security name | | Interest rate | | | Maturity date | | | Principal | | | Value | |
| | | | |
| Colorado (continued) | | | | | | | | | | | | | | | | |
Colorado Regional Transportation District Certificate of Participation Series 2014A (Miscellaneous Revenue) | | | 5.00 | % | | | 6-1-2044 | | | $ | 2,000,000 | �� | | $ | 2,181,900 | |
Colorado Regional Transportation District Certificate of Participation Series 2010A (Miscellaneous Revenue) | | | 5.38 | | | | 6-1-2031 | | | | 2,500,000 | | | | 2,737,975 | |
Colorado Regional Transportation District Certificate of Participation Transit Vehicles Series A (Miscellaneous Revenue, Ambac Insured) | | | 5.00 | | | | 12-1-2022 | | | | 1,000,000 | | | | 1,036,520 | |
Colorado Regional Transportation District Fastracks Project Revenue Bonds Series 2013A (Tax Revenue) | | | 5.00 | | | | 11-1-2031 | | | | 1,000,000 | | | | 1,139,020 | |
Colorado Solaris Metropolitan District No. 3 Refunding Bonds (GO Revenue) | | | 5.00 | | | | 12-1-2046 | | | | 500,000 | | | | 486,810 | |
Colorado Springs CO Utilities System Improvement Bonds Series 2013 B-2 (Utilities Revenue) | | | 5.00 | | | | 11-15-2038 | | | | 3,000,000 | | | | 3,390,030 | |
Colorado Thompson Crossing Metropolitan District No. 2 Series B (GO Revenue, AGM Insured) | | | 5.00 | | | | 12-1-2046 | | | | 820,000 | | | | 894,292 | |
Colorado Western State University Auxiliary Facilities (Education Revenue) | | | 5.00 | | | | 5-15-2027 | | | | 1,100,000 | | | | 1,298,451 | |
Commerce City CO Sales & Use Tax Bonds Series 2014 (Tax Revenue, AGM Insured) | | | 5.00 | | | | 8-1-2044 | | | | 1,250,000 | | | | 1,378,313 | |
Denver CO City & County Department of Aviation Airport System Bonds Series 2012B (Airport Revenue) | | | 5.00 | | | | 11-15-2030 | | | | 2,000,000 | | | | 2,244,840 | |
Denver CO City & County Excise Tax Series A (Tax Revenue, AGC Insured) | | | 6.00 | | | | 9-1-2021 | | | | 2,000,000 | | | | 2,236,800 | |
Denver CO School District No. 1 Certificate of Participation Series B (Miscellaneous Revenue) | | | 5.00 | | | | 12-15-2035 | | | | 1,000,000 | | | | 1,125,950 | |
Denver CO School District No. 1 Certificate of Participation Series B (Miscellaneous Revenue) | | | 5.00 | | | | 12-15-2045 | | | | 1,200,000 | | | | 1,332,504 | |
Douglas County CO Stonegate Village Metropolitan District (Water & Sewer Revenue, AGM Insured) | | | 5.00 | | | | 12-1-2045 | | | | 525,000 | | | | 576,471 | |
East Cherry Creek Valley CO Water and Sanitation District (Water & Sewer Revenue) | | | 5.00 | | | | 11-15-2032 | | | | 750,000 | | | | 860,423 | |
El Paso County CO Lorson Ranch Metropolitan District No. 2 (GO Revenue) | | | 5.00 | | | | 12-1-2041 | | | | 855,000 | | | | 920,057 | |
El Paso County CO School District No. 49 (Miscellaneous Revenue, National Insured) | | | 5.00 | | | | 12-15-2027 | | | | 1,430,000 | | | | 1,484,569 | |
Fountain CO Urban Renewal Authority South Academy Highlands Project Series 2015-A (Tax Revenue) | | | 4.50 | | | | 11-1-2029 | | | | 1,330,000 | | | | 1,357,451 | |
Fremont County CO Finance Corporation Certificate of Participation Series 2013 (Miscellaneous Revenue) | | | 5.25 | | | | 12-15-2038 | | | | 1,265,000 | | | | 1,398,888 | |
Garfield County CO Public Library District Lease Purchase Financing Program (Miscellaneous Revenue) | | | 5.00 | | | | 12-1-2026 | | | | 715,000 | | | | 773,966 | |
Longmont CO Certificate of Participation Series 2014 (Miscellaneous Revenue) | | | 5.00 | | | | 12-1-2034 | | | | 1,000,000 | | | | 1,110,250 | |
Park Meadows CO Business Improvement District (Tax Revenue) | | | 5.00 | | | | 12-1-2017 | | | | 50,000 | | | | 50,921 | |
Platte Valley CO Fire Protection District (Miscellaneous Revenue) | | | 5.00 | | | | 12-1-2036 | | | | 325,000 | | | | 348,212 | |
Regents of the University of Colorado Certificate of Participation Series 2013A (Education Revenue) | | | 5.00 | | | | 11-1-2028 | | | | 2,000,000 | | | | 2,278,820 | |
Thornton CO Development Authority East 144th Avenue and I-25 Project Series B (Tax Revenue) | | | 5.00 | | | | 12-1-2034 | | | | 1,375,000 | | | | 1,527,592 | |
University of Colorado Enterprise System Series A (Education Revenue) | | | 5.00 | | | | 6-1-2026 | | | | 1,000,000 | | | | 1,136,940 | |
University of Colorado Hospital Authority Series A (Health Revenue) | | | 6.00 | | | | 11-15-2029 | | | | 2,000,000 | | | | 2,208,420 | |
Weld County CO Eaton Area Park and Recreation District Series 2015 (GO Revenue) | | | 5.50 | | | | 12-1-2038 | | | | 1,075,000 | | | | 1,104,530 | |
Westminster CO Certificate of Participation Series 2015A (Miscellaneous Revenue) | | | 5.00 | | | | 12-1-2035 | | | | 2,000,000 | | | | 2,246,020 | |
Wheatlands CO (GO Revenue, Build America Mutual Assurance Company Insured) | | | 5.00 | | | | 12-1-2030 | | | | 500,000 | | | | 565,200 | |
| | | | |
| | | | | | | | | | | | | | | 96,700,122 | |
| | | | | | | | | | | | | | | | |
|
| Guam: 1.48% | |
Guam Government Business Privilege Tax Series A (Tax Revenue) | | | 5.00 | | | | 1-1-2031 | | | | 1,000,000 | | | | 1,062,630 | |
Guam Government Limited Obligation Section 30 Series A (Miscellaneous Revenue) | | | 5.75 | | | | 12-1-2034 | | | | 500,000 | | | | 558,035 | |
| | | | |
| | | | | | | | | | | | | | | 1,620,665 | |
| | | | | | | | | | | | | | | | |
The accompanying notes are an integral part of these financial statements.
| | | | |
| 10 | | Wells Fargo Colorado Tax-Free Fund | | Portfolio of investments—December 31, 2016 (unaudited) |
| | | | | | | | | | | | | | | | |
| Security name | | Interest rate | | | Maturity date | | | Principal | | | Value | |
|
| Maryland: 0.42% | |
Maryland Economic Development Corporation Salisbury University Project (Education Revenue) | | | 5.00 | % | | | 6-1-2027 | | | $ | 235,000 | | | $ | 250,228 | |
Maryland Economic Development Corporation Salisbury University Project (Education Revenue) | | | 5.00 | | | | 6-1-2030 | | | | 200,000 | | | | 210,248 | |
| | | | |
| | | | | | | | | | | | | | | 460,476 | |
| | | | | | | | | | | | | | | | |
| Pennsylvania: 1.48% | |
East Hempfield Township PA IDA Student Services Incorporated Student Housing Project of Millersville University (Education Revenue) | | | 5.00 | | | | 7-1-2029 | | | | 500,000 | | | | 529,805 | |
Pennsylvania Higher Education Facilities Authority Indiana University Student Housing Project Series A (Education Revenue) | | | 5.00 | | | | 7-1-2032 | | | | 1,000,000 | | | | 1,087,530 | |
| | | | |
| | | | | | | | | | | | | | | 1,617,335 | |
| | | | | | | | | | | | | | | | |
| Virgin Islands: 0.99% | |
Virgin Islands PFA Matching Fund Loan Note Senior Lien Series A (Tobacco Revenue, AGM Insured) | | | 5.00 | | | | 10-1-2029 | | | | 1,000,000 | | | | 1,075,590 | |
| | | | | | | | | | | | | | | | |
| |
Total Municipal Obligations (Cost $102,116,020) | | | | 104,964,724 | |
| | | | | | | | | | | | | | | | |
| | | | |
| | | Yield | | | | | | Shares | | | | |
| Short-Term Investments: 0.26% | |
|
| Investment Companies: 0.26% | |
Wells Fargo Municipal Cash Management Fund Institutional Class (l)(u) | | | 0.67 | | | | | | | | 284,383 | | | | 284,553 | |
| | | | | | | | | | | | | | | | |
| |
Total Short-Term Investments (Cost $284,490) | | | | 284,553 | |
| | | | | | | | | | | | | | | | |
| | | | | | | | |
| Total investments in securities (Cost $102,400,510) * | | | 96.47 | % | | | 105,249,277 | |
Other assets and liabilities, net | | | 3.53 | | | | 3,848,418 | |
| | | | | | | | |
| Total net assets | | | 100.00 | % | | $ | 109,097,695 | |
| | | | | | | | |
| ¤ | The security is issued in zero coupon form with no periodic interest payments. |
| 144A | The security may be resold in transactions exempt from registration, normally to qualified institutional buyers, pursuant to Rule 144A under the Securities Act of 1933. |
| ± | Variable rate investment. The rate shown is the rate in effect at period end. |
| (l) | The issuer of the security is an affiliated person of the Fund as defined in the Investment Company Act of 1940. |
| (u) | The rate represents the 7-day annualized yield at period end. |
| * | Cost for federal income tax purposes is $102,400,308 and unrealized gains (losses) consists of: |
| | | | |
Gross unrealized gains | | $ | 4,318,093 | |
Gross unrealized losses | | | (1,469,124 | ) |
| | | | |
Net unrealized gains | | $ | 2,848,969 | |
The accompanying notes are an integral part of these financial statements.
| | | | | | |
| Statement of assets and liabilities—December 31, 2016 (unaudited) | | Wells Fargo Colorado Tax-Free Fund | | | 11 | |
| | | | |
| | | | |
| |
Assets | | | | |
Investments | | | | |
In unaffiliated securities, at value (cost $102,116,020) | | $ | 104,964,724 | |
In affiliated securities, at value (cost $284,490) | | | 284,553 | |
| | | | |
Total investments, at value (cost $102,400,510) | | | 105,249,277 | |
Receivable for investments sold | | | 3,029,438 | |
Receivable for Fund shares sold | | | 291,151 | |
Receivable for interest | | | 875,982 | |
Prepaid expenses and other assets | | | 31,596 | |
| | | | |
Total assets | | | 109,477,444 | |
| | | | |
| |
Liabilities | | | | |
Dividends payable | | | 136,141 | |
Payable for Fund shares redeemed | | | 98,530 | |
Management fee payable | | | 13,023 | |
Distribution fee payable | | | 6,057 | |
Administration fees payable | | | 12,664 | |
Shareholder report expenses payable | | | 46,912 | |
Shareholder servicing fees payable | | | 23,613 | |
Professional fees payable | | | 35,610 | |
Accrued expenses and other liabilities | | | 7,199 | |
| | | | |
Total liabilities | | | 379,749 | |
| | | | |
Total net assets | | $ | 109,097,695 | |
| | | | |
| |
NET ASSETS CONSIST OF | | | | |
Paid-in capital | | $ | 107,573,957 | |
Undistributed net investment income | | | 298,074 | |
Accumulated net realized losses on investments | | | (1,623,103 | ) |
Net unrealized gains on investments | | | 2,848,767 | |
| | | | |
Total net assets | | $ | 109,097,695 | |
| | | | |
| |
COMPUTATION OF NET ASSET VALUE AND OFFERING PRICE PER SHARE | | | | |
Net assets – Class A | | $ | 39,382,085 | |
Shares outstanding – Class A1 | | | 3,649,818 | |
Net asset value per share – Class A | | | $10.79 | |
Maximum offering price per share – Class A2 | | | $11.30 | |
Net assets – Class C | | $ | 8,940,179 | |
Shares outstanding – Class C1 | | | 827,768 | |
Net asset value per share – Class C | | | $10.80 | |
Net assets – Administrator Class | | $ | 52,139,622 | |
Shares outstanding – Administrator Class1 | | | 4,832,205 | |
Net asset value per share – Administrator Class | | | $10.79 | |
Net assets – Institutional Class | | $ | 8,635,809 | |
Shares outstanding – Institutional Class1 | | | 800,247 | |
Net asset value per share – Institutional Class | | | $10.79 | |
| 1 | The Fund has an unlimited number of authorized shares. |
| 2 | Maximum offering price is computed as 100/95.50 of net asset value. On investments of $50,000 or more, the offering price is reduced. |
The accompanying notes are an integral part of these financial statements.
| | | | |
| 12 | | Wells Fargo Colorado Tax-Free Fund | | Statement of operations—six months ended December 31, 2016 (unaudited) |
| | | | |
| | | | |
| |
Investment income | | | | |
Interest | | $ | 2,275,401 | |
Income from affiliated securities | | | 2,742 | |
| | | | |
Total investment income | | | 2,278,143 | |
| | | | |
| |
Expenses | | | | |
Management fee | | | 239,725 | |
Administration fees | | | | |
Class A | | | 34,241 | |
Class C | | | 7,452 | |
Administrator Class | | | 32,913 | |
Institutional Class | | | 768 | 1 |
Shareholder servicing fees | | | | |
Class A | | | 53,502 | |
Class C | | | 11,644 | |
Administrator Class | | | 82,061 | |
Distribution fee | |
Class C | | | 34,932 | |
Custody and accounting fees | | | 5,856 | |
Professional fees | | | 40,669 | |
Registration fees | | | 10,980 | |
Shareholder report expenses | | | 51,505 | |
Trustees’ fees and expenses | | | 12,730 | |
Other fees and expenses | | | 3,380 | |
| | | | |
Total expenses | | | 622,358 | |
Less: Fee waivers and/or expense reimbursements | | | (163,461 | ) |
| | | | |
Net expenses | | | 458,897 | |
| | | | |
Net investment income | | | 1,819,246 | |
| | | | |
| |
REALIZED AND UNREALIZED GAINS (LOSSES) ON INVESTMENTS | | | | |
| |
Net realized gains (losses) on: | | | | |
Unaffiliated securities | | | (150,046 | ) |
Affiliated securities | | | 30 | |
| | | | |
Net realized gains (losses) on investments | | | (150,016 | ) |
| | | | |
| |
Net change in unrealized gains (losses) on: | | | | |
Unaffiliated securities | | | (7,401,128 | ) |
Affiliated securities | | | 63 | |
| | | | |
Net change in unrealized gains (losses) on investments | | | (7,401,065 | ) |
| | | | |
Net realized and unrealized gains (losses) on investments | | | (7,551,081 | ) |
| | | | |
Net decrease in net assets resulting from operations | | $ | (5,731,835 | ) |
| | | | |
| 1 | For the period from October 31, 2016 (commencement of class operations) to December 31, 2016 |
The accompanying notes are an integral part of these financial statements.
| | | | | | |
| Statement of changes in net assets | | Wells Fargo Colorado Tax-Free Fund | | | 13 | |
| | | | | | | | | | | | | | | | |
| | | Six months ended December 31, 2016 (unaudited) | | | Year ended
June 30, 2016 | |
| | | | |
Operations | | | | | | | | | | | | | | | | |
Net investment income | | | | | | $ | 1,819,246 | | | | | | | $ | 3,085,095 | |
Net realized losses on investments | | | | | | | (150,016 | ) | | | | | | | (27,079 | ) |
Net change in unrealized gains (losses) on investments | | | | | | | (7,401,065 | ) | | | | | | | 5,358,174 | |
| | | | |
Net increase (decrease) in net assets resulting from operations | | | | | | | (5,731,835 | ) | | | | | | | 8,416,190 | |
| | | | |
| | | | |
Distributions to shareholders from | | | | | | | | | | | | | | | | |
Net investment income | | | | | | | | | | | | | | | | |
Class A | | | | | | | (631,673 | ) | | | | | | | (1,095,590 | ) |
Class C | | | | | | | (102,449 | ) | | | | | | | (124,324 | ) |
Administrator Class | | | | | | | (1,051,844 | ) | | | | | | | (1,865,181 | ) |
Institutional Class | | | | | | | (33,278 | )1 | | | | | | | N/A | |
| | | | |
Total distributions to shareholders | | | | | | | (1,819,244 | ) | | | | | | | (3,085,095 | ) |
| | | | |
| | | | |
Capital share transactions | | | Shares | | | | | | | | Shares | | | | | |
Proceeds from shares sold | | | | | | | | | | | | | | | | |
Class A | | | 470,516 | | | | 5,315,535 | | | | 696,674 | | | | 7,784,831 | |
Class C | | | 174,810 | | | | 1,975,652 | | | | 422,886 | | | | 4,750,010 | |
Administrator Class | | | 815,456 | | | | 9,155,252 | | | | 1,447,561 | | | | 16,128,508 | |
Institutional Class | | | 853,214 | 1 | | | 9,226,997 | 1 | | | N/A | | | | N/A | |
| | | | |
| | | | | | | 25,673,436 | | | | | | | | 28,663,349 | |
| | | | |
Reinvestment of distributions | | | | | | | | | | | | | | | | |
Class A | | | 54,553 | | | | 607,486 | | | | 95,642 | | | | 1,066,603 | |
Class C | | | 8,642 | | | | 96,225 | | | | 10,332 | | | | 115,562 | |
Administrator Class | | | 33,777 | | | | 377,111 | | | | 58,589 | | | | 653,646 | |
Institutional Class | | | 2,939 | 1 | | | 31,651 | 1 | | | N/A | | | | N/A | |
| | | | |
| | | | | | | 1,112,473 | | | | | | | | 1,835,811 | |
| | | | |
Payment for shares redeemed | | | | | | | | | | | | | | | | |
Class A | | | (470,921 | ) | | | (5,197,001 | ) | | | (285,488 | ) | | | (3,174,098 | ) |
Class C | | | (94,537 | ) | | | (1,049,336 | ) | | | (76,234 | ) | | | (855,123 | ) |
Administrator Class | | | (1,695,037 | ) | | | (18,420,994 | ) | | | (618,076 | ) | | | (6,860,160 | ) |
Institutional Class | | | (55,906 | )1 | | | (598,919 | )1 | | | N/A | | | | N/A | |
| | | | |
| | | | | | | (25,266,250 | ) | | | | | | | (10,889,381 | ) |
| | | | |
Net increase in net assets resulting from capital share transactions | | | | | | | 1,519,659 | | | | | | | | 19,609,779 | |
| | | | |
Total increase (decrease) in net assets | | | | | | | (6,031,420 | ) | | | | | | | 24,940,874 | |
| | | | |
| | | | |
Net assets | | | | | | | | | | | | | | | | |
Beginning of period | | | | | | | 115,129,115 | | | | | | | | 90,188,241 | |
| | | | |
End of period | | | | | | $ | 109,097,695 | | | | | | | $ | 115,129,115 | |
| | | | |
Undistributed net investment income | | | | | | $ | 298,074 | | | | | | | $ | 298,072 | |
| | | | |
| 1 | For the period from October 31, 2016 (commencement of class operations) to December 31, 2016 |
The accompanying notes are an integral part of these financial statements.
| | | | |
| 14 | | Wells Fargo Colorado Tax-Free Fund | | Financial highlights |
(For a share outstanding throughout each period)
| | | | | | | | | | | | | | | | | | | | | | | | |
| | | Six months ended
December 31, 2016 (unaudited) | | | Year ended June 30 | |
| CLASS A | | | 2016 | | | 2015 | | | 2014 | | | 2013 | | | 2012 | |
Net asset value, beginning of period | | | $11.50 | | | | $10.92 | | | | $10.85 | | | | $10.46 | | | | $10.72 | | | | $10.15 | |
Net investment income | | | 0.17 | | | | 0.34 | 1 | | | 0.34 | 1 | | | 0.35 | 1 | | | 0.34 | | | | 0.38 | |
Net realized and unrealized gains (losses) on investments | | | (0.71 | ) | | | 0.58 | | | | 0.07 | | | | 0.39 | | | | (0.26 | ) | | | 0.57 | |
| | | | | | | | | | | | | | | | | | | | | | | | |
Total from investment operations | | | (0.54 | ) | | | 0.92 | | | | 0.41 | | | | 0.74 | | | | 0.08 | | | | 0.95 | |
Distributions to shareholders from | | | | | | | | | | | | | | | | | | | | | | | | |
Net investment income | | | (0.17 | ) | | | (0.34 | ) | | | (0.34 | ) | | | (0.35 | ) | | | (0.34 | ) | | | (0.38 | ) |
Net asset value, end of period | | | $10.79 | | | | $11.50 | | | | $10.92 | | | | $10.85 | | | | $10.46 | | | | $10.72 | |
Total return2 | | | (4.76 | )% | | | 8.53 | % | | | 3.82 | % | | | 7.26 | % | | | 0.65 | % | | | 9.51 | % |
Ratios to average net assets (annualized) | | | | | | | | | | | | | | | | | | | | | | | | |
Gross expenses | | | 1.02 | % | | | 0.93 | % | | | 0.93 | % | | | 0.94 | % | | | 0.91 | % | | | 0.91 | % |
Net expenses | | | 0.85 | % | | | 0.85 | % | | | 0.85 | % | | | 0.85 | % | | | 0.85 | % | | | 0.85 | % |
Net investment income | | | 2.95 | % | | | 3.02 | % | | | 3.12 | % | | | 3.35 | % | | | 3.10 | % | | | 3.64 | % |
Supplemental data | | | | | | | | | | | | | | | | | | | | | | | | |
Portfolio turnover rate | | | 13 | % | | | 13 | % | | | 23 | % | | | 33 | % | | | 36 | % | | | 41 | % |
Net assets, end of period (000s omitted) | | | $39,382 | | | | $41,341 | | | | $33,722 | | | | $35,088 | | | | $46,069 | | | | $53,185 | |
| 1 | Calculated based upon average shares outstanding |
| 2 | Total return calculations do not include any sales charges. Returns for periods of less than one year are not annualized. |
The accompanying notes are an integral part of these financial statements.
| | | | | | |
| Financial highlights | | Wells Fargo Colorado Tax-Free Fund | | | 15 | |
(For a share outstanding throughout each period)
| | | | | | | | | | | | | | | | | | | | | | | | |
| | | Six months ended
December 31, 2016 (unaudited) | | | Year ended June 30 | |
| CLASS C | | | 2016 | | | 2015 | | | 2014 | | | 2013 | | | 2012 | |
Net asset value, beginning of period | | | $11.51 | | | | $10.93 | | | | $10.86 | | | | $10.47 | | | | $10.73 | | | | $10.16 | |
Net investment income | | | 0.13 | | | | 0.25 | | | | 0.26 | | | | 0.28 | | | | 0.26 | | | | 0.30 | |
Net realized and unrealized gains (losses) on investments | | | (0.71 | ) | | | 0.58 | | | | 0.07 | | | | 0.38 | | | | (0.26 | ) | | | 0.57 | |
| | | | | | | | | | | | | | | | | | | | | | | | |
Total from investment operations | | | (0.58 | ) | | | 0.83 | | | | 0.33 | | | | 0.66 | | | | 0.00 | | | | 0.87 | |
Distributions to shareholders from | | | | | | | | | | | | | | | | | | | | | | | | |
Net investment income | | | (0.13 | ) | | | (0.25 | ) | | | (0.26 | ) | | | (0.27 | ) | | | (0.26 | ) | | | (0.30 | ) |
Net asset value, end of period | | | $10.80 | | | | $11.51 | | | | $10.93 | | | | $10.86 | | | | $10.47 | | | | $10.73 | |
Total return1 | | | (5.12 | )% | | | 7.71 | % | | | 3.05 | % | | | 6.46 | % | | | (0.10 | )% | | | 8.69 | % |
Ratios to average net assets (annualized) | | | | | | | | | | | | | | | | | | | | | | | | |
Gross expenses | | | 1.77 | % | | | 1.68 | % | | | 1.68 | % | | | 1.69 | % | | | 1.67 | % | | | 1.66 | % |
Net expenses | | | 1.60 | % | | | 1.60 | % | | | 1.60 | % | | | 1.60 | % | | | 1.60 | % | | | 1.60 | % |
Net investment income | | | 2.20 | % | | | 2.26 | % | | | 2.35 | % | | | 2.60 | % | | | 2.34 | % | | | 2.89 | % |
Supplemental data | | | | | | | | | | | | | | | | | | | | | | | | |
Portfolio turnover rate | | | 13 | % | | | 13 | % | | | 23 | % | | | 33 | % | | | 36 | % | | | 41 | % |
Net assets, end of period (000s omitted) | | | $8,940 | | | | $8,503 | | | | $4,173 | | | | $3,689 | | | | $4,460 | | | | $4,012 | |
| 1 | Total return calculations do not include any sales charges. Returns for periods of less than one year are not annualized. |
The accompanying notes are an integral part of these financial statements.
| | | | |
| 16 | | Wells Fargo Colorado Tax-Free Fund | | Financial highlights |
(For a share outstanding throughout each period)
| | | | | | | | | | | | | | | | | | | | | | | | |
| | | Six months ended
December 31, 2016 (unaudited) | | | Year ended June 30 | |
| ADMINISTRATOR CLASS | | | 2016 | | | 2015 | | | 2014 | | | 2013 | | | 2012 | |
Net asset value, beginning of period | | | $11.50 | | | | $10.92 | | | | $10.85 | | | | $10.46 | | | | $10.72 | | | | $10.15 | |
Net investment income | | | 0.18 | 1 | | | 0.36 | | | | 0.37 | | | | 0.38 | | | | 0.36 | | | | 0.41 | |
Net realized and unrealized gains (losses) on investments | | | (0.71 | ) | | | 0.58 | | | | 0.07 | | | | 0.39 | | | | (0.26 | ) | | | 0.57 | |
| | | | | | | | | | | | | | | | | | | | | | | | |
Total from investment operations | | | (0.53 | ) | | | 0.94 | | | | 0.44 | | | | 0.77 | | | | 0.10 | | | | 0.98 | |
Distributions to shareholders from | | | | | | | | | | | | | | | | | | | | | | | | |
Net investment income | | | (0.18 | ) | | | (0.36 | ) | | | (0.37 | ) | | | (0.38 | ) | | | (0.36 | ) | | | (0.41 | ) |
Net asset value, end of period | | | $10.79 | | | | $11.50 | | | | $10.92 | | | | $10.85 | | | | $10.46 | | | | $10.72 | |
Total return2 | | | (4.64 | )% | | | 8.80 | % | | | 4.08 | % | | | 7.53 | % | | | 0.90 | % | | | 9.78 | % |
Ratios to average net assets (annualized) | | | | | | | | | | | | | | | | | | | | | | | | |
Gross expenses | | | 0.96 | % | | | 0.87 | % | | | 0.87 | % | | | 0.88 | % | | | 0.86 | % | | | 0.84 | % |
Net expenses | | | 0.60 | % | | | 0.60 | % | | | 0.60 | % | | | 0.60 | % | | | 0.60 | % | | | 0.60 | % |
Net investment income | | | 3.20 | % | | | 3.27 | % | | | 3.36 | % | | | 3.60 | % | | | 3.34 | % | | | 3.89 | % |
Supplemental data | | | | | | | | | | | | | | | | | | | | | | | | |
Portfolio turnover rate | | | 13 | % | | | 13 | % | | | 23 | % | | | 33 | % | | | 36 | % | | | 41 | % |
Net assets, end of period (000s omitted) | | | $52,140 | | | | $65,285 | | | | $52,294 | | | | $44,272 | | | | $49,549 | | | | $43,876 | |
| 1 | Calculated based upon average shares outstanding |
| 2 | Returns for periods of less than one year are not annualized. |
The accompanying notes are an integral part of these financial statements.
| | | | | | |
| Financial highlights | | Wells Fargo Colorado Tax-Free Fund | | | 17 | |
(For a share outstanding throughout the period)
| | | | |
| | | Period ended
December 31, 20161 (unaudited) | |
| INSTITUTIONAL CLASS | |
Net asset value, beginning of period | | | $11.19 | |
Net investment income | | | 0.06 | |
Net realized and unrealized gains (losses) on investments | | | (0.40 | ) |
| | | | |
Total from investment operations | | | (0.34 | ) |
Distributions to shareholders from | | | | |
Net investment income | | | (0.06 | ) |
Net asset value, end of period | | | $10.79 | |
Total return2 | | | (3.01 | )% |
Ratios to average net assets (annualized) | | | | |
Gross expenses | | | 0.70 | % |
Net expenses | | | 0.52 | % |
Net investment income | | | 3.47 | % |
Supplemental data | | | | |
Portfolio turnover rate | | | 13 | % |
Net assets, end of period (000s omitted) | | | $8,636 | |
| 1 | For the period from October 31, 2016 (commencement of class operations) to December 31, 2016 |
| 2 | Returns for periods of less than one year are not annualized. |
The accompanying notes are an integral part of these financial statements.
| | | | |
| 18 | | Wells Fargo Colorado Tax-Free Fund | | Notes to financial statements (unaudited) |
1. ORGANIZATION
Wells Fargo Funds Trust (the “Trust”), a Delaware statutory trust organized on March 10, 1999, is an open-end management investment company registered under the Investment Company Act of 1940, as amended (the “1940 Act”). As an investment company, the Trust follows the accounting and reporting guidance in Financial Accounting Standards Board (“FASB”) Accounting Standards Codification Topic 946, Financial Services – Investment Companies. These financial statements report on the Wells Fargo Colorado Tax-Free Fund (the “Fund”) which is a non-diversified series of the Trust.
2. SIGNIFICANT ACCOUNTING POLICIES
The following significant accounting policies, which are consistently followed in the preparation of the financial statements of the Fund, are in conformity with U.S. generally accepted accounting principles which require management to make estimates and assumptions that affect the reported amounts of assets and liabilities, disclosure of contingent assets and liabilities at the date of the financial statements, and the reported amounts of revenues and expenses during the reporting period. Actual results could differ from those estimates.
Securities valuation
All investments are valued each business day as of the close of regular trading on the New York Stock Exchange (generally 4 p.m. Eastern Time), although the Fund may deviate from this calculation time under unusual or unexpected circumstances.
Debt securities are valued at the evaluated bid price provided by an independent pricing service or, if a reliable price is not available, the quoted bid price from an independent broker-dealer.
Investments in registered open-end investment companies are valued at net asset value.
Investments which are not valued using any of the methods discussed above are valued at their fair value, as determined in good faith by the Board of Trustees of the Fund. The Board of Trustees has established a Valuation Committee comprised of the Trustees and has delegated to it the authority to take any actions regarding the valuation of portfolio securities that the Valuation Committee deems necessary or appropriate, including determining the fair value of portfolio securities, unless the determination has been delegated to the Management Valuation Team of Wells Fargo Funds Management, LLC (“Funds Management”). The Board of Trustees retains the authority to make or ratify any valuation decisions or approve any changes to the Valuation Procedures as it deems appropriate. On a quarterly basis, the Board of Trustees receives reports on any valuation actions taken by the Valuation Committee or the Management Valuation Team which may include items for ratification.
Valuations of fair valued securities are compared to the next actual sales price when available, or other appropriate market values, to assess the continued appropriateness of the fair valuation methodologies used. These securities are fair valued on a day-to-day basis, taking into consideration changes to appropriate market information and any significant changes to the inputs considered in the valuation process until there is a readily available price provided on an exchange or by an independent pricing service. Valuations received from an independent pricing service or independent broker-dealer quotes are periodically validated by comparisons to most recent trades and valuations provided by other independent pricing services in addition to the review of prices by the manager and/or subadviser. Unobservable inputs used in determining fair valuations are identified based on the type of security, taking into consideration factors utilized by market participants in valuing the investment, knowledge about the issuer and the current market environment.
When-issued transactions
The Fund may purchase securities on a forward commitment or when-issued basis. The Fund records a when-issued transaction on the trade date and will segregate assets in an amount at least equal in value to the Fund’s commitment to purchase when-issued securities. Securities purchased on a when-issued basis are marked-to-market daily and the Fund begins earning interest on the settlement date. Losses may arise due to changes in the market value of the underlying securities or if the counterparty does not perform under the contract.
Security transactions and income recognition
Securities transactions are recorded on a trade date basis. Realized gains or losses are recorded on the basis of identified cost.
Interest income is accrued daily and bond discounts are accreted and premiums are amortized daily based on the effective interest method. To the extent debt obligations are placed on non-accrual status, any related interest income may be reduced by writing off interest receivables when the collection of all or a portion of interest has become doubtful based on consistently applied procedures. If the issuer subsequently resumes interest payments or when the collectability of interest is reasonably assured, the debt obligation is removed from non-accrual status.
| | | | | | |
| Notes to financial statements (unaudited) | | Wells Fargo Colorado Tax-Free Fund | | | 19 | |
Distributions to shareholders
Distributions to shareholders from net investment income are accrued daily and paid monthly. Distributions from net realized gains, if any, are recorded on the ex-dividend date. Such distributions are determined in conformity with federal income tax regulations, which may differ in amount or character from net investment income and realized gains recognized for purposes of U.S. generally accepted accounting principles.
Federal and other taxes
The Fund intends to continue to qualify as a regulated investment company by distributing substantially all of its investment company taxable and tax-exempt income and any net realized capital gains (after reduction for capital loss carryforwards) sufficient to relieve it from all, or substantially all, federal income taxes. Accordingly, no provision for federal income taxes was required.
The Fund’s income and federal excise tax returns and all financial records supporting those returns for the prior three fiscal years are subject to examination by the federal and Delaware revenue authorities. Management has analyzed the Fund’s tax positions taken on federal, state, and foreign tax returns for all open tax years and does not believe that there are any uncertain tax positions that require recognition of a tax liability.
Capital loss carryforwards that do not expire are required to be utilized prior to capital loss carryforwards that expire. As of June 30, 2016, capital loss carryforwards available to offset future net realized capital gains were as follows through the indicated expiration dates:
| | | | |
| | | | | No expiration |
| 2018 | | 2019 | | Short-term |
| $548,785 | | $57,793 | | $829,427 |
As of June 30, 2016, the Fund had current year deferred post-October capital losses consisting of $37,825 in long-term losses which were recognized on the first day of the current fiscal year.
Class allocations
The separate classes of shares offered by the Fund differ principally in applicable sales charges, distribution, shareholder servicing, and administration fees. Class specific expenses are charged directly to that share class. Investment income, common expenses, and realized and unrealized gains (losses) on investments are allocated daily to each class of shares based on the relative proportion of net assets of each class.
3. FAIR VALUATION MEASUREMENTS
Fair value measurements of investments are determined within a framework that has established a fair value hierarchy based upon the various data inputs utilized in determining the value of the Fund’s investments. The three-level hierarchy gives the highest priority to unadjusted quoted prices in active markets for identical assets or liabilities (Level 1) and the lowest priority to significant unobservable inputs (Level 3). The Fund’s investments are classified within the fair value hierarchy based on the lowest level of input that is significant to the fair value measurement. The inputs are summarized into three broad levels as follows:
| ∎ | | Level 1 – quoted prices in active markets for identical securities |
| ∎ | | Level 2 – other significant observable inputs (including quoted prices for similar securities, interest rates, prepayment speeds, credit risk, use of amortized cost, etc.) |
| ∎ | | Level 3 – significant unobservable inputs (including the Fund’s own assumptions in determining the fair value of investments) |
The inputs or methodologies used for valuing investments in securities are not necessarily an indication of the risk associated with investing in those securities.
| | | | |
| 20 | | Wells Fargo Colorado Tax-Free Fund | | Notes to financial statements (unaudited) |
The following is a summary of the inputs used in valuing the Fund’s assets and liabilities as of December 31, 2016:
| | | | | | | | | | | | | | | | |
| | | Quoted prices
(Level 1) | | | Other significant
observable inputs
(Level 2) | | | Significant
unobservable inputs
(Level 3) | | | Total | |
Assets | | | | | | | | | | | | | | | | |
Investments in: | | | | | | | | | | | | | | | | |
| | | | |
Municipal obligations | | $ | 0 | | | $ | 104,964,724 | | | $ | 0 | | | $ | 104,964,724 | |
| | | | |
Short-term investments | | | | | | | | | | | | | | | | |
Investment companies | | | 284,553 | | | | 0 | | | | 0 | | | | 284,553 | |
Total assets | | $ | 284,553 | | | $ | 104,964,724 | | | $ | 0 | | | $ | 105,249,277 | |
The Fund recognizes transfers between levels within the fair value hierarchy at the end of the reporting period. At December 31, 2016, the Fund did not have any transfers into/out of Level 1, Level 2, or Level 3.
4. TRANSACTIONS WITH AFFILIATES AND OTHER EXPENSES
Management fee
Funds Management, an indirect wholly owned subsidiary of Wells Fargo & Company (“Wells Fargo”), is the manager of the Fund and provides advisory and fund-level administrative services under an investment management agreement. Under the investment management agreement, Funds Management is responsible for, among other services, implementing the investment objectives and strategies of the Fund, supervising the subadviser, providing fund-level administrative services in connection with the Fund’s operations, and providing any other fund-level administrative services reasonably necessary for the operation of the Fund. As compensation for its services under the investment management agreement, Funds Management is entitled to receive an annual management fee starting at 0.40% and declining to 0.28% as the average daily net assets of the Fund increase. For the six months ended December 31, 2016, the management fee was equivalent to an annual rate of 0.40% of the Fund’s average daily net assets.
Funds Management has retained the services of a subadviser to provide daily portfolio management to the Fund. The fee for subadvisory services is borne by Funds Management. Wells Capital Management Incorporated, an affiliate of Funds Management and an indirect wholly owned subsidiary of Wells Fargo, is the subadviser to the Fund and is entitled to receive a fee from Funds Management at an annual rate starting at 0.20% and declining to 0.10% as the average daily net assets of the Fund increase.
Administration fees
Under a class-level administration agreement, Funds Management provides class-level administrative services to the Fund, which includes paying fees and expenses for services provided by the transfer agent, sub-transfer agents, omnibus account servicers and record-keepers. As compensation for its services under the class-level administration agreement, Funds Management receives an annual fee which is calculated based on the average daily net assets of each class as follows:
| | | | |
| | | Class level
administration fee | |
Class A, Class C | | | 0.16 | % |
Administrator Class | | | 0.10 | |
Institutional Class | | | 0.08 | |
Funds Management has contractually waived and/or reimbursed management and administration fees to the extent necessary to maintain certain net operating expense ratios for the Fund. Waiver of fees and/or reimbursement of expenses by Funds Management were made first from fund level expenses on a proportionate basis and then from class specific expenses. Funds Management has committed through October 31, 2017 to waive fees and/or reimburse expenses to the extent necessary to cap the Fund’s expenses at 0.85% for Class A shares, 1.60% for Class C shares, 0.60% for Administrator Class shares, and 0.52% for Institutional Class shares. After this time, the cap may be increased or the commitment to maintain the cap may be terminated only with the approval of the Board of Trustees.
During the six months ended December 31, 2016, State Street Bank and Trust Company, the Fund’s custodian, reimbursed the Fund $7 for certain out-of-pocket expenses that were billed to the Fund in error from 1998-2015. This amount is included in interest income on the Statement of Operations. In addition, Funds Management was also reimbursed $3,035 for waivers/reimbursements it made to the Fund during the period the Fund was erroneously billed.
| | | | | | |
| Notes to financial statements (unaudited) | | Wells Fargo Colorado Tax-Free Fund | | | 21 | |
Distribution fee
The Trust has adopted a Distribution Plan for Class C shares of the Fund pursuant to Rule 12b-1 under the 1940 Act. A distribution fee is charged to Class C shares and paid to Wells Fargo Funds Distributor, LLC (“Funds Distributor”), the principal underwriter, at an annual rate of 0.75% of the average daily net assets of Class C shares.
In addition, Funds Distributor is entitled to receive the front-end sales charge from the purchase of Class A shares and a contingent deferred sales charge on the redemption of certain Class A shares. Funds Distributor is also entitled to receive the contingent deferred sales charges from redemptions of Class C shares. For the six months ended December 31, 2016, Funds Distributor received $6,653 from the sale of Class A shares.
Shareholder servicing fees
The Trust has entered into contracts with one or more shareholder servicing agents, whereby Class A, Class C, and Administrator Class of the Fund are charged a fee at an annual rate of 0.25% of the average daily net assets of each respective class.
A portion of these total shareholder servicing fees were paid to affiliates of Wells Fargo.
5. INVESTMENT PORTFOLIO TRANSACTIONS
Purchases and sales of investments, excluding U.S. government obligations (if any) and short-term securities, for the six months ended December 31, 2016 were $16,072,628 and $14,405,041, respectively.
The Fund may purchase or sell investment securities to other Wells Fargo funds under procedures adopted by the Board of Trustees. The procedures have been designed to ensure that these interfund transactions, which generally do not incur broker commissions, are effected at current market prices. Interfund trades are included within the respective purchases and sales amounts shown.
6. BANK BORROWINGS
The Trust (excluding the money market funds and certain other funds) and Wells Fargo Variable Trust are parties to a $250,000,000 revolving credit agreement whereby the Fund is permitted to use bank borrowings for temporary or emergency purposes, such as to fund shareholder redemption requests. Interest under the credit agreement is charged to the Fund based on a borrowing rate equal to the higher of the Federal Funds rate in effect on that day plus 1.25% or the overnight LIBOR rate in effect on that day plus 1.25%. In addition, an annual commitment fee equal to 0.25% of the unused balance is allocated to each participating fund. Prior to August 30, 2016, the revolving credit agreement amount was $200,000,000 and the annual commitment fee was equal to 0.20% of the unused balance which was allocated to each participating fund.
For the six months ended December 31, 2016, there were no borrowings by the Fund under the agreement.
7. CONCENTRATION RISK
The Fund invests a substantial portion of its assets in issuers of municipal debt securities located in a single state or territories of the U.S. Therefore, it may be more affected by economic and political developments in that state or region than would be a comparable general tax-exempt fund.
8. INDEMNIFICATION
Under the Trust’s organizational documents, the officers and Trustees have been granted certain indemnification rights against certain liabilities that may arise out of performance of their duties to the Trust. Additionally, in the normal course of business, the Trust may enter into contracts with service providers that contain a variety of indemnification clauses. The Trust’s maximum exposure under these arrangements is dependent on future claims that may be made against the Fund and, therefore, cannot be estimated.
9. REGULATORY CHANGES
In October 2016, the Securities and Exchange Commission (“SEC”) adopted new rules and forms and amended existing rules and forms (together, “final rules”) intended to modernize and enhance the reporting and disclosure of information by registered investment companies and to enhance liquidity risk management by open-end mutual funds and exchange-traded funds. The final rules will enhance the quality of information available to investors and will allow the SEC to more effectively collect and use data reported by funds. In part, the final rules amend Regulation S-X and require standardized, enhanced disclosure about derivatives in the Fund’s financial statements, as well as other amendments. The compliance date for the amendments to Regulation S-X is August 1, 2017 while the compliance date for the new form types is June 1, 2018 and the compliance date for the liquidity risk management program requirements is December 1, 2018. Management is currently assessing the potential impact of these enhancements and their impact on the financial statement disclosures and reporting requirements.
| | | | |
| 22 | | Wells Fargo Colorado Tax-Free Fund | | Other information (unaudited) |
PROXY VOTING INFORMATION
A description of the policies and procedures that the Fund uses to determine how to vote proxies relating to portfolio securities is available, upon request, by calling 1-800-222-8222, visiting our website at wellsfargofunds.com, or visiting the SEC website at sec.gov. Information regarding how the Fund voted proxies relating to portfolio securities during the most recent 12-month period ended June 30 is available on the Fund’s website at wellsfargofunds.com or by visiting the SEC website at sec.gov.
PORTFOLIO HOLDINGS INFORMATION
The complete portfolio holdings for the Fund are publicly available monthly on the Fund’s website (wellsfargofunds.com), on a one-month delayed basis. In addition, top ten holdings information (excluding derivative positions) for the Fund is publicly available on the Fund’s website on a monthly, seven-day or more delayed basis. The Fund files its complete schedule of portfolio holdings with the SEC for the first and third quarters of each fiscal year on Form N-Q, which is available by visiting the SEC website at sec.gov. In addition, the Fund’s Form N-Q may be reviewed and copied at the SEC’s Public Reference Room in Washington, DC, and at regional offices in New York City, at 233 Broadway, and in Chicago, at 175 West Jackson Boulevard, Suite 900. Information about the Public Reference Room may be obtained by calling 1-800-SEC-0330.
| | | | | | |
| Other information (unaudited) | | Wells Fargo Colorado Tax-Free Fund | | | 23 | |
BOARD OF TRUSTEES AND OFFICERS
Each of the Trustees and Officers1 listed in the table below acts in identical capacities for each fund in the Wells Fargo family of funds, which consists of 139 mutual funds comprising the Wells Fargo Funds Trust, Wells Fargo Variable Trust, Wells Fargo Master Trust and four closed-end funds (collectively the “Fund Complex”). This table should be read in conjunction with the Prospectus and the Statement of Additional Information2. The mailing address of each Trustee and Officer is 525 Market Street, 12th Floor, San Francisco, CA 94105. Each Trustee and Officer serves an indefinite term, however, each Trustee serves such term until reaching the mandatory retirement age established by the Trustees.
Independent Trustees
| | | | | | |
Name and
year of birth | | Position held and
length of service* | | Principal occupations during past five years or longer | | Current other
public company or
investment company
directorships |
| William R. Ebsworth (Born 1957) | | Trustee, since 2015 | | Retired. From 1984 to 2013, equities analyst, portfolio manager, research director and chief financial officer at Fidelity Management and Research Company in Boston, Tokyo, and Hong Kong and retired in 2013 as Chief Investment Officer of Fidelity Strategic Advisers, Inc. where he lead a team of investment professionals managing client assets. Prior thereto, Board member of Hong Kong Securities Clearing Co., Hong Kong Options Clearing Corp., the Thailand International Fund, Ltd., Fidelity Investments Life Insurance Company, and Empire Fidelity Investments Life Insurance Company. Board member of the Fonté Foundation (non-profit organization) and the Vincent Memorial Hospital Endowment (non-profit organization), where he serves on the Investment Committee and as a Chair of the Audit Committee. Mr. Ebsworth is a CFA® charterholder and an Adjunct Lecturer, Finance, at Babson College. | | Asset Allocation Trust |
| Jane A. Freeman (Born 1953) | | Trustee, since 2015 | | Retired. From 2012 to 2014 and 1999 to 2008, Chief Financial Officer of Scientific Learning Corporation. From 2008 to 2012, Ms. Freeman provided consulting services related to strategic business projects. Prior to 1999, Portfolio Manager at Rockefeller & Co. and Scudder, Stevens & Clark. Board member of the Harding Loevner Funds from 1996 to 2014, serving as both Lead Independent Director and chair of the Audit Committee. Board member of the Russell Exchange Traded Funds Trust from 2011 to 2012 and the chair of the Audit Committee. Ms. Freeman is a Board Member of Ruth Bancroft Garden (non-profit organization) and an inactive chartered financial analyst. | | Asset Allocation Trust |
| Peter G. Gordon** (Born 1942) | | Trustee, since 1998; Chairman, since 2005 | | Co-Founder, Retired Chairman, President and CEO of Crystal Geyser Water Company. Trustee Emeritus, Colby College. | | Asset Allocation Trust |
Isaiah Harris, Jr.
(Born 1952) | | Trustee, since 2009 | | Retired. Chairman of the Board of CIGNA Corporation since 2009, and Director since 2005. From 2003 to 2011, Director of Deluxe Corporation. Prior thereto, President and CEO of BellSouth Advertising and Publishing Corp. from 2005 to 2007, President and CEO of BellSouth Enterprises from 2004 to 2005 and President of BellSouth Consumer Services from 2000 to 2003. Emeritus member of the Iowa State University Foundation Board of Governors. Emeritus Member of the Advisory Board of Iowa State University School of Business. Advisory Board Member, Palm Harbor Academy (charter school). Advisory Board Member, Child Evangelism Fellowship (non-profit). Mr. Harris is a certified public accountant (inactive status). | | CIGNA Corporation; Asset Allocation Trust |
| Judith M. Johnson (Born 1949) | | Trustee, since 2008; Audit Committee Chairman, since 2008 | | Retired. Prior thereto, Chief Executive Officer and Chief Investment Officer of Minneapolis Employees Retirement Fund from 1996 to 2008. Ms. Johnson is an attorney, certified public accountant and a certified managerial accountant. | | Asset Allocation Trust |
David F. Larcker
(Born 1950) | | Trustee, since 2009 | | James Irvin Miller Professor of Accounting at the Graduate School of Business, Stanford University, Director of the Corporate Governance Research Initiative and Senior Faculty of The Rock Center for Corporate Governance since 2006. From 2005 to 2008, Professor of Accounting at the Graduate School of Business, Stanford University. Prior thereto, Ernst & Young Professor of Accounting at The Wharton School, University of Pennsylvania from 1985 to 2005. | | Asset Allocation Trust |
| | | | |
| 24 | | Wells Fargo Colorado Tax-Free Fund | | Other information (unaudited) |
| | | | | | |
Name and
year of birth | | Position held and
length of service* | | Principal occupations during past five years or longer | | Current other
public company or
investment company
directorships |
| Olivia S. Mitchell (Born 1953) | | Trustee, since 2006 | | International Foundation of Employee Benefit Plans Professor, Wharton School of the University of Pennsylvania since 1993. Director of Wharton’s Pension Research Council and Boettner Center on Pensions & Retirement Research, and Research Associate at the National Bureau of Economic Research. Previously, Cornell University Professor from 1978 to 1993. | | Asset Allocation Trust |
| Timothy J. Penny (Born 1951) | | Trustee, since 1996 | | President and Chief Executive Officer of Southern Minnesota Initiative Foundation, a non-profit organization, since 2007 and Senior Fellow at the Humphrey Institute Policy Forum at the University of Minnesota since 1995. Member of the Board of Trustees of NorthStar Education Finance, Inc., a non-profit organization, since 2007. | | Asset Allocation Trust |
| Michael S. Scofield (Born 1943) | | Trustee, since 2010 | | Served on the Investment Company Institute’s Board of Governors and Executive Committee from 2008-2011 as well the Governing Council of the Independent Directors Council from 2006-2011 and the Independent Directors Council Executive Committee from 2008-2011. Chairman of the IDC from 2008-2010. Institutional Investor (Fund Directions) Trustee of Year in 2007. Trustee of the Evergreen Funds complex (and its predecessors) from 1984 to 2010. Chairman of the Evergreen Funds from 2000-2010. Former Trustee of the Mentor Funds. Retired Attorney, Law Offices of Michael S. Scofield. | | Asset Allocation Trust |
| * | Length of service dates reflect the Trustee’s commencement of service with the Trust’s predecessor entities, where applicable. |
| ** | Peter Gordon is expected to retire on December 31, 2017. |
Officers
| | | | | | |
Name and
year of birth | | Position held and
length of service | | Principal occupations during past five years or longer | | |
Andrew Owen3
(Born 1960) | | President, since 2017 | | Executive Vice President of Wells Fargo Bank, N.A. and President of Wells Fargo & Company and Head of Affiliated Managaers, Wells Fargo Asset Management, since 2014. Executive Vice President responsible for marketing, investments and product development for Wells Fargo Funds Management, LLC, from 2009 to 2014. | | |
Nancy Wiser1
(Born 1967) | | Treasurer, since 2012 | | Executive Vice President of Wells Fargo Funds Management, LLC since 2011. Chief Operating Officer and Chief Compliance Officer at LightBox Capital Management LLC, from 2008 to 2011. | | |
| C. David Messman (Born 1960) | | Secretary, since 2000; Chief Legal Officer,
since 2003 | | Senior Vice President and Secretary of Wells Fargo Funds Management, LLC since 2001. Assistant General Counsel of Wells Fargo Bank, N.A. since 2013 and Vice President and Managing Counsel of Wells Fargo Bank, N.A. from 1996 to 2013. | | |
| Michael Whitaker (Born 1967) | | Chief Compliance Officer, since 2016 | | Executive Vice President of Wells Fargo Funds Management, LLC since 2016. Chief Compliance Officer of Fidelity’s Fixed Income Funds and Asset Allocation Funds from 2008 to 2016, Compliance Officer of FMR Co., Inc. from 2014 to 2016, Fidelity Investments Money Management, Inc. from 2014 to 2016, Fidelity Investments from 2007 to 2016. | | |
David Berardi
(Born 1975) | | Assistant Treasurer,
since 2009 | | Vice President of Wells Fargo Funds Management, LLC since 2009. Vice President of Evergreen Investment Management Company, LLC from 2008 to 2010. Manager of Fund Reporting and Control for Evergreen Investment Management Company, LLC from 2004 to 2010. | | |
| Jeremy DePalma1 (Born 1974) | | Assistant Treasurer,
since 2009 | | Senior Vice President of Wells Fargo Funds Management, LLC since 2009. Senior Vice President of Evergreen Investment Management Company, LLC from 2008 to 2010 and head of the Fund Reporting and Control Team within Fund Administration from 2005 to 2010. | | |
| 1 | Nancy Wiser acts as Treasurer of 70 funds in the Fund Complex. Jeremy DePalma acts as Treasurer of 69 funds and Assistant Treasurer of 70 funds in the Fund Complex. |
| 2 | The Statement of Additional Information includes additional information about the Trustees and is available, without charge, upon request, by calling 1-800-222-8222 or by visiting the website at wellsfargofunds.com. |
| 3 | Andrew Owen became President on January 1, 2017. |
| | | | | | |
| List of abbreviations | | Wells Fargo Colorado Tax-Free Fund | | | 25 | |
The following is a list of common abbreviations for terms and entities that may have appeared in this report.
| ACA | — ACA Financial Guaranty Corporation |
| ADR | — American depositary receipt |
| ADS | — American depositary shares |
| AGC | — Assured Guaranty Corporation |
| AGM | — Assured Guaranty Municipal |
| Ambac | — Ambac Financial Group Incorporated |
| AMT | — Alternative minimum tax |
| BAN | — Bond anticipation notes |
| BHAC | — Berkshire Hathaway Assurance Corporation |
| CAB | — Capital appreciation bond |
| CCAB | — Convertible capital appreciation bond |
| CDA | — Community Development Authority |
| CDO | — Collateralized debt obligation |
| DRIVER | — Derivative inverse tax-exempt receipts |
| DW&P | — Department of Water & Power |
| DWR | — Department of Water Resources |
| ECFA | — Educational & Cultural Facilities Authority |
| EDA | — Economic Development Authority |
| EDFA | — Economic Development Finance Authority |
| ETF | — Exchange-traded fund |
| FDIC | — Federal Deposit Insurance Corporation |
| FFCB | — Federal Farm Credit Banks |
| FGIC | — Financial Guaranty Insurance Corporation |
| FHA | — Federal Housing Administration |
| FHLB | — Federal Home Loan Bank |
| FHLMC | — Federal Home Loan Mortgage Corporation |
| FICO | — The Financing Corporation |
| FNMA | — Federal National Mortgage Association |
| GDR | — Global depositary receipt |
| GNMA | — Government National Mortgage Association |
| HCFR | — Healthcare facilities revenue |
| HEFA | — Health & Educational Facilities Authority |
| HEFAR | — Higher education facilities authority revenue |
| HFA | — Housing Finance Authority |
| HFFA | — Health Facilities Financing Authority |
| HUD | — Department of Housing and Urban Development |
| IDA | — Industrial Development Authority |
| IDAG | — Industrial Development Agency |
| KRW | — Republic of Korea won |
| LIBOR | — London Interbank Offered Rate |
| LIFER | — Long Inverse Floating Exempt Receipts |
| LLC | — Limited liability company |
| LLLP | — Limited liability limited partnership |
| LLP | — Limited liability partnership |
| MBIA | — Municipal Bond Insurance Association |
| MFHR | — Multifamily housing revenue |
| MSTR | — Municipal securities trust receipts |
| MUD | — Municipal Utility District |
| National | — National Public Finance Guarantee Corporation |
| PCFA | — Pollution Control Financing Authority |
| PCL | — Public Company Limited |
| PCR | — Pollution control revenue |
| PFA | — Public Finance Authority |
| PFFA | — Public Facilities Financing Authority |
| PFOTER | — Puttable floating option tax-exempt receipts |
| plc | — Public limited company |
| PUTTER | — Puttable tax-exempt receipts |
| R&D | — Research & development |
| Radian | — Radian Asset Assurance |
| RAN | — Revenue anticipation notes |
| RDA | — Redevelopment Authority |
| RDFA | — Redevelopment Finance Authority |
| REIT | — Real estate investment trust |
| ROC | — Reset option certificates |
| SAVRS | — Select auction variable rate securities |
| SBA | — Small Business Authority |
| SDR | — Swedish depositary receipt |
| SFHR | — Single-family housing revenue |
| SFMR | — Single-family mortgage revenue |
| SPA | — Standby purchase agreement |
| SPDR | — Standard & Poor’s Depositary Receipts |
| SPEAR | — Short Puttable Exempt Adjustable Receipts |
| STRIPS | — Separate trading of registered interest and |
| TAN | — Tax anticipation notes |
| TIPS | — Treasury inflation-protected securities |
| TRAN | — Tax revenue anticipation notes |
| TTFA | — Transportation Trust Fund Authority |
| TVA | — Tennessee Valley Authority |
This page is intentionally left blank.
This page is intentionally left blank.
This page is intentionally left blank.

For more information
More information about Wells Fargo Funds is available free upon request. To obtain literature, please write, email, visit the Fund’s website, or call:
Wells Fargo Funds
P.O. Box 8266
Boston, MA 02266-8266
Email: fundservice@wellsfargo.com
Website: wellsfargofunds.com
Individual investors: 1-800-222-8222
Retail investment professionals: 1-888-877-9275
Institutional investment professionals: 1-866-765-0778
This report and the financial statements contained herein are submitted for the general information of the shareholders of the Fund. If this report is used for promotional purposes, distribution of the report must be accompanied or preceded by a current prospectus. Before investing, please consider the investment objectives, risks, charges, and expenses of the investment. For a current prospectus and, if available, a summary prospectus, containing this information, call 1-800-222-8222 or visit the Fund’s website at wellsfargofunds.com. Read the prospectus carefully before you invest or send money.
Wells Fargo Asset Management (WFAM) is a trade name used by the asset management businesses of Wells Fargo & Company. Wells Fargo Funds Management, LLC, a wholly owned subsidiary of Wells Fargo & Company, provides investment advisory and administrative services for Wells Fargo Funds. Other affiliates of Wells Fargo & Company provide subadvisory and other services for the funds. The funds are distributed by Wells Fargo Funds Distributor, LLC, Member FINRA, an affiliate of Wells Fargo & Company. Neither Wells Fargo Funds Management nor Wells Fargo Funds Distributor has Fund customer accounts/assets, and neither provides investment advice/recommendations or acts as an investment advice fiduciary to any investor.
NOT FDIC INSURED ◾ NO BANK GUARANTEE ◾ MAY LOSE VALUE
© 2016 Wells Fargo Funds Management, LLC. All rights reserved.
| | |
 | | 300478 02-17 SA250/SAR250 12-16 |
Semi-Annual Report
December 31, 2016

Wells Fargo High Yield Municipal Bond Fund


Reduce clutter. Save trees.
Sign up for electronic delivery of prospectuses and shareholder reports at wellsfargo.com/advantagedelivery
Contents
The views expressed and any forward-looking statements are as of December 31, 2016, unless otherwise noted, and are those of the Fund managers and/or Wells Fargo Funds Management, LLC. Discussions of individual securities, or the markets generally, or any Wells Fargo Fund are not intended as individual recommendations. Future events or results may vary significantly from those expressed in any forward-looking statements. The views expressed are subject to change at any time in response to changing circumstances in the market. Wells Fargo Funds Management, LLC and the Fund disclaim any obligation to publicly update or revise any views expressed or forward-looking statements.
NOT FDIC INSURED ◾ NO BANK GUARANTEE ◾ MAY LOSE VALUE
| | | | |
| 2 | | Wells Fargo High Yield Municipal Bond Fund | | Letter to shareholders (unaudited) |

Andrew Owen
President
Wells Fargo Funds
The Bloomberg Barclays Municipal Bond Index,1 a broad measure tracking investment-grade municipal bonds, lost 3.91% during the six-month reporting period.
Dear Shareholder:
As the new president of Wells Fargo Funds now that Karla Rabusch is retiring from that position after nearly 14 years, I am pleased to offer you this semi-annual report for the Wells Fargo High Yield Municipal Bond Fund for the six-month period that ended December 31, 2016. The Federal Reserve (Fed) raised the federal funds rate in December by 0.25%. Municipal bond yields rose sharply in the fourth quarter. The Bloomberg Barclays Municipal Bond Index,1 a broad measure tracking investment-grade municipal bonds, lost 3.91% during the six-month reporting period.
Municipal bond yields rose during the reporting period.
The municipal market reversed course in the second half of 2016, with yields increasing and prices declining. Initially the sell-off was driven by negative supply and demand trends, also known as technical factors. By the fourth quarter, fund flows turned negative (reversing a trend of 54 weeks of positive flows) and municipal bond supply increased. These deteriorating technical factors, along with the expectation of an expansionary fiscal policy and lower tax rates under the new administration, drove market volatility; credit spreads widened and the yield curve steepened as the market sold-off.
Stronger economic indicators drove monetary policy.
On December 14, the Fed hiked the short-term interest rate by 0.25% to reach a target range of 0.50% to 0.75%. This was the second rate increase in more than 10 years, with the Fed citing job gains and lower than expected unemployment of 4.6%. The Fed confirmed the continuation of an accommodative monetary policy to support a stronger labor market and reiterated its long-term objective of a 2% inflation rate, which increased slightly during the fourth quarter but fell short of the benchmark. The Fed expressed confidence in the economy’s progress and expects this positive trajectory to continue. Both sentiments helped to bolster the Fed’s expectation of three additional rate increases during 2017.
Meanwhile, the Bank of England continued its quantitative-easing program and lowered the official bank rate to 0.25% in August 2016. The Bank of Japan maintained its negative interest rate put in place earlier in the year, and in September announced an interest rate target for 10-year government bonds—keeping the yield at zero—as it struggles to accelerate economic growth. In December, the European Central Bank announced that it will extend its quantitative-easing program and continue purchasing large amounts of eurozone corporate and government debt each month through December 2017.
U.S. economic data released during the fourth quarter showed that U.S. real gross domestic product increased at an annual 3.5% rate in the third quarter, the largest increase since mid-2014. Business investment by U.S. companies was mixed, with a 12.0% increase in structures and 4.5% decrease in equipment over the prior quarter on an annualized basis. Consumer confidence hit pre-recession levels for the first time in November, and increased again in December. The dollar strengthened during the quarter’s post-election period.
Supply and demand trends reflected volatility of municipals.
Demand for municipal debt, as measured by cash flows to municipal bond mutual funds, was negative for the reporting period. There were $19 billion of inflows from July through October, but a sharp reversal occurred post-election, with $26 billion of redemptions in the last two months of the year. This followed a
| 1 | The Bloomberg Barclays Municipal Bond Index (formerly known as Barclays Municipal Bond Index) is an unmanaged index composed of long-term tax-exempt bonds with a minimum credit rating of Baa. You cannot invest directly in an index. |
| | | | | | |
| Letter to shareholders (unaudited) | | Wells Fargo High Yield Municipal Bond Fund | | | 3 | |
noteworthy 54 consecutive weeks of inflows. On the supply side, August through October saw 30-year record-breaking volumes each month; both refundings and new issuance were up. These levels were attributed to deals pulled forward in anticipation of higher interest rates. Not surprisingly, December volume was down 25% year-over-year to $19 billion. Total municipal bond issuance for the period was $219 billion; new issuance outpaced refundings by $18 billion.
Municipal credit fundamentals were solid.
Overall, municipal credit was sound for the period. The most significant development was the election of Ricardo Rossello as governor of the Commonwealth of Puerto Rico. In the past, prices of Puerto Rico bonds reflected negative credit considerations, including defaults on its securities in 2015 and early 2016, but recent events point to a potentially more positive fiscal environment. Rossello campaigned, in part, on a platform that included promises to ultimately pay 100% of interest due on Puerto Rico’s outstanding municipal debt, negotiate with bondholders, and ration government expenditures. This stance is a major shift from his predecessor who focused on a bankruptcy mechanism.
Since the end of the financial crisis, structural changes in the fixed-income markets have reduced trading liquidity (the degree to which assets can be bought or sold without affecting the price). New regulations and capital requirements have caused traditional liquidity suppliers (banks and broker/dealers) to be more risk averse and hold less inventory. Meanwhile, corporate debt issuance has spiked as companies finance themselves at record-low yields, bond mutual funds hold larger amounts of this new debt supply, trading volumes are lower, and large-size trades are more difficult to execute. However, fixed-income markets appeared to function well over the past year with sufficient liquidity.
Don’t let short-term uncertainty derail long-term investment goals.
Periods of uncertainty can present challenges, but experience has taught us that maintaining long-term investment goals can be an effective way to plan for the future. To help you create a sound strategy based on your personal goals and risk tolerance, Wells Fargo Funds offers more than 100 mutual funds spanning a wide range of asset classes and investment styles. Although diversification cannot guarantee an investment profit or prevent losses, we believe it can be an effective way to manage investment risk and potentially smooth out overall portfolio performance. We encourage investors to know their investments and to understand that appropriate levels of risk-taking may unlock opportunities.
Thank you for choosing to invest in Wells Fargo Funds. We appreciate your confidence in us and remain committed to helping you meet your financial needs.
Sincerely,

Andrew Owen
President
Wells Fargo Funds
Periods of uncertainty can present challenges, but experience has taught us that maintaining long-term investment goals can be an effective way to plan for the future.
For further information about your Fund, contact your investment professional, visit our website at wellsfargofunds.com, or call us directly at 1-800-222-8222. We are available 24 hours a day, 7 days a week.
| | | | |
| 4 | | Wells Fargo High Yield Municipal Bond Fund | | Performance highlights (unaudited) |
Investment objective
The Fund seeks current income exempt from federal income tax, and capital appreciation.
Manager
Wells Fargo Funds Management, LLC
Subadviser
Wells Capital Management Incorporated
Portfolio managers
Dennis Derby
Lyle J. Fitterer, CFA®, CPA
Terry J. Goode
Average annual total returns (%) as of December 31, 2016
| | | | | | | | | | | | | | | | | | | | | | | | | | |
| | | | | Including sales charge | | | Excluding sales charge | | | Expense ratios1 (%) | |
| | | Inception date | | 1 year | | | Since inception | | | 1 year | | | Since inception | | | Gross | | | Net2 | |
| Class A (WHYMX) | | 1-31-2013 | | | (4.89 | ) | | | 3.17 | | | | (0.39 | ) | | | 4.38 | | | | 1.08 | | | | 0.86 | |
| Class C (WHYCX) | | 1-31-2013 | | | (2.09 | ) | | | 3.61 | | | | (1.13 | ) | | | 3.61 | | | | 1.83 | | | | 1.61 | |
| Administrator Class (WHYDX) | | 1-31-2013 | | | – | | | | – | | | | (0.29 | ) | | | 4.49 | | | | 1.02 | | | | 0.76 | |
| Institutional Class (WHYIX) | | 1-31-2013 | | | – | | | | – | | | | (0.14 | ) | | | 4.64 | | | | 0.75 | | | | 0.61 | |
| Bloomberg Barclays Municipal Bond Index3 | | – | | | – | | | | – | | | | 0.25 | | | | 2.37 | | | | – | | | | – | |
| Bloomberg Barclays High Yield Municipal Bond Index4 | | – | | | – | | | | – | | | | 2.99 | | | | 2.83 | | | | – | | | | – | |
Figures quoted represent past performance, which is no guarantee of future results, and do not reflect taxes that a shareholder may pay on fund distributions or the redemption of fund shares. Investment return and principal value of an investment will fluctuate so that an investor’s shares, when redeemed, may be worth more or less than their original cost. Performance shown without sales charges would be lower if sales charges were reflected. Current performance may be lower or higher than the performance data quoted, which assumes the reinvestment of dividends and capital gains. Current month-end performance is available on the Fund’s website, wellsfargofunds.com.
Index returns do not include transaction costs associated with buying and selling securities, any mutual fund fees or expenses, or any taxes. It is not possible to invest directly in an index.
For Class A shares, the maximum front-end sales charge is 4.50%. For Class C shares, the maximum contingent deferred sales charge is 1.00%. Performance including a contingent deferred sales charge assumes the sales charge for the corresponding time period. Administrator Class and Institutional Class shares are sold without a front-end sales charge or contingent deferred sales charge.
Bond values fluctuate in response to the financial condition of individual issuers, general market and economic conditions, and changes in interest rates. Changes in market conditions and government policies may lead to periods of heightened volatility in the bond market and reduced liquidity for certain bonds held by the Fund. In general, when interest rates rise, bond values fall and investors may lose principal value. Interest-rate changes and their impact on the Fund and its share price can be sudden and unpredictable. High-yield securities have a greater risk of default and tend to be more volatile than higher-rated debt securities. The use of derivatives may reduce returns and/or increase volatility. Certain investment strategies tend to increase the total risk of an investment (relative to the broader market). The Fund is exposed to municipal securities risk. Consult the Fund’s prospectus for additional information on these and other risks. A portion of the Fund’s income may be subject to federal, state, and/or local income taxes or the Alternative Minimum Tax (AMT). Any capital gains distributions may be taxable.
Please see footnotes on page 5.
| | | | | | |
| Performance highlights (unaudited) | | Wells Fargo High Yield Municipal Bond Fund | | | 5 | |
|
| Effective maturity distribution as of December 31, 20165 |
|
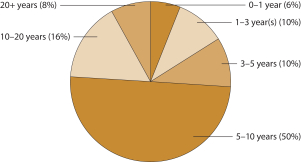
|
|
| Credit quality as of December 31, 20166 |
|
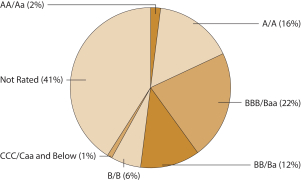
|
| 1 | Reflects the expense ratios as stated in the most recent prospectuses, which include the impact of 0.01% in acquired fund fees and expenses. The expense ratios shown are subject to change and may differ from the annualized expense ratios shown in the financial highlights of this report, which do not include acquired fund fees and expenses. |
| 2 | The manager has contractually committed through October 31, 2017, to waive fees and/or reimburse expenses to the extent necessary to cap the Fund’s Total Annual Fund Operating Expenses After Fee Waiver at 0.85% for Class A, 1.60% for Class C, 0.75% for Administrator Class, and 0.60% for Institutional Class. After this time, the cap may be increased or the commitment to maintain the cap may be terminated only with the approval of the Board of Trustees. Brokerage commissions, stamp duty fees, interest, taxes, acquired fund fees and expenses, and extraordinary expenses are excluded from the expense cap. Without this cap, the Fund’s returns would have been lower. |
| 3 | The Bloomberg Barclays Municipal Bond Index (formerly known as Barclays Municipal Bond Index) is an unmanaged index composed of long-term tax-exempt bonds with a minimum credit rating of Baa. You cannot invest directly in an index. |
| 4 | The Bloomberg Barclays High Yield Municipal Bond Index (formerly known as Barclays High Yield Municipal Bond Index) measures the non-investment-grade and nonrated U.S. dollar–denominated, fixed-rate, tax-exempt bond market within the 50 United States and four other qualifying regions (Washington, D.C.; Puerto Rico; Guam; and the Virgin Islands). The index allows state and local general obligation, revenue, insured, and prefunded bonds; however, historically the index has been composed of mostly revenue bonds. You cannot invest directly in an index. |
| 5 | Amounts are calculated based on the total investments of the Fund. These amounts are subject to change and may have changed since the date specified. |
| 6 | The credit quality distribution of portfolio holdings reflected in the chart is based on ratings from Standard & Poor’s, Moody’s Investors Service, and/or Fitch Ratings Ltd. Credit quality ratings apply to the underlying holdings of the Fund and not to the Fund itself. The percentages of the Fund’s portfolio with the ratings depicted in the chart are calculated based on the total market value of fixed income securities held by the Fund. If a security was rated by all three rating agencies, the middle rating was utilized. If rated by two of three rating agencies, the lower rating was utilized, and if rated by one of the rating agencies, that rating was utilized. Standard & Poor’s rates the creditworthiness of bonds, ranging from AAA (highest) to D (lowest). Ratings from A to CCC may be modified by the addition of a plus (+) or minus (-) sign to show relative standing within the rating categories. Standard & Poor’s rates the creditworthiness of short-term notes from SP-1 (highest) to SP-3 (lowest). Moody’s rates the creditworthiness of bonds, ranging from Aaa (highest) to C (lowest). Ratings Aa to B may be modified by the addition of a number 1 (highest) to 3 (lowest) to show relative standing within the ratings categories. Moody’s rates the creditworthiness of short-term U.S. tax-exempt municipal securities from MIG 1/VMIG 1 (highest) to SG (lowest). Fitch rates the creditworthiness of bonds, ranging from AAA (highest) to D (lowest). Credit quality distribution is subject to change and may have changed since the date specified. |
| | | | |
| 6 | | Wells Fargo High Yield Municipal Bond Fund | | Fund expenses (unaudited) |
As a shareholder of the Fund, you incur two types of costs: (1) transaction costs, including sales charges (loads) on purchase payments and contingent deferred sales charges (if any) on redemptions and (2) ongoing costs, including management fees, distribution (12b-1) and/or shareholder servicing fees, and other Fund expenses. This example is intended to help you understand your ongoing costs (in dollars) of investing in the Fund and to compare these costs with the ongoing costs of investing in other mutual funds.
The example is based on an investment of $1,000 invested at the beginning of the six-month period and held for the entire period from July 1, 2016 to December 31, 2016.
Actual expenses
The “Actual” line of the table below provides information about actual account values and actual expenses. You may use the information in this line, together with the amount you invested, to estimate the expenses that you paid over the period. Simply divide your account value by $1,000 (for example, an $8,600 account value divided by $1,000 = 8.6), then multiply the result by the number in the “Actual” line under the heading entitled “Expenses paid during period” for your applicable class of shares to estimate the expenses you paid on your account during this period.
Hypothetical example for comparison purposes
The “Hypothetical” line of the table below provides information about hypothetical account values and hypothetical expenses based on the Fund’s actual expense ratio and an assumed rate of return of 5% per year before expenses, which is not the Fund’s actual return. The hypothetical account values and expenses may not be used to estimate the actual ending account balance or expenses you paid for the period. You may use this information to compare the ongoing costs of investing in the Fund and other funds. To do so, compare this 5% hypothetical example with the 5% hypothetical
examples that appear in the shareholder reports of the other funds.
Please note that the expenses shown in the table are meant to highlight your ongoing costs only and do not reflect any transactional costs, such as sales charges (loads) and contingent deferred sales charges. Therefore, the “Hypothetical” line of the table is useful in comparing ongoing costs only and will not help you determine the relative total costs of owning different funds. In addition, if these transactional costs were included, your costs would have been higher.
| | | | | | | | | | | | | | | | |
| | | Beginning
account value
7-1-2016 | | | Ending
account value
12-31-2016 | | | Expenses
paid during
the period¹ | | | Annualized net
expense ratio | |
Class A | | | | | | | | | | | | | | | | |
Actual | | $ | 1,000.00 | | | $ | 949.44 | | | $ | 4.17 | | | | 0.85 | % |
Hypothetical (5% return before expenses) | | $ | 1,000.00 | | | $ | 1,020.86 | | | $ | 4.32 | | | | 0.85 | % |
Class C | | | | | | | | | | | | | | | | |
Actual | | $ | 1,000.00 | | | $ | 945.83 | | | $ | 7.83 | | | | 1.60 | % |
Hypothetical (5% return before expenses) | | $ | 1,000.00 | | | $ | 1,017.09 | | | $ | 8.11 | | | | 1.60 | % |
Administrator Class | | | | | | | | | | | | | | | | |
Actual | | $ | 1,000.00 | | | $ | 949.04 | | | $ | 3.67 | | | | 0.75 | % |
Hypothetical (5% return before expenses) | | $ | 1,000.00 | | | $ | 1,021.37 | | | $ | 3.81 | | | | 0.75 | % |
Institutional Class | | | | | | | | | | | | | | | | |
Actual | | $ | 1,000.00 | | | $ | 950.63 | | | $ | 2.94 | | | | 0.60 | % |
Hypothetical (5% return before expenses) | | $ | 1,000.00 | | | $ | 1,022.12 | | | $ | 3.05 | | | | 0.60 | % |
| 1 | Expenses paid is equal to the annualized net expense ratio of each class multiplied by the average account value over the period, multiplied by the number of days in the most recent fiscal half-year divided by the number of days in the fiscal year (to reflect the one-half-year period). |
| | | | | | |
| Portfolio of investments—December 31, 2016 (unaudited) | | Wells Fargo High Yield Municipal Bond Fund | | | 7 | |
| | | | | | | | | | | | | | | | |
| Security name | | Interest rate | | | Maturity date | | | Principal | | | Value | |
| | | | |
Municipal Obligations: 98.53% | | | | | | | | | | | | | | | | |
| | | | |
| Alabama: 1.21% | | | | | | | | | | | | | | | | |
Alabama State University General Tuition and Fee (Education Revenue, Syncora Guarantee Incorporated Insured) | | | 5.25 | % | | | 8-1-2032 | | | $ | 1,000,000 | | | $ | 952,890 | |
Jefferson County AL Warrants CAB Senior Lien Series B (Water & Sewer Revenue, AGM Insured) ¤ | | | 0.00 | | | | 10-1-2027 | | | | 920,000 | | | | 584,191 | |
| | | | |
| | | | | | | | | | | | | | | 1,537,081 | |
| | | | | | | | | | | | | | | | |
| | | |
| Arizona: 2.37% | | | | | | | | | | | | | |
Florence AZ IDA Legacy Traditional School Project Queen Creek & Casa Grande Campuses (Education Revenue) | | | 5.00 | | | | 7-1-2023 | | | | 250,000 | | | | 259,405 | |
Maricopa County AZ IDA Senior Living Facility Series 2016 (Health Revenue) 144A | | | 6.00 | | | | 1-1-2048 | | | | 1,000,000 | | | | 914,750 | |
Phoenix AZ IDA Great Hearts Academies Project (Education Revenue) | | | 5.20 | | | | 7-1-2022 | | | | 160,000 | | | | 166,688 | |
Phoenix AZ IDA Legacy Traditional Schools Project Series A (Education Revenue) 144A | | | 6.50 | | | | 7-1-2034 | | | | 500,000 | | | | 556,685 | |
Pima County AZ IDA New Plan Learning Project Series A (Education Revenue) | | | 8.13 | | | | 7-1-2041 | | | | 500,000 | | | | 505,505 | |
Pima County AZ IDA Refunding Bond Desert Heights Charter School Facility (Education Revenue) | | | 6.00 | | | | 5-1-2024 | | | | 580,000 | | | | 613,385 | |
| | | | |
| | | | | | | | | | | | | | | 3,016,418 | |
| | | | | | | | | | | | | | | | |
| | | |
| California: 6.22% | | | | | | | | | | | | | |
Anaheim CA PFA Convention Center Expansion Project Series A (Miscellaneous Revenue) | | | 5.00 | | | | 5-1-2046 | | | | 500,000 | | | | 547,115 | |
California CDA Baptist University Series B (Education Revenue) 144A | | | 5.75 | | | | 11-1-2017 | | | | 100,000 | | | | 101,427 | |
California Municipal Finance Authority Charter School Albert Einstein Academies Project Series A (Miscellaneous Revenue) | | | 7.13 | | | | 8-1-2043 | | | | 250,000 | | | | 274,200 | |
California School Finance Authority View Park Elementary & Middle Schools Series A (Education Revenue) | | | 5.88 | | | | 10-1-2044 | | | | 1,000,000 | | | | 1,042,850 | |
California Statewide CDA Loma Linda University Medical Center Refunding Bond Series A (Health Revenue) | | | 5.25 | | | | 12-1-2044 | | | | 1,000,000 | | | | 1,026,000 | |
California Statewide CDA Senior Living Health Facilities Los Angeles Jewish Home for the Aging Series D (Health Revenue) | | | 4.75 | | | | 8-1-2020 | | | | 1,000,000 | | | | 1,000,330 | |
California Student Education Loan Marketing Corporation Series IV-D1 (Education Revenue) | | | 5.88 | | | | 1-1-2018 | | | | 500,000 | | | | 498,010 | |
Compton CA Community College RDA Project 2nd Lien Series A (Tax Revenue) | | | 4.75 | | | | 8-1-2019 | | | | 225,000 | | | | 234,959 | |
Compton CA Community College RDA Project 2nd Lien Series A (Tax Revenue) | | | 5.00 | | | | 8-1-2020 | | | | 100,000 | | | | 106,037 | |
Compton CA PFA Refunding Bond (Miscellaneous Revenue) 144A | | | 4.50 | | | | 9-1-2032 | | | | 2,585,000 | | | | 2,509,260 | |
San Francisco City & County CA CAB Redevelopment Agency Successor Agency Mission Bay South Redevelopment Project Sub-Series D (Tax Revenue) 144A¤(i) | | | 0.00 | | | | 8-1-2026 | | | | 1,000,000 | | | | 570,840 | |
| | | | |
| | | | | | | | | | | | | | | 7,911,028 | |
| | | | | | | | | | | | | | | | |
| | | |
| Colorado: 6.75% | | | | | | | | | | | | | |
Arapahoe County CO Copperleaf Metropolitan District #2 (GO Revenue) | | | 5.75 | | | | 12-1-2045 | | | | 500,000 | | | | 508,930 | |
Arvada CO Jefferson Center Metropolitan District #10 (Tax Revenue) | | | 4.75 | | | | 12-1-2026 | | | | 1,280,000 | | | | 1,257,523 | |
Arvada CO Leyden Rock Metropolitan District #10 (GO Revenue) | | | 5.00 | | | | 12-1-2045 | | | | 600,000 | | | | 554,424 | |
Broomfield CO Great Western Park Metropolitan District #2 (GO Revenue) | | | 5.00 | | | | 12-1-2046 | | | | 1,000,000 | | | | 928,910 | |
Centennial CO Southglenn Metropolitan District (GO Revenue) | | | 3.00 | | | | 12-1-2021 | | | | 960,000 | | | | 918,816 | |
Centennial CO Southglenn Metropolitan District (GO Revenue) | | | 5.00 | | | | 12-1-2030 | | | | 785,000 | | | | 796,092 | |
Colorado High Performance Transportation Enterprise U.S. 36 and I-25 Managed Lanes (Transportation Revenue) | | | 5.75 | | | | 1-1-2044 | | | | 500,000 | | | | 527,505 | |
Eaton CO Area Park & Recreation District (GO Revenue) | | | 5.00 | | | | 12-1-2023 | | | | 810,000 | | | | 836,933 | |
Eaton CO Area Park & Recreation District (GO Revenue) | | | 5.50 | | | | 12-1-2030 | | | | 475,000 | | | | 495,515 | |
The accompanying notes are an integral part of these financial statements.
| | | | |
| 8 | | Wells Fargo High Yield Municipal Bond Fund | | Portfolio of investments—December 31, 2016 (unaudited) |
| | | | | | | | | | | | | | | | |
| Security name | | Interest rate | | | Maturity date | | | Principal | | | Value | |
| | | | |
| Colorado (continued) | | | | | | | | | | | | | | | | |
Fountain CO Urban Renewal Authority South Academy Highlands Project
Series 2015-A (Tax Revenue) | | | 4.50 | % | | | 11-1-2029 | | | $ | 1,725,000 | | | $ | 1,760,604 | |
| | | | |
| | | | | | | | | | | | | | | 8,585,252 | |
| | | | | | | | | | | | | | | | |
| | | | |
| Delaware: 0.78% | | | | | | | | | | | | | | | | |
Delaware EDA Odyssey Charter School Incorporated Project Series A (Education Revenue) 144A | | | 7.00 | | | | 9-1-2045 | | | | 1,000,000 | | | | 997,410 | |
| | | | | | | | | | | | | | | | |
| | | | |
| District of Columbia: 0.35% | | | | | | | | | | | | | | | | |
District of Columbia Tobacco Settlement Financing Corporation (Tobacco Revenue) | | | 6.75 | | | | 5-15-2040 | | | | 435,000 | | | | 449,472 | |
| | | | | | | | | | | | | | | | |
| | | | |
| Florida: 1.90% | | | | | | | | | | | | | | | | |
Florida Development Finance Corporation Educational Facilities Renaissance Charter School Project Series A (Education Revenue) | | | 8.50 | | | | 6-15-2044 | | | | 250,000 | | | | 286,210 | |
Holmes County FL Hospital Corporation Doctors Memorial Hospital Project (Health Revenue) | | | 6.00 | | | | 11-1-2038 | | | | 250,000 | | | | 247,575 | |
Miami-Dade County FL IDA Youth Co-Op Charter Schools Project Series A (Education Revenue) 144A | | | 6.00 | | | | 9-15-2045 | | | | 1,000,000 | | | | 991,770 | |
Trout Creek Florida Community Development District (Miscellaneous Revenue) | | | 4.88 | | | | 5-1-2025 | | | | 920,000 | | | | 892,961 | |
| | | | |
| | | | | | | | | | | | | | | 2,418,516 | |
| | | | | | | | | | | | | | | | |
| | | | |
| Georgia: 1.15% | | | | | | | | | | | | | | | | |
Cobb County GA Development Authority Student Housing Refunding Bond Kennesaw State University Foundation Project Series C (Housing Revenue) | | | 5.00 | | | | 7-15-2028 | | | | 800,000 | | | | 863,896 | |
Georgia Road & Tollway Authority CCAB I-75 South Expressway Lanes Project Series B (Transportation Revenue) 144A± | | | 0.00 | | | | 6-1-2049 | | | | 1,000,000 | | | | 605,680 | |
| | | | |
| | | | | | | | | | | | | | | 1,469,576 | |
| | | | | | | | | | | | | | | | |
| | | | |
| Guam: 0.23% | | | | | | | | | | | | | | | | |
Guam International Airport Authority Series C (Airport Revenue) | | | 6.38 | | | | 10-1-2043 | | | | 260,000 | | | | 297,861 | |
| | | | | | | | | | | | | | | | |
| | | | |
| Idaho: 0.49% | | | | | | | | | | | | | | | | |
Idaho Housing & Finance Association Idaho Arts Charter School Incorporated Project Series A (Education Revenue) | | | 6.50 | | | | 12-1-2038 | | | | 335,000 | | | | 367,405 | |
Idaho Housing & Finance Association Legacy Public Charter School Incorporated Project Series A (Education Revenue) | | | 6.25 | | | | 5-1-2043 | | | | 250,000 | | | | 260,165 | |
| | | | |
| | | | | | | | | | | | | | | 627,570 | |
| | | | | | | | | | | | | | | | |
| | | | |
| Illinois: 16.92% | | | | | | | | | | | | | | | | |
Chicago IL Board of Education CAB School Reform Series A (GO Revenue, National Insured) ¤ | | | 0.00 | | | | 12-1-2023 | | | | 500,000 | | | | 368,730 | |
Chicago IL Board of Education CAB School Reform Series A (GO Revenue, National Insured) ¤ | | | 0.00 | | | | 12-1-2024 | | | | 1,000,000 | | | | 699,080 | |
Chicago IL Board of Education CAB School Reform Series A (GO Revenue, National Insured) ¤ | | | 0.00 | | | | 12-1-2025 | | | | 500,000 | | | | 330,330 | |
Chicago IL Board of Education CAB School Reform Series B-1 (GO Revenue, National Insured) ¤ | | | 0.00 | | | | 12-1-2028 | | | | 1,000,000 | | | | 552,500 | |
Chicago IL Board of Education Series A (GO Revenue, National Insured) | | | 5.00 | | | | 12-1-2021 | | | | 250,000 | | | | 253,123 | |
Chicago IL Midway Airport Refunding Bond Second Lien Series A (Airport Revenue) | | | 5.00 | | | | 1-1-2031 | | | | 1,000,000 | | | | 1,073,810 | |
Chicago IL O’Hare International Airport Revenue Bond Series B (Airport Revenue) | | | 6.00 | | | | 1-1-2041 | | | | 150,000 | | | | 170,676 | |
The accompanying notes are an integral part of these financial statements.
| | | | | | |
| Portfolio of investments—December 31, 2016 (unaudited) | | Wells Fargo High Yield Municipal Bond Fund | | | 9 | |
| | | | | | | | | | | | | | | | |
| Security name | | Interest rate | | | Maturity date | | | Principal | | | Value | |
| | | | |
| Illinois (continued) | | | | | | | | | | | | | | | | |
Chicago IL Sales Tax (Tax Revenue) | | | 5.00 | % | | | 1-1-2032 | | | $ | 1,500,000 | | | $ | 1,567,365 | |
Chicago IL Sales Tax Series A (Tax Revenue) | | | 5.00 | | | | 1-1-2041 | | | | 1,000,000 | | | | 1,015,020 | |
Chicago IL Series A (GO Revenue) | | | 5.00 | | | | 1-1-2033 | | | | 310,000 | | | | 287,723 | |
Chicago IL Series A (GO Revenue) | | | 5.25 | | | | 1-1-2023 | | | | 500,000 | | | | 496,475 | |
Chicago IL Series B (GO Revenue) | | | 5.50 | | | | 1-1-2032 | | | | 700,000 | | | | 671,503 | |
Chicago IL Transit Authority Sales Tax Receipts Bonds (Tax Revenue, AGM Insured) | | | 5.00 | | | | 12-1-2044 | | | | 1,000,000 | | | | 1,065,880 | |
Cook County IL School District #144 Prairie Hills CAB Refunding Bond Series C (GO Revenue, AGM Insured) ¤ | | | 0.00 | | | | 12-1-2025 | | | | 730,000 | | | | 492,772 | |
Cook County IL School District #148 Dolton Series E (GO Revenue, AGM Insured) | | | 4.75 | | | | 12-1-2025 | | | | 450,000 | | | | 467,978 | |
Illinois (GO Revenue) | | | 5.00 | | | | 3-1-2033 | | | | 2,000,000 | | | | 1,980,180 | |
Illinois (Miscellaneous Revenue, Build America Mutual Assurance Company Insured) | | | 5.50 | | | | 7-1-2025 | | | | 525,000 | | | | 573,479 | |
Illinois (Miscellaneous Revenue) | | | 5.50 | | | | 7-1-2025 | | | | 250,000 | | | | 262,383 | |
Illinois Finance Authority Charter School Aid Intrinsic Schools Belmont School Project Series A (Education Revenue) 144A | | | 5.25 | | | | 12-1-2025 | | | | 800,000 | | | | 783,256 | |
Illinois Finance Authority Charter School Refunding Bond Series A (Education Revenue) | | | 6.88 | | | | 10-1-2031 | | | | 700,000 | | | | 761,313 | |
Illinois Finance Authority Educational Facility Senior Rogers Park Montessori School (Miscellaneous Revenue) | | | 6.00 | | | | 2-1-2034 | | | | 680,000 | | | | 702,508 | |
Illinois Finance Authority Presence Health Network Series C (Health Revenue) | | | 5.00 | | | | 2-15-2028 | | | | 1,150,000 | | | | 1,228,499 | |
Illinois Series A (GO Revenue, AGM Insured) | | | 5.00 | | | | 4-1-2024 | | | | 500,000 | | | | 534,380 | |
Illinois Sports Facilities Authority State Tax Supported CAB (Tax Revenue, Ambac Insured) ¤ | | | 0.00 | | | | 6-15-2025 | | | | 1,000,000 | | | | 700,520 | |
Lake County IL Community Unit School District #187 North Chicago Series A (GO Revenue, AGM Insured) ¤ | | | 0.00 | | | | 1-1-2023 | | | | 590,000 | | | | 443,031 | |
Metropolitan Pier & Exposition Authority IIlinois CAB McCormick Place Expansion Project Series A (Tax Revenue, National Insured) ¤ | | | 0.00 | | | | 12-15-2034 | | | | 2,200,000 | | | | 935,308 | |
Metropolitan Pier & Exposition Authority Illinois CAB McCormick Place Expansion Project Series A (Tax Revenue, National Insured) ¤ | | | 0.00 | | | | 6-15-2033 | | | | 2,000,000 | | | | 923,600 | |
Sangamon County IL School District #186 Certificate of Participation Hay-Edwards Elementary School Project Series A (Miscellaneous Revenue, ACA Insured) | | | 5.88 | | | | 8-15-2018 | | | | 85,000 | | | | 84,147 | |
Will County IL Lincoln-Way Community High School District #210 CAB Series B (GO Revenue) ¤ | | | 0.00 | | | | 1-1-2033 | | | | 1,000,000 | | | | 391,910 | |
Will County IL Lincoln-Way Community High School District #210 Series A (GO Revenue) | | | 5.00 | | | | 1-1-2030 | | | | 1,000,000 | | | | 959,370 | |
Will County IL Lincoln-Way Communty High School District #210 (GO Revenue) | | | 4.00 | | | | 1-1-2022 | | | | 525,000 | | | | 497,138 | |
Will County IL Lincoln-Way Communty High School District #210 CAB Series B (GO Revenue) ¤ | | | 0.00 | | | | 1-1-2027 | | | | 445,000 | | | | 257,112 | |
| | | | |
| | | | | | | | | | | | | | | 21,531,099 | |
| | | | | | | | | | | | | | | | |
| | | |
| Indiana: 3.85% | | | | | | | | | | | | | |
Brookhaven County IN EDA Line Senior Apartments Project Series A (Housing Revenue) | | | 6.25 | | | | 7-1-2043 | | | | 1,585,000 | | | | 1,651,887 | |
Indiana Business Finance Authority Refunding Bond Marquette Project Series A (Health Revenue) | | | 5.00 | | | | 3-1-2030 | | | | 1,100,000 | | | | 1,176,747 | |
Indiana Finance Authority AMT-I-69 Development Partners LLC (Miscellaneous Revenue) | | | 5.25 | | | | 9-1-2034 | | | | 250,000 | | | | 249,440 | |
Indiana Finance Authority AMT-I-69 Development Partners LLC (Miscellaneous Revenue) | | | 5.25 | | | | 9-1-2040 | | | | 1,000,000 | | | | 1,024,965 | |
Indiana Finance Authority AMT-I-69 Development Partners LLC (Miscellaneous Revenue) | | | 4.00 | | | | 3-1-2017 | | | | 800,000 | | | | 800,760 | |
| | | | |
| | | | | | | | | | | | | | | 4,903,799 | |
| | | | | | | | | | | | | | | | |
| | | |
| Iowa: 1.40% | | | | | | | | | | | | | |
Xenia Dallas County IA Rural Water District Capital Loan Notes (Water & Sewer Revenue) | | | 5.00 | | | | 12-1-2031 | | | | 1,600,000 | | | | 1,782,592 | |
| | | | | | | | | | | | | | | | |
The accompanying notes are an integral part of these financial statements.
| | | | |
| 10 | | Wells Fargo High Yield Municipal Bond Fund | | Portfolio of investments—December 31, 2016 (unaudited) |
| | | | | | | | | | | | | | | | |
| Security name | | Interest rate | | | Maturity date | | | Principal | | | Value | |
| | | |
| Kansas: 1.83% | | | | | | | | | | | | | |
Wyandotte County & Kansas City KS Special Obligation Vacation Village Project Area 4 – Major Multi-Sport Athletic Complex Project CAB Series 2015 (Tax Revenue) 144A¤ | | | 0.00 | % | | | 9-1-2034 | | | $ | 4,400,000 | | | $ | 1,387,364 | |
Wyandotte County & Kansas City KS Special Obligation Refunding and Improvement Bonds Plaza Redevelopment Project (Tax Revenue) | | | 4.00 | | | | 12-1-2028 | | | | 1,000,000 | | | | 942,230 | |
| | | | |
| | | | | | | | | | | | | | | 2,329,594 | |
| | | | | | | | | | | | | | | | |
| | | |
| Kentucky: 2.17% | | | | | | | | | | | | | |
Kentucky EDFA Refunding Bond Rosedale Green Project (Health Revenue) | | | 5.50 | | | | 11-15-2035 | | | | 1,000,000 | | | | 1,000,630 | |
Kentucky EDFA Senior Revenue Bonds Next Generation Kentucky Information Highway Project Series A (Miscellaneous Revenue) | | | 5.00 | | | | 7-1-2037 | | | | 700,000 | | | | 730,163 | |
Kentucky EDFA Senior Revenue Bonds Next Generation Kentucky Information Highway Project Series A (Miscellaneous Revenue) | | | 5.00 | | | | 1-1-2045 | | | | 1,000,000 | | | | 1,036,600 | |
| | | | |
| | | | | | | | | | | | | | | 2,767,393 | |
| | | | | | | | | | | | | | | | |
| | | |
| Maryland: 0.79% | | | | | | | | | | | | | |
Prince George’s County MD Chesapeake Lighthouse Charter School Project Series 2016-A (Education Revenue) 144A | | | 6.90 | | | | 8-1-2041 | | | | 1,000,000 | | | | 1,007,750 | |
| | | | | | | | | | | | | | | | |
| | | |
| Michigan: 7.76% | | | | | | | | | | | | | |
Charyl Stockwell Academy Michigan Public School Refunding Bond (Miscellaneous Revenue) | | | 4.88 | | | | 10-1-2023 | | | | 445,000 | | | | 441,938 | |
Detroit MI Downtown Development Authority CAB (Tax Revenue) ¤ | | | 0.00 | | | | 7-1-2020 | | | | 285,000 | | | | 237,294 | |
Detroit MI Downtown Development Authority CAB (Tax Revenue) ¤ | | | 0.00 | | | | 7-1-2021 | | | | 170,000 | | | | 135,354 | |
Detroit MI Downtown Development Authority CAB (Tax Revenue) ¤ | | | 0.00 | | | | 7-1-2024 | | | | 20,000 | | | | 13,331 | |
Detroit MI Downtown Development Authority CAB (Tax Revenue) ¤ | | | 0.00 | | | | 7-1-2025 | | | | 580,000 | | | | 347,942 | |
Detroit MI Wayne County Stadium Authority (Miscellaneous Revenue) | | | 5.00 | | | | 10-1-2018 | | | | 1,000,000 | | | | 985,780 | |
Michigan Finance Authority Limited Obligation Public School Academy Cesar Chavez Academy Project (Education Revenue) | | | 5.00 | | | | 2-1-2022 | | | | 250,000 | | | | 253,398 | |
Michigan Finance Authority Refunding Bond Local Government Loan Program City of Detroit Financial Recovery Series F (Tax Revenue) | | | 4.50 | | | | 10-1-2029 | | | | 1,000,000 | | | | 1,021,740 | |
Michigan Finance Authority Refunding Bond Local Government Loan Program Detroit Series D-4 (Water & Sewer Revenue) | | | 5.00 | | | | 7-1-2031 | | | | 1,015,000 | | | | 1,122,458 | |
Michigan Finance Authority Refunding Bond Local Government Loan Program Detroit Series D-6 (Water & Sewer Revenue, National Insured) | | | 5.00 | | | | 7-1-2036 | | | | 1,000,000 | | | | 1,092,020 | |
Michigan Finance Authority Refunding Bond Local Government Loan Program Public Lighting Authority Series B (Tax Revenue) | | | 5.00 | | | | 7-1-2044 | | | | 1,000,000 | | | | 1,062,930 | |
Michigan Municipal Bond Authority Local Government Loan Program CAB Series G (Miscellaneous Revenue, Ambac Insured) ¤ | | | 0.00 | | | | 5-1-2017 | | | | 300,000 | | | | 297,435 | |
Michigan Municipal Bond Authority Local Government Loan Program Series C (Miscellaneous Revenue, Ambac Insured) | | | 4.75 | | | | 5-1-2027 | | | | 950,000 | | | | 952,005 | |
Michigan Public Educational Facilities Authority Chandler Park Academy (Miscellaneous Revenue) | | | 6.35 | | | | 11-1-2028 | | | | 225,000 | | | | 225,322 | |
Michigan Public Educational Facilities Authority Limited Obligation Bradford Academy Project (Education Revenue) 144A | | | 6.50 | | | | 9-1-2037 | | | | 200,000 | | | | 159,972 | |
Michigan Public Educational Facilities Authority Limited Obligation Crescent Academy (Education Revenue) | | | 7.00 | | | | 10-1-2036 | | | | 312,500 | | | | 322,619 | |
Oakland County MI Economic Development Corporation The Academy of The Sacred Heart Project Series A (Education Revenue) | | | 6.50 | | | | 12-15-2036 | | | | 250,000 | | | | 235,125 | |
Wayne County MI Building Improvement Series A (GO Revenue) | | | 6.75 | | | | 11-1-2039 | | | | 940,000 | | | | 971,518 | |
| | | | |
| | | | | | | | | | | | | | | 9,878,181 | |
| | | | | | | | | | | | | | | | |
The accompanying notes are an integral part of these financial statements.
| | | | | | |
| Portfolio of investments—December 31, 2016 (unaudited) | | Wells Fargo High Yield Municipal Bond Fund | | | 11 | |
| | | | | | | | | | | | | | | | |
| Security name | | Interest rate | | | Maturity date | | | Principal | | | Value | |
| | | |
| Minnesota: 1.01% | | | | | | | | | | | | | |
Deephaven MN Charter School Eagle Ridge Academy Project Series A (Education Revenue) | | | 4.40 | % | | | 7-1-2025 | | | $ | 160,000 | | | $ | 161,606 | |
Deephaven MN Charter School Eagle Ridge Academy Project Series A (Education Revenue) | | | 5.00 | | | | 7-1-2030 | | | | 195,000 | | | | 199,335 | |
Deephaven MN Charter School Eagle Ridge Academy Project Series A (Education Revenue) | | | 5.25 | | | | 7-1-2037 | | | | 190,000 | | | | 193,521 | |
Minneapolis MN Student Housing Refunding Bond Riverton Community Housing Project (Housing Revenue) | | | 4.70 | | | | 8-1-2026 | | | | 335,000 | | | | 333,147 | |
Minneapolis MN Student Housing Refunding Bond Riverton Community Housing Project (Housing Revenue) | | | 4.80 | | | | 8-1-2027 | | | | 400,000 | | | | 396,320 | |
| | | | |
| | | | | | | | | | | | | | | 1,283,929 | |
| | | | | | | | | | | | | | | | |
| | | |
| Missouri: 0.68% | | | | | | | | | | | | | |
Blue Springs MO Special Obligation Tax Refunding & Improvement Bonds Adams Farm Project Series A (Tax Revenue) | | | 4.00 | | | | 6-1-2026 | | | | 870,000 | | | | 859,151 | |
| | | | | | | | | | | | | | | | |
| | | |
| New Jersey: 3.99% | | | | | | | | | | | | | |
Essex County NJ Improvement Authority Lease Newark Project Series A (Miscellaneous Revenue) | | | 6.25 | | | | 11-1-2030 | | | | 200,000 | | | | 207,926 | |
New Jersey EDA Continental Airlines Incorporated Project (Industrial Development Revenue) | | | 5.25 | | | | 9-15-2029 | | | | 250,000 | | | | 263,220 | |
New Jersey EDA School Facilities Construction Project Series NN (Miscellaneous Revenue, National Insured) | | | 5.00 | | | | 3-1-2030 | | | | 1,000,000 | | | | 1,012,020 | |
New Jersey TTFA CAB Series A (Transportation Revenue) ¤ | | | 0.00 | | | | 12-15-2031 | | | | 1,000,000 | | | | 477,030 | |
New Jersey TTFA Series C (Transportation Revenue) | | | 5.25 | | | | 6-15-2032 | | | | 2,000,000 | | | | 2,057,580 | |
Newark NJ Qualified General Improvement Series A (GO Revenue) | | | 5.00 | | | | 7-15-2027 | | | | 1,000,000 | | | | 1,058,220 | |
| | | | |
| | | | | | | | | | | | | | | 5,075,996 | |
| | | | | | | | | | | | | | | | |
| | | |
| New York: 5.17% | | | | | | | | | | | | | |
Glen Cove NY Local Economic Assistance Corporation CAB Series 2016-B (Industrial Development Revenue) ¤ | | | 0.00 | | | | 1-1-2045 | | | | 5,500,000 | | | | 992,255 | |
Green Island NY Power Authority Power System (Utilities Revenue) | | | 6.00 | | | | 12-15-2020 | | | | 730,000 | | | | 741,899 | |
Hempstead Town NY Local Development Corporation The Academy Charter School Project Series A (Education Revenue) | | | 7.65 | | | | 2-1-2044 | | | | 1,000,000 | | | | 1,096,510 | |
New York Urban Development Corporation Certificate of Participation James A Farley Post Office Project (Miscellaneous Revenue) 144A | | | 4.20 | | | | 2-1-2017 | | | | 1,000,000 | | | | 999,600 | |
Oyster Bay NY BAN Series C (GO Revenue) | | | 4.00 | | | | 6-1-2018 | | | | 2,000,000 | | | | 2,006,740 | |
Oyster Bay NY Public Improvement Bonds (GO Revenue) | | | 3.00 | | | | 8-15-2020 | | | | 500,000 | | | | 480,950 | |
Westchester County NY Local Development Pace University Series A (Education Revenue) | | | 5.00 | | | | 5-1-2034 | | | | 250,000 | | | | 254,283 | |
| | | | |
| | | | | | | | | | | | | | | 6,572,237 | |
| | | | | | | | | | | | | | | | |
| | | |
| North Dakota: 1.49% | | | | | | | | | | | | | |
Burleigh County ND Educational Facilities Authority University of Mary Project (Education Revenue) | | | 4.38 | | | | 4-15-2026 | | | | 2,000,000 | | | | 1,899,300 | |
| | | | | | | | | | | | | | | | |
| | | |
| Ohio: 1.92% | | | | | | | | | | | | | |
Maple Heights OH City School District Certificate of Participation (Miscellaneous Revenue) | | | 6.00 | | | | 11-1-2028 | | | | 500,000 | | | | 524,075 | |
Ohio Air Quality Development Authority AMT Refunding Bond Pollution Control 1st Energy Series C (Industrial Development Revenue) ± | | | 3.95 | | | | 11-1-2032 | | | | 1,000,000 | | | | 418,030 | |
The accompanying notes are an integral part of these financial statements.
| | | | |
| 12 | | Wells Fargo High Yield Municipal Bond Fund | | Portfolio of investments—December 31, 2016 (unaudited) |
| | | | | | | | | | | | | | | | |
| Security name | | Interest rate | | | Maturity date | | | Principal | | | Value | |
| | | | |
| Ohio (continued) | | | | | | | | | | | | | | | | |
Ohio Air Quality Development Authority Series A (Utilities Revenue) ± | | | 3.75 | % | | | 12-1-2023 | | | $ | 1,000,000 | | | $ | 418,470 | |
Ohio Private Activity Bond AMT Portsmouth Bypass Project (Miscellaneous Revenue, AGM Insured) | | | 5.00 | | | | 12-31-2039 | | | | 1,000,000 | | | | 1,077,430 | |
| | | | |
| | | | | | | | | | | | | | | 2,438,005 | |
| | | | | | | | | | | | | | | | |
| | | |
| Oregon: 0.73% | | | | | | | | | | | | | |
Multnomah County OR Hospital Facilities Authority Refunding Bond Mirabella South Waterfront Project Series A (Health Revenue) | | | 5.00 | | | | 10-1-2019 | | | | 350,000 | | | | 366,569 | |
Polk County OR Hospital Facility Authority Revenue Bond Dallas Retirement Village Project Series 2015-A (Health Revenue) | | | 5.00 | | | | 7-1-2025 | | | | 550,000 | | | | 558,756 | |
| | | | |
| | | | | | | | | | | | | | | 925,325 | |
| | | | | | | | | | | | | | | | |
| | | |
| Pennsylvania: 7.10% | | | | | | | | | | | | | |
Allegheny County PA IDA Propel Charter School Sunrise Project (Education Revenue) | | | 5.25 | | | | 7-15-2023 | | | | 155,000 | | | | 159,399 | |
Chester County PA HEFA Immaculata University Project (Education Revenue) | | | 5.50 | | | | 10-15-2025 | | | | 915,000 | | | | 922,896 | |
Chester PA Upland School District (GO Revenue) | | | 4.75 | | | | 9-15-2027 | | | | 1,725,000 | | | | 1,574,528 | |
East Hempfield Township PA IDA Student Services Incorporated Student Housing Project of Millersville University (Education Revenue) | | | 5.00 | | | | 7-1-2029 | | | | 500,000 | | | | 529,805 | |
Montgomery County PA Higher Education & Health Authority Arcadia University (Education Revenue) | | | 5.00 | | | | 4-1-2026 | | | | 1,655,000 | | | | 1,830,397 | |
Philadelphia PA IDA Tacony Academy Charter School Project (Education Revenue) | | | 6.88 | | | | 6-15-2033 | | | | 375,000 | | | | 409,879 | |
Philadelphia PA State Public School Building Authority School District Project (Miscellaneous Revenue) | | | 5.00 | | | | 4-1-2031 | | | | 1,000,000 | | | | 1,056,110 | |
Scranton PA Notes (GO Revenue) | | | 5.00 | | | | 11-15-2032 | | | | 1,500,000 | | | | 1,523,955 | |
Scranton PA RDA Series A (Miscellaneous Revenue, Municipal Government Guaranty Insured) | | | 5.00 | | | | 11-15-2021 | | | | 1,000,000 | | | | 1,025,220 | |
| | | | |
| | | | | | | | | | | | | | | 9,032,189 | |
| | | | | | | | | | | | | | | | |
| | | |
| Puerto Rico: 1.10% | | | | | | | | | | | | | |
Puerto Rico Industrial Tourist Educational Medical & Environmental Control Facilities Financing Authority Hospital Auxilio Mutuo Obligated Group Series A (Health Revenue) | | | 5.00 | | | | 7-1-2018 | | | | 1,275,000 | | | | 1,309,540 | |
Puerto Rico Public Finance Corporation Commonwealth Appropriation Bond Series B (Tax Revenue, Government Development Bank for Puerto Rico SPA) (s) | | | 6.00 | | | | 8-1-2024 | | | | 1,175,000 | | | | 94,000 | |
| | | | |
| | | | | | | | | | | | | | | 1,403,540 | |
| | | | | | | | | | | | | | | | |
| | | |
| South Carolina: 0.70% | | | | | | | | | | | | | |
Connector 2000 Association Incorporated CAB Series A (Transportation Revenue) ¤ | | | 0.00 | | | | 1-1-2017 | | | | 152,230 | | | | 149,143 | |
Jasper County SC School Project (Miscellaneous Revenue) | | | 4.00 | | | | 4-1-2020 | | | | 30,000 | | | | 30,693 | |
South Carolina Jobs EDA York Preparatory Academy Project Series A (Education Revenue) | | | 5.75 | | | | 11-1-2023 | | | | 170,000 | | | | 174,522 | |
South Carolina Jobs EDA York Preparatory Academy Project Series A (Education Revenue) | | | 7.25 | | | | 11-1-2045 | | | | 500,000 | | | | 536,305 | |
| | | | |
| | | | | | | | | | | | | | | 890,663 | |
| | | | | | | | | | | | | | | | |
| | | |
| Tennessee: 2.15% | | | | | | | | | | | | | |
Bristol TN Industrial Development Board Sales Tax CAB Series B (Tax Revenue) 144A¤ | | | 0.00 | | | | 12-1-2031 | | | | 3,500,000 | | | | 1,395,310 | |
Bristol TN Industrial Development Board Sales Tax Series A (Tax Revenue) 144A | | | 5.13 | | | | 12-1-2042 | | | | 1,500,000 | | | | 1,338,705 | |
| | | | |
| | | | | | | | | | | | | | | 2,734,015 | |
| | | | | | | | | | | | | | | | |
The accompanying notes are an integral part of these financial statements.
| | | | | | |
| Portfolio of investments—December 31, 2016 (unaudited) | | Wells Fargo High Yield Municipal Bond Fund | | | 13 | |
| | | | | | | | | | | | | | | | |
| Security name | | Interest rate | | | Maturity date | | | Principal | | | Value | |
| | | |
| Texas: 6.47% | | | | | | | | | | | | | |
Arlington TX Higher Education Finance Corporation Universal Academy Series A (Education Revenue) | | | 7.00 | % | | | 3-1-2034 | | | $ | 320,000 | | | $ | 324,573 | |
Hackberry TX Special Assessment Revenue Public Improvement District #3 Phase #13 (Miscellaneous Revenue) | | | 6.00 | | | | 9-1-2026 | | | | 210,000 | | | | 209,309 | |
Lewisville TX Combination Contract Castle Hills Public Improvement Bonds Project #5 (Miscellaneous Revenue) 144A | | | 6.50 | | | | 9-1-2034 | | | | 970,000 | | | | 992,329 | |
New Hope TX Cultural Education Facilities Finance Corporation Cardinal Bay Incorporated Village On The Park Carriage Inn Series B (Health Revenue) | | | 5.00 | | | | 7-1-2046 | | | | 2,500,000 | | | | 2,611,525 | |
New Hope TX Cultural Education Facilities Finance Corporation Collegiate Housing San Antonio I LLC A&M University Series A (Housing Revenue) | | | 5.00 | | | | 4-1-2036 | | | | 1,000,000 | | | | 1,037,430 | |
Pottsboro TX Higher Education Finance Corporation Imagine International Academy of North Texas Series A (Education Revenue) | | | 3.88 | | | | 8-15-2026 | | | | 1,015,000 | | | | 937,342 | |
Pottsboro TX Higher Education Finance Corporation Imagine International Academy of North Texas Series A (Education Revenue) | | | 5.00 | | | | 8-15-2036 | | | | 655,000 | | | | 615,196 | |
Tarrant County TX Cultural Education Facilities Finance Corporation Series B (Health Revenue) | | | 5.00 | | | | 11-15-2030 | | | | 1,000,000 | | | | 1,051,900 | |
Texas Gas Supply SA Energy Acquisition Public Facilities Corporation (Utilities Revenue) | | | 5.50 | | | | 8-1-2027 | | | | 190,000 | | | | 226,338 | |
Texas Private Activity Bond Surface Transportation Corporation Project NTE Mobility Partners Segments LLC (Transportation Revenue) | | | 7.00 | | | | 12-31-2038 | | | | 200,000 | | | | 227,332 | |
| | | | |
| | | | | | | | | | | | | | | 8,233,274 | |
| | | | | | | | | | | | | | | | |
| | | |
| Utah: 0.79% | | | | | | | | | | | | | |
Utah Finance Authority Charter School Revenue Spectrum Academy Project (Education Revenue) 144A | | | 5.00 | | | | 4-15-2030 | | | | 1,000,000 | | | | 1,002,030 | |
| | | | | | | | | | | | | | | | |
| | | |
| Virgin Islands: 2.51% | | | | | | | | | | | | | |
Virgin Islands PFA Matching Funding Loan Series A (Miscellaneous Revenue) | | | 6.75 | | | | 10-1-2019 | | | | 1,545,000 | | | | 1,529,195 | |
Virgin Islands PFA Series A (Tax Revenue) 144A | | | 5.00 | | | | 10-1-2032 | | | | 2,000,000 | | | | 1,660,100 | |
| | | | |
| | | | | | | | | | | | | | | 3,189,295 | |
| | | | | | | | | | | | | | | | |
| | | |
| Virginia: 1.25% | | | | | | | | | | | | | |
Stafford County & Staunton VA IDA Community Services Boards League/Central Series B (Miscellaneous Revenue) | | | 6.50 | | | | 8-1-2028 | | | | 1,555,000 | | | | 1,586,551 | |
| | | | | | | | | | | | | | | | |
| | | |
| Washington: 1.75% | | | | | | | | | | | | | |
Skagit County WA Public Hospital District #1 Skagit Valley Hospital Project (Health Revenue) | | | 5.25 | | | | 12-1-2025 | | | | 250,000 | | | | 267,858 | |
Washington Housing Finance Commission Bayview Manor Homes Series A (Health Revenue) 144A | | | 4.00 | | | | 7-1-2026 | | | | 1,000,000 | | | | 961,310 | |
Washington Housing Finance Commission Nonprofit Housing Bonds Heron’s Key Senior Living Series B-3 (Health Revenue) 144A | | | 4.38 | | | | 1-1-2021 | | | | 1,000,000 | | | | 996,120 | |
| | | | |
| | | | | | | | | | | | | | | 2,225,288 | |
| | | | | | | | | | | | | | | | |
| | | |
| West Virginia: 1.27% | | | | | | | | | | | | | |
West Virginia EDA Morgantown Energy Associates Project (Industrial Development Revenue) | | | 2.88 | | | | 12-15-2026 | | | | 1,435,000 | | | | 1,337,463 | |
West Virginia Hospital Finance Authority (Health Revenue) | | | 6.25 | | | | 10-1-2023 | | | | 270,000 | | | | 279,609 | |
| | | | |
| | | | | | | | | | | | | | | 1,617,072 | |
| | | | | | | | | | | | | | | | |
The accompanying notes are an integral part of these financial statements.
| | | | |
| 14 | | Wells Fargo High Yield Municipal Bond Fund | | Portfolio of investments—December 31, 2016 (unaudited) |
| | | | | | | | | | | | | | | | |
| Security name | | Interest rate | | | Maturity date | | | Principal | | | Value | |
| | | |
| Wisconsin: 2.28% | | | | | | | | | | | | | |
Wisconsin PFA Bancroft Neurohealth Project Series A (Health Revenue) 144A | | | 5.13 | % | | | 6-1-2048 | | | $ | 1,250,000 | | | $ | 1,147,163 | |
Wisconsin PFA Charter School Voyager Funding Incorporated Project Series A (Education Revenue) | | | 4.13 | | | | 10-1-2024 | | | | 270,000 | | | | 270,948 | |
Wisconsin PFA Coral Academy Science Las Vegas Series A (Education Revenue) | | | 5.00 | | | | 7-1-2024 | | | | 500,000 | | | | 526,500 | |
Wisconsin PFA Research Triangle High School Project Series 2015-A (Education Revenue) 144A | | | 5.63 | | | | 7-1-2045 | | | | 1,000,000 | | | | 959,610 | |
| | |
| | | | | | | | 2,904,221 | |
| | | | | | | | | | | | | | | | |
| | |
Total Municipal Obligations (Cost $128,295,407) | | | | | | | | 125,382,673 | |
| | | | | | | | | | | | | | | | |
| | | | |
| | | Yield | | | | | | Shares | | | | |
| Short-Term Investments: 0.95% | | | | | | | | | | | | | | | | |
| | | | |
| Investment Companies: 0.95% | | | | | | | | | | | | | | | | |
Wells Fargo Municipal Cash Management Fund Institutional Class (l)(u) | | | 0.67 | | | | | | | | 1,205,308 | | | | 1,206,032 | |
| | | | | | | | | | | | | | | | |
| | | |
Total Short-Term Investments (Cost $1,205,790) | | | | | | | | | | | | 1,206,032 | |
| | | | | | | | | | | | | | | | |
| | | | | | | | |
| Total investments in securities (Cost $129,501,197) * | | | 99.48 | % | | | 126,588,705 | |
Other assets and liabilities, net | | | 0.52 | | | | 656,513 | |
| | | | | | | | |
| Total net assets | | | 100.00 | % | | $ | 127,245,218 | |
| | | | | | | | |
| ¤ | The security is issued in zero coupon form with no periodic interest payments. |
| 144A | The security may be resold in transactions exempt from registration, normally to qualified institutional buyers, pursuant to Rule 144A under the Securities Act of 1933. |
| ± | Variable rate investment. The rate shown is the rate in effect at period end. |
| (s) | The security is currently in default with regards to scheduled interest and/or principal payments. The Fund has stopped accruing interest on the security. |
| (l) | The issuer of the security is an affiliated person of the Fund as defined in the Investment Company Act of 1940. |
| (u) | The rate represents the 7-day annualized yield at period end. |
| * | Cost for federal income tax purposes is $129,501,197 and unrealized gains (losses) consists of: |
| | | | |
Gross unrealized gains | | $ | 1,569,073 | |
Gross unrealized losses | | | (4,481,565 | ) |
| | | | |
Net unrealized losses | | $ | (2,912,492 | ) |
The accompanying notes are an integral part of these financial statements.
| | | | | | |
| Statement of assets and liabilities—December 31, 2016 (unaudited) | | Wells Fargo High Yield Municipal Bond Fund | | | 15 | |
| | | | |
| | | | |
| |
Assets | | | | |
Investments | | | | |
In unaffiliated securities, at value (cost $128,295,407) | | $ | 125,382,673 | |
In affiliated securities, at value (cost $1,205,790) | | | 1,206,032 | |
| | | | |
Total investments, at value (cost $129,501,197) | | | 126,588,705 | |
Receivable for investments sold | | | 984,980 | |
Receivable for Fund shares sold | | | 1,168,339 | |
Receivable for interest | | | 1,750,372 | |
Prepaid expenses and other assets | | | 16,208 | |
| | | | |
Total assets | | | 130,508,604 | |
| | | | |
| |
Liabilities | | | | |
Distributions payable | | | 74,360 | |
Payable for investments purchased | | | 966,490 | |
Payable for Fund shares redeemed | | | 2,133,317 | |
Management fee payable | | | 37,612 | |
Distribution fee payable | | | 6,653 | |
Administration fees payable | | | 12,966 | |
Accrued expenses and other liabilities | | | 31,988 | |
| | | | |
Total liabilities | | | 3,263,386 | |
| | | | |
Total net assets | | $ | 127,245,218 | |
| | | | |
| |
NET ASSETS CONSIST OF | | | | |
Paid-in capital | | $ | 130,589,123 | |
Overdistributed net investment income | | | (5,210 | ) |
Accumulated net realized losses on investments | | | (426,203 | ) |
Net unrealized losses on investments | | | (2,912,492 | ) |
| | | | |
Total net assets | | $ | 127,245,218 | |
| | | | |
| |
COMPUTATION OF NET ASSET VALUE AND OFFERING PRICE PER SHARE | | | | |
Net assets – Class A | | $ | 32,930,677 | |
Shares outstanding – Class A1 | | | 3,258,246 | |
Net asset value per share – Class A | | | $10.11 | |
Maximum offering price per share – Class A2 | | | $10.59 | |
Net assets – Class C | | $ | 9,364,759 | |
Shares outstanding – Class C1 | | | 926,494 | |
Net asset value per share – Class C | | | $10.11 | |
Net assets – Administrator Class | | $ | 18,096,300 | |
Shares outstanding – Administrator Class1 | | | 1,789,997 | |
Net asset value per share – Administrator Class | | | $10.11 | |
Net assets – Institutional Class | | $ | 66,853,482 | |
Shares outstanding – Institutional Class1 | | | 6,615,766 | |
Net asset value per share – Institutional Class | | | $10.11 | |
| 1 | The Fund has an unlimited number of authorized shares. |
| 2 | Maximum offering price is computed as 100/95.50 of net asset value. On investments of $50,000 or more, the offering price is reduced. |
The accompanying notes are an integral part of these financial statements.
| | | | |
| 16 | | Wells Fargo High Yield Municipal Bond Fund | | Statement of operations—six months ended December 31, 2016 (unaudited) |
| | | | |
| | | | |
| |
Investment income | | | | |
Interest | | $ | 3,032,693 | |
Income from affiliated securities | | | 5,133 | |
Securities lending income, net | | | 2,714 | |
| | | | |
Total investment income | | | 3,040,540 | |
| | | | |
| |
Expenses | | | | |
Management fee | | | 365,662 | |
Administration fees | | | | |
Class A | | | 31,941 | |
Class C | | | 8,890 | |
Administrator Class | | | 14,390 | |
Institutional Class | | | 26,578 | |
Shareholder servicing fees | | | | |
Class A | | | 49,909 | |
Class C | | | 13,890 | |
Administrator Class | | | 35,362 | |
Distribution fee | | | | |
Class C | | | 41,670 | |
Custody and accounting fees | | | 6,901 | |
Professional fees | | | 22,439 | |
Registration fees | | | 53,293 | |
Shareholder report expenses | | | 8,184 | |
Trustees’ fees and expenses | | | 12,081 | |
Other fees and expenses | | | 4,060 | |
| | | | |
Total expenses | | | 695,250 | |
Less: Fee waivers and/or expense reimbursements | | | (129,402 | ) |
| | | | |
Net expenses | | | 565,848 | |
| | | | |
Net investment income | | | 2,474,692 | |
| | | | |
| |
REALIZED AND UNREALIZED GAINS (LOSSES) ON INVESTMENTS | | | | |
| |
Net realized gains (losses) on: | | | | |
Unaffiliated securities | | | (361,871 | ) |
Affiliated securities | | | 1,292 | |
Futures transactions | | | (29,630 | ) |
| | | | |
Net realized losses on investments | | | (390,209 | ) |
| | | | |
| |
Net change in unrealized gains (losses) on: | | | | |
Unaffiliated securities | | | (9,717,870 | ) |
Affiliated securities | | | 242 | |
Futures transactions | | | 101,349 | |
| | | | |
Net change in unrealized gains (losses) on investments | | | (9,616,279 | ) |
| | | | |
Net realized and unrealized gains (losses) on investments | | | (10,006,488 | ) |
| | | | |
Net decrease in net assets resulting from operations | | $ | (7,531,796 | ) |
| | | | |
The accompanying notes are an integral part of these financial statements.
| | | | | | |
| Statement of changes in net assets | | Wells Fargo High Yield Municipal Bond Fund | | | 17 | |
| | | | | | | | | | | | | | | | |
| | | Six months ended December 31, 2016 (unaudited) | | | Year ended June 30, 2016 | |
| | | |
Operations | | | | | | | | | | | | |
Net investment income | | | | | | $ | 2,474,692 | | | | | | | $ | 4,089,406 | |
Net realized gains (losses) on investments | | | | | | | (390,209 | ) | | | | | | | 962,509 | |
Net change in unrealized gains (losses) on investments | | | | | | | (9,616,279 | ) | | | | | | | 6,104,160 | |
| | | | | | | | | | | | | | | | |
Net increase (decrease) in net assets resulting from operations | | | | | | | (7,531,796 | ) | | | | | | | 11,156,075 | |
| | | | | | | | | | | | | | | | |
| | | |
Distributions to shareholders from | | | | | | | | | | | | |
Net investment income | | | | | | | | | | | | | | | | |
Class A | | | | | | | (660,932 | ) | | | | | | | (894,513 | ) |
Class C | | | | | | | (141,964 | ) | | | | | | | (154,285 | ) |
Administrator Class | | | | | | | (487,450 | ) | | | | | | | (659,408 | ) |
Institutional Class | | | | | | | (1,184,167 | ) | | | | | | | (2,387,200 | ) |
Net realized gains | | | | | | | | | | | | | | | | |
Class A | | | | | | | (272,085 | ) | | | | | | | (78,573 | ) |
Class C | | | | | | | (74,086 | ) | | | | | | | (16,949 | ) |
Administrator Class | | | | | | | (130,075 | ) | | | | | | | (60,643 | ) |
Institutional Class | | | | | | | (522,236 | ) | | | | | | | (205,261 | ) |
| | | | | | | | | | | | | | | | |
Total distributions to shareholders | | | | | | | (3,472,995 | ) | | | | | | | (4,456,832 | ) |
| | | | | | | | | | | | | | | | |
| | | | |
Capital share transactions | | | Shares | | | | | | | | Shares | | | | | |
Proceeds from shares sold | | | | | | | | | | | | | | | | |
Class A | | | 987,077 | | | | 10,564,573 | | | | 2,125,225 | | | | 22,523,949 | |
Class C | | | 174,368 | | | | 1,867,098 | | | | 634,079 | | | | 6,747,929 | |
Administrator Class | | | 1,305,908 | | | | 14,111,206 | | | | 1,668,935 | | | | 17,660,288 | |
Institutional Class | | | 3,238,452 | | | | 34,069,310 | | | | 1,691,722 | | | | 17,947,276 | |
| | | | | | | | | | | | | | | | |
| | | | | | | 60,612,187 | | | | | | | | 64,879,442 | |
| | | | | | | | | | | | | | | | |
Reinvestment of distributions | | | | | | | | | | | | | | | | |
Class A | | | 85,744 | | | | 894,539 | | | | 88,701 | | | | 939,044 | |
Class C | | | 18,172 | | | | 189,120 | | | | 14,306 | | | | 151,701 | |
Administrator Class | | | 50,575 | | | | 531,748 | | | | 56,332 | | | | 597,072 | |
Institutional Class | | | 138,035 | | | | 1,436,207 | | | | 166,900 | | | | 1,762,332 | |
| | | | | | | | | | | | | | | | |
| | | | | | | 3,051,614 | | | | | | | | 3,450,149 | |
| | | | | | | | | | | | | | | | |
Payment for shares redeemed | | | | | | | | | | | | | | | | |
Class A | | | (1,297,961 | ) | | | (13,521,062 | ) | | | (771,697 | ) | | | (8,162,455 | ) |
Class C | | | (234,678 | ) | | | (2,440,435 | ) | | | (117,144 | ) | | | (1,224,951 | ) |
Administrator Class | | | (1,872,927 | ) | | | (19,482,417 | ) | | | (750,383 | ) | | | (7,978,247 | ) |
Institutional Class | | | (2,980,088 | ) | | | (31,606,353 | ) | | | (3,003,097 | ) | | | (31,534,674 | ) |
| | | | | | | | | | | | | | | | |
| | | | | | | (67,050,267 | ) | | | | | | | (48,900,327 | ) |
| | | | | | | | | | | | | | | | |
Net increase (decrease) in net assets resulting from capital share transactions | | | | | | | (3,386,466 | ) | | | | | | | 19,429,264 | |
| | | | | | | | | | | | | | | | |
Total increase (decrease) in net assets | | | | | | | (14,391,257 | ) | | | | | | | 26,128,507 | |
| | | | | | | | | | | | | | | | |
| | |
Net assets | | | | | | | | |
Beginning of period | | | | | | | 141,636,475 | | | | | | | | 115,507,968 | |
| | | | | | | | | | | | | | | | |
End of period | | | | | | $ | 127,245,218 | | | | | | | $ | 141,636,475 | |
| | | | | | | | | | | | | | | | |
Overdistributed net investment income | | | | | | $ | (5,210 | ) | | | | | | $ | (5,389 | ) |
| | | | | | | | | | | | | | | | |
The accompanying notes are an integral part of these financial statements.
| | | | |
| 18 | | Wells Fargo High Yield Municipal Bond Fund | | Financial highlights |
(For a share outstanding throughout each period)
| | | | | | | | | | | | | | | | | | | | |
| | | Six months ended
December 31, 2016 (unaudited) | | | Year ended June 30 | |
| CLASS A | | | 2016 | | | 2015 | | | 2014 | | | 20131 | |
Net asset value, beginning of period | | | $10.91 | | | | $10.34 | | | | $10.25 | | | | $9.52 | | | | $10.00 | |
Net investment income | | | 0.18 | | | | 0.35 | | | | 0.34 | | | | 0.40 | | | | 0.13 | |
Net realized and unrealized gains (losses) on investments | | | (0.72 | ) | | | 0.60 | | | | 0.18 | | | | 0.75 | | | | (0.49 | ) |
| | | | | | | | | | | | | | | | | | | | |
Total from investment operations | | | (0.54 | ) | | | 0.95 | | | | 0.52 | | | | 1.15 | | | | (0.36 | ) |
Distributions to shareholders from | | | | | | | | | | | | | | | | | | | | |
Net investment income | | | (0.18 | ) | | | (0.35 | ) | | | (0.34 | ) | | | (0.40 | ) | | | (0.12 | ) |
Net realized gains | | | (0.08 | ) | | | (0.03 | ) | | | (0.09 | ) | | | (0.02 | ) | | | 0.00 | |
| | | | | | | | | | | | | | | | | | | | |
Total distributions to shareholders | | | (0.26 | ) | | | (0.38 | ) | | | (0.43 | ) | | | (0.42 | ) | | | (0.12 | ) |
Net asset value, end of period | | | $10.11 | | | | $10.91 | | | | $10.34 | | | | $10.25 | | | | $9.52 | |
Total return2 | | | (5.06 | )% | | | 9.44 | % | | | 5.06 | % | | | 12.41 | % | | | (3.61 | )% |
Ratios to average net assets (annualized) | | | | | | | | | | | | | | | | | | | | |
Gross expenses | | | 1.06 | % | | | 1.07 | % | | | 1.07 | % | | | 1.90 | % | | | 3.45 | % |
Net expenses | | | 0.85 | % | | | 0.85 | % | | | 0.85 | % | | | 0.85 | % | | | 0.85 | % |
Net investment income | | | 3.31 | % | | | 3.28 | % | | | 3.26 | % | | | 3.98 | % | | | 3.21 | % |
Supplemental data | | | | | | | | | | | | | | | | | | | | |
Portfolio turnover rate | | | 49 | % | | | 61 | % | | | 62 | % | | | 65 | % | | | 69 | % |
Net assets, end of period (000s omitted) | | | $32,931 | | | | $38,018 | | | | $21,100 | | | | $4,022 | | | | $998 | |
| 1 | For the period from January 31, 2013 (commencement of operations) to June 30, 2013 |
| 2 | Total return calculations do not include any sales charges. Returns for periods of less than one year are not annualized. |
The accompanying notes are an integral part of these financial statements.
| | | | | | |
| Financial Highlights | | Wells Fargo High Yield Municipal Bond Fund | | | 19 | |
(For a share outstanding throughout each period)
| | | | | | | | | | | | | | | | | | | | |
| | | Six months ended
December 31, 2016 (unaudited) | | | Year ended June 30 | |
| CLASS C | | | 2016 | | | 2015 | | | 2014 | | | 20131 | |
Net asset value, beginning of period | | | $10.91 | | | | $10.34 | | | | $10.25 | | | | $9.52 | | | | $10.00 | |
Net investment income | | | 0.14 | | | | 0.27 | | | | 0.26 | | | | 0.33 | | | | 0.09 | |
Net realized and unrealized gains (losses) on investments | | | (0.72 | ) | | | 0.60 | | | | 0.18 | | | | 0.75 | | | | (0.48 | ) |
| | | | | | | | | | | | | | | | | | | | |
Total from investment operations | | | (0.58 | ) | | | 0.87 | | | | 0.44 | | | | 1.08 | | | | (0.39 | ) |
Distributions to shareholders from | | | | | | | | | | | | | | | | | | | | |
Net investment income | | | (0.14 | ) | | | (0.27 | ) | | | (0.26 | ) | | | (0.33 | ) | | | (0.09 | ) |
Net realized gains | | | (0.08 | ) | | | (0.03 | ) | | | (0.09 | ) | | | (0.02 | ) | | | 0.00 | |
| | | | | | | | | | | | | | | | | | | | |
Total distributions to shareholders | | | (0.22 | ) | | | (0.30 | ) | | | (0.35 | ) | | | (0.35 | ) | | | (0.09 | ) |
Net asset value, end of period | | | $10.11 | | | | $10.91 | | | | $10.34 | | | | $10.25 | | | | $9.52 | |
Total return2 | | | (5.42 | )% | | | 8.62 | % | | | 4.28 | % | | | 11.58 | % | | | (3.89 | )% |
Ratios to average net assets (annualized) | | | | | | | | | | | | | | | | | | | | |
Gross expenses | | | 1.81 | % | | | 1.82 | % | | | 1.82 | % | | | 2.58 | % | | | 4.05 | % |
Net expenses | | | 1.60 | % | | | 1.60 | % | | | 1.60 | % | | | 1.60 | % | | | 1.60 | % |
Net investment income | | | 2.56 | % | | | 2.49 | % | | | 2.50 | % | | | 3.15 | % | | | 2.25 | % |
Supplemental data | | | | | | | | | | | | | | | | | | | | |
Portfolio turnover rate | | | 49 | % | | | 61 | % | | | 62 | % | | | 65 | % | | | 69 | % |
Net assets, end of period (000s omitted) | | | $9,365 | | | | $10,573 | | | | $4,522 | | | | $2,323 | | | | $481 | |
| 1 | For the period from January 31, 2013 (commencement of operations) to June 30, 2013 |
| 2 | Total return calculations do not include any sales charges. Returns for periods of less than one year are not annualized. |
The accompanying notes are an integral part of these financial statements.
| | | | |
| 20 | | Wells Fargo High Yield Municipal Bond Fund | | Financial highlights |
(For a share outstanding throughout each period)
| | | | | | | | | | | | | | | | | | | | |
| | | Six months ended
December 31, 2016 (unaudited) | | | Year ended June 30 | |
| ADMINISTRATOR CLASS | | | 2016 | | | 2015 | | | 2014 | | | 20131 | |
Net asset value, beginning of period | | | $10.92 | | | | $10.34 | | | | $10.26 | | | | $9.52 | | | | $10.00 | |
Net investment income | | | 0.19 | | | | 0.36 | | | | 0.35 | | | | 0.41 | | | | 0.13 | |
Net realized and unrealized gains (losses) on investments | | | (0.73 | ) | | | 0.61 | | | | 0.17 | | | | 0.76 | | | | (0.48 | ) |
| | | | | | | | | | | | | | | | | | | | |
Total from investment operations | | | (0.54 | ) | | | 0.97 | | | | 0.52 | | | | 1.17 | | | | (0.35 | ) |
Distributions to shareholders from | | | | | | | | | | | | | | | | | | | | |
Net investment income | | | (0.19 | ) | | | (0.36 | ) | | | (0.35 | ) | | | (0.41 | ) | | | (0.13 | ) |
Net realized gains | | | (0.08 | ) | | | (0.03 | ) | | | (0.09 | ) | | | (0.02 | ) | | | 0.00 | |
| | | | | | | | | | | | | | | | | | | | |
Total distributions to shareholders | | | (0.27 | ) | | | (0.39 | ) | | | (0.44 | ) | | | (0.43 | ) | | | (0.13 | ) |
Net asset value, end of period | | | $10.11 | | | | $10.92 | | | | $10.34 | | | | $10.26 | | | | $9.52 | |
Total return2 | | | (5.10 | )% | | | 9.65 | % | | | 5.07 | % | | | 12.63 | % | | | (3.57 | )% |
Ratios to average net assets (annualized) | | | | | | | | | | | | | | | | | | | | |
Gross expenses | | | 0.99 | % | | | 1.00 | % | | | 1.00 | % | | | 1.80 | % | | | 3.24 | % |
Net expenses | | | 0.75 | % | | | 0.75 | % | | | 0.75 | % | | | 0.75 | % | | | 0.75 | % |
Net investment income | | | 3.39 | % | | | 3.39 | % | | | 3.35 | % | | | 4.14 | % | | | 3.10 | % |
Supplemental data | | | | | | | | | | | | | | | | | | | | |
Portfolio turnover rate | | | 49 | % | | | 61 | % | | | 62 | % | | | 65 | % | | | 69 | % |
Net assets, end of period (000s omitted) | | | $18,096 | | | | $25,179 | | | | $13,768 | | | | $3,282 | | | | $482 | |
| 1 | For the period from January 31, 2013 (commencement of operations) to June 30, 2013 |
| 2 | Returns for periods of less than one year are not annualized. |
The accompanying notes are an integral part of these financial statements.
| | | | | | |
| Financial Highlights | | Wells Fargo High Yield Municipal Bond Fund | | | 21 | |
(For a share outstanding throughout each period)
| | | | | | | | | | | | | | | | | | | | |
| | | Six months ended
December 31, 2016 (unaudited) | | | Year ended June 30 | |
| INSTITUTIONAL CLASS | | | 2016 | | | 2015 | | | 2014 | | | 20131 | |
Net asset value, beginning of period | | | $10.91 | | | | $10.34 | | | | $10.25 | | | | $9.52 | | | | $10.00 | |
Net investment income | | | 0.19 | | | | 0.38 | | | | 0.37 | | | | 0.42 | | | | 0.13 | |
Net realized and unrealized gains (losses) on investments | | | (0.72 | ) | | | 0.60 | | | | 0.18 | | | | 0.75 | | | | (0.48 | ) |
| | | | | | | | | | | | | | | | | | | | |
Total from investment operations | | | (0.53 | ) | | | 0.98 | | | | 0.55 | | | | 1.17 | | | | (0.35 | ) |
Distributions to shareholders from | | | | | | | | | | | | | | | | | | | | |
Net investment income | | | (0.19 | ) | | | (0.38 | ) | | | (0.37 | ) | | | (0.42 | ) | | | (0.13 | ) |
Net realized gains | | | (0.08 | ) | | | (0.03 | ) | | | (0.09 | ) | | | (0.02 | ) | | | 0.00 | |
| | | | | | | | | | | | | | | | | | | | |
Total distributions to shareholders | | | (0.27 | ) | | | (0.41 | ) | | | (0.46 | ) | | | (0.44 | ) | | | (0.13 | ) |
Net asset value, end of period | | | $10.11 | | | | $10.91 | | | | $10.34 | | | | $10.25 | | | | $9.52 | |
Total return2 | | | (4.94 | )% | | | 9.71 | % | | | 5.33 | % | | | 12.70 | % | | | (3.52 | )% |
Ratios to average net assets (annualized) | | | | | | | | | | | | | | | | | | | | |
Gross expenses | | | 0.73 | % | | | 0.74 | % | | | 0.74 | % | | | 1.53 | % | | | 2.97 | % |
Net expenses | | | 0.60 | % | | | 0.60 | % | | | 0.60 | % | | | 0.60 | % | | | 0.60 | % |
Net investment income | | | 3.56 | % | | | 3.58 | % | | | 3.51 | % | | | 4.26 | % | | | 3.25 | % |
Supplemental data | | | | | | | | | | | | | | | | | | | | |
Portfolio turnover rate | | | 49 | % | | | 61 | % | | | 62 | % | | | 65 | % | | | 69 | % |
Net assets, end of period (000s omitted) | | | $66,853 | | | | $67,867 | | | | $76,118 | | | | $31,105 | | | | $8,204 | |
| 1 | For the period from January 31, 2013 (commencement of operations) to June 30, 2013 |
| 2 | Returns for periods of less than one year are not annualized. |
The accompanying notes are an integral part of these financial statements.
| | | | |
| 22 | | Wells Fargo High Yield Municipal Bond Fund | | Notes to financial statements (unaudited) |
1. ORGANIZATION
Wells Fargo Funds Trust (the “Trust”), a Delaware statutory trust organized on March 10, 1999, is an open-end management investment company registered under the Investment Company Act of 1940, as amended (the “1940 Act”). As an investment company, the Trust follows the accounting and reporting guidance in Financial Accounting Standards Board (“FASB”) Accounting Standards Codification Topic 946, Financial Services – Investment Companies. These financial statements report on the Wells Fargo High Yield Municipal Bond Fund (the “Fund”) which is a diversified series of the Trust.
2. SIGNIFICANT ACCOUNTING POLICIES
The following significant accounting policies, which are consistently followed in the preparation of the financial statements of the Fund, are in conformity with U.S. generally accepted accounting principles which require management to make estimates and assumptions that affect the reported amounts of assets and liabilities, disclosure of contingent assets and liabilities at the date of the financial statements, and the reported amounts of revenues and expenses during the reporting period. Actual results could differ from those estimates.
Securities valuation
All investments are valued each business day as of the close of regular trading on the New York Stock Exchange (generally 4 p.m. Eastern Time), although the Fund may deviate from this calculation time under unusual or unexpected circumstances.
Debt securities are valued at the evaluated bid price provided by an independent pricing service or, if a reliable price is not available, the quoted bid price from an independent broker-dealer.
Equity securities and futures that are listed on a foreign or domestic exchange or market are valued at the official closing price or, if none, the last sales price. If no sale occurs on the principal exchange or market that day, the prior day’s price will be deemed “stale” and a fair value price will be determined in accordance with the Fund’s Valuation Procedures.
Investments in registered open-end investment companies are valued at net asset value. Interests in non-registered investment vehicles that are redeemable at net asset value are fair valued normally at net asset value.
Investments which are not valued using any of the methods discussed above are valued at their fair value, as determined in good faith by the Board of Trustees of the Fund. The Board of Trustees has established a Valuation Committee comprised of the Trustees and has delegated to it the authority to take any actions regarding the valuation of portfolio securities that the Valuation Committee deems necessary or appropriate, including determining the fair value of portfolio securities, unless the determination has been delegated to the Management Valuation Team of Wells Fargo Funds Management, LLC (“Funds Management”). The Board of Trustees retains the authority to make or ratify any valuation decisions or approve any changes to the Valuation Procedures as it deems appropriate. On a quarterly basis, the Board of Trustees receives reports on any valuation actions taken by the Valuation Committee or the Management Valuation Team which may include items for ratification.
Valuations of fair valued securities are compared to the next actual sales price when available, or other appropriate market values, to assess the continued appropriateness of the fair valuation methodologies used. These securities are fair valued on a day-to-day basis, taking into consideration changes to appropriate market information and any significant changes to the inputs considered in the valuation process until there is a readily available price provided on an exchange or by an independent pricing service. Valuations received from an independent pricing service or independent broker-dealer quotes are periodically validated by comparisons to most recent trades and valuations provided by other independent pricing services in addition to the review of prices by the manager and/or subadviser. Unobservable inputs used in determining fair valuations are identified based on the type of security, taking into consideration factors utilized by market participants in valuing the investment, knowledge about the issuer and the current market environment.
When-issued transactions
The Fund may purchase securities on a forward commitment or when-issued basis. The Fund records a when-issued transaction on the trade date and will segregate assets in an amount at least equal in value to the Fund’s commitment to purchase when-issued securities. Securities purchased on a when-issued basis are marked-to-market daily and the Fund begins earning interest on the settlement date. Losses may arise due to changes in the market value of the underlying securities or if the counterparty does not perform under the contract.
| | | | | | |
| Notes to financial statements (unaudited) | | Wells Fargo High Yield Municipal Bond Fund | | | 23 | |
Security loans
The Fund may lend its securities from time to time in order to earn additional income in the form of fees or interest on securities received as collateral or the investment of any cash received as collateral. The Fund continues to receive interest or dividends on the securities loaned. The Fund receives collateral in the form of cash or securities with a value at least equal to the value of the securities on loan. The value of the loaned securities is determined at the close of each business day and any additional required collateral is delivered to the Fund on the next business day. In a securities lending transaction, the net asset value of the Fund will be affected by an increase or decrease in the value of the securities loaned and by an increase or decrease in the value of the instrument in which collateral is invested. The amount of securities lending activity undertaken by the Fund fluctuates from time to time. In the event of default or bankruptcy by the borrower, the Fund may be prevented from recovering the loaned securities or gaining access to the collateral or may experience delays or costs in doing so. In addition, the investment of any cash collateral received may lose all or part of its value. The Fund has the right under the lending agreement to recover the securities from the borrower on demand.
The Fund lends its securities through an unaffiliated securities lending agent. Cash collateral received in connection with its securities lending transactions is invested in Securities Lending Cash Investments, LLC (the “Securities Lending Fund”). The Securities Lending Fund is exempt from registration under Section 3(c)(7) of the 1940 Act and is managed by Funds Management and is subadvised by Wells Capital Management Incorporated (“WellsCap”), an affiliate of Funds Management and an indirect wholly owned subsidiary of Wells Fargo & Company (“Wells Fargo”). Funds Management receives an advisory fee starting at 0.05% and declining to 0.01% as the average daily net assets of the Securities Lending Fund increase. All of the fees received by Funds Management are paid to WellsCap for its services as subadviser. The Securities Lending Fund seeks to provide a positive return compared to the daily Fed Funds Open Rate by investing in high-quality, U.S. dollar-denominated short-term money market instruments. Securities Lending Fund investments are valued at the evaluated bid price provided by an independent pricing service. Income earned from investment in the Securities Lending Fund is included in securities lending income on the Statement of Operations.
Futures contracts
The Fund is subject to interest rate risk in the normal course of pursuing its investment objectives. The Fund may buy and sell futures contracts in order to gain exposure to, or protect against, changes in security values and interest rates. The primary risks associated with the use of futures contracts are the imperfect correlation between changes in market values of securities held by the Fund and the prices of futures contracts, and the possibility of an illiquid market.
The aggregate principal amounts of the contracts are not recorded in the financial statements. Fluctuations in the value of the contracts are recorded in the Statement of Assets and Liabilities as an asset or liability and in the Statement of Operations as unrealized gains or losses until the contracts are closed, at which point they are recorded as net realized gains or losses on futures contracts. With futures contracts, there is minimal counterparty risk to the Fund since futures are exchange traded and the exchange’s clearinghouse, as counterparty to all exchange traded futures, guarantees the futures against default.
Security transactions and income recognition
Securities transactions are recorded on a trade date basis. Realized gains or losses are recorded on the basis of identified cost.
Interest income is accrued daily and bond discounts are accreted and premiums are amortized daily based on the effective interest method. To the extent debt obligations are placed on non-accrual status, any related interest income may be reduced by writing off interest receivables when the collection of all or a portion of interest has become doubtful based on consistently applied procedures. If the issuer subsequently resumes interest payments or when the collectability of interest is reasonably assured, the debt obligation is removed from non-accrual status.
Distributions to shareholders
Distributions to shareholders from net investment income are accrued daily and paid monthly. Distributions from net realized gains, if any, are recorded on the ex-dividend date. Such distributions are determined in conformity with federal income tax regulations, which may differ in amount or character from net investment income and realized gains recognized for purposes of U.S. generally accepted accounting principles.
Federal and other taxes
The Fund intends to continue to qualify as a regulated investment company by distributing substantially all of its investment company taxable and tax-exempt income and any net realized capital gains (after reduction for capital loss carryforwards) sufficient to relieve it from all, or substantially all, federal income taxes. Accordingly, no provision for federal income taxes was required.
| | | | |
| 24 | | Wells Fargo High Yield Municipal Bond Fund | | Notes to financial statements (unaudited) |
The Fund’s income and federal excise tax returns and all financial records supporting those returns for the prior three fiscal years are subject to examination by the federal and Delaware revenue authorities. Management has analyzed the Fund’s tax positions taken on federal, state, and foreign tax returns for all open tax years and does not believe that there are any uncertain tax positions that require recognition of a tax liability.
Class allocations
The separate classes of shares offered by the Fund differ principally in applicable sales charges, distribution, shareholder servicing, and administration fees. Class specific expenses are charged directly to that share class. Investment income, common expenses, and realized and unrealized gains (losses) on investments are allocated daily to each class of shares based on the relative proportion of net assets of each class.
3. FAIR VALUATION MEASUREMENTS
Fair value measurements of investments are determined within a framework that has established a fair value hierarchy based upon the various data inputs utilized in determining the value of the Fund’s investments. The three-level hierarchy gives the highest priority to unadjusted quoted prices in active markets for identical assets or liabilities (Level 1) and the lowest priority to significant unobservable inputs (Level 3). The Fund’s investments are classified within the fair value hierarchy based on the lowest level of input that is significant to the fair value measurement. The inputs are summarized into three broad levels as follows:
| ∎ | | Level 1 – quoted prices in active markets for identical securities |
| ∎ | | Level 2 – other significant observable inputs (including quoted prices for similar securities, interest rates, prepayment speeds, credit risk, use of amortized cost, etc.) |
| ∎ | | Level 3 – significant unobservable inputs (including the Fund’s own assumptions in determining the fair value of investments) |
The inputs or methodologies used for valuing investments in securities are not necessarily an indication of the risk associated with investing in those securities.
The following is a summary of the inputs used in valuing the Fund’s assets and liabilities as of December 31, 2016:
| | | | | | | | | | | | | | | | |
| | | Quoted prices
(Level 1) | | | Other significant
observable inputs
(Level 2) | | | Significant
unobservable inputs
(Level 3) | | | Total | |
Assets | | | | | | | | | | | | | | | | |
Investments in: | | | | | | | | | | | | | | | | |
| | | | |
Municipal obligations | | $ | 0 | | | $ | 125,382,673 | | | $ | 0 | | | $ | 125,382,673 | |
| | | | |
Short-term investments | | | | | | | | | | | | | | | | |
Investment companies | | | 1,206,032 | | | | 0 | | | | 0 | | | | 1,206,032 | |
Total assets | | $ | 1,206,032 | | | $ | 125,382,673 | | | $ | 0 | | | $ | 126,588,705 | |
The Fund recognizes transfers between levels within the fair value hierarchy at the end of the reporting period. At December 31, 2016, the Fund did not have any transfers into/out of Level 1, Level 2, or Level 3.
4. TRANSACTIONS WITH AFFILIATES AND OTHER EXPENSES
Management fee
Funds Management, an indirect wholly owned subsidiary of Wells Fargo, is the manager of the Fund and provides advisory and fund-level administrative services under an investment management agreement. Under the investment management agreement, Funds Management is responsible for, among other services, implementing the investment objectives and strategies of the Fund, supervising the subadviser, providing fund-level administrative services in connection with the Fund’s operations, and providing any other fund-level administrative services reasonably necessary for the operation of the Fund. As compensation for its services under the investment management agreement, Funds Management is entitled to receive an annual management fee starting at 0.50% and declining to 0.38% as the average daily net assets of the Fund increase. For the six months ended December 31, 2016, the management fee was equivalent to an annual rate of 0.50% of the Fund’s average daily net assets.
| | | | | | |
| Notes to financial statements (unaudited) | | Wells Fargo High Yield Municipal Bond Fund | | | 25 | |
Funds Management has retained the services of a subadviser to provide daily portfolio management to the Fund. The fee for subadvisory services is borne by Funds Management. WellsCap is the subadviser to the Fund and is entitled to receive a fee from Funds Management at an annual rate starting at 0.35% and declining to 0.20% as the average daily net assets of the Fund increase.
Administration fees
Under a class-level administration agreement, Funds Management provides class-level administrative services to the Fund, which includes paying fees and expenses for services provided by the transfer agent, sub-transfer agents, omnibus account servicers and record-keepers. As compensation for its services under the class-level administration agreement, Funds Management receives an annual fee which is calculated based on the average daily net assets of each class as follows:
| | | | |
| | | Class-level
administration fee | |
Class A, Class C | | | 0.16 | % |
Administrator Class | | | 0.10 | |
Institutional Class | | | 0.08 | |
Funds Management has contractually waived and/or reimbursed management and administration fees to the extent necessary to maintain certain net operating expense ratios for the Fund. Waiver of fees and/or reimbursement of expenses by Funds Management were made first from fund level expenses on a proportionate basis and then from class specific expenses. Funds Management has committed through October 31, 2017 to waive fees and/or reimburse expenses to the extent necessary to cap the Fund’s expenses at 0.85% for Class A shares, 1.60% for Class C shares, 0.75% for Administrator Class shares, and 0.60% for Institutional Class shares. After this time, the cap may be increased or the commitment to maintain the cap may be terminated only with the approval of the Board of Trustees.
During the six months ended December 31, 2016, Funds Management received $1,311 from State Street Bank and Trust Company, the Fund’s custodian, for certain out-of-pocket expenses that were billed to the Fund in error from 1998-2015 that increased waivers/reimbursements made by Funds Management for the Fund during the period.
Distribution fee
The Trust has adopted a distribution plan for Class C shares of the Fund pursuant to Rule 12b-1 under the 1940 Act. A distribution fee is charged to Class C shares and paid to Wells Fargo Funds Distributor, LLC (“Funds Distributor”), the principal underwriter, at an annual rate of 0.75% of the average daily net assets of Class C shares.
In addition, Funds Distributor is entitled to receive the front-end sales charge from the purchase of Class A shares and a contingent deferred sales charge on the redemption of certain Class A shares. Funds Distributor is also entitled to receive the contingent deferred sales charges from redemptions of Class C shares. For the six months ended December 31, 2016, Funds Distributor received $1,978 from the sale of Class A shares.
Shareholder servicing fees
The Trust has entered into contracts with one or more shareholder servicing agents, whereby Class A, Class C, and Administrator Class of the Fund are charged a fee at an annual rate of 0.25% of the average daily net assets of each respective class.
A portion of these total shareholder servicing fees were paid to affiliates of Wells Fargo.
5. INVESTMENT PORTFOLIO TRANSACTIONS
Purchases and sales of investments, excluding U.S. government obligations (if any) and short-term securities, for the six months ended December 31, 2016 were $66,883,390 and $63,546,661, respectively.
The Fund may purchase or sell investment securities to other Wells Fargo funds under procedures adopted by the Board of Trustees. The procedures have been designed to ensure that these interfund transactions, which generally do not incur broker commissions, are effected at current market prices. Interfund trades are included within the respective purchases and sales amounts shown.
6. DERIVATIVE TRANSACTIONS
During the six months ended December 31, 2016, the Fund entered into futures contracts to take advantage of the differences between municipal and treasury yields and to help manage the duration of the Fund.
| | | | |
| 26 | | Wells Fargo High Yield Municipal Bond Fund | | Notes to financial statements (unaudited) |
As of December 31, 2016, the Fund did not have any open futures contracts. The Fund had an average notional amount of $688,937 in short futures contracts during the six months ended December 31, 2016.
The realized losses and change in unrealized gains (losses) on futures contracts are reflected in the Statement of Operations.
7. BANK BORROWINGS
The Trust (excluding the money market funds and certain other funds) and Wells Fargo Variable Trust are parties to a $250,000,000 revolving credit agreement whereby the Fund is permitted to use bank borrowings for temporary or emergency purposes, such as to fund shareholder redemption requests. Interest under the credit agreement is charged to the Fund based on a borrowing rate equal to the higher of the Federal Funds rate in effect on that day plus 1.25% or the overnight LIBOR rate in effect on that day plus 1.25%. In addition, an annual commitment fee equal to 0.25% of the unused balance is allocated to each participating fund. Prior to August 30, 2016, the revolving credit agreement amount was $200,000,000 and the annual commitment fee was equal to 0.20% of the unused balance which was allocated to each participating fund.
For the six months ended December 31, 2016, there were no borrowings by the Fund under the agreement.
8. INDEMNIFICATION
Under the Trust’s organizational documents, the officers and Trustees have been granted certain indemnification rights against certain liabilities that may arise out of performance of their duties to the Trust. Additionally, in the normal course of business, the Trust may enter into contracts with service providers that contain a variety of indemnification clauses. The Trust’s maximum exposure under these arrangements is dependent on future claims that may be made against the Fund and, therefore, cannot be estimated.
9. REGULATORY CHANGES
In October 2016, the Securities and Exchange Commission (“SEC”) adopted new rules and forms and amended existing rules and forms (together, “final rules”) intended to modernize and enhance the reporting and disclosure of information by registered investment companies and to enhance liquidity risk management by open-end mutual funds and exchange-traded funds. The final rules will enhance the quality of information available to investors and will allow the SEC to more effectively collect and use data reported by funds. In part, the final rules amend Regulation S-X and require standardized, enhanced disclosure about derivatives in the Fund’s financial statements, as well as other amendments. The compliance date for the amendments to Regulation S-X is August 1, 2017 while the compliance date for the new form types is June 1, 2018 and the compliance date for the liquidity risk management program requirements is December 1, 2018. Management is currently assessing the potential impact of these enhancements and their impact on the financial statement disclosures and reporting requirements.
| | | | | | |
| Other information (unaudited) | | Wells Fargo High Yield Municipal Bond Fund | | | 27 | |
PROXY VOTING INFORMATION
A description of the policies and procedures that the Fund uses to determine how to vote proxies relating to portfolio securities is available, upon request, by calling 1-800-222-8222, visiting our website at wellsfargofunds.com, or visiting the SEC website at sec.gov. Information regarding how the Fund voted proxies relating to portfolio securities during the most recent 12-month period ended June 30 is available on the Fund’s website at wellsfargofunds.com or by visiting the SEC website at sec.gov.
PORTFOLIO HOLDINGS INFORMATION
The complete portfolio holdings for the Fund are publicly available monthly on the Fund’s website (wellsfargofunds.com), on a one-month delayed basis. In addition, top ten holdings information (excluding derivative positions) for the Fund is publicly available on the Fund’s website on a monthly, seven-day or more delayed basis. The Fund files its complete schedule of portfolio holdings with the SEC for the first and third quarters of each fiscal year on Form N-Q, which is available by visiting the SEC website at sec.gov. In addition, the Fund’s Form N-Q may be reviewed and copied at the SEC’s Public Reference Room in Washington, DC, and at regional offices in New York City, at 233 Broadway, and in Chicago, at 175 West Jackson Boulevard, Suite 900. Information about the Public Reference Room may be obtained by calling 1-800-SEC-0330.
| | | | |
| 28 | | Wells Fargo High Yield Municipal Bond Fund | | Other information (unaudited) |
BOARD OF TRUSTEES AND OFFICERS
Each of the Trustees and Officers1 listed in the table below acts in identical capacities for each fund in the Wells Fargo family of funds, which consists of 139 mutual funds comprising the Wells Fargo Funds Trust, Wells Fargo Variable Trust, Wells Fargo Master Trust and four closed-end funds (collectively the “Fund Complex”). This table should be read in conjunction with the Prospectus and the Statement of Additional Information2. The mailing address of each Trustee and Officer is 525 Market Street, 12th Floor, San Francisco, CA 94105. Each Trustee and Officer serves an indefinite term, however, each Trustee serves such term until reaching the mandatory retirement age established by the Trustees.
Independent Trustees
| | | | | | |
Name and
year of birth | | Position held and
length of service* | | Principal occupations during past five years or longer | | Current other
public company or
investment company
directorships |
| William R. Ebsworth (Born 1957) | | Trustee, since 2015 | | Retired. From 1984 to 2013, equities analyst, portfolio manager, research director and chief financial officer at Fidelity Management and Research Company in Boston, Tokyo, and Hong Kong and retired in 2013 as Chief Investment Officer of Fidelity Strategic Advisers, Inc. where he lead a team of investment professionals managing client assets. Prior thereto, Board member of Hong Kong Securities Clearing Co., Hong Kong Options Clearing Corp., the Thailand International Fund, Ltd., Fidelity Investments Life Insurance Company, and Empire Fidelity Investments Life Insurance Company. Board member of the Fonté Foundation (non-profit organization) and the Vincent Memorial Hospital Endowment (non-profit organization), where he serves on the Investment Committee and as a Chair of the Audit Committee. Mr. Ebsworth is a CFA® charterholder and an Adjunct Lecturer, Finance, at Babson College. | | Asset Allocation Trust |
| Jane A. Freeman (Born 1953) | | Trustee, since 2015 | | Retired. From 2012 to 2014 and 1999 to 2008, Chief Financial Officer of Scientific Learning Corporation. From 2008 to 2012, Ms. Freeman provided consulting services related to strategic business projects. Prior to 1999, Portfolio Manager at Rockefeller & Co. and Scudder, Stevens & Clark. Board member of the Harding Loevner Funds from 1996 to 2014, serving as both Lead Independent Director and chair of the Audit Committee. Board member of the Russell Exchange Traded Funds Trust from 2011 to 2012 and the chair of the Audit Committee. Ms. Freeman is a Board Member of Ruth Bancroft Garden (non-profit organization) and an inactive chartered financial analyst. | | Asset Allocation Trust |
| Peter G. Gordon** (Born 1942) | | Trustee, since 1998; Chairman, since 2005 | | Co-Founder, Retired Chairman, President and CEO of Crystal Geyser Water Company. Trustee Emeritus, Colby College. | | Asset Allocation Trust |
| Isaiah Harris, Jr. (Born 1952) | | Trustee, since 2009 | | Retired. Chairman of the Board of CIGNA Corporation since 2009, and Director since 2005. From 2003 to 2011, Director of Deluxe Corporation. Prior thereto, President and CEO of BellSouth Advertising and Publishing Corp. from 2005 to 2007, President and CEO of BellSouth Enterprises from 2004 to 2005 and President of BellSouth Consumer Services from 2000 to 2003. Emeritus member of the Iowa State University Foundation Board of Governors. Emeritus Member of the Advisory Board of Iowa State University School of Business. Advisory Board Member, Palm Harbor Academy (charter school). Advisory Board Member, Child Evangelism Fellowship (non-profit). Mr. Harris is a certified public accountant (inactive status). | | CIGNA Corporation; Asset Allocation Trust |
| Judith M. Johnson (Born 1949) | | Trustee, since 2008;
Audit Committee Chairman, since 2008 | | Retired. Prior thereto, Chief Executive Officer and Chief Investment Officer of Minneapolis Employees Retirement Fund from 1996 to 2008. Ms. Johnson is an attorney, certified public accountant and a certified managerial accountant. | | Asset Allocation Trust |
| David F. Larcker (Born 1950) | | Trustee, since 2009 | | James Irvin Miller Professor of Accounting at the Graduate School of Business, Stanford University, Director of the Corporate Governance Research Initiative and Senior Faculty of The Rock Center for Corporate Governance since 2006. From 2005 to 2008, Professor of Accounting at the Graduate School of Business, Stanford University. Prior thereto, Ernst & Young Professor of Accounting at The Wharton School, University of Pennsylvania from 1985 to 2005. | | Asset Allocation Trust |
| | | | | | |
| Other information (unaudited) | | Wells Fargo High Yield Municipal Bond Fund | | | 29 | |
| | | | | | |
Name and
year of birth | | Position held and
length of service* | | Principal occupations during past five years or longer | | Current other
public company or
investment company
directorships |
| Olivia S. Mitchell (Born 1953) | | Trustee, since 2006 | | International Foundation of Employee Benefit Plans Professor, Wharton School of the University of Pennsylvania since 1993. Director of Wharton’s Pension Research Council and Boettner Center on Pensions & Retirement Research, and Research Associate at the National Bureau of Economic Research. Previously, Cornell University Professor from 1978 to 1993. | | Asset Allocation Trust |
| Timothy J. Penny (Born 1951) | | Trustee, since 1996 | | President and Chief Executive Officer of Southern Minnesota Initiative Foundation, a non-profit organization, since 2007 and Senior Fellow at the Humphrey Institute Policy Forum at the University of Minnesota since 1995. Member of the Board of Trustees of NorthStar Education Finance, Inc., a non-profit organization, since 2007. | | Asset Allocation Trust |
| Michael S. Scofield (Born 1943) | | Trustee, since 2010 | | Served on the Investment Company Institute’s Board of Governors and Executive Committee from 2008-2011 as well the Governing Council of the Independent Directors Council from 2006-2011 and the Independent Directors Council Executive Committee from 2008-2011. Chairman of the IDC from 2008-2010. Institutional Investor (Fund Directions) Trustee of Year in 2007. Trustee of the Evergreen Funds complex (and its predecessors) from 1984 to 2010. Chairman of the Evergreen Funds from 2000-2010. Former Trustee of the Mentor Funds. Retired Attorney, Law Offices of Michael S. Scofield. | | Asset Allocation Trust |
| * | Length of service dates reflect the Trustee’s commencement of service with the Trust’s predecessor entities, where applicable. |
| ** | Peter Gordon is expected to retire on December 31, 2017. |
Officers
| | | | | | |
Name and
year of birth | | Position held and
length of service | | Principal occupations during past five years or longer | | |
| Andrew Owen3 (Born 1960) | | President, since 2017 | | Executive Vice President of Wells Fargo Bank, N.A. and President of Wells Fargo & Company and Head of Affiliated Managers, Wells Fargo Asset Management, since 2014. Executive Vice President responsible for marketing, investments and product development for Wells Fargo Funds Management, LLC, from 2009 to 2014. | | |
| Nancy Wiser1 (Born 1967) | | Treasurer, since 2012 | | Executive Vice President of Wells Fargo Funds Management, LLC since 2011. Chief Operating Officer and Chief Compliance Officer at LightBox Capital Management LLC, from 2008 to 2011. | | |
| C. David Messman (Born 1960) | | Secretary, since 2000; Chief Legal Officer,
since 2003 | | Senior Vice President and Secretary of Wells Fargo Funds Management, LLC since 2001. Assistant General Counsel of Wells Fargo Bank, N.A. since 2013 and Vice President and Managing Counsel of Wells Fargo Bank, N.A. from 1996 to 2013. | | |
| Michael Whitaker (Born 1967) | | Chief Compliance Officer, since 2016 | | Executive Vice President of Wells Fargo Funds Management, LLC since 2016. Chief Compliance Officer of Fidelity’s Fixed Income Funds and Asset Allocation Funds from 2008 to 2016, Compliance Officer of FMR Co., Inc. from 2014 to 2016, Fidelity Investments Money Management, Inc. from 2014 to 2016, Fidelity Investments from 2007 to 2016. | | |
| David Berardi (Born 1975) | | Assistant Treasurer,
since 2009 | | Vice President of Wells Fargo Funds Management, LLC since 2009. Vice President of Evergreen Investment Management Company, LLC from 2008 to 2010. Manager of Fund Reporting and Control for Evergreen Investment Management Company, LLC from 2004 to 2010. | | |
| Jeremy DePalma1 (Born 1974) | | Assistant Treasurer,
since 2009 | | Senior Vice President of Wells Fargo Funds Management, LLC since 2009. Senior Vice President of Evergreen Investment Management Company, LLC from 2008 to 2010 and head of the Fund Reporting and Control Team within Fund Administration from 2005 to 2010. | | |
| 1 | Nancy Wiser acts as Treasurer of 70 funds in the Fund Complex. Jeremy DePalma acts as Treasurer of 69 funds and Assistant Treasurer of 70 funds in the Fund Complex. |
| 2 | The Statement of Additional Information includes additional information about the Trustees and is available, without charge, upon request, by calling 1-800-222-8222 or by visiting the website at wellsfargofunds.com. |
| 3 | Andrew Owen became President on January 1, 2017. |
| | | | |
| 30 | | Wells Fargo High Yield Municipal Bond Fund | | List of abbreviations |
The following is a list of common abbreviations for terms and entities that may have appeared in this report.
| ACA | — ACA Financial Guaranty Corporation |
| ADR | — American depositary receipt |
| ADS | — American depositary shares |
| AGC | — Assured Guaranty Corporation |
| AGM | — Assured Guaranty Municipal |
| Ambac | — Ambac Financial Group Incorporated |
| AMT | — Alternative minimum tax |
| BAN | — Bond anticipation notes |
| BHAC | — Berkshire Hathaway Assurance Corporation |
| CAB | — Capital appreciation bond |
| CCAB | — Convertible capital appreciation bond |
| CDA | — Community Development Authority |
| CDO | — Collateralized debt obligation |
| DRIVER | — Derivative inverse tax-exempt receipts |
| DW&P | — Department of Water & Power |
| DWR | — Department of Water Resources |
| ECFA | — Educational & Cultural Facilities Authority |
| EDA | — Economic Development Authority |
| EDFA | — Economic Development Finance Authority |
| ETF | — Exchange-traded fund |
| FDIC | — Federal Deposit Insurance Corporation |
| FFCB | — Federal Farm Credit Banks |
| FGIC | — Financial Guaranty Insurance Corporation |
| FHA | — Federal Housing Administration |
| FHLB | — Federal Home Loan Bank |
| FHLMC | — Federal Home Loan Mortgage Corporation |
| FICO | — The Financing Corporation |
| FNMA | — Federal National Mortgage Association |
| GDR | — Global depositary receipt |
| GNMA | — Government National Mortgage Association |
| HCFR | — Healthcare facilities revenue |
| HEFA | — Health & Educational Facilities Authority |
| HEFAR | — Higher education facilities authority revenue |
| HFA | — Housing Finance Authority |
| HFFA | — Health Facilities Financing Authority |
| HUD | — Department of Housing and Urban Development |
| IDA | — Industrial Development Authority |
| IDAG | — Industrial Development Agency |
| KRW | — Republic of Korea won |
| LIBOR | — London Interbank Offered Rate |
| LIFER | — Long Inverse Floating Exempt Receipts |
| LLC | — Limited liability company |
| LLLP | — Limited liability limited partnership |
| LLP | — Limited liability partnership |
| MBIA | — Municipal Bond Insurance Association |
| MFHR | — Multifamily housing revenue |
| MSTR | — Municipal securities trust receipts |
| MUD | — Municipal Utility District |
| National | — National Public Finance Guarantee Corporation |
| PCFA | — Pollution Control Financing Authority |
| PCL | — Public Company Limited |
| PCR | — Pollution control revenue |
| PFA | — Public Finance Authority |
| PFFA | — Public Facilities Financing Authority |
| PFOTER | — Puttable floating option tax-exempt receipts |
| plc | — Public limited company |
| PUTTER | — Puttable tax-exempt receipts |
| R&D | — Research & development |
| Radian | — Radian Asset Assurance |
| RAN | — Revenue anticipation notes |
| RDA | — Redevelopment Authority |
| RDFA | — Redevelopment Finance Authority |
| REIT | — Real estate investment trust |
| ROC | — Reset option certificates |
| SAVRS | — Select auction variable rate securities |
| SBA | — Small Business Authority |
| SDR | — Swedish depositary receipt |
| SFHR | — Single-family housing revenue |
| SFMR | — Single-family mortgage revenue |
| SPA | — Standby purchase agreement |
| SPDR | — Standard & Poor’s Depositary Receipts |
| SPEAR | — Short Puttable Exempt Adjustable Receipts |
| STRIPS | — Separate trading of registered interest and |
| TAN | — Tax anticipation notes |
| TIPS | — Treasury inflation-protected securities |
| TRAN | — Tax revenue anticipation notes |
| TTFA | — Transportation Trust Fund Authority |
| TVA | — Tennessee Valley Authority |
This page is intentionally left blank.
This page is intentionally left blank.

For more information
More information about Wells Fargo Funds is available free upon request. To obtain literature, please write, email, visit the Fund’s website, or call:
Wells Fargo Funds
P.O. Box 8266
Boston, MA 02266-8266
Email: fundservice@wellsfargo.com
Website: wellsfargofunds.com
Individual investors: 1-800-222-8222
Retail investment professionals: 1-888-877-9275
Institutional investment professionals: 1-866-765-0778
This report and the financial statements contained herein are submitted for the general information of the shareholders of the Fund. If this report is used for promotional purposes, distribution of the report must be accompanied or preceded by a current prospectus. Before investing, please consider the investment objectives, risks, charges, and expenses of the investment. For a current prospectus and, if available, a summary prospectus, containing this information, call 1-800-222-8222 or visit the Fund’s website at wellsfargofunds.com. Read the prospectus carefully before you invest or send money.
Wells Fargo Asset Management (WFAM) is a trade name used by the asset management businesses of Wells Fargo & Company. Wells Fargo Funds Management, LLC, a wholly owned subsidiary of Wells Fargo & Company, provides investment advisory and administrative services for Wells Fargo Funds. Other affiliates of Wells Fargo & Company provide subadvisory and other services for the funds. The funds are distributed by Wells Fargo Funds Distributor, LLC, Member FINRA, an affiliate of Wells Fargo & Company. Neither Wells Fargo Funds Management nor Wells Fargo Funds Distributor has Fund customer accounts/assets, and neither provides investment advice/recommendations or acts as an investment advice fiduciary to any investor.
NOT FDIC INSURED ◾ NO BANK GUARANTEE ◾ MAY LOSE VALUE
© 2016 Wells Fargo Funds Management, LLC. All rights reserved.
| | |
 | | 300479 02-17 SA264/SAR264 12-16 |
Semi-Annual Report
December 31, 2016

Wells Fargo Intermediate Tax/AMT-Free Fund


Reduce clutter. Save trees.
Sign up for electronic delivery of prospectuses and shareholder reports at wellsfargo.com/advantagedelivery
Contents
| * | A complete schedule of portfolio holdings as of the report date may be obtained, free of charge, by accessing the following website: https://www.wellsfargofunds.com/assets/edocs/regulatory/holdings/intermediate-tax-amt-free-semi.pdf or by calling Wells Fargo Funds at 1-800-222-8222. This complete schedule, filed on Form N-CSRS, is also available on the SEC’s website at sec.gov. |
The views expressed and any forward-looking statements are as of December 31, 2016, unless otherwise noted, and are those of the Fund managers and/or Wells Fargo Funds Management, LLC. Discussions of individual securities, or the markets generally, or any Wells Fargo Fund are not intended as individual recommendations. Future events or results may vary significantly from those expressed in any forward-looking statements. The views expressed are subject to change at any time in response to changing circumstances in the market. Wells Fargo Funds Management, LLC and the Fund disclaim any obligation to publicly update or revise any views expressed or forward-looking statements.
NOT FDIC INSURED ◾ NO BANK GUARANTEE ◾ MAY LOSE VALUE
| | | | |
| 2 | | Wells Fargo Intermediate Tax/AMT-Free Fund | | Letter to shareholders (unaudited) |

Andrew Owen
President
Wells Fargo Funds
The Bloomberg Barclays Municipal Bond Index,1 a broad measure tracking investment-grade municipal bonds, lost 3.91% during the six-month reporting period.
Dear Shareholder:
As the new president of Wells Fargo Funds now that Karla Rabusch is retiring from that position after nearly 14 years, I am pleased to offer you this semi-annual report for the Wells Fargo Intermediate Tax/AMT-Free Fund for the six-month period that ended December 31, 2016. The Federal Reserve (Fed) raised the federal funds rate in December by 0.25%. Municipal bond yields rose sharply in the fourth quarter. The Bloomberg Barclays Municipal Bond Index,1 a broad measure tracking investment-grade municipal bonds, lost 3.91% during the six-month reporting period.
Municipal bond yields rose during the reporting period.
The municipal market reversed course in the second half of 2016, with yields increasing and prices declining. Initially the sell-off was driven by negative supply and demand trends, also known as technical factors. By the fourth quarter, fund flows turned negative (reversing a trend of 54 weeks of positive flows) and municipal bond supply increased. These deteriorating technical factors, along with the expectation of an expansionary fiscal policy and lower tax rates under the new administration, drove market volatility; credit spreads widened and the yield curve steepened as the market sold-off.
Stronger economic indicators drove monetary policy.
On December 14, the Fed hiked the short-term interest rate by 0.25% to reach a target range of 0.50% to 0.75%. This was the second rate increase in more than 10 years, with the Fed citing job gains and lower than expected unemployment of 4.6%. The Fed confirmed the continuation of an accommodative monetary policy to support a stronger labor market and reiterated its long-term objective of a 2% inflation rate, which increased slightly during the fourth quarter but fell short of the benchmark. The Fed expressed confidence in the economy’s progress and expects this positive trajectory to continue. Both sentiments helped to bolster the Fed’s expectation of three additional rate increases during 2017.
Meanwhile, the Bank of England continued its quantitative-easing program and lowered the official bank rate to 0.25% in August 2016. The Bank of Japan maintained its negative interest rate put in place earlier in the year, and in September announced an interest rate target for 10-year government bonds—keeping the yield at zero—as it struggles to accelerate economic growth. In December, the European Central Bank announced that it will extend its quantitative-easing program and continue purchasing large amounts of eurozone corporate and government debt each month through December 2017.
U.S. economic data released during the fourth quarter showed that U.S. real gross domestic product increased at an annual 3.5% rate in the third quarter, the largest increase since mid-2014. Business investment by U.S. companies was mixed, with a 12.0% increase in structures and 4.5% decrease in equipment over the prior quarter on an annualized basis. Consumer confidence hit pre-recession levels for the first time in November, and increased again in December. The dollar strengthened during the quarter’s post-election period.
Supply and demand trends reflected volatility of municipals.
Demand for municipal debt, as measured by cash flows to municipal bond mutual funds, was negative for the reporting period. There were $19 billion of inflows from July through October, but a sharp reversal occurred post-election, with $26 billion of redemptions in the last two months of the year. This followed a
| 1 | The Bloomberg Barclays Municipal Bond Index (formerly known as Barclays Municipal Bond Index) is an unmanaged index composed of long-term tax-exempt bonds with a minimum credit rating of Baa. You cannot invest directly in an index. |
| | | | | | |
| Letter to shareholders (unaudited) | | Wells Fargo Intermediate Tax/AMT-Free Fund | | | 3 | |
noteworthy 54 consecutive weeks of inflows. On the supply side, August through October saw 30-year record-breaking volumes each month; both refundings and new issuance were up. These levels were attributed to deals pulled forward in anticipation of higher interest rates. Not surprisingly, December volume was down 25% year-over-year to $19 billion. Total municipal bond issuance for the period was $219 billion; new issuance outpaced refundings by $18 billion.
Municipal credit fundamentals were solid.
Overall, municipal credit was sound for the period. The most significant development was the election of Ricardo Rossello as governor of the Commonwealth of Puerto Rico. In the past, prices of Puerto Rico bonds reflected negative credit considerations, including defaults on its securities in 2015 and early 2016, but recent events point to a potentially more positive fiscal environment. Rossello campaigned, in part, on a platform that included promises to ultimately pay 100% of interest due on Puerto Rico’s outstanding municipal debt, negotiate with bondholders, and ration government expenditures. This stance is a major shift from his predecessor who focused on a bankruptcy mechanism.
Since the end of the financial crisis, structural changes in the fixed-income markets have reduced trading liquidity (the degree to which assets can be bought or sold without affecting the price). New regulations and capital requirements have caused traditional liquidity suppliers (banks and broker/dealers) to be more risk averse and hold less inventory. Meanwhile, corporate debt issuance has spiked as companies finance themselves at record-low yields, bond mutual funds hold larger amounts of this new debt supply, trading volumes are lower, and large-size trades are more difficult to execute. However, fixed-income markets appeared to function well over the past year with sufficient liquidity.
Don’t let short-term uncertainty derail long-term investment goals.
Periods of uncertainty can present challenges, but experience has taught us that maintaining long-term investment goals can be an effective way to plan for the future. To help you create a sound strategy based on your personal goals and risk tolerance, Wells Fargo Funds offers more than 100 mutual funds spanning a wide range of asset classes and investment styles. Although diversification cannot guarantee an investment profit or prevent losses, we believe it can be an effective way to manage investment risk and potentially smooth out overall portfolio performance. We encourage investors to know their investments and to understand that appropriate levels of risk-taking may unlock opportunities.
Thank you for choosing to invest in Wells Fargo Funds. We appreciate your confidence in us and remain committed to helping you meet your financial needs.
Sincerely,

Andrew Owen
President
Wells Fargo Funds
Periods of uncertainty can present challenges, but experience has taught us that maintaining long-term investment goals can be an effective way to plan for the future.
For further information about your Fund, contact your investment professional, visit our website at wellsfargofunds.com, or call us directly at 1-800-222-8222. We are available 24 hours a day, 7 days a week.
| | | | |
| 4 | | Wells Fargo Intermediate Tax/AMT-Free Fund | | Performance highlights (unaudited) |
Investment objective
The Fund seeks current income exempt from federal income tax.
Manager
Wells Fargo Funds Management, LLC
Subadviser
Wells Capital Management Incorporated
Portfolio managers
Lyle J. Fitterer, CFA®, CPA
Robert J. Miller
Average annual total returns (%) as of December 31, 20161
| | | | | | | | | | | | | | | | | | | | | | | | | | | | | | | | | | |
| | | | | Including sales charge | | | Excluding sales charge | | | Expense ratios2 (%) | |
| | | Inception date | | 1 year | | | 5 year | | | 10 year | | | 1 year | | | 5 year | | | 10 year | | | Gross | | | Net3 | |
| Class A (WFTAX) | | 7-31-2007 | | | (3.90 | ) | | | 1.95 | | | | 3.43 | | | | (0.93 | ) | | | 2.58 | | | | 3.74 | | | | 0.80 | | | | 0.70 | |
| Class C (WFTFX) | | 7-31-2007 | | | (2.67 | ) | | | 1.81 | | | | 2.97 | | | | (1.67 | ) | | | 1.81 | | | | 2.97 | | | | 1.55 | | | | 1.45 | |
| Administrator Class (WFITX) | | 3-31-2008 | | | – | | | | – | | | | – | | | | (0.83 | ) | | | 2.70 | | | | 3.84 | | | | 0.74 | | | | 0.60 | |
| Institutional Class (WITIX) | | 3-31-2008 | | | – | | | | – | | | | – | | | | (0.76 | ) | | | 2.86 | | | | 4.00 | | | | 0.47 | | | | 0.45 | |
| Bloomberg Barclays Municipal Bond 1-15 Year Blend Index4 | | – | | | – | | | | – | | | | – | | | | 0.01 | | | | 2.54 | | | | 4.00 | | | | – | | | | – | |
Figures quoted represent past performance, which is no guarantee of future results, and do not reflect taxes that a shareholder may pay on fund distributions or the redemption of fund shares. Investment return and principal value of an investment will fluctuate so that an investor’s shares, when redeemed, may be worth more or less than their original cost. Performance shown without sales charges would be lower if sales charges were reflected. Current performance may be lower or higher than the performance data quoted, which assumes the reinvestment of dividends and capital gains. Current month-end performance is available on the Fund’s website, wellsfargofunds.com.
Index returns do not include transaction costs associated with buying and selling securities, any mutual fund fees or expenses, or any taxes. It is not possible to invest directly in an index.
For Class A shares, the maximum front-end sales charge is 3.00%. For Class C shares, the maximum contingent deferred sales charge is 1.00%. Performance including a contingent deferred sales charge assumes the sales charge for the corresponding time period. Administrator Class and Institutional Class shares are sold without a front-end sales charge or contingent deferred sales charge.
Bond values fluctuate in response to the financial condition of individual issuers, general market and economic conditions, and changes in interest rates. Changes in market conditions and government policies may lead to periods of heightened volatility in the bond market and reduced liquidity for certain bonds held by the Fund. In general, when interest rates rise, bond values fall and investors may lose principal value. Interest-rate changes and their impact on the Fund and its share price can be sudden and unpredictable. High-yield securities have a greater risk of default and tend to be more volatile than higher-rated debt securities. The use of derivatives may reduce returns and/or increase volatility. Certain investment strategies tend to increase the total risk of an investment (relative to the broader market). The Fund is exposed to municipal securities risk. Consult the Fund’s prospectus for additional information on these and other risks. A portion of the Fund’s income may be subject to federal, state, and/or local income taxes or the Alternative Minimum Tax (AMT). Any capital gains distributions may be taxable.
Please see footnotes on page 5.
| | | | | | |
| Performance highlights (unaudited) | | Wells Fargo Intermediate Tax/AMT-Free Fund | | | 5 | |
|
| Effective maturity distribution as of December 31, 20165 |
|
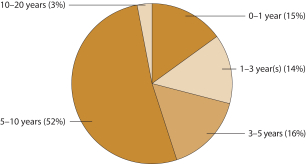
|
|
| Credit quality as of December 31, 20166 |
|
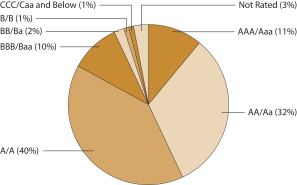 |
| 1 | Historical performance shown for Class A shares prior to their inception reflects the performance of the former Investor Class shares, and includes the higher expenses applicable to the former Investor Class shares (except during those periods in which expenses of Class A shares would have been higher than those of the former Investor Class shares, no such adjustment is reflected). Historical performance shown for Class C shares prior to their inception reflects the performance of the former Investor Class shares, adjusted to reflect the higher expenses applicable to Class C shares. Historical performance shown for the Administrator Class shares prior to their inception reflects the performance of the former Investor Class shares, and includes the higher expenses applicable to the Investor Class shares. Historical performance shown for the Institutional Class shares prior to their inception reflects the performance of the former Investor Class shares, and includes the higher expenses applicable to the Investor Class shares. If these expenses had not been included, returns would be higher. |
| 2 | Reflects the expense ratios as stated in the most recent prospectuses. The expense ratios shown are subject to change and may differ from the annualized expense ratios shown in the financial highlights of this report. |
| 3 | The manager has contractually committed through October 31, 2017, to waive fees and/or reimburse expenses to the extent necessary to cap the Fund’s Total Annual Fund Operating Expenses After Fee Waiver at the amount shown. After this time, the cap may be increased or the commitment to maintain the cap may be terminated only with the approval of the Board of Trustees. Brokerage commissions, stamp duty fees, interest, taxes, acquired fund fees and expenses, and extraordinary expenses are excluded from the expense cap. Without this cap, the Fund’s returns would have been lower. |
| 4 | The Bloomberg Barclays Municipal Bond 1–15 Year Blend Index (formerly known as Barclays Municipal Bond 1–15 Year Blend Index) is the 1–15 Year Blend component of the Bloomberg Barclays Municipal Bond Index (formerly known as Barclays Municipal Bond Index). The Bloomberg Barclays Municipal Bond Index is an unmanaged index composed of tax-exempt bonds with maturities between six and eight years and a minimum credit rating of Baa. You cannot invest directly in an index. |
| 5 | Amounts are calculated based on the total investments of the Fund. These amounts are subject to change and may have changed since the date specified. |
| 6 | The credit quality distribution of portfolio holdings reflected in the chart is based on ratings from Standard & Poor’s, Moody’s Investors Service, and/ or Fitch Ratings Ltd. Credit quality ratings apply to the underlying holdings of the Fund and not to the Fund itself. The percentages of the Fund’s portfolio with the ratings depicted in the chart are calculated based on the total market value of fixed income securities held by the Fund. If a security was rated by all three rating agencies, the middle rating was utilized. If rated by two of three rating agencies, the lower rating was utilized, and if rated by one of the rating agencies, that rating was utilized. Standard & Poor’s rates the creditworthiness of bonds, ranging from AAA (highest) to D (lowest). Ratings from A to CCC may be modified by the addition of a plus (+) or minus (-) sign to show relative standing within the rating categories. Standard & Poor’s rates the creditworthiness of short-term notes from SP-1 (highest) to SP-3 (lowest). Moody’s rates the creditworthiness of bonds, ranging from Aaa (highest) to C (lowest). Ratings Aa to B may be modified by the addition of a number 1 (highest) to 3 (lowest) to show relative standing within the ratings categories. Moody’s rates the creditworthiness of short-term U.S. tax-exempt municipal securities from MIG 1/VMIG 1 (highest) to SG (lowest). Fitch rates the creditworthiness of bonds, ranging from AAA (highest) to D (lowest). Credit quality distribution is subject to change and may have changed since the date specified. |
| | | | |
| 6 | | Wells Fargo Intermediate Tax/AMT-Free Fund | | Fund expenses (unaudited) |
As a shareholder of the Fund, you incur two types of costs: (1) transaction costs, including sales charges (loads) on purchase payments and contingent deferred sales charges (if any) on redemptions and (2) ongoing costs, including management fees, distribution (12b-1) and/or shareholder servicing fees, and other Fund expenses. This example is intended to help you understand your ongoing costs (in dollars) of investing in the Fund and to compare these costs with the ongoing costs of investing in other mutual funds.
The example is based on an investment of $1,000 invested at the beginning of the six-month period and held for the entire period from July 1, 2016 to December 31, 2016.
Actual expenses
The “Actual” line of the table below provides information about actual account values and actual expenses. You may use the information in this line, together with the amount you invested, to estimate the expenses that you paid over the period. Simply divide your account value by $1,000 (for example, an $8,600 account value divided by $1,000 = 8.6), then multiply the result by the number in the “Actual” line under the heading entitled “Expenses paid during period” for your applicable class of shares to estimate the expenses you paid on your account during this period.
Hypothetical example for comparison purposes
The “Hypothetical” line of the table below provides information about hypothetical account values and hypothetical expenses based on the Fund’s actual expense ratio and an assumed rate of return of 5% per year before expenses, which is not the Fund’s actual return. The hypothetical account values and expenses may not be used to estimate the actual ending account balance or expenses you paid for the period. You may use this information to compare the ongoing costs of investing in the Fund and other funds. To do so, compare this 5% hypothetical example with the 5% hypothetical examples that appear in the shareholder reports of the other funds.
Please note that the expenses shown in the table are meant to highlight your ongoing costs only and do not reflect any transactional costs, such as sales charges (loads) and contingent deferred sales charges. Therefore, the “Hypothetical” line of the table is useful in comparing ongoing costs only and will not help you determine the relative total costs of owning different funds. In addition, if these transactional costs were included, your costs would have been higher.
| | | | | | | | | | | | | | | | |
| | | Beginning
account value
7-1-2016 | | | Ending
account value
12-31-2016 | | | Expenses
paid during
the period¹ | | | Annualized net
expense ratio | |
Class A | | | | | | | | | | | | | | | | |
Actual | | $ | 1,000.00 | | | $ | 960.09 | | | $ | 3.45 | | | | 0.70 | % |
Hypothetical (5% return before expenses) | | $ | 1,000.00 | | | $ | 1,021.62 | | | $ | 3.56 | | | | 0.70 | % |
Class��C | | | | | | | | | | | | | | | | |
Actual | | $ | 1,000.00 | | | $ | 956.47 | | | $ | 7.13 | | | | 1.45 | % |
Hypothetical (5% return before expenses) | | $ | 1,000.00 | | | $ | 1,017.85 | | | $ | 7.35 | | | | 1.45 | % |
Administrator Class | | | | | | | | | | | | | | | | |
Actual | | $ | 1,000.00 | | | $ | 960.61 | | | $ | 2.96 | | | | 0.60 | % |
Hypothetical (5% return before expenses) | | $ | 1,000.00 | | | $ | 1,022.12 | | | $ | 3.05 | | | | 0.60 | % |
Institutional Class | | | | | | | | | | | | | | | | |
Actual | | $ | 1,000.00 | | | $ | 960.55 | | | $ | 2.22 | | | | 0.45 | % |
Hypothetical (5% return before expenses) | | $ | 1,000.00 | | | $ | 1,022.87 | | | $ | 2.29 | | | | 0.45 | % |
| 1 | Expenses paid is equal to the annualized net expense ratio of each class multiplied by the average account value over the period, multiplied by the number of days in the most recent fiscal half-year divided by the number of days in the fiscal year (to reflect the one-half-year period). |
| | | | | | |
| Summary portfolio of investments—December 31, 2016 (unaudited) | | Wells Fargo Intermediate Tax/AMT-Free Fund | | | 7 | |
The Summary portfolio of investments shows the 50 largest portfolio holdings in unaffiliated issuers and any holdings exceeding 1% of the total net assets as of the report date. The remaining securities held are grouped as “Other securities” in each category.
| | | | | | | | | | | | | | | | | | | | |
| Security name | | Interest rate | | | Maturity date | | | Principal | | | Value | | | Percent of
net assets | |
|
Municipal Obligations: 98.80% | |
|
| Alabama: 0.26% | |
Other securities | | | $ | 6,199,552 | | | | 0.26 | % |
| | | | | | | | | | | | | | | | | | | | |
|
| Alaska: 0.18% | |
Other securities | | | | 4,421,604 | | | | 0.18 | |
| | | | | | | | | | | | | | | | | | | | |
|
| Arizona: 1.68% | |
Other securities | | | | 40,107,763 | | | | 1.68 | |
| | | | | | | | | | | | | | | | | | | | |
|
| California: 9.19% | |
Bay Area CA Toll Authority Toll Bridge Series A (Transportation Revenue) ± | | | 1.97 | % | | | 4-1-2036 | | | $ | 9,810,000 | | | | 9,847,474 | | | | 0.41 | |
California Public Works University of California Board of Regents Series G (Miscellaneous Revenue) | | | 5.00 | | | | 12-1-2030 | | | | 12,110,000 | | | | 13,871,036 | | | | 0.58 | |
California Various Purposes (GO Revenue) | | | 6.00 | | | | 4-1-2038 | | | | 8,055,000 | | | | 8,791,871 | | | | 0.37 | |
Northern California Gas Authority #1 LIBOR Series B (Utilities Revenue) ± | | | 1.29 | | | | 7-1-2027 | | | | 10,000,000 | | | | 8,901,900 | | | | 0.37 | |
San Jose CA MFHR Casa Del Pueblo Apartments Project Series D (Housing Revenue) ±## | | | 0.95 | | | | 12-1-2017 | | | | 10,000,000 | | | | 9,987,900 | | | | 0.42 | |
University of California Limited Project Series G (Education Revenue) | | | 5.00 | | | | 5-15-2037 | | | | 10,390,000 | | | | 11,694,465 | | | | 0.49 | |
University of California Medical Center Series J (Health Revenue) | | | 5.25 | | | | 5-15-2030 | | | | 15,000,000 | | | | 17,397,300 | | | | 0.73 | |
Other securities | | | | | | | | | | | | | | | 139,504,042 | | | | 5.82 | |
| | |
| | | | 219,995,988 | | | | 9.19 | |
| | | | | | | | | | | | | | | | | | | | |
|
| Colorado: 0.69% | |
Other securities | | | | 16,581,640 | | | | 0.69 | |
| | | | | | | | | | | | | | | | | | | | |
|
| Connecticut: 3.02% | |
Connecticut HEFAR Yale University Issue Series A (Education Revenue) ± | | | 1.00 | | | | 7-1-2042 | | | | 25,000,000 | | | | 24,530,750 | | | | 1.02 | |
Connecticut HEFAR Yale University Issue Series A (Education Revenue) ± | | | 1.38 | | | | 7-1-2035 | | | | 10,000,000 | | | | 9,975,600 | | | | 0.42 | |
Other securities | | | | 37,811,669 | | | | 1.58 | |
| | |
| | | | 72,318,019 | | | | 3.02 | |
| | | | | | | | | | | | | | | | | | | | |
|
| Delaware: 0.08% | |
Other securities | | | | 1,985,080 | | | | 0.08 | |
| | | | | | | | | | | | | | | | | | | | |
|
| District of Columbia: 0.59% | |
Other securities | | | | 14,086,161 | | | | 0.59 | |
| | | | | | | | | | | | | | | | | | | | |
|
| Florida: 5.24% | |
Miami-Dade County FL School Board Certificate of Participation Series 4 (Miscellaneous Revenue, Dexia Credit Local LOC, Dexia Credit Local LIQ) 144Aø | | | 1.27 | | | | 9-25-2024 | | | | 11,960,000 | | | | 11,960,000 | | | | 0.50 | |
The accompanying notes are an integral part of these financial statements.
| | | | |
| 8 | | Wells Fargo Intermediate Tax/AMT-Free Fund | | Summary portfolio of investments—December 31, 2016 (unaudited) |
| | | | | | | | | | | | | | | | | | | | |
| Security name | | Interest rate | | | Maturity date | | | Principal | | | Value | | | Percent of
net assets | |
|
| Florida (continued) | |
Miami-Dade County FL School Board Certificate of Participation Series 5 (Miscellaneous Revenue, Dexia Credit Local LOC, FGIC Insured, Dexia Credit Local LIQ) 144Aø | | | 1.11 | % | | | 5-1-2037 | | | $ | 18,235,000 | | | $ | 18,235,000 | | | | 0.76 | % |
Other securities | | | | 95,145,374 | | | | 3.98 | |
| | |
| | | | 125,340,374 | | | | 5.24 | |
| | | | | | | | | | | | | | | | | | | | |
| | | | | |
| Georgia: 1.48% | | | | | | | | | | | | | | | | | | | | |
Georgia Series F (Miscellaneous Revenue) | | | 5.00 | | | | 7-1-2026 | | | | 10,000,000 | | | | 12,317,100 | | | | 0.51 | |
Other securities | | | | | | | | | | | | | | | 23,095,848 | | | | 0.97 | |
| | | | | |
| | | | | | | | | | | | | | | 35,412,948 | | | | 1.48 | |
| | | | | | | | | | | | | | | | | | | | |
| | | | | |
| Guam: 0.35% | | | | | | | | | | | | | | | | | | | | |
Other securities | | | | | | | | | | | | | | | 8,473,194 | | | | 0.35 | |
| | | | | | | | | | | | | | | | | | | | |
| | | | | |
| Illinois: 15.88% | | | | | | | | | | | | | | | | | | | | |
Chicago IL Board of Education (GO Revenue) µ | | | 0.00-5.25 | | | | 12-1-2020 to 12-1-2029 | | | | 34,170,000 | | | | 29,662,636 | | | | 1.23 | |
Chicago IL Board of Education Series A3 (GO Revenue) ± | | | 1.55 | | | | 3-1-2036 | | | | 10,000,000 | | | | 9,437,700 | | | | 0.39 | |
Chicago IL O’Hare International Airport Senior Lien (Airport Revenue) | | | 5.25 | | | | 1-1-2032 | | | | 8,755,000 | | | | 9,697,914 | | | | 0.41 | |
Chicago IL O’Hare International Airport Senior Lien Series B (Airport Revenue) | | | 5.00 | | | | 1-1-2030 | | | | 8,000,000 | | | | 8,931,840 | | | | 0.37 | |
Chicago IL Second Lien Series A (Water & Sewer Revenue, Ambac Insured) | | | 5.00 | | | | 11-1-2032 | | | | 10,000,000 | | | | 10,025,400 | | | | 0.42 | |
Chicago IL (GO Revenue) µ | | | 0.00-5.25 | | | | 1-1-2019 to 1-1-2037 | | | | 32,310,000 | | | | 31,404,514 | | | | 1.30 | |
Chicago IL Series G (GO Revenue, Ambac Insured) | | | 5.00 | | | | 12-1-2024 | | | | 16,865,000 | | | | 16,913,374 | | | | 0.71 | |
Cook County IL Series A (GO Revenue) | | | 5.25 | | | | 11-15-2022 | | | | 7,240,000 | | | | 7,915,058 | | | | 0.33 | |
Cook County IL Series A (GO Revenue) | | | 5.25 | | | | 11-15-2023 | | | | 7,680,000 | | | | 8,361,062 | | | | 0.35 | |
Illinois (Various Revenue) µ | | | 4.75-5.50 | | | | 4-1-2020 to 7-1-2026 | | | | 18,400,000 | | | | 19,151,509 | | | | 0.80 | |
Illinois (Tax Revenue) | | | 5.00 | | | | 6-15-2023 | | | | 16,050,000 | | | | 18,240,023 | | | | 0.76 | |
Illinois Regional Transportation Authority (Tax Revenue, National Insured) | | | 6.50 | | | | 7-1-2026 | | | | 7,815,000 | | | | 9,996,088 | | | | 0.42 | |
Illinois Series A (Tax Revenue) | | | 5.00 | | | | 1-1-2027 | | | | 10,625,000 | | | | 10,676,319 | | | | 0.45 | |
Will County IL Community Unified School District CAB (GO Revenue, National Insured) ¤ | | | 0.00 | | | | 11-1-2018 | | | | 9,730,000 | | | | 9,363,179 | | | | 0.39 | |
Other securities | | | | | | | | | | | | | | | 180,240,460 | | | | 7.55 | |
| | | | | |
| | | | | | | | | | | | | | | 380,017,076 | | | | 15.88 | |
| | | | | | | | | | | | | | | | | | | | |
| | | | | |
| Indiana: 1.63% | | | | | | | | | | | | | | | | | | | | |
Other securities | | | | | | | | | | | | | | | 38,886,132 | | | | 1.63 | |
| | | | | | | | | | | | | | | | | | | | |
| | | | | |
| Iowa: 0.89% | | | | | | | | | | | | | | | | | | | | |
Other securities | | | | | | | | | | | | | | | 21,281,509 | | | | 0.89 | |
| | | | | | | | | | | | | | | | | | | | |
| | | | | |
| Kansas: 0.24% | | | | | | | | | | | | | | | | | | | | |
Other securities | | | | | | | | | | | | | | | 5,753,967 | | | | 0.24 | |
| | | | | | | | | | | | | | | | | | | | |
| | | | | |
| Kentucky: 0.50% | | | | | | | | | | | | | | | | | | | | |
Other securities | | | | | | | | | | | | | | | 11,951,210 | | | | 0.50 | |
| | | | | | | | | | | | | | | | | | | | |
The accompanying notes are an integral part of these financial statements.
| | | | | | |
| Summary portfolio of investments—December 31, 2016 (unaudited) | | Wells Fargo Intermediate Tax/AMT-Free Fund | | | 9 | |
| | | | | | | | | | | | | | | | | | | | |
| Security name | | Interest rate | | | Maturity date | | | Principal | | | Value | | | Percent of
net assets | |
| | | | | |
| Louisiana: 0.92% | | | | | | | | | | | | | | | | | | | | |
Other securities | | | | | | | | | | | | | | $ | 21,911,600 | | | | 0.92 | % |
| | | | | | | | | | | | | | | | | | | | |
| | | | | |
| Maryland: 1.80% | | | | | | | | | | | | | | | | | | | | |
Maryland Series B (GO Revenue) | | | 4.00 | % | | | 8-1-2024 | | | $ | 15,000,000 | | | | 16,929,900 | | | | 0.71 | |
Other securities | | | | | | | | | | | | | | | 26,168,497 | | | | 1.09 | |
| | | | | |
| | | | | | | | | | | | | | | 43,098,397 | | | | 1.80 | |
| | | | | | | | | | | | | | | | | | | | |
| | | | | |
| Massachusetts: 3.05% | | | | | | | | | | | | | | | | | | | | |
Massachusetts Consolidate Loan Series D (GO Revenue) | | | 5.00 | | | | 9-1-2028 | | | | 10,000,000 | | | | 11,880,100 | | | | 0.50 | |
Massachusetts Consolidated Loan Series D-1 (Miscellaneous Revenue) ± | | | 1.05 | | | | 8-1-2043 | | | | 10,000,000 | | | | 9,678,500 | | | | 0.40 | |
Massachusetts HEFA Various Partners Healthcare Series G-6 (Health Revenue) ± | | | 1.60 | | | | 7-1-2038 | | | | 14,000,000 | | | | 13,999,860 | | | | 0.58 | |
Massachusetts Housing Finance Agency Multifamily Conduit Wood Ridge Homes Project Series A (Housing Revenue) ± | | | 1.05 | | | | 12-1-2017 | | | | 9,000,000 | | | | 8,992,980 | | | | 0.37 | |
Other securities | | | | | | | | | | | | | | | 28,491,441 | | | | 1.20 | |
| | | | | |
| | | | | | | | | | | | | | | 73,042,881 | | | | 3.05 | |
| | | | | | | | | | | | | | | | | | | | |
| | | | | |
| Michigan: 4.05% | | | | | | | | | | | | | | | | | | | | |
Michigan Finance Authority Local Government Loan Program Series D (Water & Sewer Revenue) | | | 5.00 | | | | 7-1-2030 | | | | 12,000,000 | | | | 13,312,320 | | | | 0.56 | |
Michigan Strategic Fund Limited Obligation Events Center Project Series A (Tax Revenue) ± | | | 4.13 | | | | 7-1-2045 | | | | 11,500,000 | | | | 11,643,750 | | | | 0.49 | |
Other securities | | | | | | | | | | | | | | | 72,059,415 | | | | 3.00 | |
| | | | | |
| | | | | | | | | | | | | | | 97,015,485 | | | | 4.05 | |
| | | | | | | | | | | | | | | | | | | | |
| | | | | |
| Minnesota: 0.31% | | | | | | | | | | | | | | | | | | | | |
Other securities | | | | | | | | | | | | | | | 7,415,458 | | | | 0.31 | |
| | | | | | | | | | | | | | | | | | | | |
| | | | | |
| Mississippi: 0.82% | | | | | | | | | | | | | | | | | | | | |
Mississippi Development Bank Special Obligation Jackson Water & Sewer System Project Series A (Water & Sewer Revenue, AGM Insured) | | | 5.00 | | | | 9-1-2030 | | | | 10,000,000 | | | | 11,190,000 | | | | 0.47 | |
Other securities | | | | | | | | | | | | | | | 8,329,146 | | | | 0.35 | |
| | | | | |
| | | | | | | | | | | | | | | 19,519,146 | | | | 0.82 | |
| | | | | | | | | | | | | | | | | | | | |
| | | | | |
| Missouri: 0.30% | | | | | | | | | | | | | | | | | | | | |
Other securities | | | | | | | | | | | | | | | 7,069,140 | | | | 0.30 | |
| | | | | | | | | | | | | | | | | | | | |
| | | | | |
| Nebraska: 0.13% | | | | | | | | | | | | | | | | | | | | |
Other securities | | | | | | | | | | | | | | | 3,050,730 | | | | 0.13 | |
| | | | | | | | | | | | | | | | | | | | |
| | | | | |
| Nevada: 1.43% | | | | | | | | | | | | | | | | | | | | |
Other securities | | | | | | | | | | | | | | | 34,258,910 | | | | 1.43 | |
| | | | | | | | | | | | | | | | | | | | |
| | | | | |
| New Hampshire: 0.07% | | | | | | | | | | | | | | | | | | | | |
Other securities | | | | | | | | | | | | | | | 1,661,633 | | | | 0.07 | |
| | | | | | | | | | | | | | | | | | | | |
The accompanying notes are an integral part of these financial statements.
| | | | |
| 10 | | Wells Fargo Intermediate Tax/AMT-Free Fund | | Summary portfolio of investments—December 31, 2016 (unaudited) |
| | | | | | | | | | | | | | | | | | | | |
| Security name | | Interest rate | | | Maturity date | | | Principal | | | Value | | | Percent of
net assets | |
| | | | | |
| New Jersey: 4.70% | | | | | | | | | | | | | | | | | | | | |
New Jersey EDA School Facilities Construction Refunding Bond Series NN (Miscellaneous Revenue) | | | 5.00 | % | | | 3-1-2021 | | | $ | 15,035,000 | | | $ | 15,924,771 | | | | 0.67 | % |
New Jersey EDA School Facilities Construction Refunding Bond Series PP (Miscellaneous Revenue) | | | 5.00 | | | | 6-15-2026 | | | | 8,380,000 | | | | 8,664,333 | | | | 0.36 | |
New Jersey HEFAR Student Assistance Authority Series A (Education Revenue) | | | 5.00 | | | | 6-1-2019 | | | | 9,860,000 | | | | 10,503,168 | | | | 0.44 | |
New Jersey TTFA Series DC8033 (Transportation Revenue, Dexia Credit Local LOC, AGM Insured, Dexia Credit Local LIQ) 144Aø | | | 0.84 | | | | 12-15-2022 | | | | 19,775,000 | | | | 19,775,000 | | | | 0.83 | |
Other securities | | | | | | | | | | | | | | | 57,515,096 | | | | 2.40 | |
| | | | | |
| | | | | | | | | | | | | | | 112,382,368 | | | | 4.70 | |
| | | | | | | | | | | | | | | | | | | | |
| | | | | |
| New Mexico: 0.76% | | | | | | | | | | | | | | | | | | | | |
Clayton NM Jail Project Improvement & Refunding Bonds (Miscellaneous Revenue, National Insured) | | | 5.00 | | | | 11-1-2028 | | | | 9,265,000 | | | | 10,364,014 | | | | 0.43 | |
Other securities | | | | | | | | | | | | | | | 7,770,820 | | | | 0.33 | |
| | | | | |
| | | | | | | | | | | | | | | 18,134,834 | | | | 0.76 | |
| | | | | | | | | | | | | | | | | | | | |
| | | | | |
| New York: 8.37% | | | | | | | | | | | | | | | | | | | | |
Metropolitan Transportation Authority New York (Transportation Revenue) µ | | | 5.00-5.25 | | | | 11-15-2025 to 11-15-2031 | | | | 20,450,000 | | | | 23,656,551 | | | | 0.99 | |
Metropolitan Transportation Authority New York Series C (Transportation Revenue) | | | 5.25 | | | | 11-15-2029 | | | | 11,100,000 | | | | 13,047,162 | | | | 0.55 | |
Metropolitan Transportation Authority New York Series C (Transportation Revenue) | | | 5.25 | | | | 11-15-2030 | | | | 8,350,000 | | | | 9,789,874 | | | | 0.41 | |
New York Convention Center Development Corporation (Tax Revenue) | | | 5.00 | | | | 11-15-2028 | | | | 8,000,000 | | | | 9,312,000 | | | | 0.39 | |
New York NY Series J-4 (GO Revenue) ± | | | 1.27 | | | | 8-1-2025 | | | | 10,000,000 | | | | 10,003,600 | | | | 0.42 | |
New York Urban Development Corporation Certificate of Participation James A Farley Post Office Project (Miscellaneous Revenue) 144A## | | | 4.20 | | | | 2-1-2017 | | | | 14,910,000 | | | | 14,904,036 | | | | 0.62 | |
Other securities | | | | | | | | | | | | | | | 119,501,409 | | | | 4.99 | |
| | | | | |
| | | | | | | | | | | | | | | 200,214,632 | | | | 8.37 | |
| | | | | | | | | | | | | | | | | | | | |
| | | | | |
| North Carolina: 0.64% | | | | | | | | | | | | | | | | | | | | |
Other securities | | | | | | | | | �� | | | | | | 15,389,538 | | | | 0.64 | |
| | | | | | | | | | | | | | | | | | | | |
| | | | | |
| North Dakota: 0.23% | | | | | | | | | | | | | | | | | | | | |
Other securities | | | | | | | | | | | | | | | 5,614,352 | | | | 0.23 | |
| | | | | | | | | | | | | | | | | | | | |
| | | | | |
| Ohio: 1.54% | | | | | | | | | | | | | | | | | | | | |
Other securities | | | | | | | | | | | | | | | 36,969,878 | | | | 1.54 | |
| | | | | | | | | | | | | | | | | | | | |
| | | | | |
| Oklahoma: 2.01% | | | | | | | | | | | | | | | | | | | | |
Other securities | | | | | | | | | | | | | | | 48,150,564 | | | | 2.01 | |
| | | | | | | | | | | | | | | | | | | | |
The accompanying notes are an integral part of these financial statements.
| | | | | | |
| Summary portfolio of investments—December 31, 2016 (unaudited) | | Wells Fargo Intermediate Tax/AMT-Free Fund | | | 11 | |
| | | | | | | | | | | | | | | | | | | | |
| Security name | | Interest rate | | | Maturity date | | | Principal | | | Value | | | Percent of
net assets | |
| | | | | |
| Oregon: 0.38% | | | | | | | | | | | | | | | | | | | | |
Other securities | | | | | | | | | | | | | | $ | 9,120,446 | | | | 0.38 | % |
| | | | | | | | | | | | | | | | | | | | |
| | | | | |
| Pennsylvania: 8.77% | | | | | | | | | | | | | | | | | | | | |
Berks County PA Municipal Authority Reading Hospital & Medical Center Project Series B (Health Revenue) | | | 2.22 | % | | | 11-1-2039 | | | $ | 10,000,000 | | | | 10,077,500 | | | | 0.42 | |
Philadelphia PA School District Refunding Bond Series C (GO Revenue) | | | 5.00 | | | | 9-1-2018 | | | | 8,065,000 | | | | 8,426,554 | | | | 0.35 | |
Philadelphia PA School District Refunding Bond (GO Revenue) µ | | | 5.00-5.25 | | | | 9-1-2021 to 9-1-2032 | | | | 19,680,000 | | | | 21,509,484 | | | | 0.91 | |
Philadelphia PA Series A (GO Revenue) | | | 5.00 | | | | 9-15-2021 | | | | 7,000,000 | | | | 7,874,160 | | | | 0.33 | |
Other securities | | | | | | | | | | | | | | | 161,843,530 | | | | 6.76 | |
| | | | | |
| | | | | | | | | | | | | | | 209,731,228 | | | | 8.77 | |
| | | | | | | | | | | | | | | | | | | | |
| | | | | |
| Rhode Island: 0.19% | | | | | | | | | | | | | | | | | | | | |
Other securities | | | | | | | | | | | | | | | 4,626,925 | | | | 0.19 | |
| | | | | | | | | | | | | | | | | | | | |
| | | | | |
| South Carolina: 1.43% | | | | | | | | | | | | | | | | | | | | |
South Carolina Public Service Authority Series A (Utilities Revenue) | | | 5.00 | | | | 12-1-2037 | | | | 12,215,000 | | | | 13,611,907 | | | | 0.57 | |
Other securities | | | | 20,538,252 | | | | 0.86 | |
| | |
| | | | 34,150,159 | | | | 1.43 | |
| | | | | | | | | | | | | | | | | | | | |
|
| South Dakota: 0.04% | |
Other securities | | | | 993,674 | | | | 0.04 | |
| | | | | | | | | | | | | | | | | | | | |
|
| Tennessee: 0.29% | |
Other securities | | | | 6,828,729 | | | | 0.29 | |
| | | | | | | | | | | | | | | | | | | | |
|
| Texas: 8.92% | |
Central Texas Regional Mobility Authority Series B (Transportation Revenue) ± | | | 5.00 | | | | 1-1-2045 | | | | 8,000,000 | | | | 8,627,760 | | | | 0.36 | |
Cypress-Fairbanks TX Independent School District Series B-2 (GO Revenue) ± | | | 3.00 | | | | 2-15-2040 | | | | 11,010,000 | | | | 11,289,764 | | | | 0.47 | |
Harris County TX Tax Road Refunding Bond Series A (GO Revenue) | | | 5.00 | | | | 10-1-2025 | | | | 8,445,000 | | | | 9,989,591 | | | | 0.42 | |
Other securities | | | | 183,580,727 | | | | 7.67 | |
| | |
| | | | 213,487,842 | | | | 8.92 | |
| | | | | | | | | | | | | | | | | | | | |
|
| Utah: 0.17% | |
Other securities | | | | 4,180,515 | | | | 0.17 | |
| | | | | | | | | | | | | | | | | | | | |
|
| Virgin Islands: 0.29% | |
Other securities | | | | 6,892,308 | | | | 0.29 | |
| | | | | | | | | | | | | | | | | | | | |
|
| Virginia: 1.06% | |
Virginia College Building Authority Educational Facilities Series A (Education Revenue) | | | 3.00 | | | | 9-1-2025 | | | | 13,630,000 | | | | 14,143,442 | | | | 0.59 | |
Other securities | | | | 11,110,287 | | | | 0.47 | |
| | |
| | | | 25,253,729 | | | | 1.06 | |
| | | | | | | | | | | | | | | | | | | | |
The accompanying notes are an integral part of these financial statements.
| | | | |
| 12 | | Wells Fargo Intermediate Tax/AMT-Free Fund | | Summary portfolio of investments—December 31, 2016 (unaudited) |
| | | | | | | | | | | | | | | | | | | | |
| Security name | | Interest rate | | | Maturity date | | | Principal | | | Value | | | Percent of
net assets | |
|
| Washington: 3.23% | |
Washington Various Purposes Refunding Bond Series B (GO Revenue) | | | 5.00 | % | | | 7-1-2028 | | | $ | 7,130,000 | | | $ | 8,454,825 | | | | 0.35 | % |
Other securities | | | | 68,770,768 | | | | 2.88 | |
| | |
| | | | 77,225,593 | | | | 3.23 | |
| | | | | | | | | | | | | | | | | | | | |
|
| West Virginia: 0.29% | |
Other securities | | | | 6,873,619 | | | | 0.29 | |
| | | | | | | | | | | | | | | | | | | | |
|
| Wisconsin: 0.71% | |
Other securities | | | | 16,928,892 | | | | 0.71 | |
| | | | | | | | | | | | | | | | | | | | |
| | |
Total Municipal Obligations (Cost $2,342,745,800) | | | | 2,364,005,422 | | | | 98.80 | |
| | | | | | | | | | | | | | | | | | | | |
| | |
| Total investments in securities (Cost $2,342,745,800) * | | | | 2,364,005,422 | | | | 98.80 | % |
Other assets and liabilities, net | | | | 28,748,493 | | | | 1.20 | |
| | | | | | | | | | | | | | | | | | | | |
| Total net assets | | | $ | 2,392,753,915 | | | | 100.00 | % |
| | | | | | | | | | | | | | | | | | | | |
| ± | Variable rate investment. The rate shown is the rate in effect at period end. |
| ## | All or a portion of this security is segregated for when-issued securities. |
| 144A | The security may be resold in transactions exempt from registration, normally to qualified institutional buyers, pursuant to Rule 144A under the Securities Act of 1933. |
| ø | Variable rate demand notes are subject to a demand feature which reduces the effective maturity. The maturity date shown represents the final maturity date of the security. The interest rate is determined and reset by the issuer daily, weekly, or monthly depending upon the terms of the security. The rate shown is the rate in effect at period end. |
| µ | All or some of these obligations have credit enhancements or liquidity features that may, under certain circumstances, provide for repayment of principal and interest. |
| * | Cost for federal income tax purposes is $2,342,808,131 and unrealized gains (losses) consists of: |
| | | | |
Gross unrealized gains | | $ | 62,212,521 | |
Gross unrealized losses | | | (41,015,230 | ) |
| | | | |
Net unrealized gains | | $ | 21,197,291 | |
The accompanying notes are an integral part of these financial statements.
| | | | | | |
| Statement of assets and liabilities—December 31, 2016 (unaudited) | | Wells Fargo Intermediate Tax/AMT-Free Fund | | | 13 | |
| | | | |
| | | | |
| |
Assets | | | | |
Investment in unaffiliated securities, at value (cost $2,342,745,800) | | $ | 2,364,005,422 | |
Cash | | | 2,141,412 | |
Receivable for investments sold | | | 8,966,151 | |
Receivable for Fund shares sold | | | 41,383,860 | |
Receivable for interest | | | 26,924,839 | |
Prepaid expenses and other assets | | | 101,028 | |
| | | | |
Total assets | | | 2,443,522,712 | |
| | | | |
| |
Liabilities | | | | |
Distributions payable | | | 1,711,492 | |
Payable for investments purchased | | | 25,696,661 | |
Payable for Fund shares redeemed | | | 22,069,106 | |
Management fee payable | | | 708,109 | |
Distribution fee payable | | | 34,409 | |
Administration fees payable | | | 224,796 | |
Accrued expenses and other liabilities | | | 324,224 | |
| | | | |
Total liabilities | | | 50,768,797 | |
| | | | |
Total net assets | | $ | 2,392,753,915 | |
| | | | |
| |
NET ASSETS CONSIST OF | | | | |
Paid-in capital | | $ | 2,378,214,676 | |
Overdistributed net investment income | | | (53,945 | ) |
Accumulated net realized losses on investments | | | (6,666,438 | ) |
Net unrealized gains on investments | | | 21,259,622 | |
| | | | |
Total net assets | | $ | 2,392,753,915 | |
| | | | |
| |
COMPUTATION OF NET ASSET VALUE AND OFFERING PRICE PER SHARE | | | | |
Net assets – Class A | | $ | 446,088,837 | |
Shares outstanding – Class A1 | | | 39,555,500 | |
Net asset value per share – Class A | | | $11.28 | |
Maximum offering price per share – Class A2 | | | $11.63 | |
Net assets – Class C | | $ | 50,165,934 | |
Shares outstanding – Class C1 | | | 4,448,328 | |
Net asset value per share – Class C | | | $11.28 | |
Net assets – Administrator Class | | $ | 378,293,250 | |
Shares outstanding – Administrator Class1 | | | 33,516,141 | |
Net asset value per share – Administrator Class | | | $11.29 | |
Net assets – Institutional Class | | $ | 1,518,205,894 | |
Shares outstanding – Institutional Class1 | | | 134,447,306 | |
Net asset value per share – Institutional Class | | | $11.29 | |
| 1 | The Fund has an unlimited number of authorized shares. |
| 2 | Maximum offering price is computed as 100/97.00 of net asset value. On investments of $50,000 or more, the offering price is reduced. |
The accompanying notes are an integral part of these financial statements.
| | | | |
| 14 | | Wells Fargo Intermediate Tax/AMT-Free Fund | | Statement of operations—six months ended December 31, 2016 (unaudited) |
| | | | |
| | | | |
| |
Investment income | | | | |
Interest | | $ | 38,851,860 | |
Income from affiliated securities | | | 4,275 | |
| | | | |
Total investment income | | | 38,856,135 | |
| | | | |
| |
Expenses | | | | |
Management fee | | | 4,873,536 | |
Administration fees | |
Class A | | | 424,130 | |
Class C | | | 44,469 | |
Administrator Class | | | 257,400 | |
Institutional Class | | | 630,053 | |
Shareholder servicing fees | |
Class A | | | 662,703 | |
Class C | | | 69,482 | |
Administrator Class | | | 640,039 | |
Distribution fee | |
Class C | | | 208,446 | |
Custody and accounting fees | | | 72,467 | |
Professional fees | | | 27,303 | |
Registration fees | | | 82,807 | |
Shareholder report expenses | | | 60,952 | |
Trustees’ fees and expenses | | | 12,079 | |
Other fees and expenses | | | 12,351 | |
| | | | |
Total expenses | | | 8,078,217 | |
Less: Fee waivers and/or expense reimbursements | | | (731,205 | ) |
| | | | |
Net expenses | | | 7,347,012 | |
| | | | |
Net investment income | | | 31,509,123 | |
| | | | |
| |
REALIZED AND UNREALIZED GAINS (LOSSES) ON INVESTMENTS | | | | |
|
Net realized losses on: | |
Unaffiliated securities | | | (6,543,751 | ) |
Futures transactions | | | (83,310 | ) |
| | | | |
Net realized losses on investments | | | (6,627,061 | ) |
| | | | |
|
Net change in unrealized gains (losses) on: | |
Unaffiliated securities | | | (130,718,285 | ) |
Futures transactions | | | (39,009 | ) |
| | | | |
Net change in unrealized gains (losses) on investments | | | (130,757,294 | ) |
| | | | |
Net realized and unrealized gains (losses) on investments | | | (137,384,355 | ) |
| | | | |
Net decrease in net assets resulting from operations | | $ | (105,875,232 | ) |
| | | | |
The accompanying notes are an integral part of these financial statements.
| | | | | | |
| Statement of changes in net assets | | Wells Fargo Intermediate Tax/AMT-Free Fund | | | 15 | |
| | | | | | | | | | | | | | | | |
| | | Six months ended December 31, 2016 (unaudited) | | | Year ended June 30, 2016 | |
| | | | |
Operations | | | | | | | | | | | | | | | | |
Net investment income | | | | | | $ | 31,509,123 | | | | | | | $ | 57,940,980 | |
Net realized gains (losses) on investments | | | | | | | (6,627,061 | ) | | | | | | | 2,232,112 | |
Net change in unrealized gains (losses) on investments | | | | | | | (130,757,294 | ) | | | | | | | 86,262,670 | |
| | | | |
Net increase (decrease) in net assets resulting from operations | | | | | | | (105,875,232 | ) | | | | | | | 146,435,762 | |
| | | | |
| | | | |
Distributions to shareholders from | | | | | | | | | | | | | | | | |
Net investment income | | | | | | | | | | | | | | | | |
Class A | | | | | | | (5,837,040 | ) | | | | | | | (10,348,026 | ) |
Class C | | | | | | | (404,386 | ) | | | | | | | (835,135 | ) |
Administrator Class | | | | | | | (5,875,849 | ) | | | | | | | (17,804,373 | ) |
Institutional Class | | | | | | | (19,393,462 | ) | | | | | | | (26,049,426 | ) |
Investor Class | | | | | | | N/A | | | | | | | | (2,904,150 | )1 |
Net realized gains | | | | | | | | | | | | | | | | |
Class A | | | | | | | (379,176 | ) | | | | | | | 0 | |
Class C | | | | | | | (40,611 | ) | | | | | | | 0 | |
Administrator Class | | | | | | | (307,288 | ) | | | | | | | 0 | |
Institutional Class | | | | | | | (1,290,263 | ) | | | | | | | 0 | |
| | | | |
Total distributions to shareholders | | | | | | | (33,528,075 | ) | | | | | | | (57,941,110 | ) |
| | | | |
| | | | |
Capital share transactions | | | Shares | | | | | | | | Shares | | | | | |
Proceeds from shares sold | | | | | | | | | | | | | | | | |
Class A | | | 2,261,688 | | | | 26,417,602 | | | | 39,565,308 | | | | 458,186,456 | |
Class C | | | 225,549 | | | | 2,630,251 | | | | 603,319 | | | | 7,044,101 | |
Administrator Class | | | 5,113,998 | | | | 59,566,276 | | | | 20,607,008 | | | | 240,192,483 | |
Institutional Class | | | 67,410,986 | | | | 785,861,415 | | | | 52,291,609 | | | | 610,662,188 | |
Investor Class | | | N/A | | | | N/A | | | | 1,416,573 | 1 | | | 16,288,070 | 1 |
| | | | |
| | | | | | | 874,475,544 | | | | | | | | 1,332,373,298 | |
| | | | |
Reinvestment of distributions | | | | | | | | | | | | | | | | |
Class A | | | 510,301 | | | | 5,917,263 | | | | 848,840 | | | | 9,927,258 | |
Class C | | | 34,006 | | | | 393,676 | | | | 63,902 | | | | 745,237 | |
Administrator Class | | | 505,238 | | | | 5,879,173 | | | | 1,448,279 | | | | 16,905,947 | |
Institutional Class | | | 1,100,640 | | | | 12,746,240 | | | | 1,258,565 | | | | 14,714,093 | |
Investor Class | | | N/A | | | | N/A | | | | 195,909 | 1 | | | 2,256,316 | 1 |
| | | | |
| | | | | | | 24,936,352 | | | | | | | | 44,548,851 | |
| | | | |
Payment for shares redeemed | | | | | | | | | | | | | | | | |
Class A | | | (10,033,165 | ) | | | (115,602,480 | ) | | | (12,323,773 | ) | | | (144,035,345 | ) |
Class C | | | (571,432 | ) | | | (6,599,159 | ) | | | (848,510 | ) | | | (9,891,073 | ) |
Administrator Class | | | (39,554,170 | ) | | | (465,034,483 | ) | | | (21,996,551 | ) | | | (255,465,209 | ) |
Institutional Class | | | (39,946,190 | ) | | | (456,455,381 | ) | | | (24,133,951 | ) | | | (281,891,835 | ) |
Investor Class | | | N/A | | | | N/A | | | | (39,753,597 | )1 | | | (459,096,510 | )1 |
| | | | |
| | | | | | | (1,043,691,503 | ) | | | | | | | (1,150,379,972 | ) |
| | | | |
Net increase (decrease) in net assets resulting from capital share transactions | | | | | | | (144,279,607 | ) | | | | | | | 226,542,177 | |
| | | | |
Total increase (decrease) in net assets | | | | | | | (283,682,914 | ) | | | | | | | 315,036,829 | |
| | | | |
| | | | |
Net assets | | | | | | | | | | | | | | | | |
Beginning of period | | | | | | | 2,676,436,829 | | | | | | | | 2,361,400,000 | |
| | | | |
End of period | | | | | | $ | 2,392,753,915 | | | | | | | $ | 2,676,436,829 | |
| | | | |
Overdistributed net investment income | | | | | | $ | (53,945 | ) | | | | | | $ | (52,331 | ) |
| | | | |
| 1 | For the period from July 1, 2015 to October 23, 2015. Effective at the close of business on October 23, 2015, Investor Class shares were converted to Class A shares and are no longer offered by the Fund. |
The accompanying notes are an integral part of these financial statements.
| | | | |
| 16 | | Wells Fargo Intermediate Tax/AMT-Free Fund | | Financial highlights |
(For a share outstanding throughout each period)
| | | | | | | | | | | | | | | | | | | | | | | | |
| | | Six months ended
December 31, 2016 (unaudited) | | | Year ended June 30 | |
| CLASS A | | | 2016 | | | 2015 | | | 2014 | | | 2013 | | | 2012 | |
Net asset value, beginning of period | | | $11.89 | | | | $11.47 | | | | $11.53 | | | | $11.31 | | | | $11.53 | | | | $10.94 | |
Net investment income | | | 0.13 | | | | 0.26 | | | | 0.25 | | | | 0.30 | | | | 0.28 | | | | 0.35 | |
Net realized and unrealized gains (losses) on investments | | | (0.60 | ) | | | 0.42 | | | | (0.06 | ) | | | 0.29 | | | | (0.18 | ) | | | 0.59 | |
| | | | | | | | | | | | | | | | | | | | | | | | |
Total from investment operations | | | (0.47 | ) | | | 0.68 | | | | 0.19 | | | | 0.59 | | | | 0.10 | | | | 0.94 | |
Distributions to shareholders from | | | | | | | | | | | | | | | | | | | | | | | | |
Net investment income | | | (0.13 | ) | | | (0.26 | ) | | | (0.25 | ) | | | (0.30 | ) | | | (0.28 | ) | | | (0.35 | ) |
Net realized gains | | | (0.01 | ) | | | 0.00 | | | | 0.00 | | | | (0.07 | ) | | | (0.04 | ) | | | (0.00 | )1 |
| | | | | | | | | | | | | | | | | | | | | | | | |
Total distributions to shareholders | | | (0.14 | ) | | | (0.26 | ) | | | (0.25 | ) | | | (0.37 | ) | | | (0.32 | ) | | | (0.35 | ) |
Net asset value, end of period | | | $11.28 | | | | $11.89 | | | | $11.47 | | | | $11.53 | | | | $11.31 | | | | $11.53 | |
Total return2 | | | (3.99 | )% | | | 5.99 | % | | | 1.68 | % | | | 5.37 | % | | | 0.82 | % | | | 8.71 | % |
Ratios to average net assets (annualized) | | | | | | | | | | | | | | | | | | | | | | | | |
Gross expenses | | | 0.79 | % | | | 0.80 | % | | | 0.80 | % | | | 0.81 | % | | | 0.80 | % | | | 0.81 | % |
Net expenses | | | 0.70 | % | | | 0.70 | % | | | 0.70 | % | | | 0.70 | % | | | 0.70 | % | | | 0.70 | % |
Net investment income | | | 2.20 | % | | | 2.23 | % | | | 2.19 | % | | | 2.66 | % | | | 2.36 | % | | | 3.07 | % |
Supplemental data | | | | | | | | | | | | | | | | | | | | | | | | |
Portfolio turnover rate | | | 11 | % | | | 14 | % | | | 38 | % | | | 29 | % | | | 24 | % | | | 38 | % |
Net assets, end of period (000s omitted) | | | $446,089 | | | | $556,673 | | | | $214,880 | | | | $264,796 | | | | $289,931 | | | | $307,991 | |
| 1 | Amount is less than $0.005. |
| 2 | Total return calculations do not include any sales charges. Returns for periods of less than one year are not annualized. |
The accompanying notes are an integral part of these financial statements.
| | | | | | |
| Financial highlights | | Wells Fargo Intermediate Tax/AMT-Free Fund | | | 17 | |
(For a share outstanding throughout each period)
| | | | | | | | | | | | | | | | | | | | | | | | |
| | | Six months ended
December 31, 2016 (unaudited) | | | Year ended June 30 | |
| CLASS C | | | 2016 | | | 2015 | | | 2014 | | | 2013 | | | 2012 | |
Net asset value, beginning of period | | | $11.89 | | | | $11.47 | | | | $11.53 | | | | $11.31 | | | | $11.53 | | | | $10.94 | |
Net investment income | | | 0.09 | | | | 0.17 | | | | 0.17 | | | | 0.22 | | | | 0.19 | | | | 0.27 | |
Net realized and unrealized gains (losses) on investments | | | (0.60 | ) | | | 0.42 | | | | (0.06 | ) | | | 0.29 | | | | (0.18 | ) | | | 0.59 | |
| | | | | | | | | | | | | | | | | | | | | | | | |
Total from investment operations | | | (0.51 | ) | | | 0.59 | | | | 0.11 | | | | 0.51 | | | | 0.01 | | | | 0.86 | |
Distributions to shareholders from | | | | | | | | | | | | | | | | | | | | | | | | |
Net investment income | | | (0.09 | ) | | | (0.17 | ) | | | (0.17 | ) | | | (0.22 | ) | | | (0.19 | ) | | | (0.27 | ) |
Net realized gains | | | (0.01 | ) | | | 0.00 | | | | 0.00 | | | | (0.07 | ) | | | (0.04 | ) | | | (0.00 | )1 |
| | | | | | | | | | | | | | | | | | | | | | | | |
Total distributions to shareholders | | | (0.10 | ) | | | (0.17 | ) | | | (0.17 | ) | | | (0.29 | ) | | | (0.23 | ) | | | (0.27 | ) |
Net asset value, end of period | | | $11.28 | | | | $11.89 | | | | $11.47 | | | | $11.53 | | | | $11.31 | | | | $11.53 | |
Total return2 | | | (4.35 | )% | | | 5.20 | % | | | 0.92 | % | | | 4.59 | % | | | 0.07 | % | | | 7.90 | % |
Ratios to average net assets (annualized) | | | | | | | | | | | | | | | | | | | | | | | | |
Gross expenses | | | 1.54 | % | | | 1.55 | % | | | 1.55 | % | | | 1.56 | % | | | 1.55 | % | | | 1.56 | % |
Net expenses | | | 1.45 | % | | | 1.45 | % | | | 1.45 | % | | | 1.45 | % | | | 1.45 | % | | | 1.45 | % |
Net investment income | | | 1.45 | % | | | 1.48 | % | | | 1.44 | % | | | 1.92 | % | | | 1.61 | % | | | 2.32 | % |
Supplemental data | | | | | | | | | | | | | | | | | | | | | | | | |
Portfolio turnover rate | | | 11 | % | | | 14 | % | | | 38 | % | | | 29 | % | | | 24 | % | | | 38 | % |
Net assets, end of period (000s omitted) | | | $50,166 | | | | $56,601 | | | | $56,703 | | | | $57,580 | | | | $72,106 | | | | $67,598 | |
| 1 | Amount is less than $0.005. |
| 2 | Total return calculations do not include any sales charges. Returns for periods of less than one year are not annualized. |
The accompanying notes are an integral part of these financial statements.
| | | | |
| 18 | | Wells Fargo Intermediate Tax/AMT-Free Fund | | Financial highlights |
(For a share outstanding throughout each period)
| | | | | | | | | | | | | | | | | | | | | | | | |
| | | Six months ended December 31, 2016
(unaudited) | | | Year ended June 30 | |
| ADMINISTRATOR CLASS | | | 2016 | | | 2015 | | | 2014 | | | 2013 | | | 2012 | |
Net asset value, beginning of period | | | $11.90 | | | | $11.48 | | | | $11.54 | | | | $11.32 | | | | $11.54 | | | | $10.95 | |
Net investment income | | | 0.14 | | | | 0.27 | | | | 0.27 | | | | 0.31 | | | | 0.29 | | | | 0.36 | |
Net realized and unrealized gains (losses) on investments | | | (0.60 | ) | | | 0.42 | | | | (0.06 | ) | | | 0.29 | | | | (0.18 | ) | | | 0.59 | |
| | | | | | | | | | | | | | | | | | | | | | | | |
Total from investment operations | | | (0.46 | ) | | | 0.69 | | | | 0.21 | | | | 0.60 | | | | 0.11 | | | | 0.95 | |
Distributions to shareholders from | | | | | | | | | | | | | | | | | | | | | | | | |
Net investment income | | | (0.14 | ) | | | (0.27 | ) | | | (0.27 | ) | | | (0.31 | ) | | | (0.29 | ) | | | (0.36 | ) |
Net realized gains | | | (0.01 | ) | | | 0.00 | | | | 0.00 | | | | (0.07 | ) | | | (0.04 | ) | | | (0.00 | )1 |
| | | | | | | | | | | | | | | | | | | | | | | | |
Total distributions to shareholders | | | (0.15 | ) | | | (0.27 | ) | | | (0.27 | ) | | | (0.38 | ) | | | (0.33 | ) | | | (0.36 | ) |
Net asset value, end of period | | | $11.29 | | | | $11.90 | | | | $11.48 | | | | $11.54 | | | | $11.32 | | | | $11.54 | |
Total return2 | | | (3.94 | )% | | | 6.09 | % | | | 1.78 | % | | | 5.47 | % | | | 0.92 | % | | | 8.81 | % |
Ratios to average net assets (annualized) | | | | | | | | | | | | | | | | | | | | | | | | |
Gross expenses | | | 0.73 | % | | | 0.74 | % | | | 0.74 | % | | | 0.75 | % | | | 0.74 | % | | | 0.75 | % |
Net expenses | | | 0.60 | % | | | 0.60 | % | | | 0.60 | % | | | 0.60 | % | | | 0.60 | % | | | 0.60 | % |
Net investment income | | | 2.28 | % | | | 2.33 | % | | | 2.29 | % | | | 2.76 | % | | | 2.46 | % | | | 3.18 | % |
Supplemental data | | | | | | | | | | | | | | | | | | | | | | | | |
Portfolio turnover rate | | | 11 | % | | | 14 | % | | | 38 | % | | | 29 | % | | | 24 | % | | | 38 | % |
Net assets, end of period (000s omitted) | | | $378,293 | | | | $802,527 | | | | $773,770 | | | | $668,517 | | | | $621,627 | | | | $494,528 | |
| 1 | Amount is less than $0.005. |
| 2 | Returns for periods of less than one year are not annualized. |
The accompanying notes are an integral part of these financial statements.
| | | | | | |
| Financial highlights | | Wells Fargo Intermediate Tax/AMT-Free Fund | | | 19 | |
(For a share outstanding throughout each period)
| | | | | | | | | | | | | | | | | | | | | | | | |
| | | Six months ended December 31, 2016 (unaudited) | | | Year ended June 30 | |
| INSTITUTIONAL CLASS | | | 2016 | | | 2015 | | | 2014 | | | 2013 | | | 2012 | |
Net asset value, beginning of period | | | $11.91 | | | | $11.49 | | | | $11.55 | | | | $11.32 | | | | $11.54 | | | | $10.96 | |
Net investment income | | | 0.15 | | | | 0.29 | | | | 0.29 | | | | 0.33 | | | | 0.31 | | | | 0.38 | |
Net realized and unrealized gains (losses) on investments | | | (0.61 | ) | | | 0.42 | | | | (0.06 | ) | | | 0.30 | | | | (0.18 | ) | | | 0.58 | |
| | | | | | | | | | | | | | | | | | | | | | | | |
Total from investment operations | | | (0.46 | ) | | | 0.71 | | | | 0.23 | | | | 0.63 | | | | 0.13 | | | | 0.96 | |
Distributions to shareholders from | | | | | | | | | | | | | | | | | | | | | | | | |
Net investment income | | | (0.15 | ) | | | (0.29 | ) | | | (0.29 | ) | | | (0.33 | ) | | | (0.31 | ) | | | (0.38 | ) |
Net realized gains | | | (0.01 | ) | | | 0.00 | | | | 0.00 | | | | (0.07 | ) | | | (0.04 | ) | | | (0.00 | )1 |
| | | | | | | | | | | | | | | | | | | | | | | | |
Total distributions to shareholders | | | (0.16 | ) | | | (0.29 | ) | | | (0.29 | ) | | | (0.40 | ) | | | (0.35 | ) | | | (0.38 | ) |
Net asset value, end of period | | | $11.29 | | | | $11.91 | | | | $11.49 | | | | $11.55 | | | | $11.32 | | | | $11.54 | |
Total return2 | | | (3.95 | )% | | | 6.26 | % | | | 1.97 | % | | | 5.75 | % | | | 1.10 | % | | | 8.91 | % |
Ratios to average net assets (annualized) | | | | | | | | | | | | | | | | | | | | | | | | |
Gross expenses | | | 0.46 | % | | | 0.47 | % | | | 0.47 | % | | | 0.48 | % | | | 0.48 | % | | | 0.49 | % |
Net expenses | | | 0.45 | % | | | 0.44 | % | | | 0.42 | % | | | 0.42 | % | | | 0.42 | % | | | 0.42 | % |
Net investment income | | | 2.46 | % | | | 2.49 | % | | | 2.47 | % | | | 2.94 | % | | | 2.65 | % | | | 3.32 | % |
Supplemental data | | | | | | | | | | | | | | | | | | | | | | | | |
Portfolio turnover rate | | | 11 | % | | | 14 | % | | | 38 | % | | | 29 | % | | | 24 | % | | | 38 | % |
Net assets, end of period (000s omitted) | | | $1,518,206 | | | | $1,260,636 | | | | $878,585 | | | | $599,686 | | | | $461,403 | | | | $326,772 | |
| 1 | Amount is less than $0.005. |
| 2 | Returns for periods of less than one year are not annualized. |
The accompanying notes are an integral part of these financial statements.
| | | | |
| 20 | | Wells Fargo Intermediate Tax/AMT-Free Fund | | Notes to financial statements (unaudited) |
1. ORGANIZATION
Wells Fargo Funds Trust (the “Trust”), a Delaware statutory trust organized on March 10, 1999, is an open-end management investment company registered under the Investment Company Act of 1940, as amended (the “1940 Act”). As an investment company, the Trust follows the accounting and reporting guidance in Financial Accounting Standards Board (“FASB”) Accounting Standards Codification Topic 946, Financial Services – Investment Companies. These financial statements report on the Wells Fargo Intermediate Tax/AMT-Free Fund (the “Fund”) which is a diversified series of the Trust.
Effective at the close of business on October 23, 2015, Investor Class shares became Class A shares in a tax-free conversion. Shareholders of Investor Class received Class A shares at a value equal to the value of their Investor Class shares immediately prior to the conversion. Investor Class shares are no longer offered by the Fund.
2. SIGNIFICANT ACCOUNTING POLICIES
The following significant accounting policies, which are consistently followed in the preparation of the financial statements of the Fund, are in conformity with U.S. generally accepted accounting principles which require management to make estimates and assumptions that affect the reported amounts of assets and liabilities, disclosure of contingent assets and liabilities at the date of the financial statements, and the reported amounts of revenues and expenses during the reporting period. Actual results could differ from those estimates.
Securities valuation
All investments are valued each business day as of the close of regular trading on the New York Stock Exchange (generally 4 p.m. Eastern Time), although the Fund may deviate from this calculation time under unusual or unexpected circumstances.
Debt securities are valued at the evaluated bid price provided by an independent pricing service or, if a reliable price is not available, the quoted bid price from an independent broker-dealer.
Futures that are listed on a foreign or domestic exchange or market are valued at the official closing price or, if none, the last sales price.
Investments in registered open-end investment companies are valued at net asset value.
Investments which are not valued using any of the methods discussed above are valued at their fair value, as determined in good faith by the Board of Trustees of the Fund. The Board of Trustees has established a Valuation Committee comprised of the Trustees and has delegated to it the authority to take any actions regarding the valuation of portfolio securities that the Valuation Committee deems necessary or appropriate, including determining the fair value of portfolio securities, unless the determination has been delegated to the Management Valuation Team of Wells Fargo Funds Management, LLC (“Funds Management”). The Board of Trustees retains the authority to make or ratify any valuation decisions or approve any changes to the Valuation Procedures as it deems appropriate. On a quarterly basis, the Board of Trustees receives reports on any valuation actions taken by the Valuation Committee or the Management Valuation Team which may include items for ratification.
Valuations of fair valued securities are compared to the next actual sales price when available, or other appropriate market values, to assess the continued appropriateness of the fair valuation methodologies used. These securities are fair valued on a day-to-day basis, taking into consideration changes to appropriate market information and any significant changes to the inputs considered in the valuation process until there is a readily available price provided on an exchange or by an independent pricing service. Valuations received from an independent pricing service or independent broker-dealer quotes are periodically validated by comparisons to most recent trades and valuations provided by other independent pricing services in addition to the review of prices by the manager and/or subadviser. Unobservable inputs used in determining fair valuations are identified based on the type of security, taking into consideration factors utilized by market participants in valuing the investment, knowledge about the issuer and the current market environment.
When-issued transactions
The Fund may purchase securities on a forward commitment or when-issued basis. The Fund records a when-issued transaction on the trade date and will segregate assets in an amount at least equal in value to the Fund’s commitment to purchase when-issued securities. Securities purchased on a when-issued basis are marked-to-market daily and the Fund begins earning interest on the settlement date. Losses may arise due to changes in the market value of the underlying securities or if the counterparty does not perform under the contract.
Futures contracts
The Fund is subject to interest rate risk in the normal course of pursuing its investment objectives. The Fund may buy and sell futures contracts in order to gain exposure to, or protect against, changes in security values and interest rates. The
| | | | | | |
| Notes to financial statements (unaudited) | | Wells Fargo Intermediate Tax/AMT-Free Fund | | | 21 | |
primary risks associated with the use of futures contracts are the imperfect correlation between changes in market values of securities held by the Fund and the prices of futures contracts, and the possibility of an illiquid market.
The aggregate principal amounts of the contracts are not recorded in the financial statements. Fluctuations in the value of the contracts are recorded in the Statement of Assets and Liabilities as an asset or liability and in the Statement of Operations as unrealized gains or losses until the contracts are closed, at which point they are recorded as net realized gains or losses on futures contracts. With futures contracts, there is minimal counterparty risk to the Fund since futures are exchange traded and the exchange’s clearinghouse, as counterparty to all exchange traded futures, guarantees the futures against default.
Security transactions and income recognition
Securities transactions are recorded on a trade date basis. Realized gains or losses are recorded on the basis of identified cost.
Interest income is accrued daily and bond discounts are accreted and premiums are amortized daily based on the effective interest method. To the extent debt obligations are placed on non-accrual status, any related interest income may be reduced by writing off interest receivables when the collection of all or a portion of interest has become doubtful based on consistently applied procedures. If the issuer subsequently resumes interest payments or when the collectability of interest is reasonably assured, the debt obligation is removed from non-accrual status.
Distributions to shareholders
Distributions to shareholders from net investment income are accrued daily and paid monthly. Distributions from net realized gains, if any, are recorded on the ex-dividend date. Such distributions are determined in conformity with federal income tax regulations, which may differ in amount or character from net investment income and realized gains recognized for purposes of U.S. generally accepted accounting principles.
Federal and other taxes
The Fund intends to continue to qualify as a regulated investment company by distributing substantially all of its investment company taxable and tax-exempt income and any net realized capital gains (after reduction for capital loss carryforwards) sufficient to relieve it from all, or substantially all, federal income taxes. Accordingly, no provision for federal income taxes was required.
The Fund’s income and federal excise tax returns and all financial records supporting those returns for the prior three fiscal years are subject to examination by the federal and Delaware revenue authorities. Management has analyzed the Fund’s tax positions taken on federal, state, and foreign tax returns for all open tax years and does not believe that there are any uncertain tax positions that require recognition of a tax liability.
Class allocations
The separate classes of shares offered by the Fund differ principally in applicable sales charges, distribution, shareholder servicing, and administration fees. Class specific expenses are charged directly to that share class. Investment income, common expenses, and realized and unrealized gains (losses) on investments are allocated daily to each class of shares based on the relative proportion of net assets of each class.
3. FAIR VALUATION MEASUREMENTS
Fair value measurements of investments are determined within a framework that has established a fair value hierarchy based upon the various data inputs utilized in determining the value of the Fund’s investments. The three-level hierarchy gives the highest priority to unadjusted quoted prices in active markets for identical assets or liabilities (Level 1) and the lowest priority to significant unobservable inputs (Level 3). The Fund’s investments are classified within the fair value hierarchy based on the lowest level of input that is significant to the fair value measurement. The inputs are summarized into three broad levels as follows:
| ∎ | | Level 1 – quoted prices in active markets for identical securities |
| ∎ | | Level 2 – other significant observable inputs (including quoted prices for similar securities, interest rates, prepayment speeds, credit risk, use of amortized cost, etc.) |
| ∎ | | Level 3 – significant unobservable inputs (including the Fund’s own assumptions in determining the fair value of investments) |
The inputs or methodologies used for valuing investments in securities are not necessarily an indication of the risk associated with investing in those securities.
| | | | |
| 22 | | Wells Fargo Intermediate Tax/AMT-Free Fund | | Notes to financial statements (unaudited) |
The following is a summary of the inputs used in valuing the Fund’s assets and liabilities as of December 31, 2016:
| | | | | | | | | | | | | | | | |
| | | Quoted prices
(Level 1) | | | Other significant
observable inputs
(Level 2) | | | Significant
unobservable inputs (Level 3) | | | Total | |
Assets | | | | | | | | | | | | | | | | |
Investments in: | | | | | | | | | | | | | | | | |
| | | | |
Municipal obligations | | $ | 0 | | | $ | 2,364,005,422 | | | $ | 0 | | | $ | 2,364,005,422 | |
The Fund recognizes transfers between levels within the fair value hierarchy at the end of the reporting period. At December 31, 2016, the Fund did not have any transfers into/out of Level 1, Level 2, or Level 3.
4. TRANSACTIONS WITH AFFILIATES AND OTHER EXPENSES
Management fee
Funds Management an indirect wholly owned subsidiary of Wells Fargo & Company (“Wells Fargo”), is the manager of the Fund and provides advisory and fund-level administrative services under an investment management agreement. Under the investment management agreement, Funds Management is responsible for, among other services, implementing the investment objectives and strategies of the Fund, supervising the subadviser, providing fund-level administrative services in connection with the Fund’s operations, and providing any other fund-level administrative services reasonably necessary for the operation of the Fund. As compensation for its services under the investment management agreement, Funds Management is entitled to receive an annual management fee starting at 0.40% and declining to 0.28% as the average daily net assets of the Fund increase. For the six months ended December 31, 2016, the management fee was equivalent to an annual rate of 0.36% of the Fund’s average daily net assets.
Funds Management has retained the services of a subadviser to provide daily portfolio management to the Fund. The fee for subadvisory services is borne by Funds Management. Wells Capital Management Incorporated, an affiliate of Funds Management and an indirect wholly owned subsidiary of Wells Fargo, is the subadviser to the Fund and is entitled to receive a fee from Funds Management at an annual rate starting at 0.20% and declining to 0.10% as the average daily net assets of the Fund increase.
Administration fees
Under a class-level administration agreement, Funds Management provides class-level administrative services to the Fund, which includes paying fees and expenses for services provided by the transfer agent, sub-transfer agents, omnibus account servicers and record-keepers. As compensation for its services under the class-level administration agreement, Funds Management receives an annual fee which is calculated based on the average daily net assets of each class as follows:
| | | | |
| | | Class-level
administration fee | |
Class A, Class C | | | 0.16 | % |
Administrator Class | | | 0.10 | |
Institutional Class | | | 0.08 | |
Funds Management has contractually waived and/or reimbursed management and administration fees to the extent necessary to maintain certain net operating expense ratios for the Fund. Waiver of fees and/or reimbursement of expenses by Funds Management were made first from fund level expenses on a proportionate basis and then from class specific expenses. Funds Management has committed through October 31, 2017 to waive fees and/or reimburse expenses to the extent necessary to cap the Fund’s expenses at 0.70% for Class A shares, 1.45% for Class C shares, 0.60% for Administrator Class shares, and 0.45% for Institutional Class shares. After this time, the cap may be increased or the commitment to maintain the cap may be terminated only with the approval of the Board of Trustees.
During the six months ended December 31, 2016, State Street Bank and Trust Company, the Fund’s custodian, reimbursed the Fund $6,430 for certain out-of-pocket expenses that were billed to the Fund in error from 1998-2015. This amount is included in interest income on the Statement of Operations. In addition, Funds Management was also reimbursed $3,233 for waivers/reimbursements it made to the Fund during the period the Fund was erroneously billed.
| | | | | | |
| Notes to financial statements (unaudited) | | Wells Fargo Intermediate Tax/AMT-Free Fund | | | 23 | |
Distribution fee
The Trust has adopted a distribution plan for Class C shares of the Fund pursuant to Rule 12b-1 under the 1940 Act. A distribution fee is charged to Class C shares and paid to Wells Fargo Funds Distributor, LLC, the principal underwriter, at an annual rate of 0.75% of the average daily net assets of Class C shares.
In addition, Funds Distributor is entitled to receive the front-end sales charge from the purchase of Class A shares and a contingent deferred sales charge on the redemption of certain Class A shares. Funds Distributor is also entitled to receive the contingent deferred sales charges from redemptions of Class C shares. For the six months ended December 31, 2016, Funds Distributor received $4,253 from the sale of Class A shares and $449 in contingent deferred sales charges from redemptions of Class C shares.
Shareholder servicing fees
The Trust has entered into contracts with one or more shareholder servicing agents, whereby Class A, Class C, and Administrator Class of the Fund are charged a fee at an annual rate of 0.25% of the average daily net assets of each respective class.
A portion of these total shareholder servicing fees were paid to affiliates of Wells Fargo.
5. INVESTMENT PORTFOLIO TRANSACTIONS
Purchases and sales of investments, excluding U.S. government obligations (if any) and short-term securities, for the six months ended December 31, 2016 were $269,317,620 and $251,787,885, respectively.
The Fund may purchase or sell investment securities to other Wells Fargo funds under procedures adopted by the Board of Trustees. The procedures have been designed to ensure that these interfund transactions, which generally do not incur broker commissions, are effected at current market prices. Interfund trades are included within the respective purchases and sales amounts shown.
6. DERIVATIVE TRANSACTIONS
During the six months ended December 31, 2016, the Fund entered into futures contracts to take advantage of the differences between municipal and treasury yields and to help manage the duration of the Fund.
As of December 31, 2016, the Fund did not have any open futures contracts. The Fund had an average notional amount of $3,071,999 in short futures contracts during the six months ended December 31, 2016.
The realized losses and change in unrealized gains or losses on futures contracts are reflected in the Statement of Operations.
7. BANK BORROWINGS
The Trust (excluding the money market funds and certain other funds) and Wells Fargo Variable Trust are parties to a $250,000,000 revolving credit agreement whereby the Fund is permitted to use bank borrowings for temporary or emergency purposes, such as to fund shareholder redemption requests. Interest under the credit agreement is charged to the Fund based on a borrowing rate equal to the higher of the Federal Funds rate in effect on that day plus 1.25% or the overnight LIBOR rate in effect on that day plus 1.25%. In addition, an annual commitment fee equal to 0.25% of the unused balance is allocated to each participating fund. Prior to August 30, 2016, the revolving credit agreement amount was $200,000,000 and the annual commitment fee was equal to 0.20% of the unused balance which was allocated to each participating fund.
For the six months ended December 31, 2016, there were no borrowings by the Fund under the agreement.
8. INDEMNIFICATION
Under the Trust’s organizational documents, the officers and Trustees have been granted certain indemnification rights against certain liabilities that may arise out of performance of their duties to the Trust. Additionally, in the normal course of business, the Trust may enter into contracts with service providers that contain a variety of indemnification clauses. The Trust’s maximum exposure under these arrangements is dependent on future claims that may be made against the Fund and, therefore, cannot be estimated.
| | | | |
| 24 | | Wells Fargo Intermediate Tax/AMT-Free Fund | | Notes to financial statements (unaudited) |
9. REGULATORY CHANGES
In October 2016, the Securities and Exchange Commission (“SEC”) adopted new rules and forms and amended existing rules and forms (together, “final rules”) intended to modernize and enhance the reporting and disclosure of information by registered investment companies and to enhance liquidity risk management by open-end mutual funds and exchange-traded funds. The final rules will enhance the quality of information available to investors and will allow the SEC to more effectively collect and use data reported by funds. In part, the final rules amend Regulation S-X and require standardized, enhanced disclosure about derivatives in the Fund’s financial statements, as well as other amendments. The compliance date for the amendments to Regulation S-X is August 1, 2017 while the compliance date for the new form types is June 1, 2018 and the compliance date for the liquidity risk management program requirements is December 1, 2018. Management is currently assessing the potential impact of these enhancements and their impact on the financial statement disclosures and reporting requirements.
| | | | | | |
| Other information (unaudited) | | Wells Fargo Intermediate Tax/AMT-Free Fund | | | 25 | |
PROXY VOTING INFORMATION
A description of the policies and procedures that the Fund uses to determine how to vote proxies relating to portfolio securities is available, upon request, by calling 1-800-222-8222, visiting our website at wellsfargofunds.com, or visiting the SEC website at sec.gov. Information regarding how the Fund voted proxies relating to portfolio securities during the most recent 12-month period ended June 30 is available on the Fund’s website at wellsfargofunds.com or by visiting the SEC website at sec.gov.
PORTFOLIO HOLDINGS INFORMATION
The complete portfolio holdings for the Fund are publicly available monthly on the Fund’s website (wellsfargofunds.com), on a one-month delayed basis. In addition, top ten holdings information (excluding derivative positions) for the Fund is publicly available on the Fund’s website on a monthly, seven-day or more delayed basis. The Fund files its complete schedule of portfolio holdings with the SEC for the first and third quarters of each fiscal year on Form N-Q, which is available by visiting the SEC website at sec.gov. In addition, the Fund’s Form N-Q may be reviewed and copied at the SEC’s Public Reference Room in Washington, DC, and at regional offices in New York City, at 233 Broadway, and in Chicago, at 175 West Jackson Boulevard, Suite 900. Information about the Public Reference Room may be obtained by calling 1-800-SEC-0330.
| | | | |
| 26 | | Wells Fargo Intermediate Tax/AMT-Free Fund | | Other information (unaudited) |
BOARD OF TRUSTEES AND OFFICERS
Each of the Trustees and Officers1 listed in the table below acts in identical capacities for each fund in the Wells Fargo family of funds, which consists of 139 mutual funds comprising the Wells Fargo Funds Trust, Wells Fargo Variable Trust, Wells Fargo Master Trust and four closed-end funds (collectively the “Fund Complex”). This table should be read in conjunction with the Prospectus and the Statement of Additional Information2. The mailing address of each Trustee and Officer is 525 Market Street, 12th Floor, San Francisco, CA 94105. Each Trustee and Officer serves an indefinite term, however, each Trustee serves such term until reaching the mandatory retirement age established by the Trustees.
Independent Trustees
| | | | | | |
Name and year of birth | | Position held and length of service* | | Principal occupations during past five years or longer | | Current other public company or investment company directorships |
William R. Ebsworth (Born 1957) | | Trustee, since 2015 | | Retired. From 1984 to 2013, equities analyst, portfolio manager, research director and chief financial officer at Fidelity Management and Research Company in Boston, Tokyo, and Hong Kong and retired in 2013 as Chief Investment Officer of Fidelity Strategic Advisers, Inc. where he lead a team of investment professionals managing client assets. Prior thereto, Board member of Hong Kong Securities Clearing Co., Hong Kong Options Clearing Corp., the Thailand International Fund, Ltd., Fidelity Investments Life Insurance Company, and Empire Fidelity Investments Life Insurance Company. Board member of the Fonté Foundation (non-profit organization) and the Vincent Memorial Hospital Endowment (non-profit organization), where he serves on the Investment Committee and as a Chair of the Audit Committee. Mr. Ebsworth is a CFA® charterholder and an Adjunct Lecturer, Finance, at Babson College. | | Asset Allocation Trust |
Jane A. Freeman (Born 1953) | | Trustee, since 2015 | | Retired. From 2012 to 2014 and 1999 to 2008, Chief Financial Officer of Scientific Learning Corporation. From 2008 to 2012, Ms. Freeman provided consulting services related to strategic business projects. Prior to 1999, Portfolio Manager at Rockefeller & Co. and Scudder, Stevens & Clark. Board member of the Harding Loevner Funds from 1996 to 2014, serving as both Lead Independent Director and chair of the Audit Committee. Board member of the Russell Exchange Traded Funds Trust from 2011 to 2012 and the chair of the Audit Committee. Ms. Freeman is a Board Member of Ruth Bancroft Garden (non-profit organization) and an inactive chartered financial analyst. | | Asset Allocation Trust |
Peter G. Gordon** (Born 1942) | | Trustee, since 1998; Chairman, since 2005 | | Co-Founder, Retired Chairman, President and CEO of Crystal Geyser Water Company. Trustee Emeritus, Colby College. | | Asset Allocation Trust |
Isaiah Harris, Jr.
(Born 1952) | | Trustee, since 2009 | | Retired. Chairman of the Board of CIGNA Corporation since 2009, and Director since 2005. From 2003 to 2011, Director of Deluxe Corporation. Prior thereto, President and CEO of BellSouth Advertising and Publishing Corp. from 2005 to 2007, President and CEO of BellSouth Enterprises from 2004 to 2005 and President of BellSouth Consumer Services from 2000 to 2003. Emeritus member of the Iowa State University Foundation Board of Governors. Emeritus Member of the Advisory Board of Iowa State University School of Business. Advisory Board Member, Palm Harbor Academy (charter school). Advisory Board Member, Child Evangelism Fellowship (non-profit). Mr. Harris is a certified public accountant (inactive status). | | CIGNA Corporation; Asset Allocation Trust |
Judith M. Johnson
(Born 1949) | | Trustee, since 2008; Audit Committee Chairman, since 2008 | | Retired. Prior thereto, Chief Executive Officer and Chief Investment Officer of Minneapolis Employees Retirement Fund from 1996 to 2008. Ms. Johnson is an attorney, certified public accountant and a certified managerial accountant. | | Asset Allocation Trust |
David F. Larcker
(Born 1950) | | Trustee, since 2009 | | James Irvin Miller Professor of Accounting at the Graduate School of Business, Stanford University, Director of the Corporate Governance Research Initiative and Senior Faculty of The Rock Center for Corporate Governance since 2006. From 2005 to 2008, Professor of Accounting at the Graduate School of Business, Stanford University. Prior thereto, Ernst & Young Professor of Accounting at The Wharton School, University of Pennsylvania from 1985 to 2005. | | Asset Allocation Trust |
| | | | | | |
| Other information (unaudited) | | Wells Fargo Intermediate Tax/AMT-Free Fund | | | 27 | |
| | | | | | |
Name and year of birth | | Position held and length of service* | | Principal occupations during past five years or longer | | Current other public company or investment company directorships |
Olivia S. Mitchell
(Born 1953) | | Trustee, since 2006 | | International Foundation of Employee Benefit Plans Professor, Wharton School of the University of Pennsylvania since 1993. Director of Wharton’s Pension Research Council and Boettner Center on Pensions & Retirement Research, and Research Associate at the National Bureau of Economic Research. Previously, Cornell University Professor from 1978 to 1993. | | Asset Allocation Trust |
Timothy J. Penny
(Born 1951) | | Trustee, since 1996 | | President and Chief Executive Officer of Southern Minnesota Initiative Foundation, a non-profit organization, since 2007 and Senior Fellow at the Humphrey Institute Policy Forum at the University of Minnesota since 1995. Member of the Board of Trustees of NorthStar Education Finance, Inc., a non-profit organization, since 2007. | | Asset Allocation Trust |
Michael S. Scofield
(Born 1943) | | Trustee, since 2010 | | Served on the Investment Company Institute’s Board of Governors and Executive Committee from 2008-2011 as well the Governing Council of the Independent Directors Council from 2006-2011 and the Independent Directors Council Executive Committee from 2008-2011. Chairman of the IDC from 2008-2010. Institutional Investor (Fund Directions) Trustee of Year in 2007. Trustee of the Evergreen Funds complex (and its predecessors) from 1984 to 2010. Chairman of the Evergreen Funds from 2000-2010. Former Trustee of the Mentor Funds. Retired Attorney, Law Offices of Michael S. Scofield. | | Asset Allocation Trust |
| * | Length of service dates reflect the Trustee’s commencement of service with the Trust’s predecessor entities, where applicable. |
| ** | Peter Gordon is expected to retire on December 31, 2017. |
Officers
| | | | | | |
Name and year of birth | | Position held and length of service | | Principal occupations during past five years or longer | | |
Andrew Owen3
(Born 1960) | | President, since 2017 | | Executive Vice President of Wells Fargo Bank, N.A. and President of Wells Fargo & Company and Head of Affiliated Managaers, Wells Fargo Asset Management, since 2014. Executive Vice President responsible for marketing, investments and product development for Wells Fargo Funds Management, LLC, from 2009 to 2014. | | |
Nancy Wiser1
(Born 1967) | | Treasurer, since 2012 | | Executive Vice President of Wells Fargo Funds Management, LLC since 2011. Chief Operating Officer and Chief Compliance Officer at LightBox Capital Management LLC, from 2008 to 2011. | | |
C. David Messman
(Born 1960) | | Secretary, since 2000; Chief Legal Officer, since 2003 | | Senior Vice President and Secretary of Wells Fargo Funds Management, LLC since 2001. Assistant General Counsel of Wells Fargo Bank, N.A. since 2013 and Vice President and Managing Counsel of Wells Fargo Bank, N.A. from 1996 to 2013. | | |
Michael Whitaker
(Born 1967) | | Chief Compliance Officer, since 2016 | | Executive Vice President of Wells Fargo Funds Management, LLC since 2016. Chief Compliance Officer of Fidelity’s Fixed Income Funds and Asset Allocation Funds from 2008 to 2016, Compliance Officer of FMR Co., Inc. from 2014 to 2016, Fidelity Investments Money Management, Inc. from 2014 to 2016, Fidelity Investments from 2007 to 2016. | | |
David Berardi (Born 1975) | | Assistant Treasurer, since 2009 | | Vice President of Wells Fargo Funds Management, LLC since 2009. Vice President of Evergreen Investment Management Company, LLC from 2008 to 2010. Manager of Fund Reporting and Control for Evergreen Investment Management Company, LLC from 2004 to 2010. | | |
Jeremy DePalma1 (Born 1974) | | Assistant Treasurer, since 2009 | | Senior Vice President of Wells Fargo Funds Management, LLC since 2009. Senior Vice President of Evergreen Investment Management Company, LLC from 2008 to 2010 and head of the Fund Reporting and Control Team within Fund Administration from 2005 to 2010. | | |
| 1 | Nancy Wiser acts as Treasurer of 70 funds in the Fund Complex. Jeremy DePalma acts as Treasurer of 69 funds and Assistant Treasurer of 70 funds in the Fund Complex. |
| 2 | The Statement of Additional Information includes additional information about the Trustees and is available, without charge, upon request, by calling 1-800-222-8222 or by visiting the website at wellsfargofunds.com. |
| 3 | Andrew Owen became President on January 1, 2017. |
| | | | |
| 28 | | Wells Fargo Intermediate Tax/AMT-Free Fund | | List of abbreviations |
The following is a list of common abbreviations for terms and entities that may have appeared in this report.
| ACA | — ACA Financial Guaranty Corporation |
| ADR | — American depositary receipt |
| ADS | — American depositary shares |
| AGC | — Assured Guaranty Corporation |
| AGM | — Assured Guaranty Municipal |
| Ambac | — Ambac Financial Group Incorporated |
| AMT | — Alternative minimum tax |
| BAN | — Bond anticipation notes |
| BHAC | — Berkshire Hathaway Assurance Corporation |
| CAB | — Capital appreciation bond |
| CCAB | — Convertible capital appreciation bond |
| CDA | — Community Development Authority |
| CDO | — Collateralized debt obligation |
| DRIVER | — Derivative inverse tax-exempt receipts |
| DW&P | — Department of Water & Power |
| DWR | — Department of Water Resources |
| ECFA | — Educational & Cultural Facilities Authority |
| EDA | — Economic Development Authority |
| EDFA | — Economic Development Finance Authority |
| ETF | — Exchange-traded fund |
| FDIC | — Federal Deposit Insurance Corporation |
| FFCB | — Federal Farm Credit Banks |
| FGIC | — Financial Guaranty Insurance Corporation |
| FHA | — Federal Housing Administration |
| FHLB | — Federal Home Loan Bank |
| FHLMC | — Federal Home Loan Mortgage Corporation |
| FICO | — The Financing Corporation |
| FNMA | — Federal National Mortgage Association |
| GDR | — Global depositary receipt |
| GNMA | — Government National Mortgage Association |
| HCFR | — Healthcare facilities revenue |
| HEFA | — Health & Educational Facilities Authority |
| HEFAR | — Higher education facilities authority revenue |
| HFA | — Housing Finance Authority |
| HFFA | — Health Facilities Financing Authority |
| HUD | — Department of Housing and Urban Development |
| IDA | — Industrial Development Authority |
| IDAG | — Industrial Development Agency |
| KRW | — Republic of Korea won |
| LIBOR | — London Interbank Offered Rate |
| LIFER | — Long Inverse Floating Exempt Receipts |
| LLC | — Limited liability company |
| LLLP | — Limited liability limited partnership |
| LLP | — Limited liability partnership |
| MBIA | — Municipal Bond Insurance Association |
| MFHR | — Multifamily housing revenue |
| MSTR | — Municipal securities trust receipts |
| MUD | — Municipal Utility District |
| National | — National Public Finance Guarantee Corporation |
| PCFA | — Pollution Control Financing Authority |
| PCL | — Public Company Limited |
| PCR | — Pollution control revenue |
| PFA | — Public Finance Authority |
| PFFA | — Public Facilities Financing Authority |
| PFOTER | — Puttable floating option tax-exempt receipts |
| plc | — Public limited company |
| PUTTER | — Puttable tax-exempt receipts |
| R&D | — Research & development |
| Radian | — Radian Asset Assurance |
| RAN | — Revenue anticipation notes |
| RDA | — Redevelopment Authority |
| RDFA | — Redevelopment Finance Authority |
| REIT | — Real estate investment trust |
| ROC | — Reset option certificates |
| SAVRS | — Select auction variable rate securities |
| SBA | — Small Business Authority |
| SDR | — Swedish depositary receipt |
| SFHR | — Single-family housing revenue |
| SFMR | — Single-family mortgage revenue |
| SPA | — Standby purchase agreement |
| SPDR | — Standard & Poor’s Depositary Receipts |
| SPEAR | — Short Puttable Exempt Adjustable Receipts |
| STRIPS | — Separate trading of registered interest and |
| TAN | — Tax anticipation notes |
| TIPS | — Treasury inflation-protected securities |
| TRAN | — Tax revenue anticipation notes |
| TTFA | — Transportation Trust Fund Authority |
| TVA | — Tennessee Valley Authority |

For more information
More information about Wells Fargo Funds is available free upon request. To obtain literature, please write, email, visit the Fund’s website, or call:
Wells Fargo Funds
P.O. Box 8266
Boston, MA 02266-8266
Email: fundservice@wellsfargo.com
Website: wellsfargofunds.com
Individual investors: 1-800-222-8222
Retail investment professionals: 1-888-877-9275
Institutional investment professionals: 1-866-765-0778
This report and the financial statements contained herein are submitted for the general information of the shareholders of the Fund. If this report is used for promotional purposes, distribution of the report must be accompanied or preceded by a current prospectus. Before investing, please consider the investment objectives, risks, charges, and expenses of the investment. For a current prospectus and, if available, a summary prospectus, containing this information, call 1-800-222-8222 or visit the Fund’s website at wellsfargofunds.com. Read the prospectus carefully before you invest or send money.
Wells Fargo Asset Management (WFAM) is a trade name used by the asset management businesses of Wells Fargo & Company. Wells Fargo Funds Management, LLC, a wholly owned subsidiary of Wells Fargo & Company, provides investment advisory and administrative services for Wells Fargo Funds. Other affiliates of Wells Fargo & Company provide subadvisory and other services for the funds. The funds are distributed by Wells Fargo Funds Distributor, LLC, Member FINRA, an affiliate of Wells Fargo & Company. Neither Wells Fargo Funds Management nor Wells Fargo Funds Distributor has Fund customer accounts/assets, and neither provides investment advice/recommendations or acts as an investment advice fiduciary to any investor.
NOT FDIC INSURED ◾ NO BANK GUARANTEE ◾ MAY LOSE VALUE
© 2016 Wells Fargo Funds Management, LLC. All rights reserved.
| | |
 | | 300480 02-17 SA251/SAR251 12-16 |
Semi-Annual Report
December 31, 2016

Wells Fargo
Minnesota Tax-Free Fund


Reduce clutter. Save trees.
Sign up for electronic delivery of prospectuses and shareholder reports at wellsfargo.com/advantagedelivery
Contents
The views expressed and any forward-looking statements are as of December 31, 2016, unless otherwise noted, and are those of the Fund managers and/or Wells Fargo Funds Management, LLC. Discussions of individual securities, or the markets generally, or any Wells Fargo Fund are not intended as individual recommendations. Future events or results may vary significantly from those expressed in any forward-looking statements. The views expressed are subject to change at any time in response to changing circumstances in the market. Wells Fargo Funds Management, LLC and the Fund disclaim any obligation to publicly update or revise any views expressed or forward-looking statements.
NOT FDIC INSURED ◾ NO BANK GUARANTEE ◾ MAY LOSE VALUE
| | | | |
| 2 | | Wells Fargo Minnesota Tax-Free Fund | | Letter to shareholders (unaudited) |

Andrew Owen
President
Wells Fargo Funds
The Bloomberg Barclays Municipal Bond Index,1 a broad measure tracking investment-grade municipal bonds, lost 3.91% during the six-month reporting period.
Dear Shareholder:
As the new president of Wells Fargo Funds now that Karla Rabusch is retiring from that position after nearly 14 years, I am pleased to offer you this semi-annual report for the Wells Fargo Minnesota Tax -Free Fund for the six-month period that ended December 31, 2016. The Federal Reserve (Fed) raised the federal funds rate in December by 0.25%. Municipal bond yields rose sharply in the fourth quarter. The Bloomberg Barclays Municipal Bond Index,1 a broad measure tracking investment-grade municipal bonds, lost 3.91% during the six-month reporting period.
Municipal bond yields rose during the reporting period.
The municipal market reversed course in the second half of 2016, with yields increasing and prices declining. Initially the sell-off was driven by negative supply and demand trends, also known as technical factors. By the fourth quarter, fund flows turned negative (reversing a trend of 54 weeks of positive flows) and municipal bond supply increased. These deteriorating technical factors, along with the expectation of an expansionary fiscal policy and lower tax rates under the new administration, drove market volatility; credit spreads widened and the yield curve steepened as the market sold-off.
Stronger economic indicators drove monetary policy.
On December 14, the Fed hiked the short-term interest rate by 0.25% to reach a target range of 0.50% to 0.75%. This was the second rate increase in more than 10 years, with the Fed citing job gains and lower than expected unemployment of 4.6%. The Fed confirmed the continuation of an accommodative monetary policy to support a stronger labor market and reiterated its long-term objective of a 2% inflation rate, which increased slightly during the fourth quarter but fell short of the benchmark. The Fed expressed confidence in the economy’s progress and expects this positive trajectory to continue. Both sentiments helped to bolster the Fed’s expectation of three additional rate increases during 2017.
Meanwhile, the Bank of England continued its quantitative-easing program and lowered the official bank rate to 0.25% in August 2016. The Bank of Japan maintained its negative interest rate put in place earlier in the year, and in September announced an interest rate target for 10-year government bonds—keeping the yield at zero—as it struggles to accelerate economic growth. In December, the European Central Bank announced that it will extend its quantitative-easing program and continue purchasing large amounts of eurozone corporate and government debt each month through December 2017.
U.S. economic data released during the fourth quarter that U.S. real gross domestic product increased at an annual 3.5% rate in the third quarter, the largest increase since mid-2014. Business investment by U.S. companies was mixed, with a 12.0% increase in structures and 4.5% decrease in equipment over the prior quarter on an annualized basis. Consumer confidence hit pre-recession levels for the first time in November, and increased again in December. The dollar strengthened during the quarter’s post-election period.
Supply and demand trends reflected volatility of municipals.
Demand for municipal debt, as measured by cash flows to municipal bond mutual funds, was negative for the reporting period. There were $19 billion of inflows from July through October, but a sharp reversal occurred post-election, with $26 billion of redemptions in the last two months of the year. This followed a
| 1 | The Bloomberg Barclays Municipal Bond Index (formerly known as Barclays Municipal Bond Index) is an unmanaged index composed of long-term tax-exempt bonds with a minimum credit rating of Baa. You cannot invest directly in an index. |
| | | | | | |
| Letter to shareholders (unaudited) | | Wells Fargo Minnesota Tax-Free Fund | | | 3 | |
noteworthy 54 consecutive weeks of inflows. On the supply side, August through October saw 30-year record-breaking volumes each month; both refundings and new issuance were up. These levels were attributed to deals pulled forward in anticipation of higher interest rates. Not surprisingly, December volume was down 25% year-over-year to $19 billion. Total municipal bond issuance for the period was $219 billion; new issuance outpaced refundings by $18 billion.
Municipal credit fundamentals were solid.
Overall, municipal credit was sound for the period. The most significant development was the election of Ricardo Rossello as governor of the Commonwealth of Puerto Rico. In the past, prices of Puerto Rico bonds reflected negative credit considerations, including defaults on its securities in 2015 and early 2016, but recent events point to a potentially more positive fiscal environment. Rossello campaigned, in part, on a platform that included promises to ultimately pay 100% of interest due on Puerto Rico’s outstanding municipal debt, negotiate with bondholders, and ration government expenditures. This stance is a major shift from his predecessor who focused on a bankruptcy mechanism.
Since the end of the financial crisis, structural changes in the fixed-income markets have reduced trading liquidity (the degree to which assets can be bought or sold without affecting the price). New regulations and capital requirements have caused traditional liquidity suppliers (banks and broker/dealers) to be more risk averse and hold less inventory. Meanwhile, corporate debt issuance has spiked as companies finance themselves at record-low yields, bond mutual funds hold larger amounts of this new debt supply, trading volumes are lower, and large-size trades are more difficult to execute. However, fixed-income markets appeared to function well over the past year with sufficient liquidity.
Don’t let short-term uncertainty derail long-term investment goals.
Periods of uncertainty can present challenges, but experience has taught us that maintaining long-term investment goals can be an effective way to plan for the future. To help you create a sound strategy based on your personal goals and risk tolerance, Wells Fargo Funds offers more than 100 mutual funds spanning a wide range of asset classes and investment styles. Although diversification cannot guarantee an investment profit or prevent losses, we believe it can be an effective way to manage investment risk and potentially smooth out overall portfolio performance. We encourage investors to know their investments and to understand that appropriate levels of risk-taking may unlock opportunities.
Thank you for choosing to invest in Wells Fargo Funds. We appreciate your confidence in us and remain committed to helping you meet your financial needs.
Sincerely,

Andrew Owen
President
Wells Fargo Funds
Periods of uncertainty can present challenges, but experience has taught us that maintaining long-term investment goals can be an effective way to plan for the future.
For further information about your Fund, contact your investment professional, visit our website at wellsfargofunds.com, or call us directly at 1-800-222-8222. We are available 24 hours a day, 7 days a week.
| | | | |
| 4 | | Wells Fargo Minnesota Tax-Free Fund | | Performance highlights (unaudited) |
Investment objective
The Fund seeks current income exempt from federal income tax and Minnesota individual income tax.
Manager
Wells Fargo Funds Management, LLC
Subadviser
Wells Capital Management Incorporated
Portfolio managers
Wendy Casetta
Bruce R. Johns
Average annual total returns (%) as of December 31, 20161
| | | | | | | | | | | | | | | | | | | | | | | | | | | | | | | | | | |
| | | | | Including sales charge | | | Excluding sales charge | | | Expense ratios2 (%) | |
| | | Inception date | | 1 year | | | 5 year | | | 10 year | | | 1 year | | | 5 year | | | 10 year | | | Gross | | | Net3 | |
| Class A (NMTFX) | | 1-2-1988 | | | (4.11 | ) | | | 1.88 | | | | 3.19 | | | | 0.41 | | | | 2.83 | | | | 3.66 | | | | 0.89 | | | | 0.85 | |
| Class C (WMTCX) | | 4-8-2005 | | | (1.34 | ) | | | 2.06 | | | | 2.90 | | | | (0.34 | ) | | | 2.06 | | | | 2.90 | | | | 1.64 | | | | 1.60 | |
| Administrator Class (NWMIX) | | 8-2-1993 | | | – | | | | – | | | | – | | | | 0.56 | | | | 3.08 | | | | 3.92 | | | | 0.83 | | | | 0.60 | |
| Institutional Class (WMTIX) | | 10-31-2016 | | | – | | | | – | | | | – | | | | 0.66 | | | | 3.10 | | | | 3.93 | | | | 0.56 | | | | 0.52 | |
| Bloomberg Barclays Municipal Bond Index4 | | – | | | – | | | | – | | | | – | | | | 0.25 | | | | 3.28 | | | | 4.25 | | | | – | | | | – | |
| Bloomberg Barclays Minnesota Municipal Bond Index5 | | – | | | – | | | | – | | | | – | | | | (0.30 | ) | | | 2.68 | | | | 4.08 | | | | – | | | | – | |
Figures quoted represent past performance, which is no guarantee of future results, and do not reflect taxes that a shareholder may pay on fund distributions or the redemption of fund shares. Investment return and principal value of an investment will fluctuate so that an investor’s shares, when redeemed, may be worth more or less than their original cost. Performance shown without sales charges would be lower if sales charges were reflected. Current performance may be lower or higher than the performance data quoted, which assumes the reinvestment of dividends and capital gains. Current month-end performance is available on the Fund’s website, wellsfargofunds.com.
Index returns do not include transaction costs associated with buying and selling securities, any mutual fund fees or expenses, or any taxes. It is not possible to invest directly in an index.
For Class A shares, the maximum front-end sales charge is 4.50%. For Class C shares, the maximum contingent deferred sales charge is 1.00%. Performance including a contingent deferred sales charge assumes the sales charge for the corresponding time period. Administrator Class and Institutional Class shares are sold without a front-end sales charge or contingent deferred sales charge.
Bond values fluctuate in response to the financial condition of individual issuers, general market and economic conditions, and changes in interest rates. Changes in market conditions and government policies may lead to periods of heightened volatility in the bond market and reduced liquidity for certain bonds held by the Fund. In general, when interest rates rise, bond values fall and investors may lose principal value. Interest-rate changes and their impact on the Fund and its share price can be sudden and unpredictable. The use of derivatives may reduce returns and/or increase volatility. Certain investment strategies tend to increase the total risk of an investment (relative to the broader market). The Fund is exposed to Minnesota municipal securities risk and high-yield securities risk. Consult the Fund’s prospectus for additional information on these and other risks. A portion of the Fund’s income may be subject to federal, state, and/ or local income taxes or the Alternative Minimum Tax (AMT). Any capital gains distributions may be taxable.
Please see footnotes on page 5.
| | | | | | |
| Performance highlights (unaudited) | | Wells Fargo Minnesota Tax-Free Fund | | | 5 | |
|
| Effective maturity distribution as of December 31, 20166 |
|
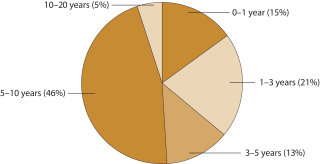
|
|
| Credit quality as of December 31, 20167 |
|
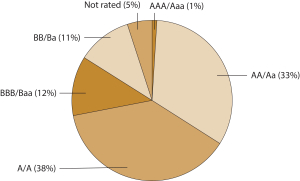 |
| 1 | Historical performance shown for the Institutional Class shares prior to their inception reflects the performance of the Administrator Class shares, and is not adjusted to reflect Institutional Class expenses. If these expenses had been included, returns for Institutional Class would be higher. |
| 2 | Reflects the expense ratios as stated in the most recent prospectuses. The expense ratios shown are subject to change and may differ from the annualized expense ratios shown in the financial highlights of this report. |
| 3 | The manager has contractually committed through October 31, 2017, to waive fees and/or reimburse expenses to the extent necessary to cap the Fund’s Total Annual Fund Operating Expenses After Fee Waiver at the amounts shown. After this time, the cap may be increased or the commitment to maintain the cap may be terminated only with the approval of the Board of Trustees. Brokerage commissions, stamp duty fees, interest, taxes, acquired fund fees and expenses, and extraordinary expenses are excluded from the expense cap. Without this cap, the Fund’s returns would have been lower. |
| 4 | The Bloomberg Barclays Municipal Bond Index (formerly known as Barclays Municipal Bond Index) is an unmanaged index composed of long-term tax-exempt bonds with a minimum credit rating of Baa. You cannot invest directly in an index. |
| 5 | The Bloomberg Barclays Minnesota Municipal Bond Index (formerly known as Barclays Minnesota Municipal Bond Index) is the Minnesota component of the Bloomberg Barclays Municipal Bond Index. You cannot invest directly in an index. |
| 6 | Amounts are calculated based on the total investments of the Fund. These amounts are subject to change and may have changed since the date specified. |
| 7 | The credit quality distribution of portfolio holdings reflected in the chart is based on ratings from Standard & Poor’s, Moody’s Investors Service, and/ or Fitch Ratings Ltd. Credit quality ratings apply to the underlying holdings of the Fund and not to the Fund itself. The percentages of the Fund’s portfolio with the ratings depicted in the chart are calculated based on the total market value of fixed income securities held by the Fund. If a security was rated by all three rating agencies, the middle rating was utilized. If rated by two of three rating agencies, the lower rating was utilized, and if rated by one of the rating agencies, that rating was utilized. Standard & Poor’s rates the creditworthiness of bonds, ranging from AAA (highest) to D (lowest). Ratings from A to CCC may be modified by the addition of a plus (+) or minus (-) sign to show relative standing within the rating categories. Standard & Poor’s rates the creditworthiness of short-term notes from SP-1 (highest) to SP-3 (lowest). Moody’s rates the creditworthiness of bonds, ranging from Aaa (highest) to C (lowest). Ratings Aa to B may be modified by the addition of a number 1 (highest) to 3 (lowest) to show relative standing within the ratings categories. Moody’s rates the creditworthiness of short-term U.S. tax-exempt municipal securities from MIG 1/VMIG 1 (highest) to SG (lowest). Fitch rates the creditworthiness of bonds, ranging from AAA (highest) to D (lowest). Credit quality distribution is subject to change and may have changed since the date specified. |
| | | | |
| 6 | | Wells Fargo Minnesota Tax-Free Fund | | Fund expenses (unaudited) |
As a shareholder of the Fund, you incur two types of costs: (1) transaction costs, including sales charges (loads) on purchase payments and contingent deferred sales charges (if any) on redemptions and (2) ongoing costs, including management fees, distribution (12b-1) and/or shareholder servicing fees, and other Fund expenses. This example is intended to help you understand your ongoing costs (in dollars) of investing in the Fund and to compare these costs with the ongoing costs of investing in other mutual funds.
The example is based on an investment of $1,000 invested at the beginning of the six-month period and held for the entire period from July 1, 2016 to December 31, 2016.
Actual expenses
The “Actual” line of the table below provides information about actual account values and actual expenses. You may use the information in this line, together with the amount you invested, to estimate the expenses that you paid over the period. Simply divide your account value by $1,000 (for example, an $8,600 account value divided by $1,000 = 8.6), then multiply the result by the number in the “Actual” line under the heading entitled “Expenses paid during period” for your applicable class of shares to estimate the expenses you paid on your account during this period.
Hypothetical example for comparison purposes
The “Hypothetical” line of the table below provides information about hypothetical account values and hypothetical expenses based on the Fund’s actual expense ratio and an assumed rate of return of 5% per year before expenses, which is not the Fund’s actual return. The hypothetical account values and expenses may not be used to estimate the actual ending account balance or expenses you paid for the period. You may use this information to compare the ongoing costs of investing in the Fund and other funds. To do so, compare this 5% hypothetical example with the 5% hypothetical examples that appear in the shareholder reports of the other funds.
Please note that the expenses shown in the table are meant to highlight your ongoing costs only and do not reflect any transactional costs, such as sales charges (loads) and contingent deferred sales charges. Therefore, the “Hypothetical” line of the table is useful in comparing ongoing costs only and will not help you determine the relative total costs of owning different funds. In addition, if these transactional costs were included, your costs would have been higher.
| | | | | | | | | | | | | | | | |
| | | Beginning account value 7-1-2016 | | | Ending account value 12-31-2016 | | | Expenses paid during the period¹ | | | Annualized net expense ratio | |
Class A | | | | | | | | | | | | | | | | |
Actual | | $ | 1,000.00 | | | $ | 971.86 | | | $ | 4.21 | | | | 0.85 | % |
Hypothetical (5% return before expenses) | | $ | 1,000.00 | | | $ | 1,020.86 | | | $ | 4.32 | | | | 0.85 | % |
Class C | | | | | | | | | | | | | | | | |
Actual | | $ | 1,000.00 | | | $ | 968.19 | | | $ | 7.92 | | | | 1.60 | % |
Hypothetical (5% return before expenses) | | $ | 1,000.00 | | | $ | 1,017.09 | | | $ | 8.11 | | | | 1.60 | % |
Administrator Class | | | | | | | | | | | | | | | | |
Actual | | $ | 1,000.00 | | | $ | 972.17 | | | $ | 2.97 | | | | 0.60 | % |
Hypothetical (5% return before expenses) | | $ | 1,000.00 | | | $ | 1,022.12 | | | $ | 3.05 | | | | 0.60 | % |
Institutional Class | | | | | | | | | | | | | | | | |
Actual | | $ | 1,000.00 | | | $ | 973.13 | | | $ | 2.58 | | | | 0.52 | % |
Hypothetical (5% return before expenses) | | $ | 1,000.00 | | | $ | 1,022.52 | | | $ | 2.64 | | | | 0.52 | % |
| 1 | Expenses paid is equal to the annualized net expense ratio of each class multiplied by the average account value over the period, multiplied by the number of days in the most recent fiscal half-year divided by the number of days in the fiscal year (to reflect the one-half-year period). |
| | | | | | |
| Portfolio of investments—December 31, 2016 (unaudited) | | Wells Fargo Minnesota Tax-Free Fund | | | 7 | |
| | | | | | | | | | | | | | | | |
| Security name | | Interest rate | | | Maturity date | | | Principal | | | Value | |
| | | | |
Municipal Obligations: 98.48% | | | | | | | | | | | | | | | | |
| | | | |
| Guam: 2.11% | | | | | | | | | | | | | | | | |
Guam Government Business Privilege Tax Series D (Tax Revenue) | | | 5.00 | % | | | 11-15-2022 | | | $ | 500,000 | | | $ | 559,160 | |
Guam Government Limited Obligation Series A (Tax Revenue) | | | 5.00 | | | | 12-1-2028 | | | | 1,000,000 | | | | 1,143,160 | |
Guam Government Waterworks Authority Water & Wastewater System Project Series 2013 (Water & Sewer Revenue) | | | 5.25 | | | | 7-1-2022 | | | | 865,000 | | | | 965,617 | |
Guam International Airport Authority Series 2013A (Airport Revenue) | | | 5.00 | | | | 10-1-2017 | | | | 200,000 | | | | 204,804 | |
Guam International Airport Authority Series 2013A (Airport Revenue) | | | 5.00 | | | | 10-1-2018 | | | | 100,000 | | | | 105,236 | |
Guam International Airport Authority Series 2013B (Airport Revenue) | | | 5.00 | | | | 10-1-2017 | | | | 300,000 | | | | 307,743 | |
| | | | |
| | | | | | | | | | | | | | | 3,285,720 | |
| | | | | | | | | | | | | | | | |
| | | | |
| Minnesota: 96.02% | | | | | | | | | | | | | | | | |
Anoka County MN Capital Improvement Series A (GO Revenue) | | | 5.00 | | | | 2-1-2024 | | | | 500,000 | | | | 518,850 | |
Anoka County MN Charter School Series A (Education Revenue) | | | 3.40 | | | | 6-1-2019 | | | | 225,000 | | | | 226,611 | |
Anoka County MN Charter School Series A (Education Revenue) | | | 3.65 | | | | 6-1-2020 | | | | 185,000 | | | | 186,894 | |
Anoka County MN Charter School Series A (Education Revenue) | | | 3.75 | | | | 6-1-2021 | | | | 245,000 | | | | 246,982 | |
Anoka County MN Charter School Series A (Education Revenue) | | | 5.00 | | | | 6-1-2027 | | | | 510,000 | | | | 540,263 | |
Anoka County MN Charter School Series A (Education Revenue) | | | 5.00 | | | | 6-1-2032 | | | | 300,000 | | | | 315,519 | |
Anoka County MN Charter School Series A (Education Revenue) | | | 5.00 | | | | 6-1-2043 | | | | 1,100,000 | | | | 1,142,603 | |
Anoka Hennepin MN Independent School District #11 Certificate of Participation Series 2014A (Miscellaneous Revenue) | | | 5.00 | | | | 2-1-2034 | | | | 1,000,000 | | | | 1,109,270 | |
Austin MN Housing & RDA Courtyard Residence Project Series A (Housing Revenue) | | | 5.00 | | | | 1-1-2031 | | | | 1,500,000 | | | | 1,553,445 | |
Brooklyn Park MN Charter School Athlos Leadership Academy Project Series 2015A (Education Revenue) | | | 4.00 | | | | 7-1-2020 | | | | 245,000 | | | | 243,341 | |
Brooklyn Park MN Charter School Athlos Leadership Academy Project Series 2015A (Education Revenue) | | | 5.50 | | | | 7-1-2040 | | | | 750,000 | | | | 720,398 | |
Brooklyn Park MN Charter School Prairie Seeds Academy Project Series 2015A (Miscellaneous Revenue) | | | 5.00 | | | | 3-1-2034 | | | | 1,500,000 | | | | 1,494,765 | |
Center City MN Health Care Facilities Hazelden Betty Ford Foundation Project Series 2011 (Miscellaneous Revenue) | | | 5.00 | | | | 11-1-2041 | | | | 1,400,000 | | | | 1,453,858 | |
Center City MN Health Care Facilities Hazelden Betty Ford Foundation Project Series 2014 (Health Revenue) | | | 5.00 | | | | 11-1-2026 | | | | 750,000 | | | | 858,150 | |
Center City MN Health Care Facilities Hazelden Betty Ford Foundation Project Series 2014 (Health Revenue) | | | 5.00 | | | | 11-1-2027 | | | | 500,000 | | | | 568,970 | |
Center City MN Health Care Facilities Hazelden Betty Ford Foundation Project Series 2014 (Health Revenue) | | | 5.00 | | | | 11-1-2029 | | | | 300,000 | | | | 338,667 | |
Central Minnesota Municipal Power Agency Brookings Southeast Twin Cities Transmission Project Series 2012 (Utilities Revenue) | | | 5.00 | | | | 1-1-2042 | | | | 1,500,000 | | | | 1,628,955 | |
Cologne MN Charter School Cologne Academy Project Series 2014A (Education Revenue) | | | 5.00 | | | | 7-1-2029 | | | | 590,000 | | | | 625,170 | |
Cologne MN Charter School Cologne Academy Project Series 2014A (Education Revenue) | | | 5.00 | | | | 7-1-2034 | | | | 500,000 | | | | 519,640 | |
Columbus MN Charter School New Millennium Academy Project Series 2015A (Education Revenue) | | | 5.50 | | | | 7-1-2030 | | | | 1,000,000 | | | | 973,090 | |
Dakota County MN Community Development Agency SFMR (Housing Revenue, GNMA/FNMA/FHLMC Insured) | | | 5.30 | | | | 12-1-2039 | | | | 41,154 | | | | 41,740 | |
Deephaven MN Charter School Eagle Ridge Academy Project Series 2015A (Education Revenue) | | | 5.25 | | | | 7-1-2040 | | | | 500,000 | | | | 506,500 | |
Deephaven MN Charter School Eagle Ridge Academy Project Series 2016A (Education Revenue) | | | 4.00 | | | | 7-1-2027 | | | | 100,000 | | | | 94,249 | |
Deephaven MN Charter School Eagle Ridge Academy Project Series A (Education Revenue) | | | 5.25 | | | | 7-1-2037 | | | | 400,000 | | | | 407,412 | |
The accompanying notes are an integral part of these financial statements.
| | | | |
| 8 | | Wells Fargo Minnesota Tax-Free Fund | | Portfolio of investments—December 31, 2016 (unaudited) |
| | | | | | | | | | | | | | | | |
| Security name | | Interest rate | | | Maturity date | | | Principal | | | Value | |
| | | | |
| Minnesota (continued) | | | | | | | | | | | | | | | | |
Deephaven MN Charter School Eagle Ridge Academy Project Series 2016A (Education Revenue) | | | 4.00 | % | | | 7-1-2025 | | | $ | 125,000 | | | $ | 120,625 | |
Deephaven MN Charter School Eagle Ridge Academy Project Series 2016A (Education Revenue) | | | 4.00 | | | | 7-1-2026 | | | | 100,000 | | | | 95,497 | |
Duluth MN Housing & RDA Public School Academy Series 2010A (Education Revenue) | | | 5.60 | | | | 11-1-2030 | | | | 2,000,000 | | | | 2,044,060 | |
Duluth MN Independent School District No. 709 St. Louis County Certificate of Participation Series 2016A (Miscellaneous Revenue, South Dakota Credit Program Insured) | | | 5.00 | | | | 2-1-2026 | | | | 1,000,000 | | | | 1,179,110 | |
Forest Lakes MN Charter School Lakes International Language Academy Project Series 2014A (Education Revenue) | | | 5.50 | | | | 8-1-2036 | | | | 500,000 | | | | 527,540 | |
Glencoe MN HCFR Glencoe Regional Health Services Project Series 2013 (Health Revenue) | | | 4.00 | | | | 4-1-2022 | | | | 735,000 | | | | 776,777 | |
Goodhue County MN Education District #6051 Red Wing Certificate of Participation Series 2014A (Miscellaneous Revenue) | | | 5.00 | | | | 2-1-2029 | | | | 750,000 | | | | 838,785 | |
Ham Lake MN Charter School Parnassus Preparatory School Project Series A (Education Revenue) | | | 4.00 | | | | 11-1-2026 | | | | 1,000,000 | | | | 949,860 | |
Ham Lake MN Charter School Da Vinci Academy Project Series 2012A (Education Revenue) | | | 4.00 | | | | 7-1-2028 | | | | 370,000 | | | | 348,444 | |
Ham Lake MN Charter School Da Vinci Academy Project Series 2016A (Education Revenue) | | | 5.00 | | | | 7-1-2031 | | | | 625,000 | | | | 616,131 | |
Hayward MN HCFR St. John’s Lutheran Home of Albert Lea Project Series 2015 (Health Revenue) | | | 2.75 | | | | 11-1-2017 | | | | 500,000 | | | | 503,115 | |
Hugo MN Charter School Lease Revenue Bonds Noble Academy Project Series 2014A (Education Revenue) | | | 5.00 | | | | 7-1-2029 | | | | 600,000 | | | | 605,226 | |
Hutchinson MN Public Utility Revenue Refunding Bonds Series 2012A (Utilities Revenue) | | | 5.00 | | | | 12-1-2026 | | | | 700,000 | | | | 795,165 | |
Maple Grove MN HCFR North Memorial Health Care Series 2015 (Health Revenue) | | | 5.00 | | | | 9-1-2023 | | | | 655,000 | | | | 754,992 | |
Maple Grove MN Maple Grove Hospital Corporation (Health Revenue) | | | 5.25 | | | | 5-1-2024 | | | | 1,735,000 | | | | 1,754,571 | |
Meeker County MN Memorial Hospital Project Series 2007 (Health Revenue) | | | 5.63 | | | | 11-1-2022 | | | | 800,000 | | | | 815,264 | |
Minneapolis & St. Paul MN Housing & RDA Children’s Health Care Facilities Series A (Health Revenue) | | | 5.25 | | | | 8-15-2025 | | | | 1,000,000 | | | | 1,102,670 | |
Minneapolis & St. Paul MN Housing & RDA Children’s Health Care Facilities Series A (Health Revenue) | | | 5.25 | | | | 8-15-2035 | | | | 1,000,000 | | | | 1,097,620 | |
Minneapolis & St. Paul MN Housing & RDA HealthSpan Series B (Health Revenue, Ambac Insured) ±(m)(n) | | | 0.95 | | | | 11-15-2017 | | | | 820,000 | | | | 815,900 | |
Minneapolis & St. Paul MN Metropolitan Airports Commission Sub Series 2014A (Airport Revenue) | | | 5.00 | | | | 1-1-2029 | | | | 500,000 | | | | 564,420 | |
Minneapolis & St. Paul MN Metropolitan Airports Commission Sub Series 2014B (Airport Revenue) | | | 5.00 | | | | 1-1-2026 | | | | 500,000 | | | | 558,055 | |
Minneapolis & St. Paul MN Metropolitan Airports Commission Sub Series B (Airport Revenue, National Insured) | | | 5.00 | | | | 1-1-2018 | | | | 1,000,000 | | | | 1,000,110 | |
Minneapolis MN Charter School Yinghua Academy Project Series 2013A (Education Revenue) | | | 5.00 | | | | 7-1-2023 | | | | 300,000 | | | | 312,840 | |
Minneapolis MN Development Limited Tax Supported Common Bond Series 2A (Miscellaneous Revenue) | | | 5.00 | | | | 6-1-2028 | | | | 1,115,000 | | | | 1,122,560 | |
Minneapolis MN Development Limited Tax Supported Common Bond Series 2A (Miscellaneous Revenue) | | | 6.00 | | | | 12-1-2040 | | | | 1,000,000 | | | | 1,131,040 | |
Minneapolis MN Fairview Health Services Series A (Health Revenue, AGM Insured) | | | 6.63 | | | | 11-15-2028 | | | | 1,000,000 | | | | 1,098,650 | |
Minneapolis MN Health Care System Fairview Health Services Series 2015A (Health Revenue) | | | 5.00 | | | | 11-15-2033 | | | | 2,000,000 | | | | 2,253,100 | |
Minneapolis MN Health Care System Revenue Prerefunded Bond (Health Revenue, AGC Insured) | | | 6.50 | | | | 11-15-2038 | | | | 345,000 | | | | 378,237 | |
The accompanying notes are an integral part of these financial statements.
| | | | | | |
| Portfolio of investments—December 31, 2016 (unaudited) | | Wells Fargo Minnesota Tax-Free Fund | | | 9 | |
| | | | | | | | | | | | | | | | |
| Security name | | Interest rate | | | Maturity date | | | Principal | | | Value | |
| | | | |
| Minnesota (continued) | | | | | | | | | | | | | | | | |
Minneapolis MN Health Care System Revenue Unrefunded Bond (Health Revenue, AGC Insured) | | | 6.50 | % | | | 11-15-2038 | | | $ | 1,890,000 | | | $ | 2,039,197 | |
Minneapolis MN Plymouth Stevens House Project Series A (Housing Revenue) | | | 1.00 | | | | 12-1-2017 | | | | 1,000,000 | | | | 996,870 | |
Minneapolis MN Seward Towers Apartments Project Series A (Housing Revenue) | | | 1.10 | | | | 1-1-2018 | | | | 2,000,000 | | | | 1,995,240 | |
Minneapolis MN Student Housing Riverton Community Housing Project Series 2014 (Housing Revenue) | | | 5.00 | | | | 8-1-2032 | | | | 860,000 | | | | 839,953 | |
Minneapolis St Paul MN Metropolitan Airport Commission Series 2016D (Airport Revenue) | | | 5.00 | | | | 1-1-2041 | | | | 250,000 | | | | 273,465 | |
Minneapolis St. Paul MN Metropolitan Airport Commission Series 2016C (Airport Revenue) | | | 5.00 | | | | 1-1-2046 | | | | 1,000,000 | | | | 1,134,710 | |
Minnesota Agricultural & Economic Development Board Health Care Essentia Health Series C1 (Health Revenue, AGC Insured) | | | 4.00 | | | | 2-15-2020 | | | | 50,000 | | | | 53,206 | |
Minnesota Agricultural & Economic Development Board Health Care Essentia Health Series C1 (Health Revenue, AGC Insured) | | | 5.00 | | | | 2-15-2030 | | | | 2,000,000 | | | | 2,144,360 | |
Minnesota Agricultural & Economic Development Board Health Care Essentia Health Series E (Health Revenue, AGC Insured) | | | 5.00 | | | | 2-15-2037 | | | | 4,030,000 | | | | 4,128,292 | |
Minnesota Certificate of Participation Legislative Office Facility Project Series 2014 (Miscellaneous Revenue) | | | 5.00 | | | | 6-1-2023 | | | | 435,000 | | | | 505,070 | |
Minnesota General Fund Appropriation Bonds Series 2012B (Miscellaneous Revenue) | | | 5.00 | | | | 3-1-2027 | | | | 2,000,000 | | | | 2,248,580 | |
Minnesota General Fund Appropriation Bonds Series 2012B (Miscellaneous Revenue) | | | 5.00 | | | | 3-1-2028 | | | | 2,000,000 | | | | 2,269,920 | |
Minnesota General Fund Appropriation Bonds Series 2012B (Miscellaneous Revenue) | | | 5.00 | | | | 3-1-2029 | | | | 2,000,000 | | | | 2,264,000 | |
Minnesota General Fund Appropriation Bonds Series 2014A (Miscellaneous Revenue) | | | 5.00 | | | | 6-1-2033 | | | | 1,000,000 | | | | 1,126,540 | |
Minnesota HEFAR Bethel University Series 6R (Education Revenue) | | | 5.50 | | | | 5-1-2025 | | | | 1,535,000 | | | | 1,543,489 | |
Minnesota HEFAR Carleton College Series 7D (Education Revenue) | | | 5.00 | | | | 3-1-2030 | | | | 2,000,000 | | | | 2,123,880 | |
Minnesota HEFAR College of St. Scholastica Series 7R (Education Revenue) | | | 4.25 | | | | 12-1-2027 | | | | 400,000 | | | | 412,984 | |
Minnesota HEFAR Hamline University Series 7E (Education Revenue) | | | 4.50 | | | | 10-1-2021 | | | | 300,000 | | | | 312,969 | |
Minnesota HEFAR Hamline University Series 7E (Education Revenue) | | | 5.00 | | | | 10-1-2029 | | | | 500,000 | | | | 518,645 | |
Minnesota HEFAR St. Benedict College Series 7M (Education Revenue) | | | 5.13 | | | | 3-1-2036 | | | | 275,000 | | | | 290,397 | |
Minnesota HEFAR St. Benedict College Series 7V (Education Revenue) | | | 5.00 | | | | 3-1-2018 | | | | 635,000 | | | | 659,028 | |
Minnesota HEFAR St. Olaf College Series Eight-N (Education Revenue) | | | 4.00 | | | | 10-1-2025 | | | | 220,000 | | | | 241,571 | |
Minnesota HEFAR St. Olaf College Series Eight-N (Education Revenue) | | | 4.00 | | | | 10-1-2026 | | | | 100,000 | | | | 109,572 | |
Minnesota HEFAR St. Olaf College Series Eight-N (Education Revenue) | | | 4.00 | | | | 10-1-2027 | | | | 110,000 | | | | 119,359 | |
Minnesota HEFAR St. Olaf College Series Eight-N (Education Revenue) | | | 4.50 | | | | 10-1-2030 | | | | 500,000 | | | | 540,290 | |
Minnesota HEFAR St. Thomas University Series 7U (Education Revenue) | | | 5.00 | | | | 4-1-2023 | | | | 750,000 | | | | 863,528 | |
Minnesota HEFAR St. Thomas University Series 8-L (Education Revenue) | | | 5.00 | | | | 4-1-2024 | | | | 750,000 | | | | 870,000 | |
Minnesota HEFAR St. Thomas University Series 8-L (Education Revenue) | | | 5.00 | | | | 4-1-2028 | | | | 920,000 | | | | 1,069,077 | |
Minnesota HEFAR St. Thomas University Series 8-L (Education Revenue) | | | 5.00 | | | | 4-1-2029 | | | | 750,000 | | | | 865,635 | |
Minnesota HEFAR St. Thomas University Series 8-L (Education Revenue) | | | 5.00 | | | | 4-1-2035 | | | | 750,000 | | | | 839,483 | |
Minnesota Housing Finance Agency MFHR Series 2016 (Housing Revenue) ± | | | 0.70 | | | | 2-1-2019 | | | | 2,000,000 | | | | 1,999,220 | |
Minnesota Housing Finance Agency Residential Housing Series 2007Q (Housing Revenue) | | | 5.25 | | | | 7-1-2033 | | | | 625,000 | | | | 628,850 | |
Minnesota Housing Finance Agency Residential Housing Series 2009E (Housing Revenue) | | | 4.20 | | | | 7-1-2021 | | | | 955,000 | | | | 974,329 | |
Minnesota Housing Finance Agency Residential Housing Series 2012D (Housing Revenue, GNMA/FNMA/FHLMC Insured) | | | 4.00 | | | | 7-1-2040 | | | | 635,000 | | | | 655,580 | |
Minnesota Housing Finance Agency Series 2009B (Housing Revenue) | | | 5.90 | | | | 7-1-2028 | | | | 25,000 | | | | 25,761 | |
Minnesota Housing Finance Agency Series 2015A (Housing Revenue) | | | 5.00 | | | | 8-1-2027 | | | | 1,665,000 | | | | 1,933,614 | |
Minnesota Housing Finance Agency State Appropriation Bonds Series 2015A (Housing Revenue) | | | 5.00 | | | | 8-1-2032 | | | | 500,000 | | | | 568,475 | |
Minnesota Municipal Power Agency Series 2007 (Utilities Revenue) | | | 5.00 | | | | 10-1-2037 | | | | 1,200,000 | | | | 1,227,180 | |
The accompanying notes are an integral part of these financial statements.
| | | | |
| 10 | | Wells Fargo Minnesota Tax-Free Fund | | Portfolio of investments—December 31, 2016 (unaudited) |
| | | | | | | | | | | | | | | | |
| Security name | | Interest rate | | | Maturity date | | | Principal | | | Value | |
| | | | |
| Minnesota (continued) | | | | | | | | | | | | | | | | |
Minnesota Municipal Power Agency Series 2010A & Series 2010B (Utilities Revenue) | | | 5.00 | % | | | 10-1-2025 | | | $ | 2,335,000 | | | $ | 2,545,407 | |
Minnesota Prerefunded Bond (GO Revenue) | | | 5.00 | | | | 8-1-2022 | | | | 100,000 | | | | 102,395 | |
Minnetonka MN Independent School District #276 Series F (Miscellaneous Revenue) | | | 5.00 | | | | 2-1-2022 | | | | 175,000 | | | | 198,475 | |
Minnetonka MN Independent School District #276 Series F (Miscellaneous Revenue) | | | 5.00 | | | | 2-1-2023 | | | | 185,000 | | | | 212,787 | |
Minnetonka MN Independent School District #276 Series F (Miscellaneous Revenue) | | | 5.00 | | | | 2-1-2024 | | | | 195,000 | | | | 223,178 | |
Minnetonka MN Independent School District #276 Series F (Miscellaneous Revenue) | | | 5.00 | | | | 2-1-2025 | | | | 205,000 | | | | 236,818 | |
Mounds View MN Independent School District #621 Series A (GO Revenue, South Dakota Credit Program Insured) | | | 4.00 | | | | 2-1-2022 | | | | 530,000 | | | | 558,827 | |
Northeastern Minnesota Metropolitan Intermediate School District #916 Certificate of Participation Series 2013A (Miscellaneous Revenue) | | | 4.00 | | | | 2-1-2024 | | | | 1,100,000 | | | | 1,180,476 | |
Northeastern Minnesota Metropolitan Intermediate School District #916 Certificate of Participation Series 2015B (Miscellaneous Revenue) | | | 5.00 | | | | 2-1-2034 | | | | 1,000,000 | | | | 1,113,760 | |
Northern Minnesota Municipal Power Agency Series 2008A (Utilities Revenue, AGC Insured) | | | 5.00 | | | | 1-1-2018 | | | | 820,000 | | | | 850,881 | |
Northern Minnesota Municipal Power Agency Series 2008A (Utilities Revenue, AGC Insured) | | | 5.00 | | | | 1-1-2021 | | | | 50,000 | | | | 51,705 | |
Northern Minnesota Municipal Power Agency Series 2013A (Utilities Revenue) | | | 4.00 | | | | 1-1-2028 | | | | 450,000 | | | | 473,792 | |
Northern Minnesota Municipal Power Agency Series 2016 (Utilities Revenue) | | | 5.00 | | | | 1-1-2030 | | | | 520,000 | | | | 597,537 | |
Northern Minnesota Municipal Power Agency Series 2016 (Utilities Revenue) | | | 5.00 | | | | 1-1-2031 | | | | 350,000 | | | | 400,708 | |
Otsego MN Charter School Kaleidoscope Charter School Project Series 2014A (Education Revenue) | | | 4.15 | | | | 9-1-2024 | | | | 600,000 | | | | 601,536 | |
Otsego MN Charter School Kaleidoscope Charter School Project Series 2014A (Education Revenue) | | | 5.00 | | | | 9-1-2034 | | | | 1,100,000 | | | | 1,122,396 | |
Plymouth MN Certificate of Participation Intermediate School District #287 Series A (Miscellaneous Revenue) | | | 5.00 | | | | 2-1-2024 | | | | 250,000 | | | | 268,250 | |
Plymouth MN Intermediate School District #287 Certificate of Participation Series 2016A (Miscellaneous Revenue) | | | 4.00 | | | | 5-1-2027 | | | | 500,000 | | | | 532,825 | |
Plymouth MN Intermediate School District #287 Certificate of Participation Series 2016A (Miscellaneous Revenue) | | | 4.00 | | | | 5-1-2026 | | | | 500,000 | | | | 536,755 | |
Red Wing MN Senior Housing Deer Crest Project Series A (Health Revenue) | | | 5.00 | | | | 11-1-2032 | | | | 660,000 | | | | 676,394 | |
Red Wing MN Senior Housing Deer Crest Project Series A (Health Revenue) | | | 5.00 | | | | 11-1-2042 | | | | 560,000 | | | | 561,086 | |
Rice County MN Educational Facilities Shattuck-St. Mary’s School Project (Education Revenue) 144A | | | 5.00 | | | | 8-1-2022 | | | | 990,000 | | | | 1,032,540 | |
Rochester MN Electric Utility Revenue Series 2007C (Utilities Revenue) | | | 5.00 | | | | 12-1-2030 | | | | 355,000 | | | | 355,937 | |
Rochester MN Electric Utility Revenue Series 2013B (Utilities Revenue) | | | 5.00 | | | | 12-1-2023 | | | | 815,000 | | | | 959,997 | |
Rochester MN Electric Utility Revenue Series 2013B (Utilities Revenue) | | | 5.00 | | | | 12-1-2025 | | | | 315,000 | | | | 368,802 | |
Rochester MN Electric Utility Revenue Series 2013B (Utilities Revenue) | | | 5.00 | | | | 12-1-2026 | | | | 250,000 | | | | 291,323 | |
Rochester MN HCFR Mayo Clinic Series 2011 (Health Revenue) ± | | | 4.50 | | | | 11-15-2038 | | | | 200,000 | | | | 221,834 | |
Sartell MN Independent School District 748 St. Stephen Public Schools GO Series 2016A (GO Revenue, South Dakota Credit Program Insured) | | | 5.00 | | | | 2-1-2027 | | | | 1,250,000 | | | | 1,473,050 | |
Shakopee MN St. Francis Regional Medical Center Series 2014 (Health Revenue) | | | 5.00 | | | | 9-1-2027 | | | | 700,000 | | | | 792,687 | |
Shakopee MN St. Francis Regional Medical Center Series 2014 (Health Revenue) | | | 5.00 | | | | 9-1-2029 | | | | 725,000 | | | | 809,267 | |
South St. Paul MN Housing & RDA Airport Project Series 2007 (Industrial Development Revenue, AGC Insured) | | | 4.70 | | | | 9-1-2019 | | | | 230,000 | | | | 230,610 | |
South St. Paul MN Housing & RDA Airport Project Series 2007 (Industrial Development Revenue, AGC Insured) | | | 5.13 | | | | 9-1-2029 | | | | 500,000 | | | | 501,615 | |
Southern Minnesota Municipal Power Agency Series 1994A (Utilities Revenue, National Insured) ¤ | | | 0.00 | | | | 1-1-2020 | | | | 5,100,000 | | | | 4,778,547 | |
Southern Minnesota Municipal Power Agency Series 2009A (Utilities Revenue) | | | 5.25 | | | | 1-1-2030 | | | | 2,000,000 | | | | 2,154,860 | |
St. Cloud MN Charter School Lease Revenue Bonds Stride Academy Project Series 2016A (Miscellaneous Revenue) | | | 5.00 | | | | 4-1-2036 | | | | 750,000 | | | | 654,143 | |
The accompanying notes are an integral part of these financial statements.
| | | | | | |
| Portfolio of investments—December 31, 2016 (unaudited) | | Wells Fargo Minnesota Tax-Free Fund | | | 11 | |
| | | | | | | | | | | | | | | | |
| Security name | | Interest rate | | | Maturity date | | | Principal | | | Value | |
| | | | |
| Minnesota (continued) | | | | | | | | | | | | | | | | |
St. Cloud MN Health Care Revenue Bonds Series 2016A (Health Revenue) | | | 5.00 | % | | | 5-1-2030 | | | $ | 2,000,000 | | | $ | 2,302,420 | |
St. Cloud MN Health Care Revenue Bonds Series 2016A (Health Revenue) | | | 5.00 | | | | 5-1-2031 | | | | 2,000,000 | | | | 2,293,700 | |
St. Cloud MN Health Care Unrefunded Revenue Bonds CentraCare Health (Health Revenue) | | | 5.13 | | | | 5-1-2030 | | | | 125,000 | | | | 135,980 | |
St. Louis Park MN Nicollett Health Services Series 2009 (Health Revenue) | | | 5.50 | | | | 7-1-2029 | | | | 1,000,000 | | | | 1,098,930 | |
St. Paul MN Housing & RDA Allina Health Systems Series A1 (Health Revenue) | | | 5.00 | | | | 11-15-2024 | | | | 2,350,000 | | | | 2,561,289 | |
St. Paul MN Housing & RDA Charter School Hmog College Preparatory Academy Project Series 2016A (Education Revenue) | | | 5.25 | | | | 9-1-2031 | | | | 1,000,000 | | | | 988,850 | |
St. Paul MN Housing & RDA Charter School Lease Revenue German Immersion School Project Series 2013A (Education Revenue) | | | 4.00 | | | | 7-1-2023 | | | | 250,000 | | | | 249,150 | |
St. Paul MN Housing & RDA Charter School Lease Revenue Twin Cities Academy Project Series 2015A (Education Revenue) | | | 5.00 | | | | 7-1-2035 | | | | 925,000 | | | | 910,737 | |
St. Paul MN Housing & RDA Charter School Nova Classical Academy Project Series 2011A (Miscellaneous Revenue) | | | 6.63 | | | | 9-1-2042 | | | | 865,000 | | | | 1,040,742 | |
St. Paul MN Housing & RDA Health Care Facilities Refunding Bonds Series 2015A (Health Revenue) | | | 5.00 | | | | 7-1-2025 | | | | 250,000 | | | | 292,395 | |
St. Paul MN Housing & RDA HealthEast Care Systems Project Series 2015A (Health Revenue) | | | 4.00 | | | | 11-15-2017 | | | | 550,000 | | | | 562,557 | |
St. Paul MN Housing & RDA HealthEast Care Systems Project Series 2015A (Health Revenue) | | | 5.00 | | | | 11-15-2027 | | | | 1,000,000 | | | | 1,108,520 | |
St. Paul MN Housing & RDA HealthPartners Obligated Group Series 2015A (Health Revenue) | | | 5.00 | | | | 7-1-2031 | | | | 2,010,000 | | | | 2,266,315 | |
St. Paul MN Housing & RDA Hmong Academy Project Series A (Education Revenue) | | | 5.75 | | | | 9-1-2026 | | | | 650,000 | | | | 651,138 | |
St. Paul MN Housing & RDA Hmong Academy Project Series A (Education Revenue) | | | 6.00 | | | | 9-1-2036 | | | | 500,000 | | | | 500,920 | |
St. Paul MN Housing & RDA Hope Community Academy Project Series 2015A (Education Revenue) | | | 5.00 | | | | 12-1-2034 | | | | 1,645,000 | | | | 1,710,333 | |
St. Paul MN Housing & RDA Parking Facilities Project Series A (Transportation Revenue) | | | 5.00 | | | | 8-1-2035 | | | | 875,000 | | | | 931,595 | |
St. Paul MN Housing & RDA St. Paul Academy & Summit School Project (Education Revenue) | | | 5.00 | | | | 10-1-2024 | | | | 2,000,000 | | | | 2,051,780 | |
St. Paul MN Housing & RDA St. Paul Conservatory for Performing Artists Series A (Education Revenue) | | | 4.00 | | | | 3-1-2028 | | | | 150,000 | | | | 146,555 | |
St. Paul MN Housing RDA Healtheast Care System Project Series 2015A (Health Revenue) | | | 5.00 | | | | 11-15-2025 | | | | 1,000,000 | | | | 1,080,710 | |
St. Paul MN Port Authority Lease Revenue Freeman Office Building Series 2 (Miscellaneous Revenue) | | | 5.00 | | | | 12-1-2024 | | | | 2,000,000 | | | | 2,318,700 | |
Todd County MN United Hospital District BAN Lakewood Health System Series A (Health Revenue) | | | 1.30 | | | | 12-1-2018 | | | | 1,000,000 | | | | 993,810 | |
University of Minnesota Series 2009A (Education Revenue) | | | 5.00 | | | | 4-1-2021 | | | | 1,180,000 | | | | 1,267,993 | |
University of Minnesota Series 2009A (Education Revenue) | | | 5.13 | | | | 4-1-2034 | | | | 1,000,000 | | | | 1,071,570 | |
University of Minnesota State Supported Biomedical Science Series 2011B (Education Revenue) | | | 5.00 | | | | 8-1-2036 | | | | 1,000,000 | | | | 1,108,470 | |
Virginia MN Housing & RDA HCFR Series 2005 (Miscellaneous Revenue) | | | 5.25 | | | | 10-1-2025 | | | | 2,085,000 | | | | 2,088,878 | |
Western Minnesota Municipal Power Agency Series A (Utilities Revenue) | | | 5.00 | | | | 1-1-2027 | | | | 1,565,000 | | | | 1,788,388 | |
Western Minnesota Municipal Power Agency Series A (Utilities Revenue) | | | 5.00 | | | | 1-1-2030 | | | | 1,000,000 | | | | 1,128,440 | |
Western Minnesota Municipal Power Agency Series A (Utilities Revenue) | | | 5.00 | | | | 1-1-2031 | | | | 1,000,000 | | | | 1,161,910 | |
Western Minnesota Municipal Power Agency Series A (Utilities Revenue) | | | 5.00 | | | | 1-1-2032 | | | | 1,250,000 | | | | 1,413,588 | |
Willmar MN Rice Memorial Hospital Project Series 2012A (GO Revenue) | | | 5.00 | | | | 2-1-2026 | | | | 1,000,000 | | | | 1,109,300 | |
Winona MN Health Care Facilities Refunding Bond Series 2012 (Health Revenue) | | | 3.00 | | | | 7-1-2018 | | | | 295,000 | | | | 299,257 | |
Winona MN Health Care Facilities Refunding Bond Series 2012 (Health Revenue) | | | 5.00 | | | | 7-1-2034 | | | | 500,000 | | | | 525,040 | |
Woodbury MN Charter School Series A (Education Revenue) | | | 3.15 | | | | 12-1-2018 | | | | 190,000 | | | | 192,405 | |
The accompanying notes are an integral part of these financial statements.
| | | | |
| 12 | | Wells Fargo Minnesota Tax-Free Fund | | Portfolio of investments—December 31, 2016 (unaudited) |
| | | | | | | | | | | | | | | | |
| Security name | | Interest rate | | | Maturity date | | | Principal | | | Value | |
| | | | |
| Minnesota (continued) | | | | | | | | | | | | | | | | |
Woodbury MN Charter School Series A (Education Revenue) | | | 3.90 | % | | | 12-1-2022 | | | $ | 220,000 | | | $ | 226,444 | |
Woodbury MN Charter School Series A (Education Revenue) | | | 5.00 | | | | 12-1-2027 | | | | 215,000 | | | | 225,533 | |
Woodbury MN Charter School Series A (Education Revenue) | | | 5.00 | | | | 12-1-2032 | | | | 220,000 | | | | 228,664 | |
| | | | |
| | | | | | | | | | | | | | | 149,592,231 | |
| | | | | | | | | | | | | | | | |
| | | | |
| Puerto Rico: 0.01% | | | | | | | | | | | | | | | | |
Puerto Rico Public Finance Corporation Commonwealth Appropriation Bond Series B (Miscellaneous Revenue, Government Development Bank for Puerto Rico SPA) (s) | | | 5.50 | | | | 8-1-2031 | | | | 250,000 | | | | 20,000 | |
| | | | | | | | | | | | | | | | |
| | | | |
| Virgin Islands: 0.34% | | | | | | | | | | | | | | | | |
Virgin Islands PFA Matching Fund Loan Notes Senior Lien Series B (Tobacco Revenue, AGM Insured) | | | 5.00 | | | | 10-1-2025 | | | | 500,000 | | | | 535,545 | |
| | | | | | | | | | | | | | | | |
| | | | |
Total Municipal Obligations (Cost $150,468,113) | | | | | | | | | | | | | | | 153,433,496 | |
| | | | | | | | | | | | | | | | |
| | | | | | | | |
| Total investments in securities (Cost $150,468,113) * | | | 98.48 | % | | | 153,433,496 | |
Other assets and liabilities, net | | | 1.52 | | | | 2,362,813 | |
| | | | | | | | |
| Total net assets | | | 100.00 | % | | $ | 155,796,309 | |
| | | | | | | | |
| ± | Variable rate investment. The rate shown is the rate in effect at period end. |
| (m) | The security is an auction-rate security which has an interest rate that resets at predetermined short-term intervals through a Dutch auction. The rate shown is the rate in effect at period end. |
| (n) | The auction to set the interest rate on the security failed at period end due to insufficient investor interest. A failed auction does not itself cause a default. |
| 144A | The security may be resold in transactions exempt from registration, normally to qualified institutional buyers, pursuant to Rule 144A under the Securities Act of 1933. |
| ¤ | The security is issued in zero coupon form with no periodic interest payments. |
| (s) | The security is currently in default with regards to scheduled interest and/or principal payments. The Fund has stopped accruing interest on the security. |
| * | Cost for federal income tax purposes is $150,466,295 and unrealized gains (losses) consists of: |
| | | | |
Gross unrealized gains | | $ | 4,272,479 | |
Gross unrealized losses | | | (1,305,278 | ) |
| | | | |
Net unrealized gains | | $ | 2,967,201 | |
The accompanying notes are an integral part of these financial statements.
| | | | | | |
| Statement of assets and liabilities—December 31, 2016 (unaudited) | | Wells Fargo Minnesota Tax-Free Fund | | | 13 | |
| | | | |
| | | | |
| |
Assets | | | | |
Investment in unaffiliated securities, at value (cost $150,468,113) | | $ | 153,433,496 | |
Cash | | | 2,726,816 | |
Receivable for investments sold | | | 90,124 | |
Receivable for Fund shares sold | | | 203,346 | |
Receivable for interest | | | 2,038,668 | |
Prepaid expenses and other assets | | | 27,861 | |
| | | | |
Total assets | | | 158,520,311 | |
| | | | |
| |
Liabilities | | | | |
Distributions payable | | | 107,125 | |
Payable for Fund shares redeemed | | | 2,457,831 | |
Management fee payable | | | 23,858 | |
Distribution fee payable | | | 6,614 | |
Administration fees payable | | | 17,453 | |
Accrued expenses and other liabilities | | | 111,121 | |
| | | | |
Total liabilities | | | 2,724,002 | |
| | | | |
Total net assets | | $ | 155,796,309 | |
| | | | |
| |
NET ASSETS CONSIST OF | | | | |
Paid-in capital | | $ | 152,258,062 | |
Undistributed net investment income | | | 625,178 | |
Accumulated net realized losses on investments | | | (52,314 | ) |
Net unrealized gains on investments | | | 2,965,383 | |
| | | | |
Total net assets | | $ | 155,796,309 | |
| | | | |
| |
COMPUTATION OF NET ASSET VALUE AND OFFERING PRICE PER SHARE | | | | |
Net assets – Class A | | $ | 42,207,547 | |
Shares outstanding – Class A1 | | | 3,994,788 | |
Net asset value per share – Class A | | | $10.57 | |
Maximum offering price per share – Class A2 | | | $11.07 | |
Net assets – Class C | | $ | 9,661,703 | |
Shares outstanding – Class C1 | | | 914,473 | |
Net asset value per share – Class C | | | $10.57 | |
Net assets – Administrator Class | | $ | 99,382,458 | |
Shares outstanding – Administrator Class1 | | | 9,409,116 | |
Net asset value per share – Administrator Class | | | $10.56 | |
Net assets – Institutional Class | | $ | 4,544,601 | |
Shares outstanding – Institutional Class1 | | | 429,941 | |
Net asset value per share – Institutional Class | | | $10.57 | |
| 1 | The Fund has an unlimited number of authorized shares. |
| 2 | Maximum offering price is computed as 100/95.50 of net asset value. On investments of $50,000 or more, the offering price is reduced. |
The accompanying notes are an integral part of these financial statements.
| | | | |
| 14 | | Wells Fargo Minnesota Tax-Free Fund | | Statement of operations—six months ended December 31, 2016 (unaudited) |
| | | | |
| | | | |
| |
Investment income | | | | |
Interest | | $ | 3,199,879 | |
| | | | |
| |
Expenses | | | | |
Management fee | | | 365,518 | |
Administration fees | | | | |
Class A | | | 36,362 | |
Class C | | | 8,467 | |
Administrator Class | | | 62,801 | |
Institutional Class | | | 448 | 1 |
Shareholder servicing fees | | | | |
Class A | | | 56,816 | |
Class C | | | 13,229 | |
Administrator Class | | | 157,002 | |
Distribution fee | | | | |
Class C | | | 39,687 | |
Custody and accounting fees | | | 4,481 | |
Professional fees | | | 41,350 | |
Registration fees | | | 30,080 | |
Shareholder report expenses | | | 15,114 | |
Trustees’ fees and expenses | | | 34,233 | |
Other fees and expenses | | | 3,004 | |
| | | | |
Total expenses | | | 868,592 | |
Less: Fee waivers and/or expense reimbursements | | | (211,032 | ) |
| | | | |
Net expenses | | | 657,560 | |
| | | | |
Net investment income | | | 2,542,319 | |
| | | | |
| |
REALIZED AND UNREALIZED GAINS (LOSSES) ON INVESTMENTS | | | | |
Net realized gains on investments | | | 419,629 | |
Net change in unrealized gains (losses) on investments | | | (8,301,377 | ) |
| | | | |
Net realized and unrealized gains (losses) on investments | | | (7,881,748 | ) |
| | | | |
Net decrease in net assets resulting from operations | | $ | (5,339,429 | ) |
| | | | |
| 1 | For the period from October 31, 2016 (commencement of operations) to December 31, 2016 |
The accompanying notes are an integral part of these financial statements.
| | | | | | |
| Statement of changes in net assets | | Wells Fargo Minnesota Tax-Free Fund | | | 15 | |
| | | | | | | | | | | | | | | | |
| | | Six months ended
December 31, 2016 (unaudited) | | | Year ended
June 30, 2016 | |
| | | | |
Operations | | | | | | | | | | | | | | | | |
Net investment income | | | | | | $ | 2,542,319 | | | | | | | $ | 5,318,450 | |
Net realized gains on investments | | | | | | | 419,629 | | | | | | | | 288,003 | |
Net change in unrealized gains (losses) on investments | | | | | | | (8,301,377 | ) | | | | | | | 4,267,904 | |
| | | | |
Net increase (decrease) in net assets resulting from operations | | | | | | | (5,339,429 | ) | | | | | | | 9,874,357 | |
| | | | |
| | | | |
Distributions to shareholders from | | | | | | | | | | | | | | | | |
Net investment income | | | | | | | | | | | | | | | | |
Class A | | | | | | | (602,764 | ) | | | | | | | (1,342,912 | ) |
Class C | | | | | | | (100,721 | ) | | | | | | | (223,290 | ) |
Administrator Class | | | | | | | (1,821,780 | ) | | | | | | | (3,752,248 | ) |
Institutional Class | | | | | | | (17,054 | )1 | | | | | | | N/A | |
Net realized gains | | | | | | | | | | | | | | | | |
Class A | | | | | | | (181,495 | ) | | | | | | | (15,554 | ) |
Class C | | | | | | | (42,362 | ) | | | | | | | (3,355 | ) |
Administrator Class | | | | | | | (459,088 | ) | | | | | | | (39,659 | ) |
Institutional Class | | | | | | | (21,534 | )1 | | | | | | | N/A | |
| | | | |
Total distributions to shareholders | | | | | | | (3,246,798 | ) | | | | | | | (5,377,018 | ) |
| | | | |
| | | | |
Capital share transactions | | | Shares | | | | | | | | Shares | | | | | |
Proceeds from shares sold | | | | | | | | | | | | | | | | |
Class A | | | 302,273 | | | | 3,311,895 | | | | 361,762 | | | | 3,948,616 | |
Class C | | | 68,974 | | | | 757,314 | | | | 96,385 | | | | 1,052,616 | |
Administrator Class | | | 2,167,944 | | | | 23,486,229 | | | | 2,631,468 | | | | 28,640,215 | |
Institutional Class | | | 491,069 | 1 | | | 5,229,201 | 1 | | | N/A | | | | N/A | |
| | | | |
| | | | | | | 32,784,639 | | | | | | | | 33,641,447 | |
| | | | |
Reinvestment of distributions | | | | | | | | | | | | | | | | |
Class A | | | 70,828 | | | | 763,301 | | | | 123,205 | | | | 1,342,193 | |
Class C | | | 13,205 | | | | 142,031 | | | | 20,786 | | | | 226,424 | |
Administrator Class | | | 152,650 | | | | 1,646,440 | | | | 241,208 | | | | 2,627,645 | |
Institutional Class | | | 3,580 | 1 | | | 37,834 | 1 | | | N/A | | | | N/A | |
| | | | |
| | | | | | | 2,589,606 | | | | | | | | 4,196,262 | |
| | | | |
Payment for shares redeemed | | | | | | | | | | | | | | | | |
Class A | | | (482,551 | ) | | | (5,232,039 | ) | | | (592,484 | ) | | | (6,450,893 | ) |
Class C | | | (103,383 | ) | | | (1,104,001 | ) | | | (114,142 | ) | | | (1,239,380 | ) |
Administrator Class | | | (4,159,508 | ) | | | (44,253,735 | ) | | | (1,961,032 | ) | | | (21,337,031 | ) |
Institutional Class | | | (64,708 | )1 | | | (682,064 | )1 | | | N/A | | | | N/A | |
| | | | |
| | | | | | | (51,271,839 | ) | | | | | | | (29,027,304 | ) |
| | | | |
Net increase (decrease) in net assets resulting from capital share transactions | | | | | | | (15,897,594 | ) | | | | | | | 8,810,405 | |
| | | | |
Total increase (decrease) in net assets | | | | | | | (24,483,821 | ) | | | | | | | 13,307,744 | |
| | | | |
| | | | |
Net assets | | | | | | | | | | | | | | | | |
Beginning of period | | | | | | | 180,280,130 | | | | | | | | 166,972,386 | |
| | | | |
End of period | | | | | | $ | 155,796,309 | | | | | | | $ | 180,280,130 | |
| | | | |
Undistributed net investment income | | | | | | $ | 625,178 | | | | | | | $ | 625,178 | |
| | | | |
| 1 | For the period from October 31, 2016 (commencement of operations) to December 31, 2016 |
The accompanying notes are an integral part of these financial statements.
| | | | |
| 16 | | Wells Fargo Minnesota Tax-Free Fund | | Financial highlights |
(For a share outstanding throughout each period)
| | | | | | | | | | | | | | | | | | | | | | | | |
| | | Six months ended
December 31, 2016 (unaudited) | | | Year ended June 30 | |
| CLASS A | | | 2016 | | | 2015 | | | 2014 | | | 2013 | | | 2012 | |
Net asset value, beginning of period | | | $11.07 | | | | $10.79 | | | | $10.86 | | | | $10.74 | | | | $11.08 | | | | $10.68 | |
Net investment income | | | 0.15 | | | | 0.33 | | | | 0.33 | | | | 0.35 | | | | 0.32 | | | | 0.37 | |
Net realized and unrealized gains (losses) on investments | | | (0.45 | ) | | | 0.28 | | | | (0.04 | ) | | | 0.20 | | | | (0.31 | ) | | | 0.55 | |
| | | | | | | | | | | | | | | | | | | | | | | | |
Total from investment operations | | | (0.30 | ) | | | 0.61 | | | | 0.29 | | | | 0.55 | | | | 0.01 | | | | 0.92 | |
Distributions to shareholders from | | | | | | | | | | | | | | | | | | | | | | | | |
Net investment income | | | (0.15 | ) | | | (0.33 | ) | | | (0.33 | ) | | | (0.35 | ) | | | (0.32 | ) | | | (0.37 | ) |
Net realized gains | | | (0.05 | ) | | | (0.00 | )1 | | | (0.03 | ) | | | (0.08 | ) | | | (0.03 | ) | | | (0.15 | ) |
| | | | | | | | | | | | | | | | | | | | | | | | |
Total distributions to shareholders | | | (0.20 | ) | | | (0.33 | ) | | | (0.36 | ) | | | (0.43 | ) | | | (0.35 | ) | | | (0.52 | ) |
Net asset value, end of period | | | $10.57 | | | | $11.07 | | | | $10.79 | | | | $10.86 | | | | $10.74 | | | | $11.08 | |
Total return2 | | | (2.81 | )% | | | 5.74 | % | | | 2.72 | % | | | 5.29 | % | | | (0.01 | )% | | | 8.80 | % |
Ratios to average net assets (annualized) | | | | | | | | | | | | | | | | | | | | | | | | |
Gross expenses | | | 0.95 | % | | | 0.89 | % | | | 0.89 | % | | | 0.89 | % | | | 0.88 | % | | | 0.89 | % |
Net expenses | | | 0.85 | % | | | 0.85 | % | | | 0.85 | % | | | 0.85 | % | | | 0.85 | % | | | 0.85 | % |
Net investment income | | | 2.65 | % | | | 2.99 | % | | | 3.03 | % | | | 3.28 | % | | | 2.87 | % | | | 3.35 | % |
Supplemental data | | | | | | | | | | | | | | | | | | | | | | | | |
Portfolio turnover rate | | | 9 | %3 | | | 16 | %3 | | | 20 | %3 | | | 15 | %3 | | | 14 | %3 | | | 36 | % |
Net assets, end of period (000s omitted) | | | $42,208 | | | | $45,437 | | | | $45,437 | | | | $44,499 | | | | $49,535 | | | | $52,550 | |
| 1 | Amount is less than $0.005. |
| 2 | Total return calculations do not include any sales charges. Returns for periods of less than one year are not annualized. |
| 3 | Portfolio turnover rate excludes variable rate demand notes which may account for changes from rates reported in prior periods. |
The accompanying notes are an integral part of these financial statements.
| | | | | | |
| Financial highlights | | Wells Fargo Minnesota Tax-Free Fund | | | 17 | |
(For a share outstanding throughout each period)
| | | | | | | | | | | | | | | | | | | | | | | | |
| | | Six months ended
December 31, 2016 (unaudited) | | | Year ended June 30 | |
| CLASS C | | | 2016 | | | 2015 | | | 2014 | | | 2013 | | | 2012 | |
Net asset value, beginning of period | | | $11.07 | | | | $10.79 | | | | $10.86 | | | | $10.74 | | | | $11.08 | | | | $10.68 | |
Net investment income | | | 0.11 | | | | 0.24 | | | | 0.25 | | | | 0.27 | | | | 0.24 | | | | 0.28 | |
Net realized and unrealized gains (losses) on investments | | | (0.45 | ) | | | 0.28 | | | | (0.04 | ) | | | 0.20 | | | | (0.31 | ) | | | 0.55 | |
| | | | | | | | | | | | | | | | | | | | | | | | |
Total from investment operations | | | (0.34 | ) | | | 0.52 | | | | 0.21 | | | | 0.47 | | | | (0.07 | ) | | | 0.83 | |
Distributions to shareholders from | | | | | | | | | | | | | | | | | | | | | | | | |
Net investment income | | | (0.11 | ) | | | (0.24 | ) | | | (0.25 | ) | | | (0.27 | ) | | | (0.24 | ) | | | (0.28 | ) |
Net realized gains | | | (0.05 | ) | | | (0.00 | )1 | | | (0.03 | ) | | | (0.08 | ) | | | (0.03 | ) | | | (0.15 | ) |
| | | | | | | | | | | | | | | | | | | | | | | | |
Total distributions to shareholders | | | (0.16 | ) | | | (0.24 | ) | | | (0.28 | ) | | | (0.35 | ) | | | (0.27 | ) | | | (0.43 | ) |
Net asset value, end of period | | | $10.57 | | | | $11.07 | | | | $10.79 | | | | $10.86 | | | | $10.74 | | | | $11.08 | |
Total return2 | | | (3.18 | )% | | | 4.95 | % | | | 1.96 | % | | | 4.50 | % | | | (0.76 | )% | | | 7.99 | % |
Ratios to average net assets (annualized) | | | | | | | | | | | | | | | | | | | | | | | | |
Gross expenses | | | 1.70 | % | | | 1.64 | % | | | 1.64 | % | | | 1.64 | % | | | 1.63 | % | | | 1.64 | % |
Net expenses | | | 1.60 | % | | | 1.60 | % | | | 1.60 | % | | | 1.60 | % | | | 1.60 | % | | | 1.60 | % |
Net investment income | | | 1.90 | % | | | 2.24 | % | | | 2.28 | % | | | 2.53 | % | | | 2.12 | % | | | 2.58 | % |
Supplemental data | | | | | | | | | | | | | | | | | | | | | | | | |
Portfolio turnover rate | | | 9 | %3 | | | 16 | %3 | | | 20 | %3 | | | 15 | %3 | | | 14 | %3 | | | 36 | % |
Net assets, end of period (000s omitted) | | | $9,662 | | | | $10,358 | | | | $10,061 | | | | $8,768 | | | | $8,972 | | | | $9,144 | |
| 1 | Amount is less than $0.005. |
| 2 | Total return calculations do not include any sales charges. Returns for periods of less than one year are not annualized. |
| 3 | Portfolio turnover rate excludes variable rate demand notes which may account for changes from rates reported in prior periods. |
The accompanying notes are an integral part of these financial statements.
| | | | |
| 18 | | Wells Fargo Minnesota Tax-Free Fund | | Financial highlights |
(For a share outstanding throughout each period)
| | | | | | | | | | | | | | | | | | | | | | | | |
| | | Six months ended
December 31, 2016 (unaudited) | | | Year ended June 30 | |
| ADMINISTRATOR CLASS | | | 2016 | | | 2015 | | | 2014 | | | 2013 | | | 2012 | |
Net asset value, beginning of period | | | $11.07 | | | | $10.78 | | | | $10.86 | | | | $10.74 | | | | $11.07 | | | | $10.68 | |
Net investment income | | | 0.16 | | | | 0.35 | | | | 0.36 | | | | 0.38 | | | | 0.35 | | | | 0.39 | |
Net realized and unrealized gains (losses) on investments | | | (0.46 | ) | | | 0.29 | | | | (0.05 | ) | | | 0.20 | | | | (0.30 | ) | | | 0.54 | |
| | | | | | | | | | | | | | | | | | | | | | | | |
Total from investment operations | | | (0.30 | ) | | | 0.64 | | | | 0.31 | | | | 0.58 | | | | 0.05 | | | | 0.93 | |
Distributions to shareholders from | | | | | | | | | | | | | | | | | | | | | | | | |
Net investment income | | | (0.16 | ) | | | (0.35 | ) | | | (0.36 | ) | | | (0.38 | ) | | | (0.35 | ) | | | (0.39 | ) |
Net realized gains | | | (0.05 | ) | | | (0.00 | )1 | | | (0.03 | ) | | | (0.08 | ) | | | (0.03 | ) | | | (0.15 | ) |
| | | | | | | | | | | | | | | | | | | | | | | | |
Total distributions to shareholders | | | (0.21 | ) | | | (0.35 | ) | | | (0.39 | ) | | | (0.46 | ) | | | (0.38 | ) | | | (0.54 | ) |
Net asset value, end of period | | | $10.56 | | | | $11.07 | | | | $10.78 | | | | $10.86 | | | | $10.74 | | | | $11.07 | |
Total return2 | | | (2.78 | )% | | | 6.10 | % | | | 2.88 | % | | | 5.55 | % | | | 0.32 | % | | | 8.97 | % |
Ratios to average net assets (annualized) | | | | | | | | | | | | | | | | | | | | | | | | |
Gross expenses | | | 0.89 | % | | | 0.83 | % | | | 0.83 | % | | | 0.83 | % | | | 0.82 | % | | | 0.83 | % |
Net expenses | | | 0.60 | % | | | 0.60 | % | | | 0.60 | % | | | 0.60 | % | | | 0.60 | % | | | 0.60 | % |
Net investment income | | | 2.90 | % | | | 3.24 | % | | | 3.28 | % | | | 3.53 | % | | | 3.11 | % | | | 3.59 | % |
Supplemental data | | | | | | | | | | | | | | | | | | | | | | | | |
Portfolio turnover rate | | | 9 | %3 | | | 16 | %3 | | | 20 | %3 | | | 15 | %3 | | | 14 | %3 | | | 36 | % |
Net assets, end of period (000s omitted) | | | $99,382 | | | | $124,485 | | | | $111,475 | | | | $98,483 | | | | $98,992 | | | | $109,637 | |
| 1 | Amount is less than $0.005. |
| 2 | Returns for periods of less than one year are not annualized. |
| 3 | Portfolio turnover rate excludes variable rate demand notes which may account for changes from rates reported in prior periods. |
The accompanying notes are an integral part of these financial statements.
| | | | | | |
| Financial highlights | | Wells Fargo Minnesota Tax-Free Fund | | | 19 | |
(For a share outstanding throughout the period)
| | | | |
| | | Period ended
December 31, 20161
(unaudited) | |
| INSTITUTIONAL CLASS | |
Net asset value, beginning of period | | | $10.88 | |
Net investment income | | | 0.05 | |
Net realized and unrealized gains (losses) on investments | | | (0.26 | ) |
| | | | |
Total from investment operations | | | (0.21 | ) |
Distributions to shareholders from | | | | |
Net investment income | | | (0.05 | ) |
Net realized gains | | | (0.05 | ) |
| | | | |
Total distributions to shareholders | | | (0.10 | ) |
Net asset value, end of period | | | $10.57 | |
Total return2 | | | (1.95 | )% |
Ratios to average net assets (annualized) | | | | |
Gross expenses | | | 0.63 | % |
Net expenses | | | 0.52 | % |
Net investment income | | | 3.04 | % |
Supplemental data | | | | |
Portfolio turnover rate | | | 9 | % |
Net assets, end of period (000s omitted) | | | $4,545 | |
| 1 | For the period from October 31, 2016 (commencement of operations) to December 31, 2016 |
| 2 | Returns for periods of less than one year are not annualized. |
The accompanying notes are an integral part of these financial statements.
| | | | |
| 20 | | Wells Fargo Minnesota Tax-Free Fund | | Notes to financial statements (unaudited) |
1. ORGANIZATION
Wells Fargo Funds Trust (the “Trust”), a Delaware statutory trust organized on March 10, 1999, is an open-end management investment company registered under the Investment Company Act of 1940, as amended (the “1940 Act”). As an investment company, the Trust follows the accounting and reporting guidance in Financial Accounting Standards Board (“FASB”) Accounting Standards Codification Topic 946, Financial Services – Investment Companies. These financial statements report on the Wells Fargo Minnesota Tax-Free Fund (the “Fund”) which is a diversified series of the Trust.
2. SIGNIFICANT ACCOUNTING POLICIES
The following significant accounting policies, which are consistently followed in the preparation of the financial statements of the Fund, are in conformity with U.S. generally accepted accounting principles which require management to make estimates and assumptions that affect the reported amounts of assets and liabilities, disclosure of contingent assets and liabilities at the date of the financial statements, and the reported amounts of revenues and expenses during the reporting period. Actual results could differ from those estimates.
Securities valuation
All investments are valued each business day as of the close of regular trading on the New York Stock Exchange (generally 4 p.m. Eastern Time), although the Fund may deviate from this calculation time under unusual or unexpected circumstances.
Debt securities are valued at the evaluated bid price provided by an independent pricing service or, if a reliable price is not available, the quoted bid price from an independent broker-dealer.
Investments which are not valued using any of the methods discussed above are valued at their fair value, as determined in good faith by the Board of Trustees of the Fund. The Board of Trustees has established a Valuation Committee comprised of the Trustees and has delegated to it the authority to take any actions regarding the valuation of portfolio securities that the Valuation Committee deems necessary or appropriate, including determining the fair value of portfolio securities, unless the determination has been delegated to the Management Valuation Team of Wells Fargo Funds Management, LLC (“Funds Management”). The Board of Trustees retains the authority to make or ratify any valuation decisions or approve any changes to the Valuation Procedures as it deems appropriate. On a quarterly basis, the Board of Trustees receives reports on any valuation actions taken by the Valuation Committee or the Management Valuation Team which may include items for ratification.
Valuations of fair valued securities are compared to the next actual sales price when available, or other appropriate market values, to assess the continued appropriateness of the fair valuation methodologies used. These securities are fair valued on a day-to-day basis, taking into consideration changes to appropriate market information and any significant changes to the inputs considered in the valuation process until there is a readily available price provided on an exchange or by an independent pricing service. Valuations received from an independent pricing service or independent broker-dealer quotes are periodically validated by comparisons to most recent trades and valuations provided by other independent pricing services in addition to the review of prices by the manager and/or subadviser. Unobservable inputs used in determining fair valuations are identified based on the type of security, taking into consideration factors utilized by market participants in valuing the investment, knowledge about the issuer and the current market environment.
When-issued transactions
The Fund may purchase securities on a forward commitment or when-issued basis. The Fund records a when-issued transaction on the trade date and will segregate assets in an amount at least equal in value to the Fund’s commitment to purchase when-issued securities. Securities purchased on a when-issued basis are marked-to-market daily and the Fund begins earning interest on the settlement date. Losses may arise due to changes in the market value of the underlying securities or if the counterparty does not perform under the contract.
Security transactions and income recognition
Securities transactions are recorded on a trade date basis. Realized gains or losses are recorded on the basis of identified cost.
Interest income is accrued daily and bond discounts are accreted and premiums are amortized daily based on the effective interest method. To the extent debt obligations are placed on non-accrual status, any related interest income may be reduced by writing off interest receivables when the collection of all or a portion of interest has become doubtful based on consistently applied procedures. If the issuer subsequently resumes interest payments or when the collectability of interest is reasonably assured, the debt obligation is removed from non-accrual status.
| | | | | | |
| Notes to financial statements (unaudited) | | Wells Fargo Minnesota Tax-Free Fund | | | 21 | |
Distributions to shareholders
Distributions to shareholders from net investment income are accrued daily and paid monthly. Distributions from net realized gains, if any, are recorded on the ex-dividend date. Such distributions are determined in conformity with federal income tax regulations, which may differ in amount or character from net investment income and realized gains recognized for purposes of U.S. generally accepted accounting principles.
Federal and other taxes
The Fund intends to continue to qualify as a regulated investment company by distributing substantially all of its investment company taxable and tax-exempt income and any net realized capital gains (after reduction for capital loss carryforwards) sufficient to relieve it from all, or substantially all, federal income taxes. Accordingly, no provision for federal income taxes was required.
The Fund’s income and federal excise tax returns and all financial records supporting those returns for the prior three fiscal years are subject to examination by the federal and Delaware revenue authorities. Management has analyzed the Fund’s tax positions taken on federal, state, and foreign tax returns for all open tax years and does not believe that there are any uncertain tax positions that require recognition of a tax liability.
Class allocations
The separate classes of shares offered by the Fund differ principally in applicable sales charges, distribution, shareholder servicing, and administration fees. Class specific expenses are charged directly to that share class. Investment income, common expenses, and realized and unrealized gains (losses) on investments are allocated daily to each class of shares based on the relative proportion of net assets of each class.
3. FAIR VALUATION MEASUREMENTS
Fair value measurements of investments are determined within a framework that has established a fair value hierarchy based upon the various data inputs utilized in determining the value of the Fund’s investments. The three-level hierarchy gives the highest priority to unadjusted quoted prices in active markets for identical assets or liabilities (Level 1) and the lowest priority to significant unobservable inputs (Level 3). The Fund’s investments are classified within the fair value hierarchy based on the lowest level of input that is significant to the fair value measurement. The inputs are summarized into three broad levels as follows:
| ∎ | | Level 1 – quoted prices in active markets for identical securities |
| ∎ | | Level 2 – other significant observable inputs (including quoted prices for similar securities, interest rates, prepayment speeds, credit risk, use of amortized cost, etc.) |
| ∎ | | Level 3 – significant unobservable inputs (including the Fund’s own assumptions in determining the fair value of investments) |
The inputs or methodologies used for valuing investments in securities are not necessarily an indication of the risk associated with investing in those securities.
The following is a summary of the inputs used in valuing the Fund’s assets and liabilities as of December 31, 2016:
| | | | | | | | | | | | | | | | |
| | | Quoted prices
(Level 1) | | | Other significant
observable inputs
(Level 2) | | | Significant
unobservable inputs (Level 3) | | | Total | |
Assets | | | | | | | | | | | | | | | | |
Investments in: | | | | | | | | | | | | | | | | |
| | | | |
Municipal obligations | | $ | 0 | | | $ | 153,433,496 | | | $ | 0 | | | $ | 153,433,496 | |
The Fund recognizes transfers between levels within the fair value hierarchy at the end of the reporting period. At December 31, 2016, the Fund did not have any transfers into/out of Level 1, Level 2, or Level 3.
4. TRANSACTIONS WITH AFFILIATES AND OTHER EXPENSES
Management fee
Funds Management, an indirect wholly owned subsidiary of Wells Fargo & Company (“Wells Fargo”), is the manager of the Fund and provides advisory and fund-level administrative services under an investment management agreement. Under the investment management agreement, Funds Management is responsible for, among other services, implementing the investment
| | | | |
| 22 | | Wells Fargo Minnesota Tax-Free Fund | | Notes to financial statements (unaudited) |
objectives and strategies of the Fund, supervising the subadviser, providing fund-level administrative services in connection with the Fund’s operations, and providing any other fund-level administrative services reasonably necessary for the operation of the Fund. As compensation for its services under the investment management agreement, Funds Management is entitled to receive an annual management fee starting at 0.40% and declining to 0.28% as the average daily net assets of the Fund increase. For the six months ended December 31, 2016, the management fee was equivalent to an annual rate of 0.40% of the Fund’s average daily net assets.
Funds Management has retained the services of a subadviser to provide daily portfolio management to the Fund. The fee for subadvisory services is borne by Funds Management. Wells Capital Management Incorporated, an affiliate of Funds Management and an indirect wholly owned subsidiary of Wells Fargo, is the subadviser to the Fund and is entitled to receive a fee from Funds Management at an annual rate starting at 0.20% and declining to 0.10% as the average daily net assets of the Fund increase.
Administration fees
Under a class-level administration agreement, Funds Management provides class-level administrative services to the Fund, which includes paying fees and expenses for services provided by the transfer agent, sub-transfer agents, omnibus account servicers and record-keepers. As compensation for its services under the class-level administration agreement, Funds Management receives an annual fee which is calculated based on the average daily net assets of each class as follows:
| | | | |
| | | Class-level
administration fee | |
Class A, Class C | | | 0.16 | % |
Administrator Class | | | 0.10 | |
Institutional Class | | | 0.08 | |
Funds Management has contractually waived and/or reimbursed management and administration fees to the extent necessary to maintain certain net operating expense ratios for the Fund. Waiver of fees and/or reimbursement of expenses by Funds Management were made first from fund level expenses on a proportionate basis and then from class specific expenses. Funds Management has committed through October 31, 2017 to waive fees and/or reimburse expenses to the extent necessary to cap the Fund’s expenses at 0.85% for Class A shares, 1.60% for Class C shares, 0.60% for Administrator Class shares, and 0.52% for Institutional Class shares. After this time, the cap may be increased or the commitment to maintain the cap may be terminated only with the approval of the Board of Trustees.
During the six months ended December 31, 2016, State Street Bank and Trust Company, the Fund’s custodian, reimbursed the Fund $7 for certain out-of-pocket expenses that were billed to the Fund in error from 1998-2015. This amount is included in interest income on the Statement of Operations. In addition, Funds Management was also reimbursed $3,049 for waivers/reimbursements it made to the Fund during the period the Fund was erroneously billed.
Distribution fee
The Trust has adopted a distribution plan for Class C shares of the Fund pursuant to Rule 12b-1 under the 1940 Act. A distribution fee is charged to Class C shares and paid to Wells Fargo Funds Distributor, LLC (“Funds Distributor”), the principal underwriter, at an annual rate of 0.75% of the average daily net assets of Class C shares.
In addition, Funds Distributor is entitled to receive the front-end sales charge from the purchase of Class A shares and a contingent deferred sales charge on the redemption of certain Class A shares. Funds Distributor is also entitled to receive the contingent deferred sales charges from redemptions of Class C shares. For the six months ended December 31, 2016, Funds Distributor received $2,050 from the sale of Class A shares.
Shareholder servicing fees
The Trust has entered into contracts with one or more shareholder servicing agents, whereby Class A, Class C, and Administrator Class of the Fund are charged a fee at an annual rate of 0.25% of the average daily net assets of each respective class.
A portion of these total shareholder servicing fees were paid to affiliates of Wells Fargo.
5. INVESTMENT PORTFOLIO TRANSACTIONS
Purchases and sales of investments, excluding U.S. government obligations (if any) and short-term securities, for the year ended June 30, 2016 were $14,871,288 and $31,676,311, respectively.
| | | | | | |
| Notes to financial statements (unaudited) | | Wells Fargo Minnesota Tax-Free Fund | | | 23 | |
The Fund may purchase or sell investment securities to other Wells Fargo funds under procedures adopted by the Board of Trustees. The procedures have been designed to ensure that these interfund transactions, which generally do not incur broker commissions, are effected at current market prices. Interfund trades are included within the respective purchases and sales amounts shown.
6. BANK BORROWINGS
The Trust (excluding the money market funds and certain other funds) and Wells Fargo Variable Trust are parties to a $250,000,000 revolving credit agreement whereby the Fund is permitted to use bank borrowings for temporary or emergency purposes, such as to fund shareholder redemption requests. Interest under the credit agreement is charged to the Fund based on a borrowing rate equal to the higher of the Federal Funds rate in effect on that day plus 1.25% or the overnight LIBOR rate in effect on that day plus 1.25%. In addition, an annual commitment fee equal to 0.25% of the unused balance is allocated to each participating fund. Prior to August 30, 2016, the revolving credit agreement amount was $200,000,000 and the annual commitment fee was equal to 0.20% of the unused balance which was allocated to each participating fund.
For the six months ended December 31, 2016, there were no borrowings by the Fund under the agreement.
7. CONCENTRATION RISK
The Fund invests a substantial portion of its assets in issuers of municipal debt securities located in a single state or territories of the U.S. Therefore, it may be more affected by economic and political developments in that state or region than would be a comparable general tax-exempt fund.
8. INDEMNIFICATION
Under the Trust’s organizational documents, the officers and Trustees have been granted certain indemnification rights against certain liabilities that may arise out of performance of their duties to the Trust. Additionally, in the normal course of business, the Trust may enter into contracts with service providers that contain a variety of indemnification clauses. The Trust’s maximum exposure under these arrangements is dependent on future claims that may be made against the Fund and, therefore, cannot be estimated.
9. REGULATORY CHANGES
In October 2016, the Securities and Exchange Commission (“SEC”) adopted new rules and forms and amended existing rules and forms (together, “final rules”) intended to modernize and enhance the reporting and disclosure of information by registered investment companies and to enhance liquidity risk management by open-end mutual funds and exchange-traded funds. The final rules will enhance the quality of information available to investors and will allow the SEC to more effectively collect and use data reported by funds. In part, the final rules amend Regulation S-X and require standardized, enhanced disclosure about derivatives in the Fund’s financial statements, as well as other amendments. The compliance date for the amendments to Regulation S-X is August 1, 2017 while the compliance date for the new form types is June 1, 2018 and the compliance date for the liquidity risk management program requirements is December 1, 2018. Management is currently assessing the potential impact of these enhancements and their impact on the financial statement disclosures and reporting requirements.
| | | | |
| 24 | | Wells Fargo Minnesota Tax-Free Fund | | Other information (unaudited) |
PROXY VOTING INFORMATION
A description of the policies and procedures that the Fund uses to determine how to vote proxies relating to portfolio securities is available, upon request, by calling 1-800-222-8222, visiting our website at wellsfargofunds.com, or visiting the SEC website at sec.gov. Information regarding how the Fund voted proxies relating to portfolio securities during the most recent 12-month period ended June 30 is available on the Fund’s website at wellsfargofunds.com or by visiting the SEC website at sec.gov.
PORTFOLIO HOLDINGS INFORMATION
The complete portfolio holdings for the Fund are publicly available monthly on the Fund’s website (wellsfargofunds.com), on a one-month delayed basis. In addition, top ten holdings information (excluding derivative positions) for the Fund is publicly available on the Fund’s website on a monthly, seven-day or more delayed basis. The Fund files its complete schedule of portfolio holdings with the SEC for the first and third quarters of each fiscal year on Form N-Q, which is available by visiting the SEC website at sec.gov. In addition, the Fund’s Form N-Q may be reviewed and copied at the SEC’s Public Reference Room in Washington, DC, and at regional offices in New York City, at 233 Broadway, and in Chicago, at 175 West Jackson Boulevard, Suite 900. Information about the Public Reference Room may be obtained by calling 1-800-SEC-0330.
| | | | | | |
| Other information (unaudited) | | Wells Fargo Minnesota Tax-Free Fund | | | 25 | |
BOARD OF TRUSTEES AND OFFICERS
Each of the Trustees and Officers1 listed in the table below acts in identical capacities for each fund in the Wells Fargo family of funds, which consists of 139 mutual funds comprising the Wells Fargo Funds Trust, Wells Fargo Variable Trust, Wells Fargo Master Trust and four closed-end funds (collectively the “Fund Complex”). This table should be read in conjunction with the Prospectus and the Statement of Additional Information2. The mailing address of each Trustee and Officer is 525 Market Street, 12th Floor, San Francisco, CA 94105. Each Trustee and Officer serves an indefinite term, however, each Trustee serves such term until reaching the mandatory retirement age established by the Trustees.
Independent Trustees
| | | | | | |
Name and
year of birth | | Position held and
length of service* | | Principal occupations during past five years or longer | | Current other
public company or
investment company
directorships |
| William R. Ebsworth (Born 1957) | | Trustee, since 2015 | | Retired. From 1984 to 2013, equities analyst, portfolio manager, research director and chief financial officer at Fidelity Management and Research Company in Boston, Tokyo, and Hong Kong and retired in 2013 as Chief Investment Officer of Fidelity Strategic Advisers, Inc. where he lead a team of investment professionals managing client assets. Prior thereto, Board member of Hong Kong Securities Clearing Co., Hong Kong Options Clearing Corp., the Thailand International Fund, Ltd., Fidelity Investments Life Insurance Company, and Empire Fidelity Investments Life Insurance Company. Board member of the Fonté Foundation (non-profit organization) and the Vincent Memorial Hospital Endowment (non-profit organization), where he serves on the Investment Committee and as a Chair of the Audit Committee. Mr. Ebsworth is a CFA® charterholder and an Adjunct Lecturer, Finance, at Babson College. | | Asset Allocation Trust |
| Jane A. Freeman (Born 1953) | | Trustee, since 2015 | | Retired. From 2012 to 2014 and 1999 to 2008, Chief Financial Officer of Scientific Learning Corporation. From 2008 to 2012, Ms. Freeman provided consulting services related to strategic business projects. Prior to 1999, Portfolio Manager at Rockefeller & Co. and Scudder, Stevens & Clark. Board member of the Harding Loevner Funds from 1996 to 2014, serving as both Lead Independent Director and chair of the Audit Committee. Board member of the Russell Exchange Traded Funds Trust from 2011 to 2012 and the chair of the Audit Committee. Ms. Freeman is a Board Member of Ruth Bancroft Garden (non-profit organization) and an inactive chartered financial analyst. | | Asset Allocation Trust |
| Peter G. Gordon** (Born 1942) | | Trustee, since 1998; Chairman, since 2005 | | Co-Founder, Retired Chairman, President and CEO of Crystal Geyser Water Company. Trustee Emeritus, Colby College. | | Asset Allocation Trust |
| Isaiah Harris, Jr. (Born 1952) | | Trustee, since 2009 | | Retired. Chairman of the Board of CIGNA Corporation since 2009, and Director since 2005. From 2003 to 2011, Director of Deluxe Corporation. Prior thereto, President and CEO of BellSouth Advertising and Publishing Corp. from 2005 to 2007, President and CEO of BellSouth Enterprises from 2004 to 2005 and President of BellSouth Consumer Services from 2000 to 2003. Emeritus member of the Iowa State University Foundation Board of Governors. Emeritus Member of the Advisory Board of Iowa State University School of Business. Advisory Board Member, Palm Harbor Academy (charter school). Advisory Board Member, Child Evangelism Fellowship (non-profit). Mr. Harris is a certified public accountant (inactive status). | | CIGNA Corporation; Asset Allocation Trust |
| Judith M. Johnson (Born 1949) | | Trustee, since 2008;
Audit Committee
Chairman, since 2008 | | Retired. Prior thereto, Chief Executive Officer and Chief Investment Officer of Minneapolis Employees Retirement Fund from 1996 to 2008. Ms. Johnson is an attorney, certified public accountant and a certified managerial accountant. | | Asset Allocation Trust |
| David F. Larcker (Born 1950) | | Trustee, since 2009 | | James Irvin Miller Professor of Accounting at the Graduate School of Business, Stanford University, Director of the Corporate Governance Research Initiative and Senior Faculty of The Rock Center for Corporate Governance since 2006. From 2005 to 2008, Professor of Accounting at the Graduate School of Business, Stanford University. Prior thereto, Ernst & Young Professor of Accounting at The Wharton School, University of Pennsylvania from 1985 to 2005. | | Asset Allocation Trust |
| | | | |
| 26 | | Wells Fargo Minnesota Tax-Free Fund | | Other information (unaudited) |
| | | | | | |
Name and
year of birth | | Position held and
length of service* | | Principal occupations during past five years or longer | | Current other
public company or
investment company
directorships |
| Olivia S. Mitchell (Born 1953) | | Trustee, since 2006 | | International Foundation of Employee Benefit Plans Professor, Wharton School of the University of Pennsylvania since 1993. Director of Wharton’s Pension Research Council and Boettner Center on Pensions & Retirement Research, and Research Associate at the National Bureau of Economic Research. Previously, Cornell University Professor from 1978 to 1993. | | Asset Allocation Trust |
| Timothy J. Penny (Born 1951) | | Trustee, since 1996 | | President and Chief Executive Officer of Southern Minnesota Initiative Foundation, a non-profit organization, since 2007 and Senior Fellow at the Humphrey Institute Policy Forum at the University of Minnesota since 1995. Member of the Board of Trustees of NorthStar Education Finance, Inc., a non-profit organization, since 2007. | | Asset Allocation Trust |
| Michael S. Scofield (Born 1943) | | Trustee, since 2010 | | Served on the Investment Company Institute’s Board of Governors and Executive Committee from 2008-2011 as well the Governing Council of the Independent Directors Council from 2006-2011 and the Independent Directors Council Executive Committee from 2008-2011. Chairman of the IDC from 2008-2010. Institutional Investor (Fund Directions) Trustee of Year in 2007. Trustee of the Evergreen Funds complex (and its predecessors) from 1984 to 2010. Chairman of the Evergreen Funds from 2000-2010. Former Trustee of the Mentor Funds. Retired Attorney, Law Offices of Michael S. Scofield. | | Asset Allocation Trust |
| * | Length of service dates reflect the Trustee’s commencement of service with the Trust’s predecessor entities, where applicable. |
| ** | Peter Gordon is expected to retire on December 31, 2017. |
Officers
| | | | | | |
Name and
year of birth | | Position held and
length of service | | Principal occupations during past five years or longer | | |
| Andrew Owen3 (Born 1960) | | President, since 2017 | | Executive Vice President of Wells Fargo Bank, N.A. and President of Wells Fargo & Company and Head of Affiliated Managers, Wells Fargo Asset Management, since 2014. Executive Vice President responsible for marketing, investments and product development for Wells Fargo Funds Management, LLC, from 2009 to 2014. | | |
| Nancy Wiser1 (Born 1967) | | Treasurer, since 2012 | | Executive Vice President of Wells Fargo Funds Management, LLC since 2011. Chief Operating Officer and Chief Compliance Officer at LightBox Capital Management LLC, from 2008 to 2011. | | |
| C. David Messman (Born 1960) | | Secretary, since 2000; Chief Legal Officer, since 2003 | | Senior Vice President and Secretary of Wells Fargo Funds Management, LLC since 2001. Assistant General Counsel of Wells Fargo Bank, N.A. since 2013 and Vice President and Managing Counsel of Wells Fargo Bank, N.A. from 1996 to 2013. | | |
| Michael Whitaker (Born 1967) | | Chief Compliance Officer, since 2016 | | Executive Vice President of Wells Fargo Funds Management, LLC since 2016. Chief Compliance Officer of Fidelity’s Fixed Income Funds and Asset Allocation Funds from 2008 to 2016, Compliance Officer of FMR Co., Inc. from 2014 to 2016, Fidelity Investments Money Management, Inc. from 2014 to 2016, Fidelity Investments from 2007 to 2016. | | |
| David Berardi (Born 1975) | | Assistant Treasurer, since 2009 | | Vice President of Wells Fargo Funds Management, LLC since 2009. Vice President of Evergreen Investment Management Company, LLC from 2008 to 2010. Manager of Fund Reporting and Control for Evergreen Investment Management Company, LLC from 2004 to 2010. | | |
| Jeremy DePalma1 (Born 1974) | | Assistant Treasurer, since 2009 | | Senior Vice President of Wells Fargo Funds Management, LLC since 2009. Senior Vice President of Evergreen Investment Management Company, LLC from 2008 to 2010 and head of the Fund Reporting and Control Team within Fund Administration from 2005 to 2010. | | |
| 1 | Nancy Wiser acts as Treasurer of 70 funds in the Fund Complex. Jeremy DePalma acts as Treasurer of 69 funds and Assistant Treasurer of 70 funds in the Fund Complex. |
| 2 | The Statement of Additional Information includes additional information about the Trustees and is available, without charge, upon request, by calling 1-800-222-8222 or by visiting the website at wellsfargofunds.com. |
| 3 | Andrew Owen became President on January 1, 2017. |
| | | | | | |
| List of abbreviations | | Wells Fargo Minnesota Tax-Free Fund | | | 27 | |
The following is a list of common abbreviations for terms and entities that may have appeared in this report.
| ACA | — ACA Financial Guaranty Corporation |
| ADR | — American depositary receipt |
| ADS | — American depositary shares |
| AGC | — Assured Guaranty Corporation |
| AGM | — Assured Guaranty Municipal |
| Ambac | — Ambac Financial Group Incorporated |
| AMT | — Alternative minimum tax |
| BAN | — Bond anticipation notes |
| BHAC | — Berkshire Hathaway Assurance Corporation |
| CAB | — Capital appreciation bond |
| CCAB | — Convertible capital appreciation bond |
| CDA | — Community Development Authority |
| CDO | — Collateralized debt obligation |
| DRIVER | — Derivative inverse tax-exempt receipts |
| DW&P | — Department of Water & Power |
| DWR | — Department of Water Resources |
| ECFA | — Educational & Cultural Facilities Authority |
| EDA | — Economic Development Authority |
| EDFA | — Economic Development Finance Authority |
| ETF | — Exchange-traded fund |
| FDIC | — Federal Deposit Insurance Corporation |
| FFCB | — Federal Farm Credit Banks |
| FGIC | — Financial Guaranty Insurance Corporation |
| FHA | — Federal Housing Administration |
| FHLB | — Federal Home Loan Bank |
| FHLMC | — Federal Home Loan Mortgage Corporation |
| FICO | — The Financing Corporation |
| FNMA | — Federal National Mortgage Association |
| GDR | — Global depositary receipt |
| GNMA | — Government National Mortgage Association |
| HCFR | — Healthcare facilities revenue |
| HEFA | — Health & Educational Facilities Authority |
| HEFAR | — Higher education facilities authority revenue |
| HFA | — Housing Finance Authority |
| HFFA | — Health Facilities Financing Authority |
| HUD | — Department of Housing and Urban Development |
| IDA | — Industrial Development Authority |
| IDAG | — Industrial Development Agency |
| KRW | — Republic of Korea won |
| LIBOR | — London Interbank Offered Rate |
| LIFER | — Long Inverse Floating Exempt Receipts |
| LLC | — Limited liability company |
| LLLP | — Limited liability limited partnership |
| LLP | — Limited liability partnership |
| MBIA | — Municipal Bond Insurance Association |
| MFHR | — Multifamily housing revenue |
| MSTR | — Municipal securities trust receipts |
| MUD | — Municipal Utility District |
| National | — National Public Finance Guarantee Corporation |
| PCFA | — Pollution Control Financing Authority |
| PCL | — Public Company Limited |
| PCR | — Pollution control revenue |
| PFA | — Public Finance Authority |
| PFFA | — Public Facilities Financing Authority |
| PFOTER | — Puttable floating option tax-exempt receipts |
| plc | — Public limited company |
| PUTTER | — Puttable tax-exempt receipts |
| R&D | — Research & development |
| Radian | — Radian Asset Assurance |
| RAN | — Revenue anticipation notes |
| RDA | — Redevelopment Authority |
| RDFA | — Redevelopment Finance Authority |
| REIT | — Real estate investment trust |
| ROC | — Reset option certificates |
| SAVRS | — Select auction variable rate securities |
| SBA | — Small Business Authority |
| SDR | — Swedish depositary receipt |
| SFHR | — Single-family housing revenue |
| SFMR | — Single-family mortgage revenue |
| SPA | — Standby purchase agreement |
| SPDR | — Standard & Poor’s Depositary Receipts |
| SPEAR | — Short Puttable Exempt Adjustable Receipts |
| STRIPS | — Separate trading of registered interest and |
| TAN | — Tax anticipation notes |
| TIPS | — Treasury inflation-protected securities |
| TRAN | — Tax revenue anticipation notes |
| TTFA | — Transportation Trust Fund Authority |
| TVA | — Tennessee Valley Authority |
This page is intentionally left blank.

For more information
More information about Wells Fargo Funds is available free upon request. To obtain literature, please write, email, visit the Fund’s website, or call:
Wells Fargo Funds
P.O. Box 8266
Boston, MA 02266-8266
Email: fundservice@wellsfargo.com
Website: wellsfargofunds.com
Individual investors: 1-800-222-8222
Retail investment professionals: 1-888-877-9275
Institutional investment professionals: 1-866-765-0778
This report and the financial statements contained herein are submitted for the general information of the shareholders of the Fund. If this report is used for promotional purposes, distribution of the report must be accompanied or preceded by a current prospectus. Before investing, please consider the investment objectives, risks, charges, and expenses of the investment. For a current prospectus and, if available, a summary prospectus, containing this information, call 1-800-222-8222 or visit the Fund’s website at wellsfargofunds.com. Read the prospectus carefully before you invest or send money.
Wells Fargo Asset Management (WFAM) is a trade name used by the asset management businesses of Wells Fargo & Company. Wells Fargo Funds Management, LLC, a wholly owned subsidiary of Wells Fargo & Company, provides investment advisory and administrative services for Wells Fargo Funds. Other affiliates of Wells Fargo & Company provide subadvisory and other services for the funds. The funds are distributed by Wells Fargo Funds Distributor, LLC, Member FINRA, an affiliate of Wells Fargo & Company. Neither Wells Fargo Funds Management nor Wells Fargo Funds Distributor has Fund customer accounts/assets, and neither provides investment advice/recommendations or acts as an investment advice fiduciary to any investor.
NOT FDIC INSURED ◾ NO BANK GUARANTEE ◾ MAY LOSE VALUE
© 2016 Wells Fargo Funds Management, LLC. All rights reserved.
| | |
 | | 300481 02-17 SA252/SAR252 12-16 |
Semi-Annual Report
December 31, 2016

Wells Fargo Municipal Bond Fund


Reduce clutter. Save trees.
Sign up for electronic delivery of prospectuses and shareholder reports at wellsfargo.com/advantagedelivery
Contents
| * | A complete schedule of portfolio holdings as of the report date may be obtained, free of charge, by accessing the following website: https://www.wellsfargofunds.com/assets/edocs/regulatory/holdings/municipal-bond-semi.pdf or by calling Wells Fargo Funds at 1-800-222-8222. This complete schedule, filed on Form N-CSRS, is also available on the SEC’s website at sec.gov. |
The views expressed and any forward-looking statements are as of December 31, 2016, unless otherwise noted, and are those of the Fund managers and/or Wells Fargo Funds Management, LLC. Discussions of individual securities, or the markets generally, or any Wells Fargo Fund are not intended as individual recommendations. Future events or results may vary significantly from those expressed in any forward-looking statements. The views expressed are subject to change at any time in response to changing circumstances in the market. Wells Fargo Funds Management, LLC and the Fund disclaim any obligation to publicly update or revise any views expressed or forward-looking statements.
NOT FDIC INSURED ◾ NO BANK GUARANTEE ◾ MAY LOSE VALUE
| | | | |
| 2 | | Wells Fargo Municipal Bond Fund | | Letter to shareholders (unaudited) |

Andrew Owen
President
Wells Fargo Funds
The Bloomberg Barclays Municipal Bond Index,1 a broad measure tracking investment-grade municipal bonds, lost 3.91% during the six-month reporting period.
Dear Shareholder:
As the new president of Wells Fargo Funds now that Karla Rabusch is retiring from that position after nearly 14 years, I am pleased to offer you this semi-annual report for the Wells Fargo Municipal Bond Fund for the six-month period that ended December 31, 2016. The Federal Reserve (Fed) raised the federal funds rate in December by 0.25%. Municipal bond yields rose sharply in the fourth quarter. The Bloomberg Barclays Municipal Bond Index,1 a broad measure tracking investment-grade municipal bonds, lost 3.91% during the six-month reporting period.
Municipal bond yields rose during the reporting period.
The municipal market reversed course in the second half of 2016, with yields increasing and prices declining. Initially the sell-off was driven by negative supply and demand trends, also known as technical factors. By the fourth quarter, fund flows turned negative (reversing a trend of 54 weeks of positive flows) and municipal bond supply increased. These deteriorating technical factors, along with the expectation of an expansionary fiscal policy and lower tax rates under the new administration, drove market volatility; credit spreads widened and the yield curve steepened as the market sold-off.
Stronger economic indicators drove monetary policy.
On December 14, the Fed hiked the short-term interest rate by 0.25% to reach a target range of 0.50% to 0.75%. This was the second rate increase in more than 10 years, with the Fed citing job gains and lower than expected unemployment of 4.6%. The Fed confirmed the continuation of an accommodative monetary policy to support a stronger labor market and reiterated its long-term objective of a 2% inflation rate, which increased slightly during the fourth quarter but fell short of the benchmark. The Fed expressed confidence in the economy’s progress and expects this positive trajectory to continue. Both sentiments helped to bolster the Fed’s expectation of three additional rate increases during 2017.
Meanwhile, the Bank of England continued its quantitative-easing program and lowered the official bank rate to 0.25% in August 2016. The Bank of Japan maintained its negative interest rate put in place earlier in the year, and in September announced an interest rate target for 10-year government bonds—keeping the yield at zero—as it struggles to accelerate economic growth. In December, the European Central Bank announced that it will extend its quantitative-easing program and continue purchasing large amounts of eurozone corporate and government debt each month through December 2017.
U.S. economic data released during the fourth quarter showed that U.S. real gross domestic product increased at an annual 3.5% rate in the third quarter, the largest increase since mid-2014. Business investment by U.S. companies was mixed, with a 12.0% increase in structures and 4.5% decrease in equipment over the prior quarter on an annualized basis. Consumer confidence hit pre-recession levels for the first time in November, and increased again in December. The dollar strengthened during the quarter’s post-election period.
Supply and demand trends reflected volatility of municipals.
Demand for municipal debt, as measured by cash flows to municipal bond mutual funds, was negative for the reporting period. There were $19 billion of inflows from July through October, but a sharp reversal occurred post-election, with $26 billion of redemptions in the last two months of the year. This followed a
| 1 | The Bloomberg Barclays Municipal Bond Index (formerly known as Barclays Municipal Bond Index) is an unmanaged index composed of long-term tax-exempt bonds with a minimum credit rating of Baa. You cannot invest directly in an index. |
| | | | | | |
| Letter to shareholders (unaudited) | | Wells Fargo Municipal Bond Fund | | | 3 | |
noteworthy 54 consecutive weeks of inflows. On the supply side, August through October saw 30-year record-breaking volumes each month; both refundings and new issuance were up. These levels were attributed to deals pulled forward in anticipation of higher interest rates. Not surprisingly, December volume was down 25% year-over-year to $19 billion. Total municipal bond issuance for the period was $219 billion; new issuance outpaced refundings by $18 billion.
Municipal credit fundamentals were solid.
Overall, municipal credit was sound for the period. The most significant development was the election of Ricardo Rossello as governor of the Commonwealth of Puerto Rico. In the past, prices of Puerto Rico bonds reflected negative credit considerations, including defaults on its securities in 2015 and early 2016, but recent events point to a potentially more positive fiscal environment. Rossello campaigned, in part, on a platform that included promises to ultimately pay 100% of interest due on Puerto Rico’s outstanding municipal debt, negotiate with bondholders, and ration government expenditures. This stance is a major shift from his predecessor who focused on a bankruptcy mechanism.
Since the end of the financial crisis, structural changes in the fixed-income markets have reduced trading liquidity (the degree to which assets can be bought or sold without affecting the price). New regulations and capital requirements have caused traditional liquidity suppliers (banks and broker/dealers) to be more risk averse and hold less inventory. Meanwhile, corporate debt issuance has spiked as companies finance themselves at record-low yields, bond mutual funds hold larger amounts of this new debt supply, trading volumes are lower, and large-size trades are more difficult to execute. However, fixed-income markets appeared to function well over the past year with sufficient liquidity.
Don’t let short-term uncertainty derail long-term investment goals.
Periods of uncertainty can present challenges, but experience has taught us that maintaining long-term investment goals can be an effective way to plan for the future. To help you create a sound strategy based on your personal goals and risk tolerance, Wells Fargo Funds offers more than 100 mutual funds spanning a wide range of asset classes and investment styles. Although diversification cannot guarantee an investment profit or prevent losses, we believe it can be an effective way to manage investment risk and potentially smooth out overall portfolio performance. We encourage investors to know their investments and to understand that appropriate levels of risk-taking may unlock opportunities.
Thank you for choosing to invest in Wells Fargo Funds. We appreciate your confidence in us and remain committed to helping you meet your financial needs.
Sincerely,

Andrew Owen
President
Wells Fargo Funds
Periods of uncertainty can present challenges, but experience has taught us that maintaining long-term investment goals can be an effective way to plan for the future.
For further information about your Fund, contact your investment professional, visit our website at wellsfargofunds.com, or call us directly at 1-800-222-8222. We are available 24 hours a day, 7 days a week.
| | | | |
| 4 | | Wells Fargo Municipal Bond Fund | | Performance highlights (unaudited) |
Investment objective
The Fund seeks current income exempt from federal income tax.
Manager
Wells Fargo Funds Management, LLC
Subadviser
Wells Capital Management Incorporated
Portfolio managers
Lyle J. Fitterer, CFA®, CPA
Robert J. Miller
Average annual total returns (%) as of December 31, 20161
| | | | | | | | | | | | | | | | | | | | | | | | | | | | | | | | | | |
| | | | | Including sales charge | | | Excluding sales charge | | | Expense ratios2 (%) | |
| | | Inception date | | 1 year | | | 5 year | | | 10 year | | | 1 year | | | 5 year | | | 10 year | | | Gross | | | Net3 | |
| Class A (WMFAX) | | 4-8-2005 | | | (4.32 | ) | | | 3.48 | | | | 4.28 | | | | 0.17 | | | | 4.44 | | | | 4.76 | | | | 0.79 | | | | 0.75 | |
| Class C (WMFCX) | | 4-8-2005 | | | (1.57 | ) | | | 3.66 | | | | 3.98 | | | | (0.57 | ) | | | 3.66 | | | | 3.98 | | | | 1.54 | | | | 1.50 | |
| Administrator Class (WMFDX) | | 4-8-2005 | | | – | | | | – | | | | – | | | | 0.42 | | | | 4.59 | | | | 4.95 | | | | 0.73 | | | | 0.60 | |
| Institutional Class (WMBIX) | | 3-31-2008 | | | – | | | | – | | | | – | | | | 0.46 | | | | 4.74 | | | | 5.03 | | | | 0.46 | | | | 0.46 | |
| Bloomberg Barclays Municipal Bond Index4 | | – | | | – | | | | – | | | | – | | | | 0.25 | | | | 3.28 | | | | 4.25 | | | | – | | | | – | |
Figures quoted represent past performance, which is no guarantee of future results, and do not reflect taxes that a shareholder may pay on fund distributions or the redemption of fund shares. Investment return and principal value of an investment will fluctuate so that an investor’s shares, when redeemed, may be worth more or less than their original cost. Performance shown without sales charges would be lower if sales charges were reflected. Current performance may be lower or higher than the performance data quoted, which assumes the reinvestment of dividends and capital gains. Current month-end performance is available on the Fund’s website, wellsfargofunds.com.
Index returns do not include transaction costs associated with buying and selling securities, any mutual fund fees or expenses, or any taxes. It is not possible to invest directly in an index.
For Class A shares, the maximum front-end sales charge is 4.50%. For Class C shares, the maximum contingent deferred sales charge is 1.00%. Performance including a contingent deferred sales charge assumes the sales charge for the corresponding time period. Administrator Class and Institutional Class shares are sold without a front-end sales charge or contingent deferred sales charge.
Bond values fluctuate in response to the financial condition of individual issuers, general market and economic conditions, and changes in interest rates. Changes in market conditions and government policies may lead to periods of heightened volatility in the bond market and reduced liquidity for certain bonds held by the Fund. In general, when interest rates rise, bond values fall and investors may lose principal value. Interest-rate changes and their impact on the Fund and its share price can be sudden and unpredictable. The use of derivatives may reduce returns and/or increase volatility. Certain investment strategies tend to increase the total risk of an investment (relative to the broader market). The Fund is exposed to high-yield securities risk and municipal securities risk. Consult the Fund’s prospectus for additional information on these and other risks. A portion of the Fund’s income may be subject to federal, state, and/ or local income taxes or the Alternative Minimum Tax (AMT). Any capital gains distributions may be taxable.
Please see footnotes on page 5.
| | | | | | |
| Performance highlights (unaudited) | | Wells Fargo Municipal Bond Fund | | | 5 | |
|
| Effective maturity distribution as of December 31, 20165 |
|
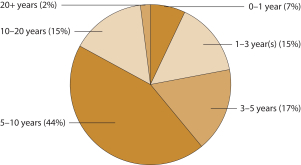
|
|
| Credit quality as of December 31, 20166 |
|
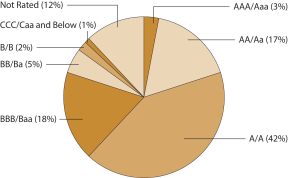
|
| 1 | Historical performance shown for Institutional Class shares prior to their inception reflects the performance of the former Investor Class shares, and includes the higher expenses applicable to the former Investor Class shares. If these expenses had not been included, returns would be higher. |
| 2 | Reflects the expense ratios as stated in the most recent prospectuses. The expense ratios shown are subject to change and may differ from the annualized expense ratios shown in the financial highlights of this report. |
| 3 | The manager has contractually committed through October 31, 2017, to waive fees and/or reimburse expenses to the extent necessary to cap the Fund’s Total Annual Fund Operating Expenses After Fee Waiver at 0.75% for Class A, 1.50% for Class C, 0.60% for Administrator Class, and 0.48% for Institutional Class. After this time, the cap may be increased or the commitment to maintain the cap may be terminated only with the approval of the Board of Trustees. Brokerage commissions, stamp duty fees, interest, taxes, acquired fund fees and expenses, and extraordinary expenses are excluded from the expense cap. Without this cap, the Fund’s returns would have been lower. |
| 4 | The Bloomberg Barclays Municipal Bond Index (formerly known as Barclays Municipal Bond Index) is an unmanaged index composed of long-term tax-exempt bonds with a minimum credit rating of Baa. You cannot invest directly in an index. |
| 5 | Amounts are calculated based on the total investments of the Fund. These amounts are subject to change and may have changed since the date specified. |
| 6 | The credit quality distribution of portfolio holdings reflected in the chart is based on ratings from Standard & Poor’s, Moody’s Investors Service, and/ or Fitch Ratings Ltd. Credit quality ratings apply to the underlying holdings of the Fund and not to the Fund itself. The percentages of the Fund’s portfolio with the ratings depicted in the chart are calculated based on the total market value of fixed income securities held by the Fund. If a security was rated by all three rating agencies, the middle rating was utilized. If rated by two of three rating agencies, the lower rating was utilized, and if rated by one of the rating agencies, that rating was utilized. Standard & Poor’s rates the creditworthiness of bonds, ranging from AAA (highest) to D (lowest). Ratings from A to CCC may be modified by the addition of a plus (+) or minus (-) sign to show relative standing within the rating categories. Standard & Poor’s rates the creditworthiness of short-term notes from SP-1 (highest) to SP-3 (lowest). Moody’s rates the creditworthiness of bonds, ranging from Aaa (highest) to C (lowest). Ratings Aa to B may be modified by the addition of a number 1 (highest) to 3 (lowest) to show relative standing within the ratings categories. Moody’s rates the creditworthiness of short-term U.S. tax-exempt municipal securities from MIG 1/VMIG 1 (highest) to SG (lowest). Fitch rates the creditworthiness of bonds, ranging from AAA (highest) to D (lowest). Credit quality distribution is subject to change and may have changed since the date specified. |
| | | | |
| 6 | | Wells Fargo Municipal Bond Fund | | Fund expenses (unaudited) |
As a shareholder of the Fund, you incur two types of costs: (1) transaction costs, including sales charges (loads) on purchase payments and contingent deferred sales charges (if any) on redemptions and (2) ongoing costs, including management fees, distribution (12b-1) and/or shareholder servicing fees, and other Fund expenses. This example is intended to help you understand your ongoing costs (in dollars) of investing in the Fund and to compare these costs with the ongoing costs of investing in other mutual funds.
The example is based on an investment of $1,000 invested at the beginning of the six-month period and held for the entire period from July 1, 2016 to December 31, 2016.
Actual expenses
The “Actual” line of the table below provides information about actual account values and actual expenses. You may use the information in this line, together with the amount you invested, to estimate the expenses that you paid over the period. Simply divide your account value by $1,000 (for example, an $8,600 account value divided by $1,000 = 8.6), then multiply the result by the number in the “Actual” line under the heading entitled “Expenses paid during period” for your applicable class of shares to estimate the expenses you paid on your account during this period.
Hypothetical example for comparison purposes
The “Hypothetical” line of the table below provides information about hypothetical account values and hypothetical expenses based on the Fund’s actual expense ratio and an assumed rate of return of 5% per year before expenses, which is not the Fund’s actual return. The hypothetical account values and expenses may not be used to estimate the actual ending account balance or expenses you paid for the period. You may use this information to compare the ongoing costs of investing in the Fund and other funds. To do so, compare this 5% hypothetical example with the 5% hypothetical examples that appear in the shareholder reports of the other funds.
Please note that the expenses shown in the table are meant to highlight your ongoing costs only and do not reflect any transactional costs, such as sales charges (loads) and contingent deferred sales charges. Therefore, the “Hypothetical” line of the table is useful in comparing ongoing costs only and will not help you determine the relative total costs of owning different funds. In addition, if these transactional costs were included, your costs would have been higher.
| | | | | | | | | | | | | | | | |
| | | Beginning account value 7-1-2016 | | | Ending account value 12-31-2016 | | | Expenses paid during the period¹ | | | Annualized net expense ratio | |
Class A | | | | | | | | | | | | | | | | |
Actual | | $ | 1,000.00 | | | $ | 962.43 | | | $ | 3.70 | | | | 0.75 | % |
Hypothetical (5% return before expenses) | | $ | 1,000.00 | | | $ | 1,021.37 | | | $ | 3.81 | | | | 0.75 | % |
Class C | | | | | | | | | | | | | | | | |
Actual | | $ | 1,000.00 | | | $ | 959.68 | | | $ | 7.39 | | | | 1.50 | % |
Hypothetical (5% return before expenses) | | $ | 1,000.00 | | | $ | 1,017.60 | | | $ | 7.61 | | | | 1.50 | % |
Administrator Class | | | | | | | | | | | | | | | | |
Actual | | $ | 1,000.00 | | | $ | 964.10 | | | $ | 2.96 | | | | 0.60 | % |
Hypothetical (5% return before expenses) | | $ | 1,000.00 | | | $ | 1,022.12 | | | $ | 3.05 | | | | 0.60 | % |
Institutional Class | | | | | | | | | | | | | | | | |
Actual | | $ | 1,000.00 | | | $ | 963.83 | | | $ | 2.27 | | | | 0.46 | % |
Hypothetical (5% return before expenses) | | $ | 1,000.00 | | | $ | 1,022.82 | | | $ | 2.34 | | | | 0.46 | % |
| 1 | Expenses paid is equal to the annualized net expense ratio of each class multiplied by the average account value over the period, multiplied by the number of days in the most recent fiscal half-year divided by the number of days in the fiscal year (to reflect the one-half-year period). |
| | | | | | |
| Summary portfolio of investments—December 31, 2016 (unaudited) | | Wells Fargo Municipal Bond Fund | | | 7 | |
The Summary portfolio of investments shows the 50 largest portfolio holdings in unaffiliated issuers and any holdings exceeding 1% of the total net assets as of the report date. The remaining securities held are grouped as “Other securities” in each category.
| | | | | | | | | | | | | | | | | | | | |
| Security name | | Interest rate | | | Maturity date | | | Principal | | | Value | | | Percent of
net assets | |
|
Corporate Bonds and Notes: 0.61% | |
| | | | | |
Consumer Discretionary: 0.61% | | | | | | | | | | | | | | | | | | | | |
| | | | | |
| Diversified Consumer Services: 0.61% | | | | | | | | | | | | | | | | | | | | |
Toll Road Investors Partnership II 144A¤ | | | 0.00 | % | | | 2-15-2028 | | | $ | 30,780,000 | | | $ | 15,545,778 | | | | 0.61 | % |
| | | | | | | | | | | | | | | | | | | | |
| | | |
Total Corporate Bonds and Notes (Cost $15,840,313) | | | | | | | | 15,545,778 | | | | 0.61 | |
| | | | | | | | | | | | | | | | | | | | |
| | | | | |
Municipal Obligations: 99.25% | | | | | | | | | | | | | | | | | | | | |
| | | | | |
| Alabama: 2.05% | | | | | | | | | | | | | | | | | | | | |
Alabama Federal Aid Highway Finance Authority Series A (Tax Revenue) | | | 5.00 | | | | 9-1-2035 | | | | 19,000,000 | | | | 22,029,740 | | | | 0.86 | |
Other securities | | | | | | | | | | | | | | | 30,616,452 | | | | 1.19 | |
| | | | | |
| | | | | | | | | | | | | | | 52,646,192 | | | | 2.05 | |
| | | | | | | | | | | | | | | | | | | | |
| | | | | |
| Alaska: 0.27% | | | | | | | | | | | | | | | | | | | | |
Other securities | | | | | | | | | | | | | | | 7,012,074 | | | | 0.27 | |
| | | | | | | | | | | | | | | | | | | | |
| | | | | |
| Arizona: 1.09% | | | | | | | | | | | | | | | | | | | | |
Other securities | | | | | | | | | | | | | | | 28,055,139 | | | | 1.09 | |
| | | | | | | | | | | | | | | | | | | | |
| | | | | |
| California: 7.52% | | | | | | | | | | | | | | | | | | | | |
Bay Area CA Toll Authority Toll Bridge Series A (Transportation Revenue) ± | | | 1.97 | | | | 4-1-2036 | | | | 28,000,000 | | | | 28,106,960 | | | | 1.09 | |
M-S-R California Energy Authority Gas Series B (Utilities Revenue) | | | 6.13 | | | | 11-1-2029 | | | | 15,925,000 | | | | 19,657,661 | | | | 0.76 | |
Northern California Gas Authority #1 LIBOR Series B (Utilities Revenue) ± | | | 1.29 | | | | 7-1-2027 | | | | 27,660,000 | | | | 24,622,655 | | | | 0.96 | |
Other securities | | | | | | | | | | | | | | | 121,218,661 | | | | 4.71 | |
| | | | | |
| | | | | | | | | | | | | | | 193,605,937 | | | | 7.52 | |
| | | | | | | | | | | | | | | | | | | | |
| | | | | |
| Colorado: 2.89% | | | | | | | | | | | | | | | | | | | | |
Colorado ECFA (Various Revenue) | | | 5.50-8.13 | | | | 10-1-2017 to 9-1-2048 | | | | 27,515,000 | | | | 29,024,282 | | | | 1.13 | |
Colorado Health Facilities Authority Catholic Health Initiative Series 2009A (Health Revenue) | | | 5.00 | | | | 7-1-2039 | | | | 14,100,000 | | | | 14,452,923 | | | | 0.56 | |
Other securities | | | | | | | | | | | | | | | 30,864,136 | | | | 1.20 | |
| | | | | |
| | | | | | | | | | | | | | | 74,341,341 | | | | 2.89 | |
| | | | | | | | | | | | | | | | | | | | |
| | | | | |
| Connecticut: 0.64% | | | | | | | | | | | | | | | | | | | | |
Other securities | | | | | | | | | | | | | | | 16,477,162 | | | | 0.64 | |
| | | | | | | | | | | | | | | | | | | | |
| | | | | |
| Delaware: 0.38% | | | | | | | | | | | | | | | | | | | | |
Other securities | | | | | | | | | | | | | | | 9,840,167 | | | | 0.38 | |
| | | | | | | | | | | | | | | | | | | | |
| | | | | |
| District of Columbia: 0.23% | | | | | | | | | | | | | | | | | | | | |
Other securities | | | | | | | | | | | | | | | 5,960,100 | | | | 0.23 | |
| | | | | | | | | | | | | | | | | | | | |
The accompanying notes are an integral part of these financial statements.
| | | | |
| 8 | | Wells Fargo Municipal Bond Fund | | Summary portfolio of investments—December 31, 2016 (unaudited) |
| | | | | | | | | | | | | | | | | | | | |
| Security name | | Interest rate | | | Maturity date | | | Principal | | | Value | | | Percent of
net assets | |
| | | | | |
| Florida: 3.90% | | | | | | | | | | | | | | | | | | | | |
Florida Development Finance Corporation Educational Facilities Renaissance Charter School Project Series A (Education Revenue) | | | 8.50 | % | | | 6-15-2044 | | | $ | 13,290,000 | | | $ | 15,214,924 | | | | 0.59 | % |
Miami-Dade County FL School District (GO Revenue) | | | 5.00 | | | | 3-15-2046 | | | | 25,000,000 | | | | 27,392,750 | | | | 1.07 | |
Other securities | | | | | | | | | | | | | | | 57,784,916 | | | | 2.24 | |
| | | | | |
| | | | | | | | | | | | | | | 100,392,590 | | | | 3.90 | |
| | | | | | | | | | | | | | | | | | | | |
| | | | | |
| Georgia: 0.38% | | | | | | | | | | | | | | | | | | | | |
Other securities | | | | | | | | | | | | | | | 9,777,258 | | | | 0.38 | |
| | | | | | | | | | | | | | | | | | | | |
| | | | | |
| Guam: 0.16% | | | | | | | | | | | | | | | | | | | | |
Other securities | | | | | | | | | | | | | | | 4,075,969 | | | | 0.16 | |
| | | | | | | | | | | | | | | | | | | | |
| | | | | |
| Hawaii: 0.12% | | | | | | | | | | | | | | | | | | | | |
Other securities | | | | | | | | | | | | | | | 3,067,284 | | | | 0.12 | |
| | | | | | | | | | | | | | | | | | | | |
| | | | | |
| Idaho: 0.69% | | | | | | | | | | | | | | | | | | | | |
Other securities | | | | | | | | | | | | | | | 17,841,643 | | | | 0.69 | |
| | | | | | | | | | | | | | | | | | | | |
| | | | | |
| Illinois: 19.70% | | | | | | | | | | | | | | | | | | | | |
Chicago IL (Various Revenue) | | | 0.00-5.56 | | | | 1-1-2021 to 1-1-2038 | | | | 74,125,000 | | | | 67,728,063 | | | | 2.64 | |
Chicago IL Board of Education (GO Revenue, AGM Insured) | | | 0.00-5.25 | | | | 12-1-2020 to 12-1-2031 | | | | 57,930,000 | | | | 35,947,957 | | | | 1.40 | |
Chicago IL Board of Education CAB School Reform Series B-1 (GO Revenue, National Insured) ¤ | | | 0.00 | | | | 12-1-2028 | | | | 24,270,000 | | | | 13,409,175 | | | | 0.52 | |
Chicago IL O’Hare International Airport (Airport Revenue) µ | | | 5.00-5.75 | | | | 1-1-2025 to 1-1-2044 | | | | 30,290,000 | | | | 33,748,429 | | | | 1.32 | |
Chicago IL Series A (GO Revenue) | | | 5.50 | | | | 1-1-2033 | | | | 12,730,000 | | | | 12,245,496 | | | | 0.48 | |
Cook County IL (GO Revenue) µ | | | 5.00-5.25 | | | | 11-15-2022 to 11-15-2027 | | | | 9,705,000 | | | | 10,707,128 | | | | 0.41 | |
Cook County IL Series G (GO Revenue) | | | 5.00 | | | | 11-15-2028 | | | | 27,000,000 | | | | 28,663,470 | | | | 1.11 | |
Illinois (Various Revenue) µ | | | 5.00-6.00 | | | | 4-1-2021 to 7-1-2038 | | | | 50,770,000 | | | | 53,119,177 | | | | 2.04 | |
Illinois Finance Authority (Various Revenue) µ | | | 4.13-7.13 | | | | 9-1-2018 to 10-1-2041 | | | | 38,225,000 | | | | 41,798,572 | | | | 1.62 | |
Illinois Sports Facilities Authority (Tax Revenue) µ | | | 0.00-5.25 | | | | 6-15-2021 to 6-15-2032 | | | | 37,945,000 | | | | 37,720,758 | | | | 1.46 | |
Illinois Sports Facilities Authority State Tax Supported CAB (Tax Revenue, Ambac Insured) ¤ | | | 0.00 | | | | 6-15-2024 | | | | 17,510,000 | | | | 12,883,508 | | | | 0.50 | |
Kane-Cook-DuPage Counties IL School District #46 CAB Series B (GO Revenue, Ambac Insured) ¤ | | | 0.00 | | | | 1-1-2023 | | | | 15,025,000 | | | | 12,447,311 | | | | 0.48 | |
Metropolitan Pier & Exposition Authority IIlinois CAB McCormick Place Expansion Project Series A (Tax Revenue, National Insured) ¤ | | | 0.00 | | | | 12-15-2026 to 12-15-2035 | | | | 44,200,000 | | | | 21,885,544 | | | | 0.85 | |
Metropolitan Pier & Exposition Authority IIlinois CAB McCormick Place Expansion Project Series A (Tax Revenue, National Insured) ¤ | | | 0.00 | | | | 12-15-2029 | | | | 33,800,000 | | | | 18,706,610 | | | | 0.73 | |
University of Illinois Auxiliary Facilities Systems Series A (Education Revenue) | | | 5.75 | | | | 4-1-2038 | | | | 14,000,000 | | | | 15,334,200 | | | | 0.60 | |
Other securities | | | | | | | | | | | | | | | 90,720,169 | | | | 3.54 | |
| | | | | |
| | | | | | | | | | | | | | | 507,065,567 | | | | 19.70 | |
| | | | | | | | | | | | | | | | | | | | |
The accompanying notes are an integral part of these financial statements.
| | | | | | |
| Summary portfolio of investments—December 31, 2016 (unaudited) | | Wells Fargo Municipal Bond Fund | | | 9 | |
| | | | | | | | | | | | | | | | | | | | |
| Security name | | Interest rate | | | Maturity date | | | Principal | | | Value | | | Percent of
net assets | |
| | | | | |
| Indiana: 1.96% | | | | | | | | | | | | | | | | | | | | |
Indiana Finance Authority (Various Revenue) | | | 3.13-5.25 | % | | | 12-1-2024 to 7-1-2040 | | | $ | 30,790,000 | | | $ | 30,928,834 | | | | 1.21 | % |
Other securities | | | | | | | | | | | | | | | 19,382,445 | | | | 0.75 | |
| | | | | |
| | | | | | | | | | | | | | | 50,311,279 | | | | 1.96 | |
| | | | | | | | | | | | | | | | | | | | |
| | | | | |
| Iowa: 0.08% | | | | | | | | | | | | | | | | | | | | |
Other securities | | | | | | | | | | | | | | | 2,052,556 | | | | 0.08 | |
| | | | | | | | | | | | | | | | | | | | |
| | | | | |
| Kansas: 1.19% | | | | | | | | | | | | | | | | | | | | |
Wyandotte County & Kansas City KS Sales Tax Special Obligation Vacation Village Project Area 4 - Major Multi-Sport Athletic Complex Project CAB Series 2015 (Tax Revenue) 144A¤ | | | 0.00 | | | | 9-1-2034 | | | | 97,000,000 | | | | 30,585,070 | | | | 1.19 | |
Other securities | | | | | | | | | | | | | | | 40,302 | | | | 0.00 | |
| | | | | |
| | | | | | | | | | | | | | | 30,625,372 | | | | 1.19 | |
| | | | | | | | | | | | | | | | | | | | |
| | | | | |
| Kentucky: 1.62% | | | | | | | | | | | | | | | | | | | | |
Kentucky EDFA (Various Revenue) µ | | | 0.00-5.00 | | | | 10-1-2024 to 7-1-2040 | | | | 17,505,000 | | | | 13,791,005 | | | | 0.54 | |
Kentucky EDFA Catholic Health Initiatives Series B (Health Revenue) ± | | | 2.12 | | | | 2-1-2046 | | | | 22,715,000 | | | | 22,371,322 | | | | 0.87 | |
Other securities | | | | | | | | | | | | | | | 5,630,065 | | | | 0.21 | |
| | | | | |
| | | | | | | | | | | | | | | 41,792,392 | | | | 1.62 | |
| | | | | | | | | | | | | | | | | | | | |
| | | | | |
| Louisiana: 0.95% | | | | | | | | | | | | | | | | | | | | |
Other securities | | | | | | | | | | | | | | | 24,486,066 | | | | 0.95 | |
| | | | | | | | | | | | | | | | | | | | |
| | | | | |
| Maine: 0.08% | | | | | | | | | | | | | | | | | | | | |
Other securities | | | | | | | | | | | | | | | 2,058,036 | | | | 0.08 | |
| | | | | | | | | | | | | | | | | | | | |
| | | | | |
| Maryland: 0.65% | | | | | | | | | | | | | | | | | | | | |
Other securities | | | | | | | | | | | | | | | 16,656,602 | | | | 0.65 | |
| | | | | | | | | | | | | | | | | | | | |
| | | | | |
| Massachusetts: 0.79% | | | | | | | | | | | | | | | | | | | | |
Other securities | | | | | | | | | | | | | | | 20,362,362 | | | | 0.79 | |
| | | | | | | | | | | | | | | | | | | | |
| | | | | |
| Michigan: 7.51% | | | | | | | | | | | | | | | | | | | | |
Detroit MI Water Supply System Second Lien Series B (Water & Sewer Revenue, AGM Insured) | | | 7.00 | | | | 7-1-2036 | | | | 9,675,000 | | | | 10,941,554 | | | | 0.42 | |
Great Lakes Michigan Water Authority Sewage Disposal System Series 2016C | | | 5.00 | | | | 7-2-2036 | | | | 8,500,000 | | | | 9,250,635 | | | | 0.36 | |
Great Lakes Michigan Water Authority Water Supply System Series 2016D (Water & Sewer Revenue) | | | 4.00 | | | | 7-1-2032 | | | | 11,000,000 | | | | 11,069,300 | | | | 0.43 | |
Great Lakes Michigan Water Authority Water Supply System Series 2016D (Water & Sewer Revenue, AGM Insured) | | | 4.00 | | | | 7-1-2033 | | | | 11,000,000 | | | | 11,086,680 | | | | 0.43 | |
Michigan Finance Authority (Various Revenue) µ | | | 4.50-8.25 | | | | 10-1-2020 to 10-1-2040 | | | | 58,580,000 | | | | 64,121,380 | | | | 2.50 | |
Michigan Finance Authority Refunding Bond Local Government Loan Program Public Lighting Authority Series B (Tax Revenue) | | | 5.00 | | | | 7-1-2044 | | | | 12,625,000 | | | | 13,419,491 | | | | 0.52 | |
The accompanying notes are an integral part of these financial statements.
| | | | |
| 10 | | Wells Fargo Municipal Bond Fund | | Summary portfolio of investments—December 31, 2016 (unaudited) |
| | | | | | | | | | | | | | | | | | | | |
| Security name | | Interest rate | | | Maturity date | | | Principal | | | Value | | | Percent of
net assets | |
| | | | | |
| Michigan (continued) | | | | | | | | | | | | | | | | | | | | |
Michigan Strategic Fund Limited Obligation Events Bonds Center Project Series A (Tax Revenue) ± | | | 4.13 | % | | | 7-1-2045 | | | $ | 15,500,000 | | | $ | 15,693,750 | | | | 0.61 | % |
Other securities | | | | | | | | | | | | | | | 57,719,045 | | | | 2.24 | |
| | | | | |
| | | | | | | | | | | | | | | 193,301,835 | | | | 7.51 | |
| | | | | | | | | | | | | | | | | | | | |
| | | | | |
| Mississippi: 0.36% | | | | | | | | | | | | | | | | | | | | |
Other securities | | | | | | | | | | | | | | | 9,125,445 | | | | 0.36 | |
| | | | | | | | | | | | | | | | | | | | |
| | | | | |
| Missouri: 0.62% | | | | | | | | | | | | | | | | | | | | |
Other securities | | | | | | | | | | | | | | | 16,039,862 | | | | 0.62 | |
| | | | | | | | | | | | | | | | | | | | |
| | | | | |
| Nebraska: 0.04% | | | | | | | | | | | | | | | | | | | | |
Other securities | | | | | | | | | | | | | | | 1,109,495 | | | | 0.04 | |
| | | | | | | | | | | | | | | | | | | | |
| | | | | |
| Nevada: 0.05% | | | | | | | | | | | | | | | | | | | | |
Other securities | | | | | | | | | | | | | | | 1,180,766 | | | | 0.05 | |
| | | | | | | | | | | | | | | | | | | | |
| | | | | |
| New Jersey: 5.99% | | | | | | | | | | | | | | | | | | | | |
New Jersey EDA (Various Revenue) | | | 1.97-5.00 | | | | 9-1-2025 to 10-1-2040 | | | | 14,695,000 | | | | 14,465,931 | | | | 0.56 | |
New Jersey EDA School Facilities Construction Project Series I (Miscellaneous Revenue) ± | | | 2.27 | | | | 9-1-2027 | | | | 22,245,000 | | | | 20,704,756 | | | | 0.80 | |
New Jersey EDA School Facilities Construction Project Series NN (Miscellaneous Revenue) | | | 5.00 | | | | 3-1-2026 | | | | 15,000,000 | | | | 15,457,950 | | | | 0.60 | |
New Jersey TTFA (Transportation Revenue) | | | 6.00 | | | | 12-15-2038 | | | | 10,425,000 | | | | 11,062,385 | | | | 0.43 | |
New Jersey TTFA (Transportation
Revenue) 144A | | | 0.00-5.75 | | | | 6-15-2023 to 6-15-2044 | | | | 49,640,000 | | | | 42,210,216 | | | | 1.64 | |
New Jersey TTFA Series A (Various Revenue) µ | | | 5.75 | | | | 6-15-2025 | | | | 10,000,000 | | | | 11,551,400 | | | | 0.45 | |
Other securities | | | | | | | | | | | | | | | 38,778,305 | | | | 1.51 | |
| | | | | |
| | | | | | | | | | | | | | | 154,230,943 | | | | 5.99 | |
| | | | | | | | | | | | | | | | | | | | |
| | | | | |
| New Mexico: 0.41% | | | | | | | | | | | | | | | | | | | | |
Other securities | | | | | | | | | | | | | | | 10,594,771 | | | | 0.41 | |
| | | | | | | | | | | | | | | | | | | | |
| | | | | |
| New York: 10.49% | | | | | | | | | | | | | | | | | | | | |
Hempstead Town NY Local Development Corporation The Academy Charter School Project Series A (Education Revenue) | | | 8.25 | | | | 2-1-2041 | | | | 9,790,000 | | | | 10,971,261 | | | | 0.43 | |
Metropolitan Transportation Authority New York Series A (Transportation Revenue) | | | 5.00 | | | | 11-15-2030 | | | | 16,000,000 | | | | 18,092,000 | | | | 0.70 | |
Metropolitan Transportation Authority New York Series C (Transportation Revenue) | | | 6.50 | | | | 11-15-2028 | | | | 8,000,000 | | | | 8,777,132 | | | | 0.34 | |
New York Dormitory Authority Series B (Tax Revenue) | | | 5.75 | | | | 3-15-2036 | | | | 10,000,000 | | | | 10,861,100 | | | | 0.42 | |
New York NY Municipal Water Finance Authority 2nd General Resolution Series AA (Water & Sewer Revenue) | | | 5.00 | | | | 6-15-2044 | | | | 17,400,000 | | | | 19,169,580 | | | | 0.74 | |
New York NY Municipal Water Finance Authority 2nd General Resolution Series BB (Water & Sewer Revenue) | | | 5.00 | | | | 6-15-2044 | | | | 30,265,000 | | | | 33,599,295 | | | | 1.31 | |
New York NY Municipal Water Finance Authority 2nd General Resolution Series BB (Water & Sewer Revenue) | | | 5.25 | | | | 6-15-2044 | | | | 9,800,000 | | | | 11,026,862 | | | | 0.43 | |
The accompanying notes are an integral part of these financial statements.
| | | | | | |
| Summary portfolio of investments—December 31, 2016 (unaudited) | | Wells Fargo Municipal Bond Fund | | | 11 | |
| | | | | | | | | | | | | | | | | | | | |
| Security name | | Interest rate | | | Maturity date | | | Principal | | | Value | | | Percent of
net assets | |
| | | | | |
| New York (continued) | | | | | | | | | | | | | | | | | | | | |
New York NY Municipal Water Finance Authority 2nd General Resolution Series DD (Water & Sewer Revenue) | | | 6.00 | % | | | 6-15-2040 | | | $ | 11,625,000 | | | $ | 12,332,033 | | | | 0.48 | % |
New York NY Municipal Water Finance Authority Water & Sewer System Series A (Water & Sewer Revenue) | | | 5.00 | | | | 6-15-2038 | | | | 36,650,000 | | | | 37,210,745 | | | | 1.45 | |
New York NY Municipal Water Finance Authority (Water & Sewer Revenue) | | | 5.00-5.75 | | | | 6-15-2026 to 6-15-2040 | | | | 8,255,000 | | | | 8,971,548 | | | | 0.35 | |
New York NY Transitional Finance Authority (Various Revenue) | | | 5.00-5.75 | | | | 5-1-2033 to 1-15-2039 | | | | 7,895,000 | | | | 8,852,808 | | | | 0.34 | |
New York NY Transitional Finance Authority Future Tax Secured Subordinate Bonds Series A (Tax Revenue) | | | 5.00 | | | | 8-1-2031 | | | | 17,075,000 | | | | 19,803,073 | | | | 0.77 | |
New York Transportation Development Corporation American Airlines Incorporated John F Kennedy International Airport Project Series 2016 (Airport Revenue) | | | 5.00 | | | | 8-1-2026 | | | | 11,500,000 | | | | 11,859,950 | | | | 0.46 | |
New York Urban Development Corporation Certificate of Participation James A Farley Post Office Project (Miscellaneous Revenue) 144A | | �� | 4.20 | | | | 2-1-2017 | | | | 20,880,000 | | | | 20,871,648 | | | | 0.81 | |
Other securities | | | | | | | | | | | | | | | 37,445,385 | | | | 1.46 | |
| | | | | |
| | | | | | | | | | | | | | | 269,844,420 | | | | 10.49 | |
| | | | | | | | | | | | | | | | | | | | |
| | | | | |
| North Carolina: 0.71% | | | | | | | | | | | | | | | | | | | | |
Other securities | | | | | | | | | | | | | | | 18,287,340 | | | | 0.71 | |
| | | | | | | | | | | | | | | | | | | | |
| | | | | |
| Ohio: 2.53% | | | | | | | | | | | | | | | | | | | | |
Ohio Private Activity Bond AMT Portsmouth Bypass Project (Miscellaneous Revenue, AGM Insured) | | | 5.00 | | | | 12-31-2035 | | | | 12,000,000 | | | | 13,055,880 | | | | 0.51 | |
Other securities | | | | | | | | | | | | | | | 52,026,584 | | | | 2.02 | |
| | | | | |
| | | | | | | | | | | | | | | 65,082,464 | | | | 2.53 | |
| | | | | | | | | | | | | | | | | | | | |
| | | | | |
| Oklahoma: 0.41% | | | | | | | | | | | | | | | | | | | | |
Other securities | | | | | | | | | | | | | | | 10,499,007 | | | | 0.41 | |
| | | | | | | | | | | | | | | | | | | | |
| | | | | |
| Oregon: 0.20% | | | | | | | | | | | | | | | | | | | | |
Other securities | | | | | | | | | | | | | | | 5,090,400 | | | | 0.20 | |
| | | | | | | | | | | | | | | | | | | | |
| | | | | |
| Pennsylvania: 8.67% | | | | | | | | | | | | | | | | | | | | |
Berks County PA Municipal Authority Reading Hospital & Medical Center Project Series B (Health Revenue) | | | 2.23 | | | | 11-1-2039 | | | | 20,000,000 | | | | 20,155,000 | | | | 0.78 | |
Delaware Valley PA Regional Finance Authority (Miscellaneous Revenue) µ | | | 5.75-7.75 | | | | 7-1-2027 to 7-1-2032 | | | | 8,925,000 | | | | 11,511,167 | | | | 0.45 | |
Delaware Valley PA Regional Finance Authority Local Government Series A (Miscellaneous Revenue, Ambac Insured) | | | 5.50 | | | | 8-1-2028 | | | | 16,420,000 | | | | 19,482,330 | | | | 0.76 | |
Montgomery County PA IDA Exelon Generation Company LLC Project Series A (Industrial Development Revenue) ± | | | 2.55 | | | | 12-1-2029 | | | | 15,530,000 | | | | 15,369,109 | | | | 0.60 | |
The accompanying notes are an integral part of these financial statements.
| | | | |
| 12 | | Wells Fargo Municipal Bond Fund | | Summary portfolio of investments—December 31, 2016 (unaudited) |
| | | | | | | | | | | | | | | | | | | | |
| Security name | | Interest rate | | | Maturity date | | | Principal | | | Value | | | Percent of
net assets | |
| | | | | |
| Pennsylvania (continued) | | | | | | | | | | | | | | | | | | | | |
Montgomery County PA IDA Peco Energy Company Project Series A (Industrial Development Revenue) ± | | | 2.50 | % | | | 10-1-2030 | | | $ | 10,625,000 | | | $ | 10,501,856 | | | | 0.41 | % |
Pennsylvania EDFA Bridges Finco LP (Industrial Development Revenue) | | | 5.00 | | | | 12-31-2034 | | | | 14,275,000 | | | | 15,104,663 | | | | 0.59 | |
State Public School Building Authority (Miscellaneous Revenue) | | | 5.00 | | | | 4-1-2022 to 6-1-2034 | | | | 10,760,000 | | | | 11,607,307 | | | | 0.44 | |
Pennsylvania Public School Building Authority Series DCL-016 (Miscellaneous Revenue, Dexia Credit Local LOC, AGM Insured) 144Aø | | | 1.19 | | | | 6-1-2023 | | | | 15,685,000 | | | | 15,685,000 | | | | 0.61 | |
Pennsylvania Turnpike Commission Motor License Series B-1 (Transportation Revenue) | | | 5.00 | | | | 12-1-2040 | | | | 12,410,000 | | | | 13,353,905 | | | | 0.52 | |
State Public School Building Authority Pennsylvania Philadelphia School District Project Series A (Miscellaneous Revenue) | | | 5.00 | | | | 6-1-2035 | | | | 16,715,000 | | | | 17,776,235 | | | | 0.69 | |
Other securities | | | | | | | | | | | | | | | 72,620,256 | | | | 2.82 | |
| | | | | |
| | | | | | | | | | | | | | | 223,166,828 | | | | 8.67 | |
| | | | | | | | | | | | | | | | | | | | |
| | | | | |
| Puerto Rico: 0.16% | | | | | | | | | | | | | | | | | | | | |
Other securities | | | | | | | | | | | | | | | 4,176,219 | | | | 0.16 | |
| | | | | | | | | | | | | | | | | | | | |
| | | | | |
| Rhode Island: 0.21% | | | | | | | | | | | | | | | | | | | | |
Other securities | | | | | | | | | | | | | | | 5,463,070 | | | | 0.21 | |
| | | | | | | | | | | | | | | | | | | | |
| | | | | |
| South Carolina: 0.64% | | | | | | | | | | | | | | | | | | | | |
Other securities | | | | | | | | | | | | | | | 16,540,466 | | | | 0.64 | |
| | | | | | | | | | | | | | | | | | | | |
|
| South Dakota: 0.29% | |
Other securities | | | | | | | | | | | | | | | 7,329,964 | | | | 0.29 | |
| | | | | | | | | | | | | | | | | | | | |
| | | | | |
| Tennessee: 0.43% | | | | | | | | | | | | | | | | | | | | |
Other securities | | | | | | | | | | | | | | | 11,121,469 | | | | 0.43 | |
| | | | | | | | | | | | | | | | | | | | |
| | | | | |
| Texas: 6.39% | | | | | | | | | | | | | | | | | | | | |
Houston Port Authority TX Series D-1 (GO Revenue) | | | 5.00 | | | | 10-1-2035 | | | | 10,000,000 | | | | 11,021,000 | | | | 0.43 | |
Texas Municipal Gas Acquisition & Supply Corporation (Utilities Revenue) µ | | | 1.19-5.00 | | | | 9-15-2017 to 12-15-2031 | | | | 14,355,000 | | | | 14,911,475 | | | | 0.58 | |
Texas Municipal Gas Acquisition & Supply Corporation Subordinated Lien Series C (Utilities Revenue) ± | | | 2.02 | | | | 12-15-2026 | | | | 24,780,000 | | | | 22,373,366 | | | | 0.87 | |
Texas Private Activity Bond Surface Transportation Corporation Project NTE Mobility Partners Segments LLC (Transportation Revenue) | | | 7.00 | | | | 12-31-2038 | | | | 12,500,000 | | | | 14,208,250 | | | | 0.55 | |
Other securities | | | | | | | | | | | | | | | 101,838,617 | | | | 3.96 | |
| | |
| | | | 164,352,708 | | | | 6.39 | |
| | | | | | | | | | | | | | | | | | | | |
| | | | | |
| Utah: 0.54% | | | | | | | | | | | | | | | | | | | | |
Other securities | | | | | | | | | | | | | | | 13,843,623 | | | | 0.54 | |
| | | | | | | | | | | | | | | | | | | | |
The accompanying notes are an integral part of these financial statements.
| | | | | | |
| Summary portfolio of investments—December 31, 2016 (unaudited) | | Wells Fargo Municipal Bond Fund | | | 13 | |
| | | | | | | | | | | | | | | | | | | | |
| Security name | | Interest rate | | | Maturity date | | | Principal | | | Value | | | Percent of
net assets | |
| | | | | |
| Vermont: 1.53% | | | | | | | | | | | | | | | | | | | | |
Vermont Student Assistance Corporation Series B Class A-2 (Education Revenue) ± | | | 3.94 | % | | | 12-3-2035 | | | $ | 16,800,000 | | | $ | 17,704,848 | | | | 0.69 | % |
Vermont Student Assistance Corporation Series B Class B (Education Revenue) ± | | | 1.62 | | | | 6-2-2042 | | | | 21,883,566 | | | | 21,782,901 | | | | 0.84 | |
| | |
| | | | 39,487,749 | | | | 1.53 | |
| | | | | | | | | | | | | | | | | | | | |
| | | | | |
| Virgin Islands: 1.10% | | | | | | | | | | | | | | | | | | | | |
Virgin Islands PFA (Various Revenue) µ | | | 5.00 | | | | 10-1-2018 to 10-1-2032 | | | | 32,155,000 | | | | 28,366,329 | | | | 1.10 | |
| | | | | | | | | | | | | | | | | | | | |
| | | | | |
| Virginia: 0.49% | | | | | | | | | | | | | | | | | | | | |
Other securities | | | | | | | | | | | | | | | 12,475,591 | | | | 0.49 | |
| | | | | | | | | | | | | | | | | | | | |
| | | | | |
| Washington: 1.33% | | | | | | | | | | | | | | | | | | | | |
Other securities | | | | | | | | | | | | | | | 34,236,745 | | | | 1.33 | |
| | | | | | | | | | | | | | | | | | | | |
| | | | | |
| West Virginia: 0.10% | | | | | | | | | | | | | | | | | | | | |
Other securities | | | | | | | | | | | | | | | 2,489,815 | | | | 0.10 | |
| | | | | | | | | | | | | | | | | | | | |
| | | | | |
| Wisconsin: 0.62% | | | | | | | | | | | | | | | | | | | | |
Other securities | | | | | | | | | | | | | | | 15,833,276 | | | | 0.62 | |
| | | | | | | | | | | | | | | | | | | | |
| | | | | |
| Wyoming: 0.09% | | | | | | | | | | | | | | | | | | | | |
Other securities | | | | | | | | | | | | | | | 2,309,470 | | | | 0.09 | |
| | | | | | | | | | | | | | | | | | | | |
| | |
Total Municipal Obligations (Cost $2,491,776,445) | | | | 2,554,083,158 | | | | 99.25 | |
| | | | | | | | | | | | | | | | | | | | |
| | | | | |
| | | Yield | | | | | | Shares | | | | | | | |
| Short-Term Investments: 0.17% | | | | | | | | | | | | | | | | | | | | |
| | | | | |
| Investment Companies: 0.17% | | | | | | | | | | | | | | | | | | | | |
Wells Fargo Municipal Cash Management Fund Institutional Class (l)(u)## | | | 0.67 | | | | | | | | 4,425,767 | | | | 4,428,423 | | | | 0.17 | |
| | | | | | | | | | | | | | | | | | | | |
| | | |
Total Short-Term Investments (Cost $4,427,956) | | | | | | | | 4,428,423 | | | | 0.17 | |
| | | | | | | | | | | | | | | | | | | | |
| | | |
| Total investments in securities (Cost $2,512,044,714) * | | | | | | | | 2,574,057,359 | | | | 100.03 | |
Other assets and liabilities, net | | | | | | | | | | | | | | | (704,445 | ) | | | (0.03 | ) |
| | | | | | | | | | | | | | | | | | | | |
| Total net assets | | | | | | | | | | | | | | $ | 2,573,352,914 | | | | 100.00 | % |
| | | | | | | | | | | | | | | | | | | | |
| 144A | The security may be resold in transactions exempt from registration, normally to qualified institutional buyers, pursuant to Rule 144A under the Securities Act of 1933. |
| ¤ | The security is issued in zero coupon form with no periodic interest payments. |
| ± | Variable rate investment. The rate shown is the rate in effect at period end. |
| µ | All or some of these obligations have credit enhancements or liquidity features that may, under certain circumstances, provide for repayment of principal and interest. |
| ø | Variable rate demand notes are subject to a demand feature which reduces the effective maturity. The maturity date shown represents the final maturity date of the security. The interest rate is determined and reset by the issuer daily, weekly, or monthly depending upon the terms of the security. The rate shown is the rate in effect at period end. |
| (l) | The issuer of the security is an affiliated person of the Fund as defined in the Investment Company Act of 1940. |
| (u) | The rate represents the 7-day annualized yield at period end. |
| ## | All or a portion of this security is segregated for when-issued securities. |
| * | Cost for federal income tax purposes is $2,512,483,411 and unrealized gains (losses) consists of: |
| | | | |
Gross unrealized gains | | $ | 109,113,140 | |
Gross unrealized losses | | | (47,539,192 | ) |
| | | | |
Net unrealized gains | | $ | 61,573,948 | |
The accompanying notes are an integral part of these financial statements.
| | | | |
| 14 | | Wells Fargo Municipal Bond Fund | | Statement of assets and liabilities—December 31, 2016 (unaudited) |
| | | | |
| | | | |
| |
Assets | | | | |
Investments | | | | |
In unaffiliated securities, at value (cost $2,507,616,758) | | $ | 2,569,628,936 | |
In affiliated securities, at value (cost $4,427,956) | | | 4,428,423 | |
| | | | |
Total investments, at value (cost $2,512,044,714) | | | 2,574,057,359 | |
Receivable for investments sold | | | 4,065,832 | |
Receivable for Fund shares sold | | | 10,975,962 | |
Receivable for interest | | | 29,066,221 | |
Prepaid expenses and other assets | | | 275,449 | |
| | | | |
Total assets | | | 2,618,440,823 | |
| | | | |
| |
Liabilities | | | | |
Distributions payable | | | 1,661,986 | |
Payable for investments purchased | | | 23,210,645 | |
Payable for Fund shares redeemed | | | 18,477,526 | |
Management fee payable | | | 786,385 | |
Distribution fees payable | | | 111,653 | |
Administration fees payable | | | 302,821 | |
Accrued expenses and other liabilities | | | 536,893 | |
| | | | |
Total liabilities | | | 45,087,909 | |
| | | | |
Total net assets | | $ | 2,573,352,914 | |
| | | | |
| |
NET ASSETS CONSIST OF | | | | |
Paid-in capital | | $ | 2,523,679,156 | |
Overdistributed net investment income | | | (275,161 | ) |
Accumulated net realized losses on investments | | | (12,063,726 | ) |
Net unrealized gains on investments | | | 62,012,645 | |
| | | | |
Total net assets | | $ | 2,573,352,914 | |
| | | | |
| |
COMPUTATION OF NET ASSET VALUE AND OFFERING PRICE PER SHARE | | | | |
Net assets – Class A | | $ | 1,358,700,565 | |
Shares outstanding – Class A1 | | | 134,758,474 | |
Net asset value per share – Class A | | | $10.08 | |
Maximum offering price per share – Class A2 | | | $10.55 | |
Net assets – Class C | | $ | 161,277,293 | |
Shares outstanding – Class C1 | | | 15,999,528 | |
Net asset value per share – Class C | | | $10.08 | |
Net assets – Administrator Class | | $ | 134,999,856 | |
Shares outstanding – Administrator Class1 | | | 13,386,145 | |
Net asset value per share – Administrator Class | | | $10.09 | |
Net assets – Institutional Class | | $ | 918,375,200 | |
Shares outstanding – Institutional Class1 | | | 91,094,084 | |
Net asset value per share – Institutional Class | | | $10.08 | |
| 1 | The Fund has an unlimited number of authorized shares. |
| 2 | Maximum offering price is computed as 100/95.50 of net asset value. On investments of $50,000 or more, the offering price is reduced. |
The accompanying notes are an integral part of these financial statements.
| | | | | | |
| Statement of operations—six months ended December 31, 2016 (unaudited) | | Wells Fargo Municipal Bond Fund | | | 15 | |
| | | | |
| | | | |
| |
Investment income | | | | |
Interest | | $ | 53,080,625 | |
Income from affiliated securities | | | 21,633 | |
| | | | |
Total investment income | | | 53,102,258 | |
| | | | |
| |
Expenses | | | | |
Management fee | | | 5,308,329 | |
Administration fees | | | | |
Class A | | | 1,195,557 | |
Class B | | | 271 | 1 |
Class C | | | 146,733 | |
Administrator Class | | | 119,204 | |
Institutional Class | | | 403,010 | |
Shareholder servicing fees | | | | |
Class A | | | 1,868,057 | |
Class B | | | 423 | 1 |
Class C | | | 229,270 | |
Administrator Class | | | 298,011 | |
Distribution fees | | | | |
Class B | | | 1,270 | 1 |
Class C | | | 687,810 | |
Custody and accounting fees | | | 79,166 | |
Professional fees | | | 36,690 | |
Registration fees | | | 75,901 | |
Shareholder report expenses | | | 50,811 | |
Trustees’ fees and expenses | | | 186 | |
Interest and fee expense | | | 3,227 | |
Other fees and expenses | | | 18,194 | |
| | | | |
Total expenses | | | 10,522,120 | |
Less: Fee waivers and/or expense reimbursements | | | (498,922 | ) |
| | | | |
Net expenses | | | 10,023,198 | |
| | | | |
Net investment income | | | 43,079,060 | |
| | | | |
| |
REALIZED AND UNREALIZED GAINS (LOSSES) ON INVESTMENTS | | | | |
| |
Net realized gains (losses) on: | | | | |
Unaffiliated securities | | | (969,142 | ) |
Affiliated securities | | | (2,960 | ) |
Futures transactions | | | 166,249 | |
| | | | |
Net realized losses on investments | | | (805,853 | ) |
| | | | |
| |
Net change in unrealized gains (losses) on: | | | | |
Unaffiliated securities | | | (151,216,905 | ) |
Affiiliated securities | | | 467 | |
Futures transactions | | | 1,814,832 | |
| | | | |
Net change in unrealized gains (losses) on investments | | | (149,401,606 | ) |
| | | | |
Net realized and unrealized gains (losses) on investments | | | (150,207,459 | ) |
| | | | |
Net decrease in net assets resulting from operations | | $ | (107,128,399 | ) |
| | | | |
| 1 | For the period from July 1, 2016 to December 5, 2016. At the close of business on December 5, 2016, existing Class B shareholders were converted to Class A shareholders. Effective December 6, 2016, Class B shares are no longer offered by the Fund. |
The accompanying notes are an integral part of these financial statements.
| | | | |
| 16 | | Wells Fargo Municipal Bond Fund | | Statement of changes in net assets |
| | | | | | | | | | | | | | | | |
| | | Six months ended
December 31, 2016
(unaudited) | | | Year ended
June 30, 2016 | |
| | | |
Operations | | | | | | | | | | | | |
Net investment income | | | | | | $ | 43,079,060 | | | | | | | $ | 91,385,117 | |
Net realized gains (losses) on investments | | | | | | | (805,853 | ) | | | | | | | 25,786,034 | |
Net change in unrealized gains (losses) on investments | | | | | | | (149,401,606 | ) | | | | | | | 117,272,072 | |
| | | | |
Net increase (decrease) in net assets resulting from operations | | | | | | | (107,128,399 | ) | | | | | | | 234,443,223 | |
| | | | |
| | | |
Distributions to shareholders from | | | | | | | | | | | | |
Net investment income | | | | | | | | | | | | | | | | |
Class A | | | | | | | (21,548,560 | ) | | | | | | | (49,506,305 | ) |
Class B | | | | | | | (3,436 | )1 | | | | | | | (24,157 | ) |
Class C | | | | | | | (1,955,544 | ) | | | | | | | (3,837,158 | ) |
Administrator Class | | | | | | | (3,547,970 | ) | | | | | | | (8,790,709 | ) |
Institutional Class | | | | | | | (16,027,772 | ) | | | | | | | (24,426,383 | ) |
Investor Class | | | | | | | N/A | | | | | | | | (4,799,469 | )2 |
Net realized gains | | | | | | | | | | | | | | | | |
Class A | | | | | | | (9,299,842 | ) | | | | | | | (9,166,267 | ) |
Class B | | | | | | | 0 | 1 | | | | | | | (5,119 | ) |
Class C | | | | | | | (1,129,371 | ) | | | | | | | (776,529 | ) |
Administrator Class | | | | | | | (962,759 | ) | | | | | | | (1,141,943 | ) |
Institutional Class | | | | | | | (6,674,052 | ) | | | | | | | (3,376,986 | ) |
| | | | |
Total distributions to shareholders | | | | | | | (61,149,306 | ) | | | | | | | (105,851,025 | ) |
| | | | |
| | | | |
Capital share transactions | | | Shares | | | | | | | | Shares | | | | | |
Proceeds from shares sold | | | | | | | | | | | | | | | | |
Class A | | | 6,625,362 | | | | 68,735,910 | | | | 64,653,820 | | | | 669,764,488 | |
Class B | | | 0 | 1 | | | 0 | 1 | | | 27 | | | | 279 | |
Class C | | | 956,414 | | | | 10,041,825 | | | | 3,347,238 | | | | 35,008,106 | |
Administrator Class | | | 2,252,413 | | | | 23,804,388 | | | | 10,079,801 | | | | 104,821,922 | |
Institutional Class | | | 29,388,063 | | | | 304,837,158 | | | | 55,658,632 | | | | 579,421,682 | |
Investor Class | | | N/A | | | | N/A | | | | 1,789,189 | 2 | | | 18,389,280 | 2 |
| | | | |
| | | | | | | 407,419,281 | | | | | | | | 1,407,405,757 | |
| | | | |
Reinvestment of distributions | | | | | | | | | | | | | | | | |
Class A | | | 2,648,445 | | | | 27,332,446 | | | | 5,096,119 | | | | 53,145,243 | |
Class B | | | 313 | 1 | | | 3,298 | 1 | | | 2,442 | | | | 25,421 | |
Class C | | | 251,624 | | | | 2,589,886 | | | | 375,341 | | | | 3,915,284 | |
Administrator Class | | | 417,353 | | | | 4,337,889 | | | | 922,285 | | | | 9,615,221 | |
Institutional Class | | | 1,712,227 | | | | 17,665,532 | | | | 1,934,077 | | | | 20,220,148 | |
Investor Class | | | N/A | | | | N/A | | | | 339,015 | 2 | | | 3,486,525 | 2 |
| | | | |
| | | | | | | 51,929,051 | | | | | | | | 90,407,842 | |
| | | | |
Payment for shares redeemed | | | | | | | | | | | | | | | | |
Class A | | | (17,535,874 | ) | | | (182,027,110 | ) | | | (83,965,428 | ) | | | (877,180,351 | ) |
Class B | | | (43,090 | )1 | | | (440,256 | )1 | | | (122,606 | ) | | | (1,277,115 | ) |
Class C | | | (2,604,072 | ) | | | (26,881,014 | ) | | | (2,393,610 | ) | | | (24,976,011 | ) |
Administrator Class | | | (14,541,883 | ) | | | (150,037,279 | ) | | | (23,257,159 | ) | | | (239,883,451 | ) |
Institutional Class | | | (29,878,691 | ) | | | (306,302,875 | ) | | | (18,804,492 | ) | | | (196,444,238 | ) |
Investor Class | | | N/A | | | | N/A | | | | (50,409,942 | )2 | | | (520,861,783 | )2 |
| | | | |
| | | | | | | (665,688,534 | ) | | | | | | | (1,860,622,949 | ) |
| | | | |
Net decrease in net assets resulting from capital share transactions | | | | | | | (206,340,202 | ) | | | | | | | (362,809,350 | ) |
| | | | |
Total decrease in net assets | | | | | | | (374,617,907 | ) | | | | | | | (234,217,152 | ) |
| | | | |
| | |
Net assets | | | | | | | | |
Beginning of period | | | | | | | 2,947,970,821 | | | | | | | | 3,182,187,973 | |
| | | | |
End of period | | | | | | $ | 2,573,352,914 | | | | | | | $ | 2,947,970,821 | |
| | | | |
Overdistributed net investment income | | | | | | $ | (275,161 | ) | | | | | | $ | (270,939 | ) |
| | | | |
| 1 | For the period from July 1, 2016 to December 5, 2016. At the close of business on December 5, 2016, existing Class B shareholders were converted to Class A shareholders. Effective December 6, 2016, Class B shares are no longer offered by the Fund. |
| 2 | For the period from July 1, 2015 to October 23, 2015. Effective at the close of business on October 23, 2015, Investor Class shares were converted to Class A shares and are no longer offered by the Fund. |
The accompanying notes are an integral part of these financial statements.
| | | | | | |
| Financial highlights | | Wells Fargo Municipal Bond Fund | | | 17 | |
(For a share outstanding throughout each period)
| | | | | | | | | | | | | | | | | | | | | | | | |
| | | Six months ended
December 31, 2016 (unaudited) | | | Year ended June 30 | |
| CLASS A | | | 2016 | | | 2015 | | | 2014 | | | 2013 | | | 2012 | |
Net asset value, beginning of period | | | $10.70 | | | | $10.25 | | | | $10.33 | | | | $10.00 | | | | $10.24 | | | | $9.54 | |
Net investment income | | | 0.15 | | | | 0.31 | | | | 0.28 | | | | 0.33 | | | | 0.27 | | | | 0.37 | |
Net realized and unrealized gains (losses) on investments | | | (0.55 | ) | | | 0.50 | | | | 0.01 | | | | 0.40 | | | | (0.08 | ) | | | 0.70 | |
| | | | | | | | | | | | | | | | | | | | | | | | |
Total from investment operations | | | (0.40 | ) | | | 0.81 | | | | 0.29 | | | | 0.73 | | | | 0.19 | | | | 1.07 | |
Distributions to shareholders from | | | | | | | | | | | | | | | | | | | | | | | | |
Net investment income | | | (0.15 | ) | | | (0.31 | ) | | | (0.28 | ) | | | (0.33 | ) | | | (0.27 | ) | | | (0.37 | ) |
Net realized gains | | | (0.07 | ) | | | (0.05 | ) | | | (0.09 | ) | | | (0.07 | ) | | | (0.16 | ) | | | (0.00 | )1 |
| | | | | | | | | | | | | | | | | | | | | | | | |
Total distributions to shareholders | | | (0.22 | ) | | | (0.36 | ) | | | (0.37 | ) | | | (0.40 | ) | | | (0.43 | ) | | | (0.37 | ) |
Net asset value, end of period | | | $10.08 | | | | $10.70 | | | | $10.25 | | | | $10.33 | | | | $10.00 | | | | $10.24 | |
Total return2 | | | (3.76 | )% | | | 8.04 | % | | | 2.81 | % | | | 7.60 | % | | | 1.70 | % | | | 11.45 | % |
Ratios to average net assets (annualized) | | | | | | | | | | | | | | | | | | | | | | | | |
Gross expenses | | | 0.79 | %3 | | | 0.79 | %3 | | | 0.80 | %3 | | | 0.80 | %3 | | | 0.80 | %3 | | | 0.81 | %3 |
Net expenses | | | 0.75 | %3 | | | 0.75 | %3 | | | 0.75 | %3 | | | 0.76 | %3 | | | 0.75 | %3 | | | 0.75 | %3 |
Net investment income | | | 2.88 | %3 | | | 2.99 | %3 | | | 2.71 | %3 | | | 3.36 | %3 | | | 2.56 | %3 | | | 3.72 | %3 |
Supplemental data | | | | | | | | | | | | | | | | | | | | | | | | |
Portfolio turnover rate | | | 6 | % | | | 16 | % | | | 27 | % | | | 37 | % | | | 54 | % | | | 63 | % |
Net assets, end of period (000s omitted) | | | $1,358,701 | | | | $1,529,884 | | | | $1,612,212 | | | | $1,661,362 | | | | $1,807,790 | | | | $1,759,128 | |
| 1 | Amount is less than $0.005. |
| 2 | Total return calculations do not include any sales charges. Returns for periods of less than one year are not annualized. |
| 3 | Ratios include interest and fee expense relating to inverse floating-rate obligations as follows: |
| | | | |
Six months ended December 31, 2016 (unaudited) | | | 0.00 | % |
Year ended June 30, 2016 | | | 0.00 | % |
Year ended June 30, 2015 | | | 0.00 | % |
Year ended June 30, 2014 | | | 0.01 | % |
Year ended June 30, 2013 | | | 0.00 | % |
Year ended June 30, 2012 | | | 0.00 | % |
The accompanying notes are an integral part of these financial statements.
| | | | |
| 18 | | Wells Fargo Municipal Bond Fund | | Financial highlights |
(For a share outstanding throughout each period)
| | | | | | | | | | | | | | | | | | | | | | | | |
| | | Six months ended December 31, 2016 (unaudited) | | | Year ended June 30 | |
| CLASS C | | | 2016 | | | 2015 | | | 2014 | | | 2013 | | | 2012 | |
Net asset value, beginning of period | | | $10.69 | | | | $10.25 | | | | $10.33 | | | | $10.00 | | | | $10.23 | | | | $9.53 | |
Net investment income | | | 0.11 | | | | 0.23 | | | | 0.20 | | | | 0.26 | | | | 0.19 | | | | 0.30 | |
Net realized and unrealized gains (losses) on investments | | | (0.54 | ) | | | 0.49 | | | | 0.01 | | | | 0.40 | | | | (0.07 | ) | | | 0.70 | |
| | | | | | | | | | | | | | | | | | | | | | | | |
Total from investment operations | | | (0.43 | ) | | | 0.72 | | | | 0.21 | | | | 0.66 | | | | 0.12 | | | | 1.00 | |
Distributions to shareholders from | | | | | | | | | | | | | | | | | | | | | | | | |
Net investment income | | | (0.11 | ) | | | (0.23 | ) | | | (0.20 | ) | | | (0.26 | ) | | | (0.19 | ) | | | (0.30 | ) |
Net realized gains | | | (0.07 | ) | | | (0.05 | ) | | | (0.09 | ) | | | (0.07 | ) | | | (0.16 | ) | | | (0.00 | )1 |
| | | | | | | | | | | | | | | | | | | | | | | | |
Total distributions to shareholders | | | (0.18 | ) | | | (0.28 | ) | | | (0.29 | ) | | | (0.33 | ) | | | (0.35 | ) | | | (0.30 | ) |
Net asset value, end of period | | | $10.08 | | | | $10.69 | | | | $10.25 | | | | $10.33 | | | | $10.00 | | | | $10.23 | |
Total return2 | | | (4.03 | )% | | | 7.14 | % | | | 2.05 | % | | | 6.80 | % | | | 1.04 | % | | | 10.63 | % |
Ratios to average net assets (annualized) | | | | | | | | | | | | | | | | | | | | | | | | |
Gross expenses | | | 1.54 | %3 | | | 1.54 | %3 | | | 1.55 | %3 | | | 1.55 | %3 | | | 1.55 | %3 | | | 1.56 | %3 |
Net expenses | | | 1.50 | %3 | | | 1.50 | %3 | | | 1.50 | %3 | | | 1.51 | %3 | | | 1.50 | %3 | | | 1.50 | %3 |
Net investment income | | | 2.13 | %3 | | | 2.24 | %3 | | | 1.97 | %3 | | | 2.60 | %3 | | | 1.82 | %3 | | | 2.95 | %3 |
Supplemental data | | | | | | | | | | | | | | | | | | | | | | | | |
Portfolio turnover rate | | | 6 | % | | | 16 | % | | | 27 | % | | | 37 | % | | | 54 | % | | | 63 | % |
Net assets, end of period (000s omitted) | | | $161,277 | | | | $186,036 | | | | $164,703 | | | | $154,863 | | | | $168,658 | | | | $168,883 | |
| 1 | Amount is less than $0.005. |
| 2 | Total return calculations do not include any sales charges. Returns for periods of less than one year are not annualized. |
| 3 | Ratios include interest and fee expense relating to inverse floating-rate obligations as follows: |
| | | | |
Six months ended December 31, 2016 (unaudited) | | | 0.00 | % |
Year ended June 30, 2016 | | | 0.00 | % |
Year ended June 30, 2015 | | | 0.00 | % |
Year ended June 30, 2014 | | | 0.01 | % |
Year ended June 30, 2013 | | | 0.00 | % |
Year ended June 30, 2012 | | | 0.00 | % |
The accompanying notes are an integral part of these financial statements.
| | | | | | |
| Financial highlights | | Wells Fargo Municipal Bond Fund | | | 19 | |
(For a share outstanding throughout each period)
| | | | | | | | | | | | | | | | | | | | | | | | |
| | | Six months ended
December 31, 2016 (unaudited) | | | Year ended June 30 | |
| ADMINISTRATOR CLASS | | | 2016 | | | 2015 | | | 2014 | | | 2013 | | | 2012 | |
Net asset value, beginning of period | | | $10.70 | | | | $10.26 | | | | $10.34 | | | | $10.01 | | | | $10.24 | | | | $9.54 | |
Net investment income | | | 0.16 | | | | 0.33 | | | | 0.30 | | | | 0.35 | | | | 0.28 | | | | 0.39 | |
Net realized and unrealized gains (losses) on investments | | | (0.54 | ) | | | 0.49 | | | | 0.01 | | | | 0.40 | | | | (0.07 | ) | | | 0.69 | |
| | | | | | | | | | | | | | | | | | | | | | | | |
Total from investment operations | | | (0.38 | ) | | | 0.82 | | | | 0.31 | | | | 0.75 | | | | 0.21 | | | | 1.08 | |
Distributions to shareholders from | | | | | | | | | | | | | | | | | | | | | | | | |
Net investment income | | | (0.16 | ) | | | (0.33 | ) | | | (0.30 | ) | | | (0.35 | ) | | | (0.28 | ) | | | (0.38 | ) |
Net realized gains | | | (0.07 | ) | | | (0.05 | ) | | | (0.09 | ) | | | (0.07 | ) | | | (0.16 | ) | | | (0.00 | )1 |
| | | | | | | | | | | | | | | | | | | | | | | | |
Total distributions to shareholders | | | (0.23 | ) | | | (0.38 | ) | | | (0.39 | ) | | | (0.42 | ) | | | (0.44 | ) | | | (0.38 | ) |
Net asset value, end of period | | | $10.09 | | | | $10.70 | | | | $10.26 | | | | $10.34 | | | | $10.01 | | | | $10.24 | |
Total return2 | | | (3.59 | )% | | | 8.10 | % | | | 2.97 | % | | | 7.75 | % | | | 1.96 | % | | | 11.62 | % |
Ratios to average net assets (annualized) | | | | | | | | | | | | | | | | | | | | | | | | |
Gross expenses | | | 0.73 | %3 | | | 0.73 | %3 | | | 0.73 | %3 | | | 0.74 | %3 | | | 0.74 | %3 | | | 0.74 | %3 |
Net expenses | | | 0.60 | %3 | | | 0.60 | %3 | | | 0.60 | %3 | | | 0.61 | %3 | | | 0.60 | %3 | | | 0.60 | %3 |
Net investment income | | | 2.98 | %3 | | | 3.15 | %3 | | | 2.86 | %3 | | | 3.49 | %3 | | | 2.72 | %3 | | | 3.74 | %3 |
Supplemental data | | | | | | | | | | | | | | | | | | | | | | | | |
Portfolio turnover rate | | | 6 | % | | | 16 | % | | | 27 | % | | | 37 | % | | | 54 | % | | | 63 | % |
Net assets, end of period (000s omitted) | | | $135,000 | | | | $270,304 | | | | $384,884 | | | | $362,896 | | | | $451,005 | | | | $227,942 | |
| 1 | Amount is less than $0.005. |
| 2 | Returns for periods of less than one year are not annualized. |
| 3 | Ratios include interest and fee expense relating to inverse floating-rate obligations as follows: |
| | | | |
Six months ended December 31, 2016 (unaudited) | | | 0.00 | % |
Year ended June 30, 2016 | | | 0.00 | % |
Year ended June 30, 2015 | | | 0.00 | % |
Year ended June 30, 2014 | | | 0.01 | % |
Year ended June 30, 2013 | | | 0.00 | % |
Year ended June 30, 2012 | | | 0.00 | % |
The accompanying notes are an integral part of these financial statements.
| | | | |
| 20 | | Wells Fargo Municipal Bond Fund | | Financial highlights |
(For a share outstanding throughout each period)
| | | | | | | | | | | | | | | | | | | | | | | | |
| | | Six months ended
December 31, 2016 (unaudited) | | | Year ended June 30 | |
| INSTITUTIONAL CLASS | | | 2016 | | | 2015 | | | 2014 | | | 2013 | | | 2012 | |
Net asset value, beginning of period | | | $10.70 | | | | $10.25 | | | | $10.33 | | | | $10.00 | | | | $10.24 | | | | $9.54 | |
Net investment income | | | 0.17 | | | | 0.34 | | | | 0.31 | | | | 0.36 | | | | 0.30 | | | | 0.40 | |
Net realized and unrealized gains (losses) on investments | | | (0.55 | ) | | | 0.50 | | | | 0.01 | | | | 0.40 | | | | (0.08 | ) | | | 0.70 | |
| | | | | | | | | | | | | | | | | | | | | | | | |
Total from investment operations | | | (0.38 | ) | | | 0.84 | | | | 0.32 | | | | 0.76 | | | | 0.22 | | | | 1.10 | |
Distributions to shareholders from | | | | | | | | | | | | | | | | | | | | | | | | |
Net investment income | | | (0.17 | ) | | | (0.34 | ) | | | (0.31 | ) | | | (0.36 | ) | | | (0.30 | ) | | | (0.40 | ) |
Net realized gains | | | (0.07 | ) | | | (0.05 | ) | | | (0.09 | ) | | | (0.07 | ) | | | (0.16 | ) | | | (0.00 | )1 |
| | | | | | | | | | | | | | | | | | | | | | | | |
Total distributions to shareholders | | | (0.24 | ) | | | (0.39 | ) | | | (0.40 | ) | | | (0.43 | ) | | | (0.46 | ) | | | (0.40 | ) |
Net asset value, end of period | | | $10.08 | | | | $10.70 | | | | $10.25 | | | | $10.33 | | | | $10.00 | | | | $10.24 | |
Total return2 | | | (3.62 | )% | | | 8.35 | % | | | 3.11 | % | | | 7.90 | % | | | 2.00 | % | | | 11.76 | % |
Ratios to average net assets (annualized) | | | | | | | | | | | | | | | | | | | | | | | | |
Gross expenses | | | 0.46 | %3 | | | 0.46 | %3 | | | 0.47 | %3 | | | 0.47 | %3 | | | 0.47 | %3 | | | 0.47 | %3 |
Net expenses | | | 0.46 | %3 | | | 0.46 | %3 | | | 0.47 | %3 | | | 0.47 | %3 | | | 0.47 | %3 | | | 0.47 | %3 |
Net investment income | | | 3.18 | %3 | | | 3.27 | %3 | | | 3.02 | %3 | | | 3.58 | %3 | | | 2.85 | %3 | | | 4.15 | %3 |
Supplemental data | | | | | | | | | | | | | | | | | | | | | | | | |
Portfolio turnover rate | | | 6 | % | | | 16 | % | | | 27 | % | | | 37 | % | | | 54 | % | | | 63 | % |
Net assets, end of period (000s omitted) | | | $918,375 | | | | $961,289 | | | | $523,736 | | | | $255,112 | | | | $143,062 | | | | $151,285 | |
| 1 | Amount is less than $0.005. |
| 2 | Returns for periods of less than one year are not annualized. |
| 3 | Ratios include interest and fee expense relating to inverse floating-rate obligations as follows: |
| | | | |
Six months ended December 31, 2016 (unaudited) | | | 0.00 | % |
Year ended June 30, 2016 | | | 0.00 | % |
Year ended June 30, 2015 | | | 0.00 | % |
Year ended June 30, 2014 | | | 0.01 | % |
Year ended June 30, 2013 | | | 0.00 | % |
Year ended June 30, 2012 | | | 0.00 | % |
The accompanying notes are an integral part of these financial statements.
| | | | | | |
| Notes to financial statements (unaudited) | | Wells Fargo Municipal Bond Fund | | | 21 | |
1. ORGANIZATION
Wells Fargo Funds Trust (the “Trust”), a Delaware statutory trust organized on March 10, 1999, is an open-end management investment company registered under the Investment Company Act of 1940, as amended (the “1940 Act”). As an investment company, the Trust follows the accounting and reporting guidance in Financial Accounting Standards Board (“FASB”) Accounting Standards Codification Topic 946, Financial Services – Investment Companies. These financial statements report on the Wells Fargo Municipal Bond Fund (the “Fund”) which is a diversified series of the Trust.
Effective at the close of business on October 23, 2015, Investor Class shares became Class A shares in a tax-free conversion. Shareholders of Investor Class received Class A shares at a value equal to the value of their Investor Class shares immediately prior to the conversion. Investor Class shares are no longer offered by the Fund.
Effective December 6, 2016, Class B shares of the Fund are no longer offered. Information for Class B shares reflected in the financial statements represents activity through December 5, 2016.
2. SIGNIFICANT ACCOUNTING POLICIES
The following significant accounting policies, which are consistently followed in the preparation of the financial statements of the Fund, are in conformity with U.S. generally accepted accounting principles which require management to make estimates and assumptions that affect the reported amounts of assets and liabilities, disclosure of contingent assets and liabilities at the date of the financial statements, and the reported amounts of revenues and expenses during the reporting period. Actual results could differ from those estimates.
Securities valuation
All investments are valued each business day as of the close of regular trading on the New York Stock Exchange (generally 4 p.m. Eastern Time), although the Fund may deviate from this calculation time under unusual or unexpected circumstances.
Debt securities are valued at the evaluated bid price provided by an independent pricing service or, if a reliable price is not available, the quoted bid price from an independent broker-dealer.
Equity securities and futures that are listed on a foreign or domestic exchange or market are valued at the official closing price or, if none, the last sales price. If no sale occurs on the principal exchange or market that day, the prior day’s price will be deemed “stale” and a fair value price will be determined in accordance with the Fund’s Valuation Procedures.
Investments in registered open-end investment companies are valued at net asset value.
Investments which are not valued using any of the methods discussed above are valued at their fair value, as determined in good faith by the Board of Trustees of the Fund. The Board of Trustees has established a Valuation Committee comprised of the Trustees and has delegated to it the authority to take any actions regarding the valuation of portfolio securities that the Valuation Committee deems necessary or appropriate, including determining the fair value of portfolio securities, unless the determination has been delegated to the Management Valuation Team of Wells Fargo Funds Management, LLC (“Funds Management”). The Board of Trustees retains the authority to make or ratify any valuation decisions or approve any changes to the Valuation Procedures as it deems appropriate. On a quarterly basis, the Board of Trustees receives reports on any valuation actions taken by the Valuation Committee or the Management Valuation Team which may include items for ratification.
Valuations of fair valued securities are compared to the next actual sales price when available, or other appropriate market values, to assess the continued appropriateness of the fair valuation methodologies used. These securities are fair valued on a day-to-day basis, taking into consideration changes to appropriate market information and any significant changes to the inputs considered in the valuation process until there is a readily available price provided on an exchange or by an independent pricing service. Valuations received from an independent pricing service or independent broker-dealer quotes are periodically validated by comparisons to most recent trades and valuations provided by other independent pricing services in addition to the review of prices by the manager and/or subadviser. Unobservable inputs used in determining fair valuations are identified based on the type of security, taking into consideration factors utilized by market participants in valuing the investment, knowledge about the issuer and the current market environment.
When-issued transactions
The Fund may purchase securities on a forward commitment or when-issued basis. The Fund records a when-issued transaction on the trade date and will segregate assets in an amount at least equal in value to the Fund’s commitment to purchase when-issued securities. Securities purchased on a when-issued basis are marked-to-market daily and the Fund begins earning interest on the settlement date. Losses may arise due to changes in the market value of the underlying securities or if the counterparty does not perform under the contract.
| | | | |
| 22 | | Wells Fargo Municipal Bond Fund | | Notes to financial statements (unaudited) |
Futures contracts
The Fund is subject to interest rate risk in the normal course of pursuing its investment objectives. The Fund may buy and sell futures contracts in order to gain exposure to, or protect against, changes in security values and interest rates. The primary risks associated with the use of futures contracts are the imperfect correlation between changes in market values of securities held by the Fund and the prices of futures contracts, and the possibility of an illiquid market.
The aggregate principal amounts of the contracts are not recorded in the financial statements. Fluctuations in the value of the contracts are recorded in the Statement of Assets and Liabilities as an asset or liability and in the Statement of Operations as unrealized gains or losses until the contracts are closed, at which point they are recorded as net realized gains or losses on futures contracts. With futures contracts, there is minimal counterparty risk to the Fund since futures are exchange traded and the exchange’s clearinghouse, as counterparty to all exchange traded futures, guarantees the futures against default.
Inverse floating-rate obligations
The Fund may participate in inverse floating-rate obligation (“Inverse Floater”) structures whereby a fixed-rate bond (“Fixed-Rate Bond”) purchased by the Fund is transferred to a tender option bond trust (“TOB Trust”). The TOB Trust issues floating-rate notes (“Floating-Rate Notes”) to third-parties, which are collateralized by the Fixed-Rate Bond, and the Fund buys a residual interest in the TOB Trust’s assets and cash flows. The Inverse Floater held by the Fund gives the Fund the right (1) to cause the holders of the Floating-Rate Notes to tender their notes at par, and (2) to have the Fixed-Rate Bond held by the TOB Trust transferred back to the Fund, thereby collapsing the TOB Trust. The Fund accounts for the transaction described above as a secured borrowing by including the Fixed-Rate Bond in its Portfolio of Investments, and by recording the Floating-Rate Notes as a liability in the Statement of Assets and Liabilities. The Fund also records the interest paid on Floating-Rate Notes as interest expense. The Floating-Rate Notes have interest rates that generally reset weekly and their holders have the option to tender their notes for redemption at par at each reset date. Inverse Floaters held by the Fund are securities exempt from registration under Rule 144A of the Securities Act of 1933, as amended.
Security transactions and income recognition
Securities transactions are recorded on a trade date basis. Realized gains or losses are recorded on the basis of identified cost.
Interest income is accrued daily and bond discounts are accreted and premiums are amortized daily based on the effective interest method. To the extent debt obligations are placed on non-accrual status, any related interest income may be reduced by writing off interest receivables when the collection of all or a portion of interest has become doubtful based on consistently applied procedures. If the issuer subsequently resumes interest payments or when the collectability of interest is reasonably assured, the debt obligation is removed from non-accrual status.
Distributions to shareholders
Distributions to shareholders from net investment income are accrued daily and paid monthly. Distributions from net realized gains, if any, are recorded on the ex-dividend date. Such distributions are determined in conformity with federal income tax regulations, which may differ in amount or character from net investment income and realized gains recognized for purposes of U.S. generally accepted accounting principles.
Federal and other taxes
The Fund intends to continue to qualify as a regulated investment company by distributing substantially all of its investment company taxable and tax-exempt income and any net realized capital gains (after reduction for capital loss carryforwards) sufficient to relieve it from all, or substantially all, federal income taxes. Accordingly, no provision for federal income taxes was required.
The Fund’s income and federal excise tax returns and all financial records supporting those returns for the prior three fiscal years are subject to examination by the federal and Delaware revenue authorities. Management has analyzed the Fund’s tax positions taken on federal, state, and foreign tax returns for all open tax years and does not believe that there are any uncertain tax positions that require recognition of a tax liability.
As of June 30, 2016, capital loss carryforwards available to offset future net realized capital gains were as follows through the indicated expiration dates:
| | | | |
| 2017 | | 2018 | | 2019 |
| $5,924,646 | | $5,924,646 | | $130,027 |
| | | | | | |
| Notes to financial statements (unaudited) | | Wells Fargo Municipal Bond Fund | | | 23 | |
Class allocations
The separate classes of shares offered by the Fund differ principally in applicable sales charges, distribution, shareholder servicing, and administration fees. Class specific expenses are charged directly to that share class. Investment income, common expenses, and realized and unrealized gains (losses) on investments are allocated daily to each class of shares based on the relative proportion of net assets of each class.
3. FAIR VALUATION MEASUREMENTS
Fair value measurements of investments are determined within a framework that has established a fair value hierarchy based upon the various data inputs utilized in determining the value of the Fund’s investments. The three-level hierarchy gives the highest priority to unadjusted quoted prices in active markets for identical assets or liabilities (Level 1) and the lowest priority to significant unobservable inputs (Level 3). The Fund’s investments are classified within the fair value hierarchy based on the lowest level of input that is significant to the fair value measurement. The inputs are summarized into three broad levels as follows:
| ∎ | | Level 1 – quoted prices in active markets for identical securities |
| ∎ | | Level 2 – other significant observable inputs (including quoted prices for similar securities, interest rates, prepayment speeds, credit risk, use of amortized cost, etc.) |
| ∎ | | Level 3 – significant unobservable inputs (including the Fund’s own assumptions in determining the fair value of investments) |
The inputs or methodologies used for valuing investments in securities are not necessarily an indication of the risk associated with investing in those securities.
The following is a summary of the inputs used in valuing the Fund’s assets and liabilities as of December 31, 2016:
| | | | | | | | | | | | | | | | |
| | | Quoted prices
(Level 1) | | | Other significant
observable inputs
(Level 2) | | | Significant
unobservable inputs (Level 3) | | | Total | |
Assets | | | | | | | | | | | | | | | | |
Investments in: | | | | | | | | | | | | | | | | |
| | | | |
Corporate bonds and notes | | $ | 0 | | | $ | 15,545,778 | | | $ | 0 | | | $ | 15,545,778 | |
| | | | |
Municipal obligations | | | 0 | | | | 2,554,083,158 | | | | 0 | | | | 2,554,083,158 | |
| | | | |
Short-term investments | | | | | | | | | | | | | | | | |
Investment companies | | | 4,428,423 | | | | 0 | | | | 0 | | | | 4,428,423 | |
Total assets | | $ | 4,428,423 | | | $ | 2,569,628,936 | | | $ | 0 | | | $ | 2,574,057,359 | |
The Fund recognizes transfers between levels within the fair value hierarchy at the end of the reporting period. At December 31, 2016, the Fund did not have any transfers into/out of Level 1, Level 2, or Level 3.
4. TRANSACTIONS WITH AFFILIATES AND OTHER EXPENSES
Management fee
Funds Management, an indirect wholly owned subsidiary of Wells Fargo & Company (“Wells Fargo”), is the manager of the Fund and provides advisory and fund-level administrative services under an investment management agreement. Under the investment management agreement, Funds Management is responsible for, among other services, implementing the investment objectives and strategies of the Fund, supervising the subadviser, providing fund-level administrative services in connection with the Fund’s operations, and providing any other fund-level administrative services reasonably necessary for the operation of the Fund. As compensation for its services under the investment management agreement, Funds Management is entitled to receive an annual management fee starting at 0.40% and declining to 0.28% as the average daily net assets of the Fund increase. For the six months ended December 31, 2016, the management fee was equivalent to an annual rate of 0.36% of the Fund’s average daily net assets.
Funds Management has retained the services of a subadviser to provide daily portfolio management to the Fund. The fee for subadvisory services is borne by Funds Management. Wells Capital Management Incorporated, an affiliate of Funds Management and an indirect wholly owned subsidiary of Wells Fargo, is the subadviser to the Fund and is entitled to receive a fee from Funds Management at an annual rate starting at 0.20% and declining to 0.10% as the average daily net assets of the Fund increase.
| | | | |
| 24 | | Wells Fargo Municipal Bond Fund | | Notes to financial statements (unaudited) |
Administration fees
Under a class-level administration agreement, Funds Management provides class-level administrative services to the Fund, which includes paying fees and expenses for services provided by the transfer agent, sub-transfer agents, omnibus account servicers and record-keepers. As compensation for its services under the class-level administration agreement, Funds Management receives an annual fee which is calculated based on the average daily net assets of each class as follows:
| | | | |
| | | Class-level
administration fee | |
Class A, Class B, Class C | | | 0.16 | % |
Administrator Class | | | 0.10 | |
Institutional Class | | | 0.08 | |
Funds Management has contractually waived and/or reimbursed management and administration fees to the extent necessary to maintain certain net operating expense ratios for the Fund. Waiver of fees and/or reimbursement of expenses by Funds Management were made first from fund level expenses on a proportionate basis and then from class specific expenses. Funds Management has committed through October 31, 2017 to waive fees and/or reimburse expenses to the extent necessary to cap the Fund’s expenses at 0.75% for Class A shares, 1.50% for Class C shares, 0.60% for Administrator Class shares, and 0.48% for Institutional Class shares. After this time, the cap may be increased or the commitment to maintain the cap may be terminated only with the approval of the Board of Trustees.
During the six months ended December 31, 2016, State Street Bank and Trust Company, the Fund’s custodian, reimbursed the Fund $45,290 for certain out-of-pocket expenses that were billed to the Fund in error from 1998-2015. This amount is included in interest income on the Statement of Operations. In addition, Funds Management was also reimbursed $8,295 for waivers/reimbursements it made to the Fund during the period the Fund was erroneously billed.
Distribution fees
The Trust has adopted a distribution plan for Class B and Class C shares of the Fund pursuant to Rule 12b-1 under the 1940 Act. Distribution fees are charged to Class B and Class C shares and paid to Wells Fargo Funds Distributor, LLC (“Funds Distributor”), the principal underwriter, at an annual rate of 0.75% of the average daily net assets of Class B and Class C shares.
In addition, Funds Distributor is entitled to receive the front-end sales charge from the purchase of Class A shares and a contingent deferred sales charge on the redemption of certain Class A shares. Funds Distributor is also entitled to receive the contingent deferred sales charges from redemptions of Class B and Class C shares. For the six months ended December 31, 2016, Funds Distributor received $20,194 from the sale of Class A shares and $99 in contingent deferred sales charges from redemptions of Class C shares.
Shareholder servicing fees
The Trust has entered into contracts with one or more shareholder servicing agents, whereby Class A, Class B, Class C, and Administrator Class of the Fund are charged a fee at an annual rate of 0.25% of the average daily net assets of each respective class.
A portion of these total shareholder servicing fees were paid to affiliates of Wells Fargo.
5. INVESTMENT PORTFOLIO TRANSACTIONS
Purchases and sales of investments, excluding U.S. government obligations (if any) and short-term securities, for the six months ended December 31, 2016 were $485,129,814 and $149,473,534, respectively.
The Fund may purchase or sell investment securities to other Wells Fargo funds under procedures adopted by the Board of Trustees. The procedures have been designed to ensure that these interfund transactions, which generally do not incur broker commissions, are effected at current market prices. Interfund trades are included within the respective purchases and sales amounts shown.
6. DERIVATIVE TRANSACTIONS
During the six months ended December 31, 2016, the Fund entered into futures contracts to take advantage of the differences between municipal and treasury yields and to help manage the duration of the portfolio.
| | | | | | |
| Notes to financial statements (unaudited) | | Wells Fargo Municipal Bond Fund | | | 25 | |
As of December 31, 2016, the Fund did not have any open futures contracts. The Fund had an average notional amount of $35,053,429 in short futures contracts during the six months ended December 31, 2016.
The realized gains and change in unrealized gains (losses) on futures contracts are reflected in the Statement of Operations.
7. BORROWINGS
The Trust (excluding the money market funds and certain other funds) and Wells Fargo Variable Trust are parties to a $250,000,000 revolving credit agreement whereby the Fund is permitted to use bank borrowings for temporary or emergency purposes, such as to fund shareholder redemption requests. Interest under the credit agreement is charged to the Fund based on a borrowing rate equal to the higher of the Federal Funds rate in effect on that day plus 1.25% or the overnight LIBOR rate in effect on that day plus 1.25%. In addition, an annual commitment fee equal to 0.25% of the unused balance is allocated to each participating fund. Prior to August 30, 2016, the revolving credit agreement amount was $200,000,000 and the annual commitment fee was equal to 0.20% of the unused balance which was allocated to each participating fund.
For the six months ended December 31, 2016, there were no borrowings by the Fund under the agreement.
During the six months ended December 31, 2016, the Fund participated in Inverse Floaters which are accounted for as a secured borrowing. During the six months ended December 31, 2016, the Fund held Floating-Rate Notes that had an average daily balance outstanding of $2,215,323 (on an annualized basis) and incurred interest and fee expense in the amount of $3,227.
8. INDEMNIFICATION
Under the Trust’s organizational documents, the officers and Trustees have been granted certain indemnification rights against certain liabilities that may arise out of performance of their duties to the Trust. Additionally, in the normal course of business, the Trust may enter into contracts with service providers that contain a variety of indemnification clauses. The Trust’s maximum exposure under these arrangements is dependent on future claims that may be made against the Fund and, therefore, cannot be estimated.
9. REGULATORY CHANGES
In October 2016, the Securities and Exchange Commission (“SEC”) adopted new rules and forms and amended existing rules and forms (together, “final rules”) intended to modernize and enhance the reporting and disclosure of information by registered investment companies and to enhance liquidity risk management by open-end mutual funds and exchange-traded funds. The final rules will enhance the quality of information available to investors and will allow the SEC to more effectively collect and use data reported by funds. In part, the final rules amend Regulation S-X and require standardized, enhanced disclosure about derivatives in the Fund’s financial statements, as well as other amendments. The compliance date for the amendments to Regulation S-X is August 1, 2017 while the compliance date for the new form types is June 1, 2018 and the compliance date for the liquidity risk management program requirements is December 1, 2018. Management is currently assessing the potential impact of these enhancements and their impact on the financial statement disclosures and reporting requirements.
| | | | |
| 26 | | Wells Fargo Municipal Bond Fund | | Other information (unaudited) |
PROXY VOTING INFORMATION
A description of the policies and procedures that the Fund uses to determine how to vote proxies relating to portfolio securities is available, upon request, by calling 1-800-222-8222, visiting our website at wellsfargofunds.com, or visiting the SEC website at sec.gov. Information regarding how the Fund voted proxies relating to portfolio securities during the most recent 12-month period ended June 30 is available on the Fund’s website at wellsfargofunds.com or by visiting the SEC website at sec.gov.
PORTFOLIO HOLDINGS INFORMATION
The complete portfolio holdings for the Fund are publicly available monthly on the Fund’s website (wellsfargofunds.com), on a one-month delayed basis. In addition, top ten holdings information (excluding derivative positions) for the Fund is publicly available on the Fund’s website on a monthly, seven-day or more delayed basis. The Fund files its complete schedule of portfolio holdings with the SEC for the first and third quarters of each fiscal year on Form N-Q, which is available by visiting the SEC website at sec.gov. In addition, the Fund’s Form N-Q may be reviewed and copied at the SEC’s Public Reference Room in Washington, DC, and at regional offices in New York City, at 233 Broadway, and in Chicago, at 175 West Jackson Boulevard, Suite 900. Information about the Public Reference Room may be obtained by calling 1-800-SEC-0330.
| | | | | | |
| Other information (unaudited) | | Wells Fargo Municipal Bond Fund | | | 27 | |
BOARD OF TRUSTEES AND OFFICERS
Each of the Trustees and Officers1 listed in the table below acts in identical capacities for each fund in the Wells Fargo family of funds, which consists of 139 mutual funds comprising the Wells Fargo Funds Trust, Wells Fargo Variable Trust, Wells Fargo Master Trust and four closed-end funds (collectively the “Fund Complex”). This table should be read in conjunction with the Prospectus and the Statement of Additional Information2. The mailing address of each Trustee and Officer is 525 Market Street, 12th Floor, San Francisco, CA 94105. Each Trustee and Officer serves an indefinite term, however, each Trustee serves such term until reaching the mandatory retirement age established by the Trustees.
Independent Trustees
| | | | | | |
Name and
year of birth | | Position held and
length of service* | | Principal occupations during past five years or longer | | Current other
public company or
investment company
directorships |
William R. Ebsworth (Born 1957) | | Trustee, since 2015 | | Retired. From 1984 to 2013, equities analyst, portfolio manager, research director and chief financial officer at Fidelity Management and Research Company in Boston, Tokyo, and Hong Kong and retired in 2013 as Chief Investment Officer of Fidelity Strategic Advisers, Inc. where he lead a team of investment professionals managing client assets. Prior thereto, Board member of Hong Kong Securities Clearing Co., Hong Kong Options Clearing Corp., the Thailand International Fund, Ltd., Fidelity Investments Life Insurance Company, and Empire Fidelity Investments Life Insurance Company. Board member of the Fonté Foundation (non-profit organization) and the Vincent Memorial Hospital Endowment (non-profit organization), where he serves on the Investment Committee and as a Chair of the Audit Committee. Mr. Ebsworth is a CFA® charterholder and an Adjunct Lecturer, Finance, at Babson College. | | Asset Allocation Trust |
Jane A. Freeman (Born 1953) | | Trustee, since 2015 | | Retired. From 2012 to 2014 and 1999 to 2008, Chief Financial Officer of Scientific Learning Corporation. From 2008 to 2012, Ms. Freeman provided consulting services related to strategic business projects. Prior to 1999, Portfolio Manager at Rockefeller & Co. and Scudder, Stevens & Clark. Board member of the Harding Loevner Funds from 1996 to 2014, serving as both Lead Independent Director and chair of the Audit Committee. Board member of the Russell Exchange Traded Funds Trust from 2011 to 2012 and the chair of the Audit Committee. Ms. Freeman is a Board Member of Ruth Bancroft Garden (non-profit organization) and an inactive chartered financial analyst. | | Asset Allocation Trust |
Peter G. Gordon** (Born 1942) | | Trustee, since 1998; Chairman, since 2005 | | Co-Founder, Retired Chairman, President and CEO of Crystal Geyser Water Company. Trustee Emeritus, Colby College. | | Asset Allocation Trust |
| Isaiah Harris, Jr. (Born 1952) | | Trustee, since 2009 | | Retired. Chairman of the Board of CIGNA Corporation since 2009, and Director since 2005. From 2003 to 2011, Director of Deluxe Corporation. Prior thereto, President and CEO of BellSouth Advertising and Publishing Corp. from 2005 to 2007, President and CEO of BellSouth Enterprises from 2004 to 2005 and President of BellSouth Consumer Services from 2000 to 2003. Emeritus member of the Iowa State University Foundation Board of Governors. Emeritus Member of the Advisory Board of Iowa State University School of Business. Advisory Board Member, Palm Harbor Academy (charter school). Advisory Board Member, Child Evangelism Fellowship (non-profit). Mr. Harris is a certified public accountant (inactive status). | | CIGNA Corporation; Asset Allocation Trust |
Judith M. Johnson (Born 1949) | | Trustee, since 2008; Audit Committee Chairman, since 2008 | | Retired. Prior thereto, Chief Executive Officer and Chief Investment Officer of Minneapolis Employees Retirement Fund from 1996 to 2008. Ms. Johnson is an attorney, certified public accountant and a certified managerial accountant. | | Asset Allocation Trust |
David F. Larcker (Born 1950) | | Trustee, since 2009 | | James Irvin Miller Professor of Accounting at the Graduate School of Business, Stanford University, Director of the Corporate Governance Research Initiative and Senior Faculty of The Rock Center for Corporate Governance since 2006. From 2005 to 2008, Professor of Accounting at the Graduate School of Business, Stanford University. Prior thereto, Ernst & Young Professor of Accounting at The Wharton School, University of Pennsylvania from 1985 to 2005. | | Asset Allocation Trust |
| | | | |
| 28 | | Wells Fargo Municipal Bond Fund | | Other information (unaudited) |
| | | | | | |
Name and
year of birth | | Position held and
length of service* | | Principal occupations during past five years or longer | | Current other
public company or
investment company
directorships |
| Olivia S. Mitchell (Born 1953) | | Trustee, since 2006 | | International Foundation of Employee Benefit Plans Professor, Wharton School of the University of Pennsylvania since 1993. Director of Wharton’s Pension Research Council and Boettner Center on Pensions & Retirement Research, and Research Associate at the National Bureau of Economic Research. Previously, Cornell University Professor from 1978 to 1993. | | Asset Allocation Trust |
| Timothy J. Penny (Born 1951) | | Trustee, since 1996 | | President and Chief Executive Officer of Southern Minnesota Initiative Foundation, a non-profit organization, since 2007 and Senior Fellow at the Humphrey Institute Policy Forum at the University of Minnesota since 1995. Member of the Board of Trustees of NorthStar Education Finance, Inc., a non-profit organization, since 2007. | | Asset Allocation Trust |
| Michael S. Scofield (Born 1943) | | Trustee, since 2010 | | Served on the Investment Company Institute’s Board of Governors and Executive Committee from 2008-2011 as well the Governing Council of the Independent Directors Council from 2006-2011 and the Independent Directors Council Executive Committee from 2008-2011. Chairman of the IDC from 2008-2010. Institutional Investor (Fund Directions) Trustee of Year in 2007. Trustee of the Evergreen Funds complex (and its predecessors) from 1984 to 2010. Chairman of the Evergreen Funds from 2000-2010. Former Trustee of the Mentor Funds. Retired Attorney, Law Offices of Michael S. Scofield. | | Asset Allocation Trust |
| * | Length of service dates reflect the Trustee’s commencement of service with the Trust’s predecessor entities, where applicable. |
| ** | Peter Gordon is expected to retire on December 31, 2017. |
Officers
| | | | | | |
Name and
year of birth | | Position held and
length of service | | Principal occupations during past five years or longer | | |
Andrew Owen3
(Born 1960) | | President, since 2017 | | Executive Vice President of Wells Fargo Bank, N.A. and President of Wells Fargo & Company and Head of Affiliated Managaers, Wells Fargo Asset Management, since 2014. Executive Vice President responsible for marketing, investments and product development for Wells Fargo Funds Management, LLC, from 2009 to 2014. | | |
Nancy Wiser1
(Born 1967) | | Treasurer, since 2012 | | Executive Vice President of Wells Fargo Funds Management, LLC since 2011. Chief Operating Officer and Chief Compliance Officer at LightBox Capital Management LLC, from 2008 to 2011. | | |
| C. David Messman (Born 1960) | | Secretary, since 2000; Chief Legal Officer, since 2003 | | Senior Vice President and Secretary of Wells Fargo Funds Management, LLC since 2001. Assistant General Counsel of Wells Fargo Bank, N.A. since 2013 and Vice President and Managing Counsel of Wells Fargo Bank, N.A. from 1996 to 2013. | | |
| Michael Whitaker (Born 1967) | | Chief Compliance Officer, since 2016 | | Executive Vice President of Wells Fargo Funds Management, LLC since 2016. Chief Compliance Officer of Fidelity’s Fixed Income Funds and Asset Allocation Funds from 2008 to 2016, Compliance Officer of FMR Co., Inc. from 2014 to 2016, Fidelity Investments Money Management, Inc. from 2014 to 2016, Fidelity Investments from 2007 to 2016. | | |
David Berardi
(Born 1975) | | Assistant Treasurer, since 2009 | | Vice President of Wells Fargo Funds Management, LLC since 2009. Vice President of Evergreen Investment Management Company, LLC from 2008 to 2010. Manager of Fund Reporting and Control for Evergreen Investment Management Company, LLC from 2004 to 2010. | | |
| Jeremy DePalma1 (Born 1974) | | Assistant Treasurer, since 2009 | | Senior Vice President of Wells Fargo Funds Management, LLC since 2009. Senior Vice President of Evergreen Investment Management Company, LLC from 2008 to 2010 and head of the Fund Reporting and Control Team within Fund Administration from 2005 to 2010. | | |
| 1 | Nancy Wiser acts as Treasurer of 70 funds in the Fund Complex. Jeremy DePalma acts as Treasurer of 69 funds and Assistant Treasurer of 70 funds in the Fund Complex. |
| 2 | The Statement of Additional Information includes additional information about the Trustees and is available, without charge, upon request, by calling
1-800-222-8222 or by visiting the website at wellsfargofunds.com. |
| 3 | Andrew Owen became President on January 1, 2017. |
| | | | | | |
| List of abbreviations | | Wells Fargo Municipal Bond Fund | | | 29 | |
The following is a list of common abbreviations for terms and entities that may have appeared in this report.
| ACA | — ACA Financial Guaranty Corporation |
| ADR | — American depositary receipt |
| ADS | — American depositary shares |
| AGC | — Assured Guaranty Corporation |
| AGM | — Assured Guaranty Municipal |
| Ambac | — Ambac Financial Group Incorporated |
| AMT | — Alternative minimum tax |
| BAN | — Bond anticipation notes |
| BHAC | — Berkshire Hathaway Assurance Corporation |
| CAB | — Capital appreciation bond |
| CCAB | — Convertible capital appreciation bond |
| CDA | — Community Development Authority |
| CDO | — Collateralized debt obligation |
| DRIVER | — Derivative inverse tax-exempt receipts |
| DW&P | — Department of Water & Power |
| DWR | — Department of Water Resources |
| ECFA | — Educational & Cultural Facilities Authority |
| EDA | — Economic Development Authority |
| EDFA | — Economic Development Finance Authority |
| ETF | — Exchange-traded fund |
| FDIC | — Federal Deposit Insurance Corporation |
| FFCB | — Federal Farm Credit Banks |
| FGIC | — Financial Guaranty Insurance Corporation |
| FHA | — Federal Housing Administration |
| FHLB | — Federal Home Loan Bank |
| FHLMC | — Federal Home Loan Mortgage Corporation |
| FICO | — The Financing Corporation |
| FNMA | — Federal National Mortgage Association |
| GDR | — Global depositary receipt |
| GNMA | — Government National Mortgage Association |
| HCFR | — Healthcare facilities revenue |
| HEFA | — Health & Educational Facilities Authority |
| HEFAR | — Higher education facilities authority revenue |
| HFA | — Housing Finance Authority |
| HFFA | — Health Facilities Financing Authority |
| HUD | — Department of Housing and Urban Development |
| IDA | — Industrial Development Authority |
| IDAG | — Industrial Development Agency |
| KRW | — Republic of Korea won |
| LIBOR | — London Interbank Offered Rate |
| LIFER | — Long Inverse Floating Exempt Receipts |
| LLC | — Limited liability company |
| LLLP | — Limited liability limited partnership |
| LLP | — Limited liability partnership |
| MBIA | — Municipal Bond Insurance Association |
| MFHR | — Multifamily housing revenue |
| MSTR | — Municipal securities trust receipts |
| MUD | — Municipal Utility District |
| National | — National Public Finance Guarantee Corporation |
| PCFA | — Pollution Control Financing Authority |
| PCL | — Public Company Limited |
| PCR | — Pollution control revenue |
| PFA | — Public Finance Authority |
| PFFA | — Public Facilities Financing Authority |
| PFOTER | — Puttable floating option tax-exempt receipts |
| plc | — Public limited company |
| PUTTER | — Puttable tax-exempt receipts |
| R&D | — Research & development |
| Radian | — Radian Asset Assurance |
| RAN | — Revenue anticipation notes |
| RDA | — Redevelopment Authority |
| RDFA | — Redevelopment Finance Authority |
| REIT | — Real estate investment trust |
| ROC | — Reset option certificates |
| SAVRS | — Select auction variable rate securities |
| SBA | — Small Business Authority |
| SDR | — Swedish depositary receipt |
| SFHR | — Single-family housing revenue |
| SFMR | — Single-family mortgage revenue |
| SPA | — Standby purchase agreement |
| SPDR | — Standard & Poor’s Depositary Receipts |
| SPEAR | — Short Puttable Exempt Adjustable Receipts |
| STRIPS | — Separate trading of registered interest and |
| TAN | — Tax anticipation notes |
| TIPS | — Treasury inflation-protected securities |
| TRAN | — Tax revenue anticipation notes |
| TTFA | — Transportation Trust Fund Authority |
| TVA | — Tennessee Valley Authority |
This page is intentionally left blank.
This page is intentionally left blank.
This page is intentionally left blank.

For more information
More information about Wells Fargo Funds is available free upon request. To obtain literature, please write, email, visit the Fund’s website, or call:
Wells Fargo Funds
P.O. Box 8266
Boston, MA 02266-8266
Email: fundservice@wellsfargo.com
Website: wellsfargofunds.com
Individual investors: 1-800-222-8222
Retail investment professionals: 1-888-877-9275
Institutional investment professionals:
1-866-765-0778
This report and the financial statements contained herein are submitted for the general information of the shareholders of the Fund. If this report is used for promotional purposes, distribution of the report must be accompanied or preceded by a current prospectus. Before investing, please consider the investment objectives, risks, charges, and expenses of the investment. For a current prospectus and, if available, a summary prospectus, containing this information, call 1-800-222-8222 or visit the Fund’s website at wellsfargofunds.com. Read the prospectus carefully before you invest or send money.
Wells Fargo Asset Management (WFAM) is a trade name used by the asset management businesses of Wells Fargo & Company. Wells Fargo Funds Management, LLC, a wholly owned subsidiary of Wells Fargo & Company, provides investment advisory and administrative services for Wells Fargo Funds. Other affiliates of Wells Fargo & Company provide subadvisory and other services for the funds. The funds are distributed by Wells Fargo Funds Distributor, LLC, Member FINRA, an affiliate of Wells Fargo & Company. Neither Wells Fargo Funds Management nor Wells Fargo Funds Distributor has Fund customer accounts/assets, and neither provides investment advice/recommendations or acts as an investment advice fiduciary to any investor.
NOT FDIC INSURED ◾ NO BANK GUARANTEE ◾ MAY LOSE VALUE
© 2016 Wells Fargo Funds Management, LLC. All rights reserved.
| | |
 | | 300482 02-17 SA253/SAR253 12-16 |
Semi-Annual Report
December 31, 2016

Wells Fargo
North Carolina Tax-Free Fund


Reduce clutter. Save trees.
Sign up for electronic delivery of prospectuses and shareholder reports at wellsfargo.com/advantagedelivery
Contents
The views expressed and any forward-looking statements are as of December 31, 2016, unless otherwise noted, and are those of the Fund managers and/or Wells Fargo Funds Management, LLC. Discussions of individual securities, or the markets generally, or any Wells Fargo Fund are not intended as individual recommendations. Future events or results may vary significantly from those expressed in any forward-looking statements. The views expressed are subject to change at any time in response to changing circumstances in the market. Wells Fargo Funds Management, LLC and the Fund disclaim any obligation to publicly update or revise any views expressed or forward-looking statements.
NOT FDIC INSURED ◾ NO BANK GUARANTEE ◾ MAY LOSE VALUE
| | | | |
| 2 | | Wells Fargo North Carolina Tax-Free Fund | | Letter to shareholders (unaudited) |

Andrew Owen
President
Wells Fargo Funds
The Bloomberg Barclays Municipal Bond Index,1 a broad measure tracking investment-grade municipal bonds, lost 3.91% during the six-month reporting period.
Dear Shareholder:
As the new president of Wells Fargo Funds now that Karla Rabusch is retiring from that position after nearly 14 years, I am pleased to offer you this semi-annual report for the Wells Fargo North Carolina Tax-Free Fund for the six-month period that ended December 31, 2016. The Federal Reserve (Fed) raised the federal funds rate in December by 0.25%. Municipal bond yields rose sharply in the fourth quarter. The Bloomberg Barclays Municipal Bond Index,1 a broad measure tracking investment-grade municipal bonds, lost 3.91% during the six-month reporting period.
Municipal bond yields rose during the reporting period.
The municipal market reversed course in the second half of 2016, with yields increasing and prices declining. Initially the sell-off was driven by negative supply and demand trends, also known as technical factors. By the fourth quarter, fund flows turned negative (reversing a trend of 54 weeks of positive flows) and municipal bond supply increased. These deteriorating technical factors, along with the expectation of an expansionary fiscal policy and lower tax rates under the new administration, drove market volatility; credit spreads widened and the yield curve steepened as the market sold-off.
Stronger economic indicators drove monetary policy.
On December 14, the Fed hiked the short-term interest rate by 0.25% to reach a target range of 0.50% to 0.75%. This was the second rate increase in more than 10 years, with the Fed citing job gains and lower than expected unemployment of 4.6%. The Fed confirmed the continuation of an accommodative monetary policy to support a stronger labor market and reiterated its long-term objective of a 2% inflation rate, which increased slightly during the fourth quarter but fell short of the benchmark. The Fed expressed confidence in the economy’s progress and expects this positive trajectory to continue. Both sentiments helped to bolster the Fed’s expectation of three additional rate increases during 2017.
Meanwhile, the Bank of England continued its quantitative-easing program and lowered the official bank rate to 0.25% in August 2016. The Bank of Japan maintained its negative interest rate put in place earlier in the year, and in September announced an interest rate target for 10-year government bonds—keeping the yield at zero—as it struggles to accelerate economic growth. In December, the European Central Bank announced that it will extend its quantitative-easing program and continue purchasing large amounts of eurozone corporate and government debt each month through December 2017.
U.S. economic data released during the fourth quarter showed that U.S. real gross domestic product increased at an annual 3.5% rate in the third quarter, the largest increase since mid-2014. Business investment by U.S. companies was mixed, with a 12.0% increase in structures and 4.5% decrease in equipment over the prior quarter on an annualized basis. Consumer confidence hit pre-recession levels for the first time in November, and increased again in December. The dollar strengthened during the quarter’s post-election period.
Supply and demand trends reflected volatility of municipals.
Demand for municipal debt, as measured by cash flows to municipal bond mutual funds, was negative for the reporting period. There were $19 billion of inflows from July through October, but a sharp reversal occurred post-election, with $26 billion of redemptions in the last two months of the year. This followed a
| 1 | The Bloomberg Barclays Municipal Bond Index (formerly known as Barclays Municipal Bond Index) is an unmanaged index composed of long-term tax-exempt bonds with a minimum credit rating of Baa. You cannot invest directly in an index. |
| | | | | | |
| Letter to shareholders (unaudited) | | Wells Fargo North Carolina Tax-Free Fund | | | 3 | |
noteworthy 54 consecutive weeks of inflows. On the supply side, August through October saw 30-year record-breaking volumes each month; both refundings and new issuance were up. These levels were attributed to deals pulled forward in anticipation of higher interest rates. Not surprisingly, December volume was down 25% year-over-year to $19 billion. Total municipal bond issuance for the period was $219 billion; new issuance outpaced refundings by $18 billion.
Municipal credit fundamentals were solid.
Overall, municipal credit was sound for the period. The most significant development was the election of Ricardo Rossello as governor of the Commonwealth of Puerto Rico. In the past, prices of Puerto Rico bonds reflected negative credit considerations, including defaults on its securities in 2015 and early 2016, but recent events point to a potentially more positive fiscal environment. Rossello campaigned, in part, on a platform that included promises to ultimately pay 100% of interest due on Puerto Rico’s outstanding municipal debt, negotiate with bondholders, and ration government expenditures. This stance is a major shift from his predecessor who focused on a bankruptcy mechanism.
Since the end of the financial crisis, structural changes in the fixed-income markets have reduced trading liquidity (the degree to which assets can be bought or sold without affecting the price). New regulations and capital requirements have caused traditional liquidity suppliers (banks and broker/dealers) to be more risk averse and hold less inventory. Meanwhile, corporate debt issuance has spiked as companies finance themselves at record-low yields, bond mutual funds hold larger amounts of this new debt supply, trading volumes are lower, and large-size trades are more difficult to execute. However, fixed-income markets appeared to function well over the past year with sufficient liquidity.
Don’t let short-term uncertainty derail long-term investment goals.
Periods of uncertainty can present challenges, but experience has taught us that maintaining long-term investment goals can be an effective way to plan for the future. To help you create a sound strategy based on your personal goals and risk tolerance, Wells Fargo Funds offers more than 100 mutual funds spanning a wide range of asset classes and investment styles. Although diversification cannot guarantee an investment profit or prevent losses, we believe it can be an effective way to manage investment risk and potentially smooth out overall portfolio performance. We encourage investors to know their investments and to understand that appropriate levels of risk-taking may unlock opportunities.
Thank you for choosing to invest in Wells Fargo Funds. We appreciate your confidence in us and remain committed to helping you meet your financial needs.
Sincerely,

Andrew Owen
President
Wells Fargo Funds
Periods of uncertainty can present challenges, but experience has taught us that maintaining long-term investment goals can be an effective way to plan for the future.
For further information about your Fund, contact your investment professional, visit our website at wellsfargofunds.com, or call us directly at 1-800-222-8222. We are available 24 hours a day, 7 days a week.
| | | | |
| 4 | | Wells Fargo North Carolina Tax-Free Fund | | Performance highlights (unaudited) |
Investment objective
The Fund seeks current income exempt from federal income tax and North Carolina individual income tax.
Manager
Wells Fargo Funds Management, LLC
Subadviser
Wells Capital Management Incorporated
Portfolio managers
Bruce R. Johns
Robert J. Miller
Average annual total returns (%) as of December 31, 20161
| | | | | | | | | | | | | | | | | | | | | | | | | | | | | | | | | | |
| | | | | Including sales charge | | | Excluding sales charge | | | Expense ratios2 (%) | |
| | | Inception date | | 1 year | | | 5 year | | | 10 year | | | 1 year | | | 5 year | | | 10 year | | | Gross | | | Net3 | |
| Class A (ENCMX) | | 1-11-1993 | | | (5.05 | ) | | | 2.15 | | | | 2.84 | | | | (0.59 | ) | | | 3.10 | | | | 3.32 | | | | 0.96 | | | | 0.85 | |
| Class C (ENCCX) | | 3-27-2002 | | | (2.34 | ) | | | 2.34 | | | | 2.55 | | | | (1.34 | ) | | | 2.34 | | | | 2.55 | | | | 1.71 | | | | 1.60 | |
| Institutional Class (ENCYX) | | 2-28-1994 | | | – | | | | – | | | | – | | | | (0.29 | ) | | | 3.42 | | | | 3.62 | | | | 0.63 | | | | 0.54 | |
| Bloomberg Barclays Municipal Bond Index4 | | – | | | – | | | | – | | | | – | | | | 0.25 | | | | 3.28 | | | | 4.25 | | | | – | | | | – | |
| Bloomberg Barclays North Carolina Municipal Bond Index5 | | – | | | – | | | | – | | | | – | | | | 0.33 | | | | 2.70 | | | | 4.13 | | | | – | | | | – | |
Figures quoted represent past performance, which is no guarantee of future results, and do not reflect taxes that a shareholder may pay on fund distributions or the redemption of fund shares. Investment return and principal value of an investment will fluctuate so that an investor’s shares, when redeemed, may be worth more or less than their original cost. Performance shown without sales charges would be lower if sales charges were reflected. Current performance may be lower or higher than the performance data quoted, which assumes the reinvestment of dividends and capital gains. Current month-end performance is available on the Fund’s website, wellsfargofunds.com.
Index returns do not include transaction costs associated with buying and selling securities, any mutual fund fees or expenses, or any taxes. It is not possible to invest directly in an index.
For Class A shares, the maximum front-end sales charge is 4.50%. For Class C shares, the maximum contingent deferred sales charge is 1.00%. Performance including a contingent deferred sales charge assumes the sales charge for the corresponding time period. Institutional Class shares are sold without a front-end sales charge or contingent deferred sales charge.
Bond values fluctuate in response to the financial condition of individual issuers, general market and economic conditions, and changes in interest rates. Changes in market conditions and government policies may lead to periods of heightened volatility in the bond market and reduced liquidity for certain bonds held by the Fund. In general, when interest rates rise, bond values fall and investors may lose principal value. Interest-rate changes and their impact on the Fund and its share price can be sudden and unpredictable. The use of derivatives may reduce returns and/or increase volatility. Certain investment strategies tend to increase the total risk of an investment (relative to the broader market). The Fund is exposed to North Carolina municipal securities risk, high-yield securities risk, and non-diversification risk. Consult the Fund’s prospectus for additional information on these and other risks. A portion of the Fund’s income may be subject to federal, state, and/or local income taxes or the Alternative Minimum Tax (AMT). Any capital gains distributions may be taxable.
Please see footnotes on page 5.
| | | | | | |
| Performance highlights (unaudited) | | Wells Fargo North Carolina Tax-Free Fund | | | 5 | |
|
| Effective maturity distribution as of December 31, 20166 |
|
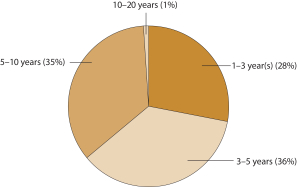 |
|
| Credit quality as of December 31, 20167 |
|
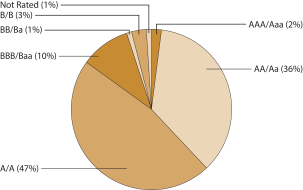 |
| 1 | Historical performance shown for all classes of the Fund prior to July 12, 2010, is based on the performance of the Fund’s predecessor, Evergreen North Carolina Municipal Bond Fund. |
| 2 | Reflects the expense ratios as stated in the most recent prospectuses. The expense ratios shown are subject to change and may differ from the annualized expense ratios shown in the financial highlights of this report. |
| 3 | The manager has contractually committed through October 31, 2017, to waive fees and/or reimburse expenses to the extent necessary to cap the Fund’s Total Annual Fund Operating Expenses After Fee Waiver at the amounts shown. After this time, the cap may be increased or the commitment to maintain the cap may be terminated only with the approval of the Board of Trustees. Brokerage commissions, stamp duty fees, interest, taxes, acquired fund fees and expenses, and extraordinary expenses are excluded from the expense cap. Without this cap, the Fund’s returns would have been lower. |
| 4 | The Bloomberg Barclays Municipal Bond Index (formerly known as Barclays Municipal Bond Index) is an unmanaged index composed of long-term tax-exempt bonds with a minimum credit rating of Baa. You cannot invest directly in an index. |
| 5 | The Bloomberg Barclays North Carolina Municipal Bond Index (formerly known as Barclays North Carolina Municipal Bond Index) is the North Carolina component of the Bloomberg Barclays Municipal Bond Index. You cannot invest directly in an index. |
| 6 | Amounts are calculated based on the total investments of the Fund. These amounts are subject to change and may have changed since the date specified. |
| 7 | The credit quality distribution of portfolio holdings reflected in the chart is based on ratings from Standard & Poor’s, Moody’s Investors Service, and/ or Fitch Ratings Ltd. Credit quality ratings apply to the underlying holdings of the Fund and not to the Fund itself. The percentages of the Fund’s portfolio with the ratings depicted in the chart are calculated based on the total market value of fixed income securities held by the Fund. If a security was rated by all three rating agencies, the middle rating was utilized. If rated by two of three rating agencies, the lower rating was utilized, and if rated by one of the rating agencies, that rating was utilized. Standard & Poor’s rates the creditworthiness of bonds, ranging from AAA (highest) to D (lowest). Ratings from A to CCC may be modified by the addition of a plus (+) or minus (-) sign to show relative standing within the rating categories. Standard & Poor’s rates the creditworthiness of short-term notes from SP-1 (highest) to SP-3 (lowest). Moody’s rates the creditworthiness of bonds, ranging from Aaa (highest) to C (lowest). Ratings Aa to B may be modified by the addition of a number 1 (highest) to 3 (lowest) to show relative standing within the ratings categories. Moody’s rates the creditworthiness of short-term U.S. tax-exempt municipal securities from MIG 1/VMIG 1 (highest) to SG (lowest). Fitch rates the creditworthiness of bonds, ranging from AAA (highest) to D (lowest). Credit quality distribution is subject to change and may have changed since the date specified. |
| | | | |
| 6 | | Wells Fargo North Carolina Tax-Free Fund | | Fund expenses (unaudited) |
As a shareholder of the Fund, you incur two types of costs: (1) transaction costs, including sales charges (loads) on purchase payments and contingent deferred sales charges (if any) on redemptions and (2) ongoing costs, including management fees, distribution (12b-1) and/or shareholder servicing fees, and other Fund expenses. This example is intended to help you understand your ongoing costs (in dollars) of investing in the Fund and to compare these costs with the ongoing costs of investing in other mutual funds.
The example is based on an investment of $1,000 invested at the beginning of the six-month period and held for the entire period from July 1, 2016 to December 31, 2016.
Actual expenses
The “Actual” line of the table below provides information about actual account values and actual expenses. You may use the information in this line, together with the amount you invested, to estimate the expenses that you paid over the period. Simply divide your account value by $1,000 (for example, an $8,600 account value divided by $1,000 = 8.6), then multiply the result by the number in the “Actual” line under the heading entitled “Expenses paid during period” for your applicable class of shares to estimate the expenses you paid on your account during this period.
Hypothetical example for comparison purposes
The “Hypothetical” line of the table below provides information about hypothetical account values and hypothetical expenses based on the Fund’s actual expense ratio and an assumed rate of return of 5% per year before expenses, which is not the Fund’s actual return. The hypothetical account values and expenses may not be used to estimate the actual ending account balance or expenses you paid for the period. You may use this information to compare the ongoing costs of investing in the Fund and other funds. To do so, compare this 5% hypothetical example with the 5% hypothetical examples that appear in the shareholder reports of the other funds.
Please note that the expenses shown in the table are meant to highlight your ongoing costs only and do not reflect any transactional costs, such as sales charges (loads) and contingent deferred sales charges. Therefore, the “Hypothetical” line of the table is useful in comparing ongoing costs only and will not help you determine the relative total costs of owning different funds. In addition, if these transactional costs were included, your costs would have been higher.
| | | | | | | | | | | | | | | | |
| | | Beginning
account value
7-1-2016 | | | Ending
account value
12-31-2016 | | | Expenses
paid during
the period¹ | | | Annualized net
expense ratio | |
Class A | | | | | | | | | | | | | | | | |
Actual | | $ | 1,000.00 | | | $ | 965.64 | | | $ | 4.20 | | | | 0.85 | % |
Hypothetical (5% return before expenses) | | $ | 1,000.00 | | | $ | 1,020.86 | | | $ | 4.32 | | | | 0.85 | % |
Class C | | | | | | | | | | | | | | | | |
Actual | | $ | 1,000.00 | | | $ | 961.99 | | | $ | 7.89 | | | | 1.60 | % |
Hypothetical (5% return before expenses) | | $ | 1,000.00 | | | $ | 1,017.09 | | | $ | 8.11 | | | | 1.60 | % |
Institutional Class | | | | | | | | | | | | | | | | |
Actual | | $ | 1,000.00 | | | $ | 967.15 | | | $ | 2.67 | | | | 0.54 | % |
Hypothetical (5% return before expenses) | | $ | 1,000.00 | | | $ | 1,022.42 | | | $ | 2.75 | | | | 0.54 | % |
| 1 | Expenses paid is equal to the annualized net expense ratio of each class multiplied by the average account value over the period, multiplied by the number of days in the most recent fiscal half-year divided by the number of days in the fiscal year (to reflect the one-half-year period). |
| | | | | | |
| Portfolio of investments—December 31, 2016 (unaudited) | | Wells Fargo North Carolina Tax-Free Fund | | | 7 | |
| | | | | | | | | | | | | | | | |
| Security name | | Interest rate | | | Maturity date | | | Principal | | | Value | |
| | | | |
Municipal Obligations: 98.26% | | | | | | | | | | | | | | | | |
| | | | |
| California: 1.39% | | | | | | | | | | | | | | | | |
University of California Limited Project Series G (Education Revenue) | | | 5.00 | % | | | 5-15-2037 | | | $ | 1,000,000 | | | $ | 1,125,550 | |
| | | | | | | | | | | | | | | | |
| | | | |
| Guam: 6.24% | | | | | | | | | | | | | | | | |
Guam Government Business Privilege Tax Series A (Tax Revenue) | | | 5.00 | | | | 1-1-2031 | | | | 1,000,000 | | | | 1,062,630 | |
Guam Government Hotel Occupancy Series A (Tax Revenue) | | | 6.00 | | | | 11-1-2026 | | | | 2,000,000 | | | | 2,291,820 | |
Guam Government Limited Obligation Series A (Tax Revenue) | | | 5.00 | | | | 12-1-2028 | | | | 500,000 | | | | 571,580 | |
Guam Government Waterworks Authority (Water & Sewer Revenue) | | | 5.25 | | | | 7-1-2023 | | | | 1,000,000 | | | | 1,124,820 | |
| | | | |
| | | | | | | | | | | | | | | 5,050,850 | |
| | | | | | | | | | | | | | | | |
| | | | |
| Indiana: 1.41% | | | | | | | | | | | | | | | | |
Indiana Finance Authority Clean Water Act Project Series A (Water & Sewer Revenue) | | | 5.00 | | | | 10-1-2031 | | | | 1,000,000 | | | | 1,141,840 | |
| | | | | | | | | | | | | | | | |
| | | | |
| New York: 2.06% | | | | | | | | | | | | | | | | |
New York Dormitory Authority Personal Income Tax Series B (Tax Revenue) | | | 5.00 | | | | 3-15-2042 | | | | 1,500,000 | | | | 1,672,230 | |
| | | | | | | | | | | | | | | | |
| | | | |
| North Carolina: 77.50% | | | | | | | | | | | | | | | | |
Cape Fear NC Public Utility Authority (Water & Sewer Revenue) | | | 5.00 | | | | 8-1-2035 | | | | 3,000,000 | | | | 3,179,910 | |
Carolina Beach NC Enterprise System (Water & Sewer Revenue) | | | 5.00 | | | | 6-1-2029 | | | | 250,000 | | | | 294,108 | |
Carolina Beach NC Enterprise System (Water & Sewer Revenue) | | | 5.00 | | | | 6-1-2031 | | | | 245,000 | | | | 285,160 | |
Charlotte NC Airport Series A (Airport Revenue) | | | 5.50 | | | | 7-1-2034 | | | | 2,500,000 | | | | 2,748,725 | |
Charlotte NC AMT Series B (Airport Revenue) | | | 5.00 | | | | 7-1-2020 | | | | 1,480,000 | | | | 1,627,896 | |
Charlotte NC AMT Series B (Airport Revenue) | | | 5.50 | | | | 7-1-2024 | | | | 810,000 | | | | 893,884 | |
Charlotte NC Certificate of Participation Series A (Miscellaneous Revenue) | | | 5.00 | | | | 12-1-2026 | | | | 1,160,000 | | | | 1,306,496 | |
Charlotte NC Certificate of Participation Series A (Miscellaneous Revenue) | | | 5.00 | | | | 6-1-2030 | | | | 1,000,000 | | | | 1,144,850 | |
Charlotte NC Certificate of Participation Series E (Miscellaneous Revenue) | | | 5.00 | | | | 6-1-2023 | | | | 3,650,000 | | | | 3,945,906 | |
Charlotte NC Douglas Airport Series A (Airport Revenue) | | | 5.00 | | | | 7-1-2025 | | | | 1,645,000 | | | | 1,808,085 | |
Charlotte-Mecklenburg NC Hospital Authority (Health Revenue) | | | 5.00 | | | | 1-15-2027 | | | | 1,885,000 | | | | 2,002,492 | |
Cumberland County NC Limited Obligation Series B (Miscellaneous Revenue) | | | 5.00 | | | | 11-1-2025 | | | | 1,000,000 | | | | 1,138,130 | |
Cumberland County NC Limited Obligation Series B (Miscellaneous Revenue) | | | 5.00 | | | | 11-1-2026 | | | | 1,000,000 | | | | 1,136,160 | |
Henderson County NC Limited Obligation Series A (Miscellaneous Revenue) | | | 5.00 | | | | 10-1-2030 | | | | 500,000 | | | | 585,835 | |
Jacksonville NC Enterprise System (Water & Sewer Revenue) | | | 5.25 | | | | 5-1-2028 | | | | 500,000 | | | | 610,650 | |
Johnston County NC Memorial Hospital Authority (Health Revenue, AGM/FHA Insured) | | | 5.25 | | | | 10-1-2036 | | | | 1,960,000 | | | | 2,059,882 | |
Mecklenburg County NC Public Facilities Corporation (Miscellaneous Revenue) | | | 5.00 | | | | 3-1-2022 | | | | 1,035,000 | | | | 1,115,740 | |
New Hanover County NC New Hanover Regional Medical Center (Health Revenue) | | | 5.00 | | | | 10-1-2026 | | | | 1,000,000 | | | | 1,120,090 | |
New Hanover County NC New Hanover Regional Medical Center (Health Revenue) | | | 5.00 | | | | 10-1-2028 | | | | 3,000,000 | | | | 3,318,060 | |
New Hanover County NC New Hanover Regional Medical Center (Health Revenue, AGM Insured) | | | 5.13 | | | | 10-1-2031 | | | | 1,800,000 | | | | 1,945,854 | |
North Carolina Department of Transportation (Transportation Revenue) | | | 5.00 | | | | 6-30-2028 | | | | 1,275,000 | | | | 1,380,443 | |
North Carolina Facilities Finance Agency (Housing Revenue, AGC Insured) | | | 5.00 | | | | 6-1-2027 | | | | 1,000,000 | | | | 1,120,550 | |
North Carolina HFA Series B (Housing Revenue) | | | 4.25 | | | | 1-1-2028 | | | | 2,065,000 | | | | 2,117,926 | |
North Carolina Medical Care Commission Baptist Hospital Project (Health Revenue) | | | 5.25 | | | | 6-1-2029 | | | | 2,000,000 | | | | 2,192,740 | |
North Carolina Medical Care Commission Deerfield Episcopal Retirement Community Project (Health Revenue) | | | 5.00 | | | | 11-1-2031 | | | | 1,500,000 | | | | 1,668,645 | |
North Carolina Medical Care Commission Presbyterian Homes Project Series C (Health Revenue) | | | 4.00 | | | | 10-1-2031 | | | | 1,500,000 | | | | 1,580,490 | |
North Carolina Medical Care Commission Southeastern Regional Medical Center Project (Health Revenue) | | | 5.00 | | | | 6-1-2026 | | | | 385,000 | | | | 422,368 | |
North Carolina Medical Care Commission Southeastern Regional Medical Center Project (Health Revenue) | | | 5.00 | | | | 6-1-2032 | | | | 500,000 | | | | 534,935 | |
The accompanying notes are an integral part of these financial statements.
| | | | |
| 8 | | Wells Fargo North Carolina Tax-Free Fund | | Portfolio of investments—December 31, 2016 (unaudited) |
| | | | | | | | | | | | | | | | |
| Security name | | Interest rate | | | Maturity date | | | Principal | | | Value | |
| | | | |
| North Carolina (continued) | | | | | | | | | | | | | | | | |
North Carolina Medical Care Commission Southminster Incorporated (Health Revenue) | | | 5.00 | % | | | 10-1-2037 | | | $ | 500,000 | | | $ | 505,930 | |
North Carolina Medical Care Commission Stanley Memorial Hospital Project (Health Revenue) | | | 5.00 | | | | 7-1-2033 | | | | 1,000,000 | | | | 1,024,940 | |
North Carolina Municipal Power Agency #1 Catawba Nuclear Power Project Prerefunded Bond Series A (Utilities Revenue) | | | 5.00 | | | | 1-1-2030 | | | | 1,105,000 | | | | 1,183,753 | |
North Carolina Municipal Power Agency #1 Catawba Nuclear Power Project Series A (Utilities Revenue) | | | 5.00 | | | | 1-1-2021 | | | | 2,720,000 | | | | 2,974,157 | |
North Carolina Municipal Power Agency #1 Catawba Nuclear Power Project Unrefunded Bond Series A (Utilities Revenue) | | | 5.00 | | | | 1-1-2030 | | | | 445,000 | | | | 470,810 | |
North Carolina Port Authority Series B (Airport Revenue) | | | 5.00 | | | | 2-1-2025 | | | | 3,540,000 | | | | 3,790,667 | |
Onslow County NC Water and Sewer Authority (Water & Sewer Revenue) | | | 5.00 | | | | 12-1-2028 | | | | 505,000 | | | | 602,319 | |
Orange County NC Public Facilities Company Limited Obligation (Miscellaneous Revenue) | | | 5.00 | | | | 10-1-2026 | | | | 1,000,000 | | | | 1,131,700 | |
Pitt County NC Limited Obligation Series A (Miscellaneous Revenue) | | | 5.00 | | | | 4-1-2027 | | | | 875,000 | | | | 1,030,409 | |
Raleigh NC Limited Obligation Series A (Miscellaneous Revenue) | | | 5.00 | | | | 2-1-2029 | | | | 900,000 | | | | 1,065,438 | |
Raleigh NC Limited Obligation Series A (Miscellaneous Revenue) | | | 5.00 | | | | 10-1-2033 | | | | 1,000,000 | | | | 1,144,820 | |
University of North Carolina at Greensboro (Education Revenue) | | | 5.00 | | | | 4-1-2033 | | | | 2,000,000 | | | | 2,257,500 | |
University of North Carolina at Greensboro (Education Revenue) | | | 5.00 | | | | 4-1-2039 | | | | 1,620,000 | | | | 1,800,679 | |
Wilmington NC Limited Obligation Series A (Miscellaneous Revenue) | | | 5.00 | | | | 6-1-2030 | | | | 400,000 | | | | 470,236 | |
| | | | |
| | | | | | | | | | | | | | | 62,739,368 | |
| | | | | | | | | | | | | | | | |
| | | | |
| Tennessee: 4.15% | | | | | | | | | | | | | | | | |
Tennessee Energy Acquisition Corporation Series A (Utilities Revenue) | | | 5.25 | | | | 9-1-2026 | | | | 1,020,000 | | | | 1,187,137 | |
Tennessee Energy Acquisition Corporation Series C (Utilities Revenue) | | | 5.00 | | | | 2-1-2021 | | | | 2,000,000 | | | | 2,173,560 | |
| | | | |
| | | | | | | | | | | | | | | 3,360,697 | |
| | | | | | | | | | | | | | | | |
| | | | |
| Virgin Islands: 2.74% | | | | | | | | | | | | | | | | |
Virgin Islands PFA (Miscellaneous Revenue) | | | 6.75 | | | | 10-1-2019 | | | | 2,240,000 | | | | 2,217,085 | |
| | | | | | | | | | | | | | | | |
| | | | |
| Washington: 1.43% | | | | | | | | | | | | | | | | |
Washington Office Building Refunding Bond (Miscellaneous Revenue) | | | 5.00 | | | | 7-1-2026 | | | | 1,000,000 | | | | 1,154,909 | |
| | | | | | | | | | | | | | | | |
| | | | |
| Wisconsin: 1.34% | | | | | | | | | | | | | | | | |
Wisconsin PFA Carolina International School Series A (Education Revenue) 144A | | | 6.75 | | | | 8-1-2033 | | | | 1,000,000 | | | | 1,081,690 | |
| | | | | | | | | | | | | | | | |
| | | | |
Total Municipal Obligations (Cost $76,257,833) | | | | | | | | | | | | | | | 79,544,219 | |
| | | | | | | | | | | | | | | | |
| | | | |
| | | Yield | | | | | | Shares | | | | |
| Short-Term Investments: 0.44% | | | | | | | | | | | | | | | | |
| | | | |
| Investment Companies: 0.44% | | | | | | | | | | | | | | | | |
Wells Fargo Municipal Cash Management Fund Institutional
Class (l)(u) | | | 0.67 | | | | | | | | 352,182 | | | | 352,393 | |
| | | | | | | | | | | | | | | | |
| | | | |
Total Short-Term Investments (Cost $352,288) | | | | | | | | | | | | | | | 352,393 | |
| | | | | | | | | | | | | | | | |
| | | | | | | | |
| Total investments in securities (Cost $76,610,121)* | | | 98.70 | % | | | 79,896,612 | |
Other assets and liabilities, net | | | 1.30 | | | | 1,054,570 | |
| | | | | | | | |
| Total net assets | | | 100.00 | % | | $ | 80,951,182 | |
| | | | | | | | |
The accompanying notes are an integral part of these financial statements.
| | | | | | |
| Portfolio of investments—December 31, 2016 (unaudited) | | Wells Fargo North Carolina Tax-Free Fund | | | 9 | |
| 144A | The security may be resold in transactions exempt from registration, normally to qualified institutional buyers, pursuant to Rule 144A under the Securities Act of 1933. |
| (l) | The issuer of the security is an affiliated person of the Fund as defined in the Investment Company Act of 1940. |
| (u) | The rate represents the 7-day annualized yield at period end. |
| * | Cost for federal income tax purposes is $76,610,119 and unrealized gains (losses) consists of: |
| | | | | | | | |
Gross unrealized gains | | $ | 3,954,298 | | | | | |
Gross unrealized losses | | | (667,805 | ) | | | | |
| | | | | | | | |
Net unrealized gains | | $ | 3,286,493 | | | | | |
The accompanying notes are an integral part of these financial statements.
| | | | |
| 10 | | Wells Fargo North Carolina Tax-Free Fund | | Statement of assets and liabilities—December 31, 2016 (unaudited) |
| | | | |
| | | | |
| |
Assets | | | | |
Investments | | | | |
In unaffiliated securities, at value (cost $76,257,833) | | $ | 79,544,219 | |
In affiliated securities, at value (cost $352,288) | | | 352,393 | |
| | | | |
Total investments, at value (cost $76,610,121) | | | 79,896,612 | |
Receivable for investments sold | | | 105,000 | |
Receivable for Fund shares sold | | | 68,703 | |
Receivable for interest | | | 1,159,329 | |
Prepaid expenses and other assets | | | 26,281 | |
| | | | |
Total assets | | | 81,255,925 | |
| | | | |
| |
Liabilities | | | | |
Dividends payable | | | 121,073 | |
Payable for Fund shares redeemed | | | 102,607 | |
Management fee payable | | | 22,950 | |
Distribution fee payable | | | 3,865 | |
Administration fees payable | | | 9,179 | |
Professional fees payable | | | 18,232 | |
Accrued expenses and other liabilities | | | 26,837 | |
| | | | |
Total liabilities | | | 304,743 | |
| | | | |
Total net assets | | $ | 80,951,182 | |
| | | | |
| |
NET ASSETS CONSIST OF | | | | |
Paid-in capital | | $ | 86,730,216 | |
Overdistributed net investment income | | | (59,560 | ) |
Accumulated net realized losses on investments | | | (9,005,965 | ) |
Net unrealized gains on investments | | | 3,286,491 | |
| | | | |
Total net assets | | $ | 80,951,182 | |
| | | | |
| |
COMPUTATION OF NET ASSET VALUE AND OFFERING PRICE PER SHARE | | | | |
Net assets – Class A | | | $32,148,160 | |
Shares outstanding – Class A1 | | | 3,184,828 | |
Net asset value per share – Class A | | | $10.09 | |
Maximum offering price per share – Class A2 | | | $10.57 | |
Net assets – Class C | | | $5,571,637 | |
Shares outstanding – Class C1 | | | 551,986 | |
Net asset value per share – Class C | | | $10.09 | |
Net assets – Institutional Class | | | $43,231,385 | |
Shares outstanding – Institutional Class1 | | | 4,282,990 | |
Net asset value per share – Institutional Class | | | $10.09 | |
| 1 | The Fund has an unlimited number of authorized shares. |
| 2 | Maximum offering price is computed as 100/95.50 of net asset value. On investments of $50,000 or more, the offering price is reduced. |
The accompanying notes are an integral part of these financial statements.
| | | | | | |
| Statement of operations—six months ended December 31, 2016 (unaudited) | | Wells Fargo North Carolina Tax-Free Fund | | | 11 | |
| | | | |
| | | | |
| |
Investment income | | | | |
Interest | | $ | 1,865,501 | |
Income from affiliated securities | | | 3,367 | |
| | | | |
Total investment income | | | 1,868,868 | |
| | | | |
| |
Expenses | | | | |
Management fee | | | 202,867 | |
Administration fees | | | | |
Class A | | | 28,366 | |
Class C | | | 5,029 | |
Institutional Class | | | 23,876 | |
Shareholder servicing fees | | | | |
Class A | | | 44,322 | |
Class C | | | 7,858 | |
Distribution fee | | | | |
Class C | | | 23,573 | |
Custody and accounting fees | | | 5,263 | |
Professional fees | | | 24,035 | |
Registration fees | | | 25,822 | |
Shareholder report expenses | | | 4,522 | |
Trustees’ fees and expenses | | | 11,486 | |
Other fees and expenses | | | 4,510 | |
| | | | |
Total expenses | | | 411,529 | |
Less: Fee waivers and/or expense reimbursements | | | (49,382 | ) |
| | | | |
Net expenses | | | 362,147 | |
| | | | |
Net investment income | | | 1,506,721 | |
| | | | |
| |
REALIZED AND UNREALIZED GAINS (LOSSES) ON INVESTMENTS | | | | |
| |
Net realized gains on: | | | | |
Unaffiliated securities | | | 1,180,199 | |
Affiliated securities | | | 103,300 | |
| | | | |
Net realized gains on investments | | | 1,283,499 | |
| | | | |
| |
Net change in unrealized gains (losses) on: | | | | |
Unaffiliated securities | | | (6,210,194 | ) |
Affiiliated securities | | | 105 | |
| | | | |
Net change in unrealized gains (losses) on investments | | | (6,210,089 | ) |
| | | | |
Net realized and unrealized gains (losses) on investments | | | (4,926,590 | ) |
| | | | |
Net decrease in net assets resulting from operations | | $ | (3,419,869 | ) |
| | | | |
The accompanying notes are an integral part of these financial statements.
| | | | |
| 12 | | Wells Fargo North Carolina Tax-Free Fund | | Statement of changes in net assets |
| | | | | | | | | | | | | | | | |
| | | Six months ended December 31, 2016 (unaudited) | | | Year ended
June 30, 2016 | |
| | | | |
Operations | | | | | | | | | | | | | | | | |
Net investment income | | | | | | $ | 1,506,721 | | | | | | | $ | 3,164,807 | |
Net realized gains (losses) on investments | | | | | | | 1,283,499 | | | | | | | | (55,699 | ) |
Net change in unrealized gains (losses) on investments | | | | | | | (6,210,089 | ) | | | | | | | 2,346,419 | |
| | | | |
Net increase (decrease) in net assets resulting from operations | | | | | | | (3,419,869 | ) | | | | | | | 5,455,527 | |
| | | | |
| | | | |
Distributions to shareholders from | | | | | | | | | | | | | | | | |
Net investment income | | | | | | | | | | | | | | | | |
Class A | | | | | | | (503,202 | ) | | | | | | | (1,060,689 | ) |
Class C | | | | | | | (65,548 | ) | | | | | | | (109,808 | ) |
Institutional Class | | | | | | | (937,957 | ) | | | | | | | (1,994,310 | ) |
| | | | |
Total distributions to shareholders | | | | | | | (1,506,707 | ) | | | | | | | (3,164,807 | ) |
| | | | |
| | | | |
Capital share transactions | | | Shares | | | | | | | | Shares | | | | | |
Proceeds from shares sold | | | | | | | | | | | | | | | | |
Class A | | | 39,881 | | | | 412,496 | | | | 424,558 | | | | 4,432,275 | |
Class C | | | 39,510 | | | | 416,579 | | | | 186,322 | | | | 1,956,171 | |
Institutional Class | | | 766,974 | | | | 7,916,114 | | | | 1,135,937 | | | | 11,925,410 | |
| | | | |
| | | | | | | 8,745,189 | | | | | | | | 18,313,856 | |
| | | | |
Reinvestment of distributions | | | | | | | | | | | | | | | | |
Class A | | | 45,279 | | | | 468,624 | | | | 94,806 | | | | 992,485 | |
Class C | | | 5,919 | | | | 61,240 | | | | 9,754 | | | | 102,165 | |
Institutional Class | | | 22,283 | | | | 230,576 | | | | 39,018 | | | | 408,587 | |
| | | | |
| | | | | | | 760,440 | | | | | | | | 1,503,237 | |
| | | | |
Payment for shares redeemed | | | | | | | | | | | | | | | | |
Class A | | | (381,333 | ) | | | (3,932,184 | ) | | | (317,128 | ) | | | (3,313,134 | ) |
Class C | | | (70,969 | ) | | | (725,286 | ) | | | (46,145 | ) | | | (483,983 | ) |
Institutional Class | | | (2,431,495 | ) | | | (24,773,614 | ) | | | (1,122,422 | ) | | | (11,750,628 | ) |
| | | | |
| | | | | | | (29,431,084 | ) | | | | | | | (15,547,745 | ) |
| | | | |
Net increase (decrease) in net assets resulting from capital share transactions | | | | | | | (19,925,455 | ) | | | | | | | 4,269,348 | |
| | | | |
Total increase (decrease) in net assets | | | | | | | (24,852,031 | ) | | | | | | | 6,560,068 | |
| | | | |
| | | | |
Net assets | | | | | | | | | | | | | | | | |
Beginning of period | | | | | | | 105,803,213 | | | | | | | | 99,243,145 | |
| | | | |
End of period | | | | | | $ | 80,951,182 | | | | | | | $ | 105,803,213 | |
| | | | |
Overdistributed net investment income | | | | | | $ | (59,560 | ) | | | | | | $ | (59,574 | ) |
| | | | |
The accompanying notes are an integral part of these financial statements.
| | | | | | |
| Financial highlights | | Wells Fargo North Carolina Tax-Free Fund | | | 13 | |
(For a share outstanding throughout each period)
| | | | | | | | | | | | | | | | | | | | | | | | |
| | | Six months ended
December 31, 2016 (unaudited) | | | Year ended June 30 | |
| CLASS A | | | 2016 | | | 2015 | | | 2014 | | | 2013 | | | 2012 | |
Net asset value, beginning of period | | | $10.60 | | | | $10.36 | | | | $10.33 | | | | $10.08 | | | | $10.34 | | | | $9.71 | |
Net investment income | | | 0.15 | | | | 0.31 | | | | 0.32 | | | | 0.33 | | | | 0.32 | | | | 0.34 | |
Net realized and unrealized gains (losses) on investments | | | (0.51 | ) | | | 0.24 | | | | 0.03 | | | | 0.25 | | | | (0.26 | ) | | | 0.63 | |
| | | | | | | | | | | | | | | | | | | | | | | | |
Total from investment operations | | | (0.36 | ) | | | 0.55 | | | | 0.35 | | | | 0.58 | | | | 0.06 | | | | 0.97 | |
Distributions to shareholders from | | | | | | | | | | | | | | | | | | | | | | | | |
Net investment income | | | (0.15 | ) | | | (0.31 | ) | | | (0.32 | ) | | | (0.33 | ) | | | (0.32 | ) | | | (0.34 | ) |
Net asset value, end of period | | | $10.09 | | | | $10.60 | | | | $10.36 | | | | $10.33 | | | | $10.08 | | | | $10.34 | |
Total return1 | | | (3.44 | )% | | | 5.43 | % | | | 3.35 | % | | | 5.92 | % | | | 0.51 | % | | | 10.09 | % |
Ratios to average net assets (annualized) | | | | | | | | | | | | | | | | | | | | | | | | |
Gross expenses | | | 0.96 | % | | | 0.96 | % | | | 0.94 | % | | | 0.94 | % | | | 0.91 | % | | | 0.90 | % |
Net expenses | | | 0.85 | % | | | 0.85 | % | | | 0.85 | % | | | 0.85 | % | | | 0.85 | % | | | 0.85 | % |
Net investment income | | | 2.84 | % | | | 3.00 | % | | | 3.01 | % | | | 3.32 | % | | | 3.06 | % | | | 3.34 | % |
Supplemental data | | | | | | | | | | | | | | | | | | | | | | | | |
Portfolio turnover rate | | | 7 | % | | | 7 | % | | | 12 | % | | | 15 | % | | | 15 | % | | | 48 | % |
Net assets, end of period (000s omitted) | | | $32,148 | | | | $36,890 | | | | $33,969 | | | | $37,067 | | | | $41,879 | | | | $44,082 | |
| 1 | Total return calculations do not include any sales charges. Returns for periods of less than one year are not annualized. |
The accompanying notes are an integral part of these financial statements.
| | | | |
| 14 | | Wells Fargo North Carolina Tax-Free Fund | | Financial highlights |
(For a share outstanding throughout each period)
| | | | | | | | | | | | | | | | | | | | | | | | |
| | | Six months ended
December 31, 2016 (unaudited) | | | Year ended June 30 | |
| CLASS C | | | 2016 | | | 2015 | | | 2014 | | | 2013 | | | 2012 | |
Net asset value, beginning of period | | | $10.60 | | | | $10.36 | | | | $10.33 | | | | $10.08 | | | | $10.34 | | | | $9.71 | |
Net investment income | | | 0.11 | | | | 0.24 | | | | 0.24 | | | | 0.26 | | | | 0.24 | | | | 0.26 | |
Net realized and unrealized gains (losses) on investments | | | (0.51 | ) | | | 0.24 | | | | 0.03 | | | | 0.25 | | | | (0.26 | ) | | | 0.63 | |
| | | | | | | | | | | | | | | | | | | | | | | | |
Total from investment operations | | | (0.40 | ) | | | 0.48 | | | | 0.27 | | | | 0.51 | | | | (0.02 | ) | | | 0.89 | |
Distributions to shareholders from | | | | | | | | | | | | | | | | | | | | | | | | |
Net investment income | | | (0.11 | ) | | | (0.24 | ) | | | (0.24 | ) | | | (0.26 | ) | | | (0.24 | ) | | | (0.26 | ) |
Net asset value, end of period | | | $10.09 | | | | $10.60 | | | | $10.36 | | | | $10.33 | | | | $10.08 | | | | $10.34 | |
Total return1 | | | (3.80 | )% | | | 4.65 | % | | | 2.58 | % | | | 5.13 | % | | | (0.24 | )% | | | 9.27 | % |
Ratios to average net assets (annualized) | | | | | | | | | | | | | | | | | | | | | | | | |
Gross expenses | | | 1.71 | % | | | 1.71 | % | | | 1.69 | % | | | 1.69 | % | | | 1.66 | % | | | 1.65 | % |
Net expenses | | | 1.60 | % | | | 1.60 | % | | | 1.60 | % | | | 1.60 | % | | | 1.60 | % | | | 1.60 | % |
Net investment income | | | 2.08 | % | | | 2.25 | % | | | 2.26 | % | | | 2.56 | % | | | 2.31 | % | | | 2.59 | % |
Supplemental data | | | | | | | | | | | | | | | | | | | | | | | | |
Portfolio turnover rate | | | 7 | % | | | 7 | % | | | 12 | % | | | 15 | % | | | 15 | % | | | 48 | % |
Net assets, end of period (000s omitted) | | | $5,572 | | | | $6,121 | | | | $4,431 | | | | $4,566 | | | | $5,164 | | | | $5,523 | |
| 1 | Total return calculations do not include any sales charges. Returns for periods of less than one year are not annualized. |
The accompanying notes are an integral part of these financial statements.
| | | | | | |
| Financial highlights | | Wells Fargo North Carolina Tax-Free Fund | | | 15 | |
(For a share outstanding throughout each period)
| | | | | | | | | | | | | | | | | | | | | | | | |
| | | Six months ended
December 31, 2016 (unaudited) | | | Year ended June 30 | |
| INSTITUTIONAL CLASS | | | 2016 | | | 2015 | | | 2014 | | | 2013 | | | 2012 | |
Net asset value, beginning of period | | | $10.60 | | | | $10.36 | | | | $10.33 | | | | $10.08 | | | | $10.34 | | | | $9.71 | |
Net investment income | | | 0.17 | 1 | | | 0.35 | | | | 0.35 | | | | 0.36 | | | | 0.35 | | | | 0.37 | |
Net realized and unrealized gains (losses) on investments | | | (0.51 | ) | | | 0.24 | | | | 0.03 | | | | 0.26 | | | | (0.26 | ) | | | 0.63 | |
| | | | | | | | | | | | | | | | | | | | | | | | |
Total from investment operations | | | (0.34 | ) | | | 0.59 | | | | 0.38 | | | | 0.62 | | | | 0.09 | | | | 1.00 | |
Distributions to shareholders from | | | | | | | | | | | | | | | | | | | | | | | | |
Net investment income | | | (0.17 | ) | | | (0.35 | ) | | | (0.35 | ) | | | (0.37 | ) | | | (0.35 | ) | | | (0.37 | ) |
Net asset value, end of period | | | $10.09 | | | | $10.60 | | | | $10.36 | | | | $10.33 | | | | $10.08 | | | | $10.34 | |
Total return2 | | | (3.28 | )% | | | 5.76 | % | | | 3.67 | % | | | 6.25 | % | | | 0.82 | % | | | 10.43 | % |
Ratios to average net assets (annualized) | | | | | | | | | | | | | | | | | | | | | | | | |
Gross expenses | | | 0.63 | % | | | 0.63 | % | | | 0.61 | % | | | 0.61 | % | | | 0.58 | % | | | 0.57 | % |
Net expenses | | | 0.54 | % | | | 0.54 | % | | | 0.54 | % | | | 0.54 | % | | | 0.54 | % | | | 0.54 | % |
Net investment income | | | 3.14 | % | | | 3.32 | % | | | 3.32 | % | | | 3.61 | % | | | 3.37 | % | | | 3.65 | % |
Supplemental data | | | | | | | | | | | | | | | | | | | | | | | | |
Portfolio turnover rate | | | 7 | % | | | 7 | % | | | 12 | % | | | 15 | % | | | 15 | % | | | 48 | % |
Net assets, end of period (000s omitted) | | | $43,231 | | | | $62,793 | | | | $60,844 | | | | $72,479 | | | | $77,926 | | | | $90,439 | |
| 1 | Calculated based upon average shares outstanding |
| 2 | Returns for periods of less than one year are not annualized. |
The accompanying notes are an integral part of these financial statements.
| | | | |
| 16 | | Wells Fargo North Carolina Tax-Free Fund | | Notes to financial statements (unaudited) |
1. ORGANIZATION
Wells Fargo Funds Trust (the “Trust”), a Delaware statutory trust organized on March 10, 1999, is an open-end management investment company registered under the Investment Company Act of 1940, as amended (the “1940 Act”). As an investment company, the Trust follows the accounting and reporting guidance in Financial Accounting Standards Board (“FASB”) Accounting Standards Codification Topic 946, Financial Services – Investment Companies. These financial statements report on the Wells Fargo North Carolina Tax-Free Fund (the “Fund”) which is a non-diversified series of the Trust.
2. SIGNIFICANT ACCOUNTING POLICIES
The following significant accounting policies, which are consistently followed in the preparation of the financial statements of the Fund, are in conformity with U.S. generally accepted accounting principles which require management to make estimates and assumptions that affect the reported amounts of assets and liabilities, disclosure of contingent assets and liabilities at the date of the financial statements, and the reported amounts of revenues and expenses during the reporting period. Actual results could differ from those estimates.
Securities valuation
All investments are valued each business day as of the close of regular trading on the New York Stock Exchange (generally 4 p.m. Eastern Time), although the Fund may deviate from this calculation time under unusual or unexpected circumstances.
Debt securities are valued at the evaluated bid price provided by an independent pricing service or, if a reliable price is not available, the quoted bid price from an independent broker-dealer.
Investments in registered open-end investment companies are valued at net asset value.
Investments which are not valued using any of the methods discussed above are valued at their fair value, as determined in good faith by the Board of Trustees of the Fund. The Board of Trustees has established a Valuation Committee comprised of the Trustees and has delegated to it the authority to take any actions regarding the valuation of portfolio securities that the Valuation Committee deems necessary or appropriate, including determining the fair value of portfolio securities, unless the determination has been delegated to the Management Valuation Team of Wells Fargo Funds Management, LLC (“Funds Management”). The Board of Trustees retains the authority to make or ratify any valuation decisions or approve any changes to the Valuation Procedures as it deems appropriate. On a quarterly basis, the Board of Trustees receives reports on any valuation actions taken by the Valuation Committee or the Management Valuation Team which may include items for ratification.
Valuations of fair valued securities are compared to the next actual sales price when available, or other appropriate market values, to assess the continued appropriateness of the fair valuation methodologies used. These securities are fair valued on a day-to-day basis, taking into consideration changes to appropriate market information and any significant changes to the inputs considered in the valuation process until there is a readily available price provided on an exchange or by an independent pricing service. Valuations received from an independent pricing service or independent broker-dealer quotes are periodically validated by comparisons to most recent trades and valuations provided by other independent pricing services in addition to the review of prices by the manager and/or subadviser. Unobservable inputs used in determining fair valuations are identified based on the type of security, taking into consideration factors utilized by market participants in valuing the investment, knowledge about the issuer and the current market environment.
Security transactions and income recognition
Securities transactions are recorded on a trade date basis. Realized gains or losses are recorded on the basis of identified cost.
Interest income is accrued daily and bond discounts are accreted and premiums are amortized daily based on the effective interest method. To the extent debt obligations are placed on non-accrual status, any related interest income may be reduced by writing off interest receivables when the collection of all or a portion of interest has become doubtful based on consistently applied procedures. If the issuer subsequently resumes interest payments or when the collectability of interest is reasonably assured, the debt obligation is removed from non-accrual status.
Distributions to shareholders
Distributions to shareholders from net investment income are accrued daily and paid monthly. Distributions from net realized gains, if any, are recorded on the ex-dividend date. Such distributions are determined in conformity with federal income tax regulations, which may differ in amount or character from net investment income and realized gains recognized for purposes of U.S. generally accepted accounting principles.
| | | | | | |
| Notes to financial statements (unaudited) | | Wells Fargo North Carolina Tax-Free Fund | | | 17 | |
Federal and other taxes
The Fund intends to continue to qualify as a regulated investment company by distributing substantially all of its investment company taxable income and any net realized capital gains (after reduction for capital loss carryforwards) sufficient to relieve it from all, or substantially all, federal income taxes. Accordingly, no provision for federal income taxes was required.
The Fund’s income and federal excise tax returns and all financial records supporting those returns for the prior three fiscal years are subject to examination by the federal and Delaware revenue authorities. Management has analyzed the Fund’s tax positions taken on federal, state, and foreign tax returns for all open tax years and does not believe that there are any uncertain tax positions that require recognition of a tax liability.
Capital loss carryforwards that do not expire are required to be utilized prior to capital loss carryforwards that expire. As of June 30, 2016, capital loss carryforwards available to offset future net realized capital gains were as follows through the indicated expiration dates:
| | | | |
| | | | | No expiration |
| 2017 | | 2018 | | Short-term |
| $6,610,328 | | $3,623,438 | | $21,451 |
As of June 30, 2016, the Fund had current year deferred post-October capital losses consisting of $34,248 in short-term losses which were be recognized on the first day of the current fiscal year.
Class allocations
The separate classes of shares offered by the Fund differ principally in applicable sales charges, distribution, shareholder servicing, and administration fees. Class specific expenses are charged directly to that share class. Investment income, common expenses, and realized and unrealized gains (losses) on investments are allocated daily to each class of shares based on the relative proportion of net assets of each class.
3. FAIR VALUATION MEASUREMENTS
Fair value measurements of investments are determined within a framework that has established a fair value hierarchy based upon the various data inputs utilized in determining the value of the Fund’s investments. The three-level hierarchy gives the highest priority to unadjusted quoted prices in active markets for identical assets or liabilities (Level 1) and the lowest priority to significant unobservable inputs (Level 3). The Fund’s investments are classified within the fair value hierarchy based on the lowest level of input that is significant to the fair value measurement. The inputs are summarized into three broad levels as follows:
| ∎ | | Level 1 – quoted prices in active markets for identical securities |
| ∎ | | Level 2 – other significant observable inputs (including quoted prices for similar securities, interest rates, prepayment speeds, credit risk, use of amortized cost, etc.) |
| ∎ | | Level 3 – significant unobservable inputs (including the Fund’s own assumptions in determining the fair value of investments) |
The inputs or methodologies used for valuing investments in securities are not necessarily an indication of the risk associated with investing in those securities.
The following is a summary of the inputs used in valuing the Fund’s assets and liabilities as of December 31, 2016:
| | | | | | | | | | | | | | | | |
| | | Quoted prices
(Level 1) | | | Other significant
observable inputs
(Level 2) | | | Significant
unobservable inputs
(Level 3) | | | Total | |
Assets | | | | | | | | | | | | | | | | |
Investments in: | | | | | | | | | | | | | | | | |
| | | | |
Municipal obligations | | $ | 0 | | | $ | 79,544,219 | | | $ | 0 | | | $ | 79,544,219 | |
| | | | |
Short-term investments | | | | | | | | | | | | | | | | |
Investment companies | | | 352,393 | | | | 0 | | | | 0 | | | | 352,393 | |
Total assets | | $ | 352,393 | | | $ | 79,544,219 | | | $ | 0 | | | $ | 79,896,612 | |
| | | | |
| 18 | | Wells Fargo North Carolina Tax-Free Fund | | Notes to financial statements (unaudited) |
The Fund recognizes transfers between levels within the fair value hierarchy at the end of the reporting period. At December 31, 2016, the Fund did not have any transfers into/out of Level 1, Level 2, or Level 3.
4. TRANSACTIONS WITH AFFILIATES AND OTHER EXPENSES
Management fee
Funds Management, an indirect wholly owned subsidiary of Wells Fargo & Company (“Wells Fargo”), is the manager of the Fund and provides advisory and fund-level administrative services under an investment management agreement. Under the investment management agreement, Funds Management is responsible for, among other services, implementing the investment objectives and strategies of the Fund, supervising the subadviser, providing fund-level administrative services in connection with the Fund’s operations, and providing any other fund-level administrative services reasonably necessary for the operation of the Fund. As compensation for its services under the investment management agreement, Funds Management is entitled to receive an annual management fee starting at 0.40% and declining to 0.28% as the average daily net assets of the Fund increase. For the six months ended December 31, 2016, the management fee was equivalent to an annual rate of 0.40% of the Fund’s average daily net assets.
Funds Management has retained the services of a subadviser to provide daily portfolio management to the Fund. The fee for subadvisory services is borne by Funds Management. Wells Capital Management Incorporated, an affiliate of Funds Management and an indirect wholly owned subsidiary of Wells Fargo, is the subadviser to the Fund and is entitled to receive a fee from Funds Management at an annual rate starting at 0.20% and declining to 0.10% as the average daily net assets of the Fund increase.
Administration fees
Under a class-level administration agreement, Funds Management provides class-level administrative services to the Fund, which includes paying fees and expenses for services provided by the transfer agent, sub-transfer agents, omnibus account servicers and record-keepers. As compensation for its services under the class-level administration agreement, Funds Management receives an annual fee which is calculated based on the average daily net assets of each class as follows:
| | | | |
| | | Class-level
administration fee | |
Class A, Class C | | | 0.16 | % |
Institutional Class | | | 0.08 | |
Funds Management has contractually waived and/or reimbursed management and administration fees to the extent necessary to maintain certain net operating expense ratios for the Fund. Waiver of fees and/or reimbursement of expenses by Funds Management were made first from fund level expenses on a proportionate basis and then from class specific expenses. Funds Management has committed through October 31, 2017 to waive fees and/or reimburse expenses to the extent necessary to cap the Fund’s expenses at 0.85% for Class A shares, 1.60% for Class C shares, and 0.54% for Institutional Class shares. After this time, the cap may be increased or the commitment to maintain the cap may be terminated only with the approval of the Board of Trustees.
During the six months ended December 31, 2016, State Street Bank and Trust Company, the Fund’s custodian, reimbursed the Fund $5,341 for certain out-of-pocket expenses that were billed to the Fund in error from 1998-2015. This amount is included in interest income on the Statement of Operations. In addition, Funds Management was also reimbursed $4,307 for waivers/reimbursements it made to the Fund during the period the Fund was erroneously billed.
Distribution fee
The Trust has adopted a distribution plan for Class C shares of the Fund pursuant to Rule 12b-1 under the 1940 Act. A distribution fee is charged to Class C shares and paid to Wells Fargo Funds Distributor, LLC (“Funds Distributor”), the principal underwriter, at an annual rate of 0.75% of the average daily net assets of Class C shares.
In addition, Funds Distributor is entitled to receive the front-end sales charge from the purchase of Class A shares and a contingent deferred sales charge on the redemption of certain Class A shares. Funds Distributor is also entitled to receive the contingent deferred sales charges from redemptions of Class C shares. For the six months ended December 31, 2016, Funds Distributor received $212 from the sale of Class A shares.
Shareholder servicing fees
The Trust has entered into contracts with one or more shareholder servicing agents, whereby Class A and Class C of the Fund are charged a fee at an annual rate of 0.25% of the average daily net assets of each respective class.
| | | | | | |
| Notes to financial statements (unaudited) | | Wells Fargo North Carolina Tax-Free Fund | | | 19 | |
A portion of these total shareholder servicing fees were paid to affiliates of Wells Fargo.
5. INVESTMENT PORTFOLIO TRANSACTIONS
Purchases and sales of investments, excluding U.S. government obligations (if any) and short-term securities, for the six months ended December 31, 2016 were $7,041,420 and $21,186,781, respectively.
The Fund may purchase or sell investment securities to other Wells Fargo funds under procedures adopted by the Board of Trustees. The procedures have been designed to ensure that these interfund transactions, which generally do not incur broker commissions, are effected at current market prices. Interfund trades are included within the respective purchases and sales amounts shown.
6. BANK BORROWINGS
The Trust (excluding the money market funds and certain other funds) and Wells Fargo Variable Trust are parties to a $250,000,000 revolving credit agreement whereby the Fund is permitted to use bank borrowings for temporary or emergency purposes, such as to fund shareholder redemption requests. Interest under the credit agreement is charged to the Fund based on a borrowing rate equal to the higher of the Federal Funds rate in effect on that day plus 1.25% or the overnight LIBOR rate in effect on that day plus 1.25%. In addition, an annual commitment fee equal to 0.25% of the unused balance is allocated to each participating fund. Prior to August 30, 2016, the revolving credit agreement amount was $200,000,000 and the annual commitment fee was equal to 0.20% of the unused balance which was allocated to each participating fund.
For the six months ended December 31, 2016, there were no borrowings by the Fund under the agreement.
7. CONCENTRATION RISK
The Fund invests a substantial portion of its assets in issuers of municipal debt securities located in a single state or territories of the U.S. Therefore, it may be more affected by economic and political developments in that state or region than would be a comparable general tax-exempt fund.
8. INDEMNIFICATION
Under the Trust’s organizational documents, the officers and Trustees have been granted certain indemnification rights against certain liabilities that may arise out of performance of their duties to the Trust. Additionally, in the normal course of business, the Trust may enter into contracts with service providers that contain a variety of indemnification clauses. The Trust’s maximum exposure under these arrangements is dependent on future claims that may be made against the Fund and, therefore, cannot be estimated.
9. REGULATORY CHANGES
In October 2016, the Securities and Exchange Commission (“SEC”) adopted new rules and forms and amended existing rules and forms (together, “final rules”) intended to modernize and enhance the reporting and disclosure of information by registered investment companies and to enhance liquidity risk management by open-end mutual funds and exchange-traded funds. The final rules will enhance the quality of information available to investors and will allow the SEC to more effectively collect and use data reported by funds. In part, the final rules amend Regulation S-X and require standardized, enhanced disclosure about derivatives in the Fund’s financial statements, as well as other amendments. The compliance date for the amendments to Regulation S-X is August 1, 2017 while the compliance date for the new form types is June 1, 2018 and the compliance date for the liquidity risk management program requirements is December 1, 2018. Management is currently assessing the potential impact of these enhancements and their impact on the financial statement disclosures and reporting requirements.
| | | | |
| 20 | | Wells Fargo North Carolina Tax-Free Fund | | Other information (unaudited) |
PROXY VOTING INFORMATION
A description of the policies and procedures that the Fund uses to determine how to vote proxies relating to portfolio securities is available, upon request, by calling 1-800-222-8222, visiting our website at wellsfargofunds.com, or visiting the SEC website at sec.gov. Information regarding how the Fund voted proxies relating to portfolio securities during the most recent 12-month period ended June 30 is available on the Fund’s website at wellsfargofunds.com or by visiting the SEC website at sec.gov.
PORTFOLIO HOLDINGS INFORMATION
The complete portfolio holdings for the Fund are publicly available monthly on the Fund’s website (wellsfargofunds.com), on a one-month delayed basis. In addition, top ten holdings information (excluding derivative positions) for the Fund is publicly available on the Fund’s website on a monthly, seven-day or more delayed basis. The Fund files its complete schedule of portfolio holdings with the SEC for the first and third quarters of each fiscal year on Form N-Q, which is available by visiting the SEC website at sec.gov. In addition, the Fund’s Form N-Q may be reviewed and copied at the SEC’s Public Reference Room in Washington, DC, and at regional offices in New York City, at 233 Broadway, and in Chicago, at 175 West Jackson Boulevard, Suite 900. Information about the Public Reference Room may be obtained by calling 1-800-SEC-0330.
| | | | | | |
| Other information (unaudited) | | Wells Fargo North Carolina Tax-Free Fund | | | 21 | |
BOARD OF TRUSTEES AND OFFICERS
Each of the Trustees and Officers1 listed in the table below acts in identical capacities for each fund in the Wells Fargo family of funds, which consists of 139 mutual funds comprising the Wells Fargo Funds Trust, Wells Fargo Variable Trust, Wells Fargo Master Trust and four closed-end funds (collectively the “Fund Complex”). This table should be read in conjunction with the Prospectus and the Statement of Additional Information2. The mailing address of each Trustee and Officer is 525 Market Street, 12th Floor, San Francisco, CA 94105. Each Trustee and Officer serves an indefinite term, however, each Trustee serves such term until reaching the mandatory retirement age established by the Trustees.
Independent Trustees
| | | | | | |
Name and
year of birth | | Position held and
length of service* | | Principal occupations during past five years or longer | | Current other
public company or
investment company
directorships |
William R. Ebsworth (Born 1957) | | Trustee, since 2015 | | Retired. From 1984 to 2013, equities analyst, portfolio manager, research director and chief financial officer at Fidelity Management and Research Company in Boston, Tokyo, and Hong Kong and retired in 2013 as Chief Investment Officer of Fidelity Strategic Advisers, Inc. where he lead a team of investment professionals managing client assets. Prior thereto, Board member of Hong Kong Securities Clearing Co., Hong Kong Options Clearing Corp., the Thailand International Fund, Ltd., Fidelity Investments Life Insurance Company, and Empire Fidelity Investments Life Insurance Company. Board member of the Fonté Foundation (non-profit organization) and the Vincent Memorial Hospital Endowment (non-profit organization), where he serves on the Investment Committee and as a Chair of the Audit Committee. Mr. Ebsworth is a CFA® charterholder and an Adjunct Lecturer, Finance, at Babson College. | | Asset Allocation Trust |
Jane A. Freeman (Born 1953) | | Trustee, since 2015 | | Retired. From 2012 to 2014 and 1999 to 2008, Chief Financial Officer of Scientific Learning Corporation. From 2008 to 2012, Ms. Freeman provided consulting services related to strategic business projects. Prior to 1999, Portfolio Manager at Rockefeller & Co. and Scudder, Stevens & Clark. Board member of the Harding Loevner Funds from 1996 to 2014, serving as both Lead Independent Director and chair of the Audit Committee. Board member of the Russell Exchange Traded Funds Trust from 2011 to 2012 and the chair of the Audit Committee. Ms. Freeman is a Board Member of Ruth Bancroft Garden (non-profit organization) and an inactive chartered financial analyst. | | Asset Allocation Trust |
Peter G. Gordon** (Born 1942) | | Trustee, since 1998; Chairman, since 2005 | | Co-Founder, Retired Chairman, President and CEO of Crystal Geyser Water Company. Trustee Emeritus, Colby College. | | Asset Allocation Trust |
Isaiah Harris, Jr. (Born 1952) | | Trustee, since 2009 | | Retired. Chairman of the Board of CIGNA Corporation since 2009, and Director since 2005. From 2003 to 2011, Director of Deluxe Corporation. Prior thereto, President and CEO of BellSouth Advertising and Publishing Corp. from 2005 to 2007, President and CEO of BellSouth Enterprises from 2004 to 2005 and President of BellSouth Consumer Services from 2000 to 2003. Emeritus member of the Iowa State University Foundation Board of Governors. Emeritus Member of the Advisory Board of Iowa State University School of Business. Advisory Board Member, Palm Harbor Academy (charter school). Advisory Board Member, Child Evangelism Fellowship (non-profit). Mr. Harris is a certified public accountant (inactive status). | | CIGNA Corporation; Asset Allocation Trust |
Judith M. Johnson (Born 1949) | | Trustee, since 2008; Audit Committee Chairman, since 2008 | | Retired. Prior thereto, Chief Executive Officer and Chief Investment Officer of Minneapolis Employees Retirement Fund from 1996 to 2008. Ms. Johnson is an attorney, certified public accountant and a certified managerial accountant. | | Asset Allocation Trust |
David F. Larcker (Born 1950) | | Trustee, since 2009 | | James Irvin Miller Professor of Accounting at the Graduate School of Business, Stanford University, Director of the Corporate Governance Research Initiative and Senior Faculty of The Rock Center for Corporate Governance since 2006. From 2005 to 2008, Professor of Accounting at the Graduate School of Business, Stanford University. Prior thereto, Ernst & Young Professor of Accounting at The Wharton School, University of Pennsylvania from 1985 to 2005. | | Asset Allocation Trust |
| | | | |
| 22 | | Wells Fargo North Carolina Tax-Free Fund | | Other information (unaudited) |
| | | | | | |
Name and
year of birth | | Position held and
length of service* | | Principal occupations during past five years or longer | | Current other
public company or
investment company
directorships |
Olivia S. Mitchell (Born 1953) | | Trustee, since 2006 | | International Foundation of Employee Benefit Plans Professor, Wharton School of the University of Pennsylvania since 1993. Director of Wharton’s Pension Research Council and Boettner Center on Pensions & Retirement Research, and Research Associate at the National Bureau of Economic Research. Previously, Cornell University Professor from 1978 to 1993. | | Asset Allocation Trust |
Timothy J. Penny (Born 1951) | | Trustee, since 1996 | | President and Chief Executive Officer of Southern Minnesota Initiative Foundation, a non-profit organization, since 2007 and Senior Fellow at the Humphrey Institute Policy Forum at the University of Minnesota since 1995. Member of the Board of Trustees of NorthStar Education Finance, Inc., a non-profit organization, since 2007. | | Asset Allocation Trust |
Michael S. Scofield (Born 1943) | | Trustee, since 2010 | | Served on the Investment Company Institute’s Board of Governors and Executive Committee from 2008-2011 as well the Governing Council of the Independent Directors Council from 2006-2011 and the Independent Directors Council Executive Committee from 2008-2011. Chairman of the IDC from 2008-2010. Institutional Investor (Fund Directions) Trustee of Year in 2007. Trustee of the Evergreen Funds complex (and its predecessors) from 1984 to 2010. Chairman of the Evergreen Funds from 2000-2010. Former Trustee of the Mentor Funds. Retired Attorney, Law Offices of Michael S. Scofield. | | Asset Allocation Trust |
| * | Length of service dates reflect the Trustee’s commencement of service with the Trust’s predecessor entities, where applicable. |
| ** | Peter Gordon is expected to retire on December 31, 2017. |
Officers
| | | | | | |
Name and
year of birth | | Position held and
length of service | | Principal occupations during past five years or longer | | |
Andrew Owen3 (Born 1960) | | President, since 2017 | | Executive Vice President of Wells Fargo Bank, N.A. and President of Wells Fargo & Company and Head of Affiliated Managers, Wells Fargo Asset Management, since 2014. Executive Vice President responsible for marketing, investments and product development for Wells Fargo Funds Management, LLC, from 2009 to 2014. | | |
Nancy Wiser1 (Born 1967) | | Treasurer, since 2012 | | Executive Vice President of Wells Fargo Funds Management, LLC since 2011. Chief Operating Officer and Chief Compliance Officer at LightBox Capital Management LLC, from 2008 to 2011. | | |
C. David Messman (Born 1960) | | Secretary, since 2000; Chief Legal Officer, since 2003 | | Senior Vice President and Secretary of Wells Fargo Funds Management, LLC since 2001. Assistant General Counsel of Wells Fargo Bank, N.A. since 2013 and Vice President and Managing Counsel of Wells Fargo Bank, N.A. from 1996 to 2013. | | |
Michael Whitaker (Born 1967) | | Chief Compliance Officer, since 2016 | | Executive Vice President of Wells Fargo Funds Management, LLC since 2016. Chief Compliance Officer of Fidelity’s Fixed Income Funds and Asset Allocation Funds from 2008 to 2016, Compliance Officer of FMR Co., Inc. from 2014 to 2016, Fidelity Investments Money Management, Inc. from 2014 to 2016, Fidelity Investments from 2007 to 2016. | | |
David Berardi (Born 1975) | | Assistant Treasurer, since 2009 | | Vice President of Wells Fargo Funds Management, LLC since 2009. Vice President of Evergreen Investment Management Company, LLC from 2008 to 2010. Manager of Fund Reporting and Control for Evergreen Investment Management Company, LLC from 2004 to 2010. | | |
Jeremy DePalma1 (Born 1974) | | Assistant Treasurer, since 2009 | | Senior Vice President of Wells Fargo Funds Management, LLC since 2009. Senior Vice President of Evergreen Investment Management Company, LLC from 2008 to 2010 and head of the Fund Reporting and Control Team within Fund Administration from 2005 to 2010. | | |
| 1 | Nancy Wiser acts as Treasurer of 70 funds in the Fund Complex. Jeremy DePalma acts as Treasurer of 69 funds and Assistant Treasurer of 70 funds in the Fund Complex. |
| 2 | The Statement of Additional Information includes additional information about the Trustees and is available, without charge, upon request, by calling 1-800-222-8222 or by visiting the website at wellsfargofunds.com. |
| 3 | Andrew Owen became President on January 1, 2017. |
| | | | | | |
| List of abbreviations | | Wells Fargo North Carolina Tax-Free Fund | | | 23 | |
The following is a list of common abbreviations for terms and entities that may have appeared in this report.
| ACA | — ACA Financial Guaranty Corporation |
| ADR | — American depositary receipt |
| ADS | — American depositary shares |
| AGC | — Assured Guaranty Corporation |
| AGM | — Assured Guaranty Municipal |
| Ambac | — Ambac Financial Group Incorporated |
| AMT | — Alternative minimum tax |
| BAN | — Bond anticipation notes |
| BHAC | — Berkshire Hathaway Assurance Corporation |
| CAB | — Capital appreciation bond |
| CCAB | — Convertible capital appreciation bond |
| CDA | — Community Development Authority |
| CDO | — Collateralized debt obligation |
| DRIVER | — Derivative inverse tax-exempt receipts |
| DW&P | — Department of Water & Power |
| DWR | — Department of Water Resources |
| ECFA | — Educational & Cultural Facilities Authority |
| EDA | — Economic Development Authority |
| EDFA | — Economic Development Finance Authority |
| ETF | — Exchange-traded fund |
| FDIC | — Federal Deposit Insurance Corporation |
| FFCB | — Federal Farm Credit Banks |
| FGIC | — Financial Guaranty Insurance Corporation |
| FHA | — Federal Housing Administration |
| FHLB | — Federal Home Loan Bank |
| FHLMC | — Federal Home Loan Mortgage Corporation |
| FICO | — The Financing Corporation |
| FNMA | — Federal National Mortgage Association |
| GDR | — Global depositary receipt |
| GNMA | — Government National Mortgage Association |
| HCFR | — Healthcare facilities revenue |
| HEFA | — Health & Educational Facilities Authority |
| HEFAR | — Higher education facilities authority revenue |
| HFA | — Housing Finance Authority |
| HFFA | — Health Facilities Financing Authority |
| HUD | — Department of Housing and Urban Development |
| IDA | — Industrial Development Authority |
| IDAG | — Industrial Development Agency |
| KRW | — Republic of Korea won |
| LIBOR | — London Interbank Offered Rate |
| LIFER | — Long Inverse Floating Exempt Receipts |
| LLC | — Limited liability company |
| LLLP | — Limited liability limited partnership |
| LLP | — Limited liability partnership |
| MBIA | — Municipal Bond Insurance Association |
| MFHR | — Multifamily housing revenue |
| MSTR | — Municipal securities trust receipts |
| MUD | — Municipal Utility District |
| National | — National Public Finance Guarantee Corporation |
| PCFA | — Pollution Control Financing Authority |
| PCL | — Public Company Limited |
| PCR | — Pollution control revenue |
| PFA | — Public Finance Authority |
| PFFA | — Public Facilities Financing Authority |
| PFOTER | — Puttable floating option tax-exempt receipts |
| plc | — Public limited company |
| PUTTER | — Puttable tax-exempt receipts |
| R&D | — Research & development |
| Radian | — Radian Asset Assurance |
| RAN | — Revenue anticipation notes |
| RDA | — Redevelopment Authority |
| RDFA | — Redevelopment Finance Authority |
| REIT | — Real estate investment trust |
| ROC | — Reset option certificates |
| SAVRS | — Select auction variable rate securities |
| SBA | — Small Business Authority |
| SDR | — Swedish depositary receipt |
| SFHR | — Single-family housing revenue |
| SFMR | — Single-family mortgage revenue |
| SPA | — Standby purchase agreement |
| SPDR | — Standard & Poor’s Depositary Receipts |
| SPEAR | — Short Puttable Exempt Adjustable Receipts |
| STRIPS | — Separate trading of registered interest and |
| TAN | — Tax anticipation notes |
| TIPS | — Treasury inflation-protected securities |
| TRAN | — Tax revenue anticipation notes |
| TTFA | — Transportation Trust Fund Authority |
| TVA | — Tennessee Valley Authority |
This page is intentionally left blank.

For more information
More information about Wells Fargo Funds is available free upon request. To obtain literature, please write, email, visit the Fund’s website, or call:
Wells Fargo Funds
P.O. Box 8266
Boston, MA 02266-8266
Email: fundservice@wellsfargo.com
Website: wellsfargofunds.com
Individual investors: 1-800-222-8222
Retail investment professionals: 1-888-877-9275
Institutional investment professionals: 1-866-765-0778
This report and the financial statements contained herein are submitted for the general information of the shareholders of the Fund. If this report is used for promotional purposes, distribution of the report must be accompanied or preceded by a current prospectus. Before investing, please consider the investment objectives, risks, charges, and expenses of the investment. For a current prospectus and, if available, a summary prospectus, containing this information, call 1-800-222-8222 or visit the Fund’s website at wellsfargofunds.com. Read the prospectus carefully before you invest or send money.
Wells Fargo Asset Management (WFAM) is a trade name used by the asset management businesses of Wells Fargo & Company. Wells Fargo Funds Management, LLC, a wholly owned subsidiary of Wells Fargo & Company, provides investment advisory and administrative services for Wells Fargo Funds. Other affiliates of Wells Fargo & Company provide subadvisory and other services for the funds. The funds are distributed by Wells Fargo Funds Distributor, LLC, Member FINRA, an affiliate of Wells Fargo & Company. Neither Wells Fargo Funds Management nor Wells Fargo Funds Distributor has Fund customer accounts/assets, and neither provides investment advice/recommendations or acts as an investment advice fiduciary to any investor.
NOT FDIC INSURED ◾ NO BANK GUARANTEE ◾ MAY LOSE VALUE
© 2016 Wells Fargo Funds Management, LLC. All rights reserved.
| | |
 | | 300483 02-17 SA254/SAR254 12-16 |
Semi-Annual Report
December 31, 2016

Wells Fargo
Pennsylvania Tax-Free Fund


Reduce clutter. Save trees.
Sign up for electronic delivery of prospectuses and shareholder reports at wellsfargo.com/advantagedelivery
Contents
The views expressed and any forward-looking statements are as of December 31, 2016, unless otherwise noted, and are those of the Fund managers and/or Wells Fargo Funds Management, LLC. Discussions of individual securities, or the markets generally, or any Wells Fargo Fund are not intended as individual recommendations. Future events or results may vary significantly from those expressed in any forward-looking statements. The views expressed are subject to change at any time in response to changing circumstances in the market. Wells Fargo Funds Management, LLC and the Fund disclaim any obligation to publicly update or revise any views expressed or forward-looking statements.
NOT FDIC INSURED ◾ NO BANK GUARANTEE ◾ MAY LOSE VALUE
| | | | |
| 2 | | Wells Fargo Pennsylvania Tax-Free Fund | | Letter to shareholders (unaudited) |

Andrew Owen
President
Wells Fargo Funds
The Bloomberg Barclays Municipal Bond Index,1 a broad measure tracking investment-grade municipal bonds, lost 3.91% during the six-month reporting period.
Dear Shareholder:
As the new president of Wells Fargo Funds now that Karla Rabusch is retiring from that position after nearly 14 years, I am pleased to offer you this semi-annual report for the Wells Fargo Pennsylvania Tax-Free Fund for the six-month period that ended December 31, 2016. The Federal Reserve (Fed) raised the federal funds rate in December by 0.25%. Municipal bond yields rose sharply in the fourth quarter. The Bloomberg Barclays Municipal Bond Index,1 a broad measure tracking investment-grade municipal bonds, lost 3.91% during the six-month reporting period.
Municipal bond yields rose during the reporting period.
The municipal market reversed course in the second half of 2016, with yields increasing and prices declining. Initially the sell-off was driven by negative supply and demand trends, also known as technical factors. By the fourth quarter, fund flows turned negative (reversing a trend of 54 weeks of positive flows) and municipal bond supply increased. These deteriorating technical factors, along with the expectation of an expansionary fiscal policy and lower tax rates under the new administration, drove market volatility; credit spreads widened and the yield curve steepened as the market sold-off.
Stronger economic indicators drove monetary policy.
On December 14, the Fed hiked the short-term interest rate by 0.25% to reach a target range of 0.50% to 0.75%. This was the second rate increase in more than 10 years, with the Fed citing job gains and lower than expected unemployment of 4.6%. The Fed confirmed the continuation of an accommodative monetary policy to support a stronger labor market and reiterated its long-term objective of a 2% inflation rate, which increased slightly during the fourth quarter but fell short of the benchmark. The Fed expressed confidence in the economy’s progress and expects this positive trajectory to continue. Both sentiments helped to bolster the Fed’s expectation of three additional rate increases during 2017.
Meanwhile, the Bank of England continued its quantitative-easing program and lowered the official bank rate to 0.25% in August 2016. The Bank of Japan maintained its negative interest rate put in place earlier in the year, and in September announced an interest rate target for 10-year government bonds—keeping the yield at zero—as it struggles to accelerate economic growth. In December, the European Central Bank announced that it will extend its quantitative-easing program and continue purchasing large amounts of eurozone corporate and government debt each month through December 2017.
U.S. economic data released during the fourth quarter showed that U.S. real gross domestic product increased at an annual 3.5% rate in the third quarter, the largest increase since mid-2014. Business investment by U.S. companies was mixed, with a 12.0% increase in structures and 4.5% decrease in equipment over the prior quarter on an annualized basis. Consumer confidence hit pre-recession levels for the first time in November, and increased again in December. The dollar strengthened during the quarter’s post-election period.
Supply and demand trends reflected volatility of municipals.
Demand for municipal debt, as measured by cash flows to municipal bond mutual funds, was negative for the reporting period. There were $19 billion of inflows from July through October, but a sharp reversal occurred post-election, with $26 billion of redemptions in the last two months of the year. This followed a
| 1 | The Bloomberg Barclays Municipal Bond Index (formerly known as Barclays Municipal Bond Index) is an unmanaged index composed of long-term tax-exempt bonds with a minimum credit rating of Baa. You cannot invest directly in an index. |
| | | | | | |
| Letter to shareholders (unaudited) | | Wells Fargo Pennsylvania Tax-Free Fund | | | 3 | |
noteworthy 54 consecutive weeks of inflows. On the supply side, August through October saw 30-year record-breaking volumes each month; both refundings and new issuance were up. These levels were attributed to deals pulled forward in anticipation of higher interest rates. Not surprisingly, December volume was down 25% year-over-year to $19 billion. Total municipal bond issuance for the period was $219 billion; new issuance outpaced refundings by $18 billion.
Municipal credit fundamentals were solid.
Overall, municipal credit was sound for the period. The most significant development was the election of Ricardo Rossello as governor of the Commonwealth of Puerto Rico. In the past, prices of Puerto Rico bonds reflected negative credit considerations, including defaults on its securities in 2015 and early 2016, but recent events point to a potentially more positive fiscal environment. Rossello campaigned, in part, on a platform that included promises to ultimately pay 100% of interest due on Puerto Rico’s outstanding municipal debt, negotiate with bondholders, and ration government expenditures. This stance is a major shift from his predecessor who focused on a bankruptcy mechanism.
Since the end of the financial crisis, structural changes in the fixed-income markets have reduced trading liquidity (the degree to which assets can be bought or sold without affecting the price). New regulations and capital requirements have caused traditional liquidity suppliers (banks and broker/dealers) to be more risk averse and hold less inventory. Meanwhile, corporate debt issuance has spiked as companies finance themselves at record-low yields, bond mutual funds hold larger amounts of this new debt supply, trading volumes are lower, and large-size trades are more difficult to execute. However, fixed-income markets appeared to function well over the past year with sufficient liquidity.
Don’t let short-term uncertainty derail long-term investment goals.
Periods of uncertainty can present challenges, but experience has taught us that maintaining long-term investment goals can be an effective way to plan for the future. To help you create a sound strategy based on your personal goals and risk tolerance, Wells Fargo Funds offers more than 100 mutual funds spanning a wide range of asset classes and investment styles. Although diversification cannot guarantee an investment profit or prevent losses, we believe it can be an effective way to manage investment risk and potentially smooth out overall portfolio performance. We encourage investors to know their investments and to understand that appropriate levels of risk-taking may unlock opportunities.
Thank you for choosing to invest in Wells Fargo Funds. We appreciate your confidence in us and remain committed to helping you meet your financial needs.
Sincerely,

Andrew Owen
President
Wells Fargo Funds
Periods of uncertainty can present challenges, but experience has taught us that maintaining long-term investment goals can be an effective way to plan for the future.
For further information about your Fund, contact your investment professional, visit our website at wellsfargofunds.com, or call us directly at 1-800-222-8222. We are available 24 hours a day, 7 days a week.
| | | | |
| 4 | | Wells Fargo Pennsylvania Tax-Free Fund | | Performance highlights (unaudited) |
Investment objective
The Fund seeks current income exempt from federal income tax and Pennsylvania individual income tax.
Manager
Wells Fargo Funds Management, LLC
Subadviser
Wells Capital Management Incorporated
Portfolio managers
Bruce R. Johns
Robert J. Miller
Average annual total returns (%) as of December 31, 20161
| | | | | | | | | | | | | | | | | | | | | | | | | | | | | | | | | | |
| | | | | Including sales charge | | | Excluding sales charge | | | Expense ratios2 (%) | |
| | | Inception date | | 1 year | | | 5 year | | | 10 year | | | 1 year | | | 5 year | | | 10 year | | | Gross | | | Net3 | |
| Class A (EKVAX) | | 12-27-1990 | | | (4.98 | ) | | | 2.85 | | | | 3.59 | | | | (0.51 | ) | | | 3.79 | | | | 4.06 | | | | 0.90 | | | | 0.74 | |
| Class C (EKVCX) | | 2-1-1993 | | | (2.26 | ) | | | 3.03 | | | | 3.29 | | | | (1.26 | ) | | | 3.03 | | | | 3.29 | | | | 1.65 | | | | 1.49 | |
| Institutional Class (EKVYX) | | 11-24-1997 | | | – | | | | – | | | | – | | | | (0.26 | ) | | | 4.05 | | | | 4.32 | | | | 0.57 | | | | 0.49 | |
| Bloomberg Barclays Municipal Bond Index4 | | – | | | – | | | | – | | | | – | | | | 0.25 | | | | 3.28 | | | | 4.25 | | | | – | | | | – | |
| Bloomberg Barclays Pennsylvania Municipal Bond Index5 | | – | | | – | | | | – | | | | – | | | | 0.24 | | | | 3.49 | | | | 4.46 | | | | – | | | | – | |
Figures quoted represent past performance, which is no guarantee of future results, and do not reflect taxes that a shareholder may pay on fund distributions or the redemption of fund shares. Investment return and principal value of an investment will fluctuate so that an investor’s shares, when redeemed, may be worth more or less than their original cost. Performance shown without sales charges would be lower if sales charges were reflected. Current performance may be lower or higher than the performance data quoted, which assumes the reinvestment of dividends and capital gains. Current month-end performance is available on the Fund’s website, wellsfargofunds.com.
Index returns do not include transaction costs associated with buying and selling securities, any mutual fund fees or expenses, or any taxes. It is not possible to invest directly in an index.
For Class A shares, the maximum front-end sales charge is 4.50%. For Class C shares, the maximum contingent deferred sales charge is 1.00%. Performance including a contingent deferred sales charge assumes the sales charge for the corresponding time period. Institutional Class shares are sold without a front-end sales charge or contingent deferred sales charge.
Bond values fluctuate in response to the financial condition of individual issuers, general market and economic conditions, and changes in interest rates. Changes in market conditions and government policies may lead to periods of heightened volatility in the bond market and reduced liquidity for certain bonds held by the Fund. In general, when interest rates rise, bond values fall and investors may lose principal value. Interest-rate changes and their impact on the Fund and its share price can be sudden and unpredictable. The use of derivatives may reduce returns and/or increase volatility. Certain investment strategies tend to increase the total risk of an investment (relative to the broader market). The Fund is exposed to Pennsylvania municipal securities risk and high-yield securities risk. Consult the Fund’s prospectus for additional information on these and other risks. A portion of the Fund’s income may be subject to federal, state, and/or local income taxes or the Alternative Minimum Tax (AMT). Any capital gains distributions may be taxable.
Please see footnotes on page 5.
| | | | | | |
| Performance highlights (unaudited) | | Wells Fargo Pennsylvania Tax-Free Fund | | | 5 | |
|
| Effective maturity distribution as of December 31, 20166 |
|
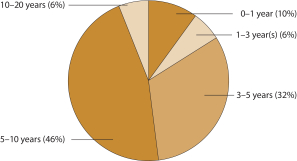
|
|
| Credit quality as of December 31, 20167 |
|
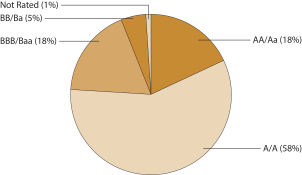 |
| 1 | Historical performance shown for all classes of the Fund prior to July 12, 2010, is based on the performance of the Fund’s predecessor, Evergreen Pennsylvania Municipal Bond Fund. |
| 2 | Reflects the expense ratios as stated in the most recent prospectuses. The expense ratios shown are subject to change and may differ from the annualized expense ratios shown in the financial highlights of this report. |
| 3 | The manager has contractually committed through October 31, 2017, to waive fees and/or reimburse expenses to the extent necessary to cap the Fund’s Total Annual Fund Operating Expenses After Fee Waiver at the amounts shown. After this time, the cap may be increased or the commitment to maintain the cap may be terminated only with the approval of the Board of Trustees. Brokerage commissions, stamp duty fees, interest, taxes, acquired fund fees and expenses, and extraordinary expenses are excluded from the expense cap. Without this cap, the Fund’s returns would have been lower. |
| 4 | The Bloomberg Barclays Municipal Bond Index (formerly known as Barclays Municipal Bond Index) is an unmanaged index composed of long-term tax-exempt bonds with a minimum credit rating of Baa. You cannot invest directly in an index. |
| 5 | The Bloomberg Barclays Pennsylvania Municipal Bond Index (formerly known as Barclays Pennsylvania Municipal Bond Index) is the Pennsylvania component of the Bloomberg Barclays Municipal Bond Index. You cannot invest directly in an index. |
| 6 | Amounts are calculated based on the total investments of the Fund. These amounts are subject to change and may have changed since the date specified. |
| 7 | The credit quality distribution of portfolio holdings reflected in the chart is based on ratings from Standard & Poor’s, Moody’s Investors Service, and/ or Fitch Ratings Ltd. Credit quality ratings apply to the underlying holdings of the Fund and not to the Fund itself. The percentages of the Fund’s portfolio with the ratings depicted in the chart are calculated based on the total market value of fixed income securities held by the Fund. If a security was rated by all three rating agencies, the middle rating was utilized. If rated by two of three rating agencies, the lower rating was utilized, and if rated by one of the rating agencies, that rating was utilized. Standard & Poor’s rates the creditworthiness of bonds, ranging from AAA (highest) to D (lowest). Ratings from A to CCC may be modified by the addition of a plus (+) or minus (-) sign to show relative standing within the rating categories. Standard & Poor’s rates the creditworthiness of short-term notes from SP-1 (highest) to SP-3 (lowest). Moody’s rates the creditworthiness of bonds, ranging from Aaa (highest) to C (lowest). Ratings Aa to B may be modified by the addition of a number 1 (highest) to 3 (lowest) to show relative standing within the ratings categories. Moody’s rates the creditworthiness of short-term U.S. tax-exempt municipal securities from MIG 1/VMIG 1 (highest) to SG (lowest). Fitch rates the creditworthiness of bonds, ranging from AAA (highest) to D (lowest). Credit quality distribution is subject to change and may have changed since the date specified. |
| | | | |
| 6 | | Wells Fargo Pennsylvania Tax-Free Fund | | Fund expenses (unaudited) |
As a shareholder of the Fund, you incur two types of costs: (1) transaction costs, including sales charges (loads) on purchase payments and contingent deferred sales charges (if any) on redemptions and (2) ongoing costs, including management fees, distribution (12b-1) and/or shareholder servicing fees, and other Fund expenses. This example is intended to help you understand your ongoing costs (in dollars) of investing in the Fund and to compare these costs with the ongoing costs of investing in other mutual funds.
The example is based on an investment of $1,000 invested at the beginning of the six-month period and held for the entire period from July 1, 2016 to December 31, 2016.
Actual expenses
The “Actual” line of the table below provides information about actual account values and actual expenses. You may use the information in this line, together with the amount you invested, to estimate the expenses that you paid over the period. Simply divide your account value by $1,000 (for example, an $8,600 account value divided by $1,000 = 8.6), then multiply the result by the number in the “Actual” line under the heading entitled “Expenses paid during period” for your applicable class of shares to estimate the expenses you paid on your account during this period.
Hypothetical example for comparison purposes
The “Hypothetical” line of the table below provides information about hypothetical account values and hypothetical expenses based on the Fund’s actual expense ratio and an assumed rate of return of 5% per year before expenses, which is not the Fund’s actual return. The hypothetical account values and expenses may not be used to estimate the actual ending account balance or expenses you paid for the period. You may use this information to compare the ongoing costs of investing in the Fund and other funds. To do so, compare this 5% hypothetical example with the 5% hypothetical examples that appear in the shareholder reports of the other funds.
Please note that the expenses shown in the table are meant to highlight your ongoing costs only and do not reflect any transactional costs, such as sales charges (loads) and contingent deferred sales charges. Therefore, the “Hypothetical” line of the table is useful in comparing ongoing costs only and will not help you determine the relative total costs of owning different funds. In addition, if these transactional costs were included, your costs would have been higher.
| | | | | | | | | | | | | | | | |
| | | Beginning
account value
7-1-2016 | | | Ending
account value
12-31-2016 | | | Expenses
paid during
the period¹ | | | Annualized net
expense ratio | |
Class A | | | | | | | | | | | | | | | | |
Actual | | $ | 1,000.00 | | | $ | 960.47 | | | $ | 3.65 | | | | 0.74 | % |
Hypothetical (5% return before expenses) | | $ | 1,000.00 | | | $ | 1,021.42 | | | $ | 3.76 | | | | 0.74 | % |
Class C | | | | | | | | | | | | | | | | |
Actual | | $ | 1,000.00 | | | $ | 956.74 | | | $ | 7.33 | | | | 1.49 | % |
Hypothetical (5% return before expenses) | | $ | 1,000.00 | | | $ | 1,017.65 | | | $ | 7.56 | | | | 1.49 | % |
Institutional Class | | | | | | | | | | | | | | | | |
Actual | | $ | 1,000.00 | | | $ | 961.68 | | | $ | 2.42 | | | | 0.49 | % |
Hypothetical (5% return before expenses) | | $ | 1,000.00 | | | $ | 1,022.67 | | | $ | 2.49 | | | | 0.49 | % |
| 1 | Expenses paid is equal to the annualized net expense ratio of each class multiplied by the average account value over the period, multiplied by the number of days in the most recent fiscal half-year divided by the number of days in the fiscal year (to reflect the one-half-year period). |
| | | | | | |
| Portfolio of investments—December 31, 2016 (unaudited) | | Wells Fargo Pennsylvania Tax-Free Fund | | | 7 | |
| | | | | | | | | | | | | | | | |
| Security name | | Interest rate | | | Maturity date | | | Principal | | | Value | |
| | | | |
Municipal Obligations: 98.94% | | | | | | | | | | | | | | | | |
| | | | |
| Florida: 0.56% | | | | | | | | | | | | | | | | |
Jacksonville FL Economic Development AMT Metropolitan Parking Solutions Project (Industrial Development Revenue, ACA Insured) | | | 5.50 | % | | | 10-1-2030 | | | $ | 1,000,000 | | | $ | 1,001,690 | |
| | | | | | | | | | | | | | | | |
| | | | |
| Guam: 1.89% | | | | | | | | | | | | | | | | |
Guam Government Business Privilege Tax Series D (Tax Revenue) | | | 5.00 | | | | 11-15-2022 | | | | 1,000,000 | | | | 1,118,320 | |
Guam Government Limited Obligation Series A (Tax Revenue) | | | 5.00 | | | | 12-1-2028 | | | | 1,000,000 | | | | 1,143,160 | |
Guam Government Waterworks Authority Water & Wastewater System Project (Water & Sewer Revenue) | | | 5.25 | | | | 7-1-2025 | | | | 1,000,000 | | | | 1,120,440 | |
| | | | |
| | | | | | | | | | | | | | | 3,381,920 | |
| | | | | | | | | | | | | | | | |
| | | | |
| Pennsylvania: 93.74% | | | | | | | | | | | | | | | | |
Allegheny County PA Higher Education Building Authority Refunding Bond Duquesne University of The Holy Spirit Series A (Education Revenue) | | | 5.00 | | | | 3-1-2029 | | | | 1,135,000 | | | | 1,293,219 | |
Allegheny County PA Hospital Development Authority Health Center Series B (Health Revenue, National Insured) | | | 6.00 | | | | 7-1-2027 | | | | 1,800,000 | | | | 2,304,954 | |
Allegheny County PA Port Authority Refunding Bond (Tax Revenue) | | | 5.75 | | | | 3-1-2029 | | | | 3,000,000 | | | | 3,416,040 | |
Allegheny County PA Series C-65 (GO Revenue) | | | 5.50 | | | | 5-1-2024 | | | | 4,675,000 | | | | 5,395,418 | |
Blair County PA (GO Revenue, Build America Mutual Assurance Company Insured) | | | 5.00 | | | | 10-1-2026 | | | | 955,000 | | | | 1,107,141 | |
Capital Region Water Pennsylvania Series A (Water & Sewer Revenue, Build America Mutual Assurance Company Insured) | | | 5.00 | | | | 7-15-2024 | | | | 750,000 | | | | 866,228 | |
Capital Region Water Pennsylvania Series A (Water & Sewer Revenue, Build America Mutual Assurance Company Insured) | | | 5.00 | | | | 7-15-2029 | | | | 525,000 | | | | 602,317 | |
Centre County PA Hospital Authority Mount Nittany Medical Center Series A (Health Revenue) | | | 5.00 | | | | 11-15-2029 | | | | 800,000 | | | | 917,544 | |
Centre County PA Hospital Authority Mount Nittany Medical Center Series A (Health Revenue) | | | 5.00 | | | | 11-15-2030 | | | | 675,000 | | | | 771,005 | |
Chester County PA IDA Avon Grove Charter School Project Series A (Education Revenue) | | | 5.65 | | | | 12-15-2017 | | | | 100,000 | | | | 101,715 | |
Chester County PA IDA Avon Grove Charter School Project Series A (Education Revenue) | | | 6.25 | | | | 12-15-2027 | | | | 2,370,000 | | | | 2,434,014 | |
Chester County PA IDA Collegium Charter School Project Series A (Education Revenue) | | | 5.00 | | | | 10-15-2022 | | | | 1,695,000 | | | | 1,742,901 | |
Chester County PA IDA Renaissance Academy Charter School Project (Education Revenue) | | | 3.75 | | | | 10-1-2024 | | | | 905,000 | | | | 892,375 | |
Chester County PA IDA University Student Housing LLC Project Series A (Housing Revenue) | | | 5.00 | | | | 8-1-2030 | | | | 555,000 | | | | 582,251 | |
Commonwealth Financing Authority Pennsylvania Series B (Water & Sewer Revenue) | | | 5.00 | | | | 6-1-2026 | | | | 1,000,000 | | | | 1,125,780 | |
Commonwealth Financing Authority Pennsylvania Series B-1 (Miscellaneous Revenue, AGM Insured) | | | 5.00 | | | | 6-1-2025 | | | | 1,500,000 | | | | 1,734,825 | |
Cumberland County PA Municipal Authority Diakon Lutheran Ministries Project (Health Revenue) | | | 5.00 | | | | 1-1-2028 | | | | 2,090,000 | | | | 2,324,122 | |
Cumberland County PA Municipal Authority Dickinson College Project Series HH-1 (Education Revenue) | | | 5.00 | | | | 11-1-2039 | | | | 1,200,000 | | | | 1,276,512 | |
Cumberland County PA Municipal Authority Refunding Bond Dickson College Project (Education Revenue) | | | 5.00 | | | | 5-1-2028 | | | | 1,170,000 | | | | 1,362,383 | |
Dauphin County PA Authority Pinnacle Health System Project Series A (Health Revenue) | | | 5.00 | | | | 6-1-2035 | | | | 1,000,000 | | | | 1,106,760 | |
Delaware County PA Authority Neumann University Refunding Bond (Miscellaneous Revenue) | | | 5.00 | | | | 10-1-2031 | | | | 1,500,000 | | | | 1,625,895 | |
Delaware County PA IDA Chester Community Charter School Series A (Education Revenue) | | | 5.00 | | | | 8-15-2020 | | | | 1,795,000 | | | | 1,794,892 | |
Delaware County PA Vocational & Technical School Authority (Miscellaneous Revenue, Build America Mutual Assurance Company Insured) | | | 5.25 | | | | 11-1-2033 | | | | 1,000,000 | | | | 1,122,980 | |
Delaware Valley PA Regional Finance Authority Local Government Series A (Miscellaneous Revenue, Ambac Insured) | | | 5.50 | | | | 8-1-2028 | | | | 4,390,000 | | | | 5,208,735 | |
The accompanying notes are an integral part of these financial statements.
| | | | |
| 8 | | Wells Fargo Pennsylvania Tax-Free Fund | | Portfolio of investments—December 31, 2016 (unaudited) |
| | | | | | | | | | | | | | | | |
| Security name | | Interest rate | | | Maturity date | | | Principal | | | Value | |
| | | | |
| Pennsylvania (continued) | | | | | | | | | | | | | | | | |
East Hempfield Township PA IDA Refunding Bond Willow Valley Communities Project (Health Revenue) | | | 5.00 | % | | | 12-1-2028 | | | $ | 450,000 | | | $ | 508,122 | |
East Hempfield Township PA IDA Refunding Bond Willow Valley Communities Project (Health Revenue) | | | 5.00 | | | | 12-1-2029 | | | | 375,000 | | | | 421,560 | |
Easton PA Area Joint Sewer Authority (Water & Sewer Revenue, Build America Mutual Assurance Company Insured) | | | 5.00 | | | | 12-1-2026 | | | | 180,000 | | | | 205,447 | |
Easton PA Area Joint Sewer Authority (Water & Sewer Revenue, Build America Mutual Assurance Company Insured) | | | 5.00 | | | | 12-1-2027 | | | | 200,000 | | | | 227,286 | |
Easton PA Area Joint Sewer Authority (Water & Sewer Revenue, Build America Mutual Assurance Company Insured) | | | 5.00 | | | | 12-1-2028 | | | | 150,000 | | | | 169,775 | |
Easton PA Area Joint Sewer Authority (Water & Sewer Revenue, Build America Mutual Assurance Company Insured) | | | 5.00 | | | | 12-1-2029 | | | | 200,000 | | | | 225,542 | |
General Authority of South Central Pennsylvania Association of Independent Colleges & Universities (Education Revenue) | | | 6.00 | | | | 11-1-2031 | | | | 2,500,000 | | | | 2,827,725 | |
Lehigh County PA General Purpose Authority Water & Sewer CAB Allentown Project (Water & Sewer Revenue) ¤ | | | 0.00 | | | | 12-1-2030 | | | | 2,000,000 | | | | 1,190,940 | |
Lycoming County PA Authority Pennsylvania College of Technology (Education Revenue) | | | 5.50 | | | | 7-1-2026 | | | | 3,000,000 | | | | 3,391,980 | |
McKeesport PA Municipal Authority (Water & Sewer Revenue, AGM Insured) | | | 5.50 | | | | 12-15-2027 | | | | 2,405,000 | | | | 2,731,383 | |
Monroe County PA Hospital Authority Pocono Medical Center Series A (Health Revenue) | | | 5.00 | | | | 1-1-2027 | | | | 840,000 | | | | 906,965 | |
Monroe County PA Hospital Authority Pocono Medical Center Series A (Health Revenue) | | | 5.00 | | | | 1-1-2032 | | | | 880,000 | | | | 935,942 | |
Montgomery County PA Higher Education & Health Authority Abington Memorial Hospital Project (Health Revenue) | | | 5.00 | | | | 6-1-2031 | | | | 2,000,000 | | | | 2,188,180 | |
Montgomery County PA Higher Education & Health Authority Refunding Bond Arcadia University (Education Revenue) | | | 5.00 | | | | 4-1-2030 | | | | 1,500,000 | | | | 1,618,410 | |
Montgomery County PA IDA ACTS Retirement-Life Communities Obligated Group (Health Revenue) | | | 5.00 | | | | 11-15-2036 | | | | 4,200,000 | | | | 4,497,192 | |
Montgomery County PA IDA Jefferson Health System Series A (Health Revenue) | | | 5.00 | | | | 10-1-2027 | | | | 1,000,000 | | | | 1,104,290 | |
Montgomery County PA IDA New Regional Medical Center Project (Health Revenue, FHA Insured) | | | 5.00 | | | | 8-1-2020 | | | | 980,000 | | | | 1,092,024 | |
Montgomery County PA Norristown Area School District (GO Revenue) | | | 5.00 | | | | 9-1-2029 | | | | 1,250,000 | | | | 1,439,913 | |
North Eastern PA Hospital and Education Authority Refunding Bond Wilkes University Project Series B (Education Revenue) | | | 5.25 | | | | 3-1-2037 | | | | 1,000,000 | | | | 1,072,000 | |
Northampton County PA St. Luke’s Hospital of Bethlehem Series A (Health Revenue) | | | 5.00 | | | | 8-15-2033 | | | | 1,500,000 | | | | 1,619,985 | |
Palmer Township PA Refunding Bond (GO Revenue) | | | 4.00 | | | | 5-15-2021 | | | | 250,000 | | | | 270,955 | |
Palmer Township PA Refunding Bond (GO Revenue) | | | 4.00 | | | | 5-15-2025 | | | | 225,000 | | | | 246,177 | |
Pennsylvania EDFA UPMC Obligated Group (Health Revenue) | | | 5.00 | | | | 3-15-2031 | | | | 2,270,000 | | | | 2,606,528 | |
Pennsylvania Financing Authority Pennsylvania Hills Project Series B (Miscellaneous Revenue, National Insured) ¤ | | | 0.00 | | | | 12-1-2022 | | | | 1,200,000 | | | | 999,444 | |
Pennsylvania Financing Authority Pennsylvania Hills Project Series B (Miscellaneous Revenue, National Insured) ¤ | | | 0.00 | | | | 12-1-2023 | | | | 3,790,000 | | | | 3,035,638 | |
Pennsylvania HEFAR La Salle University Series A (Education Revenue) | | | 5.25 | | | | 5-1-2027 | | | | 5,250,000 | | | | 5,345,130 | |
Pennsylvania HEFAR Shippensburg University Project (Education Revenue) | | | 5.00 | | | | 10-1-2020 | | | | 1,460,000 | | | | 1,535,263 | |
Pennsylvania HEFAR Shippensburg University Project (Education Revenue) | | | 6.00 | | | | 10-1-2031 | | | | 3,000,000 | | | | 3,272,070 | |
Pennsylvania HEFAR Temple University First Series (Education Revenue) | | | 5.00 | | | | 4-1-2032 | | | | 1,000,000 | | | | 1,108,790 | |
Pennsylvania Housing Finance Agency SFMR Series 112 (Housing Revenue) | | | 5.00 | | | | 4-1-2028 | | | | 1,475,000 | | | | 1,543,838 | |
Pennsylvania Public School Building Authority Series B-2 (Miscellaneous Revenue, Build America Mutual Assurance Company Insured) | | | 5.00 | | | | 12-1-2027 | | | | 1,010,000 | | | | 1,165,591 | |
Pennsylvania Turnpike Commission Motor License Series B-1 (Transportation Revenue) | | | 5.00 | | | | 12-1-2040 | | | | 1,500,000 | | | | 1,614,090 | |
Pennsylvania Turnpike Commission Oil Franchise Series A (Tax Revenue) | | | 5.00 | | | | 12-1-2032 | | | | 1,500,000 | | | | 1,734,795 | |
Pennsylvania Turnpike Commission Series A (Miscellaneous Revenue, AGM Insured) | | | 5.25 | | | | 7-15-2021 | | | | 2,000,000 | | | | 2,269,100 | |
The accompanying notes are an integral part of these financial statements.
| | | | | | |
| Portfolio of investments—December 31, 2016 (unaudited) | | Wells Fargo Pennsylvania Tax-Free Fund | | | 9 | |
| | | | | | | | | | | | | | | | |
| Security name | | Interest rate | | | Maturity date | | | Principal | | | Value | |
| | | | |
| Pennsylvania (continued) | | | | | | | | | | | | | | | | |
Philadelphia PA Airport Refunding Bond AMT Series A (Airport Revenue) | | | 5.00 | % | | | 6-15-2030 | | | $ | 1,500,000 | | | $ | 1,663,470 | |
Philadelphia PA Hospital & HEFAR Refunding Bond Temple University Health System Series B (Health Revenue) | | | 6.25 | | | | 7-1-2023 | | | | 1,000,000 | | | | 1,016,150 | |
Philadelphia PA IDA 1st Philadelphia Preparatory Charter School Project Series A (Education Revenue) | | | 7.00 | | | | 6-15-2033 | | | | 1,000,000 | | | | 1,129,180 | |
Philadelphia PA IDA Architecture & Design Charter School Project (Education Revenue) | | | 5.25 | | | | 3-15-2023 | | | | 750,000 | | | | 771,120 | |
Philadelphia PA IDA Charter School Project Series A (Education Revenue) | | | 5.30 | | | | 9-15-2027 | | | | 5,150,000 | | | | 5,198,925 | |
Philadelphia PA IDA Global Leadership Academy Project (Education Revenue) | | | 5.13 | | | | 11-15-2020 | | | | 1,000,000 | | | | 1,035,060 | |
Philadelphia PA IDA Global Leadership Academy Project (Education Revenue) | | | 5.75 | | | | 11-15-2030 | | | | 1,000,000 | | | | 1,045,380 | |
Philadelphia PA IDA Master Charter School AID (Education Revenue) | | | 5.00 | | | | 8-1-2020 | | | | 580,000 | | | | 616,453 | |
Philadelphia PA IDA National Board of Medical Examiners Project (Health Revenue) | | | 5.00 | | | | 5-1-2030 | | | | 1,705,000 | | | | 1,973,282 | |
Philadelphia PA IDA National Board of Medical Examiners Project (Health Revenue) | | | 5.00 | | | | 5-1-2031 | | | | 1,610,000 | | | | 1,857,682 | |
Philadelphia PA IDA Refunding Bond Cultural & Commercial Corridors Program Series A (Miscellaneous Revenue) | | | 5.00 | | | | 12-1-2028 | | | | 2,500,000 | | | | 2,826,850 | |
Philadelphia PA IDA Tacony Academy Charter School Project (Education Revenue) | | | 6.88 | | | | 6-15-2033 | | | | 1,000,000 | | | | 1,093,010 | |
Philadelphia PA IDA Temple University 1st Series 2015 (Education Revenue) | | | 5.00 | | | | 4-1-2033 | | | | 2,500,000 | | | | 2,808,575 | |
Philadelphia PA IDA Temple University 1st Series 2016 (Education Revenue) | | | 5.00 | | | | 4-1-2029 | | | | 1,000,000 | | | | 1,141,880 | |
Philadelphia PA IDA West Philadelphia Achievement Charter Elementary School Project (Education Revenue) | | | 7.50 | | | | 5-1-2031 | | | | 1,285,000 | | | | 1,355,983 | |
Philadelphia PA Refunding Bond Series A (GO Revenue) | | | 5.25 | | | | 7-15-2033 | | | | 1,500,000 | | | | 1,696,515 | |
Philadelphia PA School District Refunding Bond Series A (GO Revenue, AGM/FGIC Insured) | | | 5.00 | | | | 6-1-2024 | | | | 1,425,000 | | | | 1,589,659 | |
Philadelphia PA School District Refunding Bond Series C (GO Revenue) | | | 5.00 | | | | 9-1-2018 | | | | 3,000,000 | | | | 3,134,490 | |
Philadelphia PA School District Refunding Bond Series C (GO Revenue) | | | 5.00 | | | | 9-1-2021 | | | | 1,395,000 | | | | 1,526,032 | |
Philadelphia PA Water & Wastewater Refunding Bond (Water & Sewer Revenue) | | | 5.00 | | | | 10-1-2030 | | | | 3,000,000 | | | | 3,446,490 | |
Pittsburgh & Allegheny Counties PA Sports & Exhibition Authority (Tax Revenue, AGM Insured) | | | 5.00 | | | | 2-1-2031 | | | | 3,000,000 | | | | 3,257,280 | |
Pittsburgh PA (GO Revenue, Build America Mutual Assurance Company Insured) | | | 5.00 | | | | 9-1-2030 | | | | 500,000 | | | | 574,315 | |
Pittsburgh PA Moon Area School District Series A (GO Revenue) | | | 5.00 | | | | 11-15-2029 | | | | 1,445,000 | | | | 1,632,937 | |
Reading PA School District Notes Series A (GO Revenue, AGM Insured) | | | 5.00 | | | | 2-1-2033 | | | | 1,500,000 | | | | 1,641,735 | |
Reading PA School District Refunding Bond (GO Revenue) | | | 3.13 | | | | 4-1-2024 | | | | 1,000,000 | | | | 982,900 | |
Southeastern Pennsylvania Transportation Authority (Miscellaneous Revenue) | | | 5.00 | | | | 6-1-2028 | | | | 4,000,000 | | | | 4,396,240 | |
State Public School Building Authority Pennsylvania Chester Upland School District Project Series B (Miscellaneous Revenue) | | | 5.25 | | | | 9-15-2030 | | | | 540,000 | | | | 590,409 | |
State Public School Building Authority Pennsylvania Chester Upland School Project Series C (Miscellaneous Revenue, AGM Insured) | | | 5.00 | | | | 9-15-2026 | | | | 875,000 | | | | 971,294 | |
State Public School Building Authority Pennsylvania Northampton County Area Community College Project (Education Revenue) | | | 5.50 | | | | 3-1-2031 | | | | 5,000,000 | | | | 5,574,600 | |
State Public School Building Authority Pennsylvania Northampton County Area Community College Project Series A (Education Revenue, Build America Mutual Assurance Company Insured) | | | 5.00 | | | | 6-15-2027 | | | | 1,610,000 | | | | 1,766,428 | |
State Public School Building Authority Pennsylvania Philadelphia Community College Project Series A (Education Revenue, Build America Mutual Assurance Company Insured) | | | 5.00 | | | | 6-15-2027 | | | | 1,500,000 | | | | 1,703,775 | |
University Area Joint Authority Pennsylvania Refunding Bond (Water & Sewer Revenue) ± | | | 1.12 | | | | 11-1-2028 | | | | 1,500,000 | | | | 1,497,435 | |
West Mifflin PA Area School District (GO Revenue, AGM Insured) | | | 5.00 | | | | 4-1-2028 | | | | 1,000,000 | | | | 1,120,790 | |
Wilkes-Barre PA Finance Authority University of Scranton (Education Revenue) | | | 5.00 | | | | 11-1-2020 | | | | 1,005,000 | | | | 1,108,706 | |
York County PA Series B (GO Revenue) | | | 5.00 | | | | 6-1-2033 | | | | 4,000,000 | | | | 4,581,320 | |
York PA City School District Refunding Bond (GO Revenue, Build America Mutual Assurance Company Insured) | | | 4.00 | | | | 6-1-2019 | | | | 895,000 | | | | 941,003 | |
The accompanying notes are an integral part of these financial statements.
| | | | |
| 10 | | Wells Fargo Pennsylvania Tax-Free Fund | | Portfolio of investments—December 31, 2016 (unaudited) |
| | | | | | | | | | | | | | | | |
| Security name | | Interest rate | | | Maturity date | | | Principal | | | Value | |
| | | | |
| Pennsylvania (continued) | | | | | | | | | | | | | | | | |
York PA City School District Refunding Bond (GO Revenue, Build America Mutual Assurance Company Insured) | | | 4.00 | % | | | 6-1-2020 | | | $ | 970,000 | | | $ | 1,034,015 | |
York PA City School District Refunding Bond (GO Revenue, Build America Mutual Assurance Company Insured) | | | 4.00 | | | | 6-1-2021 | | | | 1,000,000 | | | | 1,077,800 | |
| | | | |
| | | | | | | | | | | | | | | 167,611,244 | |
| | | | | | | | | | | | | | | | |
| | | | |
| Virgin Islands: 2.75% | | | | | | | | | | | | | | | | |
Virgin Islands PFA Grant Anticipation Federal Highway Grant (Miscellaneous Revenue) 144A | | | 4.00 | | | | 9-1-2017 | | | | 600,000 | | | | 607,254 | |
Virgin Islands PFA Grant Anticipation Federal Highway Grant (Miscellaneous Revenue) 144A | | | 5.00 | | | | 9-1-2018 | | | | 750,000 | | | | 781,275 | |
Virgin Islands PFA Grant Anticipation Federal Highway Grant (Miscellaneous Revenue) 144A | | | 5.00 | | | | 9-1-2019 | | | | 500,000 | | | | 529,755 | |
Virgin Islands PFA Matching Fund Loan Note Senior Lien Series A (Tobacco Revenue, AGM Insured) | | | 5.00 | | | | 10-1-2029 | | | | 2,000,000 | | | | 2,151,180 | |
Virgin Islands PFA Matching Fund Loan Note Senior Lien Series B (Tobacco Revenue) | | | 5.00 | | | | 10-1-2025 | | | | 1,000,000 | | | | 849,560 | |
| | | | |
| | | | | | | | | | | | | | | 4,919,024 | |
| | | | | | | | | | | | | | | | |
| | | | |
Total Municipal Obligations (Cost $172,741,834) | | | | | | | | | | | | | | | 176,913,878 | |
| | | | | | | | | | | | | | | | |
| | | | |
| | | Yield | | | | | | Shares | | | | |
| Short-Term Investments: 0.47% | | | | | | | | | | | | | | | | |
| | | | |
| Investment Companies: 0.47% | | | | | | | | | | | | | | | | |
Wells Fargo Municipal Cash Management Fund Institutional Class (l)(u) | | | 0.67 | | | | | | | | 839,425 | | | | 839,929 | |
| | | | | | | | | | | | | | | | |
| | | | |
Total Short-Term Investments (Cost $839,856) | | | | | | | | | | | | | | | 839,929 | |
| | | | | | | | | | | | | | | | |
| | | | | | | | |
| Total investments in securities (Cost $173,581,690)* | | | 99.41 | % | | | 177,753,807 | |
Other assets and liabilities, net | | | 0.59 | | | | 1,053,246 | |
| | | | | | | | |
| Total net assets | | | 100.00 | % | | $ | 178,807,053 | |
| | | | | | | | |
| ¤ | The security is issued in zero coupon form with no periodic interest payments. |
| ± | Variable rate investment. The rate shown is the rate in effect at period end. |
| 144A | The security may be resold in transactions exempt from registration, normally to qualified institutional buyers, pursuant to Rule 144A under the Securities Act of 1933. |
| (l) | The issuer of the security is an affiliated person of the Fund as defined in the Investment Company Act of 1940. |
| (u) | The rate represents the 7-day annualized yield at period end. |
| * | Cost for federal income tax purposes is $173,581,690 and unrealized gains (losses) consists of: |
| | | | |
Gross unrealized gains | | $ | 6,797,445 | |
Gross unrealized losses | | | (2,625,328 | ) |
| | | | |
Net unrealized gains | | $ | 4,172,117 | |
The accompanying notes are an integral part of these financial statements.
| | | | | | |
| Statement of assets and liabilities—December 31, 2016 (unaudited) | | Wells Fargo Pennsylvania Tax-Free Fund | | | 11 | |
| | | | |
| | | | |
| |
Assets | | | | |
Investments | | | | |
In unaffiliated securities, at value (cost $172,741,834) | | $ | 176,913,878 | |
In affiliated securities, at value (cost $839,856) | | | 839,929 | |
| | | | |
Total investments, at value (cost $173,581,690) | | | 177,753,807 | |
Receivable for Fund shares sold | | | 46,688 | |
Receivable for interest | | | 1,906,928 | |
Prepaid expenses and other assets | | | 44,361 | |
| | | | |
Total assets | | | 179,751,784 | |
| | | | |
| |
Liabilities | | | | |
Dividends payable | | | 288,199 | |
Payable for Fund shares redeemed | | | 511,879 | |
Management fee payable | | | 50,349 | |
Distribution fees payable | | | 12,519 | |
Administration fees payable | | | 18,779 | |
Accrued expenses and other liabilities | | | 63,006 | |
| | | | |
Total liabilities | | | 944,731 | |
| | | | |
Total net assets | | $ | 178,807,053 | |
| | | | |
| |
NET ASSETS CONSIST OF | | | | |
Paid-in capital | | $ | 180,901,141 | |
Overdistributed net investment income | | | (245,938 | ) |
Accumulated net realized losses on investments | | | (6,020,267 | ) |
Net unrealized gains on investments | | | 4,172,117 | |
| | | | |
Total net assets | | $ | 178,807,053 | |
| | | | |
| |
COMPUTATION OF NET ASSET VALUE AND OFFERING PRICE PER SHARE | | | | |
Net assets – Class A | | $ | 50,521,850 | |
Shares outstanding – Class A1 | | | 4,400,329 | |
Net asset value per share – Class A | | | $11.48 | |
Maximum offering price per share – Class A2 | | | $12.02 | |
Net assets – Class C | | $ | 18,334,943 | |
Shares outstanding – Class C1 | | | 1,599,866 | |
Net asset value per share – Class C | | | $11.46 | |
Net assets – Institutional Class | | $ | 109,950,260 | |
Shares outstanding – Institutional Class1 | | | 9,576,466 | |
Net asset value per share – Institutional Class | | | $11.48 | |
| 1 | The Fund has an unlimited number of authorized shares. |
| 2 | Maximum offering price is computed as 100/95.50 of net asset value. On investments of $50,000 or more, the offering price is reduced. |
The accompanying notes are an integral part of these financial statements.
| | | | |
| 12 | | Wells Fargo Pennsylvania Tax-Free Fund | | Statement of operations—six months ended December 31, 2016 (unaudited) |
| | | | |
| | | | |
| |
Investment income | | | | |
Interest | | $ | 3,813,490 | |
Income from affiliated securities | | | 3,559 | |
| | | | |
Total investment income | | | 3,817,049 | |
| | | | |
| |
Expenses | | | | |
Management fee | | | 418,147 | |
Administration fees | | | | |
Class A | | | 44,778 | |
Class B | | | 263 | 1 |
Class C | | | 15,788 | |
Institutional Class | | | 53,215 | |
Shareholder servicing fees | | | | |
Class A | | | 69,966 | |
Class B | | | 410 | 1 |
Class C | | | 24,668 | |
Distribution fees | | | | |
Class B | | | 1,232 | 1 |
Class C | | | 74,005 | |
Custody and accounting fees | | | 7,296 | |
Professional fees | | | 23,512 | |
Registration fees | | | 35,210 | |
Shareholder report expenses | | | 6,296 | |
Trustees’ fees and expenses | | | 12,189 | |
Other fees and expenses | | | 1,767 | |
| | | | |
Total expenses | | | 788,742 | |
Less: Fee waivers and/or expense reimbursements | | | (106,230 | ) |
| | | | |
Net expenses | | | 682,512 | |
| | | | |
Net investment income | | | 3,134,537 | |
| | | | |
| |
REALIZED AND UNREALIZED GAINS (LOSSES) ON INVESTMENTS | | | | |
| |
Net realized gains (losses) on: | | | | |
Unaffiliated securities | | | (91,040 | ) |
Affiliated securities | | | 967 | |
| | | | |
Net realized losses on investments | | | (90,073 | ) |
| | | | |
| |
Net change in unrealized gains (losses) on: | | | | |
Unaffiliated securities | | | (11,394,726 | ) |
Affiiliated securities | | | 73 | |
| | | | |
Net change in unrealized gains (losses) on investments | | | (11,394,653 | ) |
| | | | |
Net realized and unrealized gains (losses) on investments | | | (11,484,726 | ) |
| | | | |
Net decrease in net assets resulting from operations | | $ | (8,350,189 | ) |
| | | | |
| 1 | For the period from July 1, 2016 to December 5, 2016. At the close of business on December 5, 2016, existing Class B shareholders were converted to Class A shareholders. Effective December 6, 2016, Class B shares are no longer offered by the Fund. |
The accompanying notes are an integral part of these financial statements.
| | | | | | |
| Statements of changes in net assets | | Wells Fargo Pennsylvania Tax-Free Fund | | | 13 | |
| | | | | | | | | | | | | | | | |
| | | Six months ended December 31, 2016
(unaudited) | | | Year ended June 30, 2016 | |
| | | | |
Operations | | | | | | | | | | | | | | | | |
Net investment income | | | | | | $ | 3,134,537 | | | | | | | $ | 6,202,910 | |
Net realized gains (losses) on investments | | | | | | | (90,073 | ) | | | | | | | 317,819 | |
Net change in unrealized gains (losses) on investments | | | | | | | (11,394,653 | ) | | | | | | | 5,818,175 | |
| | | | |
Net increase (decrease) in net assets resulting from operations | | | | | | | (8,350,189 | ) | | | | | | | 12,338,904 | |
| | | | |
| | | | |
Distributions to shareholders from | | | | | | | | | | | | | | | | |
Net investment income | | | | | | | | | | | | | | | | |
Class A | | | | | | | (814,981 | ) | | | | | | | (1,633,459 | ) |
Class B | | | | | | | (3,509 | )1 | | | | | | | (14,671 | ) |
Class C | | | | | | | (213,405 | ) | | | | | | | (370,055 | ) |
Institutional Class | | | | | | | (2,102,642 | ) | | | | | | | (4,184,725 | ) |
| | | | |
Total distributions to shareholders | | | | | | | (3,134,537 | ) | | | | | | | (6,202,910 | ) |
| | | | |
| | | | |
Capital share transactions | | | Shares | | | | | | | | Shares | | | | | |
Proceeds from shares sold | | | | | | | | | | | | | | | | |
Class A | | | 311,489 | | | | 3,724,900 | | | | 907,836 | | | | 10,807,655 | |
Class B | | | 0 | 1 | | | 0 | 1 | | | 504 | | | | 5,931 | |
Class C | | | 132,158 | | | | 1,579,715 | | | | 578,544 | | | | 6,894,873 | |
Institutional Class | | | 1,010,170 | | | | 12,009,915 | | | | 3,425,123 | | | | 40,716,691 | |
| | | | |
| | | | | | | 17,314,530 | | | | | | | | 58,425,150 | |
| | | | |
Reinvestment of distributions | | | | | | | | | | | | | | | | |
Class A | | | 63,930 | | | | 755,484 | | | | 126,426 | | | | 1,505,841 | |
Class B | | | 289 | 1 | | | 3,452 | 1 | | | 1,211 | | | | 14,352 | |
Class C | | | 16,534 | | | | 194,984 | | | | 28,590 | | | | 340,015 | |
Institutional Class | | | 41,274 | | | | 487,144 | | | | 79,004 | | | | 940,589 | |
| | | | |
| | | | | | | 1,441,064 | | | | | | | | 2,800,797 | |
| | | | |
Payment for shares redeemed | | | | | | | | | | | | | | | | |
Class A | | | (537,544 | ) | | | (6,264,735 | ) | | | (499,387 | ) | | | (5,949,813 | ) |
Class B | | | (44,832 | )1 | | | (531,995 | )1 | | | (11,946 | ) | | | (141,573 | ) |
Class C | | | (158,488 | ) | | | (1,859,594 | ) | | | (111,231 | ) | | | (1,317,623 | ) |
Institutional Class | | | (2,424,731 | ) | | | (28,034,876 | ) | | | (1,641,421 | ) | | | (19,520,308 | ) |
| | | | |
| | | | | | | (36,691,200 | ) | | | | | | | (26,929,317 | ) |
| | | | |
Net increase (decrease) in net assets resulting from capital share transactions | | | | | | | (17,935,606 | ) | | | | | | | 34,296,630 | |
| | | | |
Total increase (decrease) in net assets | | | | | | | (29,420,332 | ) | | | | | | | 40,432,624 | |
| | | | |
| | | | |
Net assets | | | | | | | | | | | | | | | | |
Beginning of period | | | | | | | 208,227,385 | | | | | | | | 167,794,761 | |
| | | | |
End of period | | | | | | $ | 178,807,053 | | | | | | | $ | 208,227,385 | |
| | | | |
Overdistributed net investment income | | | | | | $ | (245,938 | ) | | | | | | $ | (245,938 | ) |
| | | | |
| 1 | For the period from July 1, 2016 to December 5, 2016. At the close of business on December 5, 2016, existing Class B shareholders were converted to Class A shareholders. Effective December 6, 2016, Class B shares are no longer offered by the Fund. |
The accompanying notes are an integral part of these financial statements.
| | | | |
| 14 | | Wells Fargo Pennsylvania Tax-Free Fund | | Financial highlights |
(For a share outstanding throughout each period)
| | | | | | | | | | | | | | | | | | | | | | | | |
| | | Six months ended
December 31, 2016
(unaudited) | | | Year ended June 30 | |
| CLASS A | | | 2016 | | | 2015 | | | 2014 | | | 2013 | | | 2012 | |
Net asset value, beginning of period | | | $12.13 | | | | $11.75 | | | | $11.65 | | | | $11.36 | | | | $11.65 | | | | $10.93 | |
Net investment income | | | 0.18 | | | | 0.38 | | | | 0.42 | | | | 0.43 | | | | 0.42 | | | | 0.44 | |
Net realized and unrealized gains (losses) on investments | | | (0.65 | ) | | | 0.38 | | | | 0.09 | | | | 0.29 | | | | (0.29 | ) | | | 0.72 | |
| | | | | | | | | | | | | | | | | | | | | | | | |
Total from investment operations | | | (0.47 | ) | | | 0.76 | | | | 0.51 | | | | 0.72 | | | | 0.13 | | | | 1.16 | |
Distributions to shareholders from | | | | | | | | | | | | | | | | | | | | | | | | |
Net investment income | | | (0.18 | ) | | | (0.38 | ) | | | (0.41 | ) | | | (0.43 | ) | | | (0.42 | ) | | | (0.44 | ) |
Net asset value, end of period | | | $11.48 | | | | $12.13 | | | | $11.75 | | | | $11.65 | | | | $11.36 | | | | $11.65 | |
Total return1 | | | (3.95 | )% | | | 6.62 | % | | | 4.44 | % | | | 6.45 | % | | | 1.02 | % | | | 10.81 | % |
Ratios to average net assets (annualized) | | | | | | | | | | | | | | | | | | | | | | | | |
Gross expenses | | | 0.89 | % | | | 0.90 | % | | | 0.90 | % | | | 0.91 | %2 | | | 0.88 | %2 | | | 0.88 | %2 |
Net expenses | | | 0.74 | % | | | 0.74 | % | | | 0.74 | % | | | 0.74 | %2 | | | 0.75 | %2 | | | 0.74 | %2 |
Net investment income | | | 2.91 | % | | | 3.23 | % | | | 3.54 | % | | | 3.75 | %2 | | | 3.55 | %2 | | | 3.90 | %2 |
Supplemental data | | | | | | | | | | | | | | | | | | | | | | | | |
Portfolio turnover rate | | | 10 | % | | | 13 | % | | | 15 | % | | | 15 | % | | | 14 | % | | | 21 | % |
Net assets, end of period (000s omitted) | | | $50,522 | | | | $55,352 | | | | $47,323 | | | | $44,500 | | | | $43,167 | | | | $45,178 | |
| 1 | Total return calculations do not include any sales charges. Returns for periods of less than one year are not annualized. |
| 2 | Ratios include interest and fee expense relating to inverse floating-rate obligations as follows: |
| | | | |
Year ended June 30, 2014 | | | 0.00 | % |
Year ended June 30, 2013 | | | 0.01 | % |
Year ended June 30, 2012 | | | 0.00 | % |
The accompanying notes are an integral part of these financial statements.
| | | | | | |
| Financial highlights | | Wells Fargo Pennsylvania Tax-Free Fund | | | 15 | |
(For a share outstanding throughout each period)
| | | | | | | | | | | | | | | | | | | | | | | | |
| | | Six months ended
December 31, 2016
(unaudited) | | | Year ended June 30 | |
| CLASS C | | | 2016 | | | 2015 | | | 2014 | | | 2013 | | | 2012 | |
Net asset value, beginning of period | | | $12.11 | | | | $11.73 | | | | $11.63 | | | | $11.34 | | | | $11.63 | | | | $10.91 | |
Net investment income | | | 0.13 | | | | 0.29 | 1 | | | 0.33 | | | | 0.34 | | | | 0.33 | | | | 0.36 | |
Net realized and unrealized gains (losses) on investments | | | (0.65 | ) | | | 0.38 | | | | 0.09 | | | | 0.29 | | | | (0.29 | ) | | | 0.72 | |
| | | | | | | | | | | | | | | | | | | | | | | | |
Total from investment operations | | | (0.52 | ) | | | 0.67 | | | | 0.42 | | | | 0.63 | | | | 0.04 | | | | 1.08 | |
Distributions to shareholders from | | | | | | | | | | | | | | | | | | | | | | | | |
Net investment income | | | (0.13 | ) | | | (0.29 | ) | | | (0.32 | ) | | | (0.34 | ) | | | (0.33 | ) | | | (0.36 | ) |
Net asset value, end of period | | | $11.46 | | | | $12.11 | | | | $11.73 | | | | $11.63 | | | | $11.34 | | | | $11.63 | |
Total return2 | | | (4.33 | )% | | | 5.83 | % | | | 3.66 | % | | | 5.67 | % | | | 0.27 | % | | | 9.99 | % |
Ratios to average net assets (annualized) | | | | | | | | | | | | | | | | | | | | | | | | |
Gross expenses | | | 1.64 | % | | | 1.65 | % | | | 1.65 | % | | | 1.66 | %3 | | | 1.63 | %3 | | | 1.63 | %3 |
Net expenses | | | 1.49 | % | | | 1.49 | % | | | 1.49 | % | | | 1.49 | %3 | | | 1.50 | %3 | | | 1.49 | %3 |
Net investment income | | | 2.16 | % | | | 2.46 | % | | | 2.78 | % | | | 3.00 | %3 | | | 2.79 | %3 | | | 3.15 | %3 |
Supplemental data | | | | | | | | | | | | | | | | | | | | | | | | |
Portfolio turnover rate | | | 10 | % | | | 13 | % | | | 15 | % | | | 15 | % | | | 14 | % | | | 21 | % |
Net assets, end of period (000s omitted) | | | $18,335 | | | | $19,493 | | | | $13,062 | | | | $11,192 | | | | $9,798 | | | | $9,815 | |
| 1 | Calculated based upon average shares outstanding |
| 2 | Total return calculations do not include any sales charges. Returns for periods of less than one year are not annualized. |
| 3 | Ratios include interest and fee expense relating to inverse floating-rate obligations as follows: |
| | | | |
Year ended June 30, 2014 | | | 0.00 | % |
Year ended June 30, 2013 | | | 0.01 | % |
Year ended June 30, 2012 | | | 0.00 | % |
The accompanying notes are an integral part of these financial statements.
| | | | |
| 16 | | Wells Fargo Pennsylvania Tax-Free Fund | | Financial highlights |
(For a share outstanding throughout each period)
| | | | | | | | | | | | | | | | | | | | | | | | |
| | | Six months ended
December 31, 2016
(unaudited) | | | Year ended June 30 | |
| INSTITUTIONAL CLASS | | | 2016 | | | 2015 | | | 2014 | | | 2013 | | | 2012 | |
Net asset value, beginning of period | | | $12.13 | | | | $11.75 | | | | $11.65 | | | | $11.36 | | | | $11.65 | | | | $10.93 | |
Net investment income | | | 0.19 | | | | 0.41 | 1 | | | 0.44 | | | | 0.45 | | | | 0.45 | 1 | | | 0.47 | |
Net realized and unrealized gains (losses) on investments | | | (0.65 | ) | | | 0.38 | | | | 0.10 | | | | 0.29 | | | | (0.29 | ) | | | 0.72 | |
| | | | | | | | | | | | | | | | | | | | | | | | |
Total from investment operations | | | (0.46 | ) | | | 0.79 | | | | 0.54 | | | | 0.74 | | | | 0.16 | | | | 1.19 | |
Distributions to shareholders from | | | | | | | | | | | | | | | | | | | | | | | | |
Net investment income | | | (0.19 | ) | | | (0.41 | ) | | | (0.44 | ) | | | (0.45 | ) | | | (0.45 | ) | | | (0.47 | ) |
Net asset value, end of period | | | $11.48 | | | | $12.13 | | | | $11.75 | | | | $11.65 | | | | $11.36 | | | | $11.65 | |
Total return2 | | | (3.83 | )% | | | 6.88 | % | | | 4.70 | % | | | 6.72 | % | | | 1.28 | % | | | 11.08 | % |
Ratios to average net assets (annualized) | | | | | | | | | | | | | | | | | | | | | | | | |
Gross expenses | | | 0.56 | % | | | 0.57 | % | | | 0.57 | % | | | 0.58 | %3 | | | 0.55 | %3 | | | 0.55 | %3 |
Net expenses | | | 0.49 | % | | | 0.49 | % | | | 0.49 | % | | | 0.49 | %3 | | | 0.50 | %3 | | | 0.49 | %3 |
Net investment income | | | 3.16 | % | | | 3.47 | % | | | 3.78 | % | | | 4.00 | %3 | | | 3.79 | %3 | | | 4.15 | %3 |
Supplemental data | | | | | | | | | | | | | | | | | | | | | | | | |
Portfolio turnover rate | | | 10 | % | | | 13 | % | | | 15 | % | | | 15 | % | | | 14 | % | | | 21 | % |
Net assets, end of period (000s omitted) | | | $109,950 | | | | $132,844 | | | | $106,769 | | | | $119,276 | | | | $148,684 | | | | $171,861 | |
| 1 | Calculated based upon average shares outstanding |
| 2 | Returns for periods of less than one year are not annualized. |
| 3 | Ratios include interest and fee expense relating to inverse floating-rate obligations as follows: |
| | | | |
Year ended June 30, 2014 | | | 0.00 | % |
Year ended June 30, 2013 | | | 0.01 | % |
Year ended June 30, 2012 | | | 0.00 | % |
The accompanying notes are an integral part of these financial statements.
| | | | | | |
| Notes to financial statements (unaudited) | | Wells Fargo Pennsylvania Tax-Free Fund | | | 17 | |
1. ORGANIZATION
Wells Fargo Funds Trust (the “Trust”), a Delaware statutory trust organized on March 10, 1999, is an open-end management investment company registered under the Investment Company Act of 1940, as amended (the “1940 Act”). As an investment company, the Trust follows the accounting and reporting guidance in Financial Accounting Standards Board (“FASB”) Accounting Standards Codification Topic 946, Financial Services – Investment Companies. These financial statements report on the Wells Fargo Pennsylvania Tax-Free Fund (the “Fund”) which is a diversified series of the Trust.
Effective December 6, 2016, Class B shares of the Fund are no longer offered. Information for Class B shares reflected in the financial statements represents activity through December 5, 2016.
2. SIGNIFICANT ACCOUNTING POLICIES
The following significant accounting policies, which are consistently followed in the preparation of the financial statements of the Fund, are in conformity with U.S. generally accepted accounting principles which require management to make estimates and assumptions that affect the reported amounts of assets and liabilities, disclosure of contingent assets and liabilities at the date of the financial statements, and the reported amounts of revenues and expenses during the reporting period. Actual results could differ from those estimates.
Securities valuation
All investments are valued each business day as of the close of regular trading on the New York Stock Exchange (generally 4 p.m. Eastern Time), although the Fund may deviate from this calculation time under unusual or unexpected circumstances.
Debt securities are valued at the evaluated bid price provided by an independent pricing service or, if a reliable price is not available, the quoted bid price from an independent broker-dealer.
Investments in registered open-end investment companies are valued at net asset value.
Investments which are not valued using any of the methods discussed above are valued at their fair value, as determined in good faith by the Board of Trustees of the Fund. The Board of Trustees has established a Valuation Committee comprised of the Trustees and has delegated to it the authority to take any actions regarding the valuation of portfolio securities that the Valuation Committee deems necessary or appropriate, including determining the fair value of portfolio securities, unless the determination has been delegated to the Management Valuation Team of Wells Fargo Funds Management, LLC (“Funds Management”). The Board of Trustees retains the authority to make or ratify any valuation decisions or approve any changes to the Valuation Procedures as it deems appropriate. On a quarterly basis, the Board of Trustees receives reports on any valuation actions taken by the Valuation Committee or the Management Valuation Team which may include items for ratification.
Valuations of fair valued securities are compared to the next actual sales price when available, or other appropriate market values, to assess the continued appropriateness of the fair valuation methodologies used. These securities are fair valued on a day-to-day basis, taking into consideration changes to appropriate market information and any significant changes to the inputs considered in the valuation process until there is a readily available price provided on an exchange or by an independent pricing service. Valuations received from an independent pricing service or independent broker-dealer quotes are periodically validated by comparisons to most recent trades and valuations provided by other independent pricing services in addition to the review of prices by the manager and/or subadviser. Unobservable inputs used in determining fair valuations are identified based on the type of security, taking into consideration factors utilized by market participants in valuing the investment, knowledge about the issuer and the current market environment.
When-issued transactions
The Fund may purchase securities on a forward commitment or when-issued basis. The Fund records a when-issued transaction on the trade date and will segregate assets in an amount at least equal in value to the Fund’s commitment to purchase when-issued securities. Securities purchased on a when-issued basis are marked-to-market daily and the Fund begins earning interest on the settlement date. Losses may arise due to changes in the market value of the underlying securities or if the counterparty does not perform under the contract.
Security transactions and income recognition
Securities transactions are recorded on a trade date basis. Realized gains or losses are recorded on the basis of identified cost.
Interest income is accrued daily and bond discounts are accreted and premiums are amortized daily based on the effective interest method. To the extent debt obligations are placed on non-accrual status, any related interest income
| | | | |
| 18 | | Wells Fargo Pennsylvania Tax-Free Fund | | Notes to financial statements (unaudited) |
may be reduced by writing off interest receivables when the collection of all or a portion of interest has become doubtful based on consistently applied procedures. If the issuer subsequently resumes interest payments or when the collectability of interest is reasonably assured, the debt obligation is removed from non-accrual status.
Distributions to shareholders
Distributions to shareholders from net investment income are accrued daily and paid monthly. Distributions from net realized gains, if any, are recorded on the ex-dividend date. Such distributions are determined in conformity with federal income tax regulations, which may differ in amount or character from net investment income and realized gains recognized for purposes of U.S. generally accepted accounting principles.
Federal and other taxes
The Fund intends to continue to qualify as a regulated investment company by distributing substantially all of its investment company taxable and tax-exempt income and any net realized capital gains (after reduction for capital loss carryforwards) sufficient to relieve it from all, or substantially all, federal income taxes. Accordingly, no provision for federal income taxes was required.
The Fund’s income and federal excise tax returns and all financial records supporting those returns for the prior three fiscal years are subject to examination by the federal and Delaware revenue authorities. Management has analyzed the Fund’s tax positions taken on federal, state, and foreign tax returns for all open tax years and does not believe that there are any uncertain tax positions that require recognition of a tax liability.
As of June 30, 2016, the Fund had capital loss carryforwards available to offset future net realized capital gains in the amount of $5,875,768 expiring in 2017.
Class allocations
The separate classes of shares offered by the Fund differ principally in applicable sales charges, distribution, shareholder servicing, and administration fees. Class specific expenses are charged directly to that share class. Investment income, common expenses, and realized and unrealized gains (losses) on investments are allocated daily to each class of shares based on the relative proportion of net assets of each class.
3. FAIR VALUATION MEASUREMENTS
Fair value measurements of investments are determined within a framework that has established a fair value hierarchy based upon the various data inputs utilized in determining the value of the Fund’s investments. The three-level hierarchy gives the highest priority to unadjusted quoted prices in active markets for identical assets or liabilities (Level 1) and the lowest priority to significant unobservable inputs (Level 3). The Fund’s investments are classified within the fair value hierarchy based on the lowest level of input that is significant to the fair value measurement. The inputs are summarized into three broad levels as follows:
| ∎ | | Level 1 – quoted prices in active markets for identical securities |
| ∎ | | Level 2 – other significant observable inputs (including quoted prices for similar securities, interest rates, prepayment speeds, credit risk, use of amortized cost, etc.) |
| ∎ | | Level 3 – significant unobservable inputs (including the Fund’s own assumptions in determining the fair value of investments) |
The inputs or methodologies used for valuing investments in securities are not necessarily an indication of the risk associated with investing in those securities.
The following is a summary of the inputs used in valuing the Fund’s assets and liabilities as of December 31, 2016:
| | | | | | | | | | | | | | | | |
| | | Quoted prices
(Level 1) | | | Other significant
observable inputs
(Level 2) | | | Significant
unobservable inputs (Level 3) | | | Total | |
Assets | | | | | | | | | | | | | | | | |
Investments in: | | | | | | | | | | | | | | | | |
| | | | |
Municipal obligations | | $ | 0 | | | $ | 176,913,878 | | | $ | 0 | | | $ | 176,913,878 | |
| | | | |
Short-term investments | | | | | | | | | | | | | | | | |
Investment companies | | | 839,929 | | | | 0 | | | | 0 | | | | 839,929 | |
Total assets | | $ | 839,929 | | | $ | 176,913,878 | | | $ | 0 | | | $ | 177,753,807 | |
| | | | | | |
| Notes to financial statements (unaudited) | | Wells Fargo Pennsylvania Tax-Free Fund | | | 19 | |
The Fund recognizes transfers between levels within the fair value hierarchy at the end of the reporting period. At December 31, 2016, the Fund did not have any transfers into/out of Level 1, Level 2, or Level 3.
4. TRANSACTIONS WITH AFFILIATES AND OTHER EXPENSES
Management fee
Funds Management, an indirect wholly owned subsidiary of Wells Fargo & Company (“Wells Fargo”), is the manager of the Fund and provides advisory and fund-level administrative services under an investment management agreement. Under the investment management agreement, Funds Management is responsible for, among other services, implementing the investment objectives and strategies of the Fund, supervising the subadviser, providing fund-level administrative services in connection with the Fund’s operations, and providing any other fund-level administrative services reasonably necessary for the operation of the Fund. As compensation for its services under the investment management agreement, Funds Management is entitled to receive an annual management fee starting at 0.40% and declining to 0.28% as the average daily net assets of the Fund increase. For the six months ended December 31, 2016, the management fee was equivalent to an annual rate of 0.40% of the Fund’s average daily net assets.
Funds Management has retained the services of a subadviser to provide daily portfolio management to the Fund. The fee for subadvisory services is borne by Funds Management. Wells Capital Management Incorporated, an affiliate of Funds Management and an indirect wholly owned subsidiary of Wells Fargo, is the subadviser to the Fund and is entitled to receive a fee from Funds Management at an annual rate starting at 0.20% and declining to 0.10% as the average daily net assets of the Fund increase.
Administration fees
Under a class-level administration agreement, Funds Management provides class-level administrative services to the Fund, which includes paying fees and expenses for services provided by the transfer agent, sub-transfer agents, omnibus account servicers and record-keepers. As compensation for its services under the class-level administration agreement, Funds Management receives an annual fee which is calculated based on the average daily net assets of each class as follows:
| | | | |
| | | Class-level
administration fee | |
Class A, Class B, Class C | | | 0.16 | % |
Institutional Class | | | 0.08 | |
Funds Management has contractually waived and/or reimbursed management and administration fees to the extent necessary to maintain certain net operating expense ratios for the Fund. Waiver of fees and/or reimbursement of expenses by Funds Management were made first from fund level expenses on a proportionate basis and then from class specific expenses. Funds Management has committed through October 31, 2017 to waive fees and/or reimburse expenses to the extent necessary to cap the Fund’s expenses at 0.74% for Class A shares, 1.49% for Class C shares, and 0.49% for Institutional Class shares. After this time, the cap may be increased or the commitment to maintain the cap may be terminated only with the approval of the Board of Trustees.
During the six months ended December 31, 2016, State Street Bank and Trust Company, the Fund’s custodian, reimbursed the Fund $5,249 for certain out-of-pocket expenses that were billed to the Fund in error from 1998-2015. This amount is included in interest income on the Statement of Operations. In addition, Funds Management was also reimbursed $4,188 for waivers/reimbursements it made to the Fund during the period the Fund was erroneously billed.
Distribution fees
The Trust has adopted a distribution plan for Class B and Class C shares of the Fund pursuant to Rule 12b-1 under the 1940 Act. Distribution fees are charged to Class B and Class C shares and paid to Wells Fargo Funds Distributor, LLC (“Funds Distributor”), the principal underwriter, at an annual rate of 0.75% of the average daily net assets of Class B and Class C shares.
In addition, Funds Distributor is entitled to receive the front-end sales charge from the purchase of Class A shares and a contingent deferred sales charge on the redemption of certain Class A shares. Funds Distributor is also entitled to receive the contingent deferred sales charges from redemptions of Class B and Class C shares. For the six months ended December 31, 2016, Funds Distributor received $3,187 from the sale of Class A shares.
| | | | |
| 20 | | Wells Fargo Pennsylvania Tax-Free Fund | | Notes to financial statements (unaudited) |
Shareholder servicing fees
The Trust has entered into contracts with one or more shareholder servicing agents, whereby Class A, Class B, and Class C of the Fund are charged a fee at an annual rate of 0.25% of the average daily net assets of each respective class.
A portion of these total shareholder servicing fees were paid to affiliates of Wells Fargo.
5. INVESTMENT PORTFOLIO TRANSACTIONS
Purchases and sales of investments, excluding U.S. government obligations (if any) and short-term securities, for the six months ended December 31, 2016 were $19,751,119 and $38,774,741, respectively.
The Fund may purchase or sell investment securities to other Wells Fargo funds under procedures adopted by the Board of Trustees. The procedures have been designed to ensure that these interfund transactions, which generally do not incur broker commissions, are effected at current market prices. Interfund trades are included within the respective purchases and sales amounts shown.
6. BANK BORROWINGS
The Trust (excluding the money market funds and certain other funds) and Wells Fargo Variable Trust are parties to a $250,000,000 revolving credit agreement whereby the Fund is permitted to use bank borrowings for temporary or emergency purposes, such as to fund shareholder redemption requests. Interest under the credit agreement is charged to the Fund based on a borrowing rate equal to the higher of the Federal Funds rate in effect on that day plus 1.25% or the overnight LIBOR rate in effect on that day plus 1.25%. In addition, an annual commitment fee equal to 0.25% of the unused balance is allocated to each participating fund. Prior to August 30, 2016, the revolving credit agreement amount was $200,000,000 and the annual commitment fee was equal to 0.20% of the unused balance which was allocated to each participating fund.
For the six months ended December 31, 2016, there were no borrowings by the Fund under the agreement.
7. CONCENTRATION RISK
The Fund invests a substantial portion of its assets in issuers of municipal debt securities located in a single state or territories of the U.S. Therefore, it may be more affected by economic and political developments in that state or region than would be a comparable general tax-exempt fund.
8. INDEMNIFICATION
Under the Trust’s organizational documents, the officers and Trustees have been granted certain indemnification rights against certain liabilities that may arise out of performance of their duties to the Trust. Additionally, in the normal course of business, the Trust may enter into contracts with service providers that contain a variety of indemnification clauses. The Trust’s maximum exposure under these arrangements is dependent on future claims that may be made against the Fund and, therefore, cannot be estimated.
9. REGULATORY CHANGES
In October 2016, the Securities and Exchange Commission (“SEC”) adopted new rules and forms and amended existing rules and forms (together, “final rules”) intended to modernize and enhance the reporting and disclosure of information by registered investment companies and to enhance liquidity risk management by open-end mutual funds and exchange-traded funds. The final rules will enhance the quality of information available to investors and will allow the SEC to more effectively collect and use data reported by funds. In part, the final rules amend Regulation S-X and require standardized, enhanced disclosure about derivatives in the Fund’s financial statements, as well as other amendments. The compliance date for the amendments to Regulation S-X is August 1, 2017 while the compliance date for the new form types is June 1, 2018 and the compliance date for the liquidity risk management program requirements is December 1, 2018. Management is currently assessing the potential impact of these enhancements and their impact on the financial statement disclosures and reporting requirements.
| | | | | | |
| Other information (unaudited) | | Wells Fargo Pennsylvania Tax-Free Fund | | | 21 | |
PROXY VOTING INFORMATION
A description of the policies and procedures that the Fund uses to determine how to vote proxies relating to portfolio securities is available, upon request, by calling 1-800-222-8222, visiting our website at wellsfargofunds.com, or visiting the SEC website at sec.gov. Information regarding how the Fund voted proxies relating to portfolio securities during the most recent 12-month period ended June 30 is available on the Fund’s website at wellsfargofunds.com or by visiting the SEC website at sec.gov.
PORTFOLIO HOLDINGS INFORMATION
The complete portfolio holdings for the Fund are publicly available monthly on the Fund’s website (wellsfargofunds.com), on a one-month delayed basis. In addition, top ten holdings information (excluding derivative positions) for the Fund is publicly available on the Fund’s website on a monthly, seven-day or more delayed basis. The Fund files its complete schedule of portfolio holdings with the SEC for the first and third quarters of each fiscal year on Form N-Q, which is available by visiting the SEC website at sec.gov. In addition, the Fund’s Form N-Q may be reviewed and copied at the SEC’s Public Reference Room in Washington, DC, and at regional offices in New York City, at 233 Broadway, and in Chicago, at 175 West Jackson Boulevard, Suite 900. Information about the Public Reference Room may be obtained by calling 1-800-SEC-0330.
| | | | |
| 22 | | Wells Fargo Pennsylvania Tax-Free Fund | | Other information (unaudited) |
BOARD OF TRUSTEES AND OFFICERS
Each of the Trustees and Officers1 listed in the table below acts in identical capacities for each fund in the Wells Fargo family of funds, which consists of 139 mutual funds comprising the Wells Fargo Funds Trust, Wells Fargo Variable Trust, Wells Fargo Master Trust and four closed-end funds (collectively the “Fund Complex”). This table should be read in conjunction with the Prospectus and the Statement of Additional Information2. The mailing address of each Trustee and Officer is 525 Market Street, 12th Floor, San Francisco, CA 94105. Each Trustee and Officer serves an indefinite term, however, each Trustee serves such term until reaching the mandatory retirement age established by the Trustees.
Independent Trustees
| | | | | | |
Name and
year of birth | | Position held and
length of service* | | Principal occupations during past five years or longer | | Current other
public company or
investment company
directorships |
| William R. Ebsworth (Born 1957) | | Trustee, since 2015 | | Retired. From 1984 to 2013, equities analyst, portfolio manager, research director and chief financial officer at Fidelity Management and Research Company in Boston, Tokyo, and Hong Kong and retired in 2013 as Chief Investment Officer of Fidelity Strategic Advisers, Inc. where he lead a team of investment professionals managing client assets. Prior thereto, Board member of Hong Kong Securities Clearing Co., Hong Kong Options Clearing Corp., the Thailand International Fund, Ltd., Fidelity Investments Life Insurance Company, and Empire Fidelity Investments Life Insurance Company. Board member of the Fonté Foundation (non-profit organization) and the Vincent Memorial Hospital Endowment (non-profit organization), where he serves on the Investment Committee and as a Chair of the Audit Committee. Mr. Ebsworth is a CFA® charterholder and an Adjunct Lecturer, Finance, at Babson College. | | Asset Allocation Trust |
| Jane A. Freeman (Born 1953) | | Trustee, since 2015 | | Retired. From 2012 to 2014 and 1999 to 2008, Chief Financial Officer of Scientific Learning Corporation. From 2008 to 2012, Ms. Freeman provided consulting services related to strategic business projects. Prior to 1999, Portfolio Manager at Rockefeller & Co. and Scudder, Stevens & Clark. Board member of the Harding Loevner Funds from 1996 to 2014, serving as both Lead Independent Director and chair of the Audit Committee. Board member of the Russell Exchange Traded Funds Trust from 2011 to 2012 and the chair of the Audit Committee. Ms. Freeman is a Board Member of Ruth Bancroft Garden (non-profit organization) and an inactive chartered financial analyst. | | Asset Allocation Trust |
| Peter G. Gordon** (Born 1942) | | Trustee, since 1998; Chairman, since 2005 | | Co-Founder, Retired Chairman, President and CEO of Crystal Geyser Water Company. Trustee Emeritus, Colby College. | | Asset Allocation Trust |
| Isaiah Harris, Jr. (Born 1952) | | Trustee, since 2009 | | Retired. Chairman of the Board of CIGNA Corporation since 2009, and Director since 2005. From 2003 to 2011, Director of Deluxe Corporation. Prior thereto, President and CEO of BellSouth Advertising and Publishing Corp. from 2005 to 2007, President and CEO of BellSouth Enterprises from 2004 to 2005 and President of BellSouth Consumer Services from 2000 to 2003. Emeritus member of the Iowa State University Foundation Board of Governors. Emeritus Member of the Advisory Board of Iowa State University School of Business. Advisory Board Member, Palm Harbor Academy (charter school). Advisory Board Member, Child Evangelism Fellowship (non-profit). Mr. Harris is a certified public accountant (inactive status). | | CIGNA Corporation; Asset Allocation Trust |
| Judith M. Johnson (Born 1949) | | Trustee, since 2008;
Audit Committee
Chairman, since 2008 | | Retired. Prior thereto, Chief Executive Officer and Chief Investment Officer of Minneapolis Employees Retirement Fund from 1996 to 2008. Ms. Johnson is an attorney, certified public accountant and a certified managerial accountant. | | Asset Allocation Trust |
| David F. Larcker (Born 1950) | | Trustee, since 2009 | | James Irvin Miller Professor of Accounting at the Graduate School of Business, Stanford University, Director of the Corporate Governance Research Initiative and Senior Faculty of The Rock Center for Corporate Governance since 2006. From 2005 to 2008, Professor of Accounting at the Graduate School of Business, Stanford University. Prior thereto, Ernst & Young Professor of Accounting at The Wharton School, University of Pennsylvania from 1985 to 2005. | | Asset Allocation Trust |
| | | | | | |
| Other information (unaudited) | | Wells Fargo Pennsylvania Tax-Free Fund | | | 23 | |
| | | | | | |
Name and
year of birth | | Position held and
length of service* | | Principal occupations during past five years or longer | | Current other
public company or
investment company
directorships |
| Olivia S. Mitchell (Born 1953) | | Trustee, since 2006 | | International Foundation of Employee Benefit Plans Professor, Wharton School of the University of Pennsylvania since 1993. Director of Wharton’s Pension Research Council and Boettner Center on Pensions & Retirement Research, and Research Associate at the National Bureau of Economic Research. Previously, Cornell University Professor from 1978 to 1993. | | Asset Allocation Trust |
| Timothy J. Penny (Born 1951) | | Trustee, since 1996 | | President and Chief Executive Officer of Southern Minnesota Initiative Foundation, a non-profit organization, since 2007 and Senior Fellow at the Humphrey Institute Policy Forum at the University of Minnesota since 1995. Member of the Board of Trustees of NorthStar Education Finance, Inc., a non-profit organization, since 2007. | | Asset Allocation Trust |
| Michael S. Scofield (Born 1943) | | Trustee, since 2010 | | Served on the Investment Company Institute’s Board of Governors and Executive Committee from 2008-2011 as well the Governing Council of the Independent Directors Council from 2006-2011 and the Independent Directors Council Executive Committee from 2008-2011. Chairman of the IDC from 2008-2010. Institutional Investor (Fund Directions) Trustee of Year in 2007. Trustee of the Evergreen Funds complex (and its predecessors) from 1984 to 2010. Chairman of the Evergreen Funds from 2000-2010. Former Trustee of the Mentor Funds. Retired Attorney, Law Offices of Michael S. Scofield. | | Asset Allocation Trust |
| * | Length of service dates reflect the Trustee’s commencement of service with the Trust’s predecessor entities, where applicable. |
| ** | Peter Gordon is expected to retire on December 31, 2017. |
Officers
| | | | | | |
Name and
year of birth | | Position held and
length of service | | Principal occupations during past five years or longer | | |
Andrew Owen3
(Born 1960) | | President, since 2017 | | Executive Vice President of Wells Fargo Bank, N.A. and President of Wells Fargo & Company and Head of Affiliated Managers, Wells Fargo Asset Management, since 2014. Executive Vice President responsible for marketing, investments and product development for Wells Fargo Funds Management, LLC, from 2009 to 2014. | | |
Nancy Wiser1
(Born 1967) | | Treasurer, since 2012 | | Executive Vice President of Wells Fargo Funds Management, LLC since 2011. Chief Operating Officer and Chief Compliance Officer at LightBox Capital Management LLC, from 2008 to 2011. | | |
| C. David Messman (Born 1960) | | Secretary, since 2000; Chief Legal Officer, since 2003 | | Senior Vice President and Secretary of Wells Fargo Funds Management, LLC since 2001. Assistant General Counsel of Wells Fargo Bank, N.A. since 2013 and Vice President and Managing Counsel of Wells Fargo Bank, N.A. from 1996 to 2013. | | |
| Michael Whitaker (Born 1967) | | Chief Compliance Officer, since 2016 | | Executive Vice President of Wells Fargo Funds Management, LLC since 2016. Chief Compliance Officer of Fidelity’s Fixed Income Funds and Asset Allocation Funds from 2008 to 2016, Compliance Officer of FMR Co., Inc. from 2014 to 2016, Fidelity Investments Money Management, Inc. from 2014 to 2016, Fidelity Investments from 2007 to 2016. | | |
David Berardi
(Born 1975) | | Assistant Treasurer, since 2009 | | Vice President of Wells Fargo Funds Management, LLC since 2009. Vice President of Evergreen Investment Management Company, LLC from 2008 to 2010. Manager of Fund Reporting and Control for Evergreen Investment Management Company, LLC from 2004 to 2010. | | |
| Jeremy DePalma1 (Born 1974) | | Assistant Treasurer, since 2009 | | Senior Vice President of Wells Fargo Funds Management, LLC since 2009. Senior Vice President of Evergreen Investment Management Company, LLC from 2008 to 2010 and head of the Fund Reporting and Control Team within Fund Administration from 2005 to 2010. | | |
| 1 | Nancy Wiser acts as Treasurer of 70 funds in the Fund Complex. Jeremy DePalma acts as Treasurer of 69 funds and Assistant Treasurer of 70 funds in the Fund Complex. |
| 2 | The Statement of Additional Information includes additional information about the Trustees and is available, without charge, upon request, by calling 1-800-222-8222 or by visiting the website at wellsfargofunds.com. |
| 3 | Andrew Owen became President on January 1, 2017. |
| | | | |
| 24 | | Wells Fargo Pennsylvania Tax-Free Fund | | List of abbreviations |
The following is a list of common abbreviations for terms and entities that may have appeared in this report.
| ACA | — ACA Financial Guaranty Corporation |
| ADR | — American depositary receipt |
| ADS | — American depositary shares |
| AGC | — Assured Guaranty Corporation |
| AGM | — Assured Guaranty Municipal |
| Ambac | — Ambac Financial Group Incorporated |
| AMT | — Alternative minimum tax |
| BAN | — Bond anticipation notes |
| BHAC | — Berkshire Hathaway Assurance Corporation |
| CAB | — Capital appreciation bond |
| CCAB | — Convertible capital appreciation bond |
| CDA | — Community Development Authority |
| CDO | — Collateralized debt obligation |
| DRIVER | — Derivative inverse tax-exempt receipts |
| DW&P | — Department of Water & Power |
| DWR | — Department of Water Resources |
| ECFA | — Educational & Cultural Facilities Authority |
| EDA | — Economic Development Authority |
| EDFA | — Economic Development Finance Authority |
| ETF | — Exchange-traded fund |
| FDIC | — Federal Deposit Insurance Corporation |
| FFCB | — Federal Farm Credit Banks |
| FGIC | — Financial Guaranty Insurance Corporation |
| FHA | — Federal Housing Administration |
| FHLB | — Federal Home Loan Bank |
| FHLMC | — Federal Home Loan Mortgage Corporation |
| FICO | — The Financing Corporation |
| FNMA | — Federal National Mortgage Association |
| GDR | — Global depositary receipt |
| GNMA | — Government National Mortgage Association |
| HCFR | — Healthcare facilities revenue |
| HEFA | — Health & Educational Facilities Authority |
| HEFAR | — Higher education facilities authority revenue |
| HFA | — Housing Finance Authority |
| HFFA | — Health Facilities Financing Authority |
| HUD | — Department of Housing and Urban Development |
| IDA | — Industrial Development Authority |
| IDAG | — Industrial Development Agency |
| KRW | — Republic of Korea won |
| LIBOR | — London Interbank Offered Rate |
| LIFER | — Long Inverse Floating Exempt Receipts |
| LLC | — Limited liability company |
| LLLP | — Limited liability limited partnership |
| LLP | — Limited liability partnership |
| MBIA | — Municipal Bond Insurance Association |
| MFHR | — Multifamily housing revenue |
| MSTR | — Municipal securities trust receipts |
| MUD | — Municipal Utility District |
| National | — National Public Finance Guarantee Corporation |
| PCFA | — Pollution Control Financing Authority |
| PCL | — Public Company Limited |
| PCR | — Pollution control revenue |
| PFA | — Public Finance Authority |
| PFFA | — Public Facilities Financing Authority |
| PFOTER | — Puttable floating option tax-exempt receipts |
| plc | — Public limited company |
| PUTTER | — Puttable tax-exempt receipts |
| R&D | — Research & development |
| Radian | — Radian Asset Assurance |
| RAN | — Revenue anticipation notes |
| RDA | — Redevelopment Authority |
| RDFA | — Redevelopment Finance Authority |
| REIT | — Real estate investment trust |
| ROC | — Reset option certificates |
| SAVRS | — Select auction variable rate securities |
| SBA | — Small Business Authority |
| SDR | — Swedish depositary receipt |
| SFHR | — Single-family housing revenue |
| SFMR | — Single-family mortgage revenue |
| SPA | — Standby purchase agreement |
| SPDR | — Standard & Poor’s Depositary Receipts |
| SPEAR | — Short Puttable Exempt Adjustable Receipts |
| STRIPS | — Separate trading of registered interest and |
| TAN | — Tax anticipation notes |
| TIPS | — Treasury inflation-protected securities |
| TRAN | — Tax revenue anticipation notes |
| TTFA | — Transportation Trust Fund Authority |
| TVA | — Tennessee Valley Authority |

For more information
More information about Wells Fargo Funds is available free upon request. To obtain literature, please write, email, visit the Fund’s website, or call:
Wells Fargo Funds
P.O. Box 8266
Boston, MA 02266-8266
Email: fundservice@wellsfargo.com
Website: wellsfargofunds.com
Individual investors: 1-800-222-8222
Retail investment professionals: 1-888-877-9275
Institutional investment professionals: 1-866-765-0778
This report and the financial statements contained herein are submitted for the general information of the shareholders of the Fund. If this report is used for promotional purposes, distribution of the report must be accompanied or preceded by a current prospectus. Before investing, please consider the investment objectives, risks, charges, and expenses of the investment. For a current prospectus and, if available, a summary prospectus, containing this information, call 1-800-222-8222 or visit the Fund’s website at wellsfargofunds.com. Read the prospectus carefully before you invest or send money.
Wells Fargo Asset Management (WFAM) is a trade name used by the asset management businesses of Wells Fargo & Company. Wells Fargo Funds Management, LLC, a wholly owned subsidiary of Wells Fargo & Company, provides investment advisory and administrative services for Wells Fargo Funds. Other affiliates of Wells Fargo & Company provide subadvisory and other services for the funds. The funds are distributed by Wells Fargo Funds Distributor, LLC, Member FINRA, an affiliate of Wells Fargo & Company. Neither Wells Fargo Funds Management nor Wells Fargo Funds Distributor has Fund customer accounts/assets, and neither provides investment advice/recommendations or acts as an investment advice fiduciary to any investor.
NOT FDIC INSURED ◾ NO BANK GUARANTEE ◾ MAY LOSE VALUE
© 2016 Wells Fargo Funds Management, LLC. All rights reserved.
| | |
 | | 300484 02-17 SA255/SAR255 12-16 |
Semi-Annual Report
December 31, 2016

Wells Fargo Short-Term Municipal Bond Fund


Reduce clutter. Save trees.
Sign up for electronic delivery of prospectuses and shareholder reports at wellsfargo.com/advantagedelivery
Contents
The views expressed and any forward-looking statements are as of December 31, 2016, unless otherwise noted, and are those of the Fund managers and/or Wells Fargo Funds Management, LLC. Discussions of individual securities, or the markets generally, or any Wells Fargo Fund are not intended as individual recommendations. Future events or results may vary significantly from those expressed in any forward-looking statements. The views expressed are subject to change at any time in response to changing circumstances in the market. Wells Fargo Funds Management, LLC and the Fund disclaim any obligation to publicly update or revise any views expressed or forward-looking statements.
NOT FDIC INSURED ◾ NO BANK GUARANTEE ◾ MAY LOSE VALUE
| | | | |
| 2 | | Wells Fargo Short-Term Municipal Bond Fund | | Letter to shareholders (unaudited) |

Andrew Owen
President
Wells Fargo Funds
The Bloomberg Barclays Municipal Bond Index,1 a broad measure tracking investment-grade municipal bonds, lost 3.91% during the six-month reporting period.
Dear Shareholder:
As the new president of Wells Fargo Funds now that Karla Rabusch is retiring from that position after nearly 14 years, I am pleased to offer you this semi-annual report for the Wells Fargo Short-Term Municipal Bond Fund for the six-month period that ended December 31, 2016. The Federal Reserve (Fed) raised the federal funds rate in December by 0.25%. Municipal bond yields rose sharply in the fourth quarter. The Bloomberg Barclays Municipal Bond Index,1 a broad measure tracking investment-grade municipal bonds, lost 3.91% during the six-month reporting period.
Municipal bond yields rose during the reporting period.
The municipal market reversed course in the second half of 2016, with yields increasing and prices declining. Initially the sell-off was driven by negative supply and demand trends, also known as technical factors. By the fourth quarter, fund flows turned negative (reversing a trend of 54 weeks of positive flows) and municipal bond supply increased. These deteriorating technical factors, along with the expectation of an expansionary fiscal policy and lower tax rates under the new administration, drove market volatility; credit spreads widened and the yield curve steepened as the market sold-off.
Stronger economic indicators drove monetary policy.
On December 14, the Fed hiked the short-term interest rate by 0.25% to reach a target range of 0.50% to 0.75%. This was the second rate increase in more than 10 years, with the Fed citing job gains and lower than expected unemployment of 4.6%. The Fed confirmed the continuation of an accommodative monetary policy to support a stronger labor market and reiterated its long-term objective of a 2% inflation rate, which increased slightly during the fourth quarter but fell short of the benchmark. The Fed expressed confidence in the economy’s progress and expects this positive trajectory to continue. Both sentiments helped to bolster the Fed’s expectation of three additional rate increases during 2017.
Meanwhile, the Bank of England continued its quantitative-easing program and lowered the official bank rate to 0.25% in August 2016. The Bank of Japan maintained its negative interest rate put in place earlier in the year, and in September announced an interest rate target for 10-year government bonds—keeping the yield at zero—as it struggles to accelerate economic growth. In December, the European Central Bank announced that it will extend its quantitative-easing program and continue purchasing large amounts of eurozone corporate and government debt each month through December 2017.
U.S. economic data released during the fourth quarter showed that U.S. real gross domestic product increased at an annual 3.5% rate in the third quarter, the largest increase since mid-2014. Business investment by U.S. companies was mixed, with a 12.0% increase in structures and 4.5% decrease in equipment over the prior quarter on an annualized basis. Consumer confidence hit pre-recession levels for the first time in November, and increased again in December. The dollar strengthened during the quarter’s post-election period.
Supply and demand trends reflected volatility of municipals.
Demand for municipal debt, as measured by cash flows to municipal bond mutual funds, was negative for the reporting period. There were $19 billion of inflows from July through October, but a sharp reversal occurred post-election, with $26 billion of redemptions in the last two months of the year. This followed a noteworthy 54 consecutive weeks of inflows. On the supply side, August through
| 1 | The Bloomberg Barclays Municipal Bond Index (formerly known as Barclays Municipal Bond Index) is an unmanaged index composed of long-term tax-exempt bonds with a minimum credit rating of Baa. You cannot invest directly in an index. |
| | | | | | |
| Letter to shareholders (unaudited) | | Wells Fargo Short-Term Municipal Bond Fund | | | 3 | |
October saw 30-year record-breaking volumes each month; both refundings and new issuance were up. These levels were attributed to deals pulled forward in anticipation of higher interest rates. Not surprisingly, December volume was down 25% year-over-year to $19 billion. Total municipal bond issuance for the period was $219 billion; new issuance outpaced refundings by $18 billion.
Municipal credit fundamentals were solid.
Overall, municipal credit was sound for the period. The most significant development was the election of Ricardo Rossello as governor of the Commonwealth of Puerto Rico. In the past, prices of Puerto Rico bonds reflected negative credit considerations, including defaults on its securities in 2015 and early 2016, but recent events point to a potentially more positive fiscal environment. Rossello campaigned, in part, on a platform that included promises to ultimately pay 100% of interest due on Puerto Rico’s outstanding municipal debt, negotiate with bondholders, and ration government expenditures. This stance is a major shift from his predecessor who focused on a bankruptcy mechanism.
Since the end of the financial crisis, structural changes in the fixed-income markets have reduced trading liquidity (the degree to which assets can be bought or sold without affecting the price). New regulations and capital requirements have caused traditional liquidity suppliers (banks and broker/dealers) to be more risk averse and hold less inventory. Meanwhile, corporate debt issuance has spiked as companies finance themselves at record-low yields, bond mutual funds hold larger amounts of this new debt supply, trading volumes are lower, and large-size trades are more difficult to execute. However, fixed-income markets appeared to function well over the past year with sufficient liquidity.
Don’t let short-term uncertainty derail long-term investment goals.
Periods of uncertainty can present challenges, but experience has taught us that maintaining long-term investment goals can be an effective way to plan for the future. To help you create a sound strategy based on your personal goals and risk tolerance, Wells Fargo Funds offers more than 100 mutual funds spanning a wide range of asset classes and investment styles. Although diversification cannot guarantee an investment profit or prevent losses, we believe it can be an effective way to manage investment risk and potentially smooth out overall portfolio performance. We encourage investors to know their investments and to understand that appropriate levels of risk-taking may unlock opportunities.
Thank you for choosing to invest in Wells Fargo Funds. We appreciate your confidence in us and remain committed to helping you meet your financial needs.
Sincerely,

Andrew Owen
President
Wells Fargo Funds
Periods of uncertainty can present challenges, but experience has taught us that maintaining long-term investment goals can be an effective way to plan for the future.
For further information about your Fund, contact your investment professional, visit our website at wellsfargofunds.com, or call us directly at 1-800-222-8222. We are available 24 hours a day, 7 days a week.
| | | | |
| 4 | | Wells Fargo Short-Term Municipal Bond Fund | | Performance highlights (unaudited) |
Investment objective
The Fund seeks current income exempt from federal income tax consistent with capital preservation.
Manager
Wells Fargo Funds Management, LLC
Subadviser
Wells Capital Management Incorporated
Portfolio managers
Wendy Casetta
Lyle J. Fitterer, CFA®, CPA
Average annual total returns (%) as of December 31, 20161
| | | | | | | | | | | | | | | | | | | | | | | | | | | | | | | | | | |
| | | | | Including sales charge | | | Excluding sales charge | | | Expense ratios2 (%) | |
| | | Inception date | | 1 year | | | 5 year | | | 10 year | | | 1 year | | | 5 year | | | 10 year | | | Gross | | | Net3 | |
| Class A (WSMAX) | | 7-18-2008 | | | (2.25 | ) | | | 0.56 | | | | 2.13 | | | | (0.26 | ) | | | 0.97 | | | | 2.34 | | | | 0.75 | | | | 0.63 | |
| Class C (WSSCX) | | 1-31-2003 | | | (2.00 | ) | | | 0.22 | | | | 1.55 | | | | (1.00 | ) | | | 0.22 | | | | 1.55 | | | | 1.50 | | | | 1.38 | |
| Administrator Class (WSTMX) | | 7-30-2010 | | | – | | | | – | | | | – | | | | (0.23 | ) | | | 0.96 | | | | 2.31 | | | | 0.69 | | | | 0.60 | |
| Institutional Class (WSBIX) | | 3-31-2008 | | | – | | | | – | | | | – | | | | (0.02 | ) | | | 1.20 | | | | 2.53 | | | | 0.42 | | | | 0.40 | |
| Bloomberg Barclays 1-3 Year Composite Municipal Bond Index4 | | – | | | – | | | | – | | | | – | | | | 0.19 | | | | 0.88 | | | | 2.26 | | | | – | | | | – | |
Figures quoted represent past performance, which is no guarantee of future results, and do not reflect taxes that a shareholder may pay on fund distributions or the redemption of fund shares. Investment return and principal value of an investment will fluctuate so that an investor’s shares, when redeemed, may be worth more or less than their original cost. Performance shown without sales charges would be lower if sales charges were reflected. Current performance may be lower or higher than the performance data quoted, which assumes the reinvestment of dividends and capital gains. Current month-end performance is available on the Fund’s website, wellsfargofunds.com.
Index returns do not include transaction costs associated with buying and selling securities, any mutual fund fees or expenses, or any taxes. It is not possible to invest directly in an index.
For Class A shares, the maximum front-end sales charge is 2.00%. For Class C shares, the maximum contingent deferred sales charge is 1.00%. Performance including a contingent deferred sales charge assumes the sales charge for the corresponding time period. Administrator Class and Institutional Class shares are sold without a front-end sales charge or contingent deferred sales charge.
Bond values fluctuate in response to the financial condition of individual issuers, general market and economic conditions, and changes in interest rates. Changes in market conditions and government policies may lead to periods of heightened volatility in the bond market and reduced liquidity for certain bonds held by the Fund. In general, when interest rates rise, bond values fall and investors may lose principal value. Interest-rate changes and their impact on the Fund and its share price can be sudden and unpredictable. High-yield securities have a greater risk of default and tend to be more volatile than higher-rated debt securities. The use of derivatives may reduce returns and/or increase volatility. Certain investment strategies tend to increase the total risk of an investment (relative to the broader market). The Fund is exposed to high-yield securities risk and municipal securities risk. Consult the Fund’s prospectus for additional information on these and other risks. A portion of the Fund’s income may be subject to federal, state, and/or local income taxes or the Alternative Minimum Tax (AMT). Any capital gains distributions may be taxable.
Please see footnotes on page 5.
| | | | | | |
| Performance highlights (unaudited) | | Wells Fargo Short-Term Municipal Bond Fund | | | 5 | |
|
| Effective maturity distribution as of December 31, 20165 |
|
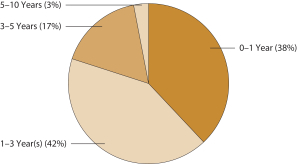
|
|
| Credit quality as of December 31, 20166 |
|
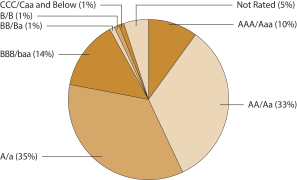
|
| 1 | Historical performance shown for Class A shares prior to their inception reflects the performance of the former Investor Class shares, and includes the higher expenses applicable to the former Investor Class shares (except during those periods in which expenses of Class A shares would have been higher than those of the former Investor Class shares). If these expenses had not been included, returns would be higher. Historical performance shown for Administrator Class shares prior to their inception reflects the performance of Institutional Class shares, adjusted to reflect the higher expenses applicable to Administrator Class shares. Historical performance shown for Institutional Class shares prior to their inception reflects the performance of the former Investor Class shares, and includes the higher expenses applicable to the former Investor Class shares. If these expenses had not been included, returns would be higher. |
| 2 | Reflects the expense ratios as stated in the most recent prospectuses. The expense ratios shown are subject to change and may differ from the annualized expense ratios shown in the financial highlights of this report. |
| 3 | The manager has contractually committed through October 31, 2017, to waive fees and/or reimburse expenses to the extent necessary to cap the Fund’s Total Annual Fund Operating Expenses After Fee Waiver at the amounts shown. After this time, the cap may be increased or the commitment to maintain the cap may be terminated only with the approval of the Board of Trustees. Brokerage commissions, stamp duty fees, interest, taxes, acquired fund fees and expenses, and extraordinary expenses are excluded from the expense cap. Without this cap, the Fund’s returns would have been lower. |
| 4 | The Bloomberg Barclays 1-3 Year Composite Municipal Bond Index (formerly known as Barclays 1-3 Year Composite Municipal Bond Index) is a blended index weighted 50% in the Bloomberg Barclays 1-Year Municipal Bond Index (fomerly known as Barclays 1-Year Municipal Bond Index) and 50% in the Bloomberg Barclays 3-Year Municipal Bond Index (fomerly known as Barclays 3-Year Municipal Bond Index). You cannot invest directly in an index. |
| 5 | Amounts are calculated based on the total investments of the Fund. These amounts are subject to change and may have changed since the date specified. |
| 6 | The credit quality distribution of portfolio holdings reflected in the chart is based on ratings from Standard & Poor’s, Moody’s Investors Service, and/ or Fitch Ratings Ltd. Credit quality ratings apply to the underlying holdings of the Fund and not to the Fund itself. The percentages of the Fund’s portfolio with the ratings depicted in the chart are calculated based on the total market value of fixed income securities held by the Fund. If a security was rated by all three rating agencies, the middle rating was utilized. If rated by two of three rating agencies, the lower rating was utilized, and if rated by one of the rating agencies, that rating was utilized. Standard & Poor’s rates the creditworthiness of bonds, ranging from AAA (highest) to D (lowest). Ratings from A to CCC may be modified by the addition of a plus (+) or minus (-) sign to show relative standing within the rating categories. Standard & Poor’s rates the creditworthiness of short-term notes from SP-1 (highest) to SP-3 (lowest). Moody’s rates the creditworthiness of bonds, ranging from Aaa (highest) to C (lowest). Ratings Aa to B may be modified by the addition of a number 1 (highest) to 3 (lowest) to show relative standing within the ratings categories. Moody’s rates the creditworthiness of short-term U.S. tax-exempt municipal securities from MIG 1/VMIG 1 (highest) to SG (lowest). Fitch rates the creditworthiness of bonds, ranging from AAA (highest) to D (lowest). Credit quality distribution is subject to change and may have changed since the date specified. |
| | | | |
| 6 | | Wells Fargo Short-Term Municipal Bond Fund | | Fund expenses (unaudited) |
As a shareholder of the Fund, you incur two types of costs: (1) transaction costs, including sales charges (loads) on purchase payments and contingent deferred sales charges (if any) on redemptions and (2) ongoing costs, including management fees, distribution (12b-1) and/or shareholder servicing fees, and other Fund expenses. This example is intended to help you understand your ongoing costs (in dollars) of investing in the Fund and to compare these costs with the ongoing costs of investing in other mutual funds.
The example is based on an investment of $1,000 invested at the beginning of the six-month period and held for the entire period from July 1, 2016 to December 31, 2016.
Actual expenses
The “Actual” line of the table below provides information about actual account values and actual expenses. You may use the information in this line, together with the amount you invested, to estimate the expenses that you paid over the period. Simply divide your account value by $1,000 (for example, an $8,600 account value divided by $1,000 = 8.6), then multiply the result by the number in the “Actual” line under the heading entitled “Expenses paid during period” for your applicable class of shares to estimate the expenses you paid on your account during this period.
Hypothetical example for comparison purposes
The “Hypothetical” line of the table below provides information about hypothetical account values and hypothetical expenses based on the Fund’s actual expense ratio and an assumed rate of return of 5% per year before expenses, which is not the Fund’s actual return. The hypothetical account values and expenses may not be used to estimate the actual ending account balance or expenses you paid for the period. You may use this information to compare the ongoing costs of investing in the Fund and other funds. To do so, compare this 5% hypothetical example with the 5% hypothetical examples that appear in the shareholder reports of the other funds.
Please note that the expenses shown in the table are meant to highlight your ongoing costs only and do not reflect any transactional costs, such as sales charges (loads) and contingent deferred sales charges. Therefore, the “Hypothetical” line of the table is useful in comparing ongoing costs only and will not help you determine the relative total costs of owning different funds. In addition, if these transactional costs were included, your costs would have been higher.
| | | | | | | | | | | | | | | | |
| | | Beginning
account value
7-1-2016 | | | Ending
account value
12-31-2016 | | | Expenses
paid during
the period¹ | �� | | Annualized net
expense ratio | |
Class A | | | | | | | | | | | | | | | | |
Actual | | $ | 1,000.00 | | | $ | 989.65 | | | $ | 3.15 | | | | 0.63 | % |
Hypothetical (5% return before expenses) | | $ | 1,000.00 | | | $ | 1,021.97 | | | $ | 3.20 | | | | 0.63 | % |
Class C | | | | | | | | | | | | | | | | |
Actual | | $ | 1,000.00 | | | $ | 985.92 | | | $ | 6.89 | | | | 1.38 | % |
Hypothetical (5% return before expenses) | | $ | 1,000.00 | | | $ | 1,018.20 | | | $ | 7.00 | | | | 1.38 | % |
Administrator Class | | | | | | | | | | | | | | | | |
Actual | | $ | 1,000.00 | | | $ | 989.82 | | | $ | 3.00 | | | | 0.60 | % |
Hypothetical (5% return before expenses) | | $ | 1,000.00 | | | $ | 1,022.12 | | | $ | 3.05 | | | | 0.60 | % |
Institutional Class | | | | | | | | | | | | | | | | |
Actual | | $ | 1,000.00 | | | $ | 990.83 | | | $ | 2.00 | | | | 0.40 | % |
Hypothetical (5% return before expenses) | | $ | 1,000.00 | | | $ | 1,023.13 | | | $ | 2.03 | | | | 0.40 | % |
| 1 | Expenses paid is equal to the annualized net expense ratio of each class multiplied by the average account value over the period, multiplied by the number of days in the most recent fiscal half-year divided by the number of days in the fiscal year (to reflect the one-half-year period). |
| | | | | | |
| Portfolio of investments—December 31, 2016 (unaudited) | | Wells Fargo Short-Term Municipal Bond Fund | | | 7 | |
| | | | | | | | | | | | | | | | |
| Security name | | Interest rate | | | Maturity date | | | Principal | | | Value | |
| | | | |
Municipal Obligations: 97.76% | | | | | | | | | | | | | | | | |
| | | | |
| Alabama: 1.50% | | | | | | | | | | | | | | | | |
Alabama 21st Century Authority Series A (Tobacco Revenue) | | | 5.00 | % | | | 6-1-2017 | | | $ | 3,000,000 | | | $ | 3,047,610 | |
Alabama Black Belt Energy Gas District Series A (Utilities Revenue, Royal Bank of Canada LIQ) ± | | | 4.00 | | | | 7-1-2046 | | | | 10,000,000 | | | | 10,658,300 | |
Board of Education of Shelby County Alabama Public School Warrants Series 2016 (Tax Revenue) | | | 4.00 | | | | 2-1-2020 | | | | 410,000 | | | | 435,301 | |
Chatom AL Industrial Development Board Gulf Opportunity Zone PowerSouth Energy Cooperative Projects Series A (Utilities Revenue, National Rural Utilities Finance Corporation SPA) ± | | | 0.95 | | | | 11-15-2038 | | | | 22,765,000 | | | | 22,742,918 | |
Jefferson County AL Warrants Series C (GO Revenue) | | | 4.90 | | | | 4-1-2021 | | | | 26,520,000 | | | | 27,607,055 | |
Jefferson County AL Warrants Series D (Water & Sewer Revenue) | | | 5.00 | | | | 10-1-2018 | | | | 1,890,000 | | | | 1,963,351 | |
Mobile County AL Industrial Development Board PCR Alabama Power Company Barry Plant (Industrial Development Revenue) ± | | | 1.63 | | | | 7-15-2034 | | | | 12,500,000 | | | | 12,504,000 | |
| | | | |
| | | | | | | | | | | | | | | 78,958,535 | |
| | | | | | | | | | | | | | | | |
| | | | |
| Alaska: 0.03% | | | | | | | | | | | | | | | | |
Alaska IDA Snettisham Hydroelectric Project (Utilities Revenue) | | | 5.00 | | | | 1-1-2021 | | | | 1,400,000 | | | | 1,521,394 | |
| | | | | | | | | | | | | | | | |
| | | | |
| Arizona: 1.76% | | | | | | | | | | | | | | | | |
Arizona Board of Regents Certificate of Participation Series A (Education Revenue) | | | 5.00 | | | | 6-1-2021 | | | | 3,000,000 | | | | 3,370,020 | |
Cochise County AZ Community College District of Cochise County Series 2016A (Education Revenue, Build America Mutual Assurance Company Insured) | | | 5.00 | | | | 7-1-2020 | | | | 405,000 | | | | 445,184 | |
Cochise County AZ Community College District of Cochise County Series 2016A (Education Revenue, Build America Mutual Assurance Company Insured) | | | 5.00 | | | | 7-1-2021 | | | | 425,000 | | | | 474,011 | |
Maricopa County AZ Certificate of Participation (Miscellaneous Revenue) | | | 3.00 | | | | 7-1-2017 | | | | 3,500,000 | | | | 3,534,475 | |
Maricopa County AZ Certificate of Participation (Miscellaneous Revenue) | | | 5.00 | | | | 7-1-2017 | | | | 32,500,000 | | | | 33,145,450 | |
Maricopa County AZ Certificate of Participation (Miscellaneous Revenue) | | | 5.00 | | | | 7-1-2018 | | | | 6,100,000 | | | | 6,431,047 | |
Maricopa County AZ PCR Series A (Utilities Revenue) ± | | | 2.40 | | | | 6-1-2043 | | | | 9,800,000 | | | | 9,588,614 | |
Maricopa County AZ PCR Series B (Utilities Revenue) ± | | | 5.20 | | | | 6-1-2043 | | | | 2,500,000 | | | | 2,670,700 | |
Maricopa County AZ Unified School District #89 Refunding Bond Series 2016 (GO Revenue, Build America Mutual Assurance Company Insured) | | | 2.00 | | | | 7-1-2019 | | | | 2,265,000 | | | | 2,282,146 | |
Navajo Nation AZ Refunding Bond Series A (Miscellaneous Revenue) 144A | | | 2.90 | | | | 12-1-2020 | | | | 11,595,000 | | | | 11,396,262 | |
Navajo Nation AZ Tribal Utility Authority (Miscellaneous Revenue, Municipal Government Guaranty Insured) | | | 4.00 | | | | 1-1-2021 | | | | 12,108,000 | | | | 12,252,327 | |
Scottsdale AZ IDA Scottsdale Healthcare Series D (Health Revenue) | | | 5.00 | | | | 9-1-2017 | | | | 2,000,000 | | | | 2,044,460 | |
Verrado AZ Community Facilities District #1 Refunding Bond Series A (GO Revenue) 144A | | | 4.00 | | | | 7-15-2017 | | | | 1,365,000 | | | | 1,368,235 | |
Verrado AZ Community Facilities District #1 Refunding Bond Series A (GO Revenue) 144A | | | 4.00 | | | | 7-15-2018 | | | | 1,245,000 | | | | 1,249,034 | |
Yavapai County AZ IDA Waste Management Incorporated Project Series A2 (Resource Recovery Revenue) ± | | | 1.60 | | | | 3-1-2028 | | | | 2,500,000 | | | | 2,502,425 | |
| | | | |
| | | | | | | | | | | | | | | 92,754,390 | |
| | | | | | | | | | | | | | | | |
| | | | |
| California: 6.14% | | | | | | | | | | | | | | | | |
Bay Area Toll Authority California San Francisco Bay Area Toll Bridge Series B (Transportation Revenue) ± | | | 1.50 | | | | 4-1-2047 | | | | 13,660,000 | | | | 13,664,918 | |
California (GO Revenue) ± | | | 4.00 | | | | 12-1-2027 | | | | 55,200,000 | | | | 55,901,040 | |
California Golden State Tobacco Securitization Series 2954 (Tobacco Revenue, Morgan Stanley Bank LIQ) 144Aø | | | 1.27 | | | | 6-1-2047 | | | | 31,160,000 | | | | 31,160,000 | |
California HFA Home Mortgage Series G (Housing Revenue) | | | 4.95 | | | | 8-1-2023 | | | | 9,000,000 | | | | 9,023,670 | |
The accompanying notes are an integral part of these financial statements.
| | | | |
| 8 | | Wells Fargo Short-Term Municipal Bond Fund | | Portfolio of investments—December 31, 2016 (unaudited) |
| | | | | | | | | | | | | | | | |
| Security name | | Interest rate | | | Maturity date | | | Principal | | | Value | |
| | | | |
| California (continued) | | | | | | | | | | | | | | | | |
California Infrastructure & Economic Development Bank Museum Art Project Series A (Miscellaneous Revenue) ± | | | 2.28 | % | | | 12-1-2037 | | | $ | 12,000,000 | | | $ | 12,089,160 | |
California Infrastructure & Economic Development Bank Series A (Education Revenue) ± | | | 1.72 | | | | 8-1-2037 | | | | 25,460,000 | | | | 25,623,453 | |
California PCFA Solid Waste Disposal Waste Management Project Series A (Resource Recovery Revenue) ± | | | 1.65 | | | �� | 7-1-2031 | | | | 6,000,000 | | | | 6,002,700 | |
California PFA Village E Apartments Project Series A (Housing Revenue) ± | | | 1.15 | | | | 10-1-2019 | | | | 7,400,000 | | | | 7,385,348 | |
California Refunding Bond Series B (GO Revenue) ± | | | 1.47 | | | | 5-1-2017 | | | | 7,000,000 | | | | 7,000,070 | |
California Refunding Bond Series B (GO Revenue) ± | | | 1.62 | | | | 5-1-2018 | | | | 6,000,000 | | | | 6,038,640 | |
California Series D (GO Revenue) ± | | | 1.14 | | | | 12-1-2028 | | | | 27,000,000 | | | | 27,008,640 | |
California Series E (GO Revenue) ± | | | 1.27 | | | | 12-1-2029 | | | | 18,000,000 | | | | 18,016,200 | |
California Statewide CDA Health Facilities Catholic Series D (Health Revenue, AGM Insured) ±(m) | | | 0.99 | | | | 7-1-2041 | | | | 14,850,000 | | | | 14,850,000 | |
California Statewide CDA Health Facilities Catholic Series E (Health Revenue, AGM Insured) ±(m) | | | 0.84 | | | | 7-1-2040 | | | | 5,425,000 | | | | 5,425,000 | |
California Statewide CDA Health Facilities Catholic Series F (Health Revenue, AGM Insured) ±(m) | | | 0.99 | | | | 7-1-2040 | | | | 4,100,000 | | | | 4,100,000 | |
Chula Vista CA Elementary School Building Projects Certificate of Participation Series A (Miscellaneous Revenue, AGM Insured) | | | 5.00 | | | | 9-1-2017 | | | | 1,765,000 | | | | 1,810,625 | |
Chula Vista CA Elementary School Building Projects Certificate of Participation Series A (Miscellaneous Revenue, AGM Insured) | | | 5.00 | | | | 9-1-2018 | | | | 1,985,000 | | | | 2,102,909 | |
Chula Vista CA Industrial Development Revenue San Diego Gas & Electric Company Series A (Utilities Revenue) | | | 1.65 | | | | 7-1-2018 | | | | 5,570,000 | | | | 5,572,284 | |
Commerce CA RDA CAB Project #1 (Tax Revenue) ¤ | | | 0.00 | | | | 8-1-2021 | | | | 4,045,000 | | | | 3,240,935 | |
Compton CA Unified School District CAB Election of 2002 Series D (GO Revenue, Ambac Insured) ¤ | | | 0.00 | | | | 6-1-2017 | | | | 3,070,000 | | | | 3,051,887 | |
El Monte CA Union High School District (GO Revenue) | | | 5.00 | | | | 6-1-2018 | | | | 5,840,000 | | | | 6,140,877 | |
Foothill-Eastern CA Transportation Corridor Agency Series B1 (Transportation Revenue) ± | | | 5.00 | | | | 1-15-2053 | | | | 24,435,000 | | | | 24,864,567 | |
Oakland CA Unified School District Alameda County Election of 2012 (GO Revenue) | | | 5.00 | | | | 8-1-2018 | | | | 1,000,000 | | | | 1,059,020 | |
Oakland CA Unified School District Alameda County Election of 2012 (GO Revenue) | | | 5.00 | | | | 8-1-2019 | | | | 1,000,000 | | | | 1,088,970 | |
Palomar CA Pomerado Health CAB Election of 2004 Series A (GO Revenue, National Insured) ¤ | | | 0.00 | | | | 8-1-2019 | | | | 2,215,000 | | | | 2,099,665 | |
Palomar CA Pomerado Health Care District Certificate of Participation Series C (Health Revenue, AGM Insured) ±(m) | | | 1.90 | | | | 11-1-2036 | | | | 9,225,000 | | | | 9,225,000 | |
San Ysidro CA School District (GO Revenue, AGM Insured) ¤ | | | 0.00 | | | | 8-1-2047 | | | | 3,610,000 | | | | 467,856 | |
South San Francisco CA Unified School District BAN Series D (GO Revenue) ¤ | | | 0.00 | | | | 5-15-2017 | | | | 20,000,000 | | | | 19,926,000 | |
| | | | |
| | | | | | | | | | | | | | | 323,939,434 | |
| | | | | | | | | | | | | | | | |
| | | | |
| Colorado: 0.68% | | | | | | | | | | | | | | | | |
Aurora CO E-470 Public Highway Authority CAB Series B (Transportation Revenue, National Insured) ¤ | | | 0.00 | | | | 9-1-2018 | | | | 2,000,000 | | | | 1,927,300 | |
Aurora CO E-470 Public Highway Authority Senior Series CD-2 (Transportation Revenue, National Insured) ± | | | 2.48 | | | | 9-1-2039 | | | | 15,325,000 | | | | 15,319,943 | |
Colorado HCFR Catholic Health Initiatives Series C2 (Health Revenue) ± | | | 1.67 | | | | 10-1-2039 | | | | 8,500,000 | | | | 8,419,590 | |
Colorado HCFR Catholic Health Initiatives Series C4 (Health Revenue) ± | | | 1.67 | | | | 10-1-2039 | | | | 3,495,000 | | | | 3,461,238 | |
Colorado Housing & Finance Authority Traditions Englewood Project (Housing Revenue) | | | 0.90 | | | | 12-1-2017 | | | | 7,000,000 | | | | 6,990,200 | |
| | | | |
| | | | | | | | | | | | | | | 36,118,271 | |
| | | | | | | | | | | | | | | | |
The accompanying notes are an integral part of these financial statements.
| | | | | | |
| Portfolio of investments—December 31, 2016 (unaudited) | | Wells Fargo Short-Term Municipal Bond Fund | | | 9 | |
| | | | | | | | | | | | | | | | |
| Security name | | Interest rate | | | Maturity date | | | Principal | | | Value | |
| | | | |
| Connecticut: 3.71% | | | | | | | | | | | | | | | | |
Connecticut Economic Recovery Notes Series A (Miscellaneous Revenue) ± | | | 1.08 | % | | | 1-1-2018 | | | $ | 9,810,000 | | | $ | 9,794,010 | |
Connecticut HEFA Series 2010A-4 (Education Revenue) ± | | | 1.20 | | | | 7-1-2049 | | | | 33,190,000 | | | | 32,916,514 | |
Connecticut HEFA Yale University Series X-2 (Education Revenue) ± | | | 0.90 | | | | 7-1-2037 | | | | 34,000,000 | | | | 33,868,080 | |
Connecticut HEFAR Hartford Healthcare Series G (Health Revenue) ± | | | 1.37 | | | | 7-1-2049 | | | | 10,000,000 | | | | 9,945,500 | |
Connecticut HEFAR Yale University Issue Series A (Education Revenue) ± | | | 1.38 | | | | 7-1-2035 | | | | 12,790,000 | | | | 12,758,792 | |
Connecticut HEFAR Yale University Issue Series A-1 (Education Revenue) ± | | | 1.00 | | | | 7-1-2042 | | | | 600,000 | | | | 589,608 | |
Connecticut Securities Industry and Financial Market Association Index Refunding Bond (Miscellaneous Revenue) ± | | | 1.83 | | | | 5-15-2019 | | | | 3,500,000 | | | | 3,518,060 | |
Connecticut Series A (Miscellaneous Revenue) ± | | | 1.27 | | | | 3-1-2019 | | | | 3,200,000 | | | | 3,188,960 | |
Connecticut Series A (Miscellaneous Revenue) ± | | | 1.38 | | | | 3-1-2020 | | | | 8,285,000 | | | | 8,253,931 | |
Connecticut Series A (Miscellaneous Revenue) ± | | | 1.40 | | | | 4-15-2017 | | | | 4,700,000 | | | | 4,700,423 | |
Connecticut Series A (Miscellaneous Revenue) ± | | | 1.48 | | | | 5-15-2018 | | | | 17,740,000 | | | | 17,774,416 | |
Connecticut Series A (Miscellaneous Revenue) ± | | | 1.50 | | | | 5-15-2017 | | | | 17,000,000 | | | | 17,018,190 | |
Connecticut Series A (Miscellaneous Revenue) ± | | | 1.82 | | | | 4-15-2019 | | | | 5,600,000 | | | | 5,627,216 | |
Connecticut Series A (Miscellaneous Revenue) ± | | | 2.07 | | | | 3-1-2019 | | | | 21,500,000 | | | | 21,514,620 | |
Connecticut Series D (GO Revenue) ± | | | 1.24 | | | | 9-15-2017 | | | | 2,100,000 | | | | 2,100,147 | |
Hamden CT Refunding Bond (GO Revenue) | | | 5.00 | | | | 8-15-2017 | | | | 1,500,000 | | | | 1,533,495 | |
Hamden CT Refunding Bond (GO Revenue) | | | 5.00 | | | | 8-15-2018 | | | | 1,000,000 | | | | 1,051,300 | |
Hartford CT Series A (GO Revenue, AGM Insured) | | | 5.00 | | | | 7-1-2018 | | | | 650,000 | | | | 681,597 | |
Hartford CT Series A (GO Revenue, AGM Insured) | | | 5.00 | | | | 7-1-2019 | | | | 700,000 | | | | 749,420 | |
Hartford CT Series B (GO Revenue, AGM Insured) | | | 5.00 | | | | 10-1-2018 | | | | 1,000,000 | | | | 1,065,420 | |
Mohegan Tribe of Indians of Connecticut (Miscellaneous Revenue) | | | 2.65 | | | | 12-15-2017 | | | | 3,856,000 | | | | 3,890,203 | |
New Haven CT Series A (GO Revenue, AGM Insured) | | | 3.00 | | | | 11-1-2019 | | | | 3,405,000 | | | | 3,477,492 | |
| | | | |
| | | | | | | | | | | | | | | 196,017,394 | |
| | | | | | | | | | | | | | | | |
| | | | |
| Delaware: 0.02% | | | | | | | | | | | | | | | | |
Delaware HCFR Nanticoke Memorial Hospital Project (Health Revenue) | | | 5.00 | | | | 7-1-2017 | | | | 1,225,000 | | | | 1,241,807 | |
| | | | | | | | | | | | | | | | |
| | | | |
| District of Columbia: 0.25% | | | | | | | | | | | | | | | | |
District of Columbia Income Tax Secured Refunding Bond Series E (Tax Revenue) ± | | | 1.31 | | | | 12-1-2017 | | | | 13,000,000 | | | | 12,957,490 | |
| | | | | | | | | | | | | | | | |
| | | | |
| Florida: 2.34% | | | | | | | | | | | | | | | | |
Brevard County FL HCFR Refunding Bond Health First Incorporated Series A (Health Revenue) | | | 5.00 | | | | 4-1-2018 | | | | 1,140,000 | | | | 1,189,020 | |
Brevard County FL Space Coast Infrastructure Agency I-95 Project (Industrial Development Revenue) | | | 4.00 | | | | 6-15-2018 | | | | 5,695,000 | | | | 5,889,541 | |
Escambia County FL Gulf Power Company Project (Resource Recovery Revenue) ± | | | 1.40 | | | | 4-1-2039 | | | | 9,500,000 | | | | 9,506,555 | |
Florida Mid-Bay Bridge Authority Series C (Transportation Revenue) | | | 5.00 | | | | 10-1-2019 | | | | 675,000 | | | | 722,756 | |
Florida Mid-Bay Bridge Authority Series C (Transportation Revenue) | | | 5.00 | | | | 10-1-2020 | | | | 785,000 | | | | 852,793 | |
Jacksonville FL Sales Tax Refunding Bond Better Jacksonville Plan (Tax Revenue) | | | 5.00 | | | | 10-1-2017 | | | | 2,000,000 | | | | 2,057,660 | |
Manatee County FL School Board Certificate Participation Series A (Miscellaneous Revenue) | | | 5.00 | | | | 7-1-2020 | | | | 1,225,000 | | | | 1,309,256 | |
Miami Beach FL Health Facilities Refunding Bond Mount Sinai Medical Center (Health Revenue) | | | 4.00 | | | | 11-15-2017 | | | | 1,750,000 | | | | 1,785,018 | |
Miami FL Refunding Bond Homeland Defense (GO Revenue, National Insured) | | | 5.00 | | | | 1-1-2017 | | | | 5,000,000 | | | | 5,000,500 | |
Miami-Dade County FL Expressway Authority Toll System (Transportation Revenue, Dexia Credit Local LOC, Dexia Credit Local LIQ) 144A± | | | 1.19 | | | | 10-13-2023 | | | | 6,325,000 | | | | 6,325,000 | |
Miami-Dade County FL Miami International Airport Series C (Airport Revenue, AGM Insured) | | | 5.25 | | | | 10-1-2021 | | | | 16,000,000 | | | | 16,495,520 | |
Miami-Dade County FL School Board Certificate of Participation Series 4 (Miscellaneous Revenue, Dexia Credit Local LOC, Dexia Credit Local LIQ) 144Aø | | | 1.27 | | | | 9-25-2024 | | | | 23,520,000 | | | | 23,520,000 | |
The accompanying notes are an integral part of these financial statements.
| | | | |
| 10 | | Wells Fargo Short-Term Municipal Bond Fund | | Portfolio of investments—December 31, 2016 (unaudited) |
| | | | | | | | | | | | | | | | |
| Security name | | Interest rate | | | Maturity date | | | Principal | | | Value | |
| | | | |
| Florida (continued) | | | | | | | | | | | | | | | | |
Miami-Dade County FL School Board Certificate of Participation Series 5 (Miscellaneous Revenue, Dexia Credit Local LOC, FGIC Insured, Dexia Credit Local LIQ) 144Aø | | | 0.95 | % | | | 5-1-2037 | | | $ | 10,000,000 | | | $ | 10,000,000 | |
Miami-Dade County FL School Board Foundation Incorporated (Miscellaneous Revenue, Dexia Credit Local LOC, National Insured, Dexia Credit Local LIQ) 144Aø | | | 1.27 | | | | 5-1-2031 | | | | 15,875,000 | | | | 15,875,000 | |
Palm Beach County FL HCFR ACTS Retirement Life Series 2016 (Health Revenue) | | | 5.00 | | | | 11-15-2021 | | | | 3,515,000 | | | | 3,868,363 | |
Palm Beach County FL HCFR Jupiter Medical Center Project Series A (Health Revenue) | | | 4.00 | | | | 11-1-2018 | | | | 1,235,000 | | | | 1,275,804 | |
Sarasota County FL Educational Facilities School Arts & Sciences Project (Education Revenue) | | | 5.20 | | | | 7-1-2017 | | | | 170,000 | | | | 171,173 | |
Space Coast Infrastructure Agency I-95 Brevard County FL Project (Industrial Development Revenue) | | | 4.00 | | | | 6-15-2017 | | | | 6,335,000 | | | | 6,414,568 | |
St. Johns County FL School Board Refunding Bond Certificate of Participation (Miscellaneous Revenue) | | | 5.00 | | | | 7-1-2020 | | | | 2,010,000 | | | | 2,218,035 | |
St. Johns County FL School Board Refunding Bond Certificate of Participation (Miscellaneous Revenue) | | | 5.00 | | | | 7-1-2021 | | | | 1,670,000 | | | | 1,875,510 | |
University of North Florida Financing Corporation Capital Housing Project (Education Revenue, AGM Insured) | | | 5.00 | | | | 11-1-2020 | | | | 3,125,000 | | | | 3,415,313 | |
University of North Florida Financing Corporation Capital Housing Project (Education Revenue, AGM Insured) | | | 5.00 | | | | 11-1-2021 | | | | 3,440,000 | | | | 3,808,871 | |
| | | | |
| | | | | | | | | | | | | | | 123,576,256 | |
| | | | | | | | | | | | | | | | |
| | | | |
| Georgia: 2.61% | | | | | | | | | | | | | | | | |
Atlanta GA Water & Wastewater Project Series A-1 (Water & Sewer Revenue) ± | | | 2.01 | | | | 11-1-2038 | | | | 21,500,000 | | | | 21,695,220 | |
Bartow County GA Development Authority Georgia Power Company Bowen Project (Utilities Revenue) ± | | | 2.70 | | | | 8-1-2043 | | | | 20,000,000 | | | | 20,386,400 | |
Burke County GA Development Authority Oglethorpe Power Corporation Vogtle Project Series A (Utilities Revenue) ± | | | 2.40 | | | | 1-1-2040 | | | | 17,825,000 | | | | 17,970,630 | |
Floyd County GA PCR Georgia Power Company Plant Hammond Project (Utilities Revenue) ± | | | 2.35 | | | | 7-1-2022 | | | | 11,000,000 | | | | 10,938,180 | |
Gainesville & Hall County GA Hospital Authority Health System Project Series B (Health Revenue) ± | | | 1.51 | | | | 8-15-2035 | | | | 23,000,000 | | | | 22,911,450 | |
Georgia Private Colleges & Universities Authority Mercer University Series B (Education Revenue) | | | 4.00 | | | | 10-1-2017 | | | | 3,285,000 | | | | 3,336,837 | |
Main Street Natural Gas Incorporated Georgia Gas Project Series B (Utilities Revenue) | | | 5.00 | | | | 3-15-2017 | | | | 8,015,000 | | | | 8,062,689 | |
Main Street Natural Gas Incorporated Georgia Gas Project Series B (Utilities Revenue) | | | 5.00 | | | | 3-15-2018 | | | | 4,815,000 | | | | 4,973,799 | |
Main Street Natural Gas Incorporated Georgia Gas Project Series B (Utilities Revenue) | | | 5.00 | | | | 3-15-2021 | | | | 2,600,000 | | | | 2,835,196 | |
Monroe County GA PCR Georgia Power Company Plant Scherer Project (Industrial Development Revenue) ± | | | 2.35 | | | | 10-1-2048 | | | | 16,000,000 | | | | 15,850,720 | |
Peach County GA Development Authority USG Real Estate Foundation LLC Project (Housing Revenue) | | | 1.20 | | | | 10-1-2018 | | | | 3,250,000 | | | | 3,224,520 | |
Savannah GA MFHR Wessels Blackshear Home Project (Housing Revenue) ± | | | 1.15 | | | | 7-1-2019 | | | | 5,550,000 | | | | 5,511,428 | |
| | | | |
| | | | | | | | | | | | | | | 137,697,069 | |
| | | | | | | | | | | | | | | | |
The accompanying notes are an integral part of these financial statements.
| | | | | | |
| Portfolio of investments—December 31, 2016 (unaudited) | | Wells Fargo Short-Term Municipal Bond Fund | | | 11 | |
| | | | | | | | | | | | | | | | |
| Security name | | Interest rate | | | Maturity date | | | Principal | | | Value | |
| | | | |
| Guam: 0.09% | | | | | | | | | | | | | | | | |
Guam International Airport Authority Series A (Airport Revenue) | | | 5.00 | % | | | 10-1-2019 | | | $ | 450,000 | | | $ | 485,780 | |
Guam International Airport Authority Series B (Airport Revenue) | | | 5.00 | | | | 10-1-2018 | | | | 675,000 | | | | 713,111 | |
Guam International Airport Authority Series C (Airport Revenue) | | | 5.00 | | | | 10-1-2018 | | | | 3,560,000 | | | | 3,715,928 | |
| | | | |
| | | | | | | | | | | | | | | 4,914,819 | |
| | | | | | | | | | | | | | | | |
| | | | |
| Illinois: 9.11% | | | | | | | | | | | | | | | | |
Chicago IL Board of Education Dedicated Series D (Miscellaneous Revenue, AGC Insured) | | | 5.00 | | | | 12-1-2018 | | | | 1,400,000 | | | | 1,443,344 | |
Chicago IL Board of Education Lease Certificates Refunding Bond Series A (Miscellaneous Revenue, National Insured) | | | 6.00 | | | | 1-1-2020 | | | | 9,245,000 | | | | 9,758,282 | |
Chicago IL Board of Education Series A (GO Revenue, National Insured) | | | 5.00 | | | | 12-1-2019 | | | | 895,000 | | | | 932,939 | |
Chicago IL Board of Education Series A (GO Revenue, National Insured) | | | 5.00 | | | | 12-1-2020 | | | | 765,000 | | | | 774,555 | |
Chicago IL Board of Education Series A2 (GO Revenue) ± | | | 1.48 | | | | 3-1-2035 | | | | 24,000,000 | | | | 23,596,320 | |
Chicago IL Board of Education Series A3 (GO Revenue) ± | | | 1.56 | | | | 3-1-2036 | | | | 48,000,000 | | | | 45,300,960 | |
Chicago IL Board of Education Series C (GO Revenue) | | | 5.00 | | | | 12-1-2019 | | | | 5,335,000 | | | | 4,911,028 | |
Chicago IL Board of Education Series D (GO Revenue, AGM Insured) | | | 5.00 | | | | 12-1-2019 | | | | 1,105,000 | | | | 1,128,304 | |
Chicago IL City Colleges of Chicago Capital Improvement Project CAB (GO Revenue, National Insured) ¤ | | | 0.00 | | | | 1-1-2019 | | | | 8,555,000 | | | | 7,971,292 | |
Chicago IL Modern Schools Across Chicago Program Series A-K (GO Revenue, Ambac Insured) | | | 5.00 | | | | 12-1-2019 | | | | 1,000,000 | | | | 1,002,810 | |
Chicago IL Motor Fuel Refunding Bond (Tax Revenue) | | | 5.00 | | | | 1-1-2017 | | | | 1,820,000 | | | | 1,820,127 | |
Chicago IL Motor Fuel Refunding Bond (Tax Revenue) | | | 5.00 | | | | 1-1-2018 | | | | 330,000 | | | | 337,062 | |
Chicago IL O’Hare International Airport Customer Facility Charge (Airport Revenue) | | | 5.00 | | | | 1-1-2019 | | | | 1,000,000 | | | | 1,060,430 | |
Chicago IL O’Hare International Airport Customer Facility Charge (Airport Revenue) | | | 5.00 | | | | 1-1-2020 | | | | 890,000 | | | | 963,648 | |
Chicago IL O’Hare International Airport Senior Lien Series A (Airport Revenue) | | | 5.00 | | | | 1-1-2017 | | | | 2,630,000 | | | | 2,630,289 | |
Chicago IL Park District Harbor Facility Series C (GO Revenue) | | | 5.00 | | | | 1-1-2022 | | | | 3,155,000 | | | | 3,424,816 | |
Chicago IL Park District Personal Property Replacement Tax (GO Revenue) | | | 5.00 | | | | 1-1-2019 | | | | 500,000 | | | | 529,100 | |
Chicago IL Park District Refunding Bonds Series B (GO Revenue) | | | 5.00 | | | | 1-1-2019 | | | | 3,555,000 | | | | 3,761,901 | |
Chicago IL Park District Refunding Bonds Series D (GO Revenue) | | | 4.00 | | | | 1-1-2019 | | | | 1,890,000 | | | | 1,963,086 | |
Chicago IL Park District Refunding Bonds Series D (GO Revenue) | | | 5.00 | | | | 1-1-2019 | | | | 1,060,000 | | | | 1,121,692 | |
Chicago IL Park District Refunding Bonds Series D (GO Revenue) | | | 5.00 | | | | 1-1-2020 | | | | 1,000,000 | | | | 1,076,700 | |
Chicago IL Park District Refunding Bonds Series D (GO Revenue) | | | 5.00 | | | | 1-1-2021 | | | | 1,000,000 | | | | 1,093,860 | |
Chicago IL Park District Series A (GO Revenue) | | | 4.50 | | | | 1-1-2023 | | | | 250,000 | | | | 263,488 | |
Chicago IL Prerefunded Balance Project Series A (GO Revenue, Ambac Insured) | | | 4.00 | | | | 1-1-2017 | | | | 720,000 | | | | 720,065 | |
Chicago IL Project & Refunding Bond Series A (GO Revenue, National Insured) | | | 5.00 | | | | 1-1-2019 | | | | 4,465,000 | | | | 4,586,091 | |
Chicago IL Project & Refunding Bond Series A (GO Revenue, Ambac Insured) | | | 5.00 | | | | 1-1-2020 | | | | 1,985,000 | | | | 1,988,930 | |
Chicago IL Project & Refunding Bond Series C (GO Revenue, National Insured) | | | 4.00 | | | | 1-1-2017 | | | | 345,000 | | | | 345,014 | |
Chicago IL Project & Refunding Bond Series C (GO Revenue, Ambac Insured) | | | 5.00 | | | | 1-1-2021 | | | | 10,280,000 | | | | 10,300,252 | |
Chicago IL Recovery Zone Facility (Industrial Development Revenue) | | | 6.13 | | | | 12-1-2018 | | | | 3,710,000 | | | | 3,796,146 | |
Chicago IL Refunding Bond Emergency Telephone System (GO Revenue, National Insured) | | | 5.25 | | | | 1-1-2018 | | | | 1,770,000 | | | | 1,818,445 | |
Chicago IL Refunding Bond Emergency Telephone System (GO Revenue, National Insured) | | | 5.25 | | | | 1-1-2020 | | | | 3,765,000 | | | | 4,027,759 | |
Chicago IL Refunding Bond Emergency Telephone System (GO Revenue, National Insured) | | | 5.50 | | | | 1-1-2019 | | | | 2,600,000 | | | | 2,741,518 | |
Chicago IL Refunding Bond Series A (GO Revenue, AGM Insured) | | | 5.00 | | | | 1-1-2019 | | | | 1,335,000 | | | | 1,337,577 | |
Chicago IL Refunding Bond Series A (GO Revenue, AGM Insured) | | | 5.00 | | | | 1-1-2020 | | | | 10,200,000 | | | | 10,231,110 | |
Chicago IL Refunding Bond Series A (GO Revenue, AGM Insured) | | | 5.00 | | | | 1-1-2021 | | | | 1,100,000 | | | | 1,108,448 | |
Chicago IL Refunding Bond Series B (GO Revenue, Ambac Insured) | | | 5.13 | | | | 1-1-2022 | | | | 4,495,000 | | | | 4,558,065 | |
Chicago IL Second Lien (Water & Sewer Revenue, AGM Insured) | | | 4.25 | | | | 11-1-2018 | | | | 1,925,000 | | | | 2,009,142 | |
The accompanying notes are an integral part of these financial statements.
| | | | |
| 12 | | Wells Fargo Short-Term Municipal Bond Fund | | Portfolio of investments—December 31, 2016 (unaudited) |
| | | | | | | | | | | | | | | | |
| Security name | | Interest rate | | | Maturity date | | | Principal | | | Value | |
| | | | |
| Illinois (continued) | | | | | | | | | | | | | | | | |
Chicago IL Second Lien (Water & Sewer Revenue) | | | 5.00 | % | | | 1-1-2017 | | | $ | 1,200,000 | | | $ | 1,200,108 | |
Chicago IL Second Lien (Water & Sewer Revenue) | | | 5.00 | | | | 11-1-2020 | | | | 730,000 | | | | 795,021 | |
Chicago IL Second Lien (Water & Sewer Revenue, National Insured) | | | 5.50 | | | | 1-1-2019 | | | | 1,460,000 | | | | 1,559,528 | |
Chicago IL Series A (GO Revenue) | | | 5.00 | | | | 1-1-2018 | | | | 550,000 | | | | 549,335 | |
Chicago IL Series A (GO Revenue) | | | 5.00 | | | | 1-1-2019 | | | | 5,850,000 | | | | 5,842,629 | |
Chicago IL Series A (GO Revenue, National Insured) | | | 5.53 | | | | 1-1-2020 | | | | 1,290,000 | | | | 1,294,064 | |
Chicago IL Series A (GO Revenue) | | | 5.25 | | | | 1-1-2021 | | | | 640,000 | | | | 638,451 | |
Chicago IL Series A2 (GO Revenue, Ambac Insured) | | | 5.50 | | | | 1-1-2018 | | | | 4,805,000 | | | | 4,856,414 | |
Chicago IL Series B (GO Revenue, AGM Insured) | | | 5.00 | | | | 1-1-2019 | | | | 8,090,000 | | | | 8,152,131 | |
Chicago IL Series B (GO Revenue, AGM Insured) | | | 5.00 | | | | 1-1-2020 | | | | 2,860,000 | | | | 2,881,965 | |
Chicago IL Series C (GO Revenue) | | | 5.00 | | | | 1-1-2021 | | | | 3,000,000 | | | | 2,992,680 | |
Chicago IL Series C (GO Revenue) | | | 5.00 | | | | 1-1-2022 | | | | 12,780,000 | | | | 12,691,435 | |
Chicago IL Series C (GO Revenue) | | | 5.00 | | | | 1-1-2023 | | | | 4,750,000 | | | | 4,716,275 | |
Chicago IL Transit Authority Federal Transit Administration Section 5309 (Transportation Revenue, AGC Insured) | | | 5.25 | | | | 6-1-2019 | | | | 1,680,000 | | | | 1,754,794 | |
Chicago IL Unrefunded Balance Project Series A (GO Revenue, Ambac Insured) | | | 4.00 | | | | 1-1-2017 | | | | 455,000 | | | | 455,005 | |
Cook County IL Forest Preserve District Series A (GO Revenue) | | | 5.00 | | | | 11-15-2018 | | | | 1,005,000 | | | | 1,062,727 | |
Cook County IL Refunding Bond Series 2016 A (GO Revenue) | | | 5.00 | | | | 11-15-2020 | | | | 5,430,000 | | | | 5,923,044 | |
Cook County IL Series 2009D (GO Revenue) | | | 5.00 | | | | 11-15-2020 | | | | 2,220,000 | | | | 2,375,866 | |
Cook County IL Series A (GO Revenue) | | | 5.00 | | | | 11-15-2019 | | | | 2,275,000 | | | | 2,446,694 | |
Cook County IL Series B (GO Revenue, National Insured) | | | 5.00 | | | | 11-15-2019 | | | | 6,020,000 | | | | 6,172,667 | |
Cook County IL Series C (GO Revenue) | | | 5.00 | | | | 11-15-2020 | | | | 21,535,000 | | | | 23,046,972 | |
Illinois (Miscellaneous Revenue) | | | 3.00 | | | | 7-1-2018 | | | | 2,000,000 | | | | 2,007,320 | |
Illinois (GO Revenue) | | | 4.00 | | | | 2-1-2019 | | | | 6,300,000 | | | | 6,393,429 | |
Illinois (GO Revenue) | | | 4.00 | | | | 2-1-2020 | | | | 1,750,000 | | | | 1,766,048 | |
Illinois (GO Revenue) | | | 5.00 | | | | 1-1-2017 | | | | 3,200,000 | | | | 3,200,352 | |
Illinois (GO Revenue) | | | 5.00 | | | | 3-1-2018 | | | | 1,795,000 | | | | 1,844,919 | |
Illinois (GO Revenue) | | | 5.00 | | | | 2-1-2019 | | | | 1,500,000 | | | | 1,552,260 | |
Illinois (GO Revenue) | | | 5.00 | | | | 2-1-2020 | | | | 2,520,000 | | | | 2,615,987 | |
Illinois (Miscellaneous Revenue) | | | 5.00 | | | | 5-1-2021 | | | | 2,000,000 | | | | 2,084,500 | |
Illinois Development Finance Authority St. Vincent De Paul Center Project Series A (Health Revenue) ± | | | 1.88 | | | | 11-15-2039 | | | | 5,730,000 | | | | 5,740,772 | |
Illinois Finance Authority Centegra Health System Project (Health Revenue) | | | 5.00 | | | | 9-1-2019 | | | | 2,265,000 | | | | 2,421,330 | |
Illinois Finance Authority Prerefunded Bond OSF Healthcare System Series A (Health Revenue) | | | 6.00 | | | | 5-15-2039 | | | | 10,915,000 | | | | 12,440,371 | |
Illinois Finance Authority Provena Health Series A (Health Revenue) | | | 5.75 | | | | 5-1-2019 | | | | 3,000,000 | | | | 3,294,510 | |
Illinois Finance Authority Refunding Bond Lifespace Communities (Health Revenue) | | | 4.00 | | | | 5-15-2018 | | | | 700,000 | | | | 721,455 | |
Illinois Finance Authority Refunding Bond Lifespace Communities (Health Revenue) | | | 4.00 | | | | 5-15-2019 | | | | 1,000,000 | | | | 1,037,200 | |
Illinois Housing Development Authority (Housing Revenue, GNMA Insured) | | | 5.00 | | | | 8-1-2028 | | | | 1,105,000 | | | | 1,133,111 | |
Illinois Municipal Electric Agency Power Supply Series A (Utilities Revenue, National Insured) | | | 5.25 | | | | 2-1-2020 | | | | 2,705,000 | | | | 2,715,360 | |
Illinois Refunding Bond (GO Revenue) | | | 5.00 | | | | 1-1-2018 | | | | 1,905,000 | | | | 1,952,263 | |
Illinois Refunding Bond (GO Revenue, AGM Insured) | | | 5.00 | | | | 1-1-2017 | | | | 1,725,000 | | | | 1,725,190 | |
Illinois Refunding Bond (GO Revenue, AGM Insured) | | | 5.00 | | | | 1-1-2018 | | | | 7,740,000 | | | | 7,970,962 | |
Illinois Refunding Bond (Miscellaneous Revenue) | | | 5.00 | | | | 8-1-2018 | | | | 1,525,000 | | | | 1,576,804 | |
Illinois Refunding Bond (GO Revenue) | | | 5.00 | | | | 1-1-2019 | | | | 12,570,000 | | | | 13,000,648 | |
Illinois Refunding Bond (GO Revenue) | | | 5.00 | | | | 1-1-2020 | | | | 13,515,000 | | | | 14,021,677 | |
Illinois Refunding Bond (Miscellaneous Revenue) | | | 5.00 | | | | 8-1-2020 | | | | 5,000,000 | | | | 5,206,850 | |
The accompanying notes are an integral part of these financial statements.
| | | | | | |
| Portfolio of investments—December 31, 2016 (unaudited) | | Wells Fargo Short-Term Municipal Bond Fund | | | 13 | |
| | | | | | | | | | | | | | | | |
| Security name | | Interest rate | | | Maturity date | | | Principal | | | Value | |
| | | | |
| Illinois (continued) | | | | | | | | | | | | | | | | |
Illinois Refunding Bond (Miscellaneous Revenue, AGM Insured) | | | 5.00 | % | | | 8-1-2020 | | | $ | 5,000,000 | | | $ | 5,338,300 | |
Illinois Refunding Bond (Miscellaneous Revenue, Build America Mutual Assurance Company Insured) | | | 5.00 | | | | 8-1-2020 | | | | 9,175,000 | | | | 9,795,781 | |
Illinois Refunding Bond (Tax Revenue) | | | 5.00 | | | | 1-1-2021 | | | | 1,510,000 | | | | 1,574,990 | |
Illinois Refunding Bond (Miscellaneous Revenue) | | | 5.00 | | | | 2-1-2022 | | | | 4,375,000 | | | | 4,551,531 | |
Illinois Refunding Bond (Miscellaneous Revenue) | | | 5.00 | | | | 2-1-2023 | | | | 6,040,000 | | | | 6,258,286 | |
Illinois Refunding Bond Series B (Miscellaneous Revenue) | | | 5.25 | | | | 1-1-2018 | | | | 1,430,000 | | | | 1,468,996 | |
Illinois Series A (Tax Revenue) | | | 4.00 | | | | 1-1-2020 | | | | 12,265,000 | | | | 12,379,065 | |
Illinois Series A (Tax Revenue) | | | 4.00 | | | | 1-1-2021 | | | | 2,715,000 | | | | 2,731,969 | |
Illinois Series A (GO Revenue) | | | 5.00 | | | | 4-1-2019 | | | | 5,000,000 | | | | 5,179,600 | |
Illinois Series A (GO Revenue) | | | 5.00 | | | | 4-1-2020 | | | | 2,500,000 | | | | 2,598,200 | |
Illinois Series A (GO Revenue) | | | 5.00 | | | | 4-1-2022 | | | | 3,575,000 | | | | 3,719,502 | |
Illinois Unemployment Insurance Series B (Tax Revenue) | | | 5.00 | | | | 12-15-2017 | | | | 2,225,000 | | | | 2,232,320 | |
Kane County IL School District #131 Aurora E Side Series C (GO Revenue, AGC Insured) | | | 5.00 | | | | 6-1-2019 | | | | 2,110,000 | | | | 2,245,821 | |
Kane County IL School District Series B (GO Revenue) | | | 2.00 | | | | 2-1-2021 | | | | 880,000 | | | | 869,176 | |
Kendall Kane & Will County IL Community Unit School District #308 (GO Revenue, AGM Insured) ¤ | | | 0.00 | | | | 2-1-2020 | | | | 1,000,000 | | | | 926,700 | |
Lake County IL Community Unit School District #60 Waukegan CAB Series A (GO Revenue, AGM Insured) ¤ | | | 0.00 | | | | 12-1-2018 | | | | 1,715,000 | | | | 1,645,800 | |
McHenry-Kane Counties IL Community Consolidated School District #158 CAB (GO Revenue, National Insured) ¤ | | | 0.00 | | | | 1-1-2021 | | | | 2,000,000 | | | | 1,803,520 | |
Metropolitan Pier & Exposition Authority CAB McCormick Place Project Series A (Tax Revenue, National Insured) ¤ | | | 0.00 | | | | 6-15-2017 | | | | 11,210,000 | | | | 11,108,325 | |
Metropolitan Pier & Exposition Authority CAB McCormick Place Project Series A (Tax Revenue, National Insured) ¤ | | | 0.00 | | | | 12-15-2017 | | | | 6,245,000 | | | | 6,122,223 | |
Metropolitan Pier & Exposition Authority CAB McCormick Place Project Series B (Tax Revenue) | | | 5.00 | | | | 12-15-2020 | | | | 1,475,000 | | | | 1,572,321 | |
Metropolitan Pier & Exposition Authority CAB McCormick Place Project Series A (Tax Revenue, National Insured) ¤ | | | 0.00 | | | | 12-15-2021 | | | | 920,000 | | | | 764,732 | |
Regional Transportation Authority Refunding Bond Series B (Tax Revenue) ± | | | 0.85 | | | | 6-1-2025 | | | | 13,395,000 | | | | 13,395,000 | |
Springfield IL Electric Senior Lien (Utilities Revenue, National Insured) | | | 5.00 | | | | 3-1-2018 | | | | 12,000,000 | | | | 12,084,360 | |
Springfield IL Electric Senior Lien (Utilities Revenue, National Insured) | | | 5.00 | | | | 3-1-2019 | | | | 5,900,000 | | | | 5,941,477 | |
University of Illinois IL Auxilary Facilities CAB (Education Revenue) ¤ | | | 0.00 | | | | 4-1-2019 | | | | 7,110,000 | | | | 6,730,539 | |
Western Illinois University Auxiliary Facilities System (Education Revenue) | | | 4.00 | | | | 4-1-2017 | | | | 1,135,000 | | | | 1,138,314 | |
Western Illinois University Auxiliary Facilities System (Education Revenue) | | | 4.00 | | | | 4-1-2018 | | | | 800,000 | | | | 808,848 | |
Western Illinois University Auxiliary Facilities System (Education Revenue) | | | 4.00 | | | | 4-1-2020 | | | | 1,480,000 | | | | 1,496,635 | |
| | | | |
| | | | | | | | | | | | | | | 480,748,049 | |
| | | | | | | | | | | | | | | | |
| | | | |
| Indiana: 3.35% | | | | | | | | | | | | | | | | |
Evansville City IN MFHR Consolidated RAD Project Series A (Housing Revenue) ± | | | 0.90 | | | | 6-1-2018 | | | | 4,600,000 | | | | 4,586,292 | |
Indiana Finance Authority Ohio River Bridges East End Crossing Project Series B (Industrial Development Revenue) | | | 5.00 | | | | 1-1-2019 | | | | 79,215,000 | | | | 79,314,811 | |
Indiana Finance Authority Refunding Bond Southern Indiana Gas & Electric Company Series E (Utilities Revenue) ± | | | 1.95 | | | | 5-1-2037 | | | | 3,200,000 | | | | 3,218,080 | |
Indiana Health & Educational Facility Financing Authority Series 2006B (Health Revenue) ± | | | 1.75 | | | | 11-15-2031 | | | | 11,385,000 | | | | 11,046,524 | |
Indiana HFFA Ascension Health Series A1 (Health Revenue) ± | | | 2.80 | | | | 11-1-2027 | | | | 10,355,000 | | | | 10,592,233 | |
Indiana HFFA Ascension Health Series A7 (Health Revenue) ± | | | 2.00 | | | | 10-1-2026 | | | | 9,080,000 | | | | 9,086,356 | |
Indiana HFFA Ascension Health Subordinated Credit Group Series 2015 A4 (Health Revenue) ± | | | 1.50 | | | | 10-1-2027 | | | | 2,495,000 | | | | 2,448,443 | |
The accompanying notes are an integral part of these financial statements.
| | | | |
| 14 | | Wells Fargo Short-Term Municipal Bond Fund | | Portfolio of investments—December 31, 2016 (unaudited) |
| | | | | | | | | | | | | | | | |
| Security name | | Interest rate | | | Maturity date | | | Principal | | | Value | |
| | | | |
| Indiana (continued) | | | | | | | | | | | | | | | | |
Petersburg IN PCR Refunding Bond Industry Power & Light (Industrial Development Revenue, National Insured) | | | 5.40 | % | | | 8-1-2017 | | | $ | 1,000,000 | | | $ | 1,024,760 | |
Rockport IN PCR Indiana-Michigan Power Company Series B (Utilities Revenue) ± | | | 1.75 | | | | 6-1-2025 | | | | 4,285,000 | | | | 4,270,260 | |
Warrick County IN Environment Import Revenue Vectren Energy Delivery of Indiana Incorporated (Utilities Revenue) ± | | | 2.38 | | | | 9-1-2055 | | | | 6,550,000 | | | | 6,541,747 | |
Whiting IN BP Products North America Incorporated Project (Resource Recovery Revenue) | | | 1.48 | | | | 12-1-2044 | | | | 45,000,000 | | | | 44,536,950 | |
| | | | |
| | | | | | | | | | | | | | | 176,666,456 | |
| | | | | | | | | | | | | | | | |
| | | | |
| Iowa: 0.34% | | | | | | | | | | | | | | | | |
Iowa Finance Authority Midwestern Disaster Area Project (Industrial Development Revenue, Korea Development Bank LOC) ø | | | 0.95 | | | | 4-1-2022 | | | | 12,800,000 | | | | 12,800,000 | |
Iowa Student Loan Liquidity Corporation Senior Series A1 (Education Revenue) | | | 4.40 | | | | 12-1-2018 | | | | 4,800,000 | | | | 4,967,184 | |
| | | | |
| | | | | | | | | | | | | | | 17,767,184 | |
| | | | | | | | | | | | | | | | |
| | | | |
| Kansas: 0.21% | | | | | | | | | | | | | | | | |
Kansas Development Finance Authority Series A (Miscellaneous Revenue) | | | 5.00 | | | | 5-1-2019 | | | | 10,305,000 | | | | 11,121,568 | |
| | | | | | | | | | | | | | | | |
| | | | |
| Kentucky: 1.78% | | | | | | | | | | | | | | | | |
Ashland KY Ashland Hospital Corporation Medical Center Project Series B (Health Revenue) | | | 5.00 | | | | 2-1-2019 | | | | 1,500,000 | | | | 1,571,340 | |
Kentucky EDA Next Generation Kentucky Information Highway Project Series 2015 A (Miscellaneous Revenue) | | | 5.00 | | | | 7-1-2020 | | | | 1,000,000 | | | | 1,079,750 | |
Kentucky EDFA Baptist Healthcare System Series A (Health Revenue) | | | 5.38 | | | | 8-15-2024 | | | | 1,500,000 | | | | 1,582,005 | |
Kentucky EDFA King’s Daughters Medical Center (Health Revenue) | | | 5.00 | | | | 2-1-2017 | | | | 1,000,000 | | | | 1,003,250 | |
Kentucky EDFA Series B1 (Health Revenue) ± | | | 1.32 | | | | 2-1-2046 | | | | 10,720,000 | | | | 10,585,035 | |
Kentucky EDFA Series B2 (Health Revenue) ± | | | 1.32 | | | | 2-1-2046 | | | | 11,220,000 | | | | 11,078,740 | |
Kentucky Higher Education Student Loan Corporation Series A (Education Revenue) | | | 3.75 | | | | 6-1-2026 | | | | 1,065,000 | | | | 1,098,590 | |
Kentucky Higher Education Student Loan Corporation Series A (Education Revenue) | | | 5.00 | | | | 6-1-2018 | | | | 1,200,000 | | | | 1,249,080 | |
Kentucky Municipal Power Agency Prairie State Project Series B (Utilities Revenue) ± | | | 1.96 | | | | 9-1-2042 | | | | 25,000,000 | | | | 25,002,250 | |
Kentucky Public Transportation Infrastructure Authority Tolls Downtown Crossing Project BAN Series A (Transportation Revenue) | | | 5.00 | | | | 7-1-2017 | | | | 29,000,000 | | | | 29,465,450 | |
Louisville & Jefferson County KY Catholic Health Initiatives Series A (Health Revenue) | | | 5.00 | | | | 12-1-2021 | | | | 8,060,000 | | | | 8,964,654 | |
Pendleton County KY Scholl District Finance Corporation (Miscellaneous Revenue) | | | 2.00 | | | | 2-1-2021 | | | | 1,200,000 | | | | 1,179,324 | |
| | | | |
| | | | | | | | | | | | | | | 93,859,468 | |
| | | | | | | | | | | | | | | | |
| | | | |
| Louisiana: 2.35% | | | | | | | | | | | | | | | | |
Desoto Parish LA PCR (Utilities Revenue) | | | 1.60 | | | | 1-1-2019 | | | | 15,000,000 | | | | 14,907,900 | |
East Baton Rouge Parish LA Sewerage Commission Refunding Bond Series A (Water & Sewer Revenue) ± | | | 0.93 | | | | 2-1-2046 | | | | 37,585,000 | | | | 37,406,847 | |
Louisiana Housing Corporation Versailes Project (Housing Revenue) ± | | | 0.90 | | | | 3-1-2019 | | | | 20,610,000 | | | | 20,516,431 | |
Louisiana Local Government Environmental Facilities & CDA East Baton Rouge Sewer Commission Series B (Tax Revenue) ± | | | 1.14 | | | | 2-1-2049 | | | | 35,500,000 | | | | 35,374,330 | |
Louisiana Local Government Environmental Facilities & Community Development Authority Series 2015 (Tax Revenue, Build America Mutual Assurance Company Insured) | | | 5.00 | | | | 12-1-2020 | | | | 1,135,000 | | | | 1,260,758 | |
The accompanying notes are an integral part of these financial statements.
| | | | | | |
| Portfolio of investments—December 31, 2016 (unaudited) | | Wells Fargo Short-Term Municipal Bond Fund | | | 15 | |
| | | | | | | | | | | | | | | | |
| Security name | | Interest rate | | | Maturity date | | | Principal | | | Value | |
| | | | |
| Louisiana (continued) | | | | | | | | | | | | | | | | |
Louisiana Regional Transit Authority CAB (Tax Revenue, National Insured) ¤ | | | 0.00 | % | | | 12-1-2021 | | | $ | 4,015,000 | | | $ | 3,158,319 | |
New Orleans LA Master Lease Agreement (GO Revenue) (i) | | | 5.25 | | | | 1-1-2018 | | | | 4,650,078 | | | | 4,694,300 | |
St. Bernard Parish LA Sales & Uses Tax (Tax Revenue) | | | 4.00 | | | | 3-1-2017 | | | | 3,135,000 | | | | 3,149,954 | |
St. Bernard Parish LA Sales & Uses Tax (Tax Revenue) | | | 4.00 | | | | 3-1-2018 | | | | 3,245,000 | | | | 3,335,990 | |
| | | | |
| | | | | | | | | | | | | | | 123,804,829 | |
| | | | | | | | | | | | | | | | |
| | | | |
| Maryland: 2.65% | | | | | | | | | | | | | | | | |
Howard County MD Housing Commission Series A (Housing Revenue) ± | | | 1.97 | | | | 7-1-2034 | | | | 16,050,000 | | | | 16,036,037 | |
Maryland CDA Multifamily Govans Manor Series M (Housing Revenue) | | | 1.80 | | | | 12-1-2018 | | | | 19,500,000 | | | | 19,466,265 | |
Maryland CDA The Brentwood Series O (Housing Revenue) | | | 1.40 | | | | 12-1-2017 | | | | 7,735,000 | | | | 7,720,690 | |
Maryland Community Development Administration Department Housing & Community Multifamily Bernard E Mason Apartments Series F (Housing Revenue) | | | 1.17 | | | | 11-1-2017 | | | | 18,020,000 | | | | 17,981,617 | |
Maryland Community Development Administration Department Housing & Community Multifamily Development Pleasant View Gardens Senior Apartments Series H (Housing Revenue) | | | 1.35 | | | | 9-1-2018 | | | | 8,200,000 | | | | 8,146,618 | |
Maryland Community Development Administration Department Housing & Community Multifamily Riverwatch Apartments Series J (Housing Revenue) | | | 1.00 | | | | 4-1-2017 | | | | 11,750,000 | | | | 11,740,130 | |
Maryland Health & HEFAR John Hopkins Health System Series A (Health Revenue) ± | | | 1.01 | | | | 5-15-2046 | | | | 8,000,000 | | | | 7,966,320 | |
Maryland Health & HEFAR John Hopkins Health System Series B (Health Revenue) ± | | | 0.99 | | | | 5-15-2029 | | | | 9,815,000 | | | | 9,770,931 | |
Maryland Health & HEFAR John Hopkins Health System Series C (Health Revenue) ± | | | 1.24 | | | | 5-15-2038 | | | | 22,100,000 | | | | 22,155,471 | |
Maryland Health & HEFAR John Hopkins Health System Series D (Health Revenue) ± | | | 1.24 | | | | 5-15-2038 | | | | 18,890,000 | | | | 18,937,414 | |
| | | | |
| | | | | | | | | | | | | | | 139,921,493 | |
| | | | | | | | | | | | | | | | |
| | | | |
| Massachusetts: 1.98% | | | | | | | | | | | | | | | | |
Massachusetts Consolidated Loan Series D-1 (Miscellaneous Revenue) ± | | | 1.05 | | | | 8-1-2043 | | | | 11,500,000 | | | | 11,130,275 | |
Massachusetts Development Finance Agency Southcoast Health System Obligation Series F (Health Revenue) | | | 3.00 | | | | 7-1-2017 | | | | 500,000 | | | | 504,550 | |
Massachusetts Development Finance Agency Waste Management Incorporated (Resource Recovery Revenue) ± | | | 1.60 | | | | 5-1-2027 | | | | 7,000,000 | | | | 7,009,310 | |
Massachusetts Educational Financing Authority Education Loan Series I (Education Revenue) | | | 4.00 | | | | 1-1-2018 | | | | 1,750,000 | | | | 1,787,030 | |
Massachusetts Educational Financing Authority Series A (Education Revenue) | | | 3.50 | | | | 1-1-2019 | | | | 2,500,000 | | | | 2,559,375 | |
Massachusetts Educational Financing Authority Series A (Education Revenue) | | | 5.00 | | | | 1-1-2018 | | | | 1,500,000 | | | | 1,546,575 | |
Massachusetts Educational Financing Authority Series A (Education Revenue) | | | 5.00 | | | | 1-1-2019 | | | | 3,000,000 | | | | 3,158,880 | |
Massachusetts Educational Financing Authority Series A (Education Revenue) | | | 5.00 | | | | 1-1-2020 | | | | 3,000,000 | | | | 3,210,270 | |
Massachusetts Educational Financing Authority Series A (Education Revenue) | | | 5.00 | | | | 1-1-2022 | | | | 2,955,000 | | | | 3,233,391 | |
Massachusetts Educational Financing Authority Series K (Education Revenue) | | | 5.00 | | | | 7-1-2019 | | | | 2,000,000 | | | | 2,127,080 | |
Massachusetts HEFA Partners Healthcare Series G6 (Health Revenue) ± | | | 1.60 | | | | 7-1-2038 | | | | 40,000,000 | | | | 39,999,600 | |
Massachusetts HFA Construction Loan Notes Series B (Housing Revenue) | | | 2.00 | | | | 6-1-2019 | | | | 9,000,000 | | | | 9,001,170 | |
Massachusetts Various Consolidated Loans Series D (Tax Revenue) ± | | | 1.15 | | | | 1-1-2018 | | | | 9,500,000 | | | | 9,506,650 | |
Tender Option Bond Trust Receipts/Certificates Floaters
Series 2016-XF2306 (Education Revenue, Morgan Stanley Bank LIQ) 144Aø | | | 0.97 | | | | 7-1-2033 | | | | 10,000,000 | | | | 10,000,000 | |
| | | | |
| | | | | | | | | | | | | | | 104,774,156 | |
| | | | | | | | | | | | | | | | |
| | | | |
| Michigan: 4.28% | | | | | | | | | | | | | | | | |
Allendale MI Public School District Series A (GO Revenue, Qualified School Board Loan Fund Insured) | | | 3.00 | | | | 11-1-2021 | | | | 895,000 | | | | 916,328 | |
Birmingham MI City School District (GO Revenue) | | | 5.00 | | | | 11-1-2018 | | | | 905,000 | | | | 966,784 | |
The accompanying notes are an integral part of these financial statements.
| | | | |
| 16 | | Wells Fargo Short-Term Municipal Bond Fund | | Portfolio of investments—December 31, 2016 (unaudited) |
| | | | | | | | | | | | | | | | |
| Security name | | Interest rate | | | Maturity date | | | Principal | | | Value | |
| | | | |
| Michigan (continued) | | | | | | | | | | | | | | | | |
Birmingham MI City School District (GO Revenue) | | | 5.00 | % | | | 11-1-2019 | | | $ | 5,970,000 | | | $ | 6,545,508 | |
Caledonia MI Community Schools (GO Revenue, Qualified School Board Loan Fund Insured) | | | 5.00 | | | | 5-1-2017 | | | | 250,000 | | | | 253,220 | |
Caledonia MI Community Schools (GO Revenue, Qualified School Board Loan Fund Insured) | | | 5.00 | | | | 5-1-2018 | | | | 1,315,000 | | | | 1,377,791 | |
Caledonia MI Community Schools (GO Revenue, Qualified School Board Loan Fund Insured) | | | 5.00 | | | | 5-1-2020 | | | | 500,000 | | | | 550,490 | |
Caledonia MI Community Schools (GO Revenue, Qualified School Board Loan Fund Insured) | | | 5.00 | | | | 5-1-2021 | | | | 1,140,000 | | | | 1,279,673 | |
Chippewa Hills MI School District (GO Revenue, Qualified School Board Loan Fund Insured) | | | 4.00 | | | | 5-1-2017 | | | | 740,000 | | | | 747,060 | |
Chippewa Hills MI School District (GO Revenue, Qualified School Board Loan Fund Insured) | | | 4.00 | | | | 5-1-2018 | | | | 1,535,000 | | | | 1,588,050 | |
Chippewa Hills MI School District (GO Revenue, Qualified School Board Loan Fund Insured) | | | 4.00 | | | | 5-1-2019 | | | | 1,595,000 | | | | 1,681,290 | |
Detroit MI Sewage Disposal System Series A (Water & Sewer Revenue, AGM Insured) | | | 5.25 | | | | 7-1-2019 | | | | 980,000 | | | | 1,061,124 | |
Detroit MI Wayne County Stadium Authority (Miscellaneous Revenue) | | | 5.00 | | | | 10-1-2017 | | | | 3,000,000 | | | | 2,982,300 | |
Flint MI International Academy Public School Project (Education Revenue) | | | 5.00 | | | | 10-1-2017 | | | | 260,000 | | | | 261,433 | |
Flushing MI Community Schools School District (GO Revenue, Qualified School Board Loan Fund Insured) | | | 4.00 | | | | 5-1-2017 | | | | 975,000 | | | | 984,302 | |
Flushing MI Community Schools School District (GO Revenue, Qualified School Board Loan Fund Insured) | | | 4.00 | | | | 5-1-2021 | | | | 1,135,000 | | | | 1,227,185 | |
Forest Hills MI Public Schools (GO Revenue) | | | 5.00 | | | | 5-1-2018 | | | | 2,000,000 | | | | 2,095,500 | |
Forest Hills MI Public Schools (GO Revenue) | | | 5.00 | | | | 5-1-2019 | | | | 1,375,000 | | | | 1,480,779 | |
Fraser MI Public Schools District (GO Revenue, Qualified School Board Loan Fund Insured) | | | 5.00 | | | | 5-1-2017 | | | | 1,000,000 | | | | 1,012,880 | |
Fraser MI Public Schools District (GO Revenue, Qualified School Board Loan Fund Insured) | | | 5.00 | | | | 5-1-2019 | | | | 1,050,000 | | | | 1,130,777 | |
Gibraltar MI School District (GO Revenue, Qualified School Board Loan Fund Insured) | | | 5.00 | | | | 5-1-2019 | | | | 1,085,000 | | | | 1,167,775 | |
Gibraltar MI School District (GO Revenue, Qualified School Board Loan Fund Insured) | | | 5.00 | | | | 5-1-2020 | | | | 1,100,000 | | | | 1,209,450 | |
Gibraltar MI School District (GO Revenue, Qualified School Board Loan Fund Insured) | | | 5.00 | | | | 5-1-2021 | | | | 1,185,000 | | | | 1,327,567 | |
Grand Ledge MI Public School District (GO Revenue, Qualified School Board Loan Fund Insured) | | | 5.00 | | | | 5-1-2020 | | | | 2,680,000 | | | | 2,950,626 | |
Haslett MI Public Schools (GO Revenue, Qualified School Board Loan Fund Insured) | | | 4.00 | | | | 5-1-2019 | | | | 515,000 | | | | 542,862 | |
Haslett MI Public Schools (GO Revenue, Qualified School Board Loan Fund Insured) | | | 4.00 | | | | 5-1-2020 | | | | 370,000 | | | | 395,452 | |
Haslett MI Public Schools (GO Revenue, Qualified School Board Loan Fund Insured) | | | 5.00 | | | | 5-1-2021 | | | | 500,000 | | | | 561,260 | |
Hudsonville MI Public Schools (GO Revenue, Qualified School Board Loan Fund Insured) | | | 5.00 | | | | 5-1-2018 | | | | 750,000 | | | | 785,813 | |
Hudsonville MI Public Schools (GO Revenue, Qualified School Board Loan Fund Insured) | | | 5.00 | | | | 5-1-2019 | | | | 1,605,000 | | | | 1,728,473 | |
Lake Orion MI Community School District 2015 Refunding Bond (GO Revenue, Qualified School Board Loan Fund Insured) | | | 5.00 | | | | 5-1-2019 | | | | 2,325,000 | | | | 2,503,862 | |
Lake Orion MI Community School District 2016 Refunding Bond (GO Revenue, Qualified School Board Loan Fund Insured) | | | 5.00 | | | | 5-1-2019 | | | | 915,000 | | | | 985,391 | |
Lake Orion MI Community School District 2016 Refunding Bond (GO Revenue, Qualified School Board Loan Fund Insured) | | | 5.00 | | | | 5-1-2021 | | | | 1,385,000 | | | | 1,554,690 | |
Lake Orion MI Community School District Advance Refunding Bond (GO Revenue, Qualified School Board Loan Fund Insured) | | | 5.00 | | | | 5-1-2020 | | | | 1,390,000 | | | | 1,530,362 | |
The accompanying notes are an integral part of these financial statements.
| | | | | | |
| Portfolio of investments—December 31, 2016 (unaudited) | | Wells Fargo Short-Term Municipal Bond Fund | | | 17 | |
| | | | | | | | | | | | | | | | |
| Security name | | Interest rate | | | Maturity date | | | Principal | | | Value | |
| | | | |
| Michigan (continued) | | | | | | | | | | | | | | | | |
Lake Orion MI Community School District Refunding Bond (GO Revenue, Qualified School Board Loan Fund Insured) | | | 5.00 | % | | | 5-1-2020 | | | $ | 1,550,000 | | | $ | 1,706,519 | |
Michigan Finance Authority Refunding Bond 2nd Lien Detroit Water & Sewer Series C-7 (Water & Sewer Revenue, National Insured) | | | 5.00 | | | | 7-1-2019 | | | | 2,500,000 | | | | 2,684,100 | |
Michigan Finance Authority Refunding Bond 2nd Lien Detroit Water & Sewer Series C-7 (Water & Sewer Revenue, National Insured) | | | 5.00 | | | | 7-1-2020 | | | | 3,835,000 | | | | 4,203,237 | |
Michigan Finance Authority Refunding Bond 2nd Lien Detroit Water & Sewer Series C-7 (Water & Sewer Revenue, National Insured) | | | 5.00 | | | | 7-1-2021 | | | | 3,095,000 | | | | 3,446,313 | |
Michigan Finance Authority Refunding Bond 2nd Lien Detroit Water & Sewer Series C-8 (Water & Sewer Revenue) | | | 5.00 | | | | 7-1-2017 | | | | 2,500,000 | | | | 2,543,525 | |
Michigan Finance Authority Refunding Bond 2nd Lien Detroit Water & Sewer Series C-8 (Water & Sewer Revenue) | | | 5.00 | | | | 7-1-2018 | | | | 2,000,000 | | | | 2,092,940 | |
Michigan Finance Authority Refunding Bond Local Government Loan Program Detroit Water & Sewer Series D-1 (Water & Sewer Revenue, AGM Insured) | | | 5.00 | | | | 7-1-2020 | | | | 10,000,000 | | | | 10,988,600 | |
Michigan Finance Authority Refunding Bond Local Government Loan Program Detroit Water & Sewer Series D-3 (Water & Sewer Revenue, National Insured) | | | 5.00 | | | | 7-1-2019 | | | | 7,000,000 | | | | 7,515,480 | |
Michigan Finance Authority Refunding Bond Local Government Loan Program Detroit Water & Sewer Series D-6 (Water & Sewer Revenue, National Insured) | | | 5.00 | | | | 7-1-2019 | | | | 1,500,000 | | | | 1,610,460 | |
Michigan Finance Authority Refunding Bond Local Government Loan Program Detroit Water & Sewer Series D-6 (Water & Sewer Revenue, National Insured) | | | 5.00 | | | | 7-1-2020 | | | | 1,800,000 | | | | 1,972,836 | |
Michigan Finance Authority Refunding Bond Senior Lien Detroit Water & Sewer Series C-3 (Water & Sewer Revenue, AGM Insured) | | | 5.00 | | | | 7-1-2021 | | | | 7,500,000 | | | | 8,354,700 | |
Michigan Finance Authority Refunding Bond Senior Lien Detroit Water & Sewer Series C-5 (Water & Sewer Revenue, National Insured) | | | 5.00 | | | | 7-1-2019 | | | | 7,000,000 | | | | 7,515,480 | |
Michigan Finance Authority Refunding Bond Senior Lien Detroit Water & Sewer Series C-5 (Water & Sewer Revenue, National Insured) | | | 5.00 | | | | 7-1-2020 | | | | 8,720,000 | | | | 9,557,294 | |
Michigan Finance Authority School District (Miscellaneous Revenue) | | | 4.00 | | | | 6-1-2017 | | | | 800,000 | | | | 810,104 | |
Michigan Finance Authority School District (Miscellaneous Revenue) | | | 5.00 | | | | 6-1-2017 | | | | 750,000 | | | | 762,510 | |
Michigan Finance Authority School District (Miscellaneous Revenue) | | | 5.00 | | | | 7-1-2021 | | | | 2,060,000 | | | | 2,176,102 | |
Michigan Finance Authority Unemployment Obligation Assessment Series B (Miscellaneous Revenue) | | | 5.00 | | | | 1-1-2020 | | | | 15,000,000 | | | | 16,269,450 | |
Michigan Hospital Finance Authority Ascension Health Series A-3 (Health Revenue) ± | | | 1.87 | | | | 11-1-2027 | | | | 22,070,000 | | | | 22,180,571 | |
Michigan Hospital Finance Authority Ascension Health Subordinated Credit Group Series 2005 A-4 (Health Revenue) ± | | | 1.63 | | | | 11-1-2027 | | | | 3,260,000 | | | | 3,230,204 | |
Michigan Housing Development Authority Series A (Housing Revenue) | | | 1.80 | | | | 4-1-2019 | | | | 7,000,000 | | | | 7,005,110 | |
Michigan Strategic Fund Limited Obligation Events Center Project Series A (Tax Revenue) ± | | | 4.13 | | | | 7-1-2045 | | | | 29,250,000 | | | | 29,615,625 | |
Rochester MI Community School District (GO Revenue, Qualified School Board Loan Fund Insured) | | | 5.00 | | | | 5-1-2017 | | | | 900,000 | | | | 911,691 | |
Rochester MI Community School District (GO Revenue, Qualified School Board Loan Fund Insured) | | | 5.00 | | | | 5-1-2019 | | | | 900,000 | | | | 969,813 | |
South Lyon MI Community School District (GO Revenue) | | | 4.00 | | | | 5-1-2018 | | | | 2,060,000 | | | | 2,131,194 | |
South Lyon MI Community School District (GO Revenue) | | | 4.00 | | | | 5-1-2019 | | | | 1,860,000 | | | | 1,960,626 | |
South Lyon MI Community School District (GO Revenue) | | | 4.00 | | | | 5-1-2020 | | | | 1,425,000 | | | | 1,523,026 | |
Southgate MI Community School District (GO Revenue, Build America Mutual Assurance Company Insured) | | | 5.00 | | | | 5-1-2019 | | | | 1,000,000 | | | | 1,077,570 | |
Southgate MI Community School District (GO Revenue, Build America Mutual Assurance Company Insured) | | | 5.00 | | | | 5-1-2020 | | | | 500,000 | | | | 550,830 | |
Warren Woods MI Public Schools (GO Revenue, Qualified School Board Loan Fund Insured) | | | 5.00 | | | | 5-1-2017 | | | | 1,445,000 | | | | 1,463,612 | |
The accompanying notes are an integral part of these financial statements.
| | | | |
| 18 | | Wells Fargo Short-Term Municipal Bond Fund | | Portfolio of investments—December 31, 2016 (unaudited) |
| | | | | | | | | | | | | | | | |
| Security name | | Interest rate | | | Maturity date | | | Principal | | | Value | |
| | | | |
| Michigan (continued) | | | | | | | | | | | | | | | | |
Warren Woods MI Public Schools (GO Revenue, Qualified School Board Loan Fund Insured) | | | 5.00 | % | | | 5-1-2020 | | | $ | 1,445,000 | | | $ | 1,590,916 | |
Wayne County MI Airport Authority Refunding Bond Series A (Airport Revenue) | | | 5.00 | | | | 12-1-2019 | | | | 19,405,000 | | | | 20,886,960 | |
Western Michigan University Refunding Bond (Education Revenue) | | | 5.00 | | | | 11-15-2020 | | | | 1,000,000 | | | | 1,112,990 | |
| | | | |
| | | | | | | | | | | | | | | 225,806,445 | |
| | | | | | | | | | | | | | | | |
| | | | |
| Minnesota: 0.29% | | | | | | | | | | | | | | | | |
Central Minnesota Municipal Power Agency Brookings Southeast Twin Cities Transmission Project (Utilities Revenue) | | | 5.00 | | | | 1-1-2017 | | | | 1,215,000 | | | | 1,215,134 | |
Hayward MN HCFR St. John’s Lutheran Home of Albert Lea Project Series 2015 (Health Revenue) | | | 2.75 | | | | 11-1-2017 | | | | 10,410,000 | | | | 10,474,854 | |
Minneapolis & St. Paul MN Housing & RDA HealthSpan Series B (Health Revenue, Ambac Insured) ±(m)(n) | | | 0.95 | | | | 11-15-2017 | | | | 3,000,000 | | | | 2,985,000 | |
Northern Minnesota Municipal Power Agency Series 2008A (Utilities Revenue, AGC Insured) | | | 5.00 | | | | 1-1-2018 | | | | 670,000 | | | | 695,232 | |
| | | | |
| | | | | | | | | | | | | | | 15,370,220 | |
| | | | | | | | | | | | | | | | |
| | | | |
| Mississippi: 0.42% | | | | | | | | | | | | | | | | |
Mississippi Business Finance Corporation Coast Electric Power Association (Utilities Revenue) ± | | | 0.95 | | | | 5-1-2037 | | | | 5,000,000 | | | | 4,997,200 | |
Mississippi Business Finance Corporation Power Company Project 1st Series (Utilities Revenue) ± | | | 1.63 | | | | 12-1-2040 | | | | 10,075,000 | | | | 10,090,012 | |
Mississippi Refunding Bond Capital Improvements Projects Series D (Miscellaneous Revenue) ± | | | 1.10 | | | | 9-1-2017 | | | | 7,050,000 | | | | 7,056,063 | |
| | | | |
| | | | | | | | | | | | | | | 22,143,275 | |
| | | | | | | | | | | | | | | | |
| | | | |
| Missouri: 0.55% | | | | | | | | | | | | | | | | |
Arnold MO Real Property Arnold Triangle Redevelopment Project Series A (Tax Revenue) | | | 3.75 | | | | 5-1-2023 | | | | 3,000,000 | | | | 2,999,280 | |
Kansas City MO Series A (GO Revenue) | | | 5.00 | | | | 2-1-2018 | | | | 1,150,000 | | | | 1,198,530 | |
Kansas City MO Series A (GO Revenue) | | | 5.00 | | | | 2-1-2019 | | | | 1,000,000 | | | | 1,074,100 | |
Kansas City MO Series A (GO Revenue) | | | 5.00 | | | | 2-1-2020 | | | | 1,495,000 | | | | 1,646,952 | |
Sikeston MO Electric System Refunding Bond (Utilities Revenue) | | | 5.00 | | | | 6-1-2019 | | | | 11,625,000 | | | | 12,360,746 | |
Tender Option Bond Trust Receipts/Certificates Floaters Series 2015-XF1015 (Health Revenue, Deutsche Bank LIQ) 144Aø | | | 0.90 | | | | 11-15-2048 | | | | 10,000,000 | | | | 10,000,000 | |
| | | | |
| | | | | | | | | | | | | | | 29,279,608 | |
| | | | | | | | | | | | | | | | |
| | | | |
| Nebraska: 0.02% | | | | | | | | | | | | | | | | |
Public Power Generation Agency Whelan Energy Center Unit (Utilities Revenue) | | | 5.00 | | | | 1-1-2020 | | | | 1,000,000 | | | | 1,085,180 | |
| | | | | | | | | | | | | | | | |
| | | | |
| Nevada: 0.67% | | | | | | | | | | | | | | | | |
Clark County NV Airport Jet Aviation Fuel Tax Series A (Airport Revenue) | | | 5.00 | | | | 7-1-2019 | | | | 1,000,000 | | | | 1,074,910 | |
Clark County NV Airport Jet Aviation Fuel Tax Series A (Airport Revenue) | | | 5.00 | | | | 7-1-2020 | | | | 1,000,000 | | | | 1,095,670 | |
Clark County NV PCR (Industrial Development Revenue) ± | | | 1.88 | | | | 6-1-2031 | | | | 880,000 | | | | 876,128 | |
Clark County NV School District Series A (GO Revenue, National Insured) | | | 5.00 | | | | 6-15-2021 | | | | 2,000,000 | | | | 2,094,220 | |
Clark County NV School District Series B (GO Revenue) | | | 5.00 | | | | 6-15-2019 | | | | 18,800,000 | | | | 20,339,720 | |
Clark County NV School District Series B (GO Revenue) | | | 5.00 | | | | 6-15-2021 | | | | 1,400,000 | | | | 1,453,424 | |
Washoe County NV Sierra Pacific Power Series B (Utilities Revenue) ± | | | 3.00 | | | | 3-1-2036 | | | | 500,000 | | | | 513,215 | |
Washoe County NV Water Facilities Refunding Bond AMT Sierra Pacific Power Company Project Series 2016E (Water & Sewer Revenue) ± | | | 0.79 | | | | 3-1-2036 | | | | 8,000,000 | | | | 8,000,000 | |
| | | | |
| | | | | | | | | | | | | | | 35,447,287 | |
| | | | | | | | | | | | | | | | |
The accompanying notes are an integral part of these financial statements.
| | | | | | |
| Portfolio of investments—December 31, 2016 (unaudited) | | Wells Fargo Short-Term Municipal Bond Fund | | | 19 | |
| | | | | | | | | | | | | | | | |
| Security name | | Interest rate | | | Maturity date | | | Principal | | | Value | |
| | | | |
| New Hampshire: 0.12% | | | | | | | | | | | | | | | | |
New Hampshire HEFA Catholic Medical Center (Health Revenue) | | | 4.00 | % | | | 7-1-2018 | | | $ | 2,405,000 | | | $ | 2,476,573 | |
New Hampshire HEFA Catholic Medical Center (Health Revenue) | | | 4.00 | | | | 7-1-2019 | | | | 2,635,000 | | | | 2,747,251 | |
New Hampshire HFA SFMR Series B (Housing Revenue) | | | 5.00 | | | | 7-1-2027 | | | | 1,170,000 | | | | 1,208,879 | |
| | | | |
| | | | | | | | | | | | | | | 6,432,703 | |
| | | | | | | | | | | | | | | | |
| | | | |
| New Jersey: 5.19% | | | | | | | | | | | | | | | | |
Andover NJ Regional School District Refunding School Bond Series 2014 (GO Revenue, Build America Mutual Assurance Company Insured) | | | 3.00 | | | | 2-15-2020 | | | | 515,000 | | | | 531,351 | |
Casino Reinvestment Development Authority New Jersey (Tax Revenue) | | | 4.00 | | | | 11-1-2017 | | | | 1,000,000 | | | | 1,005,380 | |
Casino Reinvestment Development Authority New Jersey (Tax Revenue) | | | 4.00 | | | | 11-1-2019 | | | | 1,425,000 | | | | 1,431,256 | |
Hudson County NJ Refunding Bond County College (GO Revenue) | | | 4.00 | | | | 7-15-2017 | | | | 1,000,000 | | | | 1,016,280 | |
Hudson County NJ Refunding Bond County College (GO Revenue) | | | 4.00 | | | | 7-15-2018 | | | | 1,135,000 | | | | 1,183,714 | |
Jersey City NJ Refunding Bond (GO Revenue, AGM Insured) | | | 4.00 | | | | 9-1-2017 | | | | 1,620,000 | | | | 1,648,998 | |
New Jersey Certificate of Participation Equipment Lease Purchase Agreement Series A (Miscellaneous Revenue) | | | 5.00 | | | | 6-15-2018 | | | | 11,160,000 | | | | 11,555,845 | |
New Jersey EDA (Tobacco Revenue) | | | 4.00 | | | | 6-15-2019 | | | | 2,500,000 | | | | 2,584,600 | |
New Jersey EDA CAB Saint Barnabas Hospital Series A (Health Revenue, National Insured) ¤ | | | 0.00 | | | | 7-1-2017 | | | | 2,740,000 | | | | 2,721,532 | |
New Jersey EDA Cigarette Tax (Tobacco Revenue) | | | 5.00 | | | | 6-15-2017 | | | | 18,630,000 | | | | 18,882,995 | |
New Jersey EDA School Facilities Construction Bonds Series DD-1 (Miscellaneous Revenue) | | | 5.00 | | | | 12-15-2019 | | | | 1,000,000 | | | | 1,051,050 | |
New Jersey EDA School Facilities Construction Bonds Series K (Miscellaneous Revenue, National Insured) | | | 5.25 | | | | 12-15-2021 | | | | 1,040,000 | | | | 1,142,378 | |
New Jersey EDA School Facilities Construction Notes (Miscellaneous Revenue) ± | | | 1.62 | | | | 2-1-2017 | | | | 20,725,000 | | | | 20,725,000 | |
New Jersey EDA School Facilities Construction Notes Series C (Miscellaneous Revenue) ± | | | 2.52 | | | | 2-1-2018 | | | | 28,000,000 | | | | 28,178,920 | |
New Jersey EDA School Facilities Construction Notes Series DD1 (Miscellaneous Revenue) | | | 5.00 | | | | 12-15-2018 | | | | 4,690,000 | | | | 4,895,188 | |
New Jersey EDA School Facilities Construction Notes Series K (Miscellaneous Revenue) ± | | | 1.46 | | | | 2-1-2017 | | | | 10,000,000 | | | | 10,000,000 | |
New Jersey EDA School Facilities Construction Notes Series NN (Miscellaneous Revenue) | | | 5.00 | | | | 3-1-2022 | | | | 330,000 | | | | 347,470 | |
New Jersey EDA Series BBB (Miscellaneous Revenue) | | | 5.00 | | | | 6-15-2022 | | | | 6,000,000 | | | | 6,323,280 | |
New Jersey EDA Series BBB (Miscellaneous Revenue) | | | 5.00 | | | | 6-15-2023 | | | | 4,000,000 | | | | 4,226,920 | |
New Jersey EDA Series UU (Miscellaneous Revenue) | | | 5.00 | | | | 6-15-2017 | | | | 3,000,000 | | | | 3,055,950 | |
New Jersey EDA Series UU (Miscellaneous Revenue) | | | 5.00 | | | | 6-15-2018 | | | | 7,355,000 | | | | 7,756,583 | |
New Jersey EDA Series XX (Miscellaneous Revenue) | | | 5.00 | | | | 6-15-2022 | | | | 7,500,000 | | | | 7,904,100 | |
New Jersey EDA Unrefunded Bond School Facilities Construction Series EE (Miscellaneous Revenue) | | | 5.00 | | | | 9-1-2020 | | | | 610,000 | | | | 645,020 | |
New Jersey EDA Unrefunded Bond School Facilities School Facilities Construction Series EE (Miscellaneous Revenue) | | | 5.00 | | | | 9-1-2018 | | | | 865,000 | | | | 899,185 | |
New Jersey Educational Facilities Authority Higher Education Capital Improvement Project Series A (Education Revenue) | | | 4.00 | | | | 9-1-2017 | | | | 2,675,000 | | | | 2,708,946 | |
New Jersey Educational Facilities Authority Higher Education Capital Improvement Project Series B (Education Revenue) | | | 4.00 | | | | 9-1-2017 | | | | 525,000 | | | | 531,662 | |
New Jersey Educational Facilities Authority Higher Education Capital Improvement Project Series D (Education Revenue) | | | 4.00 | | | | 9-1-2017 | | | | 565,000 | | | | 572,170 | |
New Jersey HCFA Trinitas Hospital Obligation Bonds Series B (Health Revenue) | | | 5.25 | | | | 7-1-2023 | | | | 4,475,000 | | | | 4,560,786 | |
New Jersey HFFA Greystone Park Psychiatric Hospital Project Series B (Miscellaneous Revenue) | | | 5.00 | | | | 9-15-2019 | | | | 2,135,000 | | | | 2,239,039 | |
The accompanying notes are an integral part of these financial statements.
| | | | |
| 20 | | Wells Fargo Short-Term Municipal Bond Fund | | Portfolio of investments—December 31, 2016 (unaudited) |
| | | | | | | | | | | | | | | | |
| Security name | | Interest rate | | | Maturity date | | | Principal | | | Value | |
| | | | |
| New Jersey (continued) | | | | | | | | | | | | | | | | |
New Jersey Higher Education Assistance Authority Series A1 (Education Revenue) | | | 3.63 | % | | | 12-1-2030 | | | $ | 880,000 | | | $ | 890,657 | |
New Jersey Higher Education Assistance Authority Series A1 (Education Revenue) | | | 5.00 | | | | 12-1-2020 | | | | 9,775,000 | | | | 10,510,569 | |
New Jersey Housing and Mortgage Finance Agency Series B (Housing Revenue) | | | 1.15 | | | | 11-1-2018 | | | | 11,095,000 | | | | 11,012,120 | |
New Jersey Housing and Mortgage Finance Agency Series B (Housing Revenue) | | | 1.25 | | | | 5-1-2019 | | | | 6,000,000 | | | | 5,937,060 | |
New Jersey Prerefunded Bond School Facilities Construction Series EE (Miscellaneous Revenue) | | | 5.00 | | | | 9-1-2018 | | | | 2,375,000 | | | | 2,521,894 | |
New Jersey Prerefunded Bond School Facilities Construction Series EE (Miscellaneous Revenue) | | | 5.00 | | | | 9-1-2020 | | | | 1,650,000 | | | | 1,837,853 | |
New Jersey Sports & Exposition Authority Series B (Miscellaneous Revenue) | | | 5.00 | | | | 9-1-2018 | | | | 1,605,000 | | | | 1,668,430 | |
New Jersey Transit Corporation Federal Transit Administration Grants Series A (Miscellaneous Revenue, National Insured) | | | 5.00 | | | | 9-15-2017 | | | | 7,265,000 | | | | 7,471,907 | |
New Jersey Transportation Trust Fund Authority Series A (Miscellaneous Revenue) | | | 5.00 | | | | 12-15-2019 | | | | 3,000,000 | | | | 3,154,650 | |
New Jersey TTFA Series A (Miscellaneous Revenue) | | | 5.00 | | | | 12-15-2018 | | | | 1,000,000 | | | | 1,043,170 | |
New Jersey TTFA Series A (Transportation Revenue) | | | 5.25 | | | | 12-15-2020 | | | | 33,465,000 | | | | 35,714,517 | |
New Jersey TTFA Series A1 (Transportation Revenue) | | | 5.00 | | | | 6-15-2020 | | | | 7,000,000 | | | | 7,481,180 | |
New Jersey TTFA Series A1 (Transportation Revenue) | | | 5.00 | | | | 6-15-2021 | | | | 5,000,000 | | | | 5,352,750 | |
New Jersey TTFA Series AA (Transportation Revenue) | | | 5.00 | | | | 6-15-2019 | | | | 2,070,000 | | | | 2,165,696 | |
New Jersey TTFA Transit System Series A (GO Revenue) | | | 5.75 | | | | 6-15-2020 | | | | 4,150,000 | | | | 4,441,289 | |
New Jersey Turnpike Authority Series B-3 (Transportation Revenue) ± | | | 0.98 | | | | 1-1-2024 | | | | 4,700,000 | | | | 4,689,754 | |
Newark NJ Housing Authority Refunding Bond Newark Redevelopment Project (Miscellaneous Revenue, National Insured) | | | 5.25 | | | | 1-1-2020 | | | | 2,170,000 | | | | 2,364,606 | |
Newark NJ Housing Authority Refunding Bond Newark Redevelopment Project (Miscellaneous Revenue, National Insured) | | | 5.25 | | | | 1-1-2021 | | | | 4,570,000 | | | | 5,053,232 | |
Rutgers University Series J (Education Revenue) | | | 4.00 | | | | 5-1-2018 | | | | 700,000 | | | | 725,928 | |
Rutgers University Series L (Education Revenue) | | | 5.00 | | | | 5-1-2017 | | | | 600,000 | | | | 608,220 | |
Rutgers University Series L (Education Revenue) | | | 5.00 | | | | 5-1-2018 | | | | 300,000 | | | | 315,075 | |
Trenton City NJ Refunding Bond (GO Revenue, Build America Mutual Assurance Company Insured) | | | 4.00 | | | | 12-1-2017 | | | | 1,710,000 | | | | 1,744,696 | |
Trenton City NJ Refunding Bond (GO Revenue) | | | 4.00 | | | | 7-15-2019 | | | | 1,815,000 | | | | 1,876,184 | |
Trenton City NJ Refunding Bond (GO Revenue) | | | 4.00 | | | | 7-15-2020 | | | | 1,685,000 | | | | 1,748,188 | |
Trenton City NJ Refunding Bond (GO Revenue, Build America Mutual Assurance Company Insured) | | | 5.00 | | | | 12-1-2020 | | | | 1,675,000 | | | | 1,832,115 | |
Winslow Township NJ Board of Education Refunding Bond (GO Revenue) | | | 3.00 | | | | 8-1-2017 | | | | 600,000 | | | | 605,910 | |
Winslow Township NJ Board of Education Refunding Bond (GO Revenue) | | | 4.00 | | | | 8-1-2018 | | | | 425,000 | | | | 441,129 | |
Winslow Township NJ Board of Education Refunding Bond (GO Revenue) | | | 4.00 | | | | 8-1-2019 | | | | 525,000 | | | | 553,681 | |
| | | | |
| | | | | | | | | | | | | | | 274,088,058 | |
| | | | | | | | | | | | | | | | |
| | | | |
| New Mexico: 0.81% | | | | | | | | | | | | | | | | |
Farmington NM PCR Series B (Utilities Revenue) ± | | | 4.75 | | | | 6-1-2040 | | | | 5,080,000 | | | | 5,129,378 | |
Farmington NM PCR Southern California Edison Company Four Corners Project Series B (Utilities Revenue) ± | | | 1.88 | | | | 4-1-2029 | | | | 4,750,000 | | | | 4,690,673 | |
New Mexico Educational Assistance Foundation Series A2 (Education Revenue) ± | | | 1.32 | | | | 12-1-2028 | | | | 230,000 | | | | 229,294 | |
New Mexico Mortgage Finance Authority SFMR Class I-A-2 (Housing Revenue, GNMA/FNMA/FHLMC Insured) | | | 5.60 | | | | 1-1-2039 | | | | 225,000 | | | | 235,989 | |
New Mexico Municipal Energy Acquisition Authority Gas Supply Sub Series B (Utilities Revenue, Royal Bank of Canada SPA) ± | | | 1.16 | | | | 11-1-2039 | | | | 32,500,000 | | | | 32,301,100 | |
| | | | |
| | | | | | | | | | | | | | | 42,586,434 | |
| | | | | | | | | | | | | | | | |
The accompanying notes are an integral part of these financial statements.
| | | | | | |
| Portfolio of investments—December 31, 2016 (unaudited) | | Wells Fargo Short-Term Municipal Bond Fund | | | 21 | |
| | | | | | | | | | | | | | | | |
| Security name | | Interest rate | | | Maturity date | | | Principal | | | Value | |
| | | | |
| New York: 12.10% | | | | | | | | | | | | | | | | |
Broome County NY BAN (GO Revenue) | | | 2.00 | % | | | 5-5-2017 | | | $ | 20,000,000 | | | $ | 20,060,600 | |
Candor Central School District Tioga and Tompkins Counties NY BAN (GO Revenue) | | | 2.00 | | | | 6-29-2017 | | | | 12,000,000 | | | | 12,047,400 | |
Corning NY City School District BAN (GO Revenue) | | | 2.00 | | | | 6-22-2017 | | | | 11,875,000 | | | | 11,911,456 | |
Long Island NY Power Authority Electric System Series C (Utilities Revenue) ± | | | 1.08 | | | | 5-1-2033 | | | | 12,000,000 | | | | 11,997,000 | |
Long Island NY Power Authority Electric System Series C (Utilities Revenue) ± | | | 1.31 | | | | 5-1-2033 | | | | 33,750,000 | | | | 33,881,963 | |
Metropolitan Transportation Authority New York Sub Series D2 (Transportation Revenue) ± | | | 4.00 | | | | 11-15-2034 | | | | 14,665,000 | | | | 15,481,694 | |
Metropolitan Transportation Authority New York Sub Series A2 (Transportation Revenue) ± | | | 1.31 | | | | 11-15-2039 | | | | 2,000,000 | | | | 1,998,260 | |
Metropolitan Transportation Authority New York Sub Series A3 (Transportation Revenue) ± | | | 1.22 | | | | 11-15-2042 | | | | 39,500,000 | | | | 39,344,370 | |
Metropolitan Transportation Authority New York Sub Series B3 (Tax Revenue) ± | | | 1.62 | | | | 11-1-2018 | | | | 32,600,000 | | | | 32,730,400 | |
Metropolitan Transportation Authority New York Sub Series B4 (Transportation Revenue) ± | | | 5.00 | | | | 11-15-2030 | | | | 13,620,000 | | | | 14,776,747 | |
Metropolitan Transportation Authority New York Sub Series C2 (Transportation Revenue) ± | | | 4.00 | | | | 11-15-2033 | | | | 8,000,000 | | | | 8,603,200 | |
Metropolitan Transportation Authority New York Sub Series D2 (Transportation Revenue, AGM Insured) ± | | | 1.03 | | | | 11-1-2032 | | | | 15,750,000 | | | | 15,753,308 | |
Metropolitan Transportation Authority New York Sub Series G1 (Transportation Revenue) ± | | | 0.89 | | | | 11-1-2026 | | | | 31,950,000 | | | | 31,718,043 | |
Metropolitan Transportation Authority New York Sub Series G4 (Transportation Revenue) ± | | | 1.25 | | | | 11-1-2030 | | | | 11,600,000 | | | | 11,631,668 | |
Middletown NY City School District BAN (GO Revenue) | | | 2.00 | | | | 6-22-2017 | | | | 14,000,000 | | | | 14,054,880 | |
Monroe County NY IDAG Continuing Development Services Project (Industrial Development Revenue, Citizens Bank LOC) ø | | | 0.89 | | | | 7-1-2027 | | | | 2,775,000 | | | | 2,775,000 | |
Nassau County NY Prerefunded Bond Series C (GO Revenue) | | | 5.00 | | | | 10-1-2020 | | | | 3,020,000 | | | | 3,308,199 | |
Nassau County NY Series A (GO Revenue) | | | 5.00 | | | | 1-1-2020 | | | | 4,000,000 | | | | 4,372,520 | |
Nassau County NY Series F (GO Revenue) | | | 5.00 | | | | 10-1-2020 | | | | 1,780,000 | | | | 1,928,256 | |
Nassau County NY Unrefunded Bond Series C (GO Revenue) | | | 5.00 | | | | 10-1-2020 | | | | 45,000 | | | | 49,008 | |
New York City NY Housing Development Corporation Sustainable Neighborhood Bonds Series I2B (Housing Revenue) ± | | | 2.00 | | | | 5-1-2021 | | | | 12,000,000 | | | | 11,983,800 | |
New York City NY Transitional Future Tax Series A-3B (Tax Revenue, Bank of Tokyo-Mitsubishi LOC) ø | | | 0.75 | | | | 11-1-2029 | | | | 8,700,000 | | | | 8,700,000 | |
New York Dormitory Authority North Shore-Long Island Jewish Obligated Group Series B (Health Revenue) ± | | | 1.32 | | | | 5-1-2018 | | | | 6,655,000 | | | | 6,658,660 | |
New York Dormitory Authority St. John University Series B-1 (Education Revenue, Bank of America NA LOC) ø | | | 0.68 | | | | 7-1-2034 | | | | 4,385,000 | | | | 4,385,000 | |
New York Environmental Facilities Corporation Municipal Water Series A (Water & Sewer Revenue) | | | 5.00 | | | | 6-15-2017 | | | | 2,250,000 | | | | 2,293,043 | |
New York Environmental Facilities Corporation Municipal Water Series A (Water & Sewer Revenue) | | | 5.00 | | | | 6-15-2018 | | | | 750,000 | | | | 792,878 | |
New York Environmental Facilities Corporation Municipal Water Series A (Water & Sewer Revenue) | | | 5.00 | | | | 6-15-2019 | | | | 1,000,000 | | | | 1,088,740 | |
New York Local Government Assistance Corporation Series A9V (Tax Revenue, AGM Insured) ±(m)(n) | | | 0.99 | | | | 4-1-2017 | | | | 4,225,000 | | | | 4,225,000 | |
New York NY Adjusted Fiscal 2008 Sub Series A4 (GO Revenue, AGM Insured) ±(m) | | | 0.84 | | | | 8-1-2026 | | | | 4,000,000 | | | | 4,000,000 | |
New York NY Adjusted Fiscal 2008 Sub Series C4 (GO Revenue, AGC Insured) ±(m) | | | 0.84 | | | | 10-1-2027 | | | | 14,075,000 | | | | 14,075,000 | |
New York NY Energy Research & Development Authority Gas Facilities Brooklyn Union Gas Project Series A1 (Utilities Revenue, National Insured) ±(m)(n) | | | 1.28 | | | | 12-1-2020 | | | | 15,000,000 | | | | 14,400,000 | |
New York NY Health & Hospital Corporation Health System Series A (Health Revenue) | | | 5.50 | | | | 2-15-2020 | | | | 5,755,000 | | | | 6,020,018 | |
The accompanying notes are an integral part of these financial statements.
| | | | |
| 22 | | Wells Fargo Short-Term Municipal Bond Fund | | Portfolio of investments—December 31, 2016 (unaudited) |
| | | | | | | | | | | | | | | | |
| Security name | | Interest rate | | | Maturity date | | | Principal | | | Value | |
| | | | |
| New York (continued) | | | | | | | | | | | | | | | | |
New York NY IDA 123 Washington LLC Project (Industrial Development Revenue, Bank of China LOC) ø | | | 0.90 | % | | | 10-1-2042 | | | $ | 5,700,000 | | | $ | 5,700,000 | |
New York NY IDAG Refunding Bond Senior Trips Series A (Airport Revenue) | | | 5.00 | | | | 7-1-2017 | | | | 2,000,000 | | | | 2,030,120 | |
New York NY Refunding Bond Fiscal 2015 Series A (GO Revenue) | | | 5.00 | | | | 8-1-2021 | | | | 7,515,000 | | | | 8,514,495 | |
New York NY Series J-4 (GO Revenue) ± | | | 1.27 | | | | 8-1-2025 | | | | 2,000,000 | | | | 2,000,720 | |
New York NY Sub Series J-11 (GO Revenue) ± | | | 1.30 | | | | 8-1-2027 | | | | 40,960,000 | | | | 40,944,026 | |
New York NY Transitional Finance Authority Sub Series 2A (Tax Revenue, Dexia Credit Local LIQ) ø | | | 0.93 | | | | 11-1-2022 | | | | 8,780,000 | | | | 8,780,000 | |
New York NY Urban Development Corporation Personal Income Tax Series A (Tax Revenue) | | | 5.00 | | | | 3-15-2019 | | | | 1,855,000 | | | | 2,001,860 | |
New York Tender Option Bond Trust Receipts/Certificates Series 2016 (Health Revenue, Barclays Bank plc LIQ) 144Aø | | | 0.82 | | | | 7-1-2024 | | | | 9,940,000 | | | | 9,940,000 | |
New York Tobacco Settlement Financing Corporation Series B (Tobacco Revenue) | | | 5.00 | | | | 6-1-2017 | | | | 6,500,000 | | | | 6,608,355 | |
New York Transportation Development Corporation American Airlines Incorporated John F Kennedy International Airport Project (Airport Revenue) | | | 5.00 | | | | 8-1-2020 | | | | 11,000,000 | | | | 11,441,980 | |
New York Transportation Development Corporation American Airlines Incorporated John F. Kennedy International Airport Project Series 2016 (Airport Revenue) | | | 5.00 | | | | 8-1-2019 | | | | 15,000,000 | | | | 15,587,400 | |
New York Urban Development Corporation Certificate of Participation James A Farley Post Office Project (Miscellaneous Revenue) 144A | | | 4.20 | | | | 2-1-2017 | | | | 42,760,000 | | | | 42,742,896 | |
New York Urban Development Corporation Personal Income Tax Series A (Tax Revenue) | | | 5.00 | | | | 3-15-2020 | | | | 25,175,000 | | | | 27,842,291 | |
Oyster Bay NY BAN Series A (GO Revenue) | | | 2.75 | | | | 2-3-2017 | | | | 15,000,000 | | | | 15,008,250 | |
Oyster Bay NY BAN Series D (GO Revenue) | | | 3.88 | | | | 6-28-2017 | | | | 3,485,000 | | | | 3,496,291 | |
Oyster Bay NY Public Improvement Series B (GO Revenue, AGM Insured) | | | 3.00 | | | | 11-1-2018 | | | | 1,140,000 | | | | 1,167,691 | |
Oyster Bay NY TAN Series B (GO Revenue) | | | 5.25 | | | | 4-7-2017 | | | | 3,500,000 | | | | 3,522,435 | |
Rockland County NY Public Improvement Series C (GO Revenue, AGM Insured) | | | 3.00 | | | | 5-1-2020 | | | | 1,390,000 | | | | 1,424,208 | |
Rockland County NY Refunding Bond (GO Revenue, Build America Mutual Assurance Company Insured) | | | 3.00 | | | | 2-15-2018 | | | | 2,475,000 | | | | 2,515,417 | |
Rockland County NY Refunding Bond (GO Revenue, Build America Mutual Assurance Company Insured) | | | 3.00 | | | | 2-15-2019 | | | | 1,830,000 | | | | 1,871,321 | |
Rockland County NY Refunding Bond (GO Revenue, Build America Mutual Assurance Company Insured) | | | 3.00 | | | | 2-15-2020 | | | | 630,000 | | | | 645,523 | |
Sachem NY Center School District Suffolk County TAN 2016-2017 (GO Revenue) | | | 1.50 | | | | 6-29-2017 | | | | 16,000,000 | | | | 16,011,360 | |
Suffolk County NY Judicial Facilities Agency Leases H. Lee Dennison Building (Miscellaneous Revenue) | | | 5.00 | | | | 11-1-2017 | | | | 2,365,000 | | | | 2,426,443 | |
Suffolk County NY Judicial Facilities Agency Leases H. Lee Dennison Building (Miscellaneous Revenue) | | | 5.00 | | | | 11-1-2018 | | | | 2,640,000 | | | | 2,777,095 | |
Suffolk County NY Judicial Facilities Agency Leases H. Lee Dennison Building (Miscellaneous Revenue) | | | 5.00 | | | | 11-1-2019 | | | | 2,775,000 | | | | 2,970,998 | |
Suffolk County NY Judicial Facilities Agency Leases H. Lee Dennison Building (Miscellaneous Revenue) | | | 5.00 | | | | 11-1-2020 | | | | 2,915,000 | | | | 3,163,504 | |
Suffolk County NY Public Improvement Series A (GO Revenue) | | | 4.00 | | | | 5-15-2018 | | | | 1,615,000 | | | | 1,671,557 | |
Suffolk County NY Refunding Bond (GO Revenue, AGM Insured) | | | 5.00 | | | | 2-1-2017 | | | | 1,500,000 | | | | 1,505,160 | |
Suffolk County NY Refunding Bond Series A (GO Revenue) | | | 5.00 | | | | 4-1-2018 | | | | 2,700,000 | | | | 2,820,933 | |
Suffolk County NY Refunding Bond Series A (GO Revenue) | | | 5.00 | | | | 4-1-2019 | | | | 1,385,000 | | | | 1,487,490 | |
Suffolk County NY TAN (GO Revenue) | | | 2.00 | | | | 7-26-2017 | | | | 19,000,000 | | | | 19,071,820 | |
Triborough Bridge & Tunnel Authority New York Refunding Bond Sub Series ABCD-3 (Transportation Revenue, AGM Insured) ± | | | 0.97 | | | | 1-1-2017 | | | | 4,100,000 | | | | 4,100,000 | |
| | | | |
| | | | | | | | | | | | | | | 638,837,750 | |
| | | | | | | | | | | | | | | | |
The accompanying notes are an integral part of these financial statements.
| | | | | | |
| Portfolio of investments—December 31, 2016 (unaudited) | | Wells Fargo Short-Term Municipal Bond Fund | | | 23 | |
| | | | | | | | | | | | | | | | |
| Security name | | Interest rate | | | Maturity date | | | Principal | | | Value | |
| | | | |
| North Carolina: 0.48% | | | | | | | | | | | | | | | | |
North Carolina Eastern Municipal Power Agency Series C (Utilities Revenue, AGC Insured) | | | 6.00 | % | | | 1-1-2019 | | | $ | 490,000 | | | $ | 513,236 | |
North Carolina Eastern Municipal Power Agency Series D (Utilities Revenue) | | | 5.00 | | | | 1-1-2017 | | | | 10,000,000 | | | | 10,001,200 | |
North Carolina Grant Anticipation Capital Improvement (Miscellaneous Revenue) ± | | | 4.00 | | | | 3-1-2023 | | | | 13,145,000 | | | | 13,395,544 | |
North Carolina Medical Care Commission Novant Health Obligated Group Series A (Health Revenue) | | | 4.00 | | | | 11-1-2017 | | | | 1,330,000 | | | | 1,360,790 | |
| | | | |
| | | | | | | | | | | | | | | 25,270,770 | |
| | | | | | | | | | | | | | | | |
| | | | |
| North Dakota: 0.11% | | | | | | | | | | | | | | | | |
Hazen ND Sakakawea Medical Center Project BAN (Health Revenue) | | | 2.50 | | | | 7-1-2017 | | | | 5,000,000 | | | | 5,005,100 | |
Ward County ND HCFR Trinity Obligated Group (Health Revenue) | | | 5.13 | | | | 7-1-2018 | | | | 1,000,000 | | | | 1,003,020 | |
| | | | |
| | | | | | | | | | | | | | | 6,008,120 | |
| | | | | | | | | | | | | | | | |
| | | | |
| Ohio: 3.06% | | | | | | | | | | | | | | | | |
Crawford County OH Avita Health System Obligated Group Project (Health Revenue) | | | 1.43 | | | | 11-1-2017 | | | | 10,000,000 | | | | 10,000,300 | |
Cuyahoga OH Metropolitan Housing Authority Carver Park Phase I Project (Housing Revenue) ± | | | 1.00 | | | | 9-1-2019 | | | | 7,000,000 | | | | 6,928,950 | |
Cuyahoga OH Metropolitan Housing Authority Headquarters Project (Housing Revenue) | | | 1.75 | | | | 3-1-2020 | | | | 5,835,000 | | | | 5,728,511 | |
Cuyahoga OH Metropolitan Housing Authority Heritage View Homes Project (Housing Revenue) | | | 1.00 | | | | 6-1-2017 | | | | 5,550,000 | | | | 5,545,394 | |
Franklin County OH Hospital Facilities Refunding Bond Ohio Health Corporation Series B (Health Revenue) ± | | | 5.00 | | | | 11-15-2033 | | | | 16,705,000 | | | | 17,044,112 | |
Lake County OH Lake Hospital System Incorporated (Health Revenue) | | | 5.00 | | | | 8-15-2020 | | | | 905,000 | | | | 995,391 | |
Lancaster OH Port Authority (Utilities Revenue, Royal Bank of Canada SPA) ± | | | 1.13 | | | | 5-1-2038 | | | | 73,500,000 | | | | 72,856,140 | |
Lorain County OH Port Authority EDA Series A (Health Revenue) | | | 4.00 | | | | 11-15-2018 | | | | 670,000 | | | | 696,700 | |
Lucas Metropolitan Housing Authority OH Certificate of Participation (Housing Revenue) | | | 2.25 | | | | 11-1-2020 | | | | 1,015,000 | | | | 1,012,696 | |
Muskingum County OH Hospital Facilities Genesis Healthcare System Project (Health Revenue) | | | 5.00 | | | | 2-15-2017 | | | | 1,575,000 | | | | 1,580,276 | |
Muskingum County OH Hospital Facilities Genesis Healthcare System Project (Health Revenue) | | | 5.00 | | | | 2-15-2018 | | | | 1,000,000 | | | | 1,027,980 | |
Ohio Air Quality Development Authority PCR Facilities Refunding Bond FirstEnergy Generation Project (Resource Recovery Revenue) ± | | | 3.10 | | | | 3-1-2023 | | | | 10,000,000 | | | | 4,183,900 | |
Ohio Air Quality Development Authority Series A (Miscellaneous Revenue) ± | | | 3.13 | | | | 7-1-2033 | | | | 1,500,000 | | | | 628,245 | |
Ohio Air Quality Development Authority Series A (Utilities Revenue) ± | | | 3.75 | | | | 12-1-2023 | | | | 9,000,000 | | | | 3,766,230 | |
Ohio Air Quality Development Authority Series B (Industrial Development Revenue) ± | | | 3.63 | | | | 12-1-2033 | | | | 2,000,000 | | | | 836,040 | |
Ohio Portsmouth Bypass Project (Miscellaneous Revenue) | | | 5.00 | | | | 12-31-2020 | | | | 1,000,000 | | | | 1,096,200 | |
Ohio Portsmouth Bypass Project (Miscellaneous Revenue) | | | 5.00 | | | | 12-31-2021 | | | | 1,205,000 | | | | 1,336,200 | |
Ohio Water Development Authority First Energy Nuclear Generation Project Series A (Water & Sewer Revenue) | | | 3.00 | | | | 5-15-2019 | | | | 31,000,000 | | | | 12,966,990 | |
Ohio Water Development Authority Pollution Control Series A (Industrial Development Revenue) ± | | | 3.75 | | | | 7-1-2033 | | | | 17,950,000 | | | | 7,503,639 | |
Springfield OH (GO Revenue, AGC Insured) | | | 4.00 | | | | 12-1-2020 | | | | 1,005,000 | | | | 1,052,346 | |
Warren County OH HCFR Otterbein Homes Series A (Health Revenue) | | | 5.00 | | | | 7-1-2018 | | | | 2,000,000 | | | | 2,103,320 | |
Warren County OH HCFR Otterbein Homes Series A (Health Revenue) | | | 5.00 | | | | 7-1-2019 | | | | 2,215,000 | | | | 2,386,574 | |
| | | | |
| | | | | | | | | | | | | | | 161,276,134 | |
| | | | | | | | | | | | | | | | |
The accompanying notes are an integral part of these financial statements.
| | | | |
| 24 | | Wells Fargo Short-Term Municipal Bond Fund | | Portfolio of investments—December 31, 2016 (unaudited) |
| | | | | | | | | | | | | | | | |
| Security name | | Interest rate | | | Maturity date | | | Principal | | | Value | |
| | | | |
| Oklahoma: 0.61% | | | | | | | | | | | | | | | | |
Blaine County OK Educational Facilities Authority Watonga Public Schools Project (Miscellaneous Revenue) | | | 5.00 | % | | | 12-1-2021 | | | $ | 945,000 | | | $ | 1,053,921 | |
Cleveland County OK Educational Facilities Authority Norman Public Schools Project (Miscellaneous Revenue) | | | 5.00 | | | | 7-1-2018 | | | | 2,680,000 | | | | 2,820,914 | |
Cleveland County OK Educational Facilities Authority Norman Public Schools Project (Miscellaneous Revenue) | | | 5.00 | | | | 7-1-2019 | | | | 2,000,000 | | | | 2,159,520 | |
Cleveland County OK Justice Authority Detention Facility Project (Tax Revenue) | | | 4.00 | | | | 3-1-2020 | | | | 500,000 | | | | 521,660 | |
Creek County OK Educational Facilities Authority Sapulpa Public School Project (Miscellaneous Revenue) | | | 5.00 | | | | 9-1-2020 | | | | 2,550,000 | | | | 2,810,687 | |
Grady County OK School Finance Authority Tuttle Public School Project (Miscellaneous Revenue) | | | 5.00 | | | | 9-1-2019 | | | | 1,000,000 | | | | 1,082,180 | |
Grady County OK School Finance Authority Tuttle Public School Project (Miscellaneous Revenue) | | | 5.00 | | | | 9-1-2021 | | | | 1,065,000 | | | | 1,191,234 | |
Oklahoma City OK Industrial & Cultural Facilities Series B (Health Revenue, National Insured) ±(m)(n) | | | 1.10 | | | | 6-1-2019 | | | | 10,300,000 | | | | 9,926,625 | |
Tulsa OK Airports Improvement Trust Series A (Airport Revenue, Build America Mutual Assurance Company Insured) | | | 4.00 | | | | 6-1-2018 | | | | 1,240,000 | | | | 1,277,746 | |
Tulsa OK Airports Improvement Trust Series A (Airport Revenue, Build America Mutual Assurance Company Insured) | | | 5.00 | | | | 6-1-2019 | | | | 3,025,000 | | | | 3,235,026 | |
Tulsa OK Airports Improvement Trust Series A (Airport Revenue, Build America Mutual Assurance Company Insured) | | | 5.00 | | | | 6-1-2020 | | | | 1,000,000 | | | | 1,089,420 | |
Tulsa OK Airports Improvement Trust Series A (Airport Revenue) | | | 4.00 | | | | 6-1-2017 | | | | 1,250,000 | | | | 1,260,588 | |
Tulsa OK Airports Improvement Trust Series A (Airport Revenue, Build America Mutual Assurance Company Insured) | | | 5.00 | | | | 6-1-2018 | | | | 530,000 | | | | 553,527 | |
Tulsa OK Airports Improvement Trust Series A (Airport Revenue, Build America Mutual Assurance Company Insured) | | | 5.00 | | | | 6-1-2020 | | | | 695,000 | | | | 757,147 | |
Tulsa OK Airports Improvement Trust Series B (Airport Revenue, Build America Mutual Assurance Company Insured) | | | 4.00 | | | | 6-1-2018 | | | | 860,000 | | | | 886,178 | |
Woodward County OK PFFA Series B (Tax Revenue) | | | 3.25 | | | | 9-1-2026 | | | | 1,380,000 | | | | 1,384,223 | |
| | | | |
| | | | | | | | | | | | | | | 32,010,596 | |
| | | | | | | | | | | | | | | | |
| | | | |
| Other: 1.14% | | | | | | | | | | | | | | | | |
Branch Banking & Trust Municipal Investment Trust Various States Class C (Miscellaneous Revenue, Rabobank LOC) 144A± | | | 1.43 | | | | 11-15-2017 | | | | 7,058,799 | | | | 7,050,540 | |
Branch Banking & Trust Municipal Investment Trust Various States Class C (Miscellaneous Revenue, Rabobank LOC) 144A± | | | 1.78 | | | | 12-31-2019 | | | | 20,000,000 | | | | 19,997,200 | |
Branch Banking & Trust Municipal Investment Trust Various States Class D (Miscellaneous Revenue, Rabobank LOC) ± | | | 1.47 | | | | 12-1-2017 | | | | 1,995,000 | | | | 1,995,000 | |
Branch Banking & Trust Municipal Investment Trust Various States Class D (Miscellaneous Revenue, Rabobank LOC) 144A± | | | 1.53 | | | | 11-15-2019 | | | | 6,000,000 | | | | 5,959,440 | |
FHLMC Multifamily Certificates Series M012 Class A1B (Miscellaneous Revenue) | | | 2.70 | | | | 8-15-2051 | | | | 15,000,000 | | | | 15,137,700 | |
Public Housing Capital Fund Trust I (Miscellaneous Revenue, HUD Insured) 144A | | | 4.50 | | | | 7-1-2022 | | | | 7,429,667 | | | | 7,626,776 | |
Public Housing Capital Fund Trust II (Miscellaneous Revenue, HUD Insured) 144A | | | 4.50 | | | | 7-1-2022 | | | | 2,417,348 | | | | 2,468,693 | |
| | | | |
| | | | | | | | | | | | | | | 60,235,349 | |
| | | | | | | | | | | | | | | | |
| | | | |
| Pennsylvania: 7.77% | | | | | | | | | | | | | | | | |
Allegheny County PA Airport Authority Pittsburgh International Airport (Airport Revenue, FGIC Insured) | | | 5.00 | | | | 1-1-2017 | | | | 2,500,000 | | | | 2,500,275 | |
Allegheny County PA Hospital Development Authority University of Pittsburgh Medical Center Series A-1 (Health Revenue) ± | | | 1.31 | | | | 2-1-2021 | | | | 3,190,000 | | | | 3,188,692 | |
Allegheny County PA Series C-68 (GO Revenue) | | | 5.00 | | | | 11-1-2017 | | | | 1,340,000 | | | | 1,384,877 | |
The accompanying notes are an integral part of these financial statements.
| | | | | | |
| Portfolio of investments—December 31, 2016 (unaudited) | | Wells Fargo Short-Term Municipal Bond Fund | | | 25 | |
| | | | | | | | | | | | | | | | |
| Security name | | Interest rate | | | Maturity date | | | Principal | | | Value | |
| | | | |
| Pennsylvania (continued) | | | | | | | | | | | | | | | | |
Beaver County PA IDA FirstEnergy Generation Series B (Industrial Development Revenue) ± | | | 3.50 | % | | | 12-1-2035 | | | $ | 4,300,000 | | | $ | 1,797,486 | |
Beaver County PA IDA Pollution Control First Nuclear General Project Series A (Utilities Revenue) ± | | | 2.70 | | | | 4-1-2035 | | | | 1,400,000 | | | | 586,684 | |
Delaware County PA Authority Neumann University (Miscellaneous Revenue) | | | 4.00 | | | | 10-1-2021 | | | | 3,215,000 | | | | 3,349,033 | |
Delaware County PA IDA Resource Recovery Facility Series A (Resource Recovery Revenue) | | | 6.20 | | | | 7-1-2019 | | | | 1,425,000 | | | | 1,429,617 | |
Delaware Valley PA Regional Finance Authority (Miscellaneous Revenue, Ambac Insured) | | | 5.50 | | | | 8-1-2018 | | | | 2,020,000 | | | | 2,134,292 | |
Delaware Valley PA Regional Finance Authority (Miscellaneous Revenue) | | | 5.75 | | | | 7-1-2017 | | | | 8,900,000 | | | | 9,101,051 | |
Delaware Valley PA Regional Finance Authority Series B (Miscellaneous Revenue, Ambac Insured) | | | 5.60 | | | | 7-1-2017 | | | | 5,015,000 | | | | 5,124,528 | |
Erie PA Higher Education Building Authority Mercyhurst College Project (Education Revenue) | | | 5.00 | | | | 3-15-2018 | | | | 735,000 | | | | 767,752 | |
Hempfield PA School District (GO Revenue) ± | | | 0.77 | | | | 8-1-2017 | | | | 3,770,000 | | | | 3,759,595 | |
Lackawanna County PA Riverside School District Project (GO Revenue, Build America Mutual Assurance Company Insured) | | | 4.00 | | | | 10-15-2019 | | | | 1,400,000 | | | | 1,479,562 | |
Lackawanna County PA Riverside School District Project (GO Revenue, Build America Mutual Assurance Company Insured) | | | 4.00 | | | | 10-15-2020 | | | | 1,455,000 | | | | 1,551,263 | |
Manheim Township PA School District Series A (GO Revenue) ± | | | 0.76 | | | | 5-1-2025 | | | | 4,700,000 | | | | 4,653,752 | |
Montgomery County PA IDA Albert Einstein Healthcare Network Issue Series A (Health Revenue) | | | 5.00 | | | | 1-15-2017 | | | | 1,400,000 | | | | 1,402,170 | |
Montgomery County PA IDA Albert Einstein Healthcare Network Issue Series A (Health Revenue) | | | 5.00 | | | | 1-15-2018 | | | | 1,000,000 | | | | 1,033,910 | |
Montgomery County PA IDA Albert Einstein Healthcare Network Issue Series A (Health Revenue) | | | 5.00 | | | | 1-15-2020 | | | | 1,315,000 | | | | 1,411,284 | |
Montgomery County PA IDA Exelon Generation Company LLC (Industrial Development Revenue) ± | | | 2.50 | | | | 10-1-2030 | | | | 40,795,000 | | | | 40,322,186 | |
Montgomery County PA IDA Peco Energy Company Project Series A (Industrial Development Revenue) ± | | | 2.50 | | | | 10-1-2030 | | | | 30,000,000 | | | | 29,652,300 | |
Montgomery County PA IDA Peco Energy Company Project Series A (Industrial Development Revenue) ± | | | 2.60 | | | | 3-1-2034 | | | | 2,125,000 | | | | 2,108,319 | |
Nazareth PA Area School District (GO Revenue) ± | | | 0.88 | | | | 2-1-2031 | | | | 15,040,000 | | | | 14,968,410 | |
Penn Hills PA School District (GO Revenue, Build America Mutual Assurance Company Insured) | | | 5.00 | | | | 11-15-2020 | | | | 825,000 | | | | 896,726 | |
Penn Hills PA School District (GO Revenue, Build America Mutual Assurance Company Insured) | | | 5.00 | | | | 11-15-2021 | | | | 1,275,000 | | | | 1,401,353 | |
Pennsylvania Certificate of Participation (Miscellaneous Revenue, AGM Insured) | | | 2.00 | | | | 11-1-2019 | | | | 1,100,000 | | | | 1,093,653 | |
Pennsylvania Certificate of Participation (Miscellaneous Revenue, AGM Insured) | | | 4.00 | | | | 11-1-2019 | | | | 1,005,000 | | | | 1,054,145 | |
Pennsylvania EDFA PA Bridges Finco LP (Industrial Development Revenue) | | | 5.00 | | | | 12-31-2020 | | | | 1,850,000 | | | | 1,997,908 | |
Pennsylvania EDFA PA Bridges Finco LP (Industrial Development Revenue) | | | 5.00 | | | | 12-31-2021 | | | | 1,095,000 | | | | 1,188,568 | |
Pennsylvania EDFA Pennsylvania Rapid Bridge Replacement Project (Industrial Development Revenue) | | | 4.00 | | | | 6-30-2018 | | | | 6,675,000 | | | | 6,879,389 | |
Pennsylvania EDFA Solid Waste Disposal Republic Services Incorporated Project (Resource Recovery Revenue) ± | | | 1.15 | | | | 6-1-2044 | | | | 21,300,000 | | | | 21,300,000 | |
Pennsylvania HEFAR Foundation Indiana University PA Series A (Education Revenue, Syncora Guarantee Incorporated Insured) ± | | | 1.02 | | | | 7-1-2017 | | | | 860,000 | | | | 858,074 | |
Pennsylvania Public School Building Authority (Miscellaneous Revenue) | | | 5.00 | | | | 4-1-2018 | | | | 2,200,000 | | | | 2,279,112 | |
Pennsylvania Public School Building Authority (Miscellaneous Revenue) | | | 5.00 | | | | 4-1-2019 | | | | 1,220,000 | | | | 1,290,772 | |
Pennsylvania Public School Building Authority Series 11396 (Miscellaneous Revenue, AGM Insured, Citibank NA LIQ) 144Aø | | | 0.92 | | | | 12-1-2023 | | | | 5,000,000 | | | | 5,000,000 | |
The accompanying notes are an integral part of these financial statements.
| | | | |
| 26 | | Wells Fargo Short-Term Municipal Bond Fund | | Portfolio of investments—December 31, 2016 (unaudited) |
| | | | | | | | | | | | | | | | |
| Security name | | Interest rate | | | Maturity date | | | Principal | | | Value | |
| | | | |
| Pennsylvania (continued) | | | | | | | | | | | | | | | | |
Pennsylvania Public School Building Authority The School District of Pennsylvania Project (Miscellaneous Revenue) | | | 5.00 | % | | | 4-1-2017 | | | $ | 2,685,000 | | | $ | 2,708,521 | |
Pennsylvania Refunding Bond (GO Revenue) | | | 5.00 | | | | 1-15-2021 | | | | 38,295,000 | | | | 42,602,805 | |
Pennsylvania Refunding Bond (GO Revenue) | | | 5.00 | | | | 1-15-2022 | | | | 52,845,000 | | | | 59,644,566 | |
Pennsylvania Turnpike Commission Series A (Transportation Revenue) ± | | | 1.32 | | | | 12-1-2017 | | | | 14,765,000 | | | | 14,760,866 | |
Pennsylvania Turnpike Commission Series B (Transportation Revenue) ± | | | 1.87 | | | | 12-1-2019 | | | | 18,150,000 | | | | 18,271,605 | |
Pennsylvania Turnpike Commission Series B (Transportation Revenue) ± | | | 2.00 | | | | 12-1-2020 | | | | 11,300,000 | | | | 11,409,836 | |
Philadelphia PA Gas Works 10th Series 1998 General Ordinance (Utilities Revenue, AGM Insured) | | | 5.00 | | | | 7-1-2019 | | | | 2,500,000 | | | | 2,700,025 | |
Philadelphia PA Hospital & HEFAR Temple University Health System Series B (Health Revenue) | | | 5.00 | | | | 7-1-2018 | | | | 8,385,000 | | | | 8,678,475 | |
Philadelphia PA Housing Authority Series A (Housing Revenue, AGM Insured) | | | 5.25 | | | | 12-1-2017 | | | | 2,335,000 | | | | 2,342,822 | |
Philadelphia PA RDA Transformation Initiative (Miscellaneous Revenue) | | | 5.00 | | | | 4-15-2017 | | | | 1,500,000 | | | | 1,515,990 | |
Philadelphia PA RDA Transformation Initiative Series B (Miscellaneous Revenue) | | | 5.00 | | | | 4-15-2019 | | | | 2,000,000 | | | | 2,137,780 | |
Philadelphia PA RDA Transformation Initiative Series B (Miscellaneous Revenue) | | | 5.00 | | | | 4-15-2020 | | | | 1,870,000 | | | | 2,030,409 | |
Philadelphia PA School District Series A (GO Revenue) | | | 4.00 | | | | 9-1-2017 | | | | 500,000 | | | | 507,095 | |
Philadelphia PA School District Series C (GO Revenue) | | | 5.00 | | | | 9-1-2017 | | | | 2,150,000 | | | | 2,194,742 | |
Philadelphia PA School District Series C (GO Revenue) | | | 5.00 | | | | 9-1-2020 | | | | 1,125,000 | | | | 1,217,340 | |
Philadelphia PA School District Series D (GO Revenue) | | | 5.00 | | | | 9-1-2018 | | | | 5,300,000 | | | | 5,555,407 | |
Philadelphia PA School District Series D (GO Revenue) | | | 5.00 | | | | 9-1-2020 | | | | 1,500,000 | | | | 1,614,945 | |
Philadelphia PA School District Series D (GO Revenue) | | | 5.00 | | | | 9-1-2021 | | | | 1,750,000 | | | | 1,902,390 | |
Philadelphia PA School District Series E (GO Revenue, State Aid Withholding Insured) | | | 5.00 | | | | 9-1-2020 | | | | 2,075,000 | | | | 2,226,517 | |
Philadelphia PA School District Series E (GO Revenue) | | | 5.25 | | | | 9-1-2023 | | | | 7,000,000 | | | | 7,466,130 | |
Philadelphia PA School District Series F (GO Revenue) | | | 5.00 | | | | 9-1-2020 | | | | 2,750,000 | | | | 2,960,733 | |
Philadelphia PA School District Series F (GO Revenue) | | | 5.00 | | | | 9-1-2021 | | | | 3,500,000 | | | | 3,804,780 | |
Philadelphia PA Series A (GO Revenue) | | | 5.00 | | | | 7-15-2017 | | | | 1,000,000 | | | | 1,020,400 | |
Philadelphia PA Series A (GO Revenue) | | | 5.00 | | | | 7-15-2018 | | | | 1,000,000 | | | | 1,053,330 | |
Philadelphia PA Series A (GO Revenue, AGM Insured) | | | 5.00 | | | | 8-1-2019 | | | | 4,550,000 | | | | 4,647,507 | |
Reading PA Parking Authority CAB (Transportation Revenue, National Insured) ¤ | | | 0.00 | | | | 11-15-2019 | | | | 1,000,000 | | | | 924,160 | |
Scranton PA RAN (Tax Revenue) %% | | | 2.50 | | | | 12-15-2017 | | | | 3,250,000 | | | | 3,248,798 | |
Scranton PA RDA Guaranteed Series A (Miscellaneous Revenue, Municipal Government Guaranty Insured) | | | 5.00 | | | | 11-15-2021 | | | | 2,925,000 | | | | 2,998,769 | |
Susquehanna PA Regional Airport Authority Sub Series C (Airport Revenue) | | | 3.00 | | | | 1-1-2017 | | | | 1,140,000 | | | | 1,140,023 | |
Warwick PA School District (GO Revenue) | | | 4.00 | | | | 2-15-2020 | | | | 1,000,000 | | | | 1,066,550 | |
West Mifflin PA School District (GO Revenue, AGM Insured) | | | 3.00 | | | | 10-1-2017 | | | | 400,000 | | | | 404,136 | |
West Mifflin PA School District (GO Revenue, AGM Insured) | | | 4.00 | | | | 10-1-2017 | | | | 410,000 | | | | 417,294 | |
West Mifflin PA School District (GO Revenue, AGM Insured) | | | 5.00 | | | | 10-1-2018 | | | | 605,000 | | | | 636,841 | |
West Mifflin PA School District (GO Revenue, AGM Insured) | | | 5.00 | | | | 10-1-2019 | | | | 750,000 | | | | 803,265 | |
York County PA Refunding Bond (GO Revenue) ± | | | 0.72 | | | | 6-1-2033 | | | | 14,690,000 | | | | 14,681,480 | |
| | | | |
| | | | | | | | | | | | | | | 410,243,070 | |
| | | | | | | | | | | | | | | | |
| | | | |
| Puerto Rico: 0.59% | | | | | | | | | | | | | | | | |
Puerto Rico Electric Power Authority Refunding Bond Series LL (Utilities Revenue, National Insured) | | | 5.50 | | | | 7-1-2017 | | | | 11,825,000 | | | | 12,036,431 | |
Puerto Rico Electric Power Authority Refunding Bond Series SS (Utilities Revenue, National Insured) | | | 4.25 | | | | 7-1-2017 | | | | 550,000 | | | | 550,908 | |
Puerto Rico Highway & Transportation Authority Refunding Bond Series AA (Transportation Revenue, National Insured) | | | 5.50 | | | | 7-1-2017 | | | | 7,500,000 | | | | 7,634,475 | |
The accompanying notes are an integral part of these financial statements.
| | | | | | |
| Portfolio of investments—December 31, 2016 (unaudited) | | Wells Fargo Short-Term Municipal Bond Fund | | | 27 | |
| | | | | | | | | | | | | | | | |
| Security name | | Interest rate | | | Maturity date | | | Principal | | | Value | |
| | | | |
| Puerto Rico (continued) | | | | | | | | | | | | | | | | |
Puerto Rico Public Buildings Authority Government Facilities Refunding Bond Series F (Miscellaneous Revenue, AGC Insured) | | | 5.25 | % | | | 7-1-2017 | | | $ | 10,200,000 | | | $ | 10,361,874 | |
Puerto Rico Public Finance Corporation Commonwealth Appropriation Bond Series B (Miscellaneous Revenue, Government Development Bank for Puerto Rico SPA) (s) | | | 5.50 | | | | 8-1-2031 | | | | 5,405,000 | | | | 432,400 | |
| | | | |
| | | | | | | | | | | | | | | 31,016,088 | |
| | | | | | | | | | | | | | | | |
| | | | |
| Rhode Island: 0.30% | | | | | | | | | | | | | | | | |
Rhode Island Health & Educational Building Corporation Providence College (Education Revenue) | | | 5.00 | | | | 11-1-2018 | | | | 265,000 | | | | 281,213 | |
Rhode Island Health & Educational Building Corporation Providence Public Schools Program Series A (Miscellaneous Revenue) | | | 4.00 | | | | 5-15-2017 | | | | 1,500,000 | | | | 1,515,225 | |
Rhode Island Health & Educational Building Corporation Providence Public Schools Program Series A (Miscellaneous Revenue) | | | 5.00 | | | | 5-15-2019 | | | | 1,000,000 | | | | 1,069,250 | |
Rhode Island Student Loan Authority AMT Series A (Education Revenue) | | | 5.00 | | | | 12-1-2019 | | | | 450,000 | | | | 481,887 | |
Tobacco Settlement Financing Corporation Series A (Tobacco Revenue) | | | 2.25 | | | | 6-1-2041 | | | | 12,525,000 | | | | 12,511,724 | |
| | | | |
| | | | | | | | | | | | | | | 15,859,299 | |
| | | | | | | | | | | | | | | | |
| | | | |
| South Carolina: 0.16% | | | | | | | | | | | | | | | | |
Connector 2000 Association Incorporated CAB Series A (Transportation Revenue) ¤ | | | 0.00 | | | | 1-1-2017 | | | | 179,606 | | | | 175,964 | |
Connector 2000 Association Incorporated CAB Series A (Transportation Revenue) ¤ | | | 0.00 | | | | 1-1-2018 | | | | 198,490 | | | | 178,585 | |
Lee County SC School Facilities Incorporated Lee County School District Project (Miscellaneous Revenue, AGM Insured) | | | 2.00 | | | | 6-1-2018 | | | | 325,000 | | | | 326,199 | |
Lee County SC School Facilities Incorporated Lee County School District Project (Miscellaneous Revenue, AGM Insured) | | | 3.00 | | | | 12-1-2017 | | | | 275,000 | | | | 278,768 | |
Lee County SC School Facilities Incorporated Lee County School District Project (Miscellaneous Revenue, AGM Insured) | | | 3.00 | | | | 12-1-2018 | | | | 390,000 | | | | 398,401 | |
South Carolina Housing Finance & Development Authority Housing Waters Berryhill (Housing Revenue) ± | | | 1.60 | | | | 12-1-2019 | | | | 7,250,000 | | | | 7,254,930 | |
| | | | |
| | | | | | | | | | | | | | | 8,612,847 | |
| | | | | | | | | | | | | | | | |
| | | | |
| Tennessee: 0.92% | | | | | | | | | | | | | | | | |
Clarksville TN Natural Gas Acquisition Corporation (Utilities Revenue) | | | 5.00 | | | | 12-15-2017 | | | | 1,330,000 | | | | 1,370,246 | |
Clarksville TN Water Sewer & Gas Refunding Bond (Water & Sewer Revenue) | | | 4.00 | | | | 2-1-2017 | | | | 835,000 | | | | 837,121 | |
Knox County TN HEFA Prerefunded Bond University Health System Incorporated (Health Revenue) | | | 5.00 | | | | 4-1-2019 | | | | 525,000 | | | | 530,455 | |
Knox County TN HEFA Unrefunded Bond University Health System Incorporated (Health Revenue) | | | 5.00 | | | | 4-1-2019 | | | | 1,185,000 | | | | 1,194,207 | |
Memphis-Shelby County TN Airport Authority Series A1 (Airport Revenue) | | | 5.75 | | | | 7-1-2019 | | | | 1,500,000 | | | | 1,638,570 | |
Memphis-Shelby County TN Airport Authority Series B (Airport Revenue) | | | 5.38 | | | | 7-1-2018 | | | | 1,000,000 | | | | 1,054,150 | |
Memphis-Shelby County TN Airport Authority Series B (Airport Revenue) | | | 5.50 | | | | 7-1-2019 | | | | 1,505,000 | | | | 1,634,882 | |
Metropolitan Government Nashville & Davidson County TN Prerefunded Bond (Education Revenue) ± | | | 1.33 | | | | 10-1-2038 | | | | 4,875,000 | | | | 4,875,585 | |
Metropolitan Government Nashville & Davidson County TN Unrefunded Bond (Education Revenue) ± | | | 1.33 | | | | 10-1-2038 | | | | 5,125,000 | | | | 5,125,871 | |
Tennessee Energy Acquisition Corporation Series A (Utilities Revenue) | | | 5.25 | | | | 9-1-2017 | | | | 5,440,000 | | | | 5,566,752 | |
Tennessee Energy Acquisition Corporation Series A (Utilities Revenue) | | | 5.25 | | | | 9-1-2018 | | | | 3,300,000 | | | | 3,484,074 | |
Tennessee Energy Acquisition Corporation Series A (Utilities Revenue) | | | 5.25 | | | | 9-1-2019 | | | | 6,225,000 | | | | 6,727,918 | |
Tennessee Energy Acquisition Corporation Series C (Utilities Revenue) | | | 5.00 | | | | 2-1-2018 | | | | 8,895,000 | | | | 9,209,438 | |
Tennessee Energy Acquisition Corporation Series C (Utilities Revenue) | | | 5.00 | | | | 2-1-2019 | | | | 5,110,000 | | | | 5,409,753 | |
| | | | |
| | | | | | | | | | | | | | | 48,659,022 | |
| | | | | | | | | | | | | | | | |
The accompanying notes are an integral part of these financial statements.
| | | | |
| 28 | | Wells Fargo Short-Term Municipal Bond Fund | | Portfolio of investments—December 31, 2016 (unaudited) |
| | | | | | | | | | | | | | | | |
| Security name | | Interest rate | | | Maturity date | | | Principal | | | Value | |
| | | | |
| Texas: 13.80% | | | | | | | | | | | | | | | | |
Austin TX Affordable Housing Public Facility Corporation Pathways at Georgian Manor (Housing Revenue) ± | | | 1.15 | % | | | 11-1-2019 | | | $ | 14,040,000 | | | $ | 13,981,594 | |
Central Texas Regional Mobility Authority Senior Lien (Transportation Revenue) | | | 5.75 | | | | 1-1-2017 | | | | 500,000 | | | | 500,070 | |
Central Texas Regional Mobility Authority Senior Lien Series A (Transportation Revenue) | | | 5.00 | | | | 1-1-2017 | | | | 1,500,000 | | | | 1,500,165 | |
Central Texas Regional Mobility Authority Subordinated Lien (Transportation Revenue) | | | 5.00 | | | | 1-1-2018 | | | | 250,000 | | | | 258,778 | |
Central Texas Regional Mobility Authority Subordinated Lien (Transportation Revenue) | | | 5.00 | | | | 1-1-2019 | | | | 750,000 | | | | 795,938 | |
Clear Creek TX Independent School District Series B (GO Revenue) ± | | | 1.35 | | | | 2-15-2038 | | | | 12,000,000 | | | | 11,991,480 | |
Clear Creek TX Independent School District Series B (GO Revenue) ± | | | 3.00 | | | | 2-15-2032 | | | | 4,270,000 | | | | 4,396,050 | |
Coastal Bend TX Health Facilities Development Corporation (Health Revenue, AGM Insured) ±(m) | | | 0.84 | | | | 7-1-2031 | | | | 2,800,000 | | | | 2,800,000 | |
Corpus Christi TX Utility System Junior Lien Series B (Water & Sewer Revenue) ± | | | 2.00 | | | | 7-15-2045 | | | | 12,585,000 | | | | 12,591,670 | |
Cypress Fairbanks TX School District (GO Revenue) | | | 4.25 | | | | 2-15-2021 | | | | 2,775,000 | | | | 2,786,905 | |
Cypress Fairbanks TX School District Series B-1 (GO Revenue) ± | | | 3.00 | | | | 2-15-2036 | | | | 10,130,000 | | | | 10,474,015 | |
Dallas TX Series A (GO Revenue) | | | 5.00 | | | | 2-15-2019 | | | | 5,000,000 | | | | 5,336,350 | |
Denton TX Independent School District (GO Revenue) ± | | | 2.00 | | | | 8-1-2043 | | | | 7,000,000 | | | | 7,022,820 | |
Denton TX Independent School District (GO Revenue) ± | | | 2.13 | | | | 8-1-2042 | | | | 10,895,000 | | | | 10,993,382 | |
Denton TX Independent School District Series B (GO Revenue) ± | | | 2.00 | | | | 8-1-2044 | | | | 39,075,000 | | | | 39,407,528 | |
Eagle Mountain & Saginaw TX Independent School District (GO Revenue) ± | | | 2.00 | | | | 8-1-2050 | | | | 12,150,000 | | | | 12,259,593 | |
Fort Bend Independent School District School Building Series B (GO Revenue) ± | | | 2.00 | | | | 8-1-2040 | | | | 11,770,000 | | | | 11,830,498 | |
Georgetown TX Independent School District (GO Revenue) ± | | | 2.00 | | | | 8-1-2034 | | | | 4,620,000 | | | | 4,645,040 | |
Goose Creek TX Consolidated Independent School District (GO Revenue) ± | | | 1.35 | | | | 2-15-2040 | | | | 15,160,000 | | | | 15,144,385 | |
Harlandale TX Independent School District (GO Revenue) ± | | | 2.00 | | | | 8-15-2045 | | | | 22,165,000 | | | | 22,359,165 | |
Harris County TX Health Facilities Development Corporation Series A3 (Health Revenue, AGM Insured) ±(m) | | | 0.84 | | | | 7-1-2031 | | | | 13,950,000 | | | | 13,950,000 | |
Harris County TX Health Facilities Development Corporation Series A4 (Health Revenue, AGM Insured) ±(m) | | | 0.84 | | | | 7-1-2031 | | | | 12,000,000 | | | | 12,000,000 | |
Houston TX (GO Revenue) | | | 5.00 | | | | 3-1-2019 | | | | 7,000,000 | | | | 7,530,880 | |
Houston TX Independent School District Limited Tax (GO Revenue) | | | 4.25 | | | | 2-15-2021 | | | | 5,075,000 | | | | 5,093,727 | |
Houston TX Independent School District School House Series A2R (GO Revenue) ± | | | 4.00 | | | | 6-1-2039 | | | | 43,100,000 | | | | 43,616,769 | |
Hutto TX Independent School District Series 2015 (GO Revenue) ± | | | 3.00 | | | | 2-1-2055 | | | | 23,425,000 | | | | 24,284,932 | |
Laredo TX Public Property Finance Contractual Obligation Bond (GO Revenue) | | | 3.88 | | | | 2-15-2018 | | | | 1,420,000 | | | | 1,453,966 | |
Mansfield TX Independent School District (GO Revenue) ± | | | 1.75 | | | | 8-1-2042 | | | | 8,455,000 | | | | 8,485,692 | |
North East TX Independent School District (GO Revenue) ± | | | 2.00 | | | | 8-1-2044 | | | | 8,855,000 | | | | 8,930,356 | |
North East TX Independent School District Series A (GO Revenue) ± | | | 2.00 | | | | 8-1-2042 | | | | 28,915,000 | | | | 29,185,066 | |
North Texas Health Facilities Development Corporation United Regional Health Care System (Health Revenue, AGM Insured) | | | 5.00 | | | | 9-1-2017 | | | | 850,000 | | | | 871,148 | |
North Texas Higher Education Authority Incorporated Student Loan Series 2 Class A (Education Revenue) ± | | | 1.85 | | | | 4-1-2037 | | | | 7,000,000 | | | | 6,813,100 | |
North Texas Tollway Authority Refunding Bond Series A (Transportation Revenue) ± | | | 1.53 | | | | 1-1-2050 | | | | 17,250,000 | | | | 17,270,010 | |
North Texas Tollway Authority Series A (Transportation Revenue) | | | 5.00 | | | | 1-1-2020 | | | | 1,050,000 | | | | 1,144,248 | |
North Texas Tollway Authority Series A (Transportation Revenue) | | | 5.00 | | | | 1-1-2021 | | | | 1,860,000 | | | | 2,060,768 | |
Northside TX Independent School District Building Project (GO Revenue) ± | | | 1.65 | | | | 8-1-2045 | | | | 6,250,000 | | | | 6,273,250 | |
Northside TX Independent School District Building Project (GO Revenue) ± | | | 2.00 | | | | 8-1-2044 | | | | 21,195,000 | | | | 21,375,369 | |
Northside TX Independent School District Building Project (GO Revenue) ± | | | 2.00 | | | | 6-1-2046 | | | | 5,200,000 | | | | 5,194,124 | |
Northside TX Independent School District Series A (GO Revenue) ± | | | 2.00 | | | | 6-1-2039 | | | | 2,870,000 | | | | 2,895,629 | |
Odessa TX Housing Finance Corporation 87th Street Apartments Project (Housing Revenue) ± | | | 1.43 | | | | 12-1-2020 | | | | 7,500,000 | | | | 7,495,425 | |
Pasadena TX Independent School District Building Project Series B (GO Revenue) ± | | | 3.00 | | | | 2-15-2044 | | | | 45,060,000 | | | | 46,238,770 | |
Pflugerville TX Independent School District Prerefunded Bond School Building Series A (GO Revenue) ± | | | 2.00 | | | | 8-15-2039 | | | | 4,830,000 | | | | 4,896,316 | |
The accompanying notes are an integral part of these financial statements.
| | | | | | |
| Portfolio of investments—December 31, 2016 (unaudited) | | Wells Fargo Short-Term Municipal Bond Fund | | | 29 | |
| | | | | | | | | | | | | | | | |
| Security name | | Interest rate | | | Maturity date | | | Principal | | | Value | |
| | | | |
| Texas (continued) | | | | | | | | | | | | | | | | |
Pflugerville TX Independent School District Unrefunded Balance Bond School (GO Revenue) ± | | | 2.00 | % | | | 8-15-2039 | | | $ | 22,870,000 | | | $ | 23,061,651 | |
Port Arthur TX Navigation District Jefferson County Environmental Facilities Motiva Enterprises LLC Project Series A (Resource Recovery Revenue) ø | | | 0.85 | | | | 4-1-2040 | | | | 9,775,000 | | | | 9,775,000 | |
Port Arthur TX Navigation District Jefferson County Environmental Facilities Motiva Enterprises LLC Project Series C (Resource Recovery Revenue) ø | | | 0.85 | | | | 4-1-2040 | | | | 30,000,000 | | | | 30,000,000 | |
Port Arthur TX Navigation District Jefferson County Environmental Facilities Motiva Enterprises LLC Project Series D (Resource Recovery Revenue) ø | | | 0.85 | | | | 11-1-2040 | | | | 10,000,000 | | | | 10,000,000 | |
San Antonio TX Energy Acquisition Public Facility Corporation (Utilities Revenue) | | | 5.25 | | | | 8-1-2018 | | | | 510,000 | | | | 537,137 | |
San Antonio TX Junior Lien Series A (Utilities Revenue) ± | | | 2.00 | | | | 12-1-2027 | | | | 20,320,000 | | | | 20,492,110 | |
San Antonio TX Junior Lien Series B (Utilities Revenue) ± | | | 1.10 | | | | 2-1-2033 | | | | 26,700,000 | | | | 26,643,663 | |
San Antonio TX Junior Lien Series B (Utilities Revenue) ± | | | 1.75 | | | | 12-1-2027 | | | | 11,000,000 | | | | 11,020,900 | |
San Antonio TX Junior Lien Series C (Utilities Revenue) ± | | | 3.00 | | | | 12-1-2045 | | | | 12,000,000 | | | | 12,373,560 | |
San Antonio TX Junior Lien Series D (Utilities Revenue) ± | | | 3.00 | | | | 12-1-2045 | | | | 12,000,000 | | | | 12,456,840 | |
San Antonio TX Series A (Utilities Revenue) ± | | | 2.25 | | | | 2-1-2033 | | | | 24,350,000 | | | | 24,529,460 | |
Tarrant County TX ECFA Hendrick Medical Center Group (Health Revenue) | | | 5.00 | | | | 9-1-2019 | | | | 655,000 | | | | 706,928 | |
Tarrant County TX ECFA Hendrick Medical Center Group (Health Revenue) | | | 5.00 | | | | 9-1-2020 | | | | 920,000 | | | | 1,012,681 | |
Tarrant County TX ECFA Hendrick Medical Center Group (Health Revenue) | | | 5.00 | | | | 11-15-2020 | | | | 1,045,000 | | | | 1,128,245 | |
Tennessee Energy Acquisition Corporation Series C (Utilities Revenue) | | | 5.00 | | | | 2-1-2017 | | | | 14,000,000 | | | | 14,040,880 | |
Texas Municipal Gas Acquisition & Supply Corporation II Series A (Utilities Revenue, JPMorgan Chase & Company Guaranteed) ± | | | 1.27 | | | | 9-15-2017 | | | | 1,415,000 | | | | 1,416,854 | |
Texas Municipal Gas Acquisition & Supply Corporation II Series B (Utilities Revenue, JPMorgan Chase & Company Guaranteed) ± | | | 1.19 | | | | 9-15-2017 | | | | 13,785,000 | | | | 13,737,442 | |
Texas Municipal Gas Acquisition & Supply Corporation III (Utilities Revenue) | | | 5.00 | | | | 12-15-2017 | | | | 6,450,000 | | | | 6,644,274 | |
Texas Municipal Gas Acquisition & Supply Corporation III (Utilities Revenue) | | | 5.00 | | | | 12-15-2018 | | | | 4,500,000 | | | | 4,769,550 | |
Texas Municipal Gas Acquisition & Supply Corporation III (Utilities Revenue) | | | 5.00 | | | | 12-15-2019 | | | | 7,000,000 | | | | 7,556,220 | |
Texas Municipal Gas Acquisition & Supply Corporation Senior Lien Series A (Utilities Revenue) | | | 5.25 | | | | 12-15-2017 | | | | 1,745,000 | | | | 1,801,922 | |
Texas PFA Assessment Unemployment Compensation Series B (Miscellaneous Revenue) | | | 4.00 | | | | 1-1-2018 | | | | 3,245,000 | | | | 3,253,372 | |
Texas PFA Southern University Financing System (Education Revenue, Build America Mutual Assurance Company Insured) | | | 5.00 | | | | 11-1-2017 | | | | 4,000,000 | | | | 4,117,160 | |
Texas PFA Southern University Financing System (Education Revenue, Build America Mutual Assurance Company Insured) | | | 5.00 | | | | 11-1-2018 | | | | 3,395,000 | | | | 3,595,305 | |
Texas PFA Southern University Financing System (Education Revenue, Build America Mutual Assurance Company Insured) | | | 5.00 | | | | 11-1-2019 | | | | 2,375,000 | | | | 2,569,014 | |
Tomball TX Independent School District Series B2 (GO Revenue) ± | | | 3.00 | | | | 2-15-2039 | | | | 10,000,000 | | | | 10,254,100 | |
Walnut Creek TX Special Utility District (Water & Sewer Revenue, Build America Mutual Assurance Company Insured) | | | 3.00 | | | | 1-10-2017 | | | | 405,000 | | | | 405,207 | |
Walnut Creek TX Special Utility District (Water & Sewer Revenue, Build America Mutual Assurance Company Insured) | | | 4.00 | | | | 1-10-2018 | | | | 640,000 | | | | 656,275 | |
Walnut Creek TX Special Utility District (Water & Sewer Revenue, Build America Mutual Assurance Company Insured) | | | 4.00 | | | | 1-10-2019 | | | | 1,010,000 | | | | 1,055,157 | |
Walnut Creek TX Special Utility District (Water & Sewer Revenue, Build America Mutual Assurance Company Insured) | | | 4.00 | | | | 1-10-2020 | | | | 500,000 | | | | 528,595 | |
| | | | |
| | | | | | | | | | | | | | | 728,274,473 | |
| | | | | | | | | | | | | | | | |
| | | | |
| Utah: 0.01% | | | | | | | | | | | | | | | | |
Utah Charter School Finance Authority Summit Academy Series A (Education Revenue) | | | 5.13 | | | | 6-15-2017 | | | | 325,000 | | | | 327,142 | |
| | | | | | | | | | | | | | | | |
| | | | |
| Vermont: 0.26% | | | | | | | | | | | | | | | | |
Vermont Student Assistance Corporation Series BCL-A1 (Education Revenue) ± | | | 2.44 | | | | 6-1-2022 | | | | 13,707,621 | | | | 13,861,283 | |
| | | | | | | | | | | | | | | | |
The accompanying notes are an integral part of these financial statements.
| | | | |
| 30 | | Wells Fargo Short-Term Municipal Bond Fund | | Portfolio of investments—December 31, 2016 (unaudited) |
| | | | | | | | | | | | | | | | |
| Security name | | Interest rate | | | Maturity date | | | Principal | | | Value | |
| | | | |
| Virgin Islands: 0.09% | | | | | | | | | | | | | | | | |
Virgin Islands PFA Matching Funding Loan Series A (Miscellaneous Revenue) | | | 6.75 | % | | | 10-1-2019 | | | $ | 1,210,000 | | | $ | 1,197,622 | |
Virgin Islands PFA Series A (Tobacco Revenue) | | | 5.00 | | | | 10-1-2018 | | | | 800,000 | | | | 787,976 | |
Virgin Islands PFA Senior Lien Matching Fund Loan Note Series B (Tobacco Revenue) | | | 5.00 | | | | 10-1-2018 | | | | 2,985,000 | | | | 2,940,135 | |
| | | | |
| | | | | | | | | | | | | | | 4,925,733 | |
| | | | | | | | | | | | | | | | |
| | | | |
| Virginia: 1.69% | | | | | | | | | | | | | | | | |
Charles City VA EDA Solid Waste Disposal Waste Management Incorporated (Resource Recovery Revenue) ± | | | 1.60 | | | | 8-1-2027 | | | | 3,150,000 | | | | 3,154,253 | |
Fairfax County VA Redevelopment & Housing Authority Residences At Government Center II Project (Housing Revenue, FHA Insured) ± | | | 1.00 | | | | 4-1-2018 | | | | 13,000,000 | | | | 13,000,000 | |
Gloucester County VA EDA Solid Waste Disposal Waste Management Services Series A (Resource Recovery Revenue) ± | | | 1.60 | | | | 9-1-2038 | | | | 1,500,000 | | | | 1,500,465 | |
Greater Richmond VA Convention Center Authority (Tax Revenue) | | | 5.00 | | | | 6-15-2019 | | | | 1,250,000 | | | | 1,350,800 | |
Greater Richmond VA Convention Center Authority (Tax Revenue) | | | 5.00 | | | | 6-15-2020 | | | | 1,000,000 | | | | 1,103,820 | |
Halifax County VA IDA (Utilities Revenue) ± | | | 2.15 | | | | 12-1-2041 | | | | 57,500,000 | | | | 57,478,150 | |
Lexington VA IDA Kendal at Lexington (Health Revenue) | | | 3.00 | | | | 1-1-2019 | | | | 320,000 | | | | 326,253 | |
Lexington VA IDA Kendal at Lexington (Health Revenue) | | | 3.00 | | | | 1-1-2020 | | | | 450,000 | | | | 458,564 | |
Lexington VA IDA Kendal at Lexington (Health Revenue) | | | 4.00 | | | | 1-1-2021 | | | | 440,000 | | | | 463,786 | |
Lexington VA IDA Kendal at Lexington (Health Revenue) | | | 4.00 | | | | 1-1-2022 | | | | 525,000 | | | | 554,720 | |
Marquis VA CDA CAB Series A (Tax Revenue) (i) | | | 5.10 | | | | 9-1-2036 | | | | 2,169,000 | | | | 1,676,529 | |
Marquis VA CDA CAB Series C (Tax Revenue) ¤(i) | | | 0.00 | | | | 9-1-2041 | | | | 3,493,000 | | | | 441,760 | |
Marquis VA CDA CCAB (Tax Revenue) 144A± | | | 0.00 | | | | 9-1-2045 | | | | 680,000 | | | | 437,335 | |
Petersburg VA RAN (GO Revenue) 144A | | | 4.00 | | | | 10-1-2017 | | | | 5,000,000 | | | | 4,999,800 | |
Washington VA County IDA Series C (Health Revenue) | | | 7.25 | | | | 7-1-2019 | | | | 1,995,000 | | | | 2,140,356 | |
| | | | |
| | | | | | | | | | | | | | | 89,086,591 | |
| | | | | | | | | | | | | | | | |
| | | | |
| Washington: 0.20% | | | | | | | | | | | | | | | | |
Washington HCFR Catholic Health Initiatives Series B (Health Revenue) ± | | | 1.73 | | | | 1-1-2035 | | | | 8,550,000 | | | | 8,514,347 | |
Washington Health Care Facilities Authority Series 2015 (Health Revenue) | | | 5.00 | | | | 7-1-2020 | | | | 850,000 | | | | 925,319 | |
Washington Housing Financing Commission Nonprofit Wesley Homes Series A (Health Revenue, AGC Insured) | | | 5.38 | | | | 1-1-2017 | | | | 1,110,000 | | | | 1,110,144 | |
| | | | |
| | | | | | | | | | | | | | | 10,549,810 | |
| | | | | | | | | | | | | | | | |
| | | | |
| West Virginia: 0.05% | | | | | | | | | | | | | | | | |
West Virginia EDA PCR Appalachian Power Company Series D (Resource Recovery Revenue) | | | 3.25 | | | | 5-1-2019 | | | | 2,745,000 | | | | 2,805,527 | |
| | | | | | | | | | | | | | | | |
| | | | |
| Wisconsin: 1.17% | | | | | | | | | | | | | | | | |
Johnson Creek WI School District BAN (Miscellaneous Revenue) ## | | | 3.00 | | | | 3-1-2020 | | | | 2,550,000 | | | | 2,557,140 | |
Milwaukee WI RDA Public Schools Refunding Bond Series A (Miscellaneous Revenue) | | | 5.00 | | | | 8-1-2018 | | | | 4,320,000 | | | | 4,550,558 | |
Milwaukee WI RDA Wisconsin Housing Preservation Corporation (Housing Revenue, Johnson Bank LOC) ø | | | 1.80 | | | | 12-1-2038 | | | | 1,510,000 | | | | 1,510,000 | |
PFA WI Guilford College (Education Revenue) | | | 5.00 | | | | 1-1-2021 | | | | 650,000 | | | | 700,473 | |
PFA WI Guilford College (Education Revenue) | | | 5.00 | | | | 1-1-2022 | | | | 625,000 | | | | 678,431 | |
Racine WI Elderly Housing Authority Wisconsin Housing Preservation Corporation (Housing Revenue, Johnson Bank LOC) ø | | | 1.80 | | | | 10-1-2042 | | | | 3,555,000 | | | | 3,555,000 | |
Waukesha County WI Series B (Miscellaneous Revenue) | | | 3.00 | | | | 5-1-2021 | | | | 17,400,000 | | | | 17,685,012 | |
Wisconsin Airport Facilities PFA Senior Obligation Group Series B (Airport Revenue) | | | 5.00 | | | | 7-1-2022 | | | | 12,620,000 | | | | 13,472,102 | |
Wisconsin HEFA Ascension Health Alliance Series B (Health Revenue) ± | | | 4.00 | | | | 11-15-2043 | | | | 13,000,000 | | | | 13,743,340 | |
Wisconsin HEFA Mercy Alliance Incorporated Project Series A (Health Revenue) | | | 5.00 | | | | 6-1-2019 | | | | 2,100,000 | | | | 2,160,802 | |
Wisconsin HEFA Vernon Memorial Healthcare Incorporated (Health Revenue) | | | 4.00 | | | | 3-1-2017 | | | | 200,000 | | | | 200,908 | |
The accompanying notes are an integral part of these financial statements.
| | | | | | |
| Portfolio of investments—December 31, 2016 (unaudited) | | Wells Fargo Short-Term Municipal Bond Fund | | | 31 | |
| | | | | | | | | | | | | | | | |
| Security name | | Interest rate | | | Maturity date | | | Principal | | | Value | |
| | | | |
| Wisconsin (continued) | | | | | | | | | | | | | | | | |
Wisconsin HEFA Vernon Memorial Healthcare Incorporated (Health Revenue) | | | 4.00 | % | | | 3-1-2018 | | | $ | 300,000 | | | $ | 308,001 | |
Wisconsin HEFA Vernon Memorial Healthcare Incorporated (Health Revenue) | | | 4.00 | | | | 3-1-2019 | | | | 445,000 | | | | 463,899 | |
Wisconsin HEFA Vernon Memorial Healthcare Incorporated (Health Revenue) | | | 5.00 | | | | 3-1-2020 | | | | 375,000 | | | | 406,328 | |
| | | | |
| | | | | | | | | | | | | | | 61,991,994 | |
| | | | | | | | | | | | | | | | |
| | | | |
Total Municipal Obligations (Cost $5,217,838,780) | | | | | | | | | | | | | | | 5,160,450,870 | |
| | | | | | | | | | | | | | | | |
| | | | |
Other: 1.89% | | | | | | | | | | | | | | | | |
Eaton Vance Municipal Income Trust ±144A§ | | | 2.22 | | | | 9-1-2019 | | | | 23,000,000 | | | | 22,984,360 | |
Nuveen California AMT-Free Municipal Income Fund Institutional MuniFund Term Preferred Shares ±144A§ | | | 1.02 | | | | 7-1-2018 | | | | 3,000,000 | | | | 2,990,730 | |
Nuveen Enhanced Municipal Credit Opportunities Fund Institutional MuniFund Term Preferred Shares ±144A | | | 1.47 | | | | 10-1-2017 | | | | 62,000,000 | | | | 61,775,560 | |
Nuveen Texas Quality Income Municipal Fund Institutional MuniFund Term Preferred Shares ±144A | | | 1.56 | | | | 11-1-2018 | | | | 12,000,000 | | | | 11,999,040 | |
| | | | |
Total Other (Cost $100,000,000) | | | | | | | | | | | | | | | 99,749,690 | |
| | | | | | | | | | | | | | | | |
| | | | |
| | | Yield | | | | | | Shares | | | | |
| Short-Term Investments: 0.04% | | | | | | | | | | | | | | | | |
| | | | |
| Investment Companies: 0.04% | | | | | | | | | | | | | | | | |
Wells Fargo Municipal Cash Management Fund Institutional Class ##(l)(u) | | | 0.67 | | | | | | | | 2,406,597 | | | | 2,408,040 | |
| | | | | | | | | | | | | | | | |
| | | | |
Total Short-Term Investments (Cost $2,407,449) | | | | | | | | | | | | | | | 2,408,040 | |
| | | | | | | | | | | | | | | | |
| | | | | | | | |
| Total investments in securities (Cost $5,320,246,229) * | | | 99.69 | % | | | 5,262,608,600 | |
Other assets and liabilities, net | | | 0.31 | | | | 16,193,185 | |
| | | | | | | | |
| Total net assets | | | 100.00 | % | | $ | 5,278,801,785 | |
| | | | | | | | |
| ± | Variable rate investment. The rate shown is the rate in effect at period end. |
| 144A | The security may be resold in transactions exempt from registration, normally to qualified institutional buyers, pursuant to Rule 144A under the Securities Act of 1933. |
| ¤ | The security is issued in zero coupon form with no periodic interest payments. |
| ø | Variable rate demand notes are subject to a demand feature which reduces the effective maturity. The maturity date shown represents the final maturity date of the security. The interest rate is determined and reset by the issuer daily, weekly, or monthly depending upon the terms of the security. The rate shown is the rate in effect at period end. |
| (m) | The security is an auction-rate security which has an interest rate that resets at predetermined short-term intervals through a Dutch auction. The rate shown is the rate in effect at period end. |
| %% | The security is issued on a when-issued basis. |
| ## | All or a portion of this security is segregated for when-issued securities. |
| (n) | The auction to set the interest rate on the security failed at period end due to insufficient investor interest. A failed auction does not itself cause a default. |
| (s) | The security is currently in default with regards to scheduled interest and/or principal payments. The Fund has stopped accruing interest on the security. |
| § | The security is subject to a demand feature which reduces the effective maturity. |
| (l) | The issuer of the security is an affiliated person of the Fund as defined in the Investment Company Act of 1940. |
| (u) | The rate represents the 7-day annualized yield at period end. |
| * | Cost for federal income tax purposes is $5,320,283,357 and unrealized gains (losses) consists of: |
| | | | |
Gross unrealized gains | | $ | 15,057,079 | |
Gross unrealized losses | | | (72,731,836 | ) |
| | | | |
Net unrealized losses | | $ | (57,674,757 | ) |
The accompanying notes are an integral part of these financial statements.
| | | | |
| 32 | | Wells Fargo Short-Term Municipal Bond Fund | | Statement of assets and liabilities—December 31, 2016 (unaudited) |
| | | | |
| | | | |
| |
Assets | | | | |
Investments | | | | |
In unaffiliated securities, at value (cost $5,317,838,780) | | $ | 5,260,200,560 | |
In affiliated securities, at value (cost $2,407,449) | | | 2,408,040 | |
| | | | |
Total investments, at value (cost $5,320,246,229) | | | 5,262,608,600 | |
Cash | | | 755 | |
Receivable for investments sold | | | 13,720,996 | |
Receivable for Fund shares sold | | | 23,447,025 | |
Receivable for interest | | | 40,094,177 | |
Prepaid expenses and other assets | | | 486,638 | |
| | | | |
Total assets | | | 5,340,358,191 | |
| | | | |
| |
Liabilities | | | | |
Dividends payable | | | 1,664,166 | |
Payable for investments purchased | | | 3,274,894 | |
Payable for Fund shares redeemed | | | 53,915,691 | |
Management fee payable | | | 1,284,615 | |
Distribution fee payable | | | 49,191 | |
Administration fees payable | | | 557,113 | |
Accrued expenses and other liabilities | | | 810,736 | |
| | | | |
Total liabilities | | | 61,556,406 | |
| | | | |
Total net assets | | $ | 5,278,801,785 | |
| | | | |
| |
NET ASSETS CONSIST OF | | | | |
Paid-in capital | | $ | 5,338,578,557 | |
Undistributed net investment income | | | 155,722 | |
Accumulated net realized losses on investments | | | (2,294,865 | ) |
Net unrealized losses on investments | | | (57,637,629 | ) |
| | | | |
Total net assets | | $ | 5,278,801,785 | |
| | | | |
| |
COMPUTATION OF NET ASSET VALUE AND OFFERING PRICE PER SHARE | | | | |
Net assets – Class A | | $ | 2,046,828,582 | |
Shares outstanding – Class A1 | | | 208,852,264 | |
Net asset value per share – Class A | | | $9.80 | |
Maximum offering price per share – Class A2 | | | $10.00 | |
Net assets – Class C | | $ | 71,465,333 | |
Shares outstanding – Class C1 | | | 7,291,618 | |
Net asset value per share – Class C | | | $9.80 | |
Net assets – Administrator Class | | $ | 80,687,242 | |
Shares outstanding – Administrator Class1 | | | 8,227,710 | |
Net asset value per share – Administrator Class | | | $9.81 | |
Net assets – Institutional Class | | $ | 3,079,820,628 | |
Shares outstanding – Institutional Class1 | | | 313,663,598 | |
Net asset value per share – Institutional Class | | | $9.82 | |
| 1 | The Fund has an unlimited number of authorized shares. |
| 2 | Maximum offering price is computed as 100/98 of net asset value. On investments of $50,000 or more, the offering price is reduced. |
The accompanying notes are an integral part of these financial statements.
| | | | | | |
| Statement of operations—six months ended December 31, 2016 (unaudited) | | Wells Fargo Short-Term Municipal Bond Fund | | | 33 | |
| | | | |
| | | | |
| |
Investment income | | | | |
Interest | | $ | 51,862,437 | |
Income from affiliated securities | | | 75,126 | |
| | | | |
Total investment income | | | 51,937,563 | |
| | | | |
| |
Expenses | | | | |
Management fee | | | 9,485,847 | |
Administration fees | | | | |
Class A | | | 2,080,772 | |
Class C | | | 63,619 | |
Administrator Class | | | 45,950 | |
Institutional Class | | | 1,226,677 | |
Shareholder servicing fees | | | | |
Class A | | | 3,251,206 | |
Class C | | | 99,405 | |
Administrator Class | | | 114,610 | |
Distribution fee | | | | |
Class C | | | 298,214 | |
Custody and accounting fees | | | 146,595 | |
Professional fees | | | 32,009 | |
Registration fees | | | 94,756 | |
Shareholder report expenses | | | 140,690 | |
Trustees’ fees and expenses | | | 12,207 | |
Other fees and expenses | | | 34,570 | |
| | | | |
Total expenses | | | 17,127,127 | |
Less: Fee waivers and/or expense reimbursements | | | (1,976,287 | ) |
| | | | |
Net expenses | | | 15,150,840 | |
| | | | |
Net investment income | | | 36,786,723 | |
| | | | |
| |
REALIZED AND UNREALIZED GAINS (LOSSES) ON INVESTMENTS | | | | |
| |
Net realized gains (losses) on: | | | | |
Unaffiliated securities | | | (1,426,271 | ) |
Affiliated securities | | | 20,036 | |
Futures transactions | | | (1,003,673 | ) |
| | | | |
Net realized losses on investments | | | (2,409,908 | ) |
| | | | |
| |
Net change in unrealized gains (losses) on: | | | | |
Unaffiliated securities | | | (94,332,925 | ) |
Affiiliated securities | | | 591 | |
Futures transactions | | | 2,244,088 | |
| | | | |
Net change in unrealized gains (losses) on investments | | | (92,088,246 | ) |
| | | | |
Net realized and unrealized gains (losses) on investments | | | (94,498,154 | ) |
| | | | |
Net decrease in net assets resulting from operations | | $ | (57,711,431 | ) |
| | | | |
The accompanying notes are an integral part of these financial statements.
| | | | |
| 34 | | Wells Fargo Short-Term Municipal Bond Fund | | Statement of changes in net assets |
| | | | | | | | | | | | | | | | |
| | | Six months ended
December 31, 2016 (unaudited) | | | Year ended
June 30, 2016 | |
| | | | |
Operations | | | | | | | | | | | | | | | | |
Net investment income | | | | | | $ | 36,786,723 | | | | | | | $ | 69,753,998 | |
Net realized gains (losses) on investments | | | | | | | (2,409,908 | ) | | | | | | | 313,342 | |
Net change in unrealized gains (losses) on investments | | | | | | | (92,088,246 | ) | | | | | | | 25,680,125 | |
| | | | |
Net increase (decrease) in net assets resulting from operations | | | | | | | (57,711,431 | ) | | | | | | | 95,747,465 | |
| | | | |
| | | | |
Distributions to shareholders from | | | | | | | | | | | | | | | | |
Net investment income | | | | | | | | | | | | | | | | |
Class A | | | | | | | (14,884,828 | ) | | | | | | | (34,052,798 | ) |
Class C | | | | | | | (159,240 | ) | | | | | | | (323,418 | ) |
Administrator Class | | | | | | | (541,141 | ) | | | | | | | (1,830,622 | ) |
Institutional Class | | | | | | | (21,209,742 | ) | | | | | | | (28,544,540 | ) |
Investor Class | | | | | | | N/A | | | | | | | | (4,994,406 | )1 |
Net realized gains | | | | | | | | | | | | | | | | |
Class A | | | | | | | 0 | | | | | | | | (2,591,530 | ) |
Class C | | | | | | | 0 | | | | | | | | (67,566 | ) |
Administrator Class | | | | | | | 0 | | | | | | | | (68,933 | ) |
Institutional Class | | | | | | | 0 | | | | | | | | (1,635,693 | ) |
| | | | |
Total distributions to shareholders | | | | | | | (36,794,951 | ) | | | | | | | (74,109,506 | ) |
| | | | |
| | | | |
Capital share transactions | | | Shares | | | | | | | | Shares | | | | | |
Proceeds from shares sold | | | | | | | | | | | | | | | | |
Class A | | | 33,209,134 | | | | 329,969,662 | | | | 222,039,298 | | | | 2,209,060,220 | |
Class C | | | 275,669 | | | | 2,726,934 | | | | 619,066 | | | | 6,157,726 | |
Administrator Class | | | 1,929,857 | | | | 19,138,128 | | | | 6,630,944 | | | | 66,017,256 | |
Institutional Class | | | 153,580,580 | | | | 1,529,735,676 | | | | 144,491,550 | | | | 1,439,440,660 | |
Investor Class | | | N/A | | | | N/A | | | | 7,146,734 | 1 | | | 71,071,037 | 1 |
| | | | |
| | | | | | | 1,881,570,400 | | | | | | | | 3,791,746,899 | |
| | | | |
Reinvestment of distributions | | | | | | | | | | | | | | | | |
Class A | | | 1,443,396 | | | | 14,301,919 | | | | 3,592,827 | | | | 35,741,018 | |
Class C | | | 13,991 | | | | 138,543 | | | | 34,436 | | | | 342,547 | |
Administrator Class | | | 53,518 | | | | 530,496 | | | | 189,138 | | | | 1,882,997 | |
Institutional Class | | | 1,430,872 | | | | 14,190,944 | | | | 1,702,491 | | | | 16,967,909 | |
Investor Class | | | N/A | | | | N/A | | | | 384,006 | 1 | | | 3,819,645 | 1 |
| | | | |
| | | | | | | 29,161,902 | | | | | | | | 58,754,116 | |
| | | | |
Payment for shares redeemed | | | | | | | | | | | | | | | | |
Class A | | | (163,248,064 | ) | | | (1,620,956,428 | ) | | | (112,700,409 | ) | | | (1,121,238,204 | ) |
Class C | | | (1,238,638 | ) | | | (12,253,294 | ) | | | (2,801,679 | ) | | | (27,864,138 | ) |
Administrator Class | | | (3,296,100 | ) | | | (32,669,225 | ) | | | (48,717,360 | ) | | | (485,134,480 | ) |
Institutional Class | | | (67,869,896 | ) | | | (672,016,297 | ) | | | (110,273,026 | ) | | | (1,098,863,134 | ) |
Investor Class | | | N/A | | | | N/A | | | | (169,667,638 | )1 | | | (1,689,668,427 | )1 |
| | | | |
| | | | | | | (2,337,895,244 | ) | | | | | | | (4,422,768,383 | ) |
| | | | |
Net decrease in net assets resulting from capital share transactions | | | | | | | (427,162,942 | ) | | | | | | | (572,267,368 | ) |
| | | | |
Total decrease in net assets | | | | | | | (521,669,324 | ) | | | | | | | (550,629,409 | ) |
| | | | |
| | | | |
Net assets | | | | | | | | | | | | | | | | |
Beginning of period | | | | | | | 5,800,471,109 | | | | | | | | 6,351,100,518 | |
| | | | |
End of period | | | | | | $ | 5,278,801,785 | | | | | | | $ | 5,800,471,109 | |
| | | | |
Undistributed net investment income | | | | | | $ | 155,722 | | | | | | | $ | 163,950 | |
| | | | |
| 1 | For the period from July 1, 2015 to October 23, 2015. Effective at the close of business on October 23, 2015, Investor Class shares were converted to Class A shares and are no longer offered by the Fund. |
The accompanying notes are an integral part of these financial statements.
| | | | | | |
| Financial highlights | | Wells Fargo Short-Term Municipal Bond Fund | | | 35 | |
(For a share outstanding throughout each period)
| | | | | | | | | | | | | | | | | | | | | | | | |
| | | Six months ended December 31, 2016 (unaudited) | | | Year ended June 30 | |
| CLASS A | | | 2016 | | | 2015 | | | 2014 | | | 2013 | | | 2012 | |
Net asset value, beginning of period | | | $9.96 | | | | $9.93 | | | | $10.00 | | | | $9.97 | | | | $10.01 | | | | $9.94 | |
Net investment income | | | 0.06 | | | | 0.11 | | | | 0.09 | | | | 0.11 | | | | 0.11 | | | | 0.19 | |
Net realized and unrealized gains (losses) on investments | | | (0.16 | ) | | | 0.04 | | | | (0.06 | ) | | | 0.05 | | | | 0.00 | 1 | | | 0.08 | |
| | | | | | | | | | | | | | | | | | | | | | | | |
Total from investment operations | | | (0.10 | ) | | | 0.15 | | | | 0.03 | | | | 0.16 | | | | 0.11 | | | | 0.27 | |
Distributions to shareholders from | | | | | | | | | | | | | | | | | | | | | | | | |
Net investment income | | | (0.06 | ) | | | (0.11 | ) | | | (0.09 | ) | | | (0.11 | ) | | | (0.11 | ) | | | (0.19 | ) |
Net realized gains | | | 0.00 | | | | (0.01 | ) | | | (0.01 | ) | | | (0.02 | ) | | | (0.04 | ) | | | (0.01 | ) |
| | | | | | | | | | | | | | | | | | | | | | | | |
Total distributions to shareholders | | | (0.06 | ) | | | (0.12 | ) | | | (0.10 | ) | | | (0.13 | ) | | | (0.15 | ) | | | (0.20 | ) |
Net asset value, end of period | | | $9.80 | | | | $9.96 | | | | $9.93 | | | | $10.00 | | | | $9.97 | | | | $10.01 | |
Total return2 | | | (1.03 | )% | | | 1.49 | % | | | 0.27 | % | | | 1.55 | % | | | 1.07 | % | | | 2.77 | % |
Ratios to average net assets (annualized) | | | | | | | | | | | | | | | | | | | | | | | | |
Gross expenses | | | 0.75 | % | | | 0.75 | % | | | 0.75 | % | | | 0.76 | % | | | 0.77 | % | | | 0.78 | % |
Net expenses | | | 0.63 | % | | | 0.62 | % | | | 0.60 | % | | | 0.60 | % | | | 0.60 | % | | | 0.60 | % |
Net investment income | | | 1.14 | % | | | 1.11 | % | | | 0.89 | % | | | 1.08 | % | | | 1.10 | % | | | 1.91 | % |
Supplemental data | | | | | | | | | | | | | | | | | | | | | | | | |
Portfolio turnover rate | | | 11 | %3 | | | 16 | %3 | | | 24 | %3 | | | 28 | %3 | | | 39 | %3 | | | 72 | % |
Net assets, end of period (000s omitted) | | | $2,046,829 | | | | $3,362,147 | | | | $2,228,977 | | | | $2,031,798 | | | | $1,620,994 | | | | $1,467,816 | |
| 1 | Amount is less than $0.005 per share. |
| 2 | Total return calculations do not include any sales charges. Returns for periods of less than one year are not annualized. |
| 3 | Portfolio turnover rate excludes variable rate demand notes which may account for changes from rates reported in prior periods. |
The accompanying notes are an integral part of these financial statements.
| | | | |
| 36 | | Wells Fargo Short-Term Municipal Bond Fund | | Financial highlights |
(For a share outstanding throughout each period)
| | | | | | | | | | | | | | | | | | | | | | | | |
| | | Six months ended December 31, 2016 (unaudited) | | | Year ended June 30 | |
| CLASS C | | | 2016 | | | 2015 | | | 2014 | | | 2013 | | | 2012 | |
Net asset value, beginning of period | | | $9.96 | | | | $9.93 | | | | $10.00 | | | | $9.97 | | | | $10.01 | | | | $9.94 | |
Net investment income | | | 0.02 | | | | 0.04 | | | | 0.01 | | | | 0.03 | | | | 0.04 | | | | 0.12 | |
Net realized and unrealized gains (losses) on investments | | | (0.16 | ) | | | 0.04 | | | | (0.06 | ) | | | 0.05 | | | | 0.00 | 1 | | | 0.08 | |
| | | | | | | | | | | | | | | | | | | | | | | | |
Total from investment operations | | | (0.14 | ) | | | 0.08 | | | | (0.05 | ) | | | 0.08 | | | | 0.04 | | | | 0.20 | |
Distributions to shareholders from | | | | | | | | | | | | | | | | | | | | | | | | |
Net investment income | | | (0.02 | ) | | | (0.04 | ) | | | (0.01 | ) | | | (0.03 | ) | | | (0.04 | ) | | | (0.12 | ) |
Net realized gains | | | 0.00 | | | | (0.01 | ) | | | (0.01 | ) | | | (0.02 | ) | | | (0.04 | ) | | | (0.01 | ) |
| | | | | | | | | | | | | | | | | | | | | | | | |
Total distributions to shareholders | | | (0.02 | ) | | | (0.05 | ) | | | (0.02 | ) | | | (0.05 | ) | | | (0.08 | ) | | | (0.13 | ) |
Net asset value, end of period | | | $9.80 | | | | $9.96 | | | | $9.93 | | | | $10.00 | | | | $9.97 | | | | $10.01 | |
Total return2 | | | (1.41 | )% | | | 0.73 | % | | | (0.48 | )% | | | 0.79 | % | | | 0.32 | % | | | 2.01 | % |
Ratios to average net assets (annualized) | | | | | | | | | | | | | | | | | | | | | | | | |
Gross expenses | | | 1.50 | % | | | 1.50 | % | | | 1.50 | % | | | 1.51 | % | | | 1.52 | % | | | 1.53 | % |
Net expenses | | | 1.38 | % | | | 1.37 | % | | | 1.35 | % | | | 1.35 | % | | | 1.35 | % | | | 1.35 | % |
Net investment income | | | 0.40 | % | | | 0.35 | % | | | 0.14 | % | | | 0.34 | % | | | 0.37 | % | | | 1.18 | % |
Supplemental data | | | | | | | | | | | | | | | | | | | | | | | | |
Portfolio turnover rate | | | 11 | %3 | | | 16 | %3 | | | 24 | %3 | | | 28 | %3 | | | 39 | %3 | | | 72 | % |
Net assets, end of period (000s omitted) | | | $71,465 | | | | $82,111 | | | | $103,146 | | | | $133,463 | | | | $172,364 | | | | $211,286 | |
| 1 | Amount is less than $0.005. |
| 2 | Total return calculations do not include any sales charges. Returns for periods of less than one year are not annualized. |
| 3 | Portfolio turnover rate excludes variable rate demand notes which may account for changes from rates reported in prior periods. |
The accompanying notes are an integral part of these financial statements.
| | | | | | |
| Financial highlights | | Wells Fargo Short-Term Municipal Bond Fund | | | 37 | |
(For a share outstanding throughout each period)
| | | | | | | | | | | | | | | | | | | | | | | | |
| | | Six months ended December 31, 2016 (unaudited) | | | Year ended June 30 | |
| ADMINISTRATOR CLASS | | | 2016 | | | 2015 | | | 2014 | | | 2013 | | | 2012 | |
Net asset value, beginning of period | | | $9.97 | | | | $9.95 | | | | $10.03 | | | | $9.99 | | | | $10.03 | | | | $9.96 | |
Net investment income | | | 0.06 | | | | 0.11 | 1 | | | 0.09 | | | | 0.11 | | | | 0.11 | | | | 0.19 | |
Net realized and unrealized gains (losses) on investments | | | (0.16 | ) | | | 0.03 | | | | (0.07 | ) | | | 0.06 | | | | 0.00 | 2 | | | 0.08 | |
| | | | | | | | | | | | | | | | | | | | | | | | |
Total from investment operations | | | (0.10 | ) | | | 0.14 | | | | 0.02 | | | | 0.17 | | | | 0.11 | | | | 0.27 | |
Distributions to shareholders from | | | | | | | | | | | | | | | | | | | | | | | | |
Net investment income | | | (0.06 | ) | | | (0.11 | ) | | | (0.09 | ) | | | (0.11 | ) | | | (0.11 | ) | | | (0.19 | ) |
Net realized gains | | | 0.00 | | | | (0.01 | ) | | | (0.01 | ) | | | (0.02 | ) | | | (0.04 | ) | | | (0.01 | ) |
| | | | | | | | | | | | | | | | | | | | | | | | |
Total distributions to shareholders | | | (0.06 | ) | | | (0.12 | ) | | | (0.10 | ) | | | (0.13 | ) | | | (0.15 | ) | | | (0.20 | ) |
Net asset value, end of period | | | $9.81 | | | | $9.97 | | | | $9.95 | | | | $10.03 | | | | $9.99 | | | | $10.03 | |
Total return3 | | | (1.02 | )% | | | 1.42 | % | | | 0.17 | % | | | 1.65 | % | | | 1.07 | % | | | 2.77 | % |
Ratios to average net assets (annualized) | | | | | | | | | | | | | | | | | | | | | | | | |
Gross expenses | | | 0.69 | % | | | 0.66 | % | | | 0.68 | % | | | 0.70 | % | | | 0.71 | % | | | 0.72 | % |
Net expenses | | | 0.60 | % | | | 0.59 | % | | | 0.60 | % | | | 0.60 | % | | | 0.60 | % | | | 0.60 | % |
Net investment income | | | 1.18 | % | | | 1.08 | % | | | 0.89 | % | | | 1.08 | % | | | 1.07 | % | | | 1.82 | % |
Supplemental data | | | | | | | | | | | | | | | | | | | | | | | | |
Portfolio turnover rate | | | 11 | %4 | | | 16 | %4 | | | 24 | %4 | | | 28 | %4 | | | 39 | %4 | | | 72 | % |
Net assets, end of period (000s omitted) | | | $80,687 | | | | $95,121 | | | | $511,894 | | | | $565,737 | | | | $547,806 | | | | $201,225 | |
| 1 | Calculated based upon average shares outstanding |
| 2 | Amount is less than $0.005. |
| 3 | Returns for periods of less than one year are not annualized. |
| 4 | Portfolio turnover rate excludes variable rate demand notes which may account for changes from rates reported in prior periods. |
The accompanying notes are an integral part of these financial statements.
| | | | |
| 38 | | Wells Fargo Short-Term Municipal Bond Fund | | Financial highlights |
(For a share outstanding throughout each period)
| | | | | | | | | | | | | | | | | | | | | | | | |
| | | Six months ended December 31, 2016 (unaudited) | | | Year ended June 30 | |
| INSTITUTIONAL CLASS | | | 2016 | | | 2015 | | | 2014 | | | 2013 | | | 2012 | |
Net asset value, beginning of period | | | $9.98 | | | | $9.95 | | | | $10.02 | | | | $9.99 | | | | $10.02 | | | | $9.96 | |
Net investment income | | | 0.07 | | | | 0.13 | | | | 0.11 | | | | 0.13 | | | | 0.13 | | | | 0.21 | |
Net realized and unrealized gains (losses) on investments | | | (0.16 | ) | | | 0.04 | | | | (0.06 | ) | | | 0.05 | | | | 0.01 | | | | 0.07 | |
| | | | | | | | | | | | | | | | | | | | | | | | |
Total from investment operations | | | (0.09 | ) | | | 0.17 | | | | 0.05 | | | | 0.18 | | | | 0.14 | | | | 0.28 | |
Distributions to shareholders from | | | | | | | | | | | | | | | | | | | | | | | | |
Net investment income | | | (0.07 | ) | | | (0.13 | ) | | | (0.11 | ) | | | (0.13 | ) | | | (0.13 | ) | | | (0.21 | ) |
Net realized gains | | | 0.00 | | | | (0.01 | ) | | | (0.01 | ) | | | (0.02 | ) | | | (0.04 | ) | | | (0.01 | ) |
| | | | | | | | | | | | | | | | | | | | | | | | |
Total distributions to shareholders | | | (0.07 | ) | | | (0.14 | ) | | | (0.12 | ) | | | (0.15 | ) | | | (0.17 | ) | | | (0.22 | ) |
Net asset value, end of period | | | $9.82 | | | | $9.98 | | | | $9.95 | | | | $10.02 | | | | $9.99 | | | | $10.02 | |
Total return1 | | | (0.92 | )% | | | 1.71 | % | | | 0.47 | % | | | 1.75 | % | | | 1.37 | % | | | 2.88 | % |
Ratios to average net assets (annualized) | | | | | | | | | | | | | | | | | | | | | | | | |
Gross expenses | | | 0.42 | % | | | 0.42 | % | | | 0.42 | % | | | 0.43 | % | | | 0.45 | % | | | 0.45 | % |
Net expenses | | | 0.40 | % | | | 0.40 | % | | | 0.40 | % | | | 0.40 | % | | | 0.40 | % | | | 0.40 | % |
Net investment income | | | 1.38 | % | | | 1.33 | % | | | 1.09 | % | | | 1.29 | % | | | 1.30 | % | | | 2.10 | % |
Supplemental data | | | | | | | | | | | | | | | | | | | | | | | | |
Portfolio turnover rate | | | 11 | %2 | | | 16 | %2 | | | 24 | %2 | | | 28 | %2 | | | 39 | %2 | | | 72 | % |
Net assets, end of period (000s omitted) | | | $3,079,821 | | | | $2,261,092 | | | | $1,895,713 | | | | $1,382,576 | | | | $1,185,687 | | | | $935,583 | |
| 1 | Returns for periods of less than one year are not annualized. |
| 2 | Portfolio turnover rate excludes variable rate demand notes which may account for changes from rates reported in prior periods. |
The accompanying notes are an integral part of these financial statements.
| | | | | | |
| Notes to financial statements (unaudited) | | Wells Fargo Short-Term Municipal Bond Fund | | | 39 | |
1. ORGANIZATION
Wells Fargo Funds Trust (the “Trust”), a Delaware statutory trust organized on March 10, 1999, is an open-end management investment company registered under the Investment Company Act of 1940, as amended (the “1940 Act”). As an investment company, the Trust follows the accounting and reporting guidance in Financial Accounting Standards Board (“FASB”) Accounting Standards Codification Topic 946, Financial Services – Investment Companies. These financial statements report on the Wells Fargo Short-Term Municipal Bond Fund (the “Fund”) which is a diversified series of the Trust.
Effective at the close of business on October 23, 2015, Investor Class shares became Class A shares in a tax-free conversion. Shareholders of Investor Class received Class A shares at a value equal to the value of their Investor Class shares immediately prior to the conversion. Investor Class shares are no longer offered by the Fund.
2. SIGNIFICANT ACCOUNTING POLICIES
The following significant accounting policies, which are consistently followed in the preparation of the financial statements of the Fund, are in conformity with U.S. generally accepted accounting principles which require management to make estimates and assumptions that affect the reported amounts of assets and liabilities, disclosure of contingent assets and liabilities at the date of the financial statements, and the reported amounts of revenues and expenses during the reporting period. Actual results could differ from those estimates.
Securities valuation
All investments are valued each business day as of the close of regular trading on the New York Stock Exchange (generally 4 p.m. Eastern Time), although the Fund may deviate from this calculation time under unusual or unexpected circumstances.
Debt securities are valued at the evaluated bid price provided by an independent pricing service or, if a reliable price is not available, the quoted bid price from an independent broker-dealer.
Futures that are listed on a foreign or domestic exchange or market are valued at the official closing price or, if none, the last sales price.
Investments in registered open-end investment companies are valued at net asset value.
Investments which are not valued using any of the methods discussed above are valued at their fair value, as determined in good faith by the Board of Trustees of the Fund. The Board of Trustees has established a Valuation Committee comprised of the Trustees and has delegated to it the authority to take any actions regarding the valuation of portfolio securities that the Valuation Committee deems necessary or appropriate, including determining the fair value of portfolio securities, unless the determination has been delegated to the Management Valuation Team of Wells Fargo Funds Management, LLC (“Funds Management”). The Board of Trustees retains the authority to make or ratify any valuation decisions or approve any changes to the Valuation Procedures as it deems appropriate. On a quarterly basis, the Board of Trustees receives reports on any valuation actions taken by the Valuation Committee or the Management Valuation Team which may include items for ratification.
Valuations of fair valued securities are compared to the next actual sales price when available, or other appropriate market values, to assess the continued appropriateness of the fair valuation methodologies used. These securities are fair valued on a day-to-day basis, taking into consideration changes to appropriate market information and any significant changes to the inputs considered in the valuation process until there is a readily available price provided on an exchange or by an independent pricing service. Valuations received from an independent pricing service or independent broker-dealer quotes are periodically validated by comparisons to most recent trades and valuations provided by other independent pricing services in addition to the review of prices by the manager and/or subadviser. Unobservable inputs used in determining fair valuations are identified based on the type of security, taking into consideration factors utilized by market participants in valuing the investment, knowledge about the issuer and the current market environment.
When-issued transactions
The Fund may purchase securities on a forward commitment or when-issued basis. The Fund records a when-issued transaction on the trade date and will segregate assets in an amount at least equal in value to the Fund’s commitment to purchase when-issued securities. Securities purchased on a when-issued basis are marked-to-market daily and the Fund begins earning interest on the settlement date. Losses may arise due to changes in the market value of the underlying securities or if the counterparty does not perform under the contract.
| | | | |
| 40 | | Wells Fargo Short-Term Municipal Bond Fund | | Notes to financial statements (unaudited) |
Futures contracts
The Fund is subject to interest rate risk in the normal course of pursuing its investment objectives. The Fund may buy and sell futures contracts in order to gain exposure to, or protect against, changes in security values and interest rates. The primary risks associated with the use of futures contracts are the imperfect correlation between changes in market values of securities held by the Fund and the prices of futures contracts, and the possibility of an illiquid market.
The aggregate principal amounts of the contracts are not recorded in the financial statements. Fluctuations in the value of the contracts are recorded in the Statement of Assets and Liabilities as an asset or liability and in the Statement of Operations as unrealized gains or losses until the contracts are closed, at which point they are recorded as net realized gains or losses on futures contracts. With futures contracts, there is minimal counterparty risk to the Fund since futures are exchange traded and the exchange’s clearinghouse, as counterparty to all exchange traded futures, guarantees the futures against default.
Security transactions and income recognition
Securities transactions are recorded on a trade date basis. Realized gains or losses are recorded on the basis of identified cost.
Interest income is accrued daily and bond discounts are accreted and premiums are amortized daily based on the effective interest method. To the extent debt obligations are placed on non-accrual status, any related interest income may be reduced by writing off interest receivables when the collection of all or a portion of interest has become doubtful based on consistently applied procedures. If the issuer subsequently resumes interest payments or when the collectability of interest is reasonably assured, the debt obligation is removed from non-accrual status.
Distributions to shareholders
Distributions to shareholders from net investment income are accrued daily and paid monthly. Distributions from net realized gains, if any, are recorded on the ex-dividend date. Such distributions are determined in conformity with federal income tax regulations, which may differ in amount or character from net investment income and realized gains recognized for purposes of U.S. generally accepted accounting principles.
Federal and other taxes
The Fund intends to continue to qualify as a regulated investment company by distributing substantially all of its investment company taxable and tax-exempt income and any net realized capital gains (after reduction for capital loss carryforwards) sufficient to relieve it from all, or substantially all, federal income taxes. Accordingly, no provision for federal income taxes was required.
The Fund’s income and federal excise tax returns and all financial records supporting those returns for the prior three fiscal years are subject to examination by the federal and Delaware revenue authorities. Management has analyzed the Fund’s tax positions taken on federal, state, and foreign tax returns for all open tax years and does not believe that there are any uncertain tax positions that require recognition of a tax liability.
As of June 30, 2016, the Fund had current year deferred post-October capital losses consisting of $2,044,486 in long-term losses which was recognized on the first day of the current fiscal year.
Class allocations
The separate classes of shares offered by the Fund differ principally in applicable sales charges, distribution, shareholder servicing, and administration fees. Class specific expenses are charged directly to that share class. Investment income, common expenses, and realized and unrealized gains (losses) on investments are allocated daily to each class of shares based on the relative proportion of net assets of each class.
3. FAIR VALUATION MEASUREMENTS
Fair value measurements of investments are determined within a framework that has established a fair value hierarchy based upon the various data inputs utilized in determining the value of the Fund’s investments. The three-level hierarchy gives the highest priority to unadjusted quoted prices in active markets for identical assets or liabilities (Level 1) and the lowest priority to significant unobservable inputs (Level 3). The Fund’s investments are classified within the fair value hierarchy based on the lowest level of input that is significant to the fair value measurement. The inputs are summarized into three broad levels as follows:
| ∎ | | Level 1 – quoted prices in active markets for identical securities |
| ∎ | | Level 2 – other significant observable inputs (including quoted prices for similar securities, interest rates, prepayment speeds, credit risk, use of amortized cost, etc.) |
| ∎ | | Level 3 – significant unobservable inputs (including the Fund’s own assumptions in determining the fair value of investments) |
| | | | | | |
| Notes to financial statements (unaudited) | | Wells Fargo Short-Term Municipal Bond Fund | | | 41 | |
The inputs or methodologies used for valuing investments in securities are not necessarily an indication of the risk associated with investing in those securities.
The following is a summary of the inputs used in valuing the Fund’s assets and liabilities as of December 31, 2016:
| | | | | | | | | | | | | | | | |
| | | Quoted prices (Level 1) | | | Other significant
observable inputs (Level 2) | | | Significant
unobservable inputs (Level 3) | | | Total | |
Assets | | | | | | | | | | | | | | | | |
Investments in: | | | | | | | | | | | | | | | | |
| | | | |
Municipal obligations | | $ | 0 | | | $ | 5,160,450,870 | | | $ | 0 | | | $ | 5,160,450,870 | |
| | | | |
Other | | | 0 | | | | 99,749,690 | | | | 0 | | | | 99,749,690 | |
| | | | |
Short-term investments | | | | | | | | | | | | | | | | |
Investment companies | | | 2,408,040 | | | | 0 | | | | 0 | | | | 2,408,040 | |
Total assets | | $ | 2,408,040 | | | $ | 5,260,200,560 | | | $ | 0 | | | $ | 5,262,608,600 | |
The Fund recognizes transfers between levels within the fair value hierarchy at the end of the reporting period. At December 31, 2016, the Fund did not have any transfers into/out of Level 1. The Fund had no material transfers between Level 2 and Level 3.
4. TRANSACTIONS WITH AFFILIATES AND OTHER EXPENSES
Management fee
Funds Management, an indirect wholly owned subsidiary of Wells Fargo & Company (“Wells Fargo”), is the manager of the Fund and provides advisory and fund-level administrative services under an investment management agreement. Under the investment management agreement, Funds Management is responsible for, among other services, implementing the investment objectives and strategies of the Fund, supervising the subadviser, providing fund-level administrative services in connection with the Fund’s operations, and providing any other fund-level administrative services reasonably necessary for the operation of the Fund. As compensation for its services under the investment management agreement, Funds Management is entitled to receive an annual management fee starting at 0.35% and declining to 0.255% as the average daily net assets of the Fund increase. For the six months ended December 31, 2016, the management fee was equivalent to an annual rate of 0.32% of the Fund’s average daily net assets.
Funds Management has retained the services of a subadviser to provide daily portfolio management to the Fund. The fee for subadvisory services is borne by Funds Management. Wells Capital Management Incorporated, an affiliate of Funds Management and an indirect wholly owned subsidiary of Wells Fargo, is the subadviser to the Fund and is entitled to receive a fee from Funds Management at an annual rate starting at 0.15% and declining to 0.05% as the average daily net assets of the Fund increase.
Administration fees
Under a class-level administration agreement, Funds Management provides class-level administrative services to the Fund, which includes paying fees and expenses for services provided by the transfer agent, sub-transfer agents, omnibus account servicers and record-keepers. As compensation for its services under the class-level administration agreement, Funds Management receives an annual fee which is calculated based on the average daily net assets of each class as follows:
| | | | |
| | | Class-level
administration fee | |
Class A, Class C | | | 0.16 | % |
Administrator Class | | | 0.10 | |
Institutional Class | | | 0.08 | |
Funds Management has contractually waived and/or reimbursed management and administration fees to the extent necessary to maintain certain net operating expense ratios for the Fund. Waiver of fees and/or reimbursement of expenses by Funds Management were made first from fund level expenses on a proportionate basis and then from class specific expenses. Funds Management has committed through October 31, 2017 to waive fees and/or reimburse expenses to the extent necessary to cap the Fund’s expenses at 0.63% for Class A shares, 1.38% for Class C shares, 0.60%
| | | | |
| 42 | | Wells Fargo Short-Term Municipal Bond Fund | | Notes to financial statements (unaudited) |
for Administrator Class shares, and 0.40% for Institutional Class shares. After this time, the cap may be increased or the commitment to maintain the cap may be terminated only with the approval of the Board of Trustees.
During the six months ended December 31, 2016, State Street Bank and Trust Company, the Fund’s custodian, reimbursed the Fund $6,280 for certain out-of-pocket expenses that were billed to the Fund in error from 1998-2015. This amount is included in interest income on the Statement of Operations. In addition, Funds Management was also reimbursed $3,206 for waivers/reimbursements it made to the Fund during the period the Fund was erroneously billed.
Distribution fee
The Trust has adopted a distribution plan for Class C shares of the Fund pursuant to Rule 12b-1 under the 1940 Act. A distribution fee is charged to Class C shares and paid to Wells Fargo Funds Distributor, LLC (“Funds Distributor”), the principal underwriter, at an annual rate of 0.75% of the average daily net assets of Class C shares.
In addition, Funds Distributor is entitled to receive the front-end sales charge from the purchase of Class A shares and a contingent deferred sales charge on the redemption of certain Class A shares. Funds Distributor is also entitled to receive the contingent deferred sales charges from redemptions of Class C shares. For the six months ended December 31, 2016, Funds Distributor received $3,521 from the sale of Class A shares.
Shareholder servicing fees
The Trust has entered into contracts with one or more shareholder servicing agents, whereby Class A, Class C, and Administrator Class of the Fund are charged a fee at an annual rate of 0.25% of the average daily net assets of each respective class.
A portion of these total shareholder servicing fees were paid to affiliates of Wells Fargo.
5. INVESTMENT PORTFOLIO TRANSACTIONS
Purchases and sales of investments, excluding U.S. government obligations (if any) and short-term securities, for the six months ended December 31, 2016 were $637,875,326 and $585,699,260, respectively.
The Fund may purchase or sell investment securities to other Wells Fargo funds under procedures adopted by the Board of Trustees. The procedures have been designed to ensure that these interfund transactions, which generally do not incur broker commissions, are effected at current market prices. Interfund trades are included within the respective purchases and sales amounts shown.
6. DERIVATIVE TRANSACTIONS
During the six months ended December 31, 2016, the Fund entered into futures contracts to take advantage of the differences between municipal and treasury yields and to help manage the duration of the portfolio.
As of December 31, 2016, the Fund did not have any open futures contracts. The Fund had an average notional amount of $58,820,022 in short futures contracts during the six months ended December 31, 2016.
The realized losses and change in unrealized gains (losses) on futures contracts are reflected in the Statement of Operations.
7. BANK BORROWINGS
The Trust (excluding the money market funds and certain other funds) and Wells Fargo Variable Trust are parties to a $250,000,000 revolving credit agreement whereby the Fund is permitted to use bank borrowings for temporary or emergency purposes, such as to fund shareholder redemption requests. Interest under the credit agreement is charged to the Fund based on a borrowing rate equal to the higher of the Federal Funds rate in effect on that day plus 1.25% or the overnight LIBOR rate in effect on that day plus 1.25%. In addition, an annual commitment fee equal to 0.25% of the unused balance is allocated to each participating fund. Prior to August 30, 2016, the revolving credit agreement amount was $200,000,000 and the annual commitment fee was equal to 0.20% of the unused balance which was allocated to each participating fund.
For the six months ended December 31, 2016, there were no borrowings by the Fund under the agreement.
8. INDEMNIFICATION
Under the Trust’s organizational documents, the officers and Trustees have been granted certain indemnification rights against certain liabilities that may arise out of performance of their duties to the Trust. Additionally, in the normal course of business, the Trust may enter into contracts with service providers that contain a variety of indemnification clauses. The Trust’s maximum exposure under these arrangements is dependent on future claims that may be made against the Fund and, therefore, cannot be estimated.
| | | | | | |
| Notes to financial statements (unaudited) | | Wells Fargo Short-Term Municipal Bond Fund | | | 43 | |
9. REGULATORY CHANGES
In October 2016, the Securities and Exchange Commission (“SEC”) adopted new rules and forms and amended existing rules and forms (together, “final rules”) intended to modernize and enhance the reporting and disclosure of information by registered investment companies and to enhance liquidity risk management by open-end mutual funds and exchange-traded funds. The final rules will enhance the quality of information available to investors and will allow the SEC to more effectively collect and use data reported by funds. In part, the final rules amend Regulation S-X and require standardized, enhanced disclosure about derivatives in the Fund’s financial statements, as well as other amendments. The compliance date for the amendments to Regulation S-X is August 1, 2017 while the compliance date for the new form types is June 1, 2018 and the compliance date for the liquidity risk management program requirements is December 1, 2018. Management is currently assessing the potential impact of these enhancements and their impact on the financial statement disclosures and reporting requirements.
| | | | |
| 44 | | Wells Fargo Short-Term Municipal Bond Fund | | Other information (unaudited) |
PROXY VOTING INFORMATION
A description of the policies and procedures that the Fund uses to determine how to vote proxies relating to portfolio securities is available, upon request, by calling 1-800-222-8222, visiting our website at wellsfargofunds.com, or visiting the SEC website at sec.gov. Information regarding how the Fund voted proxies relating to portfolio securities during the most recent 12-month period ended June 30 is available on the Fund’s website at wellsfargofunds.com or by visiting the SEC website at sec.gov.
PORTFOLIO HOLDINGS INFORMATION
The complete portfolio holdings for the Fund are publicly available monthly on the Fund’s website (wellsfargofunds.com), on a one-month delayed basis. In addition, top ten holdings information (excluding derivative positions) for the Fund is publicly available on the Fund’s website on a monthly, seven-day or more delayed basis. The Fund files its complete schedule of portfolio holdings with the SEC for the first and third quarters of each fiscal year on Form N-Q, which is available by visiting the SEC website at sec.gov. In addition, the Fund’s Form N-Q may be reviewed and copied at the SEC’s Public Reference Room in Washington, DC, and at regional offices in New York City, at 233 Broadway, and in Chicago, at 175 West Jackson Boulevard, Suite 900. Information about the Public Reference Room may be obtained by calling 1-800-SEC-0330.
| | | | | | |
| Other information (unaudited) | | Wells Fargo Short-Term Municipal Bond Fund | | | 45 | |
BOARD OF TRUSTEES AND OFFICERS
Each of the Trustees and Officers1 listed in the table below acts in identical capacities for each fund in the Wells Fargo family of funds, which consists of 139 mutual funds comprising the Wells Fargo Funds Trust, Wells Fargo Variable Trust, Wells Fargo Master Trust and four closed-end funds (collectively the “Fund Complex”). This table should be read in conjunction with the Prospectus and the Statement of Additional Information2. The mailing address of each Trustee and Officer is 525 Market Street, 12th Floor, San Francisco, CA 94105. Each Trustee and Officer serves an indefinite term, however, each Trustee serves such term until reaching the mandatory retirement age established by the Trustees.
Independent Trustees
| | | | | | |
Name and year of birth | | Position held and length of service* | | Principal occupations during past five years or longer | | Current other public company or
investment company
directorships |
William R. Ebsworth (Born 1957) | | Trustee, since 2015 | | Retired. From 1984 to 2013, equities analyst, portfolio manager, research director and chief financial officer at Fidelity Management and Research Company in Boston, Tokyo, and Hong Kong and retired in 2013 as Chief Investment Officer of Fidelity Strategic Advisers, Inc. where he lead a team of investment professionals managing client assets. Prior thereto, Board member of Hong Kong Securities Clearing Co., Hong Kong Options Clearing Corp., the Thailand International Fund, Ltd., Fidelity Investments Life Insurance Company, and Empire Fidelity Investments Life Insurance Company. Board member of the Fonté Foundation (non-profit organization) and the Vincent Memorial Hospital Endowment (non-profit organization), where he serves on the Investment Committee and as a Chair of the Audit Committee. Mr. Ebsworth is a CFA® charterholder and an Adjunct Lecturer, Finance, at Babson College. | | Asset Allocation Trust |
Jane A. Freeman (Born 1953) | | Trustee, since 2015 | | Retired. From 2012 to 2014 and 1999 to 2008, Chief Financial Officer of Scientific Learning Corporation. From 2008 to 2012, Ms. Freeman provided consulting services related to strategic business projects. Prior to 1999, Portfolio Manager at Rockefeller & Co. and Scudder, Stevens & Clark. Board member of the Harding Loevner Funds from 1996 to 2014, serving as both Lead Independent Director and chair of the Audit Committee. Board member of the Russell Exchange Traded Funds Trust from 2011 to 2012 and the chair of the Audit Committee. Ms. Freeman is a Board Member of Ruth Bancroft Garden (non-profit organization) and an inactive chartered financial analyst. | | Asset Allocation Trust |
Peter G. Gordon** (Born 1942) | | Trustee, since 1998; Chairman, since 2005 | | Co-Founder, Retired Chairman, President and CEO of Crystal Geyser Water Company. Trustee Emeritus, Colby College. | | Asset Allocation Trust |
Isaiah Harris, Jr. (Born 1952) | | Trustee, since 2009 | | Retired. Chairman of the Board of CIGNA Corporation since 2009, and Director since 2005. From 2003 to 2011, Director of Deluxe Corporation. Prior thereto, President and CEO of BellSouth Advertising and Publishing Corp. from 2005 to 2007, President and CEO of BellSouth Enterprises from 2004 to 2005 and President of BellSouth Consumer Services from 2000 to 2003. Emeritus member of the Iowa State University Foundation Board of Governors. Emeritus Member of the Advisory Board of Iowa State University School of Business. Advisory Board Member, Palm Harbor Academy (charter school). Advisory Board Member, Child Evangelism Fellowship (non-profit). Mr. Harris is a certified public accountant (inactive status). | | CIGNA Corporation; Asset Allocation Trust |
Judith M. Johnson (Born 1949) | | Trustee, since 2008; Audit Committee Chairman, since 2008 | | Retired. Prior thereto, Chief Executive Officer and Chief Investment Officer of Minneapolis Employees Retirement Fund from 1996 to 2008. Ms. Johnson is an attorney, certified public accountant and a certified managerial accountant. | | Asset Allocation Trust |
David F. Larcker (Born 1950) | | Trustee, since 2009 | | James Irvin Miller Professor of Accounting at the Graduate School of Business, Stanford University, Director of the Corporate Governance Research Initiative and Senior Faculty of The Rock Center for Corporate Governance since 2006. From 2005 to 2008, Professor of Accounting at the Graduate School of Business, Stanford University. Prior thereto, Ernst & Young Professor of Accounting at The Wharton School, University of Pennsylvania from 1985 to 2005. | | Asset Allocation Trust |
| | | | |
| 46 | | Wells Fargo Short-Term Municipal Bond Fund | | Other information (unaudited) |
| | | | | | |
Name and year of birth | | Position held and length of service* | | Principal occupations during past five years or longer | | Current other public company or
investment company
directorships |
Olivia S. Mitchell (Born 1953) | | Trustee, since 2006 | | International Foundation of Employee Benefit Plans Professor, Wharton School of the University of Pennsylvania since 1993. Director of Wharton’s Pension Research Council and Boettner Center on Pensions & Retirement Research, and Research Associate at the National Bureau of Economic Research. Previously, Cornell University Professor from 1978 to 1993. | | Asset Allocation Trust |
Timothy J. Penny (Born 1951) | | Trustee, since 1996 | | President and Chief Executive Officer of Southern Minnesota Initiative Foundation, a non-profit organization, since 2007 and Senior Fellow at the Humphrey Institute Policy Forum at the University of Minnesota since 1995. Member of the Board of Trustees of NorthStar Education Finance, Inc., a non-profit organization, since 2007. | | Asset Allocation Trust |
Michael S. Scofield (Born 1943) | | Trustee, since 2010 | | Served on the Investment Company Institute’s Board of Governors and Executive Committee from 2008-2011 as well the Governing Council of the Independent Directors Council from 2006-2011 and the Independent Directors Council Executive Committee from 2008-2011. Chairman of the IDC from 2008-2010. Institutional Investor (Fund Directions) Trustee of Year in 2007. Trustee of the Evergreen Funds complex (and its predecessors) from 1984 to 2010. Chairman of the Evergreen Funds from 2000-2010. Former Trustee of the Mentor Funds. Retired Attorney, Law Offices of Michael S. Scofield. | | Asset Allocation Trust |
| * | Length of service dates reflect the Trustee’s commencement of service with the Trust’s predecessor entities, where applicable. |
| ** | Peter Gordon is expected to retire on December 31, 2017. |
Officers
| | | | | | |
Name and year of birth | | Position held and length of service | | Principal occupations during past five years or longer | | |
Andrew Owen3 (Born 1960) | | President, since 2017 | | Executive Vice President of Wells Fargo Bank, N.A. and President of Wells Fargo & Company and Head of Affiliated Managaers, Wells Fargo Asset Management, since 2014. Executive Vice President responsible for marketing, investments and product development for Wells Fargo Funds Management, LLC, from 2009 to 2014. | | |
Nancy Wiser1 (Born 1967) | | Treasurer, since 2012 | | Executive Vice President of Wells Fargo Funds Management, LLC since 2011. Chief Operating Officer and Chief Compliance Officer at LightBox Capital Management LLC, from 2008 to 2011. | | |
C. David Messman (Born 1960) | | Secretary, since 2000; Chief Legal Officer, since 2003 | | Senior Vice President and Secretary of Wells Fargo Funds Management, LLC since 2001. Assistant General Counsel of Wells Fargo Bank, N.A. since 2013 and Vice President and Managing Counsel of Wells Fargo Bank, N.A. from 1996 to 2013. | | |
Michael Whitaker (Born 1967) | | Chief Compliance Officer, since 2016 | | Executive Vice President of Wells Fargo Funds Management, LLC since 2016. Chief Compliance Officer of Fidelity’s Fixed Income Funds and Asset Allocation Funds from 2008 to 2016, Compliance Officer of FMR Co., Inc. from 2014 to 2016, Fidelity Investments Money Management, Inc. from 2014 to 2016, Fidelity Investments from 2007 to 2016. | | |
David Berardi (Born 1975) | | Assistant Treasurer, since 2009 | | Vice President of Wells Fargo Funds Management, LLC since 2009. Vice President of Evergreen Investment Management Company, LLC from 2008 to 2010. Manager of Fund Reporting and Control for Evergreen Investment Management Company, LLC from 2004 to 2010. | | |
Jeremy DePalma1 (Born 1974) | | Assistant Treasurer, since 2009 | | Senior Vice President of Wells Fargo Funds Management, LLC since 2009. Senior Vice President of Evergreen Investment Management Company, LLC from 2008 to 2010 and head of the Fund Reporting and Control Team within Fund Administration from 2005 to 2010. | | |
| 1 | Nancy Wiser acts as Treasurer of 70 funds in the Fund Complex. Jeremy DePalma acts as Treasurer of 69 funds and Assistant Treasurer of 70 funds in the Fund Complex. |
| 2 | The Statement of Additional Information includes additional information about the Trustees and is available, without charge, upon request, by calling 1-800-222-8222 or by visiting the website at wellsfargofunds.com. |
| 3 | Andrew Owen became President on January 1, 2017. |
| | | | | | |
| List of abbreviations | | Wells Fargo Short-Term Municipal Bond Fund | | | 47 | |
The following is a list of common abbreviations for terms and entities that may have appeared in this report.
| ACA | — ACA Financial Guaranty Corporation |
| ADR | — American depositary receipt |
| ADS | — American depositary shares |
| AGC | — Assured Guaranty Corporation |
| AGM | — Assured Guaranty Municipal |
| Ambac | — Ambac Financial Group Incorporated |
| AMT | — Alternative minimum tax |
| BAN | — Bond anticipation notes |
| BHAC | — Berkshire Hathaway Assurance Corporation |
| CAB | — Capital appreciation bond |
| CCAB | — Convertible capital appreciation bond |
| CDA | — Community Development Authority |
| CDO | — Collateralized debt obligation |
| DRIVER | — Derivative inverse tax-exempt receipts |
| DW&P | — Department of Water & Power |
| DWR | — Department of Water Resources |
| ECFA | — Educational & Cultural Facilities Authority |
| EDA | — Economic Development Authority |
| EDFA | — Economic Development Finance Authority |
| ETF | — Exchange-traded fund |
| FDIC | — Federal Deposit Insurance Corporation |
| FFCB | — Federal Farm Credit Banks |
| FGIC | — Financial Guaranty Insurance Corporation |
| FHA | — Federal Housing Administration |
| FHLB | — Federal Home Loan Bank |
| FHLMC | — Federal Home Loan Mortgage Corporation |
| FICO | — The Financing Corporation |
| FNMA | — Federal National Mortgage Association |
| GDR | — Global depositary receipt |
| GNMA | — Government National Mortgage Association |
| HCFR | — Healthcare facilities revenue |
| HEFA | — Health & Educational Facilities Authority |
| HEFAR | — Higher education facilities authority revenue |
| HFA | — Housing Finance Authority |
| HFFA | — Health Facilities Financing Authority |
| HUD | — Department of Housing and Urban Development |
| IDA | — Industrial Development Authority |
| IDAG | — Industrial Development Agency |
| KRW | — Republic of Korea won |
| LIBOR | — London Interbank Offered Rate |
| LIFER | — Long Inverse Floating Exempt Receipts |
| LLC | — Limited liability company |
| LLLP | — Limited liability limited partnership |
| LLP | — Limited liability partnership |
| MBIA | — Municipal Bond Insurance Association |
| MFHR | — Multifamily housing revenue |
| MSTR | — Municipal securities trust receipts |
| MUD | — Municipal Utility District |
| National | — National Public Finance Guarantee Corporation |
| PCFA | — Pollution Control Financing Authority |
| PCL | — Public Company Limited |
| PCR | — Pollution control revenue |
| PFA | — Public Finance Authority |
| PFFA | — Public Facilities Financing Authority |
| PFOTER | — Puttable floating option tax-exempt receipts |
| plc | — Public limited company |
| PUTTER | — Puttable tax-exempt receipts |
| R&D | — Research & development |
| Radian | — Radian Asset Assurance |
| RAN | — Revenue anticipation notes |
| RDA | — Redevelopment Authority |
| RDFA | — Redevelopment Finance Authority |
| REIT | — Real estate investment trust |
| ROC | — Reset option certificates |
| SAVRS | — Select auction variable rate securities |
| SBA | — Small Business Authority |
| SDR | — Swedish depositary receipt |
| SFHR | — Single-family housing revenue |
| SFMR | — Single-family mortgage revenue |
| SPA | — Standby purchase agreement |
| SPDR | — Standard & Poor’s Depositary Receipts |
| SPEAR | — Short Puttable Exempt Adjustable Receipts |
| STRIPS | — Separate trading of registered interest and |
| TAN | — Tax anticipation notes |
| TIPS | — Treasury inflation-protected securities |
| TRAN | — Tax revenue anticipation notes |
| TTFA | — Transportation Trust Fund Authority |
| TVA | — Tennessee Valley Authority |
This page is intentionally left blank.

For more information
More information about Wells Fargo Funds is available free upon request. To obtain literature, please write, email, visit the Fund’s website, or call:
Wells Fargo Funds
P.O. Box 8266
Boston, MA 02266-8266
Email: fundservice@wellsfargo.com
Website: wellsfargofunds.com
Individual investors: 1-800-222-8222
Retail investment professionals: 1-888-877-9275
Institutional investment professionals: 1-866-765-0778
This report and the financial statements contained herein are submitted for the general information of the shareholders of the Fund. If this report is used for promotional purposes, distribution of the report must be accompanied or preceded by a current prospectus. Before investing, please consider the investment objectives, risks, charges, and expenses of the investment. For a current prospectus and, if available, a summary prospectus, containing this information, call 1-800-222-8222 or visit the Fund’s website at wellsfargofunds.com. Read the prospectus carefully before you invest or send money.
Wells Fargo Asset Management (WFAM) is a trade name used by the asset management businesses of Wells Fargo & Company. Wells Fargo Funds Management, LLC, a wholly owned subsidiary of Wells Fargo & Company, provides investment advisory and administrative services for Wells Fargo Funds. Other affiliates of Wells Fargo & Company provide subadvisory and other services for the funds. The funds are distributed by Wells Fargo Funds Distributor, LLC, Member FINRA, an affiliate of Wells Fargo & Company. Neither Wells Fargo Funds Management nor Wells Fargo Funds Distributor has Fund customer accounts/assets, and neither provides investment advice/recommendations or acts as an investment advice fiduciary to any investor.
NOT FDIC INSURED ◾ NO BANK GUARANTEE ◾ MAY LOSE VALUE
© 2016 Wells Fargo Funds Management, LLC. All rights reserved.
| | |
 | | 300485 02-17 SA256/SAR256 12-16 |
Semi-Annual Report
December 31, 2016

Wells Fargo Small Cap Core Fund


Reduce clutter. Save trees.
Sign up for electronic delivery of prospectuses and shareholder reports at wellsfargo.com/advantagedelivery
Contents
The views expressed and any forward-looking statements are as of December 31, 2016, unless otherwise noted, and are those of the Fund managers and/or Wells Fargo Funds Management, LLC. Discussions of individual securities, or the markets generally, or any Wells Fargo Fund are not intended as individual recommendations. Future events or results may vary significantly from those expressed in any forward-looking statements. The views expressed are subject to change at any time in response to changing circumstances in the market. Wells Fargo Funds Management, LLC and the Fund disclaim any obligation to publicly update or revise any views expressed or forward-looking statements.
NOT FDIC INSURED ◾ NO BANK GUARANTEE ��◾ MAY LOSE VALUE
| | | | |
| 2 | | Wells Fargo Small Cap Core Fund | | Letter to shareholders (unaudited) |

Andrew Owen
President
Wells Fargo Funds
U.S. small-cap stocks returned 18.68% for the six-month period.
In December, the Fed hiked the short-term interest rate by 0.25% to reach a target range of 0.50% to 0.75%.
Dear Shareholder:
As the new president of Wells Fargo Funds now that Karla Rabusch is retiring from that position after nearly 14 years, I am pleased to offer you this semi-annual report for the Wells Fargo Small Cap Core Fund for the six-month period that ended December 31, 2016. The U.S. economy ticked up as the period progressed. As expected, the Federal Reserve (Fed) raised the federal funds rate in December by 0.25%. U.S. small-cap stocks returned 18.68% for the six-month period, as measured by the Russell 2000® Index.1
U.S. stocks rose sharply after the U.S. presidential election.
In July, the stock market rallied from a low following the Brexit vote in June; a mostly steady trajectory continued in the U.S. stock market after that inflection point. However, stocks rose significantly immediately after the U.S. presidential election. The promise of pro-growth policies by the incoming administration—lower tax rates, less regulation, investments in infrastructure, better trade deals—set the momentum for this surge.
The types of companies leading the rally leaned toward ones that typically do well in a rising-rate environment, such as banks, and businesses likely to benefit from infrastructure spending and reduced regulations. Sectors that could be negatively affected by rising interest rates, such as utilities, delivered weaker results. Consumer confidence hit pre-recession levels for the first time in November and increased again in December. The dollar appreciated throughout the period; its strongest performance occurred in the post-election period.
Stronger economic indicators drove U.S. monetary policy.
In December, the Fed hiked the short-term interest rate by 0.25% to reach a target range of 0.50% to 0.75%. This was the second rate increase in more than 10 years, with the Fed citing job gains and lower than expected unemployment of 4.6%, down 0.3% from October. The Fed confirmed the continuation of an accommodative monetary policy to support a stronger labor market and reiterated its long-term objective of a 2% inflation rate, which increased slightly during the quarter but fell short of the benchmark. The Fed expressed confidence in the economy’s progress during the quarter and expects this positive trajectory to continue. Both of these sentiments helped to bolster the Fed’s expectation of three additional rate increases during 2017.
U.S. economic data released during the fourth quarter showed that U.S. real gross domestic product increased at an annual rate of 3.5% in the third quarter, the largest increase since mid-2014. Business investment by U.S. companies was mixed, with a 12.0% increase in structures and 4.5% decrease in equipment over the prior quarter on an annualized basis. Consumer spending slowed somewhat from the prior quarter, but late-December estimates from retail-research firms suggest that sales growth during the 2016 holiday season may outpace that of recent years.
Central banks continued with stimulus programs during 2016.
After voters in the U.K. approved a referendum in June to leave the European Union, the Bank of England lowered its interest rate in August to 0.25% and continued its quantitative easing program. The Bank of Japan maintained its negative interest rate put in place earlier in the year, and in September announced an interest rate target for 10-year government bonds—keeping the yield at zero—as it struggled to accelerate economic growth. In December, the European Central
| 1 | The Russell 2000® Index measures the performance of the 2,000 smallest companies in the Russell 3000® Index, which represents approximately 8% of the total market capitalization of the Russell 3000® Index. You cannot invest directly in an index. |
| | | | | | |
| Letter to shareholders (unaudited) | | Wells Fargo Small Cap Core Fund | | | 3 | |
Bank stated that it will extend its quantitative-easing program and continue purchasing large amounts of eurozone corporate and government debt each month through December 2017.
Don’t let short-term uncertainty derail long-term investment goals.
Periods of uncertainty can present challenges, but experience has taught us that maintaining long-term investment goals can be an effective way to plan for the future. To help you create a sound strategy based on your personal goals and risk tolerance, Wells Fargo Funds offers more than 100 mutual funds spanning a wide range of asset classes and investment styles. Although diversification cannot guarantee an investment profit or prevent losses, we believe it can be an effective way to manage investment risk and potentially smooth out overall portfolio performance. We encourage investors to know their investments and to understand that appropriate levels of risk-taking may unlock opportunities.
Thank you for choosing to invest in Wells Fargo Funds. We appreciate your confidence in us and remain committed to helping you meet your financial needs.
Sincerely,

Andrew Owen
President
Wells Fargo Funds
For further information about your Fund, contact your investment professional, visit our website at wellsfargofunds.com, or call us directly at 1-800-222-8222. We are available 24 hours a day, 7 days a week.
| | | | |
| 4 | | Wells Fargo Small Cap Core Fund | | Performance highlights (unaudited) |
Investment objective
The Fund seeks long-term capital appreciation.
Manager
Wells Fargo Funds Management, LLC
Subadviser
Golden Capital Management, LLC
Portfolio managers
John R. Campbell, CFA®
Justin P. Carr, CFA®
Greg W. Golden, CFA®
Average annual total returns (%) as of December 31, 20161
| | | | | | | | | | | | | | | | | | | | | | | | | | | | | | | | | | |
| | | | | Including sales charge | | | Excluding sales charge | | | Expense ratios2 (%) | |
| | | Inception date | | 1 year | | | 5 year | | | 10 year | | | 1 year | | | 5 year | | | 10 year | | | Gross | | | Net3 | |
| Class A (WOSCX) | | 5-20-2016 | | | 8.59 | | | | 13.61 | | | | 4.97 | | | | 15.21 | | | | 14.97 | | | | 5.59 | | | | 1.33 | | | | 1.33 | |
| Class C (WCSCX) | | 5-20-2016 | | | 13.35 | | | | 14.11 | | | | 4.80 | | | | 14.35 | | | | 14.11 | | | | 4.80 | | | | 2.08 | | | | 2.08 | |
| Class R6 (WRSCX) | | 5-20-2016 | | | 15.67 | | | | 15.38 | | | | 5.97 | | | | 15.67 | | | | 15.38 | | | | 5.97 | | | | 0.90 | | | | 0.90 | |
| Administrator Class (WNSCX) | | 5-20-2016 | | | – | | | | – | | | | – | | | | 15.31 | | | | 15.08 | | | | 5.70 | | | | 1.25 | | | | 1.25 | |
| Institutional Class (WYSCX) | | 9-13-2005 | | | – | | | | – | | | | – | | | | 15.62 | | | | 15.37 | | | | 5.96 | | | | 1.00 | | | | 1.00 | |
| Russell 2000® Index4 | | – | | | – | | | | – | | | | – | | | | 21.31 | | | | 14.46 | | | | 7.07 | | | | – | | | | – | |
Figures quoted represent past performance, which is no guarantee of future results, and do not reflect taxes that a shareholder may pay on fund distributions or the redemption of fund shares. Investment return and principal value of an investment will fluctuate so that an investor’s shares, when redeemed, may be worth more or less than their original cost. Performance shown without sales charges would be lower if sales charges were reflected. Current performance may be lower or higher than the performance data quoted, which assumes the reinvestment of dividends and capital gains. Current month-end performance is available on the Fund’s website, wellsfargofunds.com.
Index returns do not include transaction costs associated with buying and selling securities, any mutual fund fees or expenses, or any taxes. It is not possible to invest directly in an index.
For Class A shares, the maximum front-end sales charge is 5.75%. For Class C shares, the maximum contingent deferred sales charge is 1.00%. Performance including a contingent deferred sales charge assumes the sales charge for the corresponding time period. Class R6, Administrator Class, and Institutional Class shares are sold without a front-end sales charge or contingent deferred sales charge.
Stock values fluctuate in response to the activities of individual companies and general market and economic conditions. Certain investment strategies tend to increase the total risk of an investment (relative to the broader market). The Fund is exposed to foreign investment risk and smaller-company securities risk. Consult the Fund’s prospectus for additional information on these and other risks.
Please see footnotes on page 5.
| | | | | | |
| Performance highlights (unaudited) | | Wells Fargo Small Cap Core Fund | | | 5 | |
| | | | |
| Ten largest holdings (%) as of December 31, 20165 | |
Sanmina Corporation | | | 2.30 | |
Geo Group Incorporated | | | 2.24 | |
Biotelemetry Incorporated | | | 2.21 | |
Argan Incorporated | | | 2.15 | |
FCB Financial Holdings Class A | | | 2.15 | |
SkyWest Incorporated | | | 2.14 | |
Nutri System Incorporated | | | 2.08 | |
Employers Holdings Incorporated | | | 2.04 | |
Trinseo SA | | | 2.00 | |
Supernus Pharmaceuticals Incorporated | | | 1.99 | |
|
| Portfolio allocation as of December 31, 20166 |
|

|
| 1 | Historical performance shown for the Class A, Class C, and Administrator Class shares prior to their inception reflects the performance of the Institutional Class shares, and are adjusted to reflect Class A, Class C, and Administrator shares expenses, respectively. Historical performance shown for the Class R6 shares prior to their inception reflects the performance of the Institutional Class shares, and has not been adjusted to reflect Class R6 shares expenses. If these expenses had been included, returns for Class R6 shares would be higher. Historical performance shown for all classes of the Fund prior to May 20, 2016 is based on the performance of the Fund’s predecessor, Golden Small Cap Core Fund. |
| 2 | Reflects the expense ratios as stated in the most recent prospectuses. The expense ratios shown are subject to change and may differ from the annualized expense ratios shown in the financial highlights of this report. |
| 3 | The manager has contractually committed through July 31, 2019, to waive fees and/or reimburse expenses to the extent necessary to cap the Fund’s Total Annual Fund Operating Expenses After Fee Waiver at 1.35% for Class A, 2.10% for Class C, 0.90% for Class R6, 1.25% for Administrator Class, and 1.00% for Institutional Class. After this time, the cap may be increased or the commitment to maintain the cap may be terminated only with the approval of the Board of Trustees. Brokerage commissions, stamp duty fees, interest, taxes, acquired fund fees and expenses, and extraordinary expenses are excluded from the expense cap. Without this cap, the Fund’s returns would have been lower. |
| 4 | The Russell 2000® Index measures the performance of the 2,000 smallest companies in the Russell 3000® Index, which represents approximately 8% of the total market capitalization of the Russell 3000® Index. You cannot invest directly in an index. |
| 5 | The ten largest holdings, excluding cash and cash equivalents, are calculated based on the value of the investments divided by total net assets of the Fund. Holdings are subject to change and may have changed since the date specified. |
| 6 | Amounts are calculated based on the total long-term investments of the Fund. These amounts are subject to change and may have changed since the date specified. |
| | | | |
| 6 | | Wells Fargo Small Cap Core Fund | | Fund expenses (unaudited) |
As a shareholder of the Fund, you incur two types of costs: (1) transaction costs, including sales charges (loads) on purchase payments and contingent deferred sales charges (if any) on redemptions and (2) ongoing costs, including management fees, distribution (12b-1) and/or shareholder servicing fees, and other Fund expenses. This example is intended to help you understand your ongoing costs (in dollars) of investing in the Fund and to compare these costs with the ongoing costs of investing in other mutual funds.
The example is based on an investment of $1,000 invested at the beginning of the six-month period and held for the entire period from July 1, 2016 to December 31, 2016.
Actual expenses
The “Actual” line of the table below provides information about actual account values and actual expenses. You may use the information in this line, together with the amount you invested, to estimate the expenses that you paid over the period. Simply divide your account value by $1,000 (for example, an $8,600 account value divided by $1,000 = 8.6), then multiply the result by the number in the “Actual” line under the heading entitled “Expenses paid during period” for your applicable class of shares to estimate the expenses you paid on your account during this period.
Hypothetical example for comparison purposes
The “Hypothetical” line of the table below provides information about hypothetical account values and hypothetical expenses based on the Fund’s actual expense ratio and an assumed rate of return of 5% per year before expenses, which is not the Fund’s actual return. The hypothetical account values and expenses may not be used to estimate the actual ending account balance or expenses you paid for the period. You may use this information to compare the ongoing costs of investing in the Fund and other funds. To do so, compare this 5% hypothetical example with the 5% hypothetical examples that appear in the shareholder reports of the other funds.
Please note that the expenses shown in the table are meant to highlight your ongoing costs only and do not reflect any transactional costs, such as sales charges (loads) and contingent deferred sales charges. Therefore, the “Hypothetical” line of the table is useful in comparing ongoing costs only and will not help you determine the relative total costs of owning different funds. In addition, if these transactional costs were included, your costs would have been higher.
| | | | | | | | | | | | | | | | |
| | | Beginning
account value
7-1-2016 | | | Ending
account value
12-31-2016 | | | Expenses
paid during
the period¹ | | | Annualized net
expense ratio | |
Class A | | | | | | | | | | | | | | | | |
Actual | | $ | 1,000.00 | | | $ | 1,114.79 | | | $ | 7.18 | | | | 1.35 | % |
Hypothetical (5% return before expenses) | | $ | 1,000.00 | | | $ | 1,018.35 | | | $ | 6.85 | | | | 1.35 | % |
Class C | | | | | | | | | | | | | | | | |
Actual | | $ | 1,000.00 | | | $ | 1,112.60 | | | $ | 11.15 | | | | 2.10 | % |
Hypothetical (5% return before expenses) | | $ | 1,000.00 | | | $ | 1,014.58 | | | $ | 10.63 | | | | 2.10 | % |
Class R6 | | | | | | | | | | | | | | | | |
Actual | | $ | 1,000.00 | | | $ | 1,115.94 | | | $ | 4.79 | | | | 0.90 | % |
Hypothetical (5% return before expenses) | | $ | 1,000.00 | | | $ | 1,020.61 | | | $ | 4.57 | | | | 0.90 | % |
Administrator Class | | | | | | | | | | | | | | | | |
Actual | | $ | 1,000.00 | | | $ | 1,115.29 | | | $ | 6.65 | | | | 1.25 | % |
Hypothetical (5% return before expenses) | | $ | 1,000.00 | | | $ | 1,018.85 | | | $ | 6.34 | | | | 1.25 | % |
Institutional Class | | | | | | | | | | | | | | | | |
Actual | | $ | 1,000.00 | | | $ | 1,116.01 | | | $ | 5.32 | | | | 1.00 | % |
Hypothetical (5% return before expenses) | | $ | 1,000.00 | | | $ | 1,020.11 | | | $ | 5.08 | | | | 1.00 | % |
| 1 | Expenses paid is equal to the annualized net expense ratio of each class multiplied by the average account value over the period, multiplied by the number of days in the most recent fiscal half-year divided by the number of days in the fiscal year (to reflect the one-half-year period). |
| | | | | | |
| Portfolio of investments—December 31, 2016 (unaudited) | | Wells Fargo Small Cap Core Fund | | | 7 | |
| | | | | | | | | | | | | | | | |
| Security name | | | | | | | | Shares | | | Value | |
|
Common Stocks: 99.45% | |
|
Consumer Discretionary: 10.13% | |
|
| Auto Components: 2.88% | |
LCI Industries | | | | | | | | | | | 13,640 | | | $ | 1,469,710 | |
Tower International Incorporated | | | | | | | | | | | 41,628 | | | | 1,180,154 | |
| | | | |
| | | | | | | | | | | | | | | 2,649,864 | |
| | | | | | | | | | | | | | | | |
|
| Hotels, Restaurants & Leisure: 3.26% | |
Denny’s Corporation † | | | | | | | | | | | 111,505 | | | | 1,430,609 | |
Ruth’s Chris Steak House Incorporated | | | | | | | | | | | 85,937 | | | | 1,572,647 | |
| | | | |
| | | | | | | | | | | | | | | 3,003,256 | |
| | | | | | | | | | | | | | | | |
|
| Internet & Direct Marketing Retail: 2.08% | |
Nutri System Incorporated | | | | | | | | | | | 55,405 | | | | 1,919,783 | |
| | | | | | | | | | | | | | | | |
|
| Leisure Products: 1.03% | |
American Outdoor Brands Corporation † | | | | | | | | | | | 45,147 | | | | 951,699 | |
| | | | | | | | | | | | | | | | |
|
| Textiles, Apparel & Luxury Goods: 0.88% | |
Skechers U.S.A. Incorporated Class A † | | | | | | | | | | | 32,879 | | | | 808,166 | |
| | | | | | | | | | | | | | | | |
|
Consumer Staples: 3.62% | |
|
| Food Products: 3.62% | |
Dean Foods Company | | | | | | | | | | | 76,103 | | | | 1,657,523 | |
Sanderson Farms Incorporated | | | | | | | | | | | 17,817 | | | | 1,679,074 | |
| | | | |
| | | | | | | | | | | | | | | 3,336,597 | |
| | | | | | | | | | | | | | | | |
|
Energy: 1.56% | |
|
| Energy Equipment & Services: 1.56% | |
Matrix Service Company † | | | | | | | | | | | 63,204 | | | | 1,434,731 | |
| | | | | | | | | | | | | | | | |
|
Financials: 16.86% | |
|
| Banks: 2.15% | |
FCB Financial Holdings Class A † | | | | | | | | | | | 41,526 | | | | 1,980,790 | |
| | | | | | | | | | | | | | | | |
|
| Capital Markets: 1.87% | |
Evercore Partners Incorporated Class A | | | | | | | | | | | 25,047 | | | | 1,720,729 | |
| | | | | | | | | | | | | | | | |
|
| Insurance: 12.84% | |
AmTrust Financial Services Incorporated | | | | | | | | | | | 47,486 | | | | 1,300,167 | |
Employers Holdings Incorporated | | | | | | | | | | | 47,545 | | | | 1,882,782 | |
Federated National Holding Company | | | | | | | | | | | 63,343 | | | | 1,183,881 | |
Heritage Insurance Holdings | | | | | | | | | | | 92,364 | | | | 1,447,344 | |
Maiden Holdings Limited | | | | | | | | | | | 84,608 | | | | 1,476,410 | |
National General Holdings Corporation | | | | | | | | | | | 69,072 | | | | 1,726,109 | |
United Insurance Holdings Company | | | | | | | | | | | 72,477 | | | | 1,097,302 | |
Universal Insurance Holdings Company | | | | | | | | | | | 60,459 | | | | 1,717,036 | |
| | | | |
| | | | | | | | | | | | | | | 11,831,031 | |
| | | | | | | | | | | | | | | | |
The accompanying notes are an integral part of these financial statements.
| | | | |
| 8 | | Wells Fargo Small Cap Core Fund | | Portfolio of investments—December 31, 2016 (unaudited) |
| | | | | | | | | | | | | | | | |
| Security name | | | | | | | | Shares | | | Value | |
|
Health Care: 16.75% | |
|
| Biotechnology: 1.59% | |
Xencor Incorporated † | | | | | | | | | | | 55,744 | | | $ | 1,467,182 | |
| | | | | | | | | | | | | | | | |
| | | | |
| Health Care Equipment & Supplies: 3.77% | | | | | | | | | | | | | | | | |
ICU Medical Incorporated † | | | | | | | | | | | 12,106 | | | | 1,783,819 | |
NuVasive Incorporated † | | | | | | | | | | | 25,089 | | | | 1,689,995 | |
| | | | |
| | | | | | | | | | | | | | | 3,473,814 | |
| | | | | | | | | | | | | | | | |
| | | | |
| Health Care Providers & Services: 7.43% | | | | | | | | | | | | | | | | |
Biotelemetry Incorporated † | | | | | | | | | | | 91,034 | | | | 2,034,610 | |
Envision Healthcare Corporation † | | | | | | | | | | | 20,506 | | | | 1,297,825 | |
HealthSouth Corporation | | | | | | | | | | | 31,685 | | | | 1,306,689 | |
PharMerica Corporation † | | | | | | | | | | | 44,815 | | | | 1,127,097 | |
Select Medical Holdings Corporation † | | | | | | | | | | | 81,502 | | | | 1,079,902 | |
| | | | |
| | | | | | | | | | | | | | | 6,846,123 | |
| | | | | | | | | | | | | | | | |
| | | | |
| Life Sciences Tools & Services: 1.97% | | | | | | | | | | | | | | | | |
INC Research Holdings Incorporated Class A † | | | | | | | | | | | 34,381 | | | | 1,808,441 | |
| | | | | | | | | | | | | | | | |
| | | | |
| Pharmaceuticals: 1.99% | | | | | | | | | | | | | | | | |
Supernus Pharmaceuticals Incorporated † | | | | | | | | | | | 72,572 | | | | 1,832,443 | |
| | | | | | | | | | | | | | | | |
| | | | |
Industrials: 18.62% | | | | | | | | | | | | | | | | |
| | | | |
| Airlines: 2.14% | | | | | | | | | | | | | | | | |
SkyWest Incorporated | | | | | | | | | | | 54,031 | | | | 1,969,430 | |
| | | | | | | | | | | | | | | | |
| | | | |
| Commercial Services & Supplies: 5.24% | | | | | | | | | | | | | | | | |
ACCO Brands Corporation † | | | | | | | | | | | 115,421 | | | | 1,506,244 | |
Deluxe Corporation | | | | | | | | | | | 23,845 | | | | 1,707,540 | |
UniFirst Corporation | | | | | | | | | | | 11,215 | | | | 1,611,035 | |
| | | | |
| | | | | | | | | | | | | | | 4,824,819 | |
| | | | | | | | | | | | | | | | |
| | | | |
| Construction & Engineering: 5.53% | | | | | | | | | | | | | | | | |
Argan Incorporated | | | | | | | | | | | 28,129 | | | | 1,984,501 | |
Comfort Systems USA Incorporated | | | | | | | | | | | 41,658 | | | | 1,387,211 | |
EMCOR Group Incorporated | | | | | | | | | | | 24,419 | | | | 1,727,888 | |
| | | | |
| | | | | | | | | | | | | | | 5,099,600 | |
| | | | | | | | | | | | | | | | |
| | | | |
| Machinery: 3.55% | | | | | | | | | | | | | | | | |
The Greenbrier Companies Incorporated | | | | | | | | | | | 39,200 | | | | 1,628,760 | |
Wabash National Corporation | | | | | | | | | | | 103,701 | | | | 1,640,550 | |
| | | | |
| | | | | | | | | | | | | | | 3,269,310 | |
| | | | | | | | | | | | | | | | |
| | | | |
| Professional Services: 2.16% | | | | | | | | | | | | | | | | |
Insperity Incorporated | | | | | | | | | | | 17,136 | | | | 1,215,799 | |
RPX Corporation † | | | | | | | | | | | 71,407 | | | | 771,196 | |
| | | | |
| | | | | | | | | | | | | | | 1,986,995 | |
| | | | | | | | | | | | | | | | |
The accompanying notes are an integral part of these financial statements.
| | | | | | |
| Portfolio of investments—December 31, 2016 (unaudited) | | Wells Fargo Small Cap Core Fund | | | 9 | |
| | | | | | | | | | | | | | | | |
| Security name | | | | | | | | Shares | | | Value | |
| | | | |
Information Technology: 19.32% | | | | | | | | | | | | | | | | |
| | | | |
| Electronic Equipment, Instruments & Components: 3.76% | | | | | | | | | | | | | | | | |
Methode Electronics Incorporated | | | | | | | | | | | 32,407 | | | $ | 1,340,029 | |
Sanmina Corporation † | | | | | | | | | | | 57,856 | | | | 2,120,422 | |
| | | | |
| | | | | | | | | | | | | | | 3,460,451 | |
| | | | | | | | | | | | | | | | |
| | | | |
| Internet Software & Services: 3.24% | | | | | | | | | | | | | | | | |
J2 Global Incorporated | | | | | | | | | | | 20,014 | | | | 1,637,145 | |
Web.com Group Incorporated † | | | | | | | | | | | 63,746 | | | | 1,348,228 | |
| | | | |
| | | | | | | | | | | | | | | 2,985,373 | |
| | | | | | | | | | | | | | | | |
| | | | |
| IT Services: 1.84% | | | | | | | | | | | | | | | | |
Hackett Group Incorporated | | | | | | | | | | | 95,967 | | | | 1,694,777 | |
| | | | | | | | | | | | | | | | |
| | | | |
| Semiconductors & Semiconductor Equipment: 8.71% | | | | | | | | | | | | | | | | |
Advanced Energy Industries Incorporated † | | | | | | | | | | | 28,851 | | | | 1,579,592 | |
Cirrus Logic Incorporated † | | | | | | | | | | | 31,205 | | | | 1,764,331 | |
Inphi Corporation † | | | | | | | | | | | 38,797 | | | | 1,731,122 | |
MaxLinear Incorporated Class A † | | | | | | | | | | | 62,645 | | | | 1,365,661 | |
Tessera Holding Corporation | | | | | | | | | | | 35,933 | | | | 1,588,239 | |
| | | | |
| | | | | | | | | | | | | | | 8,028,945 | |
| | | | | | | | | | | | | | | | |
| | | | |
| Software: 1.77% | | | | | | | | | | | | | | | | |
Gigamon Incorporated † | | | | | | | | | | | 35,761 | | | | 1,628,914 | |
| | | | | | | | | | | | | | | | |
| | | | |
Materials: 4.88% | | | | | | | | | | | | | | | | |
| | | | |
| Chemicals: 2.00% | | | | | | | | | | | | | | | | |
Trinseo SA | | | | | | | | | | | 31,037 | | | | 1,840,494 | |
| | | | | | | | | | | | | | | | |
| | | | |
| Containers & Packaging: 1.33% | | | | | | | | | | | | | | | | |
Graphic Packaging Holding Company | | | | | | | | | | | 98,338 | | | | 1,227,258 | |
| | | | | | | | | | | | | | | | |
| | | | |
| Metals & Mining: 1.55% | | | | | | | | | | | | | | | | |
Suncoke Energy Incorporated † | | | | | | | | | | | 125,833 | | | | 1,426,946 | |
| | | | | | | | | | | | | | | | |
| | | | |
Real Estate: 6.48% | | | | | | | | | | | | | | | | |
| | | | |
| Equity REITs: 6.48% | | | | | | | | | | | | | | | | |
Ashford Hospitality Trust Incorporated | | | | | | | | | | | 185,631 | | | | 1,440,497 | |
Geo Group Incorporated | | | | | | | | | | | 57,409 | | | | 2,062,705 | |
InfraReit Incorporated | | | | | | | | | | | 61,011 | | | | 1,092,707 | |
QTS Realty Trust Incorporated Class A | | | | | | | | | | | 27,659 | | | | 1,373,269 | |
| | | | |
| | | | | | | | | | | | | | | 5,969,178 | |
| | | | | | | | | | | | | | | | |
| | | | |
Utilities: 1.23% | | | | | | | | | | | | | | | | |
| | | | |
| Electric Utilities: 1.23% | | | | | | | | | | | | | | | | |
Spark Energy Incorporated Class A | | | | | | | | | | | 37,593 | | | | 1,139,068 | |
| | | | | | | | | | | | | | | | |
| | | | |
Total Common Stocks (Cost $69,699,834) | | | | | | | | | | | | | | | 91,616,207 | |
| | | | | | | | | | | | | | | | |
The accompanying notes are an integral part of these financial statements.
| | | | |
| 10 | | Wells Fargo Small Cap Core Fund | | Portfolio of investments—December 31, 2016 (unaudited) |
| | | | | | | | | | | | | | | | |
| Security name | | Yield | | | | | | Shares | | | Value | |
| | | | |
Short-Term Investments: 0.59% | | | | | | | | | | | | | | | | |
| | | | |
| Investment Companies: 0.59% | | | | | | | | | | | | | | | | |
Wells Fargo Government Money Market Fund Select Class (l)(u) | | | 0.43 | % | | | | | | | 541,406 | | | $ | 541,406 | |
| | | | | | | | | | | | | | | | |
| | | | |
Total Short-Term Investments (Cost $541,406) | | | | | | | | | | | | | | | 541,406 | |
| | | | | | | | | | | | | | | | |
| | | | | | | | |
| Total investments in securities (Cost $70,241,240) * | | | 100.04 | % | | | 92,157,613 | |
Other assets and liabilities, net | | | (0.04 | ) | | | (39,200 | ) |
| | | | | | | | |
| Total net assets | | | 100.00 | % | | $ | 92,118,413 | |
| | | | | | | | |
| † | Non-income-earning security |
| (l) | The issuer of the security is an affiliated person of the Fund as defined in the Investment Company Act of 1940. |
| (u) | The rate represents the 7-day annualized yield at period end. |
| * | Cost for federal income tax purposes is $70,155,831 and unrealized gains (losses) consists of: |
| | | | |
Gross unrealized gains | | $ | 23,480,452 | |
Gross unrealized losses | | | (1,478,670 | ) |
| | | | |
Net unrealized gains | | $ | 22,001,782 | |
The accompanying notes are an integral part of these financial statements.
| | | | | | |
| Statement of assets and liabilities—December 31, 2016 (unaudited) | | Wells Fargo Small Cap Core Fund | | | 11 | |
| | | | |
| | | | |
| |
Assets | | | | |
Investments | | | | |
In unaffiliated securities, at value (cost $69,699,834) | | $ | 91,616,207 | |
In affiliated securities, at value (cost $541,406) | | | 541,406 | |
| | | | |
Total investments, at value (cost $70,241,240) | | | 92,157,613 | |
Receivable for Fund shares sold | | | 55,389 | |
Receivable for dividends | | | 108,089 | |
Prepaid expenses and other assets | | | 8,764 | |
| | | | |
Total assets | | | 92,329,855 | |
| | | | |
| |
Liabilities | | | | |
Payable for Fund shares redeemed | | | 135,925 | |
Management fee payable | | | 57,867 | |
Distribution fee payable | | | 89 | |
Administration fees payable | | | 10,927 | |
Accrued expenses and other liabilities | | | 6,634 | |
| | | | |
Total liabilities | | | 211,442 | |
| | | | |
Total net assets | | $ | 92,118,413 | |
| | | | |
| |
NET ASSETS CONSIST OF | | | | |
Paid-in capital | | $ | 128,150,402 | |
Undistributed net investment income | | | 108,605 | |
Accumulated net realized losses on investments | | | (58,056,967 | ) |
Net unrealized gains on investments | | | 21,916,373 | |
| | | | |
Total net assets | | $ | 92,118,413 | |
| | | | |
| |
COMPUTATION OF NET ASSET VALUE AND OFFERING PRICE PER SHARE | | | | |
Net assets – Class A | | $ | 331,937 | |
Shares outstanding – Class A1 | | | 16,211 | |
Net asset value per share – Class A | | | $20.48 | |
Maximum offering price per share – Class A2 | | | $21.73 | |
Net assets – Class C | | $ | 132,710 | |
Shares outstanding – Class C1 | | | 6,505 | |
Net asset value per share – Class C | | | $20.40 | |
Net assets – Class R6 | | $ | 123,820 | |
Shares outstanding – Class R61 | | | 6,031 | |
Net asset value per share – Class R6 | | | $20.53 | |
Net assets – Administrator Class | | $ | 125,860 | |
Shares outstanding – Administrator Class1 | | | 6,142 | |
Net asset value per share – Administrator Class | | | $20.49 | |
Net assets – Institutional Class | | $ | 91,404,086 | |
Shares outstanding – Institutional Class1 | | | 4,454,214 | |
Net asset value per share – Institutional Class | | | $20.52 | |
| 1 | The Fund has an unlimited number of authorized shares. |
| 2 | Maximum offering price is computed as 100/94.25 of net asset value. On investments of $50,000 or more, the offering price is reduced. |
The accompanying notes are an integral part of these financial statements.
| | | | |
| 12 | | Wells Fargo Small Cap Core Fund | | Statement of operations—six months ended December 31, 2016 (unaudited) |
| | | | |
| | | | |
| |
Investment income | | | | |
Dividends | | $ | 611,521 | |
Income from affiliated securities | | | 1,234 | |
| | | | |
Total investment income | | | 612,755 | |
| | | | |
| |
Expenses | | | | |
Management fee | | | 427,624 | |
Administration fees | | | | |
Class A | | | 180 | |
Class C | | | 120 | |
Class R6 | | | 17 | |
Administrator Class | | | 74 | |
Institutional Class | | | 65,068 | |
Shareholder servicing fees | | | | |
Class A | | | 214 | |
Class C | | | 143 | |
Administrator Class | | | 142 | |
Distribution fee | | | | |
Class C | | | 428 | |
Custody and accounting fees | | | 9,040 | |
Professional fees | | | 21,902 | |
Registration fees | | | 25,476 | |
Shareholder report expenses | | | 17,326 | |
Trustees’ fees and expenses | | | 7,154 | |
Other fees and expenses | | | 4,583 | |
| | | | |
Total expenses | | | 579,491 | |
Less: Fee waivers and/or expense reimbursements | | | (75,391 | ) |
| | | | |
Net expenses | | | 504,100 | |
| | | | |
Net investment income | | | 108,655 | |
| | | | |
| |
REALIZED AND UNREALIZED GAINS (LOSSES) ON INVESTMENTS | | | | |
| |
Net realized gains on investments | | | 2,077,713 | |
Net change in unrealized gains (losses) on investments | | | 16,750,435 | |
| | | | |
Net realized and unrealized gains (losses) on investments | | | 18,828,148 | |
| | | | |
Net increase in net assets resulting from operations | | $ | 18,936,803 | |
| | | | |
The accompanying notes are an integral part of these financial statements.
| | | | | | |
| Statement of changes in net assets | | Wells Fargo Small Cap Core Fund | | | 13 | |
| | | | | | | | | | | | | | | | |
| | | Six months ended
December 31, 2016
(unaudited) | | | Year ended
June 30, 20161 | |
| | | | |
Operations | | | | | | | | | | | | | | | | |
Net investment income | | | | | | $ | 108,655 | | | | | | | $ | 285,872 | |
Net realized gains (losses) on investments | | | | | | | 2,077,713 | | | | | | | | (10,551,715 | ) |
Net change in unrealized gains (losses) on investments | | | | | | | 16,750,435 | | | | | | | | (2,795,570 | ) |
| | | | |
Net increase (decrease) in net assets resulting from operations | | | | | | | 18,936,803 | | | | | | | | (13,061,413 | ) |
| | | | |
| | | | |
Distributions to shareholders from | | | | | | | | | | | | | | | | |
Net investment income | | | | | | | | | | | | | | | | |
Class A | | | | | | | (604 | ) | | | | | | | 0 | 2 |
Class C | | | | | | | (175 | ) | | | | | | | 0 | 2 |
Class R6 | | | | | | | (284 | ) | | | | | | | 0 | 2 |
Administrator Class | | | | | | | (256 | ) | | | | | | | 0 | 2 |
Institutional Class | | | | | | | (215,546 | ) | | | | | | | (153,914 | ) |
| | | | |
Total distributions to shareholders | | | | | | | (216,865 | ) | | | | | | | (153,914 | ) |
| | | | |
| | | | |
Capital share transactions | | | Shares | | | | | | | | Shares | | | | | |
Proceeds from shares sold | | | | | | | | | | | | | | | | |
Class A | | | 9,198 | | | | 181,658 | | | | 7,790 | 2 | | | 130,000 | 2 |
Class C | | | 479 | | | | 9,440 | | | | 6,017 | 2 | | | 100,000 | 2 |
Class R6 | | | 0 | | | | 0 | | | | 6,017 | 2 | | | 100,000 | 2 |
Administrator Class | | | 112 | | | | 2,000 | | | | 6,017 | 2 | | | 100,000 | 2 |
Institutional Class | | | 177,642 | | | | 3,340,423 | | | | 5,103,153 | | | | 91,283,720 | |
| | | | |
| | | | | | | 3,533,521 | | | | | | | | 91,713,720 | |
| | | | |
Reinvestment of distributions | | | | | | | | | | | | | | | | |
Class A | | | 30 | | | | 604 | | | | 0 | 2 | | | 0 | 2 |
Class C | | | 9 | | | | 175 | | | | 0 | 2 | | | 0 | 2 |
Class R6 | | | 14 | | | | 284 | | | | 0 | 2 | | | 0 | 2 |
Administrator Class | | | 13 | | | | 256 | | | | 0 | 2 | | | 0 | 2 |
Institutional Class | | | 2,392 | | | | 48,291 | | | | 1,813 | | | | 32,246 | |
| | | | |
| | | | | | | 49,610 | | | | | | | | 32,246 | |
| | | | |
Payment for shares redeemed | | | | | | | | | | | | | | | | |
Class A | | | (807 | ) | | | (14,987 | ) | | | 0 | 2 | | | 0 | 2 |
Institutional Class | | | (2,348,767 | ) | | | (42,507,632 | ) | | | (2,992,788 | ) | | | (50,609,931 | ) |
| | | | |
| | | | | | | (42,522,619 | ) | | | | | | | (50,609,931 | ) |
| | | | |
Net increase (decrease) in net assets resulting from capital share transactions | | | | | | | (38,939,488 | ) | | | | | | | 41,136,035 | |
| | | | |
Total Increase (decrease) in net assets | | | | | | | (20,219,550 | ) | | | | | | | 27,920,708 | |
| | | | |
| | | | |
Net assets | | | | | | | | | | | | | | | | |
Beginning of period | | | | | | | 112,337,963 | | | | | | | | 84,417,255 | |
| | | | |
End of period | | | | | | $ | 92,118,413 | | | | | | | $ | 112,337,963 | |
| | | | |
Undistributed net investment income | | | | | | $ | 108,605 | | | | | | | $ | 216,815 | |
| | | | |
| 1 | After the close of business on May 20, 2016, the Fund acquired the net assets of Golden Small Cap Core Fund, which became the accounting and performance survivor in the transaction. The information for the period prior to May 21, 2016 is that of Golden Small Cap Core Fund. |
| 2 | For the period from May 20, 2016 (commencement of class operations) to June 30, 2016 |
The accompanying notes are an integral part of these financial statements.
| | | | |
| 14 | | Wells Fargo Small Cap Core Fund | | Financial highlights |
(For a share outstanding throughout each period)
| | | | | | | | |
| CLASS A | | Six months ended
December 31, 2016
(unaudited) | | | Year ended June 30, 20161 | |
Net asset value, beginning of period | | | $16.89 | | | | $16.62 | |
Net investment income (loss) | | | (0.00 | )2,3 | | | 0.01 | 2 |
Net realized and unrealized gains (losses) on investments | | | 3.63 | | | | 0.26 | |
| | | | | | | | |
Total from investment operations | | | 3.63 | | | | 0.27 | |
Distributions to shareholders from | | | | | | | | |
Net investment income | | | (0.04 | ) | | | 0.00 | |
Net asset value, end of period | | | $20.48 | | | | $16.89 | |
Total return4 | | | 21.51 | % | | | 1.62 | % |
Ratios to average net assets (annualized) | | | | | | | | |
Gross expenses | | | 1.49 | % | | | 1.46 | % |
Net expenses | | | 1.35 | % | | | 1.35 | % |
Net investment income (loss) | | | (0.02 | )% | | | 0.65 | % |
Supplemental data | | | | | | | | |
Portfolio turnover rate | | | 14 | % | | | 61 | % |
Net assets, end of period (000s omitted) | | | $332 | | | | $132 | |
| 1 | For the period from May 20, 2016 (commencement of class operations) to June 30, 2016 |
| 2 | Calculated based upon average shares outstanding |
| 3 | Amount is less than $0.005. |
| 4 | Total return calculations do not include any sales charges. Returns for periods of less than one year are not annualized. |
The accompanying notes are an integral part of these financial statements.
| | | | | | |
| Financial highlights | | Wells Fargo Small Cap Core Fund | | | 15 | |
(For a share outstanding throughout each period)
| | | | | | | | |
| CLASS C | | Six months ended
December 31, 2016 (unaudited) | | | Year ended June 30, 20161 | |
Net asset value, beginning of period | | | $16.87 | | | | $16.62 | |
Net investment loss | | | (0.07 | ) | | | (0.00 | )2,3 |
Net realized and unrealized gains (losses) on investments | | | 3.63 | | | | 0.25 | |
| | | | | | | | |
Total from investment operations | | | 3.56 | | | | 0.25 | |
Distributions to shareholders from | | | | | | | | |
Net investment income | | | (0.03 | ) | | | 0.00 | |
Net asset value, end of period | | | $20.40 | | | | $16.87 | |
Total return4 | | | 21.09 | % | | | 1.50 | % |
Ratios to average net assets (annualized) | | | | | | | | |
Gross expenses | | | 2.24 | % | | | 2.21 | % |
Net expenses | | | 2.10 | % | | | 2.10 | % |
Net investment loss | | | (0.83 | )% | | | (0.27 | )% |
Supplemental data | | | | | | | | |
Portfolio turnover rate | | | 14 | % | | | 61 | % |
Net assets, end of period (000s omitted) | | | $133 | | | | $102 | |
| 1 | For the period from May 20, 2016 (commencement of class operations) to June 30, 2016 |
| 2 | Calculated based upon average shares outstanding |
| 3 | Amount is less than $0.005. |
| 4 | Total return calculations do not include any sales charges. Returns for periods of less than one year are not annualized. |
The accompanying notes are an integral part of these financial statements.
| | | | |
| 16 | | Wells Fargo Small Cap Core Fund | | Financial highlights |
(For a share outstanding throughout each period)
| | | | | | | | |
| CLASS R6 | | Six months ended
December 31, 2016 (unaudited) | | | Year ended June 30, 20161 | |
Net asset value, beginning of period | | | $16.90 | | | | $16.62 | |
Net investment income | | | 0.04 | | | | 0.02 | 2 |
Net realized and unrealized gains (losses) on investments | | | 3.64 | | | | 0.26 | |
| | | | | | | | |
Total from investment operations | | | 3.68 | | | | 0.28 | |
Distributions to shareholders from | | | | | | | | |
Net investment income | | | (0.05 | ) | | | 0.00 | |
Net asset value, end of period | | | $20.53 | | | | $16.90 | |
Total return3 | | | 21.76 | % | | | 1.68 | % |
Ratios to average net assets (annualized) | | | | | | | | |
Gross expenses | | | 1.05 | % | | | 1.03 | % |
Net expenses | | | 0.90 | % | | | 0.90 | % |
Net investment income | | | 0.37 | % | | | 0.93 | % |
Supplemental data | | | | | | | | |
Portfolio turnover rate | | | 14 | % | | | 61 | % |
Net assets, end of period (000s omitted) | | | $124 | | | | $102 | |
| 1 | For the period from May 20, 2016 (commencement of class operations) to June 30, 2016 |
| 2 | Calculated based upon average shares outstanding |
| 3 | Returns for periods of less than one year are not annualized. |
The accompanying notes are an integral part of these financial statements.
| | | | | | |
| Financial highlights | | Wells Fargo Small Cap Core Fund | | | 17 | |
(For a share outstanding throughout each period)
| | | | | | | | |
| ADMINISTRATOR CLASS | | Six months ended
December 31, 2016
(unaudited) | | | Year ended June 30, 20161 | |
Net asset value, beginning of period | | | $16.89 | | | | $16.62 | |
Net investment income | | | 0.00 | 2 | | | 0.01 | 3 |
Net realized and unrealized gains (losses) on investments | | | 3.64 | | | | 0.26 | |
| | | | | | | | |
Total from investment operations | | | 3.64 | | | | 0.27 | |
Distributions to shareholders from | | | | | | | | |
Net investment income | | | (0.04 | ) | | | 0.00 | |
Net asset value, end of period | | | $20.49 | | | | $16.89 | |
Total return4 | | | 21.57 | % | | | 1.62 | % |
Ratios to average net assets (annualized) | | | | | | | | |
Gross expenses | | | 1.41 | % | | | 1.37 | % |
Net expenses | | | 1.25 | % | | | 1.25 | % |
Net investment income | | | 0.02 | % | | | 0.58 | % |
Supplemental data | | | | | | | | |
Portfolio turnover rate | | | 14 | % | | | 61 | % |
Net assets, end of period (000s omitted) | | | $126 | | | | $102 | |
| 1 | For the period from May 20, 2016 (commencement of class operations) to June 30, 2016 |
| 2 | Amount is less than $0.005. |
| 3 | Calculated based upon average shares outstanding |
| 4 | Returns for periods of less than one year are not annualized. |
The accompanying notes are an integral part of these financial statements.
| | | | |
| 18 | | Wells Fargo Small Cap Core Fund | | Financial highlights |
(For a share outstanding throughout each period)
| | | | | | | | | | | | | | | | | | | | | | | | |
| | | Six months ended
December 31, 2016 (unaudited) | | | Year ended June 30 | |
| INSTITUTIONAL CLASS | | | 20161 | | | 20151 | | | 20141 | | | 20131 | | | 20121 | |
Net asset value, beginning of period | | | $16.90 | | | | $18.71 | | | | $16.76 | | | | $13.57 | | | | $10.64 | | | | $11.10 | |
Net investment income (loss) | | | 0.04 | | | | 0.04 | 2 | | | 0.06 | 2 | | | 0.05 | 2 | | | 0.16 | 2 | | | (0.01 | )2 |
Net realized and unrealized gains (losses) on investments | | | 3.63 | | | | (1.83 | ) | | | 1.92 | | | | 3.36 | | | | 2.77 | | | | (0.45 | ) |
| | | | | | | | | | | | | | | | | | | | | | | | |
Total from investment operations | | | 3.67 | | | | (1.79 | ) | | | 1.98 | | | | 3.41 | | | | 2.93 | | | | (0.46 | ) |
Distributions to shareholders from | | | | | | | | | | | | | | | | | | | | | | | | |
Net investment income | | | (0.05 | ) | | | (0.02 | ) | | | (0.03 | ) | | | (0.22 | ) | | | 0.00 | | | | 0.00 | |
Net asset value, end of period | | | $20.52 | | | | $16.90 | | | | $18.71 | | | | $16.76 | | | | $13.57 | | | | $10.64 | |
Total return3 | | | 21.70 | % | | | (9.57 | )% | | | 11.80 | % | | | 25.21 | % | | | 27.54 | % | | | (4.14 | )% |
Ratios to average net assets (annualized) | | | | | | | | | | | | | | | | | | | | | | | | |
Gross expenses | | | 1.15 | % | | | 1.11 | % | | | 1.10 | % | | | 1.10 | % | | | 1.10 | % | | | 1.11 | % |
Net expenses | | | 1.00 | % | | | 1.09 | % | | | 1.10 | % | | | 1.10 | % | | | 1.10 | % | | | 1.10 | % |
Net investment income (loss) | | | 0.22 | % | | | 0.25 | % | | | 0.37 | % | | | 0.30 | % | | | 1.32 | % | | | (0.12 | )% |
Supplemental data | | | | | | | | | | | | | | | | | | | | | | | | |
Portfolio turnover rate | | | 14 | % | | | 61 | % | | | 57 | % | | | 68 | % | | | 52 | % | | | 56 | % |
Net assets, end of period (000s omitted) | | | $91,404 | | | | $111,902 | | | | $84,417 | | | | $22,170 | | | | $20,093 | | | | $27,427 | |
| 1 | After the close of business on May 20, 2016, the Fund acquired the net assets of Golden Small Cap Core Fund, which became the accounting and performance survivor in the transaction. The information for the periods prior to May 21, 2016 is that of Golden Small Cap Core Fund. |
| 2 | Calculated based upon average shares outstanding |
| 3 | Returns for periods of less than one year are not annualized. |
The accompanying notes are an integral part of these financial statements.
| | | | | | |
| Notes to financial statements (unaudited) | | Wells Fargo Small Cap Core Fund | | | 19 | |
1. ORGANIZATION
Wells Fargo Funds Trust (the “Trust”), a Delaware statutory trust organized on March 10, 1999, is an open-end management investment company registered under the Investment Company Act of 1940, as amended (the “1940 Act”). As an investment company, the Trust follows the accounting and reporting guidance in Financial Accounting Standards Board (“FASB”) Accounting Standards Codification Topic 946, Financial Services – Investment Companies. These financial statements report on the Wells Fargo Small Cap Core Fund (the “Fund”) which is a diversified series of the Trust.
After the close of business on May 20, 2016, the net assets of Golden Small Cap Core Fund were acquired by the Fund, which was created to receive the assets of Golden Small Cap Core Fund, in an exchange for shares of the Fund. Institutional shares of Golden Small Cap Core Fund received shares of Institutional Class of the Fund in the transaction. Since Golden Small Cap Core Fund contributed all of the net assets and shareholders to the newly created Wells Fargo fund, the accounting and performance history of Golden Small Cap Core Fund has been carried forward in the financial statements contained herein.
2. SIGNIFICANT ACCOUNTING POLICIES
The following significant accounting policies, which are consistently followed in the preparation of the financial statements of the Fund, are in conformity with U.S. generally accepted accounting principles which require management to make estimates and assumptions that affect the reported amounts of assets and liabilities, disclosure of contingent assets and liabilities at the date of the financial statements, and the reported amounts of revenues and expenses during the reporting period. Actual results could differ from those estimates.
All investments are valued each business day as of the close of regular trading on the New York Stock Exchange (generally 4 p.m. Eastern Time), although the Fund may deviate from this calculation time under unusual or unexpected circumstances.
Equity securities that are listed on a foreign or domestic exchange or market are valued at the official closing price or, if none, the last sales price. If no sale occurs on the principal exchange or market that day, the prior day’s price will be deemed “stale” and a fair value price will be determined in accordance with the Fund’s Valuation Procedures.
Investments in registered open-end investment companies are valued at net asset value.
Investments which are not valued using any of the methods discussed above are valued at their fair value, as determined in good faith by the Board of Trustees of the Fund. The Board of Trustees has established a Valuation Committee comprised of the Trustees and has delegated to it the authority to take any actions regarding the valuation of portfolio securities that the Valuation Committee deems necessary or appropriate, including determining the fair value of portfolio securities, unless the determination has been delegated to the Management Valuation Team of Wells Fargo Funds Management, LLC (“Funds Management”). The Board of Trustees retains the authority to make or ratify any valuation decisions or approve any changes to the Valuation Procedures as it deems appropriate. On a quarterly basis, the Board of Trustees receives reports on any valuation actions taken by the Valuation Committee or the Management Valuation Team which may include items for ratification.
Valuations of fair valued securities are compared to the next actual sales price when available, or other appropriate market values, to assess the continued appropriateness of the fair valuation methodologies used. These securities are fair valued on a day-to-day basis, taking into consideration changes to appropriate market information and any significant changes to the inputs considered in the valuation process until there is a readily available price provided on an exchange or by an independent pricing service. Valuations received from an independent pricing service or independent broker-dealer quotes are periodically validated by comparisons to most recent trades and valuations provided by other independent pricing services in addition to the review of prices by the manager and/or subadviser. Unobservable inputs used in determining fair valuations are identified based on the type of security, taking into consideration factors utilized by market participants in valuing the investment, knowledge about the issuer and the current market environment.
Security transactions and income recognition
Securities transactions are recorded on a trade date basis. Realized gains or losses are recorded on the basis of identified cost.
Dividend income is recognized on the ex-dividend date.
Distributions to shareholders
Distributions to shareholders from net investment income and net realized gains, if any, are recorded on the ex-dividend date. Such distributions are determined in conformity with federal income tax regulations, which may differ in amount or character from net investment income and realized gains recognized for purposes of U.S. generally accepted accounting principles.
| | | | |
| 20 | | Wells Fargo Small Cap Core Fund | | Notes to financial statements (unaudited) |
Federal and other taxes
The Fund intends to continue to qualify as a regulated investment company by distributing substantially all of its investment company taxable income and any net realized capital gains (after reduction for capital loss carryforwards) sufficient to relieve it from all, or substantially all, federal income taxes. Accordingly, no provision for federal income taxes was required.
The Fund’s income and federal excise tax returns and all financial records supporting those returns for the prior three fiscal years are subject to examination by the federal and Delaware revenue authorities. Management has analyzed the Fund’s tax positions taken on federal, state, and foreign tax returns for all open tax years and does not believe that there are any uncertain tax positions that require recognition of a tax liability.
Capital loss carryforwards that do not expire are required to be utilized prior to capital loss carryforwards that expire. As of June 30, 2016, capital loss carryforwards available to offset future net realized capital gains were as follows through the indicated expiration dates:
| | | | |
| | | No expiration |
| 2018 | | Short-term | | Long-term |
| $49,578,591 | | $9,232,422 | | $712,049 |
Class allocations
The separate classes of shares offered by the Fund differ principally in applicable sales charges, distribution, shareholder servicing, and administration fees. Class specific expenses are charged directly to that share class. Investment income, common expenses, and realized and unrealized gains (losses) on investments are allocated daily to each class of shares based on the relative proportion of net assets of each class.
3. FAIR VALUATION MEASUREMENTS
Fair value measurements of investments are determined within a framework that has established a fair value hierarchy based upon the various data inputs utilized in determining the value of the Fund’s investments. The three-level hierarchy gives the highest priority to unadjusted quoted prices in active markets for identical assets or liabilities (Level 1) and the lowest priority to significant unobservable inputs (Level 3). The Fund’s investments are classified within the fair value hierarchy based on the lowest level of input that is significant to the fair value measurement. The inputs are summarized into three broad levels as follows:
| ∎ | | Level 1 – quoted prices in active markets for identical securities |
| ∎ | | Level 2 – other significant observable inputs (including quoted prices for similar securities, interest rates, prepayment speeds, credit risk, use of amortized cost, etc.) |
| ∎ | | Level 3 – significant unobservable inputs (including the Fund’s own assumptions in determining the fair value of investments) |
The inputs or methodologies used for valuing investments in securities are not necessarily an indication of the risk associated with investing in those securities.
| | | | | | |
| Notes to financial statements (unaudited) | | Wells Fargo Small Cap Core Fund | | | 21 | |
The following is a summary of the inputs used in valuing the Fund’s assets and liabilities as of December 31, 2016:
| | | | | | | | | | | | | | | | |
| | | Quoted prices
(Level 1) | | | Other significant
observable inputs
(Level 2) | | | Significant
unobservable inputs (Level 3) | | | Total | |
Assets | | | | | | | | | | | | | | | | |
Investments in: | | | | | | | | | | | | | | | | |
| | | | |
Common stocks | | | | | | | | | | | | | | | | |
Consumer discretionary | | $ | 9,332,768 | | | $ | 0 | | | $ | 0 | | | $ | 9,332,768 | |
Consumer staples | | | 3,336,597 | | | | 0 | | | | 0 | | | | 3,336,597 | |
Energy | | | 1,434,731 | | | | 0 | | | | 0 | | | | 1,434,731 | |
Financials | | | 15,532,550 | | | | 0 | | | | 0 | | | | 15,532,550 | |
Health care | | | 15,428,003 | | | | 0 | | | | 0 | | | | 15,428,003 | |
Industrials | | | 17,150,154 | | | | 0 | | | | 0 | | | | 17,150,154 | |
Information technology | | | 17,798,460 | | | | 0 | | | | 0 | | | | 17,798,460 | |
Materials | | | 4,494,698 | | | | 0 | | | | 0 | | | | 4,494,698 | |
Real estate | | | 5,969,178 | | | | 0 | | | | 0 | | | | 5,969,178 | |
Utilities | | | 1,139,068 | | | | 0 | | | | 0 | | | | 1,139,068 | |
| | | | |
Short-term investments | | | | | | | | | | | 0 | | | | | |
Investment companies | | | 541,406 | | | | 0 | | | | 0 | | | | 541,406 | |
Total assets | | $ | 92,157,613 | | | $ | 0 | | | $ | 0 | | | $ | 92,157,613 | |
The Fund recognizes transfers between levels within the fair value hierarchy at the end of the reporting period. At December 31, 2016, the Fund did not have any transfers into/out of Level 1, Level 2, or Level 3.
4. TRANSACTIONS WITH AFFILIATES
Management fee
Funds Management, an indirect wholly owned subsidiary of Wells Fargo & Company (“Wells Fargo”), is the manager of the Fund and provides advisory and fund-level administrative services under an investment management agreement. Under the investment management agreement, Funds Management is responsible for, among other services, implementing the investment objectives and strategies of the Fund, supervising the subadviser, providing fund-level administrative services in connection with the Fund’s operations, and providing any other fund-level administrative services reasonably necessary for the operation of the Fund. As compensation for its services under the investment management agreement, Funds Management is entitled to receive an annual management fee starting at 0.85% and declining to 0.71% as the average daily net assets of the Fund increase. For the six months ended December 31, 2016, the management fee was equivalent to an annual rate of 0.85% of the Fund’s average daily net assets.
Funds Management has retained the services of a subadviser to provide daily portfolio management to the Fund. The fee for subadvisory services is borne by Funds Management. Golden Capital Management, LLC, an affiliate of Funds Management, is the subadviser to the Fund and is entitled to receive a fee from Funds Management at an annual rate starting at 0.55% and declining to 0.45% as the average daily net assets of the Fund increase.
Administration fees
Under a class-level administration agreement, Funds Management provides class-level administrative services to the Fund, which includes paying fees and expenses for services provided by the transfer agent, sub-transfer agents, omnibus account servicers and record-keepers. As compensation for its services under the class-level administration agreement, Funds Management receives an annual fee which is calculated based on the average daily net assets of each class as follows:
| | | | |
| | | Class-level
administration fee | |
Class A, Class C | | | 0.21 | % |
Class R6 | | | 0.03 | |
Administrator Class, Institutional Class | | | 0.13 | |
Funds Management has contractually waived and/or reimbursed management and administration fees to the extent necessary to maintain certain net operating expense ratios for the Fund. Waiver of fees and/or reimbursement of expenses by Funds Management were made first from fund level expenses on a proportionate basis and then from class
| | | | |
| 22 | | Wells Fargo Small Cap Core Fund | | Notes to financial statements (unaudited) |
specific expenses. Funds Management has committed through July 31, 2019 to waive fees and/or reimburse expenses to the extent necessary to cap the Fund’s expenses at 1.35% for Class A shares, 2.10% for Class C shares, 0.90% for Class R6 shares, 1.25% for Administrator Class, and 1.00% for Institutional Class shares. After this time, the cap may be increased or the commitment to maintain the cap may be terminated only with the approval of the Board of Trustees.
Distribution fee
The Trust has adopted a distribution plan for Class C shares of the Fund pursuant to Rule 12b-1 under the 1940 Act. A distribution fee is charged to Class C shares and paid to Wells Fargo Funds Distributor, LLC (“Funds Distributor”), the principal underwriter, at an annual rate of 0.75% of the average daily net assets of Class C shares.
In addition, funds Distributor is also entitled to receive the front-end sales charge from the purchase of Class A shares and a contingent deferred sales charge on the redemption of certain Class A shares. Funds Distributor is also entitled to receive the contingent deferred sales charges from redemptions of Class C shares.
Shareholder servicing fees
The Trust has entered into contracts with one or more shareholder servicing agents, whereby Class A, Class C, and Administrator Class of the Fund are charged a fee at an annual rate of 0.25% of the average daily net assets of each respective class.
A portion of these total shareholder servicing fees were paid to affiliates of Wells Fargo.
5. INVESTMENT PORTFOLIO TRANSACTIONS
Purchases and sales of investments, excluding U.S. government obligations (if any) and short-term securities, for the six months ended December 31, 2016 were $13,841,773 and $52,209,503, respectively.
The Fund may purchase or sell investment securities to other Wells Fargo funds under procedures adopted by the Board of Trustees. The procedures have been designed to ensure that these interfund transactions, which generally do not incur broker commissions, are effected at current market prices. Interfund trades are included within the respective purchases and sales amounts shown.
6. BANK BORROWINGS
The Trust (excluding the money market funds and certain other funds) and Wells Fargo Variable Trust are parties to a $250,000,000 revolving credit agreement whereby the Fund is permitted to use bank borrowings for temporary or emergency purposes, such as to fund shareholder redemption requests. Interest under the credit agreement is charged to the Fund based on a borrowing rate equal to the higher of the Federal Funds rate in effect on that day plus 1.25% or the overnight LIBOR rate in effect on that day plus 1.25%. In addition, an annual commitment fee equal to 0.25% of the unused balance is allocated to each participating fund. Prior to August 30, 2016, the revolving credit agreement amount was $200,000,000 and the annual commitment fee was equal to 0.20% of the unused balance which was allocated to each participating fund.
For the six months ended December 31, 2016, there were no borrowings by the Fund under the agreement.
7. INDEMNIFICATION
Under the Trust’s organizational documents, the officers and Trustees have been granted certain indemnification rights against certain liabilities that may arise out of performance of their duties to the Trust. Additionally, in the normal course of business, the Trust may enter into contracts with service providers that contain a variety of indemnification clauses. The Trust’s maximum exposure under these arrangements is dependent on future claims that may be made against the Fund and, therefore, cannot be estimated.
8. REGULATORY CHANGES
In October 2016, the Securities and Exchange Commission (“SEC”) adopted new rules and forms and amended existing rules and forms (together, “final rules”) intended to modernize and enhance the reporting and disclosure of information by registered investment companies and to enhance liquidity risk management by open-end mutual funds and exchange-traded funds. The final rules will enhance the quality of information available to investors and will allow the SEC to more effectively collect and use data reported by funds. In part, the final rules amend Regulation S-X and require standardized, enhanced disclosure about derivatives in the Fund’s financial statements, as well as other amendments. The compliance date for the amendments to Regulation S-X is August 1, 2017 while the compliance date for the new form types is June 1, 2018 and the compliance date for the liquidity risk management program requirements is December 1, 2018. Management is currently assessing the potential impact of these enhancements and their impact on the financial statement disclosures and reporting requirements.
| | | | | | |
| Other information (unaudited) | | Wells Fargo Small Cap Core Fund | | | 23 | |
PROXY VOTING INFORMATION
A description of the policies and procedures that the Fund uses to determine how to vote proxies relating to portfolio securities is available, upon request, by calling 1-800-222-8222, visiting our website at wellsfargofunds.com, or visiting the SEC website at sec.gov. Information regarding how the Fund voted proxies relating to portfolio securities during the most recent 12-month period ended June 30 is available on the Fund’s website at wellsfargofunds.com or by visiting the SEC website at sec.gov.
PORTFOLIO HOLDINGS INFORMATION
The complete portfolio holdings for the Fund are publicly available monthly on the Fund’s website (wellsfargofunds.com), on a one-month delayed basis. In addition, top ten holdings information (excluding derivative positions) for the Fund is publicly available on the Fund’s website on a monthly, seven-day or more delayed basis. The Fund files its complete schedule of portfolio holdings with the SEC for the first and third quarters of each fiscal year on Form N-Q, which is available by visiting the SEC website at sec.gov. In addition, the Fund’s Form N-Q may be reviewed and copied at the SEC’s Public Reference Room in Washington, DC, and at regional offices in New York City, at 233 Broadway, and in Chicago, at 175 West Jackson Boulevard, Suite 900. Information about the Public Reference Room may be obtained by calling 1-800-SEC-0330.
| | | | |
| 24 | | Wells Fargo Small Cap Core Fund | | Other information (unaudited) |
BOARD OF TRUSTEES AND OFFICERS
Each of the Trustees and Officers1 listed in the table below acts in identical capacities for each fund in the Wells Fargo family of funds, which consists of 139 mutual funds comprising the Wells Fargo Funds Trust, Wells Fargo Variable Trust, Wells Fargo Master Trust and four closed-end funds (collectively the “Fund Complex”). This table should be read in conjunction with the Prospectus and the Statement of Additional Information2. The mailing address of each Trustee and Officer is 525 Market Street, 12th Floor, San Francisco, CA 94105. Each Trustee and Officer serves an indefinite term, however, each Trustee serves such term until reaching the mandatory retirement age established by the Trustees.
Independent Trustees
| | | | | | |
Name and year of birth | | Position held and length of service* | | Principal occupations during past five years or longer | | Current other public company or investment company directorships |
| William R. Ebsworth (Born 1957) | | Trustee, since 2015 | | Retired. From 1984 to 2013, equities analyst, portfolio manager, research director and chief financial officer at Fidelity Management and Research Company in Boston, Tokyo, and Hong Kong and retired in 2013 as Chief Investment Officer of Fidelity Strategic Advisers, Inc. where he lead a team of investment professionals managing client assets. Prior thereto, Board member of Hong Kong Securities Clearing Co., Hong Kong Options Clearing Corp., the Thailand International Fund, Ltd., Fidelity Investments Life Insurance Company, and Empire Fidelity Investments Life Insurance Company. Board member of the Fonté Foundation (non-profit organization) and the Vincent Memorial Hospital Endowment (non-profit organization), where he serves on the Investment Committee and as a Chair of the Audit Committee. Mr. Ebsworth is a CFA® charterholder and an Adjunct Lecturer, Finance, at Babson College. | | Asset Allocation Trust |
| Jane A. Freeman (Born 1953) | | Trustee, since 2015 | | Retired. From 2012 to 2014 and 1999 to 2008, Chief Financial Officer of Scientific Learning Corporation. From 2008 to 2012, Ms. Freeman provided consulting services related to strategic business projects. Prior to 1999, Portfolio Manager at Rockefeller & Co. and Scudder, Stevens & Clark. Board member of the Harding Loevner Funds from 1996 to 2014, serving as both Lead Independent Director and chair of the Audit Committee. Board member of the Russell Exchange Traded Funds Trust from 2011 to 2012 and the chair of the Audit Committee. Ms. Freeman is a Board Member of Ruth Bancroft Garden (non-profit organization) and an inactive chartered financial analyst. | | Asset Allocation Trust |
Peter G. Gordon**
(Born 1942) | | Trustee, since 1998; Chairman, since 2005 | | Co-Founder, Retired Chairman, President and CEO of Crystal Geyser Water Company. Trustee Emeritus, Colby College. | | Asset Allocation Trust |
| Isaiah Harris, Jr. (Born 1952) | | Trustee, since 2009 | | Retired. Chairman of the Board of CIGNA Corporation since 2009, and Director since 2005. From 2003 to 2011, Director of Deluxe Corporation. Prior thereto, President and CEO of BellSouth Advertising and Publishing Corp. from 2005 to 2007, President and CEO of BellSouth Enterprises from 2004 to 2005 and President of BellSouth Consumer Services from 2000 to 2003. Emeritus member of the Iowa State University Foundation Board of Governors. Emeritus Member of the Advisory Board of Iowa State University School of Business. Advisory Board Member, Palm Harbor Academy (charter school). Advisory Board Member, Child Evangelism Fellowship (non-profit). Mr. Harris is a certified public accountant (inactive status). | | CIGNA Corporation; Asset Allocation Trust |
Judith M. Johnson
(Born 1949) | | Trustee, since 2008; Audit Committee Chairman, since 2008 | | Retired. Prior thereto, Chief Executive Officer and Chief Investment Officer of Minneapolis Employees Retirement Fund from 1996 to 2008. Ms. Johnson is an attorney, certified public accountant and a certified managerial accountant. | | Asset Allocation Trust |
| David F. Larcker (Born 1950) | | Trustee, since 2009 | | James Irvin Miller Professor of Accounting at the Graduate School of Business, Stanford University, Director of the Corporate Governance Research Initiative and Senior Faculty of The Rock Center for Corporate Governance since 2006. From 2005 to 2008, Professor of Accounting at the Graduate School of Business, Stanford University. Prior thereto, Ernst & Young Professor of Accounting at The Wharton School, University of Pennsylvania from 1985 to 2005. | | Asset Allocation Trust |
| | | | | | |
| Other information (unaudited) | | Wells Fargo Small Cap Core Fund | | | 25 | |
| | | | | | |
Name and year of birth | | Position held and length of service* | | Principal occupations during past five years or longer | | Current other public company or investment company directorships |
| Olivia S. Mitchell (Born 1953) | | Trustee, since 2006 | | International Foundation of Employee Benefit Plans Professor, Wharton School of the University of Pennsylvania since 1993. Director of Wharton’s Pension Research Council and Boettner Center on Pensions & Retirement Research, and Research Associate at the National Bureau of Economic Research. Previously, Cornell University Professor from 1978 to 1993. | | Asset Allocation Trust |
| Timothy J. Penny (Born 1951) | | Trustee, since 1996 | | President and Chief Executive Officer of Southern Minnesota Initiative Foundation, a non-profit organization, since 2007 and Senior Fellow at the Humphrey Institute Policy Forum at the University of Minnesota since 1995. Member of the Board of Trustees of NorthStar Education Finance, Inc., a non-profit organization, since 2007. | | Asset Allocation Trust |
Michael S. Scofield (Born 1943) | | Trustee, since 2010 | | Served on the Investment Company Institute’s Board of Governors and Executive Committee from 2008-2011 as well the Governing Council of the Independent Directors Council from 2006-2011 and the Independent Directors Council Executive Committee from 2008-2011. Chairman of the IDC from 2008-2010. Institutional Investor (Fund Directions) Trustee of Year in 2007. Trustee of the Evergreen Funds complex (and its predecessors) from 1984 to 2010. Chairman of the Evergreen Funds from 2000-2010. Former Trustee of the Mentor Funds. Retired Attorney, Law Offices of Michael S. Scofield. | | Asset Allocation Trust |
| * | Length of service dates reflect the Trustee’s commencement of service with the Trust’s predecessor entities, where applicable. |
| ** | Peter Gordon is expected to retire on December 31, 2017. |
Officers
| | | | | | |
Name and year of birth | | Position held and
length of service | | Principal occupations during past five years or longer | | |
| Andrew Owen3 (Born 1960) | | President, since 2017 | | Executive Vice President of Wells Fargo Bank, N.A. and President of Wells Fargo & Company and Head of Affiliated Managaers, Wells Fargo Asset Management, since 2014. Executive Vice President responsible for marketing, investments and product development for Wells Fargo Funds Management, LLC, from 2009 to 2014. | | |
| Nancy Wiser1 (Born 1967) | | Treasurer, since 2012 | | Executive Vice President of Wells Fargo Funds Management, LLC since 2011. Chief Operating Officer and Chief Compliance Officer at LightBox Capital Management LLC, from 2008 to 2011. | | |
| C. David Messman (Born 1960) | | Secretary, since 2000; Chief Legal Officer, since 2003 | | Senior Vice President and Secretary of Wells Fargo Funds Management, LLC since 2001. Assistant General Counsel of Wells Fargo Bank, N.A. since 2013 and Vice President and Managing Counsel of Wells Fargo Bank, N.A. from 1996 to 2013. | | |
Michael Whitaker
(Born 1967) | | Chief Compliance Officer, since 2016 | | Executive Vice President of Wells Fargo Funds Management, LLC since 2016. Chief Compliance Officer of Fidelity’s Fixed Income Funds and Asset Allocation Funds from 2008 to 2016, Compliance Officer of FMR Co., Inc. from 2014 to 2016, Fidelity Investments Money Management, Inc. from 2014 to 2016, Fidelity Investments from 2007 to 2016. | | |
| David Berardi (Born 1975) | | Assistant Treasurer, since 2009 | | Vice President of Wells Fargo Funds Management, LLC since 2009. Vice President of Evergreen Investment Management Company, LLC from 2008 to 2010. Manager of Fund Reporting and Control for Evergreen Investment Management Company, LLC from 2004 to 2010. | | |
Jeremy DePalma1
(Born 1974) | | Assistant Treasurer, since 2009 | | Senior Vice President of Wells Fargo Funds Management, LLC since 2009. Senior Vice President of Evergreen Investment Management Company, LLC from 2008 to 2010 and head of the Fund Reporting and Control Team within Fund Administration from 2005 to 2010. | | |
| 1 | Nancy Wiser acts as Treasurer of 70 funds in the Fund Complex. Jeremy DePalma acts as Treasurer of 69 funds and Assistant Treasurer of 70 funds in the Fund Complex. |
| 2 | The Statement of Additional Information includes additional information about the Trustees and is available, without charge, upon request, by calling 1-800-222-8222 or by visiting the website at wellsfargofunds.com. |
| 3 | Andrew Owen became President on January 1, 2017. |
| | | | |
| 26 | | Wells Fargo Small Cap Core Fund | | List of abbreviations |
The following is a list of common abbreviations for terms and entities that may have appeared in this report.
| ACA | — ACA Financial Guaranty Corporation |
| ADR | — American depositary receipt |
| ADS | — American depositary shares |
| AGC | — Assured Guaranty Corporation |
| AGM | — Assured Guaranty Municipal |
| Ambac | — Ambac Financial Group Incorporated |
| AMT | — Alternative minimum tax |
| BAN | — Bond anticipation notes |
| BHAC | — Berkshire Hathaway Assurance Corporation |
| CAB | — Capital appreciation bond |
| CCAB | — Convertible capital appreciation bond |
| CDA | — Community Development Authority |
| CDO | — Collateralized debt obligation |
| DRIVER | — Derivative inverse tax-exempt receipts |
| DW&P | — Department of Water & Power |
| DWR | — Department of Water Resources |
| ECFA | — Educational & Cultural Facilities Authority |
| EDA | — Economic Development Authority |
| EDFA | — Economic Development Finance Authority |
| ETF | — Exchange-traded fund |
| FDIC | — Federal Deposit Insurance Corporation |
| FFCB | — Federal Farm Credit Banks |
| FGIC | — Financial Guaranty Insurance Corporation |
| FHA | — Federal Housing Administration |
| FHLB | — Federal Home Loan Bank |
| FHLMC | — Federal Home Loan Mortgage Corporation |
| FICO | — The Financing Corporation |
| FNMA | — Federal National Mortgage Association |
| GDR | — Global depositary receipt |
| GNMA | — Government National Mortgage Association |
| HCFR | — Healthcare facilities revenue |
| HEFA | — Health & Educational Facilities Authority |
| HEFAR | — Higher education facilities authority revenue |
| HFA | — Housing Finance Authority |
| HFFA | — Health Facilities Financing Authority |
| HUD | — Department of Housing and Urban Development |
| IDA | — Industrial Development Authority |
| IDAG | — Industrial Development Agency |
| KRW | — Republic of Korea won |
| LIBOR | — London Interbank Offered Rate |
| LIFER | — Long Inverse Floating Exempt Receipts |
| LLC | — Limited liability company |
| LLLP | — Limited liability limited partnership |
| LLP | — Limited liability partnership |
| MBIA | — Municipal Bond Insurance Association |
| MFHR | — Multifamily housing revenue |
| MSTR | — Municipal securities trust receipts |
| MUD | — Municipal Utility District |
| National | — National Public Finance Guarantee Corporation |
| PCFA | — Pollution Control Financing Authority |
| PCL | — Public Company Limited |
| PCR | — Pollution control revenue |
| PFA | — Public Finance Authority |
| PFFA | — Public Facilities Financing Authority |
| PFOTER | — Puttable floating option tax-exempt receipts |
| plc | — Public limited company |
| PUTTER | — Puttable tax-exempt receipts |
| R&D | — Research & development |
| Radian | — Radian Asset Assurance |
| RAN | — Revenue anticipation notes |
| RDA | — Redevelopment Authority |
| RDFA | — Redevelopment Finance Authority |
| REIT | — Real estate investment trust |
| ROC | — Reset option certificates |
| SAVRS | — Select auction variable rate securities |
| SBA | — Small Business Authority |
| SDR | — Swedish depositary receipt |
| SFHR | — Single-family housing revenue |
| SFMR | — Single-family mortgage revenue |
| SPA | — Standby purchase agreement |
| SPDR | — Standard & Poor’s Depositary Receipts |
| SPEAR | — Short Puttable Exempt Adjustable Receipts |
| STRIPS | — Separate trading of registered interest and |
| TAN | — Tax anticipation notes |
| TIPS | — Treasury inflation-protected securities |
| TRAN | — Tax revenue anticipation notes |
| TTFA | — Transportation Trust Fund Authority |
| TVA | — Tennessee Valley Authority |
This page is intentionally left blank.
This page is intentionally left blank.

For more information
More information about Wells Fargo Funds is available free upon request. To obtain literature, please write, email, visit the Fund’s website, or call:
Wells Fargo Funds
P.O. Box 8266
Boston, MA 02266-8266
Email: fundservice@wellsfargo.com
Website: wellsfargofunds.com
Individual investors: 1-800-222-8222
Retail investment professionals: 1-888-877-9275
Institutional investment professionals: 1-866-765-0778
This report and the financial statements contained herein are submitted for the general information of the shareholders of the Fund. If this report is used for promotional purposes, distribution of the report must be accompanied or preceded by a current prospectus. Before investing, please consider the investment objectives, risks, charges, and expenses of the investment. For a current prospectus and, if available, a summary prospectus, containing this information, call 1-800-222-8222 or visit the Fund’s website at wellsfargofunds.com. Read the prospectus carefully before you invest or send money.
Wells Fargo Asset Management (WFAM) is a trade name used by the asset management businesses of Wells Fargo & Company. Wells Fargo Funds Management, LLC, a wholly owned subsidiary of Wells Fargo & Company, provides investment advisory and administrative services for Wells Fargo Funds. Other affiliates of Wells Fargo & Company provide subadvisory and other services for the funds. The funds are distributed by Wells Fargo Funds Distributor, LLC, Member FINRA, an affiliate of Wells Fargo & Company. Neither Wells Fargo Funds Management nor Wells Fargo Funds Distributor has Fund customer accounts/assets, and neither provides investment advice/recommendations or acts as an investment advice fiduciary to any investor.
NOT FDIC INSURED ◾ NO BANK GUARANTEE ◾ MAY LOSE VALUE
© 2016 Wells Fargo Funds Management, LLC. All rights reserved.
| | |
 | | 300486 02-17 SA269/SAR269 12-16 |
Semi-Annual Report
December 31, 2016

Wells Fargo Strategic Municipal Bond Fund


Reduce clutter. Save trees.
Sign up for electronic delivery of prospectuses and shareholder reports at wellsfargo.com/advantagedelivery
Contents
The views expressed and any forward-looking statements are as of December 31, 2016, unless otherwise noted, and are those of the Fund managers and/or Wells Fargo Funds Management, LLC. Discussions of individual securities, or the markets generally, or any Wells Fargo Fund are not intended as individual recommendations. Future events or results may vary significantly from those expressed in any forward-looking statements. The views expressed are subject to change at any time in response to changing circumstances in the market. Wells Fargo Funds Management, LLC and the Fund disclaim any obligation to publicly update or revise any views expressed or forward-looking statements.
NOT FDIC INSURED ◾ NO BANK GUARANTEE ◾ MAY LOSE VALUE
| | | | |
| 2 | | Wells Fargo Strategic Municipal Bond Fund | | Letter to shareholders (unaudited) |

Andrew Owen
President
Wells Fargo Funds
The Bloomberg Barclays Municipal Bond Index,1 a broad measure tracking investment-grade municipal bonds, lost 3.91% during the six-month reporting period.
Dear Shareholder:
As the new president of Wells Fargo Funds now that Karla Rabusch is retiring from that position after nearly 14 years, I am pleased to offer you this semi-annual report for the Wells Fargo Strategic Municipal Bond Fund for the six-month period that ended December 31, 2016. The Federal Reserve (Fed) raised the federal funds rate in December by 0.25%. Municipal bond yields rose sharply in the fourth quarter. The Bloomberg Barclays Municipal Bond Index,1 a broad measure tracking investment-grade municipal bonds, lost 3.91% during the six-month reporting period.
Municipal bond yields rose during the reporting period.
The municipal market reversed course in the second half of 2016, with yields increasing and prices declining. Initially the sell-off was driven by negative supply and demand trends, also known as technical factors. By the fourth quarter, fund flows turned negative (reversing a trend of 54 weeks of positive flows) and municipal bond supply increased. These deteriorating technical factors, along with the expectation of an expansionary fiscal policy and lower tax rates under the new administration, drove market volatility; credit spreads widened and the yield curve steepened as the market sold-off.
Stronger economic indicators drove monetary policy.
On December 14, the Fed hiked the short-term interest rate by 0.25% to reach a target range of 0.50% to 0.75%. This was the second rate increase in more than 10 years, with the Fed citing job gains and lower than expected unemployment of 4.6%. The Fed confirmed the continuation of an accommodative monetary policy to support a stronger labor market and reiterated its long-term objective of a 2% inflation rate, which increased slightly during the fourth quarter but fell short of the benchmark. The Fed expressed confidence in the economy’s progress and expects this positive trajectory to continue. Both sentiments helped to bolster the Fed’s expectation of three additional rate increases during 2017.
Meanwhile, the Bank of England continued its quantitative easing program and lowered the official bank rate to 0.25% in August 2016. The Bank of Japan maintained its negative interest rate put in place earlier in the year, and in September announced an interest rate target for 10-year government bonds—keeping the yield at zero—as it struggles to accelerate economic growth. In December, the European Central Bank announced that it will extend its quantitative-easing program and continue purchasing large amounts of eurozone corporate and government debt each month through December 2017.
U.S. economic data released during the fourth quarter showed that U.S. real gross domestic product increased at an annual 3.5% rate in the third quarter, the largest increase since mid-2014. Business investment by U.S. companies was mixed, with a 12.0% increase in structures and 4.5% decrease in equipment over the prior quarter on an annualized basis. Consumer confidence hit pre-recession levels for the first time in November, and increased again in December. The dollar strengthened during the quarter’s post-election period.
Supply and demand trends reflected volatility of municipals.
Demand for municipal debt, as measured by cash flows to municipal bond mutual funds, was negative for the reporting period. There were $19 billion of inflows from July through October, but a sharp reversal occurred post-election, with $26 billion of redemptions in the last two months of the year. This followed a
| 1 | The Bloomberg Barclays Municipal Bond Index (formerly known as Barclays Municipal Bond Index) is an unmanaged index composed of long-term tax-exempt bonds with a minimum credit rating of Baa. You cannot invest directly in an index. |
| | | | | | |
| Letter to shareholders (unaudited) | | Wells Fargo Strategic Municipal Bond Fund | | | 3 | |
noteworthy 54 consecutive weeks of inflows. On the supply side, August through October saw 30-year record-breaking volumes each month; both refundings and new issuance were up. These levels were attributed to deals pulled forward in anticipation of higher interest rates. Not surprisingly, December volume was down 25% year-over-year to $19 billion. Total municipal bond issuance for the period was $219 billion; new issuance outpaced refundings by $18 billion.
Municipal credit fundamentals were solid.
Overall, municipal credit was sound for the period. The most significant development was the election of Ricardo Rossello as governor of the Commonwealth of Puerto Rico. In the past, prices of Puerto Rico bonds reflected negative credit considerations, including defaults on its securities in 2015 and early 2016, but recent events point to a potentially more positive fiscal environment. Rossello campaigned, in part, on a platform that included promises to ultimately pay 100% of interest due on Puerto Rico’s outstanding municipal debt, negotiate with bondholders, and ration government expenditures. This stance is a major shift from his predecessor who focused on a bankruptcy mechanism.
Since the end of the financial crisis, structural changes in the fixed-income markets have reduced trading liquidity (the degree to which assets can be bought or sold without affecting the price). New regulations and capital requirements have caused traditional liquidity suppliers (banks and broker/dealers) to be more risk averse and hold less inventory. Meanwhile, corporate debt issuance has spiked as companies finance themselves at record-low yields, bond mutual funds hold larger amounts of this new debt supply, trading volumes are lower, and large-size trades are more difficult to execute. However, fixed-income markets appeared to function well over the past year with sufficient liquidity.
Don’t let short-term uncertainty derail long-term investment goals.
Periods of uncertainty can present challenges, but experience has taught us that maintaining long-term investment goals can be an effective way to plan for the future. To help you create a sound strategy based on your personal goals and risk tolerance, Wells Fargo Funds offers more than 100 mutual funds spanning a wide range of asset classes and investment styles. Although diversification cannot guarantee an investment profit or prevent losses, we believe it can be an effective way to manage investment risk and potentially smooth out overall portfolio performance. We encourage investors to know their investments and to understand that appropriate levels of risk-taking may unlock opportunities.
Thank you for choosing to invest in Wells Fargo Funds. We appreciate your confidence in us and remain committed to helping you meet your financial needs.
Sincerely,

Andrew Owen
President
Wells Fargo Funds
Periods of uncertainty can present challenges, but experience has taught us that maintaining long-term investment goals can be an effective way to plan for the future.
For further information about your Fund, contact your investment professional, visit our website at wellsfargofunds.com, or call us directly at 1-800-222-8222. We are available 24 hours a day, 7 days a week.
| | | | |
| 4 | | Wells Fargo Strategic Municipal Bond Fund | | Performance highlights (unaudited) |
Investment objective
The Fund seeks current income exempt from regular federal income tax.
Manager
Wells Fargo Funds Management, LLC
Subadviser
Wells Capital Management Incorporated
Portfolio managers
Wendy Casetta
Lyle J. Fitterer, CFA®, CPA
Robert J. Miller
Average annual total returns (%) as of December 31, 20161
| | | | | | | | | | | | | | | | | | | | | | | | | | | | | | | | | | |
| | | | | Including sales charge | | | Excluding sales charge | | | Expense ratios2 (%) | |
| | | Inception date | | 1 year | | | 5 year | | | 10 year | | | 1 year | | | 5 year | | | 10 year | | | Gross | | | Net3 | |
| Class A (VMPAX) | | 12-1-1994 | | | (3.61 | ) | | | 1.42 | | | | 2.42 | | | | 0.36 | | | | 2.26 | | | | 2.84 | | | | 0.82 | | | | 0.82 | |
| Class B (VMPIX)* | | 3-21-1985 | | | (5.32 | ) | | | 1.09 | | | | 2.31 | | | | (0.40 | ) | | | 1.47 | | | | 2.31 | | | | 1.57 | | | | 1.57 | |
| Class C (DHICX) | | 8-18-1997 | | | (1.39 | ) | | | 1.49 | | | | 2.07 | | | | (0.39 | ) | | | 1.49 | | | | 2.07 | | | | 1.57 | | | | 1.57 | |
| Administrator Class (VMPYX) | | 10-6-1997 | | | – | | | | – | | | | – | | | | 0.48 | | | | 2.37 | | | | 3.02 | | | | 0.76 | | | | 0.69 | |
| Institutional Class (STRIX) | | 11-30-2012 | | | – | | | | – | | | | – | | | | 0.69 | | | | 2.56 | | | | 3.11 | | | | 0.49 | | | | 0.49 | |
| Bloomberg Barclays Short-Intermediate Municipal Bond Index4 | | – | | | – | | | | – | | | | – | | | | (0.15 | ) | | | 1.79 | | | | 3.48 | | | | – | | | | – | |
| * | | Class B shares are closed to investment, except in connection with the reinvestment of any distributions and permitted exchanges. |
Figures quoted represent past performance, which is no guarantee of future results, and do not reflect taxes that a shareholder may pay on fund distributions or the redemption of fund shares. Investment return and principal value of an investment will fluctuate so that an investor’s shares, when redeemed, may be worth more or less than their original cost. Performance shown without sales charges would be lower if sales charges were reflected. Current performance may be lower or higher than the performance data quoted, which assumes the reinvestment of dividends and capital gains. Current month-end performance is available on the Fund’s website, wellsfargofunds.com.
Index returns do not include transaction costs associated with buying and selling securities, any mutual fund fees or expenses, or any taxes. It is not possible to invest directly in an index.
For Class A shares, the maximum front-end sales charge is 4.00%. For Class B shares, the maximum contingent deferred sales charge is 5.00%. For Class C shares, the maximum contingent deferred sales charge is 1.00%. Performance including a contingent deferred sales charge assumes the sales charge for the corresponding time period. Administrator Class and Institutional Class shares are sold without a front-end sales charge or contingent deferred sales charge.
Bond values fluctuate in response to the financial condition of individual issuers, general market and economic conditions, and changes in interest rates. Changes in market conditions and government policies may lead to periods of heightened volatility in the bond market and reduced liquidity for certain bonds held by the Fund. In general, when interest rates rise, bond values fall and investors may lose principal value. Interest-rate changes and their impact on the Fund and its share price can be sudden and unpredictable. High-yield securities have a greater risk of default and tend to be more volatile than higher-rated debt securities. The use of derivatives may reduce returns and/or increase volatility. Certain investment strategies tend to increase the total risk of an investment (relative to the broader market). The Fund is exposed to municipal securities risk. Consult the Fund’s prospectus for additional information on these and other risks. A portion of the Fund’s income may be subject to federal, state, and/or local income taxes or the Alternative Minimum Tax (AMT). Any capital gains distributions may be taxable.
Please see footnotes on page 5.
| | | | | | |
| Performance highlights (unaudited) | | Wells Fargo Strategic Municipal Bond Fund | | | 5 | |
|
| Effective maturity distribution as of December 31, 20165 |
|
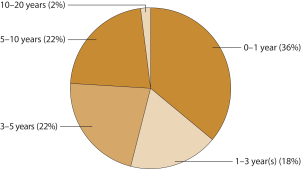
|
|
| Credit quality as of December 31, 20166 |
|
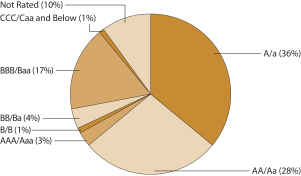 |
| 1 | Historical performance shown for the Institutional Class shares prior to their inception reflects the performance of the Administrator Class shares, and includes the higher expenses applicable to the Administrator Class shares. If these expenses had not been included, returns would be higher. Historical performance shown for all classes of the Fund prior to July 12, 2010, is based on the performance of the Fund’s predecessor, Evergreen Strategic Municipal Bond Fund. |
| 2 | Reflects the expense ratios as stated in the most recent prospectuses, which include the impact of 0.01% in acquired fund fees and expenses. The expense ratios shown are subject to change and may differ from the annualized expense ratios shown in the financial highlights of this report. |
| 3 | The manager has contractually committed through October 31, 2017, to waive fees and/or reimburse expenses to the extent necessary to cap the Fund’s Total Annual Fund Operating Expenses After Fee Waiver at 0.82% for Class A, 1.57% for Class B, 1.57% for Class C, 0.68% for Administrator Class, and 0.48% for Institutional Class. After this time, the cap may be increased or the commitment to maintain the cap may be terminated only with the approval of the Board of Trustees. Brokerage commissions, stamp duty fees, interest, taxes, acquired fund fees and expenses, and extraordinary expenses are excluded from the expense cap. Without this cap, the Fund’s returns would have been lower. |
| 4 | The Bloomberg Barclays Short-Intermediate Municipal Bond Index (formerly known as Barclays Short-Intermediate Municipal Bond Index) is a rules-based, market-value-weighted index composed of publicly traded municipal bonds that cover the U.S. dollar–denominated short-term tax-exempt bond market, including state and local general obligation bonds, revenue bonds, insured bonds, and prefunded bonds. You cannot invest directly in an index. |
| 5 | Amounts are calculated based on the total investments of the Fund. These amounts are subject to change and may have changed since the date specified. |
| 6 | The credit quality distribution of portfolio holdings reflected in the chart is based on ratings from Standard & Poor’s, Moody’s Investors Service, and/ or Fitch Ratings Ltd. Credit quality ratings apply to the underlying holdings of the Fund and not to the Fund itself. The percentages of the Fund’s portfolio with the ratings depicted in the chart are calculated based on the total market value of fixed income securities held by the Fund. If a security was rated by all three rating agencies, the middle rating was utilized. If rated by two of three rating agencies, the lower rating was utilized, and if rated by one of the rating agencies, that rating was utilized. Standard & Poor’s rates the creditworthiness of bonds, ranging from AAA (highest) to D (lowest). Ratings from A to CCC may be modified by the addition of a plus (+) or minus (-) sign to show relative standing within the rating categories. Standard & Poor’s rates the creditworthiness of short-term notes from SP-1 (highest) to SP-3 (lowest). Moody’s rates the creditworthiness of bonds, ranging from Aaa (highest) to C (lowest). Ratings Aa to B may be modified by the addition of a number 1 (highest) to 3 (lowest) to show relative standing within the ratings categories. Moody’s rates the creditworthiness of short-term U.S. tax-exempt municipal securities from MIG 1/VMIG 1 (highest) to SG (lowest). Fitch rates the creditworthiness of bonds, ranging from AAA (highest) to D (lowest). Credit quality distribution is subject to change and may have changed since the date specified. |
| | | | |
| 6 | | Wells Fargo Strategic Municipal Bond Fund | | Fund expenses (unaudited) |
As a shareholder of the Fund, you incur two types of costs: (1) transaction costs, including sales charges (loads) on purchase payments and contingent deferred sales charges (if any) on redemptions and (2) ongoing costs, including management fees, distribution (12b-1) and/or shareholder servicing fees, and other Fund expenses. This example is intended to help you understand your ongoing costs (in dollars) of investing in the Fund and to compare these costs with the ongoing costs of investing in other mutual funds.
The example is based on an investment of $1,000 invested at the beginning of the six-month period and held for the entire period from July 1, 2016 to December 31, 2016.
Actual expenses
The “Actual” line of the table below provides information about actual account values and actual expenses. You may use the information in this line, together with the amount you invested, to estimate the expenses that you paid over the period. Simply divide your account value by $1,000 (for example, an $8,600 account value divided by $1,000 = 8.6), then multiply the result by the number in the “Actual” line under the heading entitled “Expenses paid during period” for your applicable class of shares to estimate the expenses you paid on your account during this period.
Hypothetical example for comparison purposes
The “Hypothetical” line of the table below provides information about hypothetical account values and hypothetical expenses based on the Fund’s actual expense ratio and an assumed rate of return of 5% per year before expenses, which is not the Fund’s actual return. The hypothetical account values and expenses may not be used to estimate the actual ending account balance or expenses you paid for the period. You may use this information to compare the ongoing costs of investing in the Fund and other funds. To do so, compare this 5% hypothetical example with the 5% hypothetical examples that appear in the shareholder reports of the other funds.
Please note that the expenses shown in the table are meant to highlight your ongoing costs only and do not reflect any transactional costs, such as sales charges (loads) and contingent deferred sales charges. Therefore, the “Hypothetical” line of the table is useful in comparing ongoing costs only and will not help you determine the relative total costs of owning different funds. In addition, if these transactional costs were included, your costs would have been higher.
| | | | | | | | | | | | | | | | |
| | | Beginning account value 7-1-2016 | | | Ending account value 12-31-2016 | | | Expenses paid during the period¹ | | | Annualized net expense ratio | |
Class A | | | | | | | | | | | | | | | | |
Actual | | $ | 1,000.00 | | | $ | 986.85 | | | $ | 4.00 | | | | 0.80 | % |
Hypothetical (5% return before expenses) | | $ | 1,000.00 | | | $ | 1,021.11 | | | $ | 4.06 | | | | 0.80 | % |
Class B | | | | | | | | | | | | | | | | |
Actual | | $ | 1,000.00 | | | $ | 981.95 | | | $ | 7.72 | | | | 1.55 | % |
Hypothetical (5% return before expenses) | | $ | 1,000.00 | | | $ | 1,017.34 | | | $ | 7.86 | | | | 1.55 | % |
Class C | | | | | | | | | | | | | | | | |
Actual | | $ | 1,000.00 | | | $ | 983.18 | | | $ | 7.73 | | | | 1.55 | % |
Hypothetical (5% return before expenses) | | $ | 1,000.00 | | | $ | 1,017.34 | | | $ | 7.86 | | | | 1.55 | % |
Administrator Class | | | | | | | | | | | | | | | | |
Actual | | $ | 1,000.00 | | | $ | 986.32 | | | $ | 3.40 | | | | 0.68 | % |
Hypothetical (5% return before expenses) | | $ | 1,000.00 | | | $ | 1,021.72 | | | $ | 3.46 | | | | 0.68 | % |
Institutional Class | | | | | | | | | | | | | | | | |
Actual | | $ | 1,000.00 | | | $ | 988.49 | | | $ | 2.35 | | | | 0.47 | % |
Hypothetical (5% return before expenses) | | $ | 1,000.00 | | | $ | 1,022.77 | | | $ | 2.39 | | | | 0.47 | % |
| 1 | Expenses paid is equal to the annualized net expense ratio of each class multiplied by the average account value over the period, multiplied by the number of days in the most recent fiscal half-year divided by the number of days in the fiscal year (to reflect the one-half-year period). |
| | | | | | |
| Portfolio of investments—December 31, 2016 (unaudited) | | Wells Fargo Strategic Municipal Bond Fund | | | 7 | |
| | | | | | | | | | | | | | | | |
| Security name | | Interest rate | | | Maturity date | | | Principal | | | Value | |
| | | | |
Municipal Obligations: 98.71% | | | | | | | | | | | | | | | | |
| | | | |
| Alabama: 1.62% | | | | | | | | | | | | | | | | |
Alabama Black Belt Energy Gas District Series A (Utilities Revenue, Royal Bank of Canada LIQ) ± | | | 4.00 | % | | | 7-1-2046 | | | $ | 18,825,000 | | | $ | 20,064,250 | |
Birmingham AL Special Care Facilities Ascension Senior Credit Group Series C-1 (Health Revenue) ± | | | 1.85 | | | | 11-15-2046 | | | | 4,725,000 | | | | 4,530,424 | |
Jefferson County AL Series A (GO Revenue) | | | 4.90 | | | | 4-1-2021 | | | | 5,325,000 | | | | 5,545,934 | |
| | | | |
| | | | | | | | | | | | | | | 30,140,608 | |
| | | | | | | | | | | | | | | | |
| | | | |
| Alaska: 0.42% | | | | | | | | | | | | | | | | |
Alaska Housing Finance Corporation Home Mortgage Series A MFHR (Housing Revenue, Bank of Tokyo-Mitsubishi SPA) ø | | | 0.69 | | | | 12-1-2040 | | | | 500,000 | | | | 500,000 | |
Alaska Industrial Development & Export Authority Power Refunding Bonds Snettisham Hydroelectric Project Series 2015 (Utilities Revenue) | | | 5.00 | | | | 1-1-2022 | | | | 1,200,000 | | | | 1,313,640 | |
Alaska Industrial Development & Export Authority Power Refunding Bonds Snettisham Hydroelectric Project Series 2015 (Utilities Revenue) | | | 5.00 | | | | 1-1-2023 | | | | 1,545,000 | | | | 1,702,884 | |
Valdez AK Marine Terminal BP Pipelines Project Series B (Industrial Development Revenue) | | | 5.00 | | | | 1-1-2021 | | | | 4,000,000 | | | | 4,397,880 | |
| | | | |
| | | | | | | | | | | | | | | 7,914,404 | |
| | | | | | | | | | | | | | | | |
| | | | |
| Arizona: 2.06% | | | | | | | | | | | | | | | | |
Arizona Sports & Tourism Authority Multipurpose Stadium Facility Project Series A (Tax Revenue) | | | 4.00 | | | | 7-1-2017 | | | | 900,000 | | | | 911,457 | |
Florence AZ IDA Legacy Traditional School Project (Education Revenue) | | | 4.00 | | | | 7-1-2018 | | | | 515,000 | | | | 519,264 | |
Maricopa County AZ IDA Educational Horizon Community Learning Center Project (Education Revenue) | | | 2.63 | | | | 7-1-2021 | | | | 2,500,000 | | | | 2,423,600 | |
Maricopa County AZ IDA Senior Living Facilities Christian Care Retirement Apartments Incorporated Project (Health Revenue) | | | 5.00 | | | | 1-1-2022 | | | | 1,065,000 | | | | 1,150,413 | |
Maricopa County AZ IDA Senior Living Facilities Christian Care Retirement Apartments Incorporated Project (Health Revenue) | | | 5.00 | | | | 1-1-2023 | | | | 1,120,000 | | | | 1,215,928 | |
Maricopa County AZ IDA Senior Living Facilities Christian Care Surprise Incorporated Project (Health Revenue) 144A | | | 5.00 | | | | 1-1-2026 | | | | 3,205,000 | | | | 3,023,917 | |
Navajo Nation AZ Series A (Miscellaneous Revenue) 144A | | | 4.00 | | | | 12-1-2022 | | | | 6,345,000 | | | | 6,433,069 | |
Navajo Nation AZ Tribal Utility Authority (Miscellaneous Revenue, Municipal Government Guaranty Insured) | | | 4.00 | | | | 1-1-2021 | | | | 3,026,000 | | | | 3,062,070 | |
Phoenix AZ IDA BASIS Schools Projects Series A (Education Revenue) 144A | | | 3.00 | | | | 7-1-2020 | | | | 2,300,000 | | | | 2,275,091 | |
Phoenix AZ IDA Education Facility BASIS Schools Project (Education Revenue) 144A | | | 3.00 | | | | 7-1-2020 | | | | 475,000 | | | | 469,856 | |
Phoenix AZ IDA Great Hearts Academies Project (Education Revenue) | | | 5.20 | | | | 7-1-2022 | | | | 645,000 | | | | 671,961 | |
Phoenix AZ IDA Guam Facilities Foundation Incorporated Project Series 2014 (Miscellaneous Revenue) | | | 5.00 | | | | 2-1-2017 | | | | 2,845,000 | | | | 2,848,727 | |
Phoenix AZ IDA Legacy Traditional School Project Series 2015 (Education Revenue) 144A | | | 3.00 | | | | 7-1-2020 | | | | 515,000 | | | | 501,770 | |
Pima County AZ IDA American Leadership Academy Project Series 2015 (Education Revenue) 144A | | | 4.60 | | | | 6-15-2025 | | | | 1,530,000 | | | | 1,502,016 | |
Pima County AZ IDA New Plan Learning Project Series A (Education Revenue) | | | 7.75 | | | | 7-1-2035 | | | | 1,000,000 | | | | 1,004,870 | |
Pima County AZ IDA New Plan Learning Project Series A (Education Revenue) | | | 8.13 | | | | 7-1-2041 | | | | 3,000,000 | | | | 3,033,030 | |
Pima County AZ IDA Noah Webster Schools Project Series A (Education Revenue) | | | 5.50 | | | | 12-15-2023 | | | | 1,070,000 | | | | 1,133,291 | |
Pima County AZ Industrial Development Charter School (Education Revenue) | | | 4.00 | | | | 7-1-2017 | | | | 1,125,000 | | | | 1,133,775 | |
Salt River AZ Pima Maricopa Indian Community Series 2005 (Miscellaneous Revenue, Bank of America NA LOC) ø | | | 0.73 | | | | 10-1-2025 | | | | 1,500,000 | | | | 1,500,000 | |
The accompanying notes are an integral part of these financial statements.
| | | | |
| 8 | | Wells Fargo Strategic Municipal Bond Fund | | Portfolio of investments—December 31, 2016 (unaudited) |
| | | | | | | | | | | | | | | | |
| Security name | | Interest rate | | | Maturity date | | | Principal | | | Value | |
| | | |
| Arizona (continued) | | | | | | | | | | | | | |
Tempe AZ IDA Friendship Village Series A (Health Revenue) | | | 4.00 | % | | | 12-1-2017 | | | $ | 220,000 | | | $ | 222,878 | |
Tempe AZ IDA Friendship Village Series A (Health Revenue) | | | 5.00 | | | | 12-1-2018 | | | | 800,000 | | | | 835,096 | |
Verrado AZ Community Facilities District #1 Series A (GO Revenue) 144A | | | 4.25 | | | | 7-15-2019 | | | | 1,320,000 | | | | 1,332,580 | |
Verrado AZ Community Facilities District #1 Series A (GO Revenue) 144A | | | 5.00 | | | | 7-15-2020 | | | | 700,000 | | | | 724,927 | |
Verrado AZ Community Facilities District #1 Series A (GO Revenue) 144A | | | 5.00 | | | | 7-15-2021 | | | | 500,000 | | | | 520,735 | |
| | | | |
| | | | | | | | | | | | | | | 38,450,321 | |
| | | | | | | | | | | | | | | | |
|
| Arkansas: 0.25% | |
Boone County AR Hospital Construction Series 2006 (Health Revenue, BOKF NA LOC) ø | | | 1.20 | | | | 5-1-2037 | | | | 4,700,000 | | | | 4,700,000 | |
| | | | | | | | | | | | | | | | |
|
| California: 6.56% | |
Alameda CA Corridor Transportation Authority Prerefunded CAB Sub Lien Series A (Transportation Revenue, Ambac Insured) ¤ | | | 0.00 | | | | 10-1-2017 | | | | 1,660,000 | | | | 1,646,471 | |
Alameda CA Corridor Transportation Authority Unrefunded CAB Sub Lien Series A (Transportation Revenue, Ambac Insured) ¤ | | | 0.00 | | | | 10-1-2017 | | | | 425,000 | | | | 420,763 | |
California Bay Area Toll Authority Toll Bridge Series E-3 (Transportation Revenue) ± | | | 1.42 | | | | 4-1-2047 | | | | 11,600,000 | | | | 11,599,420 | |
California CDA Tender Option Bond Trust Receipts/Certificates Series ZF0199 (Health Revenue, JPMorgan Chase & Company LIQ) 144Aø | | | 0.92 | | | | 10-1-2020 | | | | 4,805,000 | | | | 4,805,000 | |
California Golden State Tobacco Securitization Series 2954 (Tobacco Revenue, Morgan Stanley Bank LIQ) 144Aø | | | 1.27 | | | | 6-1-2047 | | | | 25,000,000 | | | | 25,000,000 | |
California Infrastructure & Economic Development Bank Colburn School Series B (Education Revenue) ± | | | 1.92 | | | | 8-1-2037 | | | | 6,325,000 | | | | 6,362,570 | |
California Infrastructure & Economic Development Bank Museum Art Project Series A (Miscellaneous Revenue) ± | | | 2.29 | | | | 12-1-2037 | | | | 3,000,000 | | | | 3,022,290 | |
California Municipal Finance Authority Charter School Nova Academy Project Series 2016A (Education Revenue) 144A | | | 4.00 | | | | 6-15-2026 | | | | 890,000 | | | | 859,339 | |
California PCFA Refunding Bond Pacific Gas & Electric Company Series D (Industrial Development Revenue, FGIC Insured) | | | 4.75 | | | | 12-1-2023 | | | | 1,515,000 | | | | 1,535,983 | |
California Refunding Bond Series B (GO Revenue) ± | | | 1.62 | | | | 5-1-2018 | | | | 3,000,000 | | | | 3,019,320 | |
California Statewide CDA Eskaton Properties Incorporated (Health Revenue) | | | 5.00 | | | | 11-15-2017 | | | | 1,130,000 | | | | 1,162,680 | |
California Statewide CDA Eskaton Properties Incorporated (Health Revenue) | | | 5.00 | | | | 11-15-2018 | | | | 1,060,000 | | | | 1,119,116 | |
California Student Education Loan Marketing Corporation Series IV-D1 (Education Revenue) | | | 5.88 | | | | 1-1-2018 | | | | 2,370,000 | | | | 2,360,567 | |
California Various Purpose Bonds (Miscellaneous Revenue) | | | 6.25 | | | | 10-1-2019 | | | | 10,000 | | | | 10,134 | |
Chemehuevi Indian Tribe California (Miscellaneous Revenue) | | | 2.00 | | | | 7-15-2017 | | | | 5,935,440 | | | | 5,926,299 | |
Compton CA Public Finance Authority Lease (Miscellaneous Revenue) 144A | | | 4.00 | | | | 9-1-2022 | | | | 4,440,000 | | | | 4,419,976 | |
Delhi CA Unified School District CAB (GO Revenue, Ambac Insured) ¤ | | | 0.00 | | | | 8-1-2019 | | | | 1,460,000 | | | | 1,329,228 | |
Golden State Tobacco Securitization Corporation California Tobacco Settlement Revenue Series A (Tobacco Revenue, AGM Insured) ¤ | | | 0.00 | | | | 6-1-2026 | | | | 8,550,000 | | | | 6,183,018 | |
Grossmont CA Union High School District Series 2015 (GO Revenue, Citibank NA LIQ) 144Aø | | | 0.87 | | | | 2-1-2017 | | | | 7,525,000 | | | | 7,525,000 | |
Northern California Gas Authority #1 LIBOR Series B (Utilities Revenue) ± | | | 1.29 | | | | 7-1-2027 | | | | 18,805,000 | | | | 16,740,023 | |
Palomar Health Refunding Bond Series 2016 (Health Revenue) | | | 3.00 | | | | 11-1-2017 | | | | 500,000 | | | | 501,820 | |
Palomar Health Refunding Bond Series 2016 (Health Revenue) | | | 4.00 | | | | 11-1-2018 | | | | 750,000 | | | | 768,075 | |
Palomar Health Refunding Bond Series 2016 (Health Revenue) | | | 4.00 | | | | 11-1-2019 | | | | 1,250,000 | | | | 1,292,488 | |
Riverside CA Tender Option Bond Trust Receipts/Certificates Series 2016 (GO Revenue, AGM/National Insured, Bank of America NA LIQ) 144Aø | | | 0.68 | | | | 8-1-2032 | | | | 7,625,000 | | | | 7,625,000 | |
San Buenaventura CA Community Memorial Health System (Health Revenue) | | | 5.25 | | | | 12-1-2017 | | | | 1,455,000 | | | | 1,494,692 | |
San Buenaventura CA Community Memorial Health System (Health Revenue) | | | 5.75 | | | | 12-1-2018 | | | | 2,110,000 | | | | 2,237,613 | |
The accompanying notes are an integral part of these financial statements.
| | | | | | |
| Portfolio of investments—December 31, 2016 (unaudited) | | Wells Fargo Strategic Municipal Bond Fund | | | 9 | |
| | | | | | | | | | | | | | | | |
| Security name | | Interest rate | | | Maturity date | | | Principal | | | Value | |
|
| California (continued) | |
San Francisco City & County CA Public Utilities Commission Series 3153X (Water & Sewer Revenue, Morgan Stanley Bank LIQ) 144Aø | | | 0.78 | % | | | 11-1-2039 | | | $ | 2,190,000 | | | $ | 2,190,000 | |
Santa Clara Valley Transportation Authority Sales Tax Revenue Bonds Series 2008-B (Tax Revenue, Sumitomo Mitsui Banking SPA) ø | | | 0.70 | | | | 4-1-2036 | | | | 1,000,000 | | | | 1,000,000 | |
| | | | |
| | | | | | | | | | | | | | | 122,156,885 | |
| | | | | | | | | | | | | | | | |
|
| Colorado: 1.80% | |
Aurora CO E-470 Public Highway Authority Senior Series CD-2 (Transportation Revenue, National Insured) ± | | | 2.48 | | | | 9-1-2039 | | | | 3,000,000 | | | | 2,999,010 | |
Centennial CO Southglenn Metropolitan District (GO Revenue) | | | 3.00 | | | | 12-1-2021 | | | | 1,100,000 | | | | 1,052,810 | |
Colorado ECFA Eagle Ridge Academy Project (Education Revenue) 144A | | | 3.63 | | | | 11-1-2026 | | | | 2,560,000 | | | | 2,356,531 | |
Colorado ECFA Rocky Mountain Classical Academy Project (Education Revenue) | | | 6.38 | | | | 9-1-2023 | | | | 1,905,000 | | | | 1,973,199 | |
Colorado ECFA Vanguard School Project (Education Revenue) | | | 4.00 | | | | 6-15-2021 | | | | 250,000 | | | | 262,245 | |
Colorado ECFA Vanguard School Project (Education Revenue) | | | 4.00 | | | | 6-15-2022 | | | | 515,000 | | | | 542,316 | |
Colorado ECFA Windsor Charter Academy (Education Revenue) 144A | | | 3.88 | | | | 9-1-2026 | | | | 570,000 | | | | 527,894 | |
Colorado Health Facilities Authority Catholic Health Initiatives Series 2009A (Health Revenue) | | | 5.50 | | | | 7-1-2034 | | | | 10,000,000 | | | | 10,472,800 | |
Colorado Health Facilities Authority Catholic Health Initiatives Series 2011A (Health Revenue) | | | 5.00 | | | | 2-1-2022 | | | | 3,415,000 | | | | 3,744,684 | |
Colorado Health Facilities Authority Christian Living Neighborhoods Project (Health Revenue) | | | 1.25 | | | | 1-1-2017 | | | | 170,000 | | | | 169,991 | |
Colorado Health Facilities Authority Christian Living Neighborhoods Project (Health Revenue) | | | 4.00 | | | | 1-1-2018 | | | | 250,000 | | | | 252,242 | |
Colorado Health Facilities Authority Christian Living Neighborhoods Project (Health Revenue) | | | 4.00 | | | | 1-1-2019 | | | | 385,000 | | | | 389,920 | |
Colorado Health Facilities Authority Series 2016C (Health Revenue) ø | | | 0.58 | | | | 12-1-2045 | | | | 5,000,000 | | | | 5,000,000 | |
Colorado Health Facilities Authority Unrefunded Balance (Health Revenue) | | | 5.25 | | | | 6-1-2024 | | | | 980,000 | | | | 982,597 | |
Fountain CO Urban Renewal Authority South Academy Highlands Project Series 2015-A (Tax Revenue) | | | 4.50 | | | | 11-1-2029 | | | | 2,855,000 | | | | 2,913,927 | |
| | | | |
| | | | | | | | | | | | | | | 33,640,166 | |
| | | | | | | | | | | | | | | | |
|
| Connecticut: 2.02% | |
Connecticut HEFA Bridgeport Hospital Series D (Health Revenue) | | | 5.00 | | | | 7-1-2017 | | | | 1,070,000 | | | | 1,089,774 | |
Connecticut HEFA Bridgeport Hospital Series D (Health Revenue) | | | 5.00 | | | | 7-1-2020 | | | | 500,000 | | | | 551,930 | |
Connecticut HEFA Yale New Haven Health Series D (Health Revenue, Bank of America NA LOC) ø | | | 0.72 | | | | 7-1-2048 | | | | 5,000,000 | | | | 5,000,000 | |
Connecticut Series A (Miscellaneous Revenue) ± | | | 1.31 | | | | 3-1-2021 | | | | 2,700,000 | | | | 2,695,140 | |
Connecticut Series A (Miscellaneous Revenue) ± | | | 1.48 | | | | 5-15-2018 | | | | 2,000,000 | | | | 2,003,880 | |
Connecticut Series A (Miscellaneous Revenue) ± | | | 1.60 | | | | 4-15-2018 | | | | 5,000,000 | | | | 5,007,300 | |
Connecticut Series A (Miscellaneous Revenue) ± | | | 1.97 | | | | 4-15-2020 | | | | 7,000,000 | | | | 7,063,490 | |
Connecticut Series A (Miscellaneous Revenue) ± | | | 2.07 | | | | 3-1-2019 | | | | 4,050,000 | | | | 4,052,754 | |
Connecticut Series D (GO Revenue) ± | | | 1.49 | | | | 9-15-2018 | | | | 1,000,000 | | | | 1,001,450 | |
Connecticut Series D (GO Revenue) ± | | | 1.64 | | | | 9-15-2019 | | | | 3,345,000 | | | | 3,345,368 | |
Hamden CT Refunding Bond (GO Revenue) | | | 5.00 | | | | 8-15-2019 | | | | 1,835,000 | | | | 1,969,230 | |
Hartford CT Series A (GO Revenue) | | | 5.00 | | | | 4-1-2025 | | | | 2,500,000 | | | | 2,566,975 | |
Hartford CT Series B (GO Revenue) | | | 5.00 | | | | 4-1-2024 | | | | 1,300,000 | | | | 1,345,019 | |
| | | | |
| | | | | | | | | | | | | | | 37,692,310 | |
| | | | | | | | | | | | | | | | |
The accompanying notes are an integral part of these financial statements.
| | | | |
| 10 | | Wells Fargo Strategic Municipal Bond Fund | | Portfolio of investments—December 31, 2016 (unaudited) |
| | | | | | | | | | | | | | | | |
| Security name | | Interest rate | | | Maturity date | | | Principal | | | Value | |
|
| Delaware: 0.11% | |
Delaware EDA Odyssey Charter School Project Series A (Education Revenue) 144A | | | 6.25 | % | | | 9-1-2025 | | | $ | 2,035,000 | | | $ | 2,034,776 | |
| | | | | | | | | | | | | | | | |
|
| District of Columbia: 0.07% | |
District of Columbia Georgetown University Series B-1 (Education Revenue, Bank of America NA LOC) ø | | | 0.72 | | | | 4-1-2041 | | | | 1,225,000 | | | | 1,225,000 | |
| | | | | | | | | | | | | | | | |
|
| Florida: 2.52% | |
Brevard County FL Space Coast Infrastructure Agency I-95 Project (Industrial Development Revenue) | | | 4.00 | | | | 6-15-2018 | | | | 5,000,000 | | | | 5,170,800 | |
Eustis FL Multi-Purpose Series A (Miscellaneous Revenue, SunTrust Bank LOC) ø | | | 0.82 | | | | 12-1-2027 | | | | 260,000 | | | | 260,000 | |
Florida Cityplace Community Development District Special Assessment (Miscellaneous Revenue) | | | 5.00 | | | | 5-1-2017 | | | | 500,000 | | | | 505,215 | |
Florida Cityplace Community Development District Special Assessment (Miscellaneous Revenue) | | | 5.00 | | | | 5-1-2018 | | | | 1,375,000 | | | | 1,425,132 | |
Florida Development Finance Corporate Educational Facilities Charter Foundation Projects Series A (Education Revenue) 144A | | | 4.00 | | | | 7-15-2026 | | | | 3,920,000 | | | | 3,742,855 | |
Florida Village Community Development District #10 Special Assignment (Miscellaneous Revenue) | | | 5.13 | | | | 5-1-2024 | | | | 3,705,000 | | | | 4,043,637 | |
Lakeland FL Hospital System Lakeland Regional Health System (Health Revenue) | | | 5.00 | | | | 11-15-2022 | | | | 4,495,000 | | | | 4,997,541 | |
Miami FL HFA Jewish Home & Hospital Project (Health Revenue, SunTrust Bank LOC) ø | | | 0.80 | | | | 8-1-2026 | | | | 5,340,000 | | | | 5,340,000 | |
Miami FL Special Obligation (Miscellaneous Revenue, AGM Insured) | | | 5.00 | | | | 2-1-2017 | | | | 1,000,000 | | | | 1,003,330 | |
Miami-Dade County FL IDA Youth Charter Schools Project Series 2015A (Education Revenue) 144A | | | 5.00 | | | | 9-15-2025 | | | | 1,000,000 | | | | 992,960 | |
Miami-Dade County FL School Board Certificate of Participation Series 4 (Miscellaneous Revenue, Dexia Credit Local LOC, Dexia Credit Local LIQ) 144Aø | | | 1.27 | | | | 9-25-2024 | | | | 6,460,000 | | | | 6,460,000 | |
North Brevard County FL Parrish Medical Center Project (Health Revenue) | | | 5.50 | | | | 10-1-2018 | | | | 500,000 | | | | 529,305 | |
Orange County FL IDA Central Florida Kidney Center Project (Industrial Development Revenue, SunTrust Bank LOC) ø | | | 0.80 | | | | 12-1-2020 | | | | 2,750,000 | | | | 2,750,000 | |
Sarasota County FL Health Facilities Authority Village on the Isle Project (Health Revenue) | | | 4.00 | | | | 1-1-2020 | | | | 1,485,000 | | | | 1,558,730 | |
Sumter County FL Village Community Development District #5 Special Assessment Bond Phase I (Miscellaneous Revenue) | | | 3.00 | | | | 5-1-2017 | | | | 545,000 | | | | 543,872 | |
Sumter County FL Village Community Development District #5 Special Assessment Bond Phase I (Miscellaneous Revenue) | | | 3.00 | | | | 5-1-2018 | | | | 560,000 | | | | 557,105 | |
Sumter County FL Village Community Development District #5 Special Assessment Bond Phase II (Miscellaneous Revenue) | | | 3.00 | | | | 5-1-2017 | | | | 780,000 | | | | 778,385 | |
Sumter County FL Village Community Development District #5 Special Assessment Bond Phase II (Miscellaneous Revenue) | | | 3.00 | | | | 5-1-2018 | | | | 795,000 | | | | 790,890 | |
University of West Florida Foundation Incorporated Dormitory Series A (Housing Revenue) | | | 5.00 | | | | 6-1-2020 | | | | 1,210,000 | | | | 1,306,800 | |
University of West Florida Foundation Incorporated Dormitory Series A (Housing Revenue) | | | 5.00 | | | | 6-1-2021 | | | | 1,265,000 | | | | 1,382,835 | |
University of West Florida Foundation Incorporated Dormitory Series A (Housing Revenue) | | | 5.00 | | | | 6-1-2022 | | | | 1,325,000 | | | | 1,465,755 | |
University of West Florida Foundation Incorporated Dormitory Series A (Housing Revenue) | | | 5.00 | | | | 6-1-2023 | | | | 1,190,000 | | | | 1,329,801 | |
| | | | |
| | | | | | | | | | | | | | | 46,934,948 | |
| | | | | | | | | | | | | | | | |
The accompanying notes are an integral part of these financial statements.
| | | | | | |
| Portfolio of investments—December 31, 2016 (unaudited) | | Wells Fargo Strategic Municipal Bond Fund | | | 11 | |
| | | | | | | | | | | | | | | | |
| Security name | | Interest rate | | | Maturity date | | | Principal | | | Value | |
|
| Georgia: 3.10% | |
Atlanta GA Water & Wastewater Project Series A-1 (Water & Sewer Revenue) ± | | | 2.01 | % | | | 11-1-2038 | | | $ | 5,000,000 | | | $ | 5,045,400 | |
Burke County GA Development Authority Georgia Power Company Vogtle Plant Project Second Series 2012 (Utilities Revenue) ± | | | 1.75 | | | | 12-1-2049 | | | | 2,000,000 | | | | 2,003,440 | |
Burke County GA Development Authority Georgia Power Company Vogtle Plant Project Series 2009 (Utilities Revenue) ø | | | 0.82 | | | | 7-1-2049 | | | | 16,340,000 | | | | 16,340,000 | |
Burke County GA Development Authority Oglethorpe Power Corporation Vogtle Plant Project Series A (Utilities Revenue) ± | | | 2.40 | | | | 1-1-2040 | | | | 5,720,000 | | | | 5,766,732 | |
Cherokee County GA Water & Sewage Authority (Water & Sewer Revenue, National Insured) | | | 6.90 | | | | 8-1-2018 | | | | 5,000 | | | | 5,023 | |
Floyd County GA PCR Georgia Power Company Plant Hammond Project (Utilities Revenue) ± | | | 2.35 | | | | 7-1-2022 | | | | 8,875,000 | | | | 8,825,122 | |
Gainesville & Hall Counties GA Hospital Authority Health System Project Series B (Health Revenue) ± | | | 1.51 | | | | 8-15-2035 | | | | 6,000,000 | | | | 5,976,900 | |
Georgia General Obligation Refunding Bond Series F (Miscellaneous Revenue) | | | 5.00 | | | | 1-1-2025 | | | | 4,220,000 | | | | 5,110,251 | |
Georgia Private Colleges & Universities Authority (Education Revenue) | | | 5.00 | | | | 10-1-2019 | | | | 1,325,000 | | | | 1,414,901 | |
Georgia Road & Tollway Authority I-75 S Express Lanes Project Series A (Transportation Revenue) 144A¤ | | | 0.00 | | | | 6-1-2024 | | | | 2,500,000 | | | | 1,580,700 | |
Main Street Natural Gas Incorporated Georgia Gas Project Series B (Utilities Revenue) | | | 5.00 | | | | 3-15-2018 | | | | 5,485,000 | | | | 5,665,895 | |
| | | | |
| | | | | | | | | | | | | | | 57,734,364 | |
| | | | | | | | | | | | | | | | |
|
| Guam: 0.14% | |
Guam Government Business Privilege Tax Series D (Tax Revenue) | | | 5.00 | | | | 11-15-2020 | | | | 1,350,000 | | | | 1,472,580 | |
Guam Government Waterworks Authority Water & Wastewater System Series 2014A (Water & Sewer Revenue) | | | 5.00 | | | | 7-1-2020 | | | | 1,000,000 | | | | 1,084,050 | |
| | | | |
| | | | | | | | | | | | | | | 2,556,630 | |
| | | | | | | | | | | | | | | | |
|
| Hawaii: 0.58% | |
Hawaii Department of Budget and Finance Queens Health System Series B (Health Revenue) ø | | | 1.18 | | | | 7-1-2039 | | | | 10,765,000 | | | | 10,765,000 | |
| | | | | | | | | | | | | | | | |
|
| Illinois: 15.49% | |
Chicago IL Board of Education CAB School Reform Series B-1 (GO Revenue, National Insured) ¤ | | | 0.00 | | | | 12-1-2021 | | | | 10,255,000 | | | | 8,379,976 | |
Chicago IL Board of Education Series A3 (GO Revenue) ± | | | 1.56 | | | | 3-1-2036 | | | | 17,200,000 | | | | 16,232,844 | |
Chicago IL CAB City Colleges Series 1999 (GO Revenue, National Insured) ¤ | | | 0.00 | | | | 1-1-2024 | | | | 9,975,000 | | | | 7,309,181 | |
Chicago IL Motor Fuel Tax Refunding Bonds Series 2013 (Tax Revenue) | | | 5.00 | | | | 1-1-2021 | | | | 1,450,000 | | | | 1,521,731 | |
Chicago IL Motor Fuel Tax Refunding Bonds Series 2013 (Tax Revenue) | | | 5.00 | | | | 1-1-2023 | | | | 2,400,000 | | | | 2,533,512 | |
Chicago IL Motor Fuel Tax Refunding Bonds Series 2013 (Tax Revenue) | | | 5.00 | | | | 1-1-2022 | | | | 1,810,000 | | | | 1,907,269 | |
Chicago IL Motor Fuel Tax Refunding Bonds Series 2013 (Tax Revenue) | | | 5.00 | | | | 1-1-2024 | | | | 2,475,000 | | | | 2,614,021 | |
Chicago IL Neighborhoods Alive 21 Series B (GO Revenue) | | | 5.00 | | | | 1-1-2026 | | | | 5,835,000 | | | | 5,702,779 | |
Chicago IL O’Hare International Airport Senior Lien Bonds Series 2015 C (Airport Revenue) | | | 5.00 | | | | 1-1-2022 | | | | 695,000 | | | | 770,706 | |
Chicago IL O’Hare International Airport Senior Lien Bonds Series 2015 D (Airport Revenue) | | | 5.00 | | | | 1-1-2021 | | | | 500,000 | | | | 553,360 | |
Chicago IL O’Hare International Airport Customer Facility Charge (Airport Revenue) | | | 5.25 | | | | 1-1-2023 | | | | 1,350,000 | | | | 1,540,390 | |
Chicago IL O’Hare International Airport Customer Facility Charge (Airport Revenue) | | | 5.25 | | | | 1-1-2024 | | | | 1,415,000 | | | | 1,603,662 | |
Chicago IL Park District General Obligation Limited Series A (GO Revenue) | | | 5.00 | | | | 1-1-2022 | | | | 400,000 | | | | 442,192 | |
Chicago IL Park District General Obligation Limited Series A (GO Revenue) | | | 5.00 | | | | 1-1-2023 | | | | 400,000 | | | | 446,676 | |
The accompanying notes are an integral part of these financial statements.
| | | | |
| 12 | | Wells Fargo Strategic Municipal Bond Fund | | Portfolio of investments—December 31, 2016 (unaudited) |
| | | | | | | | | | | | | | | | |
| Security name | | Interest rate | | | Maturity date | | | Principal | | | Value | |
|
| Illinois (continued) | |
Chicago IL Park District General Obligation Limited Series A (GO Revenue) | | | 5.00 | % | | | 1-1-2024 | | | $ | 550,000 | | | $ | 617,166 | |
Chicago IL Park District General Obligation Limited Series A (GO Revenue) | | | 5.00 | | | | 1-1-2025 | | | | 625,000 | | | | 703,406 | |
Chicago IL Park District General Obligation Limited Series C (GO Revenue) | | | 5.00 | | | | 1-1-2022 | | | | 1,000,000 | | | | 1,105,480 | |
Chicago IL Park District General Obligation Limited Series C (GO Revenue) | | | 5.00 | | | | 1-1-2024 | | | | 410,000 | | | | 460,069 | |
Chicago IL Park District General Obligation Series C (GO Revenue) | | | 5.00 | | | | 1-1-2023 | | | | 1,000,000 | | | | 1,116,690 | |
Chicago IL Park District Harbor Facilities Series D (GO Revenue) | | | 5.00 | | | | 1-1-2022 | | | | 1,520,000 | | | | 1,680,330 | |
Chicago IL Park District Harbor Facilities Series D (GO Revenue) | | | 5.00 | | | | 1-1-2023 | | | | 1,175,000 | | | | 1,312,111 | |
Chicago IL Park District Limited Tax Series B (GO Revenue) | | | 5.00 | | | | 1-1-2022 | | | | 4,495,000 | | | | 4,969,133 | |
Chicago IL Park District Unlimited Tax Series E (GO Revenue) | | | 5.00 | | | | 11-15-2022 | | | | 1,235,000 | | | | 1,379,977 | |
Chicago IL Park District Unlimited Tax Series E (GO Revenue) | | | 5.00 | | | | 11-15-2023 | | | | 1,295,000 | | | | 1,456,927 | |
Chicago IL Series A (Tax Revenue) | | | 5.00 | | | | 1-1-2029 | | | | 5,000,000 | | | | 5,069,500 | |
Chicago IL Series A (GO Revenue) | | | 5.25 | | | | 1-1-2022 | | | | 2,395,000 | | | | 2,388,869 | |
Chicago IL Series C (GO Revenue) | | | 5.00 | | | | 1-1-2021 | | | | 1,000,000 | | | | 997,560 | |
Chicago IL Series C (GO Revenue) | | | 5.00 | | | | 1-1-2022 | | | | 2,250,000 | | | | 2,234,407 | |
Chicago IL Series C (GO Revenue) | | | 5.00 | | | | 1-1-2023 | | | | 2,500,000 | | | | 2,482,250 | |
Chicago IL Series C (GO Revenue) | | | 5.00 | | | | 1-1-2025 | | | | 4,865,000 | | | | 4,780,106 | |
Chicago IL Series D (GO Revenue, Ambac Insured) | | | 5.00 | | | | 12-1-2022 | | | | 3,915,000 | | | | 3,926,353 | |
Chicago IL Series G (GO Revenue, Ambac Insured) | | | 5.00 | | | | 12-1-2024 | | | | 1,140,000 | | | | 1,143,272 | |
Chicago IL Tax Increment Bond Pilson Redevelopment Project Series A (Tax Revenue) | | | 5.00 | | | | 6-1-2022 | | | | 1,635,000 | | | | 1,791,126 | |
Chicago IL Transit Authority Capital Grant Federal Transit Administration Section 5307-A (Transportation Revenue, AGC Insured) | | | 5.25 | | | | 6-1-2022 | | | | 2,100,000 | | | | 2,173,164 | |
Chicago IL Transit Authority Capital Grant Receipts Refunding Bond Series 2011 (Miscellaneous Revenue, AGM Insured) | | | 5.25 | | | | 6-1-2024 | | | | 4,450,000 | | | | 4,839,953 | |
Chicago IL Unrefunded Balance Bond Series A (GO Revenue, AGM Insured) | | | 5.00 | | | | 1-1-2024 | | | | 305,000 | | | | 307,342 | |
Chicago IL Wastewater Transmission Second Lien Series A (Water & Sewer Revenue) | | | 4.00 | | | | 1-1-2018 | | | | 1,175,000 | | | | 1,199,628 | |
Chicago IL Waterworks Series A (Water & Sewer Revenue, Ambac Insured) | | | 5.00 | | | | 11-1-2021 | | | | 1,000,000 | | | | 1,002,990 | |
Chicago lL Series A (Tax Revenue) | | | 5.00 | | | | 1-1-2022 | | | | 3,000,000 | | | | 3,114,210 | |
Cook County IL Refunding Bonds Series 2010 G (GO Revenue) | | | 5.00 | | | | 11-15-2026 | | | | 1,000,000 | | | | 1,069,080 | |
Cook County IL School District #123 Oak Lawn CAB (GO Revenue, National Insured) ¤ | | | 0.00 | | | | 12-1-2021 | | | | 1,090,000 | | | | 921,551 | |
Cook County IL Series A (GO Revenue) | | | 5.00 | | | | 11-15-2021 | | | | 2,250,000 | | | | 2,483,752 | |
Cook County IL Series A (GO Revenue) | | | 5.25 | | | | 11-15-2022 | | | | 10,040,000 | | | | 10,976,130 | |
Cook County IL Series A (GO Revenue) | | | 5.25 | | | | 11-15-2022 | | | | 1,000,000 | | | | 1,114,270 | |
Cook County IL Series C (GO Revenue, National Insured) | | | 5.00 | | | | 11-15-2020 | | | | 1,150,000 | | | | 1,179,164 | |
Cook County IL Series C (GO Revenue, National Insured) | | | 5.00 | | | | 11-15-2021 | | | | 5,000,000 | | | | 5,126,800 | |
DeWitt & Ford Counties IL Community College District #540 (GO Revenue, AGM Insured) | | | 5.00 | | | | 12-1-2021 | | | | 5,920,000 | | | | 6,109,262 | |
DuPage County IL Forest Preservation District Series 2015 (GO Revenue) | | | 5.00 | | | | 1-1-2023 | | | | 2,455,000 | | | | 2,838,078 | |
Huntley IL Special Service Area #6 (Tax Revenue, AGC Insured) | | | 4.60 | | | | 3-1-2017 | | | | 251,000 | | | | 251,703 | |
Illinois Finance Authority OSF Healthcare Series F (Health Revenue, Barclays Bank plc LOC) ø | | | 0.75 | | | | 11-15-2037 | | | | 4,800,000 | | | | 4,800,000 | |
Illinois Municipal Electric Agency Power Series A (Utilities Revenue, National Insured) | | | 5.25 | | | | 2-1-2021 | | | | 3,840,000 | | | | 3,854,707 | |
Illinois Refunding Bond (Miscellaneous Revenue) | | | 5.00 | | | | 8-1-2020 | | | | 5,000,000 | | | | 5,206,850 | |
Illinois Refunding Bond (Miscellaneous Revenue, AGM Insured) | | | 5.00 | | | | 8-1-2020 | | | | 5,050,000 | | | | 5,391,683 | |
Illinois Refunding Bonds Series 2016 (Miscellaneous Revenue) | | | 5.00 | | | | 2-1-2026 | | | | 7,000,000 | | | | 7,136,640 | |
Illinois Sales Tax Series 2016 (Tax Revenue, Bank of America NA LIQ) 144Aø | | | 1.08 | | | | 6-15-2034 | | | | 8,310,000 | | | | 8,310,000 | |
Illinois Series 2012 (Miscellaneous Revenue) | | | 5.00 | | | | 8-1-2021 | | | | 5,620,000 | | | | 5,854,691 | |
Illinois Series 2013 (Miscellaneous Revenue) | | | 5.00 | | | | 7-1-2022 | | | | 1,900,000 | | | | 1,976,874 | |
Illinois Series 2013 (Miscellaneous Revenue, AGM Insured) | | | 5.00 | | | | 7-1-2023 | | | | 4,875,000 | | | | 5,250,082 | |
Illinois Series A (GO Revenue) | | | 5.00 | | | | 4-1-2020 | | | | 2,000,000 | | | | 2,078,560 | |
The accompanying notes are an integral part of these financial statements.
| | | | | | |
| Portfolio of investments—December 31, 2016 (unaudited) | | Wells Fargo Strategic Municipal Bond Fund | | | 13 | |
| | | | | | | | | | | | | | | | |
| Security name | | Interest rate | | | Maturity date | | | Principal | | | Value | |
|
| Illinois (continued) | |
Illinois Series A (GO Revenue) | | | 5.00 | % | | | 4-1-2023 | | | $ | 3,500,000 | | | $ | 3,626,595 | |
Illinois Sports Facilities Authority Series 2014 (Tax Revenue) | | | 5.00 | | | | 6-15-2022 | | | | 3,380,000 | | | | 3,589,729 | |
Illinois Sports Facilities Authority Series 2014 (Tax Revenue) | | | 5.00 | | | | 6-15-2023 | | | | 3,200,000 | | | | 3,414,976 | |
Illinois Sports Facilities Authority series 2014 (Tax Revenue) | | | 5.00 | | | | 6-15-2024 | | | | 4,005,000 | | | | 4,292,038 | |
Illinois Sports Facilities Authority State Tax Supported CAB (Tax Revenue, Ambac Insured) ¤ | | | 0.00 | | | | 6-15-2018 | | | | 4,105,000 | | | | 3,946,013 | |
Illinois Sports Facilities Authority State Tax Supported CAB (Tax Revenue, Ambac Insured) ¤ | | | 0.00 | | | | 6-15-2022 | | | | 3,795,000 | | | | 3,094,063 | |
Illinois Sports Facilities Authority State Tax Supported CAB (Tax Revenue, Ambac Insured) ¤ | | | 0.00 | | | | 6-15-2023 | | | | 7,870,000 | | | | 6,124,119 | |
Illinois State Toll Highway Authority Series A1 (Transportation Revenue, AGM Insured, JPMorgan Chase & Company SPA) ø | | | 0.73 | | | | 1-1-2031 | | | | 3,000,000 | | | | 3,000,000 | |
Kane County IL Aurora West School District #129 (GO Revenue, AGM Insured) | | | 5.00 | | | | 2-1-2022 | | | | 6,290,000 | | | | 7,014,734 | |
Kane, Cook & DuPage Counties IL School District #46 Prerefunded CAB Series B (GO Revenue, Ambac Insured) ¤ | | | 0.00 | | | | 1-1-2021 | | | | 510,000 | | | | 470,577 | |
Kane, Cook & DuPage Counties IL School District #46 Unrefunded CAB Series B (GO Revenue, Ambac Insured) ¤ | | | 0.00 | | | | 1-1-2021 | | | | 595,000 | | | | 535,494 | |
Kendall, Kane & Will Counties IL Community Unit School District #308 Oswego Prerefunded Bond Series C (GO Revenue, AGM Insured) ¤ | | | 0.00 | | | | 10-1-2017 | | | | 1,325,000 | | | | 1,313,406 | |
Kendall, Kane & Will Counties IL Community Unit School District #308 Oswego Unrefunded Bond Series C (GO Revenue, AGM Insured) ¤ | | | 0.00 | | | | 10-1-2017 | | | | 25,000 | | | | 24,721 | |
Lake County IL Community Consolidated School District #3 Beach Park CAB (GO Revenue, Ambac Insured) ¤ | | | 0.00 | | | | 2-1-2017 | | | | 1,610,000 | | | | 1,605,911 | |
Lake County IL Community Consolidated School District #3 Beach Park CAB (GO Revenue, Ambac Insured) ¤ | | | 0.00 | | | | 2-1-2018 | | | | 1,000,000 | | | | 961,430 | |
Lake County IL Community Consolidated School District #3 Beach Park CAB (GO Revenue, Ambac Insured) ¤ | | | 0.00 | | | | 2-1-2019 | | | | 1,100,000 | | | | 1,010,856 | |
Lake County IL School District #38 Big Hollow CAB (GO Revenue, Ambac Insured) ¤ | | | 0.00 | | | | 2-1-2019 | | | | 1,175,000 | | | | 1,105,358 | |
McHenry & Kane Counties IL Community Consolidated School District #158 CAB (GO Revenue, National Insured) ¤ | | | 0.00 | | | | 1-1-2018 | | | | 4,000,000 | | | | 3,946,800 | |
McHenry & Kane Counties IL Community Consolidated School District #158 CAB (GO Revenue, AGM/FGIC Insured) ¤ | | | 0.00 | | | | 1-1-2019 | | | | 1,185,000 | | | | 1,146,867 | |
Metropolitan Pier & Exposition Authority McCormick Series A (Tax Revenue, National Insured) ¤ | | | 0.00 | | | | 12-15-2022 | | | | 1,390,000 | | | | 1,101,950 | |
Metropolitan Pier & Exposition Authority McCormick Series A (Tax Revenue, National Insured) ¤ | | | 0.00 | | | | 12-15-2023 | | | | 865,000 | | | | 652,859 | |
Metropolitan Pier & Exposition Authority McCormick Series A (Tax Revenue, National Insured) ¤ | | | 0.00 | | | | 6-15-2025 | | | | 1,000,000 | | | | 1,092,590 | |
Metropolitan Pier & Exposition Authority McCormick Series B (Tax Revenue) | | | 5.00 | | | | 12-15-2022 | | | | 11,520,000 | | | | 11,682,547 | |
Metropolitan Pier & Exposition Authority McCormiick Series B (Tax Revenue) | | | 5.00 | | | | 12-15-2026 | | | | 1,675,000 | | | | 1,773,322 | |
Rockford IL Warerworks System Series B (GO Revenue, Build America Mutual Assurance Company Insured) | | | 5.00 | | | | 12-15-2022 | | | | 1,065,000 | | | | 1,203,024 | |
Rockford IL Waterworks System Series B (GO Revenue, Build America Mutual Assurance Company Insured) | | | 5.00 | | | | 12-15-2020 | | | | 1,000,000 | | | | 1,100,670 | |
Rockford IL Waterworks System Series B (GO Revenue, Build America Mutual Assurance Company Insured) | | | 5.00 | | | | 12-15-2021 | | | | 1,015,000 | | | | 1,130,517 | |
Romeoville IL Series B (GO Revenue, AGC Insured) ¤ | | | 0.00 | | | | 12-30-2023 | | | | 3,410,000 | | | | 2,468,329 | |
Romeoville IL Series B (GO Revenue, AGC Insured) ¤ | | | 0.00 | | | | 12-30-2024 | | | | 2,840,000 | | | | 1,938,073 | |
St. Charles, Kane and Dupage Counties IL Series 2016 (Tax Revenue) | | | 4.00 | | | | 1-1-2020 | | | | 760,000 | | | | 767,281 | |
St. Charles, Kane and Dupage Counties IL Series 2016 (Tax Revenue) | | | 3.00 | | | | 1-1-2018 | | | | 200,000 | | | | 199,394 | |
St. Charles, Kane and Dupage Counties IL Series 2016 (Tax Revenue) | | | 3.00 | | | | 1-1-2019 | | | | 300,000 | | | | 297,066 | |
The accompanying notes are an integral part of these financial statements.
| | | | |
| 14 | | Wells Fargo Strategic Municipal Bond Fund | | Portfolio of investments—December 31, 2016 (unaudited) |
| | | | | | | | | | | | | | | | |
| Security name | | Interest rate | | | Maturity date | | | Principal | | | Value | |
|
| Illinois (continued) | |
St. Charles, Kane and Dupage Counties IL Series 2016 (Tax Revenue) | | | 4.00 | % | | | 1-1-2021 | | | $ | 790,000 | | | $ | 796,984 | |
St. Charles, Kane and Dupage Counties IL Series 2016 (Tax Revenue) | | | 4.00 | | | | 1-1-2022 | | | | 820,000 | | | | 817,794 | |
St. Charles, Kane and Dupage Counties IL Series 2016 (Tax Revenue) | | | 4.00 | | | | 1-1-2024 | | | | 885,000 | | | | 865,946 | |
St. Charles, Kane and Dupage Counties IL Series 2016 (Tax Revenue) | | | 4.00 | | | | 1-1-2025 | | | | 925,000 | | | | 890,590 | |
St. Charles, Kane and Dupage Counties Series 2016 (Tax Revenue) | | | 4.00 | | | | 1-1-2023 | | | | 855,000 | | | | 845,561 | |
Springfield IL Electric Senior Lien (Utilities Revenue, National Insured) | | | 5.00 | | | | 3-1-2021 | | | | 7,410,000 | | | | 7,462,092 | |
St. Clair County IL School District Series B (GO Revenue, National Insured) | | | 4.75 | | | | 1-1-2018 | | | | 655,000 | | | | 670,294 | |
University of Illinois Auxiliary Facilities (Education Revenue, JPMorgan Chase & Company SPA) ø | | | 0.95 | | | | 4-1-2038 | | | | 7,580,000 | | | | 7,580,000 | |
Will County IL Community High School District #210 Lincoln Way (GO Revenue, AGM Insured) ¤ | | | 0.00 | | | | 1-1-2021 | | | | 1,535,000 | | | | 1,299,731 | |
Will County IL Community High School District #210 Lincoln Way (GO Revenue) | | | 4.00 | | | | 1-1-2022 | | | | 1,100,000 | | | | 1,041,623 | |
Will County IL School District #114 CAB Series C (GO Revenue, National Insured) ¤ | | | 0.00 | | | | 12-1-2021 | | | | 855,000 | | | | 743,183 | |
Winnebago & Boone Counties IL School District #205 Series A (GO Revenue) ¤ | | | 0.00 | | | | 2-1-2021 | | | | 1,305,000 | | | | 1,171,381 | |
Winnebago & Boone Counties IL School District #205 Series B (GO Revenue) ¤ | | | 0.00 | | | | 2-1-2021 | | | | 3,400,000 | | | | 3,051,874 | |
| | | | |
| | | | | | | | | | | | | | | 288,608,557 | |
| | | | | | | | | | | | | | | | |
|
| Indiana: 2.74% | |
Gary IN Sanitary District Series A (Water & Sewer Revenue) | | | 5.05 | | | | 1-15-2029 | | | | 4,940,000 | | | | 5,155,236 | |
Indiana Finance Authority Development Partners LLC (Miscellaneous Revenue) | | | 5.25 | | | | 9-1-2025 | | | | 1,660,000 | | | | 1,779,371 | |
Indiana Finance Authority Development Partners LLC (Miscellaneous Revenue) | | | 5.25 | | | | 9-1-2027 | | | | 700,000 | | | | 740,901 | |
Indiana Finance Authority Environmental Facilities Series 2016A (Industrial Development Revenue) | | | 3.13 | | | | 12-1-2024 | | | | 6,000,000 | | | | 5,917,920 | |
Indiana Finance Authority Ohio River Bridges East End Crossing Project Series B (Industrial Development Revenue) | | | 5.00 | | | | 1-1-2019 | | | | 16,205,000 | | | | 16,225,418 | |
Indiana Finance Authority Parkview Health System Series A (Health Revenue) | | | 5.50 | | | | 5-1-2024 | | | | 5,255,000 | | | | 5,689,326 | |
Indiana HFFA Ancilla System Incorporated (Health Revenue, National Insured) | | | 5.25 | | | | 7-1-2022 | | | | 325,000 | | | | 326,150 | |
Knox County IN EDA Good Samaritan Hospital Series A (Health Revenue) | | | 4.00 | | | | 4-1-2017 | | | | 625,000 | | | | 628,162 | |
Knox County IN EDA Good Samaritan Hospital Series A (Health Revenue) | | | 4.00 | | | | 4-1-2018 | | | | 400,000 | | | | 408,064 | |
Whiting IN BP Products North America Incorporated Project (Resource Recovery Revenue) | | | 1.48 | | | | 12-1-2044 | | | | 11,400,000 | | | | 11,282,694 | |
Whiting IN BP Products North America Incorporated Project (Industrial Development Revenue) ± | | | 1.85 | | | | 6-1-2044 | | | | 2,950,000 | | | | 2,927,905 | |
| | | | |
| | | | | | | | | | | | | | | 51,081,147 | |
| | | | | | | | | | | | | | | | |
|
| Iowa: 0.16% | |
Iowa Finance Authority Midwestern Disaster Area Project (Industrial Development Revenue, Korea Development Bank LOC) ø | | | 0.95 | | | | 4-1-2022 | | | | 2,500,000 | | | | 2,500,000 | |
Iowa Student Loan Liquidity Corporation Series A1 (Education Revenue) | | | 4.13 | | | | 12-1-2017 | | | | 570,000 | | | | 581,292 | |
| | | | |
| | | | | | | | | | | | | | | 3,081,292 | |
| | | | | | | | | | | | | | | | |
|
| Kansas: 0.88% | |
Wyandotte County & Kansas City KS Special Obligation Refunding and Improvement Bonds Plaza Redevelopment Project (Tax Revenue) | | | 4.00 | | | | 12-1-2028 | | | | 1,000,000 | | | | 942,230 | |
Wyandotte County & Kansas City KS Special Obligation Vacation Village Project Area 4 - Major Multi-Sport Athletic Complex Project CAB Series 2015 (Tax Revenue) 144A¤ | | | 0.00 | | | | 9-1-2034 | | | | 49,000,000 | | | | 15,450,190 | |
| | | | |
| | | | | | | | | | | | | | | 16,392,420 | |
| | | | | | | | | | | | | | | | |
The accompanying notes are an integral part of these financial statements.
| | | | | | |
| Portfolio of investments—December 31, 2016 (unaudited) | | Wells Fargo Strategic Municipal Bond Fund | | | 15 | |
| | | | | | | | | | | | | | | | |
| Security name | | Interest rate | | | Maturity date | | | Principal | | | Value | |
|
| Kentucky: 1.39% | |
Christian County KY Jennie Stuart Medical Center (Health Revenue, AGC Insured) | | | 5.25 | % | | | 2-1-2018 | | | $ | 535,000 | | | $ | 546,588 | |
Kentucky EDFA Healthcare Facilities Rosedale Green Project Series 2015 (Health Revenue) | | | 2.75 | | | | 11-15-2018 | | | | 300,000 | | | | 299,817 | |
Kentucky EDFA Healthcare Facilities Rosedale Green Project Series 2015 (Health Revenue) | | | 3.00 | | | | 11-15-2019 | | | | 350,000 | | | | 349,993 | |
Kentucky EDFA Healthcare Facilities Rosedale Green Project Series 2015 (Health Revenue) | | | 3.35 | | | | 11-15-2020 | | | | 335,000 | | | | 335,402 | |
Kentucky EDFA Healthcare Facilities Rosedale Green Project Series 2015 (Health Revenue) | | | 5.00 | | | | 11-15-2025 | | | | 1,500,000 | | | | 1,517,070 | |
Kentucky EDFA Norton Healthcare Incorporated Series B (Health Revenue, National Insured) ¤ | | | 0.00 | | | | 10-1-2022 | | | | 1,000,000 | | | | 838,760 | |
Kentucky EDFA Series 2980 (Health Revenue, Morgan Stanley Bank LIQ) 144Aø | | | 1.04 | | | | 8-15-2024 | | | | 10,500,000 | | | | 10,500,000 | |
Kentucky Housing Corporate Watterson Lakeview Project (Housing Revenue) | | | 0.95 | | | | 7-1-2018 | | | | 5,000,000 | | | | 4,967,400 | |
Kentucky Municipal Power Agency Prairie State Project Series B (Utilities Revenue) ± | | | 1.96 | | | | 9-1-2042 | | | | 6,500,000 | | | | 6,500,585 | |
| | | | |
| | | | | | | | | | | | | | | 25,855,615 | |
| | | | | | | | | | | | | | | | |
|
| Louisiana: 0.27% | |
Louisiana Tobacco Settlement Financing Corporation Series A (Tobacco Revenue) | | | 5.00 | | | | 5-15-2025 | | | | 1,445,000 | | | | 1,447,991 | |
St. Bernard Parish LA Series 2012 (Tax Revenue) | | | 4.00 | | | | 3-1-2019 | | | | 3,355,000 | | | | 3,504,029 | |
| | | | |
| | | | | | | | | | | | | | | 4,952,020 | |
| | | | | | | | | | | | | | | | |
|
| Maryland: 1.87% | |
Baltimore MD Series A (Water & Sewer Revenue, National Insured) | | | 5.65 | | | | 7-1-2020 | | | | 4,100,000 | | | | 4,371,994 | |
Howard County MD Housing Commission Series A (Housing Revenue) ± | | | 1.97 | | | | 7-1-2034 | | | | 6,665,000 | | | | 6,659,201 | |
Maryland Community Development Administration Park Heights Apartments Series 2016 (Housing Revenue) | | | 2.15 | | | | 12-1-2018 | | | | 8,500,000 | | | | 8,500,595 | |
Maryland Community Development Administration Pleasant View Gardens Townhouses Series F (Housing Revenue) | | | 1.20 | | | | 7-1-2018 | | | | 12,300,000 | | | | 12,214,515 | |
Prince Georges County MD Chesapeake Lighthouse Charter School Project Series 2015 (Education Revenue) 144A | | | 5.25 | | | | 8-1-2022 | | | | 1,790,000 | | | | 1,837,793 | |
Prince Georges County MD Chesapeake Lighthouse Charter School Project Series 2016 (Education Revenue) | | | 5.00 | | | | 8-1-2026 | | | | 1,335,000 | | | | 1,351,167 | |
| | | | |
| | | | | | | | | | | | | | | 34,935,265 | |
| | | | | | | | | | | | | | | | |
|
| Massachusetts: 0.73% | |
Massachusetts Development Finance Agency Sabis International Charter School Series 2015 (Education Revenue) | | | 5.00 | | | | 4-15-2025 | | | | 1,000,000 | | | | 1,069,920 | |
Massachusetts Educational Financing Authority Series J (Education Revenue) | | | 5.00 | | | | 7-1-2018 | | | | 750,000 | | | | 783,487 | |
Massachusetts Educational Financing Authority Series J (Education Revenue) | | | 5.00 | | | | 7-1-2019 | | | | 6,000,000 | | | | 6,381,240 | |
Massachusetts HEFA Milford Regional Medical Center Series E (Health Revenue) | | | 5.00 | | | | 7-15-2022 | | | | 2,250,000 | | | | 2,285,932 | |
Massachusetts Various Consolidated Loans Series D (Tax Revenue) ± | | | 1.15 | | | | 1-1-2018 | | | | 3,000,000 | | | | 3,002,100 | |
| | | | |
| | | | | | | | | | | | | | | 13,522,679 | |
| | | | | | | | | | | | | | | | |
|
| Michigan: 5.81% | |
Birmingham MI Public Schools (GO Revenue) | | | 5.00 | | | | 11-1-2021 | | | | 1,405,000 | | | | 1,605,493 | |
Clarkston MI Community Schools (GO Revenue, Qualified School Board Loan Fund Insured) | | | 5.00 | | | | 5-1-2022 | | | | 5,000,000 | | | | 5,694,000 | |
Constantine MI Public Schools (GO Revenue, Qualified School Board Loan Fund Insured) | | | 5.00 | | | | 5-1-2020 | | | | 350,000 | | | | 385,343 | |
The accompanying notes are an integral part of these financial statements.
| | | | |
| 16 | | Wells Fargo Strategic Municipal Bond Fund | | Portfolio of investments—December 31, 2016 (unaudited) |
| | | | | | | | | | | | | | | | |
| Security name | | Interest rate | | | Maturity date | | | Principal | | | Value | |
|
| Michigan (continued) | |
Constantine MI Public Schools (GO Revenue, Qualified School Board Loan Fund Insured) | | | 5.00 | % | | | 5-1-2021 | | | $ | 1,200,000 | | | $ | 1,347,024 | |
Detroit MI Downtown Development Authority CAB (Tax Revenue) ¤ | | | 0.00 | | | | 7-1-2017 | | | | 3,015,000 | | | | 2,947,796 | |
Detroit MI Water & Sewage Department Series A (Water & Sewer Revenue) | | | 5.00 | | | | 7-1-2022 | | | | 1,000,000 | | | | 1,120,430 | |
Detroit MI Wayne County Stadium Authority (Miscellaneous Revenue) | | | 5.00 | | | | 10-1-2017 | | | | 1,245,000 | | | | 1,237,654 | |
Detroit MI Wayne County Stadium Authority (Miscellaneous Revenue) | | | 5.00 | | | | 10-1-2018 | | | | 3,425,000 | | | | 3,376,296 | |
Forest Hills MI Public Schools (GO Revenue) | | | 5.00 | | | | 5-1-2020 | | | | 1,600,000 | | | | 1,761,568 | |
Forest Hills MI Public Schools (GO Revenue) | | | 5.00 | | | | 5-1-2021 | | | | 1,600,000 | | | | 1,796,032 | |
Fraser MI Public Schools District (GO Revenue, Qualified School Board Loan Fund Insured) | | | 5.00 | | | | 5-1-2021 | | | | 1,000,000 | | | | 1,122,520 | |
Fraser MI Public Schools District (GO Revenue, Qualified School Board Loan Fund Insured) | | | 5.00 | | | | 5-1-2022 | | | | 610,000 | | | | 694,668 | |
Hudsonville MI Public Schools (GO Revenue, Qualified School Board Loan Fund Insured) | | | 5.00 | | | | 5-1-2021 | | | | 1,465,000 | | | | 1,644,492 | |
Hudsonville MI Public Schools (GO Revenue, Qualified School Board Loan Fund Insured) | | | 5.00 | | | | 5-1-2022 | | | | 1,475,000 | | | | 1,679,730 | |
Ingham County MI Williamston Community Schools Series A (GO Revenue, Qualified School Board Loan Fund Insured) | | | 4.00 | | | | 5-1-2024 | | | | 1,025,000 | | | | 1,110,762 | |
Ingham County MI Williamston Community Schools Series A (GO Revenue, Qualified School Board Loan Fund Insured) | | | 4.00 | | | | 5-1-2025 | | | | 1,000,000 | | | | 1,081,450 | |
Michigan Finance Authority Detroit Recovery Project Series 2014F (Tax Revenue) | | | 3.88 | | | | 10-1-2023 | | | | 2,500,000 | | | | 2,577,875 | |
Michigan Finance Authority Detroit Recovery Project Series 2014F (Tax Revenue) | | | 3.40 | | | | 10-1-2020 | | | | 500,000 | | | | 505,260 | |
Michigan Finance Authority Detroit Recovery Project Series 2014F (Tax Revenue) | | | 3.60 | | | | 10-1-2021 | | | | 500,000 | | | | 510,265 | |
Michigan Finance Authority Detroit Recovery Project Series 2014F (Tax Revenue) | | | 3.80 | | | | 10-1-2022 | | | | 500,000 | | | | 514,145 | |
Michigan Finance Authority Detroit Regional Convention Facility Local Project Bonds Series H-1 (Tax Revenue) | | | 5.00 | | | | 10-1-2021 | | | | 1,565,000 | | | | 1,716,617 | |
Michigan Finance Authority Limited Obligation Cesar Chavez Academy Project (Education Revenue) | | | 4.25 | | | | 2-1-2017 | | | | 345,000 | | | | 345,107 | |
Michigan Financial Authority Local Government Loan Program Series C7 (Water & Sewer Revenue, National Insured) | | | 5.00 | | | | 7-1-2022 | | | | 2,000,000 | | | | 2,252,860 | |
Michigan Financial Authority Local Government Loan Program Series D1 (Water & Sewer Revenue, AGM Insured) | | | 5.00 | | | | 7-1-2022 | | | | 2,700,000 | | | | 3,045,060 | |
Michigan Financial Authority Local Government Loan Program Series D1 (Water & Sewer Revenue, AGM Insured) | | | 5.00 | | | | 7-1-2023 | | | | 2,000,000 | | | | 2,283,580 | |
Michigan Financial Authority Local Government Loan Program Series D6 (Water & Sewer Revenue, National Insured) | | | 5.00 | | | | 7-1-2021 | | | | 6,355,000 | | | | 7,076,356 | |
Michigan Financial Authority Local Government Loan Program Series D6 (Water & Sewer Revenue, National Insured) | | | 5.00 | | | | 7-1-2022 | | | | 2,080,000 | | | | 2,342,974 | |
Michigan Financial Authority Local Government Loan Program Series D6 (Water & Sewer Revenue, National Insured) | | | 5.00 | | | | 7-1-2023 | | | | 3,670,000 | | | | 4,179,800 | |
Michigan Financial Authority Local Government Loan Program Series D6 (Water & Sewer Revenue, National Insured) | | | 5.00 | | | | 7-1-2024 | | | | 2,130,000 | | | | 2,449,820 | |
Michigan Finance Authority Student Loan Refunding Bonds Series 25-A (Education Revenue) | | | 5.00 | | | | 11-1-2018 | | | | 3,100,000 | | | | 3,250,288 | |
Michigan Finance Authority Student Loan Refunding Bonds Series 25-A (Education Revenue) | | | 5.00 | | | | 11-1-2019 | | | | 1,500,000 | | | | 1,600,140 | |
Michigan Finance Authority St. John Health System Series A (Health Revenue, Ambac Insured) | | | 5.00 | | | | 5-15-2018 | | | | 300,000 | | | | 300,993 | |
Michigan Hospital Finance Authority Unrefunded Balance Bond Trinity Health Corporation (Health Revenue) | | | 5.00 | | | | 12-1-2031 | | | | 4,500,000 | | | | 4,513,275 | |
Michigan Housing Development Authority Series E (Housing Revenue) ± | | | 1.59 | | | | 4-1-2042 | | | | 9,835,000 | | | | 9,865,390 | |
Michigan Municipal Bond Authority Local Government Loan Program Series A (Miscellaneous Revenue, Ambac Insured) | | | 4.00 | | | | 11-1-2019 | | | | 500,000 | | | | 501,155 | |
The accompanying notes are an integral part of these financial statements.
| | | | | | |
| Portfolio of investments—December 31, 2016 (unaudited) | | Wells Fargo Strategic Municipal Bond Fund | | | 17 | |
| | | | | | | | | | | | | | | | |
| Security name | | Interest rate | | | Maturity date | | | Principal | | | Value | |
|
| Michigan (continued) | |
Michigan Municipal Bond Authority Local Government Loan Program Series A (Miscellaneous Revenue, Ambac Insured) | | | 5.00 | % | | | 5-1-2018 | | | $ | 595,000 | | | $ | 596,041 | |
Michigan Municipal Bond Authority Local Government Loan Program Series C (Miscellaneous Revenue, Ambac Insured) | | | 4.13 | | | | 5-1-2020 | | | | 500,000 | | | | 501,150 | |
Michigan Municipal Bond Authority Local Government Loan Program Series C (Miscellaneous Revenue, Ambac Insured) | | | 5.00 | | | | 5-1-2023 | | | | 1,900,000 | | | | 1,907,543 | |
Michigan Public Educational Facilities Authority Chandler Park Academy (Miscellaneous Revenue) | | | 6.35 | | | | 11-1-2028 | | | | 1,500,000 | | | | 1,502,145 | |
Michigan Strategic Fund Limited Obligation Events Center Project Series A (Tax Revenue) ± | | | 4.13 | | | | 7-1-2045 | | | | 7,500,000 | | | | 7,593,750 | |
Michigan Trunkline Fund Bonds (Tax Revenue, AGM Insured) | | | 5.50 | | | | 11-1-2021 | | | | 8,275,000 | | | | 9,581,209 | |
Southfield MI Public Schools (GO Revenue, National/Qualified School Board Loan Fund Insured) | | | 4.38 | | | | 5-1-2025 | | | | 1,950,000 | | | | 1,969,091 | |
Tender Option Bond Trust Receipts/Certificates Portage Public School (GO Revenue, AGM Insured, Bank of America NA LIQ) 144Aø | | | 0.88 | | | | 5-1-2031 | | | | 5,000,000 | | | | 5,000,000 | |
Wayne County MI Airport Authority AMT Detroit Metropolitan Airport Series C (Airport Revenue) | | | 5.00 | | | | 12-1-2022 | | | | 1,000,000 | | | | 1,089,380 | |
| | | | |
| | | | | | | | | | | | | | | 108,176,527 | |
| | | | | | | | | | | | | | | | |
|
| Minnesota: 0.67% | |
Hayward MN HCFR St. John’s Lutheran Home of Albert Lea Project Series 2015 (Health Revenue) | | | 2.75 | | | | 11-1-2017 | | | | 5,000,000 | | | | 5,031,150 | |
Minneapolis & St. Paul MN Metropolitan Airports Commission Morgan Stanley Series 3200 (Airport Revenue, Morgan Stanley Bank LIQ) 144Aø | | | 0.75 | | | | 1-1-2035 | | | | 6,000,000 | | | | 6,000,000 | |
St. Paul MN Housing & RDA Charter School Hmong College Preparatory Academy Project Series A (Miscellaneous Revenue) | | | 4.75 | | | | 9-1-2022 | | | | 500,000 | | | | 508,165 | |
St. Paul MN Housing & RDA Charter School Hmong College Preparatory Academy Project Series A (Education Revenue) | | | 5.00 | | | | 9-1-2026 | | | | 1,000,000 | | | | 1,000,690 | |
| | | | |
| | | | | | | | | | | | | | | 12,540,005 | |
| | | | | | | | | | | | | | | | |
| | | | |
| Mississippi: 0.27% | | | | | | | | | | | | | | | | |
Mississippi HFFA Baptist Health System Series A (Health Revenue) ± | | | 1.86 | | | | 8-15-2036 | | | | 5,000,000 | | | | 4,963,200 | |
| | | | | | | | | | | | | | | | |
| | | | |
| Missouri: 0.11% | | | | | | | | | | | | | | | | |
Arnold MO Real Property Arnold Triangle Redevelopment Project Series A (Tax Revenue) | | | 3.75 | | | | 5-1-2023 | | | | 2,000,000 | | | | 1,999,520 | |
| | | | | | | | | | | | | | | | |
| | | | |
| Nevada: 0.38% | | | | | | | | | | | | | | | | |
Carson City NV Carson Tahoe Regional Medical Center (Health Revenue) | | | 5.00 | | | | 9-1-2018 | | | | 700,000 | | | | 734,559 | |
Las Vegas NV Special Improvement District #60 (Miscellaneous Revenue) | | | 3.00 | | | | 6-1-2017 | | | | 660,000 | | | | 659,762 | |
Las Vegas NV Special Improvement District #60 (Miscellaneous Revenue) | | | 4.00 | | | | 6-1-2018 | | | | 655,000 | | | | 661,249 | |
Tender Option Bond Trust Receipts/Certificates Nevada Water District (GO Revenue, JPMorgan Chase & Company LIQ) 144Aø | | | 0.90 | | | | 6-1-2020 | | | | 5,000,000 | | | | 5,000,000 | |
| | | | |
| | | | | | | | | | | | | | | 7,055,570 | |
| | | | | | | | | | | | | | | | |
| | | | |
| New Jersey: 4.56% | | | | | | | | | | | | | | | | |
Delaware River NJ Port Authority Pennsylvania & New Jersey Port District Project (Airport Revenue) | | | 5.00 | | | | 1-1-2017 | | | | 2,100,000 | | | | 2,100,231 | |
Delaware River NJ Port Authority Pennsylvania & New Jersey Port District Project (Airport Revenue) | | | 5.00 | | | | 1-1-2018 | | | | 1,230,000 | | | | 1,267,872 | |
Garden State NJ Preservation Open Space and Farmland Series B (Miscellaneous Revenue, AGM Insured) ¤ | | | 0.00 | | | | 11-1-2021 | | | | 8,310,000 | | | | 7,242,414 | |
The accompanying notes are an integral part of these financial statements.
| | | | |
| 18 | | Wells Fargo Strategic Municipal Bond Fund | | Portfolio of investments—December 31, 2016 (unaudited) |
| | | | | | | | | | | | | | | | |
| Security name | | Interest rate | | | Maturity date | | | Principal | | | Value | |
| | | | |
| New Jersey (continued) | | | | | | | | | | | | | | | | |
Hudson County NJ Qualified General and Water Improvements Series 2012A and 2012B (GO Revenue, AGM Insured) | | | 4.00 | % | | | 9-1-2018 | | | $ | 1,140,000 | | | $ | 1,184,540 | |
New Jersey EDA Elite Pharmaceuticals Project Series A (Industrial Development Revenue) | | | 6.50 | | | | 9-1-2030 | | | | 415,000 | | | | 355,701 | |
New Jersey EDA School Facilities Construction Project Series C (Miscellaneous Revenue) ± | | | 2.52 | | | | 2-1-2018 | | | | 6,500,000 | | | | 6,541,535 | |
New Jersey EDA School Facilities Construction Project Prerefunded Bond Series EE (Miscellaneous Revenue) | | | 5.50 | | | | 9-1-2021 | | | | 2,025,000 | | | | 2,319,354 | |
New Jersey EDA School Facilities Construction Project Series I (Miscellaneous Revenue) ± | | | 2.27 | | | | 9-1-2027 | | | | 12,500,000 | | | | 11,634,500 | |
New Jersey EDA School Facilities Construction Project Series K (Miscellaneous Revenue, Ambac Insured) | | | 5.25 | | | | 12-15-2020 | | | | 3,000,000 | | | | 3,206,040 | |
New Jersey EDA School Facilities Construction Project Series NN (Miscellaneous Revenue, AGM Insured) | | | 5.00 | | | | 3-1-2024 | | | | 1,645,000 | | | | 1,788,576 | |
New Jersey EDA School Facilities Construction Project Unrefunded Bond Series EE (Miscellaneous Revenue) | | | 5.50 | | | | 9-1-2021 | | | | 750,000 | | | | 803,948 | |
New Jersey EDA The Goethals Bridge Replacement Project (Industrial Development Revenue) | | | 5.00 | | | | 7-1-2020 | | | | 500,000 | | | | 544,480 | |
New Jersey EDA The Goethals Bridge Replacement Project (Industrial Development Revenue) | | | 5.00 | | | | 1-1-2021 | | | | 585,000 | | | | 638,048 | |
New Jersey EDA The Goethals Bridge Replacement Project (Industrial Development Revenue) | | | 5.00 | | | | 7-1-2021 | | | | 900,000 | | | | 990,819 | |
New Jersey EDA The Goethals Bridge Replacement Project (Industrial Development Revenue) | | | 5.00 | | | | 1-1-2023 | | | | 400,000 | | | | 440,072 | |
New Jersey TTFA CAB Series A (Transportation Revenue) ¤ | | | 0.00 | | | | 12-15-2026 | | | | 12,000,000 | | | | 7,676,760 | |
New Jersey TTFA Series A (Miscellaneous Revenue) | | | 5.00 | | | | 6-15-2022 | | | | 4,510,000 | | | | 4,721,609 | |
New Jersey TTFA Series A (Transportation Revenue) | | | 5.25 | | | | 12-15-2020 | | | | 1,900,000 | | | | 2,027,718 | |
New Jersey TTFA Series A (Transportation Revenue) | | | 5.25 | | | | 6-15-2022 | | | | 2,785,000 | | | | 2,943,940 | |
New Jersey TTFA Series AA (Transportation Revenue) | | | 2.50 | | | | 6-15-2018 | | | | 2,150,000 | | | | 2,149,785 | |
New Jersey TTFA Series AA (Transportation Revenue) | | | 4.00 | | | | 6-15-2018 | | | | 2,900,000 | | | | 2,961,596 | |
New Jersey TTFA Series AA (Transportation Revenue) | | | 5.00 | | | | 6-15-2023 | | | | 4,665,000 | | | | 4,924,234 | |
New Jersey TTFA Series B (Transportation Revenue) | | | 5.00 | | | | 6-15-2020 | | | | 2,000,000 | | | | 2,109,980 | |
New Jersey TTFA Series D (Transportation Revenue) | | | 5.00 | | | | 12-15-2023 | | | | 6,960,000 | | | | 7,346,628 | |
Newark NJ Housing Authority (Miscellaneous Revenue, National Insured) | | | 5.25 | | | | 1-1-2019 | | | | 2,995,000 | | | | 3,191,861 | |
Paterson NJ General Improvement (GO Revenue, AGM Insured) | | | 5.00 | | | | 6-15-2020 | | | | 400,000 | | | | 424,840 | |
South Jersey NJ Port Corporate Marine Terminal Series S-2 (Airport Revenue) | | | 5.00 | | | | 1-1-2023 | | | | 1,665,000 | | | | 1,713,668 | |
South Jersey NJ Port Corporate Marine Terminal Series S-2 (Airport Revenue) | | | 5.00 | | | | 1-1-2024 | | | | 1,750,000 | | | | 1,789,393 | |
| | | | |
| | | | | | | | | | | | | | | 85,040,142 | |
| | | | | | | | | | | | | | | | |
| | | | |
| New Mexico: 0.92% | | | | | | | | | | | | | | | | |
New Mexico Educational Assistance Foundation Series A2 (Education Revenue) ± | | | 1.32 | | | | 12-1-2028 | | | | 155,000 | | | | 154,524 | |
New Mexico Municipal Energy Acquisition Authority Gas Supply Sub Series B (Utilities Revenue, Royal Bank of Canada SPA) ± | | | 1.16 | | | | 11-1-2039 | | | | 17,100,000 | | | | 16,995,348 | |
| | | | |
| | | | | | | | | | | | | | | 17,149,872 | |
| | | | | | | | | | | | | | | | |
| | | | |
| New York: 11.85% | | | | | | | | | | | | | | | | |
Albany NY IDA Foundation State University Project Series A (Education Revenue) ø | | | 1.02 | | | | 7-1-2032 | | | | 3,030,000 | | | | 3,030,000 | |
Build New York City Resource Corporation Bronx Charter School for International Cultures & Arts Series A (Education Revenue) | | | 3.88 | | | | 4-15-2023 | | | | 1,000,000 | | | | 970,810 | |
The accompanying notes are an integral part of these financial statements.
| | | | | | |
| Portfolio of investments—December 31, 2016 (unaudited) | | Wells Fargo Strategic Municipal Bond Fund | | | 19 | |
| | | | | | | | | | | | | | | | |
| Security name | | Interest rate | | | Maturity date | | | Principal | | | Value | |
| | | | |
| New York (continued) | | | | | | | | | | | | | | | | |
East Rochester NY Housing Authority Home Good Sheperd Project Series A (Housing Revenue, Royal Bank of Scotland LOC) ø | | | 0.89 | % | | | 12-1-2036 | | | $ | 2,625,000 | | | $ | 2,625,000 | |
Glen Cove NY Local Economic Assistance Corporation CAB Series B (Industrial Development Revenue) ¤ | | | 0.00 | | | | 1-1-2045 | | | | 6,000,000 | | | | 1,082,460 | |
Monroe County NY Greece NewYork Central School (GO Revenue) | | | 2.00 | | | | 6-30-2017 | | | | 7,900,000 | | | | 7,930,178 | |
Monroe County NY Industrial Development Corporation Unity Hospital Rochester Project (Health Revenue, FHA Insured) | | | 4.20 | | | | 8-15-2025 | | | | 7,195,000 | | | | 7,203,706 | |
Nassau NY Health Care Corporation Series D-1 (Health Revenue, JPMorgan Chase & Company LOC) ø | | | 0.77 | | | | 8-1-2029 | | | | 3,000,000 | | | | 3,000,000 | |
New York City NY Municipal Water Finance Authority Water and Sewer System Series CC (Water & Sewer Revenue, Barclays Bank plc SPA) ø | | | 0.75 | | | | 6-15-2041 | | | | 13,000,000 | | | | 13,000,000 | |
New York City NY Transitional Finance Authority Sub Series 2B (Tax Revenue, Dexia Credit Local SPA) ø | | | 0.96 | | | | 11-1-2022 | | | | 7,585,000 | | | | 7,585,000 | |
New York Housing Finance Agency Manhattan Residential Market Series A (Housing Revenue, Bank of China LOC) ø | | | 0.70 | | | | 11-1-2049 | | | | 3,000,000 | | | | 3,000,000 | |
New York Local Government Assistance Corporation Series A9V (Tax Revenue, AGM Insured) ±(m)(n) | | | 0.99 | | | | 4-1-2017 | | | | 625,000 | | | | 625,000 | |
New York Metropolitan Transportation Authority Dedicated Tax Fund (Tax Revenue) ± | | | 1.67 | | | | 11-1-2019 | | | | 7,500,000 | | | | 7,567,125 | |
New York NY Adjusted Fiscal 2015 Sub Series F-5 (GO Revenue, Barclays Bank plc LIQ) ø | | | 0.75 | | | | 6-1-2044 | | | | 15,000,000 | | | | 15,000,000 | |
New York NY Energy Research & Development Authority Gas Facilities Brooklyn Union Gas Project Series A1 (Utilities Revenue, National Insured) ±(m)(n) | | | 1.28 | | | | 12-1-2020 | | | | 8,250,000 | | | | 7,920,000 | |
New York NY Industrial Development Agency Congregation Machine Chaim Incorporated (Miscellaneous Revenue, Santander Bank NA LOC) ø | | | 0.97 | | | | 5-1-2036 | | | | 7,050,000 | | | | 7,050,000 | |
New York NY Municipal Water Finance Authority Series AA3 (Water & Sewer Revenue, Dexia Credit Local SPA) ø | | | 0.93 | | | | 6-15-2032 | | | | 10,035,000 | | | | 10,035,000 | |
New York NY Series A Sub Series A-3, A-4, A-5 (GO Revenue, Landesbank Hessen-Thüringen LIQ) ø | | | 0.75 | | | | 8-1-2035 | | | | 7,000,000 | | | | 7,000,000 | |
New York NY Series J-4 (GO Revenue) ± | | | 1.27 | | | | 8-1-2025 | | | | 6,700,000 | | | | 6,702,412 | |
New York NY Transitional Finance Authority NYC Recovery Series 3 Sub Series 3C (Tax Revenue, Dexia Credit Local SPA) ø | | | 0.96 | | | | 8-1-2031 | | | | 10,000,000 | | | | 10,000,000 | |
New York NY Transitional Finance Authority Sub Series 2E (Tax Revenue, Dexia Credit Local SPA) ø | | | 1.20 | | | | 11-1-2022 | | | | 5,305,000 | | | | 5,305,000 | |
New York NY Transitional Finance Authority Sub Series A3 (Tax Revenue, Dexia Credit Local SPA) ø | | | 0.93 | | | | 8-1-2023 | | | | 18,650,000 | | | | 18,650,000 | |
New York Tender Option Bond Trust Receipts/Certificates Series 2016 (Health Revenue, Barclays Bank plc LIQ) 144Aø | | | 0.82 | | | | 7-1-2024 | | | | 5,370,000 | | | | 5,370,000 | |
New York Thruway Authority Series II (Transportation Revenue, National Insured) | | | 5.00 | | | | 1-1-2021 | | | | 5,900,000 | | | | 6,116,766 | |
New York Tobacco Settelement Asset Securitization Corporation Incorporated Series 1 (Tobacco Revenue) | | | 5.00 | | | | 6-1-2026 | | | | 6,280,000 | | | | 6,240,624 | |
New York Tobacco Settlement Financing Corporation Series A (Tobacco Revenue) | | | 5.00 | | | | 6-1-2022 | | | | 3,000,000 | | | | 3,049,170 | |
New York Tobacco Settlement Financing Corporation Series B (Tobacco Revenue) | | | 5.00 | | | | 6-1-2021 | | | | 9,500,000 | | | | 9,656,180 | |
New York Transportation Development Corporation American Airlines Incorporated John F Kennedy International Airport Project (Airport Revenue) | | | 5.00 | | | | 8-1-2020 | | | | 3,000,000 | | | | 3,120,540 | |
New York Transportation Development Corporation American Airlines Incorporated John F. Kennedy International Airport Project Series 2016 (Airport Revenue) | | | 5.00 | | | | 8-1-2026 | | | | 6,500,000 | | | | 6,703,450 | |
New York Urban Development Corporation Certificate of Participation James A Farley Post Office Project (Miscellaneous Revenue) 144A | | | 4.20 | | | | 2-1-2017 | | | | 13,925,000 | | | | 13,919,430 | |
New York Urban Development Corporation Personal Income Tax Series A (Tax Revenue) | | | 5.00 | | | | 3-15-2020 | | | | 10,000,000 | | | | 11,059,500 | |
The accompanying notes are an integral part of these financial statements.
| | | | |
| 20 | | Wells Fargo Strategic Municipal Bond Fund | | Portfolio of investments—December 31, 2016 (unaudited) |
| | | | | | | | | | | | | | | | |
| Security name | | Interest rate | | | Maturity date | | | Principal | | | Value | |
| | | | |
| New York (continued) | | | | | | | | | | | | | | | | |
Niagara NY Area Development Corporation (Education Revenue) | | | 5.00 | % | | | 5-1-2017 | | | $ | 250,000 | | | $ | 252,718 | |
Niagara NY Area Development Corporation (Education Revenue) | | | 5.00 | | | | 5-1-2018 | | | | 500,000 | | | | 519,600 | |
Oyster Bay NY (GO Revenue) | | | 3.75 | | | | 3-31-2017 | | | | 2,350,000 | | | | 2,353,337 | |
Suffolk County NY Economic Development Corporation (Health Revenue) | | | 5.00 | | | | 7-1-2017 | | | | 1,000,000 | | | | 1,019,090 | |
Suffolk County NY Tobacco Asset Securitization Corporation (Tobacco Revenue) | | | 5.00 | | | | 6-1-2019 | | | | 575,000 | | | | 616,734 | |
Suffolk County NY Tobacco Asset Securitization Corporation (Tobacco Revenue) | | | 5.00 | | | | 6-1-2020 | | | | 625,000 | | | | 682,113 | |
Suffolk County NY Village of Ocean Beach BAN (GO Revenue) | | | 2.00 | | | | 4-13-2017 | | | | 4,000,000 | | | | 4,009,000 | |
Ulster County NY Resource Recovery Agency (Resource Recovery Revenue) | | | 3.00 | | | | 3-1-2017 | | | | 900,000 | | | | 902,511 | |
| | | | |
| | | | | | | | | | | | | | | 220,872,454 | |
| | | | | | | | | | | | | | | | |
| | | | |
| Ohio: 1.85% | | | | | | | | | | | | | | | | |
Akron OH Bath and Copley Joint Township Hospital District (Health Revenue) | | | 5.00 | | | | 1-1-2031 | | | | 2,000,000 | | | | 2,280,200 | |
Akron OH Sanitary Sewer System Improvement Project (Water & Sewer Revenue, Ambac Insured) | | | 5.00 | | | | 12-1-2017 | | | | 750,000 | | | | 773,520 | |
Alliance OH Hospital Alliance Obligated Group (Health Revenue, JPMorgan Chase & Company LOC, AGC Insured) ± | | | 0.72 | | | | 12-1-2032 | | | | 4,485,000 | | | | 4,485,000 | |
Cleveland OH Airport System Series C (Airport Revenue, AGM Insured) | | | 5.00 | | | | 1-1-2020 | | | | 1,000,000 | | | | 1,000,120 | |
Cleveland OH Airport System Series C (Airport Revenue, AGM Insured) | | | 5.00 | | | | 1-1-2022 | | | | 5,000,000 | | | | 5,000,600 | |
Ohio Air Quality Development Authority PCR Facilities Refunding Bond FirstEnergy Generation Project (Resource Recovery Revenue) ± | | | 3.10 | | | | 3-1-2023 | | | | 5,315,000 | | | | 2,223,743 | |
Ohio University Hospital Health System Series B (Health Revenue) ø | | | 1.00 | | | | 1-15-2033 | | | | 5,000,000 | | | | 5,000,000 | |
Ohio University Hospital Health System Series B (Health Revenue) ø | | | 1.00 | | | | 1-15-2045 | | | | 10,000,000 | | | | 10,000,000 | |
Ohio Water Development Authority First Energy Nuclear Generation Project Series A (Water & Sewer Revenue) | | | 3.00 | | | | 5-15-2019 | | | | 3,685,000 | | | | 1,541,399 | |
Ohio Water Development Authority Pollution Control Series A (Industrial Development Revenue) ± | | | 3.75 | | | | 7-1-2033 | | | | 5,000,000 | | | | 2,090,150 | |
| | | | |
| | | | | | | | | | | | | | | 34,394,732 | |
| | | | | | | | | | | | | | | | |
| | | | |
| Oklahoma: 0.11% | | | | | | | | | | | | | | | | |
Comanche County OK Hospital Authority Series A (Health Revenue) | | | 5.00 | | | | 7-1-2018 | | | | 795,000 | | | | 815,479 | |
Woodward County OK PFFA Series B (Tax Revenue) | | | 3.25 | | | | 9-1-2026 | | | | 1,330,000 | | | | 1,334,070 | |
| | | | |
| | | | | | | | | | | | | | | 2,149,549 | |
| | | | | | | | | | | | | | | | |
| | | | |
| Oregon: 0.16% | | | | | | | | | | | | | | | | |
Polk County OR Hospital Facility Authority Dallas Retirement Village Project Series A (Health Revenue) | | | 3.63 | | | | 7-1-2020 | | | | 3,000,000 | | | | 2,968,920 | |
| | | | | | | | | | | | | | | | |
| | | | |
| Other: 0.10% | | | | | | | | | | | | | | | | |
Public Housing Capital Fund Trust II (Miscellaneous Revenue, HUD Insured) 144A | | | 4.50 | | | | 7-1-2022 | | | | 1,758,071 | | | | 1,795,413 | |
| | | | | | | | | | | | | | | | |
| | | | |
| Pennsylvania: 8.57% | | | | | | | | | | | | | | | | |
Allegheny County PA IDA Carnegie Museums of Pittsburgh (Miscellaneous Revenue, Citizens Bank LOC) ø | | | 0.80 | | | | 8-1-2032 | | | | 4,500,000 | | | | 4,500,000 | |
Allegheny County PA Penn Hills Schools District Series 2015 (GO Revenue, Build America Mutual Assurance Company Insured) | | | 5.00 | | | | 11-15-2022 | | | | 340,000 | | | | 378,281 | |
Allegheny County PA Penn Hills Schools District Series 2015 (GO Revenue, Build America Mutual Assurance Company Insured) | | | 5.00 | | | | 11-15-2023 | | | | 1,025,000 | | | | 1,149,702 | |
Beaver County PA IDA FirstEnergy Generation Series B (Industrial Development Revenue) ± | | | 3.50 | | | | 12-1-2035 | | | | 2,000,000 | | | | 836,040 | |
The accompanying notes are an integral part of these financial statements.
| | | | | | |
| Portfolio of investments—December 31, 2016 (unaudited) | | Wells Fargo Strategic Municipal Bond Fund | | | 21 | |
| | | | | | | | | | | | | | | | |
| Security name | | Interest rate | | | Maturity date | | | Principal | | | Value | |
| | | | |
| Pennsylvania (continued) | | | | | | | | | | | | | | | | |
Beaver County PA IDA Pollution Control First Nuclear General Project Series A (Utilities Revenue) ± | | | 2.70 | % | | | 4-1-2035 | | | $ | 2,500,000 | | | $ | 1,047,650 | |
Berks County PA Municipal Authority Reading Hospital & Medical Center Project Series B (Health Revenue) | | | 2.23 | | | | 11-1-2039 | | | | 8,750,000 | | | | 8,817,812 | |
Delaware County PA IDA Chester Charter School Series A (Education Revenue) 144A | | | 4.38 | | | | 6-1-2026 | | | | 1,785,000 | | | | 1,687,807 | |
Delaware County PA IDA Chester Community Charter School (Education Revenue) | | | 4.50 | | | | 8-15-2017 | | | | 1,040,000 | | | | 1,044,670 | |
Delaware Valley PA Regional Finance Authority (Miscellaneous Revenue) | | | 5.75 | | | | 7-1-2017 | | | | 1,191,000 | | | | 1,217,905 | |
Delaware Valley PA Regional Finance Authority Series B (Miscellaneous Revenue, Bayerische Landesbank LOC) ø | | | 0.85 | | | | 6-1-2042 | | | | 2,400,000 | | | | 2,400,000 | |
Emmaus PA General Authority Series A Sub Series A-13 (Miscellaneous Revenue, U.S. Bank NA LOC) ø | | | 0.72 | | | | 3-1-2024 | | | | 8,300,000 | | | | 8,300,000 | |
Fulton County PA IDA Medical Center Project (Health Revenue) | | | 2.40 | | | | 7-1-2020 | | | | 3,125,000 | | | | 3,053,312 | |
Montgomery County PA HEFAR Arcadia University (Education Revenue) | | | 5.00 | | | | 4-1-2022 | | | | 1,575,000 | | | | 1,725,381 | |
Montgomery County PA HEFAR Arcadia University (Education Revenue) | | | 5.00 | | | | 4-1-2023 | | | | 1,655,000 | | | | 1,826,756 | |
Montgomery County PA IDA Peco Energy Company Project Series A (Industrial Development Revenue) ± | | | 2.60 | | | | 3-1-2034 | | | | 8,500,000 | | | | 8,433,275 | |
Montgomery County PA IDA Peco Energy Company Project Series B (Industrial Development Revenue) ± | | | 2.55 | | | | 6-1-2029 | | | | 10,340,000 | | | | 10,231,223 | |
Pennsylvania EDFA Solid Waste Disposal Republic Services Incorporated Project (Resource Recovery Revenue) ± | | | 1.15 | | | | 6-1-2044 | | | | 2,000,000 | | | | 2,000,000 | |
Pennsylvania HEFAR Shippensburg University Student Services (Education Revenue) | | | 4.00 | | | | 10-1-2017 | | | | 550,000 | | | | 556,716 | |
Pennsylvania EDFA Rapid Bridge Replacement Project Series 2015 (Industrial Development Revenue) | | | 5.00 | | | | 12-31-2026 | | | | 3,415,000 | | | | 3,767,872 | |
Pennsylvania Public School Building Authority (Miscellaneous Revenue) | | | 5.00 | | | | 4-1-2019 | | | | 4,650,000 | | | | 4,919,747 | |
Pennsylvania Public School Building Authority Albert Gallatin Area School District Project (Miscellaneous Revenue) ± | | | 1.21 | | | | 9-1-2024 | | | | 3,865,000 | | | | 3,859,898 | |
Pennsylvania Refunding Bond (GO Revenue) | | | 5.00 | | | | 1-15-2022 | | | | 31,000,000 | | | | 34,988,770 | |
Pennsylvania Turnpike Commission Series A (Transportation Revenue) ± | | | 1.40 | | | | 12-1-2018 | | | | 11,150,000 | | | | 11,142,418 | |
Pennsylvania Turnpike Commission Series B (Transportation Revenue) ± | | | 2.00 | | | | 12-1-2020 | | | | 10,000,000 | | | | 10,097,200 | |
Philadelphia PA Hospital & HEFAR Temple University Health System Series B (Health Revenue) | | | 5.00 | | | | 7-1-2017 | | | | 1,500,000 | | | | 1,518,315 | |
Philadelphia PA IDA Charter School Project A (Education Revenue) | | | 4.50 | | | | 8-1-2026 | | | | 3,365,000 | | | | 3,372,672 | |
Philadelphia PA IDA Charter School Project Series 2016B (Education Revenue) | | | 4.88 | | | | 8-1-2026 | | | | 2,190,000 | | | | 2,193,241 | |
Philadelphia PA IDA Tacony Academy Christian School Project Series A-1 (Education Revenue) | | | 6.25 | | | | 6-15-2023 | | | | 730,000 | | | | 791,539 | |
Philadelphia PA School District Series B (GO Revenue) | | | 3.13 | | | | 9-1-2020 | | | | 200,000 | | | | 200,254 | |
Philadelphia PA School District Series D (GO Revenue) | | | 5.00 | | | | 9-1-2021 | | | | 2,000,000 | | | | 2,187,860 | |
Philadelphia PA School District Series D (GO Revenue) | | | 5.00 | | | | 9-1-2022 | | | | 3,565,000 | | | | 3,889,344 | |
Philadelphia PA School District Series E (GO Revenue) | | | 5.25 | | | | 9-1-2022 | | | | 1,040,000 | | | | 1,112,093 | |
Philadelphia PA School District Series E (GO Revenue) | | | 5.25 | | | | 9-1-2023 | | | | 5,770,000 | | | | 6,154,224 | |
Philadelphia PA School District Series E (GO Revenue, BHAC Insured) | | | 5.38 | | | | 9-1-2028 | | | | 2,425,000 | | | | 2,587,887 | |
Philadelphia PA School District Series F (GO Revenue) | | | 5.00 | | | | 9-1-2022 | | | | 5,000,000 | | | | 5,454,900 | |
Scranton PA (GO Revenue) | | | 5.00 | | | | 11-15-2026 | | | | 2,125,000 | | | | 2,191,215 | |
| | | | |
| | | | | | | | | | | | | | | 159,635,979 | |
| | | | | | | | | | | | | | | | |
| | | | |
| Puerto Rico: 0.87% | | | | | | | | | | | | | | | | |
Puerto Rico Electric Power Authority Refunding Bond Series LL (Utilities Revenue, National Insured) | | | 5.50 | | | | 7-1-2017 | | | | 1,000,000 | | | | 1,017,880 | |
Puerto Rico Highway & Transportation Authority Series A (Tax Revenue, Ambac Insured) ¤ | | | 0.00 | | | | 7-1-2017 | | | | 1,890,000 | | | | 1,866,904 | |
The accompanying notes are an integral part of these financial statements.
| | | | |
| 22 | | Wells Fargo Strategic Municipal Bond Fund | | Portfolio of investments—December 31, 2016 (unaudited) |
| | | | | | | | | | | | | | | | |
| Security name | | Interest rate | | | Maturity date | | | Principal | | | Value | |
| | | | |
| Puerto Rico (continued) | | | | | | | | | | | | | | | | |
Puerto Rico Highway & Transportation Authority Series BB (Transportation Revenue, Ambac Insured) | | | 5.25 | % | | | 7-1-2017 | | | $ | 3,185,000 | | | $ | 3,196,593 | |
Puerto Rico Industrial Tourist Educational Medical & Environmental Control Facilities Financing Authority Hospital Auxilio Mutuo Obligated Group Series A (Health Revenue) | | | 5.00 | | | | 7-1-2019 | | | | 1,840,000 | | | | 1,913,655 | |
Puerto Rico Municipal Finance Authority Series C (Miscellaneous Revenue, AGM Insured) | | | 5.25 | | �� | | 8-1-2017 | | | | 300,000 | | | | 305,502 | |
Puerto Rico Municipal Finance Authority Series C (Tobacco Revenue, BHAC/FGIC Insured) | | | 5.50 | | | | 7-1-2020 | | | | 7,050,000 | | | | 7,698,107 | |
Puerto Rico Public Finance Corporation Commonwealth Appropriation Bond Series B (Miscellaneous Revenue, Government Development Bank for Puerto Rico SPA) (s) | | | 5.50 | | | | 8-1-2031 | | | | 2,800,000 | | | | 224,000 | |
| | | | |
| | | | | | | | | | | | | | | 16,222,641 | |
| | | | | | | | | | | | | | | | |
| | | | |
| Rhode Island: 0.43% | | | | | | | | | | | | | | | | |
Providence RI RDA Series A (Miscellaneous Revenue) | | | 5.00 | | | | 4-1-2022 | | | | 1,940,000 | | | | 2,135,862 | |
Providence RI RDA Series A (Miscellaneous Revenue) | | | 5.00 | | | | 4-1-2023 | | | | 1,585,000 | | | | 1,757,559 | |
Rhode Island Clean Water Finance Agency Cranston Wastewater Treatment System (Miscellaneous Revenue, National Insured) | | | 5.80 | | | | 9-1-2022 | | | | 975,000 | | | | 976,414 | |
Rhode Island Housing & Mortgage Finance (Housing Revenue) | | | 6.50 | | | | 4-1-2027 | | | | 15,000 | | | | 15,173 | |
Tobacco Settlement Financing Corporation Series A (Tobacco Revenue) | | | 2.25 | | | | 6-1-2041 | | | | 3,135,000 | | | | 3,131,677 | |
| | | | |
| | | | | | | | | | | | | | | 8,016,685 | |
| | | | | | | | | | | | | | | | |
| | | | |
| South Carolina: 1.14% | | | | | | | | | | | | | | | | |
Lee County SC School Facilities Incorporated (Miscellaneous Revenue, AGM Insured) | | | 2.00 | | | | 6-1-2020 | | | | 185,000 | | | | 183,133 | |
Lee County SC School Facilities Incorporated (Miscellaneous Revenue, AGM Insured) | | | 4.00 | | | | 12-1-2019 | | | | 560,000 | | | | 588,986 | |
Lee County SC School Facilities Incorporated (Miscellaneous Revenue, AGM Insured) | | | 4.00 | | | | 12-1-2020 | | | | 375,000 | | | | 397,380 | |
South Carolina Jobs EDA Brashier Charter LLC Project (Education Revenue, SunTrust Bank LOC) ø | | | 0.80 | | | | 12-1-2038 | | | | 6,860,000 | | | | 6,860,000 | |
South Carolina Jobs EDA York Preparatory Academy Project Series A (Education Revenue) | | | 5.75 | | | | 11-1-2023 | | | | 910,000 | | | | 934,206 | |
Tender Option Bond Trust Receipts/Certificates Floaters Series 2016-XF2368 (Health Revenue, Barclays Bank plc LIQ) 144Aø | | | 0.66 | | | | 11-1-2046 | | | | 2,995,000 | | | | 2,995,000 | |
Tender Option Bond Trust Receipts/Certificates Floaters Series 2016-XM0291 (Utilities Revenue, Royal Bank of Canada LIQ) 144Aø | | | 0.63 | | | | 7-1-2018 | | | | 9,300,000 | | | | 9,300,000 | |
| | | | |
| | | | | | | | | | | | | | | 21,258,705 | |
| | | | | | | | | | | | | | | | |
| | | | |
| South Dakota: 0.06% | | | | | | | | | | | | | | | | |
South Dakota HEFA (Health Revenue) | | | 4.50 | | | | 9-1-2019 | | | | 990,000 | | | | 1,059,142 | |
| | | | | | | | | | | | | | | | |
| | | | |
| Tennessee: 1.75% | | | | | | | | | | | | | | | | |
Bristol TN Industrial Development Board The Pinnacle Project Series B (Tax Revenue) 144A¤ | | | 0.00 | | | | 12-1-2018 | | | | 500,000 | | | | 453,515 | |
Bristol TN Industrial Development Board The Pinnacle Project Series B (Tax Revenue) 144A¤ | | | 0.00 | | | | 12-1-2019 | | | | 1,205,000 | | | | 1,032,468 | |
Bristol TN Industrial Development Board The Pinnacle Project Series B (Tax Revenue) 144A¤ | | | 0.00 | | | | 12-1-2020 | | | | 1,180,000 | | | | 955,706 | |
Bristol TN Industrial Development Board The Pinnacle Project Series B (Tax Revenue) 144A¤ | | �� | 0.00 | | | | 12-1-2021 | | | | 775,000 | | | | 591,759 | |
The accompanying notes are an integral part of these financial statements.
| | | | | | |
| Portfolio of investments—December 31, 2016 (unaudited) | | Wells Fargo Strategic Municipal Bond Fund | | | 23 | |
| | | | | | | | | | | | | | | | |
| Security name | | Interest rate | | | Maturity date | | | Principal | | | Value | |
| | | | |
| Tennessee (continued) | | | | | | | | | | | | | | | | |
Bristol TN Industrial Development Board The Pinnacle Project Series B (Tax Revenue) 144A¤ | | | 0.00 | % | | | 12-1-2022 | | | $ | 1,000,000 | | | $ | 720,430 | |
Bristol TN Industrial Development Board The Pinnacle Project Series B (Tax Revenue) 144A¤ | | | 0.00 | | | | 12-1-2023 | | | | 2,000,000 | | | | 1,359,040 | |
Bristol TN Industrial Development Board The Pinnacle Project Series B (Tax Revenue) 144A¤ | | | 0.00 | | | | 12-1-2024 | | | | 1,810,000 | | | | 1,156,735 | |
Bristol TN Industrial Development Board The Pinnacle Project Series B (Tax Revenue) 144A¤ | | | 0.00 | | | | 12-1-2025 | | | | 2,000,000 | | | | 1,204,500 | |
Shelby County TN Health Educational & Housing Facilities Board Methodist Le Bonheur Series B (Health Revenue, AGM Insured, U.S. Bank NA SPA) ø | | | 0.72 | | | | 6-1-2042 | | | | 14,000,000 | | | | 14,000,000 | |
Tennessee Energy Acquisition Corporation Series A (Utilities Revenue) | | | 5.25 | | | | 9-1-2017 | | | | 1,655,000 | | | | 1,693,562 | |
Tennessee Energy Acquisition Corporation Series A (Utilities Revenue) | | | 5.25 | | | | 9-1-2018 | | | | 4,000,000 | | | | 4,223,120 | |
Tennessee Energy Acquisition Corporation Series A (Utilities Revenue) | | | 5.25 | | | | 9-1-2020 | | | | 4,720,000 | | | | 5,212,390 | |
| | | | |
| | | | | | | | | | | | | | | 32,603,225 | |
| | | | | | | | | | | | | | | | |
| | | | |
| Texas: 8.48% | | | | | | | | | | | | | | | | |
Arlington TX Higher Education Finance Corporate Education Series A (Education Revenue) | | | 4.00 | | | | 6-15-2026 | | | | 725,000 | | | | 687,655 | |
Austin TX Airport Systems Bond (Airport Revenue) | | | 5.00 | | | | 11-15-2026 | | | | 1,655,000 | | | | 1,872,103 | |
Austin TX Community College District Series A (Education Revenue) | | | 4.00 | | | | 2-1-2023 | | | | 320,000 | | | | 349,392 | |
Central Texas Regional Mobility Authority Senior Lien Series A (Transportation Revenue) | | | 5.00 | | | | 1-1-2021 | | | | 1,000,000 | | | | 1,096,660 | |
Central Texas Regional Mobility Authority Senior Lien Series A (Transportation Revenue) | | | 5.00 | | | | 1-1-2023 | | | | 500,000 | | | | 558,635 | |
Clifton TX Higher Education Finance Corporation International Leadership Series 2015A (Education Revenue) | | | 4.63 | | | | 8-15-2025 | | | | 8,905,000 | | | | 8,795,558 | |
Clifton TX Higher Education Finance Corporation Uplift Education Series A (Education Revenue) | | | 4.00 | | | | 12-1-2025 | | | | 3,740,000 | | | | 3,847,749 | |
Ector County TX Independent School District Unlimited Series 2016 (GO Revenue) | | | 5.00 | | | | 8-15-2027 | | | | 1,500,000 | | | | 1,786,275 | |
Galveston TX Wharves & Terminal Revenue (Airport Revenue) | | | 5.00 | | | | 2-1-2017 | | | | 1,100,000 | | | | 1,103,179 | |
Guadalupe County TX City of Seguin Board of Managers Hospital Mortgage Revenue Refunding and Improvement Bonds Series 2015 (Health Revenue) | | | 5.00 | | | | 12-1-2017 | | | | 725,000 | | | | 740,500 | |
Gulf Coast TX IDA (Industrial Development Revenue, BNP Paribas LOC) ø | | | 0.83 | | | | 11-1-2019 | | | | 2,850,000 | | | | 2,850,000 | |
Houston TX Airport System Subordinated Lien Series B (Airport Revenue, National Insured) | | | 5.00 | | | | 7-1-2026 | | | | 3,530,000 | | | | 3,597,847 | |
Houston TX Independent School District Series B (GO Revenue) ± | | | 1.70 | | | | 6-1-2036 | | | | 14,000,000 | | | | 14,102,480 | |
Houston TX Midtown RDA Series 2011 (Tax Revenue) | | | 5.00 | | | | 1-1-2017 | | | | 2,270,000 | | | | 2,270,227 | |
Houston TX Public Improvement Refunding Bonds Series A (GO Revenue) | | | 5.00 | | | | 3-1-2020 | | | | 11,000,000 | | | | 12,144,000 | |
Hunt TX Memorial Hospital Series 1998 (Health Revenue, AGM Insured, JPMorgan Chase & Company SPA) ø | | | 0.85 | | | | 8-15-2017 | | | | 1,395,000 | | | | 1,395,000 | |
Lewisville TX Independent School District Series B (GO Revenue) | | | 5.00 | | | | 8-15-2024 | | | | 5,290,000 | | | | 6,227,494 | |
Mesquite TX Health Facilities Development Corporation Christian Care Centers Incorporated Project Series 2016 (Health Revenue) | | | 1.75 | | | | 2-15-2018 | | | | 250,000 | | | | 249,632 | |
Mesquite TX Health Facilities Development Corporation Christian Care Centers Incorporated Project Series 2016 (Health Revenue) | | | 1.40 | | | | 2-15-2017 | | | | 225,000 | | | | 224,977 | |
Mesquite TX Health Facilities Development Corporation Christian Care Centers Incorporated Project Series 2016 (Health Revenue) | | | 1.95 | | | | 2-15-2019 | | | | 250,000 | | | | 248,797 | |
Mesquite TX Health Facilities Development Corporation Christian Care Centers Incorporated Project Series 2016 (Health Revenue) | | | 5.00 | | | | 2-15-2020 | | | | 810,000 | | | | 865,768 | |
Mesquite TX Health Facilities Development Corporation Christian Care Centers Incorporated Project Series 2016 (Health Revenue) | | | 5.00 | | | | 2-15-2021 | | | | 560,000 | | | | 605,623 | |
The accompanying notes are an integral part of these financial statements.
| | | | |
| 24 | | Wells Fargo Strategic Municipal Bond Fund | | Portfolio of investments—December 31, 2016 (unaudited) |
| | | | | | | | | | | | | | | | |
| Security name | | Interest rate | | | Maturity date | | | Principal | | | Value | |
| | | | |
| Texas (continued) | | | | | | | | | | | | | | | | |
New Hope TX Cultural Education Facilities Finance Corporation The Langford Project Series B-2 (Health Revenue) | | | 3.00 | % | | | 11-15-2021 | | | $ | 700,000 | | | $ | 677,852 | |
New Hope TX Cultural Education Facilities Finance Corporation Jubilee Academic Center (Education Revenue) 144A | | | 3.38 | | | | 8-15-2021 | | | | 1,955,000 | | | | 1,890,798 | |
Newark TX Higher Educational Finance Corporation Charter Schools Incorporated Series 2015 A (Education Revenue) 144A | | | 4.63 | | | | 8-15-2025 | | | | 1,485,000 | | | | 1,488,594 | |
North Texas Higher Education Authority Incorporated Student Loan Series 2 Class A (Education Revenue) ± | | | 1.85 | | | | 4-1-2037 | | | | 2,035,000 | | | | 1,980,666 | |
North Texas Tollway Authority System Refunding Bonds Series C (Transportation Revenue) ± | | | 1.23 | | | | 1-1-2038 | | | | 3,550,000 | | | | 3,562,177 | |
Pearland TX Permanent Improvement Series 2015 (GO Revenue) | | | 5.00 | | | | 3-1-2021 | | | | 1,000,000 | | | | 1,127,830 | |
Port Arthur TX Navigation District Jefferson County Environmental Facilities Motiva Enterprises LLC Project Series A (Resource Recovery Revenue) ø | | | 0.85 | | | | 4-1-2040 | | | | 9,450,000 | | | | 9,450,000 | |
Port Arthur TX Navigation District Jefferson County Environmental Facilities Motiva Enterprises LLC Project Series C (Resource Recovery Revenue) ø | | | 0.85 | | | | 4-1-2040 | | | | 3,100,000 | | | | 3,100,000 | |
Port Arthur TX Navigation District Jefferson County Environmental Facilities Motiva Enterprises LLC Project Series D (Resource Recovery Revenue) ø | | | 0.85 | | | | 11-1-2040 | | | | 18,000,000 | | | | 18,000,000 | |
Sam Rayburn TX Municipal Power Agency Bonds Series 2012 (Utilities Revenue) | | | 5.00 | | | | 10-1-2017 | | | | 560,000 | | | | 575,674 | |
Tarrant County TX Cultural Education Facilities Buckingham Senior Living Community Incorporated (Health Revenue) | | | 3.88 | | | | 11-15-2020 | | | | 2,500,000 | | | | 2,506,350 | |
Tarrant County TX Cultural Education Facilities Finance Corporation Series 2974 (Health Revenue, Credit Suisse LIQ) 144Aø | | | 0.92 | | | | 11-15-2029 | | | | 2,700,000 | | | | 2,700,000 | |
Tender Option Bond Trust Receipts/Certificates Floaters Series 2015 (Transportation Revenue, Barclays Bank plc LIQ) 144Aø | | | 1.01 | | | | 7-1-2021 | | | | 10,500,000 | | | | 10,500,000 | |
Tennessee Energy Acquisition Corporation Series C (Utilities Revenue) | | | 5.00 | | | | 2-1-2017 | | | | 1,010,000 | | | | 1,012,949 | |
Texas Municipal Gas Acquisition & Supply Corporation I Gas Supply Revenue Series D (Utilities Revenue) | | | 6.25 | | | | 12-15-2026 | | | | 10,000,000 | | | | 11,744,100 | |
Texas Municipal Gas Acquisition & Supply Corporation II Series B (Utilities Revenue, JPMorgan Chase & Company Guaranteed) ± | | | 1.19 | | | | 9-15-2017 | | | | 2,315,000 | | | | 2,307,013 | |
Texas New Hope ECFA Collegiate Housing Tarleton State University Series A (Housing Revenue) | | | 4.00 | | | | 4-1-2020 | | | | 185,000 | | | | 191,908 | |
Texas New Hope ECFA Collegiate Housing Tarleton State University Series A (Housing Revenue) | | | 4.00 | | | | 4-1-2021 | | | | 310,000 | | | | 321,901 | |
Texas New Hope ECFA Collegiate Housing Tarleton State University Series A (Housing Revenue) | | | 4.00 | | | | 4-1-2022 | | | | 430,000 | | | | 446,706 | |
Texas New Hope ECFA Collegiate Housing Tarleton State University Series A (Housing Revenue) | | | 5.00 | | | | 4-1-2025 | | | | 480,000 | | | | 524,002 | |
Texas PFA Southern University Financing System (Education Revenue, Build America Mutual Assurance Company Insured) | | | 5.00 | | | | 11-1-2020 | | | | 1,715,000 | | | | 1,884,888 | |
Texas PFA Southern University Financing System (Education Revenue, Build America Mutual Assurance Company Insured) | | | 5.00 | | | | 11-1-2021 | | | | 1,275,000 | | | | 1,421,536 | |
Texas General Obligation Veterans Bonds (GO Revenue) ø | | | 0.76 | | | | 12-1-2046 | | | | 5,000,000 | | | | 5,000,000 | |
Victoria TX Independent School District Unlimited Series 2016 (GO Revenue) | | | 5.00 | | | | 2-15-2026 | | | | 6,225,000 | | | | 7,422,690 | |
Wood Glen TX Housing Finance Corporation Mortgage Copperwood Project Series A (Miscellaneous Revenue, National/FHA Insured) | | | 7.65 | | | | 7-1-2022 | | | | 2,125,000 | | | | 2,481,873 | |
| | | | |
| | | | | | | | | | | | | | | 157,939,058 | |
| | | | | | | | | | | | | | | | |
|
| Utah: 0.06% | |
Utah Charter School Finance Authority Ronald Wilson Reagan Academy Project Series A (Education Revenue) 144A | | | 3.50 | | | | 2-15-2026 | | | | 1,195,000 | | | | 1,111,422 | |
| | | | | | | | | | | | | | | | |
The accompanying notes are an integral part of these financial statements.
| | | | | | |
| Portfolio of investments—December 31, 2016 (unaudited) | | Wells Fargo Strategic Municipal Bond Fund | | | 25 | |
| | | | | | | | | | | | | | | | |
| Security name | | Interest rate | | | Maturity date | | | Principal | | | Value | |
|
| Vermont: 0.93% | |
Vermont Student Assistance Corporation Education Loan Series A (Education Revenue) | | | 5.00 | % | | | 6-15-2021 | | | $ | 1,800,000 | | | $ | 1,955,196 | |
Vermont Student Assistance Corporation Education Loan Series A (Education Revenue) | | | 5.00 | | | | 6-15-2022 | | | | 550,000 | | | | 600,182 | |
Vermont Student Assistance Corporation Education Loan Series A (Education Revenue) | | | 5.00 | | | | 6-15-2023 | | | | 1,200,000 | | | | 1,320,636 | |
Vermont Student Assistance Corporation Series B Class B (Education Revenue) ± | | | 1.62 | | | | 6-2-2042 | | | | 10,778,472 | | | | 10,728,891 | |
Vermont Student Assistance Corporation Series B Class-A1 (Education Revenue) ± | | | 2.44 | | | | 6-1-2022 | | | | 2,741,524 | | | | 2,772,257 | |
| | | | |
| | | | | | | | | | | | | | | 17,377,162 | |
| | | | | | | | | | | | | | | | |
|
| Virgin Islands: 0.60% | |
Virgin Islands PFA Matching Fund Loan Note Senior Lien Series A (Tobacco Revenue) | | | 5.00 | | | | 10-1-2025 | | | | 5,000,000 | | | | 4,247,800 | |
Virgin Islands PFA Series C (Tax Revenue) | | | 5.00 | | | | 10-1-2020 | | | | 2,500,000 | | | | 2,299,525 | |
Virgin Islands PFA Series C (Tax Revenue) | | | 5.00 | | | | 10-1-2024 | | | | 3,600,000 | | | | 3,114,000 | |
Virgin Islands PFA Subordinated Lien Series C (Tobacco Revenue) | | | 5.00 | | | | 10-1-2017 | | | | 1,600,000 | | | | 1,597,424 | |
| | | | |
| | | | | | | | | | | | | | | 11,258,749 | |
| | | | | | | | | | | | | | | | |
|
| Virginia: 1.30% | |
Dulles VA Town Center CDA (Miscellaneous Revenue) | | | 4.00 | | | | 3-1-2017 | | | | 1,910,000 | | | | 1,910,783 | |
Louisa VA Electric and Power IDA Series 2008B (Utilities Revenue) ± | | | 2.15 | | | | 11-1-2035 | | | | 19,000,000 | | | | 19,026,220 | |
Petersburg VA Series 2016 (GO Revenue) 144A | | | 4.00 | | | | 10-1-2017 | | | | 1,500,000 | | | | 1,499,940 | |
Prince William County VA IDA Westminster At Lake Ridge Series 2016 (Health Revenue) | | | 1.75 | | | | 1-1-2018 | | | | 400,000 | | | | 396,128 | |
Prince William County VA IDA Westminster At Lake Ridge Series 2016 (Health Revenue) | | | 2.00 | | | | 1-1-2019 | | | | 600,000 | | | | 589,740 | |
Prince William County VA IDA Westminster At Lake Ridge Series 2016 (Health Revenue) | | | 2.25 | | | | 1-1-2020 | | | | 910,000 | | | | 888,369 | |
| | | | |
| | | | | | | | | | | | | | | 24,311,180 | |
| | | | | | | | | | | | | | | | |
|
| Washington: 1.62% | |
King County WA Sewer Series B (Water & Sewer Revenue, Landesbank Hessen-Thüringen LOC) ø | | | 0.75 | | | | 1-1-2032 | | | | 6,000,000 | | | | 6,000,000 | |
Redmond WA Library Capital Facilities Area (GO Revenue) | | | 5.00 | | | | 12-1-2017 | | | | 200,000 | | | | 200,668 | |
Seattle WA Housing Authority Newholly Phase I Series B (Housing Revenue) | | | 1.25 | | | | 4-1-2019 | | | | 4,505,000 | | | | 4,461,347 | |
Washington HCFR Catholic Health Initiatives Series B (Health Revenue) ± | | | 2.12 | | | | 1-1-2035 | | | | 11,000,000 | | | | 10,998,020 | |
Washington Housing Finance Commission Nonprofit Housing Bonds Heron’s Key Senior Living Series B-3 (Health Revenue) 144A | | | 4.38 | | | | 1-1-2021 | | | | 1,625,000 | | | | 1,618,695 | |
Washington Housing Finance Commission Wesley Homes (Health Revenue, AGC Insured) | | | 5.63 | | | | 1-1-2022 | | | | 6,545,000 | | | | 6,838,216 | |
| | | | |
| | | | | | | | | | | | | | | 30,116,946 | |
| | | | | | | | | | | | | | | | |
|
| West Virginia: 0.40% | |
West Virginia EDA Morgantown Energy Associates Project (Industrial Development Revenue) | | | 2.88 | | | | 12-15-2026 | | | | 2,395,000 | | | | 2,232,212 | |
West Virginia EDA Solid Waste Disposal Appalachian Power Company (Utilities Revenue, Mizuho Corporate Bank LOC) ø | | | 1.00 | | | | 2-1-2036 | | | | 5,275,000 | | | | 5,275,000 | |
| | | | |
| | | | | | | | | | | | | | | 7,507,212 | |
| | | | | | | | | | | | | | | | |
The accompanying notes are an integral part of these financial statements.
| | | | |
| 26 | | Wells Fargo Strategic Municipal Bond Fund | | Portfolio of investments—December 31, 2016 (unaudited) |
| | | | | | | | | | | | | | | | |
| Security name | | Interest rate | | | Maturity date | | | Principal | | | Value | |
|
| Wisconsin: 0.93% | |
Milwaukee WI RDA Public Schools Series A (Miscellaneous Revenue) | | | 5.00 | % | | | 8-1-2019 | | | $ | 3,710,000 | | | $ | 4,006,615 | |
Milwaukee WI RDA Science Education Consortium Incorporated Project Series A (Education Revenue) | | | 4.75 | | | | 8-1-2023 | | | | 1,140,000 | | | | 1,201,184 | |
Pine Lake WI PFA Preparatory Series 2015 (Education Revenue) 144A | | | 4.35 | | | | 3-1-2025 | | | | 2,710,000 | | | | 2,715,041 | |
Wisconsin HEFA Bellin Memorial Hospital Series 2015 (Health Revenue) | | | 3.00 | | | | 12-1-2020 | | | | 720,000 | | | | 744,379 | |
Wisconsin HEFA Bellin Memorial Hospital Series 2015 (Health Revenue) | | | 5.00 | | | | 12-1-2022 | | | | 755,000 | | | | 865,804 | |
Wisconsin PFA Airport Series C (Airport Revenue) | | | 5.00 | | | | 7-1-2022 | | | | 2,700,000 | | | | 2,820,123 | |
Wisconsin PFA Bancroft Neurohealth Project Series A (Health Revenue) 144A | | | 4.00 | | | | 6-1-2019 | | | | 1,270,000 | | | | 1,281,938 | |
Wisconsin PFA Bancroft Neurohealth Project Series A (Health Revenue) 144A | | | 4.00 | | | | 6-1-2020 | | | | 635,000 | | | | 637,807 | |
Wisconsin PFA Bancroft Neurohealth Project Series A (Health Revenue) 144A | | | 4.00 | | | | 6-1-2021 | | | | 1,370,000 | | | | 1,368,863 | |
Wisconsin PFA Roseman University of Health Sciences Project Series 2012 (Education Revenue) | | | 5.00 | | | | 4-1-2022 | | | | 1,685,000 | | | | 1,716,021 | |
| | | | |
| | | | | | | | | | | | | | | 17,357,775 | |
| | | | | | | | | | | | | | | | |
| |
Total Municipal Obligations (Cost $1,851,198,387) | | | | 1,839,256,192 | |
| | | | | | | | | | | | | | | | |
|
Other: 0.96% | |
Eaton Vance New York Municipal Income Trust Preferred Shares ± | | | 2.22 | | | | 9-1-2019 | | | | 10,600,000 | | | | 10,592,792 | |
Eaton Vance Ohio Municipal Bond Fund Institutional Preferred Shares 144A± | | | 1.56 | | | | 7-1-2019 | | | | 7,350,000 | | | | 7,332,507 | |
| |
Total Other (Cost $17,950,000) | | | | 17,925,299 | |
| | | | | | | | | | | | | | | | |
| | | | |
| | | Yield | | | | | | Shares | | | | |
|
Short-Term Investments: 0.23% | |
|
| Investment Companies: 0.14% | |
Wells Fargo Municipal Cash Management Fund Institutional Class (l)(u) | | | 0.67 | | | | | | | | 2,687,254 | | | | 2,688,866 | |
| | | | | | | | | | | | | | | | |
| | | | |
| | | | | | | | | Principal | | | | |
| U.S. Treasury Securities: 0.09% | |
U.S. Treasury Bill (z) | | | 0.50 | | | | 3-16-2017 | | | $ | 1,650,000 | | | | 1,648,350 | |
| | | | | | | | | | | | | | | | |
| |
Total Short-Term Investments (Cost $4,335,670) | | | | 4,337,216 | |
| | | | | | | | | | | | | | | | |
| | | | | | | | |
| Total investments in securities (Cost $1,873,484,057) * | | | 99.90 | % | | | 1,861,518,707 | |
Other assets and liabilities, net | | | 0.10 | | | | 1,833,879 | |
| | | | | | | | |
| Total net assets | | | 100.00 | % | | $ | 1,863,352,586 | |
| | | | | | | | |
| ± | Variable rate investment. The rate shown is the rate in effect at period end. |
| ø | Variable rate demand notes are subject to a demand feature which reduces the effective maturity. The maturity date shown represents the final maturity date of the security. The interest rate is determined and reset by the issuer daily, weekly, or monthly depending upon the terms of the security. The rate shown is the rate in effect at period end. |
| 144A | The security may be resold in transactions exempt from registration, normally to qualified institutional buyers, pursuant to Rule 144A under the Securities Act of 1933. |
| ¤ | The security is issued in zero coupon form with no periodic interest payments. |
| (m) | The security is an auction-rate security which has an interest rate that resets at predetermined short-term intervals through a Dutch auction. The rate shown is the rate in effect at period end. |
| (n) | The auction to set the interest rate on the security failed at period end due to insufficient investor interest. A failed auction does not itself cause a default. |
| (s) | The security is currently in default with regards to scheduled interest and/or principal payments. The Fund has stopped accruing interest on the security. |
| (l) | The issuer of the security is an affiliated person of the Fund as defined in the Investment Company Act of 1940. |
| (u) | The rate represents the 7-day annualized yield at period end. |
| (z) | Zero coupon security. The rate represents the current yield to maturity. |
| * | Cost for federal income tax purposes is $1,873,485,098 and unrealized gains (losses) consists of: |
| | | | |
Gross unrealized gains | | $ | 10,222,662 | |
Gross unrealized losses | | | (22,189,053 | ) |
| | | | |
Net unrealized losses | | $ | (11,966,391 | ) |
The accompanying notes are an integral part of these financial statements.
| | | | | | |
| Statement of assets and liabilities—December 31, 2016 (unaudited) | | Wells Fargo Strategic Municipal Bond Fund | | | 27 | |
| | | | |
| | | | |
| |
Assets | | | | |
Investments | | | | |
In unaffiliated securities, at value (cost $1,870,796,668) | | $ | 1,858,829,841 | |
In affiliated securities, at value (cost $2,687,389) | | | 2,688,866 | |
| | | | |
Total investments, at value (cost $1,873,484,057) | | | 1,861,518,707 | |
Receivable for investments sold | | | 991,000 | |
Receivable for Fund shares sold | | | 13,232,567 | |
Receivable for interest | | | 14,015,342 | |
Prepaid expenses and other assets | | | 274,309 | |
| | | | |
Total assets | | | 1,890,031,925 | |
| | | | |
| |
Liabilities | | | | |
Distributions payable | | | 499,507 | |
Payable for Fund shares redeemed | | | 24,977,231 | |
Management fee payable | | | 617,944 | |
Distribution fees payable | | | 104,093 | |
Administration fees payable | | | 199,774 | |
Accrued expenses and other liabilities | | | 280,790 | |
| | | | |
Total liabilities | | | 26,679,339 | |
| | | | |
Total net assets | | $ | 1,863,352,586 | |
| | | | |
| |
NET ASSETS CONSIST OF | | | | |
Paid-in capital | | $ | 1,876,432,812 | |
Overdistributed net investment income | | | (260,316 | ) |
Accumulated net realized losses on investments | | | (854,560 | ) |
Net unrealized losses on investments | | | (11,965,350 | ) |
| | | | |
Total net assets | | $ | 1,863,352,586 | |
| | | | |
| |
COMPUTATION OF NET ASSET VALUE AND OFFERING PRICE PER SHARE | | | | |
Net assets – Class A | | $ | 683,677,619 | |
Shares outstanding – Class A1 | | | 77,354,528 | |
Net asset value per share – Class A | | | $8.84 | |
Maximum offering price per share – Class A2 | | | $9.21 | |
Net assets – Class B | | $ | 311,347 | |
Shares outstanding – Class B1 | | | 35,321 | |
Net asset value per share – Class B | | | $8.81 | |
Net assets – Class C | | $ | 152,654,461 | |
Shares outstanding – Class C1 | | | 17,211,652 | |
Net asset value per share – Class C | | | $8.87 | |
Net assets – Administrator Class | | $ | 191,050,411 | |
Shares outstanding – Administrator Class1 | | | 21,626,048 | |
Net asset value per share – Administrator Class | | | $8.83 | |
Net assets – Institutional Class | | $ | 835,658,748 | |
Shares outstanding – Institutional Class1 | | | 94,570,385 | |
Net asset value per share – Institutional Class | | | $8.84 | |
| 1 | The Fund has an unlimited number of authorized shares. |
| 2 | Maximum offering price is computed as 100/96 of net asset value. On investments of $50,000 or more, the offering price is reduced. |
The accompanying notes are an integral part of these financial statements.
| | | | |
| 28 | | Wells Fargo Strategic Municipal Bond Fund | | Statement of operations—six months ended December 31, 2016 (unaudited) |
| | | | |
| | | | |
| |
Investment income | | | | |
Interest | | $ | 20,165,784 | |
Income from affiliated securities | | | 39,486 | |
| | | | |
Total investment income | | | 20,205,270 | |
| | | | |
| |
Expenses | | | | |
Management fee | | | 3,654,321 | |
Administration fees | | | | |
Class A | | | 594,943 | |
Class B | | | 388 | |
Class C | | | 128,255 | |
Administrator Class | | | 180,094 | |
Institutional Class | | | 285,726 | |
Shareholder servicing fees | | | | |
Class A | | | 929,599 | |
Class B | | | 606 | |
Class C | | | 200,399 | |
Administrator Class | | | 448,968 | |
Distribution fees | | | | |
Class B | | | 1,817 | |
Class C | | | 601,197 | |
Custody and accounting fees | | | 56,770 | |
Professional fees | | | 31,774 | |
Registration fees | | | 79,279 | |
Shareholder report expenses | | | 21,913 | |
Trustees’ fees and expenses | | | 4,051 | |
Other fees and expenses | | | 10,194 | |
| | | | |
Total expenses | | | 7,230,294 | |
Less: Fee waivers and/or expense reimbursements | | | (105,728 | ) |
| | | | |
Net expenses | | | 7,124,566 | |
| | | | |
Net investment income | | | 13,080,704 | |
| | | | |
| |
REALIZED AND UNREALIZED GAINS (LOSSES) ON INVESTMENTS | | | | |
| |
Net realized gains (losses) on: | | | | |
Unaffiliated securities | | | (845,237 | ) |
Affiliated securities | | | 4,070 | |
Futures transactions | | | 2,062 | |
| | | | |
Net realized losses on investments | | | (839,105 | ) |
| | | | |
| |
Net change in unrealized gains (losses) on: | | | | |
Unaffiliated securities | | | (41,238,266 | ) |
Affiliated securities | | | 1,477 | |
Futures transactions | | | 2,648,964 | |
| | | | |
Net change in unrealized gains (losses) on investments | | | (38,587,825 | ) |
| | | | |
Net realized and unrealized gains (losses) on investments | | | (39,426,930 | ) |
| | | | |
Net decrease in net assets resulting from operations | | $ | (26,346,226 | ) |
| | | | |
The accompanying notes are an integral part of these financial statements.
| | | | | | |
| Statement of changes in net assets | | Wells Fargo Strategic Municipal Bond Fund | | | 29 | |
| | | | | | | | | | | | | | | | |
| | | Six months ended December 31, 2016 (unaudited) | | | Year ended June 30, 2016 | |
| | | | |
Operations | | | | | | | | | | | | | | | | |
Net investment income | | | | | | $ | 13,080,704 | | | | | | | $ | 26,730,838 | |
Net realized gains (losses) on investments | | | | | | | (839,105 | ) | | | | | | | 11,562,440 | |
Net change in unrealized gains (losses) on investments | | | | | | | (38,587,825 | ) | | | | | | | 23,239,340 | |
| | | | |
Net increase (decrease) in net assets resulting from operations | | | | | | | (26,346,226 | ) | | | | | | | 61,532,618 | |
| | | | |
| | | | |
Distributions to shareholders from | | | | | | | | | | | | | | | | |
Net investment income | | | | | | | | | | | | | | | | |
Class A | | | | | | | (4,614,753 | ) | | | | | | | (10,092,186 | ) |
Class B | | | | | | | (1,128 | ) | | | | | | | (7,361 | ) |
Class C | | | | | | | (394,000 | ) | | | | | | | (1,247,141 | ) |
Administrator Class | | | | | | | (2,399,513 | ) | | | | | | | (7,962,494 | ) |
Institutional Class | | | | | | | (5,671,304 | ) | | | | | | | (7,975,567 | ) |
Net realized gains | | | | | | | | | | | | | | | | |
Class A | | | | | | | (3,453,460 | ) | | | | | | | (1,603,578 | ) |
Class B | | | | | | | (1,604 | ) | | | | | | | (2,508 | ) |
Class C | | | | | | | (776,260 | ) | | | | | | | (403,600 | ) |
Administrator Class | | | | | | | (1,027,684 | ) | | | | | | | (1,254,440 | ) |
Institutional Class | | | | | | | (4,275,093 | ) | | | | | | | (1,022,196 | ) |
| | | | |
Total distributions to shareholders | | | | | | | (22,614,799 | ) | | | | | | | (31,571,071 | ) |
| | | | |
| | | | |
Capital share transactions | | | Shares | | | | | | | | Shares | | | | | |
Proceeds from shares sold | | | | | | | | | | | | | | | | |
Class A | | | 18,588,405 | | | | 167,027,107 | | | | 29,803,012 | | | | 268,004,154 | |
Class B | | | 0 | | | | 0 | | | | 17 | | | | 155 | |
Class C | | | 1,947,723 | | | | 17,593,906 | | | | 3,644,420 | | | | 32,849,534 | |
Administrator Class | | | 8,992,798 | | | | 80,978,226 | | | | 24,016,958 | | | | 215,580,158 | |
Institutional Class | | | 50,894,097 | | | | 455,840,390 | | | | 49,566,722 | | | | 445,463,474 | |
| | | | |
| | | | | | | 721,439,629 | | | | | | | | 961,897,475 | |
| | | | |
Reinvestment of distributions | | | | | | | | | | | | | | | | |
Class A | | | 834,310 | | | | 7,448,827 | | | | 1,210,914 | | | | 10,875,081 | |
Class B | | | 296 | | | | 2,634 | | | | 1,056 | | | | 9,452 | |
Class C | | | 110,634 | | | | 987,033 | | | | 154,668 | | | | 1,393,195 | |
Administrator Class | | | 369,967 | | | | 3,313,515 | | | | 1,002,592 | | | | 8,998,639 | |
Institutional Class | | | 895,918 | | | | 7,989,861 | | | | 720,101 | | | | 6,471,003 | |
| | | | |
| | | | | | | 19,741,870 | | | | | | | | 27,747,370 | |
| | | | |
Payment for shares redeemed | | | | | | | | | | | | | | | | |
Class A | | | (22,197,408 | ) | | | (198,630,777 | ) | | | (22,262,767 | ) | | | (199,832,447 | ) |
Class B | | | (34,570 | ) | | | (310,734 | ) | | | (42,405 | ) | | | (380,448 | ) |
Class C | | | (2,062,626 | ) | | | (18,575,944 | ) | | | (3,692,094 | ) | | | (33,238,979 | ) |
Administrator Class | | | (32,867,963 | ) | | | (294,196,247 | ) | | | (39,420,096 | ) | | | (353,739,011 | ) |
Institutional Class | | | (24,434,160 | ) | | | (218,319,056 | ) | | | (18,937,647 | ) | | | (169,986,975 | ) |
| | | | |
| | | | | | | (730,032,758 | ) | | | | | | | (757,177,860 | ) |
| | | | |
Net increase in net assets resulting from capital share transactions | | | | | | | 11,148,741 | | | | | | | | 232,466,985 | |
| | | | |
Total increase (decrease) in net assets | | | | | | | (37,812,284 | ) | | | | | | | 262,428,532 | |
| | | | |
| | | | |
Net assets | | | | | | | | | | | | | | | | |
Beginning of period | | | | | | | 1,901,164,870 | | | | | | | | 1,638,736,338 | |
| | | | |
End of period | | | | | | $ | 1,863,352,586 | | | | | | | $ | 1,901,164,870 | |
| | | | |
Overdistributed net investment income | | | | | | $ | (260,316 | ) | | | | | | $ | (260,322 | ) |
| | | | |
The accompanying notes are an integral part of these financial statements.
| | | | |
| 30 | | Wells Fargo Strategic Municipal Bond Fund | | Financial highlights |
(For a share outstanding throughout each period)
| | | | | | | | | | | | | | | | | | | | | | | | |
| | | Six months ended December 31, 2016 (unaudited) | | | Year ended June 30 | |
| CLASS A | | | 2016 | | | 2015 | | | 2014 | | | 2013 | | | 2012 | |
Net asset value, beginning of period | | | $9.06 | | | | $8.90 | | | | $9.03 | | | | $8.87 | | | | $8.94 | | | | $8.77 | |
Net investment income | | | 0.06 | | | | 0.14 | | | | 0.10 | | | | 0.17 | | | | 0.13 | | | | 0.21 | |
Net realized and unrealized gains (losses) on investments | | | (0.17 | ) | | | 0.18 | | | | (0.05 | ) | | | 0.21 | | | | 0.01 | | | | 0.18 | |
| | | | | | | | | | | | | | | | | | | | | | | | |
Total from investment operations | | | (0.11 | ) | | | 0.32 | | | | 0.05 | | | | 0.38 | | | | 0.14 | | | | 0.39 | |
Distributions to shareholders from | | | | | | | | | | | | | | | | | | | | | | | | |
Net investment income | | | (0.06 | ) | | | (0.14 | ) | | | (0.10 | ) | | | (0.17 | ) | | | (0.13 | ) | | | (0.21 | ) |
Net realized gains | | | (0.05 | ) | | | (0.02 | ) | | | (0.08 | ) | | | (0.05 | ) | | | (0.08 | ) | | | (0.01 | ) |
| | | | | | | | | | | | | | | | | | | | | | | | |
Total distributions to shareholders | | | (0.11 | ) | | | (0.16 | ) | | | (0.18 | ) | | | (0.22 | ) | | | (0.21 | ) | | | (0.22 | ) |
Net asset value, end of period | | | $8.84 | | | | $9.06 | | | | $8.90 | | | | $9.03 | | | | $8.87 | | | | $8.94 | |
Total return1 | | | (1.32 | )% | | | 3.67 | % | | | 0.56 | % | | | 4.41 | % | | | 1.59 | % | | | 4.48 | % |
Ratios to average net assets (annualized) | | | | | | | | | | | | | | | | | | | | | | | | |
Gross expenses | | | 0.80 | % | | | 0.81 | % | | | 0.81 | % | | | 0.83 | % | | | 0.82 | % | | | 0.83 | % |
Net expenses | | | 0.80 | % | | | 0.81 | % | | | 0.81 | % | | | 0.82 | % | | | 0.82 | % | | | 0.83 | % |
Net investment income | | | 1.24 | % | | | 1.53 | % | | | 1.16 | % | | | 1.91 | % | | | 1.49 | % | | | 2.31 | % |
Supplemental data | | | | | | | | | | | | | | | | | | | | | | | | |
Portfolio turnover rate | | | 11 | % | | | 53 | % | | | 39 | % | | | 51 | % | | | 49 | % | | | 74 | % |
Net assets, end of period (000s omitted) | | | $683,678 | | | | $726,135 | | | | $635,610 | | | | $656,256 | | | | $609,303 | | | | $549,357 | |
| 1 | Total return calculations do not include any sales charges. Returns for periods of less than one year are not annualized. |
The accompanying notes are an integral part of these financial statements.
| | | | | | |
| Financial highlights | | Wells Fargo Strategic Municipal Bond Fund | | | 31 | |
(For a share outstanding throughout each period)
| | | | | | | | | | | | | | | | | | | | | | | | |
| | | Six months ended
December 31, 2016 (unaudited) | | | Year ended June 30 | |
| CLASS B | | | 2016 | | | 2015 | | | 2014 | | | 2013 | | | 2012 | |
Net asset value, beginning of period | | | $9.04 | | | | $8.88 | | | | $9.00 | | | | $8.85 | | | | $8.92 | | | | $8.75 | |
Net investment income | | | 0.02 | 1 | | | 0.07 | 1 | | | 0.04 | 1 | | | 0.10 | 1 | | | 0.07 | 1 | | | 0.15 | 1 |
Net realized and unrealized gains (losses) on investments | | | (0.18 | ) | | | 0.18 | | | | (0.04 | ) | | | 0.20 | | | | 0.01 | | | | 0.17 | |
| | | | | | | | | | | | | | | | | | | | | | | | |
Total from investment operations | | | (0.16 | ) | | | 0.25 | | | | (0.00 | ) | | | 0.30 | | | | 0.08 | | | | 0.32 | |
Distributions to shareholders from | | | | | | | | | | | | | | | | | | | | | | | | |
Net investment income | | | (0.02 | ) | | | (0.07 | ) | | | (0.04 | ) | | | (0.10 | ) | | | (0.07 | ) | | | (0.14 | ) |
Net realized gains | | | (0.05 | ) | | | (0.02 | ) | | | (0.08 | ) | | | (0.05 | ) | | | (0.08 | ) | | | (0.01 | ) |
| | | | | | | | | | | | | | | | | | | | | | | | |
Total distributions to shareholders | | | (0.07 | ) | | | (0.09 | ) | | | (0.12 | ) | | | (0.15 | ) | | | (0.15 | ) | | | (0.15 | ) |
Net asset value, end of period | | | $8.81 | | | | $9.04 | | | | $8.88 | | | | $9.00 | | | | $8.85 | | | | $8.92 | |
Total return2 | | | (1.80 | )% | | | 2.91 | % | | | (0.08 | )% | | | 3.53 | % | | | 0.83 | % | | | 3.71 | % |
Ratios to average net assets (annualized) | | | | | | | | | | | | | | | | | | | | | | | | |
Gross expenses | | | 1.55 | % | | | 1.56 | % | | | 1.56 | % | | | 1.58 | % | | | 1.57 | % | | | 1.58 | % |
Net expenses | | | 1.55 | % | | | 1.56 | % | | | 1.56 | % | | | 1.57 | % | | | 1.57 | % | | | 1.58 | % |
Net investment income | | | 0.47 | % | | | 0.79 | % | | | 0.40 | % | | | 1.17 | % | | | 0.77 | % | | | 1.69 | % |
Supplemental data | | | | | | | | | | | | | | | | | | | | | | | | |
Portfolio turnover rate | | | 11 | % | | | 53 | % | | | 39 | % | | | 51 | % | | | 49 | % | | | 74 | % |
Net assets, end of period (000s omitted) | | | $311 | | | | $629 | | | | $985 | | | | $1,516 | | | | $2,128 | | | | $3,738 | |
| 1 | Calculated based upon average shares outstanding |
| 2 | Total return calculations do not include any sales charges. Returns for periods of less than one year are not annualized. |
The accompanying notes are an integral part of these financial statements.
| | | | |
| 32 | | Wells Fargo Strategic Municipal Bond Fund | | Financial highlights |
(For a share outstanding throughout each period)
| | | | | | | | | | | | | | | | | | | | | | | | |
| | | Six months ended
December 31, 2016 (unaudited) | | | Year ended June 30 | |
| CLASS C | | | 2016 | | | 2015 | | | 2014 | | | 2013 | | | 2012 | |
Net asset value, beginning of period | | | $9.09 | | | | $8.94 | | | | $9.06 | | | | $8.90 | | | | $8.97 | | | | $8.80 | |
Net investment income | | | 0.02 | | | | 0.07 | | | | 0.04 | | | | 0.10 | | | | 0.07 | | | | 0.14 | |
Net realized and unrealized gains (losses) on investments | | | (0.17 | ) | | | 0.17 | | | | (0.04 | ) | | | 0.21 | | | | 0.01 | | | | 0.18 | |
| | | | | | | | | | | | | | | | | | | | | | | | |
Total from investment operations | | | (0.15 | ) | | | 0.24 | | | | 0.00 | | | | 0.31 | | | | 0.08 | | | | 0.32 | |
Distributions to shareholders from | | | | | | | | | | | | | | | | | | | | | | | | |
Net investment income | | | (0.02 | ) | | | (0.07 | ) | | | (0.04 | ) | | | (0.10 | ) | | | (0.07 | ) | | | (0.14 | ) |
Net realized gains | | | (0.05 | ) | | | (0.02 | ) | | | (0.08 | ) | | | (0.05 | ) | | | (0.08 | ) | | | (0.01 | ) |
| | | | | | | | | | | | | | | | | | | | | | | | |
Total distributions to shareholders | | | (0.07 | ) | | | (0.09 | ) | | | (0.12 | ) | | | (0.15 | ) | | | (0.15 | ) | | | (0.15 | ) |
Net asset value, end of period | | | $8.87 | | | | $9.09 | | | | $8.94 | | | | $9.06 | | | | $8.90 | | | | $8.97 | |
Total return1 | | | (1.68 | )% | | | 2.78 | % | | | (0.08 | )% | | | 3.63 | % | | | 0.83 | % | | | 3.69 | % |
Ratios to average net assets (annualized) | | | | | | | | | | | | | | | | | | | | | | | | |
Gross expenses | | | 1.55 | % | | | 1.56 | % | | | 1.56 | % | | | 1.58 | % | | | 1.57 | % | | | 1.58 | % |
Net expenses | | | 1.55 | % | | | 1.56 | % | | | 1.56 | % | | | 1.57 | % | | | 1.57 | % | | | 1.58 | % |
Net investment income | | | 0.49 | % | | | 0.78 | % | | | 0.40 | % | | | 1.16 | % | | | 0.74 | % | | | 1.59 | % |
Supplemental data | | | | | | | | | | | | | | | | | | | | | | | | |
Portfolio turnover rate | | | 11 | % | | | 53 | % | | | 39 | % | | | 51 | % | | | 49 | % | | | 74 | % |
Net assets, end of period (000s omitted) | | | $152,654 | | | | $156,560 | | | | $152,882 | | | | $146,329 | | | | $152,155 | | | | $147,006 | |
| 1 | Total return calculations do not include any sales charges. Returns for periods of less than one year are not annualized. |
The accompanying notes are an integral part of these financial statements.
| | | | | | |
| Financial highlights | | Wells Fargo Strategic Municipal Bond Fund | | | 33 | |
(For a share outstanding throughout each period)
| | | | | | | | | | | | | | | | | | | | | | | | |
| | | Six months ended
December 31, 2016 (unaudited) | | | Year ended June 30 | |
| ADMINISTRATOR CLASS | | | 2016 | | | 2015 | | | 2014 | | | 2013 | | | 2012 | |
Net asset value, beginning of period | | | $9.06 | | | | $8.90 | | | | $9.02 | | | | $8.87 | | | | $8.94 | | | | $8.76 | |
Net investment income | | | 0.06 | | | | 0.15 | | | | 0.12 | | | | 0.18 | | | | 0.15 | | | | 0.22 | |
Net realized and unrealized gains (losses) on investments | | | (0.18 | ) | | | 0.18 | | | | (0.04 | ) | | | 0.20 | | | | 0.01 | | | | 0.19 | |
| | | | | | | | | | | | | | | | | | | | | | | | |
Total from investment operations | | | (0.12 | ) | | | 0.33 | | | | 0.08 | | | | 0.38 | | | | 0.16 | | | | 0.41 | |
Distributions to shareholders from | | | | | | | | | | | | | | | | | | | | | | | | |
Net investment income | | | (0.06 | ) | | | (0.15 | ) | | | (0.12 | ) | | | (0.18 | ) | | | (0.15 | ) | | | (0.22 | ) |
Net realized gains | | | (0.05 | ) | | | (0.02 | ) | | | (0.08 | ) | | | (0.05 | ) | | | (0.08 | ) | | | (0.01 | ) |
| | | | | | | | | | | | | | | | | | | | | | | | |
Total distributions to shareholders | | | (0.11 | ) | | | (0.17 | ) | | | (0.20 | ) | | | (0.23 | ) | | | (0.23 | ) | | | (0.23 | ) |
Net asset value, end of period | | | $8.83 | | | | $9.06 | | | | $8.90 | | | | $9.02 | | | | $8.87 | | | | $8.94 | |
Total return1 | | | (1.37 | )% | | | 3.80 | % | | | 0.80 | % | | | 4.44 | % | | | 1.73 | % | | | 4.76 | % |
Ratios to average net assets (annualized) | | | | | | | | | | | | | | | | | | | | | | | | |
Gross expenses | | | 0.74 | % | | | 0.74 | % | | | 0.75 | % | | | 0.77 | % | | | 0.76 | % | | | 0.75 | % |
Net expenses | | | 0.68 | % | | | 0.68 | % | | | 0.68 | % | | | 0.68 | % | | | 0.68 | % | | | 0.68 | % |
Net investment income | | | 1.33 | % | | | 1.66 | % | | | 1.28 | % | | | 2.05 | % | | | 1.62 | % | | | 2.42 | % |
Supplemental data | | | | | | | | | | | | | | | | | | | | | | | | |
Portfolio turnover rate | | | 11 | % | | | 53 | % | | | 39 | % | | | 51 | % | | | 49 | % | | | 74 | % |
Net assets, end of period (000s omitted) | | | $191,050 | | | | $408,846 | | | | $529,945 | | | | $516,069 | | | | $521,312 | | | | $435,170 | |
| 1 | Returns for periods of less than one year are not annualized. |
The accompanying notes are an integral part of these financial statements.
| | | | |
| 34 | | Wells Fargo Strategic Municipal Bond Fund | | Financial highlights |
(For a share outstanding throughout each period)
| | | | | | | | | | | | | | | | | | | | |
| | | Six months ended December 31, 2016 (unaudited) | | | Year ended June 30 | |
| INSTITUTIONAL CLASS | | | 2016 | | | 2015 | | | 2014 | | | 20131 | |
Net asset value, beginning of period | | | $9.06 | | | | $8.90 | | | | $9.03 | | | | $8.87 | | | | $9.06 | |
Net investment income | | | 0.07 | | | | 0.17 | | | | 0.13 | | | | 0.20 | | | | 0.08 | 2 |
Net realized and unrealized gains (losses) on investments | | | (0.17 | ) | | | 0.18 | | | | (0.05 | ) | | | 0.21 | | | | (0.10 | ) |
| | | | | | | | | | | | | | | | | | | | |
Total from investment operations | | | (0.10 | ) | | | 0.35 | | | | 0.08 | | | | 0.41 | | | | (0.02 | ) |
Distributions to shareholders from | | | | | | | | | | | | | | | | | | | | |
Net investment income | | | (0.07 | ) | | | (0.17 | ) | | | (0.13 | ) | | | (0.20 | ) | | | (0.09 | ) |
Net realized gains | | | (0.05 | ) | | | (0.02 | ) | | | (0.08 | ) | | | (0.05 | ) | | | (0.08 | ) |
| | | | | | | | | | | | | | | | | | | | |
Total distributions to shareholders | | | (0.12 | ) | | | (0.19 | ) | | | (0.21 | ) | | | (0.25 | ) | | | (0.17 | ) |
Net asset value, end of period | | | $8.84 | | | | $9.06 | | | | $8.90 | | | | $9.03 | | | | $8.87 | |
Total return3 | | | (1.15 | )% | | | 4.02 | % | | | 0.89 | % | | | 4.77 | % | | | (0.28 | )% |
Ratios to average net assets (annualized) | | | | | | | | | | | | | | | | | | | | |
Gross expenses | | | 0.47 | % | | | 0.48 | % | | | 0.48 | % | | | 0.50 | % | | | 0.50 | % |
Net expenses | | | 0.47 | % | | | 0.48 | % | | | 0.48 | % | | | 0.48 | % | | | 0.48 | % |
Net investment income | | | 1.59 | % | | | 1.85 | % | | | 1.49 | % | | | 2.27 | % | | | 1.65 | % |
Supplemental data | | | | | | | | | | | | | | | | | | | | |
Portfolio turnover rate | | | 11 | % | | | 53 | % | | | 39 | % | | | 51 | % | | | 49 | % |
Net assets, end of period (000s omitted) | | | $835,659 | | | | $608,995 | | | | $319,313 | | | | $29,528 | | | | $31,868 | |
| 1 | For the period from November 30, 2012 (commencement of class operations) to June 30, 2013 |
| 2 | Calculated based upon average shares outstanding |
| 3 | Returns for periods of less than one year are not annualized. |
The accompanying notes are an integral part of these financial statements.
| | | | | | |
| Notes to financial statements (unaudited) | | Wells Fargo Strategic Municipal Bond Fund | | | 35 | |
1. ORGANIZATION
Wells Fargo Funds Trust (the “Trust”), a Delaware statutory trust organized on March 10, 1999, is an open-end management investment company registered under the Investment Company Act of 1940, as amended (the “1940 Act”). As an investment company, the Trust follows the accounting and reporting guidance in Financial Accounting Standards Board (“FASB”) Accounting Standards Codification Topic 946, Financial Services – Investment Companies. These financial statements report on the Wells Fargo Strategic Municipal Bond Fund (the “Fund”) which is a diversified series of the Trust.
2. SIGNIFICANT ACCOUNTING POLICIES
The following significant accounting policies, which are consistently followed in the preparation of the financial statements of the Fund, are in conformity with U.S. generally accepted accounting principles which require management to make estimates and assumptions that affect the reported amounts of assets and liabilities, disclosure of contingent assets and liabilities at the date of the financial statements, and the reported amounts of revenues and expenses during the reporting period. Actual results could differ from those estimates.
Securities valuation
All investments are valued each business day as of the close of regular trading on the New York Stock Exchange (generally 4 p.m. Eastern Time), although the Fund may deviate from this calculation time under unusual or unexpected circumstances.
Debt securities are valued at the evaluated bid price provided by an independent pricing service or, if a reliable price is not available, the quoted bid price from an independent broker-dealer.
Equity securities and futures that are listed on a foreign or domestic exchange or market are valued at the official closing price or, if none, the last sales price. If no sale occurs on the principal exchange or market that day, the prior day’s price will be deemed “stale” and a fair value price will be determined in accordance with the Fund’s Valuation Procedures.
Investments in registered open-end investment companies are valued at net asset value.
Investments which are not valued using any of the methods discussed above are valued at their fair value, as determined in good faith by the Board of Trustees of the Fund. The Board of Trustees has established a Valuation Committee comprised of the Trustees and has delegated to it the authority to take any actions regarding the valuation of portfolio securities that the Valuation Committee deems necessary or appropriate, including determining the fair value of portfolio securities, unless the determination has been delegated to the Management Valuation Team of Wells Fargo Funds Management, LLC (“Funds Management”). The Board of Trustees retains the authority to make or ratify any valuation decisions or approve any changes to the Valuation Procedures as it deems appropriate. On a quarterly basis, the Board of Trustees receives reports on any valuation actions taken by the Valuation Committee or the Management Valuation Team which may include items for ratification.
Valuations of fair valued securities are compared to the next actual sales price when available, or other appropriate market values, to assess the continued appropriateness of the fair valuation methodologies used. These securities are fair valued on a day-to-day basis, taking into consideration changes to appropriate market information and any significant changes to the inputs considered in the valuation process until there is a readily available price provided on an exchange or by an independent pricing service. Valuations received from an independent pricing service or independent broker-dealer quotes are periodically validated by comparisons to most recent trades and valuations provided by other independent pricing services in addition to the review of prices by the manager and/or subadviser. Unobservable inputs used in determining fair valuations are identified based on the type of security, taking into consideration factors utilized by market participants in valuing the investment, knowledge about the issuer and the current market environment.
When-issued transactions
The Fund may purchase securities on a forward commitment or when-issued basis. The Fund records a when-issued transaction on the trade date and will segregate assets in an amount at least equal in value to the Fund’s commitment to purchase when-issued securities. Securities purchased on a when-issued basis are marked-to-market daily and the Fund begins earning interest on the settlement date. Losses may arise due to changes in the market value of the underlying securities or if the counterparty does not perform under the contract.
Futures contracts
The Fund is subject to interest rate risk in the normal course of pursuing its investment objectives. The Fund may buy and sell futures contracts in order to gain exposure to, or protect against, changes in security values and interest rates. The primary risks associated with the use of futures contracts are the imperfect correlation between changes in market values of securities held by the Fund and the prices of futures contracts, and the possibility of an illiquid market.
| | | | |
| 36 | | Wells Fargo Strategic Municipal Bond Fund | | Notes to financial statements (unaudited) |
The aggregate principal amounts of the contracts are not recorded in the financial statements. Fluctuations in the value of the contracts are recorded in the Statement of Assets and Liabilities as an asset or liability and in the Statement of Operations as unrealized gains or losses until the contracts are closed, at which point they are recorded as net realized gains or losses on futures contracts. With futures contracts, there is minimal counterparty risk to the Fund since futures are exchange traded and the exchange’s clearinghouse, as counterparty to all exchange traded futures, guarantees the futures against default.
Security transactions and income recognition
Securities transactions are recorded on a trade date basis. Realized gains or losses are recorded on the basis of identified cost.
Interest income is accrued daily and bond discounts are accreted and premiums are amortized daily based on the effective interest method. To the extent debt obligations are placed on non-accrual status, any related interest income may be reduced by writing off interest receivables when the collection of all or a portion of interest has become doubtful based on consistently applied procedures. If the issuer subsequently resumes interest payments or when the collectability of interest is reasonably assured, the debt obligation is removed from non-accrual status.
Dividend income is recognized on the ex-dividend date.
Distributions to shareholders
Distributions to shareholders from net investment income are accrued daily and paid monthly. Distributions from net realized gains, if any, are recorded on the ex-dividend date. Such distributions are determined in conformity with federal income tax regulations, which may differ in amount or character from net investment income and realized gains recognized for purposes of U.S. generally accepted accounting principles.
Federal and other taxes
The Fund intends to continue to qualify as a regulated investment company by distributing substantially all of its investment company taxable and tax-exempt income and any net realized capital gains (after reduction for capital loss carryforwards) sufficient to relieve it from all, or substantially all, federal income taxes. Accordingly, no provision for federal income taxes was required.
The Fund’s income and federal excise tax returns and all financial records supporting those returns for the prior three fiscal years are subject to examination by the federal and Delaware revenue authorities. Management has analyzed the Fund’s tax positions taken on federal, state, and foreign tax returns for all open tax years and does not believe that there are any uncertain tax positions that require recognition of a tax liability.
As of June 30, 2016, the Fund had current year deferred post-October capital losses consisting of $1,483,657 in long-term losses which were recognized on the first day of the current fiscal year.
Class allocations
The separate classes of shares offered by the Fund differ principally in applicable sales charges, distribution, shareholder servicing, and administration fees. Class specific expenses are charged directly to that share class. Investment income, common expenses, and realized and unrealized gains (losses) on investments are allocated daily to each class of shares based on the relative proportion of net assets of each class.
3. FAIR VALUATION MEASUREMENTS
Fair value measurements of investments are determined within a framework that has established a fair value hierarchy based upon the various data inputs utilized in determining the value of the Fund’s investments. The three-level hierarchy gives the highest priority to unadjusted quoted prices in active markets for identical assets or liabilities (Level 1) and the lowest priority to significant unobservable inputs (Level 3). The Fund’s investments are classified within the fair value hierarchy based on the lowest level of input that is significant to the fair value measurement. The inputs are summarized into three broad levels as follows:
| ∎ | | Level 1 – quoted prices in active markets for identical securities |
| ∎ | | Level 2 – other significant observable inputs (including quoted prices for similar securities, interest rates, prepayment speeds, credit risk, use of amortized cost, etc.) |
| ∎ | | Level 3 – significant unobservable inputs (including the Fund’s own assumptions in determining the fair value of investments) |
| | | | | | |
| Notes to financial statements (unaudited) | | Wells Fargo Strategic Municipal Bond Fund | | | 37 | |
The inputs or methodologies used for valuing investments in securities are not necessarily an indication of the risk associated with investing in those securities.
The following is a summary of the inputs used in valuing the Fund’s assets and liabilities as of December 31, 2016:
| | | | | | | | | | | | | | | | |
| | | Quoted prices
(Level 1) | | | Other significant
observable inputs
(Level 2) | | | Significant
unobservable inputs (Level 3) | | | Total | |
Assets | | | | | | | | | | | | | | | | |
Investments in: | | | | | | | | | | | | | | | | |
| | | | |
Municipal obligations | | $ | 0 | | | $ | 1,839,256,192 | | | $ | 0 | | | $ | 1,839,256,192 | |
| | | | |
Other | | | 0 | | | | 17,925,299 | | | | 0 | | | | 17,925,299 | |
| | | | |
Short-term investments | | | | | | | | | | | | | | | | |
Investment companies | | | 2,688,866 | | | | 0 | | | | 0 | | | | 2,688,866 | |
U.S. Treasury securities | | | 1,648,350 | | | | 0 | | | | 0 | | | | 1,648,350 | |
Total assets | | $ | 4,337,216 | | | $ | 1,857,181,491 | | | $ | 0 | | | $ | 1,861,518,707 | |
The Fund recognizes transfers between levels within the fair value hierarchy at the end of the reporting period. At December 31, 2016, the Fund did not have any transfers into/out of Level 1, Level 2, or Level 3.
4. TRANSACTIONS WITH AFFILIATES AND OTHER EXPENSES
Management fee
Funds Management, an indirect wholly owned subsidiary of Wells Fargo & Company (“Wells Fargo”), is the manager of the Fund and provides advisory and fund-level administrative services under an investment management agreement. Under the investment management agreement, Funds Management is responsible for, among other services, implementing the investment objectives and strategies of the Fund, supervising the subadviser, providing fund-level administrative services in connection with the Fund’s operations, and providing any other fund-level administrative services reasonably necessary for the operation of the Fund. As compensation for its services under the investment management agreement, Funds Management is entitled to receive an annual management fee starting at 0.40% and declining to 0.28% as the average daily net assets of the Fund increase. For the six months ended December 31, 2016, the management fee was equivalent to an annual rate of 0.37% of the Fund’s average daily net assets.
Funds Management has retained the services of a subadviser to provide daily portfolio management to the Fund. The fee for subadvisory services is borne by Funds Management. Wells Capital Management Incorporated, an affiliate of Funds Management and an indirect wholly owned subsidiary of Wells Fargo, is the subadviser to the Fund and is entitled to receive a fee from Funds Management at an annual rate starting at 0.20% and declining to 0.10% as the average daily net assets of the Fund increase.
Administration fees
Under a class-level administration agreement, Funds Management provides class-level administrative services to the Fund, which includes paying fees and expenses for services provided by the transfer agent, sub-transfer agents, omnibus account servicers and record-keepers. As compensation for its services under the class-level administration agreement, Funds Management receives an annual fee which is calculated based on the average daily net assets of each class as follows:
| | | | |
| | | Class-level
administration fee | |
Class A, Class B, Class C | | | 0.16 | % |
Administrator Class | | | 0.10 | |
Institutional Class | | | 0.08 | |
Funds Management has contractually waived and/or reimbursed management and administration fees to the extent necessary to maintain certain net operating expense ratios for the Fund. Waiver of fees and/or reimbursement of expenses by Funds Management were made first from fund level expenses on a proportionate basis and then from class specific expenses. Funds Management has committed through October 31, 2017 to waive fees and/or reimburse expenses to the extent necessary to cap the Fund’s expenses at 0.82% for Class A shares, 1.57% for Class B shares, 1.57% for Class C shares,
| | | | |
| 38 | | Wells Fargo Strategic Municipal Bond Fund | | Notes to financial statements (unaudited) |
0.68% for Administrator Class shares, and 0.48% for Institutional Class shares. After this time, the cap may be increased or the commitment to maintain the cap may be terminated only with the approval of the Board of Trustees.
During the six months ended December 31, 2016, State Street Bank and Trust Company, the Fund’s custodian, reimbursed the Fund $5,336 for certain out-of-pocket expenses that were billed to the Fund in error from 1998-2015. This amount is included in interest income on the Statement of Operations. In addition, Funds Management was also reimbursed $4,438 for waivers/reimbursements it made to the Fund during the period the Fund was erroneously billed.
Distribution fees
The Trust has adopted a distribution plan for Class B and Class C shares of the Fund pursuant to Rule 12b-1 under the 1940 Act. Distribution fees are charged to Class B and Class C shares and paid to Wells Fargo Funds Distributor, LLC (“Funds Distributor”), the principal underwriter, at an annual rate of 0.75% of the average daily net assets of Class B and Class C shares.
In addition, Funds Distributor is entitled to receive the front-end sales charge from the purchase of Class A shares and a contingent deferred sales charge on the redemption of certain Class A shares. Funds Distributor is also entitled to receive the contingent deferred sales charges from redemptions of Class B and Class C shares. For the six months ended December 31, 2016, Funds Distributor received $10,606 from the sale of Class A shares.
Shareholder servicing fees
The Trust has entered into contracts with one or more shareholder servicing agents, whereby Class A, Class B, Class C, and Administrator Class of the Fund are charged a fee at an annual rate of 0.25% of the average daily net assets of each respective class.
A portion of these total shareholder servicing fees were paid to affiliates of Wells Fargo.
5. INVESTMENT PORTFOLIO TRANSACTIONS
Purchases and sales of investments, excluding U.S. government obligations (if any) and short-term securities, for the six months ended December 31, 2016 were $434,986,256 and $150,933,051, respectively.
The Fund may purchase or sell investment securities to other Wells Fargo funds under procedures adopted by the Board of Trustees. The procedures have been designed to ensure that these interfund transactions, which generally do not incur broker commissions, are effected at current market prices. Interfund trades are included within the respective purchases and sales amounts shown.
6. DERIVATIVE TRANSACTIONS
During the six months ended December 31, 2016, the Fund entered into futures contracts to take advantage of the differences between municipal and treasury yields and to help manage the duration of the portfolio.
As of December 31, 2016, the Fund did not have any open futures contracts. The Fund had an average notional amount of $68,327,149 in short futures contracts during the six months ended December 31, 2016.
The realized gains and change in unrealized gains (losses) on futures contracts are reflected in the Statement of Operations.
7. BANK BORROWINGS
The Trust (excluding the money market funds and certain other funds) and Wells Fargo Variable Trust are parties to a $250,000,000 revolving credit agreement whereby the Fund is permitted to use bank borrowings for temporary or emergency purposes, such as to fund shareholder redemption requests. Interest under the credit agreement is charged to the Fund based on a borrowing rate equal to the higher of the Federal Funds rate in effect on that day plus 1.25% or the overnight LIBOR rate in effect on that day plus 1.25%. In addition, an annual commitment fee equal to 0.25% of the unused balance is allocated to each participating fund. Prior to August 30, 2016, the revolving credit agreement amount was $200,000,000 and the annual commitment fee was equal to 0.20% of the unused balance which was allocated to each participating fund.
For the six months ended December 31, 2016, there were no borrowings by the Fund under the agreement.
8. INDEMNIFICATION
Under the Trust’s organizational documents, the officers and Trustees have been granted certain indemnification rights against certain liabilities that may arise out of performance of their duties to the Trust. Additionally, in the normal course of business, the Trust may enter into contracts with service providers that contain a variety of indemnification clauses. The Trust’s maximum exposure under these arrangements is dependent on future claims that may be made against the Fund and, therefore, cannot be estimated.
| | | | | | |
| Notes to financial statements (unaudited) | | Wells Fargo Strategic Municipal Bond Fund | | | 39 | |
9. REGULATORY CHANGES
In October 2016, the Securities and Exchange Commission (“SEC”) adopted new rules and forms and amended existing rules and forms (together, “final rules”) intended to modernize and enhance the reporting and disclosure of information by registered investment companies and to enhance liquidity risk management by open-end mutual funds and exchange-traded funds. The final rules will enhance the quality of information available to investors and will allow the SEC to more effectively collect and use data reported by funds. In part, the final rules amend Regulation S-X and require standardized, enhanced disclosure about derivatives in the Fund’s financial statements, as well as other amendments. The compliance date for the amendments to Regulation S-X is August 1, 2017 while the compliance date for the new form types is June 1, 2018 and the compliance date for the liquidity risk management program requirements is December 1, 2018. Management is currently assessing the potential impact of these enhancements and their impact on the financial statement disclosures and reporting requirements.
| | | | |
| 40 | | Wells Fargo Strategic Municipal Bond Fund | | Other information (unaudited) |
PROXY VOTING INFORMATION
A description of the policies and procedures that the Fund uses to determine how to vote proxies relating to portfolio securities is available, upon request, by calling 1-800-222-8222, visiting our website at wellsfargofunds.com, or visiting the SEC website at sec.gov. Information regarding how the Fund voted proxies relating to portfolio securities during the most recent 12-month period ended June 30 is available on the Fund’s website at wellsfargofunds.com or by visiting the SEC website at sec.gov.
PORTFOLIO HOLDINGS INFORMATION
The complete portfolio holdings for the Fund are publicly available monthly on the Fund’s website (wellsfargofunds.com), on a one-month delayed basis. In addition, top ten holdings information (excluding derivative positions) for the Fund is publicly available on the Fund’s website on a monthly, seven-day or more delayed basis. The Fund files its complete schedule of portfolio holdings with the SEC for the first and third quarters of each fiscal year on Form N-Q, which is available by visiting the SEC website at sec.gov. In addition, the Fund’s Form N-Q may be reviewed and copied at the SEC’s Public Reference Room in Washington, DC, and at regional offices in New York City, at 233 Broadway, and in Chicago, at 175 West Jackson Boulevard, Suite 900. Information about the Public Reference Room may be obtained by calling 1-800-SEC-0330.
| | | | | | |
| Other information (unaudited) | | Wells Fargo Strategic Municipal Bond Fund | | | 41 | |
BOARD OF TRUSTEES AND OFFICERS
Each of the Trustees and Officers1 listed in the table below acts in identical capacities for each fund in the Wells Fargo family of funds, which consists of 139 mutual funds comprising the Wells Fargo Funds Trust, Wells Fargo Variable Trust, Wells Fargo Master Trust and four closed-end funds (collectively the “Fund Complex”). This table should be read in conjunction with the Prospectus and the Statement of Additional Information2. The mailing address of each Trustee and Officer is 525 Market Street, 12th Floor, San Francisco, CA 94105. Each Trustee and Officer serves an indefinite term, however, each Trustee serves such term until reaching the mandatory retirement age established by the Trustees.
Independent Trustees
| | | | | | |
Name and
year of birth | | Position held and
length of service* | | Principal occupations during past five years or longer | | Current other public company or investment company directorships |
William R. Ebsworth (Born 1957) | | Trustee, since 2015 | | Retired. From 1984 to 2013, equities analyst, portfolio manager, research director and chief financial officer at Fidelity Management and Research Company in Boston, Tokyo, and Hong Kong and retired in 2013 as Chief Investment Officer of Fidelity Strategic Advisers, Inc. where he lead a team of investment professionals managing client assets. Prior thereto, Board member of Hong Kong Securities Clearing Co., Hong Kong Options Clearing Corp., the Thailand International Fund, Ltd., Fidelity Investments Life Insurance Company, and Empire Fidelity Investments Life Insurance Company. Board member of the Fonté Foundation (non-profit organization) and the Vincent Memorial Hospital Endowment (non-profit organization), where he serves on the Investment Committee and as a Chair of the Audit Committee. Mr. Ebsworth is a CFA® charterholder and an Adjunct Lecturer, Finance, at Babson College. | | Asset Allocation Trust |
Jane A. Freeman (Born 1953) | | Trustee, since 2015 | | Retired. From 2012 to 2014 and 1999 to 2008, Chief Financial Officer of Scientific Learning Corporation. From 2008 to 2012, Ms. Freeman provided consulting services related to strategic business projects. Prior to 1999, Portfolio Manager at Rockefeller & Co. and Scudder, Stevens & Clark. Board member of the Harding Loevner Funds from 1996 to 2014, serving as both Lead Independent Director and chair of the Audit Committee. Board member of the Russell Exchange Traded Funds Trust from 2011 to 2012 and the chair of the Audit Committee. Ms. Freeman is a Board Member of Ruth Bancroft Garden (non-profit organization) and an inactive chartered financial analyst. | | Asset Allocation Trust |
Peter G. Gordon** (Born 1942) | | Trustee, since 1998; Chairman, since 2005 | | Co-Founder, Retired Chairman, President and CEO of Crystal Geyser Water Company. Trustee Emeritus, Colby College. | | Asset Allocation Trust |
Isaiah Harris, Jr. (Born 1952) | | Trustee, since 2009 | | Retired. Chairman of the Board of CIGNA Corporation since 2009, and Director since 2005. From 2003 to 2011, Director of Deluxe Corporation. Prior thereto, President and CEO of BellSouth Advertising and Publishing Corp. from 2005 to 2007, President and CEO of BellSouth Enterprises from 2004 to 2005 and President of BellSouth Consumer Services from 2000 to 2003. Emeritus member of the Iowa State University Foundation Board of Governors. Emeritus Member of the Advisory Board of Iowa State University School of Business. Advisory Board Member, Palm Harbor Academy (charter school). Advisory Board Member, Child Evangelism Fellowship (non-profit). Mr. Harris is a certified public accountant (inactive status). | | CIGNA Corporation; Asset Allocation Trust |
Judith M. Johnson (Born 1949) | | Trustee, since 2008; Audit Committee Chairman, since 2008 | | Retired. Prior thereto, Chief Executive Officer and Chief Investment Officer of Minneapolis Employees Retirement Fund from 1996 to 2008. Ms. Johnson is an attorney, certified public accountant and a certified managerial accountant. | | Asset Allocation Trust |
David F. Larcker (Born 1950) | | Trustee, since 2009 | | James Irvin Miller Professor of Accounting at the Graduate School of Business, Stanford University, Director of the Corporate Governance Research Initiative and Senior Faculty of The Rock Center for Corporate Governance since 2006. From 2005 to 2008, Professor of Accounting at the Graduate School of Business, Stanford University. Prior thereto, Ernst & Young Professor of Accounting at The Wharton School, University of Pennsylvania from 1985 to 2005. | | Asset Allocation Trust |
| | | | |
| 42 | | Wells Fargo Strategic Municipal Bond Fund | | Other information (unaudited) |
| | | | | | |
Name and
year of birth | | Position held and
length of service* | | Principal occupations during past five years or longer | | Current other public company or investment company directorships |
Olivia S. Mitchell (Born 1953) | | Trustee, since 2006 | | International Foundation of Employee Benefit Plans Professor, Wharton School of the University of Pennsylvania since 1993. Director of Wharton’s Pension Research Council and Boettner Center on Pensions & Retirement Research, and Research Associate at the National Bureau of Economic Research. Previously, Cornell University Professor from 1978 to 1993. | | Asset Allocation Trust |
Timothy J. Penny (Born 1951) | | Trustee, since 1996 | | President and Chief Executive Officer of Southern Minnesota Initiative Foundation, a non-profit organization, since 2007 and Senior Fellow at the Humphrey Institute Policy Forum at the University of Minnesota since 1995. Member of the Board of Trustees of NorthStar Education Finance, Inc., a non-profit organization, since 2007. | | Asset Allocation Trust |
Michael S. Scofield (Born 1943) | | Trustee, since 2010 | | Served on the Investment Company Institute’s Board of Governors and Executive Committee from 2008-2011 as well the Governing Council of the Independent Directors Council from 2006-2011 and the Independent Directors Council Executive Committee from 2008-2011. Chairman of the IDC from 2008-2010. Institutional Investor (Fund Directions) Trustee of Year in 2007. Trustee of the Evergreen Funds complex (and its predecessors) from 1984 to 2010. Chairman of the Evergreen Funds from 2000-2010. Former Trustee of the Mentor Funds. Retired Attorney, Law Offices of Michael S. Scofield. | | Asset Allocation Trust |
| * | Length of service dates reflect the Trustee’s commencement of service with the Trust’s predecessor entities, where applicable. |
| ** | Peter Gordon is expected to retire on December 31, 2017. |
Officers
| | | | | | |
Name and
year of birth | | Position held and
length of service | | Principal occupations during past five years or longer | | |
Andrew Owen3 (Born 1960) | | President, since 2017 | | Executive Vice President of Wells Fargo Bank, N.A. and President of Wells Fargo & Company and Head of Affiliated Managaers, Wells Fargo Asset Management, since 2014. Executive Vice President responsible for marketing, investments and product development for Wells Fargo Funds Management, LLC, from 2009 to 2014. | | |
Nancy Wiser1 (Born 1967) | | Treasurer, since 2012 | | Executive Vice President of Wells Fargo Funds Management, LLC since 2011. Chief Operating Officer and Chief Compliance Officer at LightBox Capital Management LLC, from 2008 to 2011. | | |
C. David Messman (Born 1960) | | Secretary, since 2000; Chief Legal Officer, since 2003 | | Senior Vice President and Secretary of Wells Fargo Funds Management, LLC since 2001. Assistant General Counsel of Wells Fargo Bank, N.A. since 2013 and Vice President and Managing Counsel of Wells Fargo Bank, N.A. from 1996 to 2013. | | |
Michael Whitaker (Born 1967) | | Chief Compliance Officer, since 2016 | | Executive Vice President of Wells Fargo Funds Management, LLC since 2016. Chief Compliance Officer of Fidelity’s Fixed Income Funds and Asset Allocation Funds from 2008 to 2016, Compliance Officer of FMR Co., Inc. from 2014 to 2016, Fidelity Investments Money Management, Inc. from 2014 to 2016, Fidelity Investments from 2007 to 2016. | | |
David Berardi (Born 1975) | | Assistant Treasurer, since 2009 | | Vice President of Wells Fargo Funds Management, LLC since 2009. Vice President of Evergreen Investment Management Company, LLC from 2008 to 2010. Manager of Fund Reporting and Control for Evergreen Investment Management Company, LLC from 2004 to 2010. | | |
| Jeremy DePalma1 (Born 1974) | | Assistant Treasurer, since 2009 | | Senior Vice President of Wells Fargo Funds Management, LLC since 2009. Senior Vice President of Evergreen Investment Management Company, LLC from 2008 to 2010 and head of the Fund Reporting and Control Team within Fund Administration from 2005 to 2010. | | |
| 1 | Nancy Wiser acts as Treasurer of 70 funds in the Fund Complex. Jeremy DePalma acts as Treasurer of 69 funds and Assistant Treasurer of 70 funds in the Fund Complex. |
| 2 | The Statement of Additional Information includes additional information about the Trustees and is available, without charge, upon request, by calling 1-800-222-8222 or by visiting the website at wellsfargofunds.com. |
| 3 | Andrew Owen became President on January 1, 2017. |
| | | | | | |
| List of abbreviations | | Wells Fargo Strategic Municipal Bond Fund | | | 43 | |
The following is a list of common abbreviations for terms and entities that may have appeared in this report.
| ACA | — ACA Financial Guaranty Corporation |
| ADR | — American depositary receipt |
| ADS | — American depositary shares |
| AGC | — Assured Guaranty Corporation |
| AGM | — Assured Guaranty Municipal |
| Ambac | — Ambac Financial Group Incorporated |
| AMT | — Alternative minimum tax |
| BAN | — Bond anticipation notes |
| BHAC | — Berkshire Hathaway Assurance Corporation |
| CAB | — Capital appreciation bond |
| CCAB | — Convertible capital appreciation bond |
| CDA | — Community Development Authority |
| CDO | — Collateralized debt obligation |
| DRIVER | — Derivative inverse tax-exempt receipts |
| DW&P | — Department of Water & Power |
| DWR | — Department of Water Resources |
| ECFA | — Educational & Cultural Facilities Authority |
| EDA | — Economic Development Authority |
| EDFA | — Economic Development Finance Authority |
| ETF | — Exchange-traded fund |
| FDIC | — Federal Deposit Insurance Corporation |
| FFCB | — Federal Farm Credit Banks |
| FGIC | — Financial Guaranty Insurance Corporation |
| FHA | — Federal Housing Administration |
| FHLB | — Federal Home Loan Bank |
| FHLMC | — Federal Home Loan Mortgage Corporation |
| FICO | — The Financing Corporation |
| FNMA | — Federal National Mortgage Association |
| GDR | — Global depositary receipt |
| GNMA | — Government National Mortgage Association |
| HCFR | — Healthcare facilities revenue |
| HEFA | — Health & Educational Facilities Authority |
| HEFAR | — Higher education facilities authority revenue |
| HFA | — Housing Finance Authority |
| HFFA | — Health Facilities Financing Authority |
| HUD | — Department of Housing and Urban Development |
| IDA | — Industrial Development Authority |
| IDAG | — Industrial Development Agency |
| KRW | — Republic of Korea won |
| LIBOR | — London Interbank Offered Rate |
| LIFER | — Long Inverse Floating Exempt Receipts |
| LLC | — Limited liability company |
| LLLP | — Limited liability limited partnership |
| LLP | — Limited liability partnership |
| MBIA | — Municipal Bond Insurance Association |
| MFHR | — Multifamily housing revenue |
| MSTR | — Municipal securities trust receipts |
| MUD | — Municipal Utility District |
| National | — National Public Finance Guarantee Corporation |
| PCFA | — Pollution Control Financing Authority |
| PCL | — Public Company Limited |
| PCR | — Pollution control revenue |
| PFA | — Public Finance Authority |
| PFFA | — Public Facilities Financing Authority |
| PFOTER | — Puttable floating option tax-exempt receipts |
| plc | — Public limited company |
| PUTTER | — Puttable tax-exempt receipts |
| R&D | — Research & development |
| Radian | — Radian Asset Assurance |
| RAN | — Revenue anticipation notes |
| RDA | — Redevelopment Authority |
| RDFA | — Redevelopment Finance Authority |
| REIT | — Real estate investment trust |
| ROC | — Reset option certificates |
| SAVRS | — Select auction variable rate securities |
| SBA | — Small Business Authority |
| SDR | — Swedish depositary receipt |
| SFHR | — Single-family housing revenue |
| SFMR | — Single-family mortgage revenue |
| SPA | — Standby purchase agreement |
| SPDR | — Standard & Poor’s Depositary Receipts |
| SPEAR | — Short Puttable Exempt Adjustable Receipts |
| STRIPS | — Separate trading of registered interest and |
| TAN | — Tax anticipation notes |
| TIPS | — Treasury inflation-protected securities |
| TRAN | — Tax revenue anticipation notes |
| TTFA | — Transportation Trust Fund Authority |
| TVA | — Tennessee Valley Authority |
This page is intentionally left blank.

For more information
More information about Wells Fargo Funds is available free upon request. To obtain literature, please write, email, visit the Fund’s website, or call:
Wells Fargo Funds
P.O. Box 8266
Boston, MA 02266-8266
Email: fundservice@wellsfargo.com
Website: wellsfargofunds.com
Individual investors: 1-800-222-8222
Retail investment professionals: 1-888-877-9275
Institutional investment professionals: 1-866-765-0778
This report and the financial statements contained herein are submitted for the general information of the shareholders of the Fund. If this report is used for promotional purposes, distribution of the report must be accompanied or preceded by a current prospectus. Before investing, please consider the investment objectives, risks, charges, and expenses of the investment. For a current prospectus and, if available, a summary prospectus, containing this information, call 1-800-222-8222 or visit the Fund’s website at wellsfargofunds.com. Read the prospectus carefully before you invest or send money.
Wells Fargo Asset Management (WFAM) is a trade name used by the asset management businesses of Wells Fargo & Company. Wells Fargo Funds Management, LLC, a wholly owned subsidiary of Wells Fargo & Company, provides investment advisory and administrative services for Wells Fargo Funds. Other affiliates of Wells Fargo & Company provide subadvisory and other services for the funds. The funds are distributed by Wells Fargo Funds Distributor, LLC, Member FINRA, an affiliate of Wells Fargo & Company. Neither Wells Fargo Funds Management nor Wells Fargo Funds Distributor has Fund customer accounts/assets, and neither provides investment advice/recommendations or acts as an investment advice fiduciary to any investor.
NOT FDIC INSURED ◾ NO BANK GUARANTEE ◾ MAY LOSE VALUE
© 2016 Wells Fargo Funds Management, LLC. All rights reserved.
| | |
 | | 300487 02-17 SA257/SAR257 12-16 |
Semi-Annual Report
December 31, 2016

Wells Fargo
Ultra Short-Term Municipal Income Fund


Reduce clutter. Save trees.
Sign up for electronic delivery of prospectuses and shareholder reports at wellsfargo.com/advantagedelivery
Contents
| * | A complete schedule of portfolio holdings as of the report date may be obtained, free of charge, by accessing the following website: https://www.wellsfargofunds.com/assets/edocs/regulatory/holdings/ultra-short-term-municipal-income-semi.pdf or by calling Wells Fargo Funds at 1-800-222-8222. This complete schedule, filed on Form N-CSRS, is also available on the SEC’s website at sec.gov. |
The views expressed and any forward-looking statements are as of December 31, 2016, unless otherwise noted, and are those of the Fund managers and/or Wells Fargo Funds Management, LLC. Discussions of individual securities, or the markets generally, or any Wells Fargo Fund are not intended as individual recommendations. Future events or results may vary significantly from those expressed in any forward-looking statements. The views expressed are subject to change at any time in response to changing circumstances in the market. Wells Fargo Funds Management, LLC and the Fund disclaim any obligation to publicly update or revise any views expressed or forward-looking statements.
NOT FDIC INSURED ◾ NO BANK GUARANTEE ◾ MAY LOSE VALUE
| | | | |
| 2 | | Wells Fargo Ultra Short-Term Municipal Income Fund | | Letter to shareholders (unaudited) |

Andrew Owen
President
Wells Fargo Funds
The Bloomberg Barclays Municipal Bond Index,1 a broad measure tracking investment-grade municipal bonds, lost 3.91% during the six-month reporting period.
Dear Shareholder:
As the new president of Wells Fargo Funds now that Karla Rabusch is retiring from that position after nearly 14 years, I am pleased to offer you this semi-annual report for the Wells Fargo Ultra Short-Term Municipal Income Fund for the six-month period that ended December 31, 2016. The Federal Reserve (Fed) raised the federal funds rate in December by 0.25%. Municipal bond yields rose sharply in the fourth quarter. The Bloomberg Barclays Municipal Bond Index,1 a broad measure tracking investment-grade municipal bonds, lost 3.91% during the six-month reporting period.
Municipal bond yields rose during the reporting period.
The municipal market reversed course in the second half of 2016, with yields increasing and prices declining. Initially the sell-off was driven by negative supply and demand trends, also known as technical factors. By the fourth quarter, fund flows turned negative (reversing a trend of 54 weeks of positive flows) and municipal bond supply increased. These deteriorating technical factors, along with the expectation of an expansionary fiscal policy and lower tax rates under the new administration, drove market volatility; credit spreads widened and the yield curve steepened as the market sold-off.
Stronger economic indicators drove monetary policy.
On December 14, the Fed hiked the short-term interest rate by 0.25% to reach a target range of 0.50% to 0.75%. This was the second rate increase in more than 10 years, with the Fed citing job gains and lower than expected unemployment of 4.6%. The Fed confirmed the continuation of an accommodative monetary policy to support a stronger labor market and reiterated its long-term objective of a 2% inflation rate, which increased slightly during the fourth quarter but fell short of the benchmark. The Fed expressed confidence in the economy’s progress and expects this positive trajectory to continue. Both sentiments helped to bolster the Fed’s expectation of three additional rate increases during 2017.
Meanwhile, the Bank of England continued its quantitative-easing program and lowered the official bank rate to 0.25% in August 2016. The Bank of Japan maintained its negative interest rate put in place earlier in the year, and in September announced an interest rate target for 10-year government bonds—keeping the yield at zero—as it struggles to accelerate economic growth. In December, the European Central Bank announced that it will extend its quantitative-easing program and continue purchasing large amounts of eurozone corporate and government debt each month through December 2017.
U.S. economic data released during the fourth quarter showed that U.S. real gross domestic product increased at an annual 3.5% rate in the third quarter, the largest increase since mid-2014. Business investment by U.S. companies was mixed, with a 12.0% increase in structures and 4.5% decrease in equipment over the prior quarter on an annualized basis. Consumer confidence hit pre-recession levels for the first time in November, and increased again in December. The dollar strengthened during the quarter’s post-election period.
Supply and demand trends reflected volatility of municipals.
Demand for municipal debt, as measured by cash flows to municipal bond mutual funds, was negative for the reporting period. There were $19 billion of inflows from July through October, but a sharp reversal occurred post-election, with
$26 billion of redemptions in the last two months of the year. This followed a
| 1 | The Bloomberg Barclays Municipal Bond Index (formerly known as Barclays Municipal Bond Index) is an unmanaged index composed of long-term tax-exempt bonds with a minimum credit rating of Baa. You cannot invest directly in an index. |
| | | | | | |
| Letter to shareholders (unaudited) | | Wells Fargo Ultra Short-Term Municipal Income Fund | | | 3 | |
noteworthy 54 consecutive weeks of inflows. On the supply side, August through October saw 30-year record-breaking volumes each month; both refundings and new issuance were up. These levels were attributed to deals pulled forward in anticipation of higher interest rates. Not surprisingly, December volume was down 25% year-over-year to $19 billion. Total municipal bond issuance for the period was $219 billion; new issuance outpaced refundings by $18 billion.
Municipal credit fundamentals were solid.
Overall, municipal credit was sound for the period. The most significant development was the election of Ricardo Rossello as governor of the Commonwealth of Puerto Rico. In the past, prices of Puerto Rico bonds reflected negative credit considerations, including defaults on its securities in 2015 and early 2016, but recent events point to a potentially more positive fiscal environment. Rossello campaigned, in part, on a platform that included promises to ultimately pay 100% of interest due on Puerto Rico’s outstanding municipal debt, negotiate with bondholders, and ration government expenditures. This stance is a major shift from his predecessor who focused on a bankruptcy mechanism.
Since the end of the financial crisis, structural changes in the fixed-income markets have reduced trading liquidity (the degree to which assets can be bought or sold without affecting the price). New regulations and capital requirements have caused traditional liquidity suppliers (banks and broker/dealers) to be more risk averse and hold less inventory. Meanwhile, corporate debt issuance has spiked as companies finance themselves at record-low yields, bond mutual funds hold larger amounts of this new debt supply, trading volumes are lower, and large-size trades are more difficult to execute. However, fixed-income markets appeared to function well over the past year with sufficient liquidity.
Don’t let short-term uncertainty derail long-term investment goals.
Periods of uncertainty can present challenges, but experience has taught us that maintaining long-term investment goals can be an effective way to plan for the future. To help you create a sound strategy based on your personal goals and risk tolerance, Wells Fargo Funds offers more than 100 mutual funds spanning a wide range of asset classes and investment styles. Although diversification cannot guarantee an investment profit or prevent losses, we believe it can be an effective way to manage investment risk and potentially smooth out overall portfolio performance. We encourage investors to know their investments and to understand that appropriate levels of risk-taking may unlock opportunities.
Thank you for choosing to invest in Wells Fargo Funds. We appreciate your confidence in us and remain committed to helping you meet your financial needs.
Sincerely,

Andrew Owen
President
Wells Fargo Funds
Periods of uncertainty can present challenges, but experience has taught us that maintaining long-term investment goals can be an effective way to plan for the future.
For further information about your Fund, contact your investment professional, visit our website at wellsfargofunds.com, or call us directly at 1-800-222-8222. We are available 24 hours a day, 7 days a week.
| | | | |
| 4 | | Wells Fargo Ultra Short-Term Municipal Income Fund | | Performance highlights (unaudited) |
Investment objective
The Fund seeks current income exempt from federal income tax, consistent with capital preservation.
Manager
Wells Fargo Funds Management, LLC
Subadviser
Wells Capital Management Incorporated
Portfolio managers
Wendy Casetta
Lyle J. Fitterer, CFA®, CPA
Average annual total returns (%) as of December 31, 20161
| | | | | | | | | | | | | | | | | | | | | | | | | | | | | | | | | | |
| | | | | Including sales charge | | | Excluding sales charge | | | Expense ratios2 (%) | |
| | | Inception date | | 1 year | | | 5 year | | | 10 year | | | 1 year | | | 5 year | | | 10 year | | | Gross | | | Net3 | |
| Class A (SMAVX) | | 10-2-2000 | | | (2.26 | ) | | | (0.17 | ) | | | 1.38 | | | | (0.26 | ) | | | 0.23 | | | | 1.58 | | | | 0.75 | | | | 0.67 | |
| Class C (WFUSX) | | 3-31-2008 | | | (1.94 | ) | | | (0.51 | ) | | | 0.84 | | | | (0.94 | ) | | | (0.51 | ) | | | 0.84 | | | | 1.50 | | | | 1.42 | |
| Administrator Class (WUSMX) | | 7-30-2010 | | | – | | | | – | | | | – | | | | (0.19 | ) | | | 0.30 | | | | 1.67 | | | | 0.69 | | | | 0.60 | |
| Institutional Class (SMAIX) | | 7-31-2000 | | | – | | | | – | | | | – | | | | 0.04 | | | | 0.53 | | | | 1.90 | | | | 0.42 | | | | 0.37 | |
| Bloomberg Barclays 1-Year Municipal Bond Index4 | | – | | | – | | | | – | | | | – | | | | 0.30 | | | | 0.63 | | | | 1.82 | | | | – | | | | – | |
Figures quoted represent past performance, which is no guarantee of future results, and do not reflect taxes that a shareholder may pay on fund distributions or the redemption of fund shares. Investment return and principal value of an investment will fluctuate so that an investor’s shares, when redeemed, may be worth more or less than their original cost. Performance shown without sales charges would be lower if sales charges were reflected. Current performance may be lower or higher than the performance data quoted, which assumes the reinvestment of dividends and capital gains. Current month-end performance is available on the Fund’s website, wellsfargofunds.com.
Index returns do not include transaction costs associated with buying and selling securities, any mutual fund fees or expenses, or any taxes. It is not possible to invest directly in an index.
For Class A shares, the maximum front-end sales charge is 2.00%. For Class C shares, the maximum contingent deferred sales charge is 1.00%. Performance including a contingent deferred sales charge assumes the sales charge for the corresponding time period. Administrator Class and Institutional Class shares are sold without a front-end sales charge or contingent deferred sales charge.
Bond values fluctuate in response to the financial condition of individual issuers, general market and economic conditions, and changes in interest rates. Changes in market conditions and government policies may lead to periods of heightened volatility in the bond market and reduced liquidity for certain bonds held by the Fund. In general, when interest rates rise, bond values fall and investors may lose principal value. Interest-rate changes and their impact on the Fund and its share price can be sudden and unpredictable. The use of derivatives may reduce returns and/or increase volatility. Certain investment strategies tend to increase the total risk of an investment (relative to the broader market). The Fund is exposed to high-yield securities risk and municipal securities risk. Consult the Fund’s prospectus for additional information on these and other risks. A portion of the Fund’s income may be subject to federal, state, and/ or local income taxes or the Alternative Minimum Tax (AMT). Any capital gains distributions may be taxable.
Please see footnotes on page 5.
| | | | | | |
| Performance highlights (unaudited) | | Wells Fargo Ultra Short-Term Municipal Income Fund | | | 5 | |
|
| Effective maturity distribution as of December 31, 20165 |
|
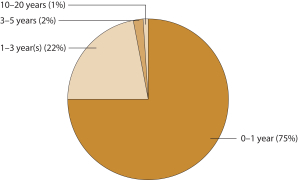 |
|
| Credit quality as of December 31, 20166 |
|
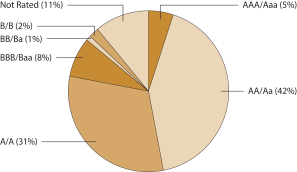 |
| 1 | Historical performance shown for Class C shares prior to their inception reflects the performance of Class A shares, adjusted to reflect the higher expenses applicable to Class C shares. Historical performance shown for Administrator Class shares prior to their inception reflects the performance of Institutional Class shares, adjusted to reflect the higher expenses applicable to Administrator Class shares. |
| 2 | Reflects the expense ratios as stated in the most recent prospectuses. The expense ratios shown are subject to change and may differ from the annualized expense ratios shown in the financial highlights of this report. |
| 3 | The manager has contractually committed through October 31, 2017, to waive fees and/or reimburse expenses to the extent necessary to cap the Fund’s Total Annual Fund Operating Expenses After Fee Waiver at the amounts shown. After this time, the cap may be increased or the commitment to maintain the cap may be terminated only with the approval of the Board of Trustees. Brokerage commissions, stamp duty fees, interest, taxes, acquired fund fees and expenses, and extraordinary expenses are excluded from the expense cap. Without this cap, the Fund’s returns would have been lower. |
| 4 | The Bloomberg Barclays 1-Year Municipal Bond Index (formerly known as Barclays 1-Year Municipal Bond Index) is the one-year component of the Bloomberg Barclays Municipal Bond Index (fomerly known as Barclays Municipal Bond Index), which is an unmanaged index composed of long-term tax-exempt bonds with a minimum credit rating of Baa. You cannot invest directly in an index. |
| 5 | Amounts are calculated based on the total investments of the Fund. These amounts are subject to change and may have changed since the date specified. |
| 6 | The credit quality distribution of portfolio holdings reflected in the chart is based on ratings from Standard & Poor’s, Moody’s Investors Service, and/ or Fitch Ratings Ltd. Credit quality ratings apply to the underlying holdings of the Fund and not to the Fund itself. The percentages of the Fund’s portfolio with the ratings depicted in the chart are calculated based on the total market value of fixed income securities held by the Fund. If a security was rated by all three rating agencies, the middle rating was utilized. If rated by two of three rating agencies, the lower rating was utilized, and if rated by one of the rating agencies, that rating was utilized. Standard & Poor’s rates the creditworthiness of bonds, ranging from AAA (highest) to D (lowest). Ratings from A to CCC may be modified by the addition of a plus (+) or minus (-) sign to show relative standing within the rating categories. Standard & Poor’s rates the creditworthiness of short-term notes from SP-1 (highest) to SP-3 (lowest). Moody’s rates the creditworthiness of bonds, ranging from Aaa (highest) to C (lowest). Ratings Aa to B may be modified by the addition of a number 1 (highest) to 3 (lowest) to show relative standing within the ratings categories. Moody’s rates the creditworthiness of short-term U.S. tax-exempt municipal securities from MIG 1/VMIG 1 (highest) to SG (lowest). Fitch rates the creditworthiness of bonds, ranging from AAA (highest) to D (lowest). Credit quality distribution is subject to change and may have changed since the date specified. |
| | | | |
| 6 | | Wells Fargo Ultra Short-Term Municipal Income Fund | | Fund expenses (unaudited) |
As a shareholder of the Fund, you incur two types of costs: (1) transaction costs, including sales charges (loads) on purchase payments and contingent deferred sales charges (if any) on redemptions and (2) ongoing costs, including management fees, distribution (12b-1) and/or shareholder servicing fees, and other Fund expenses. This example is intended to help you understand your ongoing costs (in dollars) of investing in the Fund and to compare these costs with the ongoing costs of investing in other mutual funds.
The example is based on an investment of $1,000 invested at the beginning of the six-month period and held for the entire period from July 1, 2016 to December 31, 2016.
Actual expenses
The “Actual” line of the table below provides information about actual account values and actual expenses. You may use the information in this line, together with the amount you invested, to estimate the expenses that you paid over the period. Simply divide your account value by $1,000 (for example, an $8,600 account value divided by $1,000 = 8.6), then multiply the result by the number in the “Actual” line under the heading entitled “Expenses paid during period” for your applicable class of shares to estimate the expenses you paid on your account during this period.
Hypothetical example for comparison purposes
The “Hypothetical” line of the table below provides information about hypothetical account values and hypothetical expenses based on the Fund’s actual expense ratio and an assumed rate of return of 5% per year before expenses, which is not the Fund’s actual return. The hypothetical account values and expenses may not be used to estimate the actual ending account balance or expenses you paid for the period. You may use this information to compare the ongoing costs of investing in the Fund and other funds. To do so, compare this 5% hypothetical example with the 5% hypothetical examples that appear in the shareholder reports of the other funds.
Please note that the expenses shown in the table are meant to highlight your ongoing costs only and do not reflect any transactional costs, such as sales charges (loads) and contingent deferred sales charges. Therefore, the “Hypothetical” line of the table is useful in comparing ongoing costs only and will not help you determine the relative total costs of owning different funds. In addition, if these transactional costs were included, your costs would have been higher.
| | | | | | | | | | | | | | | | |
| | | Beginning
account value
7-1-2016 | | | Ending
account value
12-31-2016 | | | Expenses
paid during
the period¹ | | | Annualized net
expense ratio | |
Class A | | | | | | | | | | | | | | | | |
Actual | | $ | 1,000.00 | | | $ | 994.26 | | | $ | 3.36 | | | | 0.67 | % |
Hypothetical (5% return before expenses) | | $ | 1,000.00 | | | $ | 1,021.77 | | | $ | 3.40 | | | | 0.67 | % |
Class C | | | | | | | | | | | | | | | | |
Actual | | $ | 1,000.00 | | | $ | 991.64 | | | $ | 7.11 | | | | 1.42 | % |
Hypothetical (5% return before expenses) | | $ | 1,000.00 | | | $ | 1,018.00 | | | $ | 7.20 | | | | 1.42 | % |
Administrator Class | | | | | | | | | | | | | | | | |
Actual | | $ | 1,000.00 | | | $ | 994.61 | | | $ | 3.01 | | | | 0.60 | % |
Hypothetical (5% return before expenses) | | $ | 1,000.00 | | | $ | 1,022.12 | | | $ | 3.05 | | | | 0.60 | % |
Institutional Class | | | | | | | | | | | | | | | | |
Actual | | $ | 1,000.00 | | | $ | 995.76 | | | $ | 1.86 | | | | 0.37 | % |
Hypothetical (5% return before expenses) | | $ | 1,000.00 | | | $ | 1,023.28 | | | $ | 1.88 | | | | 0.37 | % |
| 1 | Expenses paid is equal to the annualized net expense ratio of each class multiplied by the average account value over the period, multiplied by the number of days in the most recent fiscal half-year divided by the number of days in the fiscal year (to reflect the one-half-year period). |
| | | | | | |
| Summary portfolio of investments—December 31, 2016 (unaudited) | | Wells Fargo Ultra Short-Term Municipal Income Fund | | | 7 | |
The Summary portfolio of investments shows the 50 largest portfolio holdings in unaffiliated issuers and any holdings exceeding 1% of the total net assets as of the report date. The remaining securities held are grouped as “Other securities” in each category.
| | | | | | | | | | | | | | | | | | | | |
| Security name | | Interest rate | | | Maturity date | | | Principal | | | Value | | | Percent of
net assets | |
| | | | | |
Corporate Bonds and Notes: 0.09% | | | | | | | | | | | | | | | | | | | | |
| | | | | |
Consumer Discretionary: 0.09% | | | | | | | | | | | | | | | | | | | | |
| | | | | |
| Hotels, Restaurants & Leisure: 0.09% | | | | | | | | | | | | | | | | | | | | |
Other securities | | | | | | | | | | | | | | $ | 4,892,544 | | | | 0.09 | % |
| | | | | | | | | | | | | | | | | | | | |
| | | | | |
Total Corporate Bonds and Notes (Cost $4,933,225) | | | | | | | | | | | | | | | 4,892,544 | | | | 0.09 | |
| | | | | | | | | | | | | | | | | | | | |
| | | | | |
Municipal Obligations: 94.77% | | | | | | | | | | | | | | | | | | | | |
| | | | | |
| Alabama: 2.91% | | | | | | | | | | | | | | | | | | | | |
Chatom AL Industrial Development Board Gulf Opportunity Zone PowerSouth Energy Cooperative Projects Series A (Utilities Revenue, National Rural Utilities Finance Corporation SPA) ± | | | 0.95 | % | | | 11-15-2038 | | | $ | 35,000,000 | | | | 34,966,050 | | | | 0.65 | |
Tender Option Bond Trust Receipts/Certificates Floaters Series XM0184 (Utilities Revenue, Morgan Stanley Bank LIQ) 144Aø | | | 1.17 | | | | 9-1-2046 | | | | 31,400,000 | | | | 31,400,000 | | | | 0.58 | |
Other securities | | | | | | | | | | | | | | | 90,267,851 | | | | 1.68 | |
| | | | | |
| | | | | | | | | | | | | | | 156,633,901 | | | | 2.91 | |
| | | | | | | | | | | | | | | | | | | | |
| | | | | |
| Alaska: 0.04% | | | | | | | | | | | | | | | | | | | | |
Other securities | | | | | | | | | | | | | | | 1,936,607 | | | | 0.04 | |
| | | | | | | | | | | | | | | | | | | | |
| | | | | |
| Arizona: 1.52% | | | | | | | | | | | | | | | | | | | | |
Phoenix AZ IDA Various Republic Services Incorporated Projects (Industrial Development Revenue) ± | | | 0.90 | | | | 12-1-2035 | | | | 25,000,000 | | | | 25,000,000 | | | | 0.46 | |
Scottsdale AZ IDA Healthcare Series F (Health Revenue, AGM
Insured) ±(m) | | | 0.90 | | | | 9-1-2045 | | | | 51,000,000 | | | | 51,000,000 | | | | 0.95 | |
Other securities | | | | | | | | | | | | | | | 6,103,375 | | | | 0.11 | |
| | | | | |
| | | | | | | | | | | | | | | 82,103,375 | | | | 1.52 | |
| | | | | | | | | | | | | | | | | | | | |
| | | | | |
| Arkansas: 0.03% | | | | | | | | | | | | | | | | | | | | |
Other securities | | | | | | | | | | | | | | | 1,377,354 | | | | 0.03 | |
| | | | | | | | | | | | | | | | | | | | |
| | | | | |
| California: 6.47% | | | | | | | | | | | | | | | | | | | | |
Bay Area Toll Authority California San Francisco Bay Area Toll Bridge Series A (Transportation Revenue) ± | | | 1.00 | | | | 4-1-2047 | | | | 29,785,000 | | | | 29,771,895 | | | | 0.55 | |
California Infrastructure & Economic Development Bank The J. Paul Getty Trust Series A-2 (Miscellaneous Revenue) ± | | | 1.01 | | | | 4-1-2038 | | | | 22,920,000 | | | | 22,916,333 | | | | 0.43 | |
California Infrastructure & Economic Development Bank The J. Paul Getty Trust Series A-3 (Miscellaneous Revenue) ± | | | 1.01 | | | | 4-1-2038 | | | | 15,600,000 | | | | 15,597,504 | | | | 0.29 | |
California Infrastructure & Economic Development Bank The J. Paul Getty Trust Series A-4 (Miscellaneous Revenue) ± | | | 1.01 | | | | 4-1-2038 | | | | 32,000,000 | | | | 31,994,880 | | | | 0.59 | |
California PFOTER Series DCL-009 (GO Revenue, Dexia Credit Local LOC, AGM Insured) 144Aø | | | 0.90 | | | | 8-1-2027 | | | | 31,940,000 | | | | 31,940,000 | | | | 0.59 | |
Santa Clara CA PFOTER Series 4713 (GO Revenue, Ambac Insured, Dexia Credit Local LIQ) 144Aø | | | 1.03 | | | | 12-15-2021 | | | | 22,445,000 | | | | 22,445,000 | | | | 0.42 | |
Other securities | | | | | | | | | | | | | | | 193,621,529 | | | | 3.60 | |
| | | | | |
| | | | | | | | | | | | | | | 348,287,141 | | | | 6.47 | |
| | | | | | | | | | | | | | | | | | | | |
The accompanying notes are an integral part of these financial statements.
| | | | |
| 8 | | Wells Fargo Ultra Short-Term Municipal Income Fund | | Summary portfolio of investments—December 31, 2016 (unaudited) |
| | | | | | | | | | | | | | | | | | | | |
| Security name | | Interest rate | | | Maturity date | | | Principal | | | Value | | | Percent of
net assets | |
| | | | | |
| Colorado: 0.87% | | | | | | | | | | | | | | | | | | | | |
Other securities | | | | | | | | | | | | | | $ | 46,796,387 | | | | 0.87 | % |
| | | | | | | | | | | | | | | | | | | | |
| | | | | |
| Connecticut: 2.90% | | | | | | | | | | | | | | | | | | | | |
Connecticut HEFA (Various Revenue) | | | 0.80-4.00 | % | | | 7-1-2017 to 7-1-2048 | | | $ | 23,005,000 | | | | 22,729,068 | | | | 0.43 | |
Connecticut HEFA Yale University Series T-2 (Education Revenue) ± | | | 0.60 | | | | 7-1-2029 | | | | 34,520,000 | | | | 34,511,715 | | | | 0.64 | |
Connecticut HEFA Yale University Series X-2 (Education Revenue) ± | | | 0.90 | | | | 7-1-2037 | | | | 24,600,000 | | | | 24,504,552 | | | | 0.46 | |
Other securities | | | | | | | | | | | | | | | 74,378,510 | | | | 1.37 | |
| | | | | |
| | | | | | | | | | | | | | | 156,123,845 | | | | 2.90 | |
| | | | | | | | | | | | | | | | | | | | |
| | | | | |
| Delaware: 0.45% | | | | | | | | | | | | | | | | | | | | |
Other securities | | | | | | | | | | | | | | | 24,065,000 | | | | 0.45 | |
| | | | | | | | | | | | | | | | | | | | |
| | | | | |
| District of Columbia: 0.90% | | | | | | | | | | | | | | | | | | | | |
District of Columbia DW&P Series B (Water & Sewer Revenue, TD Bank NA SPA) ø | | | 0.72 | | | | 10-1-2050 | | | | 25,500,000 | | | | 25,500,000 | | | | 0.47 | |
Other securities | | | | | | | | | | | | | | | 22,846,665 | | | | 0.43 | |
| | | | | |
| | | | | | | | | | | | | | | 48,346,665 | | | | 0.90 | |
| | | | | | | | | | | | | | | | | | | | |
| | | | | |
| Florida: 3.37% | | | | | | | | | | | | | | | | | | | | |
Other securities | | | | | | | | | | | | | | | 181,369,948 | | | | 3.37 | |
| | | | | | | | | | | | | | | | | | | | |
| | | | | |
| Georgia: 1.17% | | | | | | | | | | | | | | | | | | | | |
Other securities | | | | | | | | | | | | | | | 63,155,711 | | | | 1.17 | |
| | | | | | | | | | | | | | | | | | | | |
| | | | | |
| Guam: 0.07% | | | | | | | | | | | | | | | | | | | | |
Other securities | | | | | | | | | | | | | | | 3,670,797 | | | | 0.07 | |
| | | | | | | | | | | | | | | | | | | | |
| | | | | |
| Hawaii: 0.08% | | | | | | | | | | | | | | | | | | | | |
Other securities | | | | | | | | | | | | | | | 4,524,652 | | | | 0.08 | |
| | | | | | | | | | | | | | | | | | | | |
| | | | | |
| Idaho: 0.42% | | | | | | | | | | | | | | | | | | | | |
Other securities | | | | | | | | | | | | | | | 22,821,650 | | | | 0.42 | |
| | | | | | | | | | | | | | | | | | | | |
| | | | | |
| Illinois: 8.85% | | | | | | | | | | | | | | | | | | | | |
Chicago IL Board of Education (Various Revenue) µ | | | 0.00-5.25 | | | | 12-1-2017 to 12-1-2018 | | | | 8,530,000 | | | | 8,163,393 | | | | 0.15 | |
Chicago IL Board of Education Series A2 (GO Revenue) ± | | | 1.48 | | | | 3-1-2035 | | | | 72,320,000 | | | | 71,103,578 | | | | 1.32 | |
Illinois (Various Revenue) | | | 2.50-5.00 | | | | 2-1-2017 to 1-1-2021 | | | | 111,455,634 | | | | 113,617,455 | | | | 2.11 | |
Regional Transportation Authority Illinois Refunding Bond Series B (Tax Revenue) ± | | | 0.85 | | | | 6-1-2025 | | | | 38,675,000 | | | | 38,675,000 | | | | 0.72 | |
Tender Option Bond Trust Receipts/Certificates Floaters Series 2016-XG0008 (Health Revenue, AGC Insured, Bank of America NA LIQ) 144Aø | | | 1.01 | | | | 8-15-2047 | | | | 23,375,000 | | | | 23,375,000 | | | | 0.43 | |
Tender Option Bond Trust Receipts/Certificates Floaters Series 2016-XG0050 (Health Revenue, Deutsche Bank LIQ) 144Aø | | | 0.92 | | | | 11-1-2039 | | | | 31,420,000 | | | | 31,420,000 | | | | 0.58 | |
Tender Option Bond Trust Receipts/Certificates Floaters Series 2016-XM0450 (Tax Revenue, Deutsche Bank LIQ) 144Aø | | | 0.83 | | | | 12-1-2036 | | | | 31,235,000 | | | | 31,235,000 | | | | 0.58 | |
Other securities | | | | | | | | | | | | | | | 158,946,816 | | | | 2.96 | |
| | | | | |
| | | | | | | | | | | | | | | 476,536,242 | | | | 8.85 | |
| | | | | | | | | | | | | | | | | | | | |
The accompanying notes are an integral part of these financial statements.
| | | | | | |
| Summary portfolio of investments—December 31, 2016 (unaudited) | | Wells Fargo Ultra Short-Term Municipal Income Fund | | | 9 | |
| | | | | | | | | | | | | | | | | | | | |
| Security name | | Interest rate | | | Maturity date | | | Principal | | | Value | | | Percent of
net assets | |
| | | | | |
| Indiana: 1.16% | | | | | | | | | | | | | | | | | | | | |
Gary IN Woodlake-Concord Project (Housing Revenue, FHA Insured) ± | | | 1.00 | % | | | 10-1-2017 | | | $ | 22,715,000 | | | $ | 22,701,598 | | | | 0.42 | % |
Other securities | | | | | | | | | | | | | | | 39,660,529 | | | | 0.74 | |
| | | | | |
| | | | | | | | | | | | | | | 62,362,127 | | | | 1.16 | |
| | | | | | | | | | | | | | | | | | | | |
| | | | | |
| Iowa: 1.21% | | | | | | | | | | | | | | | | | | | | |
Iowa Finance Authority Midwestern Disaster Area Project (Industrial Development Revenue, Korea Development Bank LOC) ø | | | 0.95 | | | | 4-1-2022 | | | | 22,500,000 | | | | 22,500,000 | | | | 0.42 | |
Other securities | | | | | | | | | | | | | | | 42,826,275 | | | | 0.79 | |
| | | | | |
| | | | | | | | | | | | | | | 65,326,275 | | | | 1.21 | |
| | | | | | | | | | | | | | | | | | | | |
| | | | | |
| Kansas: 0.45% | | | | | | | | | | | | | | | | | | | | |
Other securities | | | | | | | | | | | | | | | 24,111,695 | | | | 0.45 | |
| | | | | | | | | | | | | | | | | | | | |
| | | | | |
| Kentucky: 2.22% | | | | | | | | | | | | | | | | | | | | |
Kentucky Public Transportation Infrastructure Authority Tolls Downtown Crossing Project BAN Series A (Transportation Revenue) | | | 5.00 | | | | 7-1-2017 | | | | 55,920,000 | | | | 56,817,516 | | | | 1.05 | |
Other securities | | | | | | | | | | | | | | | 62,931,228 | | | | 1.17 | |
| | | | | |
| | | | | | | | | | | | | | | 119,748,744 | | | | 2.22 | |
| | | | | | | | | | | | | | | | | | | | |
| | | | | |
| Louisiana: 1.50% | | | | | | | | | | | | | | | | | | | | |
East Baton Rouge Parish LA Sewerage Commission Refunding Bond Series A (Water & Sewer Revenue) ± | | | 0.93 | | | | 2-1-2046 | | | | 24,000,000 | | | | 23,886,240 | | | | 0.44 | |
St. James Parish LA Nucor Steel LLC Project Gulf Opportunity Zone Series A-1 (Industrial Development Revenue) ø | | | 0.95 | | | | 11-1-2040 | | | | 35,000,000 | | | | 35,000,000 | | | | 0.65 | |
Other securities | | | | | | | | | | | | | | | 22,120,265 | | | | 0.41 | |
| | | | | |
| | | | | | | | | | | | | | | 81,006,505 | | | | 1.50 | |
| | | | | | | | | | | | | | | | | | | | |
| | | | | |
| Maryland: 2.50% | | | | | | | | | | | | | | | | | | | | |
Maryland CDA (Various Revenue) | | | 0.80-2.15 | | | | 1-1-2017 to 4-1-2019 | | | | 126,450,000 | | | | 126,007,794 | | | | 2.33 | |
Other securities | | | | | | | | | | | | | | | 8,892,147 | | | | 0.17 | |
| | | | | |
| | | | | | | | | | | | | | | 134,899,941 | | | | 2.50 | |
| | | | | | | | | | | | | | | | | | | | |
| | | | | |
| Massachusetts: 1.13% | | | | | | | | | | | | | | | | | | | | |
Other securities | | | | | | | | | | | | | | | 60,764,954 | | | | 1.13 | |
| | | | | | | | | | | | | | | | | | | | |
| | | | | |
| Michigan: 3.33% | | | | | | | | | | | | | | | | | | | | |
Michigan Finance Authority (Various Revenue) µ | | | 5.00 | | | | 7-1-2017 to 10-1-2024 | | | | 78,265,000 | | | | 81,100,867 | | | | 1.51 | |
Other securities | | | | | | | | | | | | | | | 98,208,929 | | | | 1.82 | |
| | | | | |
| | | | | | | | | | | | | | | 179,309,796 | | | | 3.33 | |
| | | | | | | | | | | | | | | | | | | | |
| | | | | |
| Minnesota: 0.67% | | | | | | | | | | | | | | | | | | | | |
Other securities | | | | | | | | | | | | | | | 36,051,563 | | | | 0.67 | |
| | | | | | | | | | | | | | | | | | | | |
| | | | | |
| Mississippi: 1.06% | | | | | | | | | | | | | | | | | | | | |
Perry County MS PCR Leaf River Forest Products Incorporated Project (Industrial Development Revenue, Georgia-Pacific LLC LOC) 144Aø | | | 0.90 | | | | 2-1-2022 | | | | 30,000,000 | | | | 30,000,000 | | | | 0.56 | |
The accompanying notes are an integral part of these financial statements.
| | | | |
| 10 | | Wells Fargo Ultra Short-Term Municipal Income Fund | | Summary portfolio of investments—December 31, 2016 (unaudited) |
| | | | | | | | | | | | | | | | | | | | |
| Security name | | Interest rate | | | Maturity date | | | Principal | | | Value | | | Percent of
net assets | |
| | | | | |
| Mississippi (continued) | | | | | | | | | | | | | | | | | | | | |
Other securities | | | | | | | | | | | | | | $ | 26,953,303 | | | | 0.50 | % |
| | | | | |
| | | | | | | | | | | | | | | 56,953,303 | | | | 1.06 | |
| | | | | | | | | | | | | | | | | | | | |
| | | | | |
| Missouri: 0.92% | | | | | | | | | | | | | | | | | | | | |
Other securities | | | | | | | | | | | | | | | 49,711,116 | | | | 0.92 | |
| | | | | | | | | | | | | | | | | | | | |
| | | | | |
| Montana: 0.15% | | | | | | | | | | | | | | | | | | | | |
Other securities | | | | | | | | | | | | | | | 8,350,000 | | | | 0.15 | |
| | | | | | | | | | | | | | | | | | | | |
| | | | | |
| Nebraska: 0.14% | | | | | | | | | | | | | | | | | | | | |
Other securities | | | | | | | | | | | | | | | 7,500,000 | | | | 0.14 | |
| | | | | | | | | | | | | | | | | | | | |
| | | | | |
| Nevada: 0.28% | | | | | | | | | | | | | | | | | | | | |
Other securities | | | | | | | | | | | | | | | 14,995,512 | | | | 0.28 | |
| | | | | | | | | | | | | | | | | | | | |
| | | | | |
| New Jersey: 6.24% | | | | | | | | | | | | | | | | | | | | |
New Jersey EDA (Various Revenue) | | | 1.46-5.00 | % | | | 2-1-2017 to 6-15-2021 | | | $ | 71,175,000 | | | | 73,450,382 | | | | 1.37 | |
Tender Option Bond Trust Receipts Floaters/Certificates Series 2016-XG0047 (Health Revenue, AGC Insured, Deutsche Bank LIQ) 144Aø | | | 1.12 | | | | 7-1-2038 | | | | 24,431,373 | | | | 24,431,373 | | | | 0.45 | |
Other securities | | | | | | | | | | | | | | | 238,535,194 | | | | 4.42 | |
| | | | | |
| | | | | | | | | | | | | | | 336,416,949 | | | | 6.24 | |
| | | | | | | | | | | | | | | | | | | | |
| | | | | |
| New Mexico: 0.75% | | | | | | | | | | | | | | | | | | | | |
New Mexico Municipal Energy Acquisition Authority Gas Supply Sub Series B (Utilities Revenue, Royal Bank of Canada SPA) ± | | | 1.16 | | | | 11-1-2039 | | | | 40,685,000 | | | | 40,436,008 | | | | 0.75 | |
| | | | | | | | | | | | | | | | | | | | |
| | | | | |
| New York: 16.35% | | | | | | | | | | | | | | | | | | | | |
Metropolitan Transportation Authority New York (Various Revenue) µ | | | 1.09-1.22 | | | | 11-1-2026 to 11-15-2044 | | | | 25,910,000 | | | | 25,867,770 | | | | 0.48 | |
Metropolitan Transportation Authority New York Sub Series D-2A (Transportation Revenue, AGM Insured) ± | | | 0.90 | | | | 11-1-2032 | | | | 36,650,000 | | | | 36,639,372 | | | | 0.68 | |
New York NY (Various Revenue) µ | | | 0.71-1.27 | | | | 8-1-2025 to 6-1-2044 | | | | 93,925,000 | | | | 93,928,911 | | | | 1.76 | |
New York NY Adjusted Fiscal 2008 Sub Series C-4 (GO Revenue, AGC
Insured) ±(m) | | | 0.84 | | | | 10-1-2027 | | | | 52,225,000 | | | | 52,225,000 | | | | 0.97 | |
New York NY Adjusted Fiscal 2015 Sub Series F-4 (GO Revenue, Bank of Tokyo-Mitsubishi LOC) ø | | | 0.75 | | | | 6-1-2044 | | | | 32,600,000 | | | | 32,600,000 | | | | 0.60 | |
New York NY Adjusted Fiscal 2017 Sub Series A-5 (GO Revenue, Landesbank Hessen-Thüringen SPA) ø | | | 0.78 | | | | 8-1-2044 | | | | 36,000,000 | | | | 36,000,000 | | | | 0.67 | |
New York NY HFA 605 West 42nd Street Series A (Housing Revenue, Bank of China LOC) ø | | | 0.90 | | | | 5-1-2048 | | | | 25,000,000 | | | | 25,000,000 | | | | 0.46 | |
New York NY Municipal Water Finance Authority Adjusted Fiscal 2013 Sub Series AA-2 (Water & Sewer Revenue, Bank of Tokyo-Mitsubishi SPA) ø | | | 0.75 | | | | 6-15-2046 | | | | 27,215,000 | | | | 27,215,000 | | | | 0.50 | |
New York NY Municipal Water Finance Authority (Various Revenue) øµ | | | 0.74-1.06 | | | | 6-15-2032 to 6-15-2050 | | | | 58,300,000 | | | | 58,300,000 | | | | 1.08 | |
New York NY Series A-6 (GO Revenue) ± | | | 1.22 | | | | 8-1-2031 | | | | 39,950,000 | | | | 39,912,447 | | | | 0.74 | |
New York NY Series J Sub Series J-3 (GO Revenue, AGM Insured) ±(m) | | | 0.84 | | | | 6-1-2036 | | | | 28,000,000 | | | | 28,000,000 | | | | 0.52 | |
The accompanying notes are an integral part of these financial statements.
| | | | | | |
| Summary portfolio of investments—December 31, 2016 (unaudited) | | Wells Fargo Ultra Short-Term Municipal Income Fund | | | 11 | |
| | | | | | | | | | | | | | | | | | | | |
| Security name | | Interest rate | | | Maturity date | | | Principal | | | Value | | | Percent of
net assets | |
| | | | | |
| New York (continued) | | | | | | | | | | | | | | | | | | | | |
New York Urban Development Corporation Certificate of Participation James A Farley Post Office Project (Miscellaneous Revenue) 144A | | | 4.20 | % | | | 2-1-2017 | | | $ | 37,290,000 | | | $ | 37,275,084 | | | | 0.69 | % |
Suffolk County NY (GO Revenue) µ | | | 1.50-2.00 | | | | 6-22-2017 to 10-15-2019 | | | | 39,380,000 | | | | 39,459,674 | | | | 0.73 | |
Suffolk County NY TAN (GO Revenue) | | | 2.00 | | | | 7-26-2017 | | | | 30,000,000 | | | | 30,113,400 | | | | 0.56 | |
Other securities | | | | | | | | | | | | | | | 318,237,318 | | | | 5.91 | |
| | | | | |
| | | | | | | | | | | | | | | 880,773,976 | | | | 16.35 | |
| | | | | | | | | | | | | | | | | | | | |
| | | | | |
| North Carolina: 1.37% | | | | | | | | | | | | | | | | | | | | |
Other securities | | | | | | | | | | | | | | | 73,589,754 | | | | 1.37 | |
| | | | | | | | | | | | | | | | | | | | |
| | | | | |
| North Dakota: 0.11% | | | | | | | | | | | | | | | | | | | | |
Other securities | | | | | | | | | | | | | | | 6,077,969 | | | | 0.11 | |
| | | | | | | | | | | | | | | | | | | | |
| | | | | |
| Ohio: 3.22% | | | | | | | | | | | | | | | | | | | | |
Other securities | | | | | | | | | | | | | | | 173,330,701 | | | | 3.22 | |
| | | | | | | | | | | | | | | | | | | | |
| | | | | |
| Oklahoma: 0.56% | | | | | | | | | | | | | | | | | | | | |
Other securities | | | | | | | | | | | | | | | 30,051,167 | | | | 0.56 | |
| | | | | | | | | | | | | | | | | | | | |
| | | | | |
| Oregon: 0.40% | | | | | | | | | | | | | | | | | | | | |
Other securities | | | | | | | | | | | | | | | 21,549,737 | | | | 0.40 | |
| | | | | | | | | | | | | | | | | | | | |
| | | | | |
| Pennsylvania: 3.82% | | | | | | | | | | | | | | | | | | | | |
Other securities | | | | | | | | | | | | | | | 205,990,703 | | | | 3.82 | |
| | | | | | | | | | | | | | | | | | | | |
| | | | | |
| Puerto Rico: 0.03% | | | | | | | | | | | | | | | | | | | | |
Other securities | | | | | | | | | | | | | | | 1,396,492 | | | | 0.03 | |
| | | | | | | | | | | | | | | | | | | | |
| | | | | |
| Rhode Island: 0.24% | | | | | | | | | | | | | | | | | | | | |
Other securities | | | | | | | | | | | | | | | 13,123,679 | | | | 0.24 | |
| | | | | | | | | | | | | | | | | | | | |
| | | | | |
| South Carolina: 0.74% | | | | | | | | | | | | | | | | | | | | |
Other securities | | | | | | | | | | | | | | | 39,848,176 | | | | 0.74 | |
| | | | | | | | | | | | | | | | | | | | |
| | | | | |
| Tennessee: 1.81% | | | | | | | | | | | | | | | | | | | | |
Shelby County TN Health Educational & Housing Facilities Board Methodist Le Bonheur Series B (Health Revenue, AGM Insured, U.S. Bank NA SPA) ø | | | 0.72 | | | | 6-1-2042 | | | | 48,000,000 | | | | 48,000,000 | | | | 0.89 | |
Other securities | | | | | | | | | | | | | | | 49,714,518 | | | | 0.92 | |
| | | | | |
| | | | | | | | | | | | | | | 97,714,518 | | | | 1.81 | |
| | | | | | | | | | | | | | | | | | | | |
| | | | | |
| Texas: 8.50% | | | | | | | | | | | | | | | | | | | | |
Donna TX International Toll Bridge (Transportation Revenue) | | | 6.25 | | | | 2-15-2037 | | | | 21,850,000 | | | | 23,012,857 | | | | 0.43 | |
North East TX Independent School District Series A (GO Revenue) ± | | | 2.00 | | | | 8-1-2042 | | | | 25,885,000 | | | | 26,126,766 | | | | 0.48 | |
North TX Tollway Authority Series F (Transportation Revenue) | | | 5.75 | | | | 1-1-2038 | | | | 32,000,000 | | | | 33,473,280 | | | | 0.62 | |
Northside TX Independent School District Series A (GO Revenue) ± | | | 2.00 | | | | 6-1-2039 | | | | 27,715,000 | | | | 27,962,495 | | | | 0.52 | |
The accompanying notes are an integral part of these financial statements.
| | | | |
| 12 | | Wells Fargo Ultra Short-Term Municipal Income Fund | | Summary portfolio of investments—December 31, 2016 (unaudited) |
| | | | | | | | | | | | | | | | | | | | |
| Security name | | Interest rate | | | Maturity date | | | Principal | | | Value | | | Percent of
net assets | |
| | | | | |
| Texas (continued) | | | | | | | | | | | | | | | | | | | | |
Port Arthur TX Navigation District (Resource Recovery Revenue) ø | | | 0.85 | % | | | 12-1-2039 to 11-1-2040 | | | $ | 38,600,000 | | | $ | 38,600,000 | | | | 0.72 | % |
Port Arthur TX Navigation District Jefferson County Environmental Facilities Motiva Enterprises LLC Project Series B (Resource Recovery Revenue) ø | | | 0.85 | | | | 4-1-2040 | | | | 26,530,000 | | | | 26,530,000 | | | | 0.49 | |
Tarrant County TX Cultural Education Facilities Finance Corporation Series 2973 (Health Revenue, Morgan Stanley Bank LIQ) 144Aø | | | 0.95 | | | | 11-15-2029 | | | | 30,400,000 | | | | 30,400,000 | | | | 0.56 | |
Texas Transportation Commission State Highway Fund Floating 1st Tier Series B (Tax Revenue) ± | | | 1.08 | | | | 4-1-2032 | | | | 24,000,000 | | | | 23,999,040 | | | | 0.44 | |
Other securities | | | | | | | | | | | | | | | 227,808,415 | | | | 4.24 | |
| | | | | |
| | | | | | | | | | | | | | | 457,912,853 | | | | 8.50 | |
| | | | | | | | | | | | | | | | | | | | |
| | | | | |
| Utah: 0.24% | | | | | | | | | | | | | | | | | | | | |
Other securities | | | | | | | | | | | | | | | 12,725,000 | | | | 0.24 | |
| | | | | | | | | | | | | | | | | | | | |
| | | | | |
| Vermont: 0.03% | | | | | | | | | | | | | | | | | | | | |
Other securities | | | | | | | | | | | | | | | 1,568,174 | | | | 0.03 | |
| | | | | | | | | | | | | | | | | | | | |
| | | | | |
| Virgin Islands: 0.17% | | | | | | | | | | | | | | | | | | | | |
Other securities | | | | | | | | | | | | | | | 9,434,786 | | | | 0.17 | |
| | | | | | | | | | | | | | | | | | | | |
| | | | | |
| Virginia: 0.78% | | | | | | | | | | | | | | | | | | | | |
Chesapeake VA EDA Electric and Power Company Series 2008A (Utilities Revenue) ± | | | 1.75 | | | | 2-1-2032 | | | | 30,000,000 | | | | 30,033,300 | | | | 0.56 | |
Other securities | | | | | | | | | | | | | | | 11,739,921 | | | | 0.22 | |
| | | | | |
| | | | | | | | | | | | | | | 41,773,221 | | | | 0.78 | |
| | | | | | | | | | | | | | | | | | | | |
| | | | | |
| Washington: 0.40% | | | | | | | | | | | | | | | | | | | | |
Other securities | | | | | | | | | | | | | | | 21,516,548 | | | | 0.40 | |
| | | | | | | | | | | | | | | | | | | | |
| | | | | |
| West Virginia: 0.90% | | | | | | | | | | | | | | | | | | | | |
West Virginia EDA Appalachian Power Company Mountaineer Project Series A (Utilities Revenue) ø | | | 1.00 | | | | 2-1-2036 | | | | 25,000,000 | | | | 25,000,000 | | | | 0.47 | |
Other securities | | | | | | | | | | | | | | | 23,268,164 | | | | 0.43 | |
| | | | | |
| | | | | | | | | | | | | | | 48,268,164 | | | | 0.90 | |
| | | | | | | | | | | | | | | | | | | | |
| | | | | |
| Wisconsin: 0.86% | | | | | | | | | | | | | | | | | | | | |
Other securities | | | | | | | | | | | | | | | 46,495,630 | | | | 0.86 | |
| | | | | | | | | | | | | | | | | | | | |
| | | | | |
| Wyoming: 0.48% | | | | | | | | | | | | | | | | | | | | |
Sweetwater County WY PCR Refunding Bond PacifiCorp Project Series A (Industrial Development Revenue) ø | | | 0.85 | | | | 1-1-2017 | | | | 26,000,000 | | | | 26,000,000 | | | | 0.48 | |
| | | | | | | | | | | | | | | | | | | | |
| | | | | |
Total Municipal Obligations (Cost $5,142,914,809) | | | | | | | | | | | | | | | 5,104,835,011 | | | | 94.77 | |
| | | | | | | | | | | | | | | | | | | | |
| | | | | |
Other: 4.25% | | | | | | | | | | | | | | | | | | | | |
Branch Banking & Trust Municipal Investment Trust Various States | | | 1.23-1.78 | | | | 6-30-2017 to 12-31-2019 | | | | 20,040,000 | | | | 20,034,898 | | | | 0.37 | |
Branch Banking & Trust Municipal Investment Trust Various States Class B ±144A§ | | | 1.38 | | | | 12-31-2017 | | | | 33,725,000 | | | | 33,725,337 | | | | 0.63 | |
Nuveen AMT-Free Quality Municipal Income Fund Preferred Share ±144A§ | | | 0.81 | | | | 6-1-2040 | | | | 35,000,000 | | | | 35,000,000 | | | | 0.65 | |
The accompanying notes are an integral part of these financial statements.
| | | | | | |
| Summary portfolio of investments—December 31, 2016 (unaudited) | | Wells Fargo Ultra Short-Term Municipal Income Fund | | | 13 | |
| | | | | | | | | | | | | | | | | | | | |
| Security name | | Interest rate | | | Maturity date | | | Principal | | | Value | | | Percent of
net assets | |
| | | | | |
Other (continued) | | | | | | | | | | | | | | | | | | | | |
Nuveen Enhanced Municipal Credit Opportunities Fund Institutional MuniFund Term Preferred Shares ±144A | | | 1.47 | % | | | 10-1-2017 | | | $ | 59,000,000 | | | $ | 58,786,420 | | | | 1.09 | % |
Nuveen Texas Quality Municipal Income Fund Institutional MuniFund Term Preferred Shares ±144A | | | 1.56 | | | | 11-1-2018 | | | | 25,000,000 | | | | 24,998,000 | | | | 0.46 | |
Other securities | | | | | | | | | | | 56,288,136 | | | | 1.05 | |
| | | | | | | | | | | | | | | | | | | | |
| | |
Total Other (Cost $229,141,648) | | | | 228,832,791 | | | | 4.25 | |
| | | | | | | | | | | | | | | | | | | | |
| | | | | |
| | | Yield | | | | | | Shares | | | | | | | |
| Short-Term Investments: 1.88% | | | | | | | | | | | | | | | | | | | | |
| | | | | |
| Investment Companies: 1.87% | | | | | | | | | | | | | | | | | | | | |
Wells Fargo Municipal Cash Management Fund Institutional Class (l)(u)## | | | 0.67 | | | | | | | | 100,839,385 | | | | 100,899,889 | | | | 1.87 | |
| | | | | | | | | | | | | | | | | | | | |
| | | | | |
| | | | | | | | | Principal | | | | | | | |
| U.S. Treasury Securities: 0.01% | | | | | | | | | | | | | | | | | | | | |
U.S. Treasury Bill (z) | | | 0.50 | | | | 3-16-2017 | | | $ | 250,000 | | | | 249,750 | | | | 0.01 | |
| | | | | | | | | | | | | | | | | | | | |
| | | | | |
Total Short-Term Investments (Cost $101,131,856) | | | | | | | | | | | | | | | 101,149,639 | | | | 1.88 | |
| | | | | | | | | | | | | | | | | | | | |
| | | | |
| Total investments in securities (Cost $5,478,121,538) * | | | | | | | | | | | | 5,439,709,985 | | | | 100.99 | % |
Other assets and liabilities, net | | | | | | | | | | | | | | | (53,119,183 | ) | | | (0.99 | ) |
| | | | | | | | | | | | | | | | | | | | |
| Total net assets | | | | | | | | | | | | | | $ | 5,386,590,802 | | | | 100.00 | % |
| | | | | | | | | | | | | | | | | | | | |
| ± | Variable rate investment. The rate shown is the rate in effect at period end. |
| 144A | The security may be resold in transactions exempt from registration, normally to qualified institutional buyers, pursuant to Rule 144A under the Securities Act of 1933. |
| ø | Variable rate demand notes are subject to a demand feature which reduces the effective maturity. The maturity date shown represents the final maturity date of the security. The interest rate is determined and reset by the issuer daily, weekly, or monthly depending upon the terms of the security. The rate shown is the rate in effect at period end. |
| (m) | The security is an auction-rate security which has an interest rate that resets at predetermined short-term intervals through a Dutch auction. The rate shown is the rate in effect at period end. |
| µ | All or some of these obligations have credit enhancements or liquidity features that may, under certain circumstances, provide for repayment of principal and interest. |
| § | The security is subject to a demand feature which reduces the effective maturity. |
| (l) | The issuer of the security is an affiliated person of the Fund as defined in the Investment Company Act of 1940. |
| (u) | The rate represents the 7-day annualized yield at period end. |
| ## | All or a portion of this security is segregated for when-issued securities. |
| (z) | Zero coupon security. The rate represents the current yield to maturity. |
| * | Cost for federal income tax purposes is $5,478,051,225 and unrealized gains (losses) consists of: |
| | | | |
Gross unrealized gains | | $ | 2,597,840 | |
Gross unrealized losses | | | (40,939,080 | ) |
| | | | |
Net unrealized losses | | $ | (38,341,240 | ) |
The accompanying notes are an integral part of these financial statements.
| | | | |
| 14 | | Wells Fargo Ultra Short-Term Municipal Income Fund | | Statement of assets and liabilities—December 31, 2016 (unaudited) |
| | | | |
| | | | |
| |
Assets | | | | |
Investments | | | | |
In unaffiliated securities, at value (cost $5,377,239,422) | | $ | 5,338,810,096 | |
In affiliated securities, at value (cost $100,882,116) | | | 100,899,889 | |
| | | | |
Total investments, at value (cost $5,478,121,538) | | | 5,439,709,985 | |
Cash | | | 1,152 | |
Receivable for investments sold | | | 11,640,000 | |
Receivable for Fund shares sold | | | 36,320,259 | |
Receivable for interest | | | 27,747,268 | |
Prepaid expenses and other assets | | | 357,506 | |
| | | | |
Total assets | | | 5,515,776,170 | |
| | | | |
| |
Liabilities | | | | |
Distributions payable | | | 1,116,420 | |
Payable for investments purchased | | | 40,402,073 | |
Payable for Fund shares redeemed | | | 85,127,969 | |
Management fee payable | | | 1,290,092 | |
Distribution fee payable | | | 19,333 | |
Administration fees payable | | | 504,226 | |
Accrued expenses and other liabilities | | | 725,255 | |
| | | | |
Total liabilities | | | 129,185,368 | |
| | | | |
Total net assets | | $ | 5,386,590,802 | |
| | | | |
| |
NET ASSETS CONSIST OF | | | | |
Paid-in capital | | $ | 5,425,550,250 | |
Overdistributed net investment income | | | (485,748 | ) |
Accumulated net realized losses on investments | | | (62,147 | ) |
Net unrealized losses on investments | | | (38,411,553 | ) |
| | | | |
Total net assets | | $ | 5,386,590,802 | |
| | | | |
| |
COMPUTATION OF NET ASSET VALUE AND OFFERING PRICE PER SHARE | | | | |
Net assets – Class A | | $ | 1,159,323,384 | |
Shares outstanding – Class A1 | | | 121,372,669 | |
Net asset value per share – Class A | | | $9.55 | |
Maximum offering price per share – Class A2 | | | $9.74 | |
Net assets – Class C | | $ | 28,278,296 | |
Shares outstanding – Class C1 | | | 3,013,091 | |
Net asset value per share – Class C | | | $9.39 | |
Net assets – Administrator Class | | $ | 1,414,519,027 | |
Shares outstanding – Administrator Class1 | | | 148,123,740 | |
Net asset value per share – Administrator Class | | | $9.55 | |
Net assets – Institutional Class | | $ | 2,784,470,095 | |
Shares outstanding – Institutional Class1 | | | 291,472,939 | |
Net asset value per share – Institutional Class | | | $9.55 | |
| 1 | The Fund has an unlimited number of authorized shares. |
| 2 | Maximum offering price is computed as 100/98.00 of net asset value. On investments of $50,000 or more, the offering price is reduced. |
The accompanying notes are an integral part of these financial statements.
| | | | | | |
| Statement of operations—six months ended December 31, 2016 (unaudited) | | Wells Fargo Ultra Short-Term Municipal Income Fund | | | 15 | |
| | | | |
| | | | |
| |
Investment income | | | | |
Interest | | $ | 33,138,964 | |
Income from affiliated securities | | | 219,741 | |
| | | | |
Total investment income | | | 33,358,705 | |
| | | | |
| |
Expenses | | | | |
Management fee | | | 9,303,152 | |
Administration fees | | | | |
Class A | | | 978,190 | |
Class C | | | 24,490 | |
Administrator Class | | | 300,897 | |
Institutional Class | | | 1,543,177 | |
Shareholder servicing fees | | | | |
Class A | | | 1,528,421 | |
Class C | | | 38,265 | |
Administrator Class | | | 751,765 | |
Distribution fee | | | | |
Class C | | | 114,796 | |
Custody and accounting fees | | | 148,223 | |
Professional fees | | | 23,460 | |
Registration fees | | | 113,945 | |
Shareholder report expenses | | | 6,445 | |
Trustees’ fees and expenses | | | 11,632 | |
Other fees and expenses | | | 19,899 | |
| | | | |
Total expenses | | | 14,906,757 | |
Less: Fee waivers and/or expense reimbursements | | | (1,650,668 | ) |
| | | | |
Net expenses | | | 13,256,089 | |
| | | | |
Net investment income | | | 20,102,616 | |
| | | | |
| |
REALIZED AND UNREALIZED GAINS (LOSSES) ON INVESTMENTS | | | | |
| |
Net realized losses on: | | | | |
Unaffiliated securities | | | (311,007 | ) |
Affiliated securities | | | (33,233 | ) |
Futures transactions | | | (285,494 | ) |
| | | | |
Net realized losses on investments | | | (629,734 | ) |
| | | | |
| |
Net change in unrealized gains (losses) on: | | | | |
Unaffiliated securities | | | (43,357,953 | ) |
Affiliated securities | | | 17,773 | |
Futures transactions | | | 561,022 | |
| | | | |
Net change in unrealized gains (losses) on investments | | | (42,779,158 | ) |
| | | | |
Net realized and unrealized gains (losses) on investments | | | (43,408,892 | ) |
| | | | |
Net decrease in net assets resulting from operations | | $ | (23,306,276 | ) |
| | | | |
The accompanying notes are an integral part of these financial statements.
| | | | |
| 16 | | Wells Fargo Ultra Short-Term Municipal Income Fund | | Statement of changes in net assets |
| | | | | | | | | | | | | | | | |
| | | Six months ended
December 31, 2016
(unaudited) | | | Year ended
June 30, 2016 | |
| | | | |
Operations | | | | | | | | | | | | | | | | |
Net investment income | | | | | | $ | 20,102,616 | | | | | | | $ | 32,781,749 | |
Net realized gains (losses) on investments | | | | | | | (629,734 | ) | | | | | | | 845,987 | |
Net change in unrealized gains (losses) on investments | | | | | | | (42,779,158 | ) | | | | | | | 9,622,472 | |
| | | | |
Net increase (decrease) in net assets resulting from operations | | | | | | | (23,306,276 | ) | | | | | | | 43,250,208 | |
| | | | |
| | | | |
Distributions to shareholders from | | | | | | | | | | | | | | | | |
Net investment income | | | | | | | | | | | | | | | | |
Class A | | | | | | | (3,035,785 | ) | | | | | | | (4,371,917 | ) |
Administrator Class | | | | | | | (1,725,720 | ) | | | | | | | (1,193,229 | ) |
Institutional Class | | | | | | | (15,340,839 | ) | | | | | | | (26,850,434 | ) |
Investor Class | | | | | | | N/A | | | | | | | | (365,755 | )1 |
Net realized gains | | | | | | | | | | | | | | | | |
Class A | | | | | | | (99,614 | ) | | | | | | | (208,960 | ) |
Class C | | | | | | | (2,471 | ) | | | | | | | (6,313 | ) |
Administrator Class | | | | | | | (112,414 | ) | | | | | | | (41,422 | ) |
Institutional Class | | | | | | | (253,274 | ) | | | | | | | (645,494 | ) |
| | | | |
Total distributions to shareholders | | | | | | | (20,570,117 | ) | | | | | | | (33,683,524 | ) |
| | | | |
| | | | |
Capital share transactions | | | Shares | | | | | | | | Shares | | | | | |
Proceeds from shares sold | | | | | | | | | | | | | | | | |
Class A | | | 24,207,463 | | | | 232,321,372 | | | | 76,129,489 | | | | 732,473,920 | |
Class C | | | 171,744 | | | | 1,615,873 | | | | 206,402 | | | | 1,957,767 | |
Administrator Class | | | 143,443,897 | | | | 1,376,764,207 | | | | 23,903,367 | | | | 229,922,937 | |
Institutional Class | | | 206,701,863 | | | | 1,985,451,047 | | | | 381,558,709 | | | | 3,670,300,026 | |
Investor Class | | | N/A | | | | N/A | | | | 1,404,939 | 1 | | | 13,526,753 | 1 |
| | | | |
| | | | | | | 3,596,152,499 | | | | | | | | 4,648,181,403 | |
| | | | |
Reinvestment of distributions | | | | | | | | | | | | | | | | |
Class A | | | 312,588 | | | | 2,999,696 | | | | 459,511 | | | | 4,421,270 | |
Class C | | | 222 | | | | 2,082 | | | | 554 | | | | 5,255 | |
Administrator Class | | | 181,606 | | | | 1,737,777 | | | | 127,969 | | | | 1,231,259 | |
Institutional Class | | | 990,858 | | | | 9,515,403 | | | | 1,790,146 | | | | 17,224,273 | |
Investor Class | | | N/A | | | | N/A | | | | 28,543 | 1 | | | 274,869 | 1 |
| | | | |
| | | | | | | 14,254,958 | | | | | | | | 23,156,926 | |
| | | | |
Payment for shares redeemed | | | | | | | | | | | | | | | | |
Class A | | | (28,825,258 | ) | | | (276,459,261 | ) | | | (50,965,659 | ) | | | (490,321,000 | ) |
Class C | | | (520,473 | ) | | | (4,909,860 | ) | | | (1,301,768 | ) | | | (12,342,895 | ) |
Administrator Class | | | (18,992,299 | ) | | | (182,054,587 | ) | | | (34,686,573 | ) | | | (333,645,141 | ) |
Institutional Class | | | (338,136,283 | ) | | | (3,245,942,869 | ) | | | (370,417,838 | ) | | | (3,562,999,025 | ) |
Investor Class | | | N/A | | | | N/A | | | | (41,749,601 | )1 | | | (402,219,702 | )1 |
| | | | |
| | | | | | | (3,709,366,577 | ) | | | | | | | (4,801,527,763 | ) |
| | | | |
Net decrease in net assets resulting from capital share transactions | | | | | | | (98,959,120 | ) | | | | | | | (130,189,434 | ) |
| | | | |
Total decrease in net assets | | | | | | | (142,835,513 | ) | | | | | | | (120,622,750 | ) |
| | | | |
| | | | |
Net assets | | | | | | | | | | | | | | | | |
Beginning of period | | | | | | | 5,529,426,315 | | | | | | | | 5,650,049,065 | |
| | | | |
End of period | | | | | | $ | 5,386,590,802 | | | | | | | $ | 5,529,426,315 | |
| | | | |
Overdistributed net investment income | | | | | | $ | (485,748 | ) | | | | | | $ | (486,020 | ) |
| | | | |
| 1 | For the period from July 1, 2015 to October 23, 2015. Effective at the close of business on October 23, 2015, Investor Class shares were converted to Class A shares and are no longer offered by the Fund. |
The accompanying notes are an integral part of these financial statements.
| | | | | | |
| Financial highlights | | Wells Fargo Ultra Short-Term Municipal Income Fund | | | 17 | |
(For a share outstanding throughout each period)
| | | | | | | | | | | | | | | | | | | | | | | | |
| | | Six months ended
December 31, 2016 (unaudited) | | | Year ended June 30 | |
| CLASS A | | | 2016 | | | 20151 | | | 20141 | | | 20131 | | | 20121 | |
Net asset value, beginning of period | | | $9.63 | | | | $9.61 | | | | $9.64 | | | | $9.64 | | | | $9.64 | | | | $9.64 | |
Net investment income | | | 0.02 | | | | 0.04 | | | | 0.02 | | | | 0.04 | | | | 0.04 | | | | 0.10 | |
Net realized and unrealized gains (losses) on investments | | | (0.08 | ) | | | 0.02 | | | | (0.03 | ) | | | 0.00 | 2 | | | (0.02 | ) | | | 0.00 | 2 |
| | | | | | | | | | | | | | | | | | | | | | | | |
Total from investment operations | | | (0.06 | ) | | | 0.06 | | | | (0.01 | ) | | | 0.04 | | | | 0.02 | | | | 0.10 | |
Distributions to shareholders from | | | | | | | | | | | | | | | | | | | | | | | | |
Net investment income | | | (0.02 | ) | | | (0.04 | ) | | | (0.02 | ) | | | (0.04 | ) | | | (0.02 | ) | | | (0.10 | ) |
Net realized gains | | | (0.00 | )2 | | | (0.00 | )2 | | | (0.00 | )2 | | | (0.00 | )2 | | | 0.00 | | | | 0.00 | |
| | | | | | | | | | | | | | | | | | | | | | | | |
Total distributions to shareholders | | | (0.02 | ) | | | (0.04 | ) | | | (0.02 | ) | | | (0.04 | ) | | | (0.02 | ) | | | (0.10 | ) |
Net asset value, end of period | | | $9.55 | | | | $9.63 | | | | $9.61 | | | | $9.64 | | | | $9.64 | | | | $9.64 | |
Total return3 | | | (0.57 | )% | | | 0.61 | % | | | (0.07 | )% | | | 0.35 | % | | | 0.31 | % | | | 0.96 | % |
Ratios to average net assets (annualized) | | | | | | | | | | | | | | | | | | | | | | | | |
Gross expenses | | | 0.75 | % | | | 0.75 | % | | | 0.75 | % | | | 0.75 | % | | | 0.75 | % | | | 0.76 | % |
Net expenses | | | 0.67 | % | | | 0.67 | % | | | 0.67 | % | | | 0.67 | % | | | 0.67 | % | | | 0.67 | % |
Net investment income | | | 0.50 | % | | | 0.38 | % | | | 0.23 | % | | | 0.34 | % | | | 0.32 | % | | | 0.95 | % |
Supplemental data | | | | | | | | | | | | | | | | | | | | | | | | |
Portfolio turnover rate | | | 28 | %4 | | | 41 | %4 | | | 44 | %4 | | | 51 | %4 | | | 65 | %4 | | | 111 | % |
Net assets, end of period (000s omitted) | | | $1,159,323 | | | | $1,209,818 | | | | $961,485 | | | | $1,582,112 | | | | $1,914,970 | | | | $2,603,618 | |
| 1 | A one-for-two share split took place after the close of business on June 12, 2015 for all classes of the Fund. The per share information has been adjusted to give effect to this transaction. |
| 2 | Amount is less than $0.005. |
| 3 | Total return calculations do not include any sales charges. Returns for periods of less than one year are not annualized. |
| 4 | Portfolio turnover rate excludes variable rate demand notes which may account for changes from rates reported in prior periods. |
The accompanying notes are an integral part of these financial statements.
| | | | |
| 18 | | Wells Fargo Ultra Short-Term Municipal Income Fund | | Financial highlights |
(For a share outstanding throughout each period)
| | | | | | | | | | | | | | | | | | | | | | | | |
| | | Six months ended
December 31, 2016 (unaudited) | | | Year ended June 30 | |
| CLASS C | | | 2016 | | | 20151 | | | 20141 | | | 20131 | | | 20121 | |
Net asset value, beginning of period | | | $9.47 | | | | $9.49 | | | | $9.58 | | | | $9.62 | | | | $9.64 | | | | $9.64 | |
Net investment income (loss) | | | (0.01 | )2 | | | (0.04 | )2 | | | (0.11 | ) | | | (0.04 | )2 | | | (0.06 | ) | | | 0.02 | |
Net realized and unrealized gains (losses) on investments | | | (0.07 | ) | | | 0.02 | | | | 0.02 | | | | 0.00 | 3 | | | 0.04 | | | | 0.00 | 3 |
| | | | | | | | | | | | | | | | | | | | | | | | |
Total from investment operations | | | (0.08 | ) | | | (0.02 | ) | | | (0.09 | ) | | | (0.04 | ) | | | (0.02 | ) | | | 0.02 | |
Distributions to shareholders from | | | | | | | | | | | | | | | | | | | | | | | | |
Net investment income | | | 0.00 | | | | 0.00 | | | | 0.00 | | | | 0.00 | | | | 0.00 | | | | (0.02 | ) |
Net realized gains | | | (0.00 | )3 | | | (0.00 | )3 | | | (0.00 | )3 | | | (0.00 | )3 | | | 0.00 | | | | 0.00 | |
| | | | | | | | | | | | | | | | | | | | | | | | |
Total distributions to shareholders | | | (0.00 | )3 | | | (0.00 | )3 | | | (0.00 | )3 | | | (0.00 | )3 | | | 0.00 | | | | (0.02 | ) |
Net asset value, end of period | | | $9.39 | | | | $9.47 | | | | $9.49 | | | | $9.58 | | | | $9.62 | | | | $9.64 | |
Total return4 | | | (0.84 | )% | | | (0.19 | )% | | | (0.93 | )% | | | (0.40 | )% | | | (0.21 | )% | | | 0.25 | % |
Ratios to average net assets (annualized) | | | | | | | | | | | | | | | | | | | | | | | | |
Gross expenses | | | 1.50 | % | | | 1.50 | % | | | 1.50 | % | | | 1.50 | % | | | 1.50 | % | | | 1.51 | % |
Net expenses | | | 1.42 | % | | | 1.42 | % | | | 1.42 | % | | | 1.42 | % | | | 1.42 | % | | | 1.42 | % |
Net investment income (loss) | | | (0.25 | )% | | | (0.37 | )% | | | (0.52 | )% | | | (0.41 | )% | | | (0.43 | )% | | | 0.23 | % |
Supplemental data | | | | | | | | | | | | | | | | | | | | | | | | |
Portfolio turnover rate | | | 28 | %5 | | | 41 | %5 | | | 44 | %5 | | | 51 | %5 | | | 65 | %5 | | | 111 | % |
Net assets, end of period (000s omitted) | | | $28,278 | | | | $31,837 | | | | $42,289 | | | | $59,352 | | | | $89,148 | | | | $148,465 | |
| 1 | A one-for-two share split took place after the close of business on June 12, 2015 for all classes of the Fund. The per share information has been adjusted to give effect to this transaction. |
| 2 | Calculated based upon average shares outstanding |
| 3 | Amount is less than $0.005. |
| 4 | Total return calculations do not include any sales charges. Returns for periods of less than one year are not annualized. |
| 5 | Portfolio turnover rate excludes variable rate demand notes which may account for changes from rates reported in prior periods. |
The accompanying notes are an integral part of these financial statements.
| | | | | | |
| Financial highlights | | Wells Fargo Ultra Short-Term Municipal Income Fund | | | 19 | |
(For a share outstanding throughout each period)
| | | | | | | | | | | | | | | | | | | | | | | | |
| | | Six months ended
December 31, 2016 (unaudited) | | | Year ended June 30 | |
| ADMINISTRATOR CLASS | | | 2016 | | | 20151 | | | 20141 | | | 20131 | | | 20121 | |
Net asset value, beginning of period | | | $9.63 | | | | $9.61 | | | | $9.64 | | | | $9.64 | | | | $9.64 | | | | $9.64 | |
Net investment income | | | 0.03 | 2 | | | 0.04 | | | | 0.03 | | | | 0.04 | | | | 0.04 | | | | 0.10 | |
Net realized and unrealized gains (losses) on investments | | | (0.08 | ) | | | 0.02 | | | | (0.03 | ) | | | 0.00 | 3 | | | 0.00 | 3 | | | 0.00 | 3 |
| | | | | | | | | | | | | | | | | | | | | | | | |
Total from investment operations | | | (0.05 | ) | | | 0.06 | | | | 0.00 | | | | 0.04 | | | | 0.04 | | | | 0.10 | |
Distributions to shareholders from | | | | | | | | | | | | | | | | | | | | | | | | |
Net investment income | | | (0.03 | ) | | | (0.04 | ) | | | (0.03 | ) | | | (0.04 | ) | | | (0.04 | ) | | | (0.10 | ) |
Net realized gains | | | (0.00 | )3 | | | (0.00 | )3 | | | (0.00 | )3 | | | (0.00 | )3 | | | 0.00 | | | | 0.00 | |
| | | | | | | | | | | | | | | | | | | | | | | | |
Total distributions to shareholders | | | (0.03 | ) | | | (0.04 | ) | | | (0.03 | ) | | | (0.04 | ) | | | (0.04 | ) | | | (0.10 | ) |
Net asset value, end of period | | | $9.55 | | | | $9.63 | | | | $9.61 | | | | $9.64 | | | | $9.64 | | | | $9.64 | |
Total return4 | | | (0.54 | )% | | | 0.68 | % | | | 0.00 | % | | | 0.42 | % | | | 0.38 | % | | | 1.03 | % |
Ratios to average net assets (annualized) | | | | | | | | | | | | | | | | | | | | | | | | |
Gross expenses | | | 0.69 | % | | | 0.68 | % | | | 0.69 | % | | | 0.69 | % | | | 0.69 | % | | | 0.68 | % |
Net expenses | | | 0.60 | % | | | 0.60 | % | | | 0.60 | % | | | 0.60 | % | | | 0.60 | % | | | 0.60 | % |
Net investment income | | | 0.57 | % | | | 0.45 | % | | | 0.30 | % | | | 0.41 | % | | | 0.39 | % | | | 0.95 | % |
Supplemental data | | | | | | | | | | | | | | | | | | | | | | | | |
Portfolio turnover rate | | | 28 | %5 | | | 41 | %5 | | | 44 | %5 | | | 51 | %5 | | | 65 | %5 | | | 111 | % |
Net assets, end of period (000s omitted) | | | $1,414,519 | | | | $226,125 | | | | $328,134 | | | | $407,791 | | | | $482,711 | | | | $597,108 | |
| 1 | A one-for-two share split took place after the close of business on June 12, 2015 for all classes of the Fund. The per share information has been adjusted to give effect to this transaction. |
| 2 | Calculated based upon average shares outstanding |
| 3 | Amount is less than $0.005. |
| 4 | Returns for periods of less than one year are not annualized. |
| 5 | Portfolio turnover rate excludes variable rate demand notes which may account for changes from rates reported in prior periods. |
The accompanying notes are an integral part of these financial statements.
| | | | |
| 20 | | Wells Fargo Ultra Short-Term Municipal Income Fund | | Financial highlights |
(For a share outstanding throughout each period)
| | | | | | | | | | | | | | | | | | | | | | | | |
| | | Six months ended
December 31, 2016 (unaudited) | | | Year ended June 30 | |
| INSTITUTIONAL CLASS | | | 2016 | | | 20151 | | | 20141 | | | 20131 | | | 20121 | |
Net asset value, beginning of period | | | $9.63 | | | | $9.61 | | | | $9.64 | | | | $9.64 | | | | $9.64 | | | | $9.64 | |
Net investment income | | | 0.04 | | | | 0.07 | | | | 0.05 | | | | 0.06 | | | | 0.06 | | | | 0.12 | |
Net realized and unrealized gains (losses) on investments | | | (0.08 | ) | | | 0.02 | | | | (0.03 | ) | | | 0.00 | 2 | | | 0.00 | 2 | | | 0.00 | 2 |
| | | | | | | | | | | | | | | | | | | | | | | | |
Total from investment operations | | | (0.04 | ) | | | 0.09 | | | | 0.02 | | | | 0.06 | | | | 0.06 | | | | 0.12 | |
Distributions to shareholders from | | | | | | | | | | | | | | | | | | | | | | | | |
Net investment income | | | (0.04 | ) | | | (0.07 | ) | | | (0.05 | ) | | | (0.06 | ) | | | (0.06 | ) | | | (0.12 | ) |
Net realized gains | | | (0.00 | )2 | | | (0.00 | )2 | | | (0.00 | )2 | | | (0.00 | )2 | | | 0.00 | | | | 0.00 | |
| | | | | | | | | | | | | | | | | | | | | | | | |
Total distributions to shareholders | | | (0.04 | ) | | | (0.07 | ) | | | (0.05 | ) | | | (0.06 | ) | | | (0.06 | ) | | | (0.12 | ) |
Net asset value, end of period | | | $9.55 | | | | $9.63 | | | | $9.61 | | | | $9.64 | | | | $9.64 | | | | $9.64 | |
Total return3 | | | (0.42 | )% | | | 0.91 | % | | | 0.23 | % | | | 0.65 | % | | | 0.61 | % | | | 1.26 | % |
Ratios to average net assets (annualized) | | | | | | | | | | | | | | | | | | | | | | | | |
Gross expenses | | | 0.42 | % | | | 0.42 | % | | | 0.42 | % | | | 0.42 | % | | | 0.42 | % | | | 0.43 | % |
Net expenses | | | 0.37 | % | | | 0.37 | % | | | 0.37 | % | | | 0.37 | % | | | 0.37 | % | | | 0.37 | % |
Net investment income | | | 0.80 | % | | | 0.68 | % | | | 0.54 | % | | | 0.64 | % | | | 0.61 | % | | | 1.23 | % |
Supplemental data | | | | | | | | | | | | | | | | | | | | | | | | |
Portfolio turnover rate | | | 28 | %4 | | | 41 | %4 | | | 44 | %4 | | | 51 | %4 | | | 65 | %4 | | | 111 | % |
Net assets, end of period (000s omitted) | | | $2,784,470 | | | | $4,061,647 | | | | $3,930,234 | | | | $3,403,244 | | | | $3,085,284 | | | | $3,158,674 | |
| 1 | A one-for-two share split took place after the close of business on June 12, 2015 for all classes of the Fund. The per share information has been adjusted to give effect to this transaction. |
| 2 | Amount is less than $0.005. |
| 3 | Returns for periods of less than one year are not annualized. |
| 4 | Portfolio turnover rate excludes variable rate demand notes which may account for changes from rates reported in prior periods. |
The accompanying notes are an integral part of these financial statements.
| | | | | | |
| Notes to financial statements (unaudited) | | Wells Fargo Ultra Short-Term Municipal Income Fund | | | 21 | |
1. ORGANIZATION
Wells Fargo Funds Trust (the “Trust”), a Delaware statutory trust organized on March 10, 1999, is an open-end management investment company registered under the Investment Company Act of 1940, as amended (the “1940 Act”). As an investment company, the Trust follows the accounting and reporting guidance in Financial Accounting Standards Board (“FASB”) Accounting Standards Codification Topic 946, Financial Services – Investment Companies. These financial statements report on the Wells Fargo Ultra Short-Term Municipal Income Fund (the “Fund”) which is a diversified series of the Trust.
Effective at the close of business on October 23, 2015, Investor Class shares became Class A shares in a tax-free conversion. Shareholders of Investor Class received Class A shares at a value equal to the value of their Investor Class shares immediately prior to the conversion. Investor Class shares are no longer offered by the Fund.
2. SIGNIFICANT ACCOUNTING POLICIES
The following significant accounting policies, which are consistently followed in the preparation of the financial statements of the Fund, are in conformity with U.S. generally accepted accounting principles which require management to make estimates and assumptions that affect the reported amounts of assets and liabilities, disclosure of contingent assets and liabilities at the date of the financial statements, and the reported amounts of revenues and expenses during the reporting period. Actual results could differ from those estimates.
Securities valuation
All investments are valued each business day as of the close of regular trading on the New York Stock Exchange (generally 4 p.m. Eastern Time), although the Fund may deviate from this calculation time under unusual or unexpected circumstances.
Debt securities are valued at the evaluated bid price provided by an independent pricing service or, if a reliable price is not available, the quoted bid price from an independent broker-dealer.
Investments in registered open-end investment companies are valued at net asset value.
Investments which are not valued using any of the methods discussed above are valued at their fair value, as determined in good faith by the Board of Trustees of the Fund. The Board of Trustees has established a Valuation Committee comprised of the Trustees and has delegated to it the authority to take any actions regarding the valuation of portfolio securities that the Valuation Committee deems necessary or appropriate, including determining the fair value of portfolio securities, unless the determination has been delegated to the Management Valuation Team of Wells Fargo Funds Management, LLC (“Funds Management”). The Board of Trustees retains the authority to make or ratify any valuation decisions or approve any changes to the Valuation Procedures as it deems appropriate. On a quarterly basis, the Board of Trustees receives reports on any valuation actions taken by the Valuation Committee or the Management Valuation Team which may include items for ratification.
Valuations of fair valued securities are compared to the next actual sales price when available, or other appropriate market values, to assess the continued appropriateness of the fair valuation methodologies used. These securities are fair valued on a day-to-day basis, taking into consideration changes to appropriate market information and any significant changes to the inputs considered in the valuation process until there is a readily available price provided on an exchange or by an independent pricing service. Valuations received from an independent pricing service or independent broker-dealer quotes are periodically validated by comparisons to most recent trades and valuations provided by other independent pricing services in addition to the review of prices by the manager and/or subadviser. Unobservable inputs used in determining fair valuations are identified based on the type of security, taking into consideration factors utilized by market participants in valuing the investment, knowledge about the issuer and the current market environment.
When-issued transactions
The Fund may purchase securities on a forward commitment or when-issued basis. The Fund records a when-issued transaction on the trade date and will segregate assets in an amount at least equal in value to the Fund’s commitment to purchase when-issued securities. Securities purchased on a when-issued basis are marked-to-market daily and the Fund begins earning interest on the settlement date. Losses may arise due to changes in the market value of the underlying securities or if the counterparty does not perform under the contract.
Futures contracts
The Fund is subject to interest rate risk in the normal course of pursuing its investment objectives. The Fund may buy and sell futures contracts in order to gain exposure to, or protect against, changes in security values and interest rates. The
| | | | |
| 22 | | Wells Fargo Ultra Short-Term Municipal Income Fund | | Notes to financial statements (unaudited) |
primary risks associated with the use of futures contracts are the imperfect correlation between changes in market values of securities held by the Fund and the prices of futures contracts, and the possibility of an illiquid market.
The aggregate principal amounts of the contracts are not recorded in the financial statements. Fluctuations in the value of the contracts are recorded in the Statement of Assets and Liabilities as an asset or liability and in the Statement of Operations as unrealized gains or losses until the contracts are closed, at which point they are recorded as net realized gains or losses on futures contracts. With futures contracts, there is minimal counterparty risk to the Fund since futures are exchange traded and the exchange’s clearinghouse, as counterparty to all exchange traded futures, guarantees the futures against default.
Security transactions and income recognition
Securities transactions are recorded on a trade date basis. Realized gains or losses are recorded on the basis of identified cost.
Interest income is accrued daily and bond discounts are accreted and premiums are amortized daily based on the effective interest method. To the extent debt obligations are placed on non-accrual status, any related interest income may be reduced by writing off interest receivables when the collection of all or a portion of interest has become doubtful based on consistently applied procedures. If the issuer subsequently resumes interest payments or when the collectability of interest is reasonably assured, the debt obligation is removed from non-accrual status.
Distributions to shareholders
Distributions to shareholders from net investment income are accrued daily and paid monthly. Distributions from net realized gains, if any, are recorded on the ex-dividend date. Such distributions are determined in conformity with federal income tax regulations, which may differ in amount or character from net investment income and realized gains recognized for purposes of U.S. generally accepted accounting principles.
Federal and other taxes
The Fund intends to continue to qualify as a regulated investment company by distributing substantially all of its investment company taxable and tax-exempt income and any net realized capital gains (after reduction for capital loss carryforwards) sufficient to relieve it from all, or substantially all, federal income taxes. Accordingly, no provision for federal income taxes was required.
The Fund’s income and federal excise tax returns and all financial records supporting those returns for the prior three fiscal years are subject to examination by the federal and Delaware revenue authorities. Management has analyzed the Fund’s tax positions taken on federal, state, and foreign tax returns for all open tax years and does not believe that there are any uncertain tax positions that require recognition of a tax liability.
Class allocations
The separate classes of shares offered by the Fund differ principally in applicable sales charges, distribution, shareholder servicing, and administration fees. Class specific expenses are charged directly to that share class. Investment income, common expenses, and realized and unrealized gains (losses) on investments are allocated daily to each class of shares based on the relative proportion of net assets of each class.
3. FAIR VALUATION MEASUREMENTS
Fair value measurements of investments are determined within a framework that has established a fair value hierarchy based upon the various data inputs utilized in determining the value of the Fund’s investments. The three-level hierarchy gives the highest priority to unadjusted quoted prices in active markets for identical assets or liabilities (Level 1) and the lowest priority to significant unobservable inputs (Level 3). The Fund’s investments are classified within the fair value hierarchy based on the lowest level of input that is significant to the fair value measurement. The inputs are summarized into three broad levels as follows:
| ∎ | | Level 1 – quoted prices in active markets for identical securities |
| ∎ | | Level 2 – other significant observable inputs (including quoted prices for similar securities, interest rates, prepayment speeds, credit risk, use of amortized cost, etc.) |
| ∎ | | Level 3 – significant unobservable inputs (including the Fund’s own assumptions in determining the fair value of investments) |
The inputs or methodologies used for valuing investments in securities are not necessarily an indication of the risk associated with investing in those securities.
| | | | | | |
| Notes to financial statements (unaudited) | | Wells Fargo Ultra Short-Term Municipal Income Fund | | | 23 | |
The following is a summary of the inputs used in valuing the Fund’s assets and liabilities as of December 31, 2016:
| | | | | | | | | | | | | | | | |
| | | Quoted prices
(Level 1) | | | Other significant
observable inputs
(Level 2) | | | Significant
unobservable inputs (Level 3) | | | Total | |
Assets | | | | | | | | | | | | | | | | |
Investments in: | | | | | | | | | | | | | | | | |
| | | | |
Corporate bonds and notes | | $ | 0 | | | $ | 4,892,544 | | | $ | 0 | | | $ | 4,892,544 | |
| | | | |
Municipal obligations | | | 0 | | | | 5,104,835,011 | | | | 0 | | | | 5,104,835,011 | |
| | | | |
Other | | | 0 | | | | 228,832,791 | | | | 0 | | | | 228,832,791 | |
| | | | |
Short-term investments | | | | | | | | | | | | | | | | |
Investment companies | | | 100,899,889 | | | | 0 | | | | 0 | | | | 100,899,889 | |
U.S. Treasury securities | | | 249,750 | | | | 0 | | | | 0 | | | | 249,750 | |
Total assets | | $ | 101,149,639 | | | $ | 5,338,560,346 | | | $ | 0 | | | $ | 5,439,709,985 | |
The Fund recognizes transfers between levels within the fair value hierarchy at the end of the reporting period. At December 31, 2016, the Fund did not have any transfers into/out of Level 1, Level 2, or Level 3.
4. TRANSACTIONS WITH AFFILIATES AND OTHER EXPENSES
Management fee
Funds Management, an indirect wholly owned subsidiary of Wells Fargo & Company (“Wells Fargo”), is the manager of the Fund and provides advisory and fund-level administrative services under an investment management agreement. Under the investment management agreement, Funds Management is responsible for, among other services, implementing the investment objectives and strategies of the Fund, supervising the subadviser, providing fund-level administrative services in connection with the Fund’s operations, and providing any other fund-level administrative services reasonably necessary for the operation of the Fund. As compensation for its services under the investment management agreement, Funds Management is entitled to receive an annual management fee starting at 0.35% and declining to 0.255% as the average daily net assets of the Fund increase. For the six months ended December 31, 2016, the management fee was equivalent to an annual rate of 0.33% of the Fund’s average daily net assets.
Funds Management has retained the services of a subadviser to provide daily portfolio management to the Fund. The fee for subadvisory services is borne by Funds Management. Wells Capital Management Incorporated, an affiliate of Funds Management and an indirect wholly owned subsidiary of Wells Fargo, is the subadviser to the Fund and is entitled to receive a fee from Funds Management at an annual rate starting at 0.15% and declining to 0.05% as the average daily net assets of the Fund increase.
Administration fees
Under a class-level administration agreement, Funds Management provides class-level administrative services to the Fund, which includes paying fees and expenses for services provided by the transfer agent, sub-transfer agents, omnibus account servicers and record-keepers. As compensation for its services under the class-level administration agreement, Funds Management receives an annual fee which is calculated based on the average daily net assets of each class as follows:
| | | | |
| | | Class level
administration fee | |
Class A, Class C | | | 0.16 | % |
Administrator Class | | | 0.10 | |
Institutional Class | | | 0.08 | |
Funds Management has contractually waived and/or reimbursed management and administration fees to the extent necessary to maintain certain net operating expense ratios for the Fund. Waiver of fees and/or reimbursement of expenses by Funds Management were made first from fund level expenses on a proportionate basis and then from class specific expenses. Funds Management has committed through October 31, 2017 to waive fees and/or reimburse expenses to the extent necessary to cap the Fund’s expenses at 0.67% for Class A shares, 1.42% for Class C shares, 0.60% for Administrator Class shares, and 0.37% for Institutional Class shares. After this time, the cap may be increased or the commitment to maintain the cap may be terminated only with the approval of the Board of Trustees.
| | | | |
| 24 | | Wells Fargo Ultra Short-Term Municipal Income Fund | | Notes to financial statements (unaudited) |
During the six months ended December 31, 2016, State Street Bank and Trust Company, the Fund’s custodian, reimbursed the Fund $7 for certain out-of-pocket expenses that were billed to the Fund in error from 1998-2015. This amount is included in interest income on the Statement of Operations. In addition, Funds Management was also reimbursed $3,129 for waivers/reimbursements it made to the Fund during the period the Fund was erroneously billed.
Distribution fee
The Trust has adopted a distribution plan for Class C shares of the Fund pursuant to Rule 12b-1 under the 1940 Act. A distribution fee is charged to Class C shares and paid to Wells Fargo Funds Distributor, LLC (“Funds Distributor”), the principal underwriter, at an annual rate of 0.75% of the average daily net assets of Class C shares.
In addition, Funds Distributor is entitled to receive the front-end sales charge from the purchase of Class A shares and a contingent deferred sales charge on the redemption of certain Class A shares. Funds Distributor is also entitled to receive the contingent deferred sales charges from redemptions of Class C shares. For the six months ended December 31, 2016, Funds Distributor received $2,689 from the sale of Class A shares.
Shareholder servicing fees
The Trust has entered into contracts with one or more shareholder servicing agents, whereby Class A, Class C, and Administrator Class of the Fund are charged a fee at an annual rate of 0.25% of the average daily net assets of each respective class.
A portion of these total shareholder servicing fees were paid to affiliates of Wells Fargo.
5. INVESTMENT PORTFOLIO TRANSACTIONS
Purchases and sales of investments, excluding U.S. government obligations (if any) and short-term securities, for the six months ended December 31, 2016 were $1,304,477,195 and $1,136,931,501, respectively.
The Fund may purchase or sell investment securities to other Wells Fargo funds under procedures adopted by the Board of Trustees. The procedures have been designed to ensure that these interfund transactions, which generally do not incur broker commissions, are effected at current market prices. Interfund trades are included within the respective purchases and sales amounts shown.
6. DERIVATIVE TRANSACTIONS
During the six months ended December 31, 2016, the Fund entered into futures contracts to take advantage of the differences between municipal and treasury yields and to help manage the duration of the portfolio.
As of December 31, 2016, the Fund did not have any open futures contracts. The Fund had an average notional amount of $13,384,958 in short futures contracts during the six months ended December 31, 2016.
The fair value, realized gains or losses and change in unrealized gains or losses, if any, on derivative instruments are reflected in the appropriate financial statements.
7. BANK BORROWINGS
The Trust (excluding the money market funds and certain other funds) and Wells Fargo Variable Trust are parties to a $250,000,000 revolving credit agreement whereby the Fund is permitted to use bank borrowings for temporary or emergency purposes, such as to fund shareholder redemption requests. Interest under the credit agreement is charged to the Fund based on a borrowing rate equal to the higher of the Federal Funds rate in effect on that day plus 1.25% or the overnight LIBOR rate in effect on that day plus 1.25%. In addition, an annual commitment fee equal to 0.25% of the unused balance is allocated to each participating fund. Prior to August 30, 2016, the revolving credit agreement amount was $200,000,000 and the annual commitment fee was equal to 0.20% of the unused balance which was allocated to each participating fund.
For the six months ended December 31, 2016, there were no borrowings by the Fund under the agreement.
8. INDEMNIFICATION
Under the Trust’s organizational documents, the officers and Trustees have been granted certain indemnification rights against certain liabilities that may arise out of performance of their duties to the Trust. Additionally, in the normal course of business, the Trust may enter into contracts with service providers that contain a variety of indemnification clauses. The Trust’s maximum exposure under these arrangements is dependent on future claims that may be made against the Fund and, therefore, cannot be estimated.
| | | | | | |
| Notes to financial statements (unaudited) | | Wells Fargo Ultra Short-Term Municipal Income Fund | | | 25 | |
9. REGULATORY CHANGES
In October 2016, the Securities and Exchange Commission (“SEC”) adopted new rules and forms and amended existing rules and forms (together, “final rules”) intended to modernize and enhance the reporting and disclosure of information by registered investment companies and to enhance liquidity risk management by open-end mutual funds and exchange-traded funds. The final rules will enhance the quality of information available to investors and will allow the SEC to more effectively collect and use data reported by funds. In part, the final rules amend Regulation S-X and require standardized, enhanced disclosure about derivatives in the Fund’s financial statements, as well as other amendments. The compliance date for the amendments to Regulation S-X is August 1, 2017 while the compliance date for the new form types is June 1, 2018 and the compliance date for the liquidity risk management program requirements is December 1, 2018. Management is currently assessing the potential impact of these enhancements and their impact on the financial statement disclosures and reporting requirements.
| | | | |
| 26 | | Wells Fargo Ultra Short-Term Municipal Income Fund | | Other information (unaudited) |
PROXY VOTING INFORMATION
A description of the policies and procedures that the Fund uses to determine how to vote proxies relating to portfolio securities is available, upon request, by calling 1-800-222-8222, visiting our website at wellsfargofunds.com, or visiting the SEC website at sec.gov. Information regarding how the Fund voted proxies relating to portfolio securities during the most recent 12-month period ended June 30 is available on the Fund’s website at wellsfargofunds.com or by visiting the SEC website at sec.gov.
PORTFOLIO HOLDINGS INFORMATION
The complete portfolio holdings for the Fund are publicly available monthly on the Fund’s website (wellsfargofunds.com), on a one-month delayed basis. In addition, top ten holdings information (excluding derivative positions) for the Fund is publicly available on the Fund’s website on a monthly, seven-day or more delayed basis. The Fund files its complete schedule of portfolio holdings with the SEC for the first and third quarters of each fiscal year on Form N-Q, which is available by visiting the SEC website at sec.gov. In addition, the Fund’s Form N-Q may be reviewed and copied at the SEC’s Public Reference Room in Washington, DC, and at regional offices in New York City, at 233 Broadway, and in Chicago, at 175 West Jackson Boulevard, Suite 900. Information about the Public Reference Room may be obtained by calling 1-800-SEC-0330.
| | | | | | |
| Other information (unaudited) | | Wells Fargo Ultra Short-Term Municipal Income Fund | | | 27 | |
BOARD OF TRUSTEES AND OFFICERS
Each of the Trustees and Officers1 listed in the table below acts in identical capacities for each fund in the Wells Fargo family of funds, which consists of 139 mutual funds comprising the Wells Fargo Funds Trust, Wells Fargo Variable Trust, Wells Fargo Master Trust and four closed-end funds (collectively the “Fund Complex”). This table should be read in conjunction with the Prospectus and the Statement of Additional Information2. The mailing address of each Trustee and Officer is 525 Market Street, 12th Floor, San Francisco, CA 94105. Each Trustee and Officer serves an indefinite term, however, each Trustee serves such term until reaching the mandatory retirement age established by the Trustees.
Independent Trustees
| | | | | | |
Name and
year of birth | | Position held and
length of service* | | Principal occupations during past five years or longer | | Current other
public company or
investment company
directorships |
| William R. Ebsworth (Born 1957) | | Trustee, since 2015 | | Retired. From 1984 to 2013, equities analyst, portfolio manager, research director and chief financial officer at Fidelity Management and Research Company in Boston, Tokyo, and Hong Kong and retired in 2013 as Chief Investment Officer of Fidelity Strategic Advisers, Inc. where he lead a team of investment professionals managing client assets. Prior thereto, Board member of Hong Kong Securities Clearing Co., Hong Kong Options Clearing Corp., the Thailand International Fund, Ltd., Fidelity Investments Life Insurance Company, and Empire Fidelity Investments Life Insurance Company. Board member of the Fonté Foundation (non-profit organization) and the Vincent Memorial Hospital Endowment (non-profit organization), where he serves on the Investment Committee and as a Chair of the Audit Committee. Mr. Ebsworth is a CFA® charterholder and an Adjunct Lecturer, Finance, at Babson College. | | Asset Allocation Trust |
| Jane A. Freeman (Born 1953) | | Trustee, since 2015 | | Retired. From 2012 to 2014 and 1999 to 2008, Chief Financial Officer of Scientific Learning Corporation. From 2008 to 2012, Ms. Freeman provided consulting services related to strategic business projects. Prior to 1999, Portfolio Manager at Rockefeller & Co. and Scudder, Stevens & Clark. Board member of the Harding Loevner Funds from 1996 to 2014, serving as both Lead Independent Director and chair of the Audit Committee. Board member of the Russell Exchange Traded Funds Trust from 2011 to 2012 and the chair of the Audit Committee. Ms. Freeman is a Board Member of Ruth Bancroft Garden (non-profit organization) and an inactive chartered financial analyst. | | Asset Allocation Trust |
| Peter G. Gordon** (Born 1942) | | Trustee, since 1998; Chairman, since 2005 | | Co-Founder, Retired Chairman, President and CEO of Crystal Geyser Water Company. Trustee Emeritus, Colby College. | | Asset Allocation Trust |
| Isaiah Harris, Jr. (Born 1952) | | Trustee, since 2009 | | Retired. Chairman of the Board of CIGNA Corporation since 2009, and Director since 2005. From 2003 to 2011, Director of Deluxe Corporation. Prior thereto, President and CEO of BellSouth Advertising and Publishing Corp. from 2005 to 2007, President and CEO of BellSouth Enterprises from 2004 to 2005 and President of BellSouth Consumer Services from 2000 to 2003. Emeritus member of the Iowa State University Foundation Board of Governors. Emeritus Member of the Advisory Board of Iowa State University School of Business. Advisory Board Member, Palm Harbor Academy (charter school). Advisory Board Member, Child Evangelism Fellowship (non-profit). Mr. Harris is a certified public accountant (inactive status). | | CIGNA Corporation; Asset Allocation Trust |
| Judith M. Johnson (Born 1949) | | Trustee, since 2008; Audit Committee Chairman, since 2008 | | Retired. Prior thereto, Chief Executive Officer and Chief Investment Officer of Minneapolis Employees Retirement Fund from 1996 to 2008. Ms. Johnson is an attorney, certified public accountant and a certified managerial accountant. | | Asset Allocation Trust |
| David F. Larcker (Born 1950) | | Trustee, since 2009 | | James Irvin Miller Professor of Accounting at the Graduate School of Business, Stanford University, Director of the Corporate Governance Research Initiative and Senior Faculty of The Rock Center for Corporate Governance since 2006. From 2005 to 2008, Professor of Accounting at the Graduate School of Business, Stanford University. Prior thereto, Ernst & Young Professor of Accounting at The Wharton School, University of Pennsylvania from 1985 to 2005. | | Asset Allocation Trust |
| | | | |
| 28 | | Wells Fargo Ultra Short-Term Municipal Income Fund | | Other information (unaudited) |
| | | | | | |
Name and year of birth | | Position held and length of service* | | Principal occupations during past five years or longer | | Current other public company or
investment company
directorships |
| Olivia S. Mitchell (Born 1953) | | Trustee, since 2006 | | International Foundation of Employee Benefit Plans Professor, Wharton School of the University of Pennsylvania since 1993. Director of Wharton’s Pension Research Council and Boettner Center on Pensions & Retirement Research, and Research Associate at the National Bureau of Economic Research. Previously, Cornell University Professor from 1978 to 1993. | | Asset Allocation Trust |
| Timothy J. Penny (Born 1951) | | Trustee, since 1996 | | President and Chief Executive Officer of Southern Minnesota Initiative Foundation, a non-profit organization, since 2007 and Senior Fellow at the Humphrey Institute Policy Forum at the University of Minnesota since 1995. Member of the Board of Trustees of NorthStar Education Finance, Inc., a non-profit organization, since 2007. | | Asset Allocation Trust |
| Michael S. Scofield (Born 1943) | | Trustee, since 2010 | | Served on the Investment Company Institute’s Board of Governors and Executive Committee from 2008-2011 as well the Governing Council of the Independent Directors Council from 2006-2011 and the Independent Directors Council Executive Committee from 2008-2011. Chairman of the IDC from 2008-2010. Institutional Investor (Fund Directions) Trustee of Year in 2007. Trustee of the Evergreen Funds complex (and its predecessors) from 1984 to 2010. Chairman of the Evergreen Funds from 2000-2010. Former Trustee of the Mentor Funds. Retired Attorney, Law Offices of Michael S. Scofield. | | Asset Allocation Trust |
| * | Length of service dates reflect the Trustee’s commencement of service with the Trust’s predecessor entities, where applicable. |
| ** | Peter Gordon is expected to retire on December 31, 2017. |
Officers
| | | | | | |
Name and year of birth | | Position held and length of service | | Principal occupations during past five years or longer | | |
| Andrew Owen3 (Born 1960) | | President, since 2017 | | Executive Vice President of Wells Fargo Bank, N.A. and President of Wells Fargo & Company and Head of Affiliated Managers, Wells Fargo Asset Management, since 2014. Executive Vice President responsible for marketing, investments and product development for Wells Fargo Funds Management, LLC, from 2009 to 2014. | | |
| Nancy Wiser1 (Born 1967) | | Treasurer, since 2012 | | Executive Vice President of Wells Fargo Funds Management, LLC since 2011. Chief Operating Officer and Chief Compliance Officer at LightBox Capital Management LLC, from 2008 to 2011. | | |
| C. David Messman (Born 1960) | | Secretary, since 2000; Chief Legal Officer, since 2003 | | Senior Vice President and Secretary of Wells Fargo Funds Management, LLC since 2001. Assistant General Counsel of Wells Fargo Bank, N.A. since 2013 and Vice President and Managing Counsel of Wells Fargo Bank, N.A. from 1996 to 2013. | | |
| Michael Whitaker (Born 1967) | | Chief Compliance Officer, since 2016 | | Executive Vice President of Wells Fargo Funds Management, LLC since 2016. Chief Compliance Officer of Fidelity’s Fixed Income Funds and Asset Allocation Funds from 2008 to 2016, Compliance Officer of FMR Co., Inc. from 2014 to 2016, Fidelity Investments Money Management, Inc. from 2014 to 2016, Fidelity Investments from 2007 to 2016. | | |
| David Berardi (Born 1975) | | Assistant Treasurer, since 2009 | | Vice President of Wells Fargo Funds Management, LLC since 2009. Vice President of Evergreen Investment Management Company, LLC from 2008 to 2010. Manager of Fund Reporting and Control for Evergreen Investment Management Company, LLC from 2004 to 2010. | | |
| Jeremy DePalma1 (Born 1974) | | Assistant Treasurer, since 2009 | | Senior Vice President of Wells Fargo Funds Management, LLC since 2009. Senior Vice President of Evergreen Investment Management Company, LLC from 2008 to 2010 and head of the Fund Reporting and Control Team within Fund Administration from 2005 to 2010. | | |
| 1 | Nancy Wiser acts as Treasurer of 70 funds in the Fund Complex. Jeremy DePalma acts as Treasurer of 69 funds and Assistant Treasurer of 70 funds in the Fund Complex. |
| 2 | The Statement of Additional Information includes additional information about the Trustees and is available, without charge, upon request, by calling 1-800-222-8222 or by visiting the website at wellsfargofunds.com. |
| 3 | Andrew Owen became President on January 1, 2017. |
| | | | | | |
| List of abbreviations | | Wells Fargo Ultra Short-Term Municipal Income Fund | | | 29 | |
The following is a list of common abbreviations for terms and entities that may have appeared in this report.
| ACA | — ACA Financial Guaranty Corporation |
| ADR | — American depositary receipt |
| ADS | — American depositary shares |
| AGC | — Assured Guaranty Corporation |
| AGM | — Assured Guaranty Municipal |
| Ambac | — Ambac Financial Group Incorporated |
| AMT | — Alternative minimum tax |
| BAN | — Bond anticipation notes |
| BHAC | — Berkshire Hathaway Assurance Corporation |
| CAB | — Capital appreciation bond |
| CCAB | — Convertible capital appreciation bond |
| CDA | — Community Development Authority |
| CDO | — Collateralized debt obligation |
| DRIVER | — Derivative inverse tax-exempt receipts |
| DW&P | — Department of Water & Power |
| DWR | — Department of Water Resources |
| ECFA | — Educational & Cultural Facilities Authority |
| EDA | — Economic Development Authority |
| EDFA | — Economic Development Finance Authority |
| ETF | — Exchange-traded fund |
| FDIC | — Federal Deposit Insurance Corporation |
| FFCB | — Federal Farm Credit Banks |
| FGIC | — Financial Guaranty Insurance Corporation |
| FHA | — Federal Housing Administration |
| FHLB | — Federal Home Loan Bank |
| FHLMC | — Federal Home Loan Mortgage Corporation |
| FICO | — The Financing Corporation |
| FNMA | — Federal National Mortgage Association |
| GDR | — Global depositary receipt |
| GNMA | — Government National Mortgage Association |
| HCFR | — Healthcare facilities revenue |
| HEFA | — Health & Educational Facilities Authority |
| HEFAR | — Higher education facilities authority revenue |
| HFA | — Housing Finance Authority |
| HFFA | — Health Facilities Financing Authority |
| HUD | — Department of Housing and Urban Development |
| IDA | — Industrial Development Authority |
| IDAG | — Industrial Development Agency |
| KRW | — Republic of Korea won |
| LIBOR | — London Interbank Offered Rate |
| LIFER | — Long Inverse Floating Exempt Receipts |
| LLC | — Limited liability company |
| LLLP | — Limited liability limited partnership |
| LLP | — Limited liability partnership |
| MBIA | — Municipal Bond Insurance Association |
| MFHR | — Multifamily housing revenue |
| MSTR | — Municipal securities trust receipts |
| MUD | — Municipal Utility District |
| National | — National Public Finance Guarantee Corporation |
| PCFA | — Pollution Control Financing Authority |
| PCL | — Public Company Limited |
| PCR | — Pollution control revenue |
| PFA | — Public Finance Authority |
| PFFA | — Public Facilities Financing Authority |
| PFOTER | — Puttable floating option tax-exempt receipts |
| plc | — Public limited company |
| PUTTER | — Puttable tax-exempt receipts |
| R&D | — Research & development |
| Radian | — Radian Asset Assurance |
| RAN | — Revenue anticipation notes |
| RDA | — Redevelopment Authority |
| RDFA | — Redevelopment Finance Authority |
| REIT | — Real estate investment trust |
| ROC | — Reset option certificates |
| SAVRS | — Select auction variable rate securities |
| SBA | — Small Business Authority |
| SDR | — Swedish depositary receipt |
| SFHR | — Single-family housing revenue |
| SFMR | — Single-family mortgage revenue |
| SPA | — Standby purchase agreement |
| SPDR | — Standard & Poor’s Depositary Receipts |
| SPEAR | — Short Puttable Exempt Adjustable Receipts |
| STRIPS | — Separate trading of registered interest and |
| TAN | — Tax anticipation notes |
| TIPS | — Treasury inflation-protected securities |
| TRAN | — Tax revenue anticipation notes |
| TTFA | — Transportation Trust Fund Authority |
| TVA | — Tennessee Valley Authority |
This page is intentionally left blank.
This page is intentionally left blank.
This page is intentionally left blank.

For more information
More information about Wells Fargo Funds is available free upon request. To obtain literature, please write, email, visit the Fund’s website, or call:
Wells Fargo Funds
P.O. Box 8266
Boston, MA 02266-8266
Email: fundservice@wellsfargo.com
Website: wellsfargofunds.com
Individual investors: 1-800-222-8222
Retail investment professionals: 1-888-877-9275
Institutional investment professionals: 1-866-765-0778
This report and the financial statements contained herein are submitted for the general information of the shareholders of the Fund. If this report is used for promotional purposes, distribution of the report must be accompanied or preceded by a current prospectus. Before investing, please consider the investment objectives, risks, charges, and expenses of the investment. For a current prospectus and, if available, a summary prospectus, containing this information, call 1-800-222-8222 or visit the Fund’s website at wellsfargofunds.com. Read the prospectus carefully before you invest or send money.
Wells Fargo Asset Management (WFAM) is a trade name used by the asset management businesses of Wells Fargo & Company. Wells Fargo Funds Management, LLC, a wholly owned subsidiary of Wells Fargo & Company, provides investment advisory and administrative services for Wells Fargo Funds. Other affiliates of Wells Fargo & Company provide subadvisory and other services for the funds. The funds are distributed by Wells Fargo Funds Distributor, LLC, Member FINRA, an affiliate of Wells Fargo & Company. Neither Wells Fargo Funds Management nor Wells Fargo Funds Distributor has Fund customer accounts/assets, and neither provides investment advice/recommendations or acts as an investment advice fiduciary to any investor.
NOT FDIC INSURED ◾ NO BANK GUARANTEE ◾ MAY LOSE VALUE
© 2016 Wells Fargo Funds Management, LLC. All rights reserved.
| | |
 | | 300488 02-17 SA258/SAR258 12-16 |
Semi-Annual Report
December 31, 2016

Wells Fargo Wisconsin Tax-Free Fund


Reduce clutter. Save trees.
Sign up for electronic delivery of prospectuses and shareholder reports at wellsfargo.com/advantagedelivery
Contents
The views expressed and any forward-looking statements are as of December 31, 2016, unless otherwise noted, and are those of the Fund managers and/or Wells Fargo Funds Management, LLC. Discussions of individual securities, or the markets generally, or any Wells Fargo Fund are not intended as individual recommendations. Future events or results may vary significantly from those expressed in any forward-looking statements. The views expressed are subject to change at any time in response to changing circumstances in the market. Wells Fargo Funds Management, LLC and the Fund disclaim any obligation to publicly update or revise any views expressed or forward-looking statements.
NOT FDIC INSURED ◾ NO BANK GUARANTEE ◾ MAY LOSE VALUE
| | | | |
| 2 | | Wells Fargo Wisconsin Tax-Free Fund | | Letter to shareholders (unaudited) |

Andrew Owen
President
Wells Fargo Funds
The Bloomberg Barclays Municipal Bond Index,1 a broad measure tracking investment-grade municipal bonds, lost 3.91% during the six-month reporting period.
Dear Shareholder:
As the new president of Wells Fargo Funds now that Karla Rabusch is retiring from that position after nearly 14 years, I am pleased to offer you this semi-annual report for the Wells Fargo Wisconsin Tax-Free Fund for the six-month period that ended December 31, 2016. The Federal Reserve (Fed) raised the federal funds rate in December by 0.25%. Municipal bond yields rose sharply in the fourth quarter. The Bloomberg Barclays Municipal Bond Index,1 a broad measure tracking investment-grade municipal bonds, lost 3.91% during the six-month reporting period.
Municipal bond yields rose during the reporting period.
The municipal market reversed course in the second half of 2016, with yields increasing and prices declining. Initially the sell-off was driven by negative supply and demand trends, also known as technical factors. By the fourth quarter, fund flows turned negative (reversing a trend of 54 weeks of positive flows) and municipal bond supply increased. These deteriorating technical factors, along with the expectation of an expansionary fiscal policy and lower tax rates under the new administration, drove market volatility; credit spreads widened and the yield curve steepened as the market sold-off.
Stronger economic indicators drove monetary policy.
On December 14, the Fed hiked the short-term interest rate by 0.25% to reach a target range of 0.50% to 0.75%. This was the second rate increase in more than 10 years, with the Fed citing job gains and lower than expected unemployment of 4.6%. The Fed confirmed the continuation of an accommodative monetary policy to support a stronger labor market and reiterated its long-term objective of a 2% inflation rate, which increased slightly during the fourth quarter but fell short of the benchmark. The Fed expressed confidence in the economy’s progress and expects this positive trajectory to continue. Both sentiments helped to bolster the Fed’s expectation of three additional rate increases during 2017.
Meanwhile, the Bank of England continued its quantitative-easing program and lowered the official bank rate to 0.25% in August 2016. The Bank of Japan maintained its negative interest rate put in place earlier in the year, and in September announced an interest rate target for 10-year government bonds—keeping the yield at zero—as it struggles to accelerate economic growth. In December, the European Central Bank announced that it will extend its quantitative-easing program and continue purchasing large amounts of eurozone corporate and government debt each month through December 2017.
U.S. economic data released during the fourth quarter showed that U.S. real gross domestic product increased at an annual 3.5% rate in the third quarter, the largest increase since mid-2014. Business investment by U.S. companies was mixed, with a 12.0% increase in structures and 4.5% decrease in equipment over the prior quarter on an annualized basis. Consumer confidence hit pre-recession levels for the first time in November, and increased again in December. The dollar strengthened during the quarter’s post-election period.
Supply and demand trends reflected volatility of municipals.
Demand for municipal debt, as measured by cash flows to municipal bond mutual funds, was negative for the reporting period. There were $19 billion of inflows from July through October, but a sharp reversal occurred post-election, with $26 billion of redemptions in the last two months of the year. This followed a
| 1 | The Bloomberg Barclays Municipal Bond Index (formerly known as Barclays Municipal Bond Index) is an unmanaged index composed of long-term tax-exempt bonds with a minimum credit rating of Baa. You cannot invest directly in an index. |
| | | | | | |
| Letter to shareholders (unaudited) | | Wells Fargo Wisconsin Tax-Free Fund | | | 3 | |
noteworthy 54 consecutive weeks of inflows. On the supply side, August through October saw 30-year record-breaking volumes each month; both refundings and new issuance were up. These levels were attributed to deals pulled forward in anticipation of higher interest rates. Not surprisingly, December volume was down 25% year-over-year to $19 billion. Total municipal bond issuance for the period was $219 billion; new issuance outpaced refundings by $18 billion.
Municipal credit fundamentals were solid.
Overall, municipal credit was sound for the period. The most significant development was the election of Ricardo Rossello as governor of the Commonwealth of Puerto Rico. In the past, prices of Puerto Rico bonds reflected negative credit considerations, including defaults on its securities in 2015 and early 2016, but recent events point to a potentially more positive fiscal environment. Rossello campaigned, in part, on a platform that included promises to ultimately pay 100% of interest due on Puerto Rico’s outstanding municipal debt, negotiate with bondholders, and ration government expenditures. This stance is a major shift from his predecessor who focused on a bankruptcy mechanism.
Since the end of the financial crisis, structural changes in the fixed-income markets have reduced trading liquidity (the degree to which assets can be bought or sold without affecting the price). New regulations and capital requirements have caused traditional liquidity suppliers (banks and broker/dealers) to be more risk averse and hold less inventory. Meanwhile, corporate debt issuance has spiked as companies finance themselves at record-low yields, bond mutual funds hold larger amounts of this new debt supply, trading volumes are lower, and large-size trades are more difficult to execute. However, fixed-income markets appeared to function well over the past year with sufficient liquidity.
Don’t let short-term uncertainty derail long-term investment goals.
Periods of uncertainty can present challenges, but experience has taught us that maintaining long-term investment goals can be an effective way to plan for the future. To help you create a sound strategy based on your personal goals and risk tolerance, Wells Fargo Funds offers more than 100 mutual funds spanning a wide range of asset classes and investment styles. Although diversification cannot guarantee an investment profit or prevent losses, we believe it can be an effective way to manage investment risk and potentially smooth out overall portfolio performance. We encourage investors to know their investments and to understand that appropriate levels of risk-taking may unlock opportunities.
Thank you for choosing to invest in Wells Fargo Funds. We appreciate your confidence in us and remain committed to helping you meet your financial needs.
Sincerely,

Andrew Owen
President
Wells Fargo Funds
Periods of uncertainty can present challenges, but experience has taught us that maintaining long-term investment goals can be an effective way to plan for the future.
For further information about your Fund, contact your investment professional, visit our website at wellsfargofunds.com, or call us directly at 1-800-222-8222. We are available 24 hours a day, 7 days a week.
| | | | |
| 4 | | Wells Fargo Wisconsin Tax-Free Fund | | Performance highlights (unaudited) |
Investment objective
The Fund seeks current income exempt from federal income tax and Wisconsin individual income tax.
Manager
Wells Fargo Funds Management, LLC
Subadviser
Wells Capital Management Incorporated
Portfolio managers
Lyle J. Fitterer, CFA®, CPA
Thomas Stoeckmann
Average annual total returns (%) as of December 31, 20161
| | | | | | | | | | | | | | | | | | | | | | | | | | | | | | | | | | |
| | | | | Including sales charge | | | Excluding sales charge | | | Expense ratios2 (%) | |
| | | Inception date | | 1 year | | | 5 year | | | 10 year | | | 1 year | | | 5 year | | | 10 year | | | Gross | | | Net3 | |
| Class A (WWTFX) | | 3-31-2008 | | | (4.76 | ) | | | 1.54 | | | | 2.99 | | | | (0.25 | ) | | | 2.49 | | | | 3.47 | | | | 0.93 | | | | 0.70 | |
| Class C (WWTCX) | | 12-26-2002 | | | (2.00 | ) | | | 1.72 | | | | 2.68 | | | | (1.00 | ) | | | 1.72 | | | | 2.68 | | | | 1.68 | | | | 1.45 | |
| Institutional Class (WWTIX) | | 10-31-2016 | | | – | | | | – | | | | – | | | | (0.22 | ) | | | 2.49 | | | | 3.47 | | | | 0.60 | | | | 0.52 | |
| Bloomberg Barclays Municipal Bond Index4 | | – | | | – | | | | – | | | | – | | | | 0.25 | | | | 3.28 | | | | 4.25 | | | | – | | | | – | |
| Bloomberg Barclays Wisconsin Municipal Bond Index5 | | – | | | – | | | | – | | | | – | | | | 0.04 | | | | 2.96 | | | | 4.31 | | | | – | | | | – | |
Figures quoted represent past performance, which is no guarantee of future results, and do not reflect taxes that a shareholder may pay on fund distributions or the redemption of fund shares. Investment return and principal value of an investment will fluctuate so that an investor’s shares, when redeemed, may be worth more or less than their original cost. Performance shown without sales charges would be lower if sales charges were reflected. Current performance may be lower or higher than the performance data quoted, which assumes the reinvestment of dividends and capital gains. Current month-end performance is available on the Fund’s website, wellsfargofunds.com.
Index returns do not include transaction costs associated with buying and selling securities, any mutual fund fees or expenses, or any taxes. It is not possible to invest directly in an index.
For Class A shares, the maximum front-end sales charge is 4.50%. For Class C shares, the maximum contingent deferred sales charge is 1.00%. Performance including a contingent deferred sales charge assumes the sales charge for the corresponding time period. Institutional Class shares are sold without a front-end sales charge or contingent deferred sales charge.
Bond values fluctuate in response to the financial condition of individual issuers, general market and economic conditions, and changes in interest rates. Changes in market conditions and government policies may lead to periods of heightened volatility in the bond market and reduced liquidity for certain bonds held by the Fund. In general, when interest rates rise, bond values fall and investors may lose principal value. Interest-rate changes and their impact on the Fund and its share price can be sudden and unpredictable. The use of derivatives may reduce returns and/or increase volatility. Certain investment strategies tend to increase the total risk of an investment (relative to the broader market). The Fund is exposed Wisconsin and Puerto Rico municipal securities risk and high-yield securities risk. Consult the Fund’s prospectus for additional information on these and other risks. A portion of the Fund’s income may be subject to federal, state, and/ or local income taxes or the Alternative Minimum Tax (AMT). Any capital gains distributions may be taxable.
Please see footnotes on page 5.
| | | | | | |
| Performance highlights (unaudited) | | Wells Fargo Wisconsin Tax-Free Fund | | | 5 | |
| | | | |
| Effective maturity distribution as of December 31, 20166 |
|
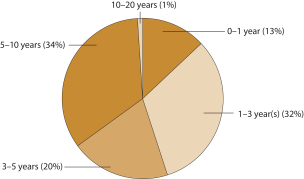
|
| | | | |
| Credit quality as of December 31, 20167 |
|
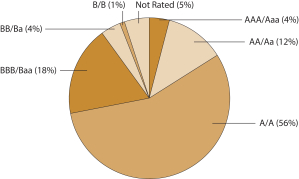
|
| 1 | Historical performance shown for Class A shares prior to their inception reflects the performance of the former Investor Class shares, and includes the higher expenses applicable to the former Investor Class shares (except during those periods in which expenses of Class A shares would have been higher than those of the former Investor Class shares, no such adjustment is reflected). If these expenses had not been included, returns would be higher. Historical performance shown for the Institutional Class shares prior to their inception reflects the performance of the Class A shares, and is not adjusted to reflect Institutional Class expenses. If these expenses had been included, returns for Institutional Class would be higher. |
| 2 | Reflects the expense ratios as stated in the most recent prospectuses. The expense ratios shown are subject to change and may differ from the annualized expense ratios shown in the financial highlights of this report. |
| 3 | The manager has contractually committed through October 31, 2017, to waive fees and/or reimburse expenses to the extent necessary to cap the Fund’s Total Annual Fund Operating Expenses After Fee Waiver at the amounts shown. After this time, the cap may be increased or the commitment to maintain the cap may be terminated only with the approval of the Board of Trustees. Brokerage commissions, stamp duty fees, interest, taxes, acquired fund fees and expenses, and extraordinary expenses are excluded from the expense cap. Without this cap, the Fund’s returns would have been lower. |
| 4 | The Bloomberg Barclays Municipal Bond Index (formerly known as Barclays Municipal Bond Index) is an unmanaged index composed of long-term tax-exempt bonds with a minimum credit rating of Baa. You cannot invest directly in an index. |
| 5 | The Bloomberg Barclays Wisconsin Municipal Bond Index (formerly known as Barclays Wisconsin Municipal Bond Index) is the Wisconsin component of the Bloomberg Barclays Municipal Bond Index. You cannot invest directly in an index. |
| 6 | Amounts are calculated based on the total investments of the Fund. These amounts are subject to change and may have changed since the date specified. |
| 7 | The credit quality distribution of portfolio holdings reflected in the chart is based on ratings from Standard & Poor’s, Moody’s Investors Service, and/ or Fitch Ratings Ltd. Credit quality ratings apply to the underlying holdings of the Fund and not to the Fund itself. The percentages of the Fund’s portfolio with the ratings depicted in the chart are calculated based on the total market value of fixed income securities held by the Fund. If a security was rated by all three rating agencies, the middle rating was utilized. If rated by two of three rating agencies, the lower rating was utilized, and if rated by one of the rating agencies, that rating was utilized. Standard & Poor’s rates the creditworthiness of bonds, ranging from AAA (highest) to D (lowest). Ratings from A to CCC may be modified by the addition of a plus (+) or minus (-) sign to show relative standing within the rating categories. Standard & Poor’s rates the creditworthiness of short-term notes from SP-1 (highest) to SP-3 (lowest). Moody’s rates the creditworthiness of bonds, ranging from Aaa (highest) to C (lowest). Ratings Aa to B may be modified by the addition of a number 1 (highest) to 3 (lowest) to show relative standing within the ratings categories. Moody’s rates the creditworthiness of short-term U.S. tax-exempt municipal securities from MIG 1/VMIG 1 (highest) to SG (lowest). Fitch rates the creditworthiness of bonds, ranging from AAA (highest) to D (lowest). Credit quality distribution is subject to change and may have changed since the date specified. |
| | | | |
| 6 | | Wells Fargo Wisconsin Tax-Free Fund | | Fund expenses (unaudited) |
As a shareholder of the Fund, you incur two types of costs: (1) transaction costs, including sales charges (loads) on purchase payments and contingent deferred sales charges (if any) on redemptions and (2) ongoing costs, including management fees, distribution (12b-1) and/or shareholder servicing fees, and other Fund expenses. This example is intended to help you understand your ongoing costs (in dollars) of investing in the Fund and to compare these costs with the ongoing costs of investing in other mutual funds.
The example is based on an investment of $1,000 invested at the beginning of the six-month period and held for the entire period from July 1, 2016 to December 31, 2016.
Actual expenses
The “Actual” line of the table below provides information about actual account values and actual expenses. You may use the information in this line, together with the amount you invested, to estimate the expenses that you paid over the period. Simply divide your account value by $1,000 (for example, an $8,600 account value divided by $1,000 = 8.6), then multiply the result by the number in the “Actual” line under the heading entitled “Expenses paid during period” for your applicable class of shares to estimate the expenses you paid on your account during this period.
Hypothetical example for comparison purposes
The “Hypothetical” line of the table below provides information about hypothetical account values and hypothetical expenses based on the Fund’s actual expense ratio and an assumed rate of return of 5% per year before expenses, which is not the Fund’s actual return. The hypothetical account values and expenses may not be used to estimate the actual ending account balance or expenses you paid for the period. You may use this information to compare the ongoing costs of investing in the Fund and other funds. To do so, compare this 5% hypothetical example with the 5% hypothetical examples that appear in the shareholder reports of the other funds.
Please note that the expenses shown in the table are meant to highlight your ongoing costs only and do not reflect any transactional costs, such as sales charges (loads) and contingent deferred sales charges. Therefore, the “Hypothetical” line of the table is useful in comparing ongoing costs only and will not help you determine the relative total costs of owning different funds. In addition, if these transactional costs were included, your costs would have been higher.
| | | | | | | | | | | | | | | | |
| | | Beginning
account value
7-1-2016 | | | Ending
account value
12-31-2016 | | | Expenses
paid during
the period¹ | | | Annualized net
expense ratio | |
Class A | | | | | | | | | | | | | | | | |
Actual | | $ | 1,000.00 | | | $ | 970.63 | | | $ | 3.47 | | | | 0.70 | % |
Hypothetical (5% return before expenses) | | $ | 1,000.00 | | | $ | 1,021.62 | | | $ | 3.56 | | | | 0.70 | % |
Class C | | | | | | | | | | | | | | | | |
Actual | | $ | 1,000.00 | | | $ | 966.97 | | | $ | 7.17 | | | | 1.45 | % |
Hypothetical (5% return before expenses) | | $ | 1,000.00 | | | $ | 1,017.85 | | | $ | 7.35 | | | | 1.45 | % |
Institutional Class | | | | | | | | | | | | | | | | |
Actual | | $ | 1,000.00 | | | $ | 970.92 | | | $ | 2.58 | | | | 0.52 | % |
Hypothetical (5% return before expenses) | | $ | 1,000.00 | | | $ | 1,022.52 | | | $ | 2.64 | | | | 0.52 | % |
| 1 | Expenses paid is equal to the annualized net expense ratio of each class multiplied by the average account value over the period, multiplied by the number of days in the most recent fiscal half-year divided by the number of days in the fiscal year (to reflect the one-half-year period). |
| | | | | | |
| Portfolio of investments—December 31, 2016 (unaudited) | | Wells Fargo Wisconsin Tax-Free Fund | | | 7 | |
| | | | | | | | | | | | | | | | |
| Security name | | Interest rate | | | Maturity date | | | Principal | | | Value | |
| | | | | | | | | | | | | | | | |
|
Municipal Obligations: 99.26% | |
|
| Guam: 15.15% | |
Guam Government Business Privilege Tax Series A (Tax Revenue) | | | 5.25 | % | | | 1-1-2036 | | | $ | 2,000,000 | | | $ | 2,124,440 | |
Guam Government Business Privilege Tax Series B1 (Tax Revenue) | | | 5.00 | | | | 1-1-2042 | | | | 500,000 | | | | 520,395 | |
Guam Government Business Privilege Tax Series D (Tax Revenue) | | | 5.00 | | | | 11-15-2021 | | | | 2,250,000 | | | | 2,483,753 | |
Guam Government Business Privilege Tax Series D (Tax Revenue) | | | 5.00 | | | | 11-15-2022 | | | | 1,500,000 | | | | 1,677,480 | |
Guam Government Limited Obligation Bonds Section 30 Series A (Tax Revenue) | | | 5.00 | | | | 12-1-2019 | | | | 1,500,000 | | | | 1,617,210 | |
Guam Government Limited Obligation Bonds Section 30 Series A (Tax Revenue) | | | 5.00 | | | | 12-1-2021 | | | | 2,000,000 | | | | 2,217,340 | |
Guam Government Limited Obligation Bonds Section 30 Series A (Miscellaneous Revenue) | | | 5.38 | | | | 12-1-2024 | | | | 1,000,000 | | | | 1,105,420 | |
Guam Government Limited Obligation Bonds Section 30 Series A (Miscellaneous Revenue) | | | 5.50 | | | | 12-1-2019 | | | | 1,000,000 | | | | 1,112,300 | |
Guam Government Series A (GO Revenue) | | | 7.00 | | | | 11-15-2039 | | | | 2,000,000 | | | | 2,301,320 | |
Guam Government Waterworks Authority Water & Wastewater System Project (Water & Sewer Revenue) | | | 5.00 | | | | 7-1-2021 | | | | 300,000 | | | | 328,272 | |
Guam Government Waterworks Authority Water & Wastewater System Project (Water & Sewer Revenue) | | | 5.25 | | | | 7-1-2025 | | | | 740,000 | | | | 829,126 | |
Guam Government Waterworks Authority Water & Wastewater System Project (Water & Sewer Revenue) | | | 5.00 | | | | 7-1-2019 | | | | 650,000 | | | | 696,222 | |
Guam International Airport Authority Series A (Airport Revenue) | | | 5.00 | | | | 10-1-2019 | | | | 100,000 | | | | 107,951 | |
Guam International Airport Authority Series A (Airport Revenue) | | | 5.00 | | | | 10-1-2020 | | | | 100,000 | | | | 109,557 | |
Guam International Airport Authority Series C (Airport Revenue) | | | 5.00 | | | | 10-1-2021 | | | | 2,500,000 | | | | 2,725,625 | |
Guam International Airport Authority Series C (Airport Revenue, AGM Insured) | | | 6.13 | | | | 10-1-2043 | | | | 1,500,000 | | | | 1,702,080 | |
Guam Power Authority Series A (Utilities Revenue, AGM Insured) | | | 5.00 | | | | 10-1-2019 | | | | 1,575,000 | | | | 1,696,039 | |
Guam Power Authority Series A (Utilities Revenue, AGM Insured) | | | 5.00 | | | | 10-1-2020 | | | | 500,000 | | | | 546,645 | |
| | | | |
| | | | | | | | | | | | | | | 23,901,175 | |
| | | | | | | | | | | | | | | | |
|
| Illinois: 5.67% | |
Chicago IL Board of Education CAB School Reform Series A (GO Revenue, National Insured) ¤ | | | 0.00 | | | | 12-1-2023 | | | | 1,000,000 | | | | 737,460 | |
Chicago IL Park District Special Recreation Activity Series E (GO Revenue) | | | 5.00 | | | | 11-15-2027 | | | | 1,000,000 | | | | 1,127,640 | |
Chicago IL Refunding Bond (Tax Revenue) | | | 5.00 | | | | 1-1-2034 | | | | 2,000,000 | | | | 2,073,380 | |
Chicago IL Series A (GO Revenue) | | | 5.00 | | | | 1-1-2027 | | | | 1,700,000 | | | | 1,641,605 | |
Chicago IL Waterworks Second Lien (Water & Sewer Revenue, AGM Insured) | | | 5.00 | | | | 11-1-2020 | | | | 500,000 | | | | 525,750 | |
Illinois (Miscellaneous Revenue) | | | 5.50 | | | | 7-1-2026 | | | | 250,000 | | | | 260,455 | |
Illinois Sports Facilities Authority State Tax Supported CAB (Tax Revenue,
Ambac Insured) ¤ | | | 0.00 | | | | 6-15-2024 | | | | 3,500,000 | | | | 2,575,230 | |
| | | | |
| | | | | | | | | | | | | | | 8,941,520 | |
| | | | | | | | | | | | | | | | |
|
| Michigan: 0.14% | |
Michigan Municipal Bond Authority Local Government Loan Program Series A (Miscellaneous Revenue, Ambac Insured) | | | 4.00 | | | | 11-1-2021 | | | | 215,000 | | | | 215,181 | |
| | | | | | | | | | | | | | | | |
|
| New Jersey: 1.89% | |
New Jersey EDA Series EE (Miscellaneous Revenue) | | | 5.00 | | | | 9-1-2023 | | | | 935,000 | | | | 969,801 | |
New Jersey TTFA CAB Series A (Transportation Revenue) ¤ | | | 0.00 | | | | 12-15-2031 | | | | 2,000,000 | | | | 954,060 | |
New Jersey TTFA Federal Highway Reimbursement Series A1 (Transportation Revenue) | | | 5.00 | | | | 6-15-2030 | | | | 1,000,000 | | | | 1,064,310 | |
| | | | |
| | | | | | | | | | | | | | | 2,988,171 | |
| | | | | | | | | | | | | | | | |
|
| Ohio: 1.29% | |
Akron OH Bath Copley Joint Township Hospital District Summa Health System Obligated Group (Health Revenue) | | | 5.25 | | | | 11-15-2041 | | | | 1,500,000 | | | | 1,616,100 | |
Ohio Air Quality Development Authority Series A (Utilities Revenue) ± | | | 3.75 | | | | 12-1-2023 | | | | 1,000,000 | | | | 418,470 | |
| | | | |
| | | | | | | | | | | | | | | 2,034,570 | |
| | | | | | | | | | | | | | | | |
The accompanying notes are an integral part of these financial statements.
| | | | |
| 8 | | Wells Fargo Wisconsin Tax-Free Fund | | Portfolio of investments—December 31, 2016 (unaudited) |
| | | | | | | | | | | | | | | | |
| Security name | | Interest rate | | | Maturity date | | | Principal | | | Value | |
| | | | | | | | | | | | | | | | |
|
| Puerto Rico: 6.55% | |
Puerto Rico Electric Power Authority Refunding Bond Series LL (Utilities Revenue, National Insured) | | | 5.50 | % | | | 7-1-2017 | | | $ | 1,000,000 | | | $ | 1,017,880 | |
Puerto Rico HFA Subordinated Capital Fund Modernization Program Refunding Bond (Housing Revenue, HUD Insured) | | | 5.50 | | | | 12-1-2018 | | | | 600,000 | | | | 641,454 | |
Puerto Rico Highway & Transportation Authority Refunding Bond Series L (Transportation Revenue, AGC Insured) | | | 5.25 | | | | 7-1-2019 | | | | 1,000,000 | | | | 1,048,930 | |
Puerto Rico Highway & Transportation Authority Refunding Bond Series L (Transportation Revenue, BHAC/FGIC Insured) | | | 5.25 | | | | 7-1-2021 | | | | 300,000 | | | | 330,759 | |
Puerto Rico Industrial Tourist Educational Medical & Environmental Control Facilities Financing Authority Hospital Auxilio Mutuo Obligated Group Series A (Health Revenue) | | | 5.00 | | | | 7-1-2017 | | | | 1,000,000 | | | | 1,013,070 | |
Puerto Rico Industrial Tourist Educational Medical & Environmental Control Facilities Financing Authority Hospital Auxilio Mutuo Obligated Group Series A (Health Revenue) | | | 5.00 | | | | 7-1-2018 | | | | 1,375,000 | | | | 1,412,249 | |
Puerto Rico Industrial Tourist Educational Medical & Environmental Control Facilities Financing Authority Hospital Auxilio Mutuo Obligated Group Series A (Health Revenue) | | | 5.00 | | | | 7-1-2019 | | | | 1,500,000 | | | | 1,560,045 | |
Puerto Rico Industrial Tourist Educational Medical & Environmental Control Facilities Financing Authority Hospital De La Concepcion Series A (Health Revenue) | | | 6.50 | | | | 11-15-2020 | | | | 20,000 | | | | 20,350 | |
Puerto Rico Municipal Finance Authority Series C (Tobacco Revenue, BHAC/FGIC Insured) | | | 5.50 | | | | 7-1-2020 | | | | 3,000,000 | | | | 3,275,790 | |
Puerto Rico Public Finance Corporation Commonwealth Appropriation Bond Series B (Miscellaneous Revenue, Government Development Bank for Puerto Rico SPA) (s) | | | 5.50 | | | | 8-1-2031 | | | | 250,000 | | | | 20,000 | |
| | | | |
| | | | | | | | | | | | | | | 10,340,527 | |
| | | | | | | | | | | | | | | | |
|
| Virgin Islands: 8.37% | |
Virgin Islands PFA (Miscellaneous Revenue) 144A | | | 5.00 | | | | 9-1-2020 | | | | 750,000 | | | | 803,955 | |
Virgin Islands PFA Gross Receipts Series C (Tax Revenue) | | | 5.00 | | | | 10-1-2017 | | | | 2,240,000 | | | | 2,236,394 | |
Virgin Islands PFA Gross Receipts Taxes Loan Notes (Tax Revenue, National Insured) | | | 4.00 | | | | 10-1-2020 | | | | 450,000 | | | | 450,833 | |
Virgin Islands PFA Gross Receipts Taxes Loan Notes (Tax Revenue, AGM Insured) | | | 4.00 | | | | 10-1-2022 | | | | 3,000,000 | | | | 3,127,560 | |
Virgin Islands PFA Matching Fund Loan Notes Senior Lien Series B (Tobacco Revenue, AGM Insured) | | | 5.00 | | | | 10-1-2025 | | | | 2,000,000 | | | | 2,142,180 | |
Virgin Islands PFA Series A (Tobacco Revenue) | | | 5.00 | | | | 10-1-2018 | | | | 4,505,000 | | | | 4,437,290 | |
Virgin Islands PFA Unrefunded Balance Bonds Series A (Miscellaneous Revenue) | | | 7.30 | | | | 10-1-2018 | | | | 10,000 | | | | 10,700 | |
| | | | |
| | | | | | | | | | | | | | | 13,208,912 | |
| | | | | | | | | | | | | | | | |
|
| Wisconsin: 60.20% | |
Blue Mounds WI CDA Series A (Miscellaneous Revenue) | | | 1.25 | | | | 4-1-2017 | | | | 50,000 | | | | 50,016 | |
Brookfield WI Community Development & Redevelopment Authority Series A (Miscellaneous Revenue) | | | 1.15 | | | | 6-1-2018 | | | | 550,000 | | | | 547,993 | |
Brookfield WI Community Development & Redevelopment Authority Series A (Miscellaneous Revenue) | | | 1.35 | | | | 6-1-2019 | | | | 750,000 | | | | 743,640 | |
Cudahy WI CDA Series A (Miscellaneous Revenue) | | | 1.20 | | | | 6-1-2017 | | | | 170,000 | | | | 170,070 | |
Cudahy WI CDA Series A (Miscellaneous Revenue) | | | 1.50 | | | | 6-1-2018 | | | | 200,000 | | | | 200,106 | |
Cudahy WI CDA Series C (Miscellaneous Revenue) | | | 0.70 | | | | 6-1-2017 | | | | 250,000 | | | | 249,790 | |
Cudahy WI CDA Series C (Miscellaneous Revenue) | | | 0.90 | | | | 6-1-2018 | | | | 200,000 | | | | 198,940 | |
Cudahy WI CDA Series C (Miscellaneous Revenue) | | | 1.05 | | | | 6-1-2019 | | | | 125,000 | | | | 123,510 | |
Glendale WI CDA Bayshore Public Parking (Miscellaneous Revenue) | | | 1.50 | | | | 10-1-2019 | | | | 300,000 | | | | 297,987 | |
Glendale WI CDA Series A (Miscellaneous Revenue) | | | 3.50 | | | | 10-1-2017 | | | | 1,635,000 | | | | 1,660,964 | |
Glendale WI CDA Series A (Miscellaneous Revenue) | | | 3.50 | | | | 10-1-2018 | | | | 1,700,000 | | | | 1,753,329 | |
Green Bay WI Housing Authority University Village Housing Incorporated (Education Revenue) | | | 4.38 | | | | 4-1-2022 | | | | 200,000 | | | | 208,472 | |
The accompanying notes are an integral part of these financial statements.
| | | | | | |
| Portfolio of investments—December 31, 2016 (unaudited) | | Wells Fargo Wisconsin Tax-Free Fund | | | 9 | |
| | | | | | | | | | | | | | | | |
| Security name | | Interest rate | | | Maturity date | | | Principal | | | Value | |
| | | | | | | | | | | | | | | | |
|
| Wisconsin (continued) | |
Green Bay WI Housing Authority University Village Housing Incorporated (Education Revenue) | | | 5.00 | % | | | 4-1-2030 | | | $ | 1,410,000 | | | $ | 1,503,934 | |
Green Bay WI RDA Bellin Memorial Hospital Incorporated (Health Revenue) | | | 5.50 | | | | 12-1-2023 | | | | 250,000 | | | | 270,198 | |
Green Bay WI RDA Bellin Memorial Hospital Incorporated (Health Revenue) | | | 5.65 | | | | 12-1-2026 | | | | 100,000 | | | | 108,363 | |
Green Bay WI RDA Bellin Memorial Hospital Incorporated (Health Revenue) | | | 6.00 | | | | 12-1-2029 | | | | 260,000 | | | | 283,470 | |
Green Bay WI RDA Bellin Memorial Hospital Incorporated (Health Revenue) | | | 6.15 | | | | 12-1-2032 | | | | 420,000 | | | | 459,110 | |
Kaukauna WI RDA (Miscellaneous Revenue) | | | 3.75 | | | | 6-1-2032 | | | | 850,000 | | | | 855,483 | |
Kaukauna WI RDA (Miscellaneous Revenue) | | | 4.00 | | | | 6-1-2019 | | | | 50,000 | | | | 52,603 | |
Kaukauna WI RDA (Miscellaneous Revenue) | | | 4.00 | | | | 6-1-2020 | | | | 100,000 | | | | 106,360 | |
Kaukauna WI RDA (Miscellaneous Revenue) | | | 4.00 | | | | 6-1-2021 | | | | 310,000 | | | | 331,660 | |
Kaukauna WI RDA (Miscellaneous Revenue) | | | 4.00 | | | | 6-1-2022 | | | | 235,000 | | | | 252,914 | |
Kaukauna WI RDA (Miscellaneous Revenue) | | | 4.00 | | | | 6-1-2023 | | | | 200,000 | | | | 215,842 | |
Kaukauna WI RDA (Miscellaneous Revenue) | | | 4.00 | | | | 6-1-2025 | | | | 425,000 | | | | 463,293 | |
Kaukauna WI RDA (Miscellaneous Revenue) | | | 4.00 | | | | 6-1-2028 | | | | 425,000 | | | | 452,523 | |
Kaukauna WI RDA (Miscellaneous Revenue) | | | 4.00 | | | | 6-1-2035 | | | | 900,000 | | | | 905,742 | |
Madison WI CDA Wisconsin Alumni Research Foundation (Education Revenue) | | | 5.00 | | | | 10-1-2023 | | | | 150,000 | | | | 163,401 | |
Madison WI CDA Wisconsin Alumni Research Foundation (Education Revenue) | | | 5.00 | | | | 10-1-2025 | | | | 475,000 | | | | 516,900 | |
Madison WI CDA Wisconsin Alumni Research Foundation (Education Revenue) | | | 5.00 | | | | 10-1-2039 | | | | 5,000,000 | | | | 5,397,550 | |
Milwaukee WI RDA Milwaukee Public Schools Series A (Miscellaneous Revenue) | | | 5.00 | | | | 11-15-2027 | | | | 1,020,000 | | | | 1,166,829 | |
Milwaukee WI RDA Milwaukee Public Schools Series A (Miscellaneous Revenue) | | | 5.00 | | | | 11-15-2028 | | | | 1,000,000 | | | | 1,140,090 | |
Milwaukee WI RDA Milwaukee Public Schools Series A (Miscellaneous Revenue) | | | 5.00 | | | | 11-15-2031 | | | | 750,000 | | | | 848,573 | |
Milwaukee WI RDA Neighborhood Schools Series A (Miscellaneous Revenue, Ambac Insured) | | | 3.85 | | | | 8-1-2020 | | | | 200,000 | | | | 202,312 | |
Milwaukee WI RDA Neighborhood Schools Series A (Miscellaneous Revenue, Ambac Insured) | | | 3.90 | | | | 8-1-2021 | | | | 405,000 | | | | 409,305 | |
Milwaukee WI RDA Public Schools Series A (Miscellaneous Revenue, Ambac Insured) | | | 4.00 | | | | 8-1-2023 | | | | 300,000 | | | | 302,754 | |
Milwaukee WI RDA Public Schools Series A (Miscellaneous Revenue) | | | 5.00 | | | | 8-1-2019 | | | | 915,000 | | | | 988,154 | |
Milwaukee WI RDA Public Schools Series A (Miscellaneous Revenue) | | | 5.00 | | | | 8-1-2020 | | | | 3,100,000 | | | | 3,412,666 | |
Milwaukee WI RDA Public Schools Series A (Miscellaneous Revenue) | | | 5.00 | | | | 8-1-2021 | | | | 3,330,000 | | | | 3,721,408 | |
Milwaukee WI RDA Science Education Consortium Incorporated Project Series A (Education Revenue) | | | 6.25 | | | | 8-1-2043 | | | | 2,100,000 | | | | 2,260,293 | |
Milwaukee WI RDA Summer Festival Project (Miscellaneous Revenue) | | | 3.15 | | | | 8-1-2017 | | | | 50,000 | | | | 50,557 | |
Milwaukee WI RDA Summer Festival Project (Miscellaneous Revenue) | | | 4.60 | | | | 8-1-2024 | | | | 870,000 | | | | 913,361 | |
Milwaukee WI RDA Summer Festival Project (Miscellaneous Revenue) | | | 5.00 | | | | 8-1-2030 | | | | 3,000,000 | | | | 3,195,750 | |
Milwaukee WI RDA Wisconsin Housing Preservation Corporation (Housing Revenue, Johnson Bank LOC) ø | | | 1.80 | | | | 12-1-2038 | | | | 2,105,000 | | | | 2,105,000 | |
Milwaukee WI Series B6 (GO Revenue) | | | 2.00 | | | | 4-1-2021 | | | | 175,000 | | | | 176,211 | |
Milwaukee WI Series B6 (GO Revenue) | | | 3.00 | | | | 4-1-2024 | | | | 570,000 | | | | 595,245 | |
Milwaukee WI Series B6 (GO Revenue) | | | 5.00 | | | | 4-1-2022 | | | | 350,000 | | | | 401,867 | |
Milwaukee WI Series B6 (GO Revenue) | | | 5.00 | | | | 4-1-2023 | | | | 580,000 | | | | 676,129 | |
Milwaukee WI Series B6 (GO Revenue) | | | 5.00 | | | | 4-1-2025 | | | | 550,000 | | | | 654,209 | |
Monroe WI RDA Monroe Clinic Incorporated (Health Revenue) | | | 5.50 | | | | 2-15-2029 | | | | 1,000,000 | | | | 1,086,470 | |
Monroe WI RDA Monroe Clinic Incorporated (Health Revenue) | | | 5.88 | | | | 2-15-2039 | | | | 1,570,000 | | | | 1,718,051 | |
North Fond Du Lac WI CDA (Miscellaneous Revenue) | | | 1.30 | | | | 12-1-2017 | | | | 50,000 | | | | 49,883 | |
North Fond Du Lac WI CDA (Miscellaneous Revenue) | | | 1.70 | | | | 12-1-2018 | | | | 50,000 | | | | 49,789 | |
Oostburg WI CDA Series A (Miscellaneous Revenue) | | | 1.75 | | | | 5-1-2018 | | | | 50,000 | | | | 50,057 | |
Pittsville WI CDA Series A (Miscellaneous Revenue) | | | 1.65 | | | | 6-1-2017 | | | | 100,000 | | | | 100,007 | |
Platteville WI RDA University of Wisconsin Platteville Real Estate (Education Revenue) | | | 5.00 | | | | 7-1-2022 | | | | 1,000,000 | | | | 1,060,610 | |
Prairie du Chien WI RDA Series B (Miscellaneous Revenue) | | | 1.65 | | | | 9-1-2020 | | | | 200,000 | | | | 199,392 | |
Southeast Wisconsin Professional Baseball Park District (Miscellaneous Revenue, National Insured) ¤ | | | 0.00 | | | | 12-15-2017 | | | | 500,000 | | | | 494,405 | |
The accompanying notes are an integral part of these financial statements.
| | | | |
| 10 | | Wells Fargo Wisconsin Tax-Free Fund | | Portfolio of investments—December 31, 2016 (unaudited) |
| | | | | | | | | | | | | | | | |
| Security name | | Interest rate | | | Maturity date | | | Principal | | | Value | |
| | | | | | | | | | | | | | | | |
|
| Wisconsin (continued) | |
Southeast Wisconsin Professional Baseball Park District Series A (Tax Revenue, National Insured) | | | 5.50 | % | | | 12-15-2017 | | | $ | 1,765,000 | | | $ | 1,835,847 | |
Southeast Wisconsin Professional Baseball Park District Series A (Tax Revenue, National Insured) | | | 5.50 | | | | 12-15-2018 | | | | 380,000 | | | | 410,807 | |
Southeast Wisconsin Professional Baseball Park District Series A (Tax Revenue, National Insured) | | | 5.50 | | | | 12-15-2019 | | | | 100,000 | | | | 111,240 | |
Southeast Wisconsin Professional Baseball Park District Series A (Tax Revenue, National Insured) | | | 5.50 | | | | 12-15-2021 | | | | 2,000,000 | | | | 2,333,500 | |
Southeast Wisconsin Professional Baseball Park District Series A (Tax Revenue, National Insured) | | | 5.50 | | | | 12-15-2023 | | | | 1,600,000 | | | | 1,899,776 | |
Southeast Wisconsin Professional Baseball Park District Series A (Tax Revenue, National Insured) | | | 5.50 | | | | 12-15-2026 | | | | 2,435,000 | | | | 2,884,331 | |
Sun Prairie WI CDA Tax Incremental #6 & 7 (Miscellaneous Revenue) | | | 3.80 | | | | 2-1-2018 | | | | 300,000 | | | | 300,765 | |
Sun Prairie WI CDA Tax Incremental #6 & 7 (Miscellaneous Revenue) | | | 4.00 | | | | 2-1-2019 | | | | 220,000 | | | | 220,598 | |
Sun Prairie WI CDA Tax Incremental #6 & 7 (Miscellaneous Revenue) | | | 4.50 | | | | 2-1-2022 | | | | 250,000 | | | | 250,790 | |
Warrens WI CDA Economic Improvements (Miscellaneous Revenue) | | | 5.10 | | | | 11-1-2020 | | | | 70,000 | | | | 54,233 | |
Warrens WI CDA Interim Workout Extension (Tax Revenue) | | | 3.70 | | | | 11-1-2029 | | | | 181,751 | | | | 94,456 | |
Waukesha WI Housing Authority Preservation Corporation Project (Housing Revenue, Johnson Bank LOC) ø | | | 1.80 | | | | 12-1-2042 | | | | 1,500,000 | | | | 1,500,000 | |
Waukesha WI RDA Welldall Manufacturing Incorporated Project (Industrial Development Revenue, U.S. Bank NA LOC) | | | 2.65 | | | | 12-1-2017 | | | | 335,000 | | | | 339,355 | |
Waukesha WI RDA Welldall Manufacturing Incorporated Project (Industrial Development Revenue, U.S. Bank NA LOC) | | | 4.00 | | | | 12-1-2023 | | | | 150,000 | | | | 155,889 | |
Waukesha WI RDA Welldall Manufacturing Incorporated Project (Industrial Development Revenue, U.S. Bank NA LOC) | | | 4.20 | | | | 12-1-2024 | | | | 150,000 | | | | 156,617 | |
Waukesha WI RDA Welldall Manufacturing Incorporated Project (Industrial Development Revenue, U.S. Bank NA LOC) | | | 4.25 | | | | 12-1-2025 | | | | 250,000 | | | | 260,983 | |
Weston WI CDA Series A (Miscellaneous Revenue) | | | 5.25 | | | | 10-1-2020 | | | | 720,000 | | | | 721,692 | |
Wisconsin Center District CAB (Tax Revenue, National Insured) ¤ | | | 0.00 | | | | 12-15-2019 | | | | 275,000 | | | | 257,609 | |
Wisconsin Center District CAB (Tax Revenue, AGM Insured) ¤ | | | 0.00 | | | | 12-15-2030 | | | | 295,000 | | | | 189,918 | |
Wisconsin Center District Junior Dedicated Bond (Tax Revenue, AGM Insured) | | | 5.25 | | | | 12-15-2018 | | | | 65,000 | | | | 69,647 | |
Wisconsin Center District Junior Dedicated Bond (Tax Revenue, AGM Insured) | | | 5.25 | | | | 12-15-2019 | | | | 2,000,000 | | | | 2,198,540 | |
Wisconsin Center District Junior Dedicated Bond (Tax Revenue, AGM Insured) | | | 5.25 | | | | 12-15-2023 | | | | 2,150,000 | | | | 2,472,457 | |
Wisconsin Center District Junior Dedicated Bond (Tax Revenue, AGM Insured) | | | 5.25 | | | | 12-15-2027 | | | | 1,005,000 | | | | 1,157,690 | |
Wisconsin Center District Junior Dedicated Bond Series A (Tax Revenue) | | | 5.00 | | | | 12-15-2022 | | | | 730,000 | | | | 813,030 | |
Wisconsin Center District Junior Dedicated Bond Series A (Tax Revenue) | | | 5.00 | | | | 12-15-2030 | | | | 2,100,000 | | | | 2,288,097 | |
Wisconsin Center District Milwaukee Arena Project (Tax Revenue) | | | 4.00 | | | | 12-15-2032 | | | | 1,100,000 | | | | 1,152,085 | |
Wisconsin Center District Milwaukee Arena Project (Tax Revenue) | | | 4.00 | | | | 12-15-2033 | | | | 920,000 | | | | 958,263 | |
Wisconsin Center District Milwaukee Arena Project (Tax Revenue) | | | 4.00 | | | | 12-15-2034 | | | | 2,000,000 | | | | 2,071,740 | |
Wisconsin Dells CDA (Miscellaneous Revenue) | | | 4.60 | | | | 3-1-2025 | | | | 175,000 | | | | 175,250 | |
Wisconsin HEFA Bellin Memorial Hospital Obligated Group (Health Revenue) | | | 3.00 | | | | 12-1-2019 | | | | 1,475,000 | | | | 1,522,466 | |
Wisconsin HEFA Bellin Memorial Hospital Obligated Group (Health Revenue) | | | 4.00 | | | | 12-1-2035 | | | | 1,000,000 | | | | 1,021,890 | |
Wisconsin HEFA Bellin Memorial Hospital Obligated Group (Health Revenue) | | | 5.00 | | | | 12-1-2025 | | | | 1,500,000 | | | | 1,726,890 | |
Wisconsin HEFA Bellin Memorial Hospital Obligated Group (Health Revenue) | | | 5.00 | | | | 12-1-2026 | | | | 1,740,000 | | | | 1,991,882 | |
Wisconsin HEFA Bellin Memorial Hospital Obligated Group (Health Revenue, Ambac Insured) | | | 5.50 | | | | 2-15-2019 | | | | 25,000 | | | | 25,684 | |
Wisconsin HEFA Monroe Clinic Incorporated (Health Revenue) | | | 4.00 | | | | 2-15-2031 | | | | 900,000 | | | | 933,903 | |
Wisconsin HEFA Monroe Clinic Incorporated (Health Revenue) | | | 4.00 | | | | 2-15-2033 | | | | 550,000 | | | | 564,938 | |
Wisconsin HEFA Rogers Memorial Hospital Incorporated Series B (Health Revenue) | | | 5.00 | | | | 7-1-2044 | | | | 3,250,000 | | | | 3,415,848 | |
Wisconsin Housing & EDA (Housing Revenue, FHA Insured) | | | 6.10 | | | | 6-1-2021 | | | | 60,000 | | | | 62,777 | |
Wisconsin Housing & EDA AMT Series A (Housing Revenue) | | | 4.63 | | | | 11-1-2037 | | | | 25,000 | | | | 25,007 | |
The accompanying notes are an integral part of these financial statements.
| | | | | | |
| Portfolio of investments—December 31, 2016 (unaudited) | | Wells Fargo Wisconsin Tax-Free Fund | | | 11 | |
| | | | | | | | | | | | | | | | |
| Security name | | Interest rate | | | Maturity date | | | Principal | | | Value | |
| | | | | | | | | | | | | | | | |
| | | | |
| Wisconsin (continued) | | | | | | | | | | | | | | | | |
Wisconsin Housing & EDA AMT Series A (Housing Revenue) | | | 4.75 | % | | | 5-1-2037 | | | $ | 260,000 | | | $ | 260,101 | |
Wisconsin Housing & EDA MFHR Series A (Industrial Development Revenue) ± | | | 4.25 | | | | 12-1-2035 | | | | 1,960,000 | | | | 1,962,979 | |
Wisconsin Housing & EDA President House Project (Housing Revenue, Associated Trust Company NA LOC) ø | | | 0.86 | | | | 8-1-2046 | | | | 1,680,000 | | | | 1,680,000 | |
Wisconsin Housing & EDA Series A (Housing Revenue) | | | 0.80 | | | | 6-1-2017 | | | | 50,000 | | | | 49,959 | |
Wisconsin Housing & EDA Series A (Housing Revenue) | | | 0.90 | | | | 12-1-2017 | | | | 50,000 | | | | 49,907 | |
Wisconsin Housing & EDA Series A (Housing Revenue) | | | 1.15 | | | | 6-1-2018 | | | | 55,000 | | | | 54,922 | |
Wisconsin Housing & EDA Series A (Housing Revenue) | | | 1.25 | | | | 12-1-2018 | | | | 55,000 | | | | 54,883 | |
Wisconsin Housing & EDA Series A (Housing Revenue) | | | 1.55 | | | | 12-1-2019 | | | | 55,000 | | | | 54,825 | |
Wisconsin Housing & EDA Series A (Housing Revenue) | | | 1.95 | | | | 12-1-2020 | | | | 55,000 | | | | 54,886 | |
Wisconsin Housing & EDA Series A (Housing Revenue) | | | 3.00 | | | | 5-1-2022 | | | | 100,000 | | | | 102,390 | |
Wisconsin Housing & EDA Series A (Housing Revenue) | | | 3.00 | | | | 11-1-2022 | | | | 125,000 | | | | 128,154 | |
Wisconsin Housing & EDA Series A (Housing Revenue) | | | 4.05 | | | | 12-1-2049 | | | | 800,000 | | | | 807,680 | |
Wisconsin Housing & EDA Series A (Housing Revenue) | | | 5.75 | | | | 11-1-2043 | | | | 2,835,000 | | | | 2,957,727 | |
Wisconsin Housing & EDA Series C (Housing Revenue) | | | 3.88 | | | | 11-1-2035 | | | | 1,000,000 | | | | 999,300 | |
Wisconsin Oneida Tribe of Indians (Tax Revenue) 144A | | | 5.50 | | | | 2-1-2021 | | | | 515,000 | | | | 556,210 | |
| | | | |
| | | | | | | | | | | | | | | 94,973,953 | |
| | | | | | | | | | | | | | | | |
| | | | |
Total Municipal Obligations (Cost $155,584,699) | | | | | | | | | | | | | | | 156,604,009 | |
| | | | | | | | | | | | | | | | |
| | | | | | | | |
| Total investments in securities (Cost $155,584,699) * | | | 99.26 | % | | | 156,604,009 | |
Other assets and liabilities, net | | | 0.74 | | | | 1,175,290 | |
| | | | | | | | |
| Total net assets | | | 100.00 | % | | $ | 157,779,299 | |
| | | | | | | | |
| ¤ | The security is issued in zero coupon form with no periodic interest payments. |
| ± | Variable rate investment. The rate shown is the rate in effect at period end. |
| (s) | The security is currently in default with regards to scheduled interest and/or principal payments. The Fund has stopped accruing interest on the security. |
| 144A | The security may be resold in transactions exempt from registration, normally to qualified institutional buyers, pursuant to Rule 144A under the Securities Act of 1933. |
| ø | Variable rate demand notes are subject to a demand feature which reduces the effective maturity. The maturity date shown represents the final maturity date of the security. The interest rate is determined and reset by the issuer daily, weekly, or monthly depending upon the terms of the security. The rate shown is the rate in effect at period end. |
| * | Cost for federal income tax purposes is $155,582,235 and unrealized gains (losses) consists of: |
| | | | |
Gross unrealized gains | | $ | 3,164,633 | |
Gross unrealized losses | | | (2,142,859 | ) |
| | | | |
Net unrealized gains | | $ | 1,021,774 | |
The accompanying notes are an integral part of these financial statements.
| | | | |
| 12 | | Wells Fargo Wisconsin Tax-Free Fund | | Statement of assets and liabilities—December 31, 2016 (unaudited) |
| | | | |
| | | | |
| |
Assets | | | | |
Investments in unaffiliated securities, at value (cost $155,584,699) | | $ | 156,604,009 | |
Cash | | | 261,760 | |
Receivable for investments sold | | | 10,000 | |
Receivable for Fund shares sold | | | 251,442 | |
Receivable for interest | | | 1,654,229 | |
Prepaid expenses and other assets | | | 39,962 | |
| | | | |
Total assets | | | 158,821,402 | |
| | | | |
| |
Liabilities | | | | |
Distributions payable | | | 48,948 | |
Payable for Fund shares redeemed | | | 824,737 | |
Management fee payable | | | 17,019 | |
Distribution fee payable | | | 6,975 | |
Administration fees payable | | | 22,976 | |
Accrued expenses and other liabilities | | | 121,448 | |
| | | | |
Total liabilities | | | 1,042,103 | |
| | | | |
Total net assets | | $ | 157,779,299 | |
| | | | |
| |
NET ASSETS CONSIST OF | | | | |
Paid-in capital | | $ | 156,767,054 | |
Overdistributed net investment income | | | (10,498 | ) |
Accumulated net realized gains on investments | | | 3,433 | |
Net unrealized gains on investments | | | 1,019,310 | |
| | | | |
Total net assets | | $ | 157,779,299 | |
| | | | |
| |
COMPUTATION OF NET ASSET VALUE AND OFFERING PRICE PER SHARE | | | | |
Net assets – Class A | | $ | 146,846,018 | |
Shares outstanding – Class A1 | | | 13,725,699 | |
Net asset value per share – Class A | | | $10.70 | |
Maximum offering price per share – Class A2 | | | $11.20 | |
Net assets – Class C | | $ | 10,223,134 | |
Shares outstanding – Class C1 | | | 955,600 | |
Net asset value per share – Class C | | | $10.70 | |
Net assets – Institutional Class | | $ | 710,147 | |
Shares outstanding – Institutional Class1 | | | 66,386 | |
Net asset value per share – Institutional Class | | | $10.70 | |
| 1 | The Fund has an unlimited number of authorized shares. |
| 2 | Maximum offering price is computed as 100/95.50 of net asset value. On investments of $50,000 or more, the offering price is reduced. |
The accompanying notes are an integral part of these financial statements.
| | | | | | |
| Statement of operations—six months ended December 31, 2016 (unaudited) | | Wells Fargo Wisconsin Tax-Free Fund | | | 13 | |
| | | | |
| | | | |
| |
Investment income | | | | |
Interest | | $ | 2,508,290 | |
| | | | |
| |
Expenses | | | | |
Management fee | | | 341,153 | |
Administration fees | | | | |
Class A | | | 127,511 | |
Class C | | | 8,775 | |
Institutional Class | | | 88 | 1 |
Shareholder servicing fees | | | | |
Class A | | | 199,236 | |
Class C | | | 13,711 | |
Distribution fee | | | | |
Class C | | | 41,132 | |
Custody and accounting fees | | | 4,865 | |
Professional fees | | | 28,313 | |
Registration fees | | | 33,746 | |
Shareholder report expenses | | | 52,504 | |
Trustees’ fees and expenses | | | 17,968 | |
Other fees and expenses | | | 2,932 | |
| | | | |
Total expenses | | | 871,934 | |
Less: Fee waivers and/or expense reimbursements | | | (233,981 | ) |
| | | | |
Net expenses | | | 637,953 | |
| | | | |
Net investment income | | | 1,870,337 | |
| | | | |
| |
REALIZED AND UNREALIZED GAINS (LOSSES) ON INVESTMENTS | | | | |
| |
Net realized gains on investments | | | 1,201 | |
| |
Net change in unrealized gains (losses) on investments | | | (6,908,551) | |
| | | | |
Net realized and unrealized gains (losses) on investments | | | (6,907,350 | ) |
| | | | |
Net decrease in net assets resulting from operations | | $ | (5,037,013 | ) |
| | | | |
| 1 | For the period from October 31, 2016 (commencement of class operations) to December 31, 2016 |
The accompanying notes are an integral part of these financial statements.
| | | | |
| 14 | | Wells Fargo Wisconsin Tax-Free Fund | | Statement of changes in net assets |
| | | | | | | | | | | | | | | | |
| | | Six months ended
December 31, 2016
(unaudited) | | | Year ended
June 30, 2016 | |
| | | | |
Operations | | | | | | | | | | | | | | | | |
Net investment income | | | | | | $ | 1,870,337 | | | | | | | $ | 3,620,411 | |
Net realized gains on investments | | | | | | | 1,201 | | | | | | | | 196,798 | |
Net change in unrealized gains (losses) on investments | | | | | | | (6,908,551 | ) | | | | | | | 4,774,120 | |
| | | | |
Net increase (decrease) in net assets resulting from operations | | | | | | | (5,037,013 | ) | | | | | | | 8,591,329 | |
| | | | |
| | | | |
Distributions to shareholders from | | | | | | | | | | | | | | | | |
Net investment income | | | | | | | | | | | | | | | | |
Class A | | | | | | | (1,785,630 | ) | | | | | | | (2,546,869 | ) |
Class C | | | | | | | (81,866 | ) | | | | | | | (164,380 | ) |
Institutional Class | | | | | | | (2,840 | )1 | | | | | | | N/A | |
Investor Class | | | | | | | N/A | | | | | | | | (909,162 | )2 |
Net realized gains | | | | | | | | | | | | | | | | |
Class A | | | | | | | (142,178 | ) | | | | | | | (46,148 | ) |
Class C | | | | | | | (9,882 | ) | | | | | | | (3,206 | ) |
Institutional Class | | | | | | | (994 | )1 | | | | | | | N/A | |
| | | | |
Total distributions to shareholders | | | | | | | (2,023,390 | ) | | | | | | | (3,669,765 | ) |
| | | | |
| | | | |
Capital share transactions | | | Shares | | | | | | | | Shares | | | | | |
Proceeds from shares sold | | | | | | | | | | | | | | | | |
Class A | | | 989,960 | | | | 10,818,118 | | | | 14,703,085 | | | | 160,926,790 | |
Class C | | | 61,258 | | | | 674,845 | | | | 130,742 | | | | 1,437,094 | |
Institutional Class | | | 97,954 | 1 | | | 1,054,329 | 1 | | | N/A | | | | N/A | |
Investor Class | | | N/A | | | | N/A | | | | 505,794 | 2 | | | 5,498,632 | 2 |
| | | | |
| | | | | | | 12,547,292 | | | | | | | | 167,862,516 | |
| | | | |
Reinvestment of distributions | | | | | | | | | | | | | | | | |
Class A | | | 157,758 | | | | 1,723,387 | | | | 211,387 | | | | 2,330,732 | |
Class C | | | 8,218 | | | | 89,654 | | | | 15,074 | | | | 165,617 | |
Institutional Class | | | 349 | 1 | | | 3,730 | 1 | | | N/A | | | | N/A | |
Investor Class | | | N/A | | | | N/A | | | | 59,864 | 2 | | | 650,999 | 2 |
| | | | |
| | | | | | | 1,816,771 | | | | | | | | 3,147,348 | |
| | | | |
Payment for shares redeemed | | | | | | | | | | | | | | | | |
Class A | | | (1,798,421 | ) | | | (19,576,496 | ) | | | (2,737,029 | ) | | | (30,185,352 | ) |
Class C | | | (94,747 | ) | | | (1,036,085 | ) | | | (173,105 | ) | | | (1,899,783 | ) |
Institutional Class | | | (31,917 | )1 | | | (340,403 | )1 | | | N/A | | | | N/A | |
Investor Class | | | N/A | | | | N/A | | | | (12,142,203 | )2 | | | (132,592,719 | )2 |
| | | | |
| | | | | | | (20,952,984 | ) | | | | | | | (164,677,854 | ) |
| | | | |
Net increase (decrease) in net assets resulting from capital share transactions | | | | | | | (6,588,921 | ) | | | | | | | 6,332,010 | |
| | | | |
Total increase (decrease) in net assets | | | | | | | (13,649,324 | ) | | | | | | | 11,253,574 | |
| | | | |
| | | | |
Net assets | | | | | | | | | | | | | | | | |
Beginning of period | | | | | | | 171,428,623 | | | | | | | | 160,175,049 | |
| | | | |
End of period | | | | | | $ | 157,779,299 | | | | | | | $ | 171,428,623 | |
| | | | |
Overdistributed net investment income | | | | | | $ | (10,498 | ) | | | | | | $ | (10,499 | ) |
| | | | |
| 1 | For the period from October 31, 2016 (commencement of class operations) to December 31, 2016 |
| 2 | For the period from July 1, 2015 to October 23, 2015. Effective at the close of business on October 23, 2015, Investor Class shares were converted to Class A shares and are no longer offered by the Fund. |
The accompanying notes are an integral part of these financial statements.
| | | | | | |
| Financial highlights | | Wells Fargo Wisconsin Tax-Free Fund | | | 15 | |
(For a share outstanding throughout each period)
| | | | | | | | | | | | | | | | | | | | | | | | |
| | | Six months ended
December 31, 2016 (unaudited) | | | Year ended June 30 | |
| CLASS A | | | 2016 | | | 2015 | | | 2014 | | | 2013 | | | 2012 | |
Net asset value, beginning of period | | | $11.16 | | | | $10.83 | | | | $10.96 | | | | $10.86 | | | | $11.09 | | | | $10.68 | |
Net investment income | | | 0.13 | | | | 0.25 | | | | 0.24 | | | | 0.33 | | | | 0.27 | | | | 0.34 | |
Net realized and unrealized gains (losses) on investments | | | (0.45 | ) | | | 0.33 | | | | (0.02 | ) | | | 0.18 | | | | (0.22 | ) | | | 0.42 | |
| | | | | | | | | | | | | | | | | | | | | | | | |
Total from investment operations | | | (0.32 | ) | | | 0.58 | | | | 0.22 | | | | 0.51 | | | | 0.05 | | | | 0.76 | |
Distributions to shareholders from | | | | | | | | | | | | | | | | | | | | |
Net investment income | | | (0.13 | ) | | | (0.25 | ) | | | (0.24 | ) | | | (0.33 | ) | | | (0.27 | ) | | | (0.34 | ) |
Net realized gains | | | (0.01 | ) | | | (0.00 | )1 | | | (0.11 | ) | | | (0.08 | ) | | | (0.01 | ) | | | (0.01 | ) |
| | | | | | | | | | | | | | | | | | | | | | | | |
Total distributions to shareholders | | | (0.14 | ) | | | (0.25 | ) | | | (0.35 | ) | | | (0.41 | ) | | | (0.28 | ) | | | (0.35 | ) |
Net asset value, end of period | | | $10.70 | | | | $11.16 | | | | $10.83 | | | | $10.96 | | | | $10.86 | | | | $11.09 | |
Total return2 | | | (2.94 | )% | | | 5.44 | % | | | 2.07 | % | | | 4.80 | % | | | 0.46 | % | | | 7.19 | % |
Ratios to average net assets (annualized) | | | | | | | | | | | | | | | | | | | | |
Gross expenses | | | 0.97 | % | | | 0.94 | % | | | 0.90 | % | | | 0.92 | % | | | 0.90 | % | | | 0.92 | % |
Net expenses | | | 0.70 | % | | | 0.70 | % | | | 0.70 | % | | | 0.70 | % | | | 0.70 | % | | | 0.70 | % |
Net investment income | | | 2.24 | % | | | 2.26 | % | | | 2.22 | % | | | 3.02 | % | | | 2.44 | % | | | 3.06 | % |
Supplemental data | | | | | | | | | | | | | | | | | | | | |
Portfolio turnover rate | | | 10 | % | | | 16 | % | | | 28 | % | | | 25 | % | | | 31 | % | | | 14 | % |
Net assets, end of period (000s omitted) | | | $146,846 | | | | $160,480 | | | | $23,824 | | | | $19,825 | | | | $25,641 | | | | $20,844 | |
| 1 | Amount is less than $0.005 per share. |
| 2 | Total return calculations do not include any sales charges. Returns for periods of less than one year are not annualized. |
The accompanying notes are an integral part of these financial statements.
| | | | |
| 16 | | Wells Fargo Wisconsin Tax-Free Fund | | Financial highlights |
(For a share outstanding throughout each period)
| | | | | | | | | | | | | | | | | | | | | | | | |
| | | Six months ended
December 31, 2016 (unaudited) | | | Year ended June 30 | |
| CLASS C | | | 2016 | | | 2015 | | | 2014 | | | 2013 | | | 2012 | |
Net asset value, beginning of period | | | $11.16 | | | | $10.83 | | | | $10.96 | | | | $10.86 | | | | $11.09 | | | | $10.68 | |
Net investment income | | | 0.08 | | | | 0.17 | | | | 0.16 | | | | 0.25 | | | | 0.19 | | | | 0.26 | |
Net realized and unrealized gains (losses) on investments | | | (0.45 | ) | | | 0.33 | | | | (0.02 | ) | | | 0.18 | | | | (0.22 | ) | | | 0.42 | |
| | | | | | | | | | | | | | | | | | | | | | | | |
Total from investment operations | | | (0.37 | ) | | | 0.50 | | | | 0.14 | | | | 0.43 | | | | (0.03 | ) | | | 0.68 | |
Distributions to shareholders from | | | | | | | | | | | | | | | | | | | | |
Net investment income | | | (0.08 | ) | | | (0.17 | ) | | | (0.16 | ) | | | (0.25 | ) | | | (0.19 | ) | | | (0.26 | ) |
Net realized gains | | | (0.01 | ) | | | (0.00 | )1 | | | (0.11 | ) | | | (0.08 | ) | | | (0.01 | ) | | | (0.01 | ) |
| | | | | | | | | | | | | | | | | | | | | | | | |
Total distributions to shareholders | | | (0.09 | ) | | | (0.17 | ) | | | (0.27 | ) | | | (0.33 | ) | | | (0.20 | ) | | | (0.27 | ) |
Net asset value, end of period | | | $10.70 | | | | $11.16 | | | | $10.83 | | | | $10.96 | | | | $10.86 | | | | $11.09 | |
Total return2 | | | (3.30 | )% | | | 4.66 | % | | | 1.31 | % | | | 4.02 | % | | | (0.29 | )% | | | 6.40 | % |
Ratios to average net assets (annualized) | | | | | | | | | | | | | | | | | | | | |
Gross expenses | | | 1.72 | % | | | 1.68 | % | | | 1.65 | % | | | 1.67 | % | | | 1.65 | % | | | 1.67 | % |
Net expenses | | | 1.45 | % | | | 1.45 | % | | | 1.45 | % | | | 1.45 | % | | | 1.45 | % | | | 1.45 | % |
Net investment income | | | 1.49 | % | | | 1.52 | % | | | 1.47 | % | | | 2.28 | % | | | 1.69 | % | | | 2.32 | % |
Supplemental data | | | | | | | | | | | | | | | | | | | | |
Portfolio turnover rate | | | 10 | % | | | 16 | % | | | 28 | % | | | 25 | % | | | 31 | % | | | 14 | % |
Net assets, end of period (000s omitted) | | | $10,223 | | | | $10,949 | | | | $10,923 | | | | $10,431 | | | | $12,094 | | | | $11,393 | |
| 1 | Amount is less than $0.005 per share. |
| 2 | Total return calculations do not include any sales charges. Returns for periods of less than one year are not annualized. |
The accompanying notes are an integral part of these financial statements.
| | | | | | |
| Financial highlights | | Wells Fargo Wisconsin Tax-Free Fund | | | 17 | |
(For a share outstanding throughout each period)
| | | | |
| | | Period ended December 31, 2016 (unaudited)1 | |
| INSTITUTIONAL CLASS | |
Net asset value, beginning of period | | | $10.99 | |
Net investment income | | | 0.05 | |
Net realized and unrealized gains (losses) on investments | | | (0.28 | ) |
| | | | |
Total from investment operations | | | (0.23 | ) |
Distributions to shareholders from | | | | |
Net investment income | | | (0.05 | ) |
Net realized gains | | | (0.01 | ) |
| | | | |
Total distributions to shareholders | | | (0.06 | ) |
Net asset value, end of period | | | $10.70 | |
Total return2 | | | (2.12 | )% |
Ratios to average net assets (annualized) | | | | |
Gross expenses | | | 0.65 | % |
Net expenses | | | 0.52 | % |
Net investment income | | | 2.59 | % |
Supplemental data | | | | |
Portfolio turnover rate | | | 10 | % |
Net assets, end of period (000s omitted) | | | $710 | |
| 1 | For the period from October 31, 2016 (commencement of class operations) to December 31, 2016 |
| 2 | Returns for periods of less than one year are not annualized. |
The accompanying notes are an integral part of these financial statements.
| | | | |
| 18 | | Wells Fargo Wisconsin Tax-Free Fund | | Notes to financial statements (unaudited) |
1. ORGANIZATION
Wells Fargo Funds Trust (the “Trust”), a Delaware statutory trust organized on March 10, 1999, is an open-end management investment company registered under the Investment Company Act of 1940, as amended (the “1940 Act”). As an investment company, the Trust follows the accounting and reporting guidance in Financial Accounting Standards Board (“FASB”) Accounting Standards Codification Topic 946, Financial Services – Investment Companies. These financial statements report on the Wells Fargo Wisconsin Tax-Free Fund (the “Fund”) which is a non-diversified series of the Trust.
Effective at the close of business on October 23, 2015, Investor Class shares became Class A shares in a tax-free conversion. Shareholders of Investor Class received Class A shares at a value equal to the value of their Investor Class shares immediately prior to the conversion. Investor Class shares are no longer offered by the Fund.
2. SIGNIFICANT ACCOUNTING POLICIES
The following significant accounting policies, which are consistently followed in the preparation of the financial statements of the Fund, are in conformity with U.S. generally accepted accounting principles which require management to make estimates and assumptions that affect the reported amounts of assets and liabilities, disclosure of contingent assets and liabilities at the date of the financial statements, and the reported amounts of revenues and expenses during the reporting period. Actual results could differ from those estimates.
Securities valuation
All investments are valued each business day as of the close of regular trading on the New York Stock Exchange (generally 4 p.m. Eastern Time), although the Fund may deviate from this calculation time under unusual or unexpected circumstances.
Debt securities are valued at the evaluated bid price provided by an independent pricing service or, if a reliable price is not available, the quoted bid price from an independent broker-dealer.
Investments which are not valued using any of the methods discussed above are valued at their fair value, as determined in good faith by the Board of Trustees of the Fund. The Board of Trustees has established a Valuation Committee comprised of the Trustees and has delegated to it the authority to take any actions regarding the valuation of portfolio securities that the Valuation Committee deems necessary or appropriate, including determining the fair value of portfolio securities, unless the determination has been delegated to the Management Valuation Team of Wells Fargo Funds Management, LLC (“Funds Management”). The Board of Trustees retains the authority to make or ratify any valuation decisions or approve any changes to the Valuation Procedures as it deems appropriate. On a quarterly basis, the Board of Trustees receives reports on any valuation actions taken by the Valuation Committee or the Management Valuation Team which may include items for ratification.
Valuations of fair valued securities are compared to the next actual sales price when available, or other appropriate market values, to assess the continued appropriateness of the fair valuation methodologies used. These securities are fair valued on a day-to-day basis, taking into consideration changes to appropriate market information and any significant changes to the inputs considered in the valuation process until there is a readily available price provided on an exchange or by an independent pricing service. Valuations received from an independent pricing service or independent broker-dealer quotes are periodically validated by comparisons to most recent trades and valuations provided by other independent pricing services in addition to the review of prices by the manager and/or subadviser. Unobservable inputs used in determining fair valuations are identified based on the type of security, taking into consideration factors utilized by market participants in valuing the investment, knowledge about the issuer and the current market environment.
When-issued transactions
The Fund may purchase securities on a forward commitment or when-issued basis. The Fund records a when-issued transaction on the trade date and will segregate assets in an amount at least equal in value to the Fund’s commitment to purchase when-issued securities. Securities purchased on a when-issued basis are marked-to-market daily and the Fund begins earning interest on the settlement date. Losses may arise due to changes in the market value of the underlying securities or if the counterparty does not perform under the contract.
Security transactions and income recognition
Securities transactions are recorded on a trade date basis. Realized gains or losses are recorded on the basis of identified cost.
Interest income is accrued daily and bond discounts are accreted and premiums are amortized daily based on the effective interest method. To the extent debt obligations are placed on non-accrual status, any related interest income
| | | | | | |
| Notes to financial statements (unaudited) | | Wells Fargo Wisconsin Tax-Free Fund | | | 19 | |
may be reduced by writing off interest receivables when the collection of all or a portion of interest has become doubtful based on consistently applied procedures. If the issuer subsequently resumes interest payments or when the collectability of interest is reasonably assured, the debt obligation is removed from non-accrual status.
Distributions to shareholders
Distributions to shareholders from net investment income are accrued daily and paid monthly. Distributions from net realized gains, if any, are recorded on the ex-dividend date. Such distributions are determined in conformity with federal income tax regulations, which may differ in amount or character from net investment income and realized gains recognized for purposes of U.S. generally accepted accounting principles.
Federal and other taxes
The Fund intends to continue to qualify as a regulated investment company by distributing substantially all of its investment company taxable and tax-exempt income and any net realized capital gains (after reduction for capital loss carryforwards) sufficient to relieve it from all, or substantially all, federal income taxes. Accordingly, no provision for federal income taxes was required.
The Fund’s income and federal excise tax returns and all financial records supporting those returns for the prior three fiscal years are subject to examination by the federal and Delaware revenue authorities. Management has analyzed the Fund’s tax positions taken on federal, state, and foreign tax returns for all open tax years and does not believe that there are any uncertain tax positions that require recognition of a tax liability.
Class allocations
The separate classes of shares offered by the Fund differ principally in applicable sales charges, distribution, shareholder servicing, and administration fees. Class specific expenses are charged directly to that share class. Investment income, common expenses, and realized and unrealized gains (losses) on investments are allocated daily to each class of shares based on the relative proportion of net assets of each class.
3. FAIR VALUATION MEASUREMENTS
Fair value measurements of investments are determined within a framework that has established a fair value hierarchy based upon the various data inputs utilized in determining the value of the Fund’s investments. The three-level hierarchy gives the highest priority to unadjusted quoted prices in active markets for identical assets or liabilities (Level 1) and the lowest priority to significant unobservable inputs (Level 3). The Fund’s investments are classified within the fair value hierarchy based on the lowest level of input that is significant to the fair value measurement. The inputs are summarized into three broad levels as follows:
| ∎ | | Level 1 – quoted prices in active markets for identical securities |
| ∎ | | Level 2 – other significant observable inputs (including quoted prices for similar securities, interest rates, prepayment speeds, credit risk, use of amortized cost, etc.) |
| ∎ | | Level 3 – significant unobservable inputs (including the Fund’s own assumptions in determining the fair value of investments) |
The inputs or methodologies used for valuing investments in securities are not necessarily an indication of the risk associated with investing in those securities.
The following is a summary of the inputs used in valuing the Fund’s assets and liabilities as of December 31, 2016:
| | | | | | | | | | | | | | | | |
| | | Quoted prices
(Level 1) | | | Other significant
observable inputs
(Level 2) | | | Significant
unobservable inputs (Level 3) | | | Total | |
Assets | | | | | | | | | | | | | | | | |
Investments in : | | | | | | | | | | | | | | | | |
Municipal obligations | | $ | 0 | | | $ | 156,604,009 | | | $ | 0 | | | $ | 156,604,009 | |
The Fund recognizes transfers between levels within the fair value hierarchy at the end of the reporting period. At December 31, 2016, the Fund did not have any transfers into/out of Level 1, Level 2, or Level 3.
| | | | |
| 20 | | Wells Fargo Wisconsin Tax-Free Fund | | Notes to financial statements (unaudited) |
4. TRANSACTIONS WITH AFFILIATES AND OTHER EXPENSES
Management fee
Funds Management, an indirect wholly owned subsidiary of Wells Fargo & Company (“Wells Fargo”), is the manager of the Fund and provides advisory and fund-level administrative services under an investment management agreement. Under the investment management agreement, Funds Management is responsible for, among other services, implementing the investment objectives and strategies of the Fund, supervising the subadviser, providing fund-level administrative services in connection with the Fund’s operations, and providing any other fund-level administrative services reasonably necessary for the operation of the Fund. As compensation for its services under the investment management agreement, Funds Management is entitled to receive an annual management fee starting at 0.40% and declining to 0.28% as the average daily net assets of the Fund increase. For the six months ended December 31, 2016, the management fee was equivalent to an annual rate of 0.40% of the Fund’s average daily net assets.
Funds Management has retained the services of a subadviser to provide daily portfolio management to the Fund. The fee for subadvisory services is borne by Funds Management. Wells Capital Management Incorporated, an affiliate of Funds Management and an indirect wholly owned subsidiary of Wells Fargo, is the subadviser to the Fund and is entitled to receive a fee from Funds Management at an annual rate starting at 0.20% and declining to 0.10% as the average daily net assets of the Fund increase.
Administration fees
Under a class-level administration agreement, Funds Management provides class-level administrative services to the Fund, which includes paying fees and expenses for services provided by the transfer agent, sub-transfer agents, omnibus account servicers and record-keepers. As compensation for its services under the class-level administration agreement, Funds Management receives an annual fee which is calculated based on the average daily net assets of each class as follows:
| | | | |
| | | Class-level
administration fee | |
Class A, Class C | | | 0.16 | % |
Institutional Class | | | 0.08 | |
Funds Management has contractually waived and/or reimbursed management and administration fees to the extent necessary to maintain certain net operating expense ratios for the Fund. Waiver of fees and/or reimbursement of expenses by Funds Management were made first from fund level expenses on a proportionate basis and then from class specific expenses. Funds Management has committed through October 31, 2017 to waive fees and/or reimburse expenses to the extent necessary to cap the Fund’s expenses at 0.70% for Class A shares, 1.45% for Class C shares, and 0.52% for Institutional Class shares. After this time, the cap may be increased or the commitment to maintain the cap may be terminated only with the approval of the Board of Trustees.
During the six months ended December 31, 2016, State Street Bank and Trust Company, the Fund’s custodian, reimbursed the Fund $7 for certain out-of-pocket expenses that were billed to the Fund in error from 1998-2015. This amount is included in interest income on the Statement of Operations. In addition, Funds Management was also reimbursed $3,045 for waivers/reimbursements it made to the Fund during the period the Fund was erroneously billed.
Distribution fee
The Trust has adopted a distribution plan for Class C shares of the Fund pursuant to Rule 12b-1 under the 1940 Act. A distribution fee is charged to Class C shares and paid to Wells Fargo Funds Distributor, LLC (“Funds Distributor”), the principal underwriter, at an annual rate of 0.75% of the average daily net assets of Class C shares.
In addition, Funds Distributor is entitled to receive the front-end sales charge from the purchase of Class A shares and a contingent deferred sales charge on the redemption of certain Class A shares. Funds Distributor is also entitled to receive the contingent deferred sales charges from redemptions of Class C shares. For the six months ended December 31, 2016, Funds Distributor received $1,374 from the sale of Class A shares.
Shareholder servicing fees
The Trust has entered into contracts with one or more shareholder servicing agents, whereby Class A and Class C of the Fund are charged a fee at an annual rate of 0.25% of the average daily net assets of each respective class.
A portion of these total shareholder servicing fees were paid to affiliates of Wells Fargo.
| | | | | | |
| Notes to financial statements (unaudited) | | Wells Fargo Wisconsin Tax-Free Fund | | | 21 | |
5. INVESTMENT PORTFOLIO TRANSACTIONS
Purchases and sales of investments, excluding U.S. government obligations (if any) and short-term securities, for the six months ended December 31, 2016 were $20,236,551 and $15,110,000, respectively.
The Fund may purchase or sell investment securities to other Wells Fargo funds under procedures adopted by the Board of Trustees. The procedures have been designed to ensure that these interfund transactions, which generally do not incur broker commissions, are effected at current market prices. Interfund trades are included within the respective purchases and sales amounts shown.
6. BANK BORROWINGS
The Trust (excluding the money market funds and certain other funds) and Wells Fargo Variable Trust are parties to a $250,000,000 revolving credit agreement whereby the Fund is permitted to use bank borrowings for temporary or emergency purposes, such as to fund shareholder redemption requests. Interest under the credit agreement is charged to the Fund based on a borrowing rate equal to the higher of the Federal Funds rate in effect on that day plus 1.25% or the overnight LIBOR rate in effect on that day plus 1.25%. In addition, an annual commitment fee equal to 0.25% of the unused balance is allocated to each participating fund. Prior to August 30, 2016, the revolving credit agreement amount was $200,000,000 and the annual commitment fee was equal to 0.20% of the unused balance which was allocated to each participating fund.
For the six months ended December 31, 2016, there were no borrowings by the Fund under the agreement.
7. CONCENTRATION RISK
The Fund invests a substantial portion of its assets in issuers of municipal debt securities located in a single state or territories of the U.S. Therefore, it may be more affected by economic and political developments in that state or region than would be a comparable general tax-exempt fund.
8. INDEMNIFICATION
Under the Trust’s organizational documents, the officers and Trustees have been granted certain indemnification rights against certain liabilities that may arise out of performance of their duties to the Trust. Additionally, in the normal course of business, the Trust may enter into contracts with service providers that contain a variety of indemnification clauses. The Trust’s maximum exposure under these arrangements is dependent on future claims that may be made against the Fund and, therefore, cannot be estimated.
9. REGULATORY CHANGES
In October 2016, the Securities and Exchange Commission (“SEC”) adopted new rules and forms and amended existing rules and forms (together, “final rules”) intended to modernize and enhance the reporting and disclosure of information by registered investment companies and to enhance liquidity risk management by open-end mutual funds and exchange-traded funds. The final rules will enhance the quality of information available to investors and will allow the SEC to more effectively collect and use data reported by funds. In part, the final rules amend Regulation S-X and require standardized, enhanced disclosure about derivatives in the Fund’s financial statements, as well as other amendments. The compliance date for the amendments to Regulation S-X is August 1, 2017 while the compliance date for the new form types is June 1, 2018 and the compliance date for the liquidity risk management program requirements is December 1, 2018. Management is currently assessing the potential impact of these enhancements and their impact on the financial statement disclosures and reporting requirements.
| | | | |
| 22 | | Wells Fargo Wisconsin Tax-Free Fund | | Other information (unaudited) |
PROXY VOTING INFORMATION
A description of the policies and procedures that the Fund uses to determine how to vote proxies relating to portfolio securities is available, upon request, by calling 1-800-222-8222, visiting our website at wellsfargofunds.com, or visiting the SEC website at sec.gov. Information regarding how the Fund voted proxies relating to portfolio securities during the most recent 12-month period ended June 30 is available on the Fund’s website at wellsfargofunds.com or by visiting the SEC website at sec.gov.
PORTFOLIO HOLDINGS INFORMATION
The complete portfolio holdings for the Fund are publicly available monthly on the Fund’s website (wellsfargofunds.com), on a one-month delayed basis. In addition, top ten holdings information (excluding derivative positions) for the Fund is publicly available on the Fund’s website on a monthly, seven-day or more delayed basis. The Fund files its complete schedule of portfolio holdings with the SEC for the first and third quarters of each fiscal year on Form N-Q, which is available by visiting the SEC website at sec.gov. In addition, the Fund’s Form N-Q may be reviewed and copied at the SEC’s Public Reference Room in Washington, DC, and at regional offices in New York City, at 233 Broadway, and in Chicago, at 175 West Jackson Boulevard, Suite 900. Information about the Public Reference Room may be obtained by calling 1-800-SEC-0330.
| | | | | | |
| Other information (unaudited) | | Wells Fargo Wisconsin Tax-Free Fund | | | 23 | |
BOARD OF TRUSTEES AND OFFICERS
Each of the Trustees and Officers1 listed in the table below acts in identical capacities for each fund in the Wells Fargo family of funds, which consists of 139 mutual funds comprising the Wells Fargo Funds Trust, Wells Fargo Variable Trust, Wells Fargo Master Trust and four closed-end funds (collectively the “Fund Complex”). This table should be read in conjunction with the Prospectus and the Statement of Additional Information2. The mailing address of each Trustee and Officer is 525 Market Street, 12th Floor, San Francisco, CA 94105. Each Trustee and Officer serves an indefinite term, however, each Trustee serves such term until reaching the mandatory retirement age established by the Trustees.
Independent Trustees
| | | | | | |
Name and year of birth | | Position held and length of service* | | Principal occupations during past five years or longer | | Current other public company or
investment company
directorships |
William R. Ebsworth
(Born 1957) | | Trustee, since 2015 | | Retired. From 1984 to 2013, equities analyst, portfolio manager, research director and chief financial officer at Fidelity Management and Research Company in Boston, Tokyo, and Hong Kong and retired in 2013 as Chief Investment Officer of Fidelity Strategic Advisers, Inc. where he lead a team of investment professionals managing client assets. Prior thereto, Board member of Hong Kong Securities Clearing Co., Hong Kong Options Clearing Corp., the Thailand International Fund, Ltd., Fidelity Investments Life Insurance Company, and Empire Fidelity Investments Life Insurance Company. Board member of the Fonté Foundation (non-profit organization) and the Vincent Memorial Hospital Endowment (non-profit organization), where he serves on the Investment Committee and as a Chair of the Audit Committee. Mr. Ebsworth is a CFA® charterholder and an Adjunct Lecturer, Finance, at Babson College. | | Asset Allocation Trust |
Jane A. Freeman (Born 1953) | | Trustee, since 2015 | | Retired. From 2012 to 2014 and 1999 to 2008, Chief Financial Officer of Scientific Learning Corporation. From 2008 to 2012, Ms. Freeman provided consulting services related to strategic business projects. Prior to 1999, Portfolio Manager at Rockefeller & Co. and Scudder, Stevens & Clark. Board member of the Harding Loevner Funds from 1996 to 2014, serving as both Lead Independent Director and chair of the Audit Committee. Board member of the Russell Exchange Traded Funds Trust from 2011 to 2012 and the chair of the Audit Committee. Ms. Freeman is a Board Member of Ruth Bancroft Garden (non-profit organization) and an inactive chartered financial analyst. | | Asset Allocation Trust |
| Peter G. Gordon** (Born 1942) | | Trustee, since 1998; Chairman, since 2005 | | Co-Founder, Retired Chairman, President and CEO of Crystal Geyser Water Company. Trustee Emeritus, Colby College. | | Asset Allocation Trust |
Isaiah Harris, Jr. (Born 1952) | | Trustee, since 2009 | | Retired. Chairman of the Board of CIGNA Corporation since 2009, and Director since 2005. From 2003 to 2011, Director of Deluxe Corporation. Prior thereto, President and CEO of BellSouth Advertising and Publishing Corp. from 2005 to 2007, President and CEO of BellSouth Enterprises from 2004 to 2005 and President of BellSouth Consumer Services from 2000 to 2003. Emeritus member of the Iowa State University Foundation Board of Governors. Emeritus Member of the Advisory Board of Iowa State University School of Business. Advisory Board Member, Palm Harbor Academy (charter school). Advisory Board Member, Child Evangelism Fellowship (non-profit). Mr. Harris is a certified public accountant (inactive status). | | CIGNA Corporation; Asset Allocation Trust |
| Judith M. Johnson (Born 1949) | | Trustee, since 2008; Audit Committee Chairman, since 2008 | | Retired. Prior thereto, Chief Executive Officer and Chief Investment Officer of Minneapolis Employees Retirement Fund from 1996 to 2008. Ms. Johnson is an attorney, certified public accountant and a certified managerial accountant. | | Asset Allocation Trust |
David F. Larcker (Born 1950) | | Trustee, since 2009 | | James Irvin Miller Professor of Accounting at the Graduate School of Business, Stanford University, Director of the Corporate Governance Research Initiative and Senior Faculty of The Rock Center for Corporate Governance since 2006. From 2005 to 2008, Professor of Accounting at the Graduate School of Business, Stanford University. Prior thereto, Ernst & Young Professor of Accounting at The Wharton School, University of Pennsylvania from 1985 to 2005. | | Asset Allocation Trust |
| | | | |
| 24 | | Wells Fargo Wisconsin Tax-Free Fund | | Other information (unaudited) |
| | | | | | |
Name and year of birth | | Position held and length of service* | | Principal occupations during past five years or longer | | Current other public company or
investment company
directorships |
Olivia S. Mitchell (Born 1953) | | Trustee, since 2006 | | International Foundation of Employee Benefit Plans Professor, Wharton School of the University of Pennsylvania since 1993. Director of Wharton’s Pension Research Council and Boettner Center on Pensions & Retirement Research, and Research Associate at the National Bureau of Economic Research. Previously, Cornell University Professor from 1978 to 1993. | | Asset Allocation Trust |
Timothy J. Penny (Born 1951) | | Trustee, since 1996 | �� | President and Chief Executive Officer of Southern Minnesota Initiative Foundation, a non-profit organization, since 2007 and Senior Fellow at the Humphrey Institute Policy Forum at the University of Minnesota since 1995. Member of the Board of Trustees of NorthStar Education Finance, Inc., a non-profit organization, since 2007. | | Asset Allocation Trust |
| Michael S. Scofield (Born 1943) | | Trustee, since 2010 | | Served on the Investment Company Institute’s Board of Governors and Executive Committee from 2008-2011 as well the Governing Council of the Independent Directors Council from 2006-2011 and the Independent Directors Council Executive Committee from 2008-2011. Chairman of the IDC from 2008-2010. Institutional Investor (Fund Directions) Trustee of Year in 2007. Trustee of the Evergreen Funds complex (and its predecessors) from 1984 to 2010. Chairman of the Evergreen Funds from 2000-2010. Former Trustee of the Mentor Funds. Retired Attorney, Law Offices of Michael S. Scofield. | | Asset Allocation Trust |
| * | Length of service dates reflect the Trustee’s commencement of service with the Trust’s predecessor entities, where applicable. |
| ** | Peter Gordon is expected to retire on December 31, 2017. |
Officers
| | | | | | |
Name and year of birth | | Position held and length of service | | Principal occupations during past five years or longer | | |
Andrew Owen3 (Born 1960) | | President, since 2017 | | Executive Vice President of Wells Fargo Bank, N.A. and President of Wells Fargo & Company and Head of Affiliated Managaers, Wells Fargo Asset Management, since 2014. Executive Vice President responsible for marketing, investments and product development for Wells Fargo Funds Management, LLC, from 2009 to 2014. | | |
Nancy Wiser1 (Born 1967) | | Treasurer, since 2012 | | Executive Vice President of Wells Fargo Funds Management, LLC since 2011. Chief Operating Officer and Chief Compliance Officer at LightBox Capital Management LLC, from 2008 to 2011. | | |
| C. David Messman (Born 1960) | | Secretary, since 2000; Chief Legal Officer, since 2003 | | Senior Vice President and Secretary of Wells Fargo Funds Management, LLC since 2001. Assistant General Counsel of Wells Fargo Bank, N.A. since 2013 and Vice President and Managing Counsel of Wells Fargo Bank, N.A. from 1996 to 2013. | | |
Michael Whitaker (Born 1967) | | Chief Compliance Officer, since 2016 | | Executive Vice President of Wells Fargo Funds Management, LLC since 2016. Chief Compliance Officer of Fidelity’s Fixed Income Funds and Asset Allocation Funds from 2008 to 2016, Compliance Officer of FMR Co., Inc. from 2014 to 2016, Fidelity Investments Money Management, Inc. from 2014 to 2016, Fidelity Investments from 2007 to 2016. | | |
David Berardi (Born 1975) | | Assistant Treasurer, since 2009 | | Vice President of Wells Fargo Funds Management, LLC since 2009. Vice President of Evergreen Investment Management Company, LLC from 2008 to 2010. Manager of Fund Reporting and Control for Evergreen Investment Management Company, LLC from 2004 to 2010. | | |
| Jeremy DePalma1 (Born 1974) | | Assistant Treasurer, since 2009 | | Senior Vice President of Wells Fargo Funds Management, LLC since 2009. Senior Vice President of Evergreen Investment Management Company, LLC from 2008 to 2010 and head of the Fund Reporting and Control Team within Fund Administration from 2005 to 2010. | | |
| 1 | Nancy Wiser acts as Treasurer of 70 funds in the Fund Complex. Jeremy DePalma acts as Treasurer of 69 funds and Assistant Treasurer of 70 funds in the Fund Complex. |
| 2 | The Statement of Additional Information includes additional information about the Trustees and is available, without charge, upon request, by calling 1-800-222-8222 or by visiting the website at wellsfargofunds.com. |
| 3 | Andrew Owen became President on January 1, 2017. |
| | | | | | |
| List of abbrevations | | Wells Fargo Wisconsin Tax-Free Fund | | | 25 | |
The following is a list of common abbreviations for terms and entities that may have appeared in this report.
| ACA | — ACA Financial Guaranty Corporation |
| ADR | — American depositary receipt |
| ADS | — American depositary shares |
| AGC | — Assured Guaranty Corporation |
| AGM | — Assured Guaranty Municipal |
| Ambac | — Ambac Financial Group Incorporated |
| AMT | — Alternative minimum tax |
| BAN | — Bond anticipation notes |
| BHAC | — Berkshire Hathaway Assurance Corporation |
| CAB | — Capital appreciation bond |
| CCAB | — Convertible capital appreciation bond |
| CDA | — Community Development Authority |
| CDO | — Collateralized debt obligation |
| DRIVER | — Derivative inverse tax-exempt receipts |
| DW&P | — Department of Water & Power |
| DWR | — Department of Water Resources |
| ECFA | — Educational & Cultural Facilities Authority |
| EDA | — Economic Development Authority |
| EDFA | — Economic Development Finance Authority |
| ETF | — Exchange-traded fund |
| FDIC | — Federal Deposit Insurance Corporation |
| FFCB | — Federal Farm Credit Banks |
| FGIC | — Financial Guaranty Insurance Corporation |
| FHA | — Federal Housing Administration |
| FHLB | — Federal Home Loan Bank |
| FHLMC | — Federal Home Loan Mortgage Corporation |
| FICO | — The Financing Corporation |
| FNMA | — Federal National Mortgage Association |
| GDR | — Global depositary receipt |
| GNMA | — Government National Mortgage Association |
| HCFR | — Healthcare facilities revenue |
| HEFA | — Health & Educational Facilities Authority |
| HEFAR | — Higher education facilities authority revenue |
| HFA | — Housing Finance Authority |
| HFFA | — Health Facilities Financing Authority |
| HUD | — Department of Housing and Urban Development |
| IDA | — Industrial Development Authority |
| IDAG | — Industrial Development Agency |
| KRW | — Republic of Korea won |
| LIBOR | — London Interbank Offered Rate |
| LIFER | — Long Inverse Floating Exempt Receipts |
| LLC | — Limited liability company |
| LLLP | — Limited liability limited partnership |
| LLP | — Limited liability partnership |
| MBIA | — Municipal Bond Insurance Association |
| MFHR | — Multifamily housing revenue |
| MSTR | — Municipal securities trust receipts |
| MUD | — Municipal Utility District |
| National | — National Public Finance Guarantee Corporation |
| PCFA | — Pollution Control Financing Authority |
| PCL | — Public Company Limited |
| PCR | — Pollution control revenue |
| PFA | — Public Finance Authority |
| PFFA | — Public Facilities Financing Authority |
| PFOTER | — Puttable floating option tax-exempt receipts |
| plc | — Public limited company |
| PUTTER | — Puttable tax-exempt receipts |
| R&D | — Research & development |
| Radian | — Radian Asset Assurance |
| RAN | — Revenue anticipation notes |
| RDA | — Redevelopment Authority |
| RDFA | — Redevelopment Finance Authority |
| REIT | — Real estate investment trust |
| ROC | — Reset option certificates |
| SAVRS | — Select auction variable rate securities |
| SBA | — Small Business Authority |
| SDR | — Swedish depositary receipt |
| SFHR | — Single-family housing revenue |
| SFMR | — Single-family mortgage revenue |
| SPA | — Standby purchase agreement |
| SPDR | — Standard & Poor’s Depositary Receipts |
| SPEAR | — Short Puttable Exempt Adjustable Receipts |
| STRIPS | — Separate trading of registered interest and |
| TAN | — Tax anticipation notes |
| TIPS | — Treasury inflation-protected securities |
| TRAN | — Tax revenue anticipation notes |
| TTFA | — Transportation Trust Fund Authority |
| TVA | — Tennessee Valley Authority |
This page is intentionally left blank.
This page is intentionally left blank.
This page is intentionally left blank.

For more information
More information about Wells Fargo Funds is available free upon request. To obtain literature, please write, email, visit the Fund’s website, or call:
Wells Fargo Funds
P.O. Box 8266
Boston, MA 02266-8266
Email: fundservice@wellsfargo.com
Website: wellsfargofunds.com
Individual investors: 1-800-222-8222
Retail investment professionals: 1-888-877-9275
Institutional investment professionals: 1-866-765-0778
This report and the financial statements contained herein are submitted for the general information of the shareholders of the Fund. If this report is used for promotional purposes, distribution of the report must be accompanied or preceded by a current prospectus. Before investing, please consider the investment objectives, risks, charges, and expenses of the investment. For a current prospectus and, if available, a summary prospectus, containing this information, call 1-800-222-8222 or visit the Fund’s website at wellsfargofunds.com. Read the prospectus carefully before you invest or send money.
Wells Fargo Asset Management (WFAM) is a trade name used by the asset management businesses of Wells Fargo & Company. Wells Fargo Funds Management, LLC, a wholly owned subsidiary of Wells Fargo & Company, provides investment advisory and administrative services for Wells Fargo Funds. Other affiliates of Wells Fargo & Company provide subadvisory and other services for the funds. The funds are distributed by Wells Fargo Funds Distributor, LLC, Member FINRA, an affiliate of Wells Fargo & Company. Neither Wells Fargo Funds Management nor Wells Fargo Funds Distributor has Fund customer accounts/assets, and neither provides investment advice/recommendations or acts as an investment advice fiduciary to any investor.
NOT FDIC INSURED ◾ NO BANK GUARANTEE ◾ MAY LOSE VALUE
© 2016 Wells Fargo Funds Management, LLC. All rights reserved.
| | |
 | | 300489 02-17 SA259/SAR259 12-16 |
ITEM 2. CODE OF ETHICS
Not applicable.
ITEM 3. AUDIT COMMITTEE FINANCIAL EXPERT
Not applicable.
ITEM 4. PRINCIPAL ACCOUNTANT FEES AND SERVICES
Not applicable.
ITEM 5. AUDIT COMMITTEE OF LISTED REGISTRANTS
Not applicable.
ITEM 6. INVESTMENTS
Wells Fargo Intermediate Tax-AMT-Free Fund, Wells Fargo Municipal Bond Fund, and Wells Fargo Ultra Short-Term Municipal Income Fund included a Summary Portfolio of Investments under Item 1. A Portfolio of Investments for each of Wells Fargo Intermediate Tax-AMT-Free Fund, Wells Fargo Municipal Bond Fund, and Wells Fargo Ultra Short-Term Municipal Income Fund are filed under this Item.
A Portfolio of Investments for each series of Wells Fargo Funds Trust is included as part of the report to shareholders filed under Item 1 of this Form.
| | | | | | |
| Portfolio of investments—December 31, 2016 (unaudited) | | Wells Fargo Intermediate Tax/AMT-Free Fund | | | 1 | |
| | | | | | | | | | | | | | | | |
| Security name | | Interest rate | | | Maturity date | | | Principal | | | Value | |
| | | | |
Municipal Obligations: 98.80% | | | | | | | | | | | | | | | | |
| | | | |
| Alabama: 0.26% | | | | | | | | | | | | | | | | |
Alabama Public School & College Authority Capital Improvement (Tax Revenue) | | | 5.00 | % | | | 12-1-2017 | | | $ | 2,640,000 | | | $ | 2,736,598 | |
Jefferson County AL Series A (GO Revenue) | | | 4.90 | | | | 4-1-2021 | | | | 3,325,000 | | | | 3,462,954 | |
| | | | |
| | | | | | | | | | | | | | | 6,199,552 | |
| | | | | | | | | | | | | | | | |
| | | | |
| Alaska: 0.18% | | | | | | | | | | | | | | | | |
Alaska Railroad Corporation Series A (Miscellaneous Revenue, National Insured) | | | 5.00 | | | | 8-1-2020 | | | | 3,245,000 | | | | 3,322,134 | |
Valdez AK Marine Terminal BP Pipelines Project Series B (Industrial Development Revenue) | | | 5.00 | | | | 1-1-2021 | | | | 1,000,000 | | | | 1,099,470 | |
| | | | |
| | | | | | | | | | | | | | | 4,421,604 | |
| | | | | | | | | | | | | | | | |
| | | | |
| Arizona: 1.68% | | | | | | | | | | | | | | | | |
Arizona Refunding Certificate of Participation (Miscellaneous Revenue) | | | 5.00 | | | | 9-1-2027 | | | | 3,040,000 | | | | 3,553,213 | |
Arizona Sports & Tourism Authority Series A (Tax Revenue) | | | 4.00 | | | | 7-1-2020 | | | | 1,365,000 | | | | 1,435,611 | |
Arizona Sports & Tourism Authority Series A (Tax Revenue) | | | 5.00 | | | | 7-1-2021 | | | | 795,000 | | | | 873,808 | |
Arizona Sports & Tourism Authority Series A (Tax Revenue) | | | 5.00 | | | | 7-1-2022 | | | | 1,000,000 | | | | 1,112,830 | |
Maricopa County AZ Elementary School District #28 Kyrene Elementary School Project 2010 Series B (GO Revenue) | | | 4.50 | | | | 7-1-2024 | | | | 1,575,000 | | | | 1,781,672 | |
Maricopa County AZ Elementary School District #28 Kyrene Elementary School Project 2010 Series B (GO Revenue) | | | 4.50 | | | | 7-1-2025 | | | | 1,270,000 | | | | 1,425,639 | |
Maricopa County AZ Elementary School District #28 Kyrene Elementary School Project 2010 Series B (GO Revenue) | | | 5.00 | | | | 7-1-2027 | | | | 420,000 | | | | 487,855 | |
Maricopa County AZ Elementary School District #28 Kyrene Elementary School Project 2010 Series B (GO Revenue) | | | 5.50 | | | | 7-1-2029 | | | | 960,000 | | | | 1,147,450 | |
McAllister AZ Arizona State University Hassayampa Academic Village Project (Education Revenue) | | | 5.00 | | | | 7-1-2025 | | | | 750,000 | | | | 883,095 | |
Mohave County AZ Kingman Unified School District #20 (GO Revenue, Build America Mutual Assurance Company Insured) | | | 5.00 | | | | 7-1-2024 | | | | 4,000,000 | | | | 4,606,440 | |
Mohave County AZ Kingman Unified School District #20 (GO Revenue, Build America Mutual Assurance Company Insured) | | | 5.00 | | | | 7-1-2026 | | | | 1,175,000 | | | | 1,369,651 | |
Phoenix AZ (GO Revenue) | | | 5.00 | | | | 7-1-2026 | | | | 3,810,000 | | | | 4,663,669 | |
Phoenix AZ Civic Improvement Corporation Series A (Airport Revenue) | | | 5.00 | | | | 7-1-2029 | | | | 5,000,000 | | | | 5,521,950 | |
Pima County AZ IDA New Plan Learning Project Series A (Education Revenue) | | | 7.00 | | | | 7-1-2021 | | | | 775,000 | | | | 786,904 | |
Pima County AZ IDA New Plan Learning Project Series A (Education Revenue) | | | 7.75 | | | | 7-1-2035 | | | | 5,000,000 | | | | 5,024,350 | |
San Luis AZ Pledged Excise Tax Series A (Tax Revenue, Build America Mutual Assurance Company Insured) | | | 5.00 | | | | 7-1-2027 | | | | 450,000 | | | | 516,744 | |
San Luis AZ Pledged Excise Tax Series A (Tax Revenue, Build America Mutual Assurance Company Insured) | | | 5.00 | | | | 7-1-2028 | | | | 700,000 | | | | 800,765 | |
San Luis AZ Pledged Excise Tax Series A (Tax Revenue, Build America Mutual Assurance Company Insured) | | | 5.00 | | | | 7-1-2034 | | | | 3,680,000 | | | | 4,116,117 | |
| | | | |
| | | | | | | | | | | | | | | 40,107,763 | |
| | | | | | | | | | | | | | | | |
| | | | |
| California: 9.19% | | | | | | | | | | | | | | | | |
Acalanes CA Union High School District Refunding Bonds (GO Revenue) | | | 5.00 | | | | 8-1-2017 | | | | 2,070,000 | | | | 2,119,494 | |
Alameda CA Corridor Transportation Authority CAB Subordinated Lien Prerefunded Series A (Transportation Revenue, Ambac Insured) ¤ | | | 0.00 | | | | 10-1-2018 | | | | 4,220,000 | | | | 4,114,458 | |
Alameda CA Corridor Transportation Authority CAB Subordinated Lien Unrefunded Series A (Transportation Revenue, Ambac Insured) ¤ | | | 0.00 | | | | 10-1-2018 | | | | 1,350,000 | | | | 1,307,340 | |
Anaheim CA PFA Convention Center Expansion Project Series A (Miscellaneous Revenue) | | | 5.00 | | | | 5-1-2039 | | | | 2,500,000 | | | | 2,762,800 | |
| | | | |
| 2 | | Wells Fargo Intermediate Tax/AMT-Free Fund | | Portfolio of investments—December 31, 2016 (unaudited) |
| | | | | | | | | | | | | | | | |
| Security name | | Interest rate | | | Maturity date | | | Principal | | | Value | |
| | | | |
| California (continued) | | | | | | | | | | | | | | | | |
Bay Area CA Toll Authority Toll Bridge Series A (Transportation Revenue) ± | | | 1.97 | % | | | 4-1-2036 | | | $ | 9,810,000 | | | $ | 9,847,474 | |
California (GO Revenue) | | | 5.25 | | | | 3-1-2024 | | | | 5,000,000 | | | | 5,542,350 | |
California (GO Revenue) | | | 5.25 | | | | 3-1-2030 | | | | 1,440,000 | | | | 1,586,578 | |
California (GO Revenue) | | | 6.00 | | | | 3-1-2033 | | | | 2,510,000 | | | | 2,838,408 | |
California Municipal Finance Authority (Utilities Revenue) | | | 5.00 | | | | 10-1-2025 | | | | 1,500,000 | | | | 1,809,465 | |
California Public Works Board Department of Corrections Project Series A (Miscellaneous Revenue, Ambac Insured) | | | 5.00 | | | | 12-1-2019 | | | | 1,675,000 | | | | 1,776,187 | |
California Public Works Board Department of General Services Buildings 8 & 9A (Miscellaneous Revenue) | | | 6.25 | | | | 4-1-2034 | | | | 2,750,000 | | | | 3,047,633 | |
California Public Works Board Various Judicial Council Project Series D (Miscellaneous Revenue) | | | 5.25 | | | | 12-1-2026 | | | | 1,000,000 | | | | 1,143,040 | |
California Public Works University of California Board of Regents Series G (Miscellaneous Revenue) | | | 5.00 | | | | 12-1-2030 | | | | 12,110,000 | | | | 13,871,036 | |
California Statewide CDA Series A (Education Revenue) | | | 6.90 | | | | 8-1-2031 | | | | 1,915,000 | | | | 2,156,616 | |
California Statewide CDA Series C (Health Revenue) | | | 5.25 | | | | 8-15-2031 | | | | 3,000,000 | | | | 3,417,210 | |
California Various Purposes (GO Revenue) | | | 5.00 | | | | 8-1-2030 | | | | 1,500,000 | | | | 1,772,955 | |
California Various Purposes (GO Revenue) | | | 6.00 | | | | 4-1-2038 | | | | 8,055,000 | | | | 8,791,871 | |
Cerritos CA Community College District Series D (GO Revenue) ¤ | | | 0.00 | | | | 8-1-2025 | | | | 1,800,000 | | | | 1,375,380 | |
Chino Basin CA Desalter Authority Series A (Water & Sewer Revenue) | | | 4.00 | | | | 6-1-2028 | | | | 2,000,000 | | | | 2,189,240 | |
Compton CA Community College District Election of 2002 CAB Series C (GO Revenue) ¤ | | | 0.00 | | | | 8-1-2029 | | | | 1,565,000 | | | | 933,538 | |
Compton CA Community College District Election of 2002 CAB Series C (GO Revenue) ¤ | | | 0.00 | | | | 8-1-2031 | | | | 2,400,000 | | | | 1,292,184 | |
El Monte CA Union High School District (GO Revenue) | | | 5.00 | | | | 6-1-2019 | | | | 1,490,000 | | | | 1,610,407 | |
El Monte CA Union High School District (GO Revenue) | | | 5.00 | | | | 6-1-2020 | | | | 2,000,000 | | | | 2,211,280 | |
Emery CA Unified School District Election of 2010 Series A (GO Revenue, AGM Insured) | | | 6.25 | | | | 8-1-2031 | | | | 4,500,000 | | | | 5,273,100 | |
Foothill De Anza CA Community College District Certificate of Participation (Miscellaneous Revenue) | | | 5.00 | | | | 4-1-2033 | | | | 500,000 | | | | 558,065 | |
M-S-R California Energy Authority Gas Series B (Utilities Revenue) | | | 7.00 | | | | 11-1-2034 | | | | 2,000,000 | | | | 2,737,860 | |
M-S-R California Energy Authority Gas Series C (Utilities Revenue) | | | 7.00 | | | | 11-1-2034 | | | | 3,000,000 | | | | 4,106,790 | |
New Haven CA Unified School District CAB Project (GO Revenue, AGC Insured) ¤ | | | 0.00 | | | | 8-1-2033 | | | | 5,590,000 | | | | 2,928,042 | |
Northern California Gas Authority #1 LIBOR Series B (Utilities Revenue) ± | | | 1.29 | | | | 7-1-2027 | | | | 10,000,000 | | | | 8,901,900 | |
Northern California Power Agency Series A (Utilities Revenue) | | | 5.25 | | | | 8-1-2023 | | | | 5,150,000 | | | | 5,665,206 | |
Northern Humboldt CA High School District Election of 2010 Series A (GO Revenue) | | | 6.50 | | | | 8-1-2034 | | | | 1,145,000 | | | | 1,383,080 | |
Oakland CA Unified School District Alameda County Election of 2006 Series A (GO Revenue) | | | 6.50 | | | | 8-1-2020 | | | | 1,730,000 | | | | 1,952,426 | |
Oakland CA Unified School District Alameda County Election of 2009 Series A (GO Revenue) | | | 6.25 | | | | 8-1-2019 | | | | 1,285,000 | | | | 1,438,532 | |
Oakland CA Unified School District Alameda County Election of 2012 (GO Revenue) | | | 6.25 | | | | 8-1-2028 | | | | 2,000,000 | | | | 2,362,180 | |
Oakland CA Unified School District Alameda County Election of 2012 (GO Revenue) | | | 6.25 | | | | 8-1-2030 | | | | 2,000,000 | | | | 2,348,380 | |
Oxnard CA School District Series A (GO Revenue, National Insured) | | | 5.75 | | | | 8-1-2030 | | | | 1,825,000 | | | | 2,154,595 | |
Pasadena CA PFA Rose Bowl Renovation Series A (Miscellaneous Revenue) | | | 5.00 | | | | 3-1-2021 | | | | 1,655,000 | | | | 1,862,785 | |
Patterson CA Unified School District CAB Election of 2008 Project Series B (GO Revenue, AGM Insured) ¤ | | | 0.00 | | | | 8-1-2033 | | | | 3,000,000 | | | | 1,604,190 | |
Peralta CA Community College District Alameda County (GO Revenue) | | | 5.00 | | | | 8-1-2023 | | | | 3,045,000 | | | | 3,526,232 | |
Peralta CA Community College District Alameda County (GO Revenue) | | | 5.00 | | | | 8-1-2024 | | | | 3,000,000 | | | | 3,452,130 | |
Richmond CA Joint Powers Financing Authority Point Potrero Series A (Miscellaneous Revenue) | | | 6.25 | | | | 7-1-2024 | | | | 2,700,000 | | | | 2,981,583 | |
Rio Hondo CA Community College District (GO Revenue) ¤ | | | 0.00 | | | | 8-1-2030 | | | | 2,315,000 | | | | 1,367,957 | |
Sacramento CA Airport Systems (Airport Revenue) | | | 5.00 | | | | 7-1-2025 | | | | 2,000,000 | | | | 2,182,160 | |
| | | | | | |
| Portfolio of investments—December 31, 2016 (unaudited) | | Wells Fargo Intermediate Tax/AMT-Free Fund | | | 3 | |
| | | | | | | | | | | | | | | | |
| Security name | | Interest rate | | | Maturity date | | | Principal | | | Value | |
| | | | |
| California (continued) | | | | | | | | | | | | | | | | |
Sacramento CA Municipal Utility District Series B (Utilities Revenue) | | | 5.00 | % | | | 8-15-2030 | | | $ | 1,075,000 | | | $ | 1,235,992 | |
San Diego CA Community College District Election of 2012 (GO Revenue) | | | 5.00 | | | | 8-1-2032 | | | | 3,095,000 | | | | 3,590,633 | |
San Diego CA PFFA Capital Improvement Projects Series B (Miscellaneous Revenue) | | | 5.00 | | | | 10-15-2027 | | | | 500,000 | | | | 583,085 | |
San Diego CA PFFA Capital Improvement Projects Series B (Miscellaneous Revenue) | | | 5.00 | | | | 10-15-2028 | | | | 1,000,000 | | | | 1,158,750 | |
San Diego CA Unified School District Election of 1998 Series E-2 (GO Revenue, AGM Insured) | | | 5.50 | | | | 7-1-2027 | | | | 5,000,000 | | | | 6,283,400 | |
San Gorgonio CA Memorial Healthcare District (GO Revenue) | | | 7.00 | | | | 8-1-2029 | | | | 2,000,000 | | | | 2,071,260 | |
San Jose CA Libraries & Parks Project (GO Revenue) | | | 5.13 | | | | 9-1-2031 | | | | 6,110,000 | | | | 6,129,552 | |
San Jose CA MFHR Casa Del Pueblo Apartments Project Series D (Housing Revenue) ±## | | | 0.95 | | | | 12-1-2017 | | | | 10,000,000 | | | | 9,987,900 | |
San Jose CA Redevelopment Agency Series A-1 (Tax Revenue) | | | 5.50 | | | | 8-1-2030 | | | | 1,355,000 | | | | 1,483,088 | |
Santa Ana CA Financing Authority Police Administration and Holding Facilities Prerefunded Balance (Miscellaneous Revenue, National Insured) | | | 6.25 | | | | 7-1-2019 | | | | 500,000 | | | | 558,520 | |
Santa Ana CA Financing Authority Police Administration and Holding Facilities Unrefunded Balance (Miscellaneous Revenue, National Insured) | | | 6.25 | | | | 7-1-2019 | | | | 500,000 | | | | 553,435 | |
Southern California Public Power Authority Milford Wind Corridor Project #1 (Utilities Revenue) | | | 5.00 | | | | 7-1-2024 | | | | 5,000,000 | | | | 5,438,100 | |
Southern California Public Power Authority Southern Transmission Project Series S (Utilities Revenue) | | | 5.75 | | | | 7-1-2024 | | | | 2,000,000 | | | | 2,135,740 | |
Sylvan CA Unified School District CAB Election of 2006 (GO Revenue, AGM Insured) ¤ | | | 0.00 | | | | 8-1-2031 | | | | 2,590,000 | | | | 1,519,424 | |
Sylvan CA Unified School District CAB Election of 2006 (GO Revenue, AGM Insured) ¤ | | | 0.00 | | | | 8-1-2032 | | | | 2,800,000 | | | | 1,566,768 | |
Tustin CA Unified School District #88-1 Election of 2008 Series B (GO Revenue) | | | 6.00 | | | | 8-1-2036 | | | | 1,500,000 | | | | 1,776,810 | |
University of California Limited Project Series G (Education Revenue) | | | 5.00 | | | | 5-15-2037 | | | | 10,390,000 | | | | 11,694,465 | |
University of California Medical Center Series J (Health Revenue) | | | 5.25 | | | | 5-15-2030 | | | | 15,000,000 | | | | 17,397,300 | |
University of California Prerefunded Series Q (Education Revenue) | | | 5.25 | | | | 5-15-2024 | | | | 2,090,000 | | | | 2,145,113 | |
University of California Unrefunded Series Q (Education Revenue) | | | 5.25 | | | | 5-15-2024 | | | | 65,000 | | | | 66,665 | |
Washington Township CA Health Care District Series A (Health Revenue) | | | 5.00 | | | | 7-1-2018 | | | | 445,000 | | | | 467,036 | |
Washington Township CA Health Care District Series A (Health Revenue) | | | 5.00 | | | | 7-1-2019 | | | | 905,000 | | | | 971,880 | |
Washington Township CA Health Care District Series A (Health Revenue) | | | 5.00 | | | | 7-1-2020 | | | | 1,300,000 | | | | 1,320,007 | |
Washington Township CA Health Care District Series A (Health Revenue) | | | 5.13 | | | | 7-1-2017 | | | | 260,000 | | | | 264,901 | |
West Contra Costa CA Unified School District Election of 2005 Series C-1 (GO Revenue, AGC Insured) ¤ | | | 0.00 | | | | 8-1-2026 | | | | 4,620,000 | | | | 3,292,027 | |
| | | | |
| | | | | | | | | | | | | | | 219,995,988 | |
| | | | | | | | | | | | | | | | |
| | | | |
| Colorado: 0.69% | | | | | | | | | | | | | | | | |
Adams County CO 12 Five Star Schools Series B (GO Revenue) | | | 5.00 | | | | 12-15-2028 | | | | 3,800,000 | | | | 4,556,124 | |
Adams County CO Refunding & Improvement Certificate of Participation (Miscellaneous Revenue) | | | 4.00 | | | | 12-1-2018 | | | | 500,000 | | | | 523,635 | |
Adams County CO Refunding & Improvement Certificate of Participation (Miscellaneous Revenue) | | | 5.00 | | | | 12-1-2021 | | | | 830,000 | | | | 940,813 | |
Colorado ECFA Charter School Monument Academy Project Series A (Education Revenue) | | | 5.50 | | | | 10-1-2017 | | | | 205,000 | | | | 210,787 | |
Colorado ECFA University of Denver Project (Education Revenue, National Insured) | | | 5.25 | | | | 3-1-2025 | | | | 1,110,000 | | | | 1,298,811 | |
Denver CO Convention Center Hotel Authority Refunding Bond (Industrial Development Revenue) | | | 5.00 | | | | 12-1-2023 | | | | 3,000,000 | | | | 3,354,420 | |
Regents of the University of Colorado Certificate of Participation Series 2013A (Education Revenue) | | | 5.00 | | | | 11-1-2028 | | | | 5,000,000 | | | | 5,697,050 | |
| | | | |
| | | | | | | | | | | | | | | 16,581,640 | |
| | | | | | | | | | | | | | | | |
| | | | |
| 4 | | Wells Fargo Intermediate Tax/AMT-Free Fund | | Portfolio of investments—December 31, 2016 (unaudited) |
| | | | | | | | | | | | | | | | |
| Security name | | Interest rate | | | Maturity date | | | Principal | | | Value | |
| | | | |
| Connecticut: 3.02% | | | | | | | | | | | | | | | | |
Connecticut HEFAR Yale University Issue Series A (Education Revenue) ± | | | 1.00 | % | | | 7-1-2042 | | | $ | 25,000,000 | | | $ | 24,530,750 | |
Connecticut HEFAR Yale University Issue Series A (Education Revenue) ± | | | 1.38 | | | | 7-1-2035 | | | | 10,000,000 | | | | 9,975,600 | |
Connecticut HEFAR Yale University Issue Series A-2 (Education Revenue) ± | | | 2.00 | | | | 7-1-2042 | | | | 3,295,000 | | | | 3,048,962 | |
Connecticut Series A (Miscellaneous Revenue) ± | | | 1.57 | | | | 3-1-2022 | | | | 3,000,000 | | | | 2,998,500 | |
Connecticut Series A (Miscellaneous Revenue) ± | | | 1.82 | | | | 4-15-2019 | | | | 2,300,000 | | | | 2,311,178 | |
Connecticut Series A (Miscellaneous Revenue) ± | | | 1.97 | | | | 4-15-2020 | | | | 3,300,000 | | | | 3,329,931 | |
Connecticut Special Tax Obligation Bonds Transportation Infrastructure Purposes Series A (Tax Revenue) | | | 5.00 | | | | 8-1-2028 | | | | 2,000,000 | | | | 2,318,660 | |
Connecticut Special Tax Obligation Bonds Transportation Infrastructure Purposes Series A (Tax Revenue) | | | 5.00 | | | | 8-1-2030 | | | | 1,000,000 | | | | 1,145,490 | |
Hamden CT (GO Revenue) | | | 4.00 | | | | 8-15-2020 | | | | 1,235,000 | | | | 1,303,864 | |
Hamden CT (GO Revenue) | | | 4.00 | | | | 8-15-2021 | | | | 1,235,000 | | | | 1,309,322 | |
Hamden CT (GO Revenue, AGM Insured) | | | 5.00 | | | | 8-15-2021 | | | | 1,000,000 | | | | 1,120,030 | |
Hamden CT (GO Revenue, AGM Insured) | | | 5.00 | | | | 8-15-2022 | | | | 1,000,000 | | | | 1,132,950 | |
Hartford CT Series A (GO Revenue, AGM Insured) | | | 5.00 | | | | 4-1-2022 | | | | 3,010,000 | | | | 3,325,478 | |
Hartford CT Series A (GO Revenue, AGM Insured) | | | 5.00 | | | | 7-1-2026 | | | | 1,000,000 | | | | 1,117,300 | |
Hartford CT Series A (GO Revenue, AGM Insured) | | | 5.00 | | | | 7-1-2028 | | | | 1,265,000 | | | | 1,401,557 | |
Hartford CT Series C (GO Revenue, AGM Insured) | | | 5.00 | | | | 7-15-2022 | | | | 2,320,000 | | | | 2,573,066 | |
University of Connecticut Series A (Education Revenue) | | | 5.00 | | | | 3-15-2027 | | | | 1,000,000 | | | | 1,180,110 | |
University of Connecticut Series A (Education Revenue) | | | 5.00 | | | | 3-15-2028 | | | | 2,000,000 | | | | 2,348,820 | |
University of Connecticut Series A (Education Revenue) | | | 5.00 | | | | 3-15-2031 | | | | 5,075,000 | | | | 5,846,451 | |
| | | | |
| | | | | | | | | | | | | | | 72,318,019 | |
| | | | | | | | | | | | | | | | |
| | | | |
| Delaware: 0.08% | | | | | | | | | | | | | | | | |
Delaware EDA Odyssey Charter School Project Series B (Education Revenue) 144A | | | 6.75 | | | | 9-1-2035 | | | | 2,000,000 | | | | 1,985,080 | |
| | | | | | | | | | | | | | | | |
| | | | |
| District of Columbia: 0.59% | | | | | | | | | | | | | | | | |
District of Columbia Federal Highway Grant Anticipation Bonds (Miscellaneous Revenue) | | | 5.00 | | | | 12-1-2023 | | | | 1,000,000 | | | | 1,140,730 | |
District of Columbia Federal Highway Grant Anticipation Bonds (Miscellaneous Revenue) | | | 5.00 | | | | 12-1-2025 | | | | 3,520,000 | | | | 4,019,347 | |
District of Columbia Federal Highway Grant Anticipation Bonds (Miscellaneous Revenue) | | | 5.25 | | | | 12-1-2025 | | | | 2,630,000 | | | | 2,944,995 | |
District of Columbia Howard University Series A (Education Revenue) | | | 5.75 | | | | 10-1-2026 | | | | 2,510,000 | | | | 2,553,222 | |
District of Columbia Medical Association of Colleges Series B (Miscellaneous Revenue) | | | 5.00 | | | | 10-1-2024 | | | | 3,095,000 | | | | 3,427,867 | |
| | | | |
| | | | | | | | | | | | | | | 14,086,161 | |
| | | | | | | | | | | | | | | | |
| | | | |
| Florida: 5.24% | | | | | | | | | | | | | | | | |
Broward County FL School Board Certificate of Participation Series A (Miscellaneous Revenue) | | | 5.00 | | | | 7-1-2024 | | | | 5,000,000 | | | | 5,833,650 | |
Cityplace Florida Community Development District Special Assessment (Miscellaneous Revenue) | | | 5.00 | | | | 5-1-2021 | | | | 2,945,000 | | | | 3,184,811 | |
Daytona Beach FL Utility System (Water & Sewer Revenue, AGM Insured) | | | 5.00 | | | | 11-1-2022 | | | | 2,205,000 | | | | 2,535,904 | |
Duval County FL School Board Certificate of Participation Series B (Miscellaneous Revenue) | | | 5.00 | | | | 7-1-2028 | | | | 2,500,000 | | | | 2,871,800 | |
Duval County FL School Board Certificate of Participation Series B (Miscellaneous Revenue) | | | 5.00 | | | | 7-1-2029 | | | | 5,000,000 | | | | 5,715,400 | |
Florida Department of Transportation Turnpike System Series A (Transportation Revenue) | | | 5.00 | | | | 7-1-2023 | | | | 3,910,000 | | | | 4,576,499 | |
| | | | | | |
| Portfolio of investments—December 31, 2016 (unaudited) | | Wells Fargo Intermediate Tax/AMT-Free Fund | | | 5 | |
| | | | | | | | | | | | | | | | |
| Security name | | Interest rate | | | Maturity date | | | Principal | | | Value | |
| | | | |
| Florida (continued) | | | | | | | | | | | | | | | | |
Florida Department of Transportation Turnpike System Series A (Transportation Revenue) | | | 5.00 | % | | | 7-1-2025 | | | $ | 4,950,000 | | | $ | 5,896,886 | |
Florida Development Finance Corporation Renaissance Charter School Series A (Education Revenue) | | | 5.00 | | | | 9-15-2020 | | | | 1,670,000 | | | | 1,710,147 | |
Florida HEFAR (Education Revenue) | | | 4.00 | | | | 4-1-2021 | | | | 1,000,000 | | | | 1,055,590 | |
Florida Mid-Bay Bridge Authority Series A (Transportation Revenue) | | | 5.00 | | | | 10-1-2025 | | | | 1,250,000 | | | | 1,437,500 | |
Gulf Breeze FL Capital Funding Loan Program Series A (Miscellaneous Revenue, AGM Insured) | | | 5.00 | | | | 10-1-2017 | | | | 1,665,000 | | | | 1,710,954 | |
Gulf Breeze FL Capital Funding Loan Program Series B (Miscellaneous Revenue, AGM Insured) | | | 4.00 | | | | 10-1-2017 | | | | 1,000,000 | | | | 1,020,140 | |
Gulf Breeze FL Local Government Loan Series J (Water & Sewer Revenue) ± | | | 4.20 | | | | 12-1-2020 | | | | 3,290,000 | | | | 3,377,086 | |
Hernando County FL School Board Florida Master Lease Program Certificate of Participation Series A (Miscellaneous Revenue, AGM Insured) | | | 5.00 | | | | 7-1-2025 | | | | 2,065,000 | | | | 2,415,183 | |
Miami-Dade County FL Public Services (Tax Revenue, AGM Insured) | | | 4.00 | | | | 10-1-2019 | | | | 3,440,000 | | | | 3,645,609 | |
Miami-Dade County FL Public Services (Tax Revenue, AGM Insured) | | | 4.00 | | | | 10-1-2020 | | | | 3,600,000 | | | | 3,855,564 | |
Miami-Dade County FL Public Services (Tax Revenue, AGM Insured) | | | 4.00 | | | | 4-1-2021 | | | | 2,485,000 | | | | 2,666,654 | |
Miami-Dade County FL School Board Certificate of Participation Series 4 (Miscellaneous Revenue, Dexia Credit Local LOC, Dexia Credit Local LIQ) 144Aø | | | 1.27 | | | | 9-25-2024 | | | | 11,960,000 | | | | 11,960,000 | |
Miami-Dade County FL School Board Certificate of Participation Series 5 (Miscellaneous Revenue, Dexia Credit Local LOC, FGIC Insured, Dexia Credit Local LIQ) 144Aø | | | 1.11 | | | | 5-1-2037 | | | | 18,235,000 | | | | 18,235,000 | |
Miami-Dade County FL School Board Certificate of Participation Series A (Miscellaneous Revenue) ± | | | 5.00 | | | | 5-1-2031 | | | | 3,000,000 | | | | 3,453,480 | |
Miami-Dade County FL School Board Certificate of Participation Series D (Miscellaneous Revenue) | | | 5.00 | | | | 11-1-2027 | | | | 6,600,000 | | | | 7,555,020 | |
Miami-Dade County FL Special Obligation Series A (Tax Revenue) | | | 5.00 | | | | 10-1-2023 | | | | 700,000 | | | | 799,246 | |
Miami-Dade County FL Water & Sewer Refunding Bond Series C (Water & Sewer Revenue, BHAC Insured) | | | 5.00 | | | | 10-1-2024 | | | | 2,950,000 | | | | 3,140,865 | |
Miami-Dade County FL Water & Sewer Refunding Bond Series C (Water & Sewer Revenue) | | | 5.25 | | | | 10-1-2022 | | | | 3,000,000 | | | | 3,207,060 | |
Orange County FL School Board Certificate of Participation Series C (Miscellaneous Revenue) | | | 5.00 | | | | 8-1-2029 | | | | 2,000,000 | | | | 2,310,720 | |
Putnam County FL Development Authority PCR Seminole Project Series A (Utilities Revenue, Ambac Insured) ± | | | 5.35 | | | | 3-15-2042 | | | | 5,260,000 | | | | 5,521,527 | |
Seminole Tribe of Florida Special Obligation Series A (Miscellaneous Revenue) 144A | | | 5.50 | | | | 10-1-2024 | | | | 2,500,000 | | | | 2,555,850 | |
South Lake County FL Hospital District South Lake Hospital Incorporated (Health Revenue) | | | 5.00 | | | | 10-1-2017 | | | | 900,000 | | | | 922,779 | |
Tampa FL Sports Authority Stadium Project (Tax Revenue) | | | 5.00 | | | | 1-1-2025 | | | | 3,395,000 | | | | 4,039,677 | |
Tender Option Bond Trust Receipt/Certificates for Seminole County FL Series ZF0444 (Tax Revenue, National Insured, JPMorgan Chase & Company LIQ) 144Aø | | | 0.87 | | | | 4-1-2027 | | | | 5,250,000 | | | | 5,250,000 | |
University of South Florida Financing Corporation Certificate of Participation Master Lease Program Series A (Education Revenue) | | | 5.00 | | | | 7-1-2022 | | | | 1,730,000 | | | | 1,951,561 | |
University of South Florida Financing Corporation Certificate of Participation Master Lease Program Series A (Education Revenue) | | | 5.00 | | | | 7-1-2023 | | | | 815,000 | | | | 928,212 | |
| | | | |
| | | | | | | | | | | | | | | 125,340,374 | |
| | | | | | | | | | | | | | | | |
| | | | |
| Georgia: 1.48% | | | | | | | | | | | | | | | | |
Columbus GA Water & Sewerage Bond (Water & Sewer Revenue) | | | 5.00 | | | | 5-1-2035 | | | | 1,200,000 | | | | 1,387,764 | |
Floyd County GA PCR Georgia Power Company Plant Hammond Project (Utilities Revenue) ± | | | 2.35 | | | | 7-1-2022 | | | | 1,000,000 | | | | 994,380 | |
Georgia Public Gas Partners Incorporated Series A (Utilities Revenue) | | | 5.00 | | | | 10-1-2017 | | | | 2,500,000 | | | | 2,570,825 | |
| | | | |
| 6 | | Wells Fargo Intermediate Tax/AMT-Free Fund | | Portfolio of investments—December 31, 2016 (unaudited) |
| | | | | | | | | | | | | | | | |
| Security name | | Interest rate | | | Maturity date | | | Principal | | | Value | |
| | | | |
| Georgia (continued) | | | | | | | | | | | | | | | | |
Georgia Public Gas Partners Incorporated Series A (Utilities Revenue) | | | 5.00 | % | | | 10-1-2019 | | | $ | 5,000,000 | | | $ | 5,436,100 | |
Georgia Series F (Miscellaneous Revenue) | | | 5.00 | | | | 7-1-2026 | | | | 10,000,000 | | | | 12,317,100 | |
Main Street Natural Gas Incorporated Georgia Gas Project Series A (Utilities Revenue) | | | 5.50 | | | | 9-15-2022 | | | | 1,000,000 | | | | 1,123,520 | |
Monroe County GA PCR Georgia Power Company Plant Scherer Project (Industrial Development Revenue) ± | | | 2.35 | | | | 10-1-2048 | | | | 2,000,000 | | | | 1,981,340 | |
Private Colleges & Universities Authority of Georgia Series A (Education Revenue) | | | 5.00 | | | | 10-1-2021 | | | | 3,330,000 | | | | 3,643,619 | |
Savannah GA MFHR Wessels Blackshear Home Project (Housing Revenue) ± | | | 1.15 | | | | 7-1-2019 | | | | 6,000,000 | | | | 5,958,300 | |
| | | | |
| | | | | | | | | | | | | | | 35,412,948 | |
| | | | | | | | | | | | | | | | |
| | | | |
| Guam: 0.35% | | | | | | | | | | | | | | | | |
Guam Government Business Privilege Tax Bond Series A (Tax Revenue) | | | 5.00 | | | | 1-1-2020 | | | | 1,345,000 | | | | 1,448,565 | |
Guam Government Waterworks Authority (Water & Sewer Revenue) | | | 5.00 | | | | 7-1-2028 | | | | 1,000,000 | | | | 1,094,780 | |
Guam Government Waterworks Authority (Water & Sewer Revenue) | | | 5.25 | | | | 7-1-2020 | | | | 350,000 | | | | 383,569 | |
Guam Government Waterworks Authority (Water & Sewer Revenue) | | | 5.25 | | | | 7-1-2033 | | | | 2,500,000 | | | | 2,734,225 | |
Guam International Airport Authority (Airport Revenue) | | | 5.00 | | | | 10-1-2022 | | | | 1,000,000 | | | | 1,121,180 | |
Guam International Airport Authority (Airport Revenue) | | | 5.00 | | | | 10-1-2023 | | | | 1,500,000 | | | | 1,690,875 | |
| | | | |
| | | | | | | | | | | | | | | 8,473,194 | |
| | | | | | | | | | | | | | | | |
| | | | |
| Illinois: 15.88% | | | | | | | | | | | | | | | | |
Bolingbrook, Will & DuPage Counties IL Series A (GO Revenue, AGM Insured) | | | 5.00 | | | | 1-1-2023 | | | | 650,000 | | | | 732,719 | |
Champaign & Coles Counties IL Community College District #505 Series A (GO Revenue) | | | 4.00 | | | | 12-1-2018 | | | | 1,015,000 | | | | 1,062,360 | |
Chicago IL Board of Education CAB School Reform Series B-1 (GO Revenue, National Insured) ¤ | | | 0.00 | | | | 12-1-2021 | | | | 1,000,000 | | | | 817,160 | |
Chicago IL Board of Education CAB School Reform Series B-1 (GO Revenue, National Insured) ¤ | | | 0.00 | | | | 12-1-2025 | | | | 3,380,000 | | | | 2,233,031 | |
Chicago IL Board of Education CAB School Reform Series B-1 (GO Revenue, National Insured) ¤ | | | 0.00 | | | | 12-1-2026 | | | | 4,030,000 | | | | 2,511,778 | |
Chicago IL Board of Education School Reform Series A (GO Revenue, National/FGIC Insured) | | | 5.25 | | | | 12-1-2023 | | | | 5,125,000 | | | | 5,518,344 | |
Chicago IL Board of Education Series A3 (GO Revenue) ± | | | 1.55 | | | | 3-1-2036 | | | | 10,000,000 | | | | 9,437,700 | |
Chicago IL Board of Education Series B (GO Revenue, Ambac Insured) | | | 5.00 | | | | 12-1-2021 | | | | 7,760,000 | | | | 7,764,423 | |
Chicago IL Board of Education Series C (GO Revenue) | | | 5.00 | | | | 12-1-2021 | | | | 2,500,000 | | | | 2,201,075 | |
Chicago IL Board of Education Series C (GO Revenue) | | | 5.00 | | | | 12-1-2029 | | | | 3,000,000 | | | | 2,400,540 | |
Chicago IL Board of Education Series C (GO Revenue) | | | 5.25 | | | | 12-1-2025 | | | | 5,000,000 | | | | 4,101,300 | |
Chicago IL Board of Education Series F (GO Revenue) | | | 5.00 | | | | 12-1-2020 | | | | 2,375,000 | | | | 2,114,985 | |
Chicago IL CAB Series A (GO Revenue, National Insured) | | | 5.44 | | | | 1-1-2018 | | | | 1,725,000 | | | | 1,730,330 | |
Chicago IL Metropolitan Reclamation Series B (GO Revenue) | | | 5.00 | | | | 12-1-2025 | | | | 2,500,000 | | | | 2,781,225 | |
Chicago IL O’Hare International Airport Senior Lien (Airport Revenue, AGM Insured) | | | 5.13 | | | | 1-1-2030 | | | | 2,610,000 | | | | 2,935,493 | |
Chicago IL O’Hare International Airport Senior Lien (Airport Revenue, AGM Insured) | | | 5.13 | | | | 1-1-2031 | | | | 3,335,000 | | | | 3,746,973 | |
Chicago IL O’Hare International Airport Senior Lien (Airport Revenue) | | | 5.25 | | | | 1-1-2032 | | | | 8,755,000 | | | | 9,697,914 | |
Chicago IL O’Hare International Airport Senior Lien Series B (Airport Revenue) | | | 5.00 | | | | 1-1-2030 | | | | 8,000,000 | | | | 8,931,840 | |
Chicago IL O’Hare International Airport Third Lien Series A (Airport Revenue, AGM Insured) | | | 5.00 | | | | 1-1-2033 | | | | 1,000,000 | | | | 1,038,680 | |
Chicago IL O’Hare International Airport Third Lien Series C (Airport Revenue, AGC Insured) | | | 5.25 | | | | 1-1-2025 | | | | 4,075,000 | | | | 4,439,183 | |
Chicago IL O’Hare International Airport Third Lien Series F (Airport Revenue) | | | 4.25 | | | | 1-1-2021 | | | | 735,000 | | | | 782,518 | |
Chicago IL Park District Series A (GO Revenue) | | | 5.00 | | | | 1-1-2036 | | | | 2,150,000 | | | | 2,249,588 | |
Chicago IL Park District Series B (GO Revenue) | | | 5.00 | | | | 1-1-2021 | | | | 3,765,000 | | | | 4,118,383 | |
| | | | | | |
| Portfolio of investments—December 31, 2016 (unaudited) | | Wells Fargo Intermediate Tax/AMT-Free Fund | | | 7 | |
| | | | | | | | | | | | | | | | |
| Security name | | Interest rate | | | Maturity date | | | Principal | | | Value | |
| | | | |
| Illinois (continued) | | | | | | | | | | | | | | | | |
Chicago IL Park District Series C (GO Revenue) | | | 5.00 | % | | | 1-1-2022 | | | $ | 1,515,000 | | | $ | 1,674,802 | |
Chicago IL Public Building Commission School Reform (Miscellaneous Revenue, National Insured) | | | 5.25 | | | | 12-1-2017 | | | | 3,555,000 | | | | 3,645,190 | |
Chicago IL Sales Tax Refunding Bond (Tax Revenue) | | | 5.00 | | | | 1-1-2025 | | | | 615,000 | | | | 634,170 | |
Chicago IL Sales Tax Refunding Bond (Tax Revenue) | | | 5.00 | | | | 1-1-2026 | | | | 5,140,000 | | | | 5,529,149 | |
Chicago IL Sales Tax Refunding Bond (Tax Revenue) | | | 5.00 | | | | 1-1-2027 | | | | 3,000,000 | | | | 3,218,580 | |
Chicago IL Sales Tax Refunding Bond (Tax Revenue) | | | 5.00 | | | | 1-1-2030 | | | | 2,075,000 | | | | 2,186,843 | |
Chicago IL Second Lien (Water & Sewer Revenue) | | | 5.00 | | | | 11-1-2022 | | | | 1,730,000 | | | | 1,923,847 | |
Chicago IL Second Lien (Water & Sewer Revenue) | | | 5.00 | | | | 11-1-2023 | | | | 1,155,000 | | | | 1,276,471 | |
Chicago IL Second Lien (Water & Sewer Revenue) | | | 5.00 | | | | 11-1-2025 | | | | 500,000 | | | | 548,565 | |
Chicago IL Second Lien (Water & Sewer Revenue) | | | 5.00 | | | | 11-1-2026 | | | | 2,000,000 | | | | 2,193,140 | |
Chicago IL Second Lien (Water & Sewer Revenue) | | | 5.00 | | | | 11-1-2028 | | | | 3,000,000 | | | | 3,260,010 | |
Chicago IL Second Lien (Water & Sewer Revenue) | | | 5.00 | | | | 11-1-2033 | | | | 1,000,000 | | | | 1,086,970 | |
Chicago IL Second Lien Project (Water & Sewer Revenue) | | | 5.00 | | | | 11-1-2029 | | | | 1,490,000 | | | | 1,613,387 | |
Chicago IL Second Lien Series A (Water & Sewer Revenue, Ambac Insured) | | | 5.00 | | | | 11-1-2032 | | | | 10,000,000 | | | | 10,025,400 | |
Chicago IL Series A (GO Revenue) | | | 5.00 | | | | 1-1-2027 | | | | 1,000,000 | | | | 965,650 | |
Chicago IL Series A (GO Revenue, Ambac Insured) | | | 5.00 | | | | 1-1-2019 | | | | 2,500,000 | | | | 2,505,125 | |
Chicago IL Series A (GO Revenue) | | | 5.00 | | | | 1-1-2025 | | | | 750,000 | | | | 736,913 | |
Chicago IL Series A (GO Revenue) | | | 5.25 | | | | 1-1-2022 | | | | 4,020,000 | | | | 4,009,709 | |
Chicago IL Series A (GO Revenue) | | | 5.25 | | | | 1-1-2023 | | | | 4,475,000 | | | | 4,443,451 | |
Chicago IL Series A (GO Revenue) | | | 5.25 | | | | 1-1-2028 | | | | 1,750,000 | | | | 1,707,195 | |
Chicago IL Series A (GO Revenue, Build America Mutual Assurance Company Insured) | | | 5.25 | | | | 1-1-2037 | | | | 4,750,000 | | | | 4,896,728 | |
Chicago IL Series C (GO Revenue) ¤ | | | 0.00 | | | | 1-1-2023 | | | | 2,500,000 | | | | 1,744,000 | |
Chicago IL Series C (GO Revenue) | | | 4.00 | | | | 1-1-2020 | | | | 1,505,000 | | | | 1,484,502 | |
Chicago IL Series C (GO Revenue) | | | 5.00 | | | | 1-1-2024 | | | | 3,695,000 | | | | 3,658,493 | |
Chicago IL Series C (GO Revenue) | | | 5.00 | | | | 1-1-2026 | | | | 5,000,000 | | | | 4,886,700 | |
Chicago IL Series G (GO Revenue, Ambac Insured) | | | 5.00 | | | | 12-1-2024 | | | | 16,865,000 | | | | 16,913,374 | |
Chicago IL Series J (GO Revenue, Ambac Insured) | | | 5.00 | | | | 12-1-2023 | | | | 365,000 | | | | 366,048 | |
Chicago IL Transit Authority Capital Grant Federal Transit Administration Section 5307-A (Transportation Revenue, AGC Insured) | | | 5.25 | | | | 6-1-2022 | | | | 500,000 | | | | 517,420 | |
Chicago IL Transit Authority Capital Grant Federal Transit Administration Section 5309-A (Transportation Revenue, AGC Insured) | | | 6.00 | | | | 6-1-2024 | | | | 2,000,000 | | | | 2,178,460 | |
Chicago IL Transit Authority Sales Tax Receipts (Tax Revenue) | | | 5.25 | | | | 12-1-2027 | | | | 2,600,000 | | | | 2,843,958 | |
Chicago IL Unrefunded Balance (GO Revenue, AGM Insured) | | | 5.00 | | | | 1-1-2024 | | | | 35,000 | | | | 35,282 | |
Chicago IL Waste Water Transmission Second Lien (Water & Sewer Revenue) | | | 5.00 | | | | 1-1-2022 | | | | 1,340,000 | | | | 1,471,481 | |
Chicago IL Waste Water Transmission Second Lien (Water & Sewer Revenue) | | | 5.00 | | | | 1-1-2023 | | | | 1,935,000 | | | | 2,119,193 | |
Chicago IL Waste Water Transmission Second Lien (Water & Sewer Revenue) | | | 5.00 | | | | 1-1-2024 | | | | 2,000,000 | | | | 2,177,740 | |
Chicago IL Waste Water Transmission Second Lien (Water & Sewer Revenue) | | | 5.00 | | | | 1-1-2032 | | | | 1,000,000 | | | | 1,075,720 | |
Chicago IL Waste Water Transmission Second Lien (Water & Sewer Revenue) | | | 5.00 | | | | 1-1-2033 | | | | 1,000,000 | | | | 1,071,270 | |
Chicago IL Waste Water Transmission Second Lien (Water & Sewer Revenue) | | | 5.00 | | | | 1-1-2034 | | | | 1,000,000 | | | | 1,066,840 | |
Chicago IL Waste Water Transmission Second Lien Series B (Water & Sewer Revenue, National Insured) | | | 5.00 | | | | 1-1-2030 | | | | 2,000,000 | | | | 2,003,360 | |
Cook County IL Community College District #508 (GO Revenue) | | | 5.25 | | | | 12-1-2025 | | | | 1,250,000 | | | | 1,384,838 | |
Cook County IL Community College District #508 (GO Revenue) | | | 5.25 | | | | 12-1-2027 | | | | 1,295,000 | | | | 1,425,225 | |
Cook County IL Community College District #508 (GO Revenue) | | | 5.25 | | | | 12-1-2028 | | | | 1,250,000 | | | | 1,368,475 | |
Cook County IL Community College District #508 (GO Revenue) | | | 5.25 | | | | 12-1-2030 | | | | 3,000,000 | | | | 3,272,100 | |
Cook County IL Community College District #508 (GO Revenue) | | | 5.25 | | | | 12-1-2031 | | | | 3,200,000 | | | | 3,473,824 | |
Cook County IL Series A (GO Revenue) | | | 5.25 | | | | 11-15-2022 | | | | 7,240,000 | | | | 7,915,058 | |
Cook County IL Series A (GO Revenue) | | | 5.25 | | | | 11-15-2023 | | | | 7,680,000 | | | | 8,361,062 | |
| | | | |
| 8 | | Wells Fargo Intermediate Tax/AMT-Free Fund | | Portfolio of investments—December 31, 2016 (unaudited) |
| | | | | | | | | | | | | | | | |
| Security name | | Interest rate | | | Maturity date | | | Principal | | | Value | |
| | | | |
| Illinois (continued) | | | | | | | | | | | | | | | | |
Cook County IL Series A (GO Revenue) | | | 5.25 | % | | | 11-15-2024 | | | $ | 2,200,000 | | | $ | 2,422,882 | |
Cook County IL Series B (GO Revenue) | | | 5.00 | | | | 11-15-2023 | | | | 600,000 | | | | 658,830 | |
Cook County IL Series C (GO Revenue) | | | 5.00 | | | | 11-15-2021 | | | | 1,340,000 | | | | 1,479,213 | |
Cook County IL Series C (GO Revenue) | | | 5.00 | | | | 11-15-2024 | | | | 2,175,000 | | | | 2,413,837 | |
Cook County IL Series C (GO Revenue) | | | 5.00 | | | | 11-15-2025 | | | | 2,450,000 | | | | 2,695,784 | |
DuPage County IL High School District (GO Revenue, AGM Insured) | | | 5.00 | | | | 1-1-2021 | | | | 1,000,000 | | | | 1,001,400 | |
DuPage, Cook & Will Counties IL Community College District #502 Series A (GO Revenue) | | | 5.00 | | | | 6-1-2022 | | | | 2,650,000 | | | | 3,005,710 | |
Homer, Glen, Will & Cook Village Counties IL Series A (GO Revenue) | | | 4.00 | | | | 12-1-2019 | | | | 1,000,000 | | | | 1,056,710 | |
Homer, Glen, Will & Cook Village Counties IL Series A (GO Revenue) | | | 5.00 | | | | 12-1-2021 | | | | 1,015,000 | | | | 1,096,362 | |
Huntley IL Special Service Area #9 (Tax Revenue, AGC Insured) | | | 4.60 | | | | 3-1-2017 | | | | 325,000 | | | | 325,910 | |
Illinois (GO Revenue) | | | 4.75 | | | | 4-1-2020 | | | | 2,650,000 | | | | 2,683,443 | |
Illinois (GO Revenue, AGM Insured) | | | 5.00 | | | | 1-1-2023 | | | | 2,450,000 | | | | 2,547,510 | |
Illinois (Tax Revenue) | | | 5.00 | | | | 6-15-2023 | | | | 16,050,000 | | | | 18,240,023 | |
Illinois (Miscellaneous Revenue) | | | 5.00 | | | | 7-1-2023 | | | | 5,000,000 | | | | 5,181,000 | |
Illinois (Miscellaneous Revenue) | | | 5.00 | | | | 8-1-2025 | | | | 1,000,000 | | | | 1,018,570 | |
Illinois (GO Revenue, AGM Insured) | | | 5.00 | | | | 4-1-2026 | | | | 5,000,000 | | | | 5,324,800 | |
Illinois (Miscellaneous Revenue) | | | 5.50 | | | | 7-1-2026 | | | | 2,300,000 | | | | 2,396,186 | |
Illinois Education Facilities Authority (Miscellaneous Revenue) ± | | | 3.40 | | | | 11-1-2036 | | | | 1,275,000 | | | | 1,290,160 | |
Illinois Education Facilities Authority Field Museum (Miscellaneous Revenue) ± | | | 4.13 | | | | 11-1-2036 | | | | 4,560,000 | | | | 4,641,487 | |
Illinois Finance Authority Student Housing Illinois State University Project (Education Revenue) | | | 5.50 | | | | 4-1-2021 | | | | 3,920,000 | | | | 4,105,416 | |
Illinois Finance Authority Wesleyan University (Education Revenue) | | | 5.00 | | | | 9-1-2026 | | | | 680,000 | | | | 770,590 | |
Illinois Municipal Electric Agency Power Supply (Utilities Revenue, National Insured) | | | 5.25 | | | | 2-1-2024 | | | | 2,500,000 | | | | 2,509,575 | |
Illinois Municipal Electric Agency Power Supply Series A (Utilities Revenue, National/FGIC Insured) | | | 5.25 | | | | 2-1-2023 | | | | 1,100,000 | | | | 1,104,213 | |
Illinois Regional Transportation Authority (Tax Revenue, AGM Insured) | | | 5.75 | | | | 6-1-2018 | | | | 6,790,000 | | | | 7,210,165 | |
Illinois Regional Transportation Authority (Tax Revenue, National Insured) | | | 6.50 | | | | 7-1-2026 | | | | 7,815,000 | | | | 9,996,088 | |
Illinois Sales Tax Build Illinois Bond (Tax Revenue) | | | 5.00 | | | | 6-15-2029 | | | | 1,000,000 | | | | 1,083,940 | |
Illinois Series A (GO Revenue) | | | 5.00 | | | | 4-1-2023 | | | | 4,500,000 | | | | 4,662,765 | |
Illinois Series A (GO Revenue, AGM Insured) | | | 5.00 | | | | 4-1-2024 | | | | 2,500,000 | | | | 2,671,900 | |
Illinois Series A (Tax Revenue) | | | 5.00 | | | | 1-1-2027 | | | | 10,625,000 | | | | 10,676,319 | |
Illinois Series B (Tax Revenue) | | | 5.00 | | | | 6-15-2018 | | | | 175,000 | | | | 184,581 | |
Illinois Sports Facilities Authority (Tax Revenue, AGM Insured) | | | 5.25 | | | | 6-15-2030 | | | | 4,000,000 | | | | 4,414,520 | |
Illinois Sports Facilities Authority State Tax Supported Refunding Bonds (Tax Revenue, AGM Insured) | | | 5.00 | | | | 6-15-2028 | | | | 2,500,000 | | | | 2,738,625 | |
Illinois Sports Facilities Authority State Tax Supported Refunding Bonds (Tax Revenue, AGM Insured) | | | 5.25 | | | | 6-15-2032 | | | | 3,000,000 | | | | 3,284,250 | |
Illinois Toll Highway Authority Series A-1 (Transportation Revenue) | | | 5.25 | | | | 1-1-2026 | | | | 3,500,000 | | | | 3,807,475 | |
Illinois Unrefunded Balance Series B (Tax Revenue) | | | 5.00 | | | | 6-15-2018 | | | | 825,000 | | | | 864,815 | |
Kane, Cook & DuPage Counties IL School District #46 Prerefunded Balance Series B (GO Revenue) | | | 4.50 | | | | 1-1-2024 | | | | 1,170,000 | | | | 1,315,712 | |
Kane, Cook & DuPage Counties IL School District #46 Unrefunded Balance Series B (GO Revenue) | | | 4.50 | | | | 1-1-2024 | | | | 3,100,000 | | | | 3,399,026 | |
Kane, McHenry, Cook & DeKalb Counties IL Unified School District (GO Revenue, Ambac Insured) | | | 5.00 | | | | 1-1-2024 | | | | 2,000,000 | | | | 2,000,240 | |
Kendall, Kane & Will Counties IL Unified School District Series A (GO Revenue) | | | 5.00 | | | | 2-1-2023 | | | | 1,000,000 | | | | 1,105,180 | |
McHenry & Kane Counties IL Community Consolidated School District #158 (GO Revenue) | | | 5.63 | | | | 1-15-2031 | | | | 2,000,000 | | | | 2,269,460 | |
McHenry & Lake Counties IL Community Consolidated School District #26 (GO Revenue, AGM Insured) | | | 5.00 | | | | 2-1-2020 | | | | 1,455,000 | | | | 1,574,048 | |
| | | | | | |
| Portfolio of investments—December 31, 2016 (unaudited) | | Wells Fargo Intermediate Tax/AMT-Free Fund | | | 9 | |
| | | | | | | | | | | | | | | | |
| Security name | | Interest rate | | | Maturity date | | | Principal | | | Value | |
| | | | |
| Illinois (continued) | | | | | | | | | | | | | | | | |
Northern IIlinois Municipal Power Agency Prairie State Project Series A (Utilities Revenue, National Insured) | | | 5.00 | % | | | 1-1-2021 | | | $ | 2,740,000 | | | $ | 2,846,559 | |
Northern Illinois University Board of Trustees Auxiliary Facilities (Education Revenue, AGM Insured) | | | 5.00 | | | | 4-1-2019 | | | | 1,000,000 | | | | 1,063,010 | |
Northern Illinois University Board of Trustees Certificate of Participation (Education Revenue, AGM Insured) | | | 5.00 | | | | 9-1-2022 | | | | 1,325,000 | | | | 1,466,523 | |
Northern Illinois University Board of Trustees Certificate of Participation (Education Revenue, AGM Insured) | | | 5.00 | | | | 9-1-2024 | | | | 1,000,000 | | | | 1,122,950 | |
Southwestern Illinois Development Authority Local Government Program Collinsville Limited (Tax Revenue) | | | 5.00 | | | | 3-1-2025 | | | | 1,950,000 | | | | 1,569,341 | |
Springfield IL Senior Lien (Utilities Revenue, National Insured) | | | 5.00 | | | | 3-1-2022 | | | | 3,600,000 | | | | 3,625,308 | |
Springfield IL Senior Lien (Utilities Revenue, National Insured) | | | 5.00 | | | | 3-1-2023 | | | | 1,560,000 | | | | 1,570,967 | |
Tazewell County IL School District #51 (GO Revenue, National Insured) | | | 9.00 | | | | 12-1-2017 | | | | 455,000 | | | | 484,975 | |
Tazewell County IL School District #51 (GO Revenue, National Insured) | | | 9.00 | | | | 12-1-2018 | | | | 535,000 | | | | 604,598 | |
University of Illinois Auxiliary Facilities Systems (Education Revenue) ¤ | | | 0.00 | | | | 4-1-2020 | | | | 8,270,000 | | | | 7,582,184 | |
University of Illinois Auxiliary Facilities Systems Series A (Education Revenue, Ambac Insured) | | | 5.50 | | | | 4-1-2024 | | | | 1,000,000 | | | | 1,187,800 | |
University of Illinois Board of Trustees Certificate of Participation Prerefunded Series B (Miscellaneous Revenue, AGM Insured) | | | 5.00 | | | | 10-1-2020 | | | | 1,045,000 | | | | 1,076,611 | |
University of Illinois Board of Trustees Certificate of Participation Unrefunded Series B (Miscellaneous Revenue, AGM Insured) | | | 5.00 | | | | 10-1-2020 | | | | 955,000 | | | | 981,091 | |
Will County IL Community Unified School District CAB (GO Revenue, National Insured) ¤ | | | 0.00 | | | | 11-1-2018 | | | | 9,730,000 | | | | 9,363,179 | |
| | | | |
| | | | | | | | | | | | | | | 380,017,076 | |
| | | | | | | | | | | | | | | | |
| | | | |
| Indiana: 1.63% | | | | | | | | | | | | | | | | |
Indiana Bond Bank Hendricks Regional Health Series A (Miscellaneous Revenue) | | | 4.00 | | | | 8-1-2017 | | | | 1,000,000 | | | | 1,016,080 | |
Indiana Bond Bank Special Program Series A (Utilities Revenue) | | | 5.00 | | | | 10-15-2017 | | | | 5,410,000 | | | | 5,545,737 | |
Indiana Bond Bank Special Program Series A (Miscellaneous Revenue, AGM Insured) | | | 5.00 | | | | 9-1-2022 | | | | 1,545,000 | | | | 1,741,802 | |
Indiana Finance Authority Clean Water Act Project Series A (Water & Sewer Revenue) | | | 5.00 | | | | 10-1-2031 | | | | 1,035,000 | | | | 1,181,804 | |
Indiana Finance Authority Parkview Health System Series A (Health Revenue) | | | 5.50 | | | | 5-1-2024 | | | | 4,500,000 | | | | 4,871,925 | |
Indiana Finance Authority Southern Indiana Gas & Electric Company Project Series D (Utilities Revenue) ± | | | 1.95 | | | | 3-1-2024 | | | | 4,000,000 | | | | 4,022,600 | |
Indiana Finance Authority Stadium Project Series A (Miscellaneous Revenue) | | | 5.25 | | | | 2-1-2028 | | | | 2,000,000 | | | | 2,365,740 | |
Indiana Finance Authority Wastewater Utilities CWA Authority Project Series A (Water & Sewer Revenue) | | | 5.00 | | | | 10-1-2030 | | | | 2,315,000 | | | | 2,648,545 | |
Indianapolis IN Local Public Improvement Bond Bank Series E (Miscellaneous Revenue) | | | 5.00 | | | | 1-1-2027 | | | | 760,000 | | | | 905,570 | |
Indianapolis IN Local Public Improvement Bond Bank Series E (Miscellaneous Revenue) | | | 5.00 | | | | 1-1-2028 | | | | 1,000,000 | | | | 1,184,490 | |
Indianapolis IN Local Public Improvement Bond Bank Series E (Miscellaneous Revenue) | | | 5.00 | | | | 1-1-2029 | | | | 735,000 | | | | 864,808 | |
Indianapolis IN Local Public Improvement Bond Bank Series E (Miscellaneous Revenue) | | | 5.00 | | | | 1-1-2030 | | | | 1,375,000 | | | | 1,598,795 | |
Indianapolis IN Local Public Improvement Bond Bank Series E (Miscellaneous Revenue) | | | 5.00 | | | | 1-1-2031 | | | | 1,000,000 | | | | 1,158,480 | |
Indianapolis IN Local Public Improvement Bond Bank Series E (Miscellaneous Revenue) | | | 5.00 | | | | 1-1-2033 | | | | 1,545,000 | | | | 1,774,062 | |
Indianapolis IN Local Public Improvement Bond Bank Series E (Miscellaneous Revenue) | | | 5.00 | | | | 1-1-2034 | | | | 2,000,000 | | | | 2,286,400 | |
Jeffersonville IN Building Corporation First Mortgage Series C (Miscellaneous Revenue) | | | 4.25 | | | | 8-15-2017 | | | | 210,000 | | | | 210,901 | |
| | | | |
| 10 | | Wells Fargo Intermediate Tax/AMT-Free Fund | | Portfolio of investments—December 31, 2016 (unaudited) |
| | | | | | | | | | | | | | | | |
| Security name | | Interest rate | | | Maturity date | | | Principal | | | Value | |
| | | | |
| Indiana (continued) | | | | | | | | | | | | | | | | |
Knox County IN EDA Series A (Health Revenue) | | | 5.00 | % | | | 4-1-2022 | | | $ | 925,000 | | | $ | 999,888 | |
Knox County IN EDA Series A (Health Revenue) | | | 5.00 | | | | 4-1-2023 | | | | 665,000 | | | | 714,443 | |
Knox County IN EDA Series A (Health Revenue) | | | 5.00 | | | | 4-1-2026 | | | | 750,000 | | | | 794,835 | |
Mount Vernon IN School Building Corporation Prerefunded Balance First Mortgage (Miscellaneous Revenue, AGM Insured) | | | 5.00 | | | | 7-15-2019 | | | | 265,000 | | | | 275,735 | |
Mount Vernon IN School Building Corporation Unrefunded Balance First Mortgage (Miscellaneous Revenue, AGM Insured) | | | 5.00 | | | | 7-15-2019 | | | | 735,000 | | | | 764,547 | |
University of Southern Indiana Student Fee Series J (Education Revenue, AGC Insured) | | | 5.00 | | | | 10-1-2019 | | | | 1,000,000 | | | | 1,083,560 | |
Valparaiso IN Multi-Schools Building Corporation (Miscellaneous Revenue) | | | 5.00 | | | | 7-15-2024 | | | | 750,000 | | | | 875,385 | |
| | | | |
| | | | | | | | | | | | | | | 38,886,132 | |
| | | | | | | | | | | | | | | | |
| | | | |
| Iowa: 0.89% | | | | | | | | | | | | | | | | |
Altoona IA Annual Appropriation Urban Renewal Refunding Bond (GO Revenue) | | | 5.00 | | | | 6-1-2027 | | | | 2,310,000 | | | | 2,675,327 | |
Iowa Finance Authority Midwestern Disaster Area Project (Industrial Development Revenue, Korea Development Bank LOC) ø | | | 0.95 | | | | 4-1-2022 | | | | 3,000,000 | | | | 3,000,000 | |
Iowa Higher Education Loan Authority Private College Facility RAN (Education Revenue) | | | 1.00 | | | | 9-1-2018 | | | | 7,000,000 | | | | 6,903,260 | |
Iowa Student Loan Liquidity Corporation Series 1 (Education Revenue) | | | 5.25 | | | | 12-1-2017 | | | | 3,000,000 | | | | 3,096,330 | |
Iowa Student Loan Liquidity Corporation Series 1 (Education Revenue) | | | 5.25 | | | | 12-1-2018 | | | | 5,285,000 | | | | 5,606,592 | |
| | | | |
| | | | | | | | | | | | | | | 21,281,509 | |
| | | | | | | | | | | | | | | | |
| | | | |
| Kansas: 0.24% | | | | | | | | | | | | | | | | |
Kansas Development Finance Authority Agro-Defense Facility Series G (Miscellaneous Revenue) | | | 5.00 | | | | 4-1-2030 | | | | 2,650,000 | | | | 2,969,246 | |
Kansas Development Finance Authority Health Facilities Series F (Health Revenue) | | | 5.00 | | | | 11-15-2021 | | | | 1,300,000 | | | | 1,466,725 | |
Wyandotte County & Kansas City KS Sales Tax Special Obligation Vacation Village Project Area 4 - Major Multi-Sport Athletic Complex Project CAB Series 2015 (Tax Revenue) 144A¤ | | | 0.00 | | | | 9-1-2034 | | | | 4,180,000 | | | | 1,317,996 | |
| | | | |
| | | | | | | | | | | | | | | 5,753,967 | |
| | | | | | | | | | | | | | | | |
| | | | |
| Kentucky: 0.50% | | | | | | | | | | | | | | | | |
Kentucky EDFA Series B2 (Health Revenue) ± | | | 1.32 | | | | 2-1-2046 | | | | 1,250,000 | | | | 1,234,263 | |
Kentucky Public Transportation Infrastructure Authority Downtown Crossing Project CAB Series B (Transportation Revenue) ¤ | | | 0.00 | | | | 7-1-2020 | | | | 1,000,000 | | | | 888,150 | |
Kentucky Public Transportation Infrastructure Authority Downtown Crossing Project CAB Series B (Transportation Revenue) ¤ | | | 0.00 | | | | 7-1-2021 | | | | 2,750,000 | | | | 2,338,215 | |
Kentucky Public Transportation Infrastructure Authority Downtown Crossing Project CAB Series B (Transportation Revenue) ¤ | | | 0.00 | | | | 7-1-2022 | | | | 4,320,000 | | | | 3,504,168 | |
Kentucky Public Transportation Infrastructure Authority Downtown Crossing Project CAB Series B (Transportation Revenue) ¤ | | | 0.00 | | | | 7-1-2025 | | | | 1,020,000 | | | | 698,557 | |
Kentucky Public Transportation Infrastructure Authority Downtown Crossing Project CAB Series B (Transportation Revenue) ¤ | | | 0.00 | | | | 7-1-2029 | | | | 1,400,000 | | | | 789,404 | |
University of Kentucky Certificate of Participation Master Street Lease #4 (Miscellaneous Revenue) | | | 4.45 | | | | 6-18-2018 | | | | 2,438,396 | | | | 2,498,453 | |
| | | | |
| | | | | | | | | | | | | | | 11,951,210 | |
| | | | | | | | | | | | | | | | |
| | | | |
| Louisiana: 0.92% | | | | | | | | | | | | | | | | |
Lafayette LA Communications System (Miscellaneous Revenue, AGM Insured) | | | 5.00 | | | | 11-1-2025 | | | | 1,500,000 | | | | 1,732,095 | |
Louisiana Correctional Facilities Corporation (Miscellaneous Revenue, Ambac Insured) | | | 5.00 | | | | 9-1-2019 | | | | 1,000,000 | | | | 1,081,090 | |
| | | | | | |
| Portfolio of investments—December 31, 2016 (unaudited) | | Wells Fargo Intermediate Tax/AMT-Free Fund | | | 11 | |
| | | | | | | | | | | | | | | | |
| Security name | | Interest rate | | | Maturity date | | | Principal | | | Value | |
| | | | |
| Louisiana (continued) | | | | | | | | | | | | | | | | |
Louisiana Local Government Environmental Facilities & CDA East Baton Rouge Series A (Water & Sewer Revenue) | | | 5.00 | % | | | 2-1-2030 | | | $ | 1,000,000 | | | $ | 1,124,760 | |
Louisiana Public Facilities Authority Black & Gold Facilities Project Series A (Housing Revenue, AGC Insured) | | | 4.25 | | | | 7-1-2017 | | | | 55,000 | | | | 55,917 | |
Louisiana Unclaimed Property Special Bond 1-49 South Project (Miscellaneous Revenue) | | | 5.00 | | | | 9-1-2026 | | | | 2,000,000 | | | | 2,309,320 | |
Louisiana Unclaimed Property Special Bond 1-49 South Project (Miscellaneous Revenue) | | | 5.00 | | | | 9-1-2027 | | | | 2,700,000 | | | | 3,101,274 | |
Louisiana Unclaimed Property Special Bond 1-49 South Project (Miscellaneous Revenue) | | | 5.00 | | | | 9-1-2028 | | | | 2,405,000 | | | | 2,744,033 | |
Louisiana Unclaimed Property Special Bond 1-49 South Project (Miscellaneous Revenue) | | | 5.00 | | | | 9-1-2029 | | | | 2,695,000 | | | | 3,061,062 | |
Louisiana Unclaimed Property Special Bond 1-49 South Project (Miscellaneous Revenue) | | | 5.00 | | | | 9-1-2030 | | | | 2,700,000 | | | | 3,054,375 | |
St. Bernard Parish LA Sales & Use Tax (Tax Revenue) | | | 4.00 | | | | 3-1-2023 | | | | 3,405,000 | | | | 3,647,674 | |
| | | | |
| | | | | | | | | | | | | | | 21,911,600 | |
| | | | | | | | | | | | | | | | |
| | | | |
| Maryland: 1.80% | | | | | | | | | | | | | | | | |
Maryland CDA Waverly View Apartments Series G (Housing Revenue) | | | 1.15 | | | | 2-1-2019 | | | | 5,000,000 | | | | 4,936,700 | |
Maryland Department of Housing & Community Development Calvin Mowbray & Stephen Camper Park Project Series E (Housing Revenue) 144A | | | 1.35 | | | | 1-1-2019 | | | | 5,000,000 | | | | 4,956,900 | |
Maryland Economic Development Corporation Salisbury University Project (Education Revenue) | | | 5.00 | | | | 6-1-2027 | | | | 500,000 | | | | 532,400 | |
Maryland Health & HEFAR John Hopkins Health System Series D (Health Revenue) ± | | | 1.24 | | | | 5-15-2038 | | | | 3,870,000 | | | | 3,879,714 | |
Maryland Series B (GO Revenue) | | | 4.00 | | | | 8-1-2023 | | | | 5,000,000 | | | | 5,612,250 | |
Maryland Series B (GO Revenue) | | | 4.00 | | | | 8-1-2024 | | | | 15,000,000 | | | | 16,929,900 | |
Maryland Series C (GO Revenue) | | | 5.00 | | | | 8-1-2022 | | | | 2,975,000 | | | | 3,469,415 | |
Westminster MD Educational Facilities McDaniel College (Education Revenue) | | | 5.00 | | | | 11-1-2026 | | | | 2,450,000 | | | | 2,781,118 | |
| | | | |
| | | | | | | | | | | | | | | 43,098,397 | |
| | | | | | | | | | | | | | | | |
| | | | |
| Massachusetts: 3.05% | | | | | | | | | | | | | | | | |
Boston MA Series A (GO Revenue) | | | 5.00 | | | | 4-1-2026 | | | | 5,790,000 | | | | 6,969,770 | |
Massachusetts Consolidate Loan Series D (GO Revenue) | | | 5.00 | | | | 9-1-2028 | | | | 10,000,000 | | | | 11,880,100 | |
Massachusetts Consolidate Loan Series I (Miscellaneous Revenue) | | | 5.00 | | | | 12-1-2030 | | | | 2,570,000 | | | | 3,071,433 | |
Massachusetts Consolidated Loan Series C (Tax Revenue, AGM Insured) | | | 5.25 | | | | 8-1-2025 | | | | 5,000,000 | | | | 5,127,050 | |
Massachusetts Consolidated Loan Series D-1 (Miscellaneous Revenue) ± | | | 1.05 | | | | 8-1-2043 | | | | 10,000,000 | | | | 9,678,500 | |
Massachusetts Development Finance Agency Lasell College (Education Revenue) | | | 5.00 | | | | 7-1-2021 | | | | 2,820,000 | | | | 3,043,739 | |
Massachusetts Development Finance Agency Merrimack College Series A (Education Revenue) | | | 5.00 | | | | 7-1-2021 | | | | 1,035,000 | | | | 1,120,222 | |
Massachusetts Development Finance Agency MFHR RTH Restoration Housing Limited Partnership (Housing Revenue, Bank of America NA LOC) | | | 1.05 | | | | 11-1-2017 | | | | 2,300,000 | | | | 2,295,469 | |
Massachusetts Development Finance Agency Sabis International Charter Series A (Education Revenue) | | | 6.55 | | | | 4-15-2020 | | | | 615,000 | | | | 699,495 | |
Massachusetts Educational Financing Authority Issue I (Education Revenue) | | | 5.50 | | | | 1-1-2018 | | | | 2,000,000 | | | | 2,083,000 | |
Massachusetts Educational Financing Authority Issue I Series A (Education Revenue) | | | 5.50 | | | | 1-1-2017 | | | | 2,000,000 | | | | 2,000,260 | |
Massachusetts HEFA Harvard University Series A (Education Revenue) | | | 5.00 | | | | 12-15-2029 | | | | 1,890,000 | | | | 2,081,003 | |
Massachusetts HEFA Various Partners Healthcare Series G-6 (Health Revenue) ± | | | 1.60 | | | | 7-1-2038 | | | | 14,000,000 | | | | 13,999,860 | |
Massachusetts Housing Finance Agency Multifamily Conduit Wood Ridge Homes Project Series A (Housing Revenue) ± | | | 1.05 | | | | 12-1-2017 | | | | 9,000,000 | | | | 8,992,980 | |
| | | | |
| | | | | | | | | | | | | | | 73,042,881 | |
| | | | | | | | | | | | | | | | |
| | | | |
| 12 | | Wells Fargo Intermediate Tax/AMT-Free Fund | | Portfolio of investments—December 31, 2016 (unaudited) |
| | | | | | | | | | | | | | | | |
| Security name | | Interest rate | | | Maturity date | | | Principal | | | Value | |
| | | | |
| Michigan: 4.05% | | | | | | | | | | | | | | | | |
Clinton MI Township Building Authority (Miscellaneous Revenue, Ambac Insured) | | | 5.50 | % | | | 11-1-2017 | | | $ | 1,475,000 | | | $ | 1,522,879 | |
Detroit MI Distributable State Aid (GO Revenue) | | | 5.00 | | | | 11-1-2018 | | | | 3,000,000 | | | | 3,109,950 | |
Detroit MI Distributable State Aid (GO Revenue) | | | 5.00 | | | | 11-1-2019 | | | | 1,500,000 | | | | 1,554,975 | |
Detroit MI Distributable State Aid (GO Revenue) | | | 5.00 | | | | 11-1-2020 | | | | 2,700,000 | | | | 2,798,955 | |
Eaton Rapids MI Public Schools (GO Revenue, Qualified School Board Loan Fund Insured) | | | 5.00 | | | | 5-1-2022 | | | | 1,785,000 | | | | 2,032,758 | |
Flint MI International Academy (Education Revenue) | | | 5.38 | | | | 10-1-2022 | | | | 2,270,000 | | | | 2,285,118 | |
Flint MI International Academy (Education Revenue) | | | 5.50 | | | | 10-1-2027 | | | | 1,985,000 | | | | 1,991,352 | |
Flint MI International Academy Public School Project (Education Revenue) | | | 5.00 | | | | 10-1-2017 | | | | 95,000 | | | | 95,523 | |
Great Lakes MI Water Authority Sewage Disposal System Series C (Water & Sewer Revenue) | | | 5.00 | | | | 7-1-2030 | | | | 3,350,000 | | | | 3,747,511 | |
Hazel Park MI School District (GO Revenue, AGM/Qualified School Board Loan Fund Insured) | | | 5.00 | | | | 5-1-2020 | | | | 1,160,000 | | | | 1,277,926 | |
Kent County MI (GO Revenue) | | | 5.00 | | | | 1-1-2025 | | | | 1,000,000 | | | | 1,062,870 | |
Kent County MI Limited Tax Capital Improvement Bond (GO Revenue) | | | 5.00 | | | | 6-1-2030 | | | | 1,040,000 | | | | 1,224,496 | |
Macomb MI Interceptor Drainage (Miscellaneous Revenue) | | | 5.00 | | | | 5-1-2024 | | | | 1,750,000 | | | | 1,907,535 | |
Macomb MI Interceptor Drainage (Miscellaneous Revenue) | | | 5.00 | | | | 5-1-2025 | | | | 1,750,000 | | | | 1,905,750 | |
Macomb MI Interceptor Drainage (Miscellaneous Revenue) | | | 5.00 | | | | 5-1-2026 | | | | 1,930,000 | | | | 2,101,133 | |
Michigan Comprehensive Transportation Program (Tax Revenue) | | | 5.25 | | | | 5-15-2017 | | | | 2,750,000 | | | | 2,791,085 | |
Michigan Finance Authority (Health Revenue) | | | 5.00 | | | | 11-15-2023 | | | | 400,000 | | | | 455,372 | |
Michigan Finance Authority (Health Revenue) | | | 5.00 | | | | 11-15-2026 | | | | 800,000 | | | | 896,152 | |
Michigan Finance Authority Limited Obligation Public School Academy Cesar Chavez Academy Project (Education Revenue) | | | 5.00 | | | | 2-1-2022 | | | | 2,540,000 | | | | 2,574,519 | |
Michigan Finance Authority Local Government Loan Program Series C (Health Revenue) | | | 5.00 | | | | 11-1-2022 | | | | 2,070,000 | | | | 2,191,136 | |
Michigan Finance Authority Local Government Loan Program Series D (Water & Sewer Revenue, National Insured) | | | 5.00 | | | | 7-1-2025 | | | | 1,000,000 | | | | 1,142,880 | |
Michigan Finance Authority Local Government Loan Program Series D (Water & Sewer Revenue) | | | 5.00 | | | | 7-1-2030 | | | | 12,000,000 | | | | 13,312,320 | |
Michigan Finance Authority Local Government Loan Program Series D (Water & Sewer Revenue, AGM Insured) | | | 5.00 | | | | 7-1-2035 | | | | 2,750,000 | | | | 3,033,470 | |
Michigan Finance Authority Local Government Loan Program Series D (Water & Sewer Revenue, AGM Insured) | | | 5.00 | | | | 7-1-2037 | | | | 2,000,000 | | | | 2,193,680 | |
Michigan Finance Authority Local Government Loan Program Series F (Tax Revenue) | | | 4.00 | | | | 10-1-2024 | | | | 3,000,000 | | | | 3,097,860 | |
Michigan Grant Anticipation Refunding Bond (Miscellaneous Revenue) | | | 5.00 | | | | 3-15-2027 | | | | 3,000,000 | | | | 3,564,780 | |
Michigan Municipal Bond Authority Local Government Loan Program Series B Group A (Miscellaneous Revenue, Ambac Insured) | | | 5.00 | | | | 12-1-2018 | | | | 1,075,000 | | | | 1,083,933 | |
Michigan Public Educational Facilities Authority Limited Obligation Chandler Park Academy (Miscellaneous Revenue) | | | 5.60 | | | | 11-1-2018 | | | | 415,000 | | | | 415,585 | |
Michigan Public Educational Facilities Authority Limited Obligation Nataki Talibah (Miscellaneous Revenue) (s)(i) | | | 6.25 | | | | 10-1-2023 | | | | 815,000 | | | | 244,345 | |
Michigan Strategic Fund Limited Obligation Cadillac Place Office Building Project (Miscellaneous Revenue) | | | 5.25 | | | | 10-15-2025 | | | | 4,165,000 | | | | 4,703,368 | |
Michigan Strategic Fund Limited Obligation Events Center Project Series A (Tax Revenue) ± | | | 4.13 | | | | 7-1-2045 | | | | 11,500,000 | | | | 11,643,750 | |
Pinckney MI Community School District (GO Revenue, Qualified School Board Loan Fund Insured) | | | 5.00 | | | | 5-1-2025 | | | | 2,040,000 | | | | 2,346,938 | |
Pinckney MI Community School District (GO Revenue, Qualified School Board Loan Fund Insured) | | | 5.00 | | | | 5-1-2026 | | | | 2,505,000 | | | | 2,863,390 | |
Southfield MI 2015 Street Improvement (GO Revenue) | | | 4.00 | | | | 5-1-2025 | | | | 1,490,000 | | | | 1,618,259 | |
| | | | | | |
| Portfolio of investments—December 31, 2016 (unaudited) | | Wells Fargo Intermediate Tax/AMT-Free Fund | | | 13 | |
| | | | | | | | | | | | | | | | |
| Security name | | Interest rate | | | Maturity date | | | Principal | | | Value | |
| | | | |
| Michigan (continued) | | | | | | | | | | | | | | | | |
Southfield MI Public Schools (GO Revenue, National/Qualified School Board Loan Fund Insured) | | | 4.38 | % | | | 5-1-2025 | | | $ | 4,000,000 | | | $ | 4,039,160 | |
Western Michigan University Board of Trustees (Education Revenue) | | | 5.25 | | | | 11-15-2027 | | | | 600,000 | | | | 694,074 | |
Western Michigan University Board of Trustees (Education Revenue) | | | 5.25 | | | | 11-15-2029 | | | | 1,000,000 | | | | 1,141,900 | |
Western Michigan University Board of Trustees (Education Revenue, AGM Insured) | | | 5.25 | | | | 11-15-2033 | | | | 750,000 | | | | 848,633 | |
Western Townships MI Utilities Authority (GO Revenue) | | | 5.00 | | | | 1-1-2017 | | | | 1,500,000 | | | | 1,500,165 | |
| | | | |
| | | | | | | | | | | | | | | 97,015,485 | |
| | | | | | | | | | | | | | | | |
| | | | |
| Minnesota: 0.31% | | | | | | | | | | | | | | | | |
Minneapolis & St. Paul MN Metropolitan Airports Commission Sub Series B (Airport Revenue, National Insured) | | | 5.00 | | | | 1-1-2018 | | | | 4,555,000 | | | | 4,555,501 | |
St. Louis Park MN Nicollett Health Services Series C (Health Revenue) | | | 5.50 | | | | 7-1-2023 | | | | 2,500,000 | | | | 2,659,625 | |
St. Paul MN Housing & RDA Hmong Academy Project Series A (Education Revenue) | | | 5.50 | | | | 9-1-2018 | | | | 200,000 | | | | 200,332 | |
| | | | |
| | | | | | | | | | | | | | | 7,415,458 | |
| | | | | | | | | | | | | | | | |
| | | | |
| Mississippi: 0.82% | | | | | | | | | | | | | | | | |
Mississippi Development Bank Special Obligation Jackson Public School District Project Series A (Miscellaneous Revenue) | | | 5.00 | | | | 4-1-2020 | | | | 1,000,000 | | | | 1,093,160 | |
Mississippi Development Bank Special Obligation Jackson Water & Sewer System Project (Water & Sewer Revenue, AGM Insured) | | | 6.00 | | | | 12-1-2023 | | | | 1,145,000 | | | | 1,378,786 | |
Mississippi Development Bank Special Obligation Jackson Water & Sewer System Project Series A (Water & Sewer Revenue, AGM Insured) | | | 5.00 | | | | 9-1-2030 | | | | 10,000,000 | | | | 11,190,000 | |
Mississippi Development Bank Special Obligation Walnut Grove Correctional Facility Project (Miscellaneous Revenue) | | | 5.00 | | | | 8-1-2026 | | | | 5,000,000 | | | | 5,857,200 | |
| | | | |
| | | | | | | | | | | | | | | 19,519,146 | |
| | | | | | | | | | | | | | | | |
| | | | |
| Missouri: 0.30% | | | | | | | | | | | | | | | | |
Kansas City MO Municipal Assistance Corporation Series B-1 (Miscellaneous Revenue, Ambac Insured) ¤ | | | 0.00 | | | | 4-15-2022 | | | | 3,640,000 | | | | 3,114,202 | |
Manchester MO Highway 141 Manchester Road Project (Tax Revenue) | | | 6.00 | | | | 11-1-2025 | | | | 430,000 | | | | 436,360 | |
Maryland Heights MO South Heights Redevelopment Project A (Tax Revenue) | | | 5.50 | | | | 9-1-2018 | | | | 260,000 | | | | 262,366 | |
Poplar Bluff MO School District (Miscellaneous Revenue, AGM Insured) | | | 5.00 | | | | 3-1-2032 | | | | 1,500,000 | | | | 1,684,965 | |
Poplar Bluff MO School District (Miscellaneous Revenue, AGM Insured) | | | 5.00 | | | | 3-1-2034 | | | | 1,000,000 | | | | 1,113,780 | |
St. Louis MO Lambert St. Louis International Airport Series A-1 (Airport Revenue) | | | 6.00 | | | | 7-1-2019 | | | | 415,000 | | | | 457,467 | |
| | | | |
| | | | | | | | | | | | | | | 7,069,140 | |
| | | | | | | | | | | | | | | | |
| | | | |
| Nebraska: 0.13% | | | | | | | | | | | | | | | | |
Lincoln County NE Hospital Authority Great Plains Regional Medical Center (Health Revenue) | | | 5.00 | | | | 11-1-2024 | | | | 1,000,000 | | | | 1,109,160 | |
Municipal Energy Agency of Nebraska Series A (Utilities Revenue, BHAC Insured) | | | 5.00 | | | | 4-1-2019 | | | | 500,000 | | | | 538,385 | |
Nebraska Central Plains Energy Project #3 (Utilities Revenue) | | | 5.00 | | | | 9-1-2027 | | | | 1,290,000 | | | | 1,403,185 | |
| | | | |
| | | | | | | | | | | | | | | 3,050,730 | |
| | | | | | | | | | | | | | | | |
| | | | |
| Nevada: 1.43% | | | | | | | | | | | | | | | | |
Clark County NV Airport Series C (Airport Revenue, AGM Insured) | | | 5.00 | | | | 7-1-2023 | | | | 5,600,000 | | | | 6,038,816 | |
Clark County NV Airport Series D (Airport Revenue) | | | 5.00 | | | | 7-1-2024 | | | | 2,750,000 | | | | 2,995,988 | |
Clark County NV Refunding Bond Series B (GO Revenue) | | | 5.00 | | | | 11-1-2028 | | | | 5,000,000 | | | | 5,978,600 | |
Clark County NV Water Reclamation District (GO Revenue) | | | 5.00 | | | | 7-1-2027 | | | | 4,155,000 | | | | 4,902,692 | |
Clark County NV Water Reclamation District Series A (GO Revenue) | | | 5.25 | | | | 7-1-2038 | | | | 2,880,000 | | | | 3,148,790 | |
| | | | |
| 14 | | Wells Fargo Intermediate Tax/AMT-Free Fund | | Portfolio of investments—December 31, 2016 (unaudited) |
| | | | | | | | | | | | | | | | |
| Security name | | Interest rate | | | Maturity date | | | Principal | | | Value | |
| | | | |
| Nevada (continued) | | | | | | | | | | | | | | | | |
Las Vegas NV New Convention & Visitors Authority Series E (Tax Revenue, AGM Insured) | | | 4.20 | % | | | 7-1-2021 | | | $ | 500,000 | | | $ | 532,840 | |
Las Vegas NV Series A (GO Revenue) | | | 5.00 | | | | 5-1-2031 | | | | 1,985,000 | | | | 2,261,431 | |
Las Vegas NV Series C (GO Revenue) | | | 5.00 | | | | 9-1-2030 | | | | 1,000,000 | | | | 1,167,980 | |
Las Vegas NV Special Improvement District #607 (Miscellaneous Revenue) | | | 4.00 | | | | 6-1-2019 | | | | 720,000 | | | | 731,678 | |
Las Vegas NV Special Improvement District #607 (Miscellaneous Revenue) | | | 4.00 | | | | 6-1-2020 | | | | 600,000 | | | | 613,734 | |
Las Vegas NV Special Improvement District #607 (Miscellaneous Revenue) | | | 4.00 | | | | 6-1-2021 | | | | 785,000 | | | | 807,278 | |
Las Vegas NV Special Improvement District #607 (Miscellaneous Revenue) | | | 4.25 | | | | 6-1-2024 | | | | 200,000 | | | | 202,100 | |
Las Vegas NV Valley Water District Series B (GO Revenue) | | | 5.00 | | | | 6-1-2030 | | | | 1,945,000 | | | | 2,290,043 | |
Reno NV Sparks Indian Governmental Colony (Miscellaneous Revenue, U.S. Bank NA LOC) | | | 5.00 | | | | 6-1-2021 | | | | 2,580,000 | | | | 2,586,940 | |
| | | | |
| | | | | | | | | | | | | | | 34,258,910 | |
| | | | | | | | | | | | | | | | |
| | | | |
| New Hampshire: 0.07% | | | | | | | | | | | | | | | | |
New Hampshire HFA Single Family Mortgage Acquisition Series E & F (Housing Revenue) | | | 4.80 | | | | 7-1-2028 | | | | 1,610,000 | | | | 1,661,633 | |
| | | | | | | | | | | | | | | | |
| | | | |
| New Jersey: 4.70% | | | | | | | | | | | | | | | | |
Essex County NJ Import Authority Series A (Miscellaneous Revenue) | | | 6.00 | | | | 11-1-2025 | | | | 5,000,000 | | | | 5,189,300 | |
Garden NJ Open Space & Farmland Preservation Refunding Bonds Series A (Tax Revenue) | | | 4.00 | | | | 11-1-2017 | | | | 930,000 | | | | 946,433 | |
Middlesex County NJ (GO Revenue) | | | 2.00 | | | | 6-1-2024 | | | | 1,845,000 | | | | 1,805,259 | |
New Jersey EDA Cigarette Tax Refunding Bonds (Tobacco Revenue) | | | 5.00 | | | | 6-15-2021 | | | | 2,500,000 | | | | 2,696,025 | |
New Jersey EDA Motor Vehicle Surcharges Series A (Miscellaneous Revenue, National Insured) | | | 5.25 | | | | 7-1-2026 | | | | 2,860,000 | | | | 3,217,357 | |
New Jersey EDA School Facilities Construction Refunding Bond Series NN (Miscellaneous Revenue) | | | 5.00 | | | | 3-1-2021 | | | | 15,035,000 | | | | 15,924,771 | |
New Jersey EDA School Facilities Construction Refunding Bond Series NN (Miscellaneous Revenue) | | | 5.00 | | | | 3-1-2023 | | | | 3,000,000 | | | | 3,169,230 | |
New Jersey EDA School Facilities Construction Refunding Bond Series PP (Miscellaneous Revenue) | | | 5.00 | | | | 6-15-2026 | | | | 8,380,000 | | | | 8,664,333 | |
New Jersey Educational Facilities Authority (Miscellaneous Revenue) | | | 5.00 | | | | 6-15-2026 | | | | 3,015,000 | | | | 3,117,299 | |
New Jersey HEFAR Student Assistance Authority Series A (Education Revenue) | | | 5.00 | | | | 6-1-2017 | | | | 2,000,000 | | | | 2,028,220 | |
New Jersey HEFAR Student Assistance Authority Series A (Education Revenue) | | | 5.00 | | | | 6-1-2019 | | | | 9,860,000 | | | | 10,503,168 | |
New Jersey Sports & Exposition Authority (Miscellaneous Revenue, National Insured) | | | 5.50 | | | | 3-1-2022 | | | | 1,755,000 | | | | 2,066,881 | |
New Jersey TTFA Series A (Miscellaneous Revenue) | | | 5.00 | | | | 6-15-2020 | | | | 4,000,000 | | | | 4,219,960 | |
New Jersey TTFA Series A (Transportation Revenue) | | | 5.25 | | | | 12-15-2020 | | | | 1,305,000 | | | | 1,392,722 | |
New Jersey TTFA Series A (Miscellaneous Revenue) | | | 5.25 | | | | 6-15-2024 | | | | 1,695,000 | | | | 1,801,395 | |
New Jersey TTFA Series A-1 and A-2 (Transportation Revenue) | | | 5.00 | | | | 6-15-2022 | | | | 4,750,000 | | | | 5,116,273 | |
New Jersey TTFA Series C (Transportation Revenue) | | | 5.25 | | | | 6-15-2032 | | | | 2,500,000 | | | | 2,571,975 | |
New Jersey TTFA Series DC8033 (Transportation Revenue, Dexia Credit Local LOC, AGM Insured, Dexia Credit Local LIQ) 144Aø | | | 0.84 | | | | 12-15-2022 | | | | 19,775,000 | | | | 19,775,000 | |
New Jersey TTFA Unrefunded Balance (Transportation Revenue, National Insured) | | | 5.25 | | | | 12-15-2021 | | | | 6,000,000 | | | | 6,590,640 | |
South Jersey NJ Port Corporation Marine Terminal Refunding Bond Series S (Airport Revenue) | | | 5.00 | | | | 1-1-2028 | | | | 2,130,000 | | | | 2,187,489 | |
South Jersey NJ Port Corporation Marine Terminal Refunding Bond Series S (Airport Revenue) | | | 5.00 | | | | 1-1-2029 | | | | 2,200,000 | | | | 2,251,238 | |
Trenton City NJ (GO Revenue, Build America Mutual Assurance Company Insured) | | | 5.00 | | | | 12-1-2022 | | | | 1,630,000 | | | | 1,829,675 | |
Trenton City NJ (GO Revenue, Build America Mutual Assurance Company Insured) | | | 5.00 | | | | 12-1-2024 | | | | 1,775,000 | | | | 2,032,499 | |
Trenton City NJ (GO Revenue, Build America Mutual Assurance Company Insured) | | | 5.00 | | | | 12-1-2025 | | | | 1,860,000 | | | | 2,141,046 | |
Trenton City NJ (GO Revenue, Build America Mutual Assurance Company Insured) | | | 5.00 | | | | 12-1-2026 | | | | 1,000,000 | | | | 1,144,180 | |
| | | | |
| | | | | | | | | | | | | | | 112,382,368 | |
| | | | | | | | | | | | | | | | |
| | | | | | |
| Portfolio of investments—December 31, 2016 (unaudited) | | Wells Fargo Intermediate Tax/AMT-Free Fund | | | 15 | |
| | | | | | | | | | | | | | | | |
| Security name | | Interest rate | | | Maturity date | | | Principal | | | Value | |
| | | | |
| New Mexico: 0.76% | | | | | | | | | | | | | | | | |
Albuquerque Bernalillo & Sandoval Counties NM Municipal School District #12 (GO Revenue) %% | | | 5.00 | % | | | 8-1-2025 | | | $ | 400,000 | | | $ | 476,368 | |
Albuquerque Bernalillo & Sandoval Counties NM Municipal School District #12 (GO Revenue) %% | | | 5.00 | | | | 8-1-2026 | | | | 1,205,000 | | | | 1,446,880 | |
Albuquerque Bernalillo County NM Water Utility Authority Series B (Water & Sewer Revenue) | | | 5.00 | | | | 7-1-2024 | | | | 1,000,000 | | | | 1,180,950 | |
Clayton NM Jail Project Improvement & Refunding Bonds (Miscellaneous Revenue, National Insured) | | | 5.00 | | | | 11-1-2028 | | | | 9,265,000 | | | | 10,364,014 | |
Clayton NM Jail Project Improvement & Refunding Bonds (Miscellaneous Revenue, National Insured) | | | 5.00 | | | | 11-1-2029 | | | | 1,000,000 | | | | 1,113,650 | |
New Mexico Mortgage Finance Authority SFMR Class I Series A (Housing Revenue, GNMA/FNMA/FHLMC Insured) | | | 4.63 | | | | 9-1-2025 | | | | 1,085,000 | | | | 1,119,850 | |
New Mexico Mortgage Finance Authority SFMR Class I Series B (Housing Revenue, GNMA/FNMA/FHLMC Insured) | | | 5.00 | | | | 3-1-2028 | | | | 425,000 | | | | 445,362 | |
New Mexico Municipal Energy Acquisition Authority Gas Supply Sub Series B (Utilities Revenue, Royal Bank of Canada SPA) ± | | | 1.16 | | | | 11-1-2039 | | | | 2,000,000 | | | | 1,987,760 | |
| | | | |
| | | | | | | | | | | | | | | 18,134,834 | |
| | | | | | | | | | | | | | | | |
| | | | |
| New York: 8.37% | | | | | | | | | | | | | | | | |
Dutchess County NY Local Development Corporation The Culinary Institute of America Project Series A-1 (Education Revenue) | | | 5.00 | | | | 7-1-2026 | | | | 625,000 | | | | 735,325 | |
Dutchess County NY Local Development Corporation The Culinary Institute of America Project Series A-1 (Education Revenue) | | | 5.00 | | | | 7-1-2027 | | | | 350,000 | | | | 408,454 | |
Dutchess County NY Local Development Corporation The Culinary Institute of America Project Series A-1 (Education Revenue) | | | 5.00 | | | | 7-1-2030 | | | | 365,000 | | | | 417,502 | |
Dutchess County NY Local Development Corporation The Culinary Institute of America Project Series A-1 (Education Revenue) | | | 5.00 | | | | 7-1-2041 | | | | 435,000 | | | | 482,537 | |
Hempstead Town NY Local Development Corporation The Academy Charter School Project Series A (Education Revenue) | | | 7.65 | | | | 2-1-2044 | | | | 2,720,000 | | | | 2,982,507 | |
Metropolitan Transportation Authority New York Dedicated Tax Fund Series A (Tax Revenue) | | | 5.00 | | | | 11-15-2024 | | | | 6,010,000 | | | | 6,930,732 | |
Metropolitan Transportation Authority New York Series A (Transportation Revenue) | | | 5.00 | | | | 11-15-2030 | | | | 4,010,000 | | | | 4,534,308 | |
Metropolitan Transportation Authority New York Series C (Transportation Revenue) | | | 5.25 | | | | 11-15-2028 | | | | 5,000,000 | | | | 5,891,000 | |
Metropolitan Transportation Authority New York Series C (Transportation Revenue) | | | 5.25 | | | | 11-15-2029 | | | | 11,100,000 | | | | 13,047,162 | |
Metropolitan Transportation Authority New York Series C (Transportation Revenue) | | | 5.25 | | | | 11-15-2030 | | | | 8,350,000 | | | | 9,789,874 | |
Metropolitan Transportation Authority New York Series C (Transportation Revenue) | | | 5.25 | | | | 11-15-2031 | | | | 4,500,000 | | | | 5,264,505 | |
Metropolitan Transportation Authority New York Series D (Transportation Revenue) | | | 5.00 | | | | 11-15-2027 | | | | 2,000,000 | | | | 2,263,080 | |
Metropolitan Transportation Authority New York Series F (Transportation Revenue) | | | 5.00 | | | | 11-15-2025 | | | | 2,490,000 | | | | 2,933,320 | |
Metropolitan Transportation Authority New York Series F (Transportation Revenue) | | | 5.00 | | | | 11-15-2028 | | | | 2,450,000 | | | | 2,770,338 | |
Monroe County NY Industrial Development Corporation Revenue Monroe Community College Project Series A (Education Revenue, AGM Insured) | | | 5.00 | | | | 1-15-2022 | | | | 790,000 | | | | 886,048 | |
Monroe County NY Industrial Development Corporation Revenue Monroe Community College Project Series A (Education Revenue, AGM Insured) | | | 5.00 | | | | 1-15-2023 | | | | 645,000 | | | | 733,552 | |
Monroe County NY Industrial Development Corporation Revenue Monroe Community College Project Series A (Education Revenue, AGM Insured) | | | 5.00 | | | | 1-15-2024 | | | | 905,000 | | | | 1,039,945 | |
| | | | |
| 16 | | Wells Fargo Intermediate Tax/AMT-Free Fund | | Portfolio of investments—December 31, 2016 (unaudited) |
| | | | | | | | | | | | | | | | |
| Security name | | Interest rate | | | Maturity date | | | Principal | | | Value | |
| | | | |
| New York (continued) | | | | | | | | | | | | | | | | |
Monroe County NY Industrial Development Corporation Revenue St. John Fisher College Project Series A (Education Revenue) | | | 5.00 | % | | | 6-1-2020 | | | $ | 2,125,000 | | | $ | 2,308,196 | |
Nassau NY Water Authority Series A (Water & Sewer Revenue) | | | 5.00 | | | | 4-1-2027 | | | | 350,000 | | | | 404,632 | |
Nassau NY Water Authority Series A (Water & Sewer Revenue) | | | 5.00 | | | | 4-1-2028 | | | | 300,000 | | | | 344,628 | |
Nassau NY Water Authority Series B (Water & Sewer Revenue) | | | 5.00 | | | | 4-1-2024 | | | | 400,000 | | | | 466,016 | |
Nassau NY Water Authority Series B (Water & Sewer Revenue) | | | 5.00 | | | | 4-1-2026 | | | | 755,000 | | | | 879,492 | |
New York City NY Transitional Finance Authority Sub Series 2B (Tax Revenue, Dexia Credit Local SPA) ø | | | 0.86 | | | | 11-1-2022 | | | | 2,540,000 | | | | 2,540,000 | |
New York Convention Center Development Corporation (Tax Revenue) | | | 5.00 | | | | 11-15-2028 | | | | 8,000,000 | | | | 9,312,000 | |
New York Dormitory Authority Interagency Council Pooled Loan Series A-1 (Miscellaneous Revenue) | | | 4.00 | | | | 7-1-2019 | | | | 740,000 | | | | 775,217 | |
New York Dormitory Authority Mount Sinai School of Medicine (Education Revenue) | | | 5.50 | | | | 7-1-2022 | | | | 2,000,000 | | | | 2,197,340 | |
New York Dormitory Authority North Shore-Long Island Jewish Obligated Group Series B (Health Revenue) ± | | | 1.32 | | | | 5-1-2018 | | | | 800,000 | | | | 800,440 | |
New York Dormitory Authority Series A (Tax Revenue) | | | 5.00 | | | | 3-15-2028 | | | | 5,000,000 | | | | 5,896,950 | |
New York Dormitory Authority Series A (Tax Revenue) | | | 5.00 | | | | 2-15-2031 | | | | 3,000,000 | | | | 3,547,830 | |
New York Dormitory Authority Series B (Tax Revenue, Ambac Insured) | | | 5.50 | | | | 3-15-2025 | | | | 3,885,000 | | | | 4,803,375 | |
New York Dormitory Authority State University Educational Facilities Series A (Miscellaneous Revenue) | | | 5.50 | | | | 5-15-2019 | | | | 3,675,000 | | | | 3,929,053 | |
New York Dormitory Authority United Health Hospitals (Health Revenue, FHA Insured) | | | 4.50 | | | | 8-1-2018 | | | | 1,500,000 | | | | 1,550,190 | |
New York NY Adjusted Fiscal 2014 Sub Series D-3 (GO Revenue, JPMorgan Chase & Company SPA) ø | | | 0.64 | | | | 8-1-2038 | | | | 2,775,000 | | | | 2,775,000 | |
New York NY Municipal Water Finance Authority Series GG (Water & Sewer Revenue) | | | 5.00 | | | | 6-15-2029 | | | | 1,645,000 | | | | 1,937,185 | |
New York NY Series B (GO Revenue) | | | 5.00 | | | | 12-1-2032 | | | | 2,000,000 | | | | 2,337,200 | |
New York NY Series C (GO Revenue) | | | 5.00 | | | | 8-1-2031 | | | | 5,000,000 | | | | 5,740,250 | |
New York NY Series C & D (GO Revenue) | | | 5.00 | | | | 8-1-2028 | | | | 3,000,000 | | | | 3,540,690 | |
New York NY Series J-4 (GO Revenue) ± | | | 1.27 | | | | 8-1-2025 | | | | 10,000,000 | | | | 10,003,600 | |
New York NY Transitional Finance Authority Prerefunded Balance Series A (Tax Revenue) | | | 5.00 | | | | 5-1-2023 | | | | 2,875,000 | | | | 3,109,284 | |
New York NY Transitional Finance Authority Series B (Tax Revenue) | | | 5.00 | | | | 8-1-2027 | | | | 1,115,000 | | | | 1,316,224 | |
New York NY Transitional Finance Authority Series C (Tax Revenue) | | | 5.00 | | | | 11-1-2027 | | | | 5,000,000 | | | | 5,893,950 | |
New York NY Transitional Finance Authority Sub Series 2A (Tax Revenue, Dexia Credit Local LIQ) ø | | | 0.85 | | | | 11-1-2022 | | | | 6,850,000 | | | | 6,850,000 | |
New York NY Transitional Finance Authority Sub Series B-1 (Tax Revenue) | | | 5.00 | | | | 11-1-2028 | | | | 1,000,000 | | | | 1,185,730 | |
New York NY Trust for Cultural Resources Series A-1 (Miscellaneous Revenue) | | | 5.00 | | | | 7-1-2031 | | | | 2,475,000 | | | | 2,720,198 | |
New York NY Water Finance Authority Sub Series BB-1 (Water & Sewer Revenue, Landesbank Hessen-Thüringen SPA) ø | | | 0.64 | | | | 6-15-2039 | | | | 6,500,000 | | | | 6,500,000 | |
New York Urban Development Corporation Certificate of Participation James A Farley Post Office Project (Miscellaneous Revenue) 144A## | | | 4.20 | | | | 2-1-2017 | | | | 14,910,000 | | | | 14,904,036 | |
New York Urban Development Corporation Personal Income Tax Series A (Tax Revenue) | | | 5.00 | | | | 3-15-2031 | | | | 3,815,000 | | | | 4,405,028 | |
New York Urban Development Corporation Personal income Tax Series A (Tax Revenue) | | | 5.00 | | | | 3-15-2032 | | | | 5,000,000 | | | | 5,847,400 | |
New York Urban Development Corporation Series D (Miscellaneous Revenue, AGC Insured) | | | 5.50 | | | | 1-1-2019 | | | | 3,000,000 | | | | 3,240,210 | |
Niagara NY Area Development Corporation (Education Revenue) | | | 5.00 | | | | 5-1-2020 | | | | 1,160,000 | | | | 1,249,796 | |
Niagara NY Area Development Corporation (Education Revenue) | | | 5.00 | | | | 5-1-2022 | | | | 1,350,000 | | | | 1,489,199 | |
Oyster Bay NY RAN (GO Revenue) | | | 3.75 | | | | 3-31-2017 | | | | 2,000,000 | | | | 2,004,580 | |
| | | | | | |
| Portfolio of investments—December 31, 2016 (unaudited) | | Wells Fargo Intermediate Tax/AMT-Free Fund | | | 17 | |
| | | | | | | | | | | | | | | | |
| Security name | | Interest rate | | | Maturity date | | | Principal | | | Value | |
| | | | |
| New York (continued) | | | | | | | | | | | | | | | | |
Port Authority New York & New Jersey Special Obligation (Airport Revenue) | | | 5.00 | % | | | 12-1-2020 | | | $ | 5,000,000 | | | $ | 5,493,250 | |
Suffolk NY Public Improvement Serial Bond Series A (GO Revenue, AGM Insured) | | | 3.00 | | | | 6-1-2019 | | | | 1,180,000 | | | | 1,217,052 | |
Suffolk NY Tobacco Asset Securitization Corporation Tobacco Settlement Series B (Tobacco Revenue) | | | 4.00 | | | | 6-1-2022 | | | | 420,000 | | | | 448,153 | |
Suffolk NY Tobacco Asset Securitization Corporation Tobacco Settlement Series B (Tobacco Revenue) | | | 5.00 | | | | 6-1-2023 | | | | 500,000 | | | | 553,735 | |
Troy NY Capital Resource Corporation Rensselaer Polytechnic Series B (Education Revenue) | | | 5.00 | | | | 9-1-2020 | | | | 1,430,000 | | | | 1,578,849 | |
Upper Mohawk Valley NY Regional Water Finance Authority Series A (Water & Sewer Revenue, AGC Insured) | | | 5.00 | | | | 4-1-2018 | | | | 435,000 | | | | 445,397 | |
Utility Debt Securitization Authority New York (Utilities Revenue) | | | 5.00 | | | | 12-15-2032 | | | | 1,250,000 | | | | 1,451,038 | |
Yonkers NY Series A (GO Revenue, AGM Insured) | | | 5.00 | | | | 10-1-2024 | | | | 1,000,000 | | | | 1,112,050 | |
| | | | |
| | | | | | | | | | | | | | | 200,214,632 | |
| | | | | | | | | | | | | | | | |
| | | | |
| North Carolina: 0.64% | | | | | | | | | | | | | | | | |
Craven County NC Certificate of Participation (Miscellaneous Revenue, National Insured) | | | 5.00 | | | | 6-1-2023 | | | | 4,400,000 | | | | 4,474,668 | |
New Hanover County NC Regional Medical Center (Health Revenue) | | | 5.00 | | | | 10-1-2020 | | | | 3,400,000 | | | | 3,763,630 | |
New Hanover County NC Regional Medical Center (Health Revenue) | | | 5.00 | | | | 10-1-2022 | | | | 250,000 | | | | 285,120 | |
New Hanover County NC Regional Medical Center (Health Revenue) | | | 5.00 | | | | 10-1-2023 | | | | 1,000,000 | | | | 1,150,390 | |
North Carolina Grant Anticipation Vehicle Bond (Miscellaneous Revenue) | | | 5.00 | | | | 3-1-2029 | | | | 2,470,000 | | | | 2,833,535 | |
Onslow County NC Limited Obligation Series A (Miscellaneous Revenue) | | | 4.00 | | | | 6-1-2022 | | | | 90,000 | | | | 98,350 | |
Pitt County NC Certificate of Participation School Facilities Project Prerefunded Balance (Miscellaneous Revenue, National Insured) | | | 5.00 | | | | 4-1-2023 | | | | 1,185,000 | | | | 1,197,407 | |
Pitt County NC Certificate of Participation School Facilities Project Unrefunded Balance (Miscellaneous Revenue, National Insured) | | | 5.00 | | | | 4-1-2023 | | | | 1,570,000 | | | | 1,586,438 | |
| | | | |
| | | | | | | | | | | | | | | 15,389,538 | |
| | | | | | | | | | | | | | | | |
| | | | |
| North Dakota: 0.23% | | | | | | | | | | | | | | | | |
Hazen ND Sakakawea Medical Center Project BAN (Health Revenue) | | | 2.50 | | | | 7-1-2017 | | | | 5,000,000 | | | | 5,005,100 | |
North Dakota Housing Finance Agency Series D (Housing Revenue) | | | 4.50 | | | | 1-1-2029 | | | | 590,000 | | | | 609,252 | |
| | | | |
| | | | | | | | | | | | | | | 5,614,352 | |
| | | | | | | | | | | | | | | | |
| | | | |
| Ohio: 1.54% | | | | | | | | | | | | | | | | |
Cincinnati OH City School District Improvement Project Certificate of Participation (Miscellaneous Revenue) | | | 5.00 | | | | 12-15-2024 | | | | 4,815,000 | | | | 5,552,417 | |
Cincinnati OH City School District Improvement Project Certificate of Participation (Miscellaneous Revenue) | | | 5.00 | | | | 12-15-2025 | | | | 2,095,000 | | | | 2,409,543 | |
Clermont County OH Port Authority West Clermont Local School District Project (Miscellaneous Revenue, Build America Mutual Assurance Company Insured) | | | 5.00 | | | | 12-1-2025 | | | | 500,000 | | | | 581,490 | |
Clermont County OH Port Authority West Clermont Local School District Project (Miscellaneous Revenue, Build America Mutual Assurance Company Insured) | | | 5.00 | | | | 12-1-2026 | | | | 600,000 | | | | 694,512 | |
Clermont County OH Port Authority West Clermont Local School District Project (Miscellaneous Revenue, Build America Mutual Assurance Company Insured) | | | 5.00 | | | | 12-1-2028 | | | | 1,250,000 | | | | 1,429,088 | |
Columbus OH Various Purposes Series 2 (GO Revenue) | | | 5.00 | | | | 7-1-2026 | | | | 1,775,000 | | | | 2,174,393 | |
Columbus OH Various Purposes Series A (GO Revenue) | | | 4.00 | | | | 8-15-2024 | | | | 1,190,000 | | | | 1,336,394 | |
JobsOhio Beverage System Statewide Liquor Profits Senior Lien Series A (Miscellaneous Revenue) | | | 5.00 | | | | 1-1-2022 | | | | 2,500,000 | | | | 2,832,425 | |
Kent University OH General Receipts Series B (Education Revenue, AGC Insured) | | | 5.00 | | | | 5-1-2018 | | | | 1,165,000 | | | | 1,222,644 | |
Ohio Air Quality Development Authority Series A (Utilities Revenue) ± | | | 3.75 | | | | 12-1-2023 | | | | 2,000,000 | | | | 836,940 | |
| | | | |
| 18 | | Wells Fargo Intermediate Tax/AMT-Free Fund | | Portfolio of investments—December 31, 2016 (unaudited) |
| | | | | | | | | | | | | | | | |
| Security name | | Interest rate | | | Maturity date | | | Principal | | | Value | |
| | | | |
| Ohio (continued) | | | | | | | | | | | | | | | | |
Ohio Air Quality Development Authority Series B (Industrial Development Revenue) ± | | | 3.63 | % | | | 10-1-2033 | | | $ | 1,750,000 | | | $ | 731,605 | |
Ohio Air Quality Development Authority Series B (Industrial Development Revenue) ± | | | 3.63 | | | | 12-1-2033 | | | | 2,500,000 | | | | 1,045,050 | |
Ohio Building Authority Series A (Miscellaneous Revenue) | | | 5.00 | | | | 10-1-2024 | | | | 1,000,000 | | | | 1,108,740 | |
Ohio Turnpike Commission Junior Lien Infrastructure Projects Series A-1 (Transportation Revenue) | | | 5.25 | | | | 2-15-2029 | | | | 1,000,000 | | | | 1,150,580 | |
Ohio Water Development Authority Pollution Control First Energy Nuclear Generation Project Series A (Water & Sewer Revenue) ± | | | 3.75 | | | | 6-1-2033 | | | | 10,000,000 | | | | 4,180,200 | |
Ohio Water Development Authority Pollution Control First Energy Nuclear Generation Project Series B (Industrial Development Revenue) ± | | | 3.63 | | | | 10-1-2033 | | | | 3,150,000 | | | | 1,316,889 | |
Ohio Water Development Authority Series A (Industrial Development Revenue) ± | | | 3.75 | | | | 7-1-2033 | | | | 15,000,000 | | | | 6,270,450 | |
RiverSouth Authority Ohio Lazarus Building Redevelopment Series A (Miscellaneous Revenue) | | | 5.75 | | | | 12-1-2027 | | | | 950,000 | | | | 971,898 | |
Summit County OH Port Authority University of Akron Student Housing Project (Education Revenue) | | | 5.25 | | | | 1-1-2024 | | | | 685,000 | | | | 776,441 | |
Summit County OH Port Authority University of Akron Student Housing Project (Education Revenue) | | | 5.25 | | | | 1-1-2024 | | | | 315,000 | | | | 348,179 | |
| | | | |
| | | | | | | | | | | | | | | 36,969,878 | |
| | | | | | | | | | | | | | | | |
| | | | |
| Oklahoma: 2.01% | | | | | | | | | | | | | | | | |
Carter County OK Public Facilities Authority Educational Facilities Plainview Public School Project (Miscellaneous Revenue) | | | 5.00 | | | | 12-1-2026 | | | | 1,000,000 | | | | 1,169,920 | |
Carter County OK Public Facilities Authority Educational Facilities Plainview Public School Project (Miscellaneous Revenue) | | | 5.00 | | | | 12-1-2027 | | | | 1,000,000 | | | | 1,162,620 | |
Carter County OK Public Facilities Authority Educational Facilities Plainview Public School Project (Miscellaneous Revenue) | | | 5.00 | | | | 12-1-2028 | | | | 1,285,000 | | | | 1,486,732 | |
Claremore OK Public Works Authority (Utilities Revenue) | | | 4.00 | | | | 6-1-2019 | | | | 1,325,000 | | | | 1,390,309 | |
Claremore OK Public Works Authority (Utilities Revenue) | | | 4.00 | | | | 6-1-2022 | | | | 2,595,000 | | | | 2,787,367 | |
Claremore OK Public Works Authority (Utilities Revenue) | | | 4.00 | | | | 6-1-2023 | | | | 1,010,000 | | | | 1,078,407 | |
Creek County OK Educational Facilities Sapulpa Public Schools Project (Miscellaneous Revenue) | | | 5.00 | | | | 9-1-2023 | | | | 3,000,000 | | | | 3,430,230 | |
Cushing OK Educational Facilities Authority (Miscellaneous Revenue) | | | 5.00 | | | | 9-1-2022 | | | | 2,210,000 | | | | 2,525,809 | |
Dewey County OK Educational Facilities Authority Seiling Public Schools Project (Miscellaneous Revenue) | | | 5.00 | | | | 9-1-2026 | | | | 1,230,000 | | | | 1,444,881 | |
Dewey County OK Educational Facilities Authority Seiling Public Schools Project (Miscellaneous Revenue) | | | 5.00 | | | | 9-1-2027 | | | | 1,240,000 | | | | 1,447,898 | |
Garvin County OK Educational Facilities Authority Lindsay Public Schools Project (Miscellaneous Revenue) | | | 5.00 | | | | 9-1-2018 | | | | 820,000 | | | | 863,862 | |
Garvin County OK Educational Facilities Authority Lindsay Public Schools Project (Miscellaneous Revenue) | | | 5.00 | | | | 9-1-2019 | | | | 860,000 | | | | 926,469 | |
Garvin County OK Educational Facilities Authority Lindsay Public Schools Project (Miscellaneous Revenue) | | | 5.00 | | | | 9-1-2020 | | | | 455,000 | | | | 497,411 | |
Garvin County OK Educational Facilities Authority Lindsay Public Schools Project (Miscellaneous Revenue) | | | 5.00 | | | | 9-1-2026 | | | | 1,000,000 | | | | 1,139,350 | |
Garvin County OK Educational Facilities Authority Lindsay Public Schools Project (Miscellaneous Revenue) | | | 5.00 | | | | 9-1-2027 | | | | 1,245,000 | | | | 1,412,764 | |
Grady County OK Educational FacilitiesTuttle Public Schools Project (Miscellaneous Revenue) | | | 5.00 | | | | 9-1-2023 | | | | 1,000,000 | | | | 1,145,390 | |
Grady County OK Educational FacilitiesTuttle Public Schools Project (Miscellaneous Revenue) | | | 5.00 | | | | 9-1-2024 | | | | 1,075,000 | | | | 1,240,636 | |
| | | | | | |
| Portfolio of investments—December 31, 2016 (unaudited) | | Wells Fargo Intermediate Tax/AMT-Free Fund | | | 19 | |
| | | | | | | | | | | | | | | | |
| Security name | | Interest rate | | | Maturity date | | | Principal | | | Value | |
| | | | |
| Oklahoma (continued) | | | | | | | | | | | | | | | | |
Grady County OK Educational FacilitiesTuttle Public Schools Project (Miscellaneous Revenue) | | | 5.00 | % | | | 9-1-2025 | | | $ | 500,000 | | | $ | 579,265 | |
Grady County OK Educational FacilitiesTuttle Public Schools Project (Miscellaneous Revenue) | | | 5.00 | | | | 9-1-2028 | | | | 1,160,000 | | | | 1,324,163 | |
McGee Creek OK Authority (Water & Sewer Revenue, National Insured) | | | 6.00 | | | | 1-1-2023 | | | | 1,310,000 | | | | 1,433,140 | |
Muskogee OK Industrial Trust Educational Facilities (Miscellaneous Revenue) | | | 5.00 | | | | 9-1-2020 | | | | 1,000,000 | | | | 1,085,130 | |
Muskogee OK Industrial Trust Educational Facilities (Miscellaneous Revenue) | | | 5.00 | | | | 9-1-2021 | | | | 1,000,000 | | | | 1,096,220 | |
Muskogee OK Industrial Trust Educational Facilities (Miscellaneous Revenue) | | | 5.00 | | | | 9-1-2022 | | | | 1,000,000 | | | | 1,105,710 | |
Oklahoma City OK Public Property Authority (Tax Revenue) | | | 5.00 | | | | 10-1-2026 | | | | 1,495,000 | | | | 1,730,149 | |
Oklahoma City OK Public Property Authority (Tax Revenue) | | | 5.00 | | | | 10-1-2027 | | | | 1,140,000 | | | | 1,311,946 | |
Oklahoma City OK Public Property Authority (Tax Revenue) | | | 5.00 | | | | 10-1-2028 | | | | 1,265,000 | | | | 1,447,173 | |
Oklahoma Development Finance Authority (Miscellaneous Revenue) | | | 4.00 | | | | 6-1-2023 | | | | 1,270,000 | | | | 1,387,856 | |
Oklahoma Development Finance Authority (Miscellaneous Revenue) | | | 5.00 | | | | 6-1-2023 | | | | 1,230,000 | | | | 1,416,837 | |
Oklahoma Development Finance Authority Higher Education Master Real Property Series B (Miscellaneous Revenue) | | | 4.00 | | | | 6-1-2024 | | | | 1,270,000 | | | | 1,389,101 | |
Tulsa OK Airports Improvement Trust Series D (Airport Revenue, Build America Mutual Assurance Company Insured) | | | 5.00 | | | | 6-1-2019 | | | | 1,500,000 | | | | 1,605,375 | |
Tulsa OK Airports Improvement Trust Series D (Airport Revenue, Build America Mutual Assurance Company Insured) | | | 5.00 | | | | 6-1-2021 | | | | 1,185,000 | | | | 1,284,054 | |
Tulsa OK Airports Improvement Trust Series D (Airport Revenue, Build America Mutual Assurance Company Insured) | | | 5.00 | | | | 6-1-2022 | | | | 520,000 | | | | 564,169 | |
Tulsa OK Airports Improvement Trust Series D (Airport Revenue, Build America Mutual Assurance Company Insured) | | | 5.00 | | | | 6-1-2025 | | | | 1,200,000 | | | | 1,292,676 | |
Tulsa OK Airports Improvement Trust Series D (Airport Revenue, Build America Mutual Assurance Company Insured) | | | 5.00 | | | | 6-1-2026 | | | | 1,250,000 | | | | 1,342,475 | |
Tulsa OK Airports Improvement Trust Series D (Airport Revenue, Build America Mutual Assurance Company Insured) | | | 5.00 | | | | 6-1-2027 | | | | 1,000,000 | | | | 1,070,740 | |
Tulsa OK Airports Improvement Trust Series D (Airport Revenue, Build America Mutual Assurance Company Insured) | | | 5.00 | | | | 6-1-2028 | | | | 500,000 | | | | 534,330 | |
| | | | |
| | | | | | | | | | | | | | | 48,150,564 | |
| | | | | | | | | | | | | | | | |
| | | | |
| Oregon: 0.38% | | | | | | | | | | | | | | | | |
Medford OR Hospital Facilities Authority (Health Revenue) | | | 5.00 | | | | 10-1-2020 | | | | 1,155,000 | | | | 1,264,494 | |
Oregon Facilities Authority Samaritan Health Services Project Series A (Health Revenue) | | | 5.00 | | | | 10-1-2026 | | | | 1,500,000 | | | | 1,703,055 | |
Washington County OR Full Faith & Credit Obligations Series B (GO Revenue) | | | 5.00 | | | | 3-1-2022 | | | | 5,345,000 | | | | 6,152,897 | |
| | | | |
| | | | | | | | | | | | | | | 9,120,446 | |
| | | | | | | | | | | | | | | | |
| | | | |
| Pennsylvania: 8.77% | | | | | | | | | | | | | | | | |
Adams County PA IDA Gettysburg College Project (Education Revenue) | | | 5.00 | | | | 8-15-2024 | | | | 1,500,000 | | | | 1,631,340 | |
Adams County PA IDA Gettysburg College Project (Education Revenue) | | | 5.00 | | | | 8-15-2025 | | | | 1,500,000 | | | | 1,626,990 | |
Allegheny County PA Hospital Development Authority Series B (Health Revenue, National Insured) | | | 6.00 | | | | 7-1-2025 | | | | 2,605,000 | | | | 3,238,614 | |
Allegheny County PA Moon Area School District Series A (GO Revenue) | | | 5.00 | | | | 11-15-2024 | | | | 3,400,000 | | | | 3,959,878 | |
Allegheny County PA Series 72 (GO Revenue) | | | 5.25 | | | | 12-1-2033 | | | | 4,000,000 | | | | 4,590,800 | |
Allegheny County PA Series 75 (GO Revenue) | | | 5.00 | | | | 11-1-2026 | | | | 2,500,000 | | | | 2,956,525 | |
Beaver County PA IDA FirstEnergy Generation Series B (Industrial Development Revenue) ± | | | 3.50 | | | | 12-1-2035 | | | | 5,000,000 | | | | 2,090,100 | |
Berks County PA Municipal Authority Reading Hospital & Medical Center Project Series B (Health Revenue) | | | 2.22 | | | | 11-1-2039 | | | | 10,000,000 | | | | 10,077,500 | |
| | | | |
| 20 | | Wells Fargo Intermediate Tax/AMT-Free Fund | | Portfolio of investments—December 31, 2016 (unaudited) |
| | | | | | | | | | | | | | | | |
| Security name | | Interest rate | | | Maturity date | | | Principal | | | Value | |
| | | | |
| Pennsylvania (continued) | | | | | | | | | | | | | | | | |
Bucks County PA Water & Sewer Authority Water System (Water & Sewer Revenue, AGM Insured) | | | 5.00 | % | | | 12-1-2026 | | | $ | 2,400,000 | | | $ | 2,679,408 | |
Central Dauphin PA School District (GO Revenue) | | | 5.00 | | | | 2-1-2029 | | | | 825,000 | | | | 961,241 | |
Central Dauphin PA School District (GO Revenue) | | | 5.00 | | | | 2-1-2030 | | | | 1,110,000 | | | | 1,282,716 | |
Central Greene PA School District Series B (GO Revenue, Build America Mutual Assurance Company Insured) | | | 5.00 | | | | 2-15-2019 | | | | 865,000 | | | | 922,998 | |
Chester County PA IDA Avon Grove Charter School Project Series A (Education Revenue) | | | 5.65 | | | | 12-15-2017 | | | | 100,000 | | | | 101,715 | |
Cumberland County PA Diakon Lutheran Social Ministries Project (Health Revenue) | | | 5.00 | | | | 1-1-2025 | | | | 1,340,000 | | | | 1,521,248 | |
Cumberland County PA Diakon Lutheran Social Ministries Project (Health Revenue) | | | 5.00 | | | | 1-1-2026 | | | | 1,370,000 | | | | 1,547,018 | |
Cumberland County PA Diakon Lutheran Social Ministries Project (Health Revenue) | | | 5.00 | | | | 1-1-2027 | | | | 1,225,000 | | | | 1,371,339 | |
Delaware County PA Vocational & Technical School Authority (Miscellaneous Revenue, Build America Mutual Assurance Company Insured) | | | 5.25 | | | | 11-1-2033 | | | | 2,000,000 | | | | 2,245,960 | |
Johnstown PA School District (GO Revenue, AGM Insured) | | | 5.00 | | | | 8-1-2024 | | | | 2,730,000 | | | | 3,019,162 | |
Lancaster County PA Solid Waste Management Authority Series A (Resource Recovery Revenue) | | | 5.25 | | | | 12-15-2028 | | | | 5,665,000 | | | | 6,449,772 | |
Lycoming County PA Authority Pennsylvania College of Technology (Education Revenue) | | | 5.50 | | | | 7-1-2026 | | | | 4,000,000 | | | | 4,522,640 | |
Millcreek Richland Joint Authority Pennsylvania Series B (Water & Sewer Revenue, AGC Insured) | | | 4.70 | | | | 8-1-2017 | | | | 195,000 | | | | 197,525 | |
Northeastern Pennsylvania Hospital & Education Authority Series A (Education Revenue) | | | 5.00 | | | | 3-1-2026 | | | | 515,000 | | | | 569,312 | |
Northeastern Pennsylvania Hospital & Education Authority Series A (Education Revenue) | | | 5.00 | | | | 3-1-2028 | | | | 660,000 | | | | 723,848 | |
Pennsylvania Certificate of Participation Retained Basic Lease Payment (Miscellaneous Revenue, AGM Insured) | | | 5.00 | | | | 11-1-2022 | | | | 3,015,000 | | | | 3,371,132 | |
Pennsylvania Certificate of Participation Retained Basic Lease Payment (Miscellaneous Revenue, AGM Insured) | | | 5.00 | | | | 11-1-2023 | | | | 1,900,000 | | | | 2,137,785 | |
Pennsylvania Certificate of Participation Retained Basic Lease Payment (Miscellaneous Revenue, AGM Insured) | | | 5.00 | | | | 11-1-2024 | | | | 1,660,000 | | | | 1,880,929 | |
Pennsylvania HEFAR Series AQ (Education Revenue) | | | 5.00 | | | | 6-15-2023 | | | | 6,090,000 | | | | 6,998,872 | |
Pennsylvania HEFAR Series AR (Education Revenue) | | | 5.00 | | | | 6-15-2025 | | | | 1,000,000 | | | | 1,169,520 | |
Pennsylvania HEFAR Series AS (Education Revenue) | | | 5.00 | | | | 6-15-2024 | | | | 1,530,000 | | | | 1,775,733 | |
Pennsylvania HEFAR Series AS (Education Revenue) | | | 5.00 | | | | 6-15-2025 | | | | 1,575,000 | | | | 1,841,994 | |
Pennsylvania HEFAR Series AS (Education Revenue) | | | 5.00 | | | | 6-15-2027 | | | | 2,190,000 | | | | 2,559,606 | |
Pennsylvania HEFAR Series LL1 (Education Revenue) | | | 5.00 | | | | 11-1-2019 | | | | 880,000 | | | | 908,090 | |
Pennsylvania HEFAR Series LL1 (Education Revenue) | | | 5.00 | | | | 11-1-2020 | | | | 590,000 | | | | 609,063 | |
Pennsylvania HEFAR Series LL1 (Education Revenue) | | | 5.00 | | | | 11-1-2022 | | | | 1,310,000 | | | | 1,347,951 | |
Pennsylvania Hills PA School District (GO Revenue, Build America Mutual Assurance Company Insured) | | | 4.00 | | | | 10-1-2021 | | | | 1,460,000 | | | | 1,538,066 | |
Pennsylvania Public School Building Authority (Miscellaneous Revenue) | | | 5.00 | | | | 4-1-2024 | | | | 2,000,000 | | | | 2,147,680 | |
Pennsylvania Public School Building Authority (Miscellaneous Revenue, Build America Mutual Assurance Company Insured) | | | 4.00 | | | | 5-15-2021 | | | | 500,000 | | | | 532,830 | |
Pennsylvania Public School Building Authority (Miscellaneous Revenue, Build America Mutual Assurance Company Insured) | | | 4.00 | | | | 5-15-2022 | | | | 1,000,000 | | | | 1,059,350 | |
Pennsylvania Public School Building Authority (Miscellaneous Revenue) | | | 5.00 | | | | 4-1-2020 | | | | 5,600,000 | | | | 5,983,880 | |
Pennsylvania Public School Building Authority (Education Revenue) | | | 5.00 | | | | 5-1-2023 | | | | 2,185,000 | | | | 2,486,770 | |
Pennsylvania Public School Building Authority (Education Revenue) | | | 5.00 | | | | 6-15-2025 | | | | 2,265,000 | | | | 2,576,619 | |
Pennsylvania Public School Building Authority (Miscellaneous Revenue) | | | 5.00 | | | | 4-1-2029 | | | | 1,000,000 | | | | 1,059,900 | |
Pennsylvania Public School Building Authority Series B (Miscellaneous Revenue, AGM Insured) | | | 5.00 | | | | 6-1-2029 | | | | 2,000,000 | | | | 2,223,060 | |
| | | | | | |
| Portfolio of investments—December 31, 2016 (unaudited) | | Wells Fargo Intermediate Tax/AMT-Free Fund | | | 21 | |
| | | | | | | | | | | | | | | | |
| Security name | | Interest rate | | | Maturity date | | | Principal | | | Value | |
| | | | |
| Pennsylvania (continued) | | | | | | | | | | | | | | | | |
Pennsylvania Public School Building Authority Series B-2 (Miscellaneous Revenue, Build America Mutual Assurance Company Insured) | | | 5.00 | % | | | 12-1-2024 | | | $ | 1,250,000 | | | $ | 1,441,038 | |
Pennsylvania Public School Building Authority Series B-2 (Miscellaneous Revenue, Build America Mutual Assurance Company Insured) | | | 5.00 | | | | 12-1-2025 | | | | 1,250,000 | | | | 1,453,638 | |
Pennsylvania Public School Building Authority Series B-2 (Miscellaneous Revenue, Build America Mutual Assurance Company Insured) | | | 5.00 | | | | 12-1-2026 | | | | 1,250,000 | | | | 1,449,613 | |
Pennsylvania Public School Building Authority Series B-2 (Miscellaneous Revenue, Build America Mutual Assurance Company Insured) | | | 5.00 | | | | 12-1-2027 | | | | 1,010,000 | | | | 1,165,591 | |
Pennsylvania Series 2 (GO Revenue) | | | 5.00 | | | | 4-15-2023 | | | | 2,000,000 | | | | 2,161,480 | |
Pennsylvania Turnpike Commission Sub Series B (Transportation Revenue) | | | 5.00 | | | | 6-1-2028 | | | | 3,000,000 | | | | 3,381,240 | |
Pennsylvania Turnpike Commission Sub Series B (Transportation Revenue) | | | 5.00 | | | | 6-1-2029 | | | | 7,000,000 | | | | 7,850,150 | |
Pennsylvania Turnpike Commission Sub Series C (Transportation Revenue, AGM Insured) | | | 6.25 | | | | 6-1-2033 | | | | 1,350,000 | | | | 1,678,793 | |
Pennsylvania Turnpike Commission Sub Series E (Transportation Revenue) | | | 6.38 | | | | 12-1-2038 | | | | 2,000,000 | | | | 2,345,320 | |
Philadelphia PA Authority for Industrial Development (Education Revenue) | | | 6.13 | | | | 6-15-2023 | | | | 1,305,000 | | | | 1,391,078 | |
Philadelphia PA Authority for Industrial Development (Education Revenue) | | | 5.88 | | | | 6-15-2022 | | | | 1,000,000 | | | | 1,060,160 | |
Philadelphia PA Authority for Industrial Development (Education Revenue) | | | 7.00 | | | | 5-1-2026 | | | | 740,000 | | | | 770,088 | |
Philadelphia PA Hospital & HEFAR Refunding Bond Temple University Health System Series B (Health Revenue) | | | 6.25 | | | | 7-1-2023 | | | | 1,475,000 | | | | 1,498,821 | |
Philadelphia PA IDA Master Charter School AID (Education Revenue) | | | 5.00 | | | | 8-1-2020 | | | | 420,000 | | | | 446,397 | |
Philadelphia PA IDA West Philadelphia Achievement Charter Elementary School Project (Education Revenue) | | | 6.25 | | | | 5-1-2021 | | | | 285,000 | | | | 292,570 | |
Philadelphia PA School District Refunding Bond Series C (GO Revenue) | | | 5.00 | | | | 9-1-2018 | | | | 8,065,000 | | | | 8,426,554 | |
Philadelphia PA School District Refunding Bond Series C (GO Revenue) | | | 5.00 | | | | 9-1-2021 | | | | 2,200,000 | | | | 2,406,646 | |
Philadelphia PA School District Refunding Bond Series D (GO Revenue) | | | 5.00 | | | | 9-1-2022 | | | | 3,750,000 | | | | 4,121,775 | |
Philadelphia PA School District Refunding Bond Series E (GO Revenue) | | | 5.25 | | | | 9-1-2021 | | | | 1,490,000 | | | | 1,600,931 | |
Philadelphia PA School District Refunding Bond Series F (GO Revenue) | | | 5.00 | | | | 9-1-2028 | | | | 5,000,000 | | | | 5,491,350 | |
Philadelphia PA School District Refunding Bond Series F (GO Revenue) | | | 5.00 | | | | 9-1-2029 | | | | 5,000,000 | | | | 5,458,900 | |
Philadelphia PA School District Refunding Bond Series F (GO Revenue) | | | 5.00 | | | | 9-1-2031 | | | | 1,240,000 | | | | 1,347,892 | |
Philadelphia PA School District Refunding Bond Series F (GO Revenue) | | | 5.00 | | | | 9-1-2032 | | | | 1,000,000 | | | | 1,081,990 | |
Philadelphia PA Series A (GO Revenue) | | | 5.00 | | | | 9-15-2021 | | | | 7,000,000 | | | | 7,874,160 | |
Philadelphia PA Series A (GO Revenue) | | | 5.00 | | | | 8-1-2024 | | | | 1,000,000 | | | | 1,151,120 | |
Philadelphia PA Series A (GO Revenue) | | | 5.00 | | | | 7-15-2026 | | | | 3,000,000 | | | | 3,406,230 | |
Philadelphia PA Series A (GO Revenue) | | | 5.25 | | | | 7-15-2028 | | | | 2,590,000 | | | | 2,974,719 | |
Philadelphia PA Series A (GO Revenue) | | | 5.25 | | | | 7-15-2029 | | | | 4,410,000 | | | | 5,051,611 | |
Philadelphia PA Series A (GO Revenue) | | | 5.25 | | | | 7-15-2032 | | | | 4,380,000 | | | | 4,971,563 | |
Pittsburgh PA Moon Area School District Series A (GO Revenue) | | | 5.00 | | | | 11-15-2029 | | | | 1,000,000 | | | | 1,130,060 | |
Pittsburgh PA Series A (GO Revenue) | | | 4.00 | | | | 9-1-2022 | | | | 1,000,000 | | | | 1,092,260 | |
Pittsburgh PA Series A (GO Revenue) | | | 5.00 | | | | 9-1-2022 | | | | 2,060,000 | | | | 2,359,091 | |
Pittsburgh PA Series A (GO Revenue) | | | 5.00 | | | | 9-1-2023 | | | | 3,810,000 | | | | 4,345,038 | |
Reading PA School District (GO Revenue) | | | 5.00 | | | | 4-1-2021 | | | | 3,120,000 | | | | 3,378,960 | |
State Public School Building Authority City of Harrisburg Project Series A (Miscellaneous Revenue, AGM Insured) | | | 5.00 | | | | 12-1-2028 | | | | 3,500,000 | | | | 4,014,115 | |
State Public School Building Authority City of Harrisburg Project Series A (Miscellaneous Revenue, AGM Insured) | | | 5.00 | | | | 12-1-2033 | | | | 4,425,000 | | | | 4,977,107 | |
State Public School Building Authority Pennsylvania Chester Upland School District Project Series B (Miscellaneous Revenue) | | | 5.25 | | | | 9-15-2030 | | | | 2,000,000 | | | | 2,186,700 | |
| | | | |
| | | | | | | | | | | | | | | 209,731,228 | |
| | | | | | | | | | | | | | | | |
| | | | |
| 22 | | Wells Fargo Intermediate Tax/AMT-Free Fund | | Portfolio of investments—December 31, 2016 (unaudited) |
| | | | | | | | | | | | | | | | |
| Security name | | Interest rate | | | Maturity date | | | Principal | | | Value | |
| | | | |
| Rhode Island: 0.19% | | | | | | | | | | | | | | | | |
Providence RI Series A (GO Revenue, AGM Insured) | | | 4.00 | % | | | 1-15-2018 | | | $ | 2,115,000 | | | $ | 2,165,041 | |
Rhode Island Health & Educational Building Corporation Providence Public Schools Financing Program Series A (Miscellaneous Revenue, AGM Insured) | | | 5.00 | | | | 5-15-2022 | | | | 2,425,000 | | | | 2,461,884 | |
| | | | |
| | | | | | | | | | | | | | | 4,626,925 | |
| | | | | | | | | | | | | | | | |
| | | | |
| South Carolina: 1.43% | | | | | | | | | | | | | | | | |
Connector 2000 Association Incorporated CAB Series A (Transportation Revenue) ¤ | | | 0.00 | | | | 1-1-2017 | | | | 35,996 | | | | 35,266 | |
Connector 2000 Association Incorporated CAB Series A (Transportation Revenue) ¤ | | | 0.00 | | | | 1-1-2018 | | | | 39,781 | | | | 35,792 | |
Laurens County SC Education Assistance for District #55 (Miscellaneous Revenue) | | | 5.00 | | | | 12-1-2021 | | | | 1,000,000 | | | | 1,116,650 | |
Laurens County SC Education Assistance for District #55 (Miscellaneous Revenue) | | | 5.00 | | | | 12-1-2022 | | | | 1,250,000 | | | | 1,412,725 | |
Laurens County SC Education Assistance for District #55 (Miscellaneous Revenue) | | | 5.00 | | | | 12-1-2025 | | | | 1,000,000 | | | | 1,156,950 | |
Piedmont SC Municipal Power Agency Series A-3 (Utilities Revenue) | | | 5.25 | | | | 1-1-2019 | | | | 3,500,000 | | | | 3,632,650 | |
Scago SC Educational Facilities Corporation For Sumter County School District 17 (Miscellaneous Revenue) | | | 4.00 | | | | 12-1-2019 | | | | 1,000,000 | | | | 1,049,400 | |
Scago SC Educational Facilities Corporation For Sumter County School District 17 (Miscellaneous Revenue) | | | 5.00 | | | | 12-1-2022 | | | | 1,720,000 | | | | 1,924,628 | |
South Carolina Education Assistance Authority Student Loan Series I (Education Revenue) | | | 5.00 | | | | 10-1-2024 | | | | 2,500,000 | | | | 2,621,750 | |
South Carolina Jobs EDA Furman University Project (Education Revenue) | | | 5.00 | | | | 10-1-2028 | | | | 700,000 | | | | 815,087 | |
South Carolina Jobs EDA Furman University Project (Education Revenue) | | | 5.00 | | | | 10-1-2030 | | | | 1,885,000 | | | | 2,174,800 | |
South Carolina Jobs EDA Furman University Project (Education Revenue) | | | 5.00 | | | | 10-1-2031 | | | | 2,155,000 | | | | 2,479,155 | |
South Carolina Jobs EDA York Preparatory Academy Project Series A (Education Revenue) | | | 7.00 | | | | 11-1-2033 | | | | 1,000,000 | | | | 1,066,830 | |
South Carolina Public Service Authority Series A (Utilities Revenue) | | | 5.00 | | | | 12-1-2037 | | | | 12,215,000 | | | | 13,611,907 | |
University of South Carolina Athletic Facilities Series A (Education Revenue) | | | 5.00 | | | | 5-1-2027 | | | | 855,000 | | | | 1,016,569 | |
| | | | |
| | | | | | | | | | | | | | | 34,150,159 | |
| | | | | | | | | | | | | | | | |
| | | | |
| South Dakota: 0.04% | | | | | | | | | | | | | | | | |
Rapid City SD Airport Project (Airport Revenue) | | | 6.25 | | | | 12-1-2026 | | | | 920,000 | | | | 993,674 | |
| | | | | | | | | | | | | | | | |
| | | | |
| Tennessee: 0.29% | | | | | | | | | | | | | | | | |
Chattanooga TN Health Educational & Housing Facilities University of Tennessee at Chattanooga Project (Housing Revenue) | | | 5.00 | | | | 10-1-2023 | | | | 750,000 | | | | 831,728 | |
Franklin County TN HEFA (Education Revenue) | | | 4.00 | | | | 9-1-2024 | | | | 250,000 | | | | 269,150 | |
Franklin County TN HEFA (Education Revenue) | | | 5.00 | | | | 9-1-2030 | | | | 560,000 | | | | 626,640 | |
Shelby County TN Health Educational & Housing Facilities Board Le Bonheur Children’s Medical Center Series D (Health Revenue, National Insured) | | | 5.50 | | | | 8-15-2019 | | | | 345,000 | | | | 365,717 | |
Tennessee Energy Acquisition Corporation Series A (Utilities Revenue) | | | 5.25 | | | | 9-1-2017 | | | | 2,140,000 | | | | 2,189,862 | |
Tennessee Energy Acquisition Corporation Series A (Utilities Revenue) | | | 5.25 | | | | 9-1-2018 | | | | 1,400,000 | | | | 1,478,092 | |
White County TN (GO Revenue) | | | 4.05 | | | | 6-1-2020 | | | | 1,010,000 | | | | 1,067,540 | |
| | | | |
| | | | | | | | | | | | | | | 6,828,729 | |
| | | | | | | | | | | | | | | | |
| | | | |
| Texas: 8.92% | | | | | | | | | | | | | | | | |
Austin TX Independent School District Series B (GO Revenue) | | | 5.00 | | | | 8-1-2023 | | | | 3,805,000 | | | | 4,469,505 | |
Austin TX Independent School District Series B (GO Revenue) | | | 5.00 | | | | 8-1-2024 | | | | 3,970,000 | | | | 4,725,610 | |
Austin TX Independent School District Series B (GO Revenue) | | | 5.00 | | | | 8-1-2025 | | | | 2,050,000 | | | | 2,463,670 | |
Austin TX Independent School District Series B (GO Revenue) | | | 5.00 | | | | 8-1-2026 | | | | 1,450,000 | | | | 1,731,924 | |
Austin TX Refunding Bond (Utilities Revenue, National Insured) | | | 5.25 | | | | 5-15-2025 | | | | 1,400,000 | | | | 1,650,586 | |
Bexar County TX Combination Tax Certificate of Obligation (GO Revenue) | | | 5.00 | | | | 6-15-2024 | | | | 1,000,000 | | | | 1,180,380 | |
Bexar County TX Limited Tax Refunding Bond (GO Revenue) | | | 4.00 | | | | 6-15-2032 | | | | 2,000,000 | | | | 2,136,080 | |
| | | | | | |
| Portfolio of investments—December 31, 2016 (unaudited) | | Wells Fargo Intermediate Tax/AMT-Free Fund | | | 23 | |
| | | | | | | | | | | | | | | | |
| Security name | | Interest rate | | | Maturity date | | | Principal | | | Value | |
| | | | |
| Texas (continued) | | | | | | | | | | | | | | | | |
Bexar County TX Limited Tax Refunding Bond (GO Revenue) | | | 5.00 | % | | | 6-15-2026 | | | $ | 2,140,000 | | | $ | 2,552,635 | |
Bexar County TX Limited Tax Refunding Bond (GO Revenue) | | | 5.00 | | | | 6-15-2027 | | | | 3,205,000 | | | | 3,795,617 | |
Brownsville TX Utilities System Refunding Bond (Utilities Revenue) | | | 5.00 | | | | 9-1-2026 | | | | 2,190,000 | | | | 2,515,478 | |
Brownsville TX Utilities System Refunding Bond (Utilities Revenue) | | | 5.00 | | | | 9-1-2029 | | | | 1,500,000 | | | | 1,695,255 | |
Brownsville TX Utilities System Refunding Bond (Utilities Revenue) | | | 5.00 | | | | 9-1-2030 | | | | 2,500,000 | | | | 2,818,050 | |
Central Texas Regional Mobility Authority Prerefunded Senior Lien (Transportation Revenue) | | | 5.75 | | | | 1-1-2019 | | | | 985,000 | | | | 1,069,533 | |
Central Texas Regional Mobility Authority Series B (Transportation Revenue) ± | | | 5.00 | | | | 1-1-2045 | | | | 8,000,000 | | | | 8,627,760 | |
Central Texas Regional Mobility Authority Unrefunded Senior Lien (Transportation Revenue) | | | 5.75 | | | | 1-1-2019 | | | | 325,000 | | | | 349,674 | |
Collin County TX Unlimited Tax Road & Refunding Bond (GO Revenue) | | | 5.00 | | | | 2-15-2023 | | | | 1,350,000 | | | | 1,576,746 | |
Collin County TX Unlimited Tax Road & Refunding Bond (GO Revenue) | | | 5.00 | | | | 2-15-2026 | | | | 1,000,000 | | | | 1,194,230 | |
Collin County TX Unlimited Tax Road & Refunding Bond (GO Revenue) | | | 5.00 | | | | 2-15-2027 | | | | 1,300,000 | | | | 1,536,951 | |
Crane County TX Water District Unlimited Tax Bond (GO Revenue) | | | 5.00 | | | | 2-15-2022 | | | | 1,515,000 | | | | 1,680,029 | |
Crane County TX Water District Unlimited Tax Bond (GO Revenue) | | | 5.00 | | | | 2-15-2023 | | | | 1,395,000 | | | | 1,567,129 | |
Crane County TX Water District Unlimited Tax Bond (GO Revenue) | | | 5.00 | | | | 2-15-2026 | | | | 1,000,000 | | | | 1,134,170 | |
Crane County TX Water District Unlimited Tax Bond (GO Revenue) | | | 5.00 | | | | 2-15-2030 | | | | 1,130,000 | | | | 1,245,565 | |
Crane County TX Water District Unlimited Tax Bond (GO Revenue) | | | 5.00 | | | | 2-15-2031 | | | | 1,000,000 | | | | 1,098,570 | |
Cypress-Fairbanks TX Independent School District Series B-2 (GO Revenue) ± | | | 3.00 | | | | 2-15-2040 | | | | 11,010,000 | | | | 11,289,764 | |
Dallas County TX Combination Tax and Parking Garage Certification of Obligation (GO Revenue) | | | 5.00 | | | | 8-15-2024 | | | | 5,600,000 | | | | 6,679,456 | |
Del Rio TX Refunding Bond (GO Revenue, Build America Mutual Assurance Company Insured) | | | 4.00 | | | | 6-1-2023 | | | | 720,000 | | | | 779,681 | |
Del Rio TX Refunding Bond (GO Revenue, Build America Mutual Assurance Company Insured) | | | 4.00 | | | | 6-1-2024 | | | | 745,000 | | | | 807,535 | |
Denton County TX Permanent Improvement & Refunding Bond (GO Revenue) | | | 5.00 | | | | 7-15-2023 | | | | 1,990,000 | | | | 2,343,703 | |
Denton County TX Permanent Improvement & Refunding Bond (GO Revenue) | | | 5.00 | | | | 7-15-2024 | | | | 1,145,000 | | | | 1,367,691 | |
Denton County TX Permanent Improvement & Refunding Bond (GO Revenue) | | | 5.00 | | | | 7-15-2025 | | | | 1,000,000 | | | | 1,176,190 | |
Denton County TX Permanent Improvement & Refunding Bond (GO Revenue) | | | 5.00 | | | | 7-15-2030 | | | | 1,000,000 | | | | 1,170,100 | |
El Paso County TX Hospital District (GO Revenue) | | | 5.00 | | | | 8-15-2028 | | | | 2,045,000 | | | | 2,231,565 | |
El Paso County TX Refunding Bond Series A (GO Revenue) | | | 5.00 | | | | 2-15-2031 | | | | 2,000,000 | | | | 2,289,680 | |
El Paso County TX Refunding Bond Series A (GO Revenue) | | | 5.00 | | | | 2-15-2032 | | | | 2,120,000 | | | | 2,416,228 | |
Flower Mound, Denton & Tarrant Counties TX Refunding Bond (GO Revenue) | | | 4.00 | | | | 3-1-2026 | | | | 755,000 | | | | 834,396 | |
Flower Mound, Denton & Tarrant Counties TX Refunding Bond (GO Revenue) | | | 5.00 | | | | 3-1-2020 | | | | 650,000 | | | | 716,112 | |
Flower Mound, Denton & Tarrant Counties TX Refunding Bond (GO Revenue) | | | 5.00 | | | | 3-1-2021 | | | | 510,000 | | | | 574,316 | |
Flower Mound, Denton & Tarrant Counties TX Refunding Bond (GO Revenue) | | | 5.00 | | | | 3-1-2022 | | | | 1,000,000 | | | | 1,144,260 | |
Flower Mound, Denton & Tarrant Counties TX Refunding Bond (GO Revenue) | | | 5.00 | | | | 3-1-2023 | | | | 620,000 | | | | 720,223 | |
Flower Mound, Denton & Tarrant Counties TX Refunding Bond (GO Revenue) | | | 5.00 | | | | 3-1-2024 | | | | 1,660,000 | | | | 1,955,663 | |
Fort Worth TX Independent School District Unlimited Tax Refunding and School Building Bond (GO Revenue) | | | 5.00 | | | | 2-15-2026 | | | | 3,000,000 | | | | 3,640,890 | |
Galveston TX Wharves & Terminal (Airport Revenue) | | | 5.00 | | | | 2-1-2026 | | | | 2,000,000 | | | | 2,139,640 | |
Georgetown TX Independent School District (GO Revenue) ± | | | 2.00 | | | | 8-1-2034 | | | | 1,630,000 | | | | 1,638,835 | |
Harris County TX Flood Control District Series A (GO Revenue) | | | 5.00 | | | | 10-1-2025 | | | | 1,500,000 | | | | 1,783,680 | |
Harris County TX Tax Road Refunding Bond Series A (GO Revenue) | | | 5.00 | | | | 10-1-2025 | | | | 8,445,000 | | | | 9,989,591 | |
Harris County TX Tax Road Refunding Bond Series A (GO Revenue) | | | 5.00 | | | | 10-1-2025 | | | | 4,215,000 | | | | 5,082,784 | |
Harris County TX Toll Road Project Series C (GO Revenue, AGM Insured) | | | 5.25 | | | | 8-15-2027 | | | | 4,000,000 | | | | 4,904,520 | |
Hays County TX Refunding Bond (GO Revenue) | | | 5.00 | | | | 2-15-2023 | | | | 1,750,000 | | | | 2,018,345 | |
Houston TX Airport Senior Lien Series A (Airport Revenue) | | | 5.00 | | | | 7-1-2025 | | | | 1,000,000 | | | | 1,051,970 | |
Houston TX Higher Education Finance Corporation Series A (Education Revenue) | | | 4.00 | | | | 2-15-2022 | | | | 740,000 | | | | 742,353 | |
Houston TX Independent School District Limited Tax (GO Revenue) | | | 4.25 | | | | 2-15-2021 | | | | 5,000,000 | | | | 5,018,450 | |
| | | | |
| 24 | | Wells Fargo Intermediate Tax/AMT-Free Fund | | Portfolio of investments—December 31, 2016 (unaudited) |
| | | | | | | | | | | | | | | | |
| Security name | | Interest rate | | | Maturity date | | | Principal | | | Value | |
| | | | |
| Texas (continued) | | | | | | | | | | | | | | | | |
Houston TX Utilities Systems Series A (Water & Sewer Revenue) | | | 5.25 | % | | | 11-15-2031 | | | $ | 3,000,000 | | | $ | 3,351,930 | |
Lower Colorado River TX Authority (Utilities Revenue) | | | 5.50 | | | | 5-15-2031 | | | | 2,500,000 | | | | 2,899,425 | |
Midland County TX PFFA Compass Pointe Apartments (Housing Revenue) | | | 1.25 | | | | 3-1-2018 | | | | 2,500,000 | | | | 2,495,975 | |
Midtown TX RDA (Tax Revenue, Build America Mutual Assurance Company Insured) | | | 5.25 | | | | 1-1-2027 | | | | 1,880,000 | | | | 2,122,896 | |
Midtown TX RDA (Tax Revenue, Build America Mutual Assurance Company Insured) | | | 5.25 | | | | 1-1-2029 | | | | 2,390,000 | | | | 2,640,544 | |
Midtown TX RDA (Tax Revenue, Build America Mutual Assurance Company Insured) | | | 5.25 | | | | 1-1-2030 | | | | 1,500,000 | | | | 1,676,280 | |
Midtown TX RDA (Tax Revenue, Build America Mutual Assurance Company Insured) | | | 5.25 | | | | 1-1-2031 | | | | 1,000,000 | | | | 1,115,200 | |
North Harris County TX Regional Water Authority Senior Lien (Water & Sewer Revenue, Build America Mutual Assurance Company Insured) | | | 5.00 | | | | 12-15-2029 | | | | 1,215,000 | | | | 1,372,986 | |
North Texas Higher Education Authority Incoming Student Loan Series A-2 (Education Revenue) ± | | | 1.75 | | | | 7-1-2030 | | | | 6,655,000 | | | | 6,565,091 | |
Northside TX Independent School District Refunding Bond (GO Revenue) ± | | | 1.20 | | | | 8-1-2040 | | | | 590,000 | | | | 590,077 | |
Northwest TX Independent School District Refunding Bond (GO Revenue) | | | 5.00 | | | | 2-15-2030 | | | | 4,000,000 | | | | 4,632,280 | |
Nueces River TX Water Supply Facility Corpus Christi Lake Texana Project (Water & Sewer Revenue) | | | 5.00 | | | | 7-15-2026 | | | | 1,000,000 | | | | 1,188,420 | |
Nueces River TX Water Supply Facility Corpus Christi Lake Texana Project (Water & Sewer Revenue) | | | 5.00 | | | | 7-15-2027 | | | | 1,250,000 | | | | 1,477,175 | |
Port Arthur TX Navigation District Jefferson County Environmental Facilities Motiva Enterprises LLC Project Series B (Resource Recovery Revenue) ø | | | 0.79 | | | | 12-1-2039 | | | | 5,000,000 | | | | 5,000,000 | |
San Antonio TX Junior Lien Series B (Utilities Revenue) ± | | | 1.75 | | | | 12-1-2027 | | | | 5,000,000 | | | | 5,009,500 | |
Texas Independent School District Refunding Bond (GO Revenue) | | | 5.00 | | | | 8-15-2025 | | | | 2,260,000 | | | | 2,729,967 | |
Texas Municipal Gas Acquisition & Supply Corporation II Series B (Utilities Revenue, JPMorgan Chase & Company Guaranteed) ± | | | 1.19 | | | | 9-15-2017 | | | | 1,815,000 | | | | 1,808,738 | |
Texas Municipal Gas Acquisition & Supply Corporation III Gas Supply Series 2012 (Utilities Revenue) | | | 5.00 | | | | 12-15-2021 | | | | 3,945,000 | | | | 4,361,474 | |
Texas Municipal Gas Acquisition & Supply Corporation Series B (Utilities Revenue) | | | 5.00 | | | | 12-15-2022 | | | | 5,000,000 | | | | 5,447,850 | |
Texas Private Activity Surface Transportation Corporation Project (Transportation Revenue) | | | 7.50 | | | | 6-30-2032 | | | | 2,000,000 | | | | 2,334,600 | |
Texas Private Activity Surface Transportation Corporation Project (Transportation Revenue) | | | 7.50 | | | | 6-30-2033 | | | | 2,000,000 | | | | 2,326,860 | |
Texas Private Activity Surface Transportation Corporation Project Senior Lien Note (Transportation Revenue) | | | 7.50 | | | | 12-31-2031 | | | | 3,745,000 | | | | 4,314,652 | |
Texas SA Energy Acquisition Public Facility Corporation Gas Supply (Utilities Revenue) | | | 5.50 | | | | 8-1-2019 | | | | 1,465,000 | | | | 1,588,939 | |
Texas Transportation Commission Highway Fund Series A (Tax Revenue) | | | 5.00 | | | | 10-1-2025 | | | | 3,250,000 | | | | 3,924,798 | |
Texas Woman’s University Financing System (Education Revenue) | | | 4.00 | | | | 7-1-2020 | | | | 1,000,000 | | | | 1,071,190 | |
University of Houston Texas (Education Revenue) | | | 5.00 | | | | 2-15-2024 | | | | 2,700,000 | | | | 2,890,863 | |
University of Houston Texas Series B (Education Revenue) | | | 5.25 | | | | 7-1-2026 | | | | 4,225,000 | | | | 5,190,413 | |
University of Texas Board of Regents Series D (Education Revenue) | | | 5.00 | | | | 8-15-2026 | | | | 2,000,000 | | | | 2,438,040 | |
Weatherford TX Utility System Refunding & Improvement Bond (Utilities Revenue, AGM Insured) | | | 5.00 | | | | 9-1-2025 | | | | 1,000,000 | | | | 1,165,190 | |
Weatherford TX Utility System Refunding & Improvement Bond (Utilities Revenue, AGM Insured) | | | 5.00 | | | | 9-1-2026 | | | | 375,000 | | | | 433,721 | |
| | | | |
| | | | | | | | | | | | | | | 213,487,842 | |
| | | | | | | | | | | | | | | | |
| | | | |
| Utah: 0.17% | | | | | | | | | | | | | | | | |
Canyons UT Board of Education Utah School Bond Guaranty Program (GO Revenue, AGM Insured) | | | 5.00 | | | | 6-15-2022 | | | | 1,860,000 | | | | 2,152,299 | |
Utah Charter School Finance Authority Refunding Bond (Education Revenue, CSCE Insured) | | | 4.00 | | | | 4-15-2020 | | | | 250,000 | | | | 264,458 | |
Utah Charter School Finance Authority Refunding Bond (Education Revenue, CSCE Insured) | | | 4.00 | | | | 4-15-2021 | | | | 400,000 | | | | 426,344 | |
| | | | | | |
| Portfolio of investments—December 31, 2016 (unaudited) | | Wells Fargo Intermediate Tax/AMT-Free Fund | | | 25 | |
| | | | | | | | | | | | | | | | |
| Security name | | Interest rate | | | Maturity date | | | Principal | | | Value | |
| | | | |
| Utah (continued) | | | | | | | | | | | | | | | | |
Utah Charter School Finance Authority Refunding Bond (Education Revenue, CSCE Insured) | | | 4.00 | % | | | 4-15-2022 | | | $ | 400,000 | | | $ | 427,388 | |
Utah Charter School Finance Authority Refunding Bond (Education Revenue, CSCE Insured) | | | 4.00 | | | | 4-15-2023 | | | | 400,000 | | | | 428,728 | |
Utah Charter School Finance Authority Refunding Bond (Education Revenue, CSCE Insured) | | | 4.00 | | | | 4-15-2024 | | | | 450,000 | | | | 481,298 | |
| | | | |
| | | | | | | | | | | | | | | 4,180,515 | |
| | | | | | | | | | | | | | | | |
| | | | |
| Virgin Islands: 0.29% | | | | | | | | | | | | | | | | |
Virgin Islands PFA Matching Funding Loan Series A (Miscellaneous Revenue) | | | 6.75 | | | | 10-1-2019 | | | | 1,920,000 | | | | 1,900,358 | |
Virgin Islands PFA Subordinated Lien Series C (Tobacco Revenue) | | | 5.00 | | | | 10-1-2017 | | | | 5,000,000 | | | | 4,991,950 | |
| | | | |
| | | | | | | | | | | | | | | 6,892,308 | |
| | | | | | | | | | | | | | | | |
| | | | |
| Virginia: 1.06% | | | | | | | | | | | | | | | | |
Greater Richmond VA Convention Center (Tax Revenue) | | | 5.00 | | | | 6-15-2025 | | | | 1,000,000 | | | | 1,175,370 | |
Marquis VA CDA CAB Series C (Tax Revenue) (i)¤ | | | 0.00 | | | | 9-1-2041 | | | | 1,772,000 | | | | 224,105 | |
Marquis VA CDA CCAB (Tax Revenue) 144A | | | 7.50 | | | | 9-1-2045 | | | | 386,000 | | | | 248,252 | |
Marquis VA CDA Series B (Tax Revenue) (i) | | | 5.63 | | | | 9-1-2041 | | | | 1,274,000 | | | | 978,050 | |
Virginia College Building Authority Educational Facilities Series A (Education Revenue) | | | 3.00 | | | | 9-1-2025 | | | | 13,630,000 | | | | 14,143,442 | |
Virginia Resources Authority Pooled Financing Program Series A (Miscellaneous Revenue) | | | 4.00 | | | | 11-1-2025 | | | | 2,370,000 | | | | 2,654,850 | |
Virginia Resources Authority Pooled Financing Program Series A (Miscellaneous Revenue) | | | 5.00 | | | | 11-1-2027 | | | | 1,320,000 | | | | 1,607,206 | |
Virginia Small Business Financing Authority (Education Revenue) | | | 5.25 | | | | 10-1-2029 | | | | 3,000,000 | | | | 3,464,250 | |
Watkins Centre VA CDA (Miscellaneous Revenue) | | | 5.40 | | | | 3-1-2020 | | | | 757,000 | | | | 758,204 | |
| | | | |
| | | | | | | | | | | | | | | 25,253,729 | |
| | | | | | | | | | | | | | | | |
| | | | |
| Washington: 3.23% | | | | | | | | | | | | | | | | |
Energy Northwest Washington Wind Project (Utilities Revenue) | | | 5.00 | | | | 7-1-2022 | | | | 1,185,000 | | | | 1,342,629 | |
Kent WA Limited Tax Refunding Bond (GO Revenue) | | | 5.00 | | | | 12-1-2031 | | | | 1,000,000 | | | | 1,165,710 | |
King County WA Federal Way School District #210 (GO Revenue, AGM Insured) | | | 4.00 | | | | 12-1-2023 | | | | 4,085,000 | | | | 4,537,169 | |
King County WA Public Hospital District #1 Valley Medical Center Refunding Bond (GO Revenue) %% | | | 5.00 | | | | 12-1-2029 | | | | 1,600,000 | | | | 1,799,616 | |
King County WA Public Hospital District #1 Valley Medical Center Refunding Bond (GO Revenue) %% | | | 5.00 | | | | 12-1-2031 | | | | 6,665,000 | | | | 7,441,406 | |
King County WA Public Hospital District #1 Valley Medical Center Refunding Bond (GO Revenue) %% | | | 5.00 | | | | 12-1-2032 | | | | 2,905,000 | | | | 3,228,065 | |
King County WA Public Hospital District #1 Valley Medical Center Refunding Bond (GO Revenue) %% | | | 5.00 | | | | 12-1-2033 | | | | 7,045,000 | | | | 7,785,359 | |
Lewis County WA Public Utility District Refunding (Utilities Revenue) | | | 5.25 | | | | 4-1-2032 | | | | 6,115,000 | | | | 7,124,770 | |
Seattle WA Refunding Bond Series A (GO Revenue) | | | 5.00 | | | | 6-1-2024 | | | | 6,345,000 | | | | 7,596,171 | |
Tacoma WA Solid Waste Refunding Bond Series B (Resource Recovery Revenue) | | | 5.00 | | | | 12-1-2027 | | | | 620,000 | | | | 734,161 | |
Tacoma WA Solid Waste Refunding Bond Series B (Resource Recovery Revenue) | | | 5.00 | | | | 12-1-2028 | | | | 1,455,000 | | | | 1,715,081 | |
Tacoma WA Solid Waste Refunding Bond Series B (Resource Recovery Revenue) | | | 5.00 | | | | 12-1-2029 | | | | 1,525,000 | | | | 1,789,222 | |
Washington EDFA (Education Revenue) | | | 5.00 | | | | 6-1-2028 | | | | 1,000,000 | | | | 1,152,290 | |
Washington HCFR Fred Hutchinson Cancer Research Center (Health Revenue) | | | 5.00 | | | | 1-1-2023 | | | | 4,000,000 | | | | 4,549,440 | |
Washington HCFR Fred Hutchinson Cancer Research Center (Health Revenue) | | | 5.00 | | | | 1-1-2026 | | | | 2,250,000 | | | | 2,611,148 | |
Washington HCFR Fred Hutchinson Cancer Research Center (Health Revenue) | | | 5.00 | | | | 1-1-2027 | | | | 1,050,000 | | | | 1,205,726 | |
Washington HCFR Fred Hutchinson Cancer Research Center (Health Revenue) | | | 5.00 | | | | 1-1-2028 | | | | 1,350,000 | | | | 1,542,605 | |
Washington Motor Vehicle Fuel Tax Refunding Bond Series D (Miscellaneous Revenue) | | | 5.00 | | | | 7-1-2031 | | | | 5,830,000 | | | | 6,739,363 | |
Washington Office Building Refunding Bond (Miscellaneous Revenue) | | | 5.00 | | | | 7-1-2026 | | | | 2,750,000 | | | | 3,176,003 | |
| | | | |
| 26 | | Wells Fargo Intermediate Tax/AMT-Free Fund | | Portfolio of investments—December 31, 2016 (unaudited) |
| | | | | | | | | | | | | | | | |
| Security name | | Interest rate | | | Maturity date | | | Principal | | | Value | |
| | | | |
| Washington (continued) | | | | | | | | | | | | | | | | |
Washington TES Properties (Miscellaneous Revenue) | | | 5.50 | % | | | 12-1-2029 | | | $ | 1,400,000 | | | $ | 1,534,834 | |
Washington Various Purposes Refunding Bond Series B (GO Revenue) | | | 5.00 | | | | 7-1-2028 | | | | 7,130,000 | | | | 8,454,825 | |
| | | | |
| | | | | | | | | | | | | | | 77,225,593 | |
| | | | | | | | | | | | | | | | |
| | | | |
| West Virginia: 0.29% | | | | | | | | | | | | | | | | |
West Virginia School Building Authority (Miscellaneous Revenue) | | | 5.25 | | | | 7-1-2020 | | | | 1,100,000 | | | | 1,166,154 | |
West Virginia School Building Authority Capital Improvement Bond Series A (Miscellaneous Revenue) | | | 5.00 | | | | 7-1-2026 | | | | 1,520,000 | | | | 1,791,001 | |
West Virginia School Building Authority Capital Improvement Bond Series A (Miscellaneous Revenue) | | | 5.00 | | | | 7-1-2027 | | | | 1,595,000 | | | | 1,874,715 | |
West Virginia School Building Authority Capital Improvement Bond Series A (Miscellaneous Revenue) | | | 5.00 | | | | 7-1-2029 | | | | 1,755,000 | | | | 2,041,749 | |
| | | | |
| | | | | | | | | | | | | | | 6,873,619 | |
| | | | | | | | | | | | | | | | |
| | | | |
| Wisconsin: 0.71% | | | | | | | | | | | | | | | | |
Wisconsin HEFA Bellin Memorial Hospital Obligated Group (Health Revenue, Ambac Insured) | | | 5.50 | | | | 2-15-2019 | | | | 410,000 | | | | 421,222 | |
Wisconsin HEFA Mercy Alliance Incorporated Project Series A (Health Revenue) | | | 5.00 | | | | 6-1-2019 | | | | 1,050,000 | | | | 1,080,419 | |
Wisconsin HEFA Series A (Health Revenue) | | | 5.00 | | | | 7-15-2021 | | | | 3,500,000 | | | | 3,928,400 | |
Wisconsin HEFA Series A (Health Revenue) | | | 5.00 | | | | 11-15-2023 | | | | 3,500,000 | | | | 4,069,310 | |
Wisconsin HEFA Series M (Health Revenue, National Insured) ±(m)(n) | | | 1.10 | | | | 6-1-2019 | | | | 1,000,000 | | | | 975,000 | |
Wisconsin PFA Charter School Voyager Foundation Incorporate Project Series A (Education Revenue) | | | 6.00 | | | | 10-1-2032 | | | | 1,475,000 | | | | 1,556,110 | |
Wisconsin PFA KU Campus Development Corporation Central District Development Project (Education Revenue) | | | 5.00 | | | | 3-1-2032 | | | | 4,315,000 | | | | 4,898,431 | |
| | | | |
| | | | | | | | | | | | | | | 16,928,892 | |
| | | | | | | | | | | | | | | | |
| | | | |
Total Municipal Obligations (Cost $2,342,745,800) | | | | | | | | | | | | | | | 2,364,005,422 | |
| | | | | | | | | | | | | | | | |
| | | | | | | | |
| Total investments in securities (Cost $2,342,745,800) * | | | 98.80 | % | | | 2,364,005,422 | |
Other assets and liabilities, net | | | 1.20 | | | | 28,748,493 | |
| | | | | | | | |
| Total net assets | | | 100.00 | % | | $ | 2,392,753,915 | |
| | | | | | | | |
| ¤ | The security is issued in zero coupon form with no periodic interest payments. |
| ± | Variable rate investment. The rate shown is the rate in effect at period end. |
| ## | All or a portion of this security is segregated for when-issued securities. |
| 144A | The security may be resold in transactions exempt from registration, normally to qualified institutional buyers, pursuant to Rule 144A under the Securities Act of 1933. |
| ø | Variable rate demand notes are subject to a demand feature which reduces the effective maturity. The maturity date shown represents the final maturity date of the security. The interest rate is determined and reset by the issuer daily, weekly, or monthly depending upon the terms of the security. The rate shown is the rate in effect at period end. |
| (s) | The security is currently in default with regards to scheduled interest and/or principal payments. The Fund has stopped accruing interest on the security. |
| %% | The security is issued on a when-issued basis. |
| (m) | The security is an auction-rate security which has an interest rate that resets at predetermined short-term intervals through a Dutch auction. The rate shown is the rate in effect at period end. |
| (n) | The auction to set the interest rate on the security failed at period end due to insufficient investor interest. A failed auction does not itself cause a default. |
| * | Cost for federal income tax purposes is $2,342,808,131 and unrealized gains (losses) consists of: |
| | | | |
Gross unrealized gains | | $ | 62,212,521 | |
Gross unrealized losses | | | (41,015,230 | ) |
| | | | |
Net unrealized gains | | $ | 21,197,291 | |
| | | | | | |
| Portfolio of investments—December 31, 2016 (unaudited) | | Wells Fargo Municipal Bond Fund | | | 1 | |
| | | | | | | | | | | | | | | | |
| Security name | | Interest rate | | | Maturity date | | | Principal | | | Value | |
| | | | |
Corporate Bonds and Notes: 0.61% | | | | | | | | | | | | | | | | |
| | | | |
Consumer Discretionary: 0.61% | | | | | | | | | | | | | | | | |
| | | | |
| Diversified Consumer Services: 0.61% | | | | | | | | | | | | | | | | |
Toll Road Investors Partnership II 144A¤ | | | 0.00 | % | | | 2-15-2028 | | | $ | 30,780,000 | | | $ | 15,545,778 | |
| | | | | | | | | | | | | | | | |
| | | | |
Total Corporate Bonds and Notes (Cost $15,840,313) | | | | | | | | | | | | | | | 15,545,778 | |
| | | | | | | | | | | | | | | | |
| | | | |
Municipal Obligations: 99.25% | | | | | | | | | | | | | | | | |
| | | | |
| Alabama: 2.05% | | | | | | | | | | | | | | | | |
Alabama Federal Aid Highway Finance Authority Series A (Tax Revenue) | | | 5.00 | | | | 9-1-2035 | | | | 19,000,000 | | | | 22,029,740 | |
Alabama State University General Tuition and Fee (Education Revenue, Syncora Guarantee Incorporated Insured) | | | 5.25 | | | | 8-1-2032 | | | | 10,520,000 | | | | 10,024,403 | |
Birmingham AL CAB Series A1 (GO Revenue) ± | | | 0.00 | | | | 3-1-2045 | | | | 3,000,000 | | | | 2,955,900 | |
Jefferson County AL CAB Series B (Water & Sewer Revenue, AGM Insured) ¤ | | | 0.00 | | | | 10-1-2025 | | | | 710,000 | | | | 506,983 | |
Jefferson County AL CAB Series B (Water & Sewer Revenue, AGM Insured) ¤ | | | 0.00 | | | | 10-1-2026 | | | | 3,000,000 | | | | 2,035,080 | |
Jefferson County AL CAB Series B (Water & Sewer Revenue, AGM Insured) ¤ | | | 0.00 | | | | 10-1-2029 | | | | 4,115,000 | | | | 2,277,488 | |
Jefferson County AL Limited Obligation School District Series A (Tax Revenue, AGM Insured) | | | 5.25 | | | | 1-1-2018 | | | | 775,000 | | | | 781,402 | |
Jefferson County AL Limited Obligation School District Series A (Tax Revenue) | | | 5.25 | | | | 1-1-2020 | | | | 3,000,000 | | | | 3,012,270 | |
Jefferson County AL Series A (GO Revenue) | | | 4.90 | | | | 4-1-2021 | | | | 5,495,000 | | | | 5,722,988 | |
Jefferson County AL Warrants Series C (GO Revenue) | | | 4.90 | | | | 4-1-2021 | | | | 3,170,000 | | | | 3,299,938 | |
| | | | |
| | | | | | | | | | | | | | | 52,646,192 | |
| | | | | | | | | | | | | | | | |
| | | | |
| Alaska: 0.27% | | | | | | | | | | | | | | | | |
Alaska International Airports System Series B (Airport Revenue) | | | 5.00 | | | | 10-1-2033 | | | | 3,080,000 | | | | 3,432,937 | |
Alaska International Airports System Series B (Airport Revenue) | | | 5.00 | | | | 10-1-2034 | | | | 3,225,000 | | | | 3,579,137 | |
| | | | |
| | | | | | | | | | | | | | | 7,012,074 | |
| | | | | | | | | | | | | | | | |
| | | | |
| Arizona: 1.09% | | | | | | | | | | | | | | | | |
Maricopa County AZ IDA Senior Living Facility Series 2016 (Health Revenue) 144A | | | 6.00 | | | | 1-1-2048 | | | | 5,250,000 | | | | 4,802,438 | |
Maricopa County AZ PCR Series B (Utilities Revenue) ± | | | 5.20 | | | | 6-1-2043 | | | | 100,000 | | | | 106,828 | |
Phoenix AZ IDA Legacy Traditional Schools Project Series A (Education Revenue) 144A | | | 6.50 | | | | 7-1-2034 | | | | 2,000,000 | | | | 2,226,740 | |
Pima County AZ IDA New Plan Learning Project Series A (Education Revenue) | | | 7.75 | | | | 7-1-2035 | | | | 7,510,000 | | | | 7,546,574 | |
Pima County AZ IDA New Plan Learning Project Series A (Education Revenue) | | | 8.13 | | | | 7-1-2041 | | | | 6,495,000 | | | | 6,566,510 | |
Pima County AZ IDA Noah Webster Schools-PIMA Project (Education Revenue) | | | 7.00 | | | | 12-15-2043 | | | | 3,225,000 | | | | 3,542,469 | |
Tempe AZ IDA Friendship Village Project Series A (Health Revenue) | | | 5.25 | | | | 12-1-2020 | | | | 1,000,000 | | | | 1,082,590 | |
Tempe AZ IDA Friendship Village Project Series A (Health Revenue) | | | 5.38 | | | | 12-1-2021 | | | | 1,000,000 | | | | 1,092,770 | |
Tempe AZ IDA Friendship Village Project Series A (Health Revenue) | | | 5.50 | | | | 12-1-2022 | | | | 1,000,000 | | | | 1,088,220 | |
| | | | |
| | | | | | | | | | | | | | | 28,055,139 | |
| | | | | | | | | | | | | | | | |
| | | | |
| California: 7.52% | | | | | | | | | | | | | | | | |
Alameda County CA Certificate of Participation (Miscellaneous Revenue, National Insured) ¤ | | | 0.00 | | | | 6-15-2019 | | | | 1,400,000 | | | | 1,319,948 | |
Alhambra CA Unified School District CAB Election of 2008 Series B (GO Revenue, AGM Insured) ¤ | | | 0.00 | | | | 8-1-2031 | | | | 2,175,000 | | | | 1,247,645 | |
Alhambra CA Unified School District CAB Election of 2008 Series B (GO Revenue, AGM Insured) ¤ | | | 0.00 | | | | 8-1-2032 | | | | 3,795,000 | | | | 2,081,444 | |
Alhambra CA Unified School District CAB Election of 2008 Series B (GO Revenue, AGM Insured) ¤ | | | 0.00 | | | | 8-1-2034 | | | | 5,000,000 | | | | 2,458,250 | |
Alhambra CA Unified School District CAB Election of 2008 Series B (GO Revenue, AGM Insured) ¤ | | | 0.00 | | | | 8-1-2035 | | | | 6,700,000 | | | | 3,146,923 | |
| | | | |
| 2 | | Wells Fargo Municipal Bond Fund | | Portfolio of investments—December 31, 2016 (unaudited) |
| | | | | | | | | | | | | | | | |
| Security name | | Interest rate | | | Maturity date | | | Principal | | | Value | |
| | | | |
| California (continued) | | | | | | | | | | | | | | | | |
Alhambra CA Unified School District CAB Series B (GO Revenue, AGC Insured) ¤ | | | 0.00 | % | | | 8-1-2031 | | | $ | 7,500,000 | | | $ | 4,300,275 | |
Anaheim CA PFA Convention Center Expansion Project Series A (Miscellaneous Revenue) | | | 5.00 | | | | 5-1-2046 | | | | 8,500,000 | | | | 9,300,955 | |
Bass Lake CA Unified Elementary School District CAB (GO Revenue, AGM Insured) ¤ | | | 0.00 | | | | 8-1-2037 | | | | 1,305,000 | | | | 557,992 | |
Bass Lake CA Unified Elementary School District CAB (GO Revenue, AGM Insured) ¤ | | | 0.00 | | | | 8-1-2038 | | | | 1,900,000 | | | | 774,630 | |
Bass Lake CA Unified Elementary School District CAB (GO Revenue, AGM Insured) ¤ | | | 0.00 | | | | 8-1-2039 | | | | 2,005,000 | | | | 777,238 | |
Bay Area CA Toll Authority Toll Bridge Series A (Transportation Revenue) ± | | | 1.97 | | | | 4-1-2036 | | | | 28,000,000 | | | | 28,106,960 | |
California Municipal Finance Authority Charter School Albert Einstein Academies Project Series A (Miscellaneous Revenue) | | | 7.13 | | | | 8-1-2043 | | | | 2,230,000 | | | | 2,445,864 | |
California Public Works Board Department of General Services Buildings 8 & 9A (Miscellaneous Revenue) | | | 6.25 | | | | 4-1-2034 | | | | 4,000,000 | | | | 4,432,920 | |
California Public Works Board Judicial Council Project Series A (Miscellaneous Revenue) | | | 5.00 | | | | 3-1-2031 | | | | 3,260,000 | | | | 3,659,741 | |
California Statewide CDA School Facility Aspire Public Schools (Education Revenue) | | | 5.00 | | | | 7-1-2020 | | | | 525,000 | | | | 547,654 | |
California Statewide CDA Sutter Health Series A (Health Revenue) | | | 6.00 | | | | 8-15-2042 | | | | 4,900,000 | | | | 5,607,805 | |
Cerritos CA Community College District CAB Election of 2004 Series D (GO Revenue) ¤ | | | 0.00 | | | | 8-1-2027 | | | | 1,000,000 | | | | 701,670 | |
Cerritos CA Community College District CAB Election of 2004 Series D (GO Revenue) ¤ | | | 0.00 | | | | 8-1-2028 | | | | 1,040,000 | | | | 693,753 | |
Colton CA Unified School District CAB Series B (GO Revenue, AGM Insured) ¤ | | | 0.00 | | | | 8-1-2031 | | | | 1,000,000 | | | | 569,280 | |
Colton CA Unified School District CAB Series B (GO Revenue, AGM Insured) ¤ | | | 0.00 | | | | 8-1-2032 | | | | 1,000,000 | | | | 543,540 | |
Colton CA Unified School District CAB Series B (GO Revenue, AGM Insured) ¤ | | | 0.00 | | | | 8-1-2033 | | | | 1,000,000 | | | | 519,300 | |
Compton CA Community College District CAB Election of 2002 Series C (GO Revenue) ¤ | | | 0.00 | | | | 8-1-2032 | | | | 2,515,000 | | | | 1,287,982 | |
Compton CA Community College District CAB Election of 2002 Series C (GO Revenue) ¤ | | | 0.00 | | | | 8-1-2033 | | | | 2,000,000 | | | | 973,260 | |
Compton CA Community College District CAB Election of 2002 Series C (GO Revenue) ¤ | | | 0.00 | | | | 8-1-2036 | | | | 510,000 | | | | 210,079 | |
Compton CA PFA Refunding Bond (Miscellaneous Revenue) 144A | | | 4.00 | | | | 9-1-2027 | | | | 3,820,000 | | | | 3,670,332 | |
El Monte CA Union High School District CAB Election of 2008 (GO Revenue, AGM Insured) ¤ | | | 0.00 | | | | 6-1-2028 | | | | 1,165,000 | | | | 759,219 | |
El Monte CA Union High School District CAB Election of 2008 (GO Revenue, AGM Insured) ¤ | | | 0.00 | | | | 6-1-2029 | | | | 1,500,000 | | | | 928,845 | |
El Monte CA Union High School District CAB Election of 2008 (GO Revenue, AGM Insured) ¤ | | | 0.00 | | | | 6-1-2030 | | | | 2,000,000 | | | | 1,175,460 | |
El Monte CA Union High School District CAB Election of 2008 (GO Revenue, AGM Insured) ¤ | | | 0.00 | | | | 6-1-2031 | | | | 2,000,000 | | | | 1,118,700 | |
El Monte CA Union High School District CAB Election of 2008 (GO Revenue, AGM Insured) ¤ | | | 0.00 | | | | 6-1-2032 | | | | 1,660,000 | | | | 883,801 | |
El Monte CA Union High School District CAB Election of 2008 (GO Revenue, AGM Insured) ¤ | | | 0.00 | | | | 6-1-2033 | | | | 1,230,000 | | | | 623,598 | |
El Monte CA Union High School District CAB Election of 2008 (GO Revenue, AGM Insured) ¤ | | | 0.00 | | | | 6-1-2034 | | | | 1,615,000 | | | | 778,931 | |
Gilroy CA Unified School District Prerefunded CAB Election of 2008 Series A (GO Revenue, AGC Insured) ¤ | | | 0.00 | | | | 8-1-2032 | | | | 6,470,000 | | | | 4,130,577 | |
Gilroy CA Unified School District Unrefunded CAB Election of 2008 Series A (GO Revenue, AGC Insured) ¤ | | | 0.00 | | | | 8-1-2032 | | | | 3,330,000 | | | | 1,796,202 | |
Golden State Tobacco Securitization Corporation California Tobacco Settlement Revenue Series A (Miscellaneous Revenue) | | | 5.00 | | | | 6-1-2030 | | | | 970,000 | | | | 1,087,302 | |
M-S-R California Energy Authority Gas Series B (Utilities Revenue) | | | 6.13 | | | | 11-1-2029 | | | | 15,925,000 | | | | 19,657,661 | |
Montebello CA Unified School District CAB Election of 1998 (GO Revenue, National Insured) ¤ | | | 0.00 | | | | 8-1-2024 | | | | 1,130,000 | | | | 888,259 | |
| | | | | | |
| Portfolio of investments—December 31, 2016 (unaudited) | | Wells Fargo Municipal Bond Fund | | | 3 | |
| | | | | | | | | | | | | | | | |
| Security name | | Interest rate | | | Maturity date | | | Principal | | | Value | |
| | | | |
| California (continued) | | | | | | | | | | | | | | | | |
Montebello CA Unified School District CAB Election of 1998 (GO Revenue, National Insured) ¤ | | | 0.00 | % | | | 8-1-2027 | | | $ | 2,775,000 | | | $ | 1,897,129 | |
Morongo Band of Mission Indians California Enterprise Casino Series B (Miscellaneous Revenue) 144A | | | 6.50 | | | | 3-1-2028 | | | | 2,000,000 | | | | 2,093,780 | |
Northern California Gas Authority #1 LIBOR Series B (Utilities Revenue) ± | | | 1.29 | | | | 7-1-2027 | | | | 27,660,000 | | | | 24,622,655 | |
Ontario Montclair CA School District CAB (GO Revenue, AGC Insured) ¤ | | | 0.00 | | | | 8-1-2028 | | | | 1,500,000 | | | | 1,006,320 | |
Ontario Montclair CA School District CAB (GO Revenue, AGC Insured) ¤ | | | 0.00 | | | | 8-1-2030 | | | | 2,000,000 | | | | 1,223,520 | |
Pasadena CA PFA CAB Rose Bowl Series A (Miscellaneous Revenue) ¤ | | | 0.00 | | | | 3-1-2027 | | | | 2,095,000 | | | | 1,477,289 | |
Pasadena CA PFA CAB Rose Bowl Series A (Miscellaneous Revenue) ¤ | | | 0.00 | | | | 3-1-2028 | | | | 4,450,000 | | | | 3,015,365 | |
Pasadena CA PFA CAB Rose Bowl Series A (Miscellaneous Revenue) ¤ | | | 0.00 | | | | 3-1-2029 | | | | 4,520,000 | | | | 2,935,650 | |
Pasadena CA PFA CAB Rose Bowl Series A (Miscellaneous Revenue) ¤ | | | 0.00 | | | | 3-1-2030 | | | | 6,725,000 | | | | 4,186,447 | |
Pasadena CA PFA CAB Rose Bowl Series A (Miscellaneous Revenue) ¤ | | | 0.00 | | | | 3-1-2031 | | | | 2,185,000 | | | | 1,305,144 | |
Pasadena CA PFA CAB Rose Bowl Series A (Miscellaneous Revenue) ¤ | | | 0.00 | | | | 3-1-2032 | | | | 2,000,000 | | | | 1,146,360 | |
Pasadena CA PFA CAB Rose Bowl Series A (Miscellaneous Revenue) ¤ | | | 0.00 | | | | 3-1-2033 | | | | 4,295,000 | | | | 2,362,894 | |
Richmond CA Joint Powers Financing Authority Civic Center Project Series A (Miscellaneous Revenue, AGC Insured) | | | 5.88 | | | | 8-1-2037 | | | | 25,000 | | | | 27,099 | |
Richmond CA Joint Powers Financing Authority Point Potrero Series A (Miscellaneous Revenue) | | | 6.25 | | | | 7-1-2024 | | | | 5,420,000 | | | | 5,985,252 | |
San Bernardino CA Unified School District Election of 2012 Series A (GO Revenue, AGM Insured) | | | 5.00 | | | | 8-1-2031 | | | | 1,100,000 | | | | 1,235,454 | |
San Bernardino CA Unified School District Series A (GO Revenue, AGM Insured) | | | 5.00 | | | | 8-1-2026 | | | | 1,100,000 | | | | 1,264,824 | |
San Bernardino CA Unified School District Series A (GO Revenue, AGM Insured) | | | 5.00 | | | | 8-1-2028 | | | | 1,250,000 | | | | 1,422,788 | |
San Buenaventura CA Community Mental Health System (Health Revenue) | | | 6.00 | | | | 12-1-2019 | | | | 1,040,000 | | | | 1,133,548 | |
San Buenaventura CA Community Mental Health System (Health Revenue) | | | 6.25 | | | | 12-1-2020 | | | | 2,000,000 | | | | 2,239,900 | |
San Diego CA PFFA Capital Improvement Project Series A (Miscellaneous Revenue) | | | 5.00 | | | | 10-15-2033 | | | | 1,000,000 | | | | 1,135,300 | |
San Diego CA PFFA Capital Improvement Project Series A (Miscellaneous Revenue) | | | 5.00 | | | | 10-15-2034 | | | | 1,080,000 | | | | 1,219,946 | |
San Diego CA PFFA Capital Improvement Project Series A (Miscellaneous Revenue) | | | 5.00 | | | | 10-15-2035 | | | | 1,000,000 | | | | 1,125,520 | |
San Diego CA Unified School District CAB Series C (GO Revenue) ¤ | | | 0.00 | | | | 7-1-2031 | | | | 2,000,000 | | | | 1,150,380 | |
San Diego CA Unified School District CAB Series C (GO Revenue) ¤ | | | 0.00 | | | | 7-1-2032 | | | | 1,500,000 | | | | 817,980 | |
San Diego CA Unified School District CAB Series C (GO Revenue) ¤ | | | 0.00 | | | | 7-1-2033 | | | | 1,000,000 | | | | 516,820 | |
San Diego CA Unified School District CAB Series C (GO Revenue) ¤ | | | 0.00 | | | | 7-1-2034 | | | | 2,000,000 | | | | 976,220 | |
San Diego CA Unified School District CAB Series C (GO Revenue) ¤ | | | 0.00 | | | | 7-1-2035 | | | | 1,500,000 | | | | 698,955 | |
Sylvan CA Unified School District CAB (GO Revenue, AGM Insured) ¤ | | | 0.00 | | | | 8-1-2037 | | | | 1,085,000 | | | | 473,375 | |
Temecula Valley CA Unified School District Election of 2012 Series B (GO Revenue, AGM Insured) | | | 4.00 | | | | 8-1-2045 | | | | 7,000,000 | | | | 7,052,920 | |
West Contra Costa CA Unified School District CAB Series C (GO Revenue, AGM Insured) ¤ | | | 0.00 | | | | 8-1-2029 | | | | 3,000,000 | | | | 1,835,160 | |
West Contra Costa CA Unified School District Election of 2005 Series C-1 (GO Revenue, AGC Insured) ¤ | | | 0.00 | | | | 8-1-2029 | | | | 1,690,000 | | | | 1,033,807 | |
Wiseburn CA School District CAB Election of 2010 Series B (GO Revenue, AGM Insured) ¤ | | | 0.00 | | | | 8-1-2034 | | | | 2,530,000 | | | | 1,224,141 | |
| | | | |
| | | | | | | | | | | | | | | 193,605,937 | |
| | | | | | | | | | | | | | | | |
| | | | |
| Colorado: 2.89% | | | | | | | | | | | | | | | | |
Colorado E-470 Public Highway Authority CAB Series B (Transportation Revenue, National Insured) ¤ | | | 0.00 | | | | 9-1-2020 | | | | 9,385,000 | | | | 8,516,512 | |
Colorado E-470 Public Highway Authority CAB Series B (Transportation Revenue, National Insured) ¤ | | | 0.00 | | | | 9-1-2022 | | | | 4,600,000 | | | | 3,906,458 | |
Colorado ECFA Charter School American Academy Project (Education Revenue) | | | 7.13 | | | | 12-1-2033 | | | | 2,200,000 | | | | 2,481,028 | |
Colorado ECFA Charter School Banning Lewis Ranch Academy Project Series A (Education Revenue) | | | 6.00 | | | | 12-15-2037 | | | | 2,900,000 | | | | 2,642,712 | |
| | | | |
| 4 | | Wells Fargo Municipal Bond Fund | | Portfolio of investments—December 31, 2016 (unaudited) |
| | | | | | | | | | | | | | | | |
| Security name | | Interest rate | | | Maturity date | | | Principal | | | Value | |
| | | | |
| Colorado (continued) | | | | | | | | | | | | | | | | |
Colorado ECFA Charter School Banning Lewis Ranch Academy Project Series B-2 (Education Revenue) | | | 7.00 | % | | | 12-15-2046 | | | $ | 3,940,000 | | | $ | 3,572,319 | |
Colorado ECFA Charter School Community Leadership Academy (Education Revenue) | | | 5.75 | | | | 7-1-2019 | | | | 555,000 | | | | 568,620 | |
Colorado ECFA Charter School Community Leadership Academy Second Campus Project (Education Revenue) | | | 7.00 | | | | 8-1-2033 | | | | 1,330,000 | | | | 1,504,696 | |
Colorado ECFA Charter School Monument Academy Project Series A (Education Revenue) | | | 5.50 | | | | 10-1-2017 | | | | 60,000 | | | | 61,694 | |
Colorado ECFA Charter School Monument Academy Project Series A (Education Revenue) | | | 7.25 | | | | 10-1-2039 | | | | 500,000 | | | | 551,695 | |
Colorado ECFA Charter School Rocky Mountain Classical Academy Project Series A (Education Revenue) | | | 7.50 | | | | 9-1-2033 | | | | 5,015,000 | | | | 5,431,496 | |
Colorado ECFA Charter School Rocky Mountain Classical Academy Project Series A (Education Revenue) | | | 8.00 | | | | 9-1-2043 | | | | 5,930,000 | | | | 6,583,605 | |
Colorado ECFA Charter School Rocky Mountain Classical Academy Project Series A (Education Revenue) | | | 8.13 | | | | 9-1-2048 | | | | 3,795,000 | | | | 4,226,264 | |
Colorado ECFA Charter School Twin Peaks Charter Academy (Miscellaneous Revenue) | | | 6.50 | | | | 3-15-2043 | | | | 1,290,000 | | | | 1,400,153 | |
Colorado Health Facilities Authority Catholic Health Initiative Series 2009A (Health Revenue) | | | 5.00 | | | | 7-1-2039 | | | | 14,100,000 | | | | 14,452,923 | |
Colorado Health Facilities Authority Catholic Health Initiatives Series D-1 (Health Revenue) | | | 6.25 | | | | 10-1-2033 | | | | 4,000,000 | | | | 4,287,640 | |
Colorado High Performance Transportation Enterprise U.S. 36 and I- 25 Managed Lanes (Transportation Revenue) | | | 5.75 | | | | 1-1-2044 | | | | 2,160,000 | | | | 2,278,822 | |
Colorado PFA Charter School Highline Academy Project (Education Revenue) | | | 6.25 | | | | 12-15-2020 | | | | 280,000 | | | | 292,830 | |
Colorado PFA Charter School Highline Academy Project (Education Revenue) | | | 6.75 | | | | 12-15-2025 | | | | 455,000 | | | | 486,036 | |
Colorado PFA Charter School Highline Academy Project (Education Revenue) | | | 7.38 | | | | 12-15-2040 | | | | 4,010,000 | | | | 4,345,838 | |
Denver CO Convention Center Hotel Authority (Industrial Development Revenue) | | | 5.00 | | | | 12-1-2030 | | | | 2,000,000 | | | | 2,198,620 | |
Denver CO Convention Center Hotel Authority (Industrial Development Revenue) | | | 5.00 | | | | 12-1-2031 | | | | 1,500,000 | | | | 1,639,770 | |
Denver CO Convention Center Hotel Authority (Industrial Development Revenue) | | | 5.00 | | | | 12-1-2040 | | | | 2,000,000 | | | | 2,125,300 | |
Eagle County CO Airport Terminal Corporation Airport Terminal Improvement Project Series A (Airport Revenue) | | | 5.15 | | | | 5-1-2017 | | | | 35,000 | | | | 35,057 | |
Eagle County CO Airport Terminal Corporation Airport Terminal Improvement Project Series B (Airport Revenue) | | | 5.25 | | | | 5-1-2020 | | | | 750,000 | | | | 751,253 | |
| | | | |
| | | | | | | | | | | | | | | 74,341,341 | |
| | | | | | | | | | | | | | | | |
| | | | |
| Connecticut: 0.64% | | | | | | | | | | | | | | | | |
Connecticut HFA Special Needs Housing Series 2 (Health Revenue, Ambac Insured) | | | 5.25 | | | | 6-15-2022 | | | | 1,315,000 | | | | 1,319,090 | |
Connecticut Series A (Miscellaneous Revenue) ± | | | 1.82 | | | | 4-15-2019 | | | | 4,050,000 | | | | 4,069,683 | |
Connecticut Series A (Miscellaneous Revenue) ± | | | 1.97 | | | | 4-15-2020 | | | | 5,900,000 | | | | 5,953,513 | |
Hamden CT BAN (GO Revenue) | | | 5.00 | | | | 8-15-2026 | | | | 1,235,000 | | | | 1,363,885 | |
Hartford CT Series B (GO Revenue) | | | 5.00 | | | | 4-1-2025 | | | | 1,220,000 | | | | 1,252,684 | |
Hartford CT Series B (GO Revenue) | | | 5.00 | | | | 4-1-2026 | | | | 1,470,000 | | | | 1,501,737 | |
Hartford CT Series B (GO Revenue) | | | 5.00 | | | | 4-1-2027 | | | | 1,000,000 | | | | 1,016,570 | |
| | | | |
| | | | | | | | | | | | | | | 16,477,162 | |
| | | | | | | | | | | | | | | | |
| | | | |
| Delaware: 0.38% | | | | | | | | | | | | | | | | |
Delaware EDA Odyssey Charter School Incorporated Project Series A (Education Revenue) 144A | | | 7.00 | | | | 9-1-2045 | | | | 7,500,000 | | | | 7,480,575 | |
Kent County DE Charter School Incorporated Project (Education Revenue) | | | 7.38 | | | | 5-1-2037 | | | | 2,110,000 | | | | 2,359,592 | |
| | | | |
| | | | | | | | | | | | | | | 9,840,167 | |
| | | | | | | | | | | | | | | | |
| | | | | | |
| Portfolio of investments—December 31, 2016 (unaudited) | | Wells Fargo Municipal Bond Fund | | | 5 | |
| | | | | | | | | | | | | | | | |
| Security name | | Interest rate | | | Maturity date | | | Principal | | | Value | |
| | | | |
| District of Columbia: 0.23% | | | | | | | | | | | | | | | | |
District of Columbia Cesar Chavez Public Charter School (Education Revenue) | | | 6.50 | % | | | 11-15-2021 | | | $ | 3,545,000 | | | $ | 3,794,320 | |
District of Columbia Water & Sewer Authority Public Utilities Series A (Water & Sewer Revenue) | �� | | 6.00 | | | | 10-1-2035 | | | | 2,000,000 | | | | 2,165,780 | |
| | | | |
| | | | | | | | | | | | | | | 5,960,100 | |
| | | | | | | | | | | | | | | | |
| | | | |
| Florida: 3.90% | | | | | | | | | | | | | | | | |
Championsgate FL Community Development District Capital Improvement Series A (Miscellaneous Revenue) | | | 6.25 | | | | 5-1-2020 | | | | 1,045,000 | | | | 1,044,770 | |
CityPlace Florida Community Development District (Miscellaneous Revenue) | | | 5.00 | | | | 5-1-2022 | | | | 1,000,000 | | | | 1,089,850 | |
Collier County FL School Board Refunding Certificate of Participation (Miscellaneous Revenue, AGM Insured) | | | 5.25 | | | | 2-15-2021 | | | | 1,000,000 | | | | 1,127,520 | |
Crossings at Fleming Island Florida Community Development District Refunding Senior Lien Series A-1 (Miscellaneous Revenue) | | | 2.25 | | | | 5-1-2018 | | | | 1,260,000 | | | | 1,255,111 | |
Crossings at Fleming Island Florida Community Development District Refunding Senior Lien Series A-1 (Miscellaneous Revenue) | | | 2.63 | | | | 5-1-2019 | | | | 1,295,000 | | | | 1,286,401 | |
Daytona Beach FL Refunding & Improvement Project (Water & Sewer Revenue, AGM Insured) | | | 5.00 | | | | 11-1-2031 | | | | 1,155,000 | | | | 1,297,504 | |
Daytona Beach FL Refunding & Improvement Project (Water & Sewer Revenue, AGM Insured) | | | 5.00 | | | | 11-1-2032 | | | | 1,465,000 | | | | 1,640,712 | |
Florida Development Finance Corporation Educational Facilities Renaissance Charter School Project Series A (Education Revenue) | | | 8.50 | | | | 6-15-2044 | | | | 13,290,000 | | | | 15,214,924 | |
Florida Housing Finance Corporation Journet Place Apartments Series 1 (Housing Revenue) | | | 7.60 | | | | 12-15-2047 | | | | 805,000 | | | | 966,298 | |
Florida Housing Finance Corporation Villa Capri Phase III (Housing Revenue) | | | 7.60 | | | | 12-15-2042 | | | | 2,705,000 | | | | 2,941,715 | |
Heritage Harbor Florida Community Development District (Miscellaneous Revenue) | | | 7.75 | | | | 5-1-2023 | | | | 375,000 | | | | 358,733 | |
Holmes County FL Hospital Corporation Doctors Memorial Hospital Project (Health Revenue) | | | 6.00 | | | | 11-1-2038 | | | | 2,500,000 | | | | 2,475,750 | |
Indigo FL Community Development District Series C (Miscellaneous Revenue) (i)(s) | | | 1.40 | | | | 5-1-2030 | | | | 2,536,248 | | | | 1,282,479 | |
Lakeland FL Educational Facilities Authority Florida Southern College Project Series A (Education Revenue) | | | 5.00 | | | | 9-1-2025 | | | | 530,000 | | | | 588,168 | |
Lakeland FL Educational Facilities Authority Florida Southern College Project Series A (Education Revenue) | | | 5.00 | | | | 9-1-2028 | | | | 1,195,000 | | | | 1,314,333 | |
Lakeside Plantation FL Community Development District Series A (Miscellaneous Revenue) | | | 6.95 | | | | 5-1-2031 | | | | 1,186,000 | | | | 1,186,522 | |
Marshall Creek Florida Community Development District (Miscellaneous Revenue) | | | 6.32 | | | | 5-1-2045 | | | | 135,000 | | | | 124,278 | |
Marshall Creek Florida Community Development District (Miscellaneous Revenue) (s) | | | 6.63 | | | | 5-1-2032 | | | | 2,110,000 | | | | 2,067,167 | |
Miami-Dade County FL School District (GO Revenue) | | | 5.00 | | | | 3-15-2046 | | | | 25,000,000 | | | | 27,392,750 | |
Miami-Dade County FL Seaport AMT Series B (Airport Revenue) | | | 6.00 | | | | 10-1-2033 | | | | 500,000 | | | | 590,380 | |
Midtown Miami FL Community Development District Parking Garage Project Series A (Miscellaneous Revenue) | | | 5.00 | | | | 5-1-2029 | | | | 2,495,000 | | | | 2,573,792 | |
Orlando FL Capital Improvement Special Revenue Series B (Miscellaneous Revenue) | | | 5.00 | | | | 10-1-2033 | | | | 1,525,000 | | | | 1,715,427 | |
Orlando FL Capital Improvement Special Revenue Series B (Miscellaneous Revenue) | | | 5.00 | | | | 10-1-2035 | | | | 1,680,000 | | | | 1,875,098 | |
Orlando FL Capital Improvement Special Revenue Series B (Miscellaneous Revenue) | | | 5.00 | | | | 10-1-2036 | | | | 1,765,000 | | | | 1,964,851 | |
Palm Beach County FL Public Improvement Series 2 (Miscellaneous Revenue) | | | 5.38 | | | | 11-1-2028 | | | | 2,000,000 | | | | 2,149,740 | |
St. Petersburg FL Health Facilities Authority All Children’s Project Series A (Health Revenue) | �� | | 6.50 | | | | 11-15-2039 | | | | 5,500,000 | | | | 6,250,035 | |
| | | | |
| 6 | | Wells Fargo Municipal Bond Fund | | Portfolio of investments—December 31, 2016 (unaudited) |
| | | | | | | | | | | | | | | | |
| Security name | | Interest rate | | | Maturity date | | | Principal | | | Value | |
| | | | |
| Florida (continued) | | | | | | | | | | | | | | | | |
Seminole County FL IDA Choices in Learning Series A (Education Revenue) | | | 6.20 | % | | | 11-15-2026 | | | $ | 1,815,000 | | | $ | 1,953,539 | |
Seminole County FL IDA Choices in Learning Series A (Education Revenue) | | | 7.38 | | | | 11-15-2041 | | | | 3,525,000 | | | | 3,918,496 | |
South Miami FL Health Facilities Baptist Health (Health Revenue) | | | 5.00 | | | | 8-15-2023 | | | | 2,810,000 | | | | 2,875,614 | |
St. Johns County FL IDA Refunding Glenmoor Project Series A (Health Revenue) ±(s)(t) | | | 1.34 | | | | 1-1-2049 | | | | 750,000 | | | | 509,805 | |
St. Johns County FL IDA Refunding Subordinated Glenmoor Project Series B (Health Revenue) (s)(t) | | | 2.50 | | | | 1-1-2049 | | | | 277,527 | | | | 3 | |
Trout Creek Florida Community Development District (Miscellaneous Revenue) | | | 4.88 | | | | 5-1-2025 | | | | 2,545,000 | | | | 2,470,202 | |
Viera East FL Community Development District Water Management Project (Water & Sewer Revenue, National Insured) | | | 5.75 | | | | 5-1-2020 | | | | 2,020,000 | | | | 2,140,776 | |
Viera East FL Community Development District Water Management Project (Water & Sewer Revenue, National Insured) | | | 5.75 | | | | 5-1-2021 | | | | 2,140,000 | | | | 2,295,878 | |
Viera East FL Community Development District Water Management Project (Water & Sewer Revenue, National Insured) | | | 5.75 | | | | 5-1-2022 | | | | 2,265,000 | | | | 2,453,969 | |
| | | | |
| | | | | | | | | | | | | | | 100,392,590 | |
| | | | | | | | | | | | | | | | |
| | | | |
| Georgia: 0.38% | | | | | | | | | | | | | | | | |
Cobb County GA Development Authority Charter Learning Center Foundation Central Project Series A (Education Revenue) | | | 6.38 | | | | 7-1-2025 | | | | 1,920,000 | | | | 1,802,016 | |
Georgia Municipal Electric Authority Power Series EE (Utilities Revenue, Ambac Insured) | | | 7.25 | | | | 1-1-2024 | | | | 400,000 | | | | 518,976 | |
Georgia Private Colleges & Universities Authority Series A (Education Revenue) | | | 5.25 | | | | 10-1-2027 | | | | 2,630,000 | | | | 2,882,533 | |
Georgia Road & Tollway Authority CAB I-75 South Expressway Lanes Project Series A (Transportation Revenue) 144A¤ | | | 0.00 | | | | 6-1-2034 | | | | 3,750,000 | | | | 1,181,925 | |
Georgia Road & Tollway Authority CCAB I-75 South Expressway Lanes Project Series B (Transportation Revenue) 144A± | | | 0.00 | | | | 6-1-2049 | | | | 5,600,000 | | | | 3,391,808 | |
| | | | |
| | | | | | | | | | | | | | | 9,777,258 | |
| | | | | | | | | | | | | | | | |
| | | | |
| Guam: 0.16% | | | | | | | | | | | | | | | | |
Guam Government Limited Obligation Section 30 Series A (Miscellaneous Revenue) | | | 5.38 | | | | 12-1-2024 | | | | 3,195,000 | | | | 3,531,817 | |
Guam Government Waterworks Authority Water & Wastewater System Project Series 2010 (Water & Sewer Revenue) | | | 5.00 | | | | 7-1-2019 | | | | 450,000 | | | | 482,000 | |
Guam Housing Corporation Guaranteed Mortgage-Backed Securities Series A (Housing Revenue, FHLMC Insured) | | | 5.75 | | | | 9-1-2031 | | | | 60,000 | | | | 62,152 | |
| | | | |
| | | | | | | | | | | | | | | 4,075,969 | |
| | | | | | | | | | | | | | | | |
| | | | |
| Hawaii: 0.12% | | | | | | | | | | | | | | | | |
Hawaii Prerefunded Series DZ (GO Revenue) | | | 5.00 | | | | 12-1-2031 | | | | 1,670,000 | | | | 1,917,928 | |
Hawaii Unrefunded Series DZ (GO Revenue) | | | 5.00 | | | | 12-1-2031 | | | | 1,030,000 | | | | 1,149,356 | |
| | | | |
| | | | | | | | | | | | | | | 3,067,284 | |
| | | | | | | | | | | | | | | | |
| | | | |
| Idaho: 0.69% | | | | | | | | | | | | | | | | |
Boise-Kuna ID Irrigation District Arrowrock Hydroelectric Project (Utilities Revenue) | | | 7.38 | | | | 6-1-2040 | | | | 6,300,000 | | | | 6,844,698 | |
Idaho Health Facilities Authority Trinity Health Credit Group Series B (Health Revenue) | | | 6.25 | | | | 12-1-2033 | | | | 3,000,000 | | | | 3,278,850 | |
Idaho Housing & Finance Association Idaho Arts Charter School Incorporated Project Series A (Education Revenue) | | | 5.75 | | | | 12-1-2032 | | | | 500,000 | | | | 543,775 | |
Idaho Housing & Finance Association Idaho Arts Charter School Incorporated Project Series A (Education Revenue) | | | 6.50 | | | | 12-1-2038 | | | | 1,405,000 | | | | 1,540,906 | |
Idaho Housing & Finance Association Legacy Public Charter School Incorporated Project Series A (Education Revenue) | | | 5.85 | | | | 5-1-2033 | | | | 730,000 | | | | 745,564 | |
| | | | | | |
| Portfolio of investments—December 31, 2016 (unaudited) | | Wells Fargo Municipal Bond Fund | | | 7 | |
| | | | | | | | | | | | | | | | |
| Security name | | Interest rate | | | Maturity date | | | Principal | | | Value | |
| | | | |
| Idaho (continued) | | | | | | | | | | | | | | | | |
Idaho Housing & Finance Association Legacy Public Charter School Incorporated Project Series A (Education Revenue) | | | 6.25 | % | | | 5-1-2043 | | | $ | 1,365,000 | | | $ | 1,420,501 | |
Idaho Housing & Finance Association Liberty Charter School Series A (Education Revenue) | | | 6.00 | | | | 6-1-2038 | | | | 500,000 | | | | 511,145 | |
Idaho Housing & Finance Association Nonprofit CAB North Star Charter School Series A (Education Revenue) | | | 6.75 | | | | 7-1-2048 | | | | 1,322,876 | | | | 1,242,868 | |
Idaho Housing & Finance Association Nonprofit CAB North Star Charter School Series B (Education Revenue) 144A¤ | | | 0.00 | | | | 7-1-2049 | | | | 1,276,564 | | | | 106,491 | |
Idaho Housing & Finance Association Series A (Education Revenue) | | | 6.13 | | | | 7-1-2038 | | | | 1,500,000 | | | | 1,606,845 | |
| | | | |
| | | | | | | | | | | | | | | 17,841,643 | |
| | | | | | | | | | | | | | | | |
| | | | |
| Illinois: 19.70% | | | | | | | | | | | | | | | | |
Chicago IL (Tax Revenue) | | | 5.00 | | | | 1-1-2028 | | | | 4,430,000 | | | | 4,721,450 | |
Chicago IL (Tax Revenue) | | | 5.00 | | | | 1-1-2029 | | | | 1,500,000 | | | | 1,590,255 | |
Chicago IL Board of Education CAB City Colleges (GO Revenue, National Insured) ¤ | | | 0.00 | | | | 1-1-2025 | | | | 9,935,000 | | | | 6,920,224 | |
Chicago IL Board of Education CAB School Reform Series A (GO Revenue, National Insured) ¤ | | | 0.00 | | | | 12-1-2023 | | | | 9,455,000 | | | | 6,972,684 | |
Chicago IL Board of Education CAB School Reform Series A (GO Revenue, National Insured) ¤ | | | 0.00 | | | | 12-1-2029 | | | | 7,885,000 | | | | 4,114,708 | |
Chicago IL Board of Education CAB School Reform Series A (GO Revenue, National Insured) ¤ | | | 0.00 | | | | 12-1-2020 | | | | 1,000,000 | | | | 858,020 | |
Chicago IL Board of Education CAB School Reform Series A (GO Revenue, National Insured) �� | | | 0.00 | | | | 12-1-2031 | | | | 2,705,000 | | | | 1,257,176 | |
Chicago IL Board of Education CAB School Reform Series B-1 (GO Revenue, National Insured) ¤ | | | 0.00 | | | | 12-1-2023 | | | | 1,430,000 | | | | 1,054,568 | |
Chicago IL Board of Education CAB School Reform Series B-1 (GO Revenue, National Insured) ¤ | | | 0.00 | | | | 12-1-2030 | | | | 4,550,000 | | | | 2,239,692 | |
Chicago IL Board of Education CAB School Reform Series B-1 (GO Revenue, National Insured) ¤ | | | 0.00 | | | | 12-1-2026 | | | | 4,000,000 | | | | 2,493,080 | |
Chicago IL Board of Education CAB School Reform Series B-1 (GO Revenue, National Insured) ¤ | | | 0.00 | | | | 12-1-2028 | | | | 24,270,000 | | | | 13,409,175 | |
Chicago IL Board of Education CAB School Reform Series B-1 (GO Revenue, National Insured) ¤ | | | 0.00 | | | | 12-1-2031 | | | | 10,000,000 | | | | 4,637,400 | |
Chicago IL Board of Education Series A (GO Revenue, National Insured) ¤ | | | 0.00 | | | | 12-1-2027 | | | | 4,040,000 | | | | 2,374,954 | |
Chicago IL Board of Education Series C (GO Revenue, AGM Insured) | | | 5.25 | | | | 12-1-2023 | | | | 1,500,000 | | | | 1,566,465 | |
Chicago IL Board of Education Series D (GO Revenue, AGM Insured) | | | 5.00 | | | | 12-1-2025 | | | | 1,430,000 | | | | 1,458,986 | |
Chicago IL CAB City Colleges (GO Revenue, National Insured) ¤ | | | 0.00 | | | | 1-1-2030 | | | | 5,745,000 | | | | 3,026,638 | |
Chicago IL CAB Project & Refunding Series A (GO Revenue, National Insured) | | | 5.56 | | | | 1-1-2021 | | | | 3,520,000 | | | | 3,531,123 | |
Chicago IL CAB Project & Refunding Series C (GO Revenue, AGM Insured) ¤ | | | 0.00 | | | | 1-1-2026 | | | | 7,360,000 | | | | 4,865,770 | |
Chicago IL CAB Series C (GO Revenue) ¤ | | | 0.00 | | | | 1-1-2031 | | | | 4,945,000 | | | | 1,997,384 | |
Chicago IL Motor Fuel Refunding (Tax Revenue) | | | 5.00 | | | | 1-1-2025 | | | | 2,595,000 | | | | 2,724,646 | |
Chicago IL Motor Fuel Refunding (Tax Revenue) | | | 5.00 | | | | 1-1-2026 | | | | 3,000,000 | | | | 3,129,510 | |
Chicago IL Motor Fuel Refunding (Tax Revenue) | | | 5.00 | | | | 1-1-2028 | | | | 1,000,000 | | | | 1,032,170 | |
Chicago IL Neighborhoods Alive 21 Program Series B (GO Revenue) | | | 5.50 | | | | 1-1-2034 | | | | 1,500,000 | | | | 1,440,795 | |
Chicago IL O’Hare International Airport (Airport Revenue, AGM Insured) | | | 5.50 | | | | 1-1-2043 | | | | 4,530,000 | | | | 5,060,871 | |
Chicago IL O’Hare International Airport (Airport Revenue) | | | 5.75 | | | | 1-1-2038 | | | | 7,500,000 | | | | 8,449,725 | |
Chicago IL O’Hare International Airport AMT Passenger Facility Charge Series B (Airport Revenue) | | | 5.00 | | | | 1-1-2026 | | | | 5,000,000 | | | | 5,475,950 | |
Chicago IL O’Hare International Airport AMT Senior Lien Series A (Airport Revenue) | | | 5.00 | | | | 1-1-2025 | | | | 2,000,000 | | | | 2,207,020 | |
Chicago IL O’Hare International Airport AMT Senior Lien Series C (Airport Revenue) | | | 5.50 | | | | 1-1-2044 | | | | 4,000,000 | | | | 4,404,720 | |
Chicago IL O’Hare International Airport Customer Facility Charge Senior Lien Series D (Airport Revenue) | | | 5.75 | | | | 1-1-2043 | | | | 4,500,000 | | | | 5,059,440 | |
| | | | |
| 8 | | Wells Fargo Municipal Bond Fund | | Portfolio of investments—December 31, 2016 (unaudited) |
| | | | | | | | | | | | | | | | |
| Security name | | Interest rate | | | Maturity date | | | Principal | | | Value | |
| | | | |
| Illinois (continued) | | | | | | | | | | | | | | | | |
Chicago IL O’Hare International Airport Third Lien Series A (Airport Revenue) | | | 5.75 | % | | | 1-1-2039 | | | $ | 2,760,000 | | | $ | 3,090,703 | |
Chicago IL Public Building Commission Transit Authority (Transportation Revenue, Ambac Insured) | | | 5.25 | | | | 3-1-2025 | | | | 2,960,000 | | | | 3,244,071 | |
Chicago IL Public Building Commission Transit Authority (Transportation Revenue, Ambac Insured) | | | 5.25 | | | | 3-1-2027 | | | | 3,400,000 | | | | 3,746,154 | |
Chicago IL Second Lien Project (Water & Sewer Revenue) | | | 5.00 | | | | 11-1-2029 | | | | 4,600,000 | | | | 4,980,926 | |
Chicago IL Series A (GO Revenue, National Insured) | | | 5.00 | | | | 1-1-2029 | | | | 4,000,000 | | | | 4,010,640 | |
Chicago IL Series A (Tax Revenue) | | | 5.25 | | | | 1-1-2038 | | | | 6,000,000 | | | | 6,169,800 | |
Chicago IL Series A (GO Revenue) | | | 5.50 | | | | 1-1-2034 | | | | 7,175,000 | | | | 6,891,803 | |
Chicago IL Series A (GO Revenue) | | | 5.50 | | | | 1-1-2035 | | | | 920,000 | | | | 881,489 | |
Chicago IL Series A (GO Revenue, AGM Insured) | | | 5.00 | | | | 1-1-2028 | | | | 9,550,000 | | | | 10,100,176 | |
Chicago IL Series A (GO Revenue) | | | 5.50 | | | | 1-1-2033 | | | | 12,730,000 | | | | 12,245,496 | |
Chicago IL Series B (GO Revenue) | | | 5.50 | | | | 1-1-2032 | | | | 1,285,000 | | | | 1,232,688 | |
Chicago IL Transit Authority Sales Tax Receipts Bonds (Tax Revenue, AGM Insured) | | | 5.00 | | | | 12-1-2044 | | | | 4,000,000 | | | | 4,263,520 | |
Chicago IL Wastewater Transmission Second Lien Revenue Project Series 2012 (Water & Sewer Revenue) | | | 5.00 | | | | 1-1-2027 | | | | 4,000,000 | | | | 4,315,040 | |
Chicago IL Wastewater Transmission Second Lien Revenue Project Series B (Water & Sewer Revenue, National Insured) | | | 5.00 | | | | 1-1-2030 | | | | 2,500,000 | | | | 2,504,200 | |
Chicago IL Waterworks Second Lien Revenue Project Series 2012 (Water & Sewer Revenue) | | | 5.00 | | | | 11-1-2030 | | | | 5,000,000 | | | | 5,400,800 | |
Cook County IL Series A (GO Revenue) | | | 5.25 | | | | 11-15-2022 | | | | 3,000,000 | | | | 3,279,720 | |
Cook County IL Series C (GO Revenue, AGM Insured) | | | 5.00 | | | | 11-15-2024 | | | | 4,240,000 | | | | 4,717,085 | |
Cook County IL Series C (GO Revenue) | | | 5.00 | | | | 11-15-2025 | | | | 2,140,000 | | | | 2,354,685 | |
Cook County IL Series C (GO Revenue) | | | 5.00 | | | | 11-15-2027 | | | | 325,000 | | | | 355,638 | |
Cook County IL Series G (GO Revenue) | | | 5.00 | | | | 11-15-2028 | | | | 27,000,000 | | | | 28,663,470 | |
DeKalb-Kane-Lasalle Counties IL Kishwaukee Community College District #523 Series B (GO Revenue) ¤ | | | 0.00 | | | | 2-1-2019 | | | | 725,000 | | | | 695,507 | |
Illinois (Miscellaneous Revenue) | | | 5.00 | | | | 8-1-2024 | | | | 2,610,000 | | | | 2,674,702 | |
Illinois (Miscellaneous Revenue) | | | 5.00 | | | | 8-1-2025 | | | | 5,685,000 | | | | 5,790,570 | |
Illinois (GO Revenue, AGM Insured) | | | 5.00 | | | | 4-1-2026 | | | | 3,000,000 | | | | 3,194,880 | |
Illinois (Miscellaneous Revenue) | | | 5.25 | | | | 7-1-2030 | | | | 2,500,000 | | | | 2,535,725 | |
Illinois (Miscellaneous Revenue) | | | 5.50 | | | | 7-1-2025 | | | | 6,000,000 | | | | 6,297,180 | |
Illinois (Miscellaneous Revenue) | | | 5.50 | | | | 7-1-2026 | | | | 4,450,000 | | | | 4,636,099 | |
Illinois (GO Revenue) | | | 5.50 | | | | 1-1-2030 | | | | 2,900,000 | | | | 3,068,722 | |
Illinois (Miscellaneous Revenue) | | | 5.50 | | | | 7-1-2038 | | | | 4,000,000 | | | | 4,074,320 | |
Illinois Finance Authority Advocate Healthcare Network Series D (Health Revenue) | | | 6.50 | | | | 11-1-2038 | | | | 5,415,000 | | | | 5,927,584 | |
Illinois Finance Authority Centegra Health System Project (Health Revenue) | | | 5.00 | | | | 9-1-2018 | | | | 1,325,000 | | | | 1,388,547 | |
Illinois Finance Authority Centegra Health System Project (Health Revenue) | | | 5.00 | | | | 9-1-2020 | | | | 1,465,000 | | | | 1,589,715 | |
Illinois Finance Authority Charter School Refunding Bond Series A (Education Revenue) | | | 6.88 | | | | 10-1-2031 | | | | 1,800,000 | | | | 1,957,662 | |
Illinois Finance Authority Charter Schools Series A (Education Revenue) | | | 6.25 | | | | 9-1-2039 | | | | 7,955,000 | | | | 8,768,081 | |
Illinois Finance Authority Charter Schools Series A (Education Revenue) | | | 7.13 | | | | 10-1-2041 | | | | 3,800,000 | | | | 4,154,236 | |
Illinois Finance Authority Medical District Commission Project A (Health Revenue, AGC Insured) | | | 4.13 | | | | 9-1-2018 | | | | 350,000 | | | | 350,665 | |
Illinois Finance Authority Northwestern Memorial Hospital Project Series A (Health Revenue) | | | 6.00 | | | | 8-15-2039 | | | | 5,000,000 | | | | 5,541,400 | |
Illinois Finance Authority Student Housing Illinois State University (Education Revenue) | | | 6.75 | | | | 4-1-2031 | | | | 8,000,000 | | | | 8,776,480 | |
Illinois Finance Authority University of Chicago Series B (Education Revenue) | | | 6.25 | | | | 7-1-2038 | | | | 3,115,000 | | | | 3,344,202 | |
Illinois Municipal Electric Agency Power Supply System Series A (Utilities Revenue) | | | 5.00 | | | | 2-1-2030 | | | | 7,000,000 | | | | 7,933,590 | |
Illinois Municipal Electric Agency Power Supply System Series A (Utilities Revenue) | | | 5.00 | | | | 2-1-2031 | | | | 8,000,000 | | | | 9,034,960 | |
| | | | | | |
| Portfolio of investments—December 31, 2016 (unaudited) | | Wells Fargo Municipal Bond Fund | | | 9 | |
| | | | | | | | | | | | | | | | |
| Security name | | Interest rate | | | Maturity date | | | Principal | | | Value | |
| | | | |
| Illinois (continued) | | | | | | | | | | | | | | | | |
Illinois Series 1 (GO Revenue, National Insured) | | | 6.00 | % | | | 11-1-2026 | | | $ | 3,200,000 | | | $ | 3,659,040 | |
Illinois Series 2013 (Miscellaneous Revenue) | | | 5.00 | | | | 7-1-2022 | | | | 6,750,000 | | | | 7,023,105 | |
Illinois Series A (GO Revenue) | | | 5.00 | | | | 4-1-2021 | | | | 6,675,000 | | | | 6,958,554 | |
Illinois Series A (GO Revenue, AGM Insured) | | | 5.00 | | | | 4-1-2024 | | | | 3,000,000 | | | | 3,206,280 | |
Illinois Sports Facilities Authority State Tax Supported CAB (Tax Revenue, Ambac Insured) ¤ | | | 0.00 | | | | 6-15-2026 | | | | 1,525,000 | | | | 1,018,593 | |
Illinois Sports Facilities Authority State Tax Supported CAB (Tax Revenue, Ambac Insured) ¤ | | | 0.00 | | | | 6-15-2021 | | | | 7,595,000 | | | | 6,504,814 | |
Illinois Sports Facilities Authority State Tax Supported CAB (Tax Revenue, Ambac Insured) ¤ | | | 0.00 | | | | 6-15-2022 | | | | 1,905,000 | | | | 1,553,147 | |
Illinois Sports Facilities Authority State Tax Supported CAB (Tax Revenue, Ambac Insured) ¤ | | | 0.00 | | | | 6-15-2024 | | | | 17,510,000 | | | | 12,883,508 | |
Illinois Sports Facilities Authority State Tax Supported CAB (Tax Revenue, Ambac Insured) ¤ | | | 0.00 | | | | 6-15-2025 | | | | 2,515,000 | | | | 1,761,808 | |
Illinois Sports Facilities Authority State Tax Supported Refunding Bonds (Tax Revenue, AGM Insured) | | | 5.00 | | | | 6-15-2028 | | | | 4,030,000 | | | | 4,414,664 | |
Illinois Sports Facilities Authority State Tax Supported Refunding Bonds (Tax Revenue, AGM Insured) | | | 5.00 | | | | 6-15-2025 | | | | 3,745,000 | | | | 4,145,528 | |
Illinois Sports Facilities Authority State Tax Supported Refunding Bonds (Tax Revenue, AGM Insured) | | | 5.00 | | | | 6-15-2026 | | | | 4,775,000 | | | | 5,271,505 | |
Illinois Sports Facilities Authority State Tax Supported Refunding Bonds (Tax Revenue, AGM Insured) | | | 5.00 | | | | 6-15-2027 | | | | 8,355,000 | | | | 9,219,074 | |
Illinois Sports Facilities Authority State Tax Supported Refunding Bonds (Tax Revenue, AGM Insured) | | | 5.25 | | | | 6-15-2032 | | | | 3,500,000 | | | | 3,831,625 | |
Illinois Toll Highway Authority Series B (Transportation Revenue) | | | 5.00 | | | | 1-1-2039 | | | | 1,500,000 | | | | 1,648,440 | |
Kane-Cook-DuPage Counties IL School District #46 CAB Series B (GO Revenue, Ambac Insured) ¤ | | | 0.00 | | | | 1-1-2023 | | | | 8,225,000 | | | | 7,144,482 | |
Kane-Cook-DuPage Counties IL School District #46 CAB Series B (GO Revenue, Ambac Insured) ¤ | | | 0.00 | | | | 1-1-2023 | | | | 15,025,000 | | | | 12,447,311 | |
Kendall-Kane-Will Counties IL CAB School District #308 (GO Revenue, AGM Insured) ¤ | | | 0.00 | | | | 2-1-2025 | | | | 1,525,000 | | | | 1,162,492 | |
Kendall-Kane-Will Counties IL CAB School District #308 (GO Revenue, AGM Insured) ¤ | | | 0.00 | | | | 2-1-2026 | | | | 5,050,000 | | | | 3,689,934 | |
Kendall-Kane-Will Counties IL CAB School District #308 (GO Revenue, AGM Insured) ¤ | | | 0.00 | | | | 2-1-2027 | | | | 12,050,000 | | | | 8,437,892 | |
Lake County IL School District #24 Millburn CAB (GO Revenue, National Insured) ¤ | | | 0.00 | | | | 1-1-2024 | | | | 2,000,000 | | | | 1,551,400 | |
Lake County IL School District #38 Big Hollow CAB (GO Revenue, Ambac Insured) ¤ | | | 0.00 | | | | 2-1-2018 | | | | 3,800,000 | | | | 3,700,592 | |
Lake County IL School District #38 Big Hollow CAB (GO Revenue, Ambac Insured) ¤ | | | 0.00 | | | | 2-1-2019 | | | | 675,000 | | | | 634,993 | |
Lake County IL School District #38 Big Hollow CAB (GO Revenue, Ambac Insured) ¤ | | | 0.00 | | | | 2-1-2020 | | | | 1,250,000 | | | | 1,133,713 | |
Lake County IL School District #38 Big Hollow CAB (GO Revenue, Ambac Insured) ¤ | | | 0.00 | | | | 2-1-2021 | | | | 1,175,000 | | | | 1,025,493 | |
Lake County IL School District #38 Big Hollow CAB (GO Revenue, Ambac Insured) ¤ | | | 0.00 | | | | 2-1-2024 | | | | 5,385,000 | | | | 4,151,027 | |
Lake County IL Township High School District #126 Zion-Benton CAB (GO Revenue, National Insured) ¤ | | | 0.00 | | | | 2-1-2020 | | | | 910,000 | | | | 840,221 | |
McHenry-Kane Counties IL Community Consolidated School District #158 (GO Revenue) | | | 5.63 | | | | 1-15-2032 | | | | 2,500,000 | | | | 2,828,650 | |
McHenry-Kane Counties IL Community Consolidated School District #158 CAB (GO Revenue, National Insured) ¤ | | | 0.00 | | | | 1-1-2019 | | | | 765,000 | | | | 740,382 | |
McHenry-Kane Counties IL Community Consolidated School District #158 CAB (GO Revenue, AGM/FGIC Insured) ¤ | | | 0.00 | | | | 1-1-2023 | | | | 1,695,000 | | | | 1,404,206 | |
Metropolitan Pier & Exposition Authority IIlinois CAB McCormick Place Expansion Project Series A (Tax Revenue, National Insured) ¤ | | | 0.00 | | | | 12-15-2026 | | | | 11,795,000 | | | | 7,684,560 | |
Metropolitan Pier & Exposition Authority IIlinois CAB McCormick Place Expansion Project Series A (Tax Revenue, National Insured) ¤ | | | 0.00 | | | | 12-15-2029 | | | | 33,800,000 | | | | 18,706,610 | |
| | | | |
| 10 | | Wells Fargo Municipal Bond Fund | | Portfolio of investments—December 31, 2016 (unaudited) |
| | | | | | | | | | | | | | | | |
| Security name | | Interest rate | | | Maturity date | | | Principal | | | Value | |
| | | | |
| Illinois (continued) | | | | | | | | | | | | | | | | |
Metropolitan Pier & Exposition Authority IIlinois CAB McCormick Place Expansion Project Series A (Tax Revenue, National Insured) ¤ | | | 0.00 | % | | | 12-15-2030 | | | $ | 2,100,000 | | | $ | 1,105,503 | |
Metropolitan Pier & Exposition Authority IIlinois CAB McCormick Place Expansion Project Series A (Tax Revenue, National Insured) ¤ | | | 0.00 | | | | 12-15-2031 | | | | 6,000,000 | | | | 3,016,680 | |
Metropolitan Pier & Exposition Authority IIlinois CAB McCormick Place Expansion Project Series A (Tax Revenue, National Insured) ¤ | | | 0.00 | | | | 12-15-2034 | | | | 11,605,000 | | | | 4,933,750 | |
Metropolitan Pier & Exposition Authority IIlinois CAB McCormick Place Expansion Project Series A (Tax Revenue, National Insured) ¤ | | | 0.00 | | | | 6-15-2035 | | | | 6,450,000 | | | | 2,644,113 | |
Metropolitan Pier & Exposition Authority IIlinois CAB McCormick Place Expansion Project Series A (Tax Revenue, National Insured) ¤ | | | 0.00 | | | | 12-15-2035 | | | | 6,250,000 | | | | 2,500,938 | |
Regional Transportation Authority Illinois (Tax Revenue, AGM Insured) | | | 5.75 | | | | 6-1-2023 | | | | 400,000 | | | | 468,484 | |
Sangamon County IL School District #186 Certificate of Participation Hay-Edwards Elementary School Project Series A (Miscellaneous Revenue, ACA Insured) | | | 5.88 | | | | 8-15-2018 | | | | 1,235,000 | | | | 1,222,613 | |
Southwestern Illinois Development Authority Local Government Program Collinsville Limited (Tax Revenue) | | | 5.00 | | | | 3-1-2025 | | | | 2,495,000 | | | | 2,007,951 | |
Springfield IL Senior Lien Notes (Utilities Revenue, National Insured) | | | 5.00 | | | | 3-1-2024 | | | | 1,425,000 | | | | 1,435,018 | |
Tazewell County IL School District #51 (GO Revenue, National Insured) | | | 9.00 | | | | 12-1-2023 | | | | 350,000 | | | | 483,763 | |
University of Illinois Auxiliary Facilities Systems Series A (Education Revenue, National Insured) ¤ | | | 0.00 | | | | 4-1-2026 | | | | 2,355,000 | | | | 1,709,871 | |
University of Illinois Auxiliary Facilities Systems Series A (Education Revenue, National Insured) ¤ | | | 0.00 | | | | 4-1-2027 | | | | 2,435,000 | | | | 1,693,689 | |
University of Illinois Auxiliary Facilities Systems Series A (Education Revenue) | | | 5.75 | | | | 4-1-2038 | | | | 14,000,000 | | | | 15,334,200 | |
Will County IL Lincoln-Way Community High School District #210 Unrefunded CAB (GO Revenue, AGM Insured) ¤ | | | 0.00 | | | | 1-1-2026 | | | | 7,000,000 | | | | 4,652,270 | |
Will County IL Crete-Monee Community Unit School District #201 Prerefunded CAB (GO Revenue, National Insured) ¤ | | | 0.00 | | | | 11-1-2023 | | | | 430,000 | | | | 363,810 | |
Will County IL Crete-Monee Community Unit School District #201 Unrefunded CAB (GO Revenue, National Insured) ¤ | | | 0.00 | | | | 11-1-2023 | | | | 1,070,000 | | | | 851,741 | |
| | | | |
| | | | | | | | | | | | | | | 507,065,567 | |
| | | | | | | | | | | | | | | | |
| | | | |
| Indiana: 1.96% | | | | | | | | | | | | | | | | |
Brookhaven County IN EDA Line Senior Apartments Project Series A (Housing Revenue) | | | 6.25 | | | | 7-1-2043 | | | | 2,000,000 | | | | 2,084,400 | |
Brookhaven County IN EDA Line Senior Apartments Project Series A (Housing Revenue) | | | 6.25 | | | | 7-1-2048 | | | | 2,680,000 | | | | 2,785,672 | |
Gary IN Sanitary District Series A (Water & Sewer Revenue) | | | 5.05 | | | | 1-15-2029 | | | | 7,890,000 | | | | 8,233,767 | |
Indiana Finance Authority AMT-I-69 Development Partners LLC (Miscellaneous Revenue) | | | 5.25 | | | | 9-1-2034 | | | | 10,000,000 | | | | 9,977,600 | |
Indiana Finance Authority Environmental Facilities Series 2016A (Industrial Development Revenue) | | | 3.13 | | | | 12-1-2024 | | | | 8,350,000 | | | | 8,235,772 | |
Indiana Finance Authority Ohio River Bridges East End Crossing Project Series A (Industrial Development Revenue) | | | 5.00 | | | | 7-1-2035 | | | | 9,970,000 | | | | 10,208,782 | |
Indiana Finance Authority Ohio River Bridges East End Crossing Project Series A (Industrial Development Revenue) | | | 5.00 | | | | 7-1-2040 | | | | 2,470,000 | | | | 2,506,680 | |
Valparaiso IN Pratt Paper LLC Project (Industrial Development Revenue) | | | 5.88 | | | | 1-1-2024 | | | | 1,200,000 | | | | 1,330,056 | |
Whiting IN BP Products North America Incorporated Project (Resource Recovery Revenue) | | | 1.48 | | | | 12-1-2044 | | | | 5,000,000 | | | | 4,948,550 | |
| | | | |
| | | | | | | | | | | | | | | 50,311,279 | |
| | | | | | | | | | | | | | | | |
| | | | |
| Iowa: 0.08% | | | | | | | | | | | | | | | | |
Altoona IA Annual Appropriation Urban Renewal Series C (GO Revenue) | | | 5.00 | | | | 6-1-2031 | | | | 1,805,000 | | | | 2,052,556 | |
| | | | | | | | | | | | | | | | |
| | | | | | |
| Portfolio of investments—December 31, 2016 (unaudited) | | Wells Fargo Municipal Bond Fund | | | 11 | |
| | | | | | | | | | | | | | | | |
| Security name | | Interest rate | | | Maturity date | | | Principal | | | Value | |
| | | | |
| Kansas: 1.19% | | | | | | | | | | | | | | | | |
Sedgwick & Shawnee Counties KS Mortgage-Backed Securities Series A-2 (Housing Revenue, GNMA Insured) | | | 6.70 | % | | | 6-1-2029 | | | $ | 40,000 | | | $ | 40,302 | |
Wyandotte County & Kansas City KS Sales Tax Special Obligation Vacation Village Project Area 4 - Major Multi-Sport Athletic Complex Project CAB Series 2015 (Tax Revenue) 144A¤ | | | 0.00 | | | | 9-1-2034 | | | | 97,000,000 | | | | 30,585,070 | |
| | | | |
| | | | | | | | | | | | | | | 30,625,372 | |
| | | | | | | | | | | | | | | | |
| | | | |
| Kentucky: 1.62% | | | | | | | | | | | | | | | | |
Kentucky EDFA Balance Norton Series B (Health Revenue, National Insured) ¤ | | | 0.00 | | | | 10-1-2028 | | | | 4,845,000 | | | | 3,129,918 | |
Kentucky EDFA Catholic Health Initiatives Series B (Health Revenue) ± | | | 2.12 | | | | 2-1-2046 | | | | 22,715,000 | | | | 22,371,322 | |
Kentucky EDFA Next Generation Information Highway Project Series A (Miscellaneous Revenue) | | | 5.00 | | | | 7-1-2040 | | | | 3,400,000 | | | | 3,539,128 | |
Kentucky EDFA Norton Healthcare Incorporated Series B (Health Revenue, National Insured) ¤ | | | 0.00 | | | | 10-1-2024 | | | | 9,260,000 | | | | 7,121,959 | |
Kentucky Public Transportation Infrastructure Authority Downtown Crossing Project CAB Series B (Transportation Revenue) ¤ | | | 0.00 | | | | 7-1-2030 | | | | 2,000,000 | | | | 1,051,820 | |
Kentucky Public Transportation Infrastructure Authority Downtown Crossing Project CAB Series B (Transportation Revenue) ¤ | | | 0.00 | | | | 7-1-2031 | | | | 2,780,000 | | | | 1,362,061 | |
Kentucky Public Transportation Infrastructure Authority Downtown Crossing Project CAB Series B (Transportation Revenue) ¤ | | | 0.00 | | | | 7-1-2032 | | | | 2,500,000 | | | | 1,144,375 | |
Kentucky Public Transportation Infrastructure Authority Downtown Crossing Project CAB Series C (Transportation Revenue) ± | | | 0.00 | | | | 7-1-2033 | | | | 1,000,000 | | | | 829,070 | |
Kentucky Public Transportation Infrastructure Authority Downtown Crossing Project CAB Series C (Transportation Revenue) ± | | | 0.00 | | | | 7-1-2034 | | | | 1,505,000 | | | | 1,242,739 | |
| | | | |
| | | | | | | | | | | | | | | 41,792,392 | |
| | | | | | | | | | | | | | | | |
| | | | |
| Louisiana: 0.95% | | | | | | | | | | | | | | | | |
Louisiana Local Government Environmental Facilities & CDA (Miscellaneous Revenue, Ambac Insured) | | | 5.25 | | | | 12-1-2018 | | | | 2,085,000 | | | | 2,111,876 | |
Louisiana Tobacco Settlement Financing Corporation Series A (Tobacco Revenue) | | | 5.00 | | | | 5-15-2025 | | | | 2,410,000 | | | | 2,414,989 | |
Louisiana Tobacco Settlement Financing Corporation Series A (Tobacco Revenue) | | | 5.25 | | | | 5-15-2035 | | | | 2,300,000 | | | | 2,476,617 | |
New Orleans LA (GO Revenue, FGIC Insured) | | | 5.50 | | | | 12-1-2021 | | | | 2,050,000 | | | | 2,271,134 | |
New Orleans LA Aviation Board AMT Series B (Airport Revenue, AGM Insured) | | | 5.00 | | | | 1-1-2033 | | | | 3,000,000 | | | | 3,311,730 | |
New Orleans LA Aviation Board AMT Series B (Airport Revenue) | | | 5.00 | | | | 1-1-2034 | | | | 4,500,000 | | | | 4,892,265 | |
New Orleans LA Aviation Board Gulf Opportunity Zone Consolidated Rental Car Series A (Airport Revenue) | | | 6.50 | | | | 1-1-2040 | | | | 6,500,000 | | | | 7,007,455 | |
| | | | |
| | | | | | | | | | | | | | | 24,486,066 | |
| | | | | | | | | | | | | | | | |
| | | | |
| Maine: 0.08% | | | | | | | | | | | | | | | | |
Maine Educational Loan Authority Student Loan Series A-3 Class A (Education Revenue, AGC Insured) | | | 5.88 | | | | 12-1-2039 | | | | 1,930,000 | | | | 2,058,036 | |
| | | | | | | | | | | | | | | | |
| | | | |
| Maryland: 0.65% | | | | | | | | | | | | | | | | |
Howard County MD Certificate of Participation Agricultural Land Preservation #90-23 Series A (Miscellaneous Revenue) | | | 8.00 | | | | 8-15-2020 | | | | 293,000 | | | | 347,454 | |
Prince George’s County MD Chesapeake Lighthouse Charter School Project Series 2016A (Education Revenue) | | | 5.75 | | | | 8-1-2033 | | | | 1,585,000 | | | | 1,605,225 | |
Prince George’s County MD Chesapeake Lighthouse Charter School Project Series 2016A (Education Revenue) 144A | | | 6.90 | | | | 8-1-2041 | | | | 8,480,000 | | | | 8,545,720 | |
Prince George’s County MD Chesapeake Lighthouse Charter School Project Series 2016A (Education Revenue) | | | 7.00 | | | | 8-1-2046 | | | | 6,085,000 | | | | 6,158,203 | |
| | | | |
| | | | | | | | | | | | | | | 16,656,602 | |
| | | | | | | | | | | | | | | | |
| | | | |
| 12 | | Wells Fargo Municipal Bond Fund | | Portfolio of investments—December 31, 2016 (unaudited) |
| | | | | | | | | | | | | | | | |
| Security name | | Interest rate | | | Maturity date | | | Principal | | | Value | |
| | | | |
| Massachusetts: 0.79% | | | | | | | | | | | | | | | | |
Massachusetts Development Finance Agency Sabis International Charter Series A (Education Revenue) | | | 8.00 | % | | | 4-15-2031 | | | $ | 2,150,000 | | | $ | 2,529,647 | |
Massachusetts Development Finance Agency Sabis International Charter Series A (Education Revenue) | | | 8.00 | | | | 4-15-2039 | | | | 3,900,000 | | | | 4,588,662 | |
Massachusetts Educational Finance Authority Series B (Education Revenue) | | | 5.38 | | | | 1-1-2020 | | | | 1,780,000 | | | | 1,900,150 | |
Massachusetts Educational Finance Authority Series I (Education Revenue) | | | 6.00 | | | | 1-1-2028 | | | | 1,540,000 | | | | 1,614,813 | |
Massachusetts Educational Finance Authority Series J (Education Revenue) | | | 5.00 | | | | 7-1-2020 | | | | 6,000,000 | | | | 6,472,860 | |
Massachusetts Educational Finance Authority Series J (Education Revenue) | | | 5.00 | | | | 7-1-2021 | | | | 3,000,000 | | | | 3,256,230 | |
| | | | |
| | | | | | | | | | | | | | | 20,362,362 | |
| | | | | | | | | | | | | | | | |
| | | | |
| Michigan: 7.51% | | | | | | | | | | | | | | | | |
Detroit MI Distribution of State Aid (GO Revenue) | | | 5.00 | | | | 11-1-2030 | | | | 2,330,000 | | | | 2,415,395 | |
Detroit MI Downtown Development Authority CAB (Tax Revenue) ¤ | | | 0.00 | | | | 7-1-2018 | | | | 3,050,000 | | | | 2,842,204 | |
Detroit MI Downtown Development Authority CAB (Tax Revenue) ¤ | | | 0.00 | | | | 7-1-2019 | | | | 3,050,000 | | | | 2,708,644 | |
Detroit MI Downtown Development Authority CAB (Tax Revenue) ¤ | | | 0.00 | | | | 7-1-2020 | | | | 2,070,000 | | | | 1,723,503 | |
Detroit MI Water Supply System Second Lien Series B (Water & Sewer Revenue, AGM Insured) | | | 7.00 | | | | 7-1-2036 | | | | 9,675,000 | | | | 10,941,554 | |
Great Lakes Michigan Water Authority Sewage Disposal System Series 2016C (Water & Sewer Revenue) | | | 5.00 | | | | 7-1-2036 | | | | 8,500,000 | | | | 9,250,635 | |
Great Lakes Michigan Water Authority Water Supply System Series 2016D (Water & Sewer Revenue) | | | 4.00 | | | | 7-1-2032 | | | | 11,000,000 | | | | 11,069,300 | |
Great Lakes Michigan Water Authority Water Supply System Series 2016D (Water & Sewer Revenue, AGM Insured) | | | 4.00 | | | | 7-1-2033 | | | | 11,000,000 | | | | 11,086,680 | |
Livonia MI Public Schools School District Building & Site Series I (GO Revenue) | | | 5.00 | | | | 5-1-2026 | | | | 1,075,000 | | | | 1,199,722 | |
Livonia MI Public Schools School District Building & Site Series I (GO Revenue) | | | 5.00 | | | | 5-1-2028 | | | | 1,450,000 | | | | 1,603,816 | |
Livonia MI Public Schools School District Building & Site Series I (GO Revenue) | | | 5.00 | | | | 5-1-2029 | | | | 1,350,000 | | | | 1,462,293 | |
Livonia MI Public Schools School District Building & Site Series I (GO Revenue) | | | 5.00 | | | | 5-1-2030 | | | | 1,775,000 | | | | 1,944,051 | |
Livonia MI Public Schools School District Building & Site Series I (GO Revenue) | | | 5.00 | | | | 5-1-2031 | | | | 1,425,000 | | | | 1,558,166 | |
Michigan Finance Authority Limited Obligation Public School Holly Academy (Education Revenue) | | | 6.50 | | | | 10-1-2020 | | | | 130,000 | | | | 135,637 | |
Michigan Finance Authority Limited Obligation Public School Holly Academy (Education Revenue) | | | 8.00 | | | | 10-1-2040 | | | | 1,350,000 | | | | 1,492,263 | |
Michigan Finance Authority Limited Obligation Public School Madison Academy Project Series A (Miscellaneous Revenue) | | | 7.50 | | | | 12-1-2020 | | | | 260,000 | | | | 277,339 | |
Michigan Finance Authority Limited Obligation Public School Madison Academy Project Series A (Miscellaneous Revenue) | | | 8.00 | | | | 12-1-2030 | | | | 1,135,000 | | | | 1,238,750 | |
Michigan Finance Authority Limited Obligation Public School Madison Academy Project Series A (Miscellaneous Revenue) | | | 8.25 | | | | 12-1-2039 | | | | 2,220,000 | | | | 2,443,132 | |
Michigan Finance Authority Local Government Loan Program Series C (Water & Sewer Revenue, National Insured) | | | 5.00 | | | | 7-1-2025 | | | | 2,000,000 | | | | 2,285,760 | |
Michigan Finance Authority Local Government Loan Program Series C (Water & Sewer Revenue, National Insured) | | | 5.00 | | | | 7-1-2026 | | | | 1,945,000 | | | | 2,208,839 | |
Michigan Finance Authority Local Government Loan Program Series C (Water & Sewer Revenue, National Insured) | | | 5.00 | | | | 7-1-2027 | | | | 2,260,000 | | | | 2,553,574 | |
Michigan Finance Authority Local Government Loan Program Series C (Water & Sewer Revenue, National Insured) | | | 5.00 | | | | 7-1-2028 | | | | 3,480,000 | | | | 3,914,652 | |
Michigan Finance Authority Local Government Loan Program Series C (Water & Sewer Revenue, National Insured) | | | 5.00 | | | | 7-1-2032 | | | | 5,750,000 | | | | 6,370,770 | |
Michigan Finance Authority Local Government Loan Program Series C (Water & Sewer Revenue) | | | 5.00 | | | | 7-1-2035 | | | | 2,000,000 | | | | 2,156,400 | |
Michigan Finance Authority Local Government Loan Program Series D (Water & Sewer Revenue, National Insured) | | | 5.00 | | | | 7-1-2027 | | | | 1,000,000 | | | | 1,129,900 | |
| | | | | | |
| Portfolio of investments—December 31, 2016 (unaudited) | | Wells Fargo Municipal Bond Fund | | | 13 | |
| | | | | | | | | | | | | | | | |
| Security name | | Interest rate | | | Maturity date | | | Principal | | | Value | |
| | | | |
| Michigan (continued) | | | | | | | | | | | | | | | | |
Michigan Finance Authority Local Government Loan Program Series H-1 (Tax Revenue) | | | 5.00 | % | | | 10-1-2031 | | | $ | 1,340,000 | | | $ | 1,489,799 | |
Michigan Finance Authority Local Government Loan Program Series H-1 (Tax Revenue) | | | 5.00 | | | | 10-1-2032 | | | | 2,000,000 | | | | 2,217,820 | |
Michigan Finance Authority Local Government Loan Program Series H-1 (Tax Revenue) | | | 5.00 | | | | 10-1-2033 | | | | 2,975,000 | | | | 3,284,043 | |
Michigan Finance Authority Local Government Loan Program Series H-1 (Tax Revenue) | | | 5.00 | | | | 10-1-2034 | | | | 3,670,000 | | | | 4,032,926 | |
Michigan Finance Authority Local Government Loan Program Series H-1 (Tax Revenue) | | | 5.00 | | | | 10-1-2039 | | | | 7,955,000 | | | | 8,623,697 | |
Michigan Finance Authority Public School Academy University Learning (Education Revenue) | | | 6.25 | | | | 11-1-2020 | | | | 360,000 | | | | 376,679 | |
Michigan Finance Authority Refunding Bond Local Government Loan Program City of Detroit Financial Recovery Series F (Tax Revenue) | | | 4.50 | | | | 10-1-2029 | | | | 7,000,000 | | | | 7,152,180 | |
Michigan Finance Authority Refunding Bond Local Government Loan Program Detroit Series D-4 (Water & Sewer Revenue) | | | 5.00 | | | | 7-1-2031 | | | | 6,500,000 | | | | 7,188,155 | |
Michigan Finance Authority Refunding Bond Local Government Loan Program Detroit Series D-6 (Water & Sewer Revenue, National Insured) | | | 5.00 | | | | 7-1-2036 | | | | 3,250,000 | | | | 3,549,065 | |
Michigan Finance Authority Refunding Bond Local Government Loan Program Public Lighting Authority Series B (Tax Revenue) | | | 5.00 | | | | 7-1-2044 | | | | 12,625,000 | | | | 13,419,491 | |
Michigan Municipal Bond Authority Local Government Loan Program CAB Series G (Miscellaneous Revenue, Ambac Insured) ¤ | | | 0.00 | | | | 5-1-2017 | | | | 365,000 | | | | 361,879 | |
Michigan Municipal Bond Authority Local Government Loan Program Series A (Miscellaneous Revenue, Ambac Insured) | | | 4.00 | | | | 11-1-2021 | | | | 150,000 | | | | 150,126 | |
Michigan Municipal Bond Authority Local Government Loan Program Series A (Miscellaneous Revenue, Ambac Insured) | | | 5.00 | | | | 5-1-2017 | | | | 550,000 | | | | 554,604 | |
Michigan Municipal Bond Authority Local Government Loan Program Series B Group A (Miscellaneous Revenue, Ambac Insured) | | | 5.00 | | | | 12-1-2017 | | | | 2,475,000 | | | | 2,498,463 | |
Michigan Municipal Bond Authority Local Government Loan Program Series B Group A (Miscellaneous Revenue, Ambac Insured) | | | 5.25 | | | | 12-1-2023 | | | | 1,185,000 | | | | 1,189,823 | |
Michigan Municipal Bond Authority Local Government Loan Program Series C (Miscellaneous Revenue, Ambac Insured) | | | 3.75 | | | | 5-1-2017 | | | | 450,000 | | | | 451,701 | |
Michigan Municipal Bond Authority Local Government Loan Program Series C (Miscellaneous Revenue, Ambac Insured) | | | 4.00 | | | | 5-1-2019 | | | | 100,000 | | | | 100,269 | |
Michigan Municipal Bond Authority Local Government Loan Program Series C (Miscellaneous Revenue, Ambac Insured) | | | 4.75 | | | | 5-1-2027 | | | | 4,610,000 | | | | 4,619,727 | |
Michigan Municipal Bond Authority Local Government Loan Program Series G (Miscellaneous Revenue, Ambac Insured) ¤ | | | 0.00 | | | | 5-1-2019 | | | | 75,000 | | | | 69,608 | |
Michigan Municipal Bond Authority Local Government Loan Program Series G (Miscellaneous Revenue, Ambac Insured) ¤ | | | 0.00 | | | | 5-1-2020 | | | | 205,000 | | | | 183,153 | |
Michigan Public Educational Facilities Authority Limited Obligation Bradford Academy Project (Education Revenue) 144A | | | 6.50 | | | | 9-1-2037 | | | | 3,745,000 | | | | 2,995,476 | |
Michigan Public Educational Facilities Authority Limited Obligation Bradford Academy Project (Education Revenue) | | | 8.50 | | | | 9-1-2029 | | | | 1,500,000 | | | | 1,199,790 | |
Michigan Public Educational Facilities Authority Limited Obligation Bradford Academy Project (Education Revenue) | | | 8.75 | | | | 9-1-2039 | | | | 3,500,000 | | | | 2,799,510 | |
Michigan Public Educational Facilities Authority Limited Obligation Crescent Academy (Education Revenue) | | | 7.00 | | | | 10-1-2036 | | | | 1,160,000 | | | | 1,197,561 | |
Michigan Public Educational Facilities Authority Limited Obligation Madison Academy Project (Education Revenue) | | | 8.38 | | | | 12-1-2030 | | | | 2,085,000 | | | | 2,302,883 | |
Michigan Public Educational Facilities Authority Limited Obligation Madison Academy Project (Education Revenue) | | | 8.63 | | | | 12-1-2039 | | | | 4,170,000 | | | | 4,643,712 | |
| | | | |
| 14 | | Wells Fargo Municipal Bond Fund | | Portfolio of investments—December 31, 2016 (unaudited) |
| | | | | | | | | | | | | | | | |
| Security name | | Interest rate | | | Maturity date | | | Principal | | | Value | |
| | | | |
| Michigan (continued) | | | | | | | | | | | | | | | | |
Michigan Public Educational Facilities Authority Limited Obligation Nataki Talibah (Miscellaneous Revenue) (i)(s)(t) | | | 6.25 | % | | | 10-1-2023 | | | $ | 800,000 | | | $ | 239,848 | |
Michigan Strategic Fund Limited Obligation Detroit Edison Company Exempt Facilities Project Series KT (Utilities Revenue) | | | 5.63 | | | | 7-1-2020 | | | | 1,200,000 | | | | 1,338,252 | |
Michigan Strategic Fund Limited Obligation Events Bonds Center Project Series A (Tax Revenue) ± | | | 4.13 | | | | 7-1-2045 | | | | 15,500,000 | | | | 15,693,750 | |
Oakland County MI Economic Development Corporation The Academy of The Sacred Heart Project Series A (Education Revenue) | | | 6.50 | | | | 12-15-2036 | | | | 4,505,000 | | | | 4,236,953 | |
Star International Academy Michigan (Miscellaneous Revenue) | | | 3.40 | | | | 3-1-2017 | | | | 100,000 | | | | 100,028 | |
Wayne County MI Building Improvement Series A (GO Revenue) | | | 6.75 | | | | 11-1-2039 | | | | 8,735,000 | | | | 9,027,885 | |
| | | | |
| | | | | | | | | | | | | | | 193,301,835 | |
| | | | | | | | | | | | | | | | |
| | | | |
| Mississippi: 0.36% | | | | | | | | | | | | | | | | |
Mississippi Development Bank Special Obligation Jackson Water & Sewer System Project Series A (Water & Sewer Revenue, AGM Insured) | | | 5.00 | | | | 9-1-2030 | | | | 8,155,000 | | | | 9,125,445 | |
| | | | | | | | | | | | | | | | |
| | | | |
| Missouri: 0.62% | | | | | | | | | | | | | | | | |
Blue Springs MO Special Obligation Tax Refunding & Improvement Adams Farm Project Series A (Tax Revenue) | | | 4.00 | | | | 6-1-2026 | | | | 10,330,000 | | | | 10,201,185 | |
Manchester MO Highway 141 Manchester Road Project (Tax Revenue) | | | 6.00 | | | | 11-1-2025 | | | | 1,300,000 | | | | 1,319,227 | |
St. Louis MO IDA Convention Center Hotel (Miscellaneous Revenue, Ambac Insured) ¤ | | | 0.00 | | | | 7-15-2019 | | | | 2,475,000 | | | | 2,317,590 | |
St. Louis MO Lambert St. Louis International Airport Series A-1 (Airport Revenue) | | | 6.25 | | | | 7-1-2029 | | | | 2,000,000 | | | | 2,201,860 | |
| | | | |
| | | | | | | | | | | | | | | 16,039,862 | |
| | | | | | | | | | | | | | | | |
| | | | |
| Nebraska: 0.04% | | | | | | | | | | | | | | | | |
Nebraska Central Plains Energy Project #3 (Utilities Revenue) | | | 5.00 | | | | 9-1-2027 | | | | 1,020,000 | | | | 1,109,495 | |
| | | | | | | | | | | | | | | | |
| | | | |
| Nevada: 0.05% | | | | | | | | | | | | | | | | |
Las Vegas NV Special Improvement District #60 Local Improvement (Miscellaneous Revenue) | | | 5.00 | | | | 6-1-2022 | | | | 480,000 | | | | 509,189 | |
Las Vegas NV Special Improvement District #60 Local Improvement (Miscellaneous Revenue) | | | 5.00 | | | | 6-1-2023 | | | | 380,000 | | | | 405,392 | |
Las Vegas NV Special Improvement District #60 Local Improvement (Miscellaneous Revenue) | | | 5.00 | | | | 6-1-2024 | | | | 250,000 | | | | 266,185 | |
| | | | |
| | | | | | | | | | | | | | | 1,180,766 | |
| | | | | | | | | | | | | | | | |
| | | | |
| New Jersey: 5.99% | | | | | | | | | | | | | | | | |
Bayonne NJ School Refunding Bonds (GO Revenue, AGM Insured) | | | 5.00 | | | | 7-15-2023 | | | | 2,505,000 | | | | 2,847,659 | |
New Jersey EDA Natural Gas Company Project Series C (Utilities Revenue, National Insured) ± | | | 4.90 | | | | 10-1-2040 | | | | 5,680,000 | | | | 5,690,962 | |
New Jersey EDA School Facilities Construction Project Series I (Miscellaneous Revenue) ± | | | 1.97 | | | | 9-1-2025 | | | | 3,815,000 | | | | 3,563,897 | |
New Jersey EDA School Facilities Construction Project Series I (Miscellaneous Revenue) ± | | | 2.27 | | | | 9-1-2027 | | | | 22,245,000 | | | | 20,704,756 | |
New Jersey EDA School Facilities Construction Project Series I (Miscellaneous Revenue) ± | | | 2.32 | | | | 3-1-2028 | | | | 1,200,000 | | | | 1,106,592 | |
New Jersey EDA School Facilities Construction Project Series II (Miscellaneous Revenue) | | | 5.00 | | | | 3-1-2026 | | | | 4,000,000 | | | | 4,104,480 | |
New Jersey EDA School Facilities Construction Project Series NN (Miscellaneous Revenue) | | | 5.00 | | | | 3-1-2026 | | | | 15,000,000 | | | | 15,457,950 | |
| | | | | | |
| Portfolio of investments—December 31, 2016 (unaudited) | | Wells Fargo Municipal Bond Fund | | | 15 | |
| | | | | | | | | | | | | | | | |
| Security name | | Interest rate | | | Maturity date | | | Principal | | | Value | |
| | | | |
| New Jersey (continued) | | | | | | | | | | | | | | | | |
New Jersey Educational Facilities Authority Series 2014 (Education Revenue) | | | 5.00 | % | | | 6-15-2025 | | | $ | 5,830,000 | | | $ | 6,094,565 | |
New Jersey TTFA (Transportation Revenue) | | | 6.00 | | | | 12-15-2038 | | | | 10,425,000 | | | | 11,062,385 | |
New Jersey TTFA CAB Series A (Transportation Revenue) ¤ | | | 0.00 | | | | 12-15-2029 | | | | 11,875,000 | | | | 6,448,600 | |
New Jersey TTFA CAB Series A (Transportation Revenue) ¤ | | | 0.00 | | | | 12-15-2031 | | | | 4,500,000 | | | | 2,146,635 | |
New Jersey TTFA CAB Series A (Transportation Revenue) ¤ | | | 0.00 | | | | 12-15-2026 | | | | 1,150,000 | | | | 735,690 | |
New Jersey TTFA Series A (Transportation Revenue) | | | 5.00 | | | | 6-15-2042 | | | | 5,540,000 | | | | 5,531,967 | |
New Jersey TTFA Series A (Miscellaneous Revenue, National Insured) | | | 5.75 | | | | 6-15-2023 | | | | 2,000,000 | | | | 2,276,660 | |
New Jersey TTFA Series A (Miscellaneous Revenue, National Insured) | | | 5.75 | | | | 6-15-2025 | | | | 10,000,000 | | | | 11,551,400 | |
New Jersey TTFA Series AA (Transportation Revenue) | | | 5.00 | | | | 6-15-2044 | | | | 1,000,000 | | | | 995,540 | |
New Jersey TTFA Series AA (Transportation Revenue) | | | 5.25 | | | | 6-15-2033 | | | | 10,000,000 | | | | 10,208,200 | |
New Jersey TTFA Series B (Transportation Revenue) | | | 5.25 | | | | 6-15-2036 | | | | 5,575,000 | | | | 5,636,604 | |
New Jersey TTFA Series C (Transportation Revenue) | | | 5.25 | | | | 6-15-2032 | | | | 8,000,000 | | | | 8,230,320 | |
Newark NJ Housing Authority Port Newark Marine Terminal Rental (Miscellaneous Revenue, National Insured) | | | 5.00 | | | | 1-1-2032 | | | | 7,620,000 | | | | 8,583,778 | |
Newark NJ Qualified General Improvement Series A (GO Revenue) | | | 5.00 | | | | 7-15-2025 | | | | 5,000,000 | | | | 5,357,350 | |
Newark NJ Qualified General Improvement Series A (GO Revenue) | | | 5.00 | | | | 7-15-2026 | | | | 2,205,000 | | | | 2,346,296 | |
Newark NJ Qualified General Improvement Series A (GO Revenue) | | | 5.00 | | | | 7-15-2027 | | | | 6,035,000 | | | | 6,386,358 | |
Newark NJ Qualified General Improvement Series A (GO Revenue) | | | 5.25 | | | | 7-15-2024 | | | | 1,325,000 | | | | 1,439,639 | |
Newark NJ Qualified General Improvement Series B (GO Revenue) | | | 5.00 | | | | 7-15-2025 | | | | 385,000 | | | | 412,516 | |
Newark NJ Qualified General Improvement Series B (GO Revenue) | | | 5.00 | | | | 7-15-2026 | | | | 395,000 | | | | 420,312 | |
Newark NJ Qualified General Improvement Series B (GO Revenue) | | | 5.00 | | | | 7-15-2027 | | | | 405,000 | | | | 428,579 | |
Newark NJ Qualified General Improvement Series B (GO Revenue) | | | 5.25 | | | | 7-15-2024 | | | | 375,000 | | | | 407,445 | |
Rutgers NJ State University Series L (Education Revenue) | | | 5.00 | | | | 5-1-2033 | | | | 3,560,000 | | | | 4,053,808 | |
| | | | |
| | | | | | | | | | | | | | | 154,230,943 | |
| | | | | | | | | | | | | | | | |
| | | | |
| New Mexico: 0.41% | | | | | | | | | | | | | | | | |
New Mexico Mortgage Finance Authority SFMR Class I (Housing Revenue, GNMA/FNMA/FHLMC Insured) | | | 5.35 | | | | 3-1-2030 | | | | 615,000 | | | | 655,971 | |
New Mexico Municipal Energy Acquisition Authority Gas Supply Sub Series B (Utilities Revenue, Royal Bank of Canada SPA) ± | | | 1.16 | | | | 11-1-2039 | | | | 10,000,000 | | | | 9,938,800 | |
| | | | |
| | | | | | | | | | | | | | | 10,594,771 | |
| | | | | | | | | | | | | | | | |
| | | | |
| New York: 10.49% | | | | | | | | | | | | | | | | |
Glen Cove NY Local Economic Assistance Corporation CAB Series B (Industrial Development Revenue) ¤ | | | 0.00 | | | | 1-1-2045 | | | | 6,000,000 | | | | 1,082,460 | |
Glen Cove NY Local Economic Assistance Corporation CCAB Series C (Industrial Development Revenue) ± | | | 0.00 | | | | 1-1-2055 | | | | 2,500,000 | | | | 1,708,950 | |
Hempstead Town NY Local Development Corporation The Academy Charter School Project Series A (Education Revenue) | | | 7.65 | | | | 2-1-2044 | | | | 3,500,000 | | | | 3,837,785 | |
Hempstead Town NY Local Development Corporation The Academy Charter School Project Series A (Education Revenue) | | | 8.25 | | | | 2-1-2041 | | | | 9,790,000 | | | | 10,971,261 | |
Metropolitan Transportation Authority New York Series A (Transportation Revenue) | | | 5.00 | | | | 11-15-2030 | | | | 16,000,000 | | | | 18,092,000 | |
Metropolitan Transportation Authority New York Series C (Transportation Revenue) | | | 6.50 | | | | 11-15-2028 | | | | 1,535,000 | | | | 1,682,959 | |
Metropolitan Transportation Authority New York Series C (Transportation Revenue) | | | 6.50 | | | | 11-15-2028 | | | | 6,465,000 | | | | 7,094,173 | |
New York Dormitory Authority North Shore-Long Island Jewish Obligated Group Series B (Health Revenue) ± | | | 1.32 | | | | 5-1-2018 | | | | 1,520,000 | | | | 1,520,836 | |
New York Dormitory Authority Series B (Tax Revenue) | | | 5.75 | | | | 3-15-2036 | | | | 10,000,000 | | | | 10,861,100 | |
| | | | |
| 16 | | Wells Fargo Municipal Bond Fund | | Portfolio of investments—December 31, 2016 (unaudited) |
| | | | | | | | | | | | | | | | |
| Security name | | Interest rate | | | Maturity date | | | Principal | | | Value | |
| | | | |
| New York (continued) | | | | | | | | | | | | | | | | |
New York NY Municipal Water Finance Authority 2nd General Resolution Series AA (Water & Sewer Revenue) | | | 5.00 | % | | | 6-15-2044 | | | $ | 17,400,000 | | | $ | 19,169,580 | |
New York NY Municipal Water Finance Authority 2nd General Resolution Series BB (Water & Sewer Revenue) | | | 5.00 | | | | 6-15-2044 | | | | 30,265,000 | | | | 33,599,295 | |
New York NY Municipal Water Finance Authority 2nd General Resolution Series BB (Water & Sewer Revenue) | | | 5.25 | | | | 6-15-2044 | | | | 9,800,000 | | | | 11,026,862 | |
New York NY Municipal Water Finance Authority 2nd General Resolution Series DD (Water & Sewer Revenue) | | | 6.00 | | | | 6-15-2040 | | | | 11,625,000 | | | | 12,332,033 | |
New York NY Municipal Water Finance Authority Water & Sewer System Series A (Water & Sewer Revenue) | | | 5.00 | | | | 6-15-2038 | | | | 36,650,000 | | | | 37,210,745 | |
New York NY Municipal Water Finance Authority Water & Sewer System Series A (Water & Sewer Revenue) | | | 5.75 | | | | 6-15-2040 | | | | 1,150,000 | | | | 1,226,774 | |
New York NY Municipal Water Finance Authority Water & Sewer System Series DD (Water & Sewer Revenue) | | | 5.00 | | | | 6-15-2026 | | | | 3,255,000 | | | | 3,676,132 | |
New York NY Municipal Water Finance Authority Water & Sewer System Unrefunded Balance (Water & Sewer Revenue) | | | 5.75 | | | | 6-15-2040 | | | | 3,850,000 | | | | 4,068,642 | |
New York NY Series F-1 (GO Revenue) | | | 5.00 | | | | 3-1-2032 | | | | 3,000,000 | | | | 3,409,680 | |
New York NY Transitional Finance Authority Building Aid Fiscal Year 2009 Series S-4 (Miscellaneous Revenue) | | | 5.75 | | | | 1-15-2039 | | | | 2,500,000 | | | | 2,699,325 | |
New York NY Transitional Finance Authority Future Tax Secured Revenue Series I (Tax Revenue) | | | 5.00 | | | | 5-1-2033 | | | | 5,395,000 | | | | 6,153,483 | |
New York NY Transitional Finance Authority Future Tax Secured Subordinate Bonds Series A (Tax Revenue) | | | 5.00 | | | | 8-1-2031 | | | | 17,075,000 | | | | 19,803,073 | |
New York Tobacco Settelement Asset Securitization Corporation Incorporated Series 1 (Tobacco Revenue) | | | 5.00 | | | | 6-1-2026 | | | | 10,000,000 | | | | 9,937,300 | |
New York Transportation Development Corporation American Airlines Incorporated John F Kennedy International Airport Project (Airport Revenue) | | | 5.00 | | | | 8-1-2020 | | | | 4,865,000 | | | | 5,060,476 | |
New York Transportation Development Corporation American Airlines Incorporated John F Kennedy International Airport Project Series 2016 (Airport Revenue) | | | 5.00 | | | | 8-1-2026 | | | | 11,500,000 | | | | 11,859,950 | |
New York Urban Development Corporation Certificate of Participation James A Farley Post Office Project (Miscellaneous Revenue) 144A | | | 4.20 | | | | 2-1-2017 | | | | 20,880,000 | | | | 20,871,648 | |
Oyster Bay NY BAN Series C (GO Revenue) | | | 4.00 | | | | 6-1-2018 | | | | 3,000,000 | | | | 3,010,110 | |
Suffolk NY Tobacco Securitization Corporation Series B (Tobacco Revenue) | | | 4.50 | | | | 6-1-2026 | | | | 520,000 | | | | 550,020 | |
Suffolk NY Tobacco Securitization Corporation Series B (Tobacco Revenue) | | | 5.00 | | | | 6-1-2025 | | | | 500,000 | | | | 547,790 | |
Westchester County NY Local Development Pace University Series A (Education Revenue) | | | 5.00 | | | | 5-1-2034 | | | | 1,750,000 | | | | 1,779,978 | |
Westchester County NY Local Development Pace University Series B (Education Revenue) ø | | | 0.95 | | | | 5-1-2044 | | | | 5,000,000 | | | | 5,000,000 | |
| | | | |
| | | | | | | | | | | | | | | 269,844,420 | |
| | | | | | | | | | | | | | | | |
| | | | |
| North Carolina: 0.71% | | | | | | | | | | | | | | | | |
North Carolina Eastern Municipal Power Agency Series A (Utilities Revenue) | | | 5.50 | | | | 1-1-2026 | | | | 1,250,000 | | | | 1,353,975 | |
North Carolina Eastern Municipal Power Agency Series C (Utilities Revenue) | | | 6.75 | | | | 1-1-2024 | | | | 2,000,000 | | | | 2,215,640 | |
North Carolina Medical Care Commission University Health Systems of Eastern Carolina Series D (Health Revenue) | | | 6.00 | | | | 12-1-2029 | | | | 5,000,000 | | | | 5,436,150 | |
North Carolina Medical Care Commission University Health Systems of Eastern Carolina Series D (Health Revenue) | | | 6.25 | | | | 12-1-2033 | | | | 8,500,000 | | | | 9,281,575 | |
| | | | |
| | | | | | | | | | | | | | | 18,287,340 | |
| | | | | | | | | | | | | | | | |
| | | | | | |
| Portfolio of investments—December 31, 2016 (unaudited) | | Wells Fargo Municipal Bond Fund | | | 17 | |
| | | | | | | | | | | | | | | | |
| Security name | | Interest rate | | | Maturity date | | | Principal | | | Value | |
| | | | |
| Ohio: 2.53% | | | | | | | | | | | | | | | | |
Akron-Bath-Copley Joint Township OH Hospital District Summa Health Obligated Group (Health Revenue) | | | 5.25 | % | | | 11-15-2046 | | | $ | 6,000,000 | | | $ | 6,439,440 | |
Allen County OH Catholic Healthcare Series B (Health Revenue) | | | 5.25 | | | | 9-1-2027 | | | | 3,825,000 | | | | 4,236,838 | |
Cleveland OH Airport System Revenue Series A (Airport Revenue) | | | 5.00 | | | | 1-1-2025 | | | | 4,015,000 | | | | 4,466,286 | |
Cleveland OH Airport System Revenue Series A (Airport Revenue, AGM Insured) | | | 5.00 | | | | 1-1-2031 | | | | 3,600,000 | | | | 3,942,684 | |
Montgomery County OH Hospital Kettering Medical Center (Health Revenue, National Insured) | | | 6.25 | | | | 4-1-2020 | | | | 2,500,000 | | | | 2,655,875 | |
Ohio Air Quality Development Authority AMT Refunding Bond Pollution Control 1st Energy Series C (Industrial Development Revenue) ± | | | 3.95 | | | | 11-1-2032 | | | | 2,700,000 | | | | 1,128,681 | |
Ohio Private Activity Bond AMT Portsmouth Bypass Project (Miscellaneous Revenue, AGM Insured) | | | 5.00 | | | | 12-31-2026 | | | | 1,500,000 | | | | 1,694,790 | |
Ohio Private Activity Bond AMT Portsmouth Bypass Project (Miscellaneous Revenue, AGM Insured) | | | 5.00 | | | | 12-31-2028 | | | | 1,600,000 | | | | 1,787,600 | |
Ohio Private Activity Bond AMT Portsmouth Bypass Project (Miscellaneous Revenue, AGM Insured) | | | 5.00 | | | | 12-31-2030 | | | | 2,250,000 | | | | 2,494,553 | |
Ohio Private Activity Bond AMT Portsmouth Bypass Project (Miscellaneous Revenue, AGM Insured) | | | 5.00 | | | | 12-31-2035 | | | | 12,000,000 | | | | 13,055,880 | |
Ohio Private Activity Bond AMT Portsmouth Bypass Project (Miscellaneous Revenue, AGM Insured) | | | 5.00 | | | | 12-31-2039 | | | | 2,500,000 | | | | 2,693,575 | |
Ohio Turnpike Commission CAB Series A-4 (Transportation Revenue) ± | | | 0.00 | | | | 2-15-2034 | | | | 8,500,000 | | | | 7,640,735 | |
Ohio Water Development Authority Pollution Control AMT Series C (Industrial Development Revenue) ± | | | 3.95 | | | | 11-1-2032 | | | | 8,000,000 | | | | 3,344,240 | |
Ohio Water Development Authority Pollution Control Series A (Industrial Development Revenue) ± | | | 3.75 | | | | 7-1-2033 | | | | 11,580,000 | | | | 4,840,787 | |
Ohio Water Development Authority Pollution Control Series C (Industrial Development Revenue) ± | | | 4.00 | | | | 6-1-2033 | | | | 3,720,000 | | | | 1,555,890 | |
RiverSouth Authority Ohio Lazarus Building Redevelopment Series A (Miscellaneous Revenue) | | | 5.75 | | | | 12-1-2027 | | | | 1,900,000 | | | | 1,943,795 | |
Toledo OH Enterprise Bond Series 2-A (Industrial Development Revenue) | | | 5.50 | | | | 12-1-2019 | | | | 1,115,000 | | | | 1,160,815 | |
| | | | |
| | | | | | | | | | | | | | | 65,082,464 | |
| | | | | | | | | | | | | | | | |
| | | | |
| Oklahoma: 0.41% | | | | | | | | | | | | | | | | |
Garfield County OK Educational Facilities Authority Enid Public Schools Project Series A (Miscellaneous Revenue) | | | 5.00 | | | | 9-1-2026 | | | | 1,810,000 | | | | 2,112,361 | |
Garfield County OK Educational Facilities Authority Enid Public Schools Project Series A (Miscellaneous Revenue) | | | 5.00 | | | | 9-1-2030 | | | | 2,000,000 | | | | 2,285,360 | |
Garfield County OK Educational Facilities Authority Enid Public Schools Project Series A (Miscellaneous Revenue) | | | 5.00 | | | | 9-1-2031 | | | | 1,145,000 | | | | 1,304,292 | |
McGee Creek Authority Oklahoma Water Revenue (Water & Sewer Revenue, National Insured) | | | 6.00 | | | | 1-1-2023 | | | | 3,345,000 | | | | 3,659,430 | |
Tulsa OK Airports Improvement Trust AMT Series A (Airport Revenue, Build America Mutual Assurance Company Insured) | | | 5.00 | | | | 6-1-2035 | | | | 1,055,000 | | | | 1,137,564 | |
| | | | |
| | | | | | | | | | | | | | | 10,499,007 | |
| | | | | | | | | | | | | | | | |
| | | | |
| Oregon: 0.20% | | | | | | | | | | | | | | | | |
Deschutes County OR Hospital Facilities Authority Cascade Healthcare Community Incorporated Project (Health Revenue) | | | 8.25 | | | | 1-1-2038 | | | | 4,500,000 | | | | 5,090,400 | |
| | | | | | | | | | | | | | | | |
| | | | |
| Pennsylvania: 8.67% | | | | | | | | | | | | | | | | |
Allegheny County PA Hospital Development Authority University of Pittsburgh Medical Center Series A (Health Revenue) | | | 5.63 | | | | 8-15-2039 | | | | 5,130,000 | | | | 5,581,132 | |
Beaver County PA IDA Pollution Control First Nuclear General Project Series A (Utilities Revenue) ± | | | 2.70 | | | | 4-1-2035 | | | | 2,000,000 | | | | 838,120 | |
| | | | |
| 18 | | Wells Fargo Municipal Bond Fund | | Portfolio of investments—December 31, 2016 (unaudited) |
| | | | | | | | | | | | | | | | |
| Security name | | Interest rate | | | Maturity date | | | Principal | | | Value | |
| | | | |
| Pennsylvania (continued) | | | | | | | | | | | | | | | | |
Berks County PA Municipal Authority Reading Hospital & Medical Center Project Series B (Health Revenue) | | | 2.23 | % | | | 11-1-2039 | | | $ | 20,000,000 | | | $ | 20,155,000 | |
Chester County PA IDA Avon Grove Charter School Project Series A (Education Revenue) | | | 6.25 | | | | 12-15-2027 | | | | 2,000,000 | | | | 2,054,020 | |
Delaware County PA IDA Resource Recovery Facility Series A (Resource Recovery Revenue) | | | 6.20 | | | | 7-1-2019 | | | | 790,000 | | | | 792,560 | |
Delaware Valley PA Regional Finance Authority Local Government Public Improvements Project (Miscellaneous Revenue) | | | 5.75 | | | | 7-1-2032 | | | | 5,000,000 | | | | 6,101,300 | |
Delaware Valley PA Regional Finance Authority Local Government Series A (Miscellaneous Revenue, Ambac Insured) | | | 5.50 | | | | 8-1-2028 | | | | 16,420,000 | | | | 19,482,330 | |
Delaware Valley PA Regional Finance Authority Local Government Series C (Miscellaneous Revenue, Ambac Insured) | | | 7.75 | | | | 7-1-2027 | | | | 3,925,000 | | | | 5,409,867 | |
Luzerne County PA Series E (GO Revenue, AGM Insured) | | | 8.00 | | | | 11-1-2027 | | | | 135,000 | | | | 149,120 | |
Montgomery County PA Higher Education & Health Authority Arcadia University (Education Revenue) | | | 5.00 | | | | 4-1-2024 | | | | 1,540,000 | | | | 1,705,997 | |
Montgomery County PA Higher Education & Health Authority Arcadia University (Education Revenue) | | | 5.00 | | | | 4-1-2025 | | | | 1,625,000 | | | | 1,801,426 | |
Montgomery County PA IDA Exelon Generation Company LLC Project Series A (Industrial Development Revenue) ± | | | 2.55 | | | | 12-1-2029 | | | | 15,530,000 | | | | 15,369,109 | |
Montgomery County PA IDA Peco Energy Company Project Series A (Industrial Development Revenue) ± | | | 2.50 | | | | 10-1-2030 | | | | 10,625,000 | | | | 10,501,856 | |
Penn Hills Municipality PA Series B (GO Revenue, Ambac Insured) ¤ | | | 0.00 | | | | 12-1-2017 | | | | 1,000,000 | | | | 984,540 | |
Pennsylvania EDFA Bridges Finco LP (Industrial Development Revenue) | | | 5.00 | | | | 12-31-2034 | | | | 14,275,000 | | | | 15,104,663 | |
Pennsylvania EDFA Bridges Finco LP (Industrial Development Revenue) | | | 5.00 | | | | 12-31-2030 | | | | 600,000 | | | | 647,526 | |
Pennsylvania EDFA Bridges Finco LP (Industrial Development Revenue) | | | 5.00 | | | | 12-31-2038 | | | | 2,100,000 | | | | 2,196,978 | |
Pennsylvania Finance Authority Penn Hills Project Series B (Miscellaneous Revenue, National Insured) ¤ | | | 0.00 | | | | 12-1-2025 | | | | 2,800,000 | | | | 2,073,260 | |
Pennsylvania HFA Single Family Mortgage Revenue Bonds AMT Series A (Housing Revenue) | | | 4.70 | | | | 10-1-2037 | | | | 3,655,000 | | | | 3,656,572 | |
Pennsylvania Public School Building Authority (Miscellaneous Revenue) | | | 5.00 | | | | 4-1-2024 | | | | 3,960,000 | | | | 4,252,406 | |
Pennsylvania Public School Building Authority Series DCL-016 (Miscellaneous Revenue, Dexia Credit Local LOC, AGM Insured) 144Aø | | | 1.19 | | | | 6-1-2023 | | | | 15,685,000 | | | | 15,685,000 | |
Pennsylvania Turnpike Commission Motor License Series B-1 (Transportation Revenue) | | | 5.00 | | | | 12-1-2040 | | | | 12,410,000 | | | | 13,353,905 | |
Philadelphia PA Airport Bonds AMT Series A (Airport Revenue, AGM Insured) | | | 5.00 | | | | 6-15-2032 | | | | 5,000,000 | | | | 5,066,300 | |
Philadelphia PA Airport Bonds AMT Series A (Airport Revenue, AGM Insured) | | | 5.00 | | | | 6-15-2037 | | | | 10,000,000 | | | | 10,117,900 | |
Philadelphia PA IDA 1st Philadelphia Preparatory Charter School Project Series A (Education Revenue) | | | 7.00 | | | | 6-15-2033 | | | | 2,000,000 | | | | 2,258,360 | |
Philadelphia PA IDA New Foundations Charter School Project (Education Revenue) | | | 6.00 | | | | 12-15-2027 | | | | 285,000 | | | | 307,119 | |
Philadelphia PA School District Series A (GO Revenue) | | | 5.00 | | | | 9-1-2024 | | | | 2,075,000 | | | | 2,285,094 | |
Philadelphia PA School District Series D (GO Revenue) | | | 5.00 | | | | 9-1-2021 | | | | 5,000,000 | | | | 5,469,650 | |
Philadelphia PA School District Series F (GO Revenue) | | | 5.00 | | | | 9-1-2035 | | | | 3,820,000 | | | | 4,073,113 | |
Philadelphia PA Series A (Water & Sewer Revenue) | | | 5.00 | | | | 7-1-2033 | | | | 8,000,000 | | | | 9,001,200 | |
Scranton PA Notes (GO Revenue) | | | 5.00 | | | | 11-15-2032 | | | | 2,750,000 | | | | 2,793,918 | |
State Public School Building Authority Pennsylvania Philadelphia School District Project Series A (Miscellaneous Revenue) | | | 5.00 | | | | 4-1-2022 | | | | 2,635,000 | | | | 2,861,874 | |
State Public School Building Authority Pennsylvania Philadelphia School District Project Series A (Miscellaneous Revenue) | | | 5.00 | | | | 6-1-2024 | | | | 2,250,000 | | | | 2,446,830 | |
State Public School Building Authority Pennsylvania Philadelphia School District Project Series A (Miscellaneous Revenue) | | | 5.00 | | | | 6-1-2034 | | | | 1,915,000 | | | | 2,046,197 | |
State Public School Building Authority Pennsylvania Philadelphia School District Project Series A (Miscellaneous Revenue) | | | 5.00 | | | | 6-1-2035 | | | | 16,715,000 | | | | 17,776,235 | |
| | | | | | |
| Portfolio of investments—December 31, 2016 (unaudited) | | Wells Fargo Municipal Bond Fund | | | 19 | |
| | | | | | | | | | | | | | | | |
| Security name | | Interest rate | | | Maturity date | | | Principal | | | Value | |
| | | | |
| Pennsylvania (continued) | | | | | | | | | | | | | | | | |
West Mifflin PA Area School District (GO Revenue, AGM Insured) | | | 5.00 | % | | | 4-1-2025 | | | $ | 1,180,000 | | | $ | 1,324,762 | |
West Mifflin PA Area School District (GO Revenue, AGM Insured) | | | 5.00 | | | | 4-1-2026 | | | | 1,200,000 | | | | 1,350,264 | |
West Mifflin PA Area School District (GO Revenue, AGM Insured) | | | 5.00 | | | | 4-1-2027 | | | | 1,000,000 | | | | 1,126,080 | |
Wilkes-Barre PA Finance Authority (Education Revenue) | | | 5.00 | | | | 3-1-2022 | | | | 955,000 | | | | 961,399 | |
Wilkes-Barre PA Finance Authority (Education Revenue) | | | 5.00 | | | | 3-1-2022 | | | | 645,000 | | | | 649,509 | |
York County PA IDA Philadelphia Electric Company Project Series A (Industrial Development Revenue) ± | | | 2.55 | | | | 6-1-2036 | | | | 3,390,000 | | | | 3,354,337 | |
| | | | |
| | | | | | | | | | | | | | | 223,166,828 | |
| | | | | | | | | | | | | | | | |
| | | | |
| Puerto Rico: 0.16% | | | | | | | | | | | | | | | | |
Puerto Rico Electric Power Authority Refunding Bond Series MM (Utilities Revenue, National Insured) | | | 5.00 | | | | 7-1-2017 | | | | 150,000 | | | | 152,309 | |
Puerto Rico Highway & Transportation Authority Series AA (Transportation Revenue, National Insured) | | | 5.50 | | | | 7-1-2020 | | | | 3,015,000 | | | | 3,199,910 | |
Puerto Rico Public Finance Corporation Commonwealth Appropriation Bond Series B (Miscellaneous Revenue, Government Development Bank for Puerto Rico SPA) (s)(t) | | | 5.50 | | | | 8-1-2031 | | | | 3,300,000 | | | | 264,000 | |
Puerto Rico Public Finance Corporation Commonwealth Appropriation Bond Series B (Tax Revenue, Government Development Bank for Puerto Rico SPA) (s)(t) | | | 6.00 | | | | 8-1-2024 | | | | 7,000,000 | | | | 560,000 | |
| | | | |
| | | | | | | | | | | | | | | 4,176,219 | |
| | | | | | | | | | | | | | | | |
| | | | |
| Rhode Island: 0.21% | | | | | | | | | | | | | | | | |
Rhode Island Clean Water Finance Agency Cranston Wastewater Treatment System (Miscellaneous Revenue, National Insured) | | | 5.80 | | | | 9-1-2022 | | | | 3,335,000 | | | | 3,339,836 | |
Rhode Island Commerce Corporation Series D (Airport Revenue) | | | 5.00 | | | | 7-1-2033 | | | | 1,415,000 | | | | 1,573,239 | |
Rhode Island Commerce Corporation Series D (Airport Revenue) | | | 5.00 | | | | 7-1-2036 | | | | 500,000 | | | | 549,995 | |
| | | | |
| | | | | | | | | | | | | | | 5,463,070 | |
| | | | | | | | | | | | | | | | |
| | | | |
| South Carolina: 0.64% | | | | | | | | | | | | | | | | |
Calhoun County SC Solid Waste Disposal Facilities Eastman Kodak Company Project (Industrial Development Revenue) | | | 6.75 | | | | 5-1-2017 | | | | 400,000 | | | | 407,516 | |
Connector 2000 Association Incorporated CAB Series A (Transportation Revenue) ¤ | | | 0.00 | | | | 1-1-2017 | | | | 164,621 | | | | 161,282 | |
Connector 2000 Association Incorporated CAB Series A (Transportation Revenue) ¤ | | | 0.00 | | | | 1-1-2018 | | | | 181,929 | | | | 163,685 | |
Lee County SC School Facilities Incorporated Series 2006 (Miscellaneous Revenue, AGC Insured) | | | 6.00 | | | | 12-1-2031 | | | | 2,890,000 | | | | 3,021,119 | |
Piedmont SC Municipal Power Agency (Utilities Revenue, FGIC Insured) | | | 6.75 | | | | 1-1-2019 | | | | 210,000 | | | | 232,334 | |
South Carolina Education Assistance Authority Student Loan Series I (Education Revenue) | | | 5.10 | | | | 10-1-2029 | | | | 1,655,000 | | | | 1,703,409 | |
South Carolina Jobs EDA York Preparatory Academy Project Series A (Education Revenue) | | | 7.25 | | | | 11-1-2045 | | | | 1,500,000 | | | | 1,608,915 | |
South Carolina Public Service Authority Series C (Utilities Revenue) | | | 4.00 | | | | 12-1-2032 | | | | 3,320,000 | | | | 3,489,320 | |
South Carolina Public Service Authority Series C (Utilities Revenue) | | | 5.00 | | | | 12-1-2028 | | | | 1,230,000 | | | | 1,439,198 | |
South Carolina Public Service Authority Series C (Utilities Revenue) | | | 5.00 | | | | 12-1-2034 | | | | 1,825,000 | | | | 2,064,148 | |
South Carolina Public Service Authority Series C (Utilities Revenue) | | | 5.00 | | | | 12-1-2035 | | | | 2,000,000 | | | | 2,249,540 | |
| | | | |
| | | | | | | | | | | | | | | 16,540,466 | |
| | | | | | | | | | | | | | | | |
| | | | |
| South Dakota: 0.29% | | | | | | | | | | | | | | | | |
Rapid City SD Series A (Airport Revenue) | | | 6.75 | | | | 12-1-2031 | | | | 1,020,000 | | | | 1,125,519 | |
Rapid City SD Series A (Airport Revenue) | | | 7.00 | | | | 12-1-2035 | | | | 750,000 | | | | 816,345 | |
South Dakota HEFA Sanford Health Project (Health Revenue) | | | 5.50 | | | | 11-1-2040 | | | | 5,000,000 | | | | 5,388,100 | |
| | | | |
| | | | | | | | | | | | | | | 7,329,964 | |
| | | | | | | | | | | | | | | | |
| | | | |
| 20 | | Wells Fargo Municipal Bond Fund | | Portfolio of investments—December 31, 2016 (unaudited) |
| | | | | | | | | | | | | | | | |
| Security name | | Interest rate | | | Maturity date | | | Principal | | | Value | |
| | | | |
| Tennessee: 0.43% | | | | | | | | | | | | | | | | |
Bristol TN Industrial Development Board CAB Series B (Tax Revenue) 144A¤ | | | 0.00 | % | | | 12-1-2026 | | | $ | 2,090,000 | | | $ | 1,175,562 | |
Bristol TN Industrial Development Board Series A (Tax Revenue) 144A | | | 5.00 | | | | 12-1-2035 | | | | 8,000,000 | | | | 7,313,120 | |
Bristol TN Industrial Development Board Series A (Tax Revenue) 144A | | | 5.13 | | | | 12-1-2042 | | | | 2,950,000 | | | | 2,632,787 | |
| | | | |
| | | | | | | | | | | | | | | 11,121,469 | |
| | | | | | | | | | | | | | | | |
| | | | |
| Texas: 6.39% | | | | | | | | | | | | | | | | |
Austin TX Airport System AMT (Airport Revenue) ## | | | 5.00 | | | | 11-15-2039 | | | | 8,000,000 | | | | 8,642,080 | |
Austin TX Airport System AMT (Airport Revenue) | | | 5.00 | | | | 11-15-2044 | | | | 3,500,000 | | | | 3,771,040 | |
Beasley TX Higher Education Finance Corporation Focus Learning Academy Series A (Education Revenue) | | | 7.75 | | | | 8-15-2041 | | | | 2,000,000 | | | | 1,784,200 | |
Central Texas Regional Mobility Authority Senior Lien (Transportation Revenue) | | | 5.75 | | | | 1-1-2025 | | | | 2,000,000 | | | | 2,228,680 | |
Central Texas Regional Mobility Authority Senior Lien Series A (Transportation Revenue) | | | 5.00 | | | | 1-1-2033 | | | | 3,740,000 | | | | 4,003,745 | |
Clifton TX Higher Educational Finance Corporation International Leadership Series A (Education Revenue) | | | 5.75 | | | | 8-15-2038 | | | | 2,000,000 | | | | 2,022,880 | |
Dallas TX Independent School District School Building (GO Revenue, Permanent School Fund Insured) | | | 6.38 | | | | 2-15-2034 | | | | 10,000,000 | | | | 10,588,600 | |
Grand Parkway Transportation Corporation TX CAB Series B (Transportation Revenue) ± | | | 0.00 | | | | 10-1-2029 | | | | 1,015,000 | | | | 871,032 | |
Grand Parkway Transportation Corporation TX CAB Series B (Transportation Revenue) ± | | | 0.00 | | | | 10-1-2030 | | | | 2,000,000 | | | | 1,711,940 | |
Houston TX Housing Finance Corporation Cullen Park Apartments Series A (Housing Revenue, FNMA LIQ) | | | 5.70 | | | | 12-1-2033 | | | | 965,000 | | | | 971,118 | |
La Vernia TX Higher Education Finance Corporation Lifeschool of Dallas Series A (Education Revenue) | | | 6.25 | | | | 8-15-2021 | | | | 3,135,000 | | | | 3,508,661 | |
La Vernia TX Higher Education Finance Corporation Lifeschool of Dallas Series A (Education Revenue) | | | 7.50 | | | | 8-15-2041 | | | | 6,500,000 | | | | 7,482,800 | |
La Vernia TX Higher Education Finance Corporation Series A (Education Revenue) | | | 6.25 | | | | 2-15-2017 | | | | 170,000 | | | | 171,131 | |
Lewisville TX Combination Contract Castle Hills Public Improvement Bonds Project #5 (Miscellaneous Revenue) 144A | | | 6.50 | | | | 9-1-2034 | | | | 2,195,000 | | | | 2,245,529 | |
Lewisville TX Combination Contract Castle Hills Public Improvement Bonds Project #5 (Miscellaneous Revenue) 144A | | | 6.50 | | | | 9-1-2034 | | | | 4,370,000 | | | | 4,470,597 | |
Lewisville TX Combination Contract Castle Hills Public Improvement Bonds Project #5 (Miscellaneous Revenue) | | | 6.75 | | | | 10-1-2032 | | | | 1,855,000 | | | | 1,906,476 | |
Lower Colorado TX River Authority Series A (Utilities Revenue) | | | 5.00 | | | | 5-15-2033 | | | | 2,475,000 | | | | 2,754,131 | |
North Texas Tollway Authority Second Tier Revenue Series A (Transportation Revenue) | | | 5.00 | | | | 1-1-2035 | | | | 4,000,000 | | | | 4,445,120 | |
North Texas Tollway Authority Series A (Transportation Revenue) | | | 5.00 | | | | 1-1-2033 | | | | 3,600,000 | | | | 4,032,720 | |
Houston Port Authority Series D-1 (GO Revenue) | | | 5.00 | | | | 10-1-2035 | | | | 10,000,000 | | | | 11,021,000 | |
San Leanna TX Educational Facilities Prerefunded St. Edwards University Project (Education Revenue) | | | 5.13 | | | | 6-1-2022 | | | | 820,000 | | | | 834,243 | |
San Leanna TX Educational Facilities Prerefunded St. Edwards University Project (Education Revenue) | | | 5.13 | | | | 6-1-2023 | | | | 480,000 | | | | 488,338 | |
San Leanna TX Educational Facilities Prerefunded St. Edwards University Project (Education Revenue) | | | 5.13 | | | | 6-1-2024 | | | | 360,000 | | | | 366,253 | |
San Leanna TX Educational Facilities Unrefunded St. Edwards University Project (Education Revenue) | | | 5.13 | | | | 6-1-2022 | | | | 915,000 | | | | 924,635 | |
San Leanna TX Educational Facilities Unrefunded St. Edwards University Project (Education Revenue) | | | 5.13 | | | | 6-1-2023 | | | | 520,000 | | | | 525,226 | |
San Leanna TX Educational Facilities Unrefunded St. Edwards University Project (Education Revenue) | | | 5.13 | | | | 6-1-2024 | | | | 390,000 | | | | 393,803 | |
| | | | | | |
| Portfolio of investments—December 31, 2016 (unaudited) | | Wells Fargo Municipal Bond Fund | | | 21 | |
| | | | | | | | | | | | | | | | |
| Security name | | Interest rate | | | Maturity date | | | Principal | | | Value | |
| | | | |
| Texas (continued) | | | | | | | | | | | | | | | | |
Tarrant County TX Cultural Education Facilities Buckingham Senior Living Community Incorporated (Health Revenue) | | | 3.88 | % | | | 11-15-2020 | | | $ | 2,000,000 | | | $ | 2,005,080 | |
Tarrant County TX Cultural Education Facilities Finance Corporation Air Force Village Obligation Group (Health Revenue) | | | 5.00 | | | | 5-15-2017 | | | | 1,400,000 | | | | 1,421,462 | |
Tarrant County TX Cultural Education Facilities Finance Corporation Series B (Health Revenue) | | | 5.00 | | | | 11-15-2030 | | | | 4,000,000 | | | | 4,207,600 | |
Tarrant County TX Cultural Education Facilities Finance Corporation Texas Health Resources Series A (Health Revenue) | | | 5.00 | | | | 2-15-2023 | | | | 9,900,000 | | | | 9,949,005 | |
Texas Municipal Gas Acquisition & Supply Corporation II Series B (Utilities Revenue, JPMorgan Chase & Company Guaranteed) ± | | | 1.19 | | | | 9-15-2017 | | | | 4,355,000 | | | | 4,339,975 | |
Texas Municipal Gas Acquisition & Supply Corporation III (Utilities Revenue) | | | 5.00 | | | | 12-15-2029 | | | | 5,000,000 | | | | 5,298,000 | |
Texas Municipal Gas Acquisition & Supply Corporation III (Utilities Revenue) | | | 5.00 | | | | 12-15-2031 | | | | 5,000,000 | | | | 5,273,500 | |
Texas Municipal Gas Acquisition & Supply Corporation Subordinated Lien Series C (Utilities Revenue) ± | | | 2.02 | | | | 12-15-2026 | | | | 24,780,000 | | | | 22,373,366 | |
Texas Private Activity Bond Surface Transportation Corporation Project NTE Mobility Partners Segments LLC (Transportation Revenue) | | | 6.75 | | | | 6-30-2043 | | | | 4,000,000 | | | | 4,602,720 | |
Texas Private Activity Bond Surface Transportation Corporation Project NTE Mobility Partners Segments LLC (Transportation Revenue) | | | 7.00 | | | | 12-31-2038 | | | | 12,500,000 | | | | 14,208,250 | |
Texas Transportation Commission Highway Improvement (Miscellaneous Revenue) | | | 5.00 | | | | 4-1-2028 | | | | 7,280,000 | | | | 8,507,772 | |
| | | | |
| | | | | | | | | | | | | | | 164,352,708 | |
| | | | | | | | | | | | | | | | |
| | | | |
| Utah: 0.54% | | | | | | | | | | | | | | | | |
Utah County UT Charter School Ronald Wilson Reagan Series A (Education Revenue) | | | 5.75 | | | | 2-15-2022 | | | | 570,000 | | | | 593,524 | |
Utah State Charter School Finance Authority Early Light Academy Project (Education Revenue) | | | 8.50 | | | | 7-15-2046 | | | | 6,480,000 | | | | 7,027,366 | |
Utah State Charter School Finance Authority Oquirrh Mountain Charter School Project (Education Revenue) | | | 8.00 | | | | 7-15-2030 | | | | 1,940,000 | | | | 2,064,800 | |
Utah State Charter School Finance Authority Oquirrh Mountain Charter School Project (Education Revenue) | | | 8.00 | | | | 7-15-2041 | | | | 3,910,000 | | | | 4,157,933 | |
| | | | |
| | | | | | | | | | | | | | | 13,843,623 | |
| | | | | | | | | | | | | | | | |
| | | | |
| Vermont: 1.53% | | | | | | | | | | | | | | | | |
Vermont Student Assistance Corporation Series B Class A-2 (Education Revenue) ± | | | 3.94 | | | | 12-3-2035 | | | | 16,800,000 | | | | 17,704,848 | |
Vermont Student Assistance Corporation Series B Class B (Education Revenue) ± | | | 1.62 | | | | 6-2-2042 | | | | 21,883,566 | | | | 21,782,901 | |
| | | | |
| | | | | | | | | | | | | | | 39,487,749 | |
| | | | | | | | | | | | | | | | |
| | | | |
| Virgin Islands: 1.10% | | | | | | | | | | | | | | | | |
Virgin Islands PFA Matching Fund Loan Note Senior Lien Series A (Tobacco Revenue) | | | 5.00 | | | | 10-1-2025 | | | | 7,500,000 | | | | 6,371,700 | |
Virgin Islands PFA Series A (Tax Revenue) | | | 5.00 | | | | 10-1-2029 | | | | 7,480,000 | | | | 6,365,929 | |
Virgin Islands PFA Series A (Tax Revenue) 144A | | | 5.00 | | | | 10-1-2032 | | | | 8,315,000 | | | | 6,901,866 | |
Virgin Islands PFA Series C (Tobacco Revenue) | | | 5.00 | | | | 10-1-2018 | | | | 8,860,000 | | | | 8,726,834 | |
| | | | |
| | | | | | | | | | | | | | | 28,366,329 | |
| | | | | | | | | | | | | | | | |
| | | | |
| Virginia: 0.49% | | | | | | | | | | | | | | | | |
Chesapeake Bay VA Bridge & Tunnel District (Transportation Revenue) | | | 5.00 | | | | 7-1-2046 | | | | 1,500,000 | | | | 1,616,385 | |
Chesapeake Bay VA Bridge & Tunnel District (Transportation Revenue) | | | 5.00 | | | | 7-1-2051 | | | | 4,500,000 | | | | 4,834,395 | |
Marquis VA CDA CAB Series C (Tax Revenue) (i)¤ | | | 0.00 | | | | 9-1-2041 | | | | 1,824,000 | | | | 230,681 | |
| | | | |
| 22 | | Wells Fargo Municipal Bond Fund | | Portfolio of investments—December 31, 2016 (unaudited) |
| | | | | | | | | | | | | | | | |
| Security name | | Interest rate | | | Maturity date | | | Principal | | | Value | |
| | | | |
| Virginia (continued) | | | | | | | | | | | | | | | | |
Marquis VA CDA CCAB (Tax Revenue) 144A± | | | 0.00 | % | | | 9-1-2045 | | | $ | 397,000 | | | $ | 255,327 | |
Marquis VA CDA Series B (Tax Revenue) (i) | | | 5.63 | | | | 9-1-2041 | | | | 1,310,000 | | | | 1,005,687 | |
Riverside VA Regional Jail Authority (Miscellaneous Revenue) | | | 5.00 | | | | 7-1-2025 | | | | 3,435,000 | | | | 3,923,148 | |
Watkins Centre VA CDA (Miscellaneous Revenue) | | | 5.40 | | | | 3-1-2020 | | | | 609,000 | | | | 609,968 | |
| | | | |
| | | | | | | | | | | | | | | 12,475,591 | |
| | | | | | | | | | | | | | | | |
| | | | |
| Washington: 1.33% | | | | | | | | | | | | | | | | |
King County WA Public Hospital District #1 Valley Medical Center Refunding Bond (GO Revenue) %% | | | 5.00 | | | | 12-1-2029 | | | | 8,940,000 | | | | 10,055,354 | |
King County WA Public Hospital District #1 Valley Medical Center Refunding Bond (GO Revenue) %% | | | 5.00 | | | | 12-1-2035 | | | | 9,430,000 | | | | 10,322,832 | |
Spokane WA Housing Finance Commission Riverview Retirement Community Project (Health Revenue) | | | 5.00 | | | | 1-1-2023 | | | | 1,355,000 | | | | 1,445,284 | |
Washington Health Care Facilities Authority Central Washington (Health Revenue) | | | 7.00 | | | | 7-1-2039 | | | | 5,000,000 | | | | 5,662,425 | |
Washington Series R-A (GO Revenue) | | | 5.00 | | | | 8-1-2029 | | | | 5,680,000 | | | | 6,750,850 | |
| | | | |
| | | | | | | | | | | | | | | 34,236,745 | |
| | | | | | | | | | | | | | | | |
| | | | |
| West Virginia: 0.10% | | | | | | | | | | | | | | | | |
West Virginia Hospital Finance Authority Improvement Series D (Health Revenue, AGM Insured) | | | 5.50 | | | | 6-1-2033 | | | | 2,305,000 | | | | 2,489,815 | |
| | | | | | | | | | | | | | | | |
| | | | |
| Wisconsin: 0.62% | | | | | | | | | | | | | | | | |
Milwaukee WI RDA Science Education Consortium Incorporated Project Series A (Education Revenue) | | | 6.00 | | | | 8-1-2033 | | | | 2,120,000 | | | | 2,283,155 | |
Milwaukee WI RDA Science Education Consortium Incorporated Project Series A (Education Revenue) | | | 6.25 | | | | 8-1-2043 | | | | 4,650,000 | | | | 5,004,935 | |
Wisconsin HEFA Aurora Health Care Incorporated Series A (Health Revenue) | | | 5.25 | | | | 4-15-2024 | | | | 1,025,000 | | | | 1,116,932 | |
Wisconsin HEFA Series M (Health Revenue, National Insured) (m)(n)± | | | 1.10 | | | | 6-1-2019 | | | | 2,700,000 | | | | 2,632,500 | |
Wisconsin PFA Carolina International School Series A (Education Revenue) 144A | | | 6.00 | | | | 8-1-2023 | | | | 470,000 | | | | 494,191 | |
Wisconsin PFA Carolina International School Series A (Education Revenue) 144A | | | 6.75 | | | | 8-1-2033 | | | | 1,430,000 | | | | 1,546,817 | |
Wisconsin PFA Carolina International School Series A (Education Revenue) 144A | | | 7.00 | | | | 8-1-2043 | | | | 1,575,000 | | | | 1,721,207 | |
Wisconsin PFA Carolina International School Series A (Education Revenue) 144A | | | 7.20 | | | | 8-1-2048 | | | | 940,000 | | | | 1,033,539 | |
| | | | |
| | | | | | | | | | | | | | | 15,833,276 | |
| | | | | | | | | | | | | | | | |
| | | | |
| Wyoming: 0.09% | | | | | | | | | | | | | | | | |
West Park Hospital District Wyoming Series B (Health Revenue) | | | 6.50 | | | | 6-1-2027 | | | | 500,000 | | | | 565,390 | |
Wyoming CDA (Education Revenue) | | | 6.50 | | | | 7-1-2043 | | | | 1,600,000 | | | | 1,744,080 | |
| | | | |
| | | | | | | | | | | | | | | 2,309,470 | |
| | | | | | | | | | | | | | | | |
| | | | |
Total Municipal Obligations (Cost $2,491,776,445) | | | | | | | | | | | | | | | 2,554,083,158 | |
| | | | | | | | | | | | | | | | |
| | | | |
| | | Yield | | | | | | Shares | | | | |
| Short-Term Investments: 0.17% | | | | | | | | | | | | | | | | |
| | | | |
| Investment Companies: 0.17% | | | | | | | | | | | | | | | | |
Wells Fargo Municipal Cash Management Fund Institutional Class (l)(u)## | | | 0.67 | | | | | | | | 4,425,767 | | | $ | 4,428,423 | |
| | | | | | | | | | | | | | | | |
| | | | |
Total Short-Term Investments (Cost $4,427,956) | | | | | | | | | | | | | | | 4,428,423 | |
| | | | | | | | | | | | | | | | |
| | | | | | | | |
| Total investments in securities (Cost $2,512,044,714) * | | | 100.03 | % | | | 2,574,057,359 | |
Other assets and liabilities, net | | | (0.03 | ) | | | (704,445 | ) |
| | | | | | | | |
| Total net assets | | | 100.00 | % | | $ | 2,573,352,914 | |
| | | | | | | | |
| | | | | | |
| Portfolio of investments—December 31, 2016 (unaudited) | | Wells Fargo Municipal Bond Fund | | | 23 | |
| 144A | The security may be resold in transactions exempt from registration, normally to qualified institutional buyers, pursuant to Rule 144A under the Securities Act of 1933. |
| ¤ | The security is issued in zero coupon form with no periodic interest payments. |
| ± | Variable rate investment. The rate shown is the rate in effect at period end. |
| (s) | The security is currently in default with regards to scheduled interest and/or principal payments. |
| (t) | The Fund has stopped accruing interest on the security. |
| ## | All or a portion of this security is segregated for when-issued securities. |
| ø | Variable rate demand notes are subject to a demand feature which reduces the effective maturity. The maturity date shown represents the final maturity date of the security. The interest rate is determined and reset by the issuer daily, weekly, or monthly depending upon the terms of the security. The rate shown is the rate in effect at period end. |
| %% | The security is issued on a when-issued basis. |
| (m) | The security is an auction-rate security which has an interest rate that resets at predetermined short-term intervals through a Dutch auction. The rate shown is the rate in effect at period end. |
| (n) | The auction to set the interest rate on the security failed at period end due to insufficient investor interest. A failed auction does not itself cause a default. |
| (l) | The issuer of the security is an affiliated person of the Fund as defined in the Investment Company Act of 1940. |
| (u) | The rate represents the 7-day annualized yield at period end. |
| * | Cost for federal income tax purposes is $2,512,483,411 and unrealized gains (losses) consists of: |
| | | | |
Gross unrealized gains | | $ | 109,113,140 | |
Gross unrealized losses | | | (47,539,192 | ) |
| | | | |
Net unrealized gains | | $ | 61,573,948 | |
| | | | | | |
| Portfolio of investments—December 31, 2016 (unaudited) | | Wells Fargo Ultra Short-Term Municipal Income Fund | | | 1 | |
| | | | | | | | | | | | | | | | |
| Security name | | Interest rate | | | Maturity date | | | Principal | | | Value | |
| | | | |
Corporate Bonds and Notes: 0.09% | | | | | | | | | | | | | | | | |
| | | | |
Consumer Discretionary: 0.09% | | | | | | | | | | | | | | | | |
| | | | |
| Hotels, Restaurants & Leisure: 0.09% | | | | | | | | | | | | | | | | |
Marriott International Incorporated | | | 3.00 | % | | | 3-1-2019 | | | $ | 4,810,000 | | | $ | 4,892,544 | |
| | | | | | | | | | | | | | | | |
| | | | |
Total Corporate Bonds and Notes (Cost $4,933,225) | | | | | | | | | | | | | | | 4,892,544 | |
| | | | | | | | | | | | | | | | |
| | | | |
Municipal Obligations: 94.77% | | | | | | | | | | | | | | | | |
| | | | |
| Alabama: 2.91% | | | | | | | | | | | | | | | | |
Alabama Black Belt Energy Gas District Series A (Utilities Revenue, Royal Bank of Canada LIQ) ± | | | 4.00 | | | | 7-1-2046 | | | | 13,410,000 | | | | 14,292,780 | |
Alabama Health Care Authority for Baptist Health Series B (Health Revenue, AGC Insured) ±(m) | | | 1.15 | | | | 11-15-2037 | | | | 2,250,000 | | | | 2,250,000 | |
Alabama Health Care Authority for Baptist Health Series B (Health Revenue) ø | | | 1.25 | | | | 11-1-2042 | | | | 17,000,000 | | | | 17,000,000 | |
Alabama HFA The Park at Sydney Drive Series B (Housing Revenue) ± | | | 1.50 | | | | 12-1-2019 | | | | 10,000,000 | | | | 9,999,900 | |
Alabama Port Authority Docks Facilities AMT Series A (Airport Revenue, National Insured) | | | 5.00 | | | | 10-1-2017 | | | | 2,000,000 | | | | 2,005,760 | |
Chatom AL Industrial Development Board Alabama Electric Series A (Utilities Revenue, National Rural Utilities Cooperative Finance Corporation SPA) ± | | | 0.88 | | | | 8-1-2037 | | | | 13,000,000 | | | | 12,996,360 | |
Chatom AL Industrial Development Board Gulf Opportunity Zone PowerSouth Energy Cooperative Projects Series A (Utilities Revenue, National Rural Utilities Finance Corporation SPA) ± | | | 0.95 | | | | 11-15-2038 | | | | 35,000,000 | | | | 34,966,050 | |
Jefferson County AL Series A (GO Revenue) | | | 4.90 | | | | 4-1-2021 | | | | 16,645,000 | | | | 17,335,601 | |
Jefferson County AL Sewer Subordinated Lien Series D (Water & Sewer Revenue) | | | 5.00 | | | | 10-1-2017 | | | | 1,750,000 | | | | 1,787,450 | |
Tender Option Bond Trust Receipts/Certificates Floaters Series XM0184 (Utilities Revenue, Morgan Stanley Bank LIQ) ø144A | | | 1.17 | | | | 9-1-2046 | | | | 31,400,000 | | | | 31,400,000 | |
Tuscaloosa County AL IDA (Industrial Development Revenue) ø | | | 1.00 | | | | 9-1-2020 | | | | 12,600,000 | | | | 12,600,000 | |
| | | | |
| | | | | | | | | | | | | | | 156,633,901 | |
| | | | | | | | | | | | | | | | |
| | | | |
| Alaska: 0.04% | | | | | | | | | | | | | | | | |
Alaska Industrial Development and Export Authority Snettisham Hydroelectric Project Series 2015 (Utilities Revenue) | | | 5.00 | | | | 1-1-2017 | | | | 765,000 | | | | 765,077 | |
North Slope Borough AK Water & Wastewater Facilities Service (Water & Sewer Revenue) | | | 4.00 | | | | 6-30-2018 | | | | 1,125,000 | | | | 1,171,530 | |
| | | | |
| | | | | | | | | | | | | | | 1,936,607 | |
| | | | | | | | | | | | | | | | |
| | | | |
| Arizona: 1.52% | | | | | | | | | | | | | | | | |
Goodyear AZ McDowell Road Commercial Corridor Improvement (Miscellaneous Revenue, Ambac Insured) | | | 5.25 | | | | 1-1-2017 | | | | 1,580,000 | | | | 1,580,174 | |
Maricopa County AZ Gilbert Unified School District No. 41 (GO Revenue, Build America Mutual Assurance Company Insured) | | | 3.00 | | | | 7-1-2019 | | | | 3,845,000 | | | | 3,966,963 | |
Phoenix AZ IDA Various Republic Services Incorporated Projects (Industrial Development Revenue) ± | | | 0.90 | | | | 12-1-2035 | | | | 25,000,000 | | | | 25,000,000 | |
Scottsdale AZ IDA Healthcare Series F (Health Revenue, AGM Insured) ±(m) | | | 0.90 | | | | 9-1-2045 | | | | 51,000,000 | | | | 51,000,000 | |
University of Arizona Medical Center Corporation (Health Revenue) | | | 5.00 | | | | 7-1-2017 | | | | 545,000 | | | | 556,238 | |
| | | | |
| | | | | | | | | | | | | | | 82,103,375 | |
| | | | | | | | | | | | | | | | |
| | | | |
| Arkansas: 0.03% | | | | | | | | | | | | | | | | |
Arkansas Development Finance Authority Police Headquarters & Wireless Data Equipment Project (Miscellaneous Revenue, AGM Insured) | | | 4.00 | | | | 6-1-2017 | | | | 850,000 | | | | 859,979 | |
Arkansas Development Finance Authority Police Headquarters & Wireless Data Equipment Project (Miscellaneous Revenue, AGM Insured) | | | 4.00 | | | | 6-1-2018 | | | | 500,000 | | | | 517,375 | |
| | | | |
| | | | | | | | | | | | | | | 1,377,354 | |
| | | | | | | | | | | | | | | | |
| | | | |
| 2 | | Wells Fargo Ultra Short-Term Municipal Income Fund | | Portfolio of investments—December 31, 2016 (unaudited) |
| | | | | | | | | | | | | | | | |
| Security name | | Interest rate | | | Maturity date | | | Principal | | | Value | |
| | | | |
| California: 6.47% | | | | | | | | | | | | | | | | |
Acalanes CA Union High School District BAN (GO Revenue) | | | 5.00 | % | | | 8-1-2017 | | | $ | 4,500,000 | | | $ | 4,605,075 | |
Bay Area Toll Authority California San Francisco Bay Area Toll Bridge Series A (Transportation Revenue) ± | | | 1.00 | | | | 4-1-2047 | | | | 29,785,000 | | | | 29,771,895 | |
Bay Area Toll Authority California San Francisco Bay Area Toll Bridge Series C (Transportation Revenue) ± | | | 1.37 | | | | 4-1-2045 | | | | 1,500,000 | | | | 1,500,240 | |
California (GO Revenue) ± | | | 4.00 | | | | 12-1-2027 | | | | 5,000,000 | | | | 5,063,500 | |
California Administrative Services Sacramento Unified School District (Miscellaneous Revenue, Ambac Insured) ± | | | 1.64 | | | | 1-1-2017 | | | | 615,000 | | | | 615,000 | |
California Association of Bay Area Governments Financing Authority Series D (Health Revenue, Citibank NA LOC) ø | | | 0.69 | | | | 8-1-2035 | | | | 950,000 | | | | 950,000 | |
California GO Series B Sub Series B-2 (Miscellaneous Revenue, Bank of Tokyo-Mitsubishi LOC) ø | | | 0.69 | | | | 5-1-2040 | | | | 5,000,000 | | | | 5,000,000 | |
California HFFA San Diego Hospital Series A (Health Revenue, National Insured) ±(m)(n) | | | 0.83 | | | | 7-15-2018 | | | | 1,900,000 | | | | 1,866,750 | |
California HFFA Scripps Health Series D (Health Revenue, Bank of America NA LOC) ø | | | 0.69 | | | | 10-1-2031 | | | | 4,245,000 | | | | 4,245,000 | |
California Infrastructure & Economic Development Bank The J. Paul Getty Trust Series A-2 (Miscellaneous Revenue) ± | | | 1.01 | | | | 4-1-2038 | | | | 22,920,000 | | | | 22,916,333 | |
California Infrastructure & Economic Development Bank The J. Paul Getty Trust Series A-3 (Miscellaneous Revenue) ± | | | 1.01 | | | | 4-1-2038 | | | | 15,600,000 | | | | 15,597,504 | |
California Infrastructure & Economic Development Bank The J. Paul Getty Trust Series A-4 (Miscellaneous Revenue) ± | | | 1.01 | | | | 4-1-2038 | | | | 32,000,000 | | | | 31,994,880 | |
California Municipal Financing Authority BAN Open Door Community Health Centers (Health Revenue) | | | 2.80 | | | | 9-15-2018 | | | | 6,000,000 | | | | 6,050,820 | |
California PFOTER PT-2802 (GO Revenue, National Insured, Dexia Credit Local SPA) ø | | | 0.95 | | | | 2-1-2025 | | | | 9,935,000 | | | | 9,935,000 | |
California PFOTER Series DCL-009 (GO Revenue, Dexia Credit Local LOC, AGM Insured) ø144A | | | 0.90 | | | | 8-1-2027 | | | | 31,940,000 | | | | 31,940,000 | |
California PFOTER Series DCL-010 (GO Revenue, Dexia Credit Local LOC, AGM Insured) ø144A | | | 0.90 | | | | 8-1-2027 | | | | 7,815,000 | | | | 7,815,000 | |
California Pollution Control Financing Authority Series A (Resource Recovery Revenue) 144A± | | | 0.90 | | | | 8-1-2023 | | | | 10,000,000 | | | | 10,000,000 | |
California Public Works Board Department of Corrections Project Series A (Miscellaneous Revenue, Ambac Insured) | | | 5.00 | | | | 12-1-2019 | | | | 950,000 | | | | 1,007,390 | |
California Statewide CDA Buck Institute for Research (Miscellaneous Revenue) | | | 4.00 | | | | 11-15-2017 | | | | 260,000 | | | | 266,378 | |
California Statewide CDA Buck Institute for Research (Miscellaneous Revenue) | | | 5.00 | | | | 11-15-2018 | | | | 275,000 | | | | 292,845 | |
California Statewide CDA Health Facilities Catholic Series D (Health Revenue, AGM Insured) ±(m) | | | 0.99 | | | | 7-1-2041 | | | | 15,825,000 | | | | 15,825,000 | |
California Statewide CDA Health Facilities Catholic Series E (Health Revenue, AGM Insured) ±(m) | | | 0.84 | | | | 7-1-2040 | | | | 22,100,000 | | | | 22,100,000 | |
California Statewide CDA Health Facilities Catholic Series F (Health Revenue, AGM Insured) ±(m) | | | 0.99 | | | | 7-1-2040 | | | | 2,875,000 | | | | 2,875,000 | |
California Statewide CDA Samoa Avenue Apartments Series V (Housing Revenue) ± | | | 0.95 | | | | 12-1-2017 | | | | 10,000,000 | | | | 9,987,900 | |
Compton CA PFA Prerefunded (Miscellaneous Revenue, Ambac Insured) | | | 5.00 | | | | 9-1-2022 | | | | 6,925,000 | | | | 7,282,746 | |
El Monte CA Union High School District Refunding Bond (GO Revenue) | | | 4.00 | | | | 6-1-2017 | | | | 5,365,000 | | | | 5,431,150 | |
Northern California Gas Authority #1 LIBOR Series B (Utilities Revenue) ± | | | 1.17 | | | | 7-1-2017 | | | | 18,150,000 | | | | 18,167,424 | |
Palomar Pomerado CA Health Care District Certificate of Participation Series A (Health Revenue, AGM Insured) ±(m) | | | 1.95 | | | | 11-1-2036 | | | | 18,150,000 | | | | 18,150,000 | |
Palomar Pomerado CA Health Care District Certificate of Participation Series B (Health Revenue, AGM Insured) ±(m) | | | 1.99 | | | | 11-1-2036 | | | | 18,300,000 | | | | 18,300,000 | |
Palomar Pomerado CA Health Care District ROC RR-11872 (GO Revenue, National Insured, Citibank NA LIQ) ø144A | | | 0.92 | | | | 4-13-2017 | | | | 6,000,000 | | | | 6,000,000 | |
| | | | | | |
| Portfolio of investments—December 31, 2016 (unaudited) | | Wells Fargo Ultra Short-Term Municipal Income Fund | | | 3 | |
| | | | | | | | | | | | | | | | |
| Security name | | Interest rate | | | Maturity date | | | Principal | | | Value | |
| | | | |
| California (continued) | | | | | | | | | | | | | | | | |
Sacramento County CA Airport System AMT Senior Series B (Airport Revenue, AGM Insured) | | | 5.50 | % | | | 7-1-2018 | | | $ | 4,450,000 | | | $ | 4,560,672 | |
Sacramento County CA Airport System Refunding AMT Subordinated & PFC Series E (Airport Revenue, AGM Insured) | | | 5.50 | | | | 7-1-2018 | | | | 5,345,000 | | | | 5,478,251 | |
Santa Clara CA PFOTER Series 4713 (GO Revenue, Ambac Insured, Dexia Credit Local LIQ) ø144A | | | 1.03 | | | | 12-15-2021 | | | | 22,445,000 | | | | 22,445,000 | |
Yuba CA Community College CAB Series B (GO Revenue, Ambac Insured) ¤ | | | 0.00 | | | | 8-1-2039 | | | | 750,000 | | | | 250,388 | |
| | | | |
| | | | | | | | | | | | | | | 348,287,141 | |
| | | | | | | | | | | | | | | | |
| | | | |
| Colorado: 0.87% | | | | | | | | | | | | | | | | |
Colorado HEFA Covenant Retirement Community Series A (Health Revenue) | | | 3.00 | | | | 12-1-2017 | | | | 1,400,000 | | | | 1,419,432 | |
Colorado HEFA Covenant Retirement Community Series A (Health Revenue) | | | 4.00 | | | | 12-1-2018 | | | | 1,150,000 | | | | 1,194,436 | |
Colorado HEFA Montbello Senior Housing Project Series I (Housing Revenue, FHA Insured) | | | 1.05 | | | | 8-1-2018 | | | | 2,755,000 | | | | 2,740,371 | |
Colorado HFA Series 3127X (Health Revenue, Bank of America NA LIQ) ø144A | | | 1.32 | | | | 7-1-2034 | | | | 8,625,000 | | | | 8,625,000 | |
Colorado Springs CO Utilities Series A (Utilities Revenue, Bank of America NA SPA) ø | | | 0.74 | | | | 11-1-2023 | | | | 12,375,000 | | | | 12,375,000 | |
Denver CO City & County 2300 Welton Project (Housing Revenue) | | | 0.65 | | | | 4-1-2017 | | | | 2,290,000 | | | | 2,289,565 | |
Denver CO City & County Airport Sub Series A (Airport Revenue) | | | 5.00 | | | | 11-15-2017 | | | | 400,000 | | | | 412,652 | |
Denver CO City & County Airport Sub Series A (Airport Revenue) | | | 5.00 | | | | 11-15-2018 | | | | 500,000 | | | | 529,575 | |
Denver CO City & County Airport Sub Series B (Airport Revenue) | | | 5.00 | | | | 11-15-2017 | | | | 600,000 | | | | 619,554 | |
Denver CO City & County Airport Sub Series B (Airport Revenue) | | | 5.00 | | | | 11-15-2018 | | | | 600,000 | | | | 638,874 | |
Denver CO City & County Airport Sub Series F2 (Airport Revenue, AGC Insured) ±(m) | | | 1.05 | | | | 11-15-2025 | | | | 4,275,000 | | | | 4,275,000 | |
E-470 Colorado Public Highway Authority Senior Index Series A (Transportation Revenue) ± | | | 1.91 | | | | 9-1-2039 | | | | 11,725,000 | | | | 11,676,928 | |
| | | | |
| | | | | | | | | | | | | | | 46,796,387 | |
| | | | | | | | | | | | | | | | |
| | | | |
| Connecticut: 2.90% | | | | | | | | | | | | | | | | |
Connecticut Economic Recovery Notes Series A-3 (GO Revenue) ø | | | 0.77 | | | | 7-1-2017 | | | | 20,000,000 | | | | 20,000,000 | |
Connecticut HEFA Lawrence & Memorial Hospital Series F (Health Revenue) | | | 4.00 | | | | 7-1-2017 | | | | 1,880,000 | | | | 1,905,737 | |
Connecticut HEFA Yale University Issue Series U-1 (Education Revenue) ± | | | 1.00 | | | | 7-1-2033 | | | | 1,000,000 | | | | 987,210 | |
Connecticut HEFA Yale University Series A (Education Revenue) ± | | | 0.80 | | | | 7-1-2048 | | | | 5,125,000 | | | | 5,117,671 | |
Connecticut HEFA Yale University Series A (Education Revenue) ± | | | 1.00 | | | | 7-1-2042 | | | | 15,000,000 | | | | 14,718,450 | |
Connecticut HEFA Yale University Series T-2 (Education Revenue) ± | | | 0.60 | | | | 7-1-2029 | | | | 34,520,000 | | | | 34,511,715 | |
Connecticut HEFA Yale University Series X-2 (Education Revenue) ± | | | 0.90 | | | | 7-1-2037 | | | | 24,600,000 | | | | 24,504,552 | |
Connecticut HFA Housing Mortgage Finance Program Series A (Housing Revenue) | | | 2.40 | | | | 11-15-2020 | | | | 1,250,000 | | | | 1,265,388 | |
Connecticut HFA Housing Mortgage Finance Program Series F (Housing Revenue) | | | 1.55 | | | | 5-15-2020 | | | | 1,020,000 | | | | 999,784 | |
Connecticut Series A (Miscellaneous Revenue) ± | | | 1.15 | | | | 3-1-2018 | | | | 2,875,000 | | | | 2,868,043 | |
Connecticut Series A (Miscellaneous Revenue) ± | | | 1.48 | | | | 5-15-2018 | | | | 7,000,000 | | | | 7,013,580 | |
Connecticut Series D (Miscellaneous Revenue) ± | | | 1.42 | | | | 8-15-2017 | | | | 14,855,000 | | | | 14,872,975 | |
Connecticut Series D (Miscellaneous Revenue) ± | | | 1.61 | | | | 8-15-2018 | | | | 6,000,000 | | | | 6,006,720 | |
New Britain CT (GO Revenue, Ambac Insured) | | | 5.00 | | | | 4-15-2017 | | | | 1,165,000 | | | | 1,179,050 | |
New Haven CT Series A (GO Revenue) | | | 3.00 | | | | 8-15-2017 | | | | 13,410,000 | | | | 13,537,931 | |
New Haven CT TAN (GO Revenue) | | | 2.50 | | | | 5-18-2017 | | | | 4,000,000 | | | | 4,018,240 | |
Waterbury CT (GO Revenue) | | | 5.00 | | | | 2-1-2017 | | | | 1,350,000 | | | | 1,354,523 | |
Waterbury CT (GO Revenue) | | | 5.00 | | | | 2-1-2018 | | | | 1,215,000 | | | | 1,262,276 | |
| | | | |
| | | | | | | | | | | | | | | 156,123,845 | |
| | | | | | | | | | | | | | | | |
| | | | |
| 4 | | Wells Fargo Ultra Short-Term Municipal Income Fund | | Portfolio of investments—December 31, 2016 (unaudited) |
| | | | | | | | | | | | | | | | |
| Security name | | Interest rate | | | Maturity date | | | Principal | | | Value | |
| | | | |
| Delaware: 0.45% | | | | | | | | | | | | | | | | |
Delaware EDA Delmarva Power and Light Company Series A (Industrial Development Revenue) ø | | | 0.96 | % | | | 10-1-2017 | | | $ | 6,400,000 | | | $ | 6,400,000 | |
Delaware EDA Delmarva Power and Light Company Series B (Utilities Revenue) ø | | | 0.85 | | | | 7-1-2024 | | | | 11,000,000 | | | | 11,000,000 | |
New Castle County DE Series ZF2088 (GO Revenue, Morgan Stanley Bank LIQ) ø144A | | | 0.77 | | | | 10-1-2045 | | | | 6,665,000 | | | | 6,665,000 | |
| | | | |
| | | | | | | | | | | | | | | 24,065,000 | |
| | | | | | | | | | | | | | | | |
| | | | |
| District of Columbia: 0.90% | | | | | | | | | | | | | | | | |
District of Columbia DW&P Series B (Water & Sewer Revenue, TD Bank NA SPA) ø | | | 0.72 | | | | 10-1-2050 | | | | 25,500,000 | | | | 25,500,000 | |
District of Columbia HFA MFHR Channing Phillips Project (Housing Revenue) ± | | | 0.70 | | | | 9-1-2017 | | | | 5,750,000 | | | | 5,746,665 | |
District of Columbia Population Services International (Miscellaneous Revenue, SunTrust Bank LOC) ø | | | 0.80 | | | | 11-1-2042 | | | | 17,100,000 | | | | 17,100,000 | |
| | | | |
| | | | | | | | | | | | | | | 48,346,665 | |
| | | | | | | | | | | | | | | | |
| | | | |
| Florida: 3.37% | | | | | | | | | | | | | | | | |
Escambia County FL HFA Acts Retirement Life Communities Incorporated Series B (Health Revenue, AGC Insured, TD Bank NA SPA) ø | | | 0.90 | | | | 11-15-2029 | | | | 1,275,000 | | | | 1,275,000 | |
Florida Department of Environmental Protection Series A (Tax Revenue) | | | 5.00 | | | | 7-1-2027 | | | | 5,000,000 | | | | 5,151,850 | |
Florida Department of Transportation Right of Way Acquisition and Bridge Construction Series A (Tax Revenue) | | | 5.38 | | | | 7-1-2027 | | | | 5,695,000 | | | | 5,880,144 | |
Florida Housing Finance Corporation Hilltop Landings Apartments Project Series A (Housing Revenue) | | | 0.75 | | | | 3-1-2017 | | | | 1,500,000 | | | | 1,499,835 | |
Florida Mid-Bay Bridge Authority 2nd Senior Lien Series C (Transportation Revenue) | | | 5.00 | | | | 10-1-2017 | | | | 225,000 | | | | 230,387 | |
Florida Mid-Bay Bridge Authority 2nd Senior Lien Series C (Transportation Revenue) | | | 5.00 | | | | 10-1-2018 | | | | 300,000 | | | | 315,255 | |
Florida University of North Florida Financing Corporation Housing Project (Education Revenue, AGM Insured) | | | 5.00 | | | | 11-1-2018 | | | | 3,100,000 | | | | 3,274,995 | |
Florida University of North Florida Financing Corporation Housing Project (Education Revenue, AGM Insured) | | | 5.00 | | | | 11-1-2019 | | | | 3,215,000 | | | | 3,461,944 | |
Lakeland FL Energy System (Utilities Revenue) ± | | | 1.47 | | | | 10-1-2017 | | | | 5,220,000 | | | | 5,222,453 | |
Lee County FL IDA Florida Power and Light Company Series A (Industrial Development Revenue) ø | | | 0.65 | | | | 12-1-2046 | | | | 15,000,000 | | | | 15,000,000 | |
Lee County FL Solid Waste System (Resource Recovery Revenue) | | | 2.00 | | | | 10-1-2017 | | | | 5,235,000 | | | | 5,252,485 | |
Lee County FL Solid Waste System (Resource Recovery Revenue) | | | 5.00 | | | | 10-1-2018 | | | | 2,350,000 | | | | 2,479,297 | |
Lee County FL Solid Waste System (Resource Recovery Revenue) | | | 5.00 | | | | 10-1-2020 | | | | 600,000 | | | | 657,672 | |
Miami-Dade County FL Aviation Series B (Airport Revenue) | | | 5.00 | | | | 10-1-2017 | | | | 300,000 | | | | 308,625 | |
Miami-Dade County FL Expressway Authority Toll System (Transportation Revenue, AGM Insured, Citibank NA LIQ) ø144A | | | 0.92 | | | | 7-1-2018 | | | | 1,000,000 | | | | 1,000,000 | |
Miami-Dade County FL Expressway Authority Toll System (Transportation Revenue, Dexia Credit Local LOC, Dexia Credit Local LIQ) ±144A | | | 1.19 | | | | 10-13-2023 | | | | 9,150,000 | | | | 9,150,000 | |
Miami-Dade County FL Expressway Authority Toll System Series DCL- 2012-003 (Transportation Revenue, Dexia Credit Local LOC, Ambac Insured, Dexia Credit Local LIQ) ±144A | | | 1.19 | | | | 3-8-2026 | | | | 16,860,000 | | | | 16,860,000 | |
Miami-Dade County FL HFA Miami Children’s Hospital Project Series A (Health Revenue) | | | 5.25 | | | | 8-1-2021 | | | | 855,000 | | | | 930,454 | |
Miami-Dade County FL HFA St. John Plaza Apartments (Housing Revenue) ± | | | 0.95 | | | | 8-1-2019 | | | | 9,750,000 | | | | 9,675,315 | |
Miami-Dade County FL International Airport Series C (Airport Revenue, AGM Insured) | | | 5.25 | | | | 10-1-2019 | | | | 16,775,000 | | | | 17,267,514 | |
Miami-Dade County FL School Board Foundation Incorporated (Miscellaneous Revenue, Dexia Credit Local LOC, National Insured, Dexia Credit Local LIQ) ø144A | | | 1.27 | | | | 5-1-2031 | | | | 19,210,000 | | | | 19,210,000 | |
Miami-Dade County FL Seaport Series A (Airport Revenue, Bank of Tokyo-Mitsubishi LOC) ø | | | 0.75 | | | | 10-1-2050 | | | | 17,000,000 | | | | 17,000,000 | |
| | | | | | |
| Portfolio of investments—December 31, 2016 (unaudited) | | Wells Fargo Ultra Short-Term Municipal Income Fund | | | 5 | |
| | | | | | | | | | | | | | | | |
| Security name | | Interest rate | | | Maturity date | | | Principal | | | Value | |
| | | | |
| Florida (continued) | | | | | | | | | | | | | | | | |
Orange County FL Health Facilities Authority Lakeside Behavioral Healthcare Incorporated Project (Health Revenue, SunTrust Bank LOC) ø | | | 0.80 | % | | | 7-1-2027 | | | $ | 2,790,000 | | | $ | 2,790,000 | |
Palm Beach County FL Health Facilities Authority Lifespace Communities Series C (Health Revenue) | | | 3.00 | | | | 5-15-2017 | | | | 1,065,000 | | | | 1,072,040 | |
Palm Beach County FL Health Facilities Authority Lifespace Communities Series C (Health Revenue) | | | 4.00 | | | | 5-15-2018 | | | | 500,000 | | | | 516,810 | |
Palm Beach County FL Health Facilities Authority Lifespace Communities Series C (Health Revenue) | | | 4.00 | | | | 5-15-2019 | | | | 780,000 | | | | 818,431 | |
Palm Beach County FL HFA Retirement Life Communities Project (Health Revenue) | | | 4.00 | | | | 11-15-2019 | | | | 2,675,000 | | | | 2,800,565 | |
Pasco County FL School Board Certificates Series B (Miscellaneous Revenue, Ambac Insured) ±(m) | | | 1.20 | | | | 8-1-2030 | | | | 6,825,000 | | | | 6,825,000 | |
Pinellas County FL HFA Series A (Health Revenue) | | | 5.65 | | | | 5-1-2037 | | | | 3,380,000 | | | | 3,433,877 | |
Tender Option Bond Trust Receipts/Certificates Floaters Series 2016-XG0010 (Airport Revenue, AGC Insured, Bank of America NA LIQ) ø144A | | | 1.18 | | | | 10-1-2038 | | | | 13,500,000 | | | | 13,500,000 | |
Tender Option Bond Trust Receipts/Certificates Floaters Series 2016-ZF0286 (Airport Revenue, AGC Insured, TD Bank NA LIQ) ø144A | | | 1.07 | | | | 10-1-2032 | | | | 8,510,000 | | | | 8,510,000 | |
| | | | |
| | | | | | | | | | | | | | | 181,369,948 | |
| | | | | | | | | | | | | | | | |
| | | | |
| Georgia: 1.17% | | | | | | | | | | | | | | | | |
Atlanta GA Urban Residential Finance Authority The Remington Apartments Project (Housing Revenue) ± | | | 1.05 | | | | 6-1-2019 | | | | 10,250,000 | | | | 10,199,673 | |
Burke County GA Development Authority Georgia Power Company Plant Vogtle Project First Series 2012 (Utilities Revenue) | | | 1.75 | | | | 12-1-2049 | | | | 4,600,000 | | | | 4,609,062 | |
Burke County GA Development Authority Georgia Power Company Vogtle Plant Project Second Series 2012 (Utilities Revenue) ± | | | 1.75 | | | | 12-1-2049 | | | | 5,135,000 | | | | 5,143,832 | |
Burke County GA Development Authority Georgia Transmission Corporation (Industrial Development Revenue) ± | | | 1.30 | | | | 1-1-2052 | | | | 14,000,000 | | | | 14,023,380 | |
Cedartown GA Housing Authority Cherokee Springs Apartments Project (Housing Revenue) ± | | | 1.00 | | | | 4-1-2019 | | | | 5,000,000 | | | | 4,977,700 | |
Cedartown GA Housing Authority Grayfield Apartments Project (Housing Revenue) ± | | | 1.00 | | | | 1-1-2019 | | | | 3,800,000 | | | | 3,796,200 | |
DeKalb County GA Housing Authority Sterling at Candler Village Project (Housing Revenue) ± | | | 1.75 | | | | 1-1-2021 | | | | 7,200,000 | | | | 7,200,864 | |
Gainesville & Hall County GA Development Authority Senior Living Facilities Lanier Village Series B (Health Revenue, AGC Insured, TD Bank NA SPA) ø | | | 0.90 | | | | 11-15-2033 | | | | 6,805,000 | | | | 6,805,000 | |
Savannah GA EDA Exempt Facilities Home Depot Project Series B (Industrial Development Revenue, SunTrust Bank LOC) ø | | | 0.82 | | | | 8-1-2025 | | | | 6,400,000 | | | | 6,400,000 | |
| | | | |
| | | | | | | | | | | | | | | 63,155,711 | |
| | | | | | | | | | | | | | | | |
| | | | |
| Guam: 0.07% | | | | | | | | | | | | | | | | |
Guam International Airport Authority Series A (Airport Revenue) | | | 5.00 | | | | 10-1-2017 | | | | 850,000 | | | | 870,417 | |
Guam International Airport Authority Series C (Airport Revenue) | | | 5.00 | | | | 10-1-2017 | | | | 2,750,000 | | | | 2,800,380 | |
| | | | |
| | | | | | | | | | | | | | | 3,670,797 | |
| | | | | | | | | | | | | | | | |
| | | | |
| Hawaii: 0.08% | | | | | | | | | | | | | | | | |
Hawaii Department of Budget and Finance Queens Health System Series B (Health Revenue) ± | | | 1.18 | | | | 7-1-2039 | | | | 3,055,000 | | | | 3,055,000 | |
Hawaii Department of Transportation Airports Division Lease AMT (Miscellaneous Revenue) | | | 4.00 | | | | 8-1-2018 | | | | 1,000,000 | | | | 1,035,370 | |
Hawaii Department of Transportation Airports Division Lease AMT (Miscellaneous Revenue) | | | 5.00 | | | | 8-1-2017 | | | | 425,000 | | | | 434,282 | |
| | | | |
| | | | | | | | | | | | | | | 4,524,652 | |
| | | | | | | | | | | | | | | | |
| | | | |
| 6 | | Wells Fargo Ultra Short-Term Municipal Income Fund | | Portfolio of investments—December 31, 2016 (unaudited) |
| | | | | | | | | | | | | | | | |
| Security name | | Interest rate | | | Maturity date | | | Principal | | | Value | |
| | | | |
| Idaho: 0.42% | | | | | | | | | | | | | | | | |
Idaho Housing & Finance Association Series A (Housing Revenue, FNMA LOC) ø | | | 0.91 | % | | | 1-1-2038 | | | $ | 17,795,000 | | | $ | 17,795,000 | |
Idaho TAN (GO Revenue) | | | 2.00 | | | | 6-30-2017 | | | | 5,000,000 | | | | 5,026,650 | |
| | | | |
| | | | | | | | | | | | | | | 22,821,650 | |
| | | | | | | | | | | | | | | | |
| | | | |
| Illinois: 8.85% | | | | | | | | | | | | | | | | |
Chicago IL (GO Revenue) | | | 5.00 | | | | 1-1-2020 | | | | 1,285,000 | | | | 1,282,944 | |
Chicago IL (GO Revenue) | | | 5.00 | | | | 1-1-2021 | | | | 2,000,000 | | | | 1,995,120 | |
Chicago IL (GO Revenue, National Insured) | | | 5.25 | | | | 1-1-2017 | | | | 500,000 | | | | 500,030 | |
Chicago IL Board of Education Series A (GO Revenue, National Insured) ¤ | | | 0.00 | | | | 12-1-2018 | | | | 5,265,000 | | | | 4,926,513 | |
Chicago IL Board of Education Series A (GO Revenue, National Insured) | | | 5.25 | | | | 12-1-2017 | | | | 1,645,000 | | | | 1,678,278 | |
Chicago IL Board of Education Series A2 (GO Revenue) ± | | | 1.48 | | | | 3-1-2035 | | | | 72,320,000 | | | | 71,103,578 | |
Chicago IL Board of Education Series C (GO Revenue) | | | 5.00 | | | | 12-1-2017 | | | | 1,620,000 | | | | 1,558,602 | |
Chicago IL Neighborhoods Alive 21 Program Series B (GO Revenue) | | | 5.00 | | | | 1-1-2019 | | | | 1,925,000 | | | | 1,922,575 | |
Chicago IL Park District Limited Tax Series D (GO Revenue) | | | 4.00 | | | | 1-1-2017 | | | | 1,000,000 | | | | 1,000,070 | |
Chicago IL Park District Limited Tax Series D (GO Revenue) | | | 4.00 | | | | 1-1-2018 | | | | 2,760,000 | | | | 2,822,293 | |
Chicago IL Prerefunded Neighborhoods Alive 21 Program Series B (GO Revenue) | | | 5.00 | | | | 1-1-2017 | | | | 305,000 | | | | 305,000 | |
Chicago IL Refunding Emergency System (GO Revenue, AGM/FGIC Insured) | | | 5.50 | | | | 1-1-2019 | | | | 3,000,000 | | | | 3,174,750 | |
Chicago IL Refunding Project Series A (GO Revenue) | | | 4.00 | | | | 1-1-2019 | | | | 1,250,000 | | | | 1,235,800 | |
Chicago IL Refunding Project Series B (GO Revenue) | | | 5.00 | | | | 1-1-2019 | | | | 3,205,000 | | | | 3,200,962 | |
Chicago IL Refunding Project Series B (GO Revenue) | | | 5.00 | | | | 1-1-2020 | | | | 3,295,000 | | | | 3,289,728 | |
Chicago IL Series A (GO Revenue) | | | 4.00 | | | | 1-1-2019 | | | | 1,335,000 | | | | 1,319,834 | |
Chicago IL Series A (GO Revenue, AGM Insured) | | | 5.00 | | | | 1-1-2018 | | | | 10,000,000 | | | | 10,076,800 | |
Chicago IL Series A (GO Revenue) | | | 5.00 | | | | 12-1-2019 | | | | 1,000,000 | | | | 998,110 | |
Chicago IL Series A (GO Revenue, AGM Insured) | | | 5.25 | | | | 1-1-2017 | | | | 735,000 | | | | 735,059 | |
Chicago IL Series A2 (GO Revenue, Ambac Insured) | | | 5.50 | | | | 1-1-2018 | | | | 3,135,000 | | | | 3,168,545 | |
Chicago IL Series B (GO Revenue) | | | 5.00 | | | | 1-1-2017 | | | | 565,000 | | | | 565,062 | |
Chicago IL Series B (GO Revenue, Ambac Insured) | | | 5.00 | | | | 12-1-2018 | | | | 2,540,000 | | | | 2,547,112 | |
Chicago IL Series C (Water & Sewer Revenue) | | | 4.00 | | | | 1-1-2017 | | | | 1,980,000 | | | | 1,980,139 | |
Chicago IL Series C (GO Revenue, National Insured) | | | 5.00 | | | | 1-1-2018 | | | | 5,350,000 | | | | 5,483,269 | |
Chicago IL Series D (GO Revenue, AGM/FGIC Insured) | | | 5.25 | | | | 1-1-2017 | | | | 1,210,000 | | | | 1,210,097 | |
Chicago IL Unrefunded Neighborhoods Alive 21 Program Series B (GO Revenue) | | | 5.00 | | | | 1-1-2017 | | | | 245,000 | | | | 245,027 | |
Chicago IL Unrefunded Series B (GO Revenue) | | | 5.00 | | | | 1-1-2017 | | | | 845,000 | | | | 845,000 | |
Cook County IL Bedford Park Village Refunding Bond (Tax Revenue) | | | 3.00 | | | | 12-30-2017 | | | | 1,340,000 | | | | 1,353,078 | |
Cook County IL Bedford Park Village Refunding Bond (Tax Revenue) | | | 3.00 | | | | 12-30-2018 | | | | 880,000 | | | | 886,310 | |
Cook County IL Refunding Series A (GO Revenue) | | | 4.00 | | | | 11-15-2018 | | | | 300,000 | | | | 311,280 | |
Cook County IL Refunding Series C (GO Revenue) | | | 4.25 | | | | 11-15-2018 | | | | 100,000 | | | | 104,218 | |
Cook County IL School District No. 158 Series A (GO Revenue) ±144A | | | 4.50 | | | | 12-1-2026 | | | | 10,780,000 | | | | 10,622,396 | |
Cook County IL School District No. 163 Series A (GO Revenue) | | | 5.00 | | | | 1-1-2026 | | | | 4,000,000 | | | | 4,001,880 | |
Cook County IL School District No. 99 Series A (GO Revenue) ± | | | 1.50 | | | | 12-1-2026 | | | | 7,515,000 | | | | 7,516,127 | |
Eastern Illinois EDA Providence at Thornberry and Sycamore Hills Project (Housing Revenue) ± | | | 0.85 | | | | 7-1-2019 | | | | 10,500,000 | | | | 10,496,850 | |
Grundy Kendall & Will Counties IL Community School District No. 201 (GO Revenue, AGC Insured) | | | 5.75 | | | | 10-15-2019 | | | | 540,000 | | | | 578,081 | |
Illinois (Miscellaneous Revenue) | | | 2.50 | | | | 7-1-2017 | | | | 3,000,000 | | | | 3,011,220 | |
Illinois (GO Revenue) | | | 3.00 | | | | 2-1-2017 | | | | 8,740,000 | | | | 8,750,663 | |
Illinois (GO Revenue) | | | 4.00 | | | | 2-1-2018 | | | | 5,550,000 | | | | 5,636,969 | |
Illinois (Miscellaneous Revenue) | | | 4.00 | | | | 7-1-2018 | | | | 13,610,000 | | | | 13,858,791 | |
Illinois (GO Revenue) | | | 5.00 | | | | 3-1-2017 | | | | 5,000,000 | | | | 5,028,550 | |
Illinois (Miscellaneous Revenue) | | | 5.00 | | | | 5-1-2017 | | | | 5,070,000 | | | | 5,126,176 | |
Illinois (Miscellaneous Revenue) | | | 5.00 | | | | 7-1-2017 | | | | 10,000,000 | | | | 10,162,000 | |
| | | | | | |
| Portfolio of investments—December 31, 2016 (unaudited) | | Wells Fargo Ultra Short-Term Municipal Income Fund | | | 7 | |
| | | | | | | | | | | | | | | | |
| Security name | | Interest rate | | | Maturity date | | | Principal | | | Value | |
| | | | |
| Illinois (continued) | | | | | | | | | | | | | | | | |
Illinois (GO Revenue) | | | 5.00 | % | | | 1-1-2018 | | | $ | 15,200,000 | | | $ | 15,577,112 | |
Illinois (GO Revenue) | | | 5.00 | | | | 3-1-2018 | | | | 2,000,000 | | | | 2,055,620 | |
Illinois (Miscellaneous Revenue) | | | 5.00 | | | | 5-1-2019 | | | | 2,500,000 | | | | 2,590,925 | |
Illinois (Miscellaneous Revenue) | | | 5.00 | | | | 8-1-2019 | | | | 10,335,000 | | | | 10,723,389 | |
Illinois (GO Revenue) | | | 5.00 | | | | 1-1-2020 | | | | 8,075,000 | | | | 8,377,732 | |
Illinois (GO Revenue) | | | 5.00 | | | | 1-1-2021 | | | | 3,300,000 | | | | 3,442,032 | |
Illinois Educational Authority University of Chicago Series B-1 (Education Revenue) ± | | | 1.10 | | | | 7-1-2036 | | | | 6,485,000 | | | | 6,474,105 | |
Illinois Finance Authority Northwestern Memorial Hospital Series A-3 (Health Revenue, JPMorgan Chase & Company SPA) ø | | | 0.72 | | | | 8-15-2042 | | | | 100,000 | | | | 100,000 | |
Illinois Finance Authority Presbyterian Homes Obligated Group Series A (Health Revenue) | | | 4.00 | | | | 5-1-2019 | | | | 500,000 | | | | 524,815 | |
Illinois Finance Authority Presbyterian Homes Obligated Group Series A (Health Revenue) | | | 4.00 | | | | 11-1-2019 | | | | 500,000 | | | | 527,795 | |
Illinois Finance Authority Presbyterian Homes Obligated Group Series B (Health Revenue) ± | | | 1.78 | | | | 5-1-2036 | | | | 5,000,000 | | | | 5,005,950 | |
Illinois Finance Authority Series XF2243 (Health Revenue, AGC Insured, Citibank NA LIQ) ø144A | | | 0.92 | | | | 8-15-2039 | | | | 16,100,000 | | | | 16,100,000 | |
Illinois Finance Authority YMCA of Metropolitan Chicago Project (Miscellaneous Revenue, Harris NA LOC) ø | | | 0.73 | | | | 6-1-2034 | | | | 5,000,000 | | | | 5,000,000 | |
Illinois Metropolitan Pier & Exposition Authority Prerefunded CAB (Tax Revenue, National Insured) ¤ | | | 0.00 | | | | 6-15-2017 | | | | 450,000 | | | | 447,683 | |
Illinois Metropolitan Pier & Exposition Authority Unrefunded CAB (Tax Revenue, National Insured) ¤ | | | 0.00 | | | | 6-15-2017 | | | | 1,780,000 | | | | 1,763,855 | |
Illinois Refunding Bond (GO Revenue) | | | 5.00 | | | | 1-1-2018 | | | | 8,685,000 | | | | 8,900,475 | |
Illinois Refunding Bond (Miscellaneous Revenue) | | | 5.00 | | | | 8-1-2017 | | | | 1,425,000 | | | | 1,451,534 | |
Illinois Refunding Bond (Miscellaneous Revenue) | | | 5.00 | | | | 8-1-2018 | | | | 1,715,000 | | | | 1,773,259 | |
Illinois Series A (GO Revenue) | | | 5.00 | | | | 4-1-2017 | | | | 6,840,000 | | | | 6,897,593 | |
Illinois Series A (Tax Revenue) | | | 5.00 | | | | 6-1-2017 | | | | 250,000 | | | | 253,415 | |
Illinois Sports Facilities Authority (Tax Revenue, Ambac Insured) ¤ | | | 0.00 | | | | 6-15-2017 | | | | 320,000 | | | | 316,493 | |
Illinois Sports Facilities Authority (Tax Revenue) | | | 5.00 | | | | 6-15-2017 | | | | 760,000 | | | | 768,778 | |
Illinois Toll Highway Authority Series A-2 (Transportation Revenue, AGM Insured, JPMorgan Chase & Company SPA) ø | | | 0.75 | | | | 1-1-2031 | | | | 16,500,000 | | | | 16,500,000 | |
Kane County IL School District No. 129 Aurora West Side Series B (GO Revenue) | | | 2.00 | | | | 2-1-2017 | | | | 2,190,000 | | | | 2,191,599 | |
Kane County IL School District No. 129 Aurora West Side Series B (GO Revenue) | | | 2.00 | | | | 2-1-2018 | | | | 2,430,000 | | | | 2,443,146 | |
Kendall, Kane & Will Counties IL Community Unit School District #308 (GO Revenue) | | | 4.00 | | | | 10-1-2018 | | | | 2,000,000 | | | | 2,087,720 | |
Lake County IL School District No. 38 Big Hollow CAB (GO Revenue, Ambac Insured) ¤ | | | 0.00 | | | | 2-1-2017 | | | | 500,000 | | | | 499,210 | |
Minooka IL Special Assessment Refunding & Improvement (Miscellaneous Revenue, AGM Insured) | | | 3.00 | | | | 12-1-2017 | | | | 415,000 | | | | 419,283 | |
Minooka IL Special Assessment Refunding & Improvement (Miscellaneous Revenue, AGM Insured) | | | 3.50 | | | | 12-1-2018 | | | | 400,000 | | | | 410,092 | |
Minooka IL Special Assessment Refunding & Improvement (Miscellaneous Revenue, AGM Insured) | | | 3.50 | | | | 12-1-2019 | | | | 564,000 | | | | 579,476 | |
Regional Transportation Authority Illinois Refunding Bond Series B (Tax Revenue) ± | | | 0.85 | | | | 6-1-2025 | | | | 38,675,000 | | | | 38,675,000 | |
Tender Option Bond Trust Receipts/Certificates Floaters Series 2016-XG0008 (Health Revenue, AGC Insured, Bank of America NA LIQ) ø144A | | | 1.01 | | | | 8-15-2047 | | | | 23,375,000 | | | | 23,375,000 | |
Tender Option Bond Trust Receipts/Certificates Floaters Series 2016-XG0050 (Health Revenue, Deutsche Bank LIQ) ø144A | | | 0.92 | | | | 11-1-2039 | | | | 31,420,000 | | | | 31,420,000 | |
Tender Option Bond Trust Receipts/Certificates Floaters Series 2016-XM0450 (Tax Revenue, Deutsche Bank LIQ) ø144A | | | 0.83 | | | | 12-1-2036 | | | | 31,235,000 | | | | 31,235,000 | |
| | | | |
| 8 | | Wells Fargo Ultra Short-Term Municipal Income Fund | | Portfolio of investments—December 31, 2016 (unaudited) |
| | | | | | | | | | | | | | | | |
| Security name | | Interest rate | | | Maturity date | | | Principal | | | Value | |
| | | | |
| Illinois (continued) | | | | | | | | | | | | | | | | |
University of Illinois Auxiliary Facilities (Education Revenue, JPMorgan Chase & Company SPA) ø | | | 0.95 | % | | | 4-1-2038 | | | $ | 10,000,000 | | | $ | 10,000,000 | |
Western Illinois University Board of Trustees Certificate of Participation (Miscellaneous Revenue, AGM Insured) | | | 3.00 | | | | 10-1-2017 | | | | 500,000 | | | | 504,625 | |
Western Illinois University Board of Trustees Certificate of Participation (Miscellaneous Revenue, AGM Insured) | | | 3.00 | | | | 10-1-2018 | | | | 500,000 | | | | 508,645 | |
| | | | |
| | | | | | | | | | | | | | | 476,536,242 | |
| | | | | | | | | | | | | | | | |
| | | | |
| Indiana: 1.16% | | | | | | | | | | | | | | | | |
Gary IN Woodlake-Concord Project (Housing Revenue, FHA Insured) ± | | | 1.00 | | | | 10-1-2017 | | | | 22,715,000 | | | | 22,701,598 | |
Hammond IN Local Public Improvement Bank Advance Fund Program Series A (Miscellaneous Revenue) %% | | | 2.13 | | | | 12-31-2017 | | | | 16,913,000 | | | | 16,968,306 | |
Indiana Finance Authority I-69 Section 5 Project (Miscellaneous Revenue) | | | 4.00 | | | | 3-1-2017 | | | | 2,115,000 | | | | 2,117,009 | |
Indiana Finance Authority Ohio River Bridges East End Crossing Project Series B (Industrial Development Revenue) | | | 5.00 | | | | 1-1-2019 | | | | 4,610,000 | | | | 4,615,809 | |
Indiana HFFA Ascension Health Subordinated Credit Group Series A-8 (Health Revenue) ± | | | 1.25 | | | | 11-1-2027 | | | | 1,445,000 | | | | 1,408,167 | |
Indiana Housing and Community Development Authority DBG Apartment Projects (Housing Revenue) | | | 1.10 | | | | 3-1-2018 | | | | 4,380,000 | | | | 4,370,408 | |
Jasper County IN Northern Indiana Public Service Company Project (Industrial Development Revenue, Ambac Insured) | | | 5.70 | | | | 7-1-2017 | | | | 2,000,000 | | | | 2,039,160 | |
Rockport IN PCR Indiana-Michigan Power Company Series B (Utilities Revenue) ± | | | 1.75 | | | | 6-1-2025 | | | | 2,000,000 | | | | 1,993,120 | |
Tender Option Bond Trust Receipts/Certificates Floaters Series 2015-XF0115 (Utilities Revenue, JPMorgan Chase & Company LIQ) ø144A | | | 1.02 | | | | 4-15-2018 | | | | 1,200,000 | | | | 1,200,000 | |
Whiting IN BP Products North America Incorporated Project Series 2014 (Resource Recovery Revenue) | | | 1.48 | | | | 12-1-2044 | | | | 5,000,000 | | | | 4,948,550 | |
| | | | |
| | | | | | | | | | | | | | | 62,362,127 | |
| | | | | | | | | | | | | | | | |
| | | | |
| Iowa: 1.21% | | | | | | | | | | | | | | | | |
Buchanan County IA People’s Memorial Hospital (Health Revenue) | | | 1.50 | | | | 12-1-2018 | | | | 2,500,000 | | | | 2,476,625 | |
Iowa Finance Authority BAN Shenandoah Medical Center Project (Health Revenue) | | | 1.75 | | | | 6-1-2018 | | | | 7,000,000 | | | | 6,983,690 | |
Iowa Finance Authority Midwestern Disaster Area Project (Industrial Development Revenue, Korea Development Bank LOC) ø | | | 0.95 | | | | 4-1-2022 | | | | 22,500,000 | | | | 22,500,000 | |
Iowa Finance Authority UnityPoint Health Project Series B-1 (Health Revenue, Union Bank NA LOC) ø | | | 0.73 | | | | 2-15-2039 | | | | 15,000,000 | | | | 15,000,000 | |
Iowa Higher Education Loan Authority Central College Project Series A (Education Revenue) | | | 2.00 | | | | 12-1-2018 | | | | 18,400,000 | | | | 18,365,960 | |
| | | | |
| | | | | | | | | | | | | | | 65,326,275 | |
| | | | | | | | | | | | | | | | |
| | | | |
| Kansas: 0.45% | | | | | | | | | | | | | | | | |
Kansas Department of Transportation Highway Libor Index Series B-3 (Tax Revenue) ± | | | 0.65 | | | | 9-1-2017 | | | | 4,500,000 | | | | 4,493,655 | |
Kansas Department of Transportation Highway Libor Index Series B-4 (Tax Revenue) ± | | | 0.73 | | | | 9-1-2018 | | | | 7,000,000 | | | | 6,953,240 | |
Kansas Department of Transportation Highway Libor Index Series B-5 (Tax Revenue) ± | | | 0.81 | | | | 9-1-2019 | | | | 6,000,000 | | | | 5,939,700 | |
Kansas Development Finance Authority Series A (GO Revenue) | | | 5.00 | | | | 5-1-2018 | | | | 5,710,000 | | | | 5,995,100 | |
Lawrence KS Series A (Industrial Development Revenue, U.S. Bank NA LOC) ø | | | 1.00 | | | | 12-1-2018 | | | | 730,000 | | | | 730,000 | |
| | | | |
| | | | | | | | | | | | | | | 24,111,695 | |
| | | | | | | | | | | | | | | | |
| | | | | | |
| Portfolio of investments—December 31, 2016 (unaudited) | | Wells Fargo Ultra Short-Term Municipal Income Fund | | | 9 | |
| | | | | | | | | | | | | | | | |
| Security name | | Interest rate | | | Maturity date | | | Principal | | | Value | |
| | | | |
| Kentucky: 2.22% | | | | | | | | | | | | | | | | |
Ashland KY Medical Center Ashland Hospital Corporation Series B (Health Revenue) | | | 5.00 | % | | | 2-1-2018 | | | $ | 900,000 | | | $ | 925,011 | |
Harrison KY Harrison Memorial Hospital Project BAN (Health Revenue) | | | 1.50 | | | | 5-1-2017 | | | | 9,065,000 | | | | 9,066,450 | |
Kentucky Economic Development Finance Authority Owensboro Medical Health System Series A (Health Revenue) | | | 5.00 | | | | 6-1-2017 | | | | 2,525,000 | | | | 2,557,749 | |
Kentucky Housing Corporation Winterwood Rural Housing Portfolio (Housing Revenue) ± | | | 1.30 | | | | 12-15-2017 | | | | 9,449,000 | | | | 9,450,039 | |
Kentucky Public Transportation Infrastructure Authority Tolls Downtown Crossing Project BAN Series A (Transportation Revenue) | | | 5.00 | | | | 7-1-2017 | | | | 55,920,000 | | | | 56,817,516 | |
Louisville & Jefferson Counties KY Louisville Gas & Electric Company Project Series A (Utilities Revenue) ± | | | 1.65 | | | | 10-1-2033 | | | | 2,000,000 | | | | 2,001,140 | |
Louisville & Jefferson Counties KY PCR Louisville Gas & Electric Company Project Series B (Utilities Revenue) ± | | | 1.35 | | | | 11-1-2027 | | | | 16,000,000 | | | | 15,952,480 | |
Pikeville KY Pikeville Medical Center Incorporated Expansion Project BAN (Health Revenue) | | | 2.00 | | | | 3-1-2017 | | | | 9,000,000 | | | | 9,014,130 | |
Pikeville KY University of Pikeville College of Optometry BAN (Education Revenue, USDA Insured) | | | 3.00 | | | | 8-1-2017 | | | | 13,950,000 | | | | 13,964,229 | |
| | | | |
| | | | | | | | | | | | | | | 119,748,744 | |
| | | | | | | | | | | | | | | | |
| | | | |
| Louisiana: 1.50% | | | | | | | | | | | | | | | | |
East Baton Rouge Parish LA Sewerage Commission Refunding Bond Series A (Water & Sewer Revenue) ± | | | 0.93 | | | | 2-1-2046 | | | | 24,000,000 | | | | 23,886,240 | |
Louisiana Gas & Fuel Tax 2nd Lien Series A (Tax Revenue) ± | | | 0.90 | | | | 5-1-2043 | | | | 11,200,000 | | | | 11,123,840 | |
Louisiana Housing Corporation Twin Lakes of Leesville Project (Housing Revenue) ± | | | 1.00 | | | | 9-1-2019 | | | | 7,200,000 | | | | 7,168,680 | |
Louisiana Offshore Terminal Authority Deepwater Loop LLC Project Series B-1 (Airport Revenue) ± | | | 2.20 | | | | 10-1-2040 | | | | 750,000 | | | | 753,285 | |
Shreveport LA Water & Sewer Refunding Series A (Water & Sewer Revenue, Build America Mutual Assurance Company Insured) | | | 4.00 | | | | 12-1-2017 | | | | 3,000,000 | | | | 3,074,460 | |
St. James Parish LA Nucor Steel LLC Project Gulf Opportunity Zone Series A-1 (Industrial Development Revenue) ø | | | 0.95 | | | | 11-1-2040 | | | | 35,000,000 | | | | 35,000,000 | |
| | | | |
| | | | | | | | | | | | | | | 81,006,505 | |
| | | | | | | | | | | | | | | | |
| | | | |
| Maryland: 2.50% | | | | | | | | | | | | | | | | |
Baltimore County MD Oak Crest Village Series A (Health Revenue) | | | 5.00 | | | | 1-1-2027 | | | | 2,000,000 | | | | 2,000,220 | |
Maryland CDA Adams Crossing Apartments Phase 2 (Housing Revenue) | | | 1.15 | | | | 8-1-2018 | | | | 8,250,000 | | | | 8,178,143 | |
Maryland CDA Allendale Apartments Series I (Housing Revenue) | | | 1.02 | | | | 5-1-2017 | | | | 10,000,000 | | | | 9,987,400 | |
Maryland CDA Basilica Place Apartments Series 2015E (Housing Revenue) | | | 1.10 | | | | 3-1-2017 | | | | 6,900,000 | | | | 6,896,619 | |
Maryland CDA Chase House (Housing Revenue) | | | 2.15 | | | | 12-1-2018 | | | | 17,600,000 | | | | 17,602,112 | |
Maryland CDA Commons of Avalon Series 2015C (Housing Revenue) | | | 1.00 | | | | 1-1-2017 | | | | 12,850,000 | | | | 12,849,872 | |
Maryland CDA Hollins House (Housing Revenue) | | | 1.27 | | | | 11-1-2017 | | | | 12,000,000 | | | | 11,950,080 | |
Maryland CDA Keys Pointe Phase 1B Series I (Housing Revenue) | | | 1.60 | | | | 11-1-2018 | | | | 11,000,000 | | | | 10,927,950 | |
Maryland CDA Multifamily Development Conifer Village (Housing Revenue) | | | 0.80 | | | | 4-1-2017 | | | | 13,000,000 | | | | 12,991,810 | |
Maryland CDA St. James Terrace Apartments Series J (Housing Revenue) | | | 1.60 | | | | 4-1-2019 | | | | 12,000,000 | | | | 11,902,560 | |
Maryland CDA Tabco Towers Series K (Housing Revenue) | | | 1.40 | | | | 12-1-2017 | | | | 7,150,000 | | | | 7,136,773 | |
Maryland CDA The Brentwood Series O (Housing Revenue) | | | 1.40 | | | | 12-1-2017 | | | | 7,700,000 | | | | 7,685,755 | |
Maryland CDA Waverly View Apartments Series G (Housing Revenue) | | | 1.15 | | | | 2-1-2019 | | | | 8,000,000 | | | | 7,898,720 | |
Maryland Department of Housing and Community Development Series A (Housing Revenue) | | | 1.25 | | | | 10-1-2017 | | | | 6,900,000 | | | | 6,891,927 | |
| | | | |
| | | | | | | | | | | | | | | 134,899,941 | |
| | | | | | | | | | | | | | | | |
| | | | |
| 10 | | Wells Fargo Ultra Short-Term Municipal Income Fund | | Portfolio of investments—December 31, 2016 (unaudited) |
| | | | | | | | | | | | | | | | |
| Security name | | Interest rate | | | Maturity date | | | Principal | | | Value | |
| | | | |
| Massachusetts: 1.13% | | | | | | | | | | | | | | | | |
Commonwealth of Massachusetts Series C (GO Revenue, State Street Bank & Trust Company SPA) ø | | | 0.71 | % | | | 1-1-2021 | | | $ | 3,985,000 | | | $ | 3,985,000 | |
Massachusetts HEFA Partners Healthcare Series G-2 (Health Revenue, AGM Insured) ±(m) | | | 0.64 | | | | 7-1-2042 | | | | 8,655,000 | | | | 8,655,000 | |
Massachusetts HFA Binnall House Project Series A (Housing Revenue) ± | | | 1.50 | | | | 8-1-2018 | | | | 4,625,000 | | | | 4,624,954 | |
Massachusetts Water Resources Authority Series DCL 005 (Water & Sewer Revenue, Dexia Credit Local LOC, AGM Insured) ø144A | | | 0.84 | | | | 8-1-2025 | | | | 9,895,000 | | | | 9,895,000 | |
Tender Option Bond Trust Receipts/Certificates Floaters Series 2016-XF2306 (Education Revenue, Morgan Stanley Bank LIQ) ø144A | | | 0.97 | | | | 7-1-2033 | | | | 14,000,000 | | | | 14,000,000 | |
University of Massachusetts Building Authority Series A (Education Revenue, Barclays Bank plc SPA) ø | | | 0.74 | | | | 5-1-2038 | | | | 19,605,000 | | | | 19,605,000 | |
| | | | |
| | | | | | | | | | | | | | | 60,764,954 | |
| | | | | | | | | | | | | | | | |
| | | | |
| Michigan: 3.33% | | | | | | | | | | | | | | | | |
Birmingham MI Public Schools (GO Revenue) | | | 5.00 | | | | 11-1-2017 | | | | 4,955,000 | | | | 5,121,092 | |
Charlotte MI Public School District (GO Revenue, Qualified School Board Loan Fund Insured) | | | 4.00 | | | | 5-1-2017 | | | | 685,000 | | | | 691,535 | |
Charlotte MI Public School District (GO Revenue, Qualified School Board Loan Fund Insured) | | | 5.00 | | | | 5-1-2019 | | | | 1,515,000 | | | | 1,631,549 | |
Detroit MI (GO Revenue) | | | 5.00 | | | | 11-1-2017 | | | | 7,485,000 | | | | 7,759,325 | |
Forest Hills MI Public Schools (GO Revenue) | | | 4.00 | | | | 5-1-2017 | | | | 2,150,000 | | | | 2,170,511 | |
Genesee County MI Limited Tax Water Supply System (GO Revenue, Build America Mutual Assurance Company Insured) | | | 4.00 | | | | 11-1-2017 | | | | 225,000 | | | | 229,892 | |
Genesee County MI Limited Tax Water Supply System (GO Revenue, Build America Mutual Assurance Company Insured) | | | 4.00 | | | | 11-1-2018 | | | | 220,000 | | | | 229,346 | |
Genesee County MI Limited Tax Water Supply System (GO Revenue, Build America Mutual Assurance Company Insured) | | | 5.00 | | | | 11-1-2019 | | | | 240,000 | | | | 259,536 | |
Grand Ledge MI Public School District (GO Revenue, Qualified School Board Loan Fund Insured) | | | 5.00 | | | | 5-1-2017 | | | | 1,235,000 | | | | 1,250,907 | |
Jackson County MI Hospital Finance Authority Series A (Health Revenue) | | | 5.00 | | | | 6-1-2017 | | | | 1,105,000 | | | | 1,123,896 | |
Lake Orion MI Community School District (GO Revenue, Qualified School Board Loan Fund Insured) | | | 4.00 | | | | 5-1-2017 | | | | 2,325,000 | | | | 2,347,181 | |
Lake Orion MI Community School District (GO Revenue, Qualified School Board Loan Fund Insured) | | | 5.00 | | | | 5-1-2018 | | | | 4,650,000 | | | | 4,872,038 | |
Mattawan MI Consolidated School District (GO Revenue, Qualified School Board Loan Fund Insured) | | | 4.00 | | | | 5-1-2017 | | | | 875,000 | | | | 883,348 | |
Mattawan MI Consolidated School District (GO Revenue, Qualified School Board Loan Fund Insured) | | | 5.00 | | | | 5-1-2018 | | | | 855,000 | | | | 895,826 | |
Michigan Finance Authority Local Government Loan Program Detroit Water & Sewer Series C (Water & Sewer Revenue) | | | 5.00 | | | | 11-1-2017 | | | | 2,000,000 | | | | 2,073,220 | |
Michigan Finance Authority Local Government Loan Program Detroit Water & Sewer Series D-1 (Water & Sewer Revenue, AGM Insured) | | | 5.00 | | | | 7-1-2017 | | | | 7,065,000 | | | | 7,195,914 | |
Michigan Finance Authority Local Government Loan Program Detroit Water & Sewer Series D-3 (Water & Sewer Revenue, National Insured) | | | 5.00 | | | | 7-1-2018 | | | | 20,000,000 | | | | 20,999,600 | |
Michigan Finance Authority Local Government Loan Program Detroit Water & Sewer Series D-4 (Water & Sewer Revenue) | | | 5.00 | | | | 7-1-2017 | | | | 15,640,000 | | | | 15,931,373 | |
Michigan Finance Authority Local Government Loan Program Detroit Water & Sewer Series D-7 (Water & Sewer Revenue) | | | 5.00 | | | | 7-1-2017 | | | | 1,630,000 | | | | 1,658,378 | |
Michigan Finance Authority Senior Lien Detroit Water & Sewer Series C-5 (Water & Sewer Revenue, National Insured) | | | 5.00 | | | | 7-1-2017 | | | | 10,000,000 | | | | 10,186,900 | |
Michigan Finance Authority Senior Lien Detroit Water & Sewer Series C-5 (Water & Sewer Revenue, National Insured) | | | 5.00 | | | | 7-1-2018 | | | | 17,500,000 | | | | 18,374,650 | |
| | | | | | |
| Portfolio of investments—December 31, 2016 (unaudited) | | Wells Fargo Ultra Short-Term Municipal Income Fund | | | 11 | |
| | | | | | | | | | | | | | | | |
| Security name | | Interest rate | | | Maturity date | | | Principal | | | Value | |
| | | | |
| Michigan (continued) | | | | | | | | | | | | | | | | |
Michigan Finance Authority Senior Lien Detroit Water & Sewer Series C-6 (Water & Sewer Revenue) | | | 5.00 | % | | | 7-1-2018 | | | $ | 4,130,000 | | | $ | 4,321,921 | |
Michigan Finance Authority Series B (Water & Sewer Revenue) | | | 5.00 | | | | 10-1-2024 | | | | 300,000 | | | | 358,911 | |
Michigan Grant Anticipation Bonds (Miscellaneous Revenue, AGM Insured) | | | 5.25 | | | | 9-15-2018 | | | | 1,500,000 | | | | 1,545,585 | |
Michigan Hospital Finance Authority Ascension Health Group Project Series A-2 (Health Revenue) ± | | | 1.50 | | | | 11-1-2027 | | | | 1,855,000 | | | | 1,823,929 | |
Michigan Hospital Finance Authority Ascension Health Group Project Series E-1 (Health Revenue) ± | | | 1.10 | | | | 11-15-2046 | | | | 4,250,000 | | | | 4,180,810 | |
Michigan Hospital Finance Authority Ascension Health Series A-3 (Health Revenue) ± | | | 1.87 | | | | 11-1-2027 | | | | 6,510,000 | | | | 6,542,615 | |
Michigan Hospital Finance Authority Ascension Health Series F-3 (Health Revenue) ± | | | 1.40 | | | | 11-15-2047 | | | | 9,250,000 | | | | 9,235,200 | |
Michigan Hospital Finance Authority Prerefunded (Health Revenue) ± | | | 0.95 | | | | 11-15-2033 | | | | 65,000 | | | | 64,592 | |
Michigan Hospital Finance Authority Refunding Ascension Health Senior Credit Group (Health Revenue) ± | | | 1.50 | | | | 11-15-2047 | | | | 1,360,000 | | | | 1,360,966 | |
Michigan Hospital Finance Authority Unrefunded (Health Revenue) ± | | | 0.95 | | | | 11-15-2033 | | | | 1,935,000 | | | | 1,928,711 | |
Michigan State Housing Development Authority Cranbrook Tower Apartments Project (Housing Revenue, FHA Insured) ± | | | 1.45 | | | | 7-1-2018 | | | | 10,000,000 | | | | 9,996,700 | |
Michigan Strategic Fund Limited Obligation Events Center Project Series A (Tax Revenue) ± | | | 4.13 | | | | 7-1-2045 | | | | 16,000,000 | | | | 16,200,000 | |
Michigan Strategic Fund Waste Management Incorporated Project (Resource Recovery Revenue) ± | | | 1.50 | | | | 8-1-2027 | | | | 4,505,000 | | | | 4,507,703 | |
Pinckney MI Community Schools (GO Revenue, Qualified School Board Loan Fund Insured) | | | 4.00 | | | | 5-1-2017 | | | | 645,000 | | | | 651,108 | |
Pinckney MI Community Schools (GO Revenue, Qualified School Board Loan Fund Insured) | | | 5.00 | | | | 5-1-2018 | | | | 1,035,000 | | | | 1,083,666 | |
Rockford MI Public School District (GO Revenue, Qualified School Board Loan Fund Insured) | | | 5.00 | | | | 5-1-2017 | | | | 1,000,000 | | | | 1,012,820 | |
Rockford MI Public School District (GO Revenue, Qualified School Board Loan Fund Insured) | | | 5.00 | | | | 5-1-2018 | | | | 750,000 | | | | 785,265 | |
Rockford MI Public School District (GO Revenue, Qualified School Board Loan Fund Insured) | | | 5.00 | | | | 5-1-2019 | | | | 1,000,000 | | | | 1,076,290 | |
Shiawassee & Ingham Counties MI Perry Public Schools (GO Revenue, Qualified School Board Loan Fund Insured) | | | 4.00 | | | | 5-1-2020 | | | | 410,000 | | | | 439,532 | |
Walled Lake MI Consolidated School District (GO Revenue, Qualified School Board Loan Fund Insured) | | | 5.00 | | | | 5-1-2018 | | | | 6,020,000 | | | | 6,307,455 | |
| | | | |
| | | | | | | | | | | | | | | 179,309,796 | |
| | | | | | | | | | | | | | | | |
| | | | |
| Minnesota: 0.67% | | | | | | | | | | | | | | | | |
Apple Valley MN Senior Living LLC Project Series B (Health Revenue) | | | 3.00 | | | | 1-1-2019 | | | | 650,000 | | | | 658,983 | |
Apple Valley MN Senior Living LLC Project Series B (Health Revenue) | | | 3.00 | | | | 1-1-2020 | | | | 670,000 | | | | 677,886 | |
Apple Valley MN Senior Living LLC Project Series B (Health Revenue) | | | 4.00 | | | | 1-1-2021 | | | | 695,000 | | | | 724,496 | |
Apple Valley MN Senior Living LLC Project Series B (Health Revenue) | | | 4.00 | | | | 1-1-2022 | | | | 720,000 | | | | 750,154 | |
Hennepin County MN Series C (GO Revenue, U.S. Bank NA SPA) ø | | | 0.71 | | | | 12-1-2033 | | | | 3,000,000 | | | | 3,000,000 | |
Minneapolis & St. Paul MN Housing & RDA Children’s Hospital Clinics Series A (Miscellaneous Revenue, AGM Insured, U.S. Bank NA SPA) ± | | | 0.73 | | | | 8-15-2037 | | | | 7,600,000 | | | | 7,600,000 | |
Minneapolis & St. Paul MN Housing & RDA HealthSpan Series B (Health Revenue, Ambac Insured) ±(m)(n) | | | 0.95 | | | | 11-15-2017 | | | | 3,400,000 | | | | 3,383,000 | |
Minneapolis MN Plymouth Stevens House Project Series A (Housing Revenue) | | | 1.00 | | | | 12-1-2017 | | | | 2,400,000 | | | | 2,392,488 | |
Minneapolis MN Seward Towers Apartments Project Series A (Housing Revenue) | | | 1.10 | | | | 1-1-2018 | | | | 11,700,000 | | | | 11,672,154 | |
Minnesota HFA Series C (Housing Revenue) | | | 1.60 | | | | 8-1-2018 | | | | 2,210,000 | | | | 2,210,972 | |
Todd County MN United Hospital District BAN Lakewood Health System Series A (Health Revenue) | | | 1.30 | | | | 12-1-2018 | | | | 3,000,000 | | | | 2,981,430 | |
| | | | |
| | | | | | | | | | | | | | | 36,051,563 | |
| | | | | | | | | | | | | | | | |
| | | | |
| 12 | | Wells Fargo Ultra Short-Term Municipal Income Fund | | Portfolio of investments—December 31, 2016 (unaudited) |
| | | | | | | | | | | | | | | | |
| Security name | | Interest rate | | | Maturity date | | | Principal | | | Value | |
| | | | |
| Mississippi: 1.06% | | | | | | | | | | | | | | | | |
Jackson MS Development Bank Series A (Water & Sewer Revenue, AGM Insured) | | | 5.00 | % | | | 9-1-2019 | | | $ | 300,000 | | | $ | 324,816 | |
Mississippi Business Finance Corporation Gulf Power Company Project (Industrial Development Revenue) ø | | | 0.75 | | | | 11-1-2042 | | | | 7,100,000 | | | | 7,100,000 | |
Mississippi Business Finance Corporation Mississippi Power Company Project (Industrial Development Revenue) ø | | | 0.83 | | | | 12-1-2027 | | | | 9,400,000 | | | | 9,400,000 | |
Mississippi Business Finance Corporation Waste Management Incorporated Project (Resource Recovery Revenue) ± | | | 1.38 | | | | 3-1-2027 | | | | 800,000 | | | | 800,184 | |
Mississippi Development Bank Magnolia Regional Health Center Series 2011A (Health Revenue) | | | 5.50 | | | | 10-1-2017 | | | | 565,000 | | | | 579,899 | |
Mississippi Development Bank Magnolia Regional Health Center Series 2011A (Health Revenue) | | | 5.50 | | | | 10-1-2018 | | | | 595,000 | | | | 628,397 | |
Mississippi Hospital Equipment & Facilities Authority Baptist Memorial Health Series B2 (Health Revenue) ±144A | | | 1.40 | | | | 9-1-2022 | | | | 3,925,000 | | | | 3,919,505 | |
Mississippi Hospital Equipment & Facilities Authority Mississippi Baptist Health System Incorporated Series A (Health Revenue) | | | 5.00 | | | | 8-15-2018 | | | | 4,110,000 | | | | 4,200,502 | |
Perry County MS PCR Leaf River Forest Products Incorporated Project (Industrial Development Revenue, Georgia-Pacific LLC LOC) ø144A | | | 0.90 | | | | 2-1-2022 | | | | 30,000,000 | | | | 30,000,000 | |
| | | | |
| | | | | | | | | | | | | | | 56,953,303 | |
| | | | | | | | | | | | | | | | |
| | | | |
| Missouri: 0.92% | | | | | | | | | | | | | | | | |
Independence MO IDA Heritage House Apartments Project (Housing Revenue) | | | 1.50 | | | | 12-1-2018 | | | | 8,700,000 | | | | 8,703,741 | |
Springfield MO Public Utility Refunding (Utilities Revenue) | | | 5.00 | | | | 8-1-2017 | | | | 14,835,000 | | | | 15,192,375 | |
St. Louis MO Series 004 (Airport Revenue, Dexia Credit Local LOC, AGM Insured, Dexia Credit Local LIQ) ø144A | | | 0.90 | | | | 7-1-2026 | | | | 11,010,000 | | | | 11,010,000 | |
Tender Option Bond Trust Receipts/Certificates Floaters Series 2015-XF1015 (Health Revenue, Deutsche Bank LIQ) ø144A | | | 0.90 | | | | 11-15-2048 | | | | 14,805,000 | | | | 14,805,000 | |
| | | | |
| | | | | | | | | | | | | | | 49,711,116 | |
| | | | | | | | | | | | | | | | |
| | | | |
| Montana: 0.15% | | | | | | | | | | | | | | | | |
Montana Board of Investments Municipal Finance Consolidation (Miscellaneous Revenue) ± | | | 0.52 | | | | 3-1-2025 | | | | 1,000,000 | | | | 1,000,000 | |
Montana Board of Investments Municipal Finance Consolidation (Miscellaneous Revenue) ± | | | 0.52 | | | | 3-1-2028 | | | | 5,600,000 | | | | 5,600,000 | |
Montana Board of Investments Municipal Finance Consolidation (Miscellaneous Revenue) ± | | | 0.52 | | | | 3-1-2035 | | | | 1,750,000 | | | | 1,750,000 | |
| | | | |
| | | | | | | | | | | | | | | 8,350,000 | |
| | | | | | | | | | | | | | | | |
| | | | |
| Nebraska: 0.14% | | | | | | | | | | | | | | | | |
Tender Option Bond Trust Receipts/Certificates Floaters Series XM0184 (Airport Revenue, AGC Insured, Bank of America NA LIQ) ø144A | | | 1.09 | | | | 10-1-2033 | | | | 7,500,000 | | | | 7,500,000 | |
| | | | | | | | | | | | | | | | |
| | | | |
| Nevada: 0.28% | | | | | | | | | | | | | | | | |
Clark County NV School District (GO Revenue) | | | 5.00 | | | | 6-15-2018 | | | | 1,000,000 | | | | 1,035,480 | |
Washoe County NV (GO Revenue, Dexia Credit Local LIQ) ø144A | | | 1.07 | | | | 12-9-2030 | | | | 13,125,000 | | | | 13,125,000 | |
Washoe County NV Sierra Pacific Power Company Project Series A (Utilities Revenue) ± | | | 1.50 | | | | 8-1-2031 | | | | 850,000 | | | | 835,032 | |
| | | | |
| | | | | | | | | | | | | | | 14,995,512 | |
| | | | | | | | | | | | | | | | |
| | | | |
| New Jersey: 6.24% | | | | | | | | | | | | | | | | |
Atlantic County NJ BAN (GO Revenue) | | | 2.00 | | | | 6-22-2017 | | | | 19,566,000 | | | | 19,636,046 | |
Beach Haven NJ BAN (GO Revenue) | | | 2.00 | | | | 5-12-2017 | | | | 5,085,000 | | | | 5,095,729 | |
| | | | | | |
| Portfolio of investments—December 31, 2016 (unaudited) | | Wells Fargo Ultra Short-Term Municipal Income Fund | | | 13 | |
| | | | | | | | | | | | | | | | |
| Security name | | Interest rate | | | Maturity date | | | Principal | | | Value | |
| | | | |
| New Jersey (continued) | | | | | | | | | | | | | | | | |
Bridgeton NJ BAN (GO Revenue) | | | 2.00 | % | | | 8-25-2017 | | | $ | 9,795,681 | | | $ | 9,820,072 | |
Burlington County NJ Governmental Leasing Program Series A (Miscellaneous Revenue) | | | 2.00 | | | | 4-26-2017 | | | | 3,130,000 | | | | 3,139,421 | |
Burlington County NJ Governmental Leasing Program Series B (Miscellaneous Revenue) | | | 2.00 | | | | 4-26-2017 | | | | 10,370,000 | | | | 10,401,214 | |
Clinton NJ BAN (GO Revenue) | | | 1.50 | | | | 1-25-2017 | | | | 2,909,000 | | | | 2,909,495 | |
East Brunswick NJ BAN (GO Revenue) | | | 2.00 | | | | 3-17-2017 | | | | 15,000,000 | | | | 15,028,800 | |
East Orange NJ Capital Improvement Series A (GO Revenue, AGM Insured) | | | 3.00 | | | | 6-1-2017 | | | | 1,420,000 | | | | 1,429,983 | |
East Orange NJ Capital Improvement Series A (GO Revenue, AGM Insured) | | | 4.00 | | | | 6-1-2018 | | | | 650,000 | | | | 672,282 | |
Franklin NJ BAN Series A (GO Revenue) | | | 2.00 | | | | 4-12-2017 | | | | 5,226,250 | | | | 5,236,284 | |
Glassboro NJ School District Refunding (GO Revenue, National Insured) | | | 4.00 | | | | 8-15-2017 | | | | 1,355,000 | | | | 1,358,117 | |
Hightstown NJ BAN (GO Revenue) | | | 2.00 | | | | 2-1-2017 | | | | 3,809,000 | | | | 3,811,514 | |
Linden NJ BAN (GO Revenue) | | | 2.00 | | | | 4-11-2017 | | | | 4,339,208 | | | | 4,347,713 | |
Maple Shade NJ BAN (GO Revenue) | | | 2.00 | | | | 6-29-2017 | | | | 8,572,449 | | | | 8,587,451 | |
Monmouth County NJ BAN (GO Revenue) | | | 1.50 | | | | 1-27-2017 | | | | 9,452,379 | | | | 9,455,215 | |
New Jersey Building Authority Series A (Miscellaneous Revenue) | | | 4.00 | | | | 6-15-2017 | | | | 1,065,000 | | | | 1,074,723 | |
New Jersey Building Authority Series A (Miscellaneous Revenue) | | | 5.00 | | | | 6-15-2017 | | | | 5,595,000 | | | | 5,671,484 | |
New Jersey Building Authority Series A (Miscellaneous Revenue) | | | 5.00 | | | | 6-15-2019 | | | | 1,100,000 | | | | 1,150,853 | |
New Jersey Certificate of Participation Equipment Lease Purchase Series A (Miscellaneous Revenue) | | | 5.00 | | | | 6-15-2017 | | | | 1,000,000 | | | | 1,013,670 | |
New Jersey EDA Refunded School Facilities Construction Series DD1 (Miscellaneous Revenue) | | | 5.00 | | | | 12-15-2017 | | | | 7,785,000 | | | | 8,072,344 | |
New Jersey EDA Refunding Transportation Project Sub Lease Series A (Transportation Revenue) | | | 5.00 | | | | 5-1-2018 | | | | 5,170,000 | | | | 5,343,505 | |
New Jersey EDA School Facilities Construction Notes Series BBB (Miscellaneous Revenue) | | | 5.00 | | | | 6-15-2021 | | | | 5,000,000 | | | | 5,295,200 | |
New Jersey EDA School Facilities Construction Notes Series C (Miscellaneous Revenue) ± | | | 2.52 | | | | 2-1-2018 | | | | 2,000,000 | | | | 2,012,780 | |
New Jersey EDA School Facilities Construction Notes Series DD1 (Miscellaneous Revenue) | | | 5.00 | | | | 12-15-2018 | | | | 2,220,000 | | | | 2,317,125 | |
New Jersey EDA School Facilities Construction Notes Series K (Miscellaneous Revenue) ± | | | 1.46 | | | | 2-1-2017 | | | | 9,800,000 | | | | 9,800,000 | |
New Jersey EDA School Facilities Construction Notes Series PP (Miscellaneous Revenue) | | | 5.00 | | | | 6-15-2019 | | | | 12,710,000 | | | | 13,299,109 | |
New Jersey EDA School Facilities Construction Notes Series XX (Miscellaneous Revenue) | | | 5.00 | | | | 6-15-2019 | | | | 15,000,000 | | | | 15,695,250 | |
New Jersey EDA Transportation Project Series A (Transportation Revenue) | | | 5.00 | | | | 5-1-2017 | | | | 11,175,000 | | | | 11,288,203 | |
New Jersey EDA Unrefunded School Facilities Construction Series DD1 (Miscellaneous Revenue) | | | 5.00 | | | | 12-15-2017 | | | | 315,000 | | | | 326,866 | |
New Jersey HEFAR Student Loan Assistance Series 1 (Education Revenue) | | | 5.00 | | | | 12-1-2017 | | | | 600,000 | | | | 616,056 | |
New Jersey HFA NCC Manor Project Series 2015K (Housing Revenue) ± | | | 1.05 | | | | 2-1-2018 | | | | 20,500,000 | | | | 20,465,765 | |
New Jersey HFA Prospect Park Apartments Project Series 2015R (Housing Revenue) ± | | | 0.88 | | | | 10-1-2017 | | | | 8,145,000 | | | | 8,140,276 | |
New Jersey HFFA St. Joseph’s Healthcare System Group (Health Revenue) | | | 3.00 | | | | 7-1-2018 | | | | 1,000,000 | | | | 1,020,260 | |
New Jersey HFFA St. Joseph’s Healthcare System Group (Health Revenue) | | | 4.00 | | | | 7-1-2019 | | | | 1,200,000 | | | | 1,259,808 | |
New Jersey HFFA St. Joseph’s Healthcare System Group (Health Revenue) | | | 4.00 | | | | 7-1-2020 | | | | 1,965,000 | | | | 2,083,607 | |
New Jersey HFFA St. Joseph’s Healthcare System Group (Health Revenue) | | | 5.00 | | | | 7-1-2021 | | | | 1,000,000 | | | | 1,108,540 | |
New Jersey Higher Education Assistance Authority Senior Series 1A (Education Revenue) | | | 5.00 | | | | 12-1-2017 | | | | 1,740,000 | | | | 1,792,374 | |
New Jersey Higher Education Assistance Authority Series 1A (Education Revenue) | | | 5.00 | | | | 12-1-2017 | | | | 2,000,000 | | | | 2,053,520 | |
New Jersey Housing and Mortgage Finance Agency Oakwood Towers Project Series U (Housing Revenue) ± | | | 0.80 | | | | 11-1-2017 | | | | 3,000,000 | | | | 2,995,170 | |
| | | | |
| 14 | | Wells Fargo Ultra Short-Term Municipal Income Fund | | Portfolio of investments—December 31, 2016 (unaudited) |
| | | | | | | | | | | | | | | | |
| Security name | | Interest rate | | | Maturity date | | | Principal | | | Value | |
| | | | |
| New Jersey (continued) | | | | | | | | | | | | | | | | |
New Jersey Housing and Mortgage Finance Agency Series B (Housing Revenue) | | | 1.05 | % | | | 5-1-2018 | | | $ | 2,000,000 | | | $ | 1,989,980 | |
New Jersey Housing and Mortgage Finance Agency Series F (Housing Revenue) ± | | | 0.95 | | | | 3-1-2018 | | | | 8,450,000 | | | | 8,426,256 | |
New Jersey Housing and Mortgage Finance Agency Trent Center West Senior Apartments Project Series FF (Housing Revenue) | | | 1.10 | | | | 12-1-2017 | | | | 6,000,000 | | | | 5,988,840 | |
New Jersey Transportation Trust Fund Series A (Miscellaneous Revenue) | | | 5.00 | | | | 12-15-2019 | | | | 4,405,000 | | | | 4,632,078 | |
New Jersey Transportation Trust Fund Series A (Miscellaneous Revenue, Ambac Insured) | | | 5.75 | | | | 6-15-2017 | | | | 1,700,000 | | | | 1,729,036 | |
New Jersey Transportation Trust Fund Series A-1 (Transportation Revenue) | | | 5.00 | | | | 6-15-2019 | | | | 5,250,000 | | | | 5,543,265 | |
New Jersey Transportation Trust Fund Series AA (Miscellaneous Revenue) | | | 5.00 | | | | 6-15-2017 | | | | 695,000 | | | | 704,501 | |
New Jersey Transportation Trust Fund Series AA (Miscellaneous Revenue) | | | 5.00 | | | | 6-15-2020 | | | | 1,600,000 | | | | 1,687,984 | |
New Jersey Transportation Trust Fund Series B (Miscellaneous Revenue) | | | 5.00 | | | | 6-15-2017 | | | | 3,135,000 | | | | 3,177,855 | |
New Jersey Transportation Trust Fund Series B (Miscellaneous Revenue, National Insured) | | | 5.50 | | | | 12-15-2017 | | | | 2,505,000 | | | | 2,594,429 | |
New Jersey Transportation Trust Fund Series B-1 (Transportation Revenue) | | | 5.00 | | | | 12-15-2017 | | | | 2,275,000 | | | | 2,334,651 | |
New Jersey TTFA Series DC8033 (Transportation Revenue, Dexia Credit Local LOC, AGM Insured, Dexia Credit Local LIQ) ø144A | | | 0.84 | | | | 12-15-2022 | | | | 12,255,000 | | | | 12,255,000 | |
New Jersey Turnpike Authority Series C (Transportation Revenue) ± | | | 1.20 | | | | 1-1-2017 | | | | 13,000,000 | | | | 13,000,000 | |
Newark NJ TAN Series A (GO Revenue) | | | 2.50 | | | | 2-15-2017 | | | | 4,500,000 | | | | 4,503,375 | |
Rahway NJ BAN (GO Revenue) | | | 2.00 | | | | 6-29-2017 | | | | 4,441,105 | | | | 4,457,093 | |
Tender Option Bond Trust Receipts/Certificates Floaters Series 2016-XG0047 (Health Revenue, AGC Insured, Deutsche Bank LIQ) ø144A | | | 1.12 | | | | 7-1-2038 | | | | 24,431,373 | | | | 24,431,373 | |
Union County NJ BAN (GO Revenue) | | | 1.25 | | | | 3-3-2017 | | | | 6,979,670 | | | | 6,978,972 | |
Union County NJ BAN (GO Revenue) | | | 1.50 | | | | 3-17-2017 | | | | 3,627,000 | | | | 3,628,850 | |
Union County NJ BAN (GO Revenue) | | | 1.50 | | | | 3-22-2017 | | | | 3,526,000 | | | | 3,527,587 | |
| | | | |
| | | | | | | | | | | | | | | 336,416,949 | |
| | | | | | | | | | | | | | | | |
| | | | |
| New Mexico: 0.75% | | | | | | | | | | | | | | | | |
New Mexico Municipal Energy Acquisition Authority Gas Supply Sub Series B (Utilities Revenue, Royal Bank of Canada SPA) ± | | | 1.16 | | | | 11-1-2039 | | | | 40,685,000 | | | | 40,436,008 | |
| | | | | | | | | | | | | | | | |
| | | | |
| New York: 16.35% | | | | | | | | | | | | | | | | |
Babylon NY IDA Covanta Babylon Series A (Industrial Development Revenue) | | | 5.00 | | | | 1-1-2018 | | | | 2,500,000 | | | | 2,589,575 | |
Binghamton NY City School District TAN (GO Revenue) | | | 1.50 | | | | 1-31-2017 | | | | 3,000,000 | | | | 3,000,960 | |
Broome County NY BAN (GO Revenue) | | | 2.00 | | | | 5-5-2017 | | | | 19,620,000 | | | | 19,679,449 | |
Cicero NY BAN (GO Revenue) | | | 2.00 | | | | 3-31-2017 | | | | 3,660,549 | | | | 3,665,601 | |
Cold Spring NY BAN (GO Revenue) | | | 2.00 | | | | 5-12-2017 | | | | 3,040,000 | | | | 3,046,414 | |
Concord NY BAN (GO Revenue) | | | 2.00 | | | | 2-23-2017 | | | | 2,664,000 | | | | 2,666,451 | |
Erie County NY BAN (GO Revenue) | | | 2.00 | | | | 7-20-2017 | | | | 1,695,186 | | | | 1,699,729 | |
Erie County NY Clarence Central School District BAN (GO Revenue) | | | 2.00 | | | | 7-13-2017 | | | | 14,260,000 | | | | 14,317,896 | |
Freeport NY BAN Series C (GO Revenue) | | | 2.00 | | | | 5-3-2017 | | | | 11,360,000 | | | | 11,389,990 | |
Fulton NY City School District BAN (GO Revenue) | | | 2.00 | | | | 6-29-2017 | | | | 12,575,000 | | | | 12,622,785 | |
Hamburg NY BAN (GO Revenue) | | | 2.00 | | | | 7-6-2017 | | | | 6,580,000 | | | | 6,607,570 | |
Hancock NY Central School District BAN (GO Revenue) | | | 2.00 | | | | 7-6-2017 | | | | 4,950,000 | | | | 4,965,345 | |
Hastings Town NY BAN (GO Revenue) | | | 2.00 | | | | 7-6-2017 | | | | 1,700,000 | | | | 1,704,301 | |
Long Beach NY BAN (GO Revenue) | | | 1.50 | | | | 2-16-2017 | | | | 3,575,000 | | | | 3,576,037 | |
Long Island NY Power Authority Electric System Series C (Utilities Revenue) ± | | | 1.31 | | | | 5-1-2033 | | | | 10,000,000 | | | | 10,039,100 | |
Madison County NY BAN (GO Revenue) | | | 2.00 | | | | 4-14-2017 | | | | 2,500,000 | | | | 2,501,150 | |
Metropolitan Transportation Authority New York Refunding Series 2008A-2A (Tax Revenue) ± | | | 1.10 | | | | 11-1-2026 | | | | 6,810,000 | | | | 6,810,068 | |
Metropolitan Transportation Authority New York Refunding Sub Series B-3A (Tax Revenue) ± | | | 1.09 | | | | 11-1-2028 | | | | 3,000,000 | | | | 3,001,860 | |
| | | | | | |
| Portfolio of investments—December 31, 2016 (unaudited) | | Wells Fargo Ultra Short-Term Municipal Income Fund | | | 15 | |
| | | | | | | | | | | | | | | | |
| Security name | | Interest rate | | | Maturity date | | | Principal | | | Value | |
| | | | |
| New York (continued) | | | | | | | | | | | | | | | | |
Metropolitan Transportation Authority New York Series D-2 (Transportation Revenue) ± | | | 1.09 | % | | | 11-15-2044 | | | $ | 6,100,000 | | | $ | 6,095,242 | |
Metropolitan Transportation Authority New York Sub Series A3 (Transportation Revenue) ± | | | 1.22 | | | | 11-15-2042 | | | | 10,000,000 | | | | 9,960,600 | |
Metropolitan Transportation Authority New York Sub Series D-2A (Transportation Revenue, AGM Insured) ± | | | 0.90 | | | | 11-1-2032 | | | | 36,650,000 | | | | 36,639,372 | |
Nassau County NY Interim Finance Authority Series B (Tax Revenue, Sumitomo Mitsui Banking SPA) ø | | | 0.73 | | | | 11-15-2021 | | | | 9,600,000 | | | | 9,600,000 | |
Nassau County NY Lawrence Union Free School District TAN (GO Revenue) | | | 1.50 | | | | 6-23-2017 | | | | 4,000,000 | | | | 4,001,120 | |
New York Akron Central School District BAN (GO Revenue) | | | 2.00 | | | | 6-22-2017 | | | | 6,423,907 | | | | 6,454,356 | |
New York Energy R&D Authority PCR Keyspan Generation Series A (Industrial Development Revenue, Ambac Insured) ±(m) | | | 1.00 | | | | 10-1-2028 | | | | 1,725,000 | | | | 1,725,000 | |
New York Environmental Facilities Corporation Waste Management Incorporated Project Series A (Resource Recovery Revenue) | | | 2.75 | | | | 7-1-2017 | | | | 1,650,000 | | | | 1,661,286 | |
New York Homer Central School District BAN (GO Revenue) | | | 2.00 | | | | 6-30-2017 | | | | 9,430,000 | | | | 9,463,665 | |
New York Local Government Assistance Corporation Refinance Subordinated Lien Series A-10V (Tax Revenue, AGM Insured) ±(m)(n) | | | 0.83 | | | | 4-1-2017 | | | | 6,400,000 | | | | 6,400,000 | |
New York Local Government Refunding Series C (Tax Revenue) | | | 5.50 | | | | 4-1-2017 | | | | 1,420,000 | | | | 1,436,500 | |
New York Nassau Health Care Corporation RAN (Health Revenue) | | | 2.00 | | | | 1-17-2017 | | | | 8,000,000 | | | | 8,002,080 | |
New York NY Adjusted Fiscal 2006 Sub Series F-3 (GO Revenue, Sumitomo Mitsui Banking LOC) ø | | | 0.71 | | | | 9-1-2035 | | | | 9,700,000 | | | | 9,700,000 | |
New York NY Adjusted Fiscal 2008 Sub Series A-3 (GO Revenue, AGM Insured) ±(m) | | | 0.84 | | | | 8-1-2026 | | | | 3,000,000 | | | | 3,000,000 | |
New York NY Adjusted Fiscal 2008 Sub Series C-4 (GO Revenue, AGC Insured) ±(m) | | | 0.84 | | | | 10-1-2027 | | | | 52,225,000 | | | | 52,225,000 | |
New York NY Adjusted Fiscal 2014 Sub Series D-3 (GO Revenue, JPMorgan Chase & Company SPA) ø | | | 0.74 | | | | 8-1-2038 | | | | 10,000,000 | | | | 10,000,000 | |
New York NY Adjusted Fiscal 2015 Sub Series F-4 (GO Revenue, Bank of Tokyo-Mitsubishi LOC) ø | | | 0.75 | | | | 6-1-2044 | | | | 32,600,000 | | | | 32,600,000 | |
New York NY Adjusted Fiscal 2015 Sub Series F-5 (GO Revenue, Barclays Bank plc LIQ) ø | | | 0.75 | | | | 6-1-2044 | | | | 9,000,000 | | | | 9,000,000 | |
New York NY Adjusted Fiscal 2015 Sub Series F-6 (GO Revenue, JPMorgan Chase & Company SPA) ø | | | 0.74 | | | | 6-1-2044 | | | | 18,200,000 | | | | 18,200,000 | |
New York NY Adjusted Fiscal 2017 Sub Series A-5 (GO Revenue, Landesbank Hessen-Thüringen SPA) ø | | | 0.78 | | | | 8-1-2044 | | | | 36,000,000 | | | | 36,000,000 | |
New York NY HFA 605 West 42nd Street Series A (Housing Revenue, Bank of China LOC) ø | | | 0.90 | | | | 5-1-2048 | | | | 25,000,000 | | | | 25,000,000 | |
New York NY Housing Development Corporation Series I-2-B (Housing Revenue) ± | | | 1.85 | | | | 5-1-2021 | | | | 16,050,000 | | | | 16,027,530 | |
New York NY IDA 123 Washington LLC Project (Industrial Development Revenue, Bank of China LOC) ø | | | 0.90 | | | | 10-1-2042 | | | | 15,000,000 | | | | 15,000,000 | |
New York NY Municipal Water Finance Authority Adjusted Fiscal 2013 Sub Series AA-2 (Water & Sewer Revenue, Bank of Tokyo-Mitsubishi SPA) ø | | | 0.75 | | | | 6-15-2046 | | | | 27,215,000 | | | | 27,215,000 | |
New York NY Municipal Water Finance Authority Adjusted Fiscal 2014 Sub Series AA (Water & Sewer Revenue, JPMorgan Chase & Company SPA) ø | | | 0.74 | | | | 6-15-2050 | | | | 9,900,000 | | | | 9,900,000 | |
New York NY Municipal Water Finance Authority Adjusted Fiscal 2017 Sub Series BB (Water & Sewer Revenue, State Street Bank & Trust Company SPA) ø | | | 0.74 | | | | 6-15-2049 | | | | 12,800,000 | | | | 12,800,000 | |
New York NY Municipal Water Finance Authority Series AA-2 (Water & Sewer Revenue, Dexia Credit Local SPA) ø | | | 1.06 | | | | 6-15-2032 | | | | 15,600,000 | | | | 15,600,000 | |
New York NY Municipal Water Finance Authority Series AA3 (Water & Sewer Revenue, Dexia Credit Local SPA) ø | | | 0.93 | | | | 6-15-2032 | | | | 20,000,000 | | | | 20,000,000 | |
New York NY Series A-6 (GO Revenue) ± | | | 1.22 | | | | 8-1-2031 | | | | 39,950,000 | | | | 39,912,447 | |
New York NY Series J Sub Series J-2 (GO Revenue, AGM Insured) ±(m) | | | 0.99 | | | | 6-1-2036 | | | | 20,475,000 | | | | 20,475,000 | |
New York NY Series J Sub Series J-3 (GO Revenue, AGM Insured) ±(m) | | | 0.84 | | | | 6-1-2036 | | | | 28,000,000 | | | | 28,000,000 | |
New York NY Series J-4 (GO Revenue) ± | | | 1.27 | | | | 8-1-2025 | | | | 10,865,000 | | | | 10,868,911 | |
| | | | |
| 16 | | Wells Fargo Ultra Short-Term Municipal Income Fund | | Portfolio of investments—December 31, 2016 (unaudited) |
| | | | | | | | | | | | | | | | |
| Security name | | Interest rate | | | Maturity date | | | Principal | | | Value | |
| | | | |
| New York (continued) | | | | | | | | | | | | | | | | |
New York NY Sub Series C-4 (GO Revenue, AGM Insured) ±(m) | | | 0.84 | % | | | 1-1-2032 | | | $ | 1,025,000 | | | $ | 1,025,000 | |
New York NY Sub Series H-5 (GO Revenue, Dexia Credit Local LOC) ø | | | 0.93 | | | | 3-1-2034 | | | | 11,660,000 | | | | 11,660,000 | |
New York NY Transitional Finance Authority Future Tax Secured Bonds Fiscal 2007 Series A (Tax Revenue, Dexia Credit Local SPA) ø | | | 0.93 | | | | 8-1-2022 | | | | 7,400,000 | | | | 7,400,000 | |
New York NY Transitional Finance Authority NYC Recovery Series 3 Sub Series 3D (Tax Revenue, Dexia Credit Local SPA) ø | | | 1.20 | | | | 11-1-2022 | | | | 20,435,000 | | | | 20,435,000 | |
New York NY Transitional Finance Authority Series 1 (Tax Revenue, JPMorgan Chase & Company SPA) ø | | | 0.74 | | | | 11-1-2022 | | | | 6,330,000 | | | | 6,330,000 | |
New York Thruway Authority Series II (Transportation Revenue, National Insured) | | | 5.00 | | | | 1-1-2020 | | | | 8,940,000 | | | | 9,270,333 | |
New York Transportation Development Corporation American Airlines Incorporated John F Kennedy International Airport Project (Airport Revenue) | | | 5.00 | | | | 8-1-2020 | | | | 3,500,000 | | | | 3,640,630 | |
New York Transportation Development Corporation American Airlines Incorporated John F. Kennedy International Airport Project (Airport Revenue) | | | 5.00 | | | | 8-1-2017 | | | | 12,500,000 | | | | 12,682,250 | |
New York Transportation Development Corporation American Airlines Incorporated John F. Kennedy International Airport Project (Airport Revenue) | | | 5.00 | | | | 8-1-2018 | | | | 10,000,000 | | | | 10,316,700 | |
New York Urban Development Corporation Certificate of Participation James A Farley Post Office Project (Miscellaneous Revenue) 144A | | | 4.20 | | | | 2-1-2017 | | | | 37,290,000 | | | | 37,275,084 | |
Onondaga County NY Lafayette Central School District RAN (GO Revenue) | | | 1.50 | | | | 6-30-2017 | | | | 12,477,222 | | | | 12,490,947 | |
Onondaga County NY Lafayette Central School District RAN (GO Revenue) | | | 2.00 | | | | 6-23-2017 | | | | 2,000,000 | | | | 2,006,900 | |
Orange & Ulster Counties NY Board of Cooperative Educational Services RAN Series B (Miscellaneous Revenue) | | | 1.50 | | | | 7-31-2017 | | | | 11,000,000 | | | | 10,995,930 | |
Oyster Bay NY BAN Series A (GO Revenue) | | | 2.75 | | | | 2-3-2017 | | | | 11,000,000 | | | | 11,006,050 | |
Oyster Bay NY Public Improvement (GO Revenue) | | | 3.00 | | | | 8-15-2017 | | | | 780,000 | | | | 780,897 | |
Oyster Bay NY TAN Series B (GO Revenue) | | | 5.25 | | | | 4-7-2017 | | | | 3,000,000 | | | | 3,019,230 | |
Sackets Harbor NY BAN (GO Revenue) | | | 2.00 | | | | 6-16-2017 | | | | 2,750,000 | | | | 2,758,140 | |
South Jefferson NY Central School District (GO Revenue) | | | 0.95 | | | | 2-17-2017 | | | | 1,116,638 | | | | 1,116,024 | |
Suffolk County NY Copiague Union Free School District TAN (GO Revenue) | | | 1.50 | | | | 6-22-2017 | | | | 18,500,000 | | | | 18,510,545 | |
Suffolk County NY Public Improvement Serial Bonds Series B (GO Revenue, Build America Mutual Assurance Company Insured) | | | 2.00 | | | | 10-15-2019 | | | | 880,000 | | | | 885,729 | |
Suffolk County NY Sachem Central School District TAN (GO Revenue) | | | 2.00 | | | | 6-29-2017 | | | | 20,000,000 | | | | 20,063,400 | |
Suffolk County NY TAN (GO Revenue) | | | 2.00 | | | | 7-26-2017 | | | | 30,000,000 | | | | 30,113,400 | |
Utica NY School District (GO Revenue) | | | 3.00 | | | | 7-1-2017 | | | | 1,320,000 | | | | 1,328,686 | |
Vestal NY BAN (GO Revenue) | | | 2.00 | | | | 5-12-2017 | | | | 4,350,000 | | | | 4,360,614 | |
Watertown NY BAN (GO Revenue) | | | 2.00 | | | | 4-20-2017 | | | | 5,850,000 | | | | 5,857,137 | |
Westchester County NY Hudson Project (Health Revenue) | | | 3.00 | | | | 1-1-2017 | | | | 500,000 | | | | 500,025 | |
Yonkers NY Series D (GO Revenue) | | | 3.00 | | | | 8-1-2017 | | | | 2,045,000 | | | | 2,065,736 | |
Yonkers NY Series D (GO Revenue) | | | 4.00 | | | | 8-1-2018 | | | | 3,135,000 | | | | 3,252,813 | |
Yonkers NY Series E (GO Revenue) | | | 3.25 | | | | 9-1-2017 | | | | 790,000 | | | | 800,310 | |
Yonkers NY Series E (GO Revenue) | | | 4.00 | | | | 9-1-2018 | | | | 1,225,000 | | | | 1,274,037 | |
Yonkers NY Series F (GO Revenue) | | | 2.00 | | | | 9-1-2017 | | | | 345,000 | | | | 346,639 | |
Yonkers NY Series F (GO Revenue) | | | 3.00 | | | | 9-1-2018 | | | | 350,000 | | | | 358,400 | |
| | | | |
| | | | | | | | | | | | | | | 880,773,976 | |
| | | | | | | | | | | | | | | | |
| | | | |
| North Carolina: 1.37% | | | | | | | | | | | | | | | | |
Ashville NC Housing Authority Spruce Hill Apartments (Housing Revenue) ± | | | 0.95 | | | | 8-1-2019 | | | | 10,000,000 | | | | 9,978,500 | |
Charlotte NC Airport Series D (Airport Revenue, Bank of America NA LOC) ø | | | 0.72 | | | | 7-1-2034 | | | | 6,000,000 | | | | 6,000,000 | |
Charlotte NC Housing Authority MFHR Boulevard Phase III Project (Housing Revenue) ± | | | 0.75 | | | | 8-1-2017 | | | | 10,500,000 | | | | 10,498,110 | |
Greensboro NC Housing Authority Claremont Courts Project (Housing Revenue) ± | | | 0.95 | | | | 11-1-2017 | | | | 4,800,000 | | | | 4,796,064 | |
North Carolina Capital Finance Republic Services Incorporated Project Series 2013 (Resource Recovery Revenue) ± | | | 0.95 | | | | 6-1-2038 | | | | 11,600,000 | | | | 11,600,000 | |
| | | | | | |
| Portfolio of investments—December 31, 2016 (unaudited) | | Wells Fargo Ultra Short-Term Municipal Income Fund | | | 17 | |
| | | | | | | | | | | | | | | | |
| Security name | | Interest rate | | | Maturity date | | | Principal | | | Value | |
| | | | |
| North Carolina (continued) | | | | | | | | | | | | | | | | |
North Carolina HFA Weaver Investment Company Rural Development Portfolio Series A (Housing Revenue) ± | | | 1.50 | % | | | 12-1-2018 | | | $ | 12,800,000 | | | $ | 12,782,080 | |
North Carolina Medical Care Commission FirstHealth Carolina Project Series 2008A (Health Revenue, Branch Banking & Trust SPA) ø | | | 0.77 | | | | 10-1-2028 | | | | 14,035,000 | | | | 14,035,000 | |
North Carolina Medical Care Commission Healthcare Facilities Series A (Health Revenue, JPMorgan Chase & Company SPA) ø | | | 0.80 | | | | 11-1-2034 | | | | 3,900,000 | | | | 3,900,000 | |
| | | | |
| | | | | | | | | | | | | | | 73,589,754 | |
| | | | | | | | | | | | | | | | |
| | | | |
| North Dakota: 0.11% | | | | | | | | | | | | | | | | |
Dickinson ND Series A (Tax Revenue) | | | 3.00 | | | | 10-1-2017 | | | | 1,100,000 | | | | 1,113,618 | |
Hazen ND Sakakawea Medical Center Project BAN (Health Revenue) | | | 2.50 | | | | 7-1-2017 | | | | 3,000,000 | | | | 3,003,060 | |
Williston ND Series A (Tax Revenue, AGM Insured) | | | 3.00 | | | | 5-1-2017 | | | | 1,950,000 | | | | 1,961,291 | |
| | | | |
| | | | | | | | | | | | | | | 6,077,969 | |
| | | | | | | | | | | | | | | | |
| | | | |
| Ohio: 3.22% | | | | | | | | | | | | | | | | |
Cleveland OH Airport System Series A (Airport Revenue, Ambac Insured) | | | 5.25 | | | | 1-1-2017 | | | | 2,315,000 | | | | 2,315,255 | |
Cleveland OH Airport System Series C (Airport Revenue, AGC Insured) | | | 5.00 | | | | 1-1-2017 | | | | 2,895,000 | | | | 2,895,318 | |
Crawford County OH Avita Health System Obligated Group Project (Health Revenue) | | | 1.43 | | | | 11-1-2017 | | | | 15,000,000 | | | | 15,000,450 | |
Cuyahoga OH Metropolitan Housing Authority Bohn Tower Apartments Project (Housing Revenue) | | | 0.70 | | | | 3-1-2017 | | | | 12,700,000 | | | | 12,694,158 | |
Cuyahoga OH Metropolitan Housing Authority Carver Park Phase I Project (Housing Revenue) ± | | | 1.00 | | | | 9-1-2019 | | | | 7,000,000 | | | | 6,928,950 | |
Franklin County OH Poindexter Phase IIA Project (Housing Revenue) ± | | | 1.10 | | | | 12-1-2018 | | | | 3,000,000 | | | | 2,993,340 | |
Huber Heights OH BAN Series A (Miscellaneous Revenue) | | | 2.00 | | | | 6-1-2017 | | | | 3,000,000 | | | | 3,011,190 | |
Lancaster OH Port Authority (Utilities Revenue, Royal Bank of Canada SPA) ± | | | 0.81 | | | | 2-1-2017 | | | | 3,895,000 | | | | 3,894,494 | |
Lancaster OH Port Authority (Utilities Revenue, Royal Bank of Canada SPA) ± | | | 0.86 | | | | 8-1-2017 | | | | 3,240,000 | | | | 3,239,773 | |
Lancaster OH Port Authority (Utilities Revenue, Royal Bank of Canada SPA) ± | | | 0.96 | | | | 8-1-2018 | | | | 4,000,000 | | | | 3,985,440 | |
Lancaster OH Port Authority (Utilities Revenue, Royal Bank of Canada SPA) ± | | | 1.13 | | | | 5-1-2038 | | | | 8,500,000 | | | | 8,425,540 | |
Marietta OH BAN (GO Revenue) | | | 1.50 | | | | 5-12-2017 | | | | 3,475,000 | | | | 3,478,301 | |
Medina County OH Manor Apartments Project (Housing Revenue) ± | | | 1.00 | | | | 12-1-2017 | | | | 3,000,000 | | | | 2,997,510 | |
Ohio Air Quality Development Authority AMT Refunding Bond Pollution Control 1st Energy Series C (Industrial Development Revenue) ± | | | 3.95 | | | | 11-1-2032 | | | | 450,000 | | | | 188,114 | |
Ohio Air Quality Development Authority FirstEnergy Generation Series 2006-A (Utilities Revenue) ± | | | 3.75 | | | | 12-1-2023 | | | | 25,000,000 | | | | 10,461,750 | |
Ohio Air Quality Development Authority FirstEnergy Generation Series 2009-A (Utilities Revenue) | | | 5.70 | | | | 8-1-2020 | | | | 16,790,000 | | | | 7,018,052 | |
Ohio HFA Coopermill Manor Project (Housing Revenue) | | | 0.85 | | | | 8-1-2017 | | | | 15,850,000 | | | | 15,817,983 | |
Ohio Higher Educational Facility John Carroll University Project (Education Revenue) ± | | | 2.25 | | | | 9-1-2033 | | | | 1,495,000 | | | | 1,507,618 | |
Ohio Housing Finance Agency Northland Village Apartments Project (Housing Revenue) ± | | | 1.00 | | | | 5-1-2019 | | | | 14,000,000 | | | | 13,961,920 | |
Ohio University Hospital Health System Series B (Health Revenue) ø | | | 1.00 | | | | 1-15-2033 | | | | 15,220,000 | | | | 15,220,000 | |
Ohio University Hospital Health System Series B (Health Revenue) ø | | | 1.00 | | | | 1-15-2045 | | | | 13,000,000 | | | | 13,000,000 | |
Revere OH School Facilities Improvement BAN (GO Revenue) | | | 2.00 | | | | 5-1-2017 | | | | 8,500,000 | | | | 8,518,190 | |
Sandusky OH School District Classroom Facilities Improvement (GO Revenue) | | | 2.25 | | | | 6-1-2017 | | | | 9,800,000 | | | | 9,827,146 | |
Warren County OH Health Care Facilities Otterbein Homes Series A (Health Revenue) | | | 4.00 | | | | 7-1-2017 | | | | 4,375,000 | | | | 4,434,894 | |
Warrensville Heights OH Certificate of Participation (Miscellaneous Revenue) | | | 3.13 | | | | 12-13-2017 | | | | 1,500,000 | | | | 1,515,315 | |
| | | | |
| | | | | | | | | | | | | | | 173,330,701 | |
| | | | | | | | | | | | | | | | |
| | | | |
| 18 | | Wells Fargo Ultra Short-Term Municipal Income Fund | | Portfolio of investments—December 31, 2016 (unaudited) |
| | | | | | | | | | | | | | | | |
| Security name | | Interest rate | | | Maturity date | | | Principal | | | Value | |
| | | | |
| Oklahoma: 0.56% | | | | | | | | | | | | | | | | |
Cleveland County OK Detention Facilities Project (Tax Revenue) | | | 3.00 | % | | | 3-1-2018 | | | $ | 1,000,000 | | | $ | 1,017,670 | |
Cleveland County OK Detention Facilities Project (Tax Revenue) | | | 3.00 | | | | 3-1-2019 | | | | 1,505,000 | | | | 1,545,319 | |
Cleveland County OK Educational Facilities Moore Public Schools Project (Miscellaneous Revenue) | | | 5.00 | | | | 6-1-2017 | | | | 4,825,000 | | | | 4,902,538 | |
Comanche County OK Hospital Authority Refunding (Health Revenue) | | | 5.00 | | | | 7-1-2017 | | | | 2,855,000 | | | | 2,886,291 | |
Oklahoma Capitol Improvement Authority Higher Education Projects Series A (Miscellaneous Revenue) | | | 5.00 | | | | 7-1-2018 | | | | 2,225,000 | | | | 2,351,580 | |
Oklahoma County OK Independent School District No. 52 Series B (GO Revenue) | | | 2.00 | | | | 3-1-2017 | | | | 2,550,000 | | | | 2,554,361 | |
Oklahoma HFA Savanna Landing Apartments (Housing Revenue) ± | | | 0.85 | | | | 7-1-2019 | | | | 2,500,000 | | | | 2,480,575 | |
Oklahoma Housing Finance Agency Cherokee Terrace Apartments (Housing Revenue, GNMA Insured) ± | | | 0.70 | | | | 12-1-2017 | | | | 5,000,000 | | | | 4,996,100 | |
Oklahoma School District Certificate of Participation (Miscellaneous Revenue) | | | 1.00 | | | | 6-30-2017 | | | | 7,330,000 | | | | 7,316,733 | |
| | | | |
| | | | | | | | | | | | | | | 30,051,167 | |
| | | | | | | | | | | | | | | | |
| | | | |
| Oregon: 0.40% | | | | | | | | | | | | | | | | |
Oregon Facilities Authority Providence Health & Services Series C (Health Revenue) ± | | | 1.61 | | | | 10-1-2020 | | | | 14,650,000 | | | | 14,651,465 | |
Oregon Housing Development Holiday Garden Apartments Series 2015D (Housing Revenue) ± | | | 0.80 | | | | 8-1-2018 | | | | 6,400,000 | | | | 6,398,272 | |
Portland OR Portland International Airport Series 18-A (Airport Revenue, Bank of China LOC) ø | | | 0.86 | | | | 7-1-2026 | | | | 500,000 | | | | 500,000 | |
| | | | |
| | | | | | | | | | | | | | | 21,549,737 | |
| | | | | | | | | | | | | | | | |
| | | | |
| Pennsylvania: 3.82% | | | | | | | | | | | | | | | | |
Beaver County PA IDA FirstEnergy Generation Series A (Utilities Revenue) | | | 2.15 | | | | 3-1-2017 | | | | 3,300,000 | | | | 2,141,700 | |
Beaver County PA IDA FirstEnergy Generation Series B (Utilities Revenue) ± | | | 2.50 | | | | 12-1-2041 | | | | 4,000,000 | | | | 2,398,000 | |
Beaver County PA IDA FirstEnergy Generation Series B (Industrial Development Revenue) ± | | | 3.50 | | | | 12-1-2035 | | | | 3,025,000 | | | | 1,264,511 | |
Beaver County PA IDA FirstEnergy Generation Series B (Industrial Development Revenue) ± | | | 4.25 | | | | 10-1-2047 | | | | 5,000,000 | | | | 4,507,200 | |
Bethlehem PA Area School District Authority (Miscellaneous Revenue) ± | | | 0.86 | | | | 1-1-2030 | | | | 8,105,000 | | | | 8,090,168 | |
Clarion County PA IDA Clarion University Housing Project Series D (Housing Revenue) | | | 3.00 | | | | 7-1-2017 | | | | 900,000 | | | | 903,627 | |
Commonwealth of Pennsylvania (GO Revenue) | | | 5.00 | | | | 1-15-2020 | | | | 16,430,000 | | | | 17,920,858 | |
Delaware Valley PA Regional Finance Authority Local Government Series 2182 (Miscellaneous Revenue, Morgan Stanley Bank LIQ) ø144A | | | 0.91 | | | | 7-1-2017 | | | | 6,000,000 | | | | 6,000,000 | |
Leigh County PA IDA PPL Corporation Series A (Industrial Development Revenue) ± | | | 0.90 | | | | 9-1-2029 | | | | 12,500,000 | | | | 12,463,625 | |
Lycoming County PA Authority Association of Independent Colleges & Universities of Pennsylvania Financing Program (Education Revenue) ± | | | 1.85 | | | | 11-1-2035 | | | | 2,000,000 | | | | 1,973,600 | |
Montgomery County PA IDA Peco Energy Company Project Series A (Industrial Development Revenue) ± | | | 2.50 | | | | 10-1-2030 | | | | 3,000,000 | | | | 2,965,230 | |
Montgomery County PA IDA Peco Energy Company Project Series A (Industrial Development Revenue) ± | | | 2.60 | | | | 3-1-2034 | | | | 5,000,000 | | | | 4,960,750 | |
Montgomery County PA IDA Refunding Peco Energy Company Project Series A (Industrial Development Revenue) ± | | | 2.55 | | | | 6-1-2029 | | | | 12,910,000 | | | | 12,831,120 | |
North Pennsylvania Water Authority (Water & Sewer Revenue) ± | | | 0.76 | | | | 11-1-2018 | | | | 700,000 | | | | 695,856 | |
North Pennsylvania Water Authority (Water & Sewer Revenue) ± | | | 0.82 | | | | 11-1-2019 | | | | 1,000,000 | | | | 989,190 | |
North Pennsylvania Water Authority (Water & Sewer Revenue) ± | | | 0.91 | | | | 11-1-2024 | | | | 5,000,000 | | | | 4,958,400 | |
Pennsylvania EDFA Solid Waste Disposal Republic Services Incorporated Project (Resource Recovery Revenue) ± | | | 1.15 | | | | 6-1-2044 | | | | 10,000,000 | | | | 10,000,000 | |
| | | | | | |
| Portfolio of investments—December 31, 2016 (unaudited) | | Wells Fargo Ultra Short-Term Municipal Income Fund | | | 19 | |
| | | | | | | | | | | | | | | | |
| Security name | | Interest rate | | | Maturity date | | | Principal | | | Value | |
| | | | |
| Pennsylvania (continued) | | | | | | | | | | | | | | | | |
Pennsylvania HEFA Association of Independent Colleges and Universities Financing Program York College of Pennsylvania Project Series T-2 (Education Revenue) ± | | | 1.35 | % | | | 5-1-2034 | | | $ | 2,565,000 | | | $ | 2,557,433 | |
Pennsylvania HEFA Independent Colleges Series I4 (Education Revenue) ± | | | 1.50 | | | | 11-1-2031 | | | | 5,800,000 | | | | 5,798,956 | |
Pennsylvania HEFA Wilkes University Project Series A (Education Revenue) | | | 4.00 | | | | 3-1-2020 | | | | 735,000 | | | | 765,951 | |
Pennsylvania HEFA Wilkes University Project Series A (Education Revenue) | | | 5.00 | | | | 3-1-2021 | | | | 500,000 | | | | 541,630 | |
Pennsylvania HEFAR Association of Independent Colleges and Universities of Pennsylvania Financing Program Messiah College Project Series I-3 (Education Revenue) ± | | | 1.20 | | | | 11-1-2031 | | | | 130,000 | | | | 129,715 | |
Pennsylvania HEFAR Association of Independent Colleges and Universities of Pennsylvania Financing Program Mount Aloysius College Project Series R-1 (Education Revenue) ± | | | 1.25 | | | | 11-1-2041 | | | | 1,500,000 | | | | 1,496,985 | |
Pennsylvania HEFAR Thomas Jefferson University Series B (Education Revenue) ø | | | 1.05 | | | | 9-1-2045 | | | | 12,075,000 | | | | 12,075,000 | |
Pennsylvania HFA Courtyard Preservation Project (Housing Revenue) ± | | | 1.85 | | | | 12-1-2019 | | | | 17,000,000 | | | | 17,006,800 | |
Pennsylvania HFA Daniel Flood Tower Apartments Series CC (Housing Revenue) ± | | | 0.75 | | | | 1-1-2018 | | | | 3,250,000 | | | | 3,249,968 | |
Pennsylvania Public School Building Authority The School District of Pennsylvania Project (Miscellaneous Revenue) | | | 5.00 | | | | 4-1-2017 | | | | 3,500,000 | | | | 3,530,660 | |
Pennsylvania Series 2 (GO Revenue) | | | 5.00 | | | | 4-15-2017 | | | | 1,250,000 | | | | 1,265,038 | |
Pennsylvania Turnpike Commission Series A-2 (Transportation Revenue) ± | | | 1.13 | | | | 12-1-2018 | | | | 5,000,000 | | | | 4,969,550 | |
Pennsylvania Turnpike Commission Series B-1 (Transportation Revenue) ± | | | 1.32 | | | | 12-1-2018 | | | | 19,000,000 | | | | 18,991,830 | |
Philadelphia PA Public School Building Authority Series A (Miscellaneous Revenue) | | | 5.00 | | | | 6-1-2017 | | | | 2,000,000 | | | | 2,028,660 | |
Philadelphia PA School District Refunding Bond Series C (GO Revenue) | | | 5.00 | | | | 9-1-2018 | | | | 1,880,000 | | | | 1,964,280 | |
Philadelphia PA School District Series C (GO Revenue) | | | 5.00 | | | | 9-1-2018 | | | | 250,000 | | | | 261,208 | |
Philadelphia PA School District Series D (GO Revenue) | | | 5.00 | | | | 9-1-2017 | | | | 750,000 | | | | 766,365 | |
Philadelphia PA School District Series D (GO Revenue) | | | 5.00 | | | | 9-1-2017 | | | | 6,050,000 | | | | 6,175,901 | |
Philadelphia PA School District Series D (GO Revenue) | | | 5.00 | | | | 9-1-2019 | | | | 1,250,000 | | | | 1,328,925 | |
Philadelphia PA School District Series E (GO Revenue) | | | 5.00 | | | | 9-1-2018 | | | | 145,000 | | | | 151,135 | |
Philadelphia PA School District Series F (GO Revenue) | | | 5.00 | | | | 9-1-2019 | | | | 1,000,000 | | | | 1,063,140 | |
Scranton PA RAN (Tax Revenue) %% | | | 2.50 | | | | 12-15-2017 | | | | 3,000,000 | | | | 2,998,890 | |
University Area Joint Authority Pennsylvania Refunding Bond (Water & Sewer Revenue) ± | | | 1.12 | | | | 11-1-2028 | | | | 3,300,000 | | | | 3,294,357 | |
Upper Darby PA School District (GO Revenue) | | | 3.00 | | | | 5-1-2017 | | | | 500,000 | | | | 503,045 | |
Upper Darby PA School District (GO Revenue) | | | 4.00 | | | | 5-1-2018 | | | | 700,000 | | | | 722,995 | |
Warwick PA School District (GO Revenue) | | | 3.00 | | | | 2-15-2017 | | | | 1,000,000 | | | | 1,002,510 | |
Warwick PA School District (GO Revenue) | | | 4.00 | | | | 2-15-2018 | | | | 1,250,000 | | | | 1,287,850 | |
Warwick PA School District (GO Revenue) | | | 4.00 | | | | 2-15-2019 | | | | 1,025,000 | | | | 1,077,060 | |
Washington County PA Washington Hospital Project (Health Revenue) | | | 4.00 | | | | 7-1-2017 | | | | 1,085,000 | | | | 1,097,326 | |
Westmoreland County PA IDA Excela Health Project (Health Revenue) | | | 4.00 | | | | 7-1-2017 | | | | 1,650,000 | | | | 1,666,764 | |
Westmoreland County PA IDA Excela Health Project (Health Revenue) | | | 5.00 | | | | 7-1-2018 | | | | 1,650,000 | | | | 1,717,419 | |
York County PA Refunding Bond (GO Revenue) ± | | | 0.72 | | | | 6-1-2033 | | | | 9,445,000 | | | | 9,439,522 | |
| | | | |
| | | | | | | | | | | | | | | 205,990,703 | |
| | | | | | | | | | | | | | | | |
| | | | |
| Puerto Rico: 0.03% | | | | | | | | | | | | | | | | |
Puerto Rico Electric Power Authority Series TT (Utilities Revenue, AGM Insured) | | | 5.00 | | | | 7-1-2017 | | | | 550,000 | | | | 558,047 | |
Puerto Rico Highway & Transportation Authority Series E (Transportation Revenue, AGM Insured) | | | 5.50 | | | | 7-1-2017 | | | | 575,000 | | | | 584,787 | |
Puerto Rico Public Improvement Series A (GO Revenue, AGC Insured) | | | 5.00 | | | | 7-1-2017 | | | | 250,000 | | | | 253,658 | |
| | | | |
| | | | | | | | | | | | | | | 1,396,492 | |
| | | | | | | | | | | | | | | | |
| | | | |
| 20 | | Wells Fargo Ultra Short-Term Municipal Income Fund | | Portfolio of investments—December 31, 2016 (unaudited) |
| | | | | | | | | | | | | | | | |
| Security name | | Interest rate | | | Maturity date | | | Principal | | | Value | |
| | | | |
| Rhode Island: 0.24% | | | | | | | | | | | | | | | | |
Providence RI Redevelopment Agency Public Safety Building Project Series A (Miscellaneous Revenue) | | | 4.00 | % | | | 4-1-2018 | | | $ | 3,025,000 | | | $ | 3,106,433 | |
Providence RI Series A (GO Revenue) | | | 5.00 | | | | 7-15-2017 | | | | 1,400,000 | | | | 1,426,334 | |
Rhode Island HEFA Refunding Bond Providence Financing Program (Education Revenue, AGM Insured) | | | 3.00 | | | | 5-15-2017 | | | | 1,815,000 | | | | 1,826,507 | |
Rhode Island HEFA Refunding Bond Providence Financing Program (Education Revenue, AGM Insured) | | | 3.00 | | | | 5-15-2018 | | | | 1,535,000 | | | | 1,564,073 | |
Rhode Island Housing and Mortgage Finance Corporation Series 66-B (Housing Revenue) ± | | | 1.42 | | | | 10-1-2045 | | | | 4,400,000 | | | | 4,398,064 | |
Rhode Island Student Loan Authority AMT Program Senior Series A (Education Revenue) | | | 5.00 | | | | 12-1-2019 | | | | 750,000 | | | | 802,268 | |
| | | | |
| | | | | | | | | | | | | | | 13,123,679 | |
| | | | | | | | | | | | | | | | |
| | | | |
| South Carolina: 0.74% | | | | | | | | | | | | | | | | |
Berkeley County SC IDA Nucor Corporation Project (Industrial Development Revenue) ø | | | 1.00 | | | | 4-1-2030 | | | | 5,000,000 | | | | 5,000,000 | |
Columbia SC Waterworks (Water & Sewer Revenue, Sumitomo Mitsui Banking LOC) ø | | | 0.74 | | | | 2-1-2038 | | | | 8,075,000 | | | | 8,075,000 | |
Jasper County SC Jasper County School Project (Miscellaneous Revenue) | | | 3.00 | | | | 4-1-2017 | | | | 600,000 | | | | 601,752 | |
Jasper County SC Jasper County School Project (Miscellaneous Revenue) | | | 3.00 | | | | 4-1-2018 | | | | 500,000 | | | | 502,010 | |
Jasper County SC Jasper County School Project (Miscellaneous Revenue) | | | 4.00 | | | | 4-1-2019 | | | | 500,000 | | | | 513,055 | |
Piedmont SC Municipal Power Agency Series A-3 (Utilities Revenue) | | | 5.25 | | | | 1-1-2019 | | | | 5,720,000 | | | | 5,936,788 | |
South Carolina HFA West Greenville Project (Housing Revenue) ± | | | 1.00 | | | | 4-1-2019 | | | | 7,600,000 | | | | 7,566,104 | |
South Carolina Housing Finance & Development Authority Spartanburg 7 Project Series A (Housing Revenue) ± | | | 1.05 | | | | 1-1-2019 | | | | 2,575,000 | | | | 2,572,296 | |
South Carolina Housing Finance and Development Authority Waters at Longcreek (Housing Revenue) ± | | | 1.60 | | | | 12-1-2019 | | | | 9,075,000 | | | | 9,081,171 | |
| | | | |
| | | | | | | | | | | | | | | 39,848,176 | |
| | | | | | | | | | | | | | | | |
| | | | |
| Tennessee: 1.81% | | | | | | | | | | | | | | | | |
Anderson County TN HEFA Gate Manor Apartments Project (Housing Revenue) ± | | | 0.90 | | | | 8-1-2019 | | | | 4,100,000 | | | | 4,083,518 | |
Knoxville TN Industrial Development Board Collateralized Housing Golden Age Retirement Village Project (Housing Revenue, GNMA Insured) | | | 0.85 | | | | 12-1-2017 | | | | 5,900,000 | | | | 5,886,312 | |
Memphis TN HEFA Ashland Lakes II Apartments Project Series A (Housing Revenue, U.S. Bank NA LOC) ø | | | 0.74 | | | | 5-1-2043 | | | | 11,500,000 | | | | 11,500,000 | |
Metropolitan Government of Nashville & Davidson County TN Industrial Development Board (Resource Recovery Revenue) ± | | | 1.50 | | | | 8-1-2031 | | | | 7,500,000 | | | | 7,490,925 | |
Nashville TN HEFA The Paddock at Grandview Apartments Project (Housing Revenue) | | | 0.95 | | | | 5-1-2018 | | | | 16,500,000 | | | | 16,417,335 | |
Sevier County TN Health Educational and Housing Facility Board Hallmark Rural Housing Portfolio (Housing Revenue) ± | | | 0.85 | | | | 9-1-2017 | | | | 2,874,000 | | | | 2,873,109 | |
Shelby County TN Health Educational & Housing Facilities Board Methodist Le Bonheur Series B (Health Revenue, AGM Insured, U.S. Bank NA SPA) ø | | | 0.72 | | | | 6-1-2042 | | | | 48,000,000 | | | | 48,000,000 | |
Tennessee Energy Acquisition Corporation Series A (Utilities Revenue) | | | 5.25 | | | | 9-1-2017 | | | | 1,430,000 | | | | 1,463,319 | |
| | | | |
| | | | | | | | | | | | | | | 97,714,518 | |
| | | | | | | | | | | | | | | | |
| | | | |
| Texas: 8.50% | | | | | | | | | | | | | | | | |
Austin TX Affordable Housing Public Facility Corporation Pathways at Georgian Manor (Housing Revenue) ± | | | 1.15 | | | | 11-1-2019 | | | | 14,040,000 | | | | 13,981,594 | |
Clear Creek TX Independent School District (GO Revenue) ± | | | 3.00 | | | | 2-15-2035 | | | | 4,425,000 | | | | 4,476,286 | |
Dallas TX Independent High School District (GO Revenue) ± | | | 1.50 | | | | 2-15-2034 | | | | 4,200,000 | | | | 4,202,520 | |
| | | | | | |
| Portfolio of investments—December 31, 2016 (unaudited) | | Wells Fargo Ultra Short-Term Municipal Income Fund | | | 21 | |
| | | | | | | | | | | | | | | | |
| Security name | | Interest rate | | | Maturity date | | | Principal | | | Value | |
| | | | |
| Texas (continued) | | | | | | | | | | | | | | | | |
Donna TX International Toll Bridge (Transportation Revenue) | | | 6.25 | % | | | 2-15-2037 | | | $ | 21,850,000 | | | $ | 23,012,857 | |
El Paso TX Public Facilities Corporation Rental Assistance Demonstration Program (Housing Revenue) ± | | | 1.00 | | | | 10-1-2018 | | | | 9,600,000 | | | | 9,573,408 | |
Galveston TX Dickinson Independent High School District (GO Revenue) ± | | | 1.05 | | | | 8-1-2037 | | | | 4,250,000 | | | | 4,246,345 | |
Harris County TX Cypress-Fairbanks Independent High School Series 2014B-2 (GO Revenue) ± | | | 3.00 | | | | 2-15-2040 | | | | 960,000 | | | | 972,077 | |
Harris County TX Cypress-Fairbanks Independent High School Series 2014B-3 (GO Revenue) ± | | | 1.05 | | | | 2-15-2044 | | | | 12,000,000 | | | | 11,973,600 | |
Harris County TX Cypress-Fairbanks Independent School District Series B-1 (GO Revenue) ± | | | 0.90 | | | | 2-15-2040 | | | | 12,180,000 | | | | 12,035,302 | |
Harris County TX Houston Independent School District Series B (GO Revenue) ± | | | 0.95 | | | | 6-1-2035 | | | | 9,150,000 | | | | 9,142,680 | |
Houston TX Hotel Occupancy Unrefunded Series B (Tax Revenue) | | | 5.00 | | | | 9-1-2018 | | | | 285,000 | | | | 285,846 | |
Midland County TX PFFA Compass Pointe Apartments (Housing Revenue) | | | 1.25 | | | | 3-1-2018 | | | | 7,000,000 | | | | 6,988,730 | |
North East TX Independent School District Series A (GO Revenue) ± | | | 2.00 | | | | 8-1-2042 | | | | 25,885,000 | | | | 26,126,766 | |
North TX Tollway Authority Series F (Transportation Revenue) | | | 5.75 | | | | 1-1-2033 | | | | 14,950,000 | | | | 15,638,298 | |
North TX Tollway Authority Series F (Transportation Revenue) | | | 5.75 | | | | 1-1-2038 | | | | 32,000,000 | | | | 33,473,280 | |
Northside TX Independent School District Building Project (GO Revenue) ± | | | 2.00 | | | | 8-1-2044 | | | | 2,610,000 | | | | 2,632,211 | |
Northside TX Independent School District Building Project (GO Revenue) ± | | | 2.13 | | | | 8-1-2040 | | | | 1,915,000 | | | | 1,915,651 | |
Northside TX Independent School District Series A (GO Revenue) ± | | | 2.00 | | | | 6-1-2039 | | | | 27,715,000 | | | | 27,962,495 | |
Odessa TX Housing Finance Corporation 87th Street Apartments Project (Housing Revenue) ± | | | 1.43 | | | | 12-1-2020 | | | | 8,000,000 | | | | 7,995,120 | |
Port Arthur TX Navigation District Jefferson County Environmental Facilities Motiva Enterprises LLC Project Series B (Resource Recovery Revenue) ø | | | 0.85 | | | | 12-1-2039 | | | | 10,000,000 | | | | 10,000,000 | |
Port Arthur TX Navigation District Jefferson County Environmental Facilities Motiva Enterprises LLC Project Series B (Resource Recovery Revenue) ø | | | 0.85 | | | | 4-1-2040 | | | | 26,530,000 | | | | 26,530,000 | |
Port Arthur TX Navigation District Jefferson County Environmental Facilities Motiva Enterprises LLC Project Series D (Resource Recovery Revenue) ø | | | 0.85 | | | | 11-1-2040 | | | | 21,600,000 | | | | 21,600,000 | |
Port Arthur TX Navigation District Jefferson County Environmental Facilities Motiva Enterprises LLC Project Series D (Resource Recovery Revenue) ø | | | 0.85 | | | | 11-1-2040 | | | | 7,000,000 | | | | 7,000,000 | |
Richardson TX Independent School District Series A (GO Revenue) | | | 5.00 | | | | 2-15-2017 | | | | 3,835,000 | | | | 3,855,095 | |
San Antonio TX Housing Trust Finance Corporation Freedom Hills Ranch Apartments Project (Housing Revenue) | | | 1.00 | | | | 1-1-2018 | | | | 12,650,000 | | | | 12,606,105 | |
San Antonio TX Series A (Utilities Revenue) ± | | | 2.25 | | | | 2-1-2033 | | | | 20,000,000 | | | | 20,147,400 | |
San Antonio TX Series C (Utilities Revenue) ± | | | 2.00 | | | | 12-1-2027 | | | | 3,000,000 | | | | 3,020,370 | |
Tarrant County TX Cultural Education Facilities Finance Corporation Edgemere Project Refunding Series A (Health Revenue) | | | 3.00 | | | | 11-15-2017 | | | | 485,000 | | | | 490,510 | |
Tarrant County TX Cultural Education Facilities Finance Corporation Edgemere Project Refunding Series A (Health Revenue) | | | 4.00 | | | | 11-15-2018 | | | | 500,000 | | | | 517,650 | |
Tarrant County TX Cultural Education Facilities Finance Corporation Edgemere Project Refunding Series A (Health Revenue) | | | 4.00 | | | | 11-15-2019 | | | | 510,000 | | | | 532,348 | |
Tarrant County TX Cultural Education Facilities Finance Corporation Edgemere Project Series B (Health Revenue) | | | 3.00 | | | | 11-15-2017 | | | | 665,000 | | | | 672,907 | |
Tarrant County TX Cultural Education Facilities Finance Corporation Edgemere Project Series B (Health Revenue) | | | 4.00 | | | | 11-15-2018 | | | | 500,000 | | | | 518,515 | |
Tarrant County TX Cultural Education Facilities Finance Corporation Edgemere Project Series B (Health Revenue) | | | 4.00 | | | | 11-15-2019 | | | | 710,000 | | | | 742,120 | |
Tarrant County TX Cultural Education Facilities Finance Corporation Series 2973 (Health Revenue, Morgan Stanley Bank LIQ) ø144A | | | 0.95 | | | | 11-15-2029 | | | | 30,400,000 | | | | 30,400,000 | |
Tender Option Bond Trust Receipts/Certificates Floaters Series 2016-XG0058 (Health Revenue, Deutsche Bank LIQ) ø144A | | | 0.62 | | | | 8-15-2027 | | | | 4,985,000 | | | | 4,985,000 | |
Tennessee Energy Acquisition Corporation Series C (Utilities Revenue) | | | 5.00 | | | | 2-1-2017 | | | | 6,925,000 | | | | 6,945,221 | |
| | | | |
| 22 | | Wells Fargo Ultra Short-Term Municipal Income Fund | | Portfolio of investments—December 31, 2016 (unaudited) |
| | | | | | | | | | | | | | | | |
| Security name | | Interest rate | | | Maturity date | | | Principal | | | Value | |
| | | | |
| Texas (continued) | | | | | | | | | | | | | | | | |
Texas Affordable Housing Corporation Woodside Village Project (Housing Revenue) ± | | | 1.00 | % | | | 12-1-2018 | | | $ | 5,750,000 | | | $ | 5,744,308 | |
Texas Department of Housing and Community Affairs Good Samaritan Towers (Housing Revenue) | | | 0.95 | | | | 9-1-2017 | | | | 5,620,000 | | | | 5,610,109 | |
Texas Municipal Gas Acquisition & Supply Corporation II Series A (Utilities Revenue, JPMorgan Chase & Company Guaranteed) ± | | | 1.27 | | | | 9-15-2017 | | | | 8,530,000 | | | | 8,541,174 | |
Texas Municipal Gas Acquisition & Supply Corporation II Series B (Utilities Revenue, JPMorgan Chase & Company Guaranteed) ± | | | 1.19 | | | | 9-15-2017 | | | | 22,425,000 | | | | 22,347,634 | |
Texas Municipal Gas Acquisition & Supply Corporation Senior Lien Series B (Utilities Revenue) ± | | | 1.12 | | | | 12-15-2017 | | | | 1,500,000 | | | | 1,496,760 | |
Texas Municipal Gas Acquisition & Supply Corporation Senior Lien Series D (Utilities Revenue) | | | 5.63 | | | | 12-15-2017 | | | | 4,050,000 | | | | 4,170,245 | |
Texas New Hope Cultural Education Facilities Finance Corporation MRC Crestview Project (Health Revenue) | | | 1.50 | | | | 11-15-2017 | | | | 225,000 | | | | 222,210 | |
Texas New Hope Cultural Education Facilities Finance Corporation MRC Crestview Project (Health Revenue) | | | 1.75 | | | | 11-15-2018 | | | | 500,000 | | | | 487,500 | |
Texas New Hope Cultural Education Facilities Finance Corporation MRC Crestview Project (Health Revenue) | | | 2.00 | | | | 11-15-2019 | | | | 345,000 | | | | 332,880 | |
Texas Public Finance Authority Unemployment Compensation Series B (Miscellaneous Revenue) | | | 4.00 | | | | 7-1-2017 | | | | 11,500,000 | | | | 11,625,465 | |
Texas Tollway Authority Series C (Transportation Revenue) ± | | | 1.95 | | | | 1-1-2038 | | | | 1,535,000 | | | | 1,539,145 | |
Texas Tollway Authority Series D (Transportation Revenue, Royal Bank of Canada LOC) ø | | | 0.73 | | | | 1-1-2049 | | | | 2,000,000 | | | | 2,000,000 | |
Texas Transportation Commission State Highway Fund Floating 1st Tier Series B (Tax Revenue) ± | | | 1.08 | | | | 4-1-2032 | | | | 24,000,000 | | | | 23,999,040 | |
Williamson County TX (GO Revenue) ± | | | 1.45 | | | | 8-15-2034 | | | | 2,600,000 | | | | 2,598,076 | |
| | | | |
| | | | | | | | | | | | | | | 457,912,853 | |
| | | | | | | | | | | | | | | | |
| | | | |
| Utah: 0.24% | | | | | | | | | | | | | | | | |
Utah County UH IHC Health Services Series B (Health Revenue, U.S. Bank NA SPA) ø | | | 0.71 | | | | 5-15-2035 | | | | 12,725,000 | | | | 12,725,000 | |
| | | | | | | | | | | | | | | | |
| | | | |
| Vermont: 0.03% | | | | | | | | | | | | | | | | |
Burlington VT Airport Refunding Series 2012B (Airport Revenue) | | | 3.50 | | | | 7-1-2018 | | | | 1,560,000 | | | | 1,568,174 | |
| | | | | | | | | | | | | | | | |
| | | | |
| Virgin Islands: 0.17% | | | | | | | | | | | | | | | | |
Virgin Islands PFA Senior Lien Matching Fund Loan Series B (Tobacco Revenue) | | | 5.00 | | | | 10-1-2017 | | | | 9,450,000 | | | | 9,434,786 | |
| | | | | | | | | | | | | | | | |
| | | | |
| Virginia: 0.78% | | | | | | | | | | | | | | | | |
Bedford VA American Municipal Power Incorporated (Utilities Revenue) | | | 1.25 | | | | 3-28-2017 | | | | 4,385,000 | | | | 4,384,956 | |
Chesapeake VA EDA Electric and Power Company Series 2008A (Utilities Revenue) ± | | | 1.75 | | | | 2-1-2032 | | | | 30,000,000 | | | | 30,033,300 | |
Gloucester County VA EDA Solid Waste Disposal Waste Management Services Series A (Resource Recovery Revenue) ± | | | 1.60 | | | | 9-1-2038 | | | | 4,000,000 | | | | 4,001,240 | |
Greater Richmond VA Convention Center Authority (Tax Revenue) | | | 5.00 | | | | 6-15-2017 | | | | 1,250,000 | | | | 1,272,300 | |
Greater Richmond VA Convention Center Authority (Tax Revenue) | | | 5.00 | | | | 6-15-2018 | | | | 1,500,000 | | | | 1,577,985 | |
Virginia Housing Development Authority Series B (Housing Revenue) | | | 2.25 | | | | 9-1-2017 | | | | 500,000 | | | | 503,440 | |
| | | | |
| | | | | | | | | | | | | | | 41,773,221 | |
| | | | | | | | | | | | | | | | |
| | | | |
| Washington: 0.40% | | | | | | | | | | | | | | | | |
Grant County WA Public Utility District No. 2 Series K (Utilities Revenue) ± | | | 0.88 | | | | 1-1-2044 | | | | 4,000,000 | | | | 3,990,120 | |
King County WA Junior Lien Series A (Water & Sewer Revenue, Landesbank Hessen-Thüringen LOC) ø | | | 0.73 | | | | 1-1-2032 | | | | 2,000,000 | | | | 2,000,000 | |
Washington HCFR Series XF2035 (Health Revenue, Morgan Stanley Bank LIQ) ø144A | | | 1.07 | | | | 10-1-2036 | | | | 7,655,000 | | | | 7,655,000 | |
| | | | | | |
| Portfolio of investments—December 31, 2016 (unaudited) | | Wells Fargo Ultra Short-Term Municipal Income Fund | | | 23 | |
| | | | | | | | | | | | | | | | |
| Security name | | Interest rate | | | Maturity date | | | Principal | | | Value | |
| | | | |
| Washington (continued) | | | | | | | | | | | | | | | | |
Washington HFA Multicare Health System Series D (Health Revenue, Barclays Bank plc LOC) ø | | | 0.74 | % | | | 8-15-2041 | | | $ | 490,000 | | | $ | 490,000 | |
Washington Housing Finance Commission Hopesource Portfolio Projects (Housing Revenue) ± | | | 0.65 | | | | 4-1-2019 | | | | 7,390,000 | | | | 7,381,428 | |
| | | | |
| | | | | | | | | | | | | | | 21,516,548 | |
| | | | | | | | | | | | | | | | |
| | | | |
| West Virginia: 0.90% | | | | | | | | | | | | | | | | |
Mason County WV PCR Appalachian Power Company Series L (Industrial Development Revenue) ± | | | 1.63 | | | | 10-1-2022 | | | | 16,400,000 | | | | 16,318,164 | |
West Virginia EDA Appalachian Power Company Mountaineer Project Series A (Utilities Revenue) ø | | | 1.00 | | | | 2-1-2036 | | | | 25,000,000 | | | | 25,000,000 | |
West Virginia EDA Solid Waste Disposal Appalachian Power Company Series B (Utilities Revenue, Sumitomo Mitsui Banking LOC) ø | | | 0.75 | | | | 12-1-2042 | | | | 6,950,000 | | | | 6,950,000 | |
| | | | |
| | | | | | | | | | | | | | | 48,268,164 | |
| | | | | | | | | | | | | | | | |
| | | | |
| Wisconsin: 0.86% | | | | | | | | | | | | | | | | |
Ellsworth WI Community School District (Miscellaneous Revenue) | | | 2.00 | | | | 10-1-2017 | | | | 4,235,000 | | | | 4,238,022 | |
Milwaukee County WI Series B (Airport Revenue) | | | 4.00 | | | | 12-1-2017 | | | | 385,000 | | | | 394,121 | |
Sun Prairie WI BAN (Miscellaneous Revenue) %% | | | 2.00 | | | | 6-1-2017 | | | | 15,500,000 | | | | 15,532,240 | |
Tender Option Bond Trust Receipts/Certificates Floaters Series 2015-XF0127 (Health Revenue, JPMorgan Chase & Company LIQ) ø144A | | | 0.92 | | | | 10-1-2020 | | | | 4,875,000 | | | | 4,875,000 | |
Tender Option Bond Trust Receipts/Certificates Floaters Series 2015-XF1028 (Health Revenue, Deutsche Bank LIQ) ø144A | | | 0.92 | | | | 11-15-2044 | | | | 10,880,000 | | | | 10,880,000 | |
Waukesha WI Housing Preservation Corporation (Housing Revenue, Johnson Bank LOC) ø | | | 1.80 | | | | 12-1-2042 | | | | 4,145,000 | | | | 4,145,000 | |
Wisconsin HEFA Ascension Senior Credit Group Series B-5 (Health Revenue) ± | | | 1.38 | | | | 11-15-2038 | | | | 1,535,000 | | | | 1,508,782 | |
Wisconsin HEFA Aurora Health Care Series B-1 (Health Revenue) ± | | | 1.25 | | | | 8-15-2025 | | | | 3,540,000 | | | | 3,538,796 | |
Wisconsin HEFA Bellin Memorial Hospital Incorporated (Health Revenue) | | | 3.00 | | | | 12-1-2017 | | | | 200,000 | | | | 203,148 | |
Wisconsin HEFA Bellin Memorial Hospital Incorporated (Health Revenue) | | | 3.00 | | | | 12-1-2018 | | | | 500,000 | | | | 513,765 | |
Wisconsin Public Finance Authority Guilford College (Education Revenue) | | | 5.00 | | | | 1-1-2020 | | | | 625,000 | | | | 666,756 | |
| | | | |
| | | | | | | | | | | | | | | 46,495,630 | |
| | | | | | | | | | | | | | | | |
| | | | |
| Wyoming: 0.48% | | | | | | | | | | | | | | | | |
Sweetwater County WY PCR Refunding Bond PacifiCorp Project Series A (Industrial Development Revenue) ø | | | 0.85 | | | | 1-1-2017 | | | | 26,000,000 | | | | 26,000,000 | |
| | | | | | | | | | | | | | | | |
| | | | |
Total Municipal Obligations (Cost $5,142,914,809) | | | | | | | | | | | | | | | 5,104,835,011 | |
| | | | | | | | | | | | | | | | |
| | | | |
| Other: 4.25% | | | | | | | | | | | | | | | | |
Branch Banking & Trust Municipal Investment Trust Various States Class A ±144A§(a) | | | 1.23 | | | | 6-30-2017 | | | | 10,440,000 | | | | 10,436,242 | |
Branch Banking & Trust Municipal Investment Trust Various States Class B ±144A§ | | | 1.38 | | | | 12-31-2017 | | | | 33,725,000 | | | | 33,725,337 | |
Branch Banking & Trust Municipal Investment Trust Various States Class C ±144A§ | | | 1.78 | | | | 12-31-2019 | | | | 9,600,000 | | | | 9,598,656 | |
Eaton Vance California Municipal Income Trust Preferred Shares ±144A§ | | | 2.22 | | | | 9-1-2019 | | | | 16,975,000 | | | | 16,963,457 | |
Eaton Vance Massachusetts Municipal Bond Fund Institutional MuniFund Term Preferred Shares ±144A§ | | | 1.73 | | | | 7-1-2019 | | | | 6,475,000 | | | | 6,459,590 | |
Eaton Vance Municipal Bond Fund 2 Institutional MuniFund Term Preferred Shares ±144A§ | | | 1.71 | | | | 7-1-2019 | | | | 9,950,000 | | | | 9,938,359 | |
Eaton Vance Pennsylvania Municipal Bond Fund Institutional MuniFund Term Preferred Shares ±144A | | | 1.56 | | | | 7-1-2019 | | | | 6,000,000 | | | | 5,985,720 | |
Nuveen AMT-Free Quality Municipal Income Fund Preferred Shares ±144A§ | | | 0.81 | | | | 6-1-2040 | | | | 35,000,000 | | | | 35,000,000 | |
| | | | |
| 24 | | Wells Fargo Ultra Short-Term Municipal Income Fund | | Portfolio of investments—December 31, 2016 (unaudited) |
| | | | | | | | | | | | | | | | |
| Security name | | Interest rate | | | Maturity date | | | Principal | | | Value | |
| | | | |
| Other (continued) | | | | | | | | | | | | | | | | |
Nuveen Enhanced Municipal Credit Opportunities Fund Institutional MuniFund Term Preferred Shares ±144A | | | 1.47 | % | | | 10-1-2017 | | | $ | 59,000,000 | | | $ | 58,786,420 | |
Nuveen New York AMT-Free Municipal Income Fund Institutional MuniFund Term Preferred Shares ±144A§ | | | 1.17 | | | | 10-1-2017 | | | | 17,000,000 | | | | 16,941,010 | |
Nuveen Texas Quality Municipal Income Fund Institutional MuniFund Term Preferred Shares ±144A | | | 1.56 | | | | 11-1-2018 | | | | 25,000,000 | | | | 24,998,000 | |
| | | | |
Total Other (Cost $229,141,648) | | | | | | | | | | | | | | | 228,832,791 | |
| | | | | | | | | | | | | | | | |
| | | | |
| | | Yield | | | | | | Shares | | | | |
| Short-Term Investments: 1.88% | | | | | | | | | | | | | | | | |
| | | | |
| Investment Companies: 1.87% | | | | | | | | | | | | | | | | |
Wells Fargo Municipal Cash Management Fund Institutional Class (l)(u)## | | | 0.67 | | | | | | | | 100,839,385 | | | | 100,899,889 | |
| | | | | | | | | | | | | | | | |
| | | | |
| | | | | | | | | Principal | | | | |
| U.S. Treasury Securities: 0.01% | | | | | | | | | | | | | | | | |
U.S. Treasury Bill (z) | | | 0.50 | | | | 3-16-2017 | | | $ | 250,000 | | | | 249,750 | |
| | | | | | | | | | | | | | | | |
| | | | |
Total Short-Term Investments (Cost $101,131,856) | | | | | | | | | | | | | | | 101,149,639 | |
| | | | | | | | | | | | | | | | |
| | | | | | | | |
| Total investments in securities (Cost $5,478,121,538) * | | | 100.99 | % | | | 5,439,709,985 | |
Other assets and liabilities, net | | | (0.99 | ) | | | 53,119,183 | |
| | | | | | | | |
| Total net assets | | | 100.00 | % | | $ | 5,386,590,802 | |
| | | | | | | | |
| ± | Variable rate investment. The rate shown is the rate in effect at period end. |
| (m) | The security is an auction-rate security which has an interest rate that resets at predetermined short-term intervals through a Dutch auction. The rate shown is the rate in effect at period end. |
| ø | Variable rate demand notes are subject to a demand feature which reduces the effective maturity. The maturity date shown represents the final maturity date of the security. The interest rate is determined and reset by the issuer daily, weekly, or monthly depending upon the terms of the security. The rate shown is the rate in effect at period end. |
| 144A | The security may be resold in transactions exempt from registration, normally to qualified institutional buyers, pursuant to Rule 144A under the Securities Act of 1933. |
| (n) | The auction to set the interest rate on the security failed at period end due to insufficient investor interest. A failed auction does not itself cause a default. |
| ¤ | The security is issued in zero coupon form with no periodic interest payments. |
| %% | The security is issued on a when-issued basis. |
| § | The security is subject to a demand feature which reduces the effective maturity. |
| (a) | The security is fair valued in accordance with procedures approved by the Board of Trustees. |
| (l) | The issuer of the security is an affiliated person of the Fund as defined in the Investment Company Act of 1940. |
| (u) | The rate represents the 7-day annualized yield at period end. |
| ## | All or a portion of this security is segregated for when-issued securities. |
| (z) | Zero coupon security. The rate represents the current yield to maturity. |
| * | Cost for federal income tax purposes is $5,478,051,225 and unrealized gains (losses) consists of: |
| | | | |
Gross unrealized gains | | $ | 2,597,840 | |
Gross unrealized losses | | | (40,939,080 | ) |
| | | | |
Net unrealized losses | | $ | (38,341,240 | ) |
ITEM 7. DISCLOSURE OF PROXY VOTING POLICIES AND PROCEDURES FOR CLOSED-END MANAGEMENT INVESTMENT COMPANIES
Not applicable.
ITEM 8. PORTFOLIO MANAGERS OF CLOSED-END MANAGEMENT INVESTMENT COMPANIES
Not applicable.
ITEM 9. PURCHASES OF EQUITY SECURITIES BY CLOSED-END MANAGEMEENT INVESTMENT COMPANY AND AFFILIATED PURCHASERS
Not applicable.
ITEM 10. SUBMISSION OF MATTERS TO A VOTE OF SECURITY HOLDERS
There have been no material changes to the procedures by which shareholders may recommend nominees to the registrant’s Board of Trustees that have been implemented since the registrant’s last provided disclosure in response to the requirements of this Item.
ITEM 11. CONTROLS AND PROCEDURES
(a) The President and Treasurer have concluded that the Wells Fargo Funds Trust (the “Trust”) disclosure controls and procedures (as defined in Rule 30a-3(c) under the Investment Company Act of 1940) provide reasonable assurances that material information relating to the Trust is made known to them by the appropriate persons, based on their evaluation of these controls and procedures as of a date within 90 days of the filing of this report.
(b) There were no significant changes in the Trust’s internal controls over financial reporting (as defined in Rule 30a-3(d) under the Investment Company Act of 1940) that occurred during the second fiscal quarter of the period covered by this report that materially affected, or is reasonably likely to materially affect, the registrant’s internal control over financial reporting.
ITEM 12. EXHIBITS
(a)(1) Not applicable.
(a)(2) Certification pursuant to Rule 30a-2(a) under the Investment Company Act of 1940 (17 CFR 270.30a-2(a)) is filed and attached hereto as Exhibit 99.CERT.
(a)(3) Not applicable.
(b) Certification pursuant to Rule 30a-2(b) under the Investment Company Act of 1940 (17 CFR 270.30a-2(b)) is filed and attached hereto as Exhibit 99.906CERT.
SIGNATURES
Pursuant to the requirements of the Securities Exchange Act of 1934 and the Investment Company Act of 1940, the registrant has duly caused this report to be signed on its behalf by the undersigned, thereunto duly authorized.
| | |
| Wells Fargo Funds Trust |
| |
| By: | | |
| |
| | /s/ Andrew Owen Andrew Owen President |
| |
| Date: | | February 23, 2017 |
Pursuant to the requirements of the Securities Exchange Act of 1934 and the Investment Company Act of 1940, this report has been signed below by the following persons on behalf of the registrant and in the capacities and on the date indicated.
| | |
| Wells Fargo Funds Trust |
| |
| By: | | |
| |
| | /s/ Andrew Owen Andrew Owen President |
| |
| Date: | | February 23, 2017 |
| |
| By: | | |
| |
| | /s/ Nancy Wiser Nancy Wiser Treasurer |
| |
| Date: | | February 23, 2017 |
| |
| By: | | |
| |
| | /s/ Jeremy DePalma Jeremy DePalma Treasurer |
| |
| Date: | | February 23, 2017 |