
UNITED STATES
SECURITIES AND EXCHANGE COMMISSION
Washington, D.C. 20549
FORM N-CSRS
CERTIFIED SHAREHOLDER REPORT OF REGISTERED
MANAGEMENT INVESTMENT COMPANIES
Investment Company Act file number: 811-09253
Wells Fargo Funds Trust
(Exact name of registrant as specified in charter)
525 Market St., San Francisco, CA 94105
(Address of principal executive offices) (Zip code)
C. David Messman
Wells Fargo Funds Management, LLC
525 Market St., San Francisco, CA 94105
(Name and address of agent for service)
Registrant’s telephone number, including area code: 800-222-8222
Date of fiscal year end: July 31
Registrant is making a filing for 11 of its series:
Wells Fargo Capital Growth Fund, Wells Fargo Disciplined U.S. Core Fund, Wells Fargo Endeavor Select Fund, Wells Fargo Growth Fund, Wells Fargo Intrinsic Value Fund, Wells Fargo Large Cap Core Fund, Wells Fargo Large Cap Growth Fund, Wells Fargo Large Company Value Fund, Wells Fargo Low Volatility U.S. Equity Fund, Wells Fargo Omega Growth Fund, and Wells Fargo Premier Large Company Growth Fund.
Date of reporting period: January 31, 2017
| ITEM 1. | REPORT TO STOCKHOLDERS |
Semi-Annual Report
January 31, 2017

Wells Fargo Capital Growth Fund


Reduce clutter. Save trees.
Sign up for electronic delivery of prospectuses and shareholder reports at wellsfargo.com/advantagedelivery
Contents
The views expressed and any forward-looking statements are as of January 31, 2017, unless otherwise noted, and are those of the Fund managers and/or Wells Fargo Funds Management, LLC. Discussions of individual securities, or the markets generally, or any Wells Fargo Fund are not intended as individual recommendations. Future events or results may vary significantly from those expressed in any forward-looking statements. The views expressed are subject to change at any time in response to changing circumstances in the market. Wells Fargo Funds Management, LLC and the Fund disclaim any obligation to publicly update or revise any views expressed or forward-looking statements.
NOT FDIC INSURED ◾ NO BANK GUARANTEE ◾ MAY LOSE VALUE
| | | | |
| 2 | | Wells Fargo Capital Growth Fund | | Letter to shareholders (unaudited) |

Andrew Owen
President
Wells Fargo Funds
U.S. and international stocks returned 5.96% and 4.16% for the six-month period, respectively; within fixed income, the Bloomberg Barclays U.S. Aggregate Bond Index3 returned -2.95%.
Dear Shareholder:
As the new president of Wells Fargo Funds now that Karla Rabusch is retiring from that position after nearly 14 years, I am pleased to offer you this semi-annual report for the Wells Fargo Capital Growth Fund for the six-month period that ended January 31, 2017. Despite heightened market volatility, global stocks delivered favorable results overall. U.S. and international stocks returned 5.96% and 4.16% for the six-month period, respectively, as measured by the S&P 500 Index1 and the MSCI ACWI ex USA Index (Net)2; within fixed income, the Bloomberg Barclays U.S. Aggregate Bond Index3 returned -2.95%.
In August–September 2016, global stocks delivered generally positive results; bonds’ interest rates remained historically low.
From August into early September 2016, U.S. and international stocks generally trended upward. Ever since the Great Recession, markets worldwide have been supported to varying degrees by accommodative policies from leading central banks, including the Federal Reserve (Fed), European Central Bank, Bank of England, and Bank of Japan. As a result, investors have watched closely for any signs that global central banks might tighten their measures. In the U.S., early-September comments by several Fed officials appeared to suggest a September interest-rate increase, which sent stock and bond prices downward. However, stocks surged following the Fed’s September 20 meeting on news that the Fed had decided to delay a rate increase to later in 2016. In bond markets, interest rates remained at historically low levels as a result of easy monetary policies, subdued global growth, and modest inflation expectations. Yields rose, after bottoming in July, as market participants felt that yields had overshot the real risks of the U.K.’s Brexit vote and as economic activity strengthened. At the front end of the yield curve, anticipation of new money market fund rules resulted in significantly higher yields on many short-term securities.
During the fourth quarter of 2016, prospects for faster growth and higher interest rates in the U.S. largely influenced the markets.
Early in the fourth quarter of 2016, U.S. stocks tended to trade lower amid concerns such as a likely interest-rate increase and uncertainty over the approaching general election. However, following Donald Trump’s election as president in early November, U.S. stocks began to rally. Investors appeared optimistic that the new administration would usher in a series of pro-growth policies, and supportive economic news helped the rally carry through the quarter. The buoyant environment sent interest rates higher as well. At its mid-December meeting, Fed officials raised their short-term target interest rate for the first time in a year, by a quarter percentage point, to between 0.50% and 0.75%. The fourth quarter also saw the implementation of the Securities and Exchange Commission’s new rules for money market funds, which included floating net asset values (NAVs) for institutional prime and municipal money market funds as well as liquidity fees and redemption gates. In the year leading up to
| 1 | The S&P 500 Index consists of 500 stocks chosen for market size, liquidity, and industry group representation. It is a market-value-weighted index with each stock’s weight in the index proportionate to its market value. You cannot invest directly in an index. |
| 2 | The Morgan Stanley Capital International (MSCI) All Country World Index (ACWI) ex USA Index (Net) is a free-float-adjusted market-capitalization-weighted index that is designed to measure the equity market performance of developed markets, excluding the United States and Canada. Source: MSCI. MSCI makes no express or implied warranties or representations and shall have no liability whatsoever with respect to any MSCI data contained herein. The MSCI data may not be further redistributed or used as a basis for other indexes or any securities or financial products. This report is not approved, reviewed, or produced by MSCI. You cannot invest directly in an index. |
| 3 | The Bloomberg Barclays U.S. Aggregate Bond Index (formerly known as Barclays U.S. Aggregate Bond Index) is a broad-based benchmark that measures the investment-grade, U.S. dollar–denominated, fixed-rate taxable bond market, including Treasuries, government-related and corporate securities, mortgage-backed securities (agency fixed-rate and hybrid adjustable-rate mortgage pass-throughs), asset-backed securities, and commercial mortgage-backed securities. You cannot invest directly in an index. |
| | | | | | |
| Letter to shareholders (unaudited) | | Wells Fargo Capital Growth Fund | | | 3 | |
money fund reform implementation, nearly $1 trillion in assets moved from these types of money market funds into government money market funds, which continued to transact at a stable $1 NAV. Outside of the U.S., the prospects for faster U.S. growth appeared to trigger some acceleration in Europe. The improvement may be partly attributable to expectations for further strengthening of the U.S. dollar, which in turn could improve demand for European goods in the U.S. due to weakening of the euro relative to the dollar.
Investor optimism continued into January 2017.
January brought continued strength in global stock markets. Markets were lifted by factors such as strong trade data from Japan, robust earnings reports by businesses, and investors’ hopes that the U.S. government will approve a large fiscal stimulus package.
Don’t let short-term uncertainty derail long-term investment goals.
Periods of uncertainty can present challenges, but experience has taught us that maintaining long-term investment goals can be an effective way to plan for the future. To help you create a sound strategy based on your personal goals and risk tolerance, Wells Fargo Funds offers more than 100 mutual funds spanning a wide range of asset classes and investment styles. Although diversification cannot guarantee an investment profit or prevent losses, we believe it can be an effective way to manage investment risk and potentially smooth out overall portfolio performance. We encourage investors to know their investments and to understand that appropriate levels of risk-taking may unlock opportunities.
Thank you for choosing to invest in Wells Fargo Funds. We appreciate your confidence in us and remain committed to helping you meet your financial needs.
Sincerely,

Andrew Owen
President
Wells Fargo Funds
Although diversification cannot guarantee an investment profit or prevent losses, we believe it can be an effective way to manage investment risk and potentially smooth out overall portfolio performance.
For further information about your Fund, contact your investment professional, visit our website at wellsfargofunds.com, or call us directly at 1-800-222-8222. We are available 24 hours a day, 7 days a week.
| | | | |
| 4 | | Wells Fargo Capital Growth Fund | | Performance highlights (unaudited) |
Investment objective
The Fund seeks long-term capital appreciation.
Manager
Wells Fargo Funds Management, LLC
Subadviser
Wells Capital Management Incorporated
Portfolio managers
Michael T. Smith, CFA®
Christopher J. Warner, CFA®
Average annual total returns (%) as of January 31, 20171
| | | | | | | | | | | | | | | | | | | | | | | | | | | | | | | | | | |
| | | | | Including sales charge | | | Excluding sales charge | | | Expense ratios2 (%) | |
| | | Inception date | | 1 year | | | 5 year | | | 10 year | | | 1 year | | | 5 year | | | 10 year | | | Gross | | | Net3 | |
| Class A (WFCGX) | | 7-31-2007 | | | 6.54 | | | | 10.24 | | | | 4.89 | | | | 13.01 | | | | 11.56 | | | | 5.51 | | | | 1.24 | | | | 1.11 | |
| Class C (WFCCX) | | 7-31-2007 | | | 11.19 | | | | 10.73 | | | | 4.74 | | | | 12.19 | | | | 10.73 | | | | 4.74 | | | | 1.99 | | | | 1.86 | |
| Class R4 (WCGRX) | | 11-30-2012 | | | – | | | | – | | | | – | | | | 13.27 | | | | 11.95 | | | | 5.96 | | | | 0.96 | | | | 0.75 | |
| Class R6 (WFCRX) | | 11-30-2012 | | | – | | | | – | | | | – | | | | 13.47 | | | | 12.11 | | | | 6.04 | | | | 0.81 | | | | 0.60 | |
| Administrator Class (WFCDX) | | 6-30-2003 | | | – | | | | – | | | | – | | | | 13.15 | | | | 11.77 | | | | 5.77 | | | | 1.16 | | | | 0.94 | |
| Institutional Class (WWCIX) | | 4-8-2005 | | | – | | | | – | | | | – | | | | 13.39 | | | | 12.06 | | | | 6.01 | | | | 0.91 | | | | 0.70 | |
| Russell 1000® Growth Index4 | | – | | | – | | | | – | | | | – | | | | 17.23 | | | | 13.93 | | | | 8.42 | | | | – | | | | – | |
Figures quoted represent past performance, which is no guarantee of future results, and do not reflect taxes that a shareholder may pay on fund distributions or the redemption of fund shares. Investment return and principal value of an investment will fluctuate so that an investor’s shares, when redeemed, may be worth more or less than their original cost. Performance shown without sales charges would be lower if sales charges were reflected. Current performance may be lower or higher than the performance data quoted, which assumes the reinvestment of dividends and capital gains. Current month-end performance is available on the Fund’s website, wellsfargofunds.com.
Index returns do not include transaction costs associated with buying and selling securities, any mutual fund fees or expenses, or any taxes. It is not possible to invest directly in an index.
For Class A shares, the maximum front-end sales charge is 5.75%. For Class C shares, the maximum contingent deferred sales charge is 1.00%. Performance including a contingent deferred sales charge assumes the sales charge for the corresponding time period. Class R4, Class R6, Administrator Class, and Institutional Class shares are sold without a front-end sales charge or contingent deferred sales charge.
Stock values fluctuate in response to the activities of individual companies and general market and economic conditions. Certain investment strategies tend to increase the total risk of an investment (relative to the broader market). The Fund is exposed to foreign investment risk. Consult the Fund’s prospectus for additional information on these and other risks.
Please see footnotes on page 5.
| | | | | | |
| Performance highlights (unaudited) | | Wells Fargo Capital Growth Fund | | | 5 | |
| | | | |
| Ten largest holdings (%) as of January 31, 20175 | |
Alphabet Incorporated Class A | | | 7.09 | |
Amazon.com Incorporated | | | 6.31 | |
Visa Incorporated Class A | | | 3.82 | |
Microsoft Corporation | | | 3.53 | |
The Home Depot Incorporated | | | 3.40 | |
UnitedHealth Group Incorporated | | | 3.34 | |
Waste Connections Incorporated | | | 3.14 | |
Celgene Corporation | | | 2.97 | |
Facebook Incorporated Class A | | | 2.69 | |
Fidelity National Information Services Incorporated | | | 2.64 | |
|
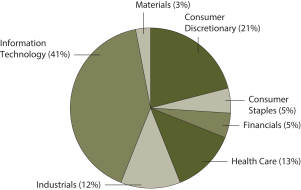
| Sector distribution as of January 31, 20176 |
|
|
| 1 | Historical performance shown for Class A shares prior to their inception reflects the performance of the former Investor Class shares, and includes the higher expenses applicable to the former Investor Class shares. If these expenses had not been included, returns would be higher. Historical performance shown for Class C shares prior to their inception reflects the performance of the former Investor Class shares, adjusted to reflect the higher expenses applicable to Class C shares. Historical performance shown for Class R4 shares prior to their inception reflects the performance of Institutional Class shares, adjusted to reflect the higher expenses applicable to Class R4 shares. Historical performance shown for Class R6 shares prior to their inception reflects the performance of Institutional Class shares, and includes the higher expenses applicable to Institutional Class shares. If these expenses had not been included, returns would be higher. |
| 2 | Reflects the expense ratios as stated in the most recent prospectuses. The expense ratios shown are subject to change and may differ from the annualized expense ratios shown in the financial highlights of this report. |
| 3 | The manager has contractually committed through November 30, 2017, to waive fees and/or reimburse expenses to the extent necessary to cap the Fund’s Total Annual Fund Operating Expenses After Fee Waiver at the amounts shown. After this time, the cap may be increased or the commitment to maintain the cap may be terminated only with the approval of the Board of Trustees. Brokerage commissions, stamp duty fees, interest, taxes, acquired fund fees and expenses, and extraordinary expenses are excluded from the expense cap. Without this cap, the Fund’s returns would have been lower. |
| 4 | The Russell 1000® Growth Index measures the performance of those Russell 1000 companies with higher price-to-book ratios and higher forecasted growth values. You cannot invest directly in an index. |
| 5 | The ten largest holdings, excluding cash and cash equivalents, are calculated based on the value of the investments divided by total net assets of the Fund. Holdings are subject to change and may have changed since the date specified. |
| 6 | Amounts are calculated based on the total long-term investments of the Fund. These amounts are subject to change and may have changed since the date specified. |
| | | | |
| 6 | | Wells Fargo Capital Growth Fund | | Fund expenses (unaudited) |
As a shareholder of the Fund, you incur two types of costs: (1) transaction costs, including sales charges (loads) on purchase payments and contingent deferred sales charges (if any) on redemptions and (2) ongoing costs, including management fees, distribution (12b-1) and/or shareholder servicing fees, and other Fund expenses. This example is intended to help you understand your ongoing costs (in dollars) of investing in the Fund and to compare these costs with the ongoing costs of investing in other mutual funds.
The example is based on an investment of $1,000 invested at the beginning of the six-month period and held for the entire period from August 1, 2016 to January 30, 2017.
Actual expenses
The “Actual” line of the table below provides information about actual account values and actual expenses. You may use the information in this line, together with the amount you invested, to estimate the expenses that you paid over the period. Simply divide your account value by $1,000 (for example, an $8,600 account value divided by $1,000 = 8.6), then multiply the result by the number in the “Actual” line under the heading entitled “Expenses paid during period” for your applicable class of shares to estimate the expenses you paid on your account during this period.
Hypothetical example for comparison purposes
The “Hypothetical” line of the table below provides information about hypothetical account values and hypothetical expenses based on the Fund’s actual expense ratio and an assumed rate of return of 5% per year before expenses, which is not the Fund’s actual return. The hypothetical account values and expenses may not be used to estimate the actual ending account balance or expenses you paid for the period. You may use this information to compare the ongoing costs of investing in the Fund and other funds. To do so, compare this 5% hypothetical example with the 5% hypothetical examples that appear in the shareholder reports of the other funds.
Please note that the expenses shown in the table are meant to highlight your ongoing costs only and do not reflect any transactional costs, such as sales charges (loads) and contingent deferred sales charges. Therefore, the “Hypothetical” line of the table is useful in comparing ongoing costs only and will not help you determine the relative total costs of owning different funds. In addition, if these transactional costs were included, your costs would have been higher.
| | | | | | | | | | | | | | | | |
| | | Beginning
account value
8-1-2016 | | | Ending
account value
1-31-2017 | | | Expenses
paid during
the period¹ | | | Annualized net
expense ratio | |
Class A | | | | | | | | | | | | | | | | |
Actual | | $ | 1,000.00 | | | $ | 1,020.27 | | | $ | 5.38 | | | | 1.06 | % |
Hypothetical (5% return before expenses) | | $ | 1,000.00 | | | $ | 1,019.81 | | | $ | 5.38 | | | | 1.06 | % |
Class C | | | | | | | | | | | | | | | | |
Actual | | $ | 1,000.00 | | | $ | 1,016.68 | | | $ | 9.18 | | | | 1.81 | % |
Hypothetical (5% return before expenses) | | $ | 1,000.00 | | | $ | 1,016.04 | | | $ | 9.17 | | | | 1.81 | % |
Class R4 | | | | | | | | | | | | | | | | |
Actual | | $ | 1,000.00 | | | $ | 1,022.11 | | | $ | 3.81 | | | | 0.75 | % |
Hypothetical (5% return before expenses) | | $ | 1,000.00 | | | $ | 1,021.37 | | | $ | 3.81 | | | | 0.75 | % |
Class R6 | | | | | | | | | | | | | | | | |
Actual | | $ | 1,000.00 | | | $ | 1,023.25 | | | $ | 3.05 | | | | 0.60 | % |
Hypothetical (5% return before expenses) | | $ | 1,000.00 | | | $ | 1,022.12 | | | $ | 3.05 | | | | 0.60 | % |
Administrator Class | | | | | | | | | | | | | | | | |
Actual | | $ | 1,000.00 | | | $ | 1,021.12 | | | $ | 4.78 | | | | 0.94 | % |
Hypothetical (5% return before expenses) | | $ | 1,000.00 | | | $ | 1,020.41 | | | $ | 4.77 | | | | 0.94 | % |
Institutional Class | | | | | | | | | | | | | | | | |
Actual | | $ | 1,000.00 | | | $ | 1,022.24 | | | $ | 3.56 | | | | 0.70 | % |
Hypothetical (5% return before expenses) | | $ | 1,000.00 | | | $ | 1,021.62 | | | $ | 3.56 | | | | 0.70 | % |
| 1 | Expenses paid is equal to the annualized net expense ratio of each class multiplied by the average account value over the period, multiplied by the number of days in the most recent fiscal half-year divided by the number of days in the fiscal year (to reflect the one-half-year period). |
| | | | | | |
| Portfolio of investments—January 31, 2017 (unaudited) | | Wells Fargo Capital Growth Fund | | | 7 | |
| | | | | | | | | | | | | | | | |
| Security name | | | | | | | | Shares | | | Value | |
| | | | |
Common Stocks: 98.38% | | | | | | | | | | | | | | | | |
| | | | |
Consumer Discretionary: 21.00% | | | | | | | | | | | | | | | | |
| | | | |
| Hotels, Restaurants & Leisure: 5.62% | | | | | | | | | | | | | | | | |
Royal Caribbean Cruises Limited | | | | | | | | | | | 37,100 | | | $ | 3,473,669 | |
Starbucks Corporation | | | | | | | | | | | 107,141 | | | | 5,916,326 | |
Yum! Brands Incorporated | | | | | | | | | | | 74,100 | | | | 4,855,773 | |
| | | | |
| | | | | | | | | | | | | | | 14,245,768 | |
| | | | | | | | | | | | | | | | |
| | | | |
| Internet & Direct Marketing Retail: 6.31% | | | | | | | | | | | | | | | | |
Amazon.com Incorporated † | | | | | | | | | | | 19,405 | | | | 15,979,629 | |
| | | | | | | | | | | | | | | | |
| | | | |
| Media: 2.23% | | | | | | | | | | | | | | | | |
Charter Communications Incorporated Class A † | | | | | | | | | | | 17,450 | | | | 5,652,928 | |
| | | | | | | | | | | | | | | | |
| | | | |
| Specialty Retail: 6.84% | | | | | | | | | | | | | | | | |
O’Reilly Automotive Incorporated † | | | | | | | | | | | 14,050 | | | | 3,684,894 | |
The Home Depot Incorporated | | | | | | | | | | | 62,533 | | | | 8,603,290 | |
The TJX Companies Incorporated | | | | | | | | | | | 67,260 | | | | 5,039,119 | |
| | | | |
| | | | | | | | | | | | | | | 17,327,303 | |
| | | | | | | | | | | | | | | | |
| | | | |
Consumer Staples: 4.57% | | | | | | | | | | | | | | | | |
| | | | |
| Beverages: 2.93% | | | | | | | | | | | | | | | | |
Constellation Brands Incorporated Class A | | | | | | | | | | | 27,634 | | | | 4,138,468 | |
Monster Beverage Corporation † | | | | | | | | | | | 77,000 | | | | 3,280,200 | |
| | | | |
| | | | | | | | | | | | | | | 7,418,668 | |
| | | | | | | | | | | | | | | | |
| | | | |
| Tobacco: 1.64% | | | | | | | | | | | | | | | | |
Reynolds American Incorporated | | | | | | | | | | | 69,100 | | | | 4,154,983 | |
| | | | | | | | | | | | | | | | |
| | | | |
Financials: 5.05% | | | | | | | | | | | | | | | | |
| | | | |
| Capital Markets: 5.05% | | | | | | | | | | | | | | | | |
Intercontinental Exchange Incorporated | | | | | | | | | | | 104,775 | | | | 6,114,669 | |
Raymond James Financial Incorporated | | | | | | | | | | | 34,900 | | | | 2,615,057 | |
S&P Global Incorporated | | | | | | | | | | | 33,863 | | | | 4,069,655 | |
| | | | |
| | | | | | | | | | | | | | | 12,799,381 | |
| | | | | | | | | | | | | | | | |
| | | | |
Health Care: 12.40% | | | | | | | | | | | | | | | | |
| | | | |
| Biotechnology: 4.58% | | | | | | | | | | | | | | | | |
Alexion Pharmaceuticals Incorporated † | | | | | | | | | | | 14,100 | | | | 1,842,588 | |
Celgene Corporation † | | | | | | | | | | | 64,800 | | | | 7,526,520 | |
Gilead Sciences Incorporated | | | | | | | | | | | 30,900 | | | | 2,238,705 | |
| | | | |
| | | | | | | | | | | | | | | 11,607,813 | |
| | | | | | | | | | | | | | | | |
| | | | |
| Health Care Equipment & Supplies: 4.48% | | | | | | | | | | | | | | | | |
Baxter International Incorporated | | | | | | | | | | | 75,850 | | | | 3,633,974 | |
Boston Scientific Corporation † | | | | | | | | | | | 163,850 | | | | 3,942,231 | |
Intuitive Surgical Incorporated † | | | | | | | | | | | 5,450 | | | | 3,775,161 | |
| | | | |
| | | | | | | | | | | | | | | 11,351,366 | |
| | | | | | | | | | | | | | | | |
The accompanying notes are an integral part of these financial statements.
| | | | |
| 8 | | Wells Fargo Capital Growth Fund | | Portfolio of investments—January 31, 2017 (unaudited) |
| | | | | | | | | | | | | | | | |
| Security name | | | | | | | | Shares | | | Value | |
| | | | |
| Health Care Providers & Services: 3.34% | | | | | | | | | | | | | | | | |
UnitedHealth Group Incorporated | | | | | | | | | | | 52,200 | | | $ | 8,461,620 | |
| | | | | | | | | | | | | | | | |
| | | | |
Industrials: 11.42% | | | | | | | | | | | | | | | | |
| | | | |
| Aerospace & Defense: 1.57% | | | | | | | | | | | | | | | | |
Northrop Grumman Corporation | | | | | | | | | | | 17,350 | | | | 3,974,538 | |
| | | | | | | | | | | | | | | | |
| | | | |
| Airlines: 1.34% | | | | | | | | | | | | | | | | |
Spirit Airlines Incorporated † | | | | | | | | | | | 62,600 | | | | 3,382,904 | |
| | | | | | | | | | | | | | | | |
| | | | |
| Building Products: 2.07% | | | | | | | | | | | | | | | | |
Johnson Controls International plc | | | | | | | | | | | 119,512 | | | | 5,256,138 | |
| | | | | | | | | | | | | | | | |
| | | | |
| Commercial Services & Supplies: 3.14% | | | | | | | | | | | | | | | | |
Waste Connections Incorporated | | | | | | | | | | | 99,020 | | | | 7,951,306 | |
| | | | | | | | | | | | | | | | |
| | | | |
| Electrical Equipment: 1.09% | | | | | | | | | | | | | | | | |
Acuity Brands Incorporated | | | | | | | | | | | 13,300 | | | | 2,756,159 | |
| | | | | | | | | | | | | | | | |
| | | | |
| Professional Services: 1.18% | | | | | | | | | | | | | | | | |
TransUnion † | | | | | | | | | | | 94,773 | | | | 2,988,193 | |
| | | | | | | | | | | | | | | | |
| | | | |
| Road & Rail: 1.03% | | | | | | | | | | | | | | | | |
Kansas City Southern | | | | | | | | | | | 30,400 | | | | 2,611,664 | |
| | | | | | | | | | | | | | | | |
| | | | |
Information Technology: 40.88% | | | | | | | | | | | | | | | | |
| | | | |
| Communications Equipment: 1.77% | | | | | | | | | | | | | | | | |
Harris Corporation | | | | | | | | | | | 43,600 | | | | 4,478,156 | |
| | | | | | | | | | | | | | | | |
| | | | |
| Internet Software & Services: 11.37% | | | | | | | | | | | | | | | | |
Alphabet Incorporated Class A † | | | | | | | | | | | 21,908 | | | | 17,968,723 | |
Facebook Incorporated Class A † | | | | | | | | | | | 52,324 | | | | 6,818,864 | |
Tencent Holdings Limited ADR | | | | | | | | | | | 153,850 | | | | 4,028,562 | |
| | | | |
| | | | | | | | | | | | | | | 28,816,149 | |
| | | | | | | | | | | | | | | | |
| | | | |
| IT Services: 9.63% | | | | | | | | | | | | | | | | |
Fidelity National Information Services Incorporated | | | | | | | | | | | 84,100 | | | | 6,679,222 | |
PayPal Holdings Incorporated † | | | | | | | | | | | 122,350 | | | | 4,867,083 | |
Total System Services Incorporated | | | | | | | | | | | 62,350 | | | | 3,159,898 | |
Visa Incorporated Class A | | | | | | | | | | | 117,133 | | | | 9,688,070 | |
| | | | |
| | | | | | | | | | | | | | | 24,394,273 | |
| | | | | | | | | | | | | | | | |
| | | | |
| Semiconductors & Semiconductor Equipment: 2.20% | | | | | | | | | | | | | | | | |
Broadcom Limited | | | | | | | | | | | 28,000 | | | | 5,586,000 | |
| | | | | | | | | | | | | | | | |
| | | | |
| Software: 15.91% | | | | | | | | | | | | | | | | |
Activision Blizzard Incorporated | | | | | | | | | | | 94,950 | | | | 3,817,940 | |
Adobe Systems Incorporated † | | | | | | | | | | | 39,700 | | | | 4,501,186 | |
Electronic Arts Incorporated † | | | | | | | | | | | 63,600 | | | | 5,306,148 | |
Microsoft Corporation | | | | | | | | | | | 138,500 | | | | 8,954,025 | |
Nintendo Company Limited | | | | | | | | | | | 101,850 | | | | 2,518,751 | |
The accompanying notes are an integral part of these financial statements.
| | | | | | |
| Portfolio of investments—January 31, 2017 (unaudited) | | Wells Fargo Capital Growth Fund | | | 9 | |
| | | | | | | | | | | | | | | | |
| Security name | | | | | | | | Shares | | | Value | |
| | | | |
| Software (continued) | | | | | | | | | | | | | | | | |
Salesforce.com Incorporated † | | | | | | | | | | | 57,380 | | | $ | 4,538,758 | |
ServiceNow Incorporated † | | | | | | | | | | | 26,780 | | | | 2,426,804 | |
Symantec Corporation | | | | | | | | | | | 183,350 | | | | 5,051,293 | |
Ultimate Software Group Incorporated † | | | | | | | | | | | 16,500 | | | | 3,195,390 | |
| | | | |
| | | | | | | | | | | | | | | 40,310,295 | |
| | | | | | | | | | | | | | | | |
| | | | |
Materials: 3.06% | | | | | | | | | | | | | | | | |
| | | | |
| Chemicals: 1.61% | | | | | | | | | | | | | | | | |
The Sherwin-Williams Company | | | | | | | | | | | 13,450 | | | | 4,086,245 | |
| | | | | | | | | | | | | | | | |
| | | | |
| Construction Materials: 1.45% | | | | | | | | | | | | | | | | |
Vulcan Materials Company | | | | | | | | | | | 28,550 | | | | 3,663,822 | |
| | | | | | | | | | | | | | | | |
| | | | |
Total Common Stocks (Cost $191,354,801) | | | | | | | | | | | | | | | 249,255,301 | |
| | | | | | | | | | | | | | | | |
| | | | |
| | | Yield | | | | | | | | | | |
| Short-Term Investments: 1.83% | | | | | | | | | | | | | | | | |
| | | | |
| Investment Companies: 1.83% | | | | | | | | | | | | | | | | |
Wells Fargo Government Money Market Fund Select Class (l)(u) | | | 0.46 | % | | | | | | | 4,627,172 | | | | 4,627,172 | |
| | | | | | | | | | | | | | | | |
| | | | |
Total Short-Term Investments (Cost $4,627,172) | | | | | | | | | | | | | | | 4,627,172 | |
| | | | | | | | | | | | | | | | |
| | | | | | | | |
| Total investments in securities (Cost $195,981,973) * | | | 100.21 | % | | | 253,882,473 | |
Other assets and liabilities, net | | | (0.21 | ) | | | (526,567 | ) |
| | | | | | | | |
| Total net assets | | | 100.00 | % | | $ | 253,355,906 | |
| | | | | | | | |
| † | Non-income-earning security |
| (l) | The issuer of the security is an affiliated person of the Fund as defined in the Investment Company Act of 1940. |
| (u) | The rate represents the 7-day annualized yield at period end. |
| * | Cost for federal income tax purposes is $196,143,042 and unrealized gains (losses) consists of: |
| | | | |
Gross unrealized gains | | $ | 60,266,643 | |
Gross unrealized losses | | | (2,527,212 | ) |
| | | | |
Net unrealized gains | | $ | 57,739,431 | |
The accompanying notes are an integral part of these financial statements.
| | | | |
| 10 | | Wells Fargo Capital Growth Fund | | Statement of assets and liabilities—January 31, 2017 (unaudited) |
| | | | |
| | | | |
| |
Assets | | | | |
Investments | | | | |
In unaffiliated securities, at value (cost $191,354,801) | | $ | 249,255,301 | |
In affiliated securities, at value (cost $4,627,172) | | | 4,627,172 | |
| | | | |
Total investments, at value (cost $195,981,973) | | | 253,882,473 | |
Receivable for Fund shares sold | | | 45,207 | |
Receivable for dividends | | | 30,842 | |
Receivable for securities lending income | | | 86 | |
Prepaid expenses and other assets | | | 49,706 | |
| | | | |
Total assets | | | 254,008,314 | |
| | | | |
| |
Liabilities | | | | |
Payable for Fund shares redeemed | | | 462,408 | |
Management fee payable | | | 106,446 | |
Distribution fee payable | | | 2,058 | |
Administration fees payable | | | 21,761 | |
Accrued expenses and other liabilities | | | 59,735 | |
| | | | |
Total liabilities | | | 652,408 | |
| | | | |
Total net assets | | $ | 253,355,906 | |
| | | | |
| |
NET ASSETS CONSIST OF | | | | |
Paid-in capital | | $ | 185,892,299 | |
Overdistributed net investment income | | | (119,782 | ) |
Accumulated net realized gains on investments | | | 9,682,889 | |
Net unrealized gains on investments | | | 57,900,500 | |
| | | | |
Total net assets | | $ | 253,355,906 | |
| | | | |
| |
COMPUTATION OF NET ASSET VALUE AND OFFERING PRICE PER SHARE | | | | |
Net assets – Class A | | $ | 72,050,061 | |
Shares outstanding – Class A1 | | | 4,807,129 | |
Net asset value per share – Class A | | | $14.99 | |
Maximum offering price per share – Class A2 | | | $15.90 | |
Net assets – Class C | | $ | 3,216,361 | |
Shares outstanding – Class C1 | | | 240,984 | |
Net asset value per share – Class C | | | $13.35 | |
Net assets – Class R4 | | $ | 16,068 | |
Share outstanding – Class R41 | | | 974 | |
Net asset value per share – Class R4 | | | $16.50 | |
Net assets – Class R6 | | $ | 132,925,386 | |
Shares outstanding – Class R61 | | | 7,999,989 | |
Net asset value per share – Class R6 | | | $16.62 | |
Net assets – Administrator Class | | $ | 20,652,178 | |
Shares outstanding – Administrator Class1 | | | 1,283,141 | |
Net asset value per share – Administrator Class | | | $16.10 | |
Net assets – Institutional Class | | $ | 24,495,852 | |
Shares outstanding – Institutional Class1 | | | 1,479,102 | |
Net asset value per share – Institutional Class | | | $16.56 | |
| 1 | The Fund has an unlimited number of authorized shares. |
| 2 | Maximum offering price is computed as 100/94.25 of net asset value. On investments of $50,000 or more, the offering price is reduced. |
The accompanying notes are an integral part of these financial statements.
| | | | | | |
| Statement of operations—six months ended January 31, 2017 (unaudited) | | Wells Fargo Capital Growth Fund | | | 11 | |
| | | | |
| | | | |
| |
Investment income | | | | |
Dividends (net of foreign withholding taxes of $7,585) | | $ | 1,525,374 | |
Income from affiliated securities | | | 6,431 | |
Securities lending income, net | | | 5,195 | |
| | | | |
Total investment income | | | 1,537,000 | |
| | | | |
| |
Expenses | | | | |
Management fee | | | 924,646 | |
Administration fees | | | | |
Class A | | | 78,036 | |
Class C | | | 3,508 | |
Class R4 | | | 6 | |
Class R6 | | | 20,385 | |
Administrator Class | | | 17,752 | |
Institutional Class | | | 15,145 | |
Shareholder servicing fees | | | | |
Class A | | | 92,900 | |
Class C | | | 4,177 | |
Class R4 | | | 7 | |
Administrator Class | | | 34,138 | |
Distribution fee | | | | |
Class C | | | 12,530 | |
Custody and accounting fees | | | 4,844 | |
Professional fees | | | 25,358 | |
Registration fees | | | 41,515 | |
Shareholder report expenses | | | 16,279 | |
Trustees’ fees and expenses | | | 12,606 | |
Other fees and expenses | | | 3,944 | |
| | | | |
Total expenses | | | 1,307,776 | |
Less: Fee waivers and/or expense reimbursements | | | (265,981 | ) |
| | | | |
Net expenses | | | 1,041,795 | |
| | | | |
Net investment income | | | 495,205 | |
| | | | |
| |
REALIZED AND UNREALIZED GAINS (LOSSES) ON INVESTMENTS | | | | |
| |
Net realized gains (losses) on: | | | | |
Unaffiliated securities | | | 18,340,874 | |
Affiliated securities | | | 260 | |
| | | | |
Net realized gains on investments | | | 18,341,134 | |
Net change in unrealized gains (losses) on investments | | | (13,712,834 | ) |
| | | | |
Net realized and unrealized gains (losses) on investments | | | 4,628,300 | |
| | | | |
Net increase in net assets resulting from operations | | $ | 5,123,505 | |
| | | | |
The accompanying notes are an integral part of these financial statements.
| | | | |
| 12 | | Wells Fargo Capital Growth Fund | | Statement of changes in net assets |
| | | | | | | | | | | | | | | | |
| | | Six months ended
January 31, 2017
(unaudited) | | | Year ended
July 31, 2016 | |
| | | | |
Operations | | | | | | | | | | | | | | | | |
Net investment income | | | | | | $ | 495,205 | | | | | | | $ | 89,510 | |
Net realized gains (losses) on investments | | | | | | | 18,341,134 | | | | | | | | (424,974 | ) |
Net change in unrealized gains (losses) on investments | | | | | | | (13,712,834 | ) | | | | | | | 701,484 | |
| | | | |
Net increase in net assets resulting from operations | | | | | | | 5,123,505 | | | | | | | | 366,020 | |
| | | | |
| | | | |
Distributions to shareholders from | | | | | | | | | | | | | | | | |
Net investment income | | | | | | | | | | | | | | | | |
Class A | | | | | | | (97,914 | ) | | | | | | | 0 | |
Class R4 | | | | | | | (38 | ) | | | | | | | 0 | |
Class R6 | | | | | | | (412,002 | ) | | | | | | | 0 | |
Administrator Class | | | | | | | (39,091 | ) | | | | | | | 0 | |
Institutional Class | | | | | | | (65,942 | ) | | | | | | | 0 | |
Net realized gains | | | | | | | | | | | | | | | | |
Class A | | | | | | | (1,953,165 | ) | | | | | | | (12,289,754 | ) |
Class C | | | | | | | (101,375 | ) | | | | | | | (556,329 | ) |
Class R4 | | | | | | | (384 | ) | | | | | | | (1,876 | ) |
Class R6 | | | | | | | (3,243,150 | ) | | | | | | | (18,521,143 | ) |
Administrator Class | | | | | | | (611,585 | ) | | | | | | | (4,001,022 | ) |
Institutional Class | | | | | | | (616,477 | ) | | | | | | | (3,150,712 | ) |
| | | | |
Total distributions to shareholders | | | | | | | (7,141,123 | ) | | | | | | | (38,520,836 | ) |
| | | | |
| | | | |
Capital share transactions | | | Shares | | | | | | | | Shares | | | | | |
Proceeds from shares sold | | | | | | | | | | | | | | | | |
Class A | | | 106,488 | | | | 1,565,916 | | | | 4,787,904 | | | | 79,683,106 | |
Class C | | | 26,447 | | | | 347,356 | | | | 37,860 | | | | 527,959 | |
Class R6 | | | 180,361 | | | | 2,968,080 | | | | 958,376 | | | | 15,871,334 | |
Administrator Class | | | 64,900 | | | | 1,032,603 | | | | 179,863 | | | | 2,841,546 | |
Institutional Class | | | 357,411 | | | | 5,902,506 | | | | 571,120 | | | | 9,788,878 | |
Investor Class | | | N/A | | | | N/A | | | | 45,169 | 1 | | | 724,606 | 1 |
| | | | |
| | | | | | | 11,816,461 | | | | | | | | 109,437,429 | |
| | | | |
Reinvestment of distributions | | | | | | | | | | | | | | | | |
Class A | | | 137,410 | | | | 2,007,306 | | | | 842,773 | | | | 12,076,915 | |
Class C | | | 6,718 | | | | 87,332 | | | | 37,294 | | | | 480,716 | |
Class R4 | | | 26 | | | | 422 | | | | 120 | | | | 1,876 | |
Class R6 | | | 225,598 | | | | 3,655,152 | | | | 1,172,966 | | | | 18,521,143 | |
Administrator Class | | | 41,307 | | | | 647,990 | | | | 259,809 | | | | 3,985,470 | |
Institutional Class | | | 41,696 | | | | 673,157 | | | | 188,296 | | | | 2,965,655 | |
| | | | |
| | | | | | | 7,071,359 | | | | | | | | 38,031,775 | |
| | | | |
Payment for shares redeemed | | | | | | | | | | | | | | | | |
Class A | | | (573,420 | ) | | | (8,495,720 | ) | | | (1,479,556 | ) | | | (21,274,728 | ) |
Class C | | | (44,435 | ) | | | (584,742 | ) | | | (87,529 | ) | | | (1,218,466 | ) |
Class R6 | | | (822,126 | ) | | | (13,493,027 | ) | | | (1,823,127 | ) | | | (29,216,949 | ) |
Administrator Class | | | (740,945 | ) | | | (11,751,991 | ) | | | (415,047 | ) | | | (6,710,672 | ) |
Institutional Class | | | (341,573 | ) | | | (5,583,267 | ) | | | (536,405 | ) | | | (8,726,371 | ) |
Investor Class | | | N/A | | | | N/A | | | | (4,836,074 | )1 | | | (80,008,660 | )1 |
| | | | |
| | | | | | | (39,908,747 | ) | | | | | | | (147,155,846 | ) |
| | | | |
Net increase (decrease) in net assets resulting from capital share transactions | | | | | | | (21,020,927 | ) | | | | | | | 313,358 | |
| | | | |
Total decrease in net assets | | | | | | | (23,038,545 | ) | | | | | | | (37,841,458 | ) |
| | | | |
| | | | |
Net assets | | | | | | | | | | | | | | | | |
Beginning of period | | | | | | | 276,394,451 | | | | | | | | 314,235,909 | |
| | | | |
End of period | | | | | | $ | 253,355,906 | | | | | | | $ | 276,394,451 | |
| | | | |
Overdistributed net investment income | | | | | | $ | (119,782 | ) | | | | | | $ | 0 | |
| | | | |
| 1 | For the period from August 1, 2015 to October 23, 2015. Effective at the close of business on October 23, 2015, Investor Class shares were converted to Class A shares and are no longer offered by the Fund. |
The accompanying notes are an integral part of these financial statements.
| | | | | | |
| Financial highlights | | Wells Fargo Capital Growth Fund | | | 13 | |
(For a share outstanding throughout each period)
| | | | | | | | | | | | | | | | | | | | | | | | |
| | | Six months ended
January 31, 2017 (unaudited) | | | Year ended July 31 | |
| CLASS A | | | 2016 | | | 2015 | | | 2014 | | | 2013 | | | 2012 | |
Net asset value, beginning of period | | | $15.12 | | | | $17.38 | | | | $21.31 | | | | $19.87 | | | | $16.74 | | | | $16.25 | |
Net investment income (loss) | | | 0.01 | 1 | | | (0.03 | )1 | | | (0.07 | )1 | | | (0.10 | )1 | | | 0.00 | 1,2 | | | (0.05 | )1 |
Net realized and unrealized gains (losses) on investments | | | 0.29 | | | | 0.04 | | | | 2.09 | | | | 3.79 | | | | 3.43 | | | | 0.54 | |
| | | | | | | | | | | | | | | | | | | | | | | | |
Total from investment operations | | | 0.30 | | | | 0.01 | | | | 2.02 | | | | 3.69 | | | | 3.43 | | | | 0.49 | |
Distributions to shareholders from | | | | | | | | | | | | | | | | | | | | | | | | |
Net investment income | | | (0.02 | ) | | | 0.00 | | | | 0.00 | | | | (0.02 | ) | | | 0.00 | | | | 0.00 | |
Net realized gains | | | (0.41 | ) | | | (2.27 | ) | | | (5.95 | ) | | | (2.23 | ) | | | (0.30 | ) | | | 0.00 | |
| | | | | | | | | | | | | | | | | | | | | | | | |
Total distributions to shareholders | | | (0.43 | ) | | | (2.27 | ) | | | (5.95 | ) | | | (2.25 | ) | | | (0.30 | ) | | | 0.00 | |
Net asset value, end of period | | | $14.99 | | | | $15.12 | | | | $17.38 | | | | $21.31 | | | | $19.87 | | | | $16.74 | |
Total return3 | | | 2.03 | % | | | 0.75 | % | | | 11.00 | % | | | 19.09 | % | | | 20.85 | % | | | 3.02 | % |
Ratios to average net assets (annualized) | | | | | | | | | | | | | | | | | | | | | | | | |
Gross expenses | | | 1.24 | % | | | 1.24 | % | | | 1.27 | % | | | 1.26 | % | | | 1.26 | % | | | 1.21 | % |
Net expenses | | | 1.06 | % | | | 1.06 | % | | | 1.11 | % | | | 1.11 | % | | | 1.14 | % | | | 1.20 | % |
Net investment income (loss) | | | 0.10 | % | | | (0.18 | )% | | | (0.39 | )% | | | (0.46 | )% | | | 0.01 | % | | | (0.30 | )% |
Supplemental data | | | | | | | | | | | | | | | | | | | | | | | | |
Portfolio turnover rate | | | 39 | % | | | 85 | % | | | 114 | % | | | 94 | % | | | 107 | % | | | 116 | % |
Net assets, end of period (000s omitted) | | | $72,050 | | | | $77,648 | | | | $17,126 | | | | $18,561 | | | | $16,390 | | | | $17,784 | |
| 1 | Calculated based upon average shares outstanding |
| 2 | Amount is less than $0.005. |
| 3 | Total return calculations do not include any sales charges. Returns for periods of less than one year are not annualized. |
The accompanying notes are an integral part of these financial statements.
| | | | |
| 14 | | Wells Fargo Capital Growth Fund | | Financial highlights |
(For a share outstanding throughout each period)
| | | | | | | | | | | | | | | | | | | | | | | | |
| | | Six months ended
January 31, 2017 (unaudited) | | | Year ended July 31 | |
| CLASS C | | | 2016 | | | 2015 | | | 2014 | | | 2013 | | | 2012 | |
Net asset value, beginning of period | | | $13.54 | | | | $15.92 | | | | $20.12 | | | | $18.98 | | | | $16.12 | | | | $15.77 | |
Net investment loss | | | (0.04 | )1 | | | (0.13 | )1 | | | (0.20 | )1 | | | (0.24 | )1 | | | (0.13 | )1 | | | (0.16 | )1 |
Net realized and unrealized gains (losses) on investments | | | 0.26 | | | | 0.02 | | | | 1.95 | | | | 3.61 | | | | 3.29 | | | | 0.51 | |
| | | | | | | | | | | | | | | | | | | | | | | | |
Total from investment operations | | | 0.22 | | | | (0.11 | ) | | | 1.75 | | | | 3.37 | | | | 3.16 | | | | 0.35 | |
Distributions to shareholders from | | | | | | | | | | | | | | | | | | | | | | | | |
Net realized gains | | | (0.41 | ) | | | (2.27 | ) | | | (5.95 | ) | | | (2.23 | ) | | | (0.30 | ) | | | 0.00 | |
Net asset value, end of period | | | $13.35 | | | | $13.54 | | | | $15.92 | | | | $20.12 | | | | $18.98 | | | | $16.12 | |
Total return2 | | | 1.67 | % | | | 0.00 | % | | | 10.15 | % | | | 18.21 | % | | | 19.97 | % | | | 2.22 | % |
Ratios to average net assets (annualized) | | | | | | | | | | | | | | | | | | | | | | | | |
Gross expenses | | | 1.99 | % | | | 1.99 | % | | | 2.02 | % | | | 2.01 | % | | | 2.01 | % | | | 1.96 | % |
Net expenses | | | 1.81 | % | | | 1.81 | % | | | 1.86 | % | | | 1.86 | % | | | 1.89 | % | | | 1.95 | % |
Net investment loss | | | (0.65 | )% | | | (0.98 | )% | | | (1.14 | )% | | | (1.20 | )% | | | (0.73 | )% | | | (1.05 | )% |
Supplemental data | | | | | | | | | | | | | | | | | | | | | | | | |
Portfolio turnover rate | | | 39 | % | | | 85 | % | | | 114 | % | | | 94 | % | | | 107 | % | | | 116 | % |
Net assets, end of period (000s omitted) | | | $3,216 | | | | $3,415 | | | | $4,212 | | | | $4,628 | | | | $4,503 | | | | $6,042 | |
| 1 | Calculated based upon average shares outstanding |
| 2 | Total return calculations do not include any sales charges. Returns for periods of less than one year are not annualized. |
The accompanying notes are an integral part of these financial statements.
| | | | | | |
| Financial highlights | | Wells Fargo Capital Growth Fund | | | 15 | |
(For a share outstanding throughout each period)
| | | | | | | | | | | | | | | | | | | | |
| | | Six months ended
January 31, 2017 (unaudited) | | | Year ended July 31 | |
| CLASS R4 | | | 2016 | | | 2015 | | | 2014 | | | 20131 | |
Net asset value, beginning of period | | | $16.59 | | | | $18.79 | | | | $22.52 | | | | $20.83 | | | | $18.22 | |
Net investment income (loss) | | | 0.03 | 2 | | | 0.01 | 2 | | | (0.01 | )2 | | | (0.02 | ) | | | 0.05 | |
Net realized and unrealized gains (losses) on investments | | | 0.33 | | | | 0.06 | | | | 2.23 | | | | 3.99 | | | | 2.95 | |
| | | | | | | | | | | | | | | | | | | | |
Total from investment operations | | | 0.36 | | | | 0.07 | | | | 2.22 | | | | 3.97 | | | | 3.00 | |
Distributions to shareholders from | | | | | | | | | | | | | | | | | | | | |
Net investment income | | | (0.04 | ) | | | 0.00 | | | | 0.00 | | | | (0.05 | ) | | | (0.09 | ) |
Net realized gains | | | (0.41 | ) | | | (2.27 | ) | | | (5.95 | ) | | | (2.23 | ) | | | (0.30 | ) |
| | | | | | | | | | | | | | | | | | | | |
Total distributions to shareholders | | | (0.45 | ) | | | (2.27 | ) | | | (5.95 | ) | | | (2.28 | ) | | | (0.39 | ) |
Net asset value, end of period | | | $16.50 | | | | $16.59 | | | | $18.79 | | | | $22.52 | | | | $20.83 | |
Total return3 | | | 2.21 | % | | | 1.03 | % | | | 11.35 | % | | | 19.56 | % | | | 16.86 | % |
Ratios to average net assets (annualized) | | | | | | | | | | | | | | | | | | | | |
Gross expenses | | | 0.94 | % | | | 0.93 | % | | | 0.91 | % | | | 0.91 | % | | | 0.90 | % |
Net expenses | | | 0.75 | % | | | 0.75 | % | | | 0.75 | % | | | 0.75 | % | | | 0.75 | % |
Net investment income (loss) | | | 0.41 | % | | | 0.08 | % | | | (0.04 | )% | | | (0.10 | )% | | | 0.37 | % |
Supplemental data | | | | | | | | | | | | | | | | | | | | |
Portfolio turnover rate | | | 39 | % | | | 85 | % | | | 114 | % | | | 94 | % | | | 107 | % |
Net assets, end of period (000s omitted) | | | $16 | | | | $16 | | | | $16 | | | | $14 | | | | $12 | |
| 1 | For the period from November 30, 2012 (commencement of class operations) to July 31, 2013 |
| 2 | Calculated based upon average shares outstanding |
| 3 | Returns for periods of less than one year are not annualized. |
The accompanying notes are an integral part of these financial statements.
| | | | |
| 16 | | Wells Fargo Capital Growth Fund | | Financial highlights |
(For a share outstanding throughout each period)
| | | | | | | | | | | | | | | | | | | | |
| | | Six months ended
January 31, 2017 (unaudited) | | | Year ended July 31 | |
| CLASS R6 | | | 2016 | | | 2015 | | | 2014 | | | 20131 | |
Net asset value, beginning of period | | | $16.70 | | | | $18.87 | | | | $22.56 | | | | $20.85 | | | | $18.22 | |
Net investment income | | | 0.05 | 2 | | | 0.04 | 2 | | | 0.02 | | | | 0.00 | 2,3 | | | 0.07 | |
Net realized and unrealized gains (losses) on investments | | | 0.33 | | | | 0.06 | | | | 2.24 | | | | 4.00 | | | | 2.95 | |
| | | | | | | | | | | | | | | | | | | | |
Total from investment operations | | | 0.38 | | | | 0.10 | | | | 2.26 | | | | 4.00 | | | | 3.02 | |
Distributions to shareholders from | | | | | | | | | | | | | | | | | | | | |
Net investment income | | | (0.05 | ) | | | 0.00 | | | | 0.00 | | | | (0.06 | ) | | | (0.09 | ) |
Net realized gains | | | (0.41 | ) | | | (2.27 | ) | | | (5.95 | ) | | | (2.23 | ) | | | (0.30 | ) |
| | | | | | | | | | | | | | | | | | | | |
Total distributions to shareholders | | | (0.46 | ) | | | (2.27 | ) | | | (5.95 | ) | | | (2.29 | ) | | | (0.39 | ) |
Net asset value, end of period | | | $16.62 | | | | $16.70 | | | | $18.87 | | | | $22.56 | | | | $20.85 | |
Total return4 | | | 2.32 | % | | | 1.20 | % | | | 11.54 | % | | | 19.71 | % | | | 16.99 | % |
Ratios to average net assets (annualized) | | | | | | | | | | | | | | | | | | | | |
Gross expenses | | | 0.81 | % | | | 0.81 | % | | | 0.79 | % | | | 0.78 | % | | | 0.79 | % |
Net expenses | | | 0.60 | % | | | 0.60 | % | | | 0.60 | % | | | 0.60 | % | | | 0.60 | % |
Net investment income | | | 0.56 | % | | | 0.23 | % | | | 0.11 | % | | | 0.01 | % | | | 0.52 | % |
Supplemental data | | | | | | | | | | | | | | | | | | | | |
Portfolio turnover rate | | | 39 | % | | | 85 | % | | | 114 | % | | | 94 | % | | | 107 | % |
Net assets, end of period (000s omitted) | | | $132,925 | | | | $140,581 | | | | $153,009 | | | | $142,754 | | | | $58 | |
| 1 | For the period from November 30, 2012 (commencement of class operations) to July 31, 2013 |
| 2 | Calculated based upon average shares outstanding |
| 3 | Amount is less than $0.005. |
| 4 | Returns for periods of less than one year are not annualized. |
The accompanying notes are an integral part of these financial statements.
| | | | | | |
| Financial highlights | | Wells Fargo Capital Growth Fund | | | 17 | |
(For a share outstanding throughout each period)
| | | | | | | | | | | | | | | | | | | | | | | | |
| | | Six months ended
January 31, 2017 (unaudited) | | | Year ended July 31 | |
| ADMINISTRATOR CLASS | | | 2016 | | | 2015 | | | 2014 | | | 2013 | | | 2012 | |
Net asset value, beginning of period | | | $16.20 | | | | $18.43 | | | | $22.22 | | | | $20.61 | | | | $17.32 | | | | $16.77 | |
Net investment income (loss) | | | 0.02 | 1 | | | (0.01 | )1 | | | (0.03 | )1 | | | (0.05 | )1 | | | 0.04 | 1 | | | (0.00 | )1,2 |
Net realized and unrealized gains (losses) on investments | | | 0.32 | | | | 0.05 | | | | 2.19 | | | | 3.93 | | | | 3.55 | | | | 0.55 | |
| | | | | | | | | | | | | | | | | | | | | | | | |
Total from investment operations | | | 0.34 | | | | 0.04 | | | | 2.16 | | | | 3.88 | | | | 3.59 | | | | 0.55 | |
Distributions to shareholders from | | | | | | | | | | | | | | | | | | | | | | | | |
Net investment income | | | (0.03 | ) | | | 0.00 | | | | 0.00 | | | | (0.04 | ) | | | 0.00 | | | | 0.00 | |
Net realized gains | | | (0.41 | ) | | | (2.27 | ) | | | (5.95 | ) | | | (2.23 | ) | | | (0.30 | ) | | | 0.00 | |
| | | | | | | | | | | | | | | | | | | | | | | | |
Total distributions to shareholders | | | (0.44 | ) | | | (2.27 | ) | | | (5.95 | ) | | | (2.27 | ) | | | (0.30 | ) | | | 0.00 | |
Net asset value, end of period | | | $16.10 | | | | $16.20 | | | | $18.43 | | | | $22.22 | | | | $20.61 | | | | $17.32 | |
Total return3 | | | 2.11 | % | | | 0.88 | % | | | 11.22 | % | | | 19.35 | % | | | 21.15 | % | | | 3.22 | % |
Ratios to average net assets (annualized) | | | | | | | | | | | | | | | | | | | | | | | | |
Gross expenses | | | 1.16 | % | | | 1.16 | % | | | 1.11 | % | | | 1.09 | % | | | 1.09 | % | | | 1.05 | % |
Net expenses | | | 0.94 | % | | | 0.93 | % | | | 0.90 | % | | | 0.90 | % | | | 0.91 | % | | | 0.94 | % |
Net investment income (loss) | | | 0.28 | % | | | (0.09 | )% | | | (0.16 | )% | | | (0.24 | )% | | | 0.24 | % | | | (0.01 | )% |
Supplemental data | | | | | | | | | | | | | | | | | | | | | | | | |
Portfolio turnover rate | | | 39 | % | | | 85 | % | | | 114 | % | | | 94 | % | | | 107 | % | | | 116 | % |
Net assets, end of period (000s omitted) | | | $20,652 | | | | $31,064 | | | | $34,886 | | | | $67,830 | | | | $63,786 | | | | $74,529 | |
| 1 | Calculated based upon average shares outstanding |
| 2 | Amount is less than $0.005. |
| 3 | Returns for periods of less than one year are not annualized. |
The accompanying notes are an integral part of these financial statements.
| | | | |
| 18 | | Wells Fargo Capital Growth Fund | | Financial highlights |
(For a share outstanding throughout each period)
| | | | | | | | | | | | | | | | | | | | | | | | |
| | | Six months ended
January 31, 2017 (unaudited) | | | Year ended July 31 | |
| INSTITUTIONAL CLASS | | | 2016 | | | 2015 | | | 2014 | | | 2013 | | | 2012 | |
Net asset value, beginning of period | | | $16.65 | | | | $18.84 | | | | $22.54 | | | | $20.84 | | | | $17.56 | | | | $16.96 | |
Net investment income | | | 0.04 | 1 | | | 0.03 | 1 | | | 0.02 | 1 | | | 0.01 | 1 | | | 0.09 | 1 | | | 0.03 | 1 |
Net realized and unrealized gains (losses) on investments | | | 0.32 | | | | 0.05 | | | | 2.23 | | | | 4.00 | | | | 3.58 | | | | 0.57 | |
| | | | | | | | | | | | | | | | | | | | | | | | |
Total from investment operations | | | 0.36 | | | | 0.08 | | | | 2.25 | | | | 4.01 | | | | 3.67 | | | | 0.60 | |
Distributions to shareholders from | | | | | | | | | | | | | | | | | | | | | | | | |
Net investment income | | | (0.04 | ) | | | 0.00 | | | | 0.00 | | | | (0.08 | ) | | | (0.09 | ) | | | 0.00 | |
Net realized gains | | | (0.41 | ) | | | (2.27 | ) | | | (5.95 | ) | | | (2.23 | ) | | | (0.30 | ) | | | 0.00 | |
| | | | | | | | | | | | | | | | | | | | | | | | |
Total distributions to shareholders | | | (0.45 | ) | | | (2.27 | ) | | | (5.95 | ) | | | (2.31 | ) | | | (0.39 | ) | | | 0.00 | |
Net asset value, end of period | | | $16.56 | | | | $16.65 | | | | $18.84 | | | | $22.54 | | | | $20.84 | | | | $17.56 | |
Total return2 | | | 2.22 | % | | | 1.09 | % | | | 11.50 | % | | | 19.76 | % | | | 21.42 | % | | | 3.48 | % |
Ratios to average net assets (annualized) | | | | | | | | | | | | | | | | | | | | | | | | |
Gross expenses | | | 0.91 | % | | | 0.91 | % | | | 0.84 | % | | | 0.82 | % | | | 0.82 | % | | | 0.78 | % |
Net expenses | | | 0.70 | % | | | 0.68 | % | | | 0.65 | % | | | 0.65 | % | | | 0.67 | % | | | 0.70 | % |
Net investment income | | | 0.43 | % | | | 0.16 | % | | | 0.09 | % | | | 0.05 | % | | | 0.46 | % | | | 0.21 | % |
Supplemental data | | | | | | | | | | | | | | | | | | | | | | | | |
Portfolio turnover rate | | | 39 | % | | | 85 | % | | | 114 | % | | | 94 | % | | | 107 | % | | | 116 | % |
Net assets, end of period (000s omitted) | | | $24,496 | | | | $23,670 | | | | $22,578 | | | | $49,816 | | | | $331,310 | | | | $543,933 | |
| 1 | Calculated based upon average shares outstanding |
| 2 | Returns for periods of less than one year are not annualized. |
The accompanying notes are an integral part of these financial statements.
| | | | | | |
| Notes to financial statements (unaudited) | | Wells Fargo Capital Growth Fund | | | 19 | |
1. ORGANIZATION
Wells Fargo Funds Trust (the “Trust”), a Delaware statutory trust organized on March 10, 1999, is an open-end management investment company registered under the Investment Company Act of 1940, as amended (the “1940 Act”). As an investment company, the Trust follows the accounting and reporting guidance in Financial Accounting Standards Board (“FASB”) Accounting Standards Codification Topic 946, Financial Services – Investment Companies. These financial statements report on the Wells Fargo Capital Growth Fund (the “Fund”) which is a diversified series of the Trust.
Effective at the close of business on October 23, 2015, Investor Class shares became Class A shares in a tax-free conversion. Shareholders of Investor Class received Class A shares at a value equal to the value of their Investor Class shares immediately prior to the conversion. Investor Class shares are no longer offered by the Fund.
2. SIGNIFICANT ACCOUNTING POLICIES
The following significant accounting policies, which are consistently followed in the preparation of the financial statements of the Fund, are in conformity with U.S. generally accepted accounting principles which require management to make estimates and assumptions that affect the reported amounts of assets and liabilities, disclosure of contingent assets and liabilities at the date of the financial statements, and the reported amounts of revenues and expenses during the reporting period. Actual results could differ from those estimates.
Securities valuation
All investments are valued each business day as of the close of regular trading on the New York Stock Exchange (generally 4 p.m. Eastern Time), although the Fund may deviate from this calculation time under unusual or unexpected circumstances.
Equity securities that are listed on a foreign or domestic exchange or market are valued at the official closing price or, if none, the last sales price. If no sale occurs on the principal exchange or market that day, the prior day’s price will be deemed “stale” and a fair value price will be determined in accordance with the Fund’s Valuation Procedures.
Investments in registered open-end investment companies are valued at net asset value. Interests in non-registered investment vehicles that are redeemable at net asset value are fair valued normally at net asset value.
Investments which are not valued using any of the methods discussed above are valued at their fair value, as determined in good faith by the Board of Trustees of the Fund. The Board of Trustees has established a Valuation Committee comprised of the Trustees and has delegated to it the authority to take any actions regarding the valuation of portfolio securities that the Valuation Committee deems necessary or appropriate, including determining the fair value of portfolio securities, unless the determination has been delegated to the Management Valuation Team of Wells Fargo Funds Management, LLC (“Funds Management”). The Board of Trustees retains the authority to make or ratify any valuation decisions or approve any changes to the Valuation Procedures as it deems appropriate. On a quarterly basis, the Board of Trustees receives reports on any valuation actions taken by the Valuation Committee or the Management Valuation Team which may include items for ratification.
Valuations of fair valued securities are compared to the next actual sales price when available, or other appropriate market values, to assess the continued appropriateness of the fair valuation methodologies used. These securities are fair valued on a day-to-day basis, taking into consideration changes to appropriate market information and any significant changes to the inputs considered in the valuation process until there is a readily available price provided on an exchange or by an independent pricing service. Valuations received from an independent pricing service or independent broker-dealer quotes are periodically validated by comparisons to most recent trades and valuations provided by other independent pricing services in addition to the review of prices by the manager and/or subadviser. Unobservable inputs used in determining fair valuations are identified based on the type of security, taking into consideration factors utilized by market participants in valuing the investment, knowledge about the issuer and the current market environment.
Security loans
The Fund may lend its securities from time to time in order to earn additional income in the form of fees or interest on securities received as collateral or the investment of any cash received as collateral. The Fund continues to receive interest or dividends on the securities loaned. The Fund receives collateral in the form of cash or securities with a value at least equal to the value of the securities on loan. The value of the loaned securities is determined at the close of each business day and any additional required collateral is delivered to the Fund on the next business day. In a securities lending transaction, the net asset value of the Fund will be affected by an increase or decrease in the value of the securities loaned and by an increase or decrease in the value of the instrument in which collateral is invested. The amount of securities lending activity undertaken by the Fund fluctuates from time to time. In the event of default or bankruptcy
| | | | |
| 20 | | Wells Fargo Capital Growth Fund | | Notes to financial statements (unaudited) |
by the borrower, the Fund may be prevented from recovering the loaned securities or gaining access to the collateral or may experience delays or costs in doing so. In addition, the investment of any cash collateral received may lose all or part of its value. The Fund has the right under the lending agreement to recover the securities from the borrower on demand.
The Fund lends its securities through an unaffiliated securities lending agent. Cash collateral received in connection with its securities lending transactions is invested in Securities Lending Cash Investments, LLC (the “Securities Lending Fund”). The Securities Lending Fund is exempt from registration under Section 3(c)(7) of the 1940 Act and is managed by Funds Management and is subadvised by Wells Capital Management Incorporated (“WellsCap”), an affiliate of Funds Management and an indirect wholly owned subsidiary of Wells Fargo & Company (“Wells Fargo”). Funds Management receives an advisory fee starting at 0.05% and declining to 0.01% as the average daily net assets of the Securities Lending Fund increase. All of the fees received by Funds Management are paid to WellsCap for its services as subadviser. The Securities Lending Fund seeks to provide a positive return compared to the daily Fed Funds Open rate by investing in high-quality, U.S. dollar-denominated short-term money market instruments. Securities Lending Fund investments are valued at the evaluated bid price provided by an independent pricing service.
Security transactions and income recognition
Securities transactions are recorded on a trade date basis. Realized gains or losses are recorded on the basis of identified cost.
Dividend income is recognized on the ex-dividend date. Dividend income is recorded net of foreign taxes withheld where recovery of such taxes is not assured.
Distributions to shareholders
Distributions to shareholders from net investment income and net realized gains, if any, are recorded on the ex-dividend date. Such distributions are determined in conformity with federal income tax regulations, which may differ in amount or character from net investment income and realized gains recognized for purposes of U.S. generally accepted accounting principles.
Federal and other taxes
The Fund intends to continue to qualify as a regulated investment company by distributing substantially all of its investment company taxable income and any net realized capital gains (after reduction for capital loss carryforwards) sufficient to relieve it from all, or substantially all, federal income taxes. Accordingly, no provision for federal income taxes was required.
The Fund’s income and federal excise tax returns and all financial records supporting those returns for the prior three fiscal years are subject to examination by the federal and Delaware revenue authorities. Management has analyzed the Fund’s tax positions taken on federal, state, and foreign tax returns for all open tax years and does not believe that there are any uncertain tax positions that require recognition of a tax liability.
As of July 31, 2016, the Fund had current year deferred post-October capital losses consisting of $1,426,783 in short-term losses which were recognized on the first day of the current fiscal year.
Class allocations
The separate classes of shares offered by the Fund differ principally in applicable sales charges, distribution, shareholder servicing, and administration fees. Class specific expenses are charged directly to that share class. Investment income, common expenses, and realized and unrealized gains (losses) on investments are allocated daily to each class of shares based on the relative proportion of net assets of each class.
3. FAIR VALUATION MEASUREMENTS
Fair value measurements of investments are determined within a framework that has established a fair value hierarchy based upon the various data inputs utilized in determining the value of the Fund’s investments. The three-level hierarchy gives the highest priority to unadjusted quoted prices in active markets for identical assets or liabilities (Level 1) and the lowest priority to significant unobservable inputs (Level 3). The Fund’s investments are classified within the fair value hierarchy based on the lowest level of input that is significant to the fair value measurement. The inputs are summarized into three broad levels as follows:
| ∎ | | Level 1 – quoted prices in active markets for identical securities |
| ∎ | | Level 2 – other significant observable inputs (including quoted prices for similar securities, interest rates, prepayment speeds, credit risk, etc.) |
| ∎ | | Level 3 – significant unobservable inputs (including the Fund’s own assumptions in determining the fair value of investments) |
| | | | | | |
| Notes to financial statements (unaudited) | | Wells Fargo Capital Growth Fund | | | 21 | |
The inputs or methodologies used for valuing investments in securities are not necessarily an indication of the risk associated with investing in those securities.
The following is a summary of the inputs used in valuing the Fund’s assets and liabilities as of January 31, 2017:
| | | | | | | | | | | | | | | | |
| | | Quoted prices
(Level 1) | | | Other significant
observable inputs
(Level 2) | | | Significant
unobservable inputs
(Level 3) | | | Total | |
Assets | | | | | | | | | | | | | | | | |
Investments in: | | | | | | | | | | | | | | | | |
| | | | |
Common stocks | | | | | | | | | | | | | | | | |
Consumer discretionary | | $ | 53,205,628 | | | $ | 0 | | | $ | 0 | | | $ | 53,205,628 | |
Consumer staples | | | 11,573,651 | | | | 0 | | | | 0 | | | | 11,573,651 | |
Financials | | | 12,799,381 | | | | 0 | | | | 0 | | | | 12,799,381 | |
Health care | | | 31,420,799 | | | | 0 | | | | 0 | | | | 31,420,799 | |
Industrials | | | 28,920,902 | | | | 0 | | | | 0 | | | | 28,920,902 | |
Information technology | | | 103,584,873 | | | | 0 | | | | 0 | | | | 103,584,873 | |
Materials | | | 7,750,067 | | | | 0 | | | | 0 | | | | 7,750,067 | |
| | | | |
Short-term investments | | | | | | | | | | | | | | | | |
Investment companies | | | 4,627,172 | | | | 0 | | | | 0 | | | | 4,627,172 | |
Total assets | | $ | 253,882,473 | | | $ | 0 | | | $ | 0 | | | $ | 253,882,473 | |
The Fund recognizes transfers between levels within the fair value hierarchy at the end of the reporting period. At January 31, 2017, the Fund did not have any transfers into/out of Level 1, Level 2, or Level 3.
4. TRANSACTIONS WITH AFFILIATES AND OTHER EXPENSES
Management fee
Funds Management, an indirect wholly owned subsidiary of Wells Fargo, is the manager of the Fund and provides advisory and fund-level administrative services under an investment management agreement. Under the investment management agreement, Funds Management is responsible for, among other services, implementing the investment objectives and strategies of the Fund, supervising the subadviser, providing fund-level administrative services in connection with the Fund’s operations, and providing any other fund-level administrative services reasonably necessary for the operation of the Fund. As compensation for its services under the investment management agreement, Funds Management is entitled to receive an annual management fee starting at 0.70% and declining to 0.505% as the average daily net assets of the Fund increase. For the six months ended January 31, 2017, the management fee was equivalent to an annual rate of 0.70% of the Fund’s average daily net assets.
Funds Management has retained the services of a subadviser to provide daily portfolio management to the Fund. The fee for subadvisory services is borne by Funds Management. WellsCap is the subadviser to the Fund and is entitled to receive a fee from Funds Management at an annual rate starting at 0.30% and declining to 0.20% as the average daily net assets of the Fund increase.
Administration fees
Under a class-level administration agreement, Funds Management provides class-level administrative services to the Fund, which includes paying fees and expenses for services provided by the transfer agent, sub-transfer agents, omnibus account servicers and record-keepers. As compensation for its services under the class-level administration agreement, Funds Management receives an annual fee which is calculated based on the average daily net assets of each class as follows:
| | | | |
| | | Class-level
administration fee | |
Class A, Class C | | | 0.21 | % |
Class R4 | | | 0.08 | |
Class R6 | | | 0.03 | |
Administrator Class, Institutional Class | | | 0.13 | |
| | | | |
| 22 | | Wells Fargo Capital Growth Fund | | Notes to financial statements (unaudited) |
Funds Management has contractually waived and/or reimbursed management and administration fees to the extent necessary to maintain certain net operating expense ratios for the Fund. Waiver of fees and/or reimbursement of expenses by Funds Management were made first from fund level expenses on a proportionate basis and then from class specific expenses. Funds Management has committed through November 30, 2017 to waive fees and/or reimburse expenses to the extent necessary to cap the Fund’s expenses at 1.11% for Class A shares, 1.86% for Class C shares, 0.75% for Class R4 shares, 0.60% for R6 shares, 0.94% for Administrator Class shares, and 0.70% for Institutional Class shares. After this time, the cap may be increased or the commitment to maintain the cap may be terminated only with the approval of the Board of Trustees.
During the six months ended January 31, 2017, State Street Bank and Trust Company, the Fund’s custodian, reimbursed the Fund $239 for certain out-of-pocket expenses that were billed to the Fund in error from 1998-2015. This amount is included in dividend income on the Statement of Operations. In addition, Funds Management was also reimbursed $3,471 for waivers/reimbursements it made to the Fund during the period the Fund was erroneously billed.
Distribution fee
The Trust has adopted a distribution plan for Class C shares of the Fund pursuant to Rule 12b-1 under the 1940 Act. A distribution fee is charged to Class C shares and paid to Wells Fargo Funds Distributor, LLC (“Funds Distributor”), the principal underwriter, at an annual rate of 0.75% of the average daily net assets of Class C shares.
In addition, Funds Distributor is entitled to receive the front-end sales charge from the purchase of Class A shares and a contingent deferred sales charge on the redemption of certain Class A shares. Funds Distributor is also entitled to receive the contingent deferred sales charges from redemptions of Class C shares. For the six months ended January 31, 2017, Funds Distributor received $531 from the sale of Class A shares.
Shareholder servicing fees
The Trust has entered into contracts with one or more shareholder servicing agents, whereby Class A, Class C, and Administrator Class of the Fund are charged a fee at an annual rate of 0.25% of the average daily net assets of each respective class. Class R4 is charged a fee at an annual rate of 0.10% of its average daily net assets.
A portion of these total shareholder servicing fees were paid to affiliates of Wells Fargo.
5. INVESTMENT PORTFOLIO TRANSACTIONS
Purchases and sales of investments, excluding U.S. government obligations (if any) and short-term securities, for the six months ended January 31, 2017 were $100,617,238 and $131,523,992, respectively.
The Fund may purchase or sell investment securities to other Wells Fargo funds under procedures adopted by the Board of Trustees. The procedures have been designed to ensure that these interfund transactions, which generally do not incur broker commissions, are effected at current market prices. Interfund trades are included within the respective purchases and sales amounts shown.
6. BANK BORROWINGS
The Trust (excluding the money market funds and certain other funds) and Wells Fargo Variable Trust are parties to a $250,000,000 revolving credit agreement whereby the Fund is permitted to use bank borrowings for temporary or emergency purposes, such as to fund shareholder redemption requests. Interest under the credit agreement is charged to the Fund based on a borrowing rate equal to the higher of the Federal Funds rate in effect on that day plus 1.25% or the overnight LIBOR rate in effect on that day plus 1.25%. In addition, an annual commitment fee equal to 0.25% of the unused balance is allocated to each participating fund. Prior to August 30, 2016, the revolving credit agreement amount was $200,000,000 and the annual commitment fee was equal to 0.20% of the unused balance which was allocated to each participating fund.
For the six months ended January 31, 2017, there were no borrowings by the Fund under the agreement.
7. CONCENTRATION RISK
Concentration risks result from exposure to a limited number of sectors. A fund that invests a substantial portion of its assets in any sector may be more affected by changes in that sector than would be a fund whose investments are not heavily weighted in any sector.
| | | | | | |
| Notes to financial statements (unaudited) | | Wells Fargo Capital Growth Fund | | | 23 | |
8. INDEMNIFICATION
Under the Trust’s organizational documents, the officers and Trustees have been granted certain indemnification rights against certain liabilities that may arise out of performance of their duties to the Trust. Additionally, in the normal course of business, the Trust may enter into contracts with service providers that contain a variety of indemnification clauses. The Trust’s maximum exposure under these arrangements is dependent on future claims that may be made against the Fund and, therefore, cannot be estimated.
9. NEW ACCOUNTING PRONOUNCEMENT
In December 2016, the Financial Accounting Standards Board (“FASB”) issued Accounting Standard Update (“ASU”) No. 2016-19, Technical Corrections and Improvements. ASU 2016-19 includes an amendment to FASB ASC Topic 820, Fair Value Measurement which clarifies the difference between a valuation approach and a valuation technique. The amendment also requires an entity to disclose when there has been a change in either or both a valuation approach and/or a valuation technique. The disclosure requirements are effective for fiscal years and interim periods within those fiscal years beginning after December 15, 2016. Management is currently evaluating the potential impact of this new guidance to the financial statements.
10. REGULATORY CHANGES
In October 2016, the Securities and Exchange Commission (“SEC”) adopted new rules and forms and amended existing rules and forms (together, “final rules”) intended to modernize and enhance the reporting and disclosure of information by registered investment companies and to enhance liquidity risk management by open-end mutual funds and exchange-traded funds. The final rules will enhance the quality of information available to investors and will allow the SEC to more effectively collect and use data reported by funds. In part, the final rules amend Regulation S-X and require standardized, enhanced disclosure about derivatives in the Fund’s financial statements, as well as other amendments. The compliance date for the amendments to Regulation S-X is August 1, 2017 while the compliance date for the new form types is June 1, 2018 and the compliance date for the liquidity risk management program requirements is December 1, 2018. Management is currently assessing the potential impact of these enhancements and their impact on the financial statement disclosures and reporting requirements.
| | | | |
| 24 | | Wells Fargo Capital Growth Fund | | Other information (unaudited) |
PROXY VOTING INFORMATION
A description of the policies and procedures that the Fund uses to determine how to vote proxies relating to portfolio securities is available, upon request, by calling 1-800-222-8222, visiting our website at wellsfargofunds.com, or visiting the SEC website at sec.gov. Information regarding how the Fund voted proxies relating to portfolio securities during the most recent 12-month period ended June 30 is available on the Fund’s website at wellsfargofunds.com or by visiting the SEC website at sec.gov.
PORTFOLIO HOLDINGS INFORMATION
The complete portfolio holdings for the Fund are publicly available monthly on the Fund’s website (wellsfargofunds.com), on a one-month delayed basis. In addition, top ten holdings information (excluding derivative positions) for the Fund is publicly available on the Fund’s website on a monthly, seven-day or more delayed basis. The Fund files its complete schedule of portfolio holdings with the SEC for the first and third quarters of each fiscal year on Form N-Q, which is available by visiting the SEC website at sec.gov. In addition, the Fund’s Form N-Q may be reviewed and copied at the SEC’s Public Reference Room in Washington, DC, and at regional offices in New York City, at 233 Broadway, and in Chicago, at 175 West Jackson Boulevard, Suite 900. Information about the Public Reference Room may be obtained by calling 1-800-SEC-0330.
| | | | | | |
| Other information (unaudited) | | Wells Fargo Capital Growth Fund | | | 25 | |
BOARD OF TRUSTEES AND OFFICERS
Each of the Trustees and Officers1 listed in the table below acts in identical capacities for each fund in the Wells Fargo family of funds, which consists of 138 mutual funds comprising the Wells Fargo Funds Trust, Wells Fargo Variable Trust, Wells Fargo Master Trust and four closed-end funds (collectively the “Fund Complex”). This table should be read in conjunction with the Prospectus and the Statement of Additional Information2. The mailing address of each Trustee and Officer is 525 Market Street, 12th Floor, San Francisco, CA 94105. Each Trustee and Officer serves an indefinite term, however, each Trustee serves such term until reaching the mandatory retirement age established by the Trustees.
Independent Trustees
| | | | | | |
Name and year of birth | | Position held and length of service* | | Principal occupations during past five years or longer | | Current other public company or
investment company directorships |
| William R. Ebsworth (Born 1957) | | Trustee, since 2015 | | Retired. From 1984 to 2013, equities analyst, portfolio manager, research director and chief financial officer at Fidelity Management and Research Company in Boston, Tokyo, and Hong Kong and retired in 2013 as Chief Investment Officer of Fidelity Strategic Advisers, Inc. where he lead a team of investment professionals managing client assets. Prior thereto, Board member of Hong Kong Securities Clearing Co., Hong Kong Options Clearing Corp., the Thailand International Fund, Ltd., Fidelity Investments Life Insurance Company, and Empire Fidelity Investments Life Insurance Company. Board member of the Fonté Foundation (non-profit organization) and the Vincent Memorial Hospital Endowment (non-profit organization), where he serves on the Investment Committee and as a Chair of the Audit Committee. Mr. Ebsworth is a CFA® charterholder and an Adjunct Lecturer, Finance, at Babson College. | | Asset Allocation Trust |
Jane A. Freeman (Born 1953) | | Trustee, since 2015 | | Retired. From 2012 to 2014 and 1999 to 2008, Chief Financial Officer of Scientific Learning Corporation. From 2008 to 2012, Ms. Freeman provided consulting services related to strategic business projects. Prior to 1999, Portfolio Manager at Rockefeller & Co. and Scudder, Stevens & Clark. Board member of the Harding Loevner Funds from 1996 to 2014, serving as both Lead Independent Director and chair of the Audit Committee. Board member of the Russell Exchange Traded Funds Trust from 2011 to 2012 and the chair of the Audit Committee. Ms. Freeman is Chair of Taproot Foundation (non-profit organization), a Board Member of Ruth Bancroft Garden (non-profit organization) and an inactive chartered financial analyst. | | Asset Allocation Trust |
Peter G. Gordon** (Born 1942) | | Trustee, since 1998; Chairman, since 2005 | | Co-Founder, Retired Chairman, President and CEO of Crystal Geyser Water Company. Trustee Emeritus, Colby College. | | Asset Allocation Trust |
Isaiah Harris, Jr. (Born 1952) | | Trustee, since 2009 | | Retired. Chairman of the Board of CIGNA Corporation since 2009, and Director since 2005. From 2003 to 2011, Director of Deluxe Corporation. Prior thereto, President and CEO of BellSouth Advertising and Publishing Corp. from 2005 to 2007, President and CEO of BellSouth Enterprises from 2004 to 2005 and President of BellSouth Consumer Services from 2000 to 2003. Emeritus member of the Iowa State University Foundation Board of Governors. Emeritus Member of the Advisory Board of Iowa State University School of Business. Advisory Board Member, Palm Harbor Academy (charter school). Advisory Board Member, Child Evangelism Fellowship (non-profit). Mr. Harris is a certified public accountant (inactive status). | | CIGNA Corporation; Asset Allocation Trust |
Judith M. Johnson (Born 1949) | | Trustee, since 2008; Audit Committee Chairman, since 2008 | | Retired. Prior thereto, Chief Executive Officer and Chief Investment Officer of Minneapolis Employees Retirement Fund from 1996 to 2008. Ms. Johnson is an attorney, certified public accountant and a certified managerial accountant. | | Asset Allocation Trust |
David F. Larcker (Born 1950) | | Trustee, since 2009 | | James Irvin Miller Professor of Accounting at the Graduate School of Business, Stanford University, Director of the Corporate Governance Research Initiative and Senior Faculty of The Rock Center for Corporate Governance since 2006. From 2005 to 2008, Professor of Accounting at the Graduate School of Business, Stanford University. Prior thereto, Ernst & Young Professor of Accounting at The Wharton School, University of Pennsylvania from 1985 to 2005. | | Asset Allocation Trust |
| | | | |
| 26 | | Wells Fargo Capital Growth Fund | | Other information (unaudited) |
| | | | | | |
Name and year of birth | | Position held and length of service* | | Principal occupations during past five years or longer | | Current other public company or
investment company directorships |
Olivia S. Mitchell (Born 1953) | | Trustee, since 2006 | | International Foundation of Employee Benefit Plans Professor, Wharton School of the University of Pennsylvania since 1993. Director of Wharton’s Pension Research Council and Boettner Center on Pensions & Retirement Research, and Research Associate at the National Bureau of Economic Research. Previously, Cornell University Professor from 1978 to 1993. | | Asset Allocation Trust |
Timothy J. Penny (Born 1951) | | Trustee, since 1996 | | President and Chief Executive Officer of Southern Minnesota Initiative Foundation, a non-profit organization, since 2007 and Senior Fellow at the Humphrey Institute Policy Forum at the University of Minnesota since 1995. Member of the Board of Trustees of NorthStar Education Finance, Inc., a non-profit organization, since 2007. | | Asset Allocation Trust |
| Michael S. Scofield (Born 1943) | | Trustee, since 2010 | | Served on the Investment Company Institute’s Board of Governors and Executive Committee from 2008-2011 as well the Governing Council of the Independent Directors Council from 2006-2011 and the Independent Directors Council Executive Committee from 2008-2011. Chairman of the IDC from 2008-2010. Institutional Investor (Fund Directions) Trustee of Year in 2007. Trustee of the Evergreen Funds complex (and its predecessors) from 1984 to 2010. Chairman of the Evergreen Funds from 2000-2010. Former Trustee of the Mentor Funds. Retired Attorney, Law Offices of Michael S. Scofield. | | Asset Allocation Trust |
| * | Length of service dates reflect the Trustee’s commencement of service with the Trust’s predecessor entities, where applicable. |
| ** | Peter Gordon is expected to retire on December 31, 2017. |
Officers
| | | | | | |
Name and year of birth | | Position held and
length of service | | Principal occupations during past five years or longer | | |
Andrew Owen (Born 1960) | | President, since 2017 | | Executive Vice President of Wells Fargo Bank, N.A. and President of Wells Fargo & Company and Head of Affiliated Managers, Wells Fargo Asset Management, since 2014. Executive Vice President responsible for marketing, investments and product development for Wells Fargo Funds Management, LLC, from 2009 to 2014. | | |
Jeremy DePalma1 (Born 1974) | | Treasurer, since 2012 | | Senior Vice President of Wells Fargo Funds Management, LLC since 2009. Senior Vice President of Evergreen Investment Management Company, LLC from 2008 to 2010 and head of the Fund Reporting and Control Team within Fund Administration from 2005 to 2010. | | |
C. David Messman (Born 1960) | | Secretary, since 2000; Chief Legal Officer, since 2003 | | Senior Vice President and Secretary of Wells Fargo Funds Management, LLC since 2001. Assistant General Counsel of Wells Fargo Bank, N.A. since 2013 and Vice President and Managing Counsel of Wells Fargo Bank, N.A. from 1996 to 2013. | | |
Michael Whitaker (Born 1967) | | Chief Compliance Officer, since 2016 | | Executive Vice President of Wells Fargo Funds Management, LLC since 2016. Chief Compliance Officer of Fidelity’s Fixed Income Funds and Asset Allocation Funds from 2008 to 2016, Compliance Officer of FMR Co., Inc. from 2014 to 2016, Fidelity Investments Money Management, Inc. from 2014 to 2016, Fidelity Investments from 2007 to 2016. | | |
David Berardi (Born 1975) | | Assistant Treasurer, since 2009 | | Vice President of Wells Fargo Funds Management, LLC since 2009. Vice President of Evergreen Investment Management Company, LLC from 2008 to 2010. Manager of Fund Reporting and Control for Evergreen Investment Management Company, LLC from 2004 to 2010. | | |
| 1 | Jeremy DePalma acts as Treasurer of 69 funds and Assistant Treasurer of 69 funds in the Fund Complex. |
| 2 | The Statement of Additional Information includes additional information about the Trustees and is available, without charge, upon request, by calling 1-800-222-8222 or by visiting the website at wellsfargofunds.com. |
| | | | | | |
| List of abbreviations | | Wells Fargo Capital Growth Fund | | | 27 | |
The following is a list of common abbreviations for terms and entities that may have appeared in this report.
| ACA | — ACA Financial Guaranty Corporation |
| ADR | — American depositary receipt |
| ADS | — American depositary shares |
| AGC | — Assured Guaranty Corporation |
| AGM | — Assured Guaranty Municipal |
| Ambac | — Ambac Financial Group Incorporated |
| AMT | — Alternative minimum tax |
| BAN | — Bond anticipation notes |
| BHAC | — Berkshire Hathaway Assurance Corporation |
| CAB | — Capital appreciation bond |
| CCAB | — Convertible capital appreciation bond |
| CDA | — Community Development Authority |
| CDO | — Collateralized debt obligation |
| DRIVER | — Derivative inverse tax-exempt receipts |
| DW&P | — Department of Water & Power |
| DWR | — Department of Water Resources |
| ECFA | — Educational & Cultural Facilities Authority |
| EDA | — Economic Development Authority |
| EDFA | — Economic Development Finance Authority |
| ETF | — Exchange-traded fund |
| FDIC | — Federal Deposit Insurance Corporation |
| FFCB | — Federal Farm Credit Banks |
| FGIC | — Financial Guaranty Insurance Corporation |
| FHA | — Federal Housing Administration |
| FHLB | — Federal Home Loan Bank |
| FHLMC | — Federal Home Loan Mortgage Corporation |
| FICO | — The Financing Corporation |
| FNMA | — Federal National Mortgage Association |
| GDR | — Global depositary receipt |
| GNMA | — Government National Mortgage Association |
| HCFR | — Healthcare facilities revenue |
| HEFA | — Health & Educational Facilities Authority |
| HEFAR | — Higher education facilities authority revenue |
| HFA | — Housing Finance Authority |
| HFFA | — Health Facilities Financing Authority |
| HUD | — Department of Housing and Urban Development |
| IDA | — Industrial Development Authority |
| IDAG | — Industrial Development Agency |
| KRW | — Republic of Korea won |
| LIBOR | — London Interbank Offered Rate |
| LIFER | — Long Inverse Floating Exempt Receipts |
| LLC | — Limited liability company |
| LLLP | — Limited liability limited partnership |
| LLP | — Limited liability partnership |
| MBIA | — Municipal Bond Insurance Association |
| MFHR | — Multifamily housing revenue |
| MSTR | — Municipal securities trust receipts |
| MUD | — Municipal Utility District |
| National | — National Public Finance Guarantee Corporation |
| PCFA | — Pollution Control Financing Authority |
| PCL | — Public Company Limited |
| PCR | — Pollution control revenue |
| PFA | — Public Finance Authority |
| PFFA | — Public Facilities Financing Authority |
| PFOTER | — Puttable floating option tax-exempt receipts |
| plc | — Public limited company |
| PUTTER | — Puttable tax-exempt receipts |
| R&D | — Research & development |
| Radian | — Radian Asset Assurance |
| RAN | — Revenue anticipation notes |
| RDA | — Redevelopment Authority |
| RDFA | — Redevelopment Finance Authority |
| REIT | — Real estate investment trust |
| ROC | — Reset option certificates |
| SAVRS | — Select auction variable rate securities |
| SBA | — Small Business Authority |
| SDR | — Swedish depositary receipt |
| SFHR | — Single-family housing revenue |
| SFMR | — Single-family mortgage revenue |
| SPA | — Standby purchase agreement |
| SPDR | — Standard & Poor’s Depositary Receipts |
| SPEAR | — Short Puttable Exempt Adjustable Receipts |
| STRIPS | — Separate trading of registered interest and |
| TAN | — Tax anticipation notes |
| TIPS | — Treasury inflation-protected securities |
| TRAN | — Tax revenue anticipation notes |
| TTFA | — Transportation Trust Fund Authority |
| TVA | — Tennessee Valley Authority |
This page is intentionally left blank.

For more information
More information about Wells Fargo Funds is available free upon request. To obtain literature, please write, email, visit the Fund’s website, or call:
Wells Fargo Funds
P.O. Box 8266
Boston, MA 02266-8266
Email: fundservice@wellsfargo.com
Website: wellsfargofunds.com
Individual investors: 1-800-222-8222
Retail investment professionals: 1-888-877-9275
Institutional investment professionals: 1-866-765-0778
This report and the financial statements contained herein are submitted for the general information of the shareholders of the Fund. If this report is used for promotional purposes, distribution of the report must be accompanied or preceded by a current prospectus. Before investing, please consider the investment objectives, risks, charges, and expenses of the investment. For a current prospectus and, if available, a summary prospectus, containing this information, call 1-800-222-8222 or visit the Fund’s website at wellsfargofunds.com. Read the prospectus carefully before you invest or send money.
Wells Fargo Asset Management (WFAM) is a trade name used by the asset management businesses of Wells Fargo & Company. Wells Fargo Funds Management, LLC, a wholly owned subsidiary of Wells Fargo & Company, provides investment advisory and administrative services for Wells Fargo Funds. Other affiliates of Wells Fargo & Company provide subadvisory and other services for the funds. The funds are distributed by Wells Fargo Funds Distributor, LLC, Member FINRA, an affiliate of Wells Fargo & Company. Neither Wells Fargo Funds Management nor Wells Fargo Funds Distributor has Fund customer accounts/assets, and neither provides investment advice/recommendations or acts as an investment advice fiduciary to any investor.
NOT FDIC INSURED ◾ NO BANK GUARANTEE ◾ MAY LOSE VALUE
© 2017 Wells Fargo Funds Management, LLC. All rights reserved.
| | |
 | | 301455 03-17 SA200/SAR200 01-17 |
Semi-Annual Report
January 31, 2017

Wells Fargo Disciplined U.S. Core Fund


Reduce clutter. Save trees.
Sign up for electronic delivery of prospectuses and shareholder reports at wellsfargo.com/advantagedelivery
Contents
The views expressed and any forward-looking statements are as of January 31, 2017, unless otherwise noted, and are those of the Fund managers and/or Wells Fargo Funds Management, LLC. Discussions of individual securities, or the markets generally, or any Wells Fargo Fund are not intended as individual recommendations. Future events or results may vary significantly from those expressed in any forward-looking statements. The views expressed are subject to change at any time in response to changing circumstances in the market. Wells Fargo Funds Management, LLC and the Fund disclaim any obligation to publicly update or revise any views expressed or forward-looking statements.
NOT FDIC INSURED ◾ NO BANK GUARANTEE ◾ MAY LOSE VALUE
| | | | |
| 2 | | Wells Fargo Disciplined U.S. Core Fund | | Letter to shareholders (unaudited) |

Andrew Owen
President
Wells Fargo Funds
U.S. and international stocks returned 5.96% and 4.16% for the six-month period, respectively; within fixed income, the Bloomberg Barclays U.S. Aggregate Bond Index3 returned -2.95%.
Dear Shareholder:
As the new president of Wells Fargo Funds now that Karla Rabusch is retiring from that position after nearly 14 years, I am pleased to offer you this semi-annual report for the Wells Fargo Disciplined U.S. Core Fund for the six-month period that ended January 31, 2017. Despite heightened market volatility, global stocks delivered favorable results overall. U.S. and international stocks returned 5.96% and 4.16% for the six-month period, respectively, as measured by the S&P 500 Index1 and the MSCI ACWI ex USA Index (Net)2; within fixed income, the Bloomberg Barclays U.S. Aggregate Bond Index3 returned -2.95%.
In August–September 2016, global stocks delivered generally positive results; bonds’ interest rates remained historically low.
From August into early September 2016, U.S. and international stocks generally trended upward. Ever since the Great Recession, markets worldwide have been supported to varying degrees by accommodative policies from leading central banks, including the Federal Reserve (Fed), European Central Bank, Bank of England, and Bank of Japan. As a result, investors have watched closely for any signs that global central banks might tighten their measures. In the U.S., early-September comments by several Fed officials appeared to suggest a September interest-rate increase, which sent stock and bond prices downward. However, stocks surged following the Fed’s September 20 meeting on news that the Fed had decided to delay a rate increase to later in 2016. In bond markets, interest rates remained at historically low levels as a result of easy monetary policies, subdued global growth, and modest inflation expectations. Yields rose, after bottoming in July, as market participants felt that yields had overshot the real risks of the U.K.’s Brexit vote and as economic activity strengthened. At the front end of the yield curve, anticipation of new money market fund rules resulted in significantly higher yields on many short-term securities.
During the fourth quarter of 2016, prospects for faster growth and higher interest rates in the U.S. largely influenced the markets.
Early in the fourth quarter of 2016, U.S. stocks tended to trade lower amid concerns such as a likely interest-rate increase and uncertainty over the approaching general election. However, following Donald Trump’s election as president in early November, U.S. stocks began to rally. Investors appeared optimistic that the new administration would usher in a series of pro-growth policies, and supportive economic news helped the rally carry through the quarter. The buoyant environment sent interest rates higher as well. At its mid-December meeting, Fed officials raised their short-term target interest rate for the first time in a year, by a quarter percentage point, to between 0.50% and 0.75%. The fourth quarter also saw the implementation of the Securities and Exchange Commission’s new rules for money market funds, which included floating net asset values (NAVs) for institutional prime and municipal money market funds as well as liquidity fees and redemption gates. In the year leading up to
| 1 | The S&P 500 Index consists of 500 stocks chosen for market size, liquidity, and industry group representation. It is a market-value-weighted index with each stock’s weight in the index proportionate to its market value. You cannot invest directly in an index. |
| 2 | The Morgan Stanley Capital International (MSCI) All Country World Index (ACWI) ex USA Index (Net) is a free-float-adjusted market-capitalization-weighted index that is designed to measure the equity market performance of developed markets, excluding the United States and Canada. Source: MSCI. MSCI makes no express or implied warranties or representations and shall have no liability whatsoever with respect to any MSCI data contained herein. The MSCI data may not be further redistributed or used as a basis for other indexes or any securities or financial products. This report is not approved, reviewed, or produced by MSCI. You cannot invest directly in an index. |
| 3 | The Bloomberg Barclays U.S. Aggregate Bond Index (formerly known as Barclays U.S. Aggregate Bond Index) is a broad-based benchmark that measures the investment-grade, U.S. dollar–denominated, fixed-rate taxable bond market, including Treasuries, government-related and corporate securities, mortgage-backed securities (agency fixed-rate and hybrid adjustable-rate mortgage pass-throughs), asset-backed securities, and commercial mortgage-backed securities. You cannot invest directly in an index. |
| | | | | | |
| Letter to shareholders (unaudited) | | Wells Fargo Disciplined U.S. Core Fund | | | 3 | |
money fund reform implementation, nearly $1 trillion in assets moved from these types of money market funds into government money market funds, which continued to transact at a stable $1 NAV. Outside of the U.S., the prospects for faster U.S. growth appeared to trigger some acceleration in Europe. The improvement may be partly attributable to expectations for further strengthening of the U.S. dollar, which in turn could improve demand for European goods in the U.S. due to weakening of the euro relative to the dollar.
Investor optimism continued into January 2017.
January brought continued strength in global stock markets. Markets were lifted by factors such as strong trade data from Japan, robust earnings reports by businesses, and investors’ hopes that the U.S. government will approve a large fiscal stimulus package.
Don’t let short-term uncertainty derail long-term investment goals.
Periods of uncertainty can present challenges, but experience has taught us that maintaining long-term investment goals can be an effective way to plan for the future. To help you create a sound strategy based on your personal goals and risk tolerance, Wells Fargo Funds offers more than 100 mutual funds spanning a wide range of asset classes and investment styles. Although diversification cannot guarantee an investment profit or prevent losses, we believe it can be an effective way to manage investment risk and potentially smooth out overall portfolio performance. We encourage investors to know their investments and to understand that appropriate levels of risk-taking may unlock opportunities.
Thank you for choosing to invest in Wells Fargo Funds. We appreciate your confidence in us and remain committed to helping you meet your financial needs.
Sincerely,

Andrew Owen
President
Wells Fargo Funds
Although diversification cannot guarantee an investment profit or prevent losses, we believe it can be an effective way to manage investment risk and potentially smooth out overall portfolio performance.
For further information about your Fund, contact your investment professional, visit our website at wellsfargofunds.com, or call us directly at 1-800-222-8222. We are available 24 hours a day, 7 days a week.
| | | | |
| 4 | | Wells Fargo Disciplined U.S. Core Fund | | Performance highlights (unaudited) |
Investment objective
The Fund seeks long-term capital appreciation.
Manager
Wells Fargo Funds Management, LLC
Subadviser
Golden Capital Management, LLC
Portfolio manager
Greg W. Golden, CFA®
Average annual total returns (%) as of January 31, 20171
| | | | | | | | | | | | | | | | | | | | | | | | | | | | | | | | | | |
| | | | | Including sales charge | | | Excluding sales charge | | | Expense ratios2 (%) | |
| | | Inception date | | 1 year | | | 5 year | | | 10 year | | | 1 year | | | 5 year | | | 10 year | | | Gross | | | Net3 | |
| Class A (EVSAX) | | 2-28-1990 | | | 12.22 | | | | 12.92 | | | | 6.26 | | | | 19.09 | | | | 14.27 | | | | 6.89 | | | | 0.87 | | | | 0.87 | |
| Class C (EVSTX) | | 6-30-1999 | | | 17.10 | | | | 13.40 | | | | 6.10 | | | | 18.10 | | | | 13.40 | | | | 6.10 | | | | 1.62 | | | | 1.62 | |
| Class R (EVSHX) | | 9-30-2015 | | | – | | | | – | | | | – | | | | 18.77 | | | | 13.97 | | | | 6.60 | | | | 1.12 | | | | 1.12 | |
| Class R6 (EVSRX) | | 9-30-2015 | | | – | | | | – | | | | – | | | | 19.53 | | | | 14.76 | | | | 7.29 | | | | 0.44 | | | | 0.43 | |
| Administrator Class (EVSYX) | | 2-21-1995 | | | – | | | | – | | | | – | | | | 19.17 | | | | 14.43 | | | | 7.10 | | | | 0.79 | | | | 0.74 | |
| Institutional Class (EVSIX) | | 7-30-2010 | | | – | | | | – | | | | – | | | | 19.50 | | | | 14.75 | | | | 7.28 | | | | 0.54 | | | | 0.48 | |
| S&P 500 Index4 | | – | | | – | | | | – | | | | – | | | | 20.04 | | | | 14.09 | | | | 6.99 | | | | – | | | | – | |
Figures quoted represent past performance, which is no guarantee of future results, and do not reflect taxes that a shareholder may pay on fund distributions or the redemption of fund shares. Investment return and principal value of an investment will fluctuate so that an investor’s shares, when redeemed, may be worth more or less than their original cost. Performance shown without sales charges would be lower if sales charges were reflected. Current performance may be lower or higher than the performance data quoted, which assumes the reinvestment of dividends and capital gains. Current month-end performance is available on the Fund’s website, wellsfargofunds.com.
Index returns do not include transaction costs associated with buying and selling securities, any mutual fund fees or expenses, or any taxes. It is not possible to invest directly in an index.
For Class A shares, the maximum front-end sales charge is 5.75%. For Class C shares, the maximum contingent deferred sales charge is 1.00%. Performance including a contingent deferred sales charge assumes the sales charge for the corresponding time period. Class R, Class R6, Administrator Class, and Institutional Class shares are sold without a front-end sales charge or contingent deferred sales charge.
Stock values fluctuate in response to the activities of individual companies and general market and economic conditions. The use of derivatives may reduce returns and/or increase volatility. Consult the Fund’s prospectus for additional information on these and other risks.
Please see footnotes on page 5.
| | | | | | |
| Performance highlights (unaudited) | | Wells Fargo Disciplined U.S. Core Fund | | | 5 | |
| | | | |
| Ten largest holdings (%) as of January 31, 20175 | |
Apple Incorporated | | | 3.70 | |
Microsoft Corporation | | | 3.12 | |
Exxon Mobil Corporation | | | 2.29 | |
Johnson & Johnson | | | 2.08 | |
AT&T Incorporated | | | 2.06 | |
Alphabet Incorporated Class A | | | 1.95 | |
Bank of America Corporation | | | 1.94 | |
Alphabet Incorporated Class C | | | 1.92 | |
Chevron Corporation | | | 1.77 | |
JPMorgan Chase & Company | | | 1.66 | |
|
| Sector distribution as of January 31, 20176 |
|
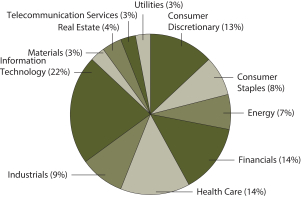 |
| 1 | Historical performance shown for Class R shares prior to their inception reflects the performance of Administrator Class shares, adjusted to reflect higher expenses applicable to Class R shares. Historical performance shown for Class R6 shares prior to their inception reflects the performance of Institutional Class shares, and includes the higher expenses applicable to Institutional Class shares. If these expenses had not been included, returns would be higher. Historical performance shown for Institutional Class shares prior to their inception reflects the performance of Administrator Class shares, and includes the higher expenses applicable to Administrator Class shares. If these expenses had not been included, returns would be higher. Historical performance shown for all classes of the Fund prior to July 19, 2010, is based on the performance of the Fund’s predecessor, Evergreen Enhanced S&P 500 Fund. |
| 2 | Reflects the expense ratios as stated in the most recent prospectuses. The expense ratios shown are subject to change and may differ from the annualized expense ratios shown in the financial highlights of this report. |
| 3 | The manager has contractually committed through November 30, 2017, to waive fees and/or reimburse expenses to the extent necessary to cap the Fund’s Total Annual Fund Operating Expenses After Fee Waiver at the amounts shown. After this time, the cap may be increased or the commitment to maintain the cap may be terminated only with the approval of the Board of Trustees. Brokerage commissions, stamp duty fees, interest, taxes, acquired fund fees and expenses, and extraordinary expenses are excluded from the expense cap. Without this cap, the Fund’s returns would have been lower. |
| 4 | The S&P 500 Index consists of 500 stocks chosen for market size, liquidity, and industry group representation. It is a market-value weighted index with each stock’s weight in the index proportionate to its market value. You cannot invest directly in an index. |
| 5 | The ten largest holdings, excluding cash and cash equivalents, are calculated based on the value of the investments divided by total net assets of the Fund. Holdings are subject to change and may have changed since the date specified. |
| 6 | Amounts are calculated based on the total long-term investments of the Fund. These amounts are subject to change and may have changed since the date specified. |
| | | | |
| 6 | | Wells Fargo Disciplined U.S. Core Fund | | Fund expenses (unaudited) |
As a shareholder of the Fund, you incur two types of costs: (1) transaction costs, including sales charges (loads) on purchase payments and contingent deferred sales charges (if any) on redemptions and (2) ongoing costs, including management fees, distribution (12b-1) and/or shareholder servicing fees, and other Fund expenses. This example is intended to help you understand your ongoing costs (in dollars) of investing in the Fund and to compare these costs with the ongoing costs of investing in other mutual funds.
The example is based on an investment of $1,000 invested at the beginning of the six-month period and held for the entire period from August 1, 2016 to January 31, 2017.
Actual expenses
The “Actual” line of the table below provides information about actual account values and actual expenses. You may use the information in this line, together with the amount you invested, to estimate the expenses that you paid over the period. Simply divide your account value by $1,000 (for example, an $8,600 account value divided by $1,000 = 8.6), then multiply the result by the number in the “Actual” line under the heading entitled “Expenses paid during period” for your applicable class of shares to estimate the expenses you paid on your account during this period.
Hypothetical example for comparison purposes
The “Hypothetical” line of the table below provides information about hypothetical account values and hypothetical expenses based on the Fund’s actual expense ratio and an assumed rate of return of 5% per year before expenses, which is not the Fund’s actual return. The hypothetical account values and expenses may not be used to estimate the actual ending account balance or expenses you paid for the period. You may use this information to compare the ongoing costs of investing in the Fund and other funds. To do so, compare this 5% hypothetical example with the 5% hypothetical examples that appear in the shareholder reports of the other funds.
Please note that the expenses shown in the table are meant to highlight your ongoing costs only and do not reflect any transactional costs, such as sales charges (loads) and contingent deferred sales charges. Therefore, the “Hypothetical” line of the table is useful in comparing ongoing costs only and will not help you determine the relative total costs of owning different funds. In addition, if these transactional costs were included, your costs would have been higher.
| | | | | | | | | | | | | | | | |
| | | Beginning
account value
8-01-2016 | | | Ending
account value
1-31-2017 | | | Expenses
paid during
the period¹ | | | Annualized net
expense ratio | |
Class A | | | | | | | | | | | | | | | | |
Actual | | $ | 1,000.00 | | | $ | 1,058.70 | | | $ | 4.40 | | | | 0.85 | % |
Hypothetical (5% return before expenses) | | $ | 1,000.00 | | | $ | 1,020.86 | | | $ | 4.32 | | | | 0.85 | % |
Class C | | | | | | | | | | | | | | | | |
Actual | | $ | 1,000.00 | | | $ | 1,054.56 | | | $ | 8.26 | | | | 1.60 | % |
Hypothetical (5% return before expenses) | | $ | 1,000.00 | | | $ | 1,017.09 | | | $ | 8.11 | | | | 1.60 | % |
Class R | | | | | | | | | | | | | | | | |
Actual | | $ | 1,000.00 | | | $ | 1,057.42 | | | $ | 5.69 | | | | 1.10 | % |
Hypothetical (5% return before expenses) | | $ | 1,000.00 | | | $ | 1,019.61 | | | $ | 5.58 | | | | 1.10 | % |
Class R6 | | | | | | | | | | | | | | | | |
Actual | | $ | 1,000.00 | | | $ | 1,060.12 | | | $ | 2.17 | | | | 0.42 | % |
Hypothetical (5% return before expenses) | | $ | 1,000.00 | | | $ | 1,023.03 | | | $ | 2.14 | | | | 0.42 | % |
Administrator Class | | | | | | | | | | | | | | | | |
Actual | | $ | 1,000.00 | | | $ | 1,059.31 | | | $ | 3.83 | | | | 0.74 | % |
Hypothetical (5% return before expenses) | | $ | 1,000.00 | | | $ | 1,021.42 | | | $ | 3.76 | | | | 0.74 | % |
Institutional Class | | | | | | | | | | | | | | | | |
Actual | | $ | 1,000.00 | | | $ | 1,060.22 | | | $ | 2.49 | | | | 0.48 | % |
Hypothetical (5% return before expenses) | | $ | 1,000.00 | | | $ | 1,022.72 | | | $ | 2.44 | | | | 0.48 | % |
| 1 | Expenses paid is equal to the annualized net expense ratio of each class multiplied by the average account value over the period, multiplied by the number of days in the most recent fiscal half-year divided by the number of days in the fiscal year (to reflect the one-half-year period). |
| | | | | | |
| Portfolio of investments—January 31, 2017 (unaudited) | | Wells Fargo Disciplined U.S. Core Fund | | | 7 | |
| | | | | | | | | | | | | | | | |
| Security name | | | | | | | | Shares | | | Value | |
| | | | |
Common Stocks: 98.08% | | | | | | | | | | | | | | | | |
| | | | |
Consumer Discretionary: 12.86% | | | | | | | | | | | | | | | | |
| | | | |
| Automobiles: 1.70% | | | | | | | | | | | | | | | | |
Ford Motor Company | | | | | | | | | | | 514,456 | | | $ | 6,358,676 | |
General Motors Company | | | | | | | | | | | 237,546 | | | | 8,696,559 | |
| | | | |
| | | | | | | | | | | | | | | 15,055,235 | |
| | | | | | | | | | | | | | | | |
| | | | |
| Hotels, Restaurants & Leisure: 1.73% | | | | | | | | | | | | | | | | |
Carnival Corporation | | | | | | | | | | | 36,878 | | | | 2,042,304 | |
Darden Restaurants Incorporated | | | | | | | | | | | 54,176 | | | | 3,970,017 | |
McDonald’s Corporation | | | | | | | | | | | 20,977 | | | | 2,571,151 | |
Starbucks Corporation | | | | | | | | | | | 121,729 | | | | 6,721,875 | |
| | | | |
| | | | | | | | | | | | | | | 15,305,347 | |
| | | | | | | | | | | | | | | | |
| | | | |
| Household Durables: 0.28% | | | | | | | | | | | | | | | | |
Garmin Limited « | | | | | | | | | | | 50,814 | | | | 2,453,808 | |
| | | | | | | | | | | | | | | | |
| | | | |
| Internet & Direct Marketing Retail: 1.50% | | | | | | | | | | | | | | | | |
Amazon.com Incorporated † | | | | | | | | | | | 16,066 | | | | 13,230,030 | |
| | | | | | | | | | | | | | | | |
| | | | |
| Media: 3.93% | | | | | | | | | | | | | | | | |
Comcast Corporation Class A | | | | | | | | | | | 171,711 | | | | 12,950,444 | |
News Corporation Class B | | | | | | | | | | | 501,026 | | | | 6,337,979 | |
The Walt Disney Company | | | | | | | | | | | 92,297 | | | | 10,212,663 | |
Twenty-First Century Fox Incorporated Class A | | | | | | | | | | | 167,108 | | | | 5,243,849 | |
| | | | |
| | | | | | | | | | | | | | | 34,744,935 | |
| | | | | | | | | | | | | | | | |
| | | | |
| Multiline Retail: 0.21% | | | | | | | | | | | | | | | | |
Macy’s Incorporated | | | | | | | | | | | 63,156 | | | | 1,865,628 | |
| | | | | | | | | | | | | | | | |
| | | | |
| Specialty Retail: 3.51% | | | | | | | | | | | | | | | | |
Best Buy Company Incorporated | | | | | | | | | | | 126,925 | | | | 5,650,701 | |
Lowe’s Companies Incorporated | | | | | | | | | | | 108,714 | | | | 7,944,819 | |
Staples Incorporated | | | | | | | | | | | 437,712 | | | | 4,026,950 | |
The Home Depot Incorporated | | | | | | | | | | | 97,785 | | | | 13,453,260 | |
| | | | |
| | | | | | | | | | | | | | | 31,075,730 | |
| | | | | | | | | | | | | | | | |
| | | | |
Consumer Staples: 8.31% | | | | | | | | | | | | | | | | |
| | | | |
| Beverages: 1.36% | | | | | | | | | | | | | | | | |
PepsiCo Incorporated | | | | | | | | | | | 76,773 | | | | 7,967,502 | |
The Coca-Cola Company | | | | | | | | | | | 97,496 | | | | 4,052,909 | |
| | | | |
| | | | | | | | | | | | | | | 12,020,411 | |
| | | | | | | | | | | | | | | | |
| | | | |
| Food & Staples Retailing: 3.16% | | | | | | | | | | | | | | | | |
CVS Health Corporation | | | | | | | | | | | 109,427 | | | | 8,623,942 | |
The Kroger Company | | | | | | | | | | | 222,767 | | | | 7,565,167 | |
Wal-Mart Stores Incorporated | | | | | | | | | | | 151,709 | | | | 10,125,059 | |
Walgreens Boots Alliance Incorporated | | | | | | | | | | | 19,991 | | | | 1,638,063 | |
| | | | |
| | | | | | | | | | | | | | | 27,952,231 | |
| | | | | | | | | | | | | | | | |
The accompanying notes are an integral part of these financial statements.
| | | | |
| 8 | | Wells Fargo Disciplined U.S. Core Fund | | Portfolio of investments—January 31, 2017 (unaudited) |
| | | | | | | | | | | | | | | | |
| Security name | | | | | | | | Shares | | | Value | |
| | | | |
| Food Products: 1.20% | | | | | | | | | | | | | | | | |
ConAgra Foods Incorporated | | | | | | | | | | | 45,435 | | | $ | 1,776,054 | |
Hormel Foods Corporation | | | | | | | | | | | 37,364 | | | | 1,356,313 | |
Tyson Foods Incorporated Class A | | | | | | | | | | | 119,370 | | | | 7,495,242 | |
| | | | |
| | | | | | | | | | | | | | | 10,627,609 | |
| | | | | | | | | | | | | | | | |
| | | | |
| Household Products: 0.91% | | | | | | | | | | | | | | | | |
Church & Dwight Company Incorporated | | | | | | | | | | | 39,919 | | | | 1,805,137 | |
Kimberly-Clark Corporation | | | | | | | | | | | 17,495 | | | | 2,119,169 | |
The Procter & Gamble Company | | | | | | | | | | | 46,884 | | | | 4,107,038 | |
| | | | |
| | | | | | | | | | | | | | | 8,031,344 | |
| | | | | | | | | | | | | | | | |
| | | | |
| Tobacco: 1.68% | | | | | | | | | | | | | | | | |
Altria Group Incorporated | | | | | | | | | | | 164,411 | | | | 11,702,775 | |
Philip Morris International | | | | | | | | | | | 32,672 | | | | 3,140,759 | |
| | | | |
| | | | | | | | | | | | | | | 14,843,534 | |
| | | | | | | | | | | | | | | | |
| | | | |
Energy: 6.38% | | | | | | | | | | | | | | | | |
| | | | |
| Energy Equipment & Services: 1.07% | | | | | | | | | | | | | | | | |
Baker Hughes Incorporated | | | | | | | | | | | 65,537 | | | | 4,134,074 | |
Schlumberger Limited | | | | | | | | | | | 63,747 | | | | 5,336,261 | |
| | | | |
| | | | | | | | | | | | | | | 9,470,335 | |
| | | | | | | | | | | | | | | | |
| | | | |
| Oil, Gas & Consumable Fuels: 5.31% | | | | | | | | | | | | | | | | |
Chevron Corporation | | | | | | | | | | | 140,735 | | | | 15,670,842 | |
Devon Energy Corporation | | | | | | | | | | | 40,977 | | | | 1,866,093 | |
Exxon Mobil Corporation | | | | | | | | | | | 240,918 | | | | 20,210,611 | |
Occidental Petroleum Corporation | | | | | | | | | | | 31,357 | | | | 2,125,064 | |
ONEOK Incorporated | | | | | | | | | | | 24,821 | | | | 1,367,885 | |
Range Resources Corporation | | | | | | | | | | | 54,756 | | | | 1,770,809 | |
Valero Energy Corporation | | | | | | | | | | | 60,143 | | | | 3,955,004 | |
| | | | |
| | | | | | | | | | | | | | | 46,966,308 | |
| | | | | | | | | | | | | | | | |
| | | | |
Financials: 13.46% | | | | | | | | | | | | | | | | |
| | | | |
| Banks: 5.97% | | | | | | | | | | | | | | | | |
Bank of America Corporation | | | | | | | | | | | 758,359 | | | | 17,169,248 | |
Citigroup Incorporated | | | | | | | | | | | 245,511 | | | | 13,706,879 | |
Citizens Financial Group Incorporated | | | | | | | | | | | 55,144 | | | | 1,994,558 | |
Fifth Third Bancorp | | | | | | | | | | | 89,972 | | | | 2,348,269 | |
JPMorgan Chase & Company | | | | | | | | | | | 173,102 | | | | 14,649,622 | |
Regions Financial Corporation | | | | | | | | | | | 119,484 | | | | 1,721,764 | |
SunTrust Banks Incorporated | | | | | | | | | | | 21,863 | | | | 1,242,256 | |
| | | | |
| | | | | | | | | | | | | | | 52,832,596 | |
| | | | | | | | | | | | | | | | |
| | | | |
| Capital Markets: 1.44% | | | | | | | | | | | | | | | | |
E*TRADE Financial Corporation † | | | | | | | | | | | 96,938 | | | | 3,630,328 | |
Morgan Stanley | | | | | | | | | | | 80,802 | | | | 3,433,277 | |
Northern Trust Corporation | | | | | | | | | | | 37,027 | | | | 3,071,760 | |
State Street Corporation | | | | | | | | | | | 34,237 | | | | 2,608,859 | |
| | | | |
| | | | | | | | | | | | | | | 12,744,224 | |
| | | | | | | | | | | | | | | | |
The accompanying notes are an integral part of these financial statements.
| | | | | | |
| Portfolio of investments—January 31, 2017 (unaudited) | | Wells Fargo Disciplined U.S. Core Fund | | | 9 | |
| | | | | | | | | | | | | | | | |
| Security name | | | | | | | | Shares | | | Value | |
| | | | |
| Consumer Finance: 0.55% | | | | | | | | | | | | | | | | |
Discover Financial Services | | | | | | | | | | | 31,363 | | | $ | 2,172,829 | |
Synchrony Financial | | | | | | | | | | | 75,311 | | | | 2,697,640 | |
| | | | |
| | | | | | | | | | | | | | | 4,870,469 | |
| | | | | | | | | | | | | | | | |
| | | | |
| Diversified Financial Services: 1.55% | | | | | | | | | | | | | | | | |
Berkshire Hathaway Incorporated Class B † | | | | | | | | | | | 83,498 | | | | 13,705,362 | |
| | | | | | | | | | | | | | | | |
| | | | |
| Insurance: 3.95% | | | | | | | | | | | | | | | | |
AFLAC Incorporated | | | | | | | | | | | 95,215 | | | | 6,664,098 | |
Aon plc | | | | | | | | | | | 15,446 | | | | 1,740,764 | |
MetLife Incorporated | | | | | | | | | | | 169,354 | | | | 9,214,551 | |
Principal Financial Group Incorporated | | | | | | | | | | | 86,020 | | | | 4,910,882 | |
Prudential Financial Incorporated | | | | | | | | | | | 81,570 | | | | 8,573,823 | |
The Travelers Companies Incorporated | | | | | | | | | | | 14,104 | | | | 1,661,169 | |
Unum Group | | | | | | | | | | | 46,807 | | | | 2,126,442 | |
| | | | |
| | | | | | | | | | | | | | | 34,891,729 | |
| | | | | | | | | | | | | | | | |
| | | | |
Health Care: 13.64% | | | | | | | | | | | | | | | | |
| | | | |
| Biotechnology: 2.66% | | | | | | | | | | | | | | | | |
AbbVie Incorporated | | | | | | | | | | | 99,107 | | | | 6,056,429 | |
Amgen Incorporated | | | | | | | | | | | 63,555 | | | | 9,957,797 | |
Gilead Sciences Incorporated | | | | | | | | | | | 103,208 | | | | 7,477,420 | |
| | | | |
| | | | | | | | | | | | | | | 23,491,646 | |
| | | | | | | | | | | | | | | | |
| | | | |
| Health Care Equipment & Supplies: 1.60% | | | | | | | | | | | | | | | | |
Baxter International Incorporated | | | | | | | | | | | 114,083 | | | | 5,465,717 | |
Medtronic plc | | | | | | | | | | | 114,972 | | | | 8,740,171 | |
| | | | |
| | | | | | | | | | | | | | | 14,205,888 | |
| | | | | | | | | | | | | | | | |
| | | | |
| Health Care Providers & Services: 3.79% | | | | | | | | | | | | | | | | |
Cardinal Health Incorporated | | | | | | | | | | | 70,540 | | | | 5,287,678 | |
Express Scripts Holding Company † | | | | | | | | | | | 27,594 | | | | 1,900,675 | |
Humana Incorporated | | | | | | | | | | | 36,793 | | | | 7,303,411 | |
McKesson Corporation | | | | | | | | | | | 45,027 | | | | 6,265,507 | |
UnitedHealth Group Incorporated | | | | | | | | | | | 78,597 | | | | 12,740,574 | |
| | | | |
| | | | | | | | | | | | | | | 33,497,845 | |
| | | | | | | | | | | | | | | | |
| | | | |
| Pharmaceuticals: 5.59% | | | | | | | | | | | | | | | | |
Bristol-Myers Squibb Company | | | | | | | | | | | 88,463 | | | | 4,348,841 | |
Johnson & Johnson | | | | | | | | | | | 162,495 | | | | 18,402,559 | |
Merck & Company Incorporated | | | | | | | | | | | 232,266 | | | | 14,398,169 | |
Pfizer Incorporated | | | | | | | | | | | 387,577 | | | | 12,297,818 | |
| | | | |
| | | | | | | | | | | | | | | 49,447,387 | |
| | | | | | | | | | | | | | | | |
| | | | |
Industrials: 9.16% | | | | | | | | | | | | | | | | |
| | | | |
| Aerospace & Defense: 1.79% | | | | | | | | | | | | | | | | |
General Dynamics Corporation | | | | | | | | | | | 13,316 | | | | 2,411,261 | |
Northrop Grumman Corporation | | | | | | | | | | | 7,463 | | | | 1,709,624 | |
The Boeing Company | | | | | | | | | | | 56,323 | | | | 9,204,305 | |
The accompanying notes are an integral part of these financial statements.
| | | | |
| 10 | | Wells Fargo Disciplined U.S. Core Fund | | Portfolio of investments—January 31, 2017 (unaudited) |
| | | | | | | | | | | | | | | | |
| Security name | | | | | | | | Shares | | | Value | |
| | | | |
| Aerospace & Defense (continued) | | | | | | | | | | | | | | | | |
United Technologies Corporation | | | | | | | | | | | 22,673 | | | $ | 2,486,548 | |
| | | | |
| | | | | | | | | | | | | | | 15,811,738 | |
| | | | | | | | | | | | | | | | |
| | | | |
| Air Freight & Logistics: 0.80% | | | | | | | | | | | | | | | | |
United Parcel Service Incorporated Class B | | | | | | | | | | | 64,902 | | | | 7,082,755 | |
| | | | | | | | | | | | | | | | |
| | | | |
| Airlines: 1.22% | | | | | | | | | | | | | | | | |
Delta Air Lines Incorporated | | | | | | | | | | | 121,262 | | | | 5,728,417 | |
United Continental Holdings Incorporated † | | | | | | | | | | | 72,033 | | | | 5,076,166 | |
| | | | |
| | | | | | | | | | | | | | | 10,804,583 | |
| | | | | | | | | | | | | | | | |
| | | | |
| Commercial Services & Supplies: 0.70% | | | | | | | | | | | | | | | | |
Waste Management Incorporated | | | | | | | | | | | 88,874 | | | | 6,176,743 | |
| | | | | | | | | | | | | | | | |
| | | | |
| Construction & Engineering: 0.68% | | | | | | | | | | | | | | | | |
Jacobs Engineering Group Incorporated | | | | | | | | | | | 60,732 | | | | 3,555,859 | |
Quanta Services Incorporated † | | | | | | | | | | | 67,936 | | | | 2,438,223 | |
| | | | |
| | | | | | | | | | | | | | | 5,994,082 | |
| | | | | | | | | | | | | | | | |
| | | | |
| Electrical Equipment: 0.56% | | | | | | | | | | | | | | | | |
Eaton Corporation plc | | | | | | | | | | | 69,887 | | | | 4,946,602 | |
| | | | | | | | | | | | | | | | |
| | | | |
| Industrial Conglomerates: 2.06% | | | | | | | | | | | | | | | | |
3M Company | | | | | | | | | | | 19,212 | | | | 3,358,642 | |
General Electric Company | | | | | | | | | | | 440,880 | | | | 13,094,136 | |
Honeywell International Incorporated | | | | | | | | | | | 14,761 | | | | 1,746,522 | |
| | | | |
| | | | | | | | | | | | | | | 18,199,300 | |
| | | | | | | | | | | | | | | | |
| | | | |
| Machinery: 1.05% | | | | | | | | | | | | | | | | |
Illinois Tool Works Incorporated | | | | | | | | | | | 21,291 | | | | 2,708,215 | |
Ingersoll-Rand plc | | | | | | | | | | | 44,630 | | | | 3,541,391 | |
Parker-Hannifin Corporation | | | | | | | | | | | 20,852 | | | | 3,067,955 | |
| | | | |
| | | | | | | | | | | | | | | 9,317,561 | |
| | | | | | | | | | | | | | | | |
| | | | |
| Road & Rail: 0.30% | | | | | | | | | | | | | | | | |
CSX Corporation | | | | | | | | | | | 58,113 | | | | 2,695,862 | |
| | | | | | | | | | | | | | | | |
| | | | |
Information Technology: 21.78% | | | | | | | | | | | | | | | | |
| | | | |
| Communications Equipment: 1.28% | | | | | | | | | | | | | | | | |
Cisco Systems Incorporated | | | | | | | | | | | 369,351 | | | | 11,346,463 | |
| | | | | | | | | | | | | | | | |
| | | | |
| Electronic Equipment, Instruments & Components: 0.34% | | | | | | | | | | | | | | | | |
Corning Incorporated | | | | | | | | | | | 113,657 | | | | 3,010,774 | |
| | | | | | | | | | | | | | | | |
| | | | |
| Internet Software & Services: 4.95% | | | | | | | | | | | | | | | | |
Alphabet Incorporated Class A † | | | | | | | | | | | 21,061 | | | | 17,274,022 | |
Alphabet Incorporated Class C † | | | | | | | | | | | 21,293 | | | | 16,966,049 | |
Facebook Incorporated Class A † | | | | | | | | | | | 72,750 | | | | 9,480,780 | |
| | | | |
| | | | | | | | | | | | | | | 43,720,851 | |
| | | | | | | | | | | | | | | | |
The accompanying notes are an integral part of these financial statements.
| | | | | | |
| Portfolio of investments—January 31, 2017 (unaudited) | | Wells Fargo Disciplined U.S. Core Fund | | | 11 | |
| | | | | | | | | | | | | | | | |
| Security name | | | | | | | | Shares | | | Value | |
| | | | |
| IT Services: 2.90% | | | | | | | | | | | | | | | | |
Accenture plc Class A | | | | | | | | | | | 62,746 | | | $ | 7,144,887 | |
International Business Machines Corporation | | | | | | | | | | | 56,755 | | | | 9,904,883 | |
The Western Union Company | | | | | | | | | | | 199,557 | | | | 3,907,326 | |
Xerox Corporation | | | | | | | | | | | 680,526 | | | | 4,716,045 | |
| | | | |
| | | | | | | | | | | | | | | 25,673,141 | |
| | | | | | | | | | | | | | | | |
| | | | |
| Semiconductors & Semiconductor Equipment: 3.64% | | | | | | | | | | | | | | | | |
Applied Materials Incorporated | | | | | | | | | | | 105,022 | | | | 3,597,004 | |
Intel Corporation | | | | | | | | | | | 357,077 | | | | 13,147,575 | |
Linear Technology Corporation | | | | | | | | | | | 51,635 | | | | 3,259,718 | |
NVIDIA Corporation | | | | | | | | | | | 74,345 | | | | 8,116,987 | |
QUALCOMM Incorporated | | | | | | | | | | | 26,507 | | | | 1,416,269 | |
Texas Instruments Incorporated | | | | | | | | | | | 34,980 | | | | 2,642,389 | |
| | | | |
| | | | | | | | | | | | | | | 32,179,942 | |
| | | | | | | | | | | | | | | | |
| | | | |
| Software: 4.14% | | | | | | | | | | | | | | | | |
Microsoft Corporation | | | | | | | | | | | 426,445 | | | | 27,569,669 | |
Oracle Corporation | | | | | | | | | | | 224,996 | | | | 9,024,590 | |
| | | | |
| | | | | | | | | | | | | | | 36,594,259 | |
| | | | | | | | | | | | | | | | |
| | | | |
| Technology Hardware, Storage & Peripherals: 4.53% | | | | | | | | | | | | | | | | |
Apple Incorporated | | | | | | | | | | | 269,473 | | | | 32,700,549 | |
Hewlett Packard Enterprise Company | | | | | | | | | | | 75,803 | | | | 1,719,212 | |
HP Incorporated | | | | | | | | | | | 373,042 | | | | 5,614,282 | |
| | | | |
| | | | | | | | | | | | | | | 40,034,043 | |
| | | | | | | | | | | | | | | | |
| | | | |
Materials: 3.38% | | | | | | | | | | | | | | | | |
| | | | |
| Chemicals: 1.85% | | | | | | | | | | | | | | | | |
Ecolab Incorporated | | | | | | | | | | | 14,023 | | | | 1,684,583 | |
LyondellBasell Industries NV Class A | | | | | | | | | | | 76,091 | | | | 7,097,008 | |
The Dow Chemical Company | | | | | | | | | | | 126,698 | | | | 7,555,002 | |
| | | | |
| | | | | | | | | | | | | | | 16,336,593 | |
| | | | | | | | | | | | | | | | |
| | | | |
| Containers & Packaging: 0.63% | | | | | | | | | | | | | | | | |
Avery Dennison Corporation | | | | | | | | | | | 76,543 | | | | 5,589,170 | |
| | | | | | | | | | | | | | | | |
| | | | |
| Metals & Mining: 0.90% | | | | | | | | | | | | | | | | |
Newmont Mining Corporation | | | | | | | | | | | 220,683 | | | | 8,006,379 | |
| | | | | | | | | | | | | | | | |
| | | | |
Real Estate: 3.51% | | | | | | | | | | | | | | | | |
| | | | |
| Equity REITs: 2.80% | | | | | | | | | | | | | | | | |
American Tower Corporation | | | | | | | | | | | 58,829 | | | | 6,088,802 | |
Equinix Incorporated | | | | | | | | | | | 14,105 | | | | 5,430,143 | |
GGP Incorporated | | | | | | | | | | | 236,218 | | | | 5,867,655 | |
Simon Property Group Incorporated | | | | | | | | | | | 40,141 | | | | 7,376,712 | |
| | | | |
| | | | | | | | | | | | | | | 24,763,312 | |
| | | | | | | | | | | | | | | | |
The accompanying notes are an integral part of these financial statements.
| | | | |
| 12 | | Wells Fargo Disciplined U.S. Core Fund | | Portfolio of investments—January 31, 2017 (unaudited) |
| | | | | | | | | | | | | | | | |
| Security name | | | | | | | | Shares | | | Value | |
| | | | |
| Real Estate Management & Development: 0.71% | | | | | | | | | | | | | | | | |
CBRE Group Incorporated Class A † | | | | | | | | | | | 207,908 | | | $ | 6,312,087 | |
| | | | | | | | | | | | | | | | |
| | | | |
Telecommunication Services: 3.10% | | | | | | | | | | | | | | | | |
| | | | |
| Diversified Telecommunication Services: 3.10% | | | | | | | | | | | | | | | | |
AT&T Incorporated | | | | | | | | | | | 432,680 | | | | 18,241,789 | |
Verizon Communications Incorporated | | | | | | | | | | | 186,299 | | | | 9,130,514 | |
| | | | |
| | | | | | | | | | | | | | | 27,372,303 | |
| | | | | | | | | | | | | | | | |
| | | | |
Utilities: 2.50% | | | | | | | | | | | | | | | | |
| | | | |
| Electric Utilities: 2.23% | | | | | | | | | | | | | | | | |
American Electric Power Company Incorporated | | | | | | | | | | | 50,409 | | | | 3,229,201 | |
Duke Energy Corporation | | | | | | | | | | | 13,644 | | | | 1,071,600 | |
Exelon Corporation | | | | | | | | | | | 223,290 | | | | 8,011,645 | |
FirstEnergy Corporation | | | | | | | | | | | 180,441 | | | | 5,470,971 | |
Xcel Energy Incorporated | | | | | | | | | | | 47,497 | | | | 1,962,576 | |
| | | | |
| | | | | | | | | | | | | | | 19,745,993 | |
| | | | | | | | | | | | | | | | |
| | | | |
| Multi-Utilities: 0.27% | | | | | | | | | | | | | | | | |
CenterPoint Energy Incorporated | | | | | | | | | | | 55,782 | | | | 1,462,043 | |
DTE Energy Company | | | | | | | | | | | 8,928 | | | | 880,658 | |
| | | | |
| | | | | | | | | | | | | | | 2,342,701 | |
| | | | | | | | | | | | | | | | |
| | | | |
Total Common Stocks (Cost $672,989,481) | | | | | | | | | | | | | | | 867,386,868 | |
| | | | | | | | | | | | | | | | |
| | | | |
| | | Yield | | | | | | | | | | |
| Short-Term Investments: 2.06% | | | | | | | | | | | | | | | | |
| | | | |
| Investment Companies: 2.06% | | | | | | | | | | | | | | | | |
Securities Lending Cash Investment LLC (l)(r)(u) | | | 0.86 | % | | | | | | | 2,274,423 | | | | 2,274,650 | |
Wells Fargo Government Money Market Fund Select Class (l)(u) | | | 0.46 | | | | | | | | 15,913,662 | | | | 15,913,662 | |
| |
Total Short-Term Investments (Cost $18,188,312) | | | | 18,188,312 | |
| | | | | | | | | | | | | | | | |
| | | | | | | | |
| Total investments in securities (Cost $691,177,793) * | | | 100.14 | % | | | 885,575,180 | |
Other assets and liabilities, net | | | (0.14 | ) | | | (1,263,602 | ) |
| | | | | | | | |
| Total net assets | | | 100.00 | % | | $ | 884,311,578 | |
| | | | | | | | |
| « | All or a portion of this security is on loan. |
| † | Non-income-earning security |
| (l) | The issuer of the security is an affiliated person of the Fund as defined in the Investment Company Act of 1940. |
| (r) | The investment is a non-registered investment vehicle purchased with cash collateral received from securities on loan. |
| (u) | The rate represents the 7-day annualized yield at period end. |
| * | Cost for federal income tax purposes is $690,386,453 and unrealized gains (losses) consists of: |
| | | | |
Gross unrealized gains | | $ | 203,237,705 | |
Gross unrealized losses | | | (8,048,978 | ) |
| | | | |
Net unrealized gains | | $ | 195,188,727 | |
The accompanying notes are an integral part of these financial statements.
| | | | | | |
| Statement of assets and liabilities—January 31, 2017 (unaudited) | | Wells Fargo Disciplined U.S. Core Fund | | | 13 | |
| | | | |
| | | | |
| |
Assets | | | | |
Investments | | | | |
In unaffiliated securities (including $2,220,715 of securities loaned), at value (cost $672,989,481) | | $ | 867,386,868 | |
In affiliated securities, at value (cost $18,188,312) | | | 18,188,312 | |
| | | | |
Total investments, at value (cost $691,177,793) | | | 885,575,180 | |
Receivable for Fund shares sold | | | 5,993,169 | |
Receivable for dividends | | | 748,652 | |
Receivable for securities lending income | | | 787 | |
Prepaid expenses and other assets | | | 136,080 | |
| | | | |
Total assets | | | 892,453,868 | |
| | | | |
| |
Liabilities | | | | |
Payable for investments purchased | | | 4,227,633 | |
Payable for Fund shares redeemed | | | 1,024,462 | |
Payable upon receipt of securities loaned | | | 2,274,300 | |
Management fee payable | | | 246,089 | |
Distribution fees payable | | | 32,152 | |
Administration fees payable | | | 126,456 | |
Accrued expenses and other liabilities | | | 211,198 | |
| | | | |
Total liabilities | | | 8,142,290 | |
| | | | |
Total net assets | | $ | 884,311,578 | |
| | | | |
| |
NET ASSETS CONSIST OF | | | | |
Paid-in capital | | $ | 667,539,445 | |
Undistributed net investment income | | | 6,059,243 | |
Accumulated net realized gains on investments | | | 16,315,503 | |
Net unrealized gains on investments | | | 194,397,387 | |
| | | | |
Total net assets | | $ | 884,311,578 | |
| | | | |
| |
COMPUTATION OF NET ASSET VALUE AND OFFERING PRICE PER SHARE | | | | |
Net assets – Class A | | $ | 440,663,870 | |
Shares outstanding – Class A1 | | | 29,404,963 | |
Net asset value per share – Class A | | | $14.99 | |
Maximum offering price per share – Class A2 | | | $15.90 | |
Net assets – Class C | | $ | 53,122,226 | |
Shares outstanding – Class C1 | | | 3,826,705 | |
Net asset value per share – Class C | | | $13.88 | |
Net assets – Class R | | $ | 1,233,821 | |
Shares outstanding – Class R1 | | | 81,191 | |
Net asset value per share – Class R | | | $15.20 | |
Net assets – Class R6 | | $ | 25,422,249 | |
Shares outstanding – Class R61 | | | 1,657,822 | |
Net asset value per share – Class R6 | | | $15.33 | |
Net assets – Administrator Class | | $ | 79,519,788 | |
Shares outstanding – Administrator Class1 | | | 5,177,058 | |
Net asset value per share – Administrator Class | | | $15.36 | |
Net assets – Institutional Class | | $ | 284,349,624 | |
Shares outstanding – Institutional Class1 | | | 18,724,863 | |
Net asset value per share – Institutional Class | | | $15.19 | |
| 1 | The Fund has an unlimited number of authorized shares. |
| 2 | Maximum offering price is computed as 100/94.25 of net asset value. On investments of $50,000 or more, the offering price is reduced. |
The accompanying notes are an integral part of these financial statements.
| | | | |
| 14 | | Wells Fargo Disciplined U.S. Core Fund | | Statement of operations—six months ended January 31, 2017 (unaudited) |
| | | | |
| | | | |
| |
Investment income | | | | |
Dividends | | $ | 9,219,789 | |
Income from affiliated securities | | | 17,543 | |
Securities lending income, net | | | 2,997 | |
| | | | |
Total investment income | | | 9,240,329 | |
| | | | |
| |
Expenses | | | | |
Management fee | | | 1,413,462 | |
Administration fees | | | | |
Class A | | | 437,799 | |
Class C | | | 52,421 | |
Class R | | | 572 | |
Class R6 | | | 3,366 | |
Administrator Class | | | 69,525 | |
Institutional Class | | | 137,064 | |
Shareholder servicing fees | | | | |
Class A | | | 521,190 | |
Class C | | | 62,406 | |
Class R | | | 681 | |
Administrator Class | | | 133,359 | |
Distribution fees | | | | |
Class C | | | 187,217 | |
Class R | | | 681 | |
Custody and accounting fees | | | 19,560 | |
Professional fees | | | 27,033 | |
Registration fees | | | 70,228 | |
Shareholder report expenses | | | 33,380 | |
Trustees’ fees and expenses | | | 14,495 | |
Other fees and expenses | | | 12,325 | |
| | | | |
Total expenses | | | 3,196,764 | |
Less: Fee waivers and/or expense reimbursements | | | (64,425 | ) |
| | | | |
Net expenses | | | 3,132,339 | |
| | | | |
Net investment income | | | 6,107,990 | |
| | | | |
| |
REALIZED AND UNREALIZED GAINS (LOSSES) ON INVESTMENTS | | | | |
Net realized gains on investments | | | 18,246,692 | |
Net change in unrealized gains (losses) on investments | | | 22,324,674 | |
| | | | |
Net realized and unrealized gains (losses) on investments | | | 40,571,366 | |
| | | | |
Net increase in net assets resulting from operations | | $ | 46,679,356 | |
| | | | |
The accompanying notes are an integral part of these financial statements.
| | | | | | |
| Statement of changes in net assets | | Wells Fargo Disciplined U.S. Core Fund | | | 15 | |
| | | | | | | | | | | | | | | | |
| | | Six months ended
January 31, 2017
(unaudited) | | | Year ended
July 31, 2016 | |
| | | | |
Operations | | | | | | | | | | | | | | | | |
Net investment income | | | | | | $ | 6,107,990 | | | | | | | $ | 9,531,603 | |
Net realized gains on investments | | | | | | | 18,246,692 | | | | | | | | 10,319,714 | |
Net change in unrealized gains (losses) on investments | | | | | | | 22,324,674 | | | | | | | | 22,567,499 | |
| | | | |
Net increase in net assets resulting from operations | | | | | | | 46,679,356 | | | | | | | | 42,418,816 | |
| | | | |
| | | | |
Distributions to shareholders from | | | | | | | | | | | | | | | | |
Net investment income | | | | | | | | | | | | | | | | |
Class A | | | | | | | (4,241,326 | ) | | | | | | | (4,528,287 | ) |
Class C | | | | | | | (349,824 | ) | | | | | | | (257,661 | ) |
Class R | | | | | | | (11,093 | ) | | | | | | | (495 | )1 |
Class R6 | | | | | | | (347,445 | ) | | | | | | | (1,177 | )1 |
Administrator Class | | | | | | | (881,706 | ) | | | | | | | (1,187,160 | ) |
Institutional Class | | | | | | | (3,455,983 | ) | | | | | | | (1,510,103 | ) |
Net realized gains | | | | | | | | | | | | | | | | |
Class A | | | | | | | (5,786,409 | ) | | | | | | | (31,556,159 | ) |
Class C | | | | | | | (762,481 | ) | | | | | | | (2,500,322 | ) |
Class R | | | | | | | (10,965 | ) | | | | | | | (2,461 | )1 |
Class R6 | | | | | | | (335,630 | ) | | | | | | | (5,847 | )1 |
Administrator Class | | | | | | | (1,132,642 | ) | | | | | | | (6,952,701 | ) |
Institutional Class | | | | | | | (3,458,102 | ) | | | | | | | (8,572,495 | ) |
| | | | |
Total distributions to shareholders | | | | | | | (20,773,606 | ) | | | | | | | (57,074,868 | ) |
| | | | |
| | | | |
Capital share transactions | | | Shares | | | | | | | | Shares | | | | | |
Proceeds from shares sold | | | | | | | | | | | | | | | | |
Class A | | | 3,381,403 | | | | 49,936,733 | | | | 9,125,390 | | | | 126,350,368 | |
Class C | | | 655,738 | | | | 8,928,242 | | | | 2,429,480 | | | | 31,365,592 | |
Class R | | | 77,312 | | | | 1,151,872 | | | | 13,383 | 1 | | | 196,826 | 1 |
Class R6 | | | 1,426,321 | | | | 21,347,703 | | | | 289,003 | 1 | | | 4,094,576 | 1 |
Administrator Class | | | 1,564,987 | | | | 23,229,885 | | | | 5,692,270 | | | | 79,570,117 | |
Institutional Class | | | 9,011,192 | | | | 134,886,390 | | | | 8,264,426 | | | | 115,262,034 | |
| | | | |
| | | | | | | 239,480,825 | | | | | | | | 356,839,513 | |
| | | | |
Reinvestment of distributions | | | | | | | | | | | | | | | | |
Class A | | | 632,192 | | | | 9,490,470 | | | | 2,569,607 | | | | 34,920,049 | |
Class C | | | 67,906 | | | | 944,467 | | | | 155,194 | | | | 1,959,119 | |
Class R | | | 1,447 | | | | 22,058 | | | | 212 | 1 | | | 2,956 | 1 |
Class R6 | | | 44,450 | | | | 683,075 | | | | 504 | 1 | | | 7,024 | 1 |
Administrator Class | | | 122,191 | | | | 1,880,016 | | | | 553,449 | | | | 7,715,022 | |
Institutional Class | | | 358,107 | | | | 5,452,012 | | | | 369,132 | | | | 5,097,050 | |
| | | | |
| | | | | | | 18,472,098 | | | | | | | | 49,701,220 | |
| | | | |
Payment for shares redeemed | | | | | | | | | | | | | | | | |
Class A | | | (3,062,873 | ) | | | (44,751,523 | ) | | | (4,670,412 | ) | | | (64,993,916 | ) |
Class C | | | (375,295 | ) | | | (5,104,002 | ) | | | (532,257 | ) | | | (7,048,689 | ) |
Class R | | | (11,163 | ) | | | (165,701 | ) | | | 0 | 1 | | | 0 | 1 |
Class R6 | | | (83,789 | ) | | | (1,266,293 | ) | | | (18,667 | )1 | | | (273,006 | )1 |
Administrator Class | | | (4,374,002 | ) | | | (66,067,358 | ) | | | (2,402,412 | ) | | | (34,276,688 | ) |
Institutional Class | | | (1,767,004 | ) | | | (26,326,960 | ) | | | (4,530,382 | ) | | | (66,406,281 | ) |
| | | | |
| | | | | | | (143,681,837 | ) | | | | | | | (172,998,580 | ) |
| | | | |
Net increase in net assets resulting from capital share transactions | | | | | | | 114,271,086 | | | | | | | | 233,542,153 | |
| | | | |
Total increase in net assets | | | | | | | 140,176,836 | | | | | | | | 218,886,101 | |
| | | | |
| | | | |
Net assets | | | | | | | | | | | | | | | | |
Beginning of period | | | | | | | 744,134,742 | | | | | | | | 525,248,641 | |
| | | | |
End of period | | | | | | $ | 884,311,578 | | | | | | | $ | 744,134,742 | |
| | | | |
Undistributed net investment income | | | | | | $ | 6,059,243 | | | | | | | $ | 9,238,630 | |
| | | | |
| 1 | For the period from September 30, 2015 (commencement of class operations) to July 31, 2016 |
The accompanying notes are an integral part of these financial statements.
| | | | |
| 16 | | Wells Fargo Disciplined U.S. Core Fund | | Financial highlights |
(For a share outstanding throughout each period)
| | | | | | | | | | | | | | | | | | | | | | | | |
| | | Six months ended
January 31, 2017 (unaudited) | | | Year ended July 31 | |
| CLASS A | | | 2016 | | | 2015 | | | 2014 | | | 2013 | | | 2012 | |
Net asset value, beginning of period | | | $14.50 | | | | $15.45 | | | | $16.29 | | | | $16.27 | | | | $14.65 | | | | $14.25 | |
Net investment income | | | 0.11 | | | | 0.21 | | | | 0.21 | | | | 0.19 | | | | 0.24 | | | | 0.20 | |
Net realized and unrealized gains (losses) on investments | | | 0.74 | | | | 0.47 | | | | 1.60 | | | | 2.35 | | | | 3.25 | | | | 0.93 | |
| | | | | | | | | | | | | | | | | | | | | | | | |
Total from investment operations | | | 0.85 | | | | 0.68 | | | | 1.81 | | | | 2.54 | | | | 3.49 | | | | 1.13 | |
Distributions to shareholders from | | | | | | | | | | | | | | | | | | | | | | | | |
Net investment income | | | (0.15 | ) | | | (0.19 | ) | | | (0.16 | ) | | | (0.24 | ) | | | (0.24 | ) | | | (0.23 | ) |
Net realized gains | | | (0.21 | ) | | | (1.44 | ) | | | (2.49 | ) | | | (2.28 | ) | | | (1.63 | ) | | | (0.50 | ) |
| | | | | | | | | | | | | | | | | | | | | | | | |
Total distributions to shareholders | | | (0.36 | ) | | | (1.63 | ) | | | (2.65 | ) | | | (2.52 | ) | | | (1.87 | ) | | | (0.73 | ) |
Net asset value, end of period | | | $14.99 | | | | $14.50 | | | | $15.45 | | | | $16.29 | | | | $16.27 | | | | $14.65 | |
Total return1 | | | 5.87 | % | | | 5.22 | % | | | 12.01 | % | | | 17.00 | % | | | 26.62 | % | | | 8.54 | % |
Ratios to average net assets (annualized) | | | | | | | | | | | | | | | | | | | | | | | | |
Gross expenses | | | 0.85 | % | | | 0.87 | % | | | 0.89 | % | | | 0.93 | % | | | 0.94 | % | | | 0.92 | % |
Net expenses | | | 0.85 | % | | | 0.87 | % | | | 0.89 | % | | | 0.92 | % | | | 0.92 | % | | | 0.92 | % |
Net investment income | | | 1.45 | % | | | 1.60 | % | | | 1.43 | % | | | 1.27 | % | | | 1.66 | % | | | 1.43 | % |
Supplemental data | | | | | | | | | | | | | | | | | | | | | | | | |
Portfolio turnover rate | | | 26 | % | | | 52 | % | | | 53 | % | | | 71 | % | | | 64 | % | | | 82 | % |
Net assets, end of period (000s omitted) | | | $440,664 | | | | $412,629 | | | | $331,123 | | | | $305,577 | | | | $285,780 | | | | $254,272 | |
| 1 | Total return calculations do not include any sales charges. Returns for periods of less than one year are not annualized. |
The accompanying notes are an integral part of these financial statements.
| | | | | | |
| Financial highlights | | Wells Fargo Disciplined U.S. Core Fund | | | 17 | |
(For a share outstanding throughout each period)
| | | | | | | | | | | | | | | | | | | | | | | | |
| | | Six months ended
January 31, 2017 (unaudited) | | | Year ended July 31 | |
| CLASS C | | | 2016 | | | 2015 | | | 2014 | | | 2013 | | | 2012 | |
Net asset value, beginning of period | | | $13.45 | | | | $14.50 | | | | $15.47 | | | | $15.58 | | | | $14.10 | | | | $13.69 | |
Net investment income | | | 0.05 | | | | 0.14 | | | | 0.13 | | | | 0.08 | | | | 0.12 | | | | 0.09 | |
Net realized and unrealized gains (losses) on investments | | | 0.68 | | | | 0.38 | | | | 1.48 | | | | 2.23 | | | | 3.12 | | | | 0.90 | |
| | | | | | | | | | | | | | | | | | | | | | | | |
Total from investment operations | | | 0.73 | | | | 0.52 | | | | 1.61 | | | | 2.31 | | | | 3.24 | | | | 0.99 | |
Distributions to shareholders from | | | | | | | | | | | | | | | | | | | | | | | | |
Net investment income | | | (0.09 | ) | | | (0.13 | ) | | | (0.09 | ) | | | (0.14 | ) | | | (0.13 | ) | | | (0.08 | ) |
Net realized gains | | | (0.21 | ) | | | (1.44 | ) | | | (2.49 | ) | | | (2.28 | ) | | | (1.63 | ) | | | (0.50 | ) |
| | | | | | | | | | | | | | | | | | | | | | | | |
Total distributions to shareholders | | | (0.30 | ) | | | (1.57 | ) | | | (2.58 | ) | | | (2.42 | ) | | | (1.76 | ) | | | (0.58 | ) |
Net asset value, end of period | | | $13.88 | | | | $13.45 | | | | $14.50 | | | | $15.47 | | | | $15.58 | | | | $14.10 | |
Total return1 | | | 5.46 | % | | | 4.43 | % | | | 11.18 | % | | | 16.10 | % | | | 25.65 | % | | | 7.75 | % |
Ratios to average net assets (annualized) | | | | | | | | | | | | | | | | | | | | | | | | |
Gross expenses | | | 1.60 | % | | | 1.62 | % | | | 1.64 | % | | | 1.68 | % | | | 1.69 | % | | | 1.67 | % |
Net expenses | | | 1.60 | % | | | 1.62 | % | | | 1.64 | % | | | 1.67 | % | | | 1.67 | % | | | 1.67 | % |
Net investment income | | | 0.69 | % | | | 0.82 | % | | | 0.66 | % | | | 0.51 | % | | | 0.92 | % | | | 0.68 | % |
Supplemental data | | | | | | | | | | | | | | | | | | | | | | | | |
Portfolio turnover rate | | | 26 | % | | | 52 | % | | | 53 | % | | | 71 | % | | | 64 | % | | | 82 | % |
Net assets, end of period (000s omitted) | | | $53,122 | | | | $46,801 | | | | $20,680 | | | | $10,913 | | | | $9,544 | | | | $8,590 | |
| 1 | Total return calculations do not include any sales charges. Returns for periods of less than one year are not annualized. |
The accompanying notes are an integral part of these financial statements.
| | | | |
| 18 | | Wells Fargo Disciplined U.S. Core Fund | | Financial highlights |
(For a share outstanding throughout each period)
| | | | | | | | |
| CLASS R | | Six months ended
January 31, 2017
(unaudited) | | | Year ended
July 31, 20161 | |
Net asset value, beginning of period | | | $14.77 | | | | $14.62 | |
Net investment income | | | 0.08 | 2 | | | 0.13 | 2 |
Net realized and unrealized gains (losses) on investments | | | 0.77 | | | | 1.72 | |
| | | | | | | | |
Total from investment operations | | | 0.85 | | | | 1.85 | |
Distributions to shareholders from | | | | | | | | |
Net investment income | | | (0.21 | ) | | | (0.26 | ) |
Net realized gains | | | (0.21 | ) | | | (1.44 | ) |
| | | | | | | | |
Total distributions to shareholders | | | (0.42 | ) | | | (1.70 | ) |
Net asset value, end of period | | | $15.20 | | | | $14.77 | |
Total return3 | | | 5.74 | % | | | 13.56 | % |
Ratios to average net assets (annualized) | | | | | | | | |
Gross expenses | | | 1.10 | % | | | 1.12 | % |
Net expenses | | | 1.10 | % | | | 1.12 | % |
Net investment income | | | 1.01 | % | | | 1.12 | % |
Supplemental data | | | | | | | | |
Portfolio turnover rate | | | 26 | % | | | 52 | % |
Net assets, end of period (000s omitted) | | | $1,234 | | | | $201 | |
| 1 | For the period from September 30, 2015 (commencement of class operations) to July 31, 2016 |
| 2 | Calculated based upon average shares outstanding |
| 3 | Returns for periods of less than one year are not annualized. |
The accompanying notes are an integral part of these financial statements.
| | | | | | |
| Financial highlights | | Wells Fargo Disciplined U.S. Core Fund | | | 19 | |
(For a share outstanding throughout each period)
| | | | | | | | |
| CLASS R6 | | Six months ended
January 31, 2017
(unaudited) | | | Year ended
July 31, 20161 | |
Net asset value, beginning of period | | | $14.86 | | | | $14.62 | |
Net investment income | | | 0.13 | 2 | | | 0.22 | 2 |
Net realized and unrealized gains (losses) on investments | | | 0.76 | | | | 1.72 | |
| | | | | | | | |
Total from investment operations | | | 0.89 | | | | 1.94 | |
Distributions to shareholders from | | | | | | | | |
Net investment income | | | (0.21 | ) | | | (0.26 | ) |
Net realized gains | | | (0.21 | ) | | | (1.44 | ) |
| | | | | | | | |
Total distributions to shareholders | | | (0.42 | ) | | | (1.70 | ) |
Net asset value, end of period | | | $15.33 | | | | $14.86 | |
Total return3 | | | 6.01 | % | | | 14.24 | % |
Ratios to average net assets (annualized) | | | | | | | | |
Gross expenses | | | 0.42 | % | | | 0.44 | % |
Net expenses | | | 0.42 | % | | | 0.43 | % |
Net investment income | | | 1.75 | % | | | 1.88 | % |
Supplemental data | | | | | | | | |
Portfolio turnover rate | | | 26 | % | | | 52 | % |
Net assets, end of period (000s omitted) | | | $25,422 | | | | $4,024 | |
| 1 | For the period from September 30, 2015 (commencement of class operations) to July 31, 2016 |
| 2 | Calculated based upon average shares outstanding |
| 3 | Returns for periods of less than one year are not annualized. |
The accompanying notes are an integral part of these financial statements.
| | | | |
| 20 | | Wells Fargo Disciplined U.S. Core Fund | | Financial highlights |
(For a share outstanding throughout each period)
| | | | | | | | | | | | | | | | | | | | | | | | |
| | | Six months ended
January 31, 2017 (unaudited) | | | Year ended July 31 | |
| ADMINISTRATOR CLASS | | | 2016 | | | 2015 | | | 2014 | | | 2013 | | | 2012 | |
Net asset value, beginning of period | | | $14.85 | | | | $15.80 | | | | $16.60 | | | | $16.47 | | | | $14.79 | | | | $14.36 | |
Net investment income | | | 0.13 | 1 | | | 0.24 | 1 | | | 0.25 | 1 | | | 0.25 | 1 | | | 0.28 | 1 | | | 0.23 | 1 |
Net realized and unrealized gains (losses) on investments | | | 0.75 | | | | 0.48 | | | | 1.63 | | | | 2.35 | | | | 3.27 | | | | 0.93 | |
| | | | | | | | | | | | | | | | | | | | | | | | |
Total from investment operations | | | 0.88 | | | | 0.72 | | | | 1.88 | | | | 2.60 | | | | 3.55 | | | | 1.16 | |
Distributions to shareholders from | | | | | | | | | | | | | | | | | | | | | | | | |
Net investment income | | | (0.16 | ) | | | (0.23 | ) | | | (0.19 | ) | | | (0.19 | ) | | | (0.24 | ) | | | (0.23 | ) |
Net realized gains | | | (0.21 | ) | | | (1.44 | ) | | | (2.49 | ) | | | (2.28 | ) | | | (1.63 | ) | | | (0.50 | ) |
| | | | | | | | | | | | | | | | | | | | | | | | |
Total distributions to shareholders | | | (0.37 | ) | | | (1.67 | ) | | | (2.68 | ) | | | (2.47 | ) | | | (1.87 | ) | | | (0.73 | ) |
Net asset value, end of period | | | $15.36 | | | | $14.85 | | | | $15.80 | | | | $16.60 | | | | $16.47 | | | | $14.79 | |
Total return2 | | | 5.93 | % | | | 5.36 | % | | | 12.20 | % | | | 17.12 | % | | | 26.82 | % | | | 8.72 | % |
Ratios to average net assets (annualized) | | | | | | | | | | | | | | | | | | | | | | | | |
Gross expenses | | | 0.77 | % | | | 0.78 | % | | | 0.74 | % | | | 0.76 | % | | | 0.78 | % | | | 0.75 | % |
Net expenses | | | 0.74 | % | | | 0.74 | % | | | 0.73 | % | | | 0.74 | % | | | 0.74 | % | | | 0.74 | % |
Net investment income | | | 1.66 | % | | | 1.71 | % | | | 1.58 | % | | | 1.56 | % | | | 1.87 | % | | | 1.63 | % |
Supplemental data | | | | | | | | | | | | | | | | | | | | | | | | |
Portfolio turnover rate | | | 26 | % | | | 52 | % | | | 53 | % | | | 71 | % | | | 64 | % | | | 82 | % |
Net assets, end of period (000s omitted) | | | $79,520 | | | | $116,807 | | | | $63,544 | | | | $50,498 | | | | $127,384 | | | | $150,408 | |
| 1 | Calculated based upon average shares outstanding |
| 2 | Returns for periods of less than one year are not annualized. |
The accompanying notes are an integral part of these financial statements.
| | | | | | |
| Financial highlights | | Wells Fargo Disciplined U.S. Core Fund | | | 21 | |
(For a share outstanding throughout each period)
| | | | | | | | | | | | | | | | | | | | | | | | |
| | | Six months ended
January 31, 2017 (unaudited) | | | Year ended July 31 | |
| INSTITUTIONAL CLASS | | | 2016 | | | 2015 | | | 2014 | | | 2013 | | | 2012 | |
Net asset value, beginning of period | | | $14.72 | | | | $15.66 | | | | $16.47 | | | | $16.43 | | | | $14.78 | | | | $14.39 | |
Net investment income | | | 0.13 | 1 | | | 0.28 | 1 | | | 0.30 | | | | 0.26 | 1 | | | 0.35 | | | | 0.26 | 1 |
Net realized and unrealized gains (losses) on investments | | | 0.76 | | | | 0.47 | | | | 1.61 | | | | 2.37 | | | | 3.23 | | | | 0.93 | |
| | | | | | | | | | | | | | | | | | | | | | | | |
Total from investment operations | | | 0.89 | | | | 0.75 | | | | 1.91 | | | | 2.63 | | | | 3.58 | | | | 1.19 | |
Distributions to shareholders from | | | | | | | | | | | | | | | | | | | | | | | | |
Net investment income | | | (0.21 | ) | | | (0.25 | ) | | | (0.23 | ) | | | (0.31 | ) | | | (0.30 | ) | | | (0.30 | ) |
Net realized gains | | | (0.21 | ) | | | (1.44 | ) | | | (2.49 | ) | | | (2.28 | ) | | | (1.63 | ) | | | (0.50 | ) |
| | | | | | | | | | | | | | | | | | | | | | | | |
Total distributions to shareholders | | | (0.42 | ) | | | (1.69 | ) | | | (2.72 | ) | | | (2.59 | ) | | | (1.93 | ) | | | (0.80 | ) |
Net asset value, end of period | | | $15.19 | | | | $14.72 | | | | $15.66 | | | | $16.47 | | | | $16.43 | | | | $14.78 | |
Total return2 | | | 6.02 | % | | | 5.64 | % | | | 12.55 | % | | | 17.48 | % | | | 27.16 | % | | | 9.02 | % |
Ratios to average net assets (annualized) | | | | | | | | | | | | | | | | | | | | | | | | |
Gross expenses | | | 0.52 | % | | | 0.54 | % | | | 0.47 | % | | | 0.50 | % | | | 0.51 | % | | | 0.49 | % |
Net expenses | | | 0.48 | % | | | 0.48 | % | | | 0.47 | % | | | 0.48 | % | | | 0.48 | % | | | 0.48 | % |
Net investment income | | | 1.73 | % | | | 1.96 | % | | | 1.86 | % | | | 1.63 | % | | | 2.08 | % | | | 1.80 | % |
Supplemental data | | | | | | | | | | | | | | | | | | | | | | | | |
Portfolio turnover rate | | | 26 | % | | | 52 | % | | | 53 | % | | | 71 | % | | | 64 | % | | | 82 | % |
Net assets, end of period (000s omitted) | | | $284,350 | | | | $163,674 | | | | $109,901 | | | | $91,144 | | | | $1,875 | | | | $1,215 | |
| 1 | Calculated based upon average shares outstanding |
| 2 | Returns for periods of less than one year are not annualized. |
The accompanying notes are an integral part of these financial statements.
| | | | |
| 22 | | Wells Fargo Disciplined U.S. Core Fund | | Notes to financial statements (unaudited) |
1. ORGANIZATION
Wells Fargo Funds Trust (the “Trust”), a Delaware statutory trust organized on March 10, 1999, is an open-end management investment company registered under the Investment Company Act of 1940, as amended (the “1940 Act”). As an investment company, the Trust follows the accounting and reporting guidance in Financial Accounting Standards Board (“FASB”) Accounting Standards Codification Topic 946, Financial Services – Investment Companies. These financial statements report on the Wells Fargo Disciplined U.S. Core Fund (the “Fund”) which is a diversified series of the Trust.
2. SIGNIFICANT ACCOUNTING POLICIES
The following significant accounting policies, which are consistently followed in the preparation of the financial statements of the Fund, are in conformity with U.S. generally accepted accounting principles which require management to make estimates and assumptions that affect the reported amounts of assets and liabilities, disclosure of contingent assets and liabilities at the date of the financial statements, and the reported amounts of revenues and expenses during the reporting period. Actual results could differ from those estimates.
Securities valuation
All investments are valued each business day as of the close of regular trading on the New York Stock Exchange (generally 4 p.m. Eastern Time), although the Fund may deviate from this calculation time under unusual or unexpected circumstances.
Equity securities that are listed on a foreign or domestic exchange or market are valued at the official closing price or, if none, the last sales price. If no sale occurs on the principal exchange or market that day, the prior day’s price will be deemed “stale” and a fair value price will be determined in accordance with the Fund’s Valuation Procedures.
Investments in registered open-end investment companies are valued at net asset value. Interests in non-registered investment vehicles that are redeemable at net asset value are fair valued normally at net asset value.
Investments which are not valued using any of the methods discussed above are valued at their fair value, as determined in good faith by the Board of Trustees of the Fund. The Board of Trustees has established a Valuation Committee comprised of the Trustees and has delegated to it the authority to take any actions regarding the valuation of portfolio securities that the Valuation Committee deems necessary or appropriate, including determining the fair value of portfolio securities, unless the determination has been delegated to the Management Valuation Team of Wells Fargo Funds Management, LLC (“Funds Management”). The Board of Trustees retains the authority to make or ratify any valuation decisions or approve any changes to the Valuation Procedures as it deems appropriate. On a quarterly basis, the Board of Trustees receives reports on any valuation actions taken by the Valuation Committee or the Management Valuation Team which may include items for ratification.
Valuations of fair valued securities are compared to the next actual sales price when available, or other appropriate market values, to assess the continued appropriateness of the fair valuation methodologies used. These securities are fair valued on a day-to-day basis, taking into consideration changes to appropriate market information and any significant changes to the inputs considered in the valuation process until there is a readily available price provided on an exchange or by an independent pricing service. Valuations received from an independent pricing service or independent broker-dealer quotes are periodically validated by comparisons to most recent trades and valuations provided by other independent pricing services in addition to the review of prices by the manager and/or subadviser. Unobservable inputs used in determining fair valuations are identified based on the type of security, taking into consideration factors utilized by market participants in valuing the investment, knowledge about the issuer and the current market environment.
Security loans
The Fund may lend its securities from time to time in order to earn additional income in the form of fees or interest on securities received as collateral or the investment of any cash received as collateral. The Fund continues to receive interest or dividends on the securities loaned. The Fund receives collateral in the form of cash or securities with a value at least equal to the value of the securities on loan. The value of the loaned securities is determined at the close of each business day and any additional required collateral is delivered to the Fund on the next business day. In a securities lending transaction, the net asset value of the Fund will be affected by an increase or decrease in the value of the securities loaned and by an increase or decrease in the value of the instrument in which collateral is invested. The amount of securities lending activity undertaken by the Fund fluctuates from time to time. In the event of default or bankruptcy by the borrower, the Fund may be prevented from recovering the loaned securities or gaining access to the collateral or may experience delays or costs in doing so. In addition, the investment of any cash collateral received may lose all or part of its value. The Fund has the right under the lending agreement to recover the securities from the borrower on demand.
| | | | | | |
| Notes to financial statements (unaudited) | | Wells Fargo Disciplined U.S. Core Fund | | | 23 | |
The Fund lends its securities through an unaffiliated securities lending agent. Cash collateral received in connection with its securities lending transactions is invested in Securities Lending Cash Investments, LLC (the “Securities Lending Fund”). The Securities Lending Fund is exempt from registration under Section 3(c)(7) of the 1940 Act and is managed by Funds Management and is subadvised by Wells Capital Management Incorporated (“WellsCap”), an affiliate of Funds Management and an indirect wholly owned subsidiary of Wells Fargo & Company (“Wells Fargo”). Funds Management receives an advisory fee starting at 0.05% and declining to 0.01% as the average daily net assets of the Securities Lending Fund increase. All of the fees received by Funds Management are paid to WellsCap for its services as subadviser. The Securities Lending Fund seeks to provide a positive return compared to the daily Fed Funds Open Rate by investing in high-quality, U.S. dollar-denominated short-term money market instruments. Securities Lending Fund investments are valued at the evaluated bid price provided by an independent pricing service. Income earned from investment in the Securities Lending Fund is included in securities lending income on the Statement of Operations.
Security transactions and income recognition
Securities transactions are recorded on a trade date basis. Realized gains or losses are recorded on the basis of identified cost.
Dividend income is recognized on the ex-dividend date.
Distributions to shareholders
Distributions to shareholders from net investment income and net realized gains, if any, are recorded on the ex-dividend date. Such distributions are determined in conformity with federal income tax regulations, which may differ in amount or character from net investment income and realized gains recognized for purposes of U.S. generally accepted accounting principles.
Federal and other taxes
The Fund intends to continue to qualify as a regulated investment company by distributing substantially all of its investment company taxable income and any net realized capital gains (after reduction for capital loss carryforwards) sufficient to relieve it from all, or substantially all, federal income taxes. Accordingly, no provision for federal income taxes was required.
The Fund’s income and federal excise tax returns and all financial records supporting those returns for the prior three fiscal years are subject to examination by the federal and Delaware revenue authorities. Management has analyzed the Fund’s tax positions taken on federal, state, and foreign tax returns for all open tax years and does not believe that there are any uncertain tax positions that require recognition of a tax liability.
Class allocations
The separate classes of shares offered by the Fund differ principally in applicable sales charges, distribution, shareholder servicing, and administration fees. Class specific expenses are charged directly to that share class. Investment income, common expenses, and realized and unrealized gains (losses) on investments are allocated daily to each class of shares based on the relative proportion of net assets of each class.
3. FAIR VALUATION MEASUREMENTS
Fair value measurements of investments are determined within a framework that has established a fair value hierarchy based upon the various data inputs utilized in determining the value of the Fund’s investments. The three-level hierarchy gives the highest priority to unadjusted quoted prices in active markets for identical assets or liabilities (Level 1) and the lowest priority to significant unobservable inputs (Level 3). The Fund’s investments are classified within the fair value hierarchy based on the lowest level of input that is significant to the fair value measurement. The inputs are summarized into three broad levels as follows:
| ∎ | | Level 1 – quoted prices in active markets for identical securities |
| ∎ | | Level 2 – other significant observable inputs (including quoted prices for similar securities, interest rates, prepayment speeds, credit risk, etc.) |
| ∎ | | Level 3 – significant unobservable inputs (including the Fund’s own assumptions in determining the fair value of investments) |
The inputs or methodologies used for valuing investments in securities are not necessarily an indication of the risk associated with investing in those securities.
| | | | |
| 24 | | Wells Fargo Disciplined U.S. Core Fund | | Notes to financial statements (unaudited) |
The following is a summary of the inputs used in valuing the Fund’s assets and liabilities as of January 31, 2017:
| | | | | | | | | | | | | | | | |
| | | Quoted prices
(Level 1) | | | Other significant
observable inputs
(Level 2) | | | Significant
unobservable inputs
(Level 3) | | | Total | |
Assets | | | | | | | | | | | | | | | | |
Investments in: | | | | | | | | | | | | | | | | |
| | | | |
Common stocks | | | | | | | | | | | | | | | | |
Consumer discretionary | | $ | 113,730,713 | | | $ | 0 | | | $ | 0 | | | $ | 113,730,713 | |
Consumer staples | | | 73,475,129 | | | | 0 | | | | 0 | | | | 73,475,129 | |
Energy | | | 56,436,643 | | | | 0 | | | | 0 | | | | 56,436,643 | |
Financials | | | 119,044,380 | | | | 0 | | | | 0 | | | | 119,044,380 | |
Health care | | | 120,642,766 | | | | 0 | | | | 0 | | | | 120,642,766 | |
Industrials | | | 81,029,226 | | | | 0 | | | | 0 | | | | 81,029,226 | |
Information technology | | | 192,559,473 | | | | 0 | | | | 0 | | | | 192,559,473 | |
Materials | | | 29,932,142 | | | | 0 | | | | 0 | | | | 29,932,142 | |
Real estate | | | 31,075,399 | | | | 0 | | | | 0 | | | | 31,075,399 | |
Telecommunications | | | 27,372,303 | | | | 0 | | | | 0 | | | | 27,372,303 | |
Utilities | | | 22,088,694 | | | | 0 | | | | 0 | | | | 22,088,694 | |
| | | | |
Short-term investments | | | | | | | | | | | | | | | | |
Investment companies | | | 15,913,662 | | | | 0 | | | | 0 | | | | 15,913,662 | |
Investments measured at net asset value* | | | | | | | | | | | | | | | 2,274,650 | |
Total assets | | $ | 883,300,530 | | | $ | 0 | | | $ | 0 | | | $ | 885,575,180 | |
| * | Investments that are measured at fair value using the net asset value per share (or its equivalent) as a practical expedient have not been categorized in the fair value hierarchy. The fair value amount presented in the table is intended to permit reconciliation of the fair value hierarchy to the amounts presented in the Statement of Assets and Liabilities. The Fund’s investment in Securities Lending Cash Investments, LLC valued at $2,274,650 does not have a redemption period notice, can be redeemed daily and does not have any unfunded commitments. |
The Fund recognizes transfers between levels within the fair value hierarchy at the end of the reporting period. At January 31, 2017, the Fund did not have any transfers into/out of Level 1, Level 2, or Level 3.
4. TRANSACTIONS WITH AFFILIATES AND OTHER EXPENSES
Management fee
Funds Management, an indirect wholly owned subsidiary of Wells Fargo, is the manager of the Fund and provides advisory and fund-level administrative services under an investment management agreement. Under the investment management agreement, Funds Management is responsible for, among other services, implementing the investment objectives and strategies of the Fund, supervising the subadviser, providing fund-level administrative services in connection with the Fund’s operations, and providing any other fund-level administrative services reasonably necessary for the operation of the Fund. As compensation for its services under the investment management agreement, Funds Management is entitled to receive an annual management fee starting at 0.35% and declining to 0.28% as the average daily net assets of the Fund increase. For the six months ended January 31, 2017, the management fee was equivalent to an annual rate of 0.35% of the Fund’s average daily net assets.
Funds Management has retained the services of a subadviser to provide daily portfolio management to the Fund. The fee for subadvisory services is borne by Funds Management. Golden Capital Management, LLC, an affiliate of Funds Management and an indirect wholly owned subsidiary of Wells Fargo, is the subadviser to the Fund and is entitled to receive a fee from Funds Management at an annual rate starting at 0.25% and declining to 0.15% as the average daily net assets of the Fund increase.
Administration fees
Under a class-level administration agreement, Funds Management provides class-level administrative services to the Fund, which includes paying fees and expenses for services provided by the transfer agent, sub-transfer agents, omnibus account servicers and record-keepers. As compensation for its services under the class-level administration agreement, Funds Management receives an annual fee which is calculated based on the average daily net assets of each class as follows:
| | | | |
| | | Class-level
administration fee | |
Class A, Class C, Class R | | | 0.21 | % |
Class R6 | | | 0.03 | |
Administrator Class, Institutional Class | | | 0.13 | |
| | | | | | |
| Notes to financial statements (unaudited) | | Wells Fargo Disciplined U.S. Core Fund | | | 25 | |
Funds Management has contractually waived and/or reimbursed management and administration fees to the extent necessary to maintain certain net operating expense ratios for the Fund. Waiver of fees and/or reimbursement of expenses by Funds Management were made first from fund level expenses on a proportionate basis and then from class specific expenses. Funds Management has committed through November 30, 2017 to waive fees and/or reimburse expenses to the extent necessary to cap the Fund’s expenses at 0.87% for Class A shares, 1.62% for Class C shares, 1.12% for Class R shares, 0.43% for Class R6 shares, 0.74% for Administrator Class shares, and 0.48% for Institutional Class shares. After this time, the cap may be increased or the commitment to maintain the cap may be terminated only with the approval of the Board of Trustees.
During the six months ended January 31, 2017, State Street Bank and Trust Company, the Fund’s custodian, reimbursed the Fund $25,961 for certain out-of-pocket expenses that were billed to the Fund in error from 1998-2015. This amount is included in interest income on the Statement of Operations. In addition, Funds Management was also reimbursed $7,719 for waivers/reimbursements it made to the Fund during the period the Fund was erroneously billed.
Distribution fees
The Trust has adopted a distribution plan for Class C and Class R shares of the Fund pursuant to Rule 12b-1 under the 1940 Act. Distribution fees are charged to Class C and Class R shares and paid to Wells Fargo Funds Distributor, LLC (“Funds Distributor”), the principal underwriter, at an annual rate of 0.75% of the average daily net assets of Class C shares and 0.25% of the average daily net assets of Class R shares.
In addition, Funds Distributor is entitled to receive the front-end sales charge from the purchase of Class A shares and a contingent deferred sales charge on the redemption of certain Class A shares. Funds Distributor is also entitled to receive the contingent deferred sales charges from redemptions of Class C shares. For the six months ended January 31, 2017, Funds Distributor received $30,544 from the sale of Class A shares and $524 in contingent deferred sales charges from redemptions of Class C shares.
Shareholder servicing fees
The Trust has entered into contracts with one or more shareholder servicing agents, whereby Class A, Class C, Class R, and Administrator Class of the Fund are charged a fee at an annual rate of 0.25% of the average daily net assets of each respective class. A portion of these total shareholder servicing fees were paid to affiliates of Wells Fargo.
A portion of these total shareholder servicing fees were paid to affiliates of Wells Fargo.
5. INVESTMENT PORTFOLIO TRANSACTIONS
Purchases and sales of investments, excluding U.S. government obligations (if any) and short-term securities, for the six months ended January 31, 2017 were $307,437,098 and $209,460,360, respectively.
The Fund may purchase or sell investment securities to other Wells Fargo funds under procedures adopted by the Board of Trustees. The procedures have been designed to ensure that these interfund transactions, which generally do not incur broker commissions, are effected at current market prices. Interfund trades are included within the respective purchases and sales amounts shown.
6. BANK BORROWINGS
The Trust (excluding the money market funds and certain other funds) and Wells Fargo Variable Trust are parties to a $250,000,000 revolving credit agreement whereby the Fund is permitted to use bank borrowings for temporary or emergency purposes, such as to fund shareholder redemption requests. Interest under the credit agreement is charged to the Fund based on a borrowing rate equal to the higher of the Federal Funds rate in effect on that day plus 1.25% or the overnight LIBOR rate in effect on that day plus 1.25%. In addition, an annual commitment fee equal to 0.25% of the unused balance is allocated to each participating fund. Prior to August 30, 2016, the revolving credit agreement amount was $200,000,000 and the annual commitment fee was equal to 0.20% of the unused balance which was allocated to each participating fund.
For the six months ended January 31, 2017, there were no borrowings by the Fund under the agreement.
7. INDEMNIFICATION
Under the Trust’s organizational documents, the officers and Trustees have been granted certain indemnification rights against certain liabilities that may arise out of performance of their duties to the Trust. Additionally, in the normal course of business, the Trust may enter into contracts with service providers that contain a variety of indemnification clauses. The Trust’s maximum exposure under these arrangements is dependent on future claims that may be made against the Fund and, therefore, cannot be estimated.
| | | | |
| 26 | | Wells Fargo Disciplined U.S. Core Fund | | Notes to financial statements (unaudited) |
8. NEW ACCOUNTING PRONOUNCEMENT
In December 2016, the Financial Accounting Standards Board (“FASB”) issued Accounting Standard Update (“ASU”) No. 2016-19, Technical Corrections and Improvements. ASU 2016-19 includes an amendment to FASB ASC Topic 820, Fair Value Measurement which clarifies the difference between a valuation approach and a valuation technique. The amendment also requires an entity to disclose when there has been a change in either or both a valuation approach and/or a valuation technique. The disclosure requirements are effective for fiscal years and interim periods within those fiscal years beginning after December 15, 2016. Management is currently evaluating the potential impact of this new guidance to the financial statements.
9. REGULATORY CHANGES
In October 2016, the Securities and Exchange Commission (“SEC”) adopted new rules and forms and amended existing rules and forms (together, “final rules”) intended to modernize and enhance the reporting and disclosure of information by registered investment companies and to enhance liquidity risk management by open-end mutual funds and exchange-traded funds. The final rules will enhance the quality of information available to investors and will allow the SEC to more effectively collect and use data reported by funds. In part, the final rules amend Regulation S-X and require standardized, enhanced disclosure about derivatives in the Fund’s financial statements, as well as other amendments. The compliance date for the amendments to Regulation S-X is August 1, 2017 while the compliance date for the new form types is June 1, 2018 and the compliance date for the liquidity risk management program requirements is December 1, 2018. Management is currently assessing the potential impact of these enhancements and their impact on the financial statement disclosures and reporting requirements.
| | | | | | |
| Other information (unaudited) | | Wells Fargo Disciplined U.S. Core Fund | | | 27 | |
PORTFOLIO HOLDINGS INFORMATION
The complete portfolio holdings for the Fund are publicly available monthly on the Fund’s website (wellsfargofunds.com), on a one-month delayed basis. In addition, top ten holdings information (excluding derivative positions) for the Fund is publicly available on the Fund’s website on a monthly, seven-day or more delayed basis. The Fund files its complete schedule of portfolio holdings with the SEC for the first and third quarters of each fiscal year on Form N-Q, which is available by visiting the SEC website at sec.gov. In addition, the Fund’s Form N-Q may be reviewed and copied at the SEC’s Public Reference Room in Washington, DC, and at regional offices in New York City, at 233 Broadway, and in Chicago, at 175 West Jackson Boulevard, Suite 900. Information about the Public Reference Room may be obtained by calling 1-800-SEC-0330.
PROXY VOTING INFORMATION
A description of the policies and procedures that the Fund uses to determine how to vote proxies relating to portfolio securities is available, upon request, by calling 1-800-222-8222, visiting our website at wellsfargofunds.com, or visiting the SEC website at sec.gov. Information regarding how the Fund voted proxies relating to portfolio securities during the most recent 12-month period ended June 30 is available on the Fund’s website at wellsfargofunds.com or by visiting the SEC website at sec.gov.
| | | | |
| 28 | | Wells Fargo Disciplined U.S. Core Fund | | Other information (unaudited) |
BOARD OF TRUSTEES AND OFFICERS
Each of the Trustees and Officers1 listed in the table below acts in identical capacities for each fund in the Wells Fargo family of funds, which consists of 138 mutual funds comprising the Wells Fargo Funds Trust, Wells Fargo Variable Trust, Wells Fargo Master Trust and four closed-end funds (collectively the “Fund Complex”). This table should be read in conjunction with the Prospectus and the Statement of Additional Information2. The mailing address of each Trustee and Officer is 525 Market Street, 12th Floor, San Francisco, CA 94105. Each Trustee and Officer serves an indefinite term, however, each Trustee serves such term until reaching the mandatory retirement age established by the Trustees.
Independent Trustees
| | | | | | |
Name and year of birth | | Position held and length of service* | | Principal occupations during past five years or longer | | Current other public company or
investment company directorships |
| William R. Ebsworth (Born 1957) | | Trustee, since 2015 | | Retired. From 1984 to 2013, equities analyst, portfolio manager, research director and chief financial officer at Fidelity Management and Research Company in Boston, Tokyo, and Hong Kong and retired in 2013 as Chief Investment Officer of Fidelity Strategic Advisers, Inc. where he lead a team of investment professionals managing client assets. Prior thereto, Board member of Hong Kong Securities Clearing Co., Hong Kong Options Clearing Corp., the Thailand International Fund, Ltd., Fidelity Investments Life Insurance Company, and Empire Fidelity Investments Life Insurance Company. Board member of the Fonté Foundation (non-profit organization) and the Vincent Memorial Hospital Endowment (non-profit organization), where he serves on the Investment Committee and as a Chair of the Audit Committee. Mr. Ebsworth is a CFA® charterholder and an Adjunct Lecturer, Finance, at Babson College. | | Asset Allocation Trust |
Jane A. Freeman (Born 1953) | | Trustee, since 2015 | | Retired. From 2012 to 2014 and 1999 to 2008, Chief Financial Officer of Scientific Learning Corporation. From 2008 to 2012, Ms. Freeman provided consulting services related to strategic business projects. Prior to 1999, Portfolio Manager at Rockefeller & Co. and Scudder, Stevens & Clark. Board member of the Harding Loevner Funds from 1996 to 2014, serving as both Lead Independent Director and chair of the Audit Committee. Board member of the Russell Exchange Traded Funds Trust from 2011 to 2012 and the chair of the Audit Committee. Ms. Freeman is Chair of Taproot Foundation (non-profit organization), a Board Member of Ruth Bancroft Garden (non-profit organization) and an inactive chartered financial analyst. | | Asset Allocation Trust |
Peter G. Gordon** (Born 1942) | | Trustee, since 1998; Chairman, since 2005 | | Co-Founder, Retired Chairman, President and CEO of Crystal Geyser Water Company. Trustee Emeritus, Colby College. | | Asset Allocation Trust |
Isaiah Harris, Jr. (Born 1952) | | Trustee, since 2009 | | Retired. Chairman of the Board of CIGNA Corporation since 2009, and Director since 2005. From 2003 to 2011, Director of Deluxe Corporation. Prior thereto, President and CEO of BellSouth Advertising and Publishing Corp. from 2005 to 2007, President and CEO of BellSouth Enterprises from 2004 to 2005 and President of BellSouth Consumer Services from 2000 to 2003. Emeritus member of the Iowa State University Foundation Board of Governors. Emeritus Member of the Advisory Board of Iowa State University School of Business. Advisory Board Member, Palm Harbor Academy (charter school). Advisory Board Member, Child Evangelism Fellowship (non-profit). Mr. Harris is a certified public accountant (inactive status). | | CIGNA Corporation; Asset Allocation Trust |
Judith M. Johnson (Born 1949) | | Trustee, since 2008; Audit Committee Chairman, since 2008 | | Retired. Prior thereto, Chief Executive Officer and Chief Investment Officer of Minneapolis Employees Retirement Fund from 1996 to 2008. Ms. Johnson is an attorney, certified public accountant and a certified managerial accountant. | | Asset Allocation Trust |
David F. Larcker (Born 1950) | | Trustee, since 2009 | | James Irvin Miller Professor of Accounting at the Graduate School of Business, Stanford University, Director of the Corporate Governance Research Initiative and Senior Faculty of The Rock Center for Corporate Governance since 2006. From 2005 to 2008, Professor of Accounting at the Graduate School of Business, Stanford University. Prior thereto, Ernst & Young Professor of Accounting at The Wharton School, University of Pennsylvania from 1985 to 2005. | | Asset Allocation Trust |
| | | | | | |
| Other information (unaudited) | | Wells Fargo Disciplined U.S. Core Fund | | | 29 | |
| | | | | | |
Name and year of birth | | Position held and length of service* | | Principal occupations during past five years or longer | | Current other public company or
investment company directorships |
Olivia S. Mitchell (Born 1953) | | Trustee, since 2006 | | International Foundation of Employee Benefit Plans Professor, Wharton School of the University of Pennsylvania since 1993. Director of Wharton’s Pension Research Council and Boettner Center on Pensions & Retirement Research, and Research Associate at the National Bureau of Economic Research. Previously, Cornell University Professor from 1978 to 1993. | | Asset Allocation Trust |
Timothy J. Penny (Born 1951) | | Trustee, since 1996 | | President and Chief Executive Officer of Southern Minnesota Initiative Foundation, a non-profit organization, since 2007 and Senior Fellow at the Humphrey Institute Policy Forum at the University of Minnesota since 1995. Member of the Board of Trustees of NorthStar Education Finance, Inc., a non-profit organization, since 2007. | | Asset Allocation Trust |
Michael S. Scofield (Born 1943) | | Trustee, since 2010 | | Served on the Investment Company Institute’s Board of Governors and Executive Committee from 2008-2011 as well the Governing Council of the Independent Directors Council from 2006-2011 and the Independent Directors Council Executive Committee from 2008-2011. Chairman of the IDC from 2008-2010. Institutional Investor (Fund Directions) Trustee of Year in 2007. Trustee of the Evergreen Funds complex (and its predecessors) from 1984 to 2010. Chairman of the Evergreen Funds from 2000-2010. Former Trustee of the Mentor Funds. Retired Attorney, Law Offices of Michael S. Scofield. | | Asset Allocation Trust |
| * | Length of service dates reflect the Trustee’s commencement of service with the Trust’s predecessor entities, where applicable. |
| ** | Peter Gordon is expected to retire on December 31, 2017. |
Officers
| | | | | | |
Name and year of birth | | Position held and
length of service | | Principal occupations during past five years or longer | | |
Andrew Owen (Born 1960) | | President, since 2017 | | Executive Vice President of Wells Fargo Bank, N.A. and President of Wells Fargo & Company and Head of Affiliated Managers, Wells Fargo Asset Management, since 2014. Executive Vice President responsible for marketing, investments and product development for Wells Fargo Funds Management, LLC, from 2009 to 2014. | | |
Jeremy DePalma1 (Born 1974) | | Treasurer, since 2012 | | Senior Vice President of Wells Fargo Funds Management, LLC since 2009. Senior Vice President of Evergreen Investment Management Company, LLC from 2008 to 2010 and head of the Fund Reporting and Control Team within Fund Administration from 2005 to 2010. | | |
C. David Messman (Born 1960) | | Secretary, since 2000; Chief Legal Officer, since 2003 | | Senior Vice President and Secretary of Wells Fargo Funds Management, LLC since 2001. Assistant General Counsel of Wells Fargo Bank, N.A. since 2013 and Vice President and Managing Counsel of Wells Fargo Bank, N.A. from 1996 to 2013. | | |
Michael Whitaker (Born 1967) | | Chief Compliance Officer, since 2016 | | Executive Vice President of Wells Fargo Funds Management, LLC since 2016. Chief Compliance Officer of Fidelity’s Fixed Income Funds and Asset Allocation Funds from 2008 to 2016, Compliance Officer of FMR Co., Inc. from 2014 to 2016, Fidelity Investments Money Management, Inc. from 2014 to 2016, Fidelity Investments from 2007 to 2016. | | |
David Berardi (Born 1975) | | Assistant Treasurer, since 2009 | | Vice President of Wells Fargo Funds Management, LLC since 2009. Vice President of Evergreen Investment Management Company, LLC from 2008 to 2010. Manager of Fund Reporting and Control for Evergreen Investment Management Company, LLC from 2004 to 2010. | | |
| 1 | Jeremy DePalma acts as Treasurer of 69 funds and Assistant Treasurer of 69 funds in the Fund Complex. |
| 2 | The Statement of Additional Information includes additional information about the Trustees and is available, without charge, upon request, by calling 1-800-222-8222 or by visiting the website at wellsfargofunds.com. |
| | | | |
| 30 | | Wells Fargo Disciplined U.S. Core Fund | | List of abbreviations |
The following is a list of common abbreviations for terms and entities that may have appeared in this report.
| ACA | — ACA Financial Guaranty Corporation |
| ADR | — American depositary receipt |
| ADS | — American depositary shares |
| AGC | — Assured Guaranty Corporation |
| AGM | — Assured Guaranty Municipal |
| Ambac | — Ambac Financial Group Incorporated |
| AMT | — Alternative minimum tax |
| BAN | — Bond anticipation notes |
| BHAC | — Berkshire Hathaway Assurance Corporation |
| CAB | — Capital appreciation bond |
| CCAB | — Convertible capital appreciation bond |
| CDA | — Community Development Authority |
| CDO | — Collateralized debt obligation |
| DRIVER | — Derivative inverse tax-exempt receipts |
| DW&P | — Department of Water & Power |
| DWR | — Department of Water Resources |
| ECFA | — Educational & Cultural Facilities Authority |
| EDA | — Economic Development Authority |
| EDFA | — Economic Development Finance Authority |
| ETF | — Exchange-traded fund |
| FDIC | — Federal Deposit Insurance Corporation |
| FFCB | — Federal Farm Credit Banks |
| FGIC | — Financial Guaranty Insurance Corporation |
| FHA | — Federal Housing Administration |
| FHLB | — Federal Home Loan Bank |
| FHLMC | — Federal Home Loan Mortgage Corporation |
| FICO | — The Financing Corporation |
| FNMA | — Federal National Mortgage Association |
| GDR | — Global depositary receipt |
| GNMA | — Government National Mortgage Association |
| HCFR | — Healthcare facilities revenue |
| HEFA | — Health & Educational Facilities Authority |
| HEFAR | — Higher education facilities authority revenue |
| HFA | — Housing Finance Authority |
| HFFA | — Health Facilities Financing Authority |
| HUD | — Department of Housing and Urban Development |
| IDA | — Industrial Development Authority |
| IDAG | — Industrial Development Agency |
| KRW | — Republic of Korea won |
| LIBOR | — London Interbank Offered Rate |
| LIFER | — Long Inverse Floating Exempt Receipts |
| LLC | — Limited liability company |
| LLLP | — Limited liability limited partnership |
| LLP | — Limited liability partnership |
| MBIA | — Municipal Bond Insurance Association |
| MFHR | — Multifamily housing revenue |
| MSTR | — Municipal securities trust receipts |
| MUD | — Municipal Utility District |
| National | — National Public Finance Guarantee Corporation |
| PCFA | — Pollution Control Financing Authority |
| PCL | — Public Company Limited |
| PCR | — Pollution control revenue |
| PFA | — Public Finance Authority |
| PFFA | — Public Facilities Financing Authority |
| PFOTER | — Puttable floating option tax-exempt receipts |
| plc | — Public limited company |
| PUTTER | — Puttable tax-exempt receipts |
| R&D | — Research & development |
| Radian | — Radian Asset Assurance |
| RAN | — Revenue anticipation notes |
| RDA | — Redevelopment Authority |
| RDFA | — Redevelopment Finance Authority |
| REIT | — Real estate investment trust |
| ROC | — Reset option certificates |
| SAVRS | — Select auction variable rate securities |
| SBA | — Small Business Authority |
| SDR | — Swedish depositary receipt |
| SFHR | — Single-family housing revenue |
| SFMR | — Single-family mortgage revenue |
| SPA | — Standby purchase agreement |
| SPDR | — Standard & Poor’s Depositary Receipts |
| SPEAR | — Short Puttable Exempt Adjustable Receipts |
| STRIPS | — Separate trading of registered interest and |
| TAN | — Tax anticipation notes |
| TIPS | — Treasury inflation-protected securities |
| TRAN | — Tax revenue anticipation notes |
| TTFA | — Transportation Trust Fund Authority |
| TVA | — Tennessee Valley Authority |
This page is intentionally left blank.
This page is intentionally left blank.

For more information
More information about Wells Fargo Funds is available free upon request. To obtain literature, please write, email, visit the Fund’s website, or call:
Wells Fargo Funds
P.O. Box 8266
Boston, MA 02266-8266
Email: fundservice@wellsfargo.com
Website: wellsfargofunds.com
Individual investors: 1-800-222-8222
Retail investment professionals: 1-888-877-9275
Institutional investment professionals: 1-866-765-0778
This report and the financial statements contained herein are submitted for the general information of the shareholders of the Fund. If this report is used for promotional purposes, distribution of the report must be accompanied or preceded by a current prospectus. Before investing, please consider the investment objectives, risks, charges, and expenses of the investment. For a current prospectus and, if available, a summary prospectus, containing this information, call 1-800-222-8222 or visit the Fund’s website at wellsfargofunds.com. Read the prospectus carefully before you invest or send money.
Wells Fargo Asset Management (WFAM) is a trade name used by the asset management businesses of Wells Fargo & Company. Wells Fargo Funds Management, LLC, a wholly owned subsidiary of Wells Fargo & Company, provides investment advisory and administrative services for Wells Fargo Funds. Other affiliates of Wells Fargo & Company provide subadvisory and other services for the funds. The funds are distributed by Wells Fargo Funds Distributor, LLC, Member FINRA, an affiliate of Wells Fargo & Company. Neither Wells Fargo Funds Management nor Wells Fargo Funds Distributor has Fund customer accounts/assets, and neither provides investment advice/recommendations or acts as an investment advice fiduciary to any investor.
NOT FDIC INSURED ◾ NO BANK GUARANTEE ◾ MAY LOSE VALUE
© 2017 Wells Fargo Funds Management, LLC. All rights reserved.
| | |
 | | 301456 03-17 SA203/SAR203 01-17 |
Semi-Annual Report
January 31, 2017

Wells Fargo Endeavor Select Fund


Reduce clutter. Save trees.
Sign up for electronic delivery of prospectuses and shareholder reports at wellsfargo.com/advantagedelivery
Contents
The views expressed and any forward-looking statements are as of January 31, 2017, unless otherwise noted, and are those of the Fund managers and/or Wells Fargo Funds Management, LLC. Discussions of individual securities, or the markets generally, or any Wells Fargo Fund are not intended as individual recommendations. Future events or results may vary significantly from those expressed in any forward-looking statements. The views expressed are subject to change at any time in response to changing circumstances in the market. Wells Fargo Funds Management, LLC and the Fund disclaim any obligation to publicly update or revise any views expressed or forward-looking statements.
NOT FDIC INSURED ◾ NO BANK GUARANTEE ◾ MAY LOSE VALUE
| | | | |
| 2 | | Wells Fargo Endeavor Select Fund | | Letter to shareholders (unaudited) |

Andrew Owen
President
Wells Fargo Funds
U.S. and international stocks returned 5.96% and 4.16% for the six-month period, respectively; within fixed income, the Bloomberg Barclays U.S. Aggregate Bond Index3 returned -2.95%.
Dear Shareholder:
As the new president of Wells Fargo Funds now that Karla Rabusch is retiring from that position after nearly 14 years, I am pleased to offer you this semi-annual report for the Wells Fargo Endeavor Select Fund for the six-month period that ended January 31, 2017. Despite heightened market volatility, global stocks delivered favorable results overall. U.S. and international stocks returned 5.96% and 4.16% for the six-month period, respectively, as measured by the S&P 500 Index1 and the MSCI ACWI ex USA Index (Net)2; within fixed income, the Bloomberg Barclays U.S. Aggregate Bond Index3 returned -2.95%.
In August–September 2016, global stocks delivered generally positive results; bonds’ interest rates remained historically low.
From August into early September 2016, U.S. and international stocks generally trended upward. Ever since the Great Recession, markets worldwide have been supported to varying degrees by accommodative policies from leading central banks, including the Federal Reserve (Fed), European Central Bank, Bank of England, and Bank of Japan. As a result, investors have watched closely for any signs that global central banks might tighten their measures. In the U.S., early-September comments by several Fed officials appeared to suggest a September interest-rate increase, which sent stock and bond prices downward. However, stocks surged following the Fed’s September 20 meeting on news that the Fed had decided to delay a rate increase to later in 2016. In bond markets, interest rates remained at historically low levels as a result of easy monetary policies, subdued global growth, and modest inflation expectations. Yields rose, after bottoming in July, as market participants felt that yields had overshot the real risks of the U.K.’s Brexit vote and as economic activity strengthened. At the front end of the yield curve, anticipation of new money market fund rules resulted in significantly higher yields on many short-term securities.
During the fourth quarter of 2016, prospects for faster growth and higher interest rates in the U.S. largely influenced the markets.
Early in the fourth quarter of 2016, U.S. stocks tended to trade lower amid concerns such as a likely interest-rate increase and uncertainty over the approaching general election. However, following Donald Trump’s election as president in early November, U.S. stocks began to rally. Investors appeared optimistic that the new administration would usher in a series of pro-growth policies, and supportive economic news helped the rally carry through the quarter. The buoyant environment sent interest rates higher as well. At its mid-December meeting, Fed officials raised their short-term target interest rate for the first time in a year, by a quarter percentage point, to between 0.50% and 0.75%. The fourth quarter also saw the implementation of the Securities and Exchange Commission’s new rules for money market funds, which included floating net asset values (NAVs) for institutional prime and municipal money market funds as well as liquidity fees and redemption gates. In the year leading up to
| 1 | The S&P 500 Index consists of 500 stocks chosen for market size, liquidity, and industry group representation. It is a market-value-weighted index with each stock’s weight in the index proportionate to its market value. You cannot invest directly in an index. |
| 2 | The Morgan Stanley Capital International (MSCI) All Country World Index (ACWI) ex USA Index (Net) is a free-float-adjusted market-capitalization-weighted index that is designed to measure the equity market performance of developed markets, excluding the United States and Canada. Source: MSCI. MSCI makes no express or implied warranties or representations and shall have no liability whatsoever with respect to any MSCI data contained herein. The MSCI data may not be further redistributed or used as a basis for other indexes or any securities or financial products. This report is not approved, reviewed, or produced by MSCI. You cannot invest directly in an index. |
| 3 | The Bloomberg Barclays U.S. Aggregate Bond Index (formerly known as Barclays U.S. Aggregate Bond Index) is a broad-based benchmark that measures the investment-grade, U.S. dollar–denominated, fixed-rate taxable bond market, including Treasuries, government-related and corporate securities, mortgage-backed securities (agency fixed-rate and hybrid adjustable-rate mortgage pass-throughs), asset-backed securities, and commercial mortgage-backed securities. You cannot invest directly in an index. |
| | | | | | |
| Letter to shareholders (unaudited) | | Wells Fargo Endeavor Select Fund | | | 3 | |
money fund reform implementation, nearly $1 trillion in assets moved from these types of money market funds into government money market funds, which continued to transact at a stable $1 NAV. Outside of the U.S., the prospects for faster U.S. growth appeared to trigger some acceleration in Europe. The improvement may be partly attributable to expectations for further strengthening of the U.S. dollar, which in turn could improve demand for European goods in the U.S. due to weakening of the euro relative to the dollar.
Investor optimism continued into January 2017.
January brought continued strength in global stock markets. Markets were lifted by factors such as strong trade data from Japan, robust earnings reports by businesses, and investors’ hopes that the U.S. government will approve a large fiscal stimulus package.
Don’t let short-term uncertainty derail long-term investment goals.
Periods of uncertainty can present challenges, but experience has taught us that maintaining long-term investment goals can be an effective way to plan for the future. To help you create a sound strategy based on your personal goals and risk tolerance, Wells Fargo Funds offers more than 100 mutual funds spanning a wide range of asset classes and investment styles. Although diversification cannot guarantee an investment profit or prevent losses, we believe it can be an effective way to manage investment risk and potentially smooth out overall portfolio performance. We encourage investors to know their investments and to understand that appropriate levels of risk-taking may unlock opportunities.
Thank you for choosing to invest in Wells Fargo Funds. We appreciate your confidence in us and remain committed to helping you meet your financial needs.
Sincerely,

Andrew Owen
President
Wells Fargo Funds
Although diversification cannot guarantee an investment profit or prevent losses, we believe it can be an effective way to manage investment risk and potentially smooth out overall portfolio performance.
For further information about your Fund, contact your investment professional, visit our website at wellsfargofunds.com, or call us directly at 1-800-222-8222. We are available 24 hours a day, 7 days a week.
| | | | |
| 4 | | Wells Fargo Endeavor Select Fund | | Performance highlights (unaudited) |
Investment objective
The Fund seeks long-term capital appreciation.
Manager
Wells Fargo Funds Management, LLC
Subadviser
Wells Capital Management Incorporated
Portfolio managers
Michael T. Smith, CFA®
Christopher J. Warner, CFA®
Average annual total returns (%) as of January 31, 2017
| | | | | | | | | | | | | | | | | | | | | | | | | | | | | | | | | | |
| | | | | Including sales charge | | | Excluding sales charge | | | Expense ratios1 (%) | |
| | | Inception date | | 1 year | | | 5 year | | | 10 year | | | 1 year | | | 5 year | | | 10 year | | | Gross | | | Net2 | |
| Class A (STAEX) | | 12-29-2000 | | | 5.84 | | | | 10.14 | | | | 4.85 | | | | 12.34 | | | | 11.45 | | | | 5.48 | | | | 1.28 | | | | 1.20 | |
| Class C (WECCX) | | 12-29-2000 | | | 10.48 | | | | 10.61 | | | | 4.69 | | | | 11.48 | | | | 10.61 | | | | 4.69 | | | | 2.03 | | | | 1.95 | |
| Administrator Class (WECDX) | | 4-8-2005 | | | – | | | | – | | | | – | | | | 12.61 | | | | 11.70 | | | | 5.75 | | | | 1.20 | | | | 1.00 | |
| Institutional Class (WFCIX) | | 4-8-2005 | | | – | | | | – | | | | – | | | | 12.80 | | | | 11.92 | | | | 5.94 | | | | 0.95 | | | | 0.80 | |
| Russell 1000® Growth Index3 | | – | | | – | | | | – | | | | – | | | | 17.23 | | | | 13.93 | | | | 8.42 | | | | – | | | | – | |
Figures quoted represent past performance, which is no guarantee of future results, and do not reflect taxes that a shareholder may pay on fund distributions or the redemption of fund shares. Investment return and principal value of an investment will fluctuate so that an investor’s shares, when redeemed, may be worth more or less than their original cost. Performance shown without sales charges would be lower if sales charges were reflected. Current performance may be lower or higher than the performance data quoted, which assumes the reinvestment of dividends and capital gains. Current month-end performance is available on the Fund’s website, wellsfargofunds.com.
Index returns do not include transaction costs associated with buying and selling securities, any mutual fund fees or expenses, or any taxes. It is not possible to invest directly in an index.
For Class A shares, the maximum front-end sales charge is 5.75%. For Class C shares, the maximum contingent deferred sales charge is 1.00%. Performance including a contingent deferred sales charge assumes the sales charge for the corresponding time period. Administrator Class and Institutional Class shares are sold without a front-end sales charge or contingent deferred sales charge.
Stock values fluctuate in response to the activities of individual companies and general market and economic conditions. Certain investment strategies tend to increase the total risk of an investment (relative to the broader market). The Fund is exposed to foreign investment risk, focused portfolio risk, and smaller-company securities risk. Consult the Fund’s prospectus for additional information on these and other risks.
Please see footnotes on page 5.
| | | | | | |
| Performance highlights (unaudited) | | Wells Fargo Endeavor Select Fund | | | 5 | |
| | | | |
| Ten largest holdings (%) as of January 31, 20174 | |
Amazon.com Incorporated | | | 6.58 | |
Alphabet Incorporated Class A | | | 5.44 | |
Visa Incorporated Class A | | | 4.41 | |
UnitedHealth Group Incorporated | | | 3.82 | |
The Home Depot Incorporated | | | 3.62 | |
Microsoft Corporation | | | 3.54 | |
Waste Connections Incorporated | | | 3.39 | |
Celgene Corporation | | | 3.17 | |
Fidelity National Information Services Incorporated | | | 3.13 | |
Intercontinental Exchange Incorporated | | | 2.81 | |
|
| Sector distribution as of January 31, 20175 |
|
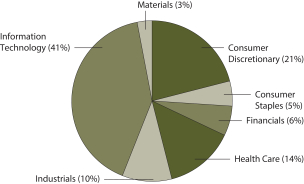
|
| 1 | Reflects the expense ratios as stated in the most recent prospectuses. The expense ratios shown are subject to change and may differ from the annualized expense ratios shown in the financial highlights of this report. |
| 2 | The manager has contractually committed through November 30, 2017, to waive fees and/or reimburse expenses to the extent necessary to cap the Fund’s Total Annual Fund Operating Expenses After Fee Waiver at the amounts shown. After this time, the cap may be increased or the commitment to maintain the cap may be terminated only with the approval of the Board of Trustees. Brokerage commissions, stamp duty fees, interest, taxes, acquired fund fees and expenses, and extraordinary expenses are excluded from the expense cap. Without this cap, the Fund’s returns would have been lower. |
| 3 | The Russell 1000® Growth Index measures the performance of those Russell 1000 companies with higher price-to-book ratios and higher forecasted growth values. You cannot invest directly in an index. |
| 4 | The ten largest holdings, excluding cash and cash equivalents, are calculated based on the value of the investments divided by total net assets of the Fund. Holdings are subject to change and may have changed since the date specified. |
| 5 | Amounts are calculated based on the total long-term investments of the Fund. These amounts are subject to change and may have changed since the date specified. |
| | | | |
| 6 | | Wells Fargo Endeavor Select Fund | | Fund expenses (unaudited) |
As a shareholder of the Fund, you incur two types of costs: (1) transaction costs, including sales charges (loads) on purchase payments and contingent deferred sales charges (if any) on redemptions and (2) ongoing costs, including management fees, distribution (12b-1) and/or shareholder servicing fees, and other Fund expenses. This example is intended to help you understand your ongoing costs (in dollars) of investing in the Fund and to compare these costs with the ongoing costs of investing in other mutual funds.
The example is based on an investment of $1,000 invested at the beginning of the six-month period and held for the entire period from August 1, 2016 to January 31, 2017.
Actual expenses
The “Actual” line of the table below provides information about actual account values and actual expenses. You may use the information in this line, together with the amount you invested, to estimate the expenses that you paid over the period. Simply divide your account value by $1,000 (for example, an $8,600 account value divided by $1,000 = 8.6), then multiply the result by the number in the “Actual” line under the heading entitled “Expenses paid during period” for your applicable class of shares to estimate the expenses you paid on your account during this period.
Hypothetical example for comparison purposes
The “Hypothetical” line of the table below provides information about hypothetical account values and hypothetical expenses based on the Fund’s actual expense ratio and an assumed rate of return of 5% per year before expenses, which is not the Fund’s actual return. The hypothetical account values and expenses may not be used to estimate the actual ending account balance or expenses you paid for the period. You may use this information to compare the ongoing costs of investing in the Fund and other funds. To do so, compare this 5% hypothetical example with the 5% hypothetical examples that appear in the shareholder reports of the other funds.
Please note that the expenses shown in the table are meant to highlight your ongoing costs only and do not reflect any transactional costs, such as sales charges (loads) and contingent deferred sales charges. Therefore, the “Hypothetical” line of the table is useful in comparing ongoing costs only and will not help you determine the relative total costs of owning different funds. In addition, if these transactional costs were included, your costs would have been higher.
| | | | | | | | | | | | | | | | |
| | | Beginning account value 8-1-2016 | | | Ending account value 1-31-2017 | | | Expenses paid during the period¹ | | | Annualized net expense ratio | |
Class A | | | | | | | | | | | | | | | | |
Actual | | $ | 1,000.00 | | | $ | 1,021.82 | | | $ | 6.10 | | | | 1.20 | % |
Hypothetical (5% return before expenses) | | $ | 1,000.00 | | | $ | 1,019.10 | | | $ | 6.09 | | | | 1.20 | % |
Class C | | | | | | | | | | | | | | | | |
Actual | | $ | 1,000.00 | | | $ | 1,017.35 | | | $ | 9.89 | | | | 1.95 | % |
Hypothetical (5% return before expenses) | | $ | 1,000.00 | | | $ | 1,015.33 | | | $ | 9.88 | | | | 1.95 | % |
Administrator Class | | | | | | | | | | | | | | | | |
Actual | | $ | 1,000.00 | | | $ | 1,022.87 | | | $ | 5.08 | | | | 1.00 | % |
Hypothetical (5% return before expenses) | | $ | 1,000.00 | | | $ | 1,020.11 | | | $ | 5.08 | | | | 1.00 | % |
Institutional Class | | | | | | | | | | | | | | | | |
Actual | | $ | 1,000.00 | | | $ | 1,024.00 | | | $ | 4.07 | | | | 0.80 | % |
Hypothetical (5% return before expenses) | | $ | 1,000.00 | | | $ | 1,021.11 | | | $ | 4.06 | | | | 0.80 | % |
| 1 | Expenses paid is equal to the annualized net expense ratio of each class multiplied by the average account value over the period, multiplied by the number of days in the most recent fiscal half-year divided by the number of days in the fiscal year (to reflect the one-half-year period). |
| | | | | | |
| Portfolio of investments—January 31, 2017 (unaudited) | | Wells Fargo Endeavor Select Fund | | | 7 | |
| | | | | | | | | | | | | | | | |
| Security name | | | | | | | | Shares | | | Value | |
| | | | |
Common Stocks: 99.31% | | | | | | | | | | | | | | | | |
| | | | |
Consumer Discretionary: 21.12% | | | | | | | | | | | | | | | | |
| | | | |
| Hotels, Restaurants & Leisure: 4.62% | | | | | | | | | | | | | | | | |
Starbucks Corporation | | | | | | | | | | | 71,400 | | | $ | 3,942,708 | |
Yum! Brands Incorporated | | | | | | | | | | | 56,900 | | | | 3,728,657 | |
| | | | |
| | | | | | | | | | | | | | | 7,671,365 | |
| | | | | | | | | | | | | | | | |
| | | | |
| Internet & Direct Marketing Retail: 6.58% | | | | | | | | | | | | | | | | |
Amazon.com Incorporated † | | | | | | | | | | | 13,253 | | | | 10,913,580 | |
| | | | | | | | | | | | | | | | |
| | | | |
| Media: 2.22% | | | | | | | | | | | | | | | | |
Charter Communications Incorporated Class A † | | | | | | | | | | | 11,400 | | | | 3,693,030 | |
| | | | | | | | | | | | | | | | |
| | | | |
| Specialty Retail: 7.70% | | | | | | | | | | | | | | | | |
O’Reilly Automotive Incorporated † | | | | | | | | | | | 10,900 | | | | 2,858,743 | |
The Home Depot Incorporated | | | | | | | | | | | 43,683 | | | | 6,009,907 | |
The TJX Companies Incorporated | | | | | | | | | | | 52,117 | | | | 3,904,606 | |
| | | | |
| | | | | | | | | | | | | | | 12,773,256 | |
| | | | | | | | | | | | | | | | |
| | | | |
Consumer Staples: 4.57% | | | | | | | | | | | | | | | | |
| | | | |
| Beverages: 2.93% | | | | | | | | | | | | | | | | |
Constellation Brands Incorporated Class A | | | | | | | | | | | 18,015 | | | | 2,697,926 | |
Monster Beverage Corporation † | | | | | | | | | | | 50,900 | | | | 2,168,340 | |
| | | | |
| | | | | | | | | | | | | | | 4,866,266 | |
| | | | | | | | | | | | | | | | |
| | | | |
| Tobacco: 1.64% | | | | | | | | | | | | | | | | |
Reynolds American Incorporated | | | | | | | | | | | 45,200 | | | | 2,717,876 | |
| | | | | | | | | | | | | | | | |
| | | | |
Financials: 5.97% | | | | | | | | | | | | | | | | |
| | | | |
| Capital Markets: 5.97% | | | | | | | | | | | | | | | | |
Intercontinental Exchange Incorporated | | | | | | | | | | | 79,815 | | | | 4,658,003 | |
Raymond James Financial Incorporated | | | | | | | | | | | 28,900 | | | | 2,165,477 | |
S&P Global Incorporated | | | | | | | | | | | 25,578 | | | | 3,073,964 | |
| | | | |
| | | | | | | | | | | | | | | 9,897,444 | |
| | | | | | | | | | | | | | | | |
| | | | |
Health Care: 13.43% | | | | | | | | | | | | | | | | |
| | | | |
| Biotechnology: 4.06% | | | | | | | | | | | | | | | | |
Celgene Corporation † | | | | | | | | | | | 45,279 | | | | 5,259,156 | |
Gilead Sciences Incorporated | | | | | | | | | | | 20,400 | | | | 1,477,980 | |
| | | | |
| | | | | | | | | | | | | | | 6,737,136 | |
| | | | | | | | | | | | | | | | |
| | | | |
| Health Care Equipment & Supplies: 5.55% | | | | | | | | | | | | | | | | |
Baxter International Incorporated | | | | | | | | | | | 65,700 | | | | 3,147,687 | |
Boston Scientific Corporation † | | | | | | | | | | | 128,500 | | | | 3,091,710 | |
Intuitive Surgical Incorporated † | | | | | | | | | | | 4,300 | | | | 2,978,567 | |
| | | | |
| | | | | | | | | | | | | | | 9,217,964 | |
| | | | | | | | | | | | | | | | |
The accompanying notes are an integral part of these financial statements.
| | | | |
| 8 | | Wells Fargo Endeavor Select Fund | | Portfolio of investments—January 31, 2017 (unaudited) |
| | | | | | | | | | | | | | | | |
| Security name | | | | | | | | Shares | | | Value | |
| | | | |
| Health Care Providers & Services: 3.82% | | | | | | | | | | | | | | | | |
UnitedHealth Group Incorporated | | | | | | | | | | | 39,100 | | | $ | 6,338,110 | |
| | | | | | | | | | | | | | | | |
| | | | |
Industrials: 9.77% | | | | | | | | | | | | | | | | |
| | | | |
| Aerospace & Defense: 1.56% | | | | | | | | | | | | | | | | |
Northrop Grumman Corporation | | | | | | | | | | | 11,300 | | | | 2,588,604 | |
| | | | | | | | | | | | | | | | |
| | | | |
| Airlines: 1.44% | | | | | | | | | | | | | | | | |
Spirit Airlines Incorporated † | | | | | | | | | | | 44,300 | | | | 2,393,972 | |
| | | | | | | | | | | | | | | | |
| | | | |
| Building Products: 2.34% | | | | | | | | | | | | | | | | |
Johnson Controls International plc | | | | | | | | | | | 88,126 | | | | 3,875,781 | |
| | | | | | | | | | | | | | | | |
| | | | |
| Commercial Services & Supplies: 3.39% | | | | | | | | | | | | | | | | |
Waste Connections Incorporated | | | | | | | | | | | 70,140 | | | | 5,632,242 | |
| | | | | | | | | | | | | | | | |
| | | | |
| Road & Rail: 1.04% | | | | | | | | | | | | | | | | |
Kansas City Southern | | | | | | | | | | | 20,100 | | | | 1,726,791 | |
| | | | | | | | | | | | | | | | |
| | | | |
Information Technology: 40.94% | | | | | | | | | | | | | | | | |
| | | | |
| Communications Equipment: 2.04% | | | | | | | | | | | | | | | | |
Harris Corporation | | | | | | | | | | | 32,900 | | | | 3,379,159 | |
| | | | | | | | | | | | | | | | |
| | | | |
| Internet Software & Services: 12.26% | | | | | | | | | | | | | | | | |
Alphabet Incorporated Class A † | | | | | | | | | | | 10,999 | | | | 9,021,270 | |
Alphabet Incorporated Class C † | | | | | | | | | | | 4,200 | | | | 3,346,518 | |
Facebook Incorporated Class A † | | | | | | | | | | | 34,349 | | | | 4,476,362 | |
Tencent Holdings Limited ADR | | | | | | | | | | | 133,500 | | | | 3,495,698 | |
| | | | |
| | | | | | | | | | | | | | | 20,339,848 | |
| | | | | | | | | | | | | | | | |
| | | | |
| IT Services: 9.79% | | | | | | | | | | | | | | | | |
Fidelity National Information Services Incorporated | | | | | | | | | | | 65,300 | | | | 5,186,126 | |
PayPal Holdings Incorporated † | | | | | | | | | | | 94,100 | | | | 3,743,298 | |
Visa Incorporated Class A | | | | | | | | | | | 88,558 | | | | 7,324,632 | |
| | | | |
| | | | | | | | | | | | | | | 16,254,056 | |
| | | | | | | | | | | | | | | | |
| | | | |
| Semiconductors & Semiconductor Equipment: 2.51% | | | | | | | | | | | | | | | | |
Broadcom Limited | | | | | | | | | | | 20,900 | | | | 4,169,550 | |
| | | | | | | | | | | | | | | | |
| | | | |
| Software: 14.34% | | | | | | | | | | | | | | | | |
Adobe Systems Incorporated † | | | | | | | | | | | 29,900 | | | | 3,390,062 | |
Electronic Arts Incorporated † | | | | | | | | | | | 51,000 | | | | 4,254,930 | |
Microsoft Corporation | | | | | | | | | | | 90,800 | | | | 5,870,220 | |
Salesforce.com Incorporated † | | | | | | | | | | | 51,000 | | | | 4,034,100 | |
Symantec Corporation | | | | | | | | | | | 136,000 | | | | 3,746,800 | |
Ultimate Software Group Incorporated † | | | | | | | | | | | 12,900 | | | | 2,498,214 | |
| | | | |
| | | | | | | | | | | | | | | 23,794,326 | |
| | | | | | | | | | | | | | | | |
| | | | |
Materials: 3.51% | | | | | | | | | | | | | | | | |
| | | | |
| Chemicals: 1.89% | | | | | | | | | | | | | | | | |
The Sherwin-Williams Company | | | | | | | | | | | 10,300 | | | | 3,129,243 | |
| | | | | | | | | | | | | | | | |
The accompanying notes are an integral part of these financial statements.
| | | | | | |
| Portfolio of investments—January 31, 2017 (unaudited) | | Wells Fargo Endeavor Select Fund | | | 9 | |
| | | | | | | | | | | | | | | | |
| Security name | | | | | | | | Shares | | | Value | |
| | | | |
| Construction Materials: 1.62% | | | | | | | | | | | | | | | | |
Vulcan Materials Company | | | | | | | | | | | 21,000 | | | $ | 2,694,930 | |
| | | | | | | | | | | | | | | | |
| | | | |
Total Common Stocks (Cost $125,504,837) | | | | | | | | | | | | | | | 164,804,529 | |
| | | | | | | | | | | | | | | | |
| | | | |
| | | Yield | | | | | | | | | | |
| Short-Term Investments: 1.09% | | | | | | | | | | | | | | | | |
| | | | |
| Investment Companies: 1.09% | | | | | | | | | | | | | | | | |
Wells Fargo Government Money Market Fund Select Class (l)(u) | | | 0.46 | % | | | | | | | 1,812,885 | | | | 1,812,885 | |
| | | | | | | | | | | | | | | | |
| | | | |
Total Short-Term Investments (Cost $1,812,885) | | | | | | | | | | | | | | | 1,812,885 | |
| | | | | | | | | | | | | | | | |
| | | | | | | | |
| Total investments in securities (Cost $127,317,722) * | | | 100.40 | % | | | 166,617,414 | |
Other assets and liabilities, net | | | (0.40 | ) | | | (662,546 | ) |
| | | | | | | | |
| Total net assets | | | 100.00 | % | | $ | 165,954,868 | |
| | | | | | | | |
| † | Non-income-earning security |
| (l) | The issuer of the security is an affiliated person of the Fund as defined in the Investment Company Act of 1940. |
| (u) | The rate represents the 7-day annualized yield at period end. |
| * | Cost for federal income tax purposes is $127,311,783 and unrealized gains (losses) consists of: |
| | | | |
Gross unrealized gains | | $ | 40,104,545 | |
Gross unrealized losses | | | (798,914 | ) |
| | | | |
Net unrealized gains | | $ | 39,305,631 | |
The accompanying notes are an integral part of these financial statements.
| | | | |
| 10 | | Wells Fargo Endeavor Select Fund | | Statement of assets and liabilities—January 31, 2017 (unaudited) |
| | | | |
| | | | |
| |
Assets | | | | |
Investments | | | | |
In unaffiliated securities, at value (cost $125,504,837) | | $ | 164,804,529 | |
In affiliated securities, at value (cost $1,812,885) | | | 1,812,885 | |
| | | | |
Total investments, at value (cost $127,317,722) | | | 166,617,414 | |
Receivable for Fund shares sold | | | 66,113 | |
Receivable for dividends | | | 21,897 | |
Receivable for securities lending income | | | 121 | |
Prepaid expenses and other assets | | | 67,517 | |
| | | | |
Total assets | | | 166,773,062 | |
| | | | |
| |
Liabilities | | | | |
Payable for Fund shares redeemed | | | 593,939 | |
Management fee payable | | | 87,801 | |
Distribution fees payable | | | 2,338 | |
Administration fees payable | | | 19,727 | |
Shareholder report expenses payable | | | 76,762 | |
Accrued expenses and other liabilities | | | 37,627 | |
| | | | |
Total liabilities | | | 818,194 | |
| | | | |
Total net assets | | $ | 165,954,868 | |
| | | | |
| |
NET ASSETS CONSIST OF | | | | |
Paid-in capital | | $ | 116,921,480 | |
Undistributed net investment income | | | 190,157 | |
Accumulated net realized gains on investments | | | 9,543,539 | |
Net unrealized gains on investments | | | 39,299,692 | |
| | | | |
Total net assets | | $ | 165,954,868 | |
| | | | |
| |
COMPUTATION OF NET ASSET VALUE AND OFFERING PRICE PER SHARE | | | | |
Net assets – Class A | | $ | 14,789,262 | |
Shares outstanding – Class A1 | | | 1,900,802 | |
Net asset value per share – Class A | | | $7.78 | |
Maximum offering price per share – Class A2 | | | $8.25 | |
Net assets – Class C | | $ | 3,667,470 | |
Shares outstanding – Class C1 | | | 627,696 | |
Net asset value per share – Class C | | | $5.84 | |
Net assets – Administrator Class | | $ | 3,815,544 | |
Shares outstanding – Administrator Class1 | | | 463,969 | |
Net asset value per share – Administrator Class | | | $8.22 | |
Net assets – Institutional Class | | $ | 143,682,592 | |
Shares outstanding – Institutional Class1 | | | 16,894,592 | |
Net asset value per share – Institutional Class | | | $8.50 | |
| 1 | The Fund has an unlimited number of authorized shares. |
| 2 | Maximum offering price is computed as 100/94.25 of net asset value. On investments of $50,000 or more, the offering price is reduced. |
The accompanying notes are an integral part of these financial statements.
| | | | | | |
| Statement of operations—six months ended January 31, 2017 (unaudited) | | Wells Fargo Endeavor Select Fund | | | 11 | |
| | | | |
| | | | |
| |
Investment income | | | | |
Dividends (net of foreign withholding taxes of $25,299) | | $ | 1,065,688 | |
Income from affiliated securities | | | 3,902 | |
Securities lending income, net | | | 121 | |
| | | | |
Total investment income | | | 1,069,711 | |
| | | | |
| |
Expenses | | | | |
Management fee | | | 623,388 | |
Administration fees | | | | |
Class A | | | 17,447 | |
Class B | | | 5 | 1 |
Class C | | | 4,562 | |
Administrator Class | | | 2,859 | |
Institutional Class | | | 99,285 | |
Shareholder servicing fees | | | | |
Class A | | | 20,770 | |
Class B | | | 6 | 1 |
Class C | | | 5,431 | |
Administrator Class | | | 5,498 | |
Distribution fees | | | | |
Class B | | | 18 | 1 |
Class C | | | 16,295 | |
Custody and accounting fees | | | 7,017 | |
Professional fees | | | 22,874 | |
Registration fees | | | 1,123 | |
Shareholder report expenses | | | 307 | |
Trustees’ fees and expenses | | | 11,746 | |
Other fees and expenses | | | 6,257 | |
| | | | |
Total expenses | | | 844,888 | |
Less: Fee waivers and/or expense reimbursements | | | (69,805 | ) |
| | | | |
Net expenses | | | 775,083 | |
| | | | |
Net investment income | | | 294,628 | |
| | | | |
| |
REALIZED AND UNREALIZED GAINS (LOSSES) ON INVESTMENTS | | | | |
Net realized gains on investments | | | 17,316,193 | |
Net change in unrealized gains (losses) on investments | | | (13,965,877 | ) |
| | | | |
Net realized and unrealized gains (losses) on investments | | | 3,350,316 | |
| | | | |
Net increase in net assets resulting from operations | | $ | 3,644,944 | |
| | | | |
| 1 | For the period from August 1, 2016 to September 9, 2016. Class B shares of the Fund were no longer offered to shareholders effective September 10, 2016. |
The accompanying notes are an integral part of these financial statements.
| | | | |
| 12 | | Wells Fargo Endeavor Select Fund | | Statement of changes in net assets |
| | | | | | | | | | | | | | | | |
| | | Six months ended
January 31, 2017
(unaudited) | | | Year ended
July 31, 2016 | |
| | | | |
Operations | | | | | | | | | | | | | | | | |
Net investment income (loss) | | | | | | $ | 294,628 | | | | | | | $ | (51,395 | ) |
Net realized gains on investments | | | | | | | 17,316,193 | | | | | | | | 23,772,212 | |
Net change in unrealized gains (losses) on investments | | | | | | | (13,965,877 | ) | | | | | | | (28,678,764 | ) |
| | | | |
Net increase (decrease) in net assets resulting from operations | | | | | | | 3,644,944 | | | | | | | | (4,957,947 | ) |
| | | | |
| | | | |
Distributions to shareholders from | | | | | | | | | | | | | | | | |
Net investment income | | | | | | | | | | | | | | | | |
Institutional Class | | | | | | | (104,471 | ) | | | | | | | 0 | |
Net realized gains | | | | | | | | | | | | | | | | |
Class A | | | | | | | (2,338,187 | ) | | | | | | | (8,268,795 | ) |
Class B | | | | | | | 0 | 1 | | | | | | | (16,431 | ) |
Class C | | | | | | | (802,158 | ) | | | | | | | (2,442,837 | ) |
Administrator Class | | | | | | | (612,919 | ) | | | | | | | (2,258,097 | ) |
Institutional Class | | | | | | | (20,446,180 | ) | | | | | | | (70,034,159 | ) |
| | | | |
Total distributions to shareholders | | | | | | | (24,303,915 | ) | | | | | | | (83,020,319 | ) |
| | | | |
| | | | |
Capital share transactions | | | Shares | | | | | | | | Shares | | | | | |
Proceeds from shares sold | | | | | | | | | | | | | | | | |
Class A | | | 99,458 | | | | 791,190 | | | | 272,747 | | | | 2,727,507 | |
Class C | | | 5,043 | | | | 28,933 | | | | 32,097 | | | | 275,581 | |
Administrator Class | | | 32,566 | | | | 299,512 | | | | 48,161 | | | | 477,125 | |
Institutional Class | | | 362,957 | | | | 3,184,357 | | | | 3,567,469 | | | | 43,696,914 | |
| | | | |
| | | | | | | 4,303,992 | | | | | | | | 47,177,127 | |
| | | | |
Reinvestment of distributions | | | | | | | | | | | | | | | | |
Class A | | | 285,522 | | | | 2,141,414 | | | | 899,011 | | | | 7,758,473 | |
Class B | | | 0 | 1 | | | 0 | 1 | | | 2,395 | | | | 16,431 | |
Class C | | | 141,389 | | | | 797,434 | | | | 348,974 | | | | 2,393,965 | |
Administrator Class | | | 74,930 | | | | 594,196 | | | | 241,051 | | | | 2,176,690 | |
Institutional Class | | | 2,494,029 | | | | 20,451,160 | | | | 7,234,603 | | | | 67,137,120 | |
| | | | |
| | | | | | | 23,984,204 | | | | | | | | 79,482,679 | |
| | | | |
Payment for shares redeemed | | | | | | | | | | | | | | | | |
Class A | | | (549,559 | ) | | | (4,582,671 | ) | | | (1,012,779 | ) | | | (9,431,420 | ) |
Class B | | | (3,203 | )1 | | | (22,604 | )1 | | | (7,902 | ) | | | (76,962 | ) |
Class C | | | (202,608 | ) | | | (1,248,123 | ) | | | (276,572 | ) | | | (2,145,911 | ) |
Administrator Class | | | (203,714 | ) | | | (1,798,027 | ) | | | (2,756,526 | ) | | | (35,152,614 | ) |
Institutional Class | | | (2,844,750 | ) | | | (25,578,200 | ) | | | (9,332,927 | ) | | | (98,111,368 | ) |
| | | | |
| | | | | | | (33,229,625 | ) | | | | | | | (144,918,275 | ) |
| | | | |
Net decrease in net assets resulting from capital share transactions | | | | | | | (4,941,429 | ) | | | | | | | (18,258,469 | ) |
| | | | |
Total decrease in net assets | | | | | | | (25,600,400 | ) | | | | | | | (106,236,735 | ) |
| | | | |
| | | | |
Net assets | | | | | | | | | | | | | | | | |
Beginning of period | | | | | | | 191,555,268 | | | | | | | | 297,792,003 | |
| | | | |
End of period | | | | | | $ | 165,954,868 | | | | | | | $ | 191,555,268 | |
| | | | |
Undistributed net investment income | | | | | | $ | 190,157 | | | | | | | $ | 0 | |
| | | | |
| 1 | For the period from August 1, 2016 to September 9, 2016. Class B shares of the Fund were no longer offered to shareholders effective September 10, 2016. |
The accompanying notes are an integral part of these financial statements.
| | | | | | |
| Financial highlights | | Wells Fargo Endeavor Select Fund | | | 13 | |
(For a share outstanding throughout each period)
| | | | | | | | | | | | | | | | | | | | | | | | |
| | | Six months ended January 31, 2017 (unaudited) | | | Year ended July 31 | |
| CLASS A | | | 2016 | | | 2015 | | | 2014 | | | 2013 | | | 2012 | |
Net asset value, beginning of period | | | $8.96 | | | | $13.74 | | | | $14.13 | | | | $12.52 | | | | $10.45 | | | | $10.12 | |
Net investment income (loss) | | | 0.00 | 1,2 | | | (0.04 | )1 | | | (0.08 | )1 | | | (0.09 | )1 | | | 0.00 | 1,2 | | | (0.05 | )1 |
Net realized and unrealized gains (losses) on investments | | | 0.15 | | | | (0.14 | ) | | | 1.65 | | | | 2.37 | | | | 2.07 | | | | 0.38 | |
| | | | | | | | | | | | | | | | | | | | | | | | |
Total from investment operations | | | 0.15 | | | | (0.18 | ) | | | 1.57 | | | | 2.28 | | | | 2.07 | | | | 0.33 | |
Distributions to shareholders from | | | | | | | | | | | | | | | | | | | | | | | | |
Net realized gains | | | (1.33 | ) | | | (4.60 | ) | | | (1.96 | ) | | | (0.67 | ) | | | 0.00 | | | | 0.00 | |
Net asset value, end of period | | | $7.78 | | | | $8.96 | | | | $13.74 | | | | $14.13 | | | | $12.52 | | | | $10.45 | |
Total return3 | | | 2.18 | % | | | (0.07 | )% | | | 12.14 | % | | | 18.40 | % | | | 19.81 | % | | | 3.26 | % |
Ratios to average net assets (annualized) | | | | | | | | | | | | | | | | | | | | | | | | |
Gross expenses | | | 1.21 | % | | | 1.28 | % | | | 1.24 | % | | | 1.25 | % | | | 1.26 | % | | | 1.23 | % |
Net expenses | | | 1.20 | % | | | 1.20 | % | | | 1.23 | % | | | 1.24 | % | | | 1.25 | % | | | 1.23 | % |
Net investment income (loss) | | | 0.00 | % | | | (0.36 | )% | | | (0.55 | )% | | | (0.66 | )% | | | 0.03 | % | | | (0.49 | )% |
Supplemental data | | | | | | | | | | | | | | | | | | | | | | | | |
Portfolio turnover rate | | | 32 | % | | | 79 | % | | | 126 | % | | | 100 | % | | | 97 | % | | | 94 | % |
Net assets, end of period (000s omitted) | | | $14,789 | | | | $18,498 | | | | $26,197 | | | | $41,708 | | | | $44,041 | | | | $47,233 | |
| 1 | Calculated based upon average shares outstanding |
| 2 | Amount is less than $0.005. |
| 3 | Total return calculations do not include any sales charges. Returns for periods of less than one year are not annualized. |
The accompanying notes are an integral part of these financial statements.
| | | | |
| 14 | | Wells Fargo Endeavor Select Fund | | Financial highlights |
(For a share outstanding throughout each period)
| | | | | | | | | | | | | | | | | | | | | | | | |
| | | Six months ended January 31, 2017 (unaudited) | | | Year ended July 31 | |
| CLASS C | | | 2016 | | | 2015 | | | 2014 | | | 2013 | | | 2012 | |
Net asset value, beginning of period | | | $7.09 | | | | $11.93 | | | | $12.61 | | | | $11.32 | | | | $9.51 | | | | $9.28 | |
Net investment loss | | | (0.02 | )1 | | | (0.09 | )1 | | | (0.16 | )1 | | | (0.17 | )1 | | | (0.07 | )1 | | | (0.11 | )1 |
Net realized and unrealized gains (losses) on investments | | | 0.10 | | | | (0.15 | ) | | | 1.44 | | | | 2.13 | | | | 1.88 | | | | 0.34 | |
| | | | | | | | | | | | | | | | | | | | | | | | |
Total from investment operations | | | 0.08 | | | | (0.24 | ) | | | 1.28 | | | | 1.96 | | | | 1.81 | | | | 0.23 | |
Distributions to shareholders from | | | | | | | | | | | | | | | | | | | | | | | | |
Net realized gains | | | (1.33 | ) | | | (4.60 | ) | | | (1.96 | ) | | | (0.67 | ) | | | 0.00 | | | | 0.00 | |
Net asset value, end of period | | | $5.84 | | | | $7.09 | | | | $11.93 | | | | $12.61 | | | | $11.32 | | | | $9.51 | |
Total return2 | | | 1.74 | % | | | (0.76 | )% | | | 11.21 | % | | | 17.60 | % | | | 18.93 | % | | | 2.48 | % |
Ratios to average net assets (annualized) | | | | | | | | | | | | | | | | | | | | | | | | |
Gross expenses | | | 1.96 | % | | | 2.03 | % | | | 1.99 | % | | | 2.00 | % | | | 2.01 | % | | | 1.98 | % |
Net expenses | | | 1.95 | % | | | 1.95 | % | | | 1.99 | % | | | 1.99 | % | | | 2.00 | % | | | 1.98 | % |
Net investment loss | | | (0.73 | )% | | | (1.11 | )% | | | (1.32 | )% | | | (1.41 | )% | | | (0.72 | )% | | | (1.25 | )% |
Supplemental data | | | | | | | | | | | | | | | | | | | | | | | | |
Portfolio turnover rate | | | 32 | % | | | 79 | % | | | 126 | % | | | 100 | % | | | 97 | % | | | 94 | % |
Net assets, end of period (000s omitted) | | | $3,667 | | | | $4,845 | | | | $6,914 | | | | $6,747 | | | | $6,320 | | | | $6,199 | |
| 1 | Calculated based upon average shares outstanding |
| 2 | Total return calculations do not include any sales charges. Returns for periods of less than one year are not annualized. |
The accompanying notes are an integral part of these financial statements.
| | | | | | |
| Financial highlights | | Wells Fargo Endeavor Select Fund | | | 15 | |
(For a share outstanding throughout each period)
| | | | | | | | | | | | | | | | | | | | | | | | |
| | | Six months ended January 31, 2017 (unaudited) | | | Year ended July 31 | |
| ADMINISTRATOR CLASS | | | 2016 | | | 2015 | | | 2014 | | | 2013 | | | 2012 | |
Net asset value, beginning of period | | | $9.38 | | | | $14.13 | | | | $14.45 | | | | $12.78 | | | | $10.63 | | | | $10.26 | |
Net investment income (loss) | | | 0.01 | 1 | | | 0.01 | 1 | | | (0.05 | )1 | | | (0.06 | )1 | | | 0.03 | 1 | | | (0.03 | )1 |
Net realized and unrealized gains (losses) on investments | | | 0.16 | | | | (0.16 | ) | | | 1.69 | | | | 2.42 | | | | 2.12 | | | | 0.40 | |
| | | | | | | | | | | | | | | | | | | | | | | | |
Total from investment operations | | | 0.17 | | | | (0.15 | ) | | | 1.64 | | | | 2.36 | | | | 2.15 | | | | 0.37 | |
Distributions to shareholders from | | | | | | | | | | | | | | | | | | | | | | | | |
Net investment income | | | 0.00 | | | | 0.00 | | | | 0.00 | | | | (0.02 | ) | | | 0.00 | | | | 0.00 | |
Net realized gains | | | (1.33 | ) | | | (4.60 | ) | | | (1.96 | ) | | | (0.67 | ) | | | 0.00 | | | | 0.00 | |
| | | | | | | | | | | | | | | | | | | | | | | | |
Total distributions to shareholders | | | (1.33 | ) | | | (4.60 | ) | | | (1.96 | ) | | | (0.69 | ) | | | 0.00 | | | | 0.00 | |
Net asset value, end of period | | | $8.22 | | | | $9.38 | | | | $14.13 | | | | $14.45 | | | | $12.78 | | | | $10.63 | |
Total return2 | | | 2.29 | % | | | 0.16 | % | | | 12.38 | % | | | 18.77 | % | | | 20.13 | % | | | 3.51 | % |
Ratios to average net assets (annualized) | | | | | | | | | | | | | | | | | | | | | | | | |
Gross expenses | | | 1.14 | % | | | 1.14 | % | | | 1.05 | % | | | 1.06 | % | | | 1.08 | % | | | 1.07 | % |
Net expenses | | | 1.00 | % | | | 1.00 | % | | | 0.99 | % | | | 1.00 | % | | | 1.00 | % | | | 1.00 | % |
Net investment income (loss) | | | 0.23 | % | | | 0.06 | % | | | (0.32 | )% | | | (0.42 | )% | | | 0.23 | % | | | (0.27 | )% |
Supplemental data | | | | | | | | | | | | | | | | | | | | | | | | |
Portfolio turnover rate | | | 32 | % | | | 79 | % | | | 126 | % | | | 100 | % | | | 97 | % | | | 94 | % |
Net assets, end of period (000s omitted) | | | $3,816 | | | | $5,254 | | | | $42,776 | | | | $48,560 | | | | $68,611 | | | | $57,533 | |
| 1 | Calculated based upon average shares outstanding |
| 2 | Returns for periods of less than one year are not annualized. |
The accompanying notes are an integral part of these financial statements.
| | | | |
| 16 | | Wells Fargo Endeavor Select Fund | | Financial highlights |
(For a share outstanding throughout each period)
| | | | | | | | | | | | | | | | | | | | | | | | |
| | | Six months ended January 31, 2017 (unaudited) | | | Year ended July 31 | |
| INSTITUTIONAL CLASS | | | 2016 | | | 2015 | | | 2014 | | | 2013 | | | 2012 | |
Net asset value, beginning of period | | | $9.65 | | | | $14.39 | | | | $14.65 | | | | $12.95 | | | | $10.75 | | | | $10.37 | |
Net investment income (loss) | | | 0.02 | | | | 0.00 | 1,2 | | | (0.01 | )1 | | | (0.03 | )1 | | | 0.06 | 1 | | | (0.01 | )1 |
Net realized and unrealized gains (losses) on investments | | | 0.17 | | | | (0.14 | ) | | | 1.71 | | | | 2.45 | | | | 2.14 | | | | 0.39 | |
| | | | | | | | | | | | | | | | | | | | | | | | |
Total from investment operations | | | 0.19 | | | | (0.14 | ) | | | 1.70 | | | | 2.42 | | | | 2.20 | | | | 0.38 | |
Distributions to shareholders from | | | | | | | | | | | | | | | | | | | | | | | | |
Net investment income | | | (0.01 | ) | | | 0.00 | | | | 0.00 | | | | (0.05 | ) | | | 0.00 | | | | 0.00 | |
Net realized gains | | | (1.33 | ) | | | (4.60 | ) | | | (1.96 | ) | | | (0.67 | ) | | | 0.00 | | | | 0.00 | |
| | | | | | | | | | | | | | | | | | | | | | | | |
Total distributions to shareholders | | | (1.34 | ) | | | (4.60 | ) | | | (1.96 | ) | | | (0.72 | ) | | | 0.00 | | | | 0.00 | |
Net asset value, end of period | | | $8.50 | | | | $9.65 | | | | $14.39 | | | | $14.65 | | | | $12.95 | | | | $10.75 | |
Total return3 | | | 2.40 | % | | | 0.27 | % | | | 12.63 | % | | | 18.98 | % | | | 20.37 | % | | | 3.66 | % |
Ratios to average net assets (annualized) | | | | | | | | | | | | | | | | | | | | | | | | |
Gross expenses | | | 0.89 | % | | | 0.95 | % | | | 0.81 | % | | | 0.82 | % | | | 0.83 | % | | | 0.80 | % |
Net expenses | | | 0.80 | % | | | 0.80 | % | | | 0.80 | % | | | 0.80 | % | | | 0.80 | % | | | 0.79 | % |
Net investment income (loss) | | | 0.40 | % | | | 0.04 | % | | | (0.09 | )% | | | (0.22 | )% | | | 0.50 | % | | | (0.06 | )% |
Supplemental data | | | | | | | | | | | | | | | | | | | | | | | | |
Portfolio turnover rate | | | 32 | % | | | 79 | % | | | 126 | % | | | 100 | % | | | 97 | % | | | 94 | % |
Net assets, end of period (000s omitted) | | | $143,683 | | | | $162,935 | | | | $221,801 | | | | $618,502 | | | | $508,685 | | | | $735,633 | |
| 1 | Calculated based upon average shares outstanding |
| 2 | Amount is less than $0.005. |
| 3 | Returns for periods of less than one year are not annualized. |
The accompanying notes are an integral part of these financial statements.
| | | | | | |
| Notes to financial statements (unaudited) | | Wells Fargo Endeavor Select Fund | | | 17 | |
1. ORGANIZATION
Wells Fargo Funds Trust (the “Trust”), a Delaware statutory trust organized on March 10, 1999, is an open-end management investment company registered under the Investment Company Act of 1940, as amended (the “1940 Act”). As an investment company, the Trust follows the accounting and reporting guidance in Financial Accounting Standards Board (“FASB”) Accounting Standards Codification Topic 946, Financial Services – Investment Companies. These financial statements report on the Wells Fargo Endeavor Select Fund (the “Fund”) which is a diversified series of the Trust.
Effective September 10, 2016, Class B shares of the Fund are no longer offered. Information for Class B shares reflected in the financial statements represents activity through September 9, 2016.
2. SIGNIFICANT ACCOUNTING POLICIES
The following significant accounting policies, which are consistently followed in the preparation of the financial statements of the Fund, are in conformity with U.S. generally accepted accounting principles which require management to make estimates and assumptions that affect the reported amounts of assets and liabilities, disclosure of contingent assets and liabilities at the date of the financial statements, and the reported amounts of revenues and expenses during the reporting period. Actual results could differ from those estimates.
Securities valuation
All investments are valued each business day as of the close of regular trading on the New York Stock Exchange (generally 4 p.m. Eastern Time), although the Fund may deviate from this calculation time under unusual or unexpected circumstances.
Equity securities that are listed on a foreign or domestic exchange or market are valued at the official closing price or, if none, the last sales price. If no sale occurs on the principal exchange or market that day, the prior day’s price will be deemed “stale” and a fair value price will be determined in accordance with the Fund’s Valuation Procedures.
Investments in registered open-end investment companies are valued at net asset value. Interests in non-registered investment vehicles that are redeemable at net asset value are fair valued normally at net asset value.
Investments which are not valued using any of the methods discussed above are valued at their fair value, as determined in good faith by the Board of Trustees of the Fund. The Board of Trustees has established a Valuation Committee comprised of the Trustees and has delegated to it the authority to take any actions regarding the valuation of portfolio securities that the Valuation Committee deems necessary or appropriate, including determining the fair value of portfolio securities, unless the determination has been delegated to the Management Valuation Team of Wells Fargo Funds Management, LLC (“Funds Management”). The Board of Trustees retains the authority to make or ratify any valuation decisions or approve any changes to the Valuation Procedures as it deems appropriate. On a quarterly basis, the Board of Trustees receives reports on any valuation actions taken by the Valuation Committee or the Management Valuation Team which may include items for ratification.
Valuations of fair valued securities are compared to the next actual sales price when available, or other appropriate market values, to assess the continued appropriateness of the fair valuation methodologies used. These securities are fair valued on a day-to-day basis, taking into consideration changes to appropriate market information and any significant changes to the inputs considered in the valuation process until there is a readily available price provided on an exchange or by an independent pricing service. Valuations received from an independent pricing service or independent broker-dealer quotes are periodically validated by comparisons to most recent trades and valuations provided by other independent pricing services in addition to the review of prices by the manager and/or subadviser. Unobservable inputs used in determining fair valuations are identified based on the type of security, taking into consideration factors utilized by market participants in valuing the investment, knowledge about the issuer and the current market environment.
Security loans
The Fund may lend its securities from time to time in order to earn additional income in the form of fees or interest on securities received as collateral or the investment of any cash received as collateral. The Fund continues to receive interest or dividends on the securities loaned. The Fund receives collateral in the form of cash or securities with a value at least equal to the value of the securities on loan. The value of the loaned securities is determined at the close of each business day and any additional required collateral is delivered to the Fund on the next business day. In a securities lending transaction, the net asset value of the Fund will be affected by an increase or decrease in the value of the securities loaned and by an increase or decrease in the value of the instrument in which collateral is invested. The amount of securities lending activity undertaken by the Fund fluctuates from time to time. In the event of default or bankruptcy by the borrower, the Fund may be prevented from recovering the loaned securities or gaining access to the collateral or
| | | | |
| 18 | | Wells Fargo Endeavor Select Fund | | Notes to financial statements (unaudited) |
may experience delays or costs in doing so. In addition, the investment of any cash collateral received may lose all or part of its value. The Fund has the right under the lending agreement to recover the securities from the borrower on demand.
The Fund lends its securities through an unaffiliated securities lending agent. Cash collateral received in connection with its securities lending transactions is invested in Securities Lending Cash Investments, LLC (the “Securities Lending Fund”). The Securities Lending Fund is exempt from registration under Section 3(c)(7) of the 1940 Act and is managed by Funds Management and is subadvised by Wells Capital Management Incorporated (“WellsCap”), an affiliate of Funds Management and an indirect wholly owned subsidiary of Wells Fargo & Company (“Wells Fargo”). Funds Management receives an advisory fee starting at 0.05% and declining to 0.01% as the average daily net assets of the Securities Lending Fund increase. All of the fees received by Funds Management are paid to WellsCap for its services as subadviser. The Securities Lending Fund seeks to provide a positive return compared to the daily Fed Funds Open Rate by investing in high-quality, U.S. dollar-denominated short-term money market instruments. Securities Lending Fund investments are valued at the evaluated bid price provided by an independent pricing service. Income earned from investment in the Securities Lending Fund is included in securities lending income on the Statement of Operations.
Security transactions and income recognition
Securities transactions are recorded on a trade date basis. Realized gains or losses are recorded on the basis of identified cost.
Dividend income is recognized on the ex-dividend date. Dividend income is recorded net of foreign taxes withheld where recovery of such taxes is not assured.
Distributions to shareholders
Distributions to shareholders from net investment income and net realized gains, if any, are recorded on the ex-dividend date. Such distributions are determined in conformity with federal income tax regulations, which may differ in amount or character from net investment income and realized gains recognized for purposes of U.S. generally accepted accounting principles.
Federal and other taxes
The Fund intends to continue to qualify as a regulated investment company by distributing substantially all of its investment company taxable income and any net realized capital gains (after reduction for capital loss carryforwards) sufficient to relieve it from all, or substantially all, federal income taxes. Accordingly, no provision for federal income taxes was required.
The Fund’s income and federal excise tax returns and all financial records supporting those returns for the prior three fiscal years are subject to examination by the federal and Delaware revenue authorities. Management has analyzed the Fund’s tax positions taken on federal, state, and foreign tax returns for all open tax years and does not believe that there are any uncertain tax positions that require recognition of a tax liability.
Class allocations
The separate classes of shares offered by the Fund differ principally in applicable sales charges, distribution, shareholder servicing, and administration fees. Class specific expenses are charged directly to that share class. Investment income, common expenses, and realized and unrealized gains (losses) on investments are allocated daily to each class of shares based on the relative proportion of net assets of each class.
3. FAIR VALUATION MEASUREMENTS
Fair value measurements of investments are determined within a framework that has established a fair value hierarchy based upon the various data inputs utilized in determining the value of the Fund’s investments. The three-level hierarchy gives the highest priority to unadjusted quoted prices in active markets for identical assets or liabilities (Level 1) and the lowest priority to significant unobservable inputs (Level 3). The Fund’s investments are classified within the fair value hierarchy based on the lowest level of input that is significant to the fair value measurement. The inputs are summarized into three broad levels as follows:
| ∎ | | Level 1 – quoted prices in active markets for identical securities |
| ∎ | | Level 2 – other significant observable inputs (including quoted prices for similar securities, interest rates, prepayment speeds, credit risk, etc.) |
| ∎ | | Level 3 – significant unobservable inputs (including the Fund’s own assumptions in determining the fair value of investments) |
| | | | | | |
| Notes to financial statements (unaudited) | | Wells Fargo Endeavor Select Fund | | | 19 | |
The inputs or methodologies used for valuing investments in securities are not necessarily an indication of the risk associated with investing in those securities.
The following is a summary of the inputs used in valuing the Fund’s assets and liabilities as of January 31, 2017:
| | | | | | | | | | | | | | | | |
| | | Quoted prices (Level 1) | | | Other significant observable inputs (Level 2) | | | Significant unobservable inputs (Level 3) | | | Total | |
Assets | | | | | | | | | | | | | | | | |
Investments in: | | | | | | | | | | | | | | | | |
| | | | |
Common stocks | | | | | | | | | | | | | | | | |
Consumer discretionary | | $ | 35,051,231 | | | $ | 0 | | | $ | 0 | | | $ | 35,051,231 | |
Consumer staples | | | 7,584,142 | | | | 0 | | | | 0 | | | | 7,584,142 | |
Financials | | | 9,897,444 | | | | 0 | | | | 0 | | | | 9,897,444 | |
Health care | | | 22,293,210 | | | | 0 | | | | 0 | | | | 22,293,210 | |
Industrials | | | 16,217,390 | | | | 0 | | | | 0 | | | | 16,217,390 | |
Information technology | | | 67,936,939 | | | | 0 | | | | 0 | | | | 67,936,939 | |
Materials | | | 5,824,173 | | | | 0 | | | | 0 | | | | 5,824,173 | |
| | | | |
Short-term investments | | | | | | | | | | | | | | | | |
Investment companies | | | 1,812,885 | | | | 0 | | | | 0 | | | | 1,812,885 | |
Total assets | | $ | 166,617,414 | | | $ | 0 | | | $ | 0 | | | $ | 166,617,414 | |
The Fund recognizes transfers between levels within the fair value hierarchy at the end of the reporting period. At January 31, 2017, the Fund did not have any transfers into/out of Level 1, Level 2, or Level 3.
4. TRANSACTIONS WITH AFFILIATES AND OTHER EXPENSES
Management fee
Funds Management, an indirect wholly owned subsidiary of Wells Fargo, is the manager of the Fund and provides advisory and fund-level administrative services under an investment management agreement. Under the investment management agreement, Funds Management is responsible for, among other services, implementing the investment objectives and strategies of the Fund, supervising the subadviser, providing fund-level administrative services in connection with the Fund’s operations, and providing any other fund-level administrative services reasonably necessary for the operation of the Fund. As compensation for its services under the investment management agreement, Funds Management is entitled to receive an annual management fee starting at 0.70% and declining to 0.505% as the average daily net assets of the Fund increase. For the six months ended January 31, 2017, the management fee was equivalent to an annual rate of 0.70% of the Fund’s average daily net assets.
Funds Management has retained the services of a subadviser to provide daily portfolio management to the Fund. The fee for subadvisory services is borne by Funds Management. WellsCap is the subadviser to the Fund and is entitled to receive a fee from Funds Management at an annual rate starting at 0.30% and declining to 0.20% as the average daily net assets of the Fund increase.
Administration fees
Under a class-level administration agreement, Funds Management provides class-level administrative services to the Fund, which includes paying fees and expenses for services provided by the transfer agent, sub-transfer agents, omnibus account servicers and record-keepers. As compensation for its services under the class-level administration agreement, Funds Management receives an annual fee which is calculated based on the average daily net assets of each class as follows:
| | | | |
| | | Class-level administration fee | |
Class A, Class B, Class C | | | 0.21 | % |
Administrator Class, Institutional Class | | | 0.13 | |
| | | | |
| 20 | | Wells Fargo Endeavor Select Fund | | Notes to financial statements (unaudited) |
Funds Management has contractually waived and/or reimbursed management and administration fees to the extent necessary to maintain certain net operating expense ratios for the Fund. Waiver of fees and/or reimbursement of expenses by Funds Management were made first from fund level expenses on a proportionate basis and then from class specific expenses. Funds Management has committed through November 30, 2017 to waive fees and/or reimburse expenses to the extent necessary to cap the Fund’s expenses at 1.20% for Class A shares, 1.95% for Class C shares, 1.00% for Administrator Class shares, and 0.80% for Institutional Class shares. After this time, the cap may be increased or the commitment to maintain the cap may be terminated only with the approval of the Board of Trustees.
During the six months ended January 31, 2017, State Street Bank and Trust Company, the Fund’s custodian, reimbursed the Fund $159 for certain out-of-pocket expenses that were billed to the Fund in error from 1998-2015. This amount is included in dividend income on the Statement of Operations. In addition, Funds Management was also reimbursed $3,042 for waivers/reimbursements it made to the Fund during the period the Fund was erroneously billed.
Distribution fees
The Trust has adopted a distribution plan for Class B and Class C shares of the Fund pursuant to Rule 12b-1 under the 1940 Act. Distribution fees are charged to Class B and Class C shares and paid to Wells Fargo Funds Distributor, LLC (“Funds Distributor”), the principal underwriter, at an annual rate of 0.75% of the average daily net assets of Class B and Class C shares.
In addition, Funds Distributor is entitled to receive the front-end sales charge from the purchase of Class A shares and a contingent deferred sales charge on the redemption of certain Class A shares. Funds Distributor is also entitled to receive the contingent deferred sales charges from redemptions of Class B and Class C shares. For the six months ended January 31, 2017, Funds Distributor received $450 from the sale of Class A shares.
Shareholder servicing fees
The Trust has entered into contracts with one or more shareholder servicing agents, whereby Class A, Class B, Class C, and Administrator Class of the Fund are charged a fee at an annual rate of 0.25% of the average daily net assets of each respective class.
A portion of these total shareholder servicing fees were paid to affiliates of Wells Fargo.
5. INVESTMENT PORTFOLIO TRANSACTIONS
Purchases and sales of investments, excluding U.S. government obligations (if any) and short-term securities, for the six months ended January 31, 2017 were $56,030,666 and $87,102,096, respectively.
The Fund may purchase or sell investment securities to other Wells Fargo funds under procedures adopted by the Board of Trustees. The procedures have been designed to ensure that these interfund transactions, which generally do not incur broker commissions, are effected at current market prices. Interfund trades are included within the respective purchases and sales amounts shown.
6. BANK BORROWINGS
The Trust (excluding the money market funds and certain other funds) and Wells Fargo Variable Trust are parties to a $250,000,000 revolving credit agreement whereby the Fund is permitted to use bank borrowings for temporary or emergency purposes, such as to fund shareholder redemption requests. Interest under the credit agreement is charged to the Fund based on a borrowing rate equal to the higher of the Federal Funds rate in effect on that day plus 1.25% or the overnight LIBOR rate in effect on that day plus 1.25%. In addition, an annual commitment fee equal to 0.25% of the unused balance is allocated to each participating fund. Prior to August 30, 2016, the revolving credit agreement amount was $200,000,000 and the annual commitment fee was equal to 0.20% of the unused balance which was allocated to each participating fund.
For the six months ended January 31, 2017, there were no borrowings by the Fund under the agreement.
7. CONCENTRATION RISK
Concentration risks result from exposure to a limited number of sectors. A fund that invests a substantial portion of its assets in any sector may be more affected by changes in that sector than would be a fund whose investments are not heavily weighted in any sector.
| | | | | | |
| Notes to financial statements (unaudited) | | Wells Fargo Endeavor Select Fund | | | 21 | |
8. INDEMNIFICATION
Under the Trust’s organizational documents, the officers and Trustees have been granted certain indemnification rights against certain liabilities that may arise out of performance of their duties to the Trust. Additionally, in the normal course of business, the Trust may enter into contracts with service providers that contain a variety of indemnification clauses. The Trust’s maximum exposure under these arrangements is dependent on future claims that may be made against the Fund and, therefore, cannot be estimated.
9. NEW ACCOUNTING PRONOUNCEMENT
In December 2016, the Financial Accounting Standards Board (“FASB”) issued Accounting Standard Update (“ASU”) No. 2016-19, Technical Corrections and Improvements. ASU 2016-19 includes an amendment to FASB ASC Topic 820, Fair Value Measurement which clarifies the difference between a valuation approach and a valuation technique. The amendment also requires an entity to disclose when there has been a change in either or both a valuation approach and/or a valuation technique. The disclosure requirements are effective for fiscal years and interim periods within those fiscal years beginning after December 15, 2016. Management is currently evaluating the potential impact of this new guidance to the financial statements.
10. REGULATORY CHANGES
In October 2016, the Securities and Exchange Commission (“SEC”) adopted new rules and forms and amended existing rules and forms (together, “final rules”) intended to modernize and enhance the reporting and disclosure of information by registered investment companies and to enhance liquidity risk management by open-end mutual funds and exchange-traded funds. The final rules will enhance the quality of information available to investors and will allow the SEC to more effectively collect and use data reported by funds. In part, the final rules amend Regulation S-X and require standardized, enhanced disclosure about derivatives in the Fund’s financial statements, as well as other amendments. The compliance date for the amendments to Regulation S-X is August 1, 2017 while the compliance date for the new form types is June 1, 2018 and the compliance date for the liquidity risk management program requirements is December 1, 2018. Management is currently assessing the potential impact of these enhancements and their impact on the financial statement disclosures and reporting requirements.
| | | | |
| 22 | | Wells Fargo Endeavor Select Fund | | Other information (unaudited) |
PROXY VOTING INFORMATION
A description of the policies and procedures that the Fund uses to determine how to vote proxies relating to portfolio securities is available, upon request, by calling 1-800-222-8222, visiting our website at wellsfargofunds.com, or visiting the SEC website at sec.gov. Information regarding how the Fund voted proxies relating to portfolio securities during the most recent 12-month period ended June 30 is available on the Fund’s website at wellsfargofunds.com or by visiting the SEC website at sec.gov.
PORTFOLIO HOLDINGS INFORMATION
The complete portfolio holdings for the Fund are publicly available monthly on the Fund’s website (wellsfargofunds.com), on a one-month delayed basis. In addition, top ten holdings information (excluding derivative positions) for the Fund is publicly available on the Fund’s website on a monthly, seven-day or more delayed basis. The Fund files its complete schedule of portfolio holdings with the SEC for the first and third quarters of each fiscal year on Form N-Q, which is available by visiting the SEC website at sec.gov. In addition, the Fund’s Form N-Q may be reviewed and copied at the SEC’s Public Reference Room in Washington, DC, and at regional offices in New York City, at 233 Broadway, and in Chicago, at 175 West Jackson Boulevard, Suite 900. Information about the Public Reference Room may be obtained by calling 1-800-SEC-0330.
| | | | | | |
| Other information (unaudited) | | Wells Fargo Endeavor Select Fund | | | 23 | |
BOARD OF TRUSTEES AND OFFICERS
Each of the Trustees and Officers1 listed in the table below acts in identical capacities for each fund in the Wells Fargo family of funds, which consists of 138 mutual funds comprising the Wells Fargo Funds Trust, Wells Fargo Variable Trust, Wells Fargo Master Trust and four closed-end funds (collectively the “Fund Complex”). This table should be read in conjunction with the Prospectus and the Statement of Additional Information2. The mailing address of each Trustee and Officer is 525 Market Street, 12th Floor, San Francisco, CA 94105. Each Trustee and Officer serves an indefinite term, however, each Trustee serves such term until reaching the mandatory retirement age established by the Trustees.
Independent Trustees
| | | | | | |
Name and year of birth | | Position held and length of service* | | Principal occupations during past five years or longer | | Current other public company or investment company directorships |
William R. Ebsworth (Born 1957) | | Trustee, since 2015 | | Retired. From 1984 to 2013, equities analyst, portfolio manager, research director and chief financial officer at Fidelity Management and Research Company in Boston, Tokyo, and Hong Kong and retired in 2013 as Chief Investment Officer of Fidelity Strategic Advisers, Inc. where he lead a team of investment professionals managing client assets. Prior thereto, Board member of Hong Kong Securities Clearing Co., Hong Kong Options Clearing Corp., the Thailand International Fund, Ltd., Fidelity Investments Life Insurance Company, and Empire Fidelity Investments Life Insurance Company. Board member of the Fonté Foundation (non-profit organization) and the Vincent Memorial Hospital Endowment (non-profit organization), where he serves on the Investment Committee and as a Chair of the Audit Committee. Mr. Ebsworth is a CFA® charterholder and an Adjunct Lecturer, Finance, at Babson College. | | Asset Allocation Trust |
Jane A. Freeman (Born 1953) | | Trustee, since 2015 | | Retired. From 2012 to 2014 and 1999 to 2008, Chief Financial Officer of Scientific Learning Corporation. From 2008 to 2012, Ms. Freeman provided consulting services related to strategic business projects. Prior to 1999, Portfolio Manager at Rockefeller & Co. and Scudder, Stevens & Clark. Board member of the Harding Loevner Funds from 1996 to 2014, serving as both Lead Independent Director and chair of the Audit Committee. Board member of the Russell Exchange Traded Funds Trust from 2011 to 2012 and the chair of the Audit Committee. Ms. Freeman is Chair of Taproot Foundation (non-profit organization), a Board Member of Ruth Bancroft Garden (non-profit organization) and an inactive chartered financial analyst. | | Asset Allocation Trust |
Peter G. Gordon** (Born 1942) | | Trustee, since 1998; Chairman, since 2005 | | Co-Founder, Retired Chairman, President and CEO of Crystal Geyser Water Company. Trustee Emeritus, Colby College. | | Asset Allocation Trust |
Isaiah Harris, Jr. (Born 1952) | | Trustee, since 2009 | | Retired. Chairman of the Board of CIGNA Corporation since 2009, and Director since 2005. From 2003 to 2011, Director of Deluxe Corporation. Prior thereto, President and CEO of BellSouth Advertising and Publishing Corp. from 2005 to 2007, President and CEO of BellSouth Enterprises from 2004 to 2005 and President of BellSouth Consumer Services from 2000 to 2003. Emeritus member of the Iowa State University Foundation Board of Governors. Emeritus Member of the Advisory Board of Iowa State University School of Business. Advisory Board Member, Palm Harbor Academy (charter school). Advisory Board Member, Child Evangelism Fellowship (non-profit). Mr. Harris is a certified public accountant (inactive status). | | CIGNA Corporation; Asset Allocation Trust |
Judith M. Johnson (Born 1949) | | Trustee, since 2008; Audit Committee Chairman, since 2008 | | Retired. Prior thereto, Chief Executive Officer and Chief Investment Officer of Minneapolis Employees Retirement Fund from 1996 to 2008. Ms. Johnson is an attorney, certified public accountant and a certified managerial accountant. | | Asset Allocation Trust |
David F. Larcker (Born 1950) | | Trustee, since 2009 | | James Irvin Miller Professor of Accounting at the Graduate School of Business, Stanford University, Director of the Corporate Governance Research Initiative and Senior Faculty of The Rock Center for Corporate Governance since 2006. From 2005 to 2008, Professor of Accounting at the Graduate School of Business, Stanford University. Prior thereto, Ernst & Young Professor of Accounting at The Wharton School, University of Pennsylvania from 1985 to 2005. | | Asset Allocation Trust |
| | | | |
| 24 | | Wells Fargo Endeavor Select Fund | | Other information (unaudited) |
| | | | | | |
Name and year of birth | | Position held and length of service* | | Principal occupations during past five years or longer | | Current other public company or investment company directorships |
Olivia S. Mitchell (Born 1953) | | Trustee, since 2006 | | International Foundation of Employee Benefit Plans Professor, Wharton School of the University of Pennsylvania since 1993. Director of Wharton’s Pension Research Council and Boettner Center on Pensions & Retirement Research, and Research Associate at the National Bureau of Economic Research. Previously, Cornell University Professor from 1978 to 1993. | | Asset Allocation Trust |
Timothy J. Penny (Born 1951) | | Trustee, since 1996 | | President and Chief Executive Officer of Southern Minnesota Initiative Foundation, a non-profit organization, since 2007 and Senior Fellow at the Humphrey Institute Policy Forum at the University of Minnesota since 1995. Member of the Board of Trustees of NorthStar Education Finance, Inc., a non-profit organization, since 2007. | | Asset Allocation Trust |
Michael S. Scofield (Born 1943) | | Trustee, since 2010 | | Served on the Investment Company Institute’s Board of Governors and Executive Committee from 2008-2011 as well the Governing Council of the Independent Directors Council from 2006-2011 and the Independent Directors Council Executive Committee from 2008-2011. Chairman of the IDC from 2008-2010. Institutional Investor (Fund Directions) Trustee of Year in 2007. Trustee of the Evergreen Funds complex (and its predecessors) from 1984 to 2010. Chairman of the Evergreen Funds from 2000-2010. Former Trustee of the Mentor Funds. Retired Attorney, Law Offices of Michael S. Scofield. | | Asset Allocation Trust |
| * | Length of service dates reflect the Trustee’s commencement of service with the Trust’s predecessor entities, where applicable. |
| ** | Peter Gordon is expected to retire on December 31, 2017. |
Officers
| | | | | | |
Name and year of birth | | Position held and length of service | | Principal occupations during past five years or longer | | |
Andrew Owen (Born 1960) | | President, since 2017 | | Executive Vice President of Wells Fargo Bank, N.A. and President of Wells Fargo & Company and Head of Affiliated Managers, Wells Fargo Asset Management, since 2014. Executive Vice President responsible for marketing, investments and product development for Wells Fargo Funds Management, LLC, from 2009 to 2014. | | |
Jeremy DePalma1 (Born 1974) | | Treasurer, since 2012 | | Senior Vice President of Wells Fargo Funds Management, LLC since 2009. Senior Vice President of Evergreen Investment Management Company, LLC from 2008 to 2010 and head of the Fund Reporting and Control Team within Fund Administration from 2005 to 2010. | | |
C. David Messman (Born 1960) | | Secretary, since 2000; Chief Legal Officer, since 2003 | | Senior Vice President and Secretary of Wells Fargo Funds Management, LLC since 2001. Assistant General Counsel of Wells Fargo Bank, N.A. since 2013 and Vice President and Managing Counsel of Wells Fargo Bank, N.A. from 1996 to 2013. | | |
Michael Whitaker (Born 1967) | | Chief Compliance Officer, since 2016 | | Executive Vice President of Wells Fargo Funds Management, LLC since 2016. Chief Compliance Officer of Fidelity’s Fixed Income Funds and Asset Allocation Funds from 2008 to 2016, Compliance Officer of FMR Co., Inc. from 2014 to 2016, Fidelity Investments Money Management, Inc. from 2014 to 2016, Fidelity Investments from 2007 to 2016. | | |
David Berardi (Born 1975) | | Assistant Treasurer, since 2009 | | Vice President of Wells Fargo Funds Management, LLC since 2009. Vice President of Evergreen Investment Management Company, LLC from 2008 to 2010. Manager of Fund Reporting and Control for Evergreen Investment Management Company, LLC from 2004 to 2010. | | |
| 1 | Jeremy DePalma acts as Treasurer of 69 funds and Assistant Treasurer of 69 funds in the Fund Complex. |
| 2 | The Statement of Additional Information includes additional information about the Trustees and is available, without charge, upon request, by calling
1-800-222-8222 or by visiting the website at wellsfargofunds.com. |
| | | | | | |
| List of abbreviations | | Wells Fargo Endeavor Select Fund | | | 25 | |
The following is a list of common abbreviations for terms and entities that may have appeared in this report.
| ACA | — ACA Financial Guaranty Corporation |
| ADR | — American depositary receipt |
| ADS | — American depositary shares |
| AGC | — Assured Guaranty Corporation |
| AGM | — Assured Guaranty Municipal |
| Ambac | — Ambac Financial Group Incorporated |
| AMT | — Alternative minimum tax |
| BAN | — Bond anticipation notes |
| BHAC | — Berkshire Hathaway Assurance Corporation |
| CAB | — Capital appreciation bond |
| CCAB | — Convertible capital appreciation bond |
| CDA | — Community Development Authority |
| CDO | — Collateralized debt obligation |
| DRIVER | — Derivative inverse tax-exempt receipts |
| DW&P | — Department of Water & Power |
| DWR | — Department of Water Resources |
| ECFA | — Educational & Cultural Facilities Authority |
| EDA | — Economic Development Authority |
| EDFA | — Economic Development Finance Authority |
| ETF | — Exchange-traded fund |
| FDIC | — Federal Deposit Insurance Corporation |
| FFCB | — Federal Farm Credit Banks |
| FGIC | — Financial Guaranty Insurance Corporation |
| FHA | — Federal Housing Administration |
| FHLB | — Federal Home Loan Bank |
| FHLMC | — Federal Home Loan Mortgage Corporation |
| FICO | — The Financing Corporation |
| FNMA | — Federal National Mortgage Association |
| GDR | — Global depositary receipt |
| GNMA | — Government National Mortgage Association |
| HCFR | — Healthcare facilities revenue |
| HEFA | — Health & Educational Facilities Authority |
| HEFAR | — Higher education facilities authority revenue |
| HFA | — Housing Finance Authority |
| HFFA | — Health Facilities Financing Authority |
| HUD | — Department of Housing and Urban Development |
| IDA | — Industrial Development Authority |
| IDAG | — Industrial Development Agency |
| KRW | — Republic of Korea won |
| LIBOR | — London Interbank Offered Rate |
| LIFER | — Long Inverse Floating Exempt Receipts |
| LLC | — Limited liability company |
| LLLP | — Limited liability limited partnership |
| LLP | — Limited liability partnership |
| MBIA | — Municipal Bond Insurance Association |
| MFHR | — Multifamily housing revenue |
| MSTR | — Municipal securities trust receipts |
| MUD | — Municipal Utility District |
| National | — National Public Finance Guarantee Corporation |
| PCFA | — Pollution Control Financing Authority |
| PCL | — Public Company Limited |
| PCR | — Pollution control revenue |
| PFA | — Public Finance Authority |
| PFFA | — Public Facilities Financing Authority |
| PFOTER | — Puttable floating option tax-exempt receipts |
| plc | — Public limited company |
| PUTTER | — Puttable tax-exempt receipts |
| R&D | — Research & development |
| Radian | — Radian Asset Assurance |
| RAN | — Revenue anticipation notes |
| RDA | — Redevelopment Authority |
| RDFA | — Redevelopment Finance Authority |
| REIT | — Real estate investment trust |
| ROC | — Reset option certificates |
| SAVRS | — Select auction variable rate securities |
| SBA | — Small Business Authority |
| SDR | — Swedish depositary receipt |
| SFHR | — Single-family housing revenue |
| SFMR | — Single-family mortgage revenue |
| SPA | — Standby purchase agreement |
| SPDR | — Standard & Poor’s Depositary Receipts |
| SPEAR | — Short Puttable Exempt Adjustable Receipts |
| STRIPS | — Separate trading of registered interest and |
| TAN | — Tax anticipation notes |
| TIPS | — Treasury inflation-protected securities |
| TRAN | — Tax revenue anticipation notes |
| TTFA | — Transportation Trust Fund Authority |
| TVA | — Tennessee Valley Authority |
This page is intentionally left blank.
This page is intentionally left blank.
This page is intentionally left blank.

For more information
More information about Wells Fargo Funds is available free upon request. To obtain literature, please write, email, visit the Fund’s website, or call:
Wells Fargo Funds
P.O. Box 8266
Boston, MA 02266-8266
Email: fundservice@wellsfargo.com
Website: wellsfargofunds.com
Individual investors: 1-800-222-8222
Retail investment professionals: 1-888-877-9275
Institutional investment professionals: 1-866-765-0778
This report and the financial statements contained herein are submitted for the general information of the shareholders of the Fund. If this report is used for promotional purposes, distribution of the report must be accompanied or preceded by a current prospectus. Before investing, please consider the investment objectives, risks, charges, and expenses of the investment. For a current prospectus and, if available, a summary prospectus, containing this information, call 1-800-222-8222 or visit the Fund’s website at wellsfargofunds.com. Read the prospectus carefully before you invest or send money.
Wells Fargo Asset Management (WFAM) is a trade name used by the asset management businesses of Wells Fargo & Company. Wells Fargo Funds Management, LLC, a wholly owned subsidiary of Wells Fargo & Company, provides investment advisory and administrative services for Wells Fargo Funds. Other affiliates of Wells Fargo & Company provide subadvisory and other services for the funds. The funds are distributed by Wells Fargo Funds Distributor, LLC, Member FINRA, an affiliate of Wells Fargo & Company. Neither Wells Fargo Funds Management nor Wells Fargo Funds Distributor has Fund customer accounts/assets, and neither provides investment advice/recommendations or acts as an investment advice fiduciary to any investor.
NOT FDIC INSURED ◾ NO BANK GUARANTEE ◾ MAY LOSE VALUE
© 2017 Wells Fargo Funds Management, LLC. All rights reserved.
| | |
 | | 301457 03-17 SA205/SAR205 1-17 |
Semi-Annual Report
January 31, 2017

Wells Fargo Growth Fund


Reduce clutter. Save trees.
Sign up for electronic delivery of prospectuses and shareholder reports at wellsfargo.com/advantagedelivery
Contents
The views expressed and any forward-looking statements are as of January 31, 2017, unless otherwise noted, and are those of the Fund managers and/or Wells Fargo Funds Management, LLC. Discussions of individual securities, or the markets generally, or any Wells Fargo Fund are not intended as individual recommendations. Future events or results may vary significantly from those expressed in any forward-looking statements. The views expressed are subject to change at any time in response to changing circumstances in the market. Wells Fargo Funds Management, LLC and the Fund disclaim any obligation to publicly update or revise any views expressed or forward-looking statements.
NOT FDIC INSURED ◾ NO BANK GUARANTEE ◾ MAY LOSE VALUE
| | | | |
| 2 | | Wells Fargo Growth Fund | | Letter to shareholders (unaudited) |

Andrew Owen
President
Wells Fargo Funds
U.S. and international stocks returned 5.96% and 4.16% for the six-month period, respectively; within fixed income, the Bloomberg Barclays U.S. Aggregate Bond Index3 returned -2.95%.
Dear Shareholder:
As the new president of Wells Fargo Funds now that Karla Rabusch is retiring from that position after nearly 14 years, I am pleased to offer you this semi-annual report for the Wells Fargo Growth Fund for the six-month period that ended January 31, 2017. Despite heightened market volatility, global stocks delivered favorable results overall. U.S. and international stocks returned 5.96% and 4.16% for the six-month period, respectively, as measured by the S&P 500 Index1 and the MSCI ACWI ex USA Index (Net)2; within fixed income, the Bloomberg Barclays U.S. Aggregate Bond Index3 returned -2.95%.
In August–September 2016, global stocks delivered generally positive results; bonds’ interest rates remained historically low.
From August into early September 2016, U.S. and international stocks generally trended upward. Ever since the Great Recession, markets worldwide have been supported to varying degrees by accommodative policies from leading central banks, including the Federal Reserve (Fed), European Central Bank, Bank of England, and Bank of Japan. As a result, investors have watched closely for any signs that global central banks might tighten their measures. In the U.S., early-September comments by several Fed officials appeared to suggest a September interest-rate increase, which sent stock and bond prices downward. However, stocks surged following the Fed’s September 20 meeting on news that the Fed had decided to delay a rate increase to later in 2016. In bond markets, interest rates remained at historically low levels as a result of easy monetary policies, subdued global growth, and modest inflation expectations. Yields rose, after bottoming in July, as market participants felt that yields had overshot the real risks of the U.K.’s Brexit vote and as economic activity strengthened. At the front end of the yield curve, anticipation of new money market fund rules resulted in significantly higher yields on many short-term securities.
During the fourth quarter of 2016, prospects for faster growth and higher interest rates in the U.S. largely influenced the markets.
Early in the fourth quarter of 2016, U.S. stocks tended to trade lower amid concerns such as a likely interest-rate increase and uncertainty over the approaching general election. However, following Donald Trump’s election as president in early November, U.S. stocks began to rally. Investors appeared optimistic that the new administration would usher in a series of pro-growth policies, and supportive economic news helped the rally carry through the quarter. The buoyant environment sent interest rates higher as well. At its mid-December meeting, Fed officials raised their short-term target interest rate for the first time in a year, by a quarter percentage point, to between 0.50% and 0.75%. The fourth quarter also saw the implementation of the Securities and Exchange Commission’s new rules for money market funds, which included floating net asset values (NAVs) for institutional prime and municipal money market funds as well as liquidity fees and redemption gates. In the year leading up to
| 1 | The S&P 500 Index consists of 500 stocks chosen for market size, liquidity, and industry group representation. It is a market-value-weighted index with each stock’s weight in the index proportionate to its market value. You cannot invest directly in an index. |
| 2 | The Morgan Stanley Capital International (MSCI) All Country World Index (ACWI) ex USA Index (Net) is a free-float-adjusted market-capitalization-weighted index that is designed to measure the equity market performance of developed markets, excluding the United States and Canada. Source: MSCI. MSCI makes no express or implied warranties or representations and shall have no liability whatsoever with respect to any MSCI data contained herein. The MSCI data may not be further redistributed or used as a basis for other indexes or any securities or financial products. This report is not approved, reviewed, or produced by MSCI. You cannot invest directly in an index. |
| 3 | The Bloomberg Barclays U.S. Aggregate Bond Index (formerly known as Barclays U.S. Aggregate Bond Index) is a broad-based benchmark that measures the investment-grade, U.S. dollar–denominated, fixed-rate taxable bond market, including Treasuries, government-related and corporate securities, mortgage-backed securities (agency fixed-rate and hybrid adjustable-rate mortgage pass-throughs), asset-backed securities, and commercial mortgage-backed securities. You cannot invest directly in an index. |
| | | | | | |
| Letter to shareholders (unaudited) | | Wells Fargo Growth Fund | | | 3 | |
money fund reform implementation, nearly $1 trillion in assets moved from these types of money market funds into government money market funds, which continued to transact at a stable $1 NAV. Outside of the U.S., the prospects for faster U.S. growth appeared to trigger some acceleration in Europe. The improvement may be partly attributable to expectations for further strengthening of the U.S. dollar, which in turn could improve demand for European goods in the U.S. due to weakening of the euro relative to the dollar.
Investor optimism continued into January 2017.
January brought continued strength in global stock markets. Markets were lifted by factors such as strong trade data from Japan, robust earnings reports by businesses, and investors’ hopes that the U.S. government will approve a large fiscal stimulus package.
Don’t let short-term uncertainty derail long-term investment goals.
Periods of uncertainty can present challenges, but experience has taught us that maintaining long-term investment goals can be an effective way to plan for the future. To help you create a sound strategy based on your personal goals and risk tolerance, Wells Fargo Funds offers more than 100 mutual funds spanning a wide range of asset classes and investment styles. Although diversification cannot guarantee an investment profit or prevent losses, we believe it can be an effective way to manage investment risk and potentially smooth out overall portfolio performance. We encourage investors to know their investments and to understand that appropriate levels of risk-taking may unlock opportunities.
Thank you for choosing to invest in Wells Fargo Funds. We appreciate your confidence in us and remain committed to helping you meet your financial needs.
Sincerely,

Andrew Owen
President
Wells Fargo Funds
Although diversification cannot guarantee an investment profit or prevent losses, we believe it can be an effective way to manage investment risk and potentially smooth out overall portfolio performance.
For further information about your Fund, contact your investment professional, visit our website at wellsfargofunds.com, or call us directly at 1-800-222-8222. We are available 24 hours a day, 7 days a week.
| | | | |
| 4 | | Wells Fargo Growth Fund | | Performance highlights (unaudited) |
Investment objective
The Fund seeks long-term capital appreciation.
Manager
Wells Fargo Funds Management, LLC
Subadviser
Wells Capital Management Incorporated
Portfolio managers
Joseph M. Eberhardy, CFA®, CPA
Thomas C. Ognar, CFA®
Bruce C. Olson, CFA®
Average annual total returns (%) as of January 31, 20171
| | | | | | | | | | | | | | | | | | | | | | | | | | | | | | | | | | |
| | | | | Including sales charge | | | Excluding sales charge | | | Expense ratios2 (%) | |
| | | Inception date | | 1 year | | | 5 year | | | 10 year | | | 1 year | | | 5 year | | | 10 year | | | Gross | | | Net3 | |
| Class A (SGRAX) | | 2-24-2000 | | | 9.62 | | | | 8.87 | | | | 9.16 | | | | 16.29 | | | | 10.17 | | | | 9.82 | | | | 1.15 | | | | 1.15 | |
| Class C (WGFCX) | | 12-26-2002 | | | 14.39 | | | | 9.34 | | | | 8.99 | | | | 15.39 | | | | 9.34 | | | | 8.99 | | | | 1.90 | | | | 1.90 | |
| Class R6 (SGRHX) | | 9-30-2015 | | | – | | | | – | | | | – | | | | 16.80 | | | | 10.65 | | | | 10.32 | | | | 0.72 | | | | 0.70 | |
| Administrator Class (SGRKX) | | 8-30-2002 | | | – | | | | – | | | | – | | | | 16.49 | | | | 10.40 | | | | 10.10 | | | | 1.07 | | | | 0.96 | |
| Institutional Class (SGRNX) | | 2-24-2000 | | | – | | | | – | | | | – | | | | 16.73 | | | | 10.63 | | | | 10.31 | | | | 0.82 | | | | 0.75 | |
| Russell 3000® Growth Index4 | | – | | | – | | | | – | | | | – | | | | 17.91 | | | | 13.81 | | | | 8.36 | | | | – | | | | – | |
Figures quoted represent past performance, which is no guarantee of future results, and do not reflect taxes that a shareholder may pay on fund distributions or the redemption of fund shares. Investment return and principal value of an investment will fluctuate so that an investor’s shares, when redeemed, may be worth more or less than their original cost. Performance shown without sales charges would be lower if sales charges were reflected. Current performance may be lower or higher than the performance data quoted, which assumes the reinvestment of dividends and capital gains. Current month-end performance is available on the Fund’s website, wellsfargofunds.com.
Index returns do not include transaction costs associated with buying and selling securities, any mutual fund fees or expenses, or any taxes. It is not possible to invest directly in an index.
For Class A shares, the maximum front-end sales charge is 5.75%. For Class C shares, the maximum contingent deferred sales charge is 1.00%. Performance including a contingent deferred sales charge assumes the sales charge for the corresponding time period. Class R6, Administrator Class, and Institutional Class shares are sold without a front-end sales charge or contingent deferred sales charge.
Stock values fluctuate in response to the activities of individual companies and general market and economic conditions. Certain investment strategies tend to increase the total risk of an investment (relative to the broader market). The Fund is exposed to foreign investment risk and smaller-company securities risk. Consult the Fund’s prospectus for additional information on these and other risks.
Please see footnotes on page 5.
| | | | | | |
| Performance highlights (unaudited) | | Wells Fargo Growth Fund | | | 5 | |
| | | | |
| Ten largest holdings (%) as of January 31, 20175 | |
Facebook Incorporated Class A | | | 6.12 | |
Alphabet Incorporated Class A | | | 5.81 | |
Amazon.com Incorporated | | | 5.64 | |
Microchip Technology Incorporated | | | 3.47 | |
Acadia Healthcare Company Incorporated | | | 3.28 | |
Burlington Stores Incorporated | | | 3.02 | |
Visa Incorporated Class A | | | 2.93 | |
MarketAxess Holdings Incorporated | | | 2.76 | |
MasterCard Incorporated Class A | | | 2.55 | |
Celgene Corporation | | | 2.31 | |
|
| Sector distribution as of January 31, 20176 |
|
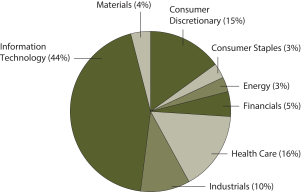 |
| 1 | Effective June 20, 2008, Advisor Class was renamed Class A and modified to assume the features and attributes of Class A. Historical performance shown for Class A shares through June 20, 2008, includes Advisor Class expenses. Historical performance shown for Class R6 shares prior to their inception reflects the performance of Institutional Class shares, and includes the higher expenses applicable to Institutional Class shares. If these expenses had not been included, returns would be higher. |
| 2 | Reflects the expense ratios as stated in the most recent prospectuses. The expense ratios shown are subject to change and may differ from the annualized expense ratios shown in the financial highlights of this report. |
| 3 | The manager has contractually committed through November 30, 2017, to waive fees and/or reimburse expenses to the extent necessary to cap the Fund’s Total Annual Fund Operating Expenses After Fee Waiver at the 1.16% for Class A, 1.91% for Class C, 0.70% for Class R6, 0.96% for Administrator Class, and 0.75% for Institutional Class. After this time, the cap may be increased or the commitment to maintain the cap may be terminated only with the approval of the Board of Trustees. Brokerage commissions, stamp duty fees, interest, taxes, acquired fund fees and expenses, and extraordinary expenses are excluded from the expense cap. Without this cap, the Fund’s returns would have been lower. |
| 4 | The Russell 3000® Growth Index measures the performance of those Russell 3000® Index companies with higher price/book ratios and higher forecasted growth values. You cannot invest directly in an index. |
| 5 | The ten largest holdings, excluding cash and cash equivalents, are calculated based on the value of the investments divided by total net assets of the Fund. Holdings are subject to change and may have changed since the date specified. |
| 6 | Amounts are calculated based on the total long-term investments of the Fund. These amounts are subject to change and may have changed since the date specified. |
| | | | |
| 6 | | Wells Fargo Growth Fund | | Fund expenses (unaudited) |
As a shareholder of the Fund, you incur two types of costs: (1) transaction costs, including sales charges (loads) on purchase payments and contingent deferred sales charges (if any) on redemptions and (2) ongoing costs, including management fees, distribution (12b-1) and/or shareholder servicing fees, and other Fund expenses. This example is intended to help you understand your ongoing costs (in dollars) of investing in the Fund and to compare these costs with the ongoing costs of investing in other mutual funds.
The example is based on an investment of $1,000 invested at the beginning of the six-month period and held for the entire period from August 1, 2016 to January 31, 2017.
Actual expenses
The “Actual” line of the table below provides information about actual account values and actual expenses. You may use the information in this line, together with the amount you invested, to estimate the expenses that you paid over the period. Simply divide your account value by $1,000 (for example, an $8,600 account value divided by $1,000 = 8.6), then multiply the result by the number in the “Actual” line under the heading entitled “Expenses paid during period” for your applicable class of shares to estimate the expenses you paid on your account during this period.
Hypothetical example for comparison purposes
The “Hypothetical” line of the table below provides information about hypothetical account values and hypothetical expenses based on the Fund’s actual expense ratio and an assumed rate of return of 5% per year before expenses, which is not the Fund’s actual return. The hypothetical account values and expenses may not be used to estimate the actual ending account balance or expenses you paid for the period. You may use this information to compare the ongoing costs of investing in the Fund and other funds. To do so, compare this 5% hypothetical example with the 5% hypothetical examples that appear in the shareholder reports of the other funds.
Please note that the expenses shown in the table are meant to highlight your ongoing costs only and do not reflect any transactional costs, such as sales charges (loads) and contingent deferred sales charges. Therefore, the “Hypothetical” line of the table is useful in comparing ongoing costs only and will not help you determine the relative total costs of owning different funds. In addition, if these transactional costs were included, your costs would have been higher.
| | | | | | | | | | | | | | | | |
| | | Beginning
account value
8-1-2016 | | | Ending
account value
1-31-2017 | | | Expenses
paid during
the period¹ | | | Annualized net
expense ratio | |
Class A | | | | | | | | | | | | | | | | |
Actual | | $ | 1,000.00 | | | $ | 1,011.65 | | | $ | 5.87 | | | | 1.16 | % |
Hypothetical (5% return before expenses) | | $ | 1,000.00 | | | $ | 1,019.30 | | | $ | 5.89 | | | | 1.16 | % |
Class C | | | | | | | | | | | | | | | | |
Actual | | $ | 1,000.00 | | | $ | 1,007.60 | | | $ | 9.64 | | | | 1.91 | % |
Hypothetical (5% return before expenses) | | $ | 1,000.00 | | | $ | 1,015.53 | | | $ | 9.68 | | | | 1.91 | % |
Class R6 | | | | | | | | | | | | | | | | |
Actual | | $ | 1,000.00 | | | $ | 1,013.91 | | | $ | 3.54 | | | | 0.70 | % |
Hypothetical (5% return before expenses) | | $ | 1,000.00 | | | $ | 1,021.62 | | | $ | 3.56 | | | | 0.70 | % |
Administrator Class | | | | | | | | | | | | | | | | |
Actual | | $ | 1,000.00 | | | $ | 1,012.58 | | | $ | 4.86 | | | | 0.96 | % |
Hypothetical (5% return before expenses) | | $ | 1,000.00 | | | $ | 1,020.31 | | | $ | 4.88 | | | | 0.96 | % |
Institutional Class | | | | | | | | | | | | | | | | |
Actual | | $ | 1,000.00 | | | $ | 1,013.72 | | | $ | 3.80 | | | | 0.75 | % |
Hypothetical (5% return before expenses) | | $ | 1,000.00 | | | $ | 1,021.37 | | | $ | 3.81 | | | | 0.75 | % |
| 1 | Expenses paid is equal to the annualized net expense ratio of each class multiplied by the average account value over the period, multiplied by the number of days in the most recent fiscal half-year divided by the number of days in the fiscal year (to reflect the one-half-year period). |
| | | | | | |
| Portfolio of investments—January 31, 2017 (unaudited) | | Wells Fargo Growth Fund | | | 7 | |
| | | | | | | | | | | | | | | | |
| Security name | | | | | | | | Shares | | | Value | |
| | | | |
Common Stocks: 99.66% | | | | | | | | | | | | | | | | |
| | | | |
Consumer Discretionary: 14.93% | | | | | | | | | | | | | | | | |
| | | | |
| Automobiles: 0.17% | | | | | | | | | | | | | | | | |
REV Group Incorporated † | | | | | | | | | | | 333,419 | | | $ | 8,415,496 | |
| | | | | | | | | | | | | | | | |
| | | | |
| Diversified Consumer Services: 0.25% | | | | | | | | | | | | | | | | |
Grand Canyon Education Incorporated † | | | | | | | | | | | 200,360 | | | | 11,817,233 | |
| | | | | | | | | | | | | | | | |
| | | | |
| Hotels, Restaurants & Leisure: 1.16% | | | | | | | | | | | | | | | | |
Starbucks Corporation | | | | | | | | | | | 607,220 | | | | 33,530,688 | |
The Habit Restaurants Incorporated Class A †«(l) | | | | | | | | | | | 1,516,650 | | | | 21,991,425 | |
| |
| | | | 55,522,113 | |
| | | | | | | | | | | | | | | | |
| | | | |
| Internet & Direct Marketing Retail: 5.64% | | | | | | | | | | | | | | | | |
Amazon.com Incorporated † | | | | | | | | | | | 328,230 | | | | 270,290,840 | |
| | | | | | | | | | | | | | | | |
| | | | |
| Multiline Retail: 1.70% | | | | | | | | | | | | | | | | |
Dollar Tree Incorporated † | | | | | | | | | | | 1,056,960 | | | | 81,586,742 | |
| | | | | | | | | | | | | | | | |
| | | | |
| Specialty Retail: 6.01% | | | | | | | | | | | | | | | | |
Burlington Stores Incorporated † | | | | | | | | | | | 1,727,860 | | | | 144,621,882 | |
Five Below Incorporated † | | | | | | | | | | | 1,287,083 | | | | 51,290,258 | |
The Home Depot Incorporated | | | | | | | | | | | 439,720 | | | | 60,496,678 | |
Tractor Supply Company | | | | | | | | | | | 116,155 | | | | 8,557,139 | |
ULTA Salon Cosmetics & Fragrance Incorporated † | | | | | | | | | | | 84,530 | | | | 23,015,828 | |
| |
| | | | 287,981,785 | |
| | | | | | | | | | | | | | | | |
| | | | |
Consumer Staples: 2.99% | | | | | | | | | | | | | | | | |
| | | | |
| Beverages: 1.11% | | | | | | | | | | | | | | | | |
Constellation Brands Incorporated Class A | | | | | | | | | | | 356,290 | | | | 53,357,990 | |
| | | | | | | | | | | | | | | | |
| | | | |
| Food & Staples Retailing: 0.89% | | | | | | | | | | | | | | | | |
Costco Wholesale Corporation | | | | | | | | | | | 140,430 | | | | 23,023,499 | |
Sprouts Farmers Market Incorporated † | | | | | | | | | | | 1,041,750 | | | | 19,449,473 | |
| |
| | | | 42,472,972 | |
| | | | | | | | | | | | | | | | |
| | | | |
| Food Products: 0.33% | | | | | | | | | | | | | | | | |
Blue Buffalo Pet Products Incorporated † | | | | | | | | | | | 654,520 | | | | 15,872,110 | |
| | | | | | | | | | | | | | | | |
| | | | |
| Personal Products: 0.66% | | | | | | | | | | | | | | | | |
The Estee Lauder Companies Incorporated Class A | | | | | | | | | | | 388,040 | | | | 31,512,728 | |
| | | | | | | | | | | | | | | | |
| | | | |
Energy: 2.68% | | | | | | | | | | | | | | | | |
| | | | |
| Energy Equipment & Services: 0.90% | | | | | | | | | | | | | | | | |
Halliburton Company | | | | | | | | | | | 509,990 | | | | 28,850,134 | |
Schlumberger Limited | | | | | | | | | | | 170,410 | | | | 14,265,021 | |
| |
| | | | 43,115,155 | |
| | | | | | | | | | | | | | | | |
The accompanying notes are an integral part of these financial statements.
| | | | |
| 8 | | Wells Fargo Growth Fund | | Portfolio of investments—January 31, 2017 (unaudited) |
| | | | | | | | | | | | | | | | |
| Security name | | | | | | | | Shares | | | Value | |
| | | | |
| Oil, Gas & Consumable Fuels: 1.78% | | | | | | | | | | | | | | | | |
Concho Resources Incorporated † | | | | | | | | | | | 497,220 | | | $ | 69,332,357 | |
EOG Resources Incorporated | | | | | | | | | | | 137,000 | | | | 13,916,460 | |
Extraction Oil & Gas Incorporated †« | | | | | | | | | | | 104,713 | | | | 1,876,457 | |
| |
| | | | 85,125,274 | |
| | | | | | | | | | | | | | | | |
| | | | |
Financials: 5.26% | | | | | | | | | | | | | | | | |
| | | | |
| Capital Markets: 5.26% | | | | | | | | | | | | | | | | |
Goldman Sachs Group Incorporated | | | | | | | | | | | 245,700 | | | | 56,343,924 | |
MarketAxess Holdings Incorporated | | | | | | | | | | | 706,509 | | | | 132,293,810 | |
Morgan Stanley | | | | | | | | | | | 453,000 | | | | 19,247,970 | |
Raymond James Financial Incorporated | | | | | | | | | | | 379,080 | | | | 28,404,464 | |
TD Ameritrade Holding Corporation | | | | | | | | | | | 344,280 | | | | 15,888,522 | |
| | | | |
| | | | | | | | | | | | | | | 252,178,690 | |
| | | | | | | | | | | | | | | | |
| | | | |
Health Care: 15.84% | | | | | | | | | | | | | | | | |
| | | | |
| Biotechnology: 6.49% | | | | | | | | | | | | | | | | |
Alexion Pharmaceuticals Incorporated † | | | | | | | | | | | 80,348 | | | | 10,499,877 | |
BioMarin Pharmaceutical Incorporated † | | | | | | | | | | | 496,340 | | | | 43,494,274 | |
Celgene Corporation † | | | | | | | | | | | 953,110 | | | | 110,703,727 | |
Incyte Corporation † | | | | | | | | | | | 294,180 | | | | 35,657,558 | |
Regeneron Pharmaceuticals Incorporated † | | | | | | | | | | | 104,590 | | | | 37,578,141 | |
Tesaro Incorporated †« | | | | | | | | | | | 108,140 | | | | 17,609,518 | |
Ultragenyx Pharmaceutical Incorporated †« | | | | | | | | | | | 419,320 | | | | 31,453,193 | |
Vertex Pharmaceuticals Incorporated † | | | | | | | | | | | 281,780 | | | | 24,196,449 | |
| | | | |
| | | | | | | | | | | | | | | 311,192,737 | |
| | | | | | | | | | | | | | | | |
| | | | |
| Health Care Equipment & Supplies: 2.73% | | | | | | | | | | | | | | | | |
Boston Scientific Corporation † | | | | | | | | | | | 729,200 | | | | 17,544,552 | |
Danaher Corporation | | | | | | | | | | | 80,490 | | | | 6,754,721 | |
Edwards Lifesciences Corporation † | | | | | | | | | | | 224,160 | | | | 21,573,158 | |
Nevro Corporation † | | | | | | | | | | | 193,650 | | | | 16,851,423 | |
NuVasive Incorporated † | | | | | | | | | | | 960,019 | | | | 67,940,545 | |
| | | | |
| | | | | | | | | | | | | | | 130,664,399 | |
| | | | | | | | | | | | | | | | |
| | | | |
| Health Care Providers & Services: 3.64% | | | | | | | | | | | | | | | | |
Acadia Healthcare Company Incorporated †« | | | | | | | | | | | 4,102,042 | | | | 157,395,352 | |
UnitedHealth Group Incorporated | | | | | | | | | | | 24,000 | | | | 3,890,400 | |
VCA Incorporated † | | | | | | | | | | | 143,840 | | | | 13,031,904 | |
| | | | |
| | | | | | | | | | | | | | | 174,317,656 | |
| | | | | | | | | | | | | | | | |
| | | | |
| Health Care Technology: 1.90% | | | | | | | | | | | | | | | | |
Veeva Systems Incorporated Class A † | | | | | | | | | | | 2,157,280 | | | | 91,317,662 | |
| | | | | | | | | | | | | | | | |
| | | | |
| Life Sciences Tools & Services: 0.11% | | | | | | | | | | | | | | | | |
Mettler-Toledo International Incorporated † | | | | | | | | | | | 12,340 | | | | 5,264,614 | |
| | | | | | | | | | | | | | | | |
| | | | |
| Pharmaceuticals: 0.97% | | | | | | | | | | | | | | | | |
Zoetis Incorporated | | | | | | | | | | | 847,234 | | | | 46,547,036 | |
| | | | | | | | | | | | | | | | |
The accompanying notes are an integral part of these financial statements.
| | | | | | |
| Portfolio of investments—January 31, 2017 (unaudited) | | Wells Fargo Growth Fund | | | 9 | |
| | | | | | | | | | | | | | | | |
| Security name | | | | | | | | Shares | | | Value | |
| | | | |
Industrials: 10.20% | | | | | | | | | | | | | | | | |
| | | | |
| Aerospace & Defense: 0.89% | | | | | | | | | | | | | | | | |
The Boeing Company | | | | | | | | | | | 260,340 | | | $ | 42,544,763 | |
| | | | | | | | | | | | | | | | |
| | | | |
| Air Freight & Logistics: 0.80% | | | | | | | | | | | | | | | | |
United Parcel Service Incorporated Class B | | | | | | | | | | | 353,200 | | | | 38,544,716 | |
| | | | | | | | | | | | | | | | |
| | | | |
| Building Products: 0.13% | | | | | | | | | | | | | | | | |
JELD-WEN Holding Incorporated † | | | | | | | | | | | 222,280 | | | | 6,017,120 | |
| | | | | | | | | | | | | | | | |
| | | | |
| Commercial Services & Supplies: 3.70% | | | | | | | | | | | | | | | | |
KAR Auction Services Incorporated | | | | | | | | | | | 2,001,400 | | | | 91,163,770 | |
Waste Connections Incorporated | | | | | | | | | | | 1,076,010 | | | | 86,403,603 | |
| | | | |
| | | | | | | | | | | | | | | 177,567,373 | |
| | | | | | | | | | | | | | | | |
| | | | |
| Machinery: 1.01% | | | | | | | | | | | | | | | | |
ITT Incorporated | | | | | | | | | | | 756,340 | | | | 30,911,616 | |
Snap-on Incorporated | | | | | | | | | | | 95,691 | | | | 17,370,787 | |
| | | | |
| | | | | | | | | | | | | | | 48,282,403 | |
| | | | | | | | | | | | | | | | |
| | | | |
| Road & Rail: 3.67% | | | | | | | | | | | | | | | | |
CSX Corporation | | | | | | | | | | | 129,000 | | | | 5,984,310 | |
Norfolk Southern Corporation | | | | | | | | | | | 532,560 | | | | 62,554,498 | |
Union Pacific Corporation | | | | | | | | | | | 1,005,130 | | | | 107,126,755 | |
| | | | |
| | | | | | | | | | | | | | | 175,665,563 | |
| | | | | | | | | | | | | | | | |
| | | | |
Information Technology: 44.02% | | | | | | | | | | | | | | | | |
| | | | |
| Internet Software & Services: 16.05% | | | | | | | | | | | | | | | | |
Alphabet Incorporated Class A † | | | | | | | | | | | 339,540 | | | | 278,487,309 | |
Alphabet Incorporated Class C † | | | | | | | | | | | 29,971 | | | | 23,880,593 | |
CoStar Group Incorporated † | | | | | | | | | | | 215,000 | | | | 43,451,500 | |
eBay Incorporated † | | | | | | | | | | | 386,700 | | | | 12,308,661 | |
Envestnet Incorporated †(l) | | | | | | | | | | | 2,274,641 | | | | 85,981,430 | |
Facebook Incorporated Class A † | | | | | | | | | | | 2,249,800 | | | | 293,193,936 | |
Trivago NV ADR †« | | | | | | | | | | | 1,002,134 | | | | 11,624,754 | |
Yelp Incorporated † | | | | | | | | | | | 484,000 | | | | 20,221,520 | |
| | | | |
| | | | | | | | | | | | | | | 769,149,703 | |
| | | | | | | | | | | | | | | | |
| | | | |
| IT Services: 10.00% | | | | | | | | | | | | | | | | |
Euronet Worldwide Incorporated † | | | | | | | | | | | 795,890 | | | | 56,922,053 | |
FleetCor Technologies Incorporated † | | | | | | | | | | | 77,700 | | | | 11,459,973 | |
Global Payments Incorporated | | | | | | | | | | | 870,250 | | | | 67,252,920 | |
MasterCard Incorporated Class A | | | | | | | | | | | 1,150,100 | | | | 122,290,133 | |
PayPal Holdings Incorporated † | | | | | | | | | | | 480,900 | | | | 19,130,202 | |
Vantiv Incorporated Class A † | | | | | | | | | | | 990,723 | | | | 61,662,600 | |
Visa Incorporated Class A | | | | | | | | | | | 1,700,070 | | | | 140,612,790 | |
| | | | |
| | | | | | | | | | | | | | | 479,330,671 | |
| | | | | | | | | | | | | | | | |
The accompanying notes are an integral part of these financial statements.
| | | | |
| 10 | | Wells Fargo Growth Fund | | Portfolio of investments—January 31, 2017 (unaudited) |
| | | | | | | | | | | | | | | | |
| Security name | | | | | | | | Shares | | | Value | |
| | | | |
| Semiconductors & Semiconductor Equipment: 6.20% | | | | | | | | | | | | | | | | |
Broadcom Limited | | | | | | | | | | | 165,430 | | | $ | 33,003,285 | |
Microchip Technology Incorporated | | | | | | | | | | | 2,471,640 | | | | 166,464,954 | |
Monolithic Power Systems Incorporated | | | | | | | | | | | 648,161 | | | | 56,545,566 | |
Texas Instruments Incorporated | | | | | | | | | | | 543,650 | | | | 41,067,321 | |
| | | | |
| | | | | | | | | | | | | | | 297,081,126 | |
| | | | | | | | | | | | | | | | |
| | | | |
| Software: 9.74% | | | | | | | | | | | | | | | | |
Adobe Systems Incorporated † | | | | | | | | | | | 417,184 | | | | 47,300,322 | |
Microsoft Corporation | | | | | | | | | | | 1,373,370 | | | | 88,788,371 | |
Paycom Software Incorporated †« | | | | | | | | | | | 651,402 | | | | 30,120,828 | |
Paylocity Holding Corporation † | | | | | | | | | | | 1,216,141 | | | | 37,530,111 | |
Proofpoint Incorporated † | | | | | | | | | | | 976,820 | | | | 78,301,891 | |
Salesforce.com Incorporated † | | | | | | | | | | | 539,950 | | | | 42,710,045 | |
ServiceNow Incorporated † | | | | | | | | | | | 313,490 | | | | 28,408,464 | |
Splunk Incorporated † | | | | | | | | | | | 1,179,881 | | | | 68,267,915 | |
Ultimate Software Group Incorporated † | | | | | | | | | | | 234,850 | | | | 45,481,051 | |
| | | | |
| | | | | | | | | | | | | | | 466,908,998 | |
| | | | | | | | | | | | | | | | |
| | | | |
| Technology Hardware, Storage & Peripherals: 2.03% | | | | | | | | | | | | | | | | |
Apple Incorporated | | | | | | | | | | | 799,430 | | | | 97,010,831 | |
| | | | | | | | | | | | | | | | |
| | | | |
Materials: 3.51% | | | | | | | | | | | | | | | | |
| | | | |
| Chemicals: 3.51% | | | | | | | | | | | | | | | | |
Ecolab Incorporated | | | | | | | | | | | 666,890 | | | | 80,113,496 | |
PolyOne Corporation | | | | | | | | | | | 47,000 | | | | 1,603,170 | |
Praxair Incorporated | | | | | | | | | | | 731,210 | | | | 86,604,512 | |
| | | | |
| | | | | | | | | | | | | | | 168,321,178 | |
| | | | | | | | | | | | | | | | |
| | | | |
Real Estate: 0.23% | | | | | | | | | | | | | | | | |
| | | | |
| Equity REITs: 0.23% | | | | | | | | | | | | | | | | |
Crown Castle International Corporation | | | | | | | | | | | 127,300 | | | | 11,180,759 | |
| | | | | | | | | | | | | | | | |
| | | | |
Total Common Stocks (Cost $2,873,723,911) | | | | | | | | | | | | | | | 4,776,158,436 | |
| | | | | | | | | | | | | | | | |
| | | | |
| | | Yield | | | | | | | | | | |
| Short-Term Investments: 2.18% | | | | | | | | | | | | | | | | |
| | | | |
| Investment Companies: 2.18% | | | | | | | | | | | | | | | | |
Securities Lending Cash Investment LLC (l)(r)(u) | | | 0.86 | % | | | | | | | 87,374,201 | | | | 87,382,939 | |
Wells Fargo Government Money Market Fund Select Class (l)(u) | | | 0.46 | | | | | | | | 16,954,326 | | | | 16,954,326 | |
| | | | |
Total Short-Term Investments (Cost $104,331,124) | | | | | | | | | | | | | | | 104,337,265 | |
| | | | | | | | | | | | | | | | |
| | | | | | | | |
| Total investments in securities (Cost $2,978,055,035) * | | | 101.84 | % | | | 4,880,495,701 | |
Other assets and liabilities, net | | | (1.84 | ) | | | (87,973,018 | ) |
| | | | | | | | |
| Total net assets | | | 100.00 | % | | $ | 4,792,522,683 | |
| | | | | | | | |
The accompanying notes are an integral part of these financial statements.
| | | | | | |
| Portfolio of investments—January 31, 2017 (unaudited) | | Wells Fargo Growth Fund | | | 11 | |
| † | Non-income-earning security |
| « | All or a portion of this security is on loan. |
| (l) | The issuer of the security is an affiliated person of the Fund as defined in the Investment Company Act of 1940. |
| (r) | The investment is a non-registered investment vehicle purchased with cash collateral received from securities on loan. |
| (u) | The rate represents the 7-day annualized yield at period end. |
| * | Cost for federal income tax purposes is $2,974,295,544 and unrealized gains (losses) consists of: |
| | | | |
Gross unrealized gains | | $ | 1,999,985,307 | |
Gross unrealized losses | | | (93,785,150 | ) |
| | | | |
Net unrealized gains | | $ | 1,906,200,157 | |
The accompanying notes are an integral part of these financial statements.
| | | | |
| 12 | | Wells Fargo Growth Fund | | Statement of assets and liabilities—January 31, 2017 (unaudited) |
| | | | |
| | | | |
| |
Assets | | | | |
Investments | | | | |
In unaffiliated securities (including $85,344,936 of securities loaned), at value (cost $2,756,779,547) | | $ | 4,668,185,581 | |
In affiliated securities, at value (cost $221,275,488) | | | 212,310,120 | |
| | | | |
Total investments, at value (cost $2,978,055,035) | | | 4,880,495,701 | |
Receivable for investments sold | | | 65,439,148 | |
Receivable for Fund shares sold | | | 3,149,191 | |
Receivable for dividends | | | 787,312 | |
Receivable for securities lending income | | | 29,881 | |
Prepaid expenses and other assets | | | 101,427 | |
| | | | |
Total assets | | | 4,950,002,660 | |
| | | | |
| |
Liabilities | | | | |
Payable for investments purchased | | | 28,808,753 | |
Payable for Fund shares redeemed | | | 36,566,552 | |
Payable upon receipt of securities loaned | | | 87,372,150 | |
Management fee payable | | | 2,657,661 | |
Distribution fee payable | | | 144,430 | |
Administration fees payable | | | 699,361 | |
Accrued expenses and other liabilities | | | 1,231,070 | |
| | | | |
Total liabilities | | | 157,479,977 | |
| | | | |
Total net assets | | $ | 4,792,522,683 | |
| | | | |
| |
NET ASSETS CONSIST OF | | | | |
Paid-in capital | | $ | 2,441,975,233 | |
Accumulated net investment loss | | | (25,202,956 | ) |
Accumulated net realized gains on investments | | | 473,309,740 | |
Net unrealized gains on investments | | | 1,902,440,666 | |
| | | | |
Total net assets | | $ | 4,792,522,683 | |
| | | | |
| |
COMPUTATION OF NET ASSET VALUE AND OFFERING PRICE PER SHARE | | | | |
Net assets – Class A | | $ | 2,054,783,862 | |
Shares outstanding – Class A1 | | | 58,329,421 | |
Net asset value per share – Class A | | | $35.23 | |
Maximum offering price per share – Class A2 | | | $37.38 | |
Net assets – Class C | | $ | 223,085,738 | |
Shares outstanding – Class C1 | | | 7,481,738 | |
Net asset value per share – Class C | | | $29.82 | |
Net assets – Class R6 | | $ | 25,332,651 | |
Shares outstanding – Class R61 | | | 617,524 | |
Net asset value per share – Class R6 | | | $41.02 | |
Net assets – Administrator Class | | $ | 730,153,728 | |
Shares outstanding – Administrator Class1 | | | 18,870,559 | |
Net asset value per share – Administrator Class | | | $38.69 | |
Net assets – Institutional Class | | $ | 1,759,166,704 | |
Shares outstanding – Institutional Class1 | | | 42,926,169 | |
Net asset value per share – Institutional Class | | | $40.98 | |
| 1 | The Fund has an unlimited number of authorized shares. |
| 2 | Maximum offering price is computed as 100/94.25 of net asset value. On investments of $50,000 or more, the offering price is reduced. |
The accompanying notes are an integral part of these financial statements.
| | | | | | |
| Statement of operations—six months ended January 31, 2017 (unaudited) | | Wells Fargo Growth Fund | | | 13 | |
| | | | |
| | | | |
| |
Investment income | | | | |
Dividends (net of foreign withholding taxes of $36,601) | | $ | 19,407,112 | |
Securities lending income, net | | | 521,676 | |
Income from affiliated securities | | | 49,992 | |
| | | | |
Total investment income | | | 19,978,780 | |
| | | | |
| |
Expenses | | | | |
Management fee | | | 19,964,375 | |
Administration fees | | | | |
Class A | | | 2,424,633 | |
Class C | | | 291,438 | |
Class R6 | | | 3,861 | |
Administrator Class | | | 705,132 | |
Institutional Class | | | 1,370,550 | |
Shareholder servicing fees | | | | |
Class A | | | 2,886,468 | |
Class C | | | 346,950 | |
Administrator Class | | | 1,351,874 | |
Distribution fee | | | | |
Class C | | | 1,040,850 | |
Custody and accounting fees | | | 79,972 | |
Professional fees | | | 25,673 | |
Registration fees | | | 92,556 | |
Shareholder report expenses | | | 157,795 | |
Trustees’ fees and expenses | | | 12,604 | |
Other fees and expenses | | | 77,474 | |
| | | | |
Total expenses | | | 30,832,205 | |
Less: Fee waivers and/or expense reimbursements | | | (1,605,450 | ) |
| | | | |
Net expenses | | | 29,226,755 | |
| | | | |
Net investment loss | | | (9,247,975 | ) |
| | | | |
| |
REALIZED AND UNREALIZED GAINS (LOSSES) ON INVESTMENTS | | | | |
| |
Net realized gains (losses) on: | | | | |
Unaffiliated securities | | | 818,929,586 | |
Affiliated securities | | | (5,652,833 | ) |
| | | | |
Net realized gains on investments | | | 813,276,753 | |
| | | | |
| |
Net change in unrealized gains (losses) on: | | | | |
Unaffiliated securities | | | (783,021,750 | ) |
Affiliated securities | | | 1,937,904 | |
| | | | |
Net change in unrealized gains (losses) on investments | | | (781,083,846 | ) |
| | | | |
Net realized and unrealized gains (losses) on investments | | | 32,192,907 | |
| | | | |
Net increase in net assets resulting from operations | | $ | 22,944,932 | |
| | | | |
The accompanying notes are an integral part of these financial statements.
| | | | |
| 14 | | Wells Fargo Growth Fund | | Statement of changes in net assets |
| | | | | | | | | | | | | | | | |
| | | Six months ended
January 31, 2017
(unaudited) | | | Year ended
July 31, 2016 | |
| | | | |
Operations | | | | | | | | | | | | | | | | |
Net investment loss | | | | | | $ | (9,247,975 | ) | | | | | | $ | (27,814,936 | ) |
Net realized gains on investments | | | | | | | 813,276,753 | | | | | | | | 876,195,475 | |
Net change in unrealized gains (losses) on investments | | | | | | | (781,083,846 | ) | | | | | | | (1,291,061,745 | ) |
| | | | |
Net increase (decrease) in net assets resulting from operations | | | | | | | 22,944,932 | | | | | | | | (442,681,206 | ) |
| | | | |
| | | | |
Distributions to shareholders from | | | | | | | | | | | | | | | | |
Net realized gains | | | | | | | | | | | | | | | | |
Class A | | | | | | | (385,155,921 | ) | | | | | | | (399,298,978 | ) |
Class C | | | | | | | (51,825,133 | ) | | | | | | | (58,938,406 | ) |
Class R6 | | | | | | | (3,453,520 | ) | | | | | | | (3,078 | )1 |
Administrator Class | | | | | | | (132,054,015 | ) | | | | | | | (246,890,849 | ) |
Institutional Class | | | | | | | (317,034,333 | ) | | | | | | | (415,951,081 | ) |
| | | | |
Total distributions to shareholders | | | | | | | (889,522,922 | ) | | | | | | | (1,121,082,392 | ) |
| | | | |
| | | | |
Capital share transactions | | | Shares | | | | | | | | Shares | | | | | |
Proceeds from shares sold | | | | | | | | | | | | | | | | |
Class A | | | 1,519,369 | | | | 57,924,419 | | | | 43,995,297 | | | | 2,023,515,239 | |
Class C | | | 536,644 | | | | 16,033,763 | | | | 581,792 | | | | 20,816,141 | |
Class R6 | | | 199,060 | | | | 8,793,014 | | | | 809,874 | 1 | | | 36,393,640 | 1 |
Administrator Class | | | 1,339,439 | | | | 57,396,210 | | | | 7,124,750 | | | | 320,564,136 | |
Institutional Class | | | 6,532,911 | | | | 297,555,443 | | | | 13,079,635 | | | | 610,815,781 | |
Investor Class | | | N/A | | | | N/A | | | | 481,943 | 2 | | | 22,113,995 | 2 |
| | | | |
| | | | | | | 437,702,849 | | | | | | | | 3,034,218,932 | |
| | | | |
Reinvestment of distributions | | | | | | | | | | | | | | | | |
Class A | | | 10,734,969 | | | | 367,135,939 | | | | 9,441,799 | | | | 377,011,011 | |
Class C | | | 1,346,264 | | | | 39,028,199 | | | | 1,219,230 | | | | 42,892,540 | |
Class R6 | | | 86,772 | | | | 3,453,520 | | | | 68 | 1 | | | 3,078 | 1 |
Administrator Class | | | 3,489,159 | | | | 131,017,902 | | | | 5,707,643 | | | | 245,828,196 | |
Institutional Class | | | 7,686,540 | | | | 305,616,849 | | | | 8,792,866 | | | | 396,558,261 | |
| | | | |
| | | | | | | 846,252,409 | | | | | | | | 1,062,293,086 | |
| | | | |
Payment for shares redeemed | | | | | | | | | | | | | | | | |
Class A | | | (15,022,711 | ) | | | (581,604,620 | ) | | | (21,946,636 | ) | | | (888,004,129 | ) |
Class C | | | (3,061,031 | ) | | | (100,500,550 | ) | | | (3,607,488 | ) | | | (128,227,500 | ) |
Class R6 | | | (313,566 | ) | | | (14,747,452 | ) | | | (164,684 | )1 | | | (7,572,255 | )1 |
Administrator Class | | | (19,430,559 | ) | | | (848,899,162 | ) | | | (23,808,569 | ) | | | (1,051,831,735 | ) |
Institutional Class | | | (21,390,567 | ) | | | (940,417,370 | ) | | | (42,021,779 | ) | | | (1,850,525,284 | ) |
Investor Class | | | N/A | | | | N/A | | | | (43,198,360 | )2 | | | (1,994,219,513 | )2 |
| | | | |
| | | | | | | (2,486,169,154 | ) | | | | | | | (5,920,380,416 | ) |
| | | | |
Net decrease in net assets resulting from capital share transactions | | | | | | | (1,202,213,896 | ) | | | | | | | (1,823,868,398 | ) |
| | | | |
Total decrease in net assets | | | | | | | (2,068,791,886 | ) | | | | | | | (3,387,631,996 | ) |
| | | | |
| | | | |
Net assets | | | | | | | | | | | | | | | | |
Beginning of period | | | | | | | 6,861,314,569 | | | | | | | | 10,248,946,565 | |
| | | | |
End of period | | | | | | $ | 4,792,522,683 | | | | | | | $ | 6,861,314,569 | |
| | | | |
Accumulated net investment loss | | | | | | $ | (25,202,956 | ) | | | | | | $ | (15,954,981 | ) |
| | | | |
| 1 | For the period from September 30, 2015 (commencement of class operations) to July 31, 2016 |
| 2 | For the period from August 1, 2015 to October 23, 2015. Effective at the close of business on October 23, 2015, Investor Class shares were converted to Class A shares and are no longer offered by the Fund. |
The accompanying notes are an integral part of these financial statements.
| | | | | | |
| Financial highlights | | Wells Fargo Growth Fund | | | 15 | |
(For a share outstanding throughout each period)
| | | | | | | | | | | | | | | | | | | | | | | | |
| | | Six months ended
January 31, 2017 (unaudited) | | | Year ended July 31 | |
| CLASS A | | | 2016 | | | 2015 | | | 2014 | | | 2013 | | | 2012 | |
Net asset value, beginning of period | | | $42.28 | | | | $49.50 | | | | $49.99 | | | | $46.74 | | | | $37.85 | | | | $35.88 | |
Net investment loss | | | (0.11 | ) | | | (0.20 | )1 | | | (0.29 | )1 | | | (0.32 | )1 | | | (0.17 | )1 | | | (0.21 | )1 |
Net realized and unrealized gains (losses) on investments | | | 0.38 | | | | (0.99 | ) | | | 7.03 | | | | 5.34 | | | | 9.06 | | | | 2.65 | |
| | | | | | | | | | | | | | | | | | | | | | | | |
Total from investment operations | | | 0.27 | | | | (1.19 | ) | | | 6.74 | | | | 5.02 | | | | 8.89 | | | | 2.44 | |
Distributions to shareholders from | | | | | | | | | | | | | | | | | | | | | | | | |
Net realized gains | | | (7.32 | ) | | | (6.03 | ) | | | (7.23 | ) | | | (1.77 | ) | | | 0.00 | | | | (0.47 | ) |
Net asset value, end of period | | | $35.23 | | | | $42.28 | | | | $49.50 | | | | $49.99 | | | | $46.74 | | | | $37.85 | |
Total return2 | | | 1.16 | % | | | (1.69 | )% | | | 15.01 | % | | | 10.77 | % | | | 23.49 | % | | | 6.93 | % |
Ratios to average net assets (annualized) | | | | | | | | | | | | | | | | | | | | | | | | |
Gross expenses | | | 1.16 | % | | | 1.15 | % | | | 1.18 | % | | | 1.18 | % | | | 1.19 | % | | | 1.20 | % |
Net expenses | | | 1.16 | % | | | 1.14 | % | | | 1.18 | % | | | 1.18 | % | | | 1.19 | % | | | 1.20 | % |
Net investment loss | | | (0.48 | )% | | | (0.49 | )% | | | (0.59 | )% | | | (0.64 | )% | | | (0.41 | )% | | | (0.56 | )% |
Supplemental data | | | | | | | | | | | | | | | | | | | | | | | | |
Portfolio turnover rate | | | 27 | % | | | 38 | % | | | 35 | % | | | 42 | % | | | 38 | % | | | 47 | % |
Net assets, end of period (000s omitted) | | | $2,054,784 | | | | $2,582,955 | | | | $1,465,643 | | | | $2,047,410 | | | | $2,464,533 | | | | $2,265,845 | |
| 1 | Calculated based upon average shares outstanding |
| 2 | Total return calculations do not include any sales charges. Returns for periods of less than one year are not annualized. |
The accompanying notes are an integral part of these financial statements.
| | | | |
| 16 | | Wells Fargo Growth Fund | | Financial highlights |
(For a share outstanding throughout each period)
| | | | | | | | | | | | | | | | | | | | | | | | |
| | | Six months ended
January 31, 2017 (unaudited) | | | Year ended July 31 | |
| CLASS C | | | 2016 | | | 2015 | | | 2014 | | | 2013 | | | 2012 | |
Net asset value, beginning of period | | | $37.07 | | | | $44.51 | | | | $45.95 | | | | $43.41 | | | | $35.42 | | | | $33.86 | |
Net investment loss | | | (0.21 | )1 | | | (0.46 | )1 | | | (0.60 | )1 | | | (0.64 | )1 | | | (0.45 | )1 | | | (0.46 | )1 |
Net realized and unrealized gains (losses) on investments | | | 0.28 | | | | (0.95 | ) | | | 6.39 | | | | 4.95 | | | | 8.44 | | | | 2.49 | |
| | | | | | | | | | | | | | | | | | | | | | | | |
Total from investment operations | | | 0.07 | | | | (1.41 | ) | | | 5.79 | | | | 4.31 | | | | 7.99 | | | | 2.03 | |
Distributions to shareholders from | | | | | | | | | | | | | | | | | | | | | | | | |
Net realized gains | | | (7.32 | ) | | | (6.03 | ) | | | (7.23 | ) | | | (1.77 | ) | | | 0.00 | | | | (0.47 | ) |
Net asset value, end of period | | | $29.82 | | | | $37.07 | | | | $44.51 | | | | $45.95 | | | | $43.41 | | | | $35.42 | |
Total return2 | | | 0.76 | % | | | (2.44 | )% | | | 14.16 | % | | | 9.96 | % | | | 22.56 | % | | | 6.12 | % |
Ratios to average net assets (annualized) | | | | | | | | | | | | | | | | | | | | | | | | |
Gross expenses | | | 1.91 | % | | | 1.90 | % | | | 1.93 | % | | | 1.93 | % | | | 1.94 | % | | | 1.95 | % |
Net expenses | | | 1.91 | % | | | 1.89 | % | | | 1.93 | % | | | 1.93 | % | | | 1.94 | % | | | 1.95 | % |
Net investment loss | | | (1.22 | )% | | | (1.24 | )% | | | (1.34 | )% | | | (1.39 | )% | | | (1.16 | )% | | | (1.32 | )% |
Supplemental data | | | | | | | | | | | | | | | | | | | | | | | | |
Portfolio turnover rate | | | 27 | % | | | 38 | % | | | 35 | % | | | 42 | % | | | 38 | % | | | 47 | % |
Net assets, end of period (000s omitted) | | | $223,086 | | | | $321,032 | | | | $465,833 | | | | $560,481 | | | | $589,402 | | | | $525,285 | |
| 1 | Calculated based upon average shares outstanding |
| 2 | Total return calculations do not include any sales charges. Returns for periods of less than one year are not annualized. |
The accompanying notes are an integral part of these financial statements.
| | | | | | |
| Financial highlights | | Wells Fargo Growth Fund | | | 17 | |
(For a share outstanding throughout each period)
| | | | | | | | |
| CLASS R6 | | Six months ended
January 31, 2017
(unaudited) | | | Year ended
July 31 20161 | |
Net asset value, beginning of period | | | $47.90 | | | | $48.97 | |
Net investment income (loss) | | | (0.00 | )2 | | | (0.02 | ) |
Net realized and unrealized gains (losses) on investments | | | 0.44 | | | | 4.98 | |
| | | | | | | | |
Total from investment operations | | | 0.44 | | | | 4.96 | |
Distributions to shareholders from | | | | | | | | |
Net realized gains | | | (7.32 | ) | | | (6.03 | ) |
Net asset value, end of period | | | $41.02 | | | | $47.90 | |
Total return3 | | | 1.39 | % | | | 10.89 | % |
Ratios to average net assets (annualized) | | | | | | | | |
Gross expenses | | | 0.74 | % | | | 0.74 | % |
Net expenses | | | 0.70 | % | | | 0.70 | % |
Net investment loss | | | (0.01 | )% | | | (0.23 | )% |
Supplemental data | | | | | | | | |
Portfolio turnover rate | | | 27 | % | | | 38 | % |
Net assets, end of period (000s omitted) | | | $25,333 | | | | $30,906 | |
| 1 | For the period from September 30, 2015 (commencement of class operations) to July 31, 2016 |
| 2 | Amount is less than $0.005. |
| 3 | Returns for periods of less than one year are not annualized. |
The accompanying notes are an integral part of these financial statements.
| | | | |
| 18 | | Wells Fargo Growth Fund | | Financial highlights |
(For a share outstanding throughout each period)
| | | | | | | | | | | | | | | | | | | | | | | | |
| | | Six months ended
January 31, 2017 (unaudited) | | | Year ended July 31 | |
| ADMINISTRATOR CLASS | | | 2016 | | | 2015 | | | 2014 | | | 2013 | | | 2012 | |
Net asset value, beginning of period | | | $45.66 | | | | $52.86 | | | | $52.80 | | | | $49.16 | | | | $39.72 | | | | $37.54 | |
Net investment loss | | | (0.05 | )1 | | | (0.14 | )1 | | | (0.20 | )1 | | | (0.23 | ) | | | (0.08 | )1 | | | (0.13 | )1 |
Net realized and unrealized gains (losses) on investments | | | 0.40 | | | | (1.03 | ) | | | 7.49 | | | | 5.64 | | | | 9.52 | | | | 2.78 | |
| | | | | | | | | | | | | | | | | | | | | | | | |
Total from investment operations | | | 0.35 | | | | (1.17 | ) | | | 7.29 | | | | 5.41 | | | | 9.44 | | | | 2.65 | |
Distributions to shareholders from | | | | | | | | | | | | | | | | | | | | | | | | |
Net realized gains | | | (7.32 | ) | | | (6.03 | ) | | | (7.23 | ) | | | (1.77 | ) | | | 0.00 | | | | (0.47 | ) |
Net asset value, end of period | | | $38.69 | | | | $45.66 | | | | $52.86 | | | | $52.80 | | | | $49.16 | | | | $39.72 | |
Total return2 | | | 1.26 | % | | | (1.53 | )% | | | 15.28 | % | | | 11.04 | % | | | 23.77 | % | | | 7.15 | % |
Ratios to average net assets (annualized) | | | | | | | | | | | | | | | | | | | | | | | | |
Gross expenses | | | 1.08 | % | | | 1.07 | % | | | 1.02 | % | | | 1.02 | % | | | 1.03 | % | | | 1.03 | % |
Net expenses | | | 0.96 | % | | | 0.96 | % | | | 0.96 | % | | | 0.96 | % | | | 0.96 | % | | | 0.96 | % |
Net investment loss | | | (0.24 | )% | | | (0.31 | )% | | | (0.37 | )% | | | (0.42 | )% | | | (0.18 | )% | | | (0.33 | )% |
Supplemental data | | | | | | | | | | | | | | | | | | | | | | | | |
Portfolio turnover rate | | | 27 | % | | | 38 | % | | | 35 | % | | | 42 | % | | | 38 | % | | | 47 | % |
Net assets, end of period (000s omitted) | | | $730,154 | | | | $1,528,288 | | | | $2,349,359 | | | | $3,359,480 | | | | $3,309,683 | | | | $2,984,775 | |
| 1 | Calculated based upon average shares outstanding |
| 2 | Returns for periods of less than one year are not annualized. |
The accompanying notes are an integral part of these financial statements.
| | | | | | |
| Financial highlights | | Wells Fargo Growth Fund | | | 19 | |
(For a share outstanding throughout each period)
| | | | | | | | | | | | | | | | | | | | | | | | |
| | | Six months ended
January 31, 2017 (unaudited) | | | Year ended July 31 | |
| INSTITUTIONAL CLASS | | | 2016 | | | 2015 | | | 2014 | | | 2013 | | | 2012 | |
Net asset value, beginning of period | | | $47.87 | | | | $54.99 | | | | $54.54 | | | | $50.63 | | | | $40.83 | | | | $38.49 | |
Net investment income (loss) | | | (0.02 | )1 | | | (0.05 | )1 | | | (0.09 | )1 | | | (0.13 | ) | | | 0.01 | 1 | | | (0.05 | )1 |
Net realized and unrealized gains (losses) on investments | | | 0.45 | | | | (1.04 | ) | | | 7.77 | | | | 5.81 | | | | 9.79 | | | | 2.86 | |
| | | | | | | | | | | | | | | | | | | | | | | | |
Total from investment operations | | | 0.43 | | | | (1.09 | ) | | | 7.68 | | | | 5.68 | | | | 9.80 | | | | 2.81 | |
Distributions to shareholders from | | | | | | | | | | | | | | | | | | | | | | | | |
Net realized gains | | | (7.32 | ) | | | (6.03 | ) | | | (7.23 | ) | | | (1.77 | ) | | | 0.00 | | | | (0.47 | ) |
Net asset value, end of period | | | $40.98 | | | | $47.87 | | | | $54.99 | | | | $54.54 | | | | $50.63 | | | | $40.83 | |
Total return2 | | | 1.37 | % | | | (1.31 | )% | | | 15.53 | % | | | 11.26 | % | | | 24.03 | % | | | 7.37 | % |
Ratios to average net assets (annualized) | | | | | | | | | | | | | | | | | | | | | | | | |
Gross expenses | | | 0.83 | % | | | 0.82 | % | | | 0.76 | % | | | 0.75 | % | | | 0.76 | % | | | 0.77 | % |
Net expenses | | | 0.75 | % | | | 0.75 | % | | | 0.75 | % | | | 0.75 | % | | | 0.75 | % | | | 0.76 | % |
Net investment income (loss) | | | (0.07 | )% | | | (0.10 | )% | | | (0.17 | )% | | | (0.21 | )% | | | 0.02 | % | | | (0.13 | )% |
Supplemental data | | | | | | | | | | | | | | | | | | | | | | | | |
Portfolio turnover rate | | | 27 | % | | | 38 | % | | | 35 | % | | | 42 | % | | | 38 | % | | | 47 | % |
Net assets, end of period (000s omitted) | | | $1,759,167 | | | | $2,398,134 | | | | $3,863,196 | | | | $2,975,721 | | | | $2,649,095 | | | | $2,312,074 | |
| 1 | Calculated based upon average shares outstanding |
| 2 | Returns for periods of less than one year are not annualized. |
The accompanying notes are an integral part of these financial statements.
| | | | |
| 20 | | Wells Fargo Growth Fund | | Notes to financial statements (unaudited) |
1. ORGANIZATION
Wells Fargo Funds Trust (the “Trust”), a Delaware statutory trust organized on March 10, 1999, is an open-end management investment company registered under the Investment Company Act of 1940, as amended (the “1940 Act”). As an investment company, the Trust follows the accounting and reporting guidance in Financial Accounting Standards Board (“FASB”) Accounting Standards Codification Topic 946, Financial Services – Investment Companies. These financial statements report on the Wells Fargo Growth Fund (the “Fund”) which is a diversified series of the Trust.
Effective at the close of business on October 23, 2015, Investor Class shares became Class A shares in a tax-free conversion. Shareholders of Investor Class received Class A shares at a value equal to the value of their Investor Class shares immediately prior to the conversion. Investor Class shares are no longer offered by the Fund.
2. SIGNIFICANT ACCOUNTING POLICIES
The following significant accounting policies, which are consistently followed in the preparation of the financial statements of the Fund, are in conformity with U.S. generally accepted accounting principles which require management to make estimates and assumptions that affect the reported amounts of assets and liabilities, disclosure of contingent assets and liabilities at the date of the financial statements, and the reported amounts of revenues and expenses during the reporting period. Actual results could differ from those estimates.
Securities valuation
All investments are valued each business day as of the close of regular trading on the New York Stock Exchange (generally 4 p.m. Eastern Time), although the Fund may deviate from this calculation time under unusual or unexpected circumstances.
Equity securities that are listed on a foreign or domestic exchange or market are valued at the official closing price or, if none, the last sales price. If no sale occurs on the principal exchange or market that day, the prior day’s price will be deemed “stale” and a fair value price will be determined in accordance with the Fund’s Valuation Procedures.
Investments in registered open-end investment companies are valued at net asset value. Interests in non-registered investment vehicles that are redeemable at net asset value are fair valued normally at net asset value.
Investments which are not valued using any of the methods discussed above are valued at their fair value, as determined in good faith by the Board of Trustees of the Fund. The Board of Trustees has established a Valuation Committee comprised of the Trustees and has delegated to it the authority to take any actions regarding the valuation of portfolio securities that the Valuation Committee deems necessary or appropriate, including determining the fair value of portfolio securities, unless the determination has been delegated to the Management Valuation Team of Wells Fargo Funds Management, LLC (“Funds Management”). The Board of Trustees retains the authority to make or ratify any valuation decisions or approve any changes to the Valuation Procedures as it deems appropriate. On a quarterly basis, the Board of Trustees receives reports on any valuation actions taken by the Valuation Committee or the Management Valuation Team which may include items for ratification.
Valuations of fair valued securities are compared to the next actual sales price when available, or other appropriate market values, to assess the continued appropriateness of the fair valuation methodologies used. These securities are fair valued on a day-to-day basis, taking into consideration changes to appropriate market information and any significant changes to the inputs considered in the valuation process until there is a readily available price provided on an exchange or by an independent pricing service. Valuations received from an independent pricing service or independent broker-dealer quotes are periodically validated by comparisons to most recent trades and valuations provided by other independent pricing services in addition to the review of prices by the manager and/or subadviser. Unobservable inputs used in determining fair valuations are identified based on the type of security, taking into consideration factors utilized by market participants in valuing the investment, knowledge about the issuer and the current market environment.
Security loans
The Fund may lend its securities from time to time in order to earn additional income in the form of fees or interest on securities received as collateral or the investment of any cash received as collateral. The Fund continues to receive interest or dividends on the securities loaned. The Fund receives collateral in the form of cash or securities with a value at least equal to the value of the securities on loan. The value of the loaned securities is determined at the close of each business day and any additional required collateral is delivered to the Fund on the next business day. In a securities lending transaction, the net asset value of the Fund will be affected by an increase or decrease in the value of the securities loaned and by an increase or decrease in the value of the instrument in which collateral is invested. The amount of securities lending activity undertaken by the Fund fluctuates from time to time. In the event of default or bankruptcy by the borrower, the Fund may be prevented from recovering the loaned securities or gaining access to the collateral or
| | | | | | |
| Notes to financial statements (unaudited) | | Wells Fargo Growth Fund | | | 21 | |
may experience delays or costs in doing so. In addition, the investment of any cash collateral received may lose all or part of its value. The Fund has the right under the lending agreement to recover the securities from the borrower on demand.
The Fund lends its securities through an unaffiliated securities lending agent. Cash collateral received in connection with its securities lending transactions is invested in Securities Lending Cash Investments, LLC (the “Securities Lending Fund”). The Securities Lending Fund is exempt from registration under Section 3(c)(7) of the 1940 Act and is managed by Funds Management and is subadvised by Wells Capital Management Incorporated (“WellsCap”), an affiliate of Funds Management and an indirect wholly owned subsidiary of Wells Fargo & Company (“Wells Fargo”). Funds Management receives an advisory fee starting at 0.05% and declining to 0.01% as the average daily net assets of the Securities Lending Fund increase. All of the fees received by Funds Management are paid to WellsCap for its services as subadviser. The Securities Lending Fund seeks to provide a positive return compared to the daily Fed Funds Open Rate by investing in high-quality, U.S. dollar-denominated short-term money market instruments. Securities Lending Fund investments are valued at the evaluated bid price provided by an independent pricing service. Income earned from investment in the Securities Lending Fund is included in securities lending income on the Statement of Operations.
Security transactions and income recognition
Securities transactions are recorded on a trade date basis. Realized gains or losses are recorded on the basis of identified cost.
Dividend income is recognized on the ex-dividend date. Dividend income from foreign securities is recorded net of foreign taxes withheld where recovery of such taxes is not assured.
Distributions to shareholders
Distributions to shareholders from net investment income and net realized gains, if any, are recorded on the ex-dividend date. Such distributions are determined in conformity with federal income tax regulations, which may differ in amount or character from net investment income and realized gains recognized for purposes of U.S. generally accepted accounting principles.
Federal and other taxes
The Fund intends to continue to qualify as a regulated investment company by distributing substantially all of its investment company taxable income and any net realized capital gains (after reduction for capital loss carryforwards) sufficient to relieve it from all, or substantially all, federal income taxes. Accordingly, no provision for federal income taxes was required.
The Fund’s income and federal excise tax returns and all financial records supporting those returns for the prior three fiscal years are subject to examination by the federal and Delaware revenue authorities. Management has analyzed the Fund’s tax positions taken on federal, state, and foreign tax returns for all open tax years and does not believe that there are any uncertain tax positions that require recognition of a tax liability.
As of July 31, 2016, the Fund had a qualified late-year ordinary loss of $15,954,981 which was recognized on the first day of the current fiscal year.
Class allocations
The separate classes of shares offered by the Fund differ principally in applicable sales charges, distribution, shareholder servicing, and administration fees. Class specific expenses are charged directly to that share class. Investment income, common expenses, and realized and unrealized gains (losses) on investments are allocated daily to each class of shares based on the relative proportion of net assets of each class.
3. FAIR VALUATION MEASUREMENTS
Fair value measurements of investments are determined within a framework that has established a fair value hierarchy based upon the various data inputs utilized in determining the value of the Fund’s investments. The three-level hierarchy gives the highest priority to unadjusted quoted prices in active markets for identical assets or liabilities (Level 1) and the lowest priority to significant unobservable inputs (Level 3). The Fund’s investments are classified within the fair value hierarchy based on the lowest level of input that is significant to the fair value measurement. The inputs are summarized into three broad levels as follows:
| ∎ | | Level 1 – quoted prices in active markets for identical securities |
| ∎ | | Level 2 – other significant observable inputs (including quoted prices for similar securities, interest rates, prepayment speeds, credit risk, etc.) |
| ∎ | | Level 3 – significant unobservable inputs (including the Fund’s own assumptions in determining the fair value of investments) |
The inputs or methodologies used for valuing investments in securities are not necessarily an indication of the risk associated with investing in those securities.
| | | | |
| 22 | | Wells Fargo Growth Fund | | Notes to financial statements (unaudited) |
The following is a summary of the inputs used in valuing the Fund’s assets and liabilities as of January 31, 2017:
| | | | | | | | | | | | | | | | |
| | | Quoted prices
(Level 1) | | | Other significant
observable inputs
(Level 2) | | | Significant
unobservable inputs (Level 3) | | | Total | |
Assets | | | | | | | | | | | | | | | | |
Investments in: | | | | | | | | | | | | | | | | |
| | | | |
Common stocks | | | | | | | | | | | | | | | | |
Consumer discretionary | | $ | 715,614,209 | | | $ | 0 | | | $ | 0 | | | $ | 715,614,209 | |
Consumer staples | | | 143,215,800 | | | | 0 | | | | 0 | | | | 143,215,800 | |
Energy | | | 128,240,429 | | | | 0 | | | | 0 | | | | 128,240,429 | |
Financials | | | 252,178,690 | | | | 0 | | | | 0 | | | | 252,178,690 | |
Health care | | | 759,304,104 | | | | 0 | | | | 0 | | | | 759,304,104 | |
Industrials | | | 488,621,938 | | | | 0 | | | | 0 | | | | 488,621,938 | |
Information technology | | | 2,109,481,329 | | | | 0 | | | | 0 | | | | 2,109,481,329 | |
Materials | | | 168,321,178 | | | | 0 | | | | 0 | | | | 168,321,178 | |
Real estate | | | 11,180,759 | | | | 0 | | | | 0 | | | | 11,180,759 | |
| | | | |
Short-term investments | | | | | | | | | | | | | | | | |
Investment companies | | | 16,954,326 | | | | 0 | | | | 0 | | | | 16,954,326 | |
Investments measured at net asset value* | | | | | | | | | | | | | | | 87,382,939 | |
Total assets | | $ | 4,793,112,762 | | | $ | 0 | | | $ | 0 | | | $ | 4,880,495,701 | |
| * | Investments that are measured at fair value using the net asset value per share (or its equivalent) as a practical expedient have not been categorized in the fair value hierarchy. The fair value amount presented in the table is intended to permit reconciliation of the fair value hierarchy to the amounts presented in the Statement of Assets and Liabilities. The Fund’s investment in Securities Lending Cash Investments, LLC valued at $87,382,939 does not have a redemption period notice, can be redeemed daily and does not have any unfunded commitments. |
The Fund recognizes transfers between levels within the fair value hierarchy at the end of the reporting period. At January 31, 2017, the Fund did not have any transfers into/out of Level 1, Level 2, or Level 3.
4. TRANSACTIONS WITH AFFILIATES AND OTHER EXPENSES
Management fee
Funds Management, an indirect wholly owned subsidiary of Wells Fargo, is the manager of the Fund and provides advisory and fund-level administrative services under an investment management agreement. Under the investment management agreement, Funds Management is responsible for, among other services, implementing the investment objectives and strategies of the Fund, supervising the subadviser, providing fund-level administrative services in connection with the Fund’s operations, and providing any other fund-level administrative services reasonably necessary for the operation of the Fund. As compensation for its services under the investment management agreement, Funds Management is entitled to receive an annual management fee starting at 0.80% and declining to 0.555% as the average daily net assets of the Fund increase. For the six months ended January 31, 2017, the management fee was equivalent to an annual rate of 0.69% of the Fund’s average daily net assets.
Funds Management has retained the services of a subadviser to provide daily portfolio management to the Fund. The fee for subadvisory services is borne by Funds Management. WellsCap is the subadviser to the Fund and is entitled to receive a fee from Funds Management at an annual rate starting at 0.45% and declining to 0.30% as the average daily net assets of the Fund increase.
Administration fees
Under a class-level administration agreement, Funds Management provides class-level administrative services to the Fund, which includes paying fees and expenses for services provided by the transfer agent, sub-transfer agents, omnibus account servicers and record-keepers. As compensation for its services under the class-level administration agreement, Funds Management receives an annual fee which is calculated based on the average daily net assets of each class as follows:
| | | | |
| | | Class-level
administration fee | |
Class A, Class C | | | 0.21 | % |
Class R6 | | | 0.03 | |
Administrator Class, Institutional Class | | | 0.13 | |
| | | | | | |
| Notes to financial statements (unaudited) | | Wells Fargo Growth Fund | | | 23 | |
Funds Management has contractually waived and/or reimbursed management and administration fees to the extent necessary to maintain certain net operating expense ratios for the Fund. Waiver of fees and/or reimbursement of expenses by Funds Management were made first from fund level expenses on a proportionate basis and then from class specific expenses. Funds Management has committed through November 30, 2017 to waive fees and/or reimburse expenses to the extent necessary to cap the Fund’s expenses at 1.16% for Class A shares, 1.91% for Class C shares, 0.70% for Class R6 shares, 0.96% for Administrator Class shares, and 0.75% for Institutional Class shares. After this time, the cap may be increased or the commitment to maintain the cap may be terminated only with the approval of the Board of Trustees. Prior to December 1, 2016, the Fund’s expenses were capped at 1.21% for Class A shares and 1.96% for Class C shares.
During the six months ended January 31, 2017, State Street Bank and Trust Company, the Fund’s custodian, reimbursed the Fund $4,566 for certain out-of-pocket expenses that were billed to the Fund in error from 1998-2015. This amount is included in dividend income on the Statement of Operations. In addition, Funds Management was also reimbursed $3,058 for waivers/reimbursements it made to the Fund during the period the Fund was erroneously billed.
Distribution fee
The Trust has adopted a distribution plan for Class C shares of the Fund pursuant to Rule 12b-1 under the 1940 Act. A distribution fee is charged to Class C shares and paid to Wells Fargo Funds Distributor, LLC, the principal underwriter, at an annual rate of 0.75% of the average daily net assets of Class C shares.
In addition, Funds Distributor is entitled to receive the front-end sales charge from the purchase of Class A shares and a contingent deferred sales charge on the redemption of certain Class A shares. Funds Distributor is also entitled to receive the contingent deferred sales charges from redemptions of Class C shares. For the six months ended January 31, 2017, Funds Distributor received $7,704 from the sale of Class A shares and $1,082 in contingent deferred sales charges from redemptions of Class C shares.
Shareholder servicing fees
The Trust has entered into contracts with one or more shareholder servicing agents, whereby Class A, Class C, and Administrator Class of the Fund are charged a fee at an annual rate of 0.25% of the average daily net assets of each respective class.
A portion of these total shareholder servicing fees were paid to affiliates of Wells Fargo.
5. INVESTMENT PORTFOLIO TRANSACTIONS
Purchases and sales of investments, excluding U.S. government obligations (if any) and short-term securities, for the six months ended January 31, 2017 were $1,551,155,071 and $3,562,166,624, respectively.
The Fund may purchase or sell investment securities to other Wells Fargo funds under procedures adopted by the Board of Trustees. The procedures have been designed to ensure that these interfund transactions, which generally do not incur broker commissions, are effected at current market prices. Interfund trades are included within the respective purchases and sales amounts shown.
6. INVESTMENTS IN AFFILIATES
An affiliated investment is a company which is under common ownership or control of the Fund or which the Fund has ownership of at least 5% of the outstanding voting shares. The following is a summary of transactions for the long-term holdings of issuers that were either affiliates of the Fund at the beginning of the period or the end of the period.
| | | | | | | | | | | | | | | | | | | | | | | | | | | | |
| | | Shares, beginning
of period | | | Shares
purchased | | | Shares
sold | | | Shares, end of period | | | Value, end of
period | | | Income from
affiliated securities | | | Realized losses | |
Envestnet Incorporated | | | 2,909,831 | | | | 0 | | | | (635,190 | ) | | | 2,274,641 | | | $ | 85,981,430 | | | $ | 0 | �� | | $ | (4,503,980 | ) |
The Habit Restaurants Incorporated Class A | | | 1,299,600 | | | | 388,000 | | | | (170,950 | ) | | | 1,516,650 | | | | 21,991,425 | | | | 0 | | | | (1,153,501 | ) |
| | | | | | | | | | | | | | | | | | | | | | | $ | 0 | | | $ | (5,657,481 | ) |
7. BANK BORROWINGS
The Trust (excluding the money market funds and certain other funds) and Wells Fargo Variable Trust are parties to a $250,000,000 revolving credit agreement whereby the Fund is permitted to use bank borrowings for temporary or emergency purposes, such as to fund shareholder redemption requests. Interest under the credit agreement is charged
| | | | |
| 24 | | Wells Fargo Growth Fund | | Notes to financial statements (unaudited) |
to the Fund based on a borrowing rate equal to the higher of the Federal Funds rate in effect on that day plus 1.25% or the overnight LIBOR rate in effect on that day plus 1.25%. In addition, an annual commitment fee equal to 0.25% of the unused balance is allocated to each participating fund. Prior to August 30, 2016, the revolving credit agreement amount was $200,000,000 and the annual commitment fee was equal to 0.20% of the unused balance which was allocated to each participating fund.
For the six months ended January 31, 2017, there were no borrowings by the Fund under the agreement.
8. CONCENTRATION RISK
Concentration risks result from exposure to a limited number of sectors. A fund that invests a substantial portion of its assets in any sector may be more affected by changes in that sector than would be a fund whose investments are not heavily weighted in any sector.
9. INDEMNIFICATION
Under the Trust’s organizational documents, the officers and Trustees have been granted certain indemnification rights against certain liabilities that may arise out of performance of their duties to the Trust. Additionally, in the normal course of business, the Trust may enter into contracts with service providers that contain a variety of indemnification clauses. The Trust’s maximum exposure under these arrangements is dependent on future claims that may be made against the Fund and, therefore, cannot be estimated.
10. NEW ACCOUNTING PRONOUNCEMENT
In December 2016, the Financial Accounting Standards Board (“FASB”) issued Accounting Standard Update (“ASU”) No. 2016-19, Technical Corrections and Improvements. ASU 2016-19 includes an amendment to FASB ASC Topic 820, Fair Value Measurement which clarifies the difference between a valuation approach and a valuation technique. The amendment also requires an entity to disclose when there has been a change in either or both a valuation approach and/or a valuation technique. The disclosure requirements are effective for fiscal years and interim periods within those fiscal years beginning after December 15, 2016. Management is currently evaluating the potential impact of this new guidance to the financial statements.
11. REGULATORY CHANGES
In October 2016, the Securities and Exchange Commission (“SEC”) adopted new rules and forms and amended existing rules and forms (together, “final rules”) intended to modernize and enhance the reporting and disclosure of information by registered investment companies and to enhance liquidity risk management by open-end mutual funds and exchange-traded funds. The final rules will enhance the quality of information available to investors and will allow the SEC to more effectively collect and use data reported by funds. In part, the final rules amend Regulation S-X and require standardized, enhanced disclosure about derivatives in the Fund’s financial statements, as well as other amendments. The compliance date for the amendments to Regulation S-X is August 1, 2017 while the compliance date for the new form types is June 1, 2018 and the compliance date for the liquidity risk management program requirements is December 1, 2018. Management is currently assessing the potential impact of these enhancements and their impact on the financial statement disclosures and reporting requirements.
| | | | | | |
| Other information (unaudited) | | Wells Fargo Growth Fund | | | 25 | |
PROXY VOTING INFORMATION
A description of the policies and procedures that the Fund uses to determine how to vote proxies relating to portfolio securities is available, upon request, by calling 1-800-222-8222, visiting our website at wellsfargofunds.com, or visiting the SEC website at sec.gov. Information regarding how the Fund voted proxies relating to portfolio securities during the most recent 12-month period ended June 30 is available on the Fund’s website at wellsfargofunds.com or by visiting the SEC website at sec.gov.
PORTFOLIO HOLDINGS INFORMATION
The complete portfolio holdings for the Fund are publicly available monthly on the Fund’s website (wellsfargofunds.com), on a one-month delayed basis. In addition, top ten holdings information (excluding derivative positions) for the Fund is publicly available on the Fund’s website on a monthly, seven-day or more delayed basis. The Fund files its complete schedule of portfolio holdings with the SEC for the first and third quarters of each fiscal year on Form N-Q, which is available by visiting the SEC website at sec.gov. In addition, the Fund’s Form N-Q may be reviewed and copied at the SEC’s Public Reference Room in Washington, DC, and at regional offices in New York City, at 233 Broadway, and in Chicago, at 175 West Jackson Boulevard, Suite 900. Information about the Public Reference Room may be obtained by calling 1-800-SEC-0330.
| | | | |
| 26 | | Wells Fargo Growth Fund | | Other information (unaudited) |
BOARD OF TRUSTEES AND OFFICERS
Each of the Trustees and Officers1 listed in the table below acts in identical capacities for each fund in the Wells Fargo family of funds, which consists of 138 mutual funds comprising the Wells Fargo Funds Trust, Wells Fargo Variable Trust, Wells Fargo Master Trust and four closed-end funds (collectively the “Fund Complex”). This table should be read in conjunction with the Prospectus and the Statement of Additional Information2. The mailing address of each Trustee and Officer is 525 Market Street, 12th Floor, San Francisco, CA 94105. Each Trustee and Officer serves an indefinite term, however, each Trustee serves such term until reaching the mandatory retirement age established by the Trustees.
Independent Trustees
| | | | | | |
Name and year of birth | | Position held and length of service* | | Principal occupations during past five years or longer | | Current other public company or
investment company directorships |
| William R. Ebsworth (Born 1957) | | Trustee, since 2015 | | Retired. From 1984 to 2013, equities analyst, portfolio manager, research director and chief financial officer at Fidelity Management and Research Company in Boston, Tokyo, and Hong Kong and retired in 2013 as Chief Investment Officer of Fidelity Strategic Advisers, Inc. where he lead a team of investment professionals managing client assets. Prior thereto, Board member of Hong Kong Securities Clearing Co., Hong Kong Options Clearing Corp., the Thailand International Fund, Ltd., Fidelity Investments Life Insurance Company, and Empire Fidelity Investments Life Insurance Company. Board member of the Fonté Foundation (non-profit organization) and the Vincent Memorial Hospital Endowment (non-profit organization), where he serves on the Investment Committee and as a Chair of the Audit Committee. Mr. Ebsworth is a CFA® charterholder and an Adjunct Lecturer, Finance, at Babson College. | | Asset Allocation Trust |
Jane A. Freeman (Born 1953) | | Trustee, since 2015 | | Retired. From 2012 to 2014 and 1999 to 2008, Chief Financial Officer of Scientific Learning Corporation. From 2008 to 2012, Ms. Freeman provided consulting services related to strategic business projects. Prior to 1999, Portfolio Manager at Rockefeller & Co. and Scudder, Stevens & Clark. Board member of the Harding Loevner Funds from 1996 to 2014, serving as both Lead Independent Director and chair of the Audit Committee. Board member of the Russell Exchange Traded Funds Trust from 2011 to 2012 and the chair of the Audit Committee. Ms. Freeman is Chair of Taproot Foundation (non-profit organization), a Board Member of Ruth Bancroft Garden (non-profit organization) and an inactive chartered financial analyst. | | Asset Allocation Trust |
Peter G. Gordon** (Born 1942) | | Trustee, since 1998; Chairman, since 2005 | | Co-Founder, Retired Chairman, President and CEO of Crystal Geyser Water Company. Trustee Emeritus, Colby College. | | Asset Allocation Trust |
Isaiah Harris, Jr. (Born 1952) | | Trustee, since 2009 | | Retired. Chairman of the Board of CIGNA Corporation since 2009, and Director since 2005. From 2003 to 2011, Director of Deluxe Corporation. Prior thereto, President and CEO of BellSouth Advertising and Publishing Corp. from 2005 to 2007, President and CEO of BellSouth Enterprises from 2004 to 2005 and President of BellSouth Consumer Services from 2000 to 2003. Emeritus member of the Iowa State University Foundation Board of Governors. Emeritus Member of the Advisory Board of Iowa State University School of Business. Advisory Board Member, Palm Harbor Academy (charter school). Advisory Board Member, Child Evangelism Fellowship (non-profit). Mr. Harris is a certified public accountant (inactive status). | | CIGNA Corporation; Asset Allocation Trust |
Judith M. Johnson (Born 1949) | | Trustee, since 2008; Audit Committee Chairman, since 2008 | | Retired. Prior thereto, Chief Executive Officer and Chief Investment Officer of Minneapolis Employees Retirement Fund from 1996 to 2008. Ms. Johnson is an attorney, certified public accountant and a certified managerial accountant. | | Asset Allocation Trust |
David F. Larcker (Born 1950) | | Trustee, since 2009 | | James Irvin Miller Professor of Accounting at the Graduate School of Business, Stanford University, Director of the Corporate Governance Research Initiative and Senior Faculty of The Rock Center for Corporate Governance since 2006. From 2005 to 2008, Professor of Accounting at the Graduate School of Business, Stanford University. Prior thereto, Ernst & Young Professor of Accounting at The Wharton School, University of Pennsylvania from 1985 to 2005. | | Asset Allocation Trust |
| | | | | | |
| Other information (unaudited) | | Wells Fargo Growth Fund | | | 27 | |
| | | | | | |
Name and year of birth | | Position held and length of service* | | Principal occupations during past five years or longer | | Current other public company or
investment company directorships |
Olivia S. Mitchell (Born 1953) | | Trustee, since 2006 | | International Foundation of Employee Benefit Plans Professor, Wharton School of the University of Pennsylvania since 1993. Director of Wharton’s Pension Research Council and Boettner Center on Pensions & Retirement Research, and Research Associate at the National Bureau of Economic Research. Previously, Cornell University Professor from 1978 to 1993. | | Asset Allocation Trust |
Timothy J. Penny (Born 1951) | | Trustee, since 1996 | | President and Chief Executive Officer of Southern Minnesota Initiative Foundation, a non-profit organization, since 2007 and Senior Fellow at the Humphrey Institute Policy Forum at the University of Minnesota since 1995. Member of the Board of Trustees of NorthStar Education Finance, Inc., a non-profit organization, since 2007. | | Asset Allocation Trust |
Michael S. Scofield (Born 1943) | | Trustee, since 2010 | | Served on the Investment Company Institute’s Board of Governors and Executive Committee from 2008-2011 as well the Governing Council of the Independent Directors Council from 2006-2011 and the Independent Directors Council Executive Committee from 2008-2011. Chairman of the IDC from 2008-2010. Institutional Investor (Fund Directions) Trustee of Year in 2007. Trustee of the Evergreen Funds complex (and its predecessors) from 1984 to 2010. Chairman of the Evergreen Funds from 2000-2010. Former Trustee of the Mentor Funds. Retired Attorney, Law Offices of Michael S. Scofield. | | Asset Allocation Trust |
| * | Length of service dates reflect the Trustee’s commencement of service with the Trust’s predecessor entities, where applicable. |
| ** | Peter Gordon is expected to retire on December 31, 2017. |
Officers
| | | | | | |
Name and year of birth | | Position held and
length of service | | Principal occupations during past five years or longer | | |
Andrew Owen (Born 1960) | | President, since 2017 | | Executive Vice President of Wells Fargo Bank, N.A. and President of Wells Fargo & Company and Head of Affiliated Managers, Wells Fargo Asset Management, since 2014. Executive Vice President responsible for marketing, investments and product development for Wells Fargo Funds Management, LLC, from 2009 to 2014. | | |
Jeremy DePalma1 (Born 1974) | | Treasurer, since 2012 | | Senior Vice President of Wells Fargo Funds Management, LLC since 2009. Senior Vice President of Evergreen Investment Management Company, LLC from 2008 to 2010 and head of the Fund Reporting and Control Team within Fund Administration from 2005 to 2010. | | |
C. David Messman (Born 1960) | | Secretary, since 2000; Chief Legal Officer, since 2003 | | Senior Vice President and Secretary of Wells Fargo Funds Management, LLC since 2001. Assistant General Counsel of Wells Fargo Bank, N.A. since 2013 and Vice President and Managing Counsel of Wells Fargo Bank, N.A. from 1996 to 2013. | | |
Michael Whitaker (Born 1967) | | Chief Compliance Officer, since 2016 | | Executive Vice President of Wells Fargo Funds Management, LLC since 2016. Chief Compliance Officer of Fidelity’s Fixed Income Funds and Asset Allocation Funds from 2008 to 2016, Compliance Officer of FMR Co., Inc. from 2014 to 2016, Fidelity Investments Money Management, Inc. from 2014 to 2016, Fidelity Investments from 2007 to 2016. | | |
David Berardi (Born 1975) | | Assistant Treasurer, since 2009 | | Vice President of Wells Fargo Funds Management, LLC since 2009. Vice President of Evergreen Investment Management Company, LLC from 2008 to 2010. Manager of Fund Reporting and Control for Evergreen Investment Management Company, LLC from 2004 to 2010. | | |
| 1 | Jeremy DePalma acts as Treasurer of 69 funds and Assistant Treasurer of 69 funds in the Fund Complex. |
| 2 | The Statement of Additional Information includes additional information about the Trustees and is available, without charge, upon request, by calling 1-800-222-8222 or by visiting the website at wellsfargofunds.com. |
| | | | |
| 28 | | Wells Fargo Growth Fund | | List of abbreviations |
The following is a list of common abbreviations for terms and entities that may have appeared in this report.
| ACA | — ACA Financial Guaranty Corporation |
| ADR | — American depositary receipt |
| ADS | — American depositary shares |
| AGC | — Assured Guaranty Corporation |
| AGM | — Assured Guaranty Municipal |
| Ambac | — Ambac Financial Group Incorporated |
| AMT | — Alternative minimum tax |
| BAN | — Bond anticipation notes |
| BHAC | — Berkshire Hathaway Assurance Corporation |
| CAB | — Capital appreciation bond |
| CCAB | — Convertible capital appreciation bond |
| CDA | — Community Development Authority |
| CDO | — Collateralized debt obligation |
| DRIVER | — Derivative inverse tax-exempt receipts |
| DW&P | — Department of Water & Power |
| DWR | — Department of Water Resources |
| ECFA | — Educational & Cultural Facilities Authority |
| EDA | — Economic Development Authority |
| EDFA | — Economic Development Finance Authority |
| ETF | — Exchange-traded fund |
| FDIC | — Federal Deposit Insurance Corporation |
| FFCB | — Federal Farm Credit Banks |
| FGIC | — Financial Guaranty Insurance Corporation |
| FHA | — Federal Housing Administration |
| FHLB | — Federal Home Loan Bank |
| FHLMC | — Federal Home Loan Mortgage Corporation |
| FICO | — The Financing Corporation |
| FNMA | — Federal National Mortgage Association |
| GDR | — Global depositary receipt |
| GNMA | — Government National Mortgage Association |
| HCFR | — Healthcare facilities revenue |
| HEFA | — Health & Educational Facilities Authority |
| HEFAR | — Higher education facilities authority revenue |
| HFA | — Housing Finance Authority |
| HFFA | — Health Facilities Financing Authority |
| HUD | — Department of Housing and Urban Development |
| IDA | — Industrial Development Authority |
| IDAG | — Industrial Development Agency |
| KRW | — Republic of Korea won |
| LIBOR | — London Interbank Offered Rate |
| LIFER | — Long Inverse Floating Exempt Receipts |
| LLC | — Limited liability company |
| LLLP | — Limited liability limited partnership |
| LLP | — Limited liability partnership |
| MBIA | — Municipal Bond Insurance Association |
| MFHR | — Multifamily housing revenue |
| MSTR | — Municipal securities trust receipts |
| MUD | — Municipal Utility District |
| National | — National Public Finance Guarantee Corporation |
| PCFA | — Pollution Control Financing Authority |
| PCL | — Public Company Limited |
| PCR | — Pollution control revenue |
| PFA | — Public Finance Authority |
| PFFA | — Public Facilities Financing Authority |
| PFOTER | — Puttable floating option tax-exempt receipts |
| plc | — Public limited company |
| PUTTER | — Puttable tax-exempt receipts |
| R&D | — Research & development |
| Radian | — Radian Asset Assurance |
| RAN | — Revenue anticipation notes |
| RDA | — Redevelopment Authority |
| RDFA | — Redevelopment Finance Authority |
| REIT | — Real estate investment trust |
| ROC | — Reset option certificates |
| SAVRS | — Select auction variable rate securities |
| SBA | — Small Business Authority |
| SDR | — Swedish depositary receipt |
| SFHR | — Single-family housing revenue |
| SFMR | — Single-family mortgage revenue |
| SPA | — Standby purchase agreement |
| SPDR | — Standard & Poor’s Depositary Receipts |
| SPEAR | — Short Puttable Exempt Adjustable Receipts |
| STRIPS | — Separate trading of registered interest and |
| TAN | — Tax anticipation notes |
| TIPS | — Treasury inflation-protected securities |
| TRAN | — Tax revenue anticipation notes |
| TTFA | — Transportation Trust Fund Authority |
| TVA | — Tennessee Valley Authority |

For more information
More information about Wells Fargo Funds is available free upon request. To obtain literature, please write, email, visit the Fund’s website, or call:
Wells Fargo Funds
P.O. Box 8266
Boston, MA 02266-8266
Email: fundservice@wellsfargo.com
Website: wellsfargofunds.com
Individual investors: 1-800-222-8222
Retail investment professionals: 1-888-877-9275
Institutional investment professionals: 1-866-765-0778
This report and the financial statements contained herein are submitted for the general information of the shareholders of the Fund. If this report is used for promotional purposes, distribution of the report must be accompanied or preceded by a current prospectus. Before investing, please consider the investment objectives, risks, charges, and expenses of the investment. For a current prospectus and, if available, a summary prospectus, containing this information, call 1-800-222-8222 or visit the Fund’s website at wellsfargofunds.com. Read the prospectus carefully before you invest or send money.
Wells Fargo Asset Management (WFAM) is a trade name used by the asset management businesses of Wells Fargo & Company. Wells Fargo Funds Management, LLC, a wholly owned subsidiary of Wells Fargo & Company, provides investment advisory and administrative services for Wells Fargo Funds. Other affiliates of Wells Fargo & Company provide subadvisory and other services for the funds. The funds are distributed by Wells Fargo Funds Distributor, LLC, Member FINRA, an affiliate of Wells Fargo & Company. Neither Wells Fargo Funds Management nor Wells Fargo Funds Distributor has Fund customer accounts/assets, and neither provides investment advice/recommendations or acts as an investment advice fiduciary to any investor.
NOT FDIC INSURED ◾ NO BANK GUARANTEE ◾ MAY LOSE VALUE
© 2017 Wells Fargo Funds Management, LLC. All rights reserved.
| | |
 | | 301458 03-17 SA206/SAR206 01-17 |
Semi-Annual Report
January 31, 2017

Wells Fargo Intrinsic Value Fund


Reduce clutter. Save trees.
Sign up for electronic delivery of prospectuses and shareholder reports at wellsfargo.com/advantagedelivery
Contents
The views expressed and any forward-looking statements are as of January 31, 2017, unless otherwise noted, and are those of the Fund managers and/or Wells Fargo Funds Management, LLC. Discussions of individual securities, or the markets generally, or any Wells Fargo Fund are not intended as individual recommendations. Future events or results may vary significantly from those expressed in any forward-looking statements. The views expressed are subject to change at any time in response to changing circumstances in the market. Wells Fargo Funds Management, LLC and the Fund disclaim any obligation to publicly update or revise any views expressed or forward-looking statements.
NOT FDIC INSURED ◾ NO BANK GUARANTEE ◾ MAY LOSE VALUE
| | | | |
| 2 | | Wells Fargo Intrinsic Value Fund | | Letter to shareholders (unaudited) |

Andrew Owen
President
Wells Fargo Funds
U.S. and international stocks returned 5.96% and 4.16% for the six-month period, respectively; within fixed income, the Bloomberg Barclays U.S. Aggregate Bond Index3 returned -2.95%.
Dear Shareholder:
As the new president of Wells Fargo Funds now that Karla Rabusch is retiring from that position after nearly 14 years, I am pleased to offer you this semi-annual report for the Wells Fargo Intrinsic Value Fund for the six-month period that ended January 31, 2017. Despite heightened market volatility, global stocks delivered favorable results overall. U.S. and international stocks returned 5.96% and 4.16% for the six-month period, respectively, as measured by the S&P 500 Index1 and the MSCI ACWI ex USA Index (Net)2; within fixed income, the Bloomberg Barclays U.S. Aggregate Bond Index3 returned -2.95%.
In August–September 2016, global stocks delivered generally positive results; bonds’ interest rates remained historically low.
From August into early September 2016, U.S. and international stocks generally trended upward. Ever since the Great Recession, markets worldwide have been supported to varying degrees by accommodative policies from leading central banks, including the Federal Reserve (Fed), European Central Bank, Bank of England, and Bank of Japan. As a result, investors have watched closely for any signs that global central banks might tighten their measures. In the U.S., early-September comments by several Fed officials appeared to suggest a September interest-rate increase, which sent stock and bond prices downward. However, stocks surged following the Fed’s September 20 meeting on news that the Fed had decided to delay a rate increase to later in 2016. In bond markets, interest rates remained at historically low levels as a result of easy monetary policies, subdued global growth, and modest inflation expectations. Yields rose, after bottoming in July, as market participants felt that yields had overshot the real risks of the U.K.’s Brexit vote and as economic activity strengthened. At the front end of the yield curve, anticipation of new money market fund rules resulted in significantly higher yields on many short-term securities.
During the fourth quarter of 2016, prospects for faster growth and higher interest rates in the U.S. largely influenced the markets.
Early in the fourth quarter of 2016, U.S. stocks tended to trade lower amid concerns such as a likely interest-rate increase and uncertainty over the approaching general election. However, following Donald Trump’s election as president in early November, U.S. stocks began to rally. Investors appeared optimistic that the new administration would usher in a series of pro-growth policies, and supportive economic news helped the rally carry through the quarter. The buoyant environment sent interest rates higher as well. At its mid-December meeting, Fed officials raised their short-term target interest rate for the first time in a year, by a quarter percentage point, to between 0.50% and 0.75%. The fourth quarter also saw the implementation of the Securities and Exchange Commission’s new rules for money market funds, which included floating net asset values (NAVs) for institutional prime and municipal money market funds as well as liquidity fees and redemption gates. In the year leading up to
| 1 | The S&P 500 Index consists of 500 stocks chosen for market size, liquidity, and industry group representation. It is a market-value-weighted index with each stock’s weight in the index proportionate to its market value. You cannot invest directly in an index. |
| 2 | The Morgan Stanley Capital International (MSCI) All Country World Index (ACWI) ex USA Index (Net) is a free-float-adjusted market-capitalization-weighted index that is designed to measure the equity market performance of developed markets, excluding the United States and Canada. Source: MSCI. MSCI makes no express or implied warranties or representations and shall have no liability whatsoever with respect to any MSCI data contained herein. The MSCI data may not be further redistributed or used as a basis for other indexes or any securities or financial products. This report is not approved, reviewed, or produced by MSCI. You cannot invest directly in an index. |
| 3 | The Bloomberg Barclays U.S. Aggregate Bond Index (formerly known as Barclays U.S. Aggregate Bond Index) is a broad-based benchmark that measures the investment-grade, U.S. dollar–denominated, fixed-rate taxable bond market, including Treasuries, government-related and corporate securities, mortgage-backed securities (agency fixed-rate and hybrid adjustable-rate mortgage pass-throughs), asset-backed securities, and commercial mortgage-backed securities. You cannot invest directly in an index. |
| | | | | | |
| Letter to shareholders (unaudited) | | Wells Fargo Intrinsic Value Fund | | | 3 | |
money fund reform implementation, nearly $1 trillion in assets moved from these types of money market funds into government money market funds, which continued to transact at a stable $1 NAV. Outside of the U.S., the prospects for faster U.S. growth appeared to trigger some acceleration in Europe. The improvement may be partly attributable to expectations for further strengthening of the U.S. dollar, which in turn could improve demand for European goods in the U.S. due to weakening of the euro relative to the dollar.
Investor optimism continued into January 2017.
January brought continued strength in global stock markets. Markets were lifted by factors such as strong trade data from Japan, robust earnings reports by businesses, and investors’ hopes that the U.S. government will approve a large fiscal stimulus package.
Don’t let short-term uncertainty derail long-term investment goals.
Periods of uncertainty can present challenges, but experience has taught us that maintaining long-term investment goals can be an effective way to plan for the future. To help you create a sound strategy based on your personal goals and risk tolerance, Wells Fargo Funds offers more than 100 mutual funds spanning a wide range of asset classes and investment styles. Although diversification cannot guarantee an investment profit or prevent losses, we believe it can be an effective way to manage investment risk and potentially smooth out overall portfolio performance. We encourage investors to know their investments and to understand that appropriate levels of risk-taking may unlock opportunities.
Thank you for choosing to invest in Wells Fargo Funds. We appreciate your confidence in us and remain committed to helping you meet your financial needs.
Sincerely,

Andrew Owen
President
Wells Fargo Funds
Although diversification cannot guarantee an investment profit or prevent losses, we believe it can be an effective way to manage investment risk and potentially smooth out overall portfolio performance.
For further information about your Fund, contact your investment professional, visit our website at wellsfargofunds.com, or call us directly at 1-800-222-8222. We are available 24 hours a day, 7 days a week.
| | | | |
| 4 | | Wells Fargo Intrinsic Value Fund | | Performance highlights (unaudited) |
Investment objective
The Fund seeks long-term capital appreciation.
Manager
Wells Fargo Funds Management, LLC
Subadviser
Wells Capital Management Incorporated
Portfolio managers
Miguel E. Giaconi, CFA®
Jean-Baptiste Nadal, CFA®
Jeffrey Peck
Average annual total returns (%) as of January 31, 20171
| | | | | | | | | | | | | | | | | | | | | | | | | | | | | | | | | | |
| | | | | Including sales charge | | | Excluding sales charge | | | Expense ratios2 (%) | |
| | | Inception date | | 1 year | | | 5 year | | | 10 year | | | 1 year | | | 5 year | | | 10 year | | | Gross | | | Net3 | |
| Class A (EIVAX) | | 8-1-2006 | | | 9.51 | | | | 10.61 | | | | 6.05 | | | | 16.20 | | | | 11.93 | | | | 6.68 | | | | 1.18 | | | | 1.11 | |
| Class B (EIVBX)* | | 8-1-2006 | | | 10.23 | | | | 10.80 | | | | 6.10 | | | | 15.23 | | | | 11.06 | | | | 6.10 | | | | 1.93 | | | | 1.86 | |
| Class C (EIVCX) | | 8-1-2006 | | | 14.36 | | | | 11.07 | | | | 5.87 | | | | 15.36 | | | | 11.07 | | | | 5.87 | | | | 1.93 | | | | 1.86 | |
| Class R (EIVTX) | | 3-1-2013 | | | – | | | | – | | | | – | | | | 15.89 | | | | 11.68 | | | | 6.43 | | | | 1.43 | | | | 1.36 | |
| Class R4 (EIVRX) | | 11-30-2012 | | | – | | | | – | | | | – | | | | 16.47 | | | | 12.30 | | | | 6.99 | | | | 0.90 | | | | 0.80 | |
| Class R6 (EIVFX) | | 11-30-2012 | | | – | | | | – | | | | – | | | | 16.67 | | | | 12.34 | | | | 7.01 | | | | 0.75 | | | | 0.65 | |
| Administrator Class (EIVDX) | | 7-30-2010 | | | – | | | | – | | | | – | | | | 16.30 | | | | 12.13 | | | | 6.86 | | | | 1.10 | | | | 0.95 | |
| Institutional Class (EIVIX) | | 8-1-2006 | | | – | | | | – | | | | – | | | | 16.59 | | | | 12.39 | | | | 7.03 | | | | 0.85 | | | | 0.70 | |
| Russell 1000® Value Index4 | | – | | | – | | | | – | | | | – | | | | 24.62 | | | | 14.11 | | | | 5.66 | | | | – | | | | – | |
| * | | Class B shares are closed to investment, except in connection with the reinvestment of any distributions and permitted exchanges. |
Figures quoted represent past performance, which is no guarantee of future results, and do not reflect taxes that a shareholder may pay on fund distributions or the redemption of fund shares. Investment return and principal value of an investment will fluctuate so that an investor’s shares, when redeemed, may be worth more or less than their original cost. Performance shown without sales charges would be lower if sales charges were reflected. Current performance may be lower or higher than the performance data quoted, which assumes the reinvestment of dividends and capital gains. Current month-end performance is available on the Fund’s website, wellsfargofunds.com.
Index returns do not include transaction costs associated with buying and selling securities, any mutual fund fees or expenses, or any taxes. It is not possible to invest directly in an index.
For Class A shares, the maximum front-end sales charge is 5.75%. Flor Class B shares, the maximum contingent deferred sales charges is 5.00%. For Class C shares, the maximum contingent deferred sales charge is 1.00%. Performance including a contingent deferred sales charge assumes the sales charge for the corresponding time period. Class R, Class R4, Class R6, Administrator Class, and Institutional Class shares are sold without a front-end sales charge or contingent deferred sales charge.
Stock values fluctuate in response to the activities of individual companies and general market and economic conditions. Certain investment strategies tend to increase the total risk of an investment (relative to the broader market). The Fund is exposed to foreign investment risk and focused portfolio risk. Consult the Fund’s prospectus for additional information on these and other risks.
Please see footnotes on page 5.
| | | | | | |
| Performance highlights (unaudited) | | Wells Fargo Intrinsic Value Fund | | | 5 | |
| | | | |
| Ten largest holdings (%) as of January 31, 20175 | |
US Bancorp | | | 3.30 | |
EOG Resources Incorporated | | | 3.22 | |
Microsoft Corporation | | | 3.17 | |
Alphabet Incorporated Class C | | | 3.03 | |
The Allstate Corporation | | | 3.02 | |
Vulcan Materials Company | | | 2.96 | |
Motorola Solutions Incorporated | | | 2.90 | |
AerCap Holdings NV | | | 2.89 | |
Comcast Corporation Class A | | | 2.78 | |
Honeywell International Incorporated | | | 2.71 | |
|
| Sector distribution as of January 31, 20176 |
|
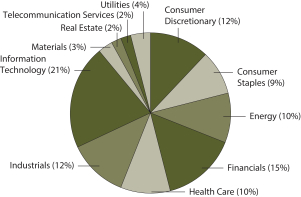 |
| 1 | Historical performance shown for Class R shares prior to their inception reflects the performance of Institutional Class shares, adjusted to reflect the higher expenses applicable to Class R shares. Historical performance shown for Class R4 shares prior to their inception reflects the performance of Institutional Class shares, adjusted to reflect the higher expenses applicable to Class R4 shares. Historical performance shown for Class R6 shares prior to their inception reflects the performance of Institutional Class shares, and includes the higher expenses applicable to Institutional Class shares. If these expenses had not been included, returns would be higher. Historical performance shown for Administrator Class shares prior to their inception reflects the performance of Institutional Class shares, adjusted to reflect the higher expenses applicable to Administrator Class shares. Historical performance shown for all classes of the Fund prior to July 19, 2010, is based on the performance of the Fund’s predecessor, Evergreen Intrinsic Value Fund. |
| 2 | Reflects the expense ratios as stated in the most recent prospectuses. The expense ratios shown are subject to change and may differ from the annualized expense ratios shown in the financial highlights of this report. |
| 3 | The manager has contractually committed through November 30, 2017, to waive fees and/or reimburse expenses to the extent necessary to cap the Fund’s Total Annual Fund Operating Expenses After Fee Waiver at the amounts shown. After this time, the cap may be increased or the commitment to maintain the cap may be terminated only with the approval of the Board of Trustees. Brokerage commissions, stamp duty fees, interest, taxes, acquired fund fees and expenses, and extraordinary expenses are excluded from the expense cap. Without this cap, the Fund’s returns would have been lower. |
| 4 | The Russell 1000® Value Index measures the performance of those Russell 1000 companies with lower price-to-book ratios and lower forecasted growth values. You cannot invest directly in an index. |
| 5 | The ten largest holdings, excluding cash and cash equivalents, are calculated based on the value of the investments divided by total net assets of the Fund. Holdings are subject to change and may have changed since the date specified. |
| 6 | Amounts are calculated based on the total long-term investments of the Fund. These amounts are subject to change and may have changed since the date specified. |
| | | | |
| 6 | | Wells Fargo Intrinsic Value Fund | | Fund expenses (unaudited) |
As a shareholder of the Fund, you incur two types of costs: (1) transaction costs, including sales charges (loads) on purchase payments and contingent deferred sales charges (if any) on redemptions and (2) ongoing costs, including management fees, distribution (12b-1) and/or shareholder servicing fees, and other Fund expenses. This example is intended to help you understand your ongoing costs (in dollars) of investing in the Fund and to compare these costs with the ongoing costs of investing in other mutual funds.
The example is based on an investment of $1,000 invested at the beginning of the six-month period and held for the entire period from August 1, 2016 to January 31, 2017.
Actual expenses
The “Actual” line of the table below provides information about actual account values and actual expenses. You may use the information in this line, together with the amount you invested, to estimate the expenses that you paid over the period. Simply divide your account value by $1,000 (for example, an $8,600 account value divided by $1,000 = 8.6), then multiply the result by the number in the “Actual” line under the heading entitled “Expenses paid during period” for your applicable class of shares to estimate the expenses you paid on your account during this period.
Hypothetical example for comparison purposes
The “Hypothetical” line of the table below provides information about hypothetical account values and hypothetical expenses based on the Fund’s actual expense ratio and an assumed rate of return of 5% per year before expenses, which is not the Fund’s actual return. The hypothetical account values and expenses may not be used to estimate the actual ending account balance or expenses you paid for the period. You may use this information to compare the ongoing costs of investing in the Fund and other funds. To do so, compare this 5% hypothetical example with the 5% hypothetical examples that appear in the shareholder reports of the other funds.
Please note that the expenses shown in the table are meant to highlight your ongoing costs only and do not reflect any transactional costs, such as sales charges (loads) and contingent deferred sales charges. Therefore, the “Hypothetical” line of the table is useful in comparing ongoing costs only and will not help you determine the relative total costs of owning different funds. In addition, if these transactional costs were included, your costs would have been higher.
| | | | | | | | | | | | | | | | |
| | | Beginning
account value
8-1-2016 | | | Ending
account value
1-31-2017 | | | Expenses
paid during
the period¹ | | | Annualized net
expense ratio | |
Class A | | | | | | | | | | | | | | | | |
Actual | | $ | 1,000.00 | | | $ | 1,059.41 | | | $ | 5.69 | | | | 1.10 | % |
Hypothetical (5% return before expenses) | | $ | 1,000.00 | | | $ | 1,019.61 | | | $ | 5.58 | | | | 1.10 | % |
Class B | | | | | | | | | | | | | | | | |
Actual | | $ | 1,000.00 | | | $ | 1,055.02 | | | $ | 9.61 | | | | 1.86 | % |
Hypothetical (5% return before expenses) | | $ | 1,000.00 | | | $ | 1,015.79 | | | $ | 9.42 | | | | 1.86 | % |
Class C | | | | | | | | | | | | | | | | |
Actual | | $ | 1,000.00 | | | $ | 1,055.38 | | | $ | 9.61 | | | | 1.86 | % |
Hypothetical (5% return before expenses) | | $ | 1,000.00 | | | $ | 1,015.79 | | | $ | 9.42 | | | | 1.86 | % |
Class R | | | | | | | | | | | | | | | | |
Actual | | $ | 1,000.00 | | | $ | 1,058.22 | | | $ | 7.04 | | | | 1.36 | % |
Hypothetical (5% return before expenses) | | $ | 1,000.00 | | | $ | 1,018.30 | | | $ | 6.90 | | | | 1.36 | % |
Class R4 | | | | | | | | | | | | | | | | |
Actual | | $ | 1,000.00 | | | $ | 1,060.40 | | | $ | 4.14 | | | | 0.80 | % |
Hypothetical (5% return before expenses) | | $ | 1,000.00 | | | $ | 1,021.11 | | | $ | 4.06 | | | | 0.80 | % |
Class R6 | | | | | | | | | | | | | | | | |
Actual | | $ | 1,000.00 | | | $ | 1,061.80 | | | $ | 3.37 | | | | 0.65 | % |
Hypothetical (5% return before expenses) | | $ | 1,000.00 | | | $ | 1,021.87 | | | $ | 3.30 | | | | 0.65 | % |
Administrator Class | | | | | | | | | | | | | | | | |
Actual | | $ | 1,000.00 | | | $ | 1,059.79 | | | $ | 4.92 | | | | 0.95 | % |
Hypothetical (5% return before expenses) | | $ | 1,000.00 | | | $ | 1,020.36 | | | $ | 4.82 | | | | 0.95 | % |
Institutional Class | | | | | | | | | | | | | | | | |
Actual | | $ | 1,000.00 | | | $ | 1,060.67 | | | $ | 3.63 | | | | 0.70 | % |
Hypothetical (5% return before expenses) | | $ | 1,000.00 | | | $ | 1,021.62 | | | $ | 3.56 | | | | 0.70 | % |
| 1 | Expenses paid is equal to the annualized net expense ratio of each class multiplied by the average account value over the period, multiplied by the number of days in the most recent fiscal half-year divided by the number of days in the fiscal year (to reflect the one-half-year period). |
| | | | | | |
| Portfolio of investments—January 31, 2017 (unaudited) | | Wells Fargo Intrinsic Value Fund | | | 7 | |
| | | | | | | | | | | | | | | | |
| Security name | | | | | | | | Shares | | | Value | |
| | | | |
Common Stocks: 98.57% | | | | | | | | | | | | | | | | |
| | | | |
Consumer Discretionary: 11.43% | | | | | | | | | | | | | | | | |
| | | | |
| Media: 4.84% | | | | | | | | | | | | | | | | |
Comcast Corporation Class A | | | | | | | | | | | 348,900 | | | $ | 26,314,038 | |
The Walt Disney Company | | | | | | | | | | | 176,400 | | | | 19,518,660 | |
| | | | |
| | | | | | | | | | | | | | | 45,832,698 | |
| | | | | | | | | | | | | | | | |
| | | | |
| Specialty Retail: 4.20% | | | | | | | | | | | | | | | | |
Advance Auto Parts Incorporated | | | | | | | | | | | 91,400 | | | | 15,011,536 | |
The TJX Companies Incorporated | | | | | | | | | | | 329,600 | | | | 24,693,632 | |
| | | | |
| | | | | | | | | | | | | | | 39,705,168 | |
| | | | | | | | | | | | | | | | |
| | | | |
| Textiles, Apparel & Luxury Goods: 2.39% | | | | | | | | | | | | | | | | |
Nike Incorporated Class B | | | | | | | | | | | 427,800 | | | | 22,630,620 | |
| | | | | | | | | | | | | | | | |
| | | | |
Consumer Staples: 8.84% | | | | | | | | | | | | | | | | |
| | | | |
| Beverages: 3.89% | | | | | | | | | | | | | | | | |
Anheuser-Busch InBev NV ADR « | | | | | | | | | | | 199,500 | | | | 20,799,870 | |
PepsiCo Incorporated | | | | | | | | | | | 154,319 | | | | 16,015,226 | |
| | | | |
| | | | | | | | | | | | | | | 36,815,096 | |
| | | | | | | | | | | | | | | | |
| | | | |
| Food Products: 4.95% | | | | | | | | | | | | | | | | |
Mondelez International Incorporated Class A | | | | | | | | | | | 514,600 | | | | 22,786,488 | |
Nestle SA ADR | | | | | | | | | | | 274,300 | | | | 20,084,246 | |
TreeHouse Foods Incorporated † | | | | | | | | | | | 52,556 | | | | 3,987,949 | |
| | | | |
| | | | | | | | | | | | | | | 46,858,683 | |
| | | | | | | | | | | | | | | | |
| | | | |
Energy: 9.63% | | | | | | | | | | | | | | | | |
| | | | |
| Energy Equipment & Services: 3.37% | | | | | | | | | | | | | | | | |
Schlumberger Limited | | | | | | | | | | | 221,500 | | | | 18,541,765 | |
TechnipFMC plc Ǡ | | | | | | | | | | | 398,600 | | | | 13,400,932 | |
| | | | |
| | | | | | | | | | | | | | | 31,942,697 | |
| | | | | | | | | | | | | | | | |
| | | | |
| Oil, Gas & Consumable Fuels: 6.26% | | | | | | | | | | | | | | | | |
Concho Resources Incorporated † | | | | | | | | | | | 66,520 | | | | 9,275,549 | |
EOG Resources Incorporated | | | | | | | | | | | 299,900 | | | | 30,463,842 | |
Royal Dutch Shell plc ADR Class A | | | | | | | | | | | 358,300 | | | | 19,487,937 | |
| | | | |
| | | | | | | | | | | | | | | 59,227,328 | |
| | | | | | | | | | | | | | | | |
| | | | |
Financials: 14.74% | | | | | | | | | | | | | | | | |
| | | | |
| Banks: 8.05% | | | | | | | | | | | | | | | | |
BB&T Corporation | | | | | | | | | | | 540,700 | | | | 24,974,933 | |
CIT Group Incorporated | | | | | | | | | | | 485,800 | | | | 20,010,102 | |
US Bancorp | | | | | | | | | | | 592,700 | | | | 31,205,655 | |
| | | | |
| | | | | | | | | | | | | | | 76,190,690 | |
| | | | | | | | | | | | | | | | |
The accompanying notes are an integral part of these financial statements.
| | | | |
| 8 | | Wells Fargo Intrinsic Value Fund | | Portfolio of investments—January 31, 2017 (unaudited) |
| | | | | | | | | | | | | | | | |
| Security name | | | | | | | | Shares | | | Value | |
| | | | |
| Capital Markets: 1.41% | | | | | | | | | | | | | | | | |
UBS Group AG « | | | | | | | | | | | 828,000 | | | $ | 13,339,080 | |
| | | | | | | | | | | | | | | | |
| | | | |
| Consumer Finance: 2.27% | | | | | | | | | | | | | | | | |
Synchrony Financial | | | | | | | | | | | 599,200 | | | | 21,463,344 | |
| | | | | | | | | | | | | | | | |
| | | | |
| Insurance: 3.01% | | | | | | | | | | | | | | | | |
The Allstate Corporation | | | | | | | | | | | 379,500 | | | | 28,542,195 | |
| | | | | | | | | | | | | | | | |
| | | | |
Health Care: 10.03% | | | | | | | | | | | | | | | | |
| | | | |
| Biotechnology: 2.15% | | | | | | | | | | | | | | | | |
Gilead Sciences Incorporated | | | | | | | | | | | 280,700 | | | | 20,336,715 | |
| | | | | | | | | | | | | | | | |
| | | | |
| Health Care Equipment & Supplies: 1.79% | | | | | | | | | | | | | | | | |
Abbott Laboratories | | | | | | | | | | | 405,700 | | | | 16,946,089 | |
| | | | | | | | | | | | | | | | |
| | | | |
| Health Care Providers & Services: 2.30% | | | | | | | | | | | | | | | | |
Cigna Corporation | | | | | | | | | | | 148,600 | | | | 21,728,292 | |
| | | | | | | | | | | | | | | | |
| | | | |
| Pharmaceuticals: 3.79% | | | | | | | | | | | | | | | | |
Eli Lilly & Company | | | | | | | | | | | 168,869 | | | | 13,007,979 | |
Merck & Company Incorporated | | | | | | | | | | | 369,200 | | | | 22,886,708 | |
| | | | |
| | | | | | | | | | | | | | | 35,894,687 | |
| | | | | | | | | | | | | | | | |
| | | | |
Industrials: 11.59% | | | | | | | | | | | | | | | | |
| | | | |
| Aerospace & Defense: 2.32% | | | | | | | | | | | | | | | | |
General Dynamics Corporation | | | | | | | | | | | 15,545 | | | | 2,800,256 | |
Lockheed Martin Corporation | | | | | | | | | | | 76,055 | | | | 19,114,903 | |
| | | | |
| | | | | | | | | | | | | | | 21,915,159 | |
| | | | | | | | | | | | | | | | |
| | | | |
| Air Freight & Logistics: 1.50% | | | | | | | | | | | | | | | | |
United Parcel Service Incorporated Class B | | | | | | | | | | | 130,400 | | | | 14,230,552 | |
| | | | | | | | | | | | | | | | |
| | | | |
| Electrical Equipment: 2.18% | | | | | | | | | | | | | | | | |
Sensata Technologies Holding NV † | | | | | | | | | | | 490,900 | | | | 20,593,255 | |
| | | | | | | | | | | | | | | | |
| | | | |
| Industrial Conglomerates: 2.70% | | | | | | | | | | | | | | | | |
Honeywell International Incorporated | | | | | | | | | | | 216,400 | | | | 25,604,448 | |
| | | | | | | | | | | | | | | | |
| | | | |
| Trading Companies & Distributors: 2.89% | | | | | | | | | | | | | | | | |
AerCap Holdings NV † | | | | | | | | | | | 617,100 | | | | 27,319,017 | |
| | | | | | | | | | | | | | | | |
| | | | |
Information Technology: 20.22% | | | | | | | | | | | | | | | | |
| | | | |
| Communications Equipment: 5.17% | | | | | | | | | | | | | | | | |
Cisco Systems Incorporated | | | | | | | | | | | 700,100 | | | | 21,507,072 | |
Motorola Solutions Incorporated | | | | | | | | | | | 340,200 | | | | 27,457,542 | |
| | | | |
| | | | | | | | | | | | | | | 48,964,614 | |
| | | | | | | | | | | | | | | | |
| | | | |
| Internet Software & Services: 3.03% | | | | | | | | | | | | | | | | |
Alphabet Incorporated Class C † | | | | | | | | | | | 36,000 | | | | 28,684,440 | |
| | | | | | | | | | | | | | | | |
The accompanying notes are an integral part of these financial statements.
| | | | | | |
| Portfolio of investments—January 31, 2017 (unaudited) | | Wells Fargo Intrinsic Value Fund | | | 9 | |
| | | | | | | | | | | | | | | | |
| Security name | | | | | | | | Shares | | | Value | |
| | | | |
| IT Services: 4.82% | | | | | | | | | | | | | | | | |
Accenture plc Class A | | | | | | | | | | | 219,500 | | | $ | 24,994,465 | |
The Western Union Company | | | | | | | | | | | 1,052,500 | | | | 20,607,950 | |
| | | | |
| | | | | | | | | | | | | | | 45,602,415 | |
| | | | | | | | | | | | | | | | |
| | | | |
| Software: 5.23% | | | | | | | | | | | | | | | | |
Microsoft Corporation | | | | | | | | | | | 463,800 | | | | 29,984,670 | |
Oracle Corporation | | | | | | | | | | | 485,200 | | | | 19,461,372 | |
| | | | |
| | | | | | | | | | | | | | | 49,446,042 | |
| | | | | | | | | | | | | | | | |
| | | | |
| Technology Hardware, Storage & Peripherals: 1.97% | | | | | | | | | | | | | | | | |
Apple Incorporated | | | | | | | | | | | 153,500 | | | | 18,627,225 | |
| | | | | | | | | | | | | | | | |
| | | | |
Materials: 2.96% | | | | | | | | | | | | | | | | |
| | | | |
| Construction Materials: 2.96% | | | | | | | | | | | | | | | | |
Vulcan Materials Company | | | | | | | | | | | 218,200 | | | | 28,001,606 | |
| | | | | | | | | | | | | | | | |
| | | | |
Real Estate: 2.66% | | | | | | | | | | | | | | | | |
| | | | |
| Equity REITs: 2.66% | | | | | | | | | | | | | | | | |
Crown Castle International Corporation | | | | | | | | | | | 287,000 | | | | 25,207,210 | |
| | | | | | | | | | | | | | | | |
| | | | |
Telecommunication Services: 1.87% | | | | | | | | | | | | | | | | |
| | | | |
| Diversified Telecommunication Services: 1.87% | | | | | | | | | | | | | | | | |
Verizon Communications Incorporated | | | | | | | | | | | 361,739 | | | | 17,728,828 | |
| | | | | | | | | | | | | | | | |
| | | | |
Utilities: 4.60% | | | | | | | | | | | | | | | | |
| | | | |
| Electric Utilities: 2.70% | | | | | | | | | | | | | | | | |
NextEra Energy Incorporated | | | | | | | | | | | 206,000 | | | | 25,486,320 | |
| | | | | | | | | | | | | | | | |
| | | | |
| Multi-Utilities: 1.90% | | | | | | | | | | | | | | | | |
WEC Energy Group Incorporated | | | | | | | | | | | 304,800 | | | | 17,998,440 | |
| | | | | | | | | | | | | | | | |
| | | | |
Total Common Stocks (Cost $774,237,632) | | | | | | | | | | | | | | | 932,862,953 | |
| | | | | | | | | | | | | | | | |
| | | | |
| | | Yield | | | | | | | | | | |
| Short-Term Investments: 3.95% | | | | | | | | | | | | | | | | |
| | | | |
| Investment Companies: 3.95% | | | | | | | | | | | | | | | | |
Securities Lending Cash Investment LLC (l)(r)(u) | | | 0.86 | % | | | | | | | 25,818,719 | | | | 25,821,301 | |
Wells Fargo Government Money Market Fund Select Class (l)(u) | | | 0.46 | | | | | | | | 11,602,239 | | | | 11,602,239 | |
| | | | |
Total Short-Term Investments (Cost $37,423,512) | | | | | | | | | | | | | | | 37,423,540 | |
| | | | | | | | | | | | | | | | |
| | | | | | | | |
| Total investments in securities (Cost $811,661,144) * | | | 102.52 | % | | | 970,286,493 | |
Other assets and liabilities, net | | | (2.52 | ) | | | (23,890,230 | ) |
| | | | | | | | |
| Total net assets | | | 100.00 | % | | $ | 946,396,263 | |
| | | | | | | | |
The accompanying notes are an integral part of these financial statements.
| | | | |
| 10 | | Wells Fargo Intrinsic Value Fund | | Portfolio of investments—January 31, 2017 (unaudited) |
| « | All or a portion of this security is on loan. |
| † | Non-income-earning security |
| (l) | The issuer of the security is an affiliated person of the Fund as defined in the Investment Company Act of 1940. |
| (r) | The rate represents the 7-day annualized yield at period end. |
| (u) | The investment is a non-registered investment vehicle purchased with cash collateral received from securities on loan. |
| * | Cost for federal income tax purposes is $811,718,966 and unrealized gains (losses) consists of: |
| | | | |
Gross unrealized gains | | $ | 169,767,798 | |
Gross unrealized losses | | | (11,200,271 | ) |
| | | | |
Net unrealized gains | | $ | 158,567,527 | |
The accompanying notes are an integral part of these financial statements.
| | | | | | |
| Statement of assets and liabilities—January 31, 2017 (unaudited) | | Wells Fargo Intrinsic Value Fund | | | 11 | |
| | | | |
| | | | |
| |
Assets | | | | |
Investments | | | | |
In unaffiliated securities (including $25,217,583 of securities on loan), at value (cost $774,237,632) | | $ | 932,862,953 | |
In affiliated securities, at value (cost $37,423,512) | | | 37,423,540 | |
| | | | |
Total investments, at value (cost $811,661,144) | | | 970,286,493 | |
Receivable for investments sold | | | 8,181,655 | |
Receivable for Fund shares sold | | | 35,163 | |
Receivable for dividends | | | 554,813 | |
Receivable for securities lending income | | | 3,857 | |
Prepaid expenses and other assets | | | 79,351 | |
| | | | |
Total assets | | | 979,141,332 | |
| | | | |
| |
Liabilities | | | | |
Payable for investments purchased | | | 4,598,007 | |
Payable for Fund shares redeemed | | | 1,342,143 | |
Payable upon receipt of securities loaned | | | 25,820,100 | |
Management fee payable | | | 457,816 | |
Distribution fees payable | | | 16,500 | |
Administration fees payable | | | 127,892 | |
Accrued expenses and other liabilities | | | 382,611 | |
| | | | |
Total liabilities | | | 32,745,069 | |
| | | | |
Total net assets | | $ | 946,396,263 | |
| | | | |
| |
NET ASSETS CONSIST OF | | | | |
Paid-in capital | | $ | 782,367,710 | |
Overdistributed net investment income | | | (635,894 | ) |
Accumulated net realized gains on investments | | | 6,039,098 | |
Net unrealized gains on investments | | | 158,625,349 | |
| | | | |
Total net assets | | $ | 946,396,263 | |
| | | | |
| |
COMPUTATION OF NET ASSET VALUE AND OFFERING PRICE PER SHARE | | | | |
Net assets – Class A | | $ | 299,838,170 | |
Shares outstanding – Class A1 | | | 25,482,211 | |
Net asset value per share – Class A | | | $11.77 | |
Maximum offering price per share – Class A2 | | | $12.49 | |
Net assets – Class B | | $ | 250,148 | |
Shares outstanding – Class B1 | | | 21,412 | |
Net asset value per share – Class B | | | $11.68 | |
Net assets – Class C | | $ | 25,083,910 | |
Shares outstanding – Class C1 | | | 2,174,380 | |
Net asset value per share – Class C | | | $11.54 | |
Net assets – Class R | | $ | 39,553 | |
Shares outstanding – Class R1 | | | 3,332 | |
Net asset value per share – Class R | | | $11.87 | |
Net assets – Class R4 | | $ | 15,832 | |
Share outstanding – Class R41 | | | 1,342 | |
Net asset value per share – Class R4 | | | $11.80 | |
Net assets – Class R6 | | $ | 3,053,399 | |
Shares outstanding – Class R61 | | | 262,568 | |
Net asset value per share – Class R6 | | | $11.63 | |
Net assets – Administrator Class | | $ | 452,605,914 | |
Shares outstanding – Administrator Class1 | | | 36,845,223 | |
Net asset value per share – Administrator Class | | | $12.28 | |
Net assets – Institutional Class | | $ | 165,509,337 | |
Shares outstanding – Institutional Class1 | | | 14,008,766 | |
Net asset value per share – Institutional Class | | | $11.81 | |
| 1 | The Fund has an unlimited number of authorized shares. |
| 2 | Maximum offering price is computed as 100/94.25 of net asset value. On investments of $50,000 or more, the offering price is reduced. |
The accompanying notes are an integral part of these financial statements.
| | | | |
| 12 | | Wells Fargo Intrinsic Value Fund | | Statement of operations—six months ended January 31, 2017 (unaudited) |
| | | | |
| | | | |
|
Investment income | |
Dividends (net of foreign withholding taxes of $114,421) | | $ | 9,423,702 | |
Securities lending income, net | | | 185,381 | |
Income from affiliated securities | | | 48,220 | |
| | | | |
Total investment income | | | 9,657,303 | |
| | | | |
| |
Expenses | | | | |
Management fee | | | 3,386,020 | |
Administration fees | | | | |
Class A | | | 326,232 | |
Class B | | | 389 | |
Class C | | | 28,661 | |
Class R | | | 42 | |
Class R4 | | | 6 | |
Class R6 | | | 444 | |
Administrator Class | | | 301,181 | |
Institutional Class | | | 117,020 | |
Shareholder servicing fees | | | | |
Class A | | | 375,041 | |
Class B | | | 463 | |
Class C | | | 34,121 | |
Class R | | | 51 | |
Class R4 | | | 7 | |
Administrator Class | | | 578,336 | |
Distribution fees | | | | |
Class B | | | 1,389 | |
Class C | | | 102,362 | |
Class R | | | 51 | |
Custody and accounting fees | | | 17,788 | |
Professional fees | | | 22,557 | |
Registration fees | | | 50,442 | |
Shareholder report expenses | | | 32,958 | |
Trustees’ fees and expenses | | | 28,658 | |
Other fees and expenses | | | 12,962 | |
| | | | |
Total expenses | | | 5,417,181 | |
Less: Fee waivers and/or expense reimbursements | | | (610,046 | ) |
| | | | |
Net expenses | | | 4,807,135 | |
| | | | |
Net investment income | | | 4,850,168 | |
| | | | |
| |
REALIZED AND UNREALIZED GAINS (LOSSES) ON INVESTMENTS | | | | |
| |
Net realized gains on: | | | | |
Unaffiliated securities | | | 33,663,501 | |
Affiliated securities | | | 1,173 | |
| | | | |
Net realized gains on investments | | | 33,664,674 | |
| | | | |
| |
Net change in unrealized gains (losses) on: | | | | |
Unaffiliated securities | | | 17,789,430 | |
Affiliated securities | | | 28 | |
| | | | |
Net change in unrealized gains (losses) on investments | | | 17,789,458 | |
| | | | |
Net realized and unrealized gains (losses) on investments | | | 51,454,132 | |
| | | | |
Net increase in net assets resulting from operations | | $ | 56,304,300 | |
| | | | |
The accompanying notes are an integral part of these financial statements.
| | | | | | |
| Statement of changes in net assets | | Wells Fargo Intrinsic Value Fund | | | 13 | |
| | | | | | | | | | | | | | | | |
| | | Six months ended
January 31, 2017
(unaudited) | | | Year ended
July 31, 2016 | |
| | | | |
Operations | | | | | | | | | | | | | | | | |
Net investment income | | | | | | $ | 4,850,168 | | | | | | | $ | 13,328,103 | |
Net realized gains on investments | | | | | | | 33,664,674 | | | | | | | | 65,259,600 | |
Net change in unrealized gains (losses) on investments | | | | | | | 17,789,458 | | | | | | | | (102,914,738 | ) |
| | | | |
Net increase (decrease) in net assets resulting from operations | | | | | | | 56,304,300 | | | | | | | | (24,327,035 | ) |
| | | | |
| | | | |
Distributions to shareholders from | | | | | | | | | | | | | | | | |
Net investment income | | | | | | | | | | | | | | | | |
Class A | | | | | | | (3,621,237 | ) | | | | | | | (3,169,347 | ) |
Class C | | | | | | | (86,648 | ) | | | | | | | (37,447 | ) |
Class R | | | | | | | (354 | ) | | | | | | | (201 | ) |
Class R4 | | | | | | | (231 | ) | | | | | | | (186 | ) |
Class R6 | | | | | | | (49,302 | ) | | | | | | | (38,287 | ) |
Administrator Class | | | | | | | (6,085,411 | ) | | | | | | | (5,583,834 | ) |
Institutional Class | | | | | | | (2,733,344 | ) | | | | | | | (3,324,787 | ) |
Net realized gains | | | | | | | | | | | | | | | | |
Class A | | | | | | | (19,813,428 | ) | | | | | | | (34,464,666 | ) |
Class B | | | | | | | (17,948 | ) | | | | | | | (132,772 | ) |
Class C | | | | | | | (1,747,106 | ) | | | | | | | (3,405,696 | ) |
Class R | | | | | | | (2,423 | ) | | | | | | | (3,205 | ) |
Class R4 | | | | | | | (1,001 | ) | | | | | | | (1,451 | ) |
Class R6 | | | | | | | (195,458 | ) | | | | | | | (277,898 | ) |
Administrator Class | | | | | | | (28,268,900 | ) | | | | | | | (47,759,263 | ) |
Institutional Class | | | | | | | (11,235,310 | ) | | | | | | | (24,324,139 | ) |
| | | | |
Total distributions to shareholders | | | | | | | (73,858,101 | ) | | | | | | | (122,523,179 | ) |
| | | | |
| | | | |
Capital share transactions | | | Shares | | | | | | | | Shares | | | | | |
Proceeds from shares sold | | | | | | | | | | | | | | | | |
Class A | | | 134,410 | | | | 1,605,968 | | | | 642,824 | | | | 7,569,378 | |
Class B | | | 1 | | | | 13 | | | | 538 | | | | 6,161 | |
Class C | | | 38,741 | | | | 450,864 | | | | 196,351 | | | | 2,323,822 | |
Class R | | | 267 | | | | 3,213 | | | | 1,207 | | | | 14,440 | |
Class R6 | | | 4,277 | | | | 50,796 | | | | 217,137 | | | | 2,885,275 | |
Administrator Class | | | 133,895 | | | | 1,665,824 | | | | 505,633 | | | | 6,457,967 | |
Institutional Class | | | 1,332,989 | | | | 16,299,433 | | | | 2,739,487 | | | | 33,654,265 | |
| | | | |
| | | | | | | 20,076,111 | | | | | | | | 52,911,308 | |
| | | | |
Reinvestment of distributions | | | | | | | | | | | | | | | | |
Class A | | | 1,877,182 | | | | 22,194,607 | | | | 3,054,047 | | | | 35,698,868 | |
Class B | | | 1,535 | | | | 17,865 | | | | 11,006 | | | | 126,021 | |
Class C | | | 138,250 | | | | 1,593,564 | | | | 256,273 | | | | 2,914,692 | |
Class R | | | 233 | | | | 2,777 | | | | 290 | | | | 3,406 | |
Class R4 | | | 104 | | | | 1,232 | | | | 139 | | | | 1,637 | |
Class R6 | | | 20,897 | | | | 244,760 | | | | 27,254 | | | | 316,185 | |
Administrator Class | | | 2,623,161 | | | | 32,407,127 | | | | 4,139,213 | | | | 50,467,672 | |
Institutional Class | �� | | 949,096 | | | | 11,290,466 | | | | 2,026,547 | | | | 23,875,792 | |
| | | | |
| | | | | | | 67,752,398 | | | | | | | | 113,404,273 | |
| | | | |
Payment for shares redeemed | | | | | | | | | | | | | | | | |
Class A | | | (3,054,286 | ) | | | (36,624,360 | ) | | | (4,303,060 | ) | | | (51,494,497 | ) |
Class B | | | (26,056 | ) | | | (310,909 | ) | | | (109,356 | ) | | | (1,315,058 | ) |
Class C | | | (452,209 | ) | | | (5,297,580 | ) | | | (687,305 | ) | | | (8,016,477 | ) |
Class R | | | (698 | ) | | | (8,357 | ) | | | (938 | ) | | | (12,248 | ) |
Class R6 | | | (1,437 | ) | | | (17,216 | ) | | | (17,996 | ) | | | (211,641 | ) |
Administrator Class | | | (3,487,837 | ) | | | (43,871,243 | ) | | | (4,210,029 | ) | | | (52,406,894 | ) |
Institutional Class | | | (6,090,003 | ) | | | (73,819,735 | ) | | | (5,462,371 | ) | | | (65,509,014 | ) |
| | | | |
| | | | | | | (159,949,400 | ) | | | | | | | (178,965,829 | ) |
| | | | |
Net decrease in net assets resulting from capital share transactions | | | | | | | (72,120,891 | ) | | | | | | | (12,650,248 | ) |
| | | | |
Total decrease in net assets | | | | | | | (89,674,692 | ) | | | | | | | (159,500,462 | ) |
| | | | |
| | | | |
Net assets | | | | | | | | | | | | | | | | |
Beginning of period | | | | | | | 1,036,070,955 | | | | | | | | 1,195,571,417 | |
| | | | |
End of period | | | | | | $ | 946,396,263 | | | | | | | $ | 1,036,070,955 | |
| | | | |
Undistributed (overdistributed) net investment income | | | | | | $ | (635,894 | ) | | | | | | $ | 7,090,465 | |
| | | | |
The accompanying notes are an integral part of these financial statements.
| | | | |
| 14 | | Wells Fargo Intrinsic Value Fund | | Financial highlights |
(For a share outstanding throughout each period)
| | | | | | | | | | | | | | | | | | | | | | | | |
| | | Six months ended January 31, 2017 (unaudited) | | | Year ended July 31 | |
| CLASS A | | | 2016 | | | 2015 | | | 2014 | | | 2013 | | | 2012 | |
Net asset value, beginning of period | | | $12.01 | | | | $13.73 | | | | $13.60 | | | | $12.52 | | | | $10.44 | | | | $11.50 | |
Net investment income | | | 0.05 | 1 | | | 0.13 | | | | 0.10 | | | | 0.07 | | | | 0.07 | 1 | | | 0.11 | 1 |
Net realized and unrealized gains (losses) on investments | | | 0.66 | | | | (0.42 | ) | | | 1.09 | | | | 1.53 | | | | 2.75 | | | | 0.24 | |
| | | | | | | | | | | | | | | | | | | | | | | | |
Total from investment operations | | | 0.71 | | | | (0.29 | ) | | | 1.19 | | | | 1.60 | | | | 2.82 | | | | 0.35 | |
Distributions to shareholders from | | | | | | | | | | | | | | | | | | | | | | | | |
Net investment income | | | (0.14 | ) | | | (0.11 | ) | | | (0.07 | ) | | | (0.06 | ) | | | (0.10 | ) | | | (0.28 | ) |
Net realized gains | | | (0.81 | ) | | | (1.32 | ) | | | (0.99 | ) | | | (0.46 | ) | | | (0.64 | ) | | | (1.13 | ) |
| | | | | | | | | | | | | | | | | | | | | | | | |
Total distributions to shareholders | | | (0.95 | ) | | | (1.43 | ) | | | (1.06 | ) | | | (1.52 | ) | | | (0.74 | ) | | | (1.41 | ) |
Net asset value, end of period | | | $11.77 | | | | $12.01 | | | | $13.73 | | | | $13.60 | | | | $12.52 | | | | $10.44 | |
Total return2 | | | 5.94 | % | | | (1.73 | )% | | | 9.19 | % | | | 13.09 | % | | | 28.53 | % | | | 4.38 | % |
Ratios to average net assets (annualized) | | | | | | | | | | | | | | | | | | | | | | | | |
Gross expenses | | | 1.17 | % | | | 1.17 | % | | | 1.20 | % | | | 1.21 | % | | | 1.20 | % | | | 1.24 | % |
Net expenses | | | 1.10 | % | | | 1.10 | % | | | 1.16 | % | | | 1.16 | % | | | 1.16 | % | | | 1.17 | % |
Net investment income | | | 0.86 | % | | | 1.12 | % | | | 0.75 | % | | | 0.53 | % | | | 0.57 | % | | | 1.05 | % |
Supplemental data | | | | | | | | | | | | | | | | | | | | | | | | |
Portfolio turnover rate | | | 33 | % | | | 34 | % | | | 29 | % | | | 23 | % | | | 28 | % | | | 34 | % |
Net assets, end of period (000s omitted) | | | $299,838 | | | | $318,543 | | | | $372,443 | | | | $391,028 | | | | $386,655 | | | | $87,784 | |
| 1 | Calculated based upon average shares outstanding |
| 2 | Total return calculations do not include any sales charges. Returns for periods of less than one year are not annualized. |
The accompanying notes are an integral part of these financial statements.
| | | | | | |
| Financial highlights | | Wells Fargo Intrinsic Value Fund | | | 15 | |
(For a share outstanding throughout each period)
| | | | | | | | | | | | | | | | | | | | | | | | |
| | | Six months ended January 31, 2017 (unaudited) | | | Year ended July 31 | |
| CLASS B | | | 2016 | | | 2015 | | | 2014 | | | 2013 | | | 2012 | |
Net asset value, beginning of period | | | $11.84 | | | | $13.54 | | | | $13.45 | | | | $12.42 | | | | $10.34 | | | | $11.37 | |
Net investment income (loss) | | | 0.01 | 1 | | | 0.05 | 1 | | | 0.00 | 1,2 | | | (0.03 | )1 | | | (0.02 | ) | | | 0.03 | 1 |
Net realized and unrealized gains (losses) on investments | | | 0.64 | | | | (0.43 | ) | | | 1.08 | | | | 1.52 | | | | 2.74 | | | | 0.24 | |
| | | | | | | | | | | | | | | | | | | | | | | | |
Total from investment operations | | | 0.65 | | | | (0.38 | ) | | | 1.08 | | | | 1.49 | | | | 2.72 | | | | 0.27 | |
Distributions to shareholders from | | | | | | | | | | | | | | | | | | | | | | | | |
Net investment income | | | 0.00 | | | | 0.00 | | | | 0.00 | | | | 0.00 | | | | 0.00 | | | | (0.17 | ) |
Net realized gains | | | (0.81 | ) | | | (1.32 | ) | | | (0.99 | ) | | | (0.46 | ) | | | (0.64 | ) | | | (1.13 | ) |
| | | | | | | | | | | | | | | | | | | | | | | | |
Total distributions to shareholders | | | (0.81 | ) | | | (1.32 | ) | | | (0.99 | ) | | | (0.46 | ) | | | (0.64 | ) | | | (1.30 | ) |
Net asset value, end of period | | | $11.68 | | | | $11.84 | | | | $13.54 | | | | $13.45 | | | | $12.42 | | | | $10.34 | |
Total return3 | | | 5.50 | % | | | (2.47 | )% | | | 8.36 | % | | | 12.25 | % | | | 27.57 | % | | | 3.56 | % |
Ratios to average net assets (annualized) | | | | | | | | | | | | | | | | | | | | | | | | |
Gross expenses | | | 1.93 | % | | | 1.92 | % | | | 1.96 | % | | | 1.97 | % | | | 1.97 | % | | | 2.01 | % |
Net expenses | | | 1.86 | % | | | 1.86 | % | | | 1.91 | % | | | 1.91 | % | | | 1.91 | % | | | 1.92 | % |
Net investment income (loss) | | | 0.15 | % | | | 0.38 | % | | | 0.00 | % | | | (0.20 | )% | | | (0.03 | )% | | | 0.27 | % |
Supplemental data | | | | | | | | | | | | | | | | | | | | | | | | |
Portfolio turnover rate | | | 33 | % | | | 34 | % | | | 29 | % | | | 23 | % | | | 28 | % | | | 34 | % |
Net assets, end of period (000s omitted) | | | $250 | | | | $544 | | | | $1,947 | | | | $3,889 | | | | $5,589 | | | | $4,323 | |
| 1 | Calculated based upon average shares outstanding |
| 2 | Amount is less than $0.005. |
| 3 | Total return calculations do not include any sales charges. Returns for periods of less than one year are not annualized. |
The accompanying notes are an integral part of these financial statements.
| | | | |
| 16 | | Wells Fargo Intrinsic Value Fund | | Financial highlights |
(For a share outstanding throughout each period)
| | | | | | | | | | | | | | | | | | | | | | | | |
| | | Six months ended January 31, 2017 (unaudited) | | | Year ended July 31 | |
| CLASS C | | | 2016 | | | 2015 | | | 2014 | | | 2013 | | | 2012 | |
Net asset value, beginning of period | | | $11.74 | | | | $13.45 | | | | $13.36 | | | | $12.35 | | | | $10.30 | | | | $11.35 | |
Net investment income (loss) | | | 0.01 | 1 | | | 0.03 | | | | 0.00 | 2 | | | (0.03 | ) | | | (0.01 | )1 | | | 0.03 | 1 |
Net realized and unrealized gains (losses) on investments | | | 0.64 | | | | (0.41 | ) | | | 1.08 | | | | 1.50 | | | | 2.72 | | | | 0.24 | |
| | | | | | | | | | | | | | | | | | | | | | | | |
Total from investment operations | | | 0.65 | | | | (0.38 | ) | | | 1.08 | | | | 1.47 | | | | 2.71 | | | | 0.27 | |
Distributions to shareholders from | | | | | | | | | | | | | | | | | | | | | | | | |
Net investment income | | | (0.04 | ) | | | (0.01 | ) | | | 0.00 | | | | 0.00 | | | | (0.02 | ) | | | (0.19 | ) |
Net realized gains | | | (0.81 | ) | | | (1.32 | ) | | | (0.99 | ) | | | (0.46 | ) | | | (0.64 | ) | | | (1.13 | ) |
| | | | | | | | | | | | | | | | | | | | | | | | |
Total distributions to shareholders | | | (0.85 | ) | | | (1.33 | ) | | | (0.99 | ) | | | (0.46 | ) | | | (0.66 | ) | | | (1.32 | ) |
Net asset value, end of period | | | $11.54 | | | | $11.74 | | | | $13.45 | | | | $13.36 | | | | $12.35 | | | | $10.30 | |
Total return3 | | | 5.54 | % | | | (2.47 | )% | | | 8.42 | % | | | 12.24 | % | | | 27.50 | % | | | 3.62 | % |
Ratios to average net assets (annualized) | | | | | | | | | | | | | | | | | | | | | | | | |
Gross expenses | | | 1.93 | % | | | 1.93 | % | | | 1.96 | % | | | 1.97 | % | | | 1.97 | % | | | 2.01 | % |
Net expenses | | | 1.86 | % | | | 1.86 | % | | | 1.91 | % | | | 1.91 | % | | | 1.91 | % | | | 1.92 | % |
Net investment income (loss) | | | 0.11 | % | | | 0.37 | % | | | 0.00 | % | | | (0.22 | )% | | | (0.05 | )% | | | 0.26 | % |
Supplemental data | | | | | | | | | | | | | | | | | | | | | | | | |
Portfolio turnover rate | | | 33 | % | | | 34 | % | | | 29 | % | | | 23 | % | | | 28 | % | | | 34 | % |
Net assets, end of period (000s omitted) | | | $25,084 | | | | $28,756 | | | | $36,098 | | | | $36,654 | | | | $35,616 | | | | $20,187 | |
| 1 | Calculated based upon average shares outstanding |
| 2 | Amount is less than $0.005. |
| 3 | Total return calculations do not include any sales charges. Returns for periods of less than one year are not annualized. |
The accompanying notes are an integral part of these financial statements.
| | | | | | |
| Financial highlights | | Wells Fargo Intrinsic Value Fund | | | 17 | |
(For a share outstanding throughout each period)
| | | | | | | | | | | | | | | | | | | | |
| | | Six months ended
January 31, 2017 (unaudited) | | | Year ended July 31 | |
| CLASS R | | | 2016 | | | 2015 | | | 2014 | | | 20131 | |
Net asset value, beginning of period | | | $12.09 | | | | $13.81 | | | | $13.66 | | | | $12.55 | | | | $11.20 | |
Net investment income | | | 0.04 | 2 | | | 0.10 | | | | 0.05 | | | | 0.03 | | | | 0.00 | 3 |
Net realized and unrealized gains (losses) on investments | | | 0.66 | | | | (0.43 | ) | | | 1.12 | | | | 1.54 | | | | 1.35 | |
| | | | | | | | | | | | | | | | | | | | |
Total from investment operations | | | 0.70 | | | | (0.33 | ) | | | 1.17 | | | | 1.57 | | | | 1.35 | |
Distributions to shareholders from | | | | | | | | | | | | | | | | | | | | |
Net investment income | | | (0.11 | ) | | | (0.07 | ) | | | (0.03 | ) | | | 0.00 | | | | 0.00 | |
Net realized gains | | | (0.81 | ) | | | (1.32 | ) | | | (0.99 | ) | | | (0.46 | ) | | | 0.00 | |
| | | | | | | | | | | | | | | | | | | | |
Total distributions to shareholders | | | (0.92 | ) | | | (1.39 | ) | | | (1.02 | ) | | | (0.46 | ) | | | 0.00 | |
Net asset value, end of period | | | $11.87 | | | | $12.09 | | | | $13.81 | | | | $13.66 | | | | $12.55 | |
Total return4 | | | 5.82 | % | | | (1.99 | )% | | | 8.96 | % | | | 12.77 | % | | | 12.05 | % |
Ratios to average net assets (annualized) | | | | | | | | | | | | | | | | | | | | |
Gross expenses | | | 1.44 | % | | | 1.44 | % | | | 1.47 | % | | | 1.49 | % | | | 1.46 | % |
Net expenses | | | 1.36 | % | | | 1.36 | % | | | 1.40 | % | | | 1.41 | % | | | 1.41 | % |
Net investment income | | | 0.59 | % | | | 0.86 | % | | | 0.50 | % | | | 0.26 | % | | | 0.01 | % |
Supplemental data | | | | | | | | | | | | | | | | | | | | |
Portfolio turnover rate | | | 33 | % | | | 34 | % | | | 29 | % | | | 23 | % | | | 28 | % |
Net assets, end of period (000s omitted) | | | $40 | | | | $43 | | | | $41 | | | | $28 | | | | $18 | |
| 1 | For the period from March 1, 2013 (commencement of class operations) to July 31, 2013 |
| 2 | Calculated based upon average shares outstanding. |
| 3 | Amount is less than $0.005. |
| 4 | Returns for periods of less than one year are not annualized. |
The accompanying notes are an integral part of these financial statements.
| | | | |
| 18 | | Wells Fargo Intrinsic Value Fund | | Financial highlights |
(For a share outstanding throughout each period)
| | | | | | | | | | | | | | | | | | | | |
| | | Six months ended January 31, 2017 (unaudited) | | | Year ended July 31 | |
| CLASS R4 | | | 2016 | | | 2015 | | | 2014 | | | 20131 | |
Net asset value, beginning of period | | | $12.06 | | | | $13.78 | | | | $13.65 | | | | $12.55 | | | | $11.10 | |
Net investment income | | | 0.07 | 2 | | | 0.17 | | | | 0.15 | | | | 0.12 | | | | 0.09 | |
Net realized and unrealized gains (losses) on investments | | | 0.65 | | | | (0.42 | ) | | | 1.09 | | | | 1.54 | | | | 2.15 | |
| | | | | | | | | | | | | | | | | | | | |
Total from investment operations | | | 0.72 | | | | (0.25 | ) | | | 1.24 | | | | 1.66 | | | | 2.24 | |
Distributions to shareholders from | | | | | | | | | | | | | | | | | | | | |
Net investment income | | | (0.17 | ) | | | (0.15 | ) | | | (0.12 | ) | | | (0.10 | ) | | | (0.15 | ) |
Net realized gains | | | (0.81 | ) | | | (1.32 | ) | | | (0.99 | ) | | | (0.46 | ) | | | (0.64 | ) |
| | | | | | | | | | | | | | | | | | | | |
Total distributions to shareholders | | | (0.98 | ) | | | (1.47 | ) | | | (1.11 | ) | | | (0.56 | ) | | | (0.79 | ) |
Net asset value, end of period | | | $11.80 | | | | $12.06 | | | | $13.78 | | | | $13.65 | | | | $12.55 | |
Total return3 | | | 6.04 | % | | | (1.39 | )% | | | 9.53 | % | | | 13.55 | % | | | 21.73 | % |
Ratios to average net assets (annualized) | | | | | | | | | | | | | | | | | | | | |
Gross expenses | | | 0.87 | % | | | 0.88 | % | | | 0.86 | % | | | 0.87 | % | | | 0.88 | % |
Net expenses | | | 0.80 | % | | | 0.80 | % | | | 0.80 | % | | | 0.80 | % | | | 0.80 | % |
Net investment income | | | 1.14 | % | | | 1.41 | % | | | 1.11 | % | | | 0.88 | % | | | 0.99 | % |
Supplemental data | | | | | | | | | | | | | | | | | | | | |
Portfolio turnover rate | | | 33 | % | | | 34 | % | | | 29 | % | | | 23 | % | | | 28 | % |
Net assets, end of period (000s omitted) | | | $16 | | | | $15 | | | | $15 | | | | $15 | | | | $14 | |
| 1 | For the period from November 30, 2012 (commencement of class operations) to July 31, 2013 |
| 2 | Calculated based upon average shares outstanding |
| 3 | Returns for periods of less than one year are not annualized. |
The accompanying notes are an integral part of these financial statements.
| | | | | | |
| Financial highlights | | Wells Fargo Intrinsic Value Fund | | | 19 | |
(For a share outstanding throughout each period)
| | | | | | | | | | | | | | | | | | | | |
| | | Six months ended January 31, 2017 (unaudited) | | | Year ended July 31 | |
| CLASS R6 | | | 2016 | | | 2015 | | | 2014 | | | 20131 | |
Net asset value, beginning of period | | | $11.90 | | | | $13.62 | | | | $13.60 | | | | $12.56 | | | | $11.10 | |
Net investment income | | | 0.08 | 2 | | | 0.17 | | | | 0.17 | 2 | | | 0.14 | 2 | | | 0.19 | |
Net realized and unrealized gains (losses) on investments | | | 0.65 | | | | (0.40 | ) | | | 1.08 | | | | 1.47 | | | | 2.06 | |
| | | | | | | | | | | | | | | | | | | | |
Total from investment operations | | | 0.73 | | | | (0.23 | ) | | | 1.25 | | | | 1.61 | | | | 2.25 | |
Distributions to shareholders from | | | | | | | | | | | | | | | | | | | | |
Net investment income | | | (0.19 | ) | | | (0.17 | ) | | | (0.24 | ) | | | (0.11 | ) | | | (0.15 | ) |
Net realized gains | | | (0.81 | ) | | | (1.32 | ) | | | (0.99 | ) | | | (0.46 | ) | | | (0.64 | ) |
| | | | | | | | | | | | | | | | | | | | |
Total distributions to shareholders | | | (1.00 | ) | | | (1.49 | ) | | | (1.23 | ) | | | (0.57 | ) | | | (0.79 | ) |
Net asset value, end of period | | | $11.63 | | | | $11.90 | | | | $13.62 | | | | $13.60 | | | | $12.56 | |
Total return3 | | | 6.18 | % | | | (1.30 | )% | | | 9.74 | % | | | 13.19 | % | | | 21.84 | % |
Ratios to average net assets (annualized) | | | | | | | | | | | | | | | | | | | | |
Gross expenses | | | 0.75 | % | | | 0.75 | % | | | 0.74 | % | | | 0.74 | % | | | 0.73 | % |
Net expenses | | | 0.65 | % | | | 0.65 | % | | | 0.65 | % | | | 0.65 | % | | | 0.65 | % |
Net investment income | | | 1.30 | % | | | 1.47 | % | | | 1.25 | % | | | 1.10 | % | | | 0.85 | % |
Supplemental data | | | | | | | | | | | | | | | | | | | | |
Portfolio turnover rate | | | 33 | % | | | 34 | % | | | 29 | % | | | 23 | % | | | 28 | % |
Net assets, end of period (000s omitted) | | | $3,053 | | | | $2,842 | | | | $169 | | | | $150 | | | | $3,359 | |
| 1 | For the period from November 30, 2012 (commencement of class operations) to July 31, 2013 |
| 2 | Calculated based upon average shares outstanding |
| 3 | Returns for periods of less than one year are not annualized. |
The accompanying notes are an integral part of these financial statements.
| | | | |
| 20 | | Wells Fargo Intrinsic Value Fund | | Financial highlights |
(For a share outstanding throughout each period)
| | | | | | | | | | | | | | | | | | | | | | | | |
| | | Six months ended January 31, 2017 (unaudited) | | | Year ended July 31 | |
| ADMINISTRATOR CLASS | | | 2016 | | | 2015 | | | 2014 | | | 2013 | | | 2012 | |
Net asset value, beginning of period | | | $12.51 | | | | $14.25 | | | | $14.08 | | | | $12.95 | | | | $10.78 | | | | $11.55 | |
Net investment income | | | 0.06 | 1 | | | 0.15 | | | | 0.13 | | | | 0.10 | | | | 0.08 | 1 | | | 0.12 | 1 |
Net realized and unrealized gains (losses) on investments | | | 0.68 | | | | (0.43 | ) | | | 1.14 | | | | 1.58 | | | | 2.87 | | | | 0.28 | |
| | | | | | | | | | | | | | | | | | | | | | | | |
Total from investment operations | | | 0.74 | | | | (0.28 | ) | | | 1.27 | | | | 1.68 | | | | 2.95 | | | | 0.40 | |
Distributions to shareholders from | | | | | | | | | | | | | | | | | | | | | | | | |
Net investment income | | | (0.16 | ) | | | (0.14 | ) | | | (0.11 | ) | | | (0.09 | ) | | | (0.14 | ) | | | (0.04 | ) |
Net realized gains | | | (0.81 | ) | | | (1.32 | ) | | | (0.99 | ) | | | (0.46 | ) | | | (0.64 | ) | | | (1.13 | ) |
| | | | | | | | | | | | | | | | | | | | | | | | |
Total distributions to shareholders | | | (0.97 | ) | | | (1.46 | ) | | | (1.10 | ) | | | (0.55 | ) | | | (0.78 | ) | | | (1.17 | ) |
Net asset value, end of period | | | $12.28 | | | | $12.51 | | | | $14.25 | | | | $14.08 | | | | $12.95 | | | | $10.78 | |
Total return2 | | | 5.98 | % | | | (1.58 | )% | | | 9.42 | % | | | 13.36 | % | | | 28.77 | % | | | 4.57 | % |
Ratios to average net assets (annualized) | | | | | | | | | | | | | | | | | | | | | | | | |
Gross expenses | | | 1.10 | % | | | 1.10 | % | | | 1.06 | % | | | 1.06 | % | | | 1.05 | % | | | 1.09 | % |
Net expenses | | | 0.95 | % | | | 0.95 | % | | | 0.95 | % | | | 0.95 | % | | | 0.95 | % | | | 0.95 | % |
Net investment income | | | 1.01 | % | | | 1.27 | % | | | 0.95 | % | | | 0.74 | % | | | 0.68 | % | | | 1.13 | % |
Supplemental data | | | | | | | | | | | | | | | | | | | | | | | | |
Portfolio turnover rate | | | 33 | % | | | 34 | % | | | 29 | % | | | 23 | % | | | 28 | % | | | 34 | % |
Net assets, end of period (000s omitted) | | | $452,606 | | | | $470,152 | | | | $529,293 | | | | $534,641 | | | | $515,012 | | | | $26,687 | |
| 1 | Calculated based upon average shares outstanding |
| 2 | Returns for periods of less than one year are not annualized. |
The accompanying notes are an integral part of these financial statements.
| | | | | | |
| Financial highlights | | Wells Fargo Intrinsic Value Fund | | | 21 | |
(For a share outstanding throughout each period)
| | | | | | | | | | | | | | | | | | | | | | | | |
| | | Six months ended
January 31, 2017 (unaudited) | | | Year ended July 31 | |
| INSTITUTIONAL CLASS | | | 2016 | | | 2015 | | | 2014 | | | 2013 | | | 2012 | |
Net asset value, beginning of period | | | $12.08 | | | | $13.80 | | | | $13.67 | | | | $12.58 | | | | $10.48 | | | | $11.56 | |
Net investment income | | | 0.08 | 1 | | | 0.18 | | | | 0.15 | | | | 0.13 | | | | 0.16 | | | | 0.14 | 1 |
Net realized and unrealized gains (losses) on investments | | | 0.65 | | | | (0.41 | ) | | | 1.11 | | | | 1.53 | | | | 2.73 | | | | 0.24 | |
| | | | | | | | | | | | | | | | | | | | | | | | |
Total from investment operations | | | 0.73 | | | | (0.23 | ) | | | 1.26 | | | | 1.66 | | | | 2.89 | | | | 0.38 | |
Distributions to shareholders from | | | | | | | | | | | | | | | | | | | | | | | | |
Net investment income | | | (0.19 | ) | | | (0.17 | ) | | | (0.14 | ) | | | (1.11 | ) | | | (0.15 | ) | | | (0.33 | ) |
Net realized gains | | | (0.81 | ) | | | (1.32 | ) | | | (0.99 | ) | | | (0.46 | ) | | | (0.64 | ) | | | (1.13 | ) |
| | | | | | | | | | | | | | | | | | | | | | | | |
Total distributions to shareholders | | | (1.00 | ) | | | (1.49 | ) | | | (1.13 | ) | | | (0.57 | ) | | | (0.79 | ) | | | (1.46 | ) |
Net asset value, end of period | | | $11.81 | | | | $12.08 | | | | $13.80 | | | | $13.67 | | | | $12.58 | | | | $10.48 | |
Total return2 | | | 6.07 | % | | | (1.27 | )% | | | 9.66 | % | | | 13.64 | % | | | 29.04 | % | | | 4.71 | % |
Ratios to average net assets (annualized) | | | | | | | | | | | | | | | | | | | | | | | | |
Gross expenses | | | 0.85 | % | | | 0.85 | % | | | 0.79 | % | | | 0.79 | % | | | 0.79 | % | | | 0.83 | % |
Net expenses | | | 0.70 | % | | | 0.70 | % | | | 0.70 | % | | | 0.70 | % | | | 0.73 | % | | | 0.82 | % |
Net investment income | | | 1.28 | % | | | 1.52 | % | | | 1.20 | % | | | 0.99 | % | | | 1.21 | % | | | 1.35 | % |
Supplemental data | | | | | | | | | | | | | | | | | | | | | | | | |
Portfolio turnover rate | | | 33 | % | | | 34 | % | | | 29 | % | | | 23 | % | | | 28 | % | | | 34 | % |
Net assets, end of period (000s omitted) | | | $165,509 | | | | $215,175 | | | | $255,565 | | | | $244,378 | | | | $221,128 | | | | $222,949 | |
| 1 | Calculated based upon average shares outstanding |
| 2 | Returns for periods of less than one year are not annualized. |
The accompanying notes are an integral part of these financial statements.
| | | | |
| 22 | | Wells Fargo Intrinsic Value Fund | | Notes to financial statements (unaudited) |
1. ORGANIZATION
Wells Fargo Funds Trust (the “Trust”), a Delaware statutory trust organized on March 10, 1999, is an open-end management investment company registered under the Investment Company Act of 1940, as amended (the “1940 Act”). As an investment company, the Trust follows the accounting and reporting guidance in Financial Accounting Standards Board (“FASB”) Accounting Standards Codification Topic 946, Financial Services – Investment Companies. These financial statements report on the Wells Fargo Intrinsic Value Fund (the “Fund”) which is a diversified series of the Trust.
2. SIGNIFICANT ACCOUNTING POLICIES
The following significant accounting policies, which are consistently followed in the preparation of the financial statements of the Fund, are in conformity with U.S. generally accepted accounting principles which require management to make estimates and assumptions that affect the reported amounts of assets and liabilities, disclosure of contingent assets and liabilities at the date of the financial statements, and the reported amounts of revenues and expenses during the reporting period. Actual results could differ from those estimates.
Securities valuation
All investments are valued each business day as of the close of regular trading on the New York Stock Exchange (generally 4 p.m. Eastern Time), although the Fund may deviate from this calculation time under unusual or unexpected circumstances.
Equity securities that are listed on a foreign or domestic exchange or market are valued at the official closing price or, if none, the last sales price. If no sale occurs on the principal exchange or market that day, the prior day’s price will be deemed “stale” and a fair value price will be determined in accordance with the Fund’s Valuation Procedures.
Investments in registered open-end investment companies are valued at net asset value. Interests in non-registered investment vehicles that are redeemable at net asset value are fair valued normally at net asset value.
Investments which are not valued using any of the methods discussed above are valued at their fair value, as determined in good faith by the Board of Trustees of the Fund. The Board of Trustees has established a Valuation Committee comprised of the Trustees and has delegated to it the authority to take any actions regarding the valuation of portfolio securities that the Valuation Committee deems necessary or appropriate, including determining the fair value of portfolio securities, unless the determination has been delegated to the Management Valuation Team of Wells Fargo Funds Management, LLC (“Funds Management”). The Board of Trustees retains the authority to make or ratify any valuation decisions or approve any changes to the Valuation Procedures as it deems appropriate. On a quarterly basis, the Board of Trustees receives reports on any valuation actions taken by the Valuation Committee or the Management Valuation Team which may include items for ratification.
Valuations of fair valued securities are compared to the next actual sales price when available, or other appropriate market values, to assess the continued appropriateness of the fair valuation methodologies used. These securities are fair valued on a day-to-day basis, taking into consideration changes to appropriate market information and any significant changes to the inputs considered in the valuation process until there is a readily available price provided on an exchange or by an independent pricing service. Valuations received from an independent pricing service or independent broker-dealer quotes are periodically validated by comparisons to most recent trades and valuations provided by other independent pricing services in addition to the review of prices by the manager and/or subadviser. Unobservable inputs used in determining fair valuations are identified based on the type of security, taking into consideration factors utilized by market participants in valuing the investment, knowledge about the issuer and the current market environment.
Security loans
The Fund may lend its securities from time to time in order to earn additional income in the form of fees or interest on securities received as collateral or the investment of any cash received as collateral. The Fund continues to receive interest or dividends on the securities loaned. The Fund receives collateral in the form of cash or securities with a value at least equal to the value of the securities on loan. The value of the loaned securities is determined at the close of each business day and any additional required collateral is delivered to the Fund on the next business day. In a securities lending transaction, the net asset value of the Fund will be affected by an increase or decrease in the value of the securities loaned and by an increase or decrease in the value of the instrument in which collateral is invested. The amount of securities lending activity undertaken by the Fund fluctuates from time to time. In the event of default or bankruptcy by the borrower, the Fund may be prevented from recovering the loaned securities or gaining access to the collateral or may experience delays or costs in doing so. In addition, the investment of any cash collateral received may lose all or part of its value. The Fund has the right under the lending agreement to recover the securities from the borrower on demand.
| | | | | | |
| Notes to financial statements (unaudited) | | Wells Fargo Intrinsic Value Fund | | | 23 | |
The Fund lends its securities through an unaffiliated securities lending agent. Cash collateral received in connection with its securities lending transactions is invested in Securities Lending Cash Investments, LLC (the “Securities Lending Fund”). The Securities Lending Fund is exempt from registration under Section 3(c)(7) of the 1940 Act and is managed by Funds Management and is subadvised by Wells Capital Management Incorporated (“WellsCap”), an affiliate of Funds Management and an indirect wholly owned subsidiary of Wells Fargo & Company (“Wells Fargo”). Funds Management receives an advisory fee starting at 0.05% and declining to 0.01% as the average daily net assets of the Securities Lending Fund increase. All of the fees received by Funds Management are paid to WellsCap for its services as subadviser. The Securities Lending Fund seeks to provide a positive return compared to the daily Fed Funds Open Rate by investing in high-quality, U.S. dollar-denominated short-term money market instruments. Securities Lending Fund investments are valued at the evaluated bid price provided by an independent pricing service. Income earned from investment in the Securities Lending Fund is included in securities lending income on the Statement of Operations.
Security transactions and income recognition
Securities transactions are recorded on a trade date basis. Realized gains or losses are recorded on the basis of identified cost.
Dividend income is recognized on the ex-dividend date. Dividend income is recorded net of foreign taxes withheld where recovery of such taxes is not assured.
Distributions to shareholders
Distributions to shareholders from net investment income and net realized gains, if any, are recorded on the ex-dividend date. Such distributions are determined in conformity with federal income tax regulations, which may differ in amount or character from net investment income and realized gains recognized for purposes of U.S. generally accepted accounting principles.
Federal and other taxes
The Fund intends to continue to qualify as a regulated investment company by distributing substantially all of its investment company taxable income and any net realized capital gains (after reduction for capital loss carryforwards) sufficient to relieve it from all, or substantially all, federal income taxes. Accordingly, no provision for federal income taxes was required.
The Fund’s income and federal excise tax returns and all financial records supporting those returns for the prior three fiscal years are subject to examination by the federal and Delaware revenue authorities. Management has analyzed the Fund’s tax positions taken on federal, state, and foreign tax returns for all open tax years and does not believe that there are any uncertain tax positions that require recognition of a tax liability.
As of July 31, 2016, the Fund had capital loss carryforwards available to offset future net realized capital gains in the amount of $4,849,228 expiring in 2017.
Class allocations
The separate classes of shares offered by the Fund differ principally in applicable sales charges, distribution, shareholder servicing, and administration fees. Class specific expenses are charged directly to that share class. Investment income, common expenses, and realized and unrealized gains (losses) on investments are allocated daily to each class of shares based on the relative proportion of net assets of each class.
3. FAIR VALUATION MEASUREMENTS
Fair value measurements of investments are determined within a framework that has established a fair value hierarchy based upon the various data inputs utilized in determining the value of the Fund’s investments. The three-level hierarchy gives the highest priority to unadjusted quoted prices in active markets for identical assets or liabilities (Level 1) and the lowest priority to significant unobservable inputs (Level 3). The Fund’s investments are classified within the fair value hierarchy based on the lowest level of input that is significant to the fair value measurement. The inputs are summarized into three broad levels as follows:
| ∎ | | Level 1 – quoted prices in active markets for identical securities |
| ∎ | | Level 2 – other significant observable inputs (including quoted prices for similar securities, interest rates, prepayment speeds, credit risk, etc.) |
| ∎ | | Level 3 – significant unobservable inputs (including the Fund’s own assumptions in determining the fair value of investments) |
| | | | |
| 24 | | Wells Fargo Intrinsic Value Fund | | Notes to financial statements (unaudited) |
The inputs or methodologies used for valuing investments in securities are not necessarily an indication of the risk associated with investing in those securities.
The following is a summary of the inputs used in valuing the Fund’s assets and liabilities as of January 31, 2017:
| | | | | | | | | | | | | | | | |
| | | Quoted prices
(Level 1) | | | Other significant
observable inputs
(Level 2) | | | Significant
unobservable inputs (Level 3) | | | Total | |
Assets | | | | | | | | | | | | | | | | |
Investments in: | | | | | | | | | | | | | | | | |
| | | | |
Common stocks | | | | | | | | | | | | | | | | |
Consumer discretionary | | $ | 108,168,486 | | | $ | 0 | | | $ | 0 | | | $ | 108,168,486 | |
Consumer staples | | | 83,673,779 | | | | 0 | | | | 0 | | | | 83,763,779 | |
Energy | | | 91,170,025 | | | | 0 | | | | 0 | | | | 91,170,025 | |
Financials | | | 139,535,309 | | | | 0 | | | | 0 | | | | 139,535,309 | |
Health care | | | 94,905,783 | | | | 0 | | | | 0 | | | | 94,905,783 | |
Industrials | | | 109,662,431 | | | | 0 | | | | 0 | | | | 109,662,431 | |
Information technology | | | 191,324,736 | | | | 0 | | | | 0 | | | | 191,324,736 | |
Materials | | | 28,001,606 | | | | 0 | | | | 0 | | | | 28,001,606 | |
Real estate | | | 25,207,210 | | | | 0 | | | | 0 | | | | 25,207,210 | |
Telecommunication services | | | 17,728,828 | | | | 0 | | | | 0 | | | | 17,728,828 | |
Utilities | | | 43,484,760 | | | | 0 | | | | 0 | | | | 43,484,760 | |
| | | | |
Short-term investments | | | | | | | | | | | | | | | | |
Investment companies | | | 11,602,239 | | | | 0 | | | | 0 | | | | 11,602,239 | |
Investments measured at net asset value* | | | | | | | | | | | | | | | 25,821,301 | |
Total assets | | $ | 944,465,192 | | | $ | 0 | | | $ | 0 | | | $ | 970,286,493 | |
| * | Investments that are measured at fair value using the net asset value per share (or its equivalent) as a practical expedient have not been categorized in the fair value hierarchy. The fair value amount presented in the table is intended to permit reconciliation of the fair value hierarchy to the amounts presented in the Statement of Assets and Liabilities. The Fund’s investment in Securities Lending Cash Investments, LLC valued at $25,821,301 does not have a redemption period notice, can be redeemed daily and does not have any unfunded commitments. |
The Fund recognizes transfers between levels within the fair value hierarchy at the end of the reporting period. At January 31, 2017, the Fund did not have any transfers into/out of Level 1, Level 2, or Level 3.
4. TRANSACTIONS WITH AFFILIATES AND OTHER EXPENSES
Management fee
Funds Management, an indirect wholly owned subsidiary of Wells Fargo, is the manager of the Fund and provides advisory and fund-level administrative services under an investment management agreement. Under the investment management agreement, Funds Management is responsible for, among other services, implementing the investment objectives and strategies of the Fund, supervising the subadviser, providing fund-level administrative services in connection with the Fund’s operations, and providing any other fund-level administrative services reasonably necessary for the operation of the Fund. As compensation for its services under the investment management agreement, Funds Management is entitled to receive an annual management fee starting at 0.70% and declining to 0.505% as the average daily net assets of the Fund increase. For the six months ended January 31, 2017, the management fee was equivalent to an annual rate of 0.69% of the Fund’s average daily net assets.
Funds Management has retained the services of a subadviser to provide daily portfolio management to the Fund. The fee for subadvisory services is borne by Funds Management. WellsCap is the subadviser to the Fund and is entitled to receive a fee from Funds Management at an annual rate starting at 0.35% and declining to 0.25% as the average daily net assets of the Fund increase.
Administration fees
Under a class-level administration agreement, Funds Management provides class-level administrative services to the Fund,
which includes paying fees and expenses for services provided by the transfer agent, sub-transfer agents, omnibus account
| | | | | | |
| Notes to financial statements (unaudited) | | Wells Fargo Intrinsic Value Fund | | | 25 | |
servicers and record-keepers. As compensation for its services under the class-level administration agreement, Funds Management receives an annual fee which is calculated based on the average daily net assets of each class as follows:
| | | | |
| | | Class-level
administration fee | |
Class A, Class B, Class C, Class R | | | 0.21 | % |
Class R4 | | | 0.08 | |
Class R6 | | | 0.03 | |
Administrator Class, Institutional Class | | | 0.13 | |
Funds Management has contractually waived and/or reimbursed management and administration fees to the extent necessary to maintain certain net operating expense ratios for the Fund. Waiver of fees and/or reimbursement of expenses by Funds Management were made first from fund level expenses on a proportionate basis and then from class specific expenses. Funds Management has committed through November 30, 2017 to waive fees and/or reimburse expenses to the extent necessary to cap the Fund’s expenses at 1.11% for Class A shares, 1.86% for Class B shares, 1.86% for Class C shares, 1.36% for Class R shares, 0.80% for Class R4 shares, 0.65% for Class R6 shares, 0.95% for Administrator Class shares, and 0.70% for Institutional Class shares. After this time, the cap may be increased or the commitment to maintain the cap may be terminated only with the approval of the Board of Trustees.
During the six months ended January 31, 2017, State Street Bank and Trust Company, the Fund’s custodian, reimbursed the Fund $34,583 for certain out-of-pocket expenses that were billed to the Fund in error from 1998-2015. This amount is included in dividend income on the Statement of Operations. In addition, Funds Management was also reimbursed $39,973 for waivers/reimbursements it made to the Fund during the period the Fund was erroneously billed.
Distribution fees
The Trust has adopted a distribution plan for Class B, Class C, and Class R shares of the Fund pursuant to Rule 12b-1 under the 1940 Act. Distribution fees are charged to Class B, Class C, and Class R shares and paid to Wells Fargo Funds Distributor, LLC (“Funds Distributor”), the principal underwriter, at an annual rate of 0.75% of the average daily net assets of Class B and Class C shares and 0.25% of the average daily net assets of Class R shares.
In addition, Funds Distributor is entitled to receive the front-end sales charge from the purchase of Class A shares and a contingent deferred sales charge on the redemption of certain Class A shares. Funds Distributor is also entitled to receive the contingent deferred sales charges from redemptions of Class B and Class C shares. For the six months ended January 31, 2017, Funds Distributor received $2,622 from the sale of Class A shares.
Shareholder servicing fees
The Trust has entered into contracts with one or more shareholder servicing agents, whereby Class A, Class B, Class C, Class R, and Administrator Class of the Fund are charged a fee at an annual rate of 0.25% of the average daily net assets of each respective class. Class R4 is charged a fee at an annual rate of 0.10% of its average daily net assets.
A portion of these total shareholder servicing fees were paid to affiliates of Wells Fargo.
5. INVESTMENT PORTFOLIO TRANSACTIONS
Purchases and sales of investments, excluding U.S. government obligations (if any) and short-term securities, for the six months ended January 31, 2017 were $317,296,487 and $407,495,400, respectively.
The Fund may purchase or sell investment securities to other Wells Fargo funds under procedures adopted by the Board of Trustees. The procedures have been designed to ensure that these interfund transactions, which generally do not incur broker commissions, are effected at current market prices. Interfund trades are included within the respective purchases and sales amounts shown.
6. BANK BORROWINGS
The Trust (excluding the money market funds and certain other funds) and Wells Fargo Variable Trust are parties to a $250,000,000 revolving credit agreement whereby the Fund is permitted to use bank borrowings for temporary or emergency purposes, such as to fund shareholder redemption requests. Interest under the credit agreement is charged to the Fund based on a borrowing rate equal to the higher of the Federal Funds rate in effect on that day plus 1.25% or the overnight LIBOR rate in effect on that day plus 1.25%. In addition, an annual commitment fee equal to 0.25% of the unused balance is allocated to each participating fund. Prior to August 30, 2016, the revolving credit agreement amount was $200,000,000 and the annual commitment fee was equal to 0.20% of the unused balance which was allocated to each participating fund.
| | | | |
| 26 | | Wells Fargo Intrinsic Value Fund | | Notes to financial statements (unaudited) |
For the six months ended January 31, 2017, there were no borrowings by the Fund under the agreement.
7. INDEMNIFICATION
Under the Trust’s organizational documents, the officers and Trustees have been granted certain indemnification rights against certain liabilities that may arise out of performance of their duties to the Trust. Additionally, in the normal course of business, the Trust may enter into contracts with service providers that contain a variety of indemnification clauses. The Trust’s maximum exposure under these arrangements is dependent on future claims that may be made against the Fund and, therefore, cannot be estimated.
8. NEW ACCOUNTING PRONOUNCEMENT
In December 2016, the Financial Accounting Standards Board (“FASB”) issued Accounting Standard Update (“ASU”) No. 2016-19, Technical Corrections and Improvements. ASU 2016-19 includes an amendment to FASB ASC Topic 820, Fair Value Measurement which clarifies the difference between a valuation approach and a valuation technique. The amendment also requires an entity to disclose when there has been a change in either or both a valuation approach and/or a valuation technique. The disclosure requirements are effective for fiscal years and interim periods within those fiscal years beginning after December 15, 2016. Management is currently evaluating the potential impact of this new guidance to the financial statements.
9. REGULATORY CHANGES
In October 2016, the Securities and Exchange Commission (“SEC”) adopted new rules and forms and amended existing rules and forms (together, “final rules”) intended to modernize and enhance the reporting and disclosure of information by registered investment companies and to enhance liquidity risk management by open-end mutual funds and exchange-traded funds. The final rules will enhance the quality of information available to investors and will allow the SEC to more effectively collect and use data reported by funds. In part, the final rules amend Regulation S-X and require standardized, enhanced disclosure about derivatives in the Fund’s financial statements, as well as other amendments. The compliance date for the amendments to Regulation S-X is August 1, 2017 while the compliance date for the new form types is June 1, 2018 and the compliance date for the liquidity risk management program requirements is December 1, 2018. Management is currently assessing the potential impact of these enhancements and their impact on the financial statement disclosures and reporting requirements.
| | | | | | |
| Other information (unaudited) | | Wells Fargo Intrinsic Value Fund | | | 27 | |
PROXY VOTING INFORMATION
A description of the policies and procedures that the Fund uses to determine how to vote proxies relating to portfolio securities is available, upon request, by calling 1-800-222-8222, visiting our website at wellsfargofunds.com, or visiting the SEC website at sec.gov. Information regarding how the Fund voted proxies relating to portfolio securities during the most recent 12-month period ended June 30 is available on the Fund’s website at wellsfargofunds.com or by visiting the SEC website at sec.gov.
PORTFOLIO HOLDINGS INFORMATION
The complete portfolio holdings for the Fund are publicly available monthly on the Fund’s website (wellsfargofunds.com), on a one-month delayed basis. In addition, top ten holdings information (excluding derivative positions) for the Fund is publicly available on the Fund’s website on a monthly, seven-day or more delayed basis. The Fund files its complete schedule of portfolio holdings with the SEC for the first and third quarters of each fiscal year on Form N-Q, which is available by visiting the SEC website at sec.gov. In addition, the Fund’s Form N-Q may be reviewed and copied at the SEC’s Public Reference Room in Washington, DC, and at regional offices in New York City, at 233 Broadway, and in Chicago, at 175 West Jackson Boulevard, Suite 900. Information about the Public Reference Room may be obtained by calling 1-800-SEC-0330.
| | | | |
| 28 | | Wells Fargo Intrinsic Value Fund | | Other information (unaudited) |
BOARD OF TRUSTEES AND OFFICERS
Each of the Trustees and Officers1 listed in the table below acts in identical capacities for each fund in the Wells Fargo family of funds, which consists of 138 mutual funds comprising the Wells Fargo Funds Trust, Wells Fargo Variable Trust, Wells Fargo Master Trust and four closed-end funds (collectively the “Fund Complex”). This table should be read in conjunction with the Prospectus and the Statement of Additional Information2. The mailing address of each Trustee and Officer is 525 Market Street, 12th Floor, San Francisco, CA 94105. Each Trustee and Officer serves an indefinite term, however, each Trustee serves such term until reaching the mandatory retirement age established by the Trustees.
Independent Trustees
| | | | | | |
Name and
year of birth | | Position held and
length of service* | | Principal occupations during past five years or longer | | Current other
public company or
investment company
directorships |
William R. Ebsworth (Born 1957) | | Trustee, since 2015 | | Retired. From 1984 to 2013, equities analyst, portfolio manager, research director and chief financial officer at Fidelity Management and Research Company in Boston, Tokyo, and Hong Kong and retired in 2013 as Chief Investment Officer of Fidelity Strategic Advisers, Inc. where he lead a team of investment professionals managing client assets. Prior thereto, Board member of Hong Kong Securities Clearing Co., Hong Kong Options Clearing Corp., the Thailand International Fund, Ltd., Fidelity Investments Life Insurance Company, and Empire Fidelity Investments Life Insurance Company. Board member of the Fonté Foundation (non-profit organization) and the Vincent Memorial Hospital Endowment (non-profit organization), where he serves on the Investment Committee and as a Chair of the Audit Committee. Mr. Ebsworth is a CFA® charterholder and an Adjunct Lecturer, Finance, at Babson College. | | Asset Allocation Trust |
Jane A. Freeman (Born 1953) | | Trustee, since 2015 | | Retired. From 2012 to 2014 and 1999 to 2008, Chief Financial Officer of Scientific Learning Corporation. From 2008 to 2012, Ms. Freeman provided consulting services related to strategic business projects. Prior to 1999, Portfolio Manager at Rockefeller & Co. and Scudder, Stevens & Clark. Board member of the Harding Loevner Funds from 1996 to 2014, serving as both Lead Independent Director and chair of the Audit Committee. Board member of the Russell Exchange Traded Funds Trust from 2011 to 2012 and the chair of the Audit Committee. Ms. Freeman is Chair of Taproot Foundation (non-profit organization), a Board Member of Ruth Bancroft Garden (non-profit organization) and an inactive chartered financial analyst. | | Asset Allocation Trust |
Peter G. Gordon** (Born 1942) | | Trustee, since 1998; Chairman, since 2005 | | Co-Founder, Retired Chairman, President and CEO of Crystal Geyser Water Company. Trustee Emeritus, Colby College. | | Asset Allocation Trust |
Isaiah Harris, Jr. (Born 1952) | | Trustee, since 2009 | | Retired. Chairman of the Board of CIGNA Corporation since 2009, and Director since 2005. From 2003 to 2011, Director of Deluxe Corporation. Prior thereto, President and CEO of BellSouth Advertising and Publishing Corp. from 2005 to 2007, President and CEO of BellSouth Enterprises from 2004 to 2005 and President of BellSouth Consumer Services from 2000 to 2003. Emeritus member of the Iowa State University Foundation Board of Governors. Emeritus Member of the Advisory Board of Iowa State University School of Business. Advisory Board Member, Palm Harbor Academy (charter school). Advisory Board Member, Child Evangelism Fellowship (non-profit). Mr. Harris is a certified public accountant (inactive status). | | CIGNA Corporation; Asset Allocation Trust |
Judith M. Johnson (Born 1949) | | Trustee, since 2008; Audit Committee Chairman, since 2008 | | Retired. Prior thereto, Chief Executive Officer and Chief Investment Officer of Minneapolis Employees Retirement Fund from 1996 to 2008. Ms. Johnson is an attorney, certified public accountant and a certified managerial accountant. | | Asset Allocation Trust |
David F. Larcker (Born 1950) | | Trustee, since 2009 | | James Irvin Miller Professor of Accounting at the Graduate School of Business, Stanford University, Director of the Corporate Governance Research Initiative and Senior Faculty of The Rock Center for Corporate Governance since 2006. From 2005 to 2008, Professor of Accounting at the Graduate School of Business, Stanford University. Prior thereto, Ernst & Young Professor of Accounting at The Wharton School, University of Pennsylvania from 1985 to 2005. | | Asset Allocation Trust |
| | | | | | |
| Other information (unaudited) | | Wells Fargo Intrinsic Value Fund | | | 29 | |
| | | | | | |
Name and
year of birth | | Position held and
length of service* | | Principal occupations during past five years or longer | | Current other
public company or
investment company
directorships |
Olivia S. Mitchell (Born 1953) | | Trustee, since 2006 | | International Foundation of Employee Benefit Plans Professor, Wharton School of the University of Pennsylvania since 1993. Director of Wharton’s Pension Research Council and Boettner Center on Pensions & Retirement Research, and Research Associate at the National Bureau of Economic Research. Previously, Cornell University Professor from 1978 to 1993. | | Asset Allocation Trust |
Timothy J. Penny (Born 1951) | | Trustee, since 1996 | | President and Chief Executive Officer of Southern Minnesota Initiative Foundation, a non-profit organization, since 2007 and Senior Fellow at the Humphrey Institute Policy Forum at the University of Minnesota since 1995. Member of the Board of Trustees of NorthStar Education Finance, Inc., a non-profit organization, since 2007. | | Asset Allocation Trust |
Michael S. Scofield (Born 1943) | | Trustee, since 2010 | | Served on the Investment Company Institute’s Board of Governors and Executive Committee from 2008-2011 as well the Governing Council of the Independent Directors Council from 2006-2011 and the Independent Directors Council Executive Committee from 2008-2011. Chairman of the IDC from 2008-2010. Institutional Investor (Fund Directions) Trustee of Year in 2007. Trustee of the Evergreen Funds complex (and its predecessors) from 1984 to 2010. Chairman of the Evergreen Funds from 2000-2010. Former Trustee of the Mentor Funds. Retired Attorney, Law Offices of Michael S. Scofield. | | Asset Allocation Trust |
| * | Length of service dates reflect the Trustee’s commencement of service with the Trust’s predecessor entities, where applicable. |
| ** | Peter Gordon is expected to retire on December 31, 2017. |
Officers
| | | | | | |
Name and
year of birth | | Position held and
length of service | | Principal occupations during past five years or longer | | |
Andrew Owen (Born 1960) | | President, since 2017 | | Executive Vice President of Wells Fargo Bank, N.A. and President of Wells Fargo & Company and Head of Affiliated Managers, Wells Fargo Asset Management, since 2014. Executive Vice President responsible for marketing, investments and product development for Wells Fargo Funds Management, LLC, from 2009 to 2014. | | |
Jeremy DePalma1 (Born 1974) | | Treasurer, since 2012 | | Senior Vice President of Wells Fargo Funds Management, LLC since 2009. Senior Vice President of Evergreen Investment Management Company, LLC from 2008 to 2010 and head of the Fund Reporting and Control Team within Fund Administration from 2005 to 2010. | | |
C. David Messman (Born 1960) | | Secretary, since 2000; Chief Legal Officer, since 2003 | | Senior Vice President and Secretary of Wells Fargo Funds Management, LLC since 2001. Assistant General Counsel of Wells Fargo Bank, N.A. since 2013 and Vice President and Managing Counsel of Wells Fargo Bank, N.A. from 1996 to 2013. | | |
Michael Whitaker (Born 1967) | | Chief Compliance Officer, since 2016 | | Executive Vice President of Wells Fargo Funds Management, LLC since 2016. Chief Compliance Officer of Fidelity’s Fixed Income Funds and Asset Allocation Funds from 2008 to 2016, Compliance Officer of FMR Co., Inc. from 2014 to 2016, Fidelity Investments Money Management, Inc. from 2014 to 2016, Fidelity Investments from 2007 to 2016. | | |
David Berardi (Born 1975) | | Assistant Treasurer, since 2009 | | Vice President of Wells Fargo Funds Management, LLC since 2009. Vice President of Evergreen Investment Management Company, LLC from 2008 to 2010. Manager of Fund Reporting and Control for Evergreen Investment Management Company, LLC from 2004 to 2010. | | |
| 1 | Jeremy DePalma acts as Treasurer of 69 funds and Assistant Treasurer of 69 funds in the Fund Complex. |
| 2 | The Statement of Additional Information includes additional information about the Trustees and is available, without charge, upon request, by calling 1-800-222-8222 or by visiting the website at wellsfargofunds.com. |
| | | | |
| 30 | | Wells Fargo Intrinsic Value Fund | | List of abbreviations |
The following is a list of common abbreviations for terms and entities that may have appeared in this report.
| ACA | — ACA Financial Guaranty Corporation |
| ADR | — American depositary receipt |
| ADS | — American depositary shares |
| AGC | — Assured Guaranty Corporation |
| AGM | — Assured Guaranty Municipal |
| Ambac | — Ambac Financial Group Incorporated |
| AMT | — Alternative minimum tax |
| BAN | — Bond anticipation notes |
| BHAC | — Berkshire Hathaway Assurance Corporation |
| CAB | — Capital appreciation bond |
| CCAB | — Convertible capital appreciation bond |
| CDA | — Community Development Authority |
| CDO | — Collateralized debt obligation |
| DRIVER | — Derivative inverse tax-exempt receipts |
| DW&P | — Department of Water & Power |
| DWR | — Department of Water Resources |
| ECFA | — Educational & Cultural Facilities Authority |
| EDA | — Economic Development Authority |
| EDFA | — Economic Development Finance Authority |
| ETF | — Exchange-traded fund |
| FDIC | — Federal Deposit Insurance Corporation |
| FFCB | — Federal Farm Credit Banks |
| FGIC | — Financial Guaranty Insurance Corporation |
| FHA | — Federal Housing Administration |
| FHLB | — Federal Home Loan Bank |
| FHLMC | — Federal Home Loan Mortgage Corporation |
| FICO | — The Financing Corporation |
| FNMA | — Federal National Mortgage Association |
| GDR | — Global depositary receipt |
| GNMA | — Government National Mortgage Association |
| HCFR | — Healthcare facilities revenue |
| HEFA | — Health & Educational Facilities Authority |
| HEFAR | — Higher education facilities authority revenue |
| HFA | — Housing Finance Authority |
| HFFA | — Health Facilities Financing Authority |
| HUD | — Department of Housing and Urban Development |
| IDA | — Industrial Development Authority |
| IDAG | — Industrial Development Agency |
| KRW | — Republic of Korea won |
| LIBOR | — London Interbank Offered Rate |
| LIFER | — Long Inverse Floating Exempt Receipts |
| LLC | — Limited liability company |
| LLLP | — Limited liability limited partnership |
| LLP | — Limited liability partnership |
| MBIA | — Municipal Bond Insurance Association |
| MFHR | — Multifamily housing revenue |
| MSTR | — Municipal securities trust receipts |
| MUD | — Municipal Utility District |
| National | — National Public Finance Guarantee Corporation |
| PCFA | — Pollution Control Financing Authority |
| PCL | — Public Company Limited |
| PCR | — Pollution control revenue |
| PFA | — Public Finance Authority |
| PFFA | — Public Facilities Financing Authority |
| PFOTER | — Puttable floating option tax-exempt receipts |
| plc | — Public limited company |
| PUTTER | — Puttable tax-exempt receipts |
| R&D | — Research & development |
| Radian | — Radian Asset Assurance |
| RAN | — Revenue anticipation notes |
| RDA | — Redevelopment Authority |
| RDFA | — Redevelopment Finance Authority |
| REIT | — Real estate investment trust |
| ROC | — Reset option certificates |
| SAVRS | — Select auction variable rate securities |
| SBA | — Small Business Authority |
| SDR | — Swedish depositary receipt |
| SFHR | — Single-family housing revenue |
| SFMR | — Single-family mortgage revenue |
| SPA | — Standby purchase agreement |
| SPDR | — Standard & Poor’s Depositary Receipts |
| SPEAR | — Short Puttable Exempt Adjustable Receipts |
| STRIPS | — Separate trading of registered interest and |
| TAN | — Tax anticipation notes |
| TIPS | — Treasury inflation-protected securities |
| TRAN | — Tax revenue anticipation notes |
| TTFA | — Transportation Trust Fund Authority |
| TVA | — Tennessee Valley Authority |
This page is intentionally left blank.
This page is intentionally left blank.

For more information
More information about Wells Fargo Funds is available free upon request. To obtain literature, please write, email, visit the Fund’s website, or call:
Wells Fargo Funds
P.O. Box 8266
Boston, MA 02266-8266
Email: fundservice@wellsfargo.com
Website: wellsfargofunds.com
Individual investors: 1-800-222-8222
Retail investment professionals: 1-888-877-9275
Institutional investment professionals: 1-866-765-0778
This report and the financial statements contained herein are submitted for the general information of the shareholders of the Fund. If this report is used for promotional purposes, distribution of the report must be accompanied or preceded by a current prospectus. Before investing, please consider the investment objectives, risks, charges, and expenses of the investment. For a current prospectus and, if available, a summary prospectus, containing this information, call 1-800-222-8222 or visit the Fund’s website at wellsfargofunds.com. Read the prospectus carefully before you invest or send money.
Wells Fargo Asset Management (WFAM) is a trade name used by the asset management businesses of Wells Fargo & Company. Wells Fargo Funds Management, LLC, a wholly owned subsidiary of Wells Fargo & Company, provides investment advisory and administrative services for Wells Fargo Funds. Other affiliates of Wells Fargo & Company provide subadvisory and other services for the funds. The funds are distributed by Wells Fargo Funds Distributor, LLC, Member FINRA, an affiliate of Wells Fargo & Company. Neither Wells Fargo Funds Management nor Wells Fargo Funds Distributor has Fund customer accounts/assets, and neither provides investment advice/recommendations or acts as an investment advice fiduciary to any investor.
NOT FDIC INSURED ◾ NO BANK GUARANTEE ◾ MAY LOSE VALUE
© 2017 Wells Fargo Funds Management, LLC. All rights reserved.
| | |
 | | 301459 03-17 SA207/SAR207 01-17 |
Semi-Annual Report
January 31, 2017

Wells Fargo Large Cap Core Fund


Reduce clutter. Save trees.
Sign up for electronic delivery of prospectuses and shareholder reports at wellsfargo.com/advantagedelivery
Contents
The views expressed and any forward-looking statements are as of January 31, 2017, unless otherwise noted, and are those of the Fund managers and/or Wells Fargo Funds Management, LLC. Discussions of individual securities, or the markets generally, or any Wells Fargo Fund are not intended as individual recommendations. Future events or results may vary significantly from those expressed in any forward-looking statements. The views expressed are subject to change at any time in response to changing circumstances in the market. Wells Fargo Funds Management, LLC and the Fund disclaim any obligation to publicly update or revise any views expressed or forward-looking statements.
NOT FDIC INSURED ◾ NO BANK GUARANTEE ◾ MAY LOSE VALUE
| | | | |
| 2 | | Wells Fargo Large Cap Core Fund | | Letter to shareholders (unaudited) |

Andrew Owen
President
Wells Fargo Funds
U.S. and international stocks returned 5.96% and 4.16% for the six-month period, respectively; within fixed income, the Bloomberg Barclays U.S. Aggregate Bond Index3 returned -2.95%.
Dear Shareholder:
As the new president of Wells Fargo Funds now that Karla Rabusch is retiring from that position after nearly 14 years, I am pleased to offer you this semi-annual report for the Wells Fargo Large Cap Core Fund for the six-month period that ended January 31, 2017. Despite heightened market volatility, global stocks delivered favorable results overall. U.S. and international stocks returned 5.96% and 4.16% for the six-month period, respectively, as measured by the S&P 500 Index1 and the MSCI ACWI ex USA Index (Net)2; within fixed income, the Bloomberg Barclays U.S. Aggregate Bond Index3 returned -2.95%.
In August–September 2016, global stocks delivered generally positive results; bonds’ interest rates remained historically low.
From August into early September 2016, U.S. and international stocks generally trended upward. Ever since the Great Recession, markets worldwide have been supported to varying degrees by accommodative policies from leading central banks, including the Federal Reserve (Fed), European Central Bank, Bank of England, and Bank of Japan. As a result, investors have watched closely for any signs that global central banks might tighten their measures. In the U.S., early-September comments by several Fed officials appeared to suggest a September interest-rate increase, which sent stock and bond prices downward. However, stocks surged following the Fed’s September 20 meeting on news that the Fed had decided to delay a rate increase to later in 2016. In bond markets, interest rates remained at historically low levels as a result of easy monetary policies, subdued global growth, and modest inflation expectations. Yields rose, after bottoming in July, as market participants felt that yields had overshot the real risks of the U.K.’s Brexit vote and as economic activity strengthened. At the front end of the yield curve, anticipation of new money market fund rules resulted in significantly higher yields on many short-term securities.
During the fourth quarter of 2016, prospects for faster growth and higher interest rates in the U.S. largely influenced the markets.
Early in the fourth quarter of 2016, U.S. stocks tended to trade lower amid concerns such as a likely interest-rate increase and uncertainty over the approaching general election. However, following Donald Trump’s election as president in early November, U.S. stocks began to rally. Investors appeared optimistic that the new administration would usher in a series of pro-growth policies, and supportive economic news helped the rally carry through the quarter. The buoyant environment sent interest rates higher as well. At its mid-December meeting, Fed officials raised their short-term target interest rate for the first time in a year, by a quarter percentage point, to between 0.50% and 0.75%. The fourth quarter also saw the implementation of the Securities and Exchange Commission’s new rules for money market funds, which included floating net asset values (NAVs) for institutional prime and municipal money market funds as well as liquidity fees and redemption gates. In the year leading up to
| 1 | The S&P 500 Index consists of 500 stocks chosen for market size, liquidity, and industry group representation. It is a market-value-weighted index with each stock’s weight in the index proportionate to its market value. You cannot invest directly in an index. |
| 2 | The Morgan Stanley Capital International (MSCI) All Country World Index (ACWI) ex USA Index (Net) is a free-float-adjusted market-capitalization-weighted index that is designed to measure the equity market performance of developed markets, excluding the United States and Canada. Source: MSCI. MSCI makes no express or implied warranties or representations and shall have no liability whatsoever with respect to any MSCI data contained herein. The MSCI data may not be further redistributed or used as a basis for other indexes or any securities or financial products. This report is not approved, reviewed, or produced by MSCI. You cannot invest directly in an index. |
| 3 | The Bloomberg Barclays U.S. Aggregate Bond Index (formerly known as Barclays U.S. Aggregate Bond Index) is a broad-based benchmark that measures the investment-grade, U.S. dollar–denominated, fixed-rate taxable bond market, including Treasuries, government-related and corporate securities, mortgage-backed securities (agency fixed-rate and hybrid adjustable-rate mortgage pass-throughs), asset-backed securities, and commercial mortgage-backed securities. You cannot invest directly in an index. |
| | | | | | |
| Letter to shareholders (unaudited) | | Wells Fargo Large Cap Core Fund | | | 3 | |
money fund reform implementation, nearly $1 trillion in assets moved from these types of money market funds into government money market funds, which continued to transact at a stable $1 NAV. Outside of the U.S., the prospects for faster U.S. growth appeared to trigger some acceleration in Europe. The improvement may be partly attributable to expectations for further strengthening of the U.S. dollar, which in turn could improve demand for European goods in the U.S. due to weakening of the euro relative to the dollar.
Investor optimism continued into January 2017.
January brought continued strength in global stock markets. Markets were lifted by factors such as strong trade data from Japan, robust earnings reports by businesses, and investors’ hopes that the U.S. government will approve a large fiscal stimulus package.
Don’t let short-term uncertainty derail long-term investment goals.
Periods of uncertainty can present challenges, but experience has taught us that maintaining long-term investment goals can be an effective way to plan for the future. To help you create a sound strategy based on your personal goals and risk tolerance, Wells Fargo Funds offers more than 100 mutual funds spanning a wide range of asset classes and investment styles. Although diversification cannot guarantee an investment profit or prevent losses, we believe it can be an effective way to manage investment risk and potentially smooth out overall portfolio performance. We encourage investors to know their investments and to understand that appropriate levels of risk-taking may unlock opportunities.
Thank you for choosing to invest in Wells Fargo Funds. We appreciate your confidence in us and remain committed to helping you meet your financial needs.
Sincerely,

Andrew Owen
President
Wells Fargo Funds
Although diversification cannot guarantee an investment profit or prevent losses, we believe it can be an effective way to manage investment risk and potentially smooth out overall portfolio performance.
For further information about your Fund, contact your investment professional, visit our website at wellsfargofunds.com, or call us directly at 1-800-222-8222. We are available 24 hours a day, 7 days a week.
| | | | |
| 4 | | Wells Fargo Large Cap Core Fund | | Performance highlights (unaudited) |
Investment objective
The Fund seeks long-term capital appreciation.
Manager
Wells Fargo Funds Management, LLC
Subadviser
Golden Capital Management, LLC
Portfolio managers
John R. Campbell, CFA®
Jeff C. Moser, CFA®
Average annual total returns (%) as of January 31, 20171
| | | | | | | | | | | | | | | | | | | | | | | | | | | | | | | | | | |
| | | | | Including sales charge | | | Excluding sales charge | | | Expense ratios2 (%) | |
| | | Inception date | | 1 year | | | 5 year | | | Since
inception | | | 1 year | | | 5 year | | | Since
inception | | | Gross | | | Net3 | |
| Class A (EGOAX) | | 12-17-2007 | | | 12.27 | | | | 12.58 | | | | 5.78 | | | | 19.12 | | | | 13.91 | | | | 6.47 | | | | 1.20 | | | | 1.14 | |
| Class C (EGOCX) | | 12-17-2007 | | | 17.18 | | | | 13.07 | | | | 5.70 | | | | 18.18 | | | | 13.07 | | | | 5.70 | | | | 1.95 | | | | 1.89 | |
| Class R (EGOHX) | | 9-30-2015 | | | – | | | | – | | | | – | | | | 18.79 | | | | 13.64 | | | | 6.22 | | | | 1.45 | | | | 1.39 | |
| Class R6 (EGORX) | | 9-30-2015 | | | – | | | | – | | | | – | | | | 23.11 | | | | 15.12 | | | | 7.26 | | | | 0.77 | | | | 0.68 | |
| Administrator Class (WFLLX) | | 7-16-2010 | | | – | | | | – | | | | – | | | | 19.13 | | | | 14.17 | | | | 6.66 | | | | 1.12 | | | | 1.00 | |
| Institutional Class (EGOIX) | | 12-17-2007 | | | – | | | | – | | | | – | | | | 19.66 | | | | 14.47 | | | | 6.93 | | | | 0.87 | | | | 0.70 | |
| S&P 500 Index4 | | – | | | – | | | | – | | | | – | | | | 20.04 | | | | 14.09 | | | | 7.42 | | | | – | | | | – | |
Figures quoted represent past performance, which is no guarantee of future results, and do not reflect taxes that a shareholder may pay on fund distributions or the redemption of fund shares. Investment return and principal value of an investment will fluctuate so that an investor’s shares, when redeemed, may be worth more or less than their original cost. Performance shown without sales charges would be lower if sales charges were reflected. Current performance may be lower or higher than the performance data quoted, which assumes the reinvestment of dividends and capital gains. Current month-end performance is available on the Fund’s website, wellsfargofunds.com.
Index returns do not include transaction costs associated with buying and selling securities, any mutual fund fees or expenses, or any taxes. It is not possible to invest directly in an index.
For Class A shares, the maximum front-end sales charge is 5.75%. For Class C shares, the maximum contingent deferred sales charge is 1.00%. Performance including a contingent deferred sales charge assumes the sales charge for the corresponding time period. Class R, Class R6, Administrator Class, and Institutional Class shares are sold without a front-end sales charge or contingent deferred sales charge.
Stock values fluctuate in response to the activities of individual companies and general market and economic conditions. Certain investment strategies tend to increase the total risk of an investment (relative to the broader market). The Fund is exposed to foreign investment risk and focused portfolio risk. Consult the Fund’s prospectus for additional information on these and other risks.
Please see footnotes on page 5.
| | | | | | |
| Performance highlights (unaudited) | | Wells Fargo Large Cap Core Fund | | | 5 | |
| | | | |
| Ten largest holdings (%) as of January 31, 20175 | |
NVIDIA Corporation | | | 2.81 | |
Microsoft Corporation | | | 2.53 | |
Lincoln National Corporation | | | 2.48 | |
SunTrust Banks Incorporated | | | 2.46 | |
JPMorgan Chase & Company | | | 2.36 | |
Comcast Corporation Class A | | | 2.29 | |
Apple Incorporated | | | 2.27 | |
Lear Corporation | | | 2.25 | |
Linear Technology Corporation | | | 2.24 | |
Goldman Sachs Group Incorporated | | | 2.23 | |
|
| Sector distribution as of January 31, 20176 |
|
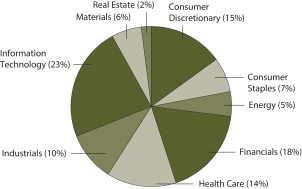
|
| 1 | Historical performance shown for Class R shares prior to their inception reflects the performance of Administrator Class shares, adjusted to reflect higher expenses applicable to Class R shares. Historical performance shown for Class R6 shares prior to their inception reflects the performance of Institutional Class shares, and adjusted to reflect higher expenses applicable to Class R6 shares. Historical performance shown for Administrator Class shares prior to their inception reflects the performance of Institutional Class shares, adjusted to reflect higher expenses applicable to Administrator Class shares. Historical performance shown for all classes of the Fund prior to July 19, 2010, is based on the performance of the Fund’s predecessor, Evergreen Golden Large Cap Core Fund. |
| 2 | Reflects the expense ratios as stated in the most recent prospectuses. The expense ratios shown are subject to change and may differ from the annualized expense ratios shown in the financial highlights of this report. |
| 3 | The manager has contractually committed through November 30, 2017, to waive fees and/or reimburse expenses to the extent necessary to cap the Fund’s Total Annual Fund Operating Expenses After Fee Waiver at the amounts shown. After this time, the cap may be increased or the commitment to maintain the cap may be terminated only with the approval of the Board of Trustees. Brokerage commissions, stamp duty fees, interest, taxes, acquired fund fees and expenses, and extraordinary expenses are excluded from the expense cap. Without this cap, the Fund’s returns would have been lower. |
| 4 | The S&P 500 Index consists of 500 stocks chosen for market size, liquidity, and industry group representation. It is a market-value weighted index with each stock’s weight in the index proportionate to its market value. You cannot invest directly in an index. |
| 5 | The ten largest holdings, excluding cash and cash equivalents, are calculated based on the value of the investments divided by total net assets of the Fund. Holdings are subject to change and may have changed since the date specified. |
| 6 | Amounts are calculated based on the total long-term investments of the Fund. These amounts are subject to change and may have changed since the date specified. |
| | | | |
| 6 | | Wells Fargo Large Cap Core Fund | | Fund expenses (unaudited) |
As a shareholder of the Fund, you incur two types of costs: (1) transaction costs, including sales charges (loads) on purchase payments and contingent deferred sales charges (if any) on redemptions and (2) ongoing costs, including management fees, distribution (12b-1) and/or shareholder servicing fees, and other Fund expenses. This example is intended to help you understand your ongoing costs (in dollars) of investing in the Fund and to compare these costs with the ongoing costs of investing in other mutual funds.
The example is based on an investment of $1,000 invested at the beginning of the six-month period and held for the entire period from August 1, 2016 to January 31, 2017.
Actual expenses
The “Actual” line of the table below provides information about actual account values and actual expenses. You may use the information in this line, together with the amount you invested, to estimate the expenses that you paid over the period. Simply divide your account value by $1,000 (for example, an $8,600 account value divided by $1,000 = 8.6), then multiply the result by the number in the “Actual” line under the heading entitled “Expenses paid during period” for your applicable class of shares to estimate the expenses you paid on your account during this period.
Hypothetical example for comparison purposes
The “Hypothetical” line of the table below provides information about hypothetical account values and hypothetical expenses based on the Fund’s actual expense ratio and an assumed rate of return of 5% per year before expenses, which is not the Fund’s actual return. The hypothetical account values and expenses may not be used to estimate the actual ending account balance or expenses you paid for the period. You may use this information to compare the ongoing costs of investing in the Fund and other funds. To do so, compare this 5% hypothetical example with the 5% hypothetical examples that appear in the shareholder reports of the other funds.
Please note that the expenses shown in the table are meant to highlight your ongoing costs only and do not reflect any transactional costs, such as sales charges (loads) and contingent deferred sales charges. Therefore, the “Hypothetical” line of the table is useful in comparing ongoing costs only and will not help you determine the relative total costs of owning different funds. In addition, if these transactional costs were included, your costs would have been higher.
| | | | | | | | | | | | | | | | |
| | | Beginning
account value
8-1-2016 | | | Ending
account value
1-31-2017 | | | Expenses
paid during
the period¹ | | | Annualized net
expense ratio | |
Class A | | | | | | | | | | | | | | | | |
Actual | | $ | 1,000.00 | | | $ | 1,097.50 | | | $ | 6.01 | | | | 1.14 | % |
Hypothetical (5% return before expenses) | | $ | 1,000.00 | | | $ | 1,019.41 | | | $ | 5.79 | | | | 1.14 | % |
Class C | | | | | | | | | | | | | | | | |
Actual | | $ | 1,000.00 | | | $ | 1,092.80 | | | $ | 9.94 | | | | 1.89 | % |
Hypothetical (5% return before expenses) | | $ | 1,000.00 | | | $ | 1,015.63 | | | $ | 9.58 | | | | 1.89 | % |
Class R | | | | | | | | | | | | | | | | |
Actual | | $ | 1,000.00 | | | $ | 1,096.24 | | | $ | 7.32 | | | | 1.39 | % |
Hypothetical (5% return before expenses) | | $ | 1,000.00 | | | $ | 1,018.15 | | | $ | 7.05 | | | | 1.39 | % |
Class R6 | | | | | | | | | | | | | | | | |
Actual | | $ | 1,000.00 | | | $ | 1,131.75 | | | $ | 3.64 | | | | 0.68 | % |
Hypothetical (5% return before expenses) | | $ | 1,000.00 | | | $ | 1,021.72 | | | $ | 3.46 | | | | 0.68 | % |
Administrator Class | | | | | | | | | | | | | | | | |
Actual | | $ | 1,000.00 | | | $ | 1,097.12 | | | $ | 5.27 | | | | 1.00 | % |
Hypothetical (5% return before expenses) | | $ | 1,000.00 | | | $ | 1,020.11 | | | $ | 5.08 | | | | 1.00 | % |
Institutional Class | | | | | | | | | | | | | | | | |
Actual | | $ | 1,000.00 | | | $ | 1,099.98 | | | $ | 3.70 | | | | 0.70 | % |
Hypothetical (5% return before expenses) | | $ | 1,000.00 | | | $ | 1,021.62 | | | $ | 3.56 | | | | 0.70 | % |
| 1 | Expenses paid is equal to the annualized net expense ratio of each class multiplied by the average account value over the period, multiplied by the number of days in the most recent fiscal half-year divided by the number of days in the fiscal year (to reflect the one-half-year period). |
| | | | | | |
| Portfolio of investments—January 31, 2017 (unaudited) | | Wells Fargo Large Cap Core Fund | | | 7 | |
| | | | | | | | | | | | | | | | |
| Security name | | | | | | | | Shares | | | Value | |
| | | | |
Common Stocks: 99.20% | | | | | | | | | | | | | | | | |
| | | | |
Consumer Discretionary: 14.46% | | | | | | | | | | | | | | | | |
| | | | |
| Auto Components: 2.25% | | | | | | | | | | | | | | | | |
Lear Corporation | | | | | | | | | | | 163,713 | | | $ | 23,261,980 | |
| | | | | | | | | | | | | | | | |
| | | | |
| Automobiles: 2.05% | | | | | | | | | | | | | | | | |
General Motors Company | | | | | | | | | | | 578,562 | | | | 21,181,155 | |
| | | | | | | | | | | | | | | | |
| | | | |
| Media: 2.29% | | | | | | | | | | | | | | | | |
Comcast Corporation Class A | | | | | | | | | | | 314,540 | | | | 23,722,607 | |
| | | | | | | | | | | | | | | | |
| | | | |
| Specialty Retail: 7.87% | | | | | | | | | | | | | | | | |
Foot Locker Incorporated | | | | | | | | | | | 293,200 | | | | 20,095,928 | |
Lowe’s Companies Incorporated | | | | | | | | | | | 288,185 | | | | 21,060,560 | |
The Home Depot Incorporated | | | | | | | | | | | 160,840 | | | | 22,128,367 | |
The TJX Companies Incorporated | | | | | | | | | | | 242,589 | | | | 18,174,768 | |
| | | | |
| | | | | | | | | | | | | | | 81,459,623 | |
| | | | | | | | | | | | | | | | |
| | | | |
Consumer Staples: 7.07% | | | | | | | | | | | | | | | | |
| | | | |
| Food & Staples Retailing: 5.16% | | | | | | | | | | | | | | | | |
CVS Health Corporation | | | | | | | | | | | 213,791 | | | | 16,848,869 | |
Sysco Corporation | | | | | | | | | | | 361,606 | | | | 18,969,851 | |
Wal-Mart Stores Incorporated | | | | | | | | | | | 263,512 | | | | 17,586,791 | |
| | | | |
| | | | | | | | | | | | | | | 53,405,511 | |
| | | | | | | | | | | | | | | | |
| | | | |
| Food Products: 1.91% | | | | | | | | | | | | | | | | |
Pinnacle Foods Incorporated | | | | | | | | | | | 370,300 | | | | 19,696,257 | |
| | | | | | | | | | | | | | | | |
| | | | |
Energy: 5.44% | | | | | | | | | | | | | | | | |
| | | | |
| Oil, Gas & Consumable Fuels: 5.44% | | | | | | | | | | | | | | | | |
Chevron Corporation | | | | | | | | | | | 174,855 | | | | 19,470,104 | |
Exxon Mobil Corporation | | | | | | | | | | | 219,788 | | | | 18,438,015 | |
Valero Energy Corporation | | | | | | | | | | | 279,942 | | | | 18,408,986 | |
| | | | |
| | | | | | | | | | | | | | | 56,317,105 | |
| | | | | | | | | | | | | | | | |
| | | | |
Financials: 17.66% | | | | | | | | | | | | | | | | |
| | | | |
| Banks: 10.83% | | | | | | | | | | | | | | | | |
Bank of America Corporation | | | | | | | | | | | 888,739 | | | | 20,121,051 | |
Citizens Financial Group Incorporated | | | | | | | | | | | 561,689 | | | | 20,316,291 | |
Huntington Bancshares Incorporated | | | | | | | | | | | 1,602,584 | | | | 21,682,962 | |
JPMorgan Chase & Company | | | | | | | | | | | 289,097 | | | | 24,466,279 | |
SunTrust Banks Incorporated | | | | | | | | | | | 447,619 | | | | 25,433,712 | |
| | | | |
| | | | | | | | | | | | | | | 112,020,295 | |
| | | | | | | | | | | | | | | | |
| | | | |
| Capital Markets: 2.23% | | | | | | | | | | | | | | | | |
Goldman Sachs Group Incorporated | | | | | | | | | | | 100,744 | | | | 23,102,614 | |
| | | | | | | | | | | | | | | | |
The accompanying notes are an integral part of these financial statements.
| | | | |
| 8 | | Wells Fargo Large Cap Core Fund | | Portfolio of investments—January 31, 2017 (unaudited) |
| | | | | | | | | | | | | | | | |
| Security name | | | | | | | | Shares | | | Value | |
| | | | |
| Insurance: 4.60% | | | | | | | | | | | | | | | | |
Lincoln National Corporation | | | | | | | | | | | 380,075 | | | $ | 25,658,863 | |
Prudential Financial Incorporated | | | | | | | | | | | 208,715 | | | | 21,938,034 | |
| | | | |
| | | | | | | | | | | | | | | 47,596,897 | |
| | | | | | | | | | | | | | | | |
| | | | |
Health Care: 14.10% | | | | | | | | | | | | | | | | |
| | | | |
| Biotechnology: 3.18% | | | | | | | | | | | | | | | | |
Amgen Incorporated | | | | | | | | | | | 114,931 | | | | 18,007,389 | |
Gilead Sciences Incorporated | | | | | | | | | | | 205,177 | | | | 14,865,074 | |
| | | | |
| | | | | | | | | | | | | | | 32,872,463 | |
| | | | | | | | | | | | | | | | |
| | | | |
| Health Care Providers & Services: 9.16% | | | | | | | | | | | | | | | | |
Aetna Incorporated | | | | | | | | | | | 182,688 | | | | 21,668,624 | |
Centene Corporation † | | | | | | | | | | | 299,970 | | | | 18,979,102 | |
Envision Healthcare Corporation † | | | | | | | | | | | 226,219 | | | | 15,382,892 | |
HCA Holdings Incorporated † | | | | | | | | | | | 218,491 | | | | 17,540,457 | |
UnitedHealth Group Incorporated | | | | | | | | | | | 130,738 | | | | 21,192,628 | |
| | | | |
| | | | | | | | | | | | | | | 94,763,703 | |
| | | | | | | | | | | | | | | | |
| | | | |
| Pharmaceuticals: 1.76% | | | | | | | | | | | | | | | | |
Merck & Company Incorporated | | | | | | | | | | | 294,198 | | | | 18,237,334 | |
| | | | | | | | | | | | | | | | |
| | | | |
Industrials: 9.74% | | | | | | | | | | | | | | | | |
| | | | |
| Aerospace & Defense: 4.26% | | | | | | | | | | | | | | | | |
Northrop Grumman Corporation | | | | | | | | | | | 92,231 | | | | 21,128,277 | |
Spirit AeroSystems Holdings Incorporated Class A | | | | | | | | | | | 383,023 | | | | 23,000,531 | |
| | | | |
| | | | | | | | | | | | | | | 44,128,808 | |
| | | | | | | | | | | | | | | | |
| | | | |
| Airlines: 1.81% | | | | | | | | | | | | | | | | |
Delta Air Lines Incorporated | | | | | | | | | | | 397,028 | | | | 18,755,603 | |
| | | | | | | | | | | | | | | | |
| | | | |
| Construction & Engineering: 1.86% | | | | | | | | | | | | | | | | |
EMCOR Group Incorporated | | | | | | | | | | | 275,693 | | | | 19,213,045 | |
| | | | | | | | | | | | | | | | |
| | | | |
| Machinery: 1.81% | | | | | | | | | | | | | | | | |
Stanley Black & Decker Incorporated | | | | | | | | | | | 150,651 | | | | 18,680,724 | |
| | | | | | | | | | | | | | | | |
| | | | |
Information Technology: 23.25% | | | | | | | | | | | | | | | | |
| | | | |
| Electronic Equipment, Instruments & Components: 3.98% | | | | | | | | | | | | | | | | |
CDW Corporation of Delaware | | | | | | | | | | | 441,401 | | | | 22,736,566 | |
Jabil Circuit Incorporated | | | | | | | | | | | 769,673 | | | | 18,456,759 | |
| | | | |
| | | | | | | | | | | | | | | 41,193,325 | |
| | | | | | | | | | | | | | | | |
| | | | |
| Internet Software & Services: 1.80% | | | | | | | | | | | | | | | | |
Alphabet Incorporated Class C † | | | | | | | | | | | 23,359 | | | | 18,612,218 | |
| | | | | | | | | | | | | | | | |
| | | | |
| IT Services: 1.75% | | | | | | | | | | | | | | | | |
Accenture plc Class A | | | | | | | | | | | 158,839 | | | | 18,086,997 | |
| | | | | | | | | | | | | | | | |
The accompanying notes are an integral part of these financial statements.
| | | | | | |
| Portfolio of investments—January 31, 2017 (unaudited) | | Wells Fargo Large Cap Core Fund | | | 9 | |
| | | | | | | | | | | | | | | | |
| Security name | | | | | | | | Shares | | | Value | |
| | | | |
| Semiconductors & Semiconductor Equipment: 6.84% | | | | | | | | | | | | | | | | |
Intel Corporation | | | | | | | | | | | 501,908 | | | $ | 18,480,253 | |
Linear Technology Corporation | | | | | | | | | | | 366,911 | | | | 23,163,091 | |
NVIDIA Corporation | | | | | | | | | | | 266,325 | | | | 29,077,364 | |
| | | | |
| | | | | | | | | | | | | | | 70,720,708 | |
| | | | | | | | | | | | | | | | |
| | | | |
| Software: 4.50% | | | | | | | | | | | | | | | | |
Electronic Arts Incorporated † | | | | | | | | | | | 244,847 | | | | 20,427,585 | |
Microsoft Corporation | | | | | | | | | | | 404,782 | | | | 26,169,156 | |
| | | | |
| | | | | | | | | | | | | | | 46,596,741 | |
| | | | | | | | | | | | | | | | |
| | | | |
| Technology Hardware, Storage & Peripherals: 4.38% | | | | | | | | | | | | | | | | |
Apple Incorporated | | | | | | | | | | | 193,683 | | | | 23,503,432 | |
NetApp Incorporated | | | | | | | | | | | 568,863 | | | | 21,798,830 | |
| | | | |
| | | | | | | | | | | | | | | 45,302,262 | |
| | | | | | | | | | | | | | | | |
| | | | |
Materials: 5.81% | | | | | | | | | | | | | | | | |
| | | | |
| Chemicals: 3.97% | | | | | | | | | | | | | | | | |
Air Products & Chemicals Incorporated | | | | | | | | | | | 138,604 | | | | 19,371,295 | |
Dow Chemical Company | | | | | | | | | | | 363,582 | | | | 21,680,395 | |
| | | | |
| | | | | | | | | | | | | | | 41,051,690 | |
| | | | | | | | | | | | | | | | |
| | | | |
| Containers & Packaging: 1.84% | | | | | | | | | | | | | | | | |
Avery Dennison Corporation | | | | | | | | | | | 260,949 | | | | 19,054,496 | |
| | | | | | | | | | | | | | | | |
| | | | |
Real Estate: 1.67% | | | | | | | | | | | | | | | | |
| | | | |
| Equity REITs: 1.67% | | | | | | | | | | | | | | | | |
Prologis Incorporated | | | | | | | | | | | 352,432 | | | | 17,216,303 | |
| | | | | | | | | | | | | | | | |
| | | | |
Total Common Stocks (Cost $834,105,274) | | | | | | | | | | | | | | | 1,026,250,464 | |
| | | | | | | | | | | | | | | | |
| | | | |
| | | Yield | | | | | | | | | | |
| Short-Term Investments: 1.20% | | | | | | | | | | | | | | | | |
| | | | |
| Investment Companies: 1.20% | | | | | | | | | | | | | | | | |
Wells Fargo Government Money Market Fund Select Class (l)(u) | | | 0.46 | % | | | | | | | 12,392,040 | | | | 12,392,040 | |
| | | | | | | | | | | | | | | | |
| | | | |
Total Short-Term Investments (Cost $12,392,040) | | | | | | | | | | | | | | | 12,392,040 | |
| | | | | | | | | | | | | | | | |
| | | | | | | | |
| Total investments in securities (Cost $846,497,314) * | | | 100.40 | % | | | 1,038,642,504 | |
Other assets and liabilities, net | | | (0.40 | ) | | | (4,094,819 | ) |
| | | | | | | | |
| Total net assets | | | 100.00 | % | | $ | 1,034,547,685 | |
| | | | | | | | |
| † | Non-income-earning security |
| (l) | The issuer of the security is an affiliated person of the Fund as defined in the Investment Company Act of 1940. |
| (u) | The rate represents the 7-day annualized yield at period end. |
| * | Cost for federal income tax purposes is $845,409,475 and unrealized gains (losses) consists of: |
| | | | |
Gross unrealized gains | | $ | 200,678,673 | |
Gross unrealized losses | | | (7,445,644 | ) |
| | | | |
Net unrealized gains | | $ | 193,233,029 | |
The accompanying notes are an integral part of these financial statements.
| | | | |
| 10 | | Wells Fargo Large Cap Core Fund | | Statement of assets and liabilities—January 31, 2017 (unaudited) |
| | | | |
| | | | |
| |
Assets | | | | |
Investments | | | | |
In unaffiliated securities, at value (cost $834,105,274) | | $ | 1,026,250,464 | |
In affiliated securities, at value (cost $12,392,040) | | | 12,392,040 | |
| | | | |
Total investments, at value (cost $846,497,314) | | | 1,038,642,504 | |
Receivable for Fund shares sold | | | 1,135,287 | |
Receivable for dividends | | | 526,151 | |
Prepaid expenses and other assets | | | 95,648 | |
| | | | |
Total assets | | | 1,040,399,590 | |
| | | | |
| |
Liabilities | | | | |
Payable for Fund shares redeemed | | | 5,032,649 | |
Management fee payable | | | 507,372 | |
Distribution fees payable | | | 39,579 | |
Administration fees payable | | | 142,005 | |
Accrued expenses and other liabilities | | | 130,300 | |
| | | | |
Total liabilities | | | 5,851,905 | |
| | | | |
Total net assets | | $ | 1,034,547,685 | |
| | | | |
| |
NET ASSETS CONSIST OF | | | | |
Paid-in capital | | $ | 883,512,924 | |
Undistributed net investment income | | | 24,940 | |
Accumulated net realized losses on investments | | | (41,135,369 | ) |
Net unrealized gains on investments | | | 192,145,190 | |
| | | | |
Total net assets | | $ | 1,034,547,685 | |
| | | | |
| |
COMPUTATION OF NET ASSET VALUE AND OFFERING PRICE PER SHARE | | | | |
Net assets – Class A | | $ | 336,233,405 | |
Shares outstanding – Class A1 | | | 20,405,167 | |
Net asset value per share – Class A | | | $16.48 | |
Maximum offering price per share – Class A2 | | | $17.49 | |
Net assets – Class C | | $ | 61,657,414 | |
Shares outstanding – Class C1 | | | 3,793,635 | |
Net asset value per share – Class C | | | $16.25 | |
Net assets – Class R | | $ | 30,339 | |
Shares outstanding – Class R1 | | | 1,835 | |
Net asset value per share – Class R | | | $16.53 | |
Net assets – Class R6 | | $ | 29,878 | |
Shares outstanding – Class R61 | | | 1,810 | |
Net asset value per share – Class R6 | | | $16.51 | |
Net assets – Administrator Class | | $ | 13,896,225 | |
Shares outstanding – Administrator Class1 | | | 834,485 | |
Net asset value per share – Administrator Class | | | $16.65 | |
Net assets – Institutional Class | | $ | 622,700,424 | |
Shares outstanding – Institutional Class1 | | | 37,636,136 | |
Net asset value per share – Institutional Class | | | $16.55 | |
| 1�� | The Fund has an unlimited number of authorized shares. |
| 2 | Maximum offering price is computed as 100/94.25 of net asset value. On investments of $50,000 or more, the offering price is reduced. |
The accompanying notes are an integral part of these financial statements.
| | | | | | |
| Statement of operations—six months ended January 31, 2017 (unaudited) | | Wells Fargo Large Cap Core Fund | | | 11 | |
| | | | |
| | | | |
| |
Investment income | | | | |
Dividends | | $ | 9,689,922 | |
Income from affiliated securities | | | 15,187 | |
Securities lending income, net | | | 6,436 | |
| | | | |
Total investment income | | | 9,711,545 | |
| | | | |
| |
Expenses | | | | |
Management fee | | | 3,478,036 | |
Administration fees | | | | |
Class A | | | 355,450 | |
Class C | | | 68,625 | |
Class R | | | 29 | |
Class R6 | | | 123 | |
Administrator Class | | | 24,791 | |
Institutional Class | | | 370,266 | |
Shareholder servicing fees | | | | |
Class A | | | 423,154 | |
Class C | | | 81,696 | |
Class R | | | 35 | |
Administrator Class | | | 47,160 | |
Distribution fees | | | | |
Class C | | | 245,088 | |
Class R | | | 35 | |
Custody and accounting fees | | | 18,484 | |
Professional fees | | | 23,489 | |
Registration fees | | | 76,785 | |
Shareholder report expenses | | | 60,977 | |
Trustees’ fees and expenses | | | 11,749 | |
Other fees and expenses | | | 11,243 | |
| | | | |
Total expenses | | | 5,297,215 | |
Less: Fee waivers and/or expense reimbursements | | | (562,572 | ) |
| | | | |
Net expenses | | | 4,734,643 | |
| | | | |
Net investment income | | | 4,976,902 | |
| | | | |
| |
REALIZED AND UNREALIZED GAINS (LOSSES) ON INVESTMENTS | | | | |
Net realized gains on investments | | | 10,240,183 | |
Net change in unrealized gains (losses) on investments | | | 78,430,559 | |
| | | | |
Net realized and unrealized gains (losses) on investments | | | 88,670,742 | |
| | | | |
Net increase in net assets resulting from operations | | $ | 93,647,644 | |
| | | | |
The accompanying notes are an integral part of these financial statements.
| | | | |
| 12 | | Wells Fargo Large Cap Core Fund | | Statement of changes in net assets |
| | | | | | | | | | | | | | | | |
| | | Six months ended
January 31, 2017 (unaudited) | | | Year ended
July 31, 2016 | |
| | | | |
Operations | | | | | | | | | | | | | | | | |
Net investment income | | | | | | $ | 4,976,902 | | | | | | | $ | 6,674,384 | |
Net realized gains (losses) on investments | | | | | | | 10,240,183 | | | | | | | | (46,422,704 | ) |
Net change in unrealized gains (losses) on investments | | | | | | | 78,430,559 | | | | | | | | 27,105,014 | |
| | | | |
Net increase (decrease) in net assets resulting from operations | | | | | | | 93,647,644 | | | | | | | | (12,643,306 | ) |
| | | | |
| | | | |
Distributions to shareholders from | | | | | | | | | | | | | | | | |
Net investment income | | | | | | | | | | | | | | | | |
Class A | | | | | | | (2,565,745 | ) | | | | | | | (1,280,167 | ) |
Class R | | | | | | | (172 | ) | | | | | | | (136 | )1 |
Class R6 | | | | | | | (1,269 | ) | | | | | | | (184 | )1 |
Administrator Class | | | | | | | (3,812 | ) | | | | | | | (617,773 | ) |
Institutional Class | | | | | | | (7,464,521 | ) | | | | | | | (732,443 | ) |
Net realized gains | | | | | | | | | | | | | | | | |
Class A | | | | | | | 0 | | | | | | | | (3,571,260 | ) |
Class C | | | | | | | 0 | | | | | | | | (613,350 | ) |
Class R | | | | | | | 0 | | | | | | | | (222 | )1 |
Class R6 | | | | | | | 0 | | | | | | | | (222 | )1 |
Administrator Class | | | | | | | 0 | | | | | | | | (908,858 | ) |
Institutional Class | | | | | | | 0 | | | | | | | | (831,664 | ) |
| | | | |
Total distributions to shareholders | | | | | | | (10,035,519 | ) | | | | | | | (8,556,279 | ) |
| | | | |
| | | | |
Capital share transactions | | | Shares | | | | | | | | Shares | | | | | |
Proceeds from shares sold | | | | | | | | | | | | | | | | |
Class A | | | 767,608 | | | | 12,206,907 | | | | 25,918,673 | | | | 399,364,361 | |
Class C | | | 295,119 | | | | 4,637,909 | | | | 2,898,348 | | | | 42,984,877 | |
Class R | | | 96 | | | | 1,593 | | | | 1,706 | 1 | | | 25,000 | 1 |
Class R6 | | | 3,027 | | | | 46,110 | | | | 171,642 | 1 | | | 2,413,783 | 1 |
Administrator Class | | | 160,335 | | | | 2,472,755 | | | | 4,428,450 | | | | 66,283,791 | |
Institutional Class | | | 19,215,447 | | | | 298,712,783 | | | | 25,684,762 | | | | 381,059,292 | |
Investor Class | | | N/A | | | | N/A | | | | 508,724 | 2 | | | 7,701,975 | 2 |
| | | | |
| | | | | | | 318,078,057 | | | | | | | | 899,833,079 | |
| | | | |
Reinvestment of distributions | | | | | | | | | | | | | | | | |
Class A | | | 149,877 | | | | 2,451,983 | | | | 311,622 | | | | 4,725,942 | |
Class C | | | 0 | | | | 0 | | | | 32,452 | | | | 481,595 | |
Class R | | | 10 | | | | 172 | | | | 23 | 1 | | | 358 | 1 |
Class R6 | | | 77 | | | | 1,269 | | | | 27 | 1 | | | 406 | 1 |
Administrator Class | | | 230 | | | | 3,794 | | | | 99,938 | | | | 1,525,664 | |
Institutional Class | | | 405,841 | | | | 6,663,907 | | | | 63,053 | | | | 966,052 | |
| | | | |
| | | | | | | 9,121,125 | | | | | | | | 7,700,017 | |
| | | | |
Payment for shares redeemed | | | | | | | | | | | | | | | | |
Class A | | | (4,300,767 | ) | | | (66,465,780 | ) | | | (8,578,334 | ) | | | (125,072,291 | ) |
Class C | | | (1,310,818 | ) | | | (19,906,297 | ) | | | (1,521,640 | ) | | | (21,894,194 | ) |
Class R6 | | | (162,026 | ) | | | (2,459,857 | ) | | | (10,937 | )1 | | | (158,688 | )1 |
Administrator Class | | | (3,139,615 | ) | | | (49,250,147 | ) | | | (5,987,164 | ) | | | (87,751,181 | ) |
Institutional Class | | | (9,079,801 | ) | | | (142,697,662 | ) | | | (9,789,487 | ) | | | (144,146,531 | ) |
Investor Class | | | N/A | | | | N/A | | | | (18,604,700 | )2 | | | (290,535,816 | )2 |
| | | | |
| | | | | | | (280,779,743 | ) | | | | | | | (669,558,701 | ) |
| | | | |
Net asset value of shares issued in acquisition | | | | | | | | | | | | | | | | |
Institutional Class | | | 0 | | | | 0 | | | | 7,161,519 | | | | 103,887,609 | |
| | | | |
Net increase in net assets resulting from capital share transactions | | | | | | | 46,419,439 | | | | | | | | 341,862,004 | |
| | | | |
Total increase in net assets | | | | | | | 130,031,564 | | | | | | | | 320,662,419 | |
| | | | |
| | | | |
Net assets | | | | | | | | | | | | | | | | |
Beginning of period | | | | | | | 904,516,121 | | | | | | | | 583,853,702 | |
| | | | |
End of period | | | | | | $ | 1,034,547,685 | | | | | | | $ | 904,516,121 | |
| | | | |
Undistributed net investment income | | | | | | $ | 24,940 | | | | | | | $ | 5,083,557 | |
| | | | |
| 1 | For the period from September 30, 2015 (commencement of class operations) to July 31, 2016 |
| 2 | For the period from August 1, 2015 to October 23, 2015. Effective at the close of business on October 23, 2015, Investor Class shares were converted to Class A shares and are no longer offered by the Fund. |
The accompanying notes are an integral part of these financial statements.
| | | | | | |
| Financial highlights | | Wells Fargo Large Cap Core Fund | | | 13 | |
(For a share outstanding throughout each period)
| | | | | | | | | | | | | | | | | | | | | | | | |
| | | Six months ended
January 31, 2017 (unaudited) | | | Year ended July 31 | |
| CLASS A | | | 2016 | | | 2015 | | | 2014 | | | 2013 | | | 2012 | |
Net asset value, beginning of period | | | $15.13 | | | | $15.81 | | | | $14.30 | | | | $12.13 | | | | $9.50 | | | | $8.75 | |
Net investment income | | | 0.07 | | | | 0.10 | | | | 0.06 | | | | 0.06 | 1 | | | 0.07 | | | | 0.06 | |
Net realized and unrealized gains (losses) on investments | | | 1.40 | | | | (0.60 | ) | | | 1.50 | | | | 2.20 | | | | 2.64 | | | | 0.74 | |
| | | | | | | | | | | | | | | | | | | | | | | | |
Total from investment operations | | | 1.47 | | | | (0.50 | ) | | | 1.56 | | | | 2.26 | | | | 2.71 | | | | 0.80 | |
Distributions to shareholders from | | | | | | | | | | | | | | | | | | | | | | | | |
Net investment income | | | (0.12 | ) | | | (0.05 | ) | | | (0.05 | ) | | | (0.09 | ) | | | (0.08 | ) | | | (0.05 | ) |
Net realized gains | | | 0.00 | | | | (0.13 | ) | | | 0.00 | | | | 0.00 | | | | 0.00 | | | | 0.00 | |
| | | | | | | | | | | | | | | | | | | | | | | | |
Total distributions to shareholders | | | (0.12 | ) | | | (0.18 | ) | | | (0.05 | ) | | | (0.09 | ) | | | (0.08 | ) | | | (0.05 | ) |
Net asset value, end of period | | | $16.48 | | | | $15.13 | | | | $15.81 | | | | $14.30 | | | | $12.13 | | | | $9.50 | |
Total return2 | | | 9.75 | % | | | (3.18 | )% | | | 10.99 | % | | | 18.58 | % | | | 28.76 | % | | | 9.27 | % |
Ratios to average net assets (annualized) | | | | | | | | | | | | | | | | | | | | | | | | |
Gross expenses | | | 1.19 | % | | | 1.20 | % | | | 1.26 | % | | | 1.29 | % | | | 1.33 | % | | | 1.37 | % |
Net expenses | | | 1.14 | % | | | 1.14 | % | | | 1.14 | % | | | 1.14 | % | | | 1.14 | % | | | 1.14 | % |
Net investment income | | | 0.80 | % | | | 0.80 | % | | | 0.35 | % | | | 0.47 | % | | | 0.75 | % | | | 0.71 | % |
Supplemental data | | | | | | | | | | | | | | | | | | | | | | | | |
Portfolio turnover rate | | | 32 | % | | | 51 | % | | | 44 | % | | | 61 | % | | | 67 | % | | | 41 | % |
Net assets, end of period (000s omitted) | | | $336,233 | | | | $359,971 | | | | $97,041 | | | | $26,685 | | | | $15,267 | | | | $8,277 | |
| 1 | Calculated based upon average shares outstanding |
| 2 | Total return calculations do not include any sales charges. Returns for periods of less than one year are not annualized. |
The accompanying notes are an integral part of these financial statements.
| | | | |
| 14 | | Wells Fargo Large Cap Core Fund | | Financial highlights |
(For a share outstanding throughout each period)
| | | | | | | | | | | | | | | | | | | | | | | | |
| | | Six months ended
January 31, 2017 (unaudited) | | | Year ended July 31 | |
| CLASS C | | | 2016 | | | 2015 | | | 2014 | | | 2013 | | | 2012 | |
Net asset value, beginning of period | | | $14.87 | | | | $15.61 | | | | $14.17 | | | | $12.05 | | | | $9.45 | | | | $8.71 | |
Net investment income (loss) | | | 0.00 | 1,2 | | | 0.00 | 1 | | | (0.06 | )1 | | | (0.01 | ) | | | (0.00 | )2 | | | (0.00 | )2 |
Net realized and unrealized gains (losses) on investments | | | 1.38 | | | | (0.61 | ) | | | 1.50 | | | | 2.15 | | | | 2.62 | | | | 0.74 | |
| | | | | | | | | | | | | | | | | | | | | | | | |
Total from investment operations | | | 1.38 | | | | (0.61 | ) | | | 1.44 | | | | 2.14 | | | | 2.62 | | | | 0.74 | |
Distributions to shareholders from | | | | | | | | | | | | | | | | | | | | | | | | |
Net investment income | | | 0.00 | | | | 0.00 | | | | 0.00 | | | | (0.02 | ) | | | (0.02 | ) | | | 0.00 | |
Net realized gains | | | 0.00 | | | | (0.13 | ) | | | 0.00 | | | | 0.00 | | | | 0.00 | | | | 0.00 | |
| | | | | | | | | | | | | | | | | | | | | | | | |
Total distributions to shareholders | | | 0.00 | | | | (0.13 | ) | | | 0.00 | | | | (0.02 | ) | | | (0.02 | ) | | | 0.00 | |
Net asset value, end of period | | | $16.25 | | | | $14.87 | | | | $15.61 | | | | $14.17 | | | | $12.05 | | | | $9.45 | |
Total return3 | | | 9.28 | % | | | (3.90 | )% | | | 10.16 | % | | | 17.73 | % | | | 27.82 | % | | | 8.50 | % |
Ratios to average net assets (annualized) | | | | | | | | | | | | | | | | | | | | | | | | |
Gross expenses | | | 1.94 | % | | | 1.95 | % | | | 2.01 | % | | | 2.04 | % | | | 2.08 | % | | | 2.12 | % |
Net expenses | | | 1.89 | % | | | 1.89 | % | | | 1.89 | % | | | 1.89 | % | | | 1.89 | % | | | 1.89 | % |
Net investment income (loss) | | | 0.05 | % | | | 0.02 | % | | | (0.38 | )% | | | (0.30 | )% | | | (0.01 | )% | | | (0.04 | )% |
Supplemental data | | | | | | | | | | | | | | | | | | | | | | | | |
Portfolio turnover rate | | | 32 | % | | | 51 | % | | | 44 | % | | | 61 | % | | | 67 | % | | | 41 | % |
Net assets, end of period (000s omitted) | | | $61,657 | | | | $71,512 | | | | $53,076 | | | | $8,624 | | | | $3,786 | | | | $2,041 | |
| 1 | Calculated based upon average shares outstanding |
| 2 | Amount is less than $0.005. |
| 3 | Total return calculations do not include any sales charges. Returns for periods of less than one year are not annualized. |
The accompanying notes are an integral part of these financial statements.
| | | | | | |
| Financial highlights | | Wells Fargo Large Cap Core Fund | | | 15 | |
(For a share outstanding throughout each period)
| | | | | | | | |
| CLASS R | | Six months ended
January 31, 2017 (unaudited) | | | Year ended July 31, 20161 | |
Net asset value, beginning of period | | | $15.17 | | | | $14.66 | |
Net investment income | | | 0.05 | | | | 0.06 | |
Net realized and unrealized gains (losses) on investments | | | 1.41 | | | | 0.66 | |
| | | | | | | | |
Total from investment operations | | | 1.46 | | | | 0.72 | |
Distributions to shareholders from | | | | | | | | |
Net investment income | | | (0.10 | ) | | | (0.08 | ) |
Net realized gains | | | 0.00 | | | | (0.13 | ) |
| | | | | | | | |
Total distributions to shareholders | | | (0.10 | ) | | | (0.21 | ) |
Net asset value, end of period | | | $16.53 | | | | $15.17 | |
Total return2 | | | 9.62 | % | | | 4.90 | % |
Ratios to average net assets (annualized) | | | | | | | | |
Gross expenses | | | 1.44 | % | | | 1.46 | % |
Net expenses | | | 1.39 | % | | | 1.39 | % |
Net investment income | | | 0.52 | % | | | 0.52 | % |
Supplemental data | | | | | | | | |
Portfolio turnover rate | | | 32 | % | | | 51 | % |
Net assets, end of period (000s omitted) | | | $30 | | | | $26 | |
| 1 | For the period from September 30, 2015 (commencement of class operations) to July 31, 2016 |
| 2 | Returns for periods of less than one year are not annualized. |
The accompanying notes are an integral part of these financial statements.
| | | | |
| 16 | | Wells Fargo Large Cap Core Fund | | Financial highlights |
(For a share outstanding throughout each period)
| | | | | | | | |
| CLASS R6 | | Six months ended
January 31, 2017
(unaudited) | | | Year ended
July 31, 20161 | |
Net asset value, beginning of period | | | $15.24 | | | | $14.66 | |
Net investment income | | | 0.13 | 2 | | | 0.20 | |
Net realized and unrealized gains (losses) on investments | | | 1.87 | | | | 0.62 | |
| | | | | | | | |
Total from investment operations | | | 2.00 | | | | 0.82 | |
Distributions to shareholders from | | | | | | | | |
Net investment income | | | (0.73 | ) | | | (0.11 | ) |
Net realized gains | | | 0.00 | | | | (0.13 | ) |
| | | | | | | | |
Total distributions to shareholders | | | (0.73 | ) | | | (0.24 | ) |
Net asset value, end of period | | | $16.51 | | | | $15.24 | |
Total return3 | | | 13.18 | % | | | 5.57 | % |
Ratios to average net assets (annualized) | | | | | | | | |
Gross expenses | | | 0.76 | % | | | 0.77 | % |
Net expenses | | | 0.68 | % | | | 0.68 | % |
Net investment income | | | 1.64 | % | | | 1.31 | % |
Supplemental data | | | | | | | | |
Portfolio turnover rate | | | 32 | % | | | 51 | % |
Net assets, end of period (000s omitted) | | | $30 | | | | $2,449 | |
| 1 | For the period from September 30, 2015 (commencement of class operations) to July 31, 2016 |
| 2 | Calculated based upon average shares outstanding |
| 3 | Returns for periods of less than one year are not annualized. |
The accompanying notes are an integral part of these financial statements.
| | | | | | |
| Financial highlights | | Wells Fargo Large Cap Core Fund | | | 17 | |
(For a share outstanding throughout each period)
| | | | | | | | | | | | | | | | | | | | | | | | |
| | | Six months ended
January 31, 2017 (unaudited) | | | Year ended July 31 | |
| ADMINISTRATOR CLASS | | | 2016 | | | 2015 | | | 2014 | | | 2013 | | | 2012 | |
Net asset value, beginning of period | | | $15.18 | | | | $15.87 | | | | $14.34 | | | | $12.16 | | | | $9.52 | | | | $8.77 | |
Net investment income | | | 0.08 | 1 | | | 0.15 | | | | 0.10 | | | | 0.09 | | | | 0.10 | | | | 0.09 | |
Net realized and unrealized gains (losses) on investments | | | 1.39 | | | | (0.62 | ) | | | 1.50 | | | | 2.20 | | | | 2.64 | | | | 0.74 | |
| | | | | | | | | | | | | | | | | | | | | | | | |
Total from investment operations | | | 1.47 | | | | (0.47 | ) | | | 1.60 | | | | 2.29 | | | | 2.74 | | | | 0.83 | |
Distributions to shareholders from | | | | | | | | | | | | | | | | | | | | | | | | |
Net investment income | | | (0.00 | )2 | | | (0.09 | ) | | | (0.07 | ) | | | (0.11 | ) | | | (0.10 | ) | | | (0.08 | ) |
Net realized gains | | | 0.00 | | | | (0.13 | ) | | | 0.00 | | | | 0.00 | | | | 0.00 | | | | 0.00 | |
| | | | | | | | | | | | | | | | | | | | | | | | |
Total distributions to shareholders | | | (0.00 | )2 | | | (0.22 | ) | | | (0.07 | ) | | | (0.11 | ) | | | (0.10 | ) | | | (0.08 | ) |
Net asset value, end of period | | | $16.65 | | | | $15.18 | | | | $15.87 | | | | $14.34 | | | | $12.16 | | | | $9.52 | |
Total return3 | | | 9.71 | % | | | (2.98 | )% | | | 11.28 | % | | | 18.83 | % | | | 29.12 | % | | | 9.61 | % |
Ratios to average net assets (annualized) | | | | | | | | | | | | | | | | | | | | | | | | |
Gross expenses | | | 1.10 | % | | | 1.12 | % | | | 1.11 | % | | | 1.11 | % | | | 1.14 | % | | | 1.16 | % |
Net expenses | | | 1.00 | % | | | 0.96 | % | | | 0.90 | % | | | 0.90 | % | | | 0.89 | % | | | 0.87 | % |
Net investment income | | | 1.07 | % | | | 0.95 | % | | | 0.61 | % | | | 0.63 | % | | | 1.00 | % | | | 0.97 | % |
Supplemental data | | | | | | | | | | | | | | | | | | | | | | | | |
Portfolio turnover rate | | | 32 | % | | | 51 | % | | | 44 | % | | | 61 | % | | | 67 | % | | | 41 | % |
Net assets, end of period (000s omitted) | | | $13,896 | | | | $57,879 | | | | $83,692 | | | | $6,849 | | | | $1,192 | | | | $522 | |
| 1 | Calculated based upon average shares outstanding |
| 2 | Amount is less than $0.005. |
| 3 | Returns for periods of less than one year are not annualized. |
The accompanying notes are an integral part of these financial statements.
| | | | |
| 18 | | Wells Fargo Large Cap Core Fund | | Financial highlights |
(For a share outstanding throughout each period)
| | | | | | | | | | | | | | | | | | | | | | | | |
| | | Six months ended
January 31, 2017 (unaudited) | | | Year ended July 31 | |
| INSTITUTIONAL CLASS | | | 2016 | | | 2015 | | | 2014 | | | 2013 | | | 2012 | |
Net asset value, beginning of period | | | $15.23 | | | | $15.91 | | | | $14.35 | | | | $12.16 | | | | $9.52 | | | | $8.77 | |
Net investment income | | | 0.09 | 1 | | | 0.18 | 1 | | | 0.14 | 1 | | | 0.11 | 1 | | | 0.13 | 1 | | | 0.12 | |
Net realized and unrealized gains (losses) on investments | | | 1.43 | | | | (0.62 | ) | | | 1.50 | | | | 2.21 | | | | 2.63 | | | | 0.73 | |
| | | | | | | | | | | | | | | | | | | | | | | | |
Total from investment operations | | | 1.52 | | | | (0.44 | ) | | | 1.64 | | | | 2.32 | | | | 2.76 | | | | 0.85 | |
Distributions to shareholders from | | | | | | | | | | | | | | | | | | | | | | | | |
Net investment income | | | (0.20 | ) | | | (0.11 | ) | | | (0.08 | ) | | | (0.13 | ) | | | (0.12 | ) | | | (0.10 | ) |
Net realized gains | | | 0.00 | | | | (0.13 | ) | | | 0.00 | | | | 0.00 | | | | 0.00 | | | | 0.00 | |
| | | | | | | | | | | | | | | | | | | | | | | | |
Total distributions to shareholders | | | (0.20 | ) | | | (0.24 | ) | | | (0.08 | ) | | | (0.13 | ) | | | (0.12 | ) | | | (0.10 | ) |
Net asset value, end of period | | | $16.55 | | | | $15.23 | | | | $15.91 | | | | $14.35 | | | | $12.16 | | | | $9.52 | |
Total return2 | | | 10.00 | % | | | (2.75 | )% | | | 11.51 | % | | | 19.21 | % | | | 29.38 | % | | | 9.88 | % |
Ratios to average net assets (annualized) | | | | | | | | | | | | | | | | | | | | | | | | |
Gross expenses | | | 0.86 | % | | | 0.87 | % | | | 0.84 | % | | | 0.85 | % | | | 0.90 | % | | | 0.94 | % |
Net expenses | | | 0.70 | % | | | 0.70 | % | | | 0.66 | % | | | 0.66 | % | | | 0.66 | % | | | 0.66 | % |
Net investment income | | | 1.19 | % | | | 1.22 | % | | | 0.86 | % | | | 0.83 | % | | | 1.24 | % | | | 1.19 | % |
Supplemental data | | | | | | | | | | | | | | | | | | | | | | | | |
Portfolio turnover rate | | | 32 | % | | | 51 | % | | | 44 | % | | | 61 | % | | | 67 | % | | | 41 | % |
Net assets, end of period (000s omitted) | | | $622,700 | | | | $412,678 | | | | $63,235 | | | | $5,775 | | | | $537 | | | | $480 | |
| 1 | Calculated based upon average shares outstanding |
| 2 | Returns for periods of less than one year are not annualized. |
The accompanying notes are an integral part of these financial statements.
| | | | | | |
| Notes to financial statements (unaudited) | | Wells Fargo Large Cap Core Fund | | | 19 | |
1. ORGANIZATION
Wells Fargo Funds Trust (the “Trust”), a Delaware statutory trust organized on March 10, 1999, is an open-end management investment company registered under the Investment Company Act of 1940, as amended (the “1940 Act”). As an investment company, the Trust follows the accounting and reporting guidance in Financial Accounting Standards Board (“FASB”) Accounting Standards Codification Topic 946, Financial Services – Investment Companies. These financial statements report on the Wells Fargo Large Cap Core Fund (the “Fund”) which is a diversified series of the Trust.
Effective at the close of business on October 23, 2015, Investor Class shares became Class A shares in a tax-free conversion. Shareholders of Investor Class received Class A shares at a value equal to the value of their Investor Class shares immediately prior to the conversion. Investor Class shares are no longer offered by the Fund.
2. SIGNIFICANT ACCOUNTING POLICIES
The following significant accounting policies, which are consistently followed in the preparation of the financial statements of the Fund, are in conformity with U.S. generally accepted accounting principles which require management to make estimates and assumptions that affect the reported amounts of assets and liabilities, disclosure of contingent assets and liabilities at the date of the financial statements, and the reported amounts of revenues and expenses during the reporting period. Actual results could differ from those estimates.
Securities valuation
All investments are valued each business day as of the close of regular trading on the New York Stock Exchange (generally 4 p.m. Eastern Time), although the Fund may deviate from this calculation time under unusual or unexpected circumstances.
Equity securities that are listed on a foreign or domestic exchange or market are valued at the official closing price or, if none, the last sales price. If no sale occurs on the principal exchange or market that day, the prior day’s price will be deemed “stale” and a fair value price will be determined in accordance with the Fund’s Valuation Procedures.
Investments in registered open-end investment companies are valued at net asset value. Interests in non-registered investment vehicles that are redeemable at net asset value are fair valued normally at net asset value.
Investments which are not valued using any of the methods discussed above are valued at their fair value, as determined in good faith by the Board of Trustees of the Fund. The Board of Trustees has established a Valuation Committee comprised of the Trustees and has delegated to it the authority to take any actions regarding the valuation of portfolio securities that the Valuation Committee deems necessary or appropriate, including determining the fair value of portfolio securities, unless the determination has been delegated to the Management Valuation Team of Wells Fargo Funds Management, LLC (“Funds Management”). The Board of Trustees retains the authority to make or ratify any valuation decisions or approve any changes to the Valuation Procedures as it deems appropriate. On a quarterly basis, the Board of Trustees receives reports on any valuation actions taken by the Valuation Committee or the Management Valuation Team which may include items for ratification.
Valuations of fair valued securities are compared to the next actual sales price when available, or other appropriate market values, to assess the continued appropriateness of the fair valuation methodologies used. These securities are fair valued on a day-to-day basis, taking into consideration changes to appropriate market information and any significant changes to the inputs considered in the valuation process until there is a readily available price provided on an exchange or by an independent pricing service. Valuations received from an independent pricing service or independent broker-dealer quotes are periodically validated by comparisons to most recent trades and valuations provided by other independent pricing services in addition to the review of prices by the manager and/or subadviser. Unobservable inputs used in determining fair valuations are identified based on the type of security, taking into consideration factors utilized by market participants in valuing the investment, knowledge about the issuer and the current market environment.
Security loans
The Fund may lend its securities from time to time in order to earn additional income in the form of fees or interest on securities received as collateral or the investment of any cash received as collateral. The Fund continues to receive interest or dividends on the securities loaned. The Fund receives collateral in the form of cash or securities with a value at least equal to the value of the securities on loan. The value of the loaned securities is determined at the close of each business day and any additional required collateral is delivered to the Fund on the next business day. In a securities lending transaction, the net asset value of the Fund will be affected by an increase or decrease in the value of the securities loaned and by an increase or decrease in the value of the instrument in which collateral is invested. The amount of securities lending activity undertaken by the Fund fluctuates from time to time. In the event of default or bankruptcy by the borrower, the Fund may be prevented from recovering the loaned securities or gaining access to the collateral or
| | | | |
| 20 | | Wells Fargo Large Cap Core Fund | | Notes to financial statements (unaudited) |
may experience delays or costs in doing so. In addition, the investment of any cash collateral received may lose all or part of its value. The Fund has the right under the lending agreement to recover the securities from the borrower on demand.
The Fund lends its securities through an unaffiliated securities lending agent. Cash collateral received in connection with its securities lending transactions is invested in Securities Lending Cash Investments, LLC (the “Securities Lending Fund”). The Securities Lending Fund is exempt from registration under Section 3(c)(7) of the 1940 Act and is managed by Funds Management and is subadvised by Wells Capital Management Incorporated (“WellsCap”), an affiliate of Funds Management and an indirect wholly owned subsidiary of Wells Fargo & Company (“Wells Fargo”). Funds Management receives an advisory fee starting at 0.05% and declining to 0.01% as the average daily net assets of the Securities Lending Fund increase. All of the fees received by Funds Management are paid to WellsCap for its services as subadviser. The Securities Lending Fund seeks to provide a positive return compared to the daily Fed Funds Open Rate by investing in high-quality, U.S. dollar-denominated short-term money market instruments. Securities Lending Fund investments are valued at the evaluated bid price provided by an independent pricing service. Income earned from investment in the Securities Lending Fund is included in securities lending income on the Statement of Operations.
Security transactions and income recognition
Securities transactions are recorded on a trade date basis. Realized gains or losses are recorded on the basis of identified cost.
Dividend income is recognized on the ex-dividend date.
Distributions to shareholders
Distributions to shareholders from net investment income and net realized gains, if any, are recorded on the ex-dividend date. Such distributions are determined in conformity with federal income tax regulations, which may differ in amount or character from net investment income and realized gains recognized for purposes of U.S. generally accepted accounting principles.
Federal and other taxes
The Fund intends to continue to qualify as a regulated investment company by distributing substantially all of its investment company taxable income and any net realized capital gains (after reduction for capital loss carryforwards) sufficient to relieve it from all, or substantially all, federal income taxes. Accordingly, no provision for federal income taxes was required.
The Fund’s income and federal excise tax returns and all financial records supporting those returns for the prior three fiscal years are subject to examination by the federal and Delaware revenue authorities. Management has analyzed the Fund’s tax positions taken on federal, state, and foreign tax returns for all open tax years and does not believe that there are any uncertain tax positions that require recognition of a tax liability.
Capital loss carryforwards that do not expire are required to be utilized prior to capital loss carryforwards that expire. As of July 31, 2016, capital loss carryforwards available to offset future net realized capital gains were as follows through the indicated expiration dates:
| | | | |
| | | No expiration |
| 2017 | | Short-term | | Long-term |
| $(309,497) | | $(27,516,712) | | $(20,816,155) |
Class allocations
The separate classes of shares offered by the Fund differ principally in applicable sales charges, distribution, shareholder servicing, and administration fees. Class specific expenses are charged directly to that share class. Investment income, common expenses, and realized and unrealized gains (losses) on investments are allocated daily to each class of shares based on the relative proportion of net assets of each class.
3. FAIR VALUATION MEASUREMENTS
Fair value measurements of investments are determined within a framework that has established a fair value hierarchy based upon the various data inputs utilized in determining the value of the Fund’s investments. The three-level hierarchy gives the highest priority to unadjusted quoted prices in active markets for identical assets or liabilities (Level 1) and the lowest priority to significant unobservable inputs (Level 3). The Fund’s investments are classified within the fair value hierarchy based on the lowest level of input that is significant to the fair value measurement. The inputs are summarized into three broad levels as follows:
| | | | | | |
| Notes to financial statements (unaudited) | | Wells Fargo Large Cap Core Fund | | | 21 | |
| ∎ | | Level 1 – quoted prices in active markets for identical securities |
| ∎ | | Level 2 – other significant observable inputs (including quoted prices for similar securities, interest rates, prepayment speeds, credit risk, etc.) |
| ∎ | | Level 3 – significant unobservable inputs (including the Fund’s own assumptions in determining the fair value of investments) |
The inputs or methodologies used for valuing investments in securities are not necessarily an indication of the risk associated with investing in those securities.
The following is a summary of the inputs used in valuing the Fund’s assets and liabilities as of January 31, 2017:
| | | | | | | | | | | | | | | | |
| | | Quoted prices (Level 1) | | | Other significant
observable inputs
(Level 2) | | | Significant
unobservable inputs
(Level 3) | | | Total | |
Assets | | | | | | | | | | | | | | | | |
Investments in: | | | | | | | | | | | | | | | | |
| | | | |
Common stocks | | | | | | | | | | | | | | | | |
Consumer discretionary | | $ | 149,625,365 | | | $ | 0 | | | $ | 0 | | | $ | 149,625,365 | |
Consumer staples | | | 73,101,768 | | | | 0 | | | | 0 | | | | 73,101,768 | |
Energy | | | 56,317,105 | | | | 0 | | | | 0 | | | | 56,317,105 | |
Financials | | | 182,719,806 | | | | 0 | | | | 0 | | | | 182,719,806 | |
Health care | | | 145,873,500 | | | | 0 | | | | 0 | | | | 145,873,500 | |
Industrials | | | 100,778,180 | | | | 0 | | | | 0 | | | | 100,778,180 | |
Information technology | | | 240,512,251 | | | | 0 | | | | 0 | | | | 240,512,251 | |
Materials | | | 60,106,186 | | | | 0 | | | | 0 | | | | 60,106,186 | |
Real estate | | | 17,216,303 | | | | 0 | | | | 0 | | | | 17,216,303 | |
| | | | |
Short-term investments | | | | | | | | | | | | | | | | |
Investment companies | | | 12,392,040 | | | | 0 | | | | 0 | | | | 12,392,040 | |
Total assets | | $ | 1,038,642,504 | | | $ | 0 | | | $ | 0 | | | $ | 1,038,642,504 | |
The Fund recognizes transfers between levels within the fair value hierarchy at the end of the reporting period. At January 31, 2017, the Fund did not have any transfers into/out of Level 1, Level 2, or Level 3.
4. TRANSACTIONS WITH AFFILIATES AND OTHER EXPENSES
Management fee
Funds Management, an indirect wholly owned subsidiary of Wells Fargo, is the manager of the Fund and provides advisory and fund-level administrative services under an investment management agreement. Under the investment management agreement, Funds Management is responsible for, among other services, implementing the investment objectives and strategies of the Fund, supervising the subadviser, providing fund-level administrative services in connection with the Fund’s operations, and providing any other fund-level administrative services reasonably necessary for the operation of the Fund. As compensation for its services under the investment management agreement, Funds Management is entitled to receive an annual management fee starting at 0.70% and declining to 0.505% as the average daily net assets of the Fund increase. For the six months ended January 31, 2017, the management fee was equivalent to an annual rate of 0.69% of the Fund’s average daily net assets.
Funds Management has retained the services of a subadviser to provide daily portfolio management to the Fund. The fee for subadvisory services is borne by Funds Management. Golden Capital Management, LLC, an affiliate of Funds Management, is the subadviser to the Fund and is entitled to receive a fee from Funds Management at an annual rate starting at 0.35% and declining to 0.30% as the average daily net assets of the Fund increase.
Administration fees
Under a class-level administration agreement, Funds Management provides class-level administrative services to the Fund, which includes paying fees and expenses for services provided by the transfer agent, sub-transfer agents, omnibus
| | | | |
| 22 | | Wells Fargo Large Cap Core Fund | | Notes to financial statements (unaudited) |
account servicers and record-keepers. As compensation for its services under the class-level administration agreement, Funds Management receives an annual fee which is calculated based on the average daily net assets of each class as follows:
| | | | |
| | | Class-level
administration fee | |
Class A, Class C, Class R | | | 0.21 | % |
Class R6 | | | 0.03 | |
Administrator Class, Institutional Class | | | 0.13 | |
Funds Management has contractually waived and/or reimbursed management and administration fees to the extent necessary to maintain certain net operating expense ratios for the Fund. Waiver of fees and/or reimbursement of expenses by Funds Management were made first from fund level expenses on a proportionate basis and then from class specific expenses. Funds Management has committed through November 30, 2017 to waive fees and/or reimburse expenses to the extent necessary to cap the Fund’s expenses at 1.14% for Class A shares, 1.89% for Class C shares, 1.39% for Class R shares, 0.68% for Class R6 shares, 1.00% for Administrator Class shares, and 0.70% for Institutional Class shares. After this time, the cap may be increased or the commitment to maintain the cap may be terminated only with the approval of the Board of Trustees.
During the year ended January 31, 2017, State Street Bank and Trust Company, the Fund’s custodian, reimbursed the Fund $1,025 for certain out-of-pocket expenses that were billed to the Fund in error from 1998-2015. This amount is included in dividend income on the Statement of Operations. In addition, Funds Management was also reimbursed $3,038 for waivers/reimbursements it made to the Fund during the period the Fund was erroneously billed.
Distribution fees
The Trust has adopted a distribution plan for Class C and Class R shares of the Fund pursuant to Rule 12b-1 under the 1940 Act. Distribution fees are charged to Class C and Class R shares and paid to Wells Fargo Funds Distributor, LLC (“Funds Distributor”), the principal underwriter, at an annual rate of 0.75% of the average daily net assets of Class C shares and 0.25% of the average daily net assets of Class R shares.
In addition, Funds Distributor is entitled to receive the front-end sales charge from the purchase of Class A shares and a contingent deferred sales charge on the redemption of certain Class A shares. Funds Distributor is also entitled to receive the contingent deferred sales charges from redemptions of Class C shares. For the six months ended January 31, 2017, Funds Distributor received $6,648 from the sale of Class A shares and $25 in contingent deferred sales charges from redemptions of Class C shares.
Shareholder servicing fees
The Trust has entered into contracts with one or more shareholder servicing agents, whereby Class A, Class C, Class R, and Administrator Class of the Fund are charged a fee at an annual rate of 0.25% of the average daily net assets of each respective class.
A portion of these total shareholder servicing fees were paid to affiliates of Wells Fargo.
5. INVESTMENT PORTFOLIO TRANSACTIONS
Purchases and sales of investments, excluding U.S. government obligations (if any) and short-term securities, for the six months ended January 31, 2017 were $354,866,157 and $319,656,938, respectively.
The Fund may purchase or sell investment securities to other Wells Fargo funds under procedures adopted by the Board of Trustees. The procedures have been designed to ensure that these interfund transactions, which generally do not incur broker commissions, are effected at current market prices. Interfund trades are included within the respective purchases and sales amounts shown.
6. ACQUISITION
After the close of business on May 20, 2016, the Fund acquired the net assets of Golden Large Cap Core Fund. The purpose of the transaction was to combine two funds with similar investment objectives and strategies. Shareholders holding Institutional Class shares of Golden Large Cap Core Fund received Institutional Class shares of the Fund in the reorganization. The acquisition was accomplished by a tax-free exchange of all of the Institutional Class shares of Golden Large Cap Core Fund for 7,161,519 Institutional Class shares of the Fund valued at $103,887,609 at an exchange ratio of
| | | | | | |
| Notes to financial statements (unaudited) | | Wells Fargo Large Cap Core Fund | | | 23 | |
0.90. The investment portfolio of Golden Large Cap Core Fund with a fair value of $101,587,245, identified cost of $91,037,630 and unrealized gains of $10,549,615 at May 20, 2016 were the principal assets acquired by the Fund. The aggregate net assets of Golden Large Cap Core Fund and the Fund immediately prior to the acquisition were $103,887,609 and $865,210,261, respectively. The aggregate net assets of the Fund immediately after the acquisition were $969,097,870. For financial reporting purposes, assets received and shares issued by the Fund were recorded at fair value; however, the cost basis of the investments received from Golden Large Cap Core Fund was carried forward to align ongoing reporting of the Fund’s realized and unrealized gains and losses with amounts distributable to shareholders for tax purposes.
Assuming the acquisition had been completed August 1, 2015, the beginning of the annual reporting period for the Fund, the pro forma results of operations for the year ended July 31, 2016 would have been:
| | | | |
Net investment income | | $ | 7,679,055 | |
Net realized and unrealized gains (losses) on investments | | $ | (9,371,087 | ) |
Net decrease in net assets resulting from operations | | $ | (1,692,032 | ) |
7. BANK BORROWINGS
The Trust (excluding the money market funds and certain other funds) and Wells Fargo Variable Trust are parties to a $250,000,000 revolving credit agreement whereby the Fund is permitted to use bank borrowings for temporary or emergency purposes, such as to fund shareholder redemption requests. Interest under the credit agreement is charged to the Fund based on a borrowing rate equal to the higher of the Federal Funds rate in effect on that day plus 1.25% or the overnight LIBOR rate in effect on that day plus 1.25%. In addition, an annual commitment fee equal to 0.25% of the unused balance is allocated to each participating fund. Prior to August 30, 2016, the revolving credit agreement amount was $200,000,000 and the annual commitment fee was equal to 0.20% of the unused balance which was allocated to each participating fund.
For the six months ended January 31, 2017, there were no borrowings by the Fund under the agreement.
8. INDEMNIFICATION
Under the Trust’s organizational documents, the officers and Trustees have been granted certain indemnification rights against certain liabilities that may arise out of performance of their duties to the Trust. Additionally, in the normal course of business, the Trust may enter into contracts with service providers that contain a variety of indemnification clauses. The Trust’s maximum exposure under these arrangements is dependent on future claims that may be made against the Fund and, therefore, cannot be estimated.
9. NEW ACCOUNTING PRONOUNCEMENT
In December 2016, the Financial Accounting Standards Board (“FASB”) issued Accounting Standard Update (“ASU”) No. 2016-19, Technical Corrections and Improvements. ASU 2016-19 includes an amendment to FASB ASC Topic 820, Fair Value Measurement which clarifies the difference between a valuation approach and a valuation technique. The amendment also requires an entity to disclose when there has been a change in either or both a valuation approach and/or a valuation technique. The disclosure requirements are effective for fiscal years and interim periods within those fiscal years beginning after December 15, 2016. Management is currently evaluating the potential impact of this new guidance to the financial statements.
10. REGULATORY CHANGES
In October 2016, the Securities and Exchange Commission (“SEC”) adopted new rules and forms and amended existing rules and forms (together, “final rules”) intended to modernize and enhance the reporting and disclosure of information by registered investment companies and to enhance liquidity risk management by open-end mutual funds and exchange-traded funds. The final rules will enhance the quality of information available to investors and will allow the SEC to more effectively collect and use data reported by funds. In part, the final rules amend Regulation S-X and require standardized, enhanced disclosure about derivatives in the Fund’s financial statements, as well as other amendments. The compliance date for the amendments to Regulation S-X is August 1, 2017 while the compliance date for the new form types is June 1, 2018 and the compliance date for the liquidity risk management program requirements is December 1, 2018. Management is currently assessing the potential impact of these enhancements and their impact on the financial statement disclosures and reporting requirements.
| | | | |
| 24 | | Wells Fargo Large Cap Core Fund | | Other information (unaudited) |
PROXY VOTING INFORMATION
A description of the policies and procedures that the Fund uses to determine how to vote proxies relating to portfolio securities is available, upon request, by calling 1-800-222-8222, visiting our website at wellsfargofunds.com, or visiting the SEC website at sec.gov. Information regarding how the Fund voted proxies relating to portfolio securities during the most recent 12-month period ended June 30 is available on the Fund’s website at wellsfargofunds.com or by visiting the SEC website at sec.gov.
PORTFOLIO HOLDINGS INFORMATION
The complete portfolio holdings for the Fund are publicly available monthly on the Fund’s website (wellsfargofunds.com), on a one-month delayed basis. In addition, top ten holdings information (excluding derivative positions) for the Fund is publicly available on the Fund’s website on a monthly, seven-day or more delayed basis. The Fund files its complete schedule of portfolio holdings with the SEC for the first and third quarters of each fiscal year on Form N-Q, which is available by visiting the SEC website at sec.gov. In addition, the Fund’s Form N-Q may be reviewed and copied at the SEC’s Public Reference Room in Washington, DC, and at regional offices in New York City, at 233 Broadway, and in Chicago, at 175 West Jackson Boulevard, Suite 900. Information about the Public Reference Room may be obtained by calling 1-800-SEC-0330.
| | | | | | |
| Other information (unaudited) | | Wells Fargo Large Cap Core Fund | | | 25 | |
BOARD OF TRUSTEES AND OFFICERS
Each of the Trustees and Officers1 listed in the table below acts in identical capacities for each fund in the Wells Fargo family of funds, which consists of 138 mutual funds comprising the Wells Fargo Funds Trust, Wells Fargo Variable Trust, Wells Fargo Master Trust and four closed-end funds (collectively the “Fund Complex”). This table should be read in conjunction with the Prospectus and the Statement of Additional Information2. The mailing address of each Trustee and Officer is 525 Market Street, 12th Floor, San Francisco, CA 94105. Each Trustee and Officer serves an indefinite term, however, each Trustee serves such term until reaching the mandatory retirement age established by the Trustees.
Independent Trustees
| | | | | | |
Name and year of birth | | Position held and length of service* | | Principal occupations during past five years or longer | | Current other public company or
investment company
directorships |
William R. Ebsworth (Born 1957) | | Trustee, since 2015 | | Retired. From 1984 to 2013, equities analyst, portfolio manager, research director and chief financial officer at Fidelity Management and Research Company in Boston, Tokyo, and Hong Kong and retired in 2013 as Chief Investment Officer of Fidelity Strategic Advisers, Inc. where he lead a team of investment professionals managing client assets. Prior thereto, Board member of Hong Kong Securities Clearing Co., Hong Kong Options Clearing Corp., the Thailand International Fund, Ltd., Fidelity Investments Life Insurance Company, and Empire Fidelity Investments Life Insurance Company. Board member of the Fonté Foundation (non-profit organization) and the Vincent Memorial Hospital Endowment (non-profit organization), where he serves on the Investment Committee and as a Chair of the Audit Committee. Mr. Ebsworth is a CFA® charterholder and an Adjunct Lecturer, Finance, at Babson College. | | Asset Allocation Trust |
Jane A. Freeman (Born 1953) | | Trustee, since 2015 | | Retired. From 2012 to 2014 and 1999 to 2008, Chief Financial Officer of Scientific Learning Corporation. From 2008 to 2012, Ms. Freeman provided consulting services related to strategic business projects. Prior to 1999, Portfolio Manager at Rockefeller & Co. and Scudder, Stevens & Clark. Board member of the Harding Loevner Funds from 1996 to 2014, serving as both Lead Independent Director and chair of the Audit Committee. Board member of the Russell Exchange Traded Funds Trust from 2011 to 2012 and the chair of the Audit Committee. Ms. Freeman is Chair of Taproot Foundation (non-profit organization), a Board Member of Ruth Bancroft Garden (non-profit organization) and an inactive chartered financial analyst. | | Asset Allocation Trust |
Peter G. Gordon** (Born 1942) | | Trustee, since 1998; Chairman, since 2005 | | Co-Founder, Retired Chairman, President and CEO of Crystal Geyser Water Company. Trustee Emeritus, Colby College. | | Asset Allocation Trust |
| Isaiah Harris, Jr. (Born 1952) | | Trustee, since 2009 | | Retired. Chairman of the Board of CIGNA Corporation since 2009, and Director since 2005. From 2003 to 2011, Director of Deluxe Corporation. Prior thereto, President and CEO of BellSouth Advertising and Publishing Corp. from 2005 to 2007, President and CEO of BellSouth Enterprises from 2004 to 2005 and President of BellSouth Consumer Services from 2000 to 2003. Emeritus member of the Iowa State University Foundation Board of Governors. Emeritus Member of the Advisory Board of Iowa State University School of Business. Advisory Board Member, Palm Harbor Academy (charter school). Advisory Board Member, Child Evangelism Fellowship (non-profit). Mr. Harris is a certified public accountant (inactive status). | | CIGNA Corporation; Asset Allocation Trust |
Judith M. Johnson (Born 1949) | | Trustee, since 2008; Audit Committee Chairman, since 2008 | | Retired. Prior thereto, Chief Executive Officer and Chief Investment Officer of Minneapolis Employees Retirement Fund from 1996 to 2008. Ms. Johnson is an attorney, certified public accountant and a certified managerial accountant. | | Asset Allocation Trust |
David F. Larcker (Born 1950) | | Trustee, since 2009 | | James Irvin Miller Professor of Accounting at the Graduate School of Business, Stanford University, Director of the Corporate Governance Research Initiative and Senior Faculty of The Rock Center for Corporate Governance since 2006. From 2005 to 2008, Professor of Accounting at the Graduate School of Business, Stanford University. Prior thereto, Ernst & Young Professor of Accounting at The Wharton School, University of Pennsylvania from 1985 to 2005. | | Asset Allocation Trust |
| | | | |
| 26 | | Wells Fargo Large Cap Core Fund | | Other information (unaudited) |
| | | | | | |
Name and year of birth | | Position held and length of service* | | Principal occupations during past five years or longer | | Current other public company or
investment company
directorships |
Olivia S. Mitchell (Born 1953) | | Trustee, since 2006 | | International Foundation of Employee Benefit Plans Professor, Wharton School of the University of Pennsylvania since 1993. Director of Wharton’s Pension Research Council and Boettner Center on Pensions & Retirement Research, and Research Associate at the National Bureau of Economic Research. Previously, Cornell University Professor from 1978 to 1993. | | Asset Allocation Trust |
Timothy J. Penny (Born 1951) | | Trustee, since 1996 | | President and Chief Executive Officer of Southern Minnesota Initiative Foundation, a non-profit organization, since 2007 and Senior Fellow at the Humphrey Institute Policy Forum at the University of Minnesota since 1995. Member of the Board of Trustees of NorthStar Education Finance, Inc., a non-profit organization, since 2007. | | Asset Allocation Trust |
Michael S. Scofield (Born 1943) | | Trustee, since 2010 | | Served on the Investment Company Institute’s Board of Governors and Executive Committee from 2008-2011 as well the Governing Council of the Independent Directors Council from 2006-2011 and the Independent Directors Council Executive Committee from 2008-2011. Chairman of the IDC from 2008-2010. Institutional Investor (Fund Directions) Trustee of Year in 2007. Trustee of the Evergreen Funds complex (and its predecessors) from 1984 to 2010. Chairman of the Evergreen Funds from 2000-2010. Former Trustee of the Mentor Funds. Retired Attorney, Law Offices of Michael S. Scofield. | | Asset Allocation Trust |
| * | Length of service dates reflect the Trustee’s commencement of service with the Trust’s predecessor entities, where applicable. |
| ** | Peter Gordon is expected to retire on December 31, 2017. |
Officers
| | | | | | |
Name and year of birth | | Position held and length of service | | Principal occupations during past five years or longer | | |
Andrew Owen (Born 1960) | | President, since 2017 | | Executive Vice President of Wells Fargo Bank, N.A. and President of Wells Fargo & Company and Head of Affiliated Managers, Wells Fargo Asset Management, since 2014. Executive Vice President responsible for marketing, investments and product development for Wells Fargo Funds Management, LLC, from 2009 to 2014. | | |
Jeremy DePalma1 (Born 1974) | | Treasurer, since 2012 | | Senior Vice President of Wells Fargo Funds Management, LLC since 2009. Senior Vice President of Evergreen Investment Management Company, LLC from 2008 to 2010 and head of the Fund Reporting and Control Team within Fund Administration from 2005 to 2010. | | |
C. David Messman (Born 1960) | | Secretary, since 2000; Chief Legal Officer, since 2003 | | Senior Vice President and Secretary of Wells Fargo Funds Management, LLC since 2001. Assistant General Counsel of Wells Fargo Bank, N.A. since 2013 and Vice President and Managing Counsel of Wells Fargo Bank, N.A. from 1996 to 2013. | | |
Michael Whitaker (Born 1967) | | Chief Compliance Officer, since 2016 | | Executive Vice President of Wells Fargo Funds Management, LLC since 2016. Chief Compliance Officer of Fidelity’s Fixed Income Funds and Asset Allocation Funds from 2008 to 2016, Compliance Officer of FMR Co., Inc. from 2014 to 2016, Fidelity Investments Money Management, Inc. from 2014 to 2016, Fidelity Investments from 2007 to 2016. | | |
David Berardi (Born 1975) | | Assistant Treasurer, since 2009 | | Vice President of Wells Fargo Funds Management, LLC since 2009. Vice President of Evergreen Investment Management Company, LLC from 2008 to 2010. Manager of Fund Reporting and Control for Evergreen Investment Management Company, LLC from 2004 to 2010. | | |
| 1 | Jeremy DePalma acts as Treasurer of 69 funds and Assistant Treasurer of 69 funds in the Fund Complex. |
| 2 | The Statement of Additional Information includes additional information about the Trustees and is available, without charge, upon request, by calling 1-800-222-8222 or by visiting the website at wellsfargofunds.com. |
| | | | | | |
| List of abbreviations | | Wells Fargo Large Cap Core Fund | | | 27 | |
The following is a list of common abbreviations for terms and entities that may have appeared in this report.
| ACA | — ACA Financial Guaranty Corporation |
| ADR | — American depositary receipt |
| ADS | — American depositary shares |
| AGC | — Assured Guaranty Corporation |
| AGM | — Assured Guaranty Municipal |
| Ambac | — Ambac Financial Group Incorporated |
| AMT | — Alternative minimum tax |
| BAN | — Bond anticipation notes |
| BHAC | — Berkshire Hathaway Assurance Corporation |
| CAB | — Capital appreciation bond |
| CCAB | — Convertible capital appreciation bond |
| CDA | — Community Development Authority |
| CDO | — Collateralized debt obligation |
| DRIVER | — Derivative inverse tax-exempt receipts |
| DW&P | — Department of Water & Power |
| DWR | — Department of Water Resources |
| ECFA | — Educational & Cultural Facilities Authority |
| EDA | — Economic Development Authority |
| EDFA | — Economic Development Finance Authority |
| ETF | — Exchange-traded fund |
| FDIC | — Federal Deposit Insurance Corporation |
| FFCB | — Federal Farm Credit Banks |
| FGIC | — Financial Guaranty Insurance Corporation |
| FHA | — Federal Housing Administration |
| FHLB | — Federal Home Loan Bank |
| FHLMC | — Federal Home Loan Mortgage Corporation |
| FICO | — The Financing Corporation |
| FNMA | — Federal National Mortgage Association |
| GDR | — Global depositary receipt |
| GNMA | — Government National Mortgage Association |
| HCFR | — Healthcare facilities revenue |
| HEFA | — Health & Educational Facilities Authority |
| HEFAR | — Higher education facilities authority revenue |
| HFA | — Housing Finance Authority |
| HFFA | — Health Facilities Financing Authority |
| HUD | — Department of Housing and Urban Development |
| IDA | — Industrial Development Authority |
| IDAG | — Industrial Development Agency |
| KRW | — Republic of Korea won |
| LIBOR | — London Interbank Offered Rate |
| LIFER | — Long Inverse Floating Exempt Receipts |
| LLC | — Limited liability company |
| LLLP | — Limited liability limited partnership |
| LLP | — Limited liability partnership |
| MBIA | — Municipal Bond Insurance Association |
| MFHR | — Multifamily housing revenue |
| MSTR | — Municipal securities trust receipts |
| MUD | — Municipal Utility District |
| National | — National Public Finance Guarantee Corporation |
| PCFA | — Pollution Control Financing Authority |
| PCL | — Public Company Limited |
| PCR | — Pollution control revenue |
| PFA | — Public Finance Authority |
| PFFA | — Public Facilities Financing Authority |
| PFOTER | — Puttable floating option tax-exempt receipts |
| plc | — Public limited company |
| PUTTER | — Puttable tax-exempt receipts |
| R&D | — Research & development |
| Radian | — Radian Asset Assurance |
| RAN | — Revenue anticipation notes |
| RDA | — Redevelopment Authority |
| RDFA | — Redevelopment Finance Authority |
| REIT | — Real estate investment trust |
| ROC | — Reset option certificates |
| SAVRS | — Select auction variable rate securities |
| SBA | — Small Business Authority |
| SDR | — Swedish depositary receipt |
| SFHR | — Single-family housing revenue |
| SFMR | — Single-family mortgage revenue |
| SPA | — Standby purchase agreement |
| SPDR | — Standard & Poor’s Depositary Receipts |
| SPEAR | — Short Puttable Exempt Adjustable Receipts |
| STRIPS | — Separate trading of registered interest and |
| TAN | — Tax anticipation notes |
| TIPS | — Treasury inflation-protected securities |
| TRAN | — Tax revenue anticipation notes |
| TTFA | — Transportation Trust Fund Authority |
| TVA | — Tennessee Valley Authority |
This page is intentionally left blank.

For more information
More information about Wells Fargo Funds is available free upon request. To obtain literature, please write, email, visit the Fund’s website, or call:
Wells Fargo Funds
P.O. Box 8266
Boston, MA 02266-8266
Email: fundservice@wellsfargo.com
Website: wellsfargofunds.com
Individual investors: 1-800-222-8222
Retail investment professionals: 1-888-877-9275
Institutional investment professionals: 1-866-765-0778
This report and the financial statements contained herein are submitted for the general information of the shareholders of the Fund. If this report is used for promotional purposes, distribution of the report must be accompanied or preceded by a current prospectus. Before investing, please consider the investment objectives, risks, charges, and expenses of the investment. For a current prospectus and, if available, a summary prospectus, containing this information, call 1-800-222-8222 or visit the Fund’s website at wellsfargofunds.com. Read the prospectus carefully before you invest or send money.
Wells Fargo Asset Management (WFAM) is a trade name used by the asset management businesses of Wells Fargo & Company. Wells Fargo Funds Management, LLC, a wholly owned subsidiary of Wells Fargo & Company, provides investment advisory and administrative services for Wells Fargo Funds. Other affiliates of Wells Fargo & Company provide subadvisory and other services for the funds. The funds are distributed by Wells Fargo Funds Distributor, LLC, Member FINRA, an affiliate of Wells Fargo & Company. Neither Wells Fargo Funds Management nor Wells Fargo Funds Distributor has Fund customer accounts/assets, and neither provides investment advice/recommendations or acts as an investment advice fiduciary to any investor.
NOT FDIC INSURED ◾ NO BANK GUARANTEE ◾ MAY LOSE VALUE
© 2017 Wells Fargo Funds Management, LLC. All rights reserved.
| | |
 | | 301460 03-17 SA208/SAR208 01-17 |
Semi-Annual Report
January 31, 2017

Wells Fargo Large Cap Growth Fund


Reduce clutter. Save trees.
Sign up for electronic delivery of prospectuses and shareholder reports at wellsfargo.com/advantagedelivery
Contents
The views expressed and any forward-looking statements are as of January 31, 2017, unless otherwise noted, and are those of the Fund managers and/or Wells Fargo Funds Management, LLC. Discussions of individual securities, or the markets generally, or any Wells Fargo Fund are not intended as individual recommendations. Future events or results may vary significantly from those expressed in any forward-looking statements. The views expressed are subject to change at any time in response to changing circumstances in the market. Wells Fargo Funds Management, LLC and the Fund disclaim any obligation to publicly update or revise any views expressed or forward-looking statements.
NOT FDIC INSURED ◾ NO BANK GUARANTEE ◾ MAY LOSE VALUE
| | | | |
| 2 | | Wells Fargo Large Cap Growth Fund | | Letter to shareholders (unaudited) |

Andrew Owen
President
Wells Fargo Funds
U.S. and international stocks returned 5.96% and 4.16% for the six-month period, respectively; within fixed income, the Bloomberg Barclays U.S. Aggregate Bond Index3 returned -2.95%.
Dear Shareholder:
As the new president of Wells Fargo Funds now that Karla Rabusch is retiring from that position after nearly 14 years, I am pleased to offer you this semi-annual report for the Wells Fargo Large Cap Growth Fund for the six-month period that ended January 31, 2017. Despite heightened market volatility, global stocks delivered favorable results overall. U.S. and international stocks returned 5.96% and 4.16% for the six-month period, respectively, as measured by the S&P 500 Index1 and the MSCI ACWI ex USA Index (Net)2; within fixed income, the Bloomberg Barclays U.S. Aggregate Bond Index3 returned -2.95%.
In August–September 2016, global stocks delivered generally positive results; bonds’ interest rates remained historically low.
From August into early September 2016, U.S. and international stocks generally trended upward. Ever since the Great Recession, markets worldwide have been supported to varying degrees by accommodative policies from leading central banks, including the Federal Reserve (Fed), European Central Bank, Bank of England, and Bank of Japan. As a result, investors have watched closely for any signs that global central banks might tighten their measures. In the U.S., early-September comments by several Fed officials appeared to suggest a September interest-rate increase, which sent stock and bond prices downward. However, stocks surged following the Fed’s September 20 meeting on news that the Fed had decided to delay a rate increase to later in 2016. In bond markets, interest rates remained at historically low levels as a result of easy monetary policies, subdued global growth, and modest inflation expectations. Yields rose, after bottoming in July, as market participants felt that yields had overshot the real risks of the U.K.’s Brexit vote and as economic activity strengthened. At the front end of the yield curve, anticipation of new money market fund rules resulted in significantly higher yields on many short-term securities.
During the fourth quarter of 2016, prospects for faster growth and higher interest rates in the U.S. largely influenced the markets.
Early in the fourth quarter of 2016, U.S. stocks tended to trade lower amid concerns such as a likely interest-rate increase and uncertainty over the approaching general election. However, following Donald Trump’s election as president in early November, U.S. stocks began to rally. Investors appeared optimistic that the new administration would usher in a series of pro-growth policies, and supportive economic news helped the rally carry through the quarter. The buoyant environment sent interest rates higher as well. At its mid-December meeting, Fed officials raised their short-term target interest rate for the first time in a year, by a quarter percentage point, to between 0.50% and 0.75%. The fourth quarter also saw the implementation of the Securities and Exchange Commission’s new rules for money market funds, which included floating net asset values (NAVs) for institutional prime and municipal money market funds as well as liquidity fees and redemption gates. In the year leading up to
| 1 | The S&P 500 Index consists of 500 stocks chosen for market size, liquidity, and industry group representation. It is a market-value-weighted index with each stock’s weight in the index proportionate to its market value. You cannot invest directly in an index. |
| 2 | The Morgan Stanley Capital International (MSCI) All Country World Index (ACWI) ex USA Index (Net) is a free-float-adjusted market-capitalization-weighted index that is designed to measure the equity market performance of developed markets, excluding the United States and Canada. Source: MSCI. MSCI makes no express or implied warranties or representations and shall have no liability whatsoever with respect to any MSCI data contained herein. The MSCI data may not be further redistributed or used as a basis for other indexes or any securities or financial products. This report is not approved, reviewed, or produced by MSCI. You cannot invest directly in an index. |
| 3 | The Bloomberg Barclays U.S. Aggregate Bond Index (formerly known as Barclays U.S. Aggregate Bond Index) is a broad-based benchmark that measures the investment-grade, U.S. dollar–denominated, fixed-rate taxable bond market, including Treasuries, government-related and corporate securities, mortgage-backed securities (agency fixed-rate and hybrid adjustable-rate mortgage pass-throughs), asset-backed securities, and commercial mortgage-backed securities. You cannot invest directly in an index. |
| | | | | | |
| Letter to shareholders (unaudited) | | Wells Fargo Large Cap Growth Fund | | | 3 | |
money fund reform implementation, nearly $1 trillion in assets moved from these types of money market funds into government money market funds, which continued to transact at a stable $1 NAV. Outside of the U.S., the prospects for faster U.S. growth appeared to trigger some acceleration in Europe. The improvement may be partly attributable to expectations for further strengthening of the U.S. dollar, which in turn could improve demand for European goods in the U.S. due to weakening of the euro relative to the dollar.
Investor optimism continued into January 2017.
January brought continued strength in global stock markets. Markets were lifted by factors such as strong trade data from Japan, robust earnings reports by businesses, and investors’ hopes that the U.S. government will approve a large fiscal stimulus package.
Don’t let short-term uncertainty derail long-term investment goals.
Periods of uncertainty can present challenges, but experience has taught us that maintaining long-term investment goals can be an effective way to plan for the future. To help you create a sound strategy based on your personal goals and risk tolerance, Wells Fargo Funds offers more than 100 mutual funds spanning a wide range of asset classes and investment styles. Although diversification cannot guarantee an investment profit or prevent losses, we believe it can be an effective way to manage investment risk and potentially smooth out overall portfolio performance. We encourage investors to know their investments and to understand that appropriate levels of risk-taking may unlock opportunities.
Thank you for choosing to invest in Wells Fargo Funds. We appreciate your confidence in us and remain committed to helping you meet your financial needs.
Sincerely,

Andrew Owen
President
Wells Fargo Funds
Although diversification cannot guarantee an investment profit or prevent losses, we believe it can be an effective way to manage investment risk and potentially smooth out overall portfolio performance.
For further information about your Fund, contact your investment professional, visit our website at wellsfargofunds.com, or call us directly at 1-800-222-8222. We are available 24 hours a day, 7 days a week.
| | | | |
| 4 | | Wells Fargo Large Cap Growth Fund | | Performance highlights (unaudited) |
Investment objective
The Fund seeks long-term capital appreciation.
Manager
Wells Fargo Funds Management, LLC
Subadviser
Wells Capital Management Incorporated
Portfolio managers
Joseph M. Eberhardy, CFA®, CPA
Thomas C. Ognar, CFA®
Bruce C. Olson, CFA®
Average annual total returns (%) as of January 31, 20171
| | | | | | | | | | | | | | | | | | | | | | | | | | | | | | | | | | |
| | | | | Including sales charge | | | Excluding sales charge | | | Expense ratios2 (%) | |
| | | Inception date | | 1 year | | | 5 year | | | 10 year | | | 1 year | | | 5 year | | | 10 year | | | Gross | | | Net3 | |
| Class A (STAFX) | | 7-30-2010 | | | 4.44 | | | | 9.32 | | | | 6.70 | | | | 10.81 | | | | 10.62 | | | | 7.33 | | | | 1.16 | | | | 1.07 | |
| Class C (STOFX) | | 7-30-2010 | | | 8.98 | | | | 9.79 | | | | 6.56 | | | | 9.98 | | | | 9.79 | | | | 6.56 | | | | 1.91 | | | | 1.82 | |
| Class R (STMFX) | | 6-15-2012 | | | – | | | | – | | | | – | | | | 10.52 | | | | 10.34 | | | | 7.12 | | | | 1.41 | | | | 1.32 | |
| Class R4 (SLGRX) | | 11-30-2012 | | | – | | | | – | | | | – | | | | 11.13 | | | | 10.97 | | | | 7.56 | | | | 0.88 | | | | 0.80 | |
| Class R6 (STFFX) | | 11-30-2012 | | | – | | | | – | | | | – | | | | 11.29 | | | | 11.11 | | | | 7.63 | | | | 0.73 | | | | 0.65 | |
| Administrator Class (STDFX) | | 7-30-2010 | | | – | | | | – | | | | – | | | | 10.93 | | | | 10.75 | | | | 7.43 | | | | 1.08 | | | | 0.95 | |
| Institutional Class (STNFX) | | 7-30-2010 | | | – | | | | – | | | | – | | | | 11.16 | | | | 11.04 | | | | 7.60 | | | | 0.83 | | | | 0.75 | |
| Russell 1000® Growth Index4 | | – | | | – | | | | – | | | | – | | | | 17.23 | | | | 13.93 | | | | 8.42 | | | | – | | | | – | |
Figures quoted represent past performance, which is no guarantee of future results, and do not reflect taxes that a shareholder may pay on fund distributions or the redemption of fund shares. Investment return and principal value of an investment will fluctuate so that an investor’s shares, when redeemed, may be worth more or less than their original cost. Performance shown without sales charges would be lower if sales charges were reflected. Current performance may be lower or higher than the performance data quoted, which assumes the reinvestment of dividends and capital gains. Current month-end performance is available on the Fund’s website, wellsfargofunds.com.
Index returns do not include transaction costs associated with buying and selling securities, any mutual fund fees or expenses, or any taxes. It is not possible to invest directly in an index.
For Class A shares, the maximum front-end sales charge is 5.75%. For Class C shares, the maximum contingent deferred sales charge is 1.00%. Performance including a contingent deferred sales charge assumes the sales charge for the corresponding time period. Class R, Class R4, Class R6, Administrator Class, and Institutional Class shares are sold without a front-end sales charge or contingent deferred sales charge.
Stock values fluctuate in response to the activities of individual companies and general market and economic conditions. Certain investment strategies tend to increase the total risk of an investment (relative to the broader market). The Fund is exposed to foreign investment risk. Consult the Fund’s prospectus for additional information on these and other risks.
Please see footnotes on page 5.
| | | | | | |
| Performance highlights (unaudited) | | Wells Fargo Large Cap Growth Fund | | | 5 | |
| | | | |
| Ten largest holdings (%) as of January 31, 20175 | |
Facebook Incorporated Class A | | | 5.67 | |
Amazon.com Incorporated | | | 5.36 | |
Microsoft Corporation | | | 5.03 | |
Alphabet Incorporated Class A | | | 4.19 | |
MasterCard Incorporated Class A | | | 3.03 | |
Dollar Tree Incorporated | | | 3.02 | |
Visa Incorporated Class A | | | 2.94 | |
Alphabet Incorporated Class C | | | 2.83 | |
Celgene Corporation | | | 2.78 | |
The Home Depot Incorporated | | | 2.69 | |
|
| Sector distribution as of January 31, 20176 |
|
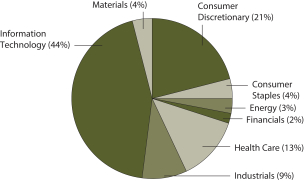
|
| 1 | Historical performance shown for Class A, Administrator Class, and Institutional Class shares prior to their inception reflects the performance of the former Investor Class shares, and includes the higher expenses applicable to the former Investor Class shares. If these expenses had not been included, returns would be higher. Historical performance shown for Class C shares prior to their inception reflects the performance of the former Investor Class shares, adjusted to reflect the higher expenses applicable to Class C shares. Historical performance shown for Class R shares prior to their inception reflects the performance of the former Investor Class shares, adjusted to reflect the higher expenses applicable to Class R shares. Historical performance shown for Class R4 shares prior to their inception reflects the performance of Institutional Class shares, adjusted to reflect the higher expenses applicable to Class R4 shares. Historical performance shown for Class R6 shares prior to their inception reflects the performance of Institutional Class shares, and includes the higher expenses applicable to Institutional Class shares. If these expenses had not been included, returns would be higher. |
| 2 | Reflects the expense ratios as stated in the most recent prospectuses. The expense ratios shown are subject to change and may differ from the annualized expense ratios shown in the financial highlights of this report. |
| 3 | The manager has contractually committed through November 30, 2017, to waive fees and/or reimburse expenses to the extent necessary to cap the Fund’s Total Annual Fund Operating Expenses After Fee Waiver at the amounts shown. After this time, the cap may be increased or the commitment to maintain the cap may be terminated only with the approval of the Board of Trustees. Brokerage commissions, stamp duty fees, interest, taxes, acquired fund fees and expenses, and extraordinary expenses are excluded from the expense cap. Without this cap, the Fund’s returns would have been lower. |
| 4 | The Russell 1000® Growth Index measures the performance of those Russell 1000 companies with higher price-to-book ratios and higher forecasted growth values. You cannot invest directly in an index. |
| 5 | The ten largest holdings, excluding cash and cash equivalents, are calculated based on the value of the investments divided by total net assets of the Fund. Holdings are subject to change and may have changed since the date specified. |
| 6 | Amounts are calculated based on the total long-term investments of the Fund. These amounts are subject to change and may have changed since the date specified. |
| | | | |
| 6 | | Wells Fargo Large Cap Growth Fund | | Fund expenses (unaudited) |
As a shareholder of the Fund, you incur two types of costs: (1) transaction costs, including sales charges (loads) on purchase payments and contingent deferred sales charges (if any) on redemptions and (2) ongoing costs, including management fees, distribution (12b-1) and/or shareholder servicing fees, and other Fund expenses. This example is intended to help you understand your ongoing costs (in dollars) of investing in the Fund and to compare these costs with the ongoing costs of investing in other mutual funds.
The example is based on an investment of $1,000 invested at the beginning of the six-month period and held for the entire period from August 1, 2016 to January 31, 2017.
Actual expenses
The “Actual” line of the table below provides information about actual account values and actual expenses. You may use the information in this line, together with the amount you invested, to estimate the expenses that you paid over the period. Simply divide your account value by $1,000 (for example, an $8,600 account value divided by $1,000 = 8.6), then multiply the result by the number in the “Actual” line under the heading entitled “Expenses paid during period” for your applicable class of shares to estimate the expenses you paid on your account during this period.
Hypothetical example for comparison purposes
The “Hypothetical” line of the table below provides information about hypothetical account values and hypothetical expenses based on the Fund’s actual expense ratio and an assumed rate of return of 5% per year before expenses, which is not the Fund’s actual return. The hypothetical account values and expenses may not be used to estimate the actual ending account balance or expenses you paid for the period. You may use this information to compare the ongoing costs of investing in the Fund and other funds. To do so, compare this 5% hypothetical example with the 5% hypothetical examples that appear in the shareholder reports of the other funds.
Please note that the expenses shown in the table are meant to highlight your ongoing costs only and do not reflect any transactional costs, such as sales charges (loads) and contingent deferred sales charges. Therefore, the “Hypothetical” line of the table is useful in comparing ongoing costs only and will not help you determine the relative total costs of owning different funds. In addition, if these transactional costs were included, your costs would have been higher.
| | | | | | | | | | | | | | | | |
| | | Beginning
account value
8-1-2016 | | | Ending
account value 1-31-2017 | | | Expenses
paid during the period¹ | | | Annualized net expense ratio | |
Class A | | | | | | | | | | | | | | | | |
Actual | | $ | 1,000.00 | | | $ | 1,012.61 | | | $ | 5.41 | | | | 1.07 | % |
Hypothetical (5% return before expenses) | | $ | 1,000.00 | | | $ | 1,019.76 | | | $ | 5.43 | | | | 1.07 | % |
Class C | | | | | | | | | | | | | | | | |
Actual | | $ | 1,000.00 | | | $ | 1,008.85 | | | $ | 9.19 | | | | 1.82 | % |
Hypothetical (5% return before expenses) | | $ | 1,000.00 | | | $ | 1,015.99 | | | $ | 9.22 | | | | 1.82 | % |
Class R | | | | | | | | | | | | | | | | |
Actual | | $ | 1,000.00 | | | $ | 1,011.20 | | | $ | 6.67 | | | | 1.32 | % |
Hypothetical (5% return before expenses) | | $ | 1,000.00 | | | $ | 1,018.50 | | | $ | 6.70 | | | | 1.32 | % |
Class R4 | | | | | | | | | | | | | | | | |
Actual | | $ | 1,000.00 | | | $ | 1,013.92 | | | $ | 4.05 | | | | 0.80 | % |
Hypothetical (5% return before expenses) | | $ | 1,000.00 | | | $ | 1,021.11 | | | $ | 4.06 | | | | 0.80 | % |
Class R6 | | | | | | | | | | | | | | | | |
Actual | | $ | 1,000.00 | | | $ | 1,014.71 | | | $ | 3.29 | | | | 0.65 | % |
Hypothetical (5% return before expenses) | | $ | 1,000.00 | | | $ | 1,021.87 | | | $ | 3.30 | | | | 0.65 | % |
Administrator Class | | | | | | | | | | | | | | | | |
Actual | | $ | 1,000.00 | | | $ | 1,013.06 | | | $ | 4.81 | | | | 0.95 | % |
Hypothetical (5% return before expenses) | | $ | 1,000.00 | | | $ | 1,020.36 | | | $ | 4.82 | | | | 0.95 | % |
Institutional Class | | | | | | | | | | | | | | | | |
Actual | | $ | 1,000.00 | | | $ | 1,014.31 | | | $ | 3.80 | | | | 0.75 | % |
Hypothetical (5% return before expenses) | | $ | 1,000.00 | | | $ | 1,021.37 | | | $ | 3.81 | | | | 0.75 | % |
| 1 | Expenses paid is equal to the annualized net expense ratio of each class multiplied by the average account value over the period, multiplied by the number of days in the most recent fiscal half-year divided by the number of days in the fiscal year (to reflect the one-half-year period). |
| | | | | | |
| Portfolio of investments—January 31, 2017 (unaudited) | | Wells Fargo Large Cap Growth Fund | | | 7 | |
| | | | | | | | | | | | | | | | |
| Security name | | | | | | | | Shares | | | Value | |
| | | | |
Common Stocks: 98.66% | | | | | | | | | | | | | | | | |
| | | | |
Consumer Discretionary: 20.45% | | | | | | | | | | | | | | | | |
| | | | |
| Hotels, Restaurants & Leisure: 2.05% | | | | | | | | | | | | | | | | |
Marriott International Incorporated Class A | | | | | | | | | | | 88,000 | | | $ | 7,444,800 | |
Starbucks Corporation | | | | | | | | | | | 330,000 | | | | 18,222,600 | |
| | | | |
| | | | | | | | | | | | | | | 25,667,400 | |
| | | | | | | | | | | | | | | | |
| | | | |
| Internet & Direct Marketing Retail: 7.05% | | | | | | | | | | | | | | | | |
Amazon.com Incorporated † | | | | | | | | | | | 81,500 | | | | 67,113,620 | |
The Priceline Group Incorporated † | | | | | | | | | | | 13,500 | | | | 21,264,255 | |
| | | | |
| | | | | | | | | | | | | | | 88,377,875 | |
| | | | | | | | | | | | | | | | |
| | | | |
| Multiline Retail: 3.02% | | | | | | | | | | | | | | | | |
Dollar Tree Incorporated † | | | | | | | | | | | 490,000 | | | | 37,823,100 | |
| | | | | | | | | | | | | | | | |
| | | | |
| Specialty Retail: 6.25% | | | | | | | | | | | | | | | | |
O’Reilly Automotive Incorporated † | | | | | | | | | | | 118,000 | | | | 30,947,860 | |
The Home Depot Incorporated | | | | | | | | | | | 245,000 | | | | 33,707,100 | |
Tractor Supply Company | | | | | | | | | | | 93,000 | | | | 6,851,310 | |
ULTA Salon Cosmetics & Fragrance Incorporated † | | | | | | | | | | | 25,000 | | | | 6,807,000 | |
| | | | |
| | | | | | | | | | | | | | | 78,313,270 | |
| | | | | | | | | | | | | | | | |
| | | | |
| Textiles, Apparel & Luxury Goods: 2.08% | | | | | | | | | | | | | | | | |
Nike Incorporated Class B | | | | | | | | | | | 329,000 | | | | 17,404,100 | |
VF Corporation | | | | | | | | | | | 169,000 | | | | 8,700,120 | |
| | | | |
| | | | | | | | | | | | | | | 26,104,220 | |
| | | | | | | | | | | | | | | | |
| | | | |
Consumer Staples: 3.70% | | | | | | | | | | | | | | | | |
| | | | |
| Food & Staples Retailing: 1.92% | | | | | | | | | | | | | | | | |
Costco Wholesale Corporation | | | | | | | | | | | 147,000 | | | | 24,100,650 | |
| | | | | | | | | | | | | | | | |
| | | | |
| Household Products: 0.51% | | | | | | | | | | | | | | | | |
Colgate-Palmolive Company | | | | | | | | | | | 99,000 | | | | 6,393,420 | |
| | | | | | | | | | | | | | | | |
| | | | |
| Personal Products: 1.27% | | | | | | | | | | | | | | | | |
The Estee Lauder Companies Incorporated Class A | | | | | | | | | | | 195,000 | | | | 15,835,950 | |
| | | | | | | | | | | | | | | | |
| | | | |
Energy: 2.66% | | | | | | | | | | | | | | | | |
| | | | |
| Energy Equipment & Services: 0.68% | | | | | | | | | | | | | | | | |
Schlumberger Limited | | | | | | | | | | | 102,480 | | | | 8,578,601 | |
| | | | | | | | | | | | | | | | |
| | | | |
| Oil, Gas & Consumable Fuels: 1.98% | | | | | | | | | | | | | | | | |
Concho Resources Incorporated † | | | | | | | | | | | 137,000 | | | | 19,103,280 | |
EOG Resources Incorporated | | | | | | | | | | | 56,000 | | | | 5,688,480 | |
| | | | |
| | | | | | | | | | | | | | | 24,791,760 | |
| | | | | | | | | | | | | | | | |
The accompanying notes are an integral part of these financial statements.
| | | | |
| 8 | | Wells Fargo Large Cap Growth Fund | | Portfolio of investments—January 31, 2017 (unaudited) |
| | | | | | | | | | | | | | | | |
| Security name | | | | | | | | Shares | | | Value | |
| | | | |
Financials: 2.08% | | | | | | | | | | | | | | | | |
| | | | |
| Capital Markets: 2.08% | | | | | | | | | | | | | | | | |
Morgan Stanley | | | | | | | | | | | 176,000 | | | $ | 7,478,240 | |
The Charles Schwab Corporation | | | | | | | | | | | 450,000 | | | | 18,558,000 | |
| | | | |
| | | | | | | | | | | | | | | 26,036,240 | |
| | | | | | | | | | | | | | | | |
| | | | |
Health Care: 12.69% | | | | | | | | | | | | | | | | |
| | | | |
| Biotechnology: 9.28% | | | | | | | | | | | | | | | | |
Alexion Pharmaceuticals Incorporated † | | | | | | | | | | | 57,000 | | | | 7,448,760 | |
Amgen Incorporated | | | | | | | | | | | 98,000 | | | | 15,354,640 | |
BioMarin Pharmaceutical Incorporated † | | | | | | | | | | | 204,000 | | | | 17,876,520 | |
Celgene Corporation † | | | | | | | | | | | 300,000 | | | | 34,845,000 | |
Incyte Corporation † | | | | | | | | | | | 115,460 | | | | 13,994,907 | |
Regeneron Pharmaceuticals Incorporated † | | | | | | | | | | | 25,850 | | | | 9,287,647 | |
Tesaro Incorporated †« | | | | | | | | | | | 43,000 | | | | 7,002,120 | |
Vertex Pharmaceuticals Incorporated † | | | | | | | | | | | 122,000 | | | | 10,476,140 | |
| | | | |
| | | | | | | | | | | | | | | 116,285,734 | |
| | | | | | | | | | | | | | | | |
| | | | |
| Health Care Equipment & Supplies: 1.91% | | | | | | | | | | | | | | | | |
Boston Scientific Corporation † | | | | | | | | | | | 161,000 | | | | 3,873,660 | |
Danaher Corporation | | | | | | | | | | | 161,930 | | | | 13,589,166 | |
Edwards Lifesciences Corporation † | | | | | | | | | | | 67,000 | | | | 6,448,080 | |
| | | | |
| | | | | | | | | | | | | | | 23,910,906 | |
| | | | | | | | | | | | | | | | |
| | | | |
| Pharmaceuticals: 1.50% | | | | | | | | | | | | | | | | |
Zoetis Incorporated | | | | | | | | | | | 342,000 | | | | 18,789,480 | |
| | | | | | | | | | | | | | | | |
| | | | |
Industrials: 9.55% | | | | | | | | | | | | | | | | |
| | | | |
| Aerospace & Defense: 1.14% | | | | | | | | | | | | | | | | |
The Boeing Company | | | | | | | | | | | 87,000 | | | | 14,217,540 | |
| | | | | | | | | | | | | | | | |
| | | | |
| Air Freight & Logistics: 0.80% | | | | | | | | | | | | | | | | |
FedEx Corporation | | | | | | | | | | | 53,000 | | | | 10,022,830 | |
| | | | | | | | | | | | | | | | |
| | | | |
| Airlines: 0.21% | | | | | | | | | | | | | | | | |
Southwest Airlines Company | | | | | | | | | | | 49,313 | | | | 2,579,563 | |
| | | | | | | | | | | | | | | | |
| | | | |
| Building Products: 0.52% | | | | | | | | | | | | | | | | |
Johnson Controls International plc | | | | | | | | | | | 149,000 | | | | 6,553,020 | |
| | | | | | | | | | | | | | | | |
| | | | |
| Commercial Services & Supplies: 0.53% | | | | | | | | | | | | | | | | |
KAR Auction Services Incorporated | | | | | | | | | | | 147,000 | | | | 6,695,850 | |
| | | | | | | | | | | | | | | | |
| | | | |
| Electrical Equipment: 0.99% | | | | | | | | | | | | | | | | |
Rockwell Automation Incorporated | | | | | | | | | | | 84,000 | | | | 12,431,160 | |
| | | | | | | | | | | | | | | | |
| | | | |
| Industrial Conglomerates: 1.48% | | | | | | | | | | | | | | | | |
3M Company | | | | | | | | | | | 106,000 | | | | 18,530,920 | |
| | | | | | | | | | | | | | | | |
| | | | |
| Machinery: 0.57% | | | | | | | | | | | | | | | | |
Fortive Corporation | | | | | | | | | | | 129,960 | | | | 7,188,088 | |
| | | | | | | | | | | | | | | | |
The accompanying notes are an integral part of these financial statements.
| | | | | | |
| Portfolio of investments—January 31, 2017 (unaudited) | | Wells Fargo Large Cap Growth Fund | | | 9 | |
| | | | | | | | | | | | | | | | |
| Security name | | | | | | | | Shares | | | Value | |
| | | | |
| Road & Rail: 3.31% | | | | | | | | | | | | | | | | |
CSX Corporation | | | | | | | | | | | 57,000 | | | $ | 2,644,230 | |
Norfolk Southern Corporation | | | | | | | | | | | 70,000 | | | | 8,222,200 | |
Union Pacific Corporation | | | | | | | | | | | 287,440 | | | | 30,635,355 | |
| | | | |
| | | | | | | | | | | | | | | 41,501,785 | |
| | | | | | | | | | | | | | | | |
| | | | |
Information Technology: 43.58% | | | | | | | | | | | | | | | | |
| | | | |
| Internet Software & Services: 14.38% | | | | | | | | | | | | | | | | |
Akamai Technologies Incorporated † | | | | | | | | | | | 82,000 | | | | 5,624,380 | |
Alphabet Incorporated Class A † | | | | | | | | | | | 64,000 | | | | 52,492,160 | |
Alphabet Incorporated Class C † | | | | | | | | | | | 44,500 | | | | 35,457,155 | |
eBay Incorporated † | | | | | | | | | | | 490,000 | | | | 15,596,700 | |
Facebook Incorporated Class A † | | | | | | | | | | | 545,000 | | | | 71,024,400 | |
| | | | |
| | | | | | | | | | | | | | | 180,194,795 | |
| | | | | | | | | | | | | | | | |
| | | | |
| IT Services: 9.26% | | | | | | | | | | | | | | | | |
Accenture plc Class A | | | | | | | | | | | 95,410 | | | | 10,864,337 | |
FleetCor Technologies Incorporated † | | | | | | | | | | | 85,000 | | | | 12,536,650 | |
MasterCard Incorporated Class A | | | | | | | | | | | 357,000 | | | | 37,959,810 | |
PayPal Holdings Incorporated † | | | | | | | | | | | 450,360 | | | | 17,915,321 | |
Visa Incorporated Class A | | | | | | | | | | | 445,000 | | | | 36,805,950 | |
| | | | |
| | | | | | | | | | | | | | | 116,082,068 | |
| | | | | | | | | | | | | | | | |
| | | | |
| Semiconductors & Semiconductor Equipment: 7.66% | | | | | | | | | | | | | | | | |
Broadcom Limited | | | | | | | | | | | 152,000 | | | | 30,323,998 | |
Microchip Technology Incorporated | | | | | | | | | | | 370,000 | | | | 24,919,500 | |
NVIDIA Corporation | | | | | | | | | | | 58,000 | | | | 6,332,440 | |
QUALCOMM Incorporated | | | | | | | | | | | 111,450 | | | | 5,954,774 | |
Texas Instruments Incorporated | | | | | | | | | | | 376,260 | | | | 28,422,680 | |
| | | | |
| | | | | | | | | | | | | | | 95,953,392 | |
| | | | | | | | | | | | | | | | |
| | | | |
| Software: 11.24% | | | | | | | | | | | | | | | | |
Adobe Systems Incorporated † | | | | | | | | | | | 179,700 | | | | 20,374,386 | |
CDK Global Incorporated | | | | | | | | | | | 102,000 | | | | 6,380,100 | |
Microsoft Corporation | | | | | | | | | | | 975,000 | | | | 63,033,750 | |
Salesforce.com Incorporated † | | | | | | | | | | | 228,700 | | | | 18,090,170 | |
ServiceNow Incorporated † | | | | | | | | | | | 169,810 | | | | 15,388,182 | |
Splunk Incorporated † | | | | | | | | | | | 304,170 | | | | 17,599,276 | |
| | | | |
| | | | | | | | | | | | | | | 140,865,864 | |
| | | | | | | | | | | | | | | | |
| | | | |
| Technology Hardware, Storage & Peripherals: 1.04% | | | | | | | | | | | | | | | | |
Apple Incorporated | | | | | | | | | | | 107,200 | | | | 13,008,720 | |
| | | | | | | | | | | | | | | | |
| | | | |
Materials: 3.95% | | | | | | | | | | | | | | | | |
| | | | |
| Chemicals: 3.95% | | | | | | | | | | | | | | | | |
Ecolab Incorporated | | | | | | | | | | | 215,000 | | | | 25,827,950 | |
Praxair Incorporated | | | | | | | | | | | 200,320 | | | | 23,725,901 | |
| | | | |
| | | | | | | | | | | | | | | 49,553,851 | |
| | | | | | | | | | | | | | | | |
| | | | |
Total Common Stocks (Cost $758,832,019) | | | | | | | | | | | | | | | 1,236,388,052 | |
| | | | | | | | | | | | | | | | |
The accompanying notes are an integral part of these financial statements.
| | | | |
| 10 | | Wells Fargo Large Cap Growth Fund | | Portfolio of investments—January 31, 2017 (unaudited) |
| | | | | | | | | | | | | | | | |
| Security name | | Yield | | | | | | Shares | | | Value | |
| | | | |
Short-Term Investments: 1.43% | | | | | | | | | | | | | | | | |
| | | | |
| Investment Companies: 1.43% | | | | | | | | | | | | | | | | |
Securities Lending Cash Investment LLC (l)(r)(u) | | | 0.86 | % | | | | | | | 424,648 | | | $ | 424,691 | |
Wells Fargo Government Money Market Fund Select Class (l)(u) | | | 0.46 | | | | | | | | 17,512,763 | | | | 17,512,763 | |
| | | | |
Total Short-Term Investments (Cost $17,937,415) | | | | | | | | | | | | | | | 17,937,454 | |
| | | | | | | | | | | | | | | | |
| | | | | | | | |
| Total investments in securities (Cost $776,769,434) * | | | 100.09 | % | | | 1,254,325,506 | |
Other assets and liabilities, net | | | (0.09 | ) | | | (1,151,909 | ) |
| | | | | | | | |
| Total net assets | | | 100.00 | % | | $ | 1,253,173,597 | |
| | | | | | | | |
| † | Non-income-earning security |
| « | All or a portion of this security is on loan. |
| (l) | The issuer of the security is an affiliated person of the Fund as defined in the Investment Company Act of 1940. |
| (r) | The investment is a non-registered investment vehicle purchased with cash collateral received from securities on loan. |
| (u) | The rate represents the 7-day annualized yield at period end. |
| * | Cost for federal income tax purposes is $776,718,925 and unrealized gains (losses) consists of: |
| | | | |
Gross unrealized gains | | $ | 484,762,404 | |
Gross unrealized losses | | | (7,155,823 | ) |
| | | | |
Net unrealized gains | | $ | 477,606,581 | |
The accompanying notes are an integral part of these financial statements.
| | | | | | |
| Statement of assets and liabilities—January 31, 2017 (unaudited) | | Wells Fargo Large Cap Growth Fund | | | 11 | |
| | | | |
| | | | |
| |
Assets | | | | |
Investments | | | | |
In unaffiliated securities (including $414,288 of securities loaned), at value (cost $758,832,019) | | $ | 1,236,388,052 | |
In affiliated securities, at value (cost $17,937,415) | | | 17,937,454 | |
| | | | |
Total investments, at value (cost $776,769,434) | | | 1,254,325,506 | |
Receivable for investments sold | | | 5,889,719 | |
Receivable for Fund shares sold | | | 1,025,733 | |
Receivable for dividends | | | 409,526 | |
Receivable for securities lending income | | | 1,830 | |
Prepaid expenses and other assets | | | 58,899 | |
| | | | |
Total assets | | | 1,261,711,213 | |
| | | | |
| |
Liabilities | | | | |
Payable for investments purchased | | | 5,556,739 | |
Payable for Fund shares redeemed | | | 1,517,454 | |
Payable upon receipt of securities loaned | | | 423,225 | |
Management fee payable | | | 620,867 | |
Distribution fees payable | | | 11,557 | |
Administration fees payable | | | 151,094 | |
Accrued expenses and other liabilities | | | 256,680 | |
| | | | |
Total liabilities | | | 8,537,616 | |
| | | | |
Total net assets | | $ | 1,253,173,597 | |
| | | | |
| |
NET ASSETS CONSIST OF | | | | |
Paid-in capital | | $ | 753,536,524 | |
Overdistributed net investment income | | | (471,102 | ) |
Accumulated net realized gains on investments | | | 22,552,103 | |
Net unrealized gains on investments | | | 477,556,072 | |
| | | | |
Total net assets | | $ | 1,253,173,597 | |
| | | | |
| |
COMPUTATION OF NET ASSET VALUE AND OFFERING PRICE PER SHARE | | | | |
Net assets – Class A | | $ | 512,248,813 | |
Shares outstanding – Class A1 | | | 11,571,429 | |
Net asset value per share – Class A | | | $44.27 | |
Maximum offering price per share – Class A2 | | | $46.97 | |
Net assets – Class C | | $ | 15,569,455 | |
Shares outstanding – Class C1 | | | 371,517 | |
Net asset value per share – Class C | | | $41.91 | |
Net assets – Class R | | $ | 6,764,465 | |
Shares outstanding – Class R1 | | | 154,984 | |
Net asset value per share – Class R | | | $43.65 | |
Net assets – Class R4 | | $ | 8,852,275 | |
Share outstanding – Class R41 | | | 197,023 | |
Net asset value per share – Class R4 | | | $44.93 | |
Net assets – Class R6 | | $ | 274,999,748 | |
Shares outstanding – Class R61 | | | 6,101,410 | |
Net asset value per share – Class R6 | | | $45.07 | |
Net assets – Administrator Class | | $ | 203,921,261 | |
Shares outstanding – Administrator Class1 | | | 4,576,900 | |
Net asset value per share – Administrator Class | | | $44.55 | |
Net assets – Institutional Class | | $ | 230,817,580 | |
Shares outstanding – Institutional Class1 | | | 5,130,395 | |
Net asset value per share – Institutional Class | | | $44.99 | |
| 1 | The Fund has an unlimited number of authorized shares. |
| 2 | Maximum offering price is computed as 100/94.25 of net asset value. On investments of $50,000 or more, the offering price is reduced. |
The accompanying notes are an integral part of these financial statements.
| | | | |
| 12 | | Wells Fargo Large Cap Growth Fund | | Statement of operations—six months ended January 31, 2017 (unaudited) |
| | | | |
| | | | |
| |
Investment income | | | | |
Dividends | | $ | 6,296,060 | |
Securities lending income, net | | | 93,034 | |
Income from affiliated securities | | | 20,348 | |
| | | | |
Total investment income | | | 6,409,442 | |
| | | | |
| |
Expenses | | | | |
Management fee | | | 4,477,616 | |
Administration fees | | | | |
Class A | | | 573,430 | |
Class C | | | 17,953 | |
Class R | | | 7,756 | |
Class R4 | | | 3,417 | |
Class R6 | | | 42,094 | |
Administrator Class | | | 142,237 | |
Institutional Class | | | 156,622 | |
Shareholder servicing fees | | | | |
Class A | | | 682,655 | |
Class C | | | 21,373 | |
Class R | | | 9,234 | |
Class R4 | | | 4,271 | |
Administrator Class | | | 273,290 | |
Distribution fees | | | | |
Class C | | | 64,119 | |
Class R | | | 9,234 | |
Custody and accounting fees | | | 22,038 | |
Professional fees | | | 21,557 | |
Registration fees | | | 58,492 | |
Shareholder report expenses | | | 39,533 | |
Trustees’ fees and expenses | | | 2,340 | |
Other fees and expenses | | | 13,348 | |
| | | | |
Total expenses | | | 6,642,609 | |
Less: Fee waivers and/or expense reimbursements | | | (627,278 | ) |
| | | | |
Net expenses | | | 6,015,331 | |
| | | | |
Net investment income | | | 394,111 | |
| | | | |
| |
REALIZED AND UNREALIZED GAINS (LOSSES) ON INVESTMENTS | | | | |
| |
Net realized gains (losses) on: | | | | |
Unaffiliated securities | | | 54,066,667 | |
Affiliated securities | | | 1,427 | |
| | | | |
Net realized gains on investments | | | 54,068,094 | |
| | | | |
| |
Net change in unrealized gains (losses) on: | | | | |
Unaffiliated securities | | | (39,715,243 | ) |
Affiiliated securities | | | 39 | |
| | | | |
Net change in unrealized gains (losses) on investments | | | (39,715,204 | ) |
| | | | |
Net realized and unrealized gains (losses) on investments | | | 14,352,890 | |
| | | | |
Net increase in net assets resulting from operations | | $ | 14,747,001 | |
| | | | |
The accompanying notes are an integral part of these financial statements.
| | | | | | |
| Statement of changes in net assets | | Wells Fargo Large Cap Growth Fund | | | 13 | |
| | | | | | | | | | | | | | | | |
| | | Six months ended
January 31, 2017
(unaudited) | | | Year ended
July 31, 2016 | |
| | | |
Operations | | | | | | | | | | | | |
Net investment income | | | | | | $ | 394,111 | | | | | | | $ | 2,363,745 | |
Net realized gains on investments | | | | | | | 54,068,094 | | | | | | | | 44,634,435 | |
Net change in unrealized gains (losses) on investments | | | | | | | (39,715,204 | ) | | | | | | | (80,144,617 | ) |
| | | | |
Net increase (decrease) in net assets resulting from operations | | | | | | | 14,747,001 | | | | | | | | (33,146,437 | ) |
| | | | |
| | | |
Distributions to shareholders from | | | | | | | | | | | | |
Net investment income | | | | | | | | | | | | | | | | |
Class A | | | | | | | 0 | | | | | | | | (8,533 | ) |
Class R4 | | | | | | | (9,195 | ) | | | | | | | (26,255 | ) |
Class R6 | | | | | | | (472,646 | ) | | | | | | | (542,444 | ) |
Administrator Class | | | | | | | (63,610 | ) | | | | | | | (399,214 | ) |
Institutional Class | | | | | | | (294,392 | ) | | | | | | | (2,359,767 | ) |
Net realized gains | | | | | | | | | | | | | | | | |
Class A | | | | | | | (26,874,841 | ) | | | | | | | (33,357,991 | ) |
Class C | | | | | | | (872,051 | ) | | | | | | | (1,130,136 | ) |
Class R | | | | | | | (365,902 | ) | | | | | | | (642,814 | ) |
Class R4 | | | | | | | (424,319 | ) | | | | | | | (366,120 | ) |
Class R6 | | | | | | | (13,853,634 | ) | | | | | | | (5,970,675 | ) |
Administrator Class | | | | | | | (10,174,259 | ) | | | | | | | (12,858,667 | ) |
Institutional Class | | | | | | | (11,729,550 | ) | | | | | | | (26,507,074 | ) |
| | | | |
Total distributions to shareholders | | | | | | | (65,134,399 | ) | | | | | | | (84,169,690 | ) |
| | | | |
| | | | |
Capital share transactions | | | Shares | | | | | | | | Shares | | | | | |
Proceeds from shares sold | | | | | | | | | | | | | | | | |
Class A | | | 232,072 | | | | 10,332,690 | | | | 10,423,557 | | | | 507,133,935 | |
Class C | | | 20,308 | | | | 852,468 | | | | 94,075 | | | | 4,156,298 | |
Class R | | | 41,413 | | | | 1,808,346 | | | | 93,883 | | | | 4,246,909 | |
Class R4 | | | 13,937 | | | | 634,422 | | | | 47,194 | | | | 2,095,908 | |
Class R6 | | | 1,541,188 | | | | 72,388,287 | | | | 2,853,291 | | | | 127,876,221 | |
Administrator Class | | | 322,179 | | | | 14,418,291 | | | | 871,378 | | | | 39,477,413 | |
Institutional Class | | | 416,424 | | | | 19,050,252 | | | | 1,620,978 | | | | 73,346,308 | |
Investor Class | | | N/A | | | | N/A | | | | 88,699 | 1 | | | 4,159,389 | 1 |
| | | | |
| | | | | | | 119,484,756 | | | | | | | | 762,492,381 | |
| | | | |
Reinvestment of distributions | | | | | | | | | | | | | | | | |
Class A | | | 579,132 | | | | 25,111,167 | | | | 689,341 | | | | 31,248,057 | |
Class C | | | 17,868 | | | | 734,193 | | | | 21,233 | | | | 921,496 | |
Class R | | | 934 | | | | 39,944 | | | | 5,901 | | | | 264,733 | |
Class R4 | | | 9,844 | | | | 433,514 | | | | 8,508 | | | | 392,375 | |
Class R6 | | | 324,173 | | | | 14,326,280 | | | | 140,783 | | | | 6,513,119 | |
Administrator Class | | | 234,472 | | | | 10,234,532 | | | | 290,191 | | | | 13,252,210 | |
Institutional Class | | | 204,593 | | | | 9,023,692 | | | | 541,392 | | | | 25,023,933 | |
| | | | |
| | | | | | | 59,903,322 | | | | | | | | 77,615,923 | |
| | | | |
Payment for shares redeemed | | | | | | | | | | | | | | | | |
Class A | | | (1,759,583 | ) | | | (78,200,772 | ) | | | (2,316,847 | ) | | | (103,461,789 | ) |
Class C | | | (96,842 | ) | | | (4,116,455 | ) | | | (164,112 | ) | | | (7,122,729 | ) |
Class R | | | (67,985 | ) | | | (2,994,056 | ) | | | (165,274 | ) | | | (7,268,281 | ) |
Class R4 | | | (6,679 | ) | | | (304,256 | ) | | | (19,211 | ) | | | (894,912 | ) |
Class R6 | | | (586,998 | ) | | | (26,664,357 | ) | | | (509,940 | ) | | | (23,062,787 | ) |
Administrator Class | | | (1,109,296 | ) | | | (50,266,095 | ) | | | (1,299,777 | ) | | | (59,103,069 | ) |
Institutional Class | | | (2,257,640 | ) | | | (104,969,603 | ) | | | (6,030,432 | ) | | | (274,102,744 | ) |
Investor Class | | | N/A | | | | N/A | | | | (9,823,525 | )1 | | | (479,180,351 | )1 |
| | | | |
| | | | | | | (267,515,594 | ) | | | | | | | (954,196,662 | ) |
| | | | |
Net decrease in net assets resulting from capital share transactions | | | | | | | (88,127,516 | ) | | | | | | | (114,088,358 | ) |
| | | | |
Total decrease in net assets | | | | | | | (138,514,914 | ) | | | | | | | (231,404,485 | ) |
| | | | |
| | | |
Net assets | | | | | | | | | | | | |
Beginning of period | | | | | | | 1,391,688,511 | | | | | | | | 1,623,092,996 | |
| | | | |
End of period | | | | | | $ | 1,253,173,597 | | | | | | | $ | 1,391,688,511 | |
| | | | |
Overdistributed net investment income | | | | | | $ | (471,102 | ) | | | | | | $ | (25,370 | ) |
| | | | |
| 1 | For the period from August 1, 2015 to October 23, 2015. Effective at the close of business on October 23, 2015, Investor Class shares were converted to Class A shares and are no longer offered by the Fund. |
The accompanying notes are an integral part of these financial statements.
| | | | |
| 14 | | Wells Fargo Large Cap Growth Fund | | Financial highlights |
(For a share outstanding throughout each period)
| | | | | | | | | | | | | | | | | | | | | | | | |
| | | Six months ended January 31, 2017 (unaudited) | | | Year ended July 31 | |
| CLASS A | | | 2016 | | | 2015 | | | 2014 | | | 2013 | | | 2012 | |
Net asset value, beginning of period | | | $46.05 | | | | $49.55 | | | | $45.30 | | | | $39.73 | | | | $32.92 | | | | $31.62 | |
Net investment income (loss) | | | (0.02 | )1 | | | (0.03 | )1 | | | (0.01 | )1 | | | (0.06 | ) | | | 0.04 | | | | (0.12 | )1 |
Net realized and unrealized gains (losses) on investments | | | 0.55 | | | | (0.92 | ) | | | 6.33 | | | | 7.01 | | | | 6.81 | | | | 1.42 | |
| | | | | | | | | | | | | | | | | | | | | | | | |
Total from investment operations | | | 0.53 | | | | (0.95 | ) | | | 6.32 | | | | 6.95 | | | | 6.85 | | | | 1.30 | |
Distributions to shareholders from | | | | | | | | | | | | | | | | | | | | | | | | |
Net investment income | | | 0.00 | | | | (0.00 | )2 | | | 0.00 | | | | 0.00 | | | | (0.04 | ) | | | 0.00 | |
Net realized gains | | | (2.31 | ) | | | (2.55 | ) | | | (2.07 | ) | | | (1.38 | ) | | | 0.00 | | | | 0.00 | |
| | | | | | | | | | | | | | | | | | | | | | | | |
Total distributions to shareholders | | | (2.31 | ) | | | (2.55 | ) | | | (2.07 | ) | | | (1.38 | ) | | | (0.04 | ) | | | 0.00 | |
Net asset value, end of period | | | $44.27 | | | | $46.05 | | | | $49.55 | | | | $45.30 | | | | $39.73 | | | | $32.92 | |
Total return3 | | | 1.26 | % | | | (1.83 | )% | | | 14.35 | % | | | 17.69 | % | | | 20.84 | % | | | 4.08 | % |
Ratios to average net assets (annualized) | | | | | | | | | | | | | | | | | | | | | | | | |
Gross expenses | | | 1.16 | % | | | 1.16 | % | | | 1.20 | % | | | 1.22 | % | | | 1.23 | % | | | 1.24 | % |
Net expenses | | | 1.07 | % | | | 1.07 | % | | | 1.07 | % | | | 1.07 | % | | | 1.07 | % | | | 1.10 | % |
Net investment income (loss) | | | (0.10 | )% | | | (0.06 | )% | | | (0.02 | )% | | | (0.17 | )% | | | 0.09 | % | | | (0.37 | )% |
Supplemental data | | | | | | | | | | | | | | | | | | | | | | | | |
Portfolio turnover rate | | | 31 | % | | | 31 | % | | | 26 | % | | | 35 | % | | | 57 | % | | | 46 | % |
Net assets, end of period (000s omitted) | | | $512,249 | | | | $576,502 | | | | $184,504 | | | | $212,273 | | | | $131,616 | | | | $75,149 | |
| 1 | Calculated based upon average shares outstanding |
| 2 | Amount is less than $0.005. |
| 3 | Total return calculations do not include any sales charges. Returns for periods of less than one year are not annualized. |
The accompanying notes are an integral part of these financial statements.
| | | | | | |
| Financial highlights | | Wells Fargo Large Cap Growth Fund | | | 15 | |
(For a share outstanding throughout each period)
| | | | | | | | | | | | | | | | | | | | | | | | |
| | | Six months ended January 31, 2017 (unaudited) | | | Year ended July 31 | |
| CLASS C | | | 2016 | | | 2015 | | | 2014 | | | 2013 | | | 2012 | |
Net asset value, beginning of period | | | $43.88 | | | | $47.68 | | | | $43.99 | | | | $38.90 | | | | $32.43 | | | | $31.38 | |
Net investment loss | | | (0.18 | )1 | | | (0.32 | )1 | | | (0.42 | ) | | | (0.33 | ) | | | (0.20 | ) | | | (0.37 | )1 |
Net realized and unrealized gains (losses) on investments | | | 0.52 | | | | (0.93 | ) | | | 6.18 | | | | 6.80 | | | | 6.67 | | | | 1.42 | |
| | | | | | | | | | | | | | | | | | | | | | | | |
Total from investment operations | | | 0.34 | | | | (1.25 | ) | | | 5.76 | | | | 6.47 | | | | 6.47 | | | | 1.05 | |
Distributions to shareholders from | | | | | | | | | | | | | | | | | | | | | | | | |
Net realized gains | | | (2.31 | ) | | | (2.55 | ) | | | (2.07 | ) | | | (1.38 | ) | | | 0.00 | | | | 0.00 | |
Net asset value, end of period | | | $41.91 | | | | $43.88 | | | | $47.68 | | | | $43.99 | | | | $38.90 | | | | $32.43 | |
Total return2 | | | 0.89 | % | | | (2.56 | )% | | | 13.47 | % | | | 16.81 | % | | | 19.95 | % | | | 3.31 | % |
Ratios to average net assets (annualized) | | | | | | | | | | | | | | | | | | | | | | | | |
Gross expenses | | | 1.91 | % | | | 1.91 | % | | | 1.95 | % | | | 1.97 | % | | | 1.98 | % | | | 1.99 | % |
Net expenses | | | 1.82 | % | | | 1.82 | % | | | 1.82 | % | | | 1.82 | % | | | 1.82 | % | | | 1.84 | % |
Net investment loss | | | (0.85 | )% | | | (0.75 | )% | | | (0.77 | )% | | | (0.89 | )% | | | (0.65 | )% | | | (1.16 | )% |
Supplemental data | | | | | | | | | | | | | | | | | | | | | | | | |
Portfolio turnover rate | | | 31 | % | | | 31 | % | | | 26 | % | | | 35 | % | | | 57 | % | | | 46 | % |
Net assets, end of period (000s omitted) | | | $15,569 | | | | $18,877 | | | | $22,839 | | | | $22,767 | | | | $17,748 | | | | $11,829 | |
| 1 | Calculated based upon average shares outstanding |
| 2 | Total return calculations do not include any sales charges. Returns for periods of less than one year are not annualized. |
The accompanying notes are an integral part of these financial statements.
| | | | |
| 16 | | Wells Fargo Large Cap Growth Fund | | Financial highlights |
(For a share outstanding throughout each period)
| | | | | | | | | | | | | | | | | | | | | | | | |
| | | Six months ended January 31, 2017 (unaudited) | | | Year ended July 31 | |
| CLASS R | | | 2016 | | | 2015 | | | 2014 | | | 2013 | | | 20121 | |
Net asset value, beginning of period | | | $45.50 | | | | $49.11 | | | | $45.03 | | | | $39.59 | | | | $32.86 | | | | $32.91 | |
Net investment loss | | | (0.08 | )2 | | | (0.10 | )2 | | | (0.16 | ) | | | (0.15 | ) | | | (0.06 | )2 | | | (0.05 | )2 |
Net realized and unrealized gains (losses) on investments | | | 0.54 | | | | (0.96 | ) | | | 6.31 | | | | 6.97 | | | | 6.80 | | | | 0.00 | 3 |
| | | | | | | | | | | | | | | | | | | | | | | | |
Total from investment operations | | | 0.46 | | | | (1.06 | ) | | | 6.15 | | | | 6.82 | | | | 6.74 | | | | (0.05 | ) |
Distributions to shareholders from | | | | | | | | | | | | | | | | | | | | | | | | |
Net investment income | | | 0.00 | | | | 0.00 | | | | 0.00 | | | | 0.00 | | | | (0.01 | ) | | | 0.00 | |
Net realized gains | | | (2.31 | ) | | | (2.55 | ) | | | (2.07 | ) | | | (1.38 | ) | | | 0.00 | | | | 0.00 | |
| | | | | | | | | | | | | | | | | | | | | | | | |
Total distributions to shareholders | | | (2.31 | ) | | | (2.55 | ) | | | (2.07 | ) | | | (1.38 | ) | | | (0.01 | ) | | | 0.00 | |
Net asset value, end of period | | | $43.65 | | | | $45.50 | | | | $49.11 | | | | $45.03 | | | | $39.59 | | | | $32.86 | |
Total return4 | | | 1.12 | % | | | (2.08 | )% | | | 14.05 | % | | | 17.42 | % | | | 20.53 | % | | | (0.15 | )% |
Ratios to average net assets (annualized) | | | | | | | | | | | | | | | | | | | | | | | | |
Gross expenses | | | 1.41 | % | | | 1.41 | % | | | 1.45 | % | | | 1.47 | % | | | 1.47 | % | | | 1.47 | % |
Net expenses | | | 1.32 | % | | | 1.32 | % | | | 1.32 | % | | | 1.32 | % | | | 1.32 | % | | | 1.32 | % |
Net investment loss | | | (0.35 | )% | | | (0.23 | )% | | | (0.28 | )% | | | (0.41 | )% | | | (0.16 | )% | | | (0.95 | )% |
Supplemental data | | | | | | | | | | | | | | | | | | | | | | | | |
Portfolio turnover rate | | | 31 | % | | | 31 | % | | | 26 | % | | | 35 | % | | | 57 | % | | | 46 | % |
Net assets, end of period (000s omitted) | | | $6,764 | | | | $8,218 | | | | $12,086 | | | | $12,295 | | | | $8,149 | | | | $5,065 | |
| 1 | For the period from June 15, 2012 (commencement of class operations) to July 31, 2012 |
| 2 | Calculated based upon average shares outstanding |
| 3 | Amount is less than $0.005. |
| 4 | Returns for periods of less than one year are not annualized. |
The accompanying notes are an integral part of these financial statements.
| | | | | | |
| Financial highlights | | Wells Fargo Large Cap Growth Fund | | | 17 | |
(For a share outstanding throughout each period)
| | | | | | | | | | | | | | | | | | | | |
| | | Six months ended January 31, 2017 (unaudited) | | | Year ended July 31 | |
| CLASS R4 | | | 2016 | | | 2015 | | | 2014 | | | 20131 | |
Net asset value, beginning of period | | | $46.69 | | | | $50.23 | | | | $45.76 | | | | $40.05 | | | | $34.26 | |
Net investment income | | | 0.04 | | | | 0.13 | | | | 0.07 | | | | 0.08 | | | | 0.09 | |
Net realized and unrealized gains (losses) on investments | | | 0.56 | | | | (0.95 | ) | | | 6.47 | | | | 7.11 | | | | 5.81 | |
| | | | | | | | | | | | | | | | | | | | |
Total from investment operations | | | 0.60 | | | | (0.82 | ) | | | 6.54 | | | | 7.19 | | | | 5.90 | |
Distributions to shareholders from | | | | | | | | | | | | | | | | | | | | |
Net investment income | | | (0.05 | ) | | | (0.17 | ) | | | 0.00 | | | | (0.10 | ) | | | (0.11 | ) |
Net realized gains | | | (2.31 | ) | | | (2.55 | ) | | | (2.07 | ) | | | (1.38 | ) | | | 0.00 | |
| | | | | | | | | | | | | | | | | | | | |
Total distributions to shareholders | | | (2.36 | ) | | | (2.72 | ) | | | (2.07 | ) | | | (1.48 | ) | | | (0.11 | ) |
Net asset value, end of period | | | $44.93 | | | | $46.69 | | | | $50.23 | | | | $45.76 | | | | $40.05 | |
Total return2 | | | 1.39 | % | | | (1.54 | )% | | | 14.69 | % | | | 18.07 | % | | | 17.37 | % |
Ratios to average net assets (annualized) | | | | | | | | | | | | | | | | | | | | |
Gross expenses | | | 0.88 | % | | | 0.88 | % | | | 0.87 | % | | | 0.89 | % | | | 0.87 | % |
Net expenses | | | 0.80 | % | | | 0.78 | % | | | 0.75 | % | | | 0.75 | % | | | 0.75 | % |
Net investment income | | | 0.16 | % | | | 0.27 | % | | | 0.17 | % | | | 0.17 | % | | | 0.39 | % |
Supplemental data | | | | | | | | | | | | | | | | | | | | |
Portfolio turnover rate | | | 31 | % | | | 31 | % | | | 26 | % | | | 35 | % | | | 57 | % |
Net assets, end of period (000s omitted) | | | $8,852 | | | | $8,400 | | | | $7,205 | | | | $2,129 | | | | $12 | |
| 1 | For the period from November 30, 2012 (commencement of class operations) to July 31, 2013 |
| 2 | Returns for periods of less than one year are not annualized. |
The accompanying notes are an integral part of these financial statements.
| | | | |
| 18 | | Wells Fargo Large Cap Growth Fund | | Financial highlights |
(For a share outstanding throughout each period)
| | | | | | | | | | | | | | | | | | | | |
| | | Six months ended January 31, 2017 (unaudited) | | | Year ended July 31 | |
| CLASS R6 | | | 2016 | | | 2015 | | | 2014 | | | 20131 | |
Net asset value, beginning of period | | | $46.82 | | | | $50.34 | | | | $45.82 | | | | $40.11 | | | | $34.26 | |
Net investment income | | | 0.07 | | | | 0.22 | | | | 0.07 | 2 | | | 0.12 | | | | 0.15 | |
Net realized and unrealized gains (losses) on investments | | | 0.57 | | | | (0.97 | ) | | | 6.56 | | | | 7.11 | | | | 5.82 | |
| | | | | | | | | | | | | | | | | | | | |
Total from investment operations | | | 0.64 | | | | (0.75 | ) | | | 6.63 | | | | 7.23 | | | | 5.97 | |
Distributions to shareholders from | | | | | | | | | | | | | | | | | | | | |
Net investment income | | | (0.08 | ) | | | (0.22 | ) | | | (0.04 | ) | | | (0.14 | ) | | | (0.12 | ) |
Net realized gains | | | (2.31 | ) | | | (2.55 | ) | | | (2.07 | ) | | | (1.38 | ) | | | 0.00 | |
| | | | | | | | | | | | | | | | | | | | |
Total distributions to shareholders | | | (2.39 | ) | | | (2.77 | ) | | | (2.11 | ) | | | (1.52 | ) | | | (0.12 | ) |
Net asset value, end of period | | | $45.07 | | | | $46.82 | | | | $50.34 | | | | $45.82 | | | | $40.11 | |
Total return3 | | | 1.47 | % | | | (1.39 | )% | | | 14.88 | % | | | 18.25 | % | | | 17.48 | % |
Ratios to average net assets (annualized) | | | | | | | | | | | | | | | | | | | | |
Gross expenses | | | 0.73 | % | | | 0.73 | % | | | 0.72 | % | | | 0.74 | % | | | 0.75 | % |
Net expenses | | | 0.65 | % | | | 0.64 | % | | | 0.60 | % | | | 0.60 | % | | | 0.60 | % |
Net investment income | | | 0.32 | % | | | 0.39 | % | | | 0.13 | % | | | 0.29 | % | | | 0.26 | % |
Supplemental data | | | | | | | | | | | | | | | | | | | | |
Portfolio turnover rate | | | 31 | % | | | 31 | % | | | 26 | % | | | 35 | % | | | 57 | % |
Net assets, end of period (000s omitted) | | | $275,000 | | | | $225,805 | | | | $117,741 | | | | $5,942 | | | | $2,278 | |
| 1 | For the period from November 30, 2012 (commencement of class operations) to July 31, 2013 |
| 2 | Calculated based upon average shares outstanding |
| 3 | Returns for periods of less than one year are not annualized. |
The accompanying notes are an integral part of these financial statements.
| | | | | | |
| Financial highlights | | Wells Fargo Large Cap Growth Fund | | | 19 | |
(For a share outstanding throughout each period)
| | | | | | | | | | | | | | | | | | | | | | | | |
| | | Six months ended January 31, 2017 (unaudited) | | | Year ended July 31 | |
| ADMINISTRATOR CLASS | | | 2016 | | | 2015 | | | 2014 | | | 2013 | | | 2012 | |
Net asset value, beginning of period | | | $46.32 | | | | $49.84 | | | | $45.50 | | | | $39.86 | | | | $33.02 | | | | $31.67 | |
Net investment income (loss) | | | 0.01 | | | | 0.05 | | | | 0.05 | | | | (0.01 | ) | | | 0.09 | 1 | | | (0.06 | )1 |
Net realized and unrealized gains (losses) on investments | | | 0.54 | | | | (0.94 | ) | | | 6.36 | | | | 7.04 | | | | 6.83 | | | | 1.41 | |
| | | | | | | | | | | | | | | | | | | | | | | | |
Total from investment operations | | | 0.55 | | | | (0.89 | ) | | | 6.41 | | | | 7.03 | | | | 6.92 | | | | 1.35 | |
Distributions to shareholders from | | | | | | | | | | | | | | | | | | | | | | | | |
Net investment income | | | (0.01 | ) | | | (0.08 | ) | | | 0.00 | | | | (0.01 | ) | | | (0.08 | ) | | | 0.00 | |
Net realized gains | | | (2.31 | ) | | | (2.55 | ) | | | (2.07 | ) | | | (1.38 | ) | | | 0.00 | | | | 0.00 | |
| | | | | | | | | | | | | | | | | | | | | | | | |
Total distributions to shareholders | | | (2.32 | ) | | | (2.63 | ) | | | (2.07 | ) | | | (1.39 | ) | | | (0.08 | ) | | | 0.00 | |
Net asset value, end of period | | | $44.55 | | | | $46.32 | | | | $49.84 | | | | $45.50 | | | | $39.86 | | | | $33.02 | |
Total return2 | | | 1.31 | % | | | (1.71 | )% | | | 14.48 | % | | | 17.84 | % | | | 21.00 | % | | | 4.26 | % |
Ratios to average net assets (annualized) | | | | | | | | | | | | | | | | | | | | | | | | |
Gross expenses | | | 1.08 | % | | | 1.08 | % | | | 1.05 | % | | | 1.06 | % | | | 1.07 | % | | | 1.08 | % |
Net expenses | | | 0.95 | % | | | 0.95 | % | | | 0.95 | % | | | 0.95 | % | | | 0.95 | % | | | 0.95 | % |
Net investment income (loss) | | | 0.03 | % | | | 0.12 | % | | | 0.10 | % | | | (0.02 | )% | | | 0.24 | % | | | (0.17 | )% |
Supplemental data | | | | | | | | | | | | | | | | | | | | | | | | |
Portfolio turnover rate | | | 31 | % | | | 31 | % | | | 26 | % | | | 35 | % | | �� | 57 | % | | | 46 | % |
Net assets, end of period (000s omitted) | | | $203,921 | | | | $237,577 | | | | $262,535 | | | | $245,364 | | | | $208,053 | | | | $75,099 | |
| 1 | Calculated based upon average shares outstanding |
| 2 | Returns for periods of less than one year are not annualized. |
The accompanying notes are an integral part of these financial statements.
| | | | |
| 20 | | Wells Fargo Large Cap Growth Fund | | Financial highlights |
(For a share outstanding throughout each period)
| | | | | | | | | | | | | | | | | | | | | | | | |
| | | Six months ended January 31, 2017 (unaudited) | | | Year ended July 31 | |
| INSTITUTIONAL CLASS | | | 2016 | | | 2015 | | | 2014 | | | 2013 | | | 2012 | |
Net asset value, beginning of period | | | $46.74 | | | | $50.30 | | | | $45.80 | | | | $40.11 | | | | $33.16 | | | | $31.73 | |
Net investment income (loss) | | | 0.05 | 1 | | | 0.17 | 1 | | | 0.19 | 1 | | | 0.11 | | | | 0.20 | | | | (0.08 | )1 |
Net realized and unrealized gains (losses) on investments | | | 0.57 | | | | (0.96 | ) | | | 6.41 | | | | 7.09 | | | | 6.86 | | | | 1.51 | |
| | | | | | | | | | | | | | | | | | | | | | | | |
Total from investment operations | | | 0.62 | | | | (0.79 | ) | | | 6.60 | | | | 7.20 | | | | 7.06 | | | | 1.43 | |
Distributions to shareholders from | | | | | | | | | | | | | | | | | | | | | | | | |
Net investment income | | | (0.06 | ) | | | (0.22 | ) | | | (0.03 | ) | | | (0.13 | ) | | | (0.11 | ) | | | 0.00 | |
Net realized gains | | | (2.31 | ) | | | (2.55 | ) | | | (2.07 | ) | | | (1.38 | ) | | | 0.00 | | | | 0.00 | |
| | | | | | | | | | | | | | | | | | | | | | | | |
Total distributions to shareholders | | | (2.37 | ) | | | (2.77 | ) | | | (2.10 | ) | | | (1.51 | ) | | | (0.11 | ) | | | 0.00 | |
Net asset value, end of period | | | $44.99 | | | | $46.74 | | | | $50.30 | | | | $45.80 | | | | $40.11 | | | | $33.16 | |
Total return2 | | | 1.43 | % | | | (1.49 | )% | | | 14.82 | % | | | 18.16 | % | | | 21.34 | % | | | 4.47 | % |
Ratios to average net assets (annualized) | | | | | | | | | | | | | | | | | | | | | | | | |
Gross expenses | | | 0.83 | % | | | 0.83 | % | | | 0.78 | % | | | 0.79 | % | | | 0.79 | % | | | 0.80 | % |
Net expenses | | | 0.75 | % | | | 0.71 | % | | | 0.65 | % | | | 0.65 | % | | | 0.69 | % | | | 0.75 | % |
Net investment income (loss) | | | 0.22 | % | | | 0.37 | % | | | 0.40 | % | | | 0.28 | % | | | 0.53 | % | | | (0.25 | )% |
Supplemental data | | | | | | | | | | | | | | | | | | | | | | | | |
Portfolio turnover rate | | | 31 | % | | | 31 | % | | | 26 | % | | | 35 | % | | | 57 | % | | | 46 | % |
Net assets, end of period (000s omitted) | | | $230,818 | | | | $316,310 | | | | $534,975 | | | | $596,006 | | | | $508,853 | | | | $601,684 | |
| 1 | Calculated based upon average shares outstanding |
| 2 | Returns for periods of less than one year are not annualized. |
The accompanying notes are an integral part of these financial statements.
| | | | | | |
| Notes to financial statements (unaudited) | | Wells Fargo Large Cap Growth Fund | | | 21 | |
1. ORGANIZATION
Wells Fargo Funds Trust (the “Trust”), a Delaware statutory trust organized on March 10, 1999, is an open-end management investment company registered under the Investment Company Act of 1940, as amended (the “1940 Act”). As an investment company, the Trust follows the accounting and reporting guidance in Financial Accounting Standards Board (“FASB”) Accounting Standards Codification Topic 946, Financial Services – Investment Companies. These financial statements report on the Wells Fargo Large Cap Growth Fund (the “Fund”) which is a diversified series of the Trust.
Effective at the close of business on October 23, 2015, Investor Class shares became Class A shares in a tax-free conversion. Shareholders of Investor Class received Class A shares at a value equal to the value of their Investor Class shares immediately prior to the conversion. Investor Class shares are no longer offered by the Fund.
2. SIGNIFICANT ACCOUNTING POLICIES
The following significant accounting policies, which are consistently followed in the preparation of the financial statements of the Fund, are in conformity with U.S. generally accepted accounting principles which require management to make estimates and assumptions that affect the reported amounts of assets and liabilities, disclosure of contingent assets and liabilities at the date of the financial statements, and the reported amounts of revenues and expenses during the reporting period. Actual results could differ from those estimates.
Securities valuation
All investments are valued each business day as of the close of regular trading on the New York Stock Exchange (generally 4 p.m. Eastern Time), although the Fund may deviate from this calculation time under unusual or unexpected circumstances.
Equity securities that are listed on a foreign or domestic exchange or market are valued at the official closing price or, if none, the last sales price. If no sale occurs on the principal exchange or market that day, the prior day’s price will be deemed “stale” and a fair value price will be determined in accordance with the Fund’s Valuation Procedures.
Investments in registered open-end investment companies are valued at net asset value. Interests in non-registered investment vehicles that are redeemable at net asset value are fair valued normally at net asset value.
Investments which are not valued using any of the methods discussed above are valued at their fair value, as determined in good faith by the Board of Trustees of the Fund. The Board of Trustees has established a Valuation Committee comprised of the Trustees and has delegated to it the authority to take any actions regarding the valuation of portfolio securities that the Valuation Committee deems necessary or appropriate, including determining the fair value of portfolio securities, unless the determination has been delegated to the Management Valuation Team of Wells Fargo Funds Management, LLC (“Funds Management”). The Board of Trustees retains the authority to make or ratify any valuation decisions or approve any changes to the Valuation Procedures as it deems appropriate. On a quarterly basis, the Board of Trustees receives reports on any valuation actions taken by the Valuation Committee or the Management Valuation Team which may include items for ratification.
Valuations of fair valued securities are compared to the next actual sales price when available, or other appropriate market values, to assess the continued appropriateness of the fair valuation methodologies used. These securities are fair valued on a day-to-day basis, taking into consideration changes to appropriate market information and any significant changes to the inputs considered in the valuation process until there is a readily available price provided on an exchange or by an independent pricing service. Valuations received from an independent pricing service or independent broker-dealer quotes are periodically validated by comparisons to most recent trades and valuations provided by other independent pricing services in addition to the review of prices by the manager and/or subadviser. Unobservable inputs used in determining fair valuations are identified based on the type of security, taking into consideration factors utilized by market participants in valuing the investment, knowledge about the issuer and the current market environment.
Security loans
The Fund may lend its securities from time to time in order to earn additional income in the form of fees or interest on securities received as collateral or the investment of any cash received as collateral. The Fund continues to receive interest or dividends on the securities loaned. The Fund receives collateral in the form of cash or securities with a value at least equal to the value of the securities on loan. The value of the loaned securities is determined at the close of each business day and any additional required collateral is delivered to the Fund on the next business day. In a securities lending transaction, the net asset value of the Fund will be affected by an increase or decrease in the value of the securities loaned and by an increase or decrease in the value of the instrument in which collateral is invested. The amount of securities lending activity undertaken by the Fund fluctuates from time to time. In the event of default or bankruptcy by the borrower, the Fund may be prevented from recovering the loaned securities or gaining access to the collateral or
| | | | |
| 22 | | Wells Fargo Large Cap Growth Fund | | Notes to financial statements (unaudited) |
may experience delays or costs in doing so. In addition, the investment of any cash collateral received may lose all or part of its value. The Fund has the right under the lending agreement to recover the securities from the borrower on demand.
The Fund lends its securities through an unaffiliated securities lending agent. Cash collateral received in connection with its securities lending transactions is invested in Securities Lending Cash Investments, LLC (the “Securities Lending Fund”). The Securities Lending Fund is exempt from registration under Section 3(c)(7) of the 1940 Act and is managed by Funds Management and is subadvised by Wells Capital Management Incorporated (“WellsCap”), an affiliate of Funds Management and an indirect wholly owned subsidiary of Wells Fargo & Company (“Wells Fargo”). Funds Management receives an advisory fee starting at 0.05% and declining to 0.01% as the average daily net assets of the Securities Lending Fund increase. All of the fees received by Funds Management are paid to WellsCap for its services as subadviser. The Securities Lending Fund seeks to provide a positive return compared to the daily Fed Funds Open Rate by investing in high-quality, U.S. dollar-denominated short-term money market instruments. Securities Lending Fund investments are valued at the evaluated bid price provided by an independent pricing service. Income earned from investment in the Securities Lending Fund is included in securities lending income on the Statement of Operations.
Security transactions and income recognition
Securities transactions are recorded on a trade date basis. Realized gains or losses are recorded on the basis of identified cost.
Dividend income is recognized on the ex-dividend date.
Distributions to shareholders
Distributions to shareholders from net investment income and net realized gains, if any, are recorded on the ex-dividend date. Such distributions are determined in conformity with federal income tax regulations, which may differ in amount or character from net investment income and realized gains recognized for purposes of U.S. generally accepted accounting principles.
Federal and other taxes
The Fund intends to continue to qualify as a regulated investment company by distributing substantially all of its investment company taxable income and any net realized capital gains (after reduction for capital loss carryforwards) sufficient to relieve it from all, or substantially all, federal income taxes. Accordingly, no provision for federal income taxes was required.
The Fund’s income and federal excise tax returns and all financial records supporting those returns for the prior three fiscal years are subject to examination by the federal and Delaware revenue authorities. Management has analyzed the Fund’s tax positions taken on federal, state, and foreign tax returns for all open tax years and does not believe that there are any uncertain tax positions that require recognition of a tax liability.
Class allocations
The separate classes of shares offered by the Fund differ principally in applicable sales charges, distribution, shareholder servicing, and administration fees. Class specific expenses are charged directly to that share class. Investment income, common expenses, and realized and unrealized gains (losses) on investments are allocated daily to each class of shares based on the relative proportion of net assets of each class.
3. FAIR VALUATION MEASUREMENTS
Fair value measurements of investments are determined within a framework that has established a fair value hierarchy based upon the various data inputs utilized in determining the value of the Fund’s investments. The three-level hierarchy gives the highest priority to unadjusted quoted prices in active markets for identical assets or liabilities (Level 1) and the lowest priority to significant unobservable inputs (Level 3). The Fund’s investments are classified within the fair value hierarchy based on the lowest level of input that is significant to the fair value measurement. The inputs are summarized into three broad levels as follows:
| ∎ | | Level 1 – quoted prices in active markets for identical securities |
| ∎ | | Level 2 – other significant observable inputs (including quoted prices for similar securities, interest rates, prepayment speeds, credit risk, etc.) |
| ∎ | | Level 3 – significant unobservable inputs (including the Fund’s own assumptions in determining the fair value of investments) |
The inputs or methodologies used for valuing investments in securities are not necessarily an indication of the risk associated with investing in those securities.
| | | | | | |
| Notes to financial statements (unaudited) | | Wells Fargo Large Cap Growth Fund | | | 23 | |
The following is a summary of the inputs used in valuing the Fund’s assets and liabilities as of January 31, 2017:
| | | | | | | | | | | | | | | | |
| | | Quoted prices (Level 1) | | | Other significant observable inputs (Level 2) | | | Significant
unobservable inputs (Level 3) | | | Total | |
Assets | | | | | | | | | | | | | | | | |
Investments in: | | | | | | | | | | | | | | | | |
| | | | |
Common stocks | | | | | | | | | | | | | | | | |
Consumer discretionary | | $ | 256,285,865 | | | $ | 0 | | | $ | 0 | | | $ | 256,285,865 | |
Consumer staples | | | 46,330,020 | | | | 0 | | | | 0 | | | | 46,330,020 | |
Energy | | | 33,370,361 | | | | 0 | | | | 0 | | | | 33,370,361 | |
Financials | | | 26,036,240 | | | | 0 | | | | 0 | | | | 26,036,240 | |
Health care | | | 158,986,120 | | | | 0 | | | | 0 | | | | 158,986,120 | |
Industrials | | | 119,720,756 | | | | 0 | | | | 0 | | | | 119,720,756 | |
Information technology | | | 546,104,839 | | | | 0 | | | | 0 | | | | 546,104,839 | |
Materials | | | 49,553,851 | | | | 0 | | | | 0 | | | | 49,553,851 | |
| | | | |
Short-term investments | | | | | | | | | | | | | | | | |
Investment companies | | | 17,512,763 | | | | 0 | | | | 0 | | | | 17,512,763 | |
Investments measured at net asset value* | | | | | | | | | | | | | | | 424,691 | |
Total assets | | $ | 1,253,900,815 | | | $ | 0 | | | $ | 0 | | | $ | 1,254,325,506 | |
| * | Investments that are measured at fair value using the net asset value per share (or its equivalent) as a practical expedient have not been categorized in the fair value hierarchy. The fair value amount presented in the table is intended to permit reconciliation of the fair value hierarchy to the amounts presented in the Statement of Assets and Liabilities. The Fund’s investment in Securities Lending Cash Investments, LLC valued at $424,691 does not have a redemption period notice, can be redeemed daily and does not have any unfunded commitments. |
The Fund recognizes transfers between levels within the fair value hierarchy at the end of the reporting period. At January 31, 2017, the Fund did not have any transfers into/out of Level 1, Level 2, or Level 3.
4. TRANSACTIONS WITH AFFILIATES AND OTHER EXPENSES
Management fee
Funds Management, an indirect wholly owned subsidiary of Wells Fargo, is the manager of the Fund and provides advisory and fund-level administrative services under an investment management agreement. Under the investment management agreement, Funds Management is responsible for, among other services, implementing the investment objectives and strategies of the Fund, supervising the subadviser, providing fund-level administrative services in connection with the Fund’s operations, and providing any other fund-level administrative services reasonably necessary for the operation of the Fund. As compensation for its services under the investment management agreement, Funds Management is entitled to receive an annual management fee starting at 0.70% and declining to 0.505% as the average daily net assets of the Fund increase. For the six months ended January 31, 2017, the management fee was equivalent to an annual rate of 0.68% of the Fund’s average daily net assets.
Funds Management has retained the services of a subadviser to provide daily portfolio management to the Fund. The fee for subadvisory services is borne by Funds Management. WellsCap is the subadviser to the Fund and is entitled to receive a fee from Funds Management at an annual rate starting at 0.30% and declining to 0.20% as the average daily net assets of the Fund increase.
Administration fees
Under a class-level administration agreement, Funds Management provides class-level administrative services to the Fund, which includes paying fees and expenses for services provided by the transfer agent, sub-transfer agents, omnibus account servicers and record-keepers. As compensation for its services under the class-level administration agreement, Funds Management receives an annual fee which is calculated based on the average daily net assets of each class as follows:
| | | | |
| | | Class-level
administration fee | |
Class A, Class C, Class R | | | 0.21 | % |
Class R4 | | | 0.08 | |
Class R6 | | | 0.03 | |
Administrator Class, Institutional Class | | | 0.13 | |
| | | | |
| 24 | | Wells Fargo Large Cap Growth Fund | | Notes to financial statements (unaudited) |
Funds Management has contractually waived and/or reimbursed management and administration fees to the extent necessary to maintain certain net operating expense ratios for the Fund. Waiver of fees and/or reimbursement of expenses by Funds Management were made first from fund level expenses on a proportionate basis and then from class specific expenses. Funds Management has committed through November 30, 2017 to waive fees and/or reimburse expenses to the extent necessary to cap the Fund’s expenses at 1.07% for Class A shares, 1.82% for Class C shares, 1.32% for Class R shares, 0.80% for Class R4 shares, 0.65% for Class R6 shares, 0.95% for Administrator Class shares, and 0.75% for Institutional Class shares. After this time, the cap may be increased or the commitment to maintain the cap may be terminated only with the approval of the Board of Trustees.
During the six months ended January 31, 2017, State Street Bank and Trust Company, the Fund’s custodian, reimbursed the Fund $18,379 for certain out-of-pocket expenses that were billed to the Fund in error from 1998-2015. This amount is included in dividend income on the Statement of Operations. In addition, Funds Management was also reimbursed $10,238 for waivers/reimbursements it made to the Fund during the period the Fund was erroneously billed.
Distribution fees
The Trust has adopted a distribution plan for Class C and Class R shares of the Fund pursuant to Rule 12b-1 under the 1940 Act. Distribution fees are charged to Class C and Class R shares and paid to Wells Fargo Funds Distributor, LLC (“Funds Distributor”), the principal underwriter, at an annual rate of 0.75% of the average daily net assets of Class C shares and 0.25% of the average daily net assets of Class R shares.
In addition, Funds Distributor is entitled to receive the front-end sales charge from the purchase of Class A shares and a contingent deferred sales charge on the redemption of certain Class A shares. Funds Distributor is also entitled to receive the contingent deferred sales charges from redemptions of Class C shares. For the six months ended January 31, 2017, Funds Distributor received $2,602 from the sale of Class A shares and $24 in contingent deferred sales charges from redemptions of Class C shares.
Shareholder servicing fees
The Trust has entered into contracts with one or more shareholder servicing agents, whereby Class A, Class C, Class R, and Administrator Class of the Fund are charged a fee at an annual rate of 0.25% of the average daily net assets of each respective class. Class R4 is charged a fee at an annual rate of 0.10% of its average daily net assets.
A portion of these total shareholder servicing fees were paid to affiliates of Wells Fargo.
5. INVESTMENT PORTFOLIO TRANSACTIONS
Purchases and sales of investments, excluding U.S. government obligations (if any) and short-term securities, for the six months ended January 31, 2017 were $395,191,247 and $545,826,910, respectively.
The Fund may purchase or sell investment securities to other Wells Fargo funds under procedures adopted by the Board of Trustees. The procedures have been designed to ensure that these interfund transactions, which generally do not incur broker commissions, are effected at current market prices. Interfund trades are included within the respective purchases and sales amounts shown.
6. BANK BORROWINGS
The Trust (excluding the money market funds and certain other funds) and Wells Fargo Variable Trust are parties to a $250,000,000 revolving credit agreement whereby the Fund is permitted to use bank borrowings for temporary or emergency purposes, such as to fund shareholder redemption requests. Interest under the credit agreement is charged to the Fund based on a borrowing rate equal to the higher of the Federal Funds rate in effect on that day plus 1.25% or the overnight LIBOR rate in effect on that day plus 1.25%. In addition, an annual commitment fee equal to 0.25% of the unused balance is allocated to each participating fund. Prior to August 30, 2016, the revolving credit agreement amount was $200,000,000 and the annual commitment fee was equal to 0.20% of the unused balance which was allocated to each participating fund.
For the six months ended January 31, 2017, there were no borrowings by the Fund under the agreement.
7. CONCENTRATION RISK
Concentration risks result from exposure to a limited number of sectors. A fund that invests a substantial portion of their assets in any sector may be more affected by changes in that sector than would be a fund whose investments are not heavily weighted in any sector.
| | | | | | |
| Notes to financial statements (unaudited) | | Wells Fargo Large Cap Growth Fund | | | 25 | |
8. INDEMNIFICATION
Under the Trust’s organizational documents, the officers and Trustees have been granted certain indemnification rights against certain liabilities that may arise out of performance of their duties to the Trust. Additionally, in the normal course of business, the Trust may enter into contracts with service providers that contain a variety of indemnification clauses. The Trust’s maximum exposure under these arrangements is dependent on future claims that may be made against the Fund and, therefore, cannot be estimated.
9. NEW ACCOUNTING PRONOUNCEMENT
In December 2016, the Financial Accounting Standards Board (“FASB”) issued Accounting Standard Update (“ASU”) No. 2016-19, Technical Corrections and Improvements. ASU 2016-19 includes an amendment to FASB ASC Topic 820, Fair Value Measurement which clarifies the difference between a valuation approach and a valuation technique. The amendment also requires an entity to disclose when there has been a change in either or both a valuation approach and/or a valuation technique. The disclosure requirements are effective for fiscal years and interim periods within those fiscal years beginning after December 15, 2016. Management is currently evaluating the potential impact of this new guidance to the financial statements.
10. REGULATORY CHANGES
In October 2016, the Securities and Exchange Commission (“SEC”) adopted new rules and forms and amended existing rules and forms (together, “final rules”) intended to modernize and enhance the reporting and disclosure of information by registered investment companies and to enhance liquidity risk management by open-end mutual funds and exchange-traded funds. The final rules will enhance the quality of information available to investors and will allow the SEC to more effectively collect and use data reported by funds. In part, the final rules amend Regulation S-X and require standardized, enhanced disclosure about derivatives in the Fund’s financial statements, as well as other amendments. The compliance date for the amendments to Regulation S-X is August 1, 2017 while the compliance date for the new form types is June 1, 2018 and the compliance date for the liquidity risk management program requirements is December 1, 2018. Management is currently assessing the potential impact of these enhancements and their impact on the financial statement disclosures and reporting requirements.
| | | | |
| 26 | | Wells Fargo Large Cap Growth Fund | | Other information (unaudited) |
PROXY VOTING INFORMATION
A description of the policies and procedures that the Fund uses to determine how to vote proxies relating to portfolio securities is available, upon request, by calling 1-800-222-8222, visiting our website at wellsfargofunds.com, or visiting the SEC website at sec.gov. Information regarding how the Fund voted proxies relating to portfolio securities during the most recent 12-month period ended June 30 is available on the Fund’s website at wellsfargofunds.com or by visiting the SEC website at sec.gov.
PORTFOLIO HOLDINGS INFORMATION
The complete portfolio holdings for the Fund are publicly available monthly on the Fund’s website (wellsfargofunds.com), on a one-month delayed basis. In addition, top ten holdings information (excluding derivative positions) for the Fund is publicly available on the Fund’s website on a monthly, seven-day or more delayed basis. The Fund files its complete schedule of portfolio holdings with the SEC for the first and third quarters of each fiscal year on Form N-Q, which is available by visiting the SEC website at sec.gov. In addition, the Fund’s Form N-Q may be reviewed and copied at the SEC’s Public Reference Room in Washington, DC, and at regional offices in New York City, at 233 Broadway, and in Chicago, at 175 West Jackson Boulevard, Suite 900. Information about the Public Reference Room may be obtained by calling 1-800-SEC-0330.
| | | | | | |
| Other information (unaudited) | | Wells Fargo Large Cap Growth Fund | | | 27 | |
BOARD OF TRUSTEES AND OFFICERS
Each of the Trustees and Officers1 listed in the table below acts in identical capacities for each fund in the Wells Fargo family of funds, which consists of 138 mutual funds comprising the Wells Fargo Funds Trust, Wells Fargo Variable Trust, Wells Fargo Master Trust and four closed-end funds (collectively the “Fund Complex”). This table should be read in conjunction with the Prospectus and the Statement of Additional Information2. The mailing address of each Trustee and Officer is 525 Market Street, 12th Floor, San Francisco, CA 94105. Each Trustee and Officer serves an indefinite term, however, each Trustee serves such term until reaching the mandatory retirement age established by the Trustees.
Independent Trustees
| | | | | | |
Name and year of birth | | Position held and length of service* | | Principal occupations during past five years or longer | | Current other public company or investment company directorships |
William R. Ebsworth (Born 1957) | | Trustee, since 2015 | | Retired. From 1984 to 2013, equities analyst, portfolio manager, research director and chief financial officer at Fidelity Management and Research Company in Boston, Tokyo, and Hong Kong and retired in 2013 as Chief Investment Officer of Fidelity Strategic Advisers, Inc. where he lead a team of investment professionals managing client assets. Prior thereto, Board member of Hong Kong Securities Clearing Co., Hong Kong Options Clearing Corp., the Thailand International Fund, Ltd., Fidelity Investments Life Insurance Company, and Empire Fidelity Investments Life Insurance Company. Board member of the Fonté Foundation (non-profit organization) and the Vincent Memorial Hospital Endowment (non-profit organization), where he serves on the Investment Committee and as a Chair of the Audit Committee. Mr. Ebsworth is a CFA® charterholder and an Adjunct Lecturer, Finance, at Babson College. | | Asset Allocation Trust |
Jane A. Freeman (Born 1953) | | Trustee, since 2015 | | Retired. From 2012 to 2014 and 1999 to 2008, Chief Financial Officer of Scientific Learning Corporation. From 2008 to 2012, Ms. Freeman provided consulting services related to strategic business projects. Prior to 1999, Portfolio Manager at Rockefeller & Co. and Scudder, Stevens & Clark. Board member of the Harding Loevner Funds from 1996 to 2014, serving as both Lead Independent Director and chair of the Audit Committee. Board member of the Russell Exchange Traded Funds Trust from 2011 to 2012 and the chair of the Audit Committee. Ms. Freeman is Chair of Taproot Foundation (non-profit organization), a Board Member of Ruth Bancroft Garden (non-profit organization) and an inactive chartered financial analyst. | | Asset Allocation Trust |
Peter G. Gordon** (Born 1942) | | Trustee, since 1998; Chairman, since 2005 | | Co-Founder, Retired Chairman, President and CEO of Crystal Geyser Water Company. Trustee Emeritus, Colby College. | | Asset Allocation Trust |
Isaiah Harris, Jr. (Born 1952) | | Trustee, since 2009 | | Retired. Chairman of the Board of CIGNA Corporation since 2009, and Director since 2005. From 2003 to 2011, Director of Deluxe Corporation. Prior thereto, President and CEO of BellSouth Advertising and Publishing Corp. from 2005 to 2007, President and CEO of BellSouth Enterprises from 2004 to 2005 and President of BellSouth Consumer Services from 2000 to 2003. Emeritus member of the Iowa State University Foundation Board of Governors. Emeritus Member of the Advisory Board of Iowa State University School of Business. Advisory Board Member, Palm Harbor Academy (charter school). Advisory Board Member, Child Evangelism Fellowship (non-profit). Mr. Harris is a certified public accountant (inactive status). | | CIGNA Corporation; Asset Allocation Trust |
| Judith M. Johnson (Born 1949) | | Trustee, since 2008; Audit Committee Chairman, since 2008 | | Retired. Prior thereto, Chief Executive Officer and Chief Investment Officer of Minneapolis Employees Retirement Fund from 1996 to 2008. Ms. Johnson is an attorney, certified public accountant and a certified managerial accountant. | | Asset Allocation Trust |
David F. Larcker (Born 1950) | | Trustee, since 2009 | | James Irvin Miller Professor of Accounting at the Graduate School of Business, Stanford University, Director of the Corporate Governance Research Initiative and Senior Faculty of The Rock Center for Corporate Governance since 2006. From 2005 to 2008, Professor of Accounting at the Graduate School of Business, Stanford University. Prior thereto, Ernst & Young Professor of Accounting at The Wharton School, University of Pennsylvania from 1985 to 2005. | | Asset Allocation Trust |
| | | | |
| 28 | | Wells Fargo Large Cap Growth Fund | | Other information (unaudited) |
| | | | | | |
Name and year of birth | | Position held and length of service* | | Principal occupations during past five years or longer | | Current other public company or investment company directorships |
Olivia S. Mitchell (Born 1953) | | Trustee, since 2006 | | International Foundation of Employee Benefit Plans Professor, Wharton School of the University of Pennsylvania since 1993. Director of Wharton’s Pension Research Council and Boettner Center on Pensions & Retirement Research, and Research Associate at the National Bureau of Economic Research. Previously, Cornell University Professor from 1978 to 1993. | | Asset Allocation Trust |
Timothy J. Penny (Born 1951) | | Trustee, since 1996 | | President and Chief Executive Officer of Southern Minnesota Initiative Foundation, a non-profit organization, since 2007 and Senior Fellow at the Humphrey Institute Policy Forum at the University of Minnesota since 1995. Member of the Board of Trustees of NorthStar Education Finance, Inc., a non-profit organization, since 2007. | | Asset Allocation Trust |
Michael S. Scofield (Born 1943) | | Trustee, since 2010 | | Served on the Investment Company Institute’s Board of Governors and Executive Committee from 2008-2011 as well the Governing Council of the Independent Directors Council from 2006-2011 and the Independent Directors Council Executive Committee from 2008-2011. Chairman of the IDC from 2008-2010. Institutional Investor (Fund Directions) Trustee of Year in 2007. Trustee of the Evergreen Funds complex (and its predecessors) from 1984 to 2010. Chairman of the Evergreen Funds from 2000-2010. Former Trustee of the Mentor Funds. Retired Attorney, Law Offices of Michael S. Scofield. | | Asset Allocation Trust |
| * | Length of service dates reflect the Trustee’s commencement of service with the Trust’s predecessor entities, where applicable. |
| ** | Peter Gordon is expected to retire on December 31, 2017. |
Officers
| | | | | | |
Name and year of birth | | Position held and length of service | | Principal occupations during past five years or longer | | |
Andrew Owen (Born 1960) | | President, since 2017 | | Executive Vice President of Wells Fargo Bank, N.A. and President of Wells Fargo & Company and Head of Affiliated Managers, Wells Fargo Asset Management, since 2014. Executive Vice President responsible for marketing, investments and product development for Wells Fargo Funds Management, LLC, from 2009 to 2014. | | |
Jeremy DePalma1 (Born 1974) | | Treasurer, since 2012 | | Senior Vice President of Wells Fargo Funds Management, LLC since 2009. Senior Vice President of Evergreen Investment Management Company, LLC from 2008 to 2010 and head of the Fund Reporting and Control Team within Fund Administration from 2005 to 2010. | | |
C. David Messman (Born 1960) | | Secretary, since 2000; Chief Legal Officer, since 2003 | | Senior Vice President and Secretary of Wells Fargo Funds Management, LLC since 2001. Assistant General Counsel of Wells Fargo Bank, N.A. since 2013 and Vice President and Managing Counsel of Wells Fargo Bank, N.A. from 1996 to 2013. | | |
Michael Whitaker (Born 1967) | | Chief Compliance Officer, since 2016 | | Executive Vice President of Wells Fargo Funds Management, LLC since 2016. Chief Compliance Officer of Fidelity’s Fixed Income Funds and Asset Allocation Funds from 2008 to 2016, Compliance Officer of FMR Co., Inc. from 2014 to 2016, Fidelity Investments Money Management, Inc. from 2014 to 2016, Fidelity Investments from 2007 to 2016. | | |
David Berardi (Born 1975) | | Assistant Treasurer, since 2009 | | Vice President of Wells Fargo Funds Management, LLC since 2009. Vice President of Evergreen Investment Management Company, LLC from 2008 to 2010. Manager of Fund Reporting and Control for Evergreen Investment Management Company, LLC from 2004 to 2010. | | |
| 1 | Jeremy DePalma acts as Treasurer of 69 funds and Assistant Treasurer of 69 funds in the Fund Complex. |
| 2 | The Statement of Additional Information includes additional information about the Trustees and is available, without charge, upon request, by calling 1-800-222-8222 or by visiting the website at wellsfargofunds.com. |
| | | | | | |
| List of abbreviations | | Wells Fargo Large Cap Growth Fund | | | 29 | |
The following is a list of common abbreviations for terms and entities that may have appeared in this report.
| ACA | — ACA Financial Guaranty Corporation |
| ADR | — American depositary receipt |
| ADS | — American depositary shares |
| AGC | — Assured Guaranty Corporation |
| AGM | — Assured Guaranty Municipal |
| Ambac | — Ambac Financial Group Incorporated |
| AMT | — Alternative minimum tax |
| BAN | — Bond anticipation notes |
| BHAC | — Berkshire Hathaway Assurance Corporation |
| CAB | — Capital appreciation bond |
| CCAB | — Convertible capital appreciation bond |
| CDA | — Community Development Authority |
| CDO | — Collateralized debt obligation |
| DRIVER | — Derivative inverse tax-exempt receipts |
| DW&P | — Department of Water & Power |
| DWR | — Department of Water Resources |
| ECFA | — Educational & Cultural Facilities Authority |
| EDA | — Economic Development Authority |
| EDFA | — Economic Development Finance Authority |
| ETF | — Exchange-traded fund |
| FDIC | — Federal Deposit Insurance Corporation |
| FFCB | — Federal Farm Credit Banks |
| FGIC | — Financial Guaranty Insurance Corporation |
| FHA | — Federal Housing Administration |
| FHLB | — Federal Home Loan Bank |
| FHLMC | — Federal Home Loan Mortgage Corporation |
| FICO | — The Financing Corporation |
| FNMA | — Federal National Mortgage Association |
| GDR | — Global depositary receipt |
| GNMA | — Government National Mortgage Association |
| HCFR | — Healthcare facilities revenue |
| HEFA | — Health & Educational Facilities Authority |
| HEFAR | — Higher education facilities authority revenue |
| HFA | — Housing Finance Authority |
| HFFA | — Health Facilities Financing Authority |
| HUD | — Department of Housing and Urban Development |
| IDA | — Industrial Development Authority |
| IDAG | — Industrial Development Agency |
| KRW | — Republic of Korea won |
| LIBOR | — London Interbank Offered Rate |
| LIFER | — Long Inverse Floating Exempt Receipts |
| LLC | — Limited liability company |
| LLLP | — Limited liability limited partnership |
| LLP | — Limited liability partnership |
| MBIA | — Municipal Bond Insurance Association |
| MFHR | — Multifamily housing revenue |
| MSTR | — Municipal securities trust receipts |
| MUD | — Municipal Utility District |
| National | — National Public Finance Guarantee Corporation |
| PCFA | — Pollution Control Financing Authority |
| PCL | — Public Company Limited |
| PCR | — Pollution control revenue |
| PFA | — Public Finance Authority |
| PFFA | — Public Facilities Financing Authority |
| PFOTER | — Puttable floating option tax-exempt receipts |
| plc | — Public limited company |
| PUTTER | — Puttable tax-exempt receipts |
| R&D | — Research & development |
| Radian | — Radian Asset Assurance |
| RAN | — Revenue anticipation notes |
| RDA | — Redevelopment Authority |
| RDFA | — Redevelopment Finance Authority |
| REIT | — Real estate investment trust |
| ROC | — Reset option certificates |
| SAVRS | — Select auction variable rate securities |
| SBA | — Small Business Authority |
| SDR | — Swedish depositary receipt |
| SFHR | — Single-family housing revenue |
| SFMR | — Single-family mortgage revenue |
| SPA | — Standby purchase agreement |
| SPDR | — Standard & Poor’s Depositary Receipts |
| SPEAR | — Short Puttable Exempt Adjustable Receipts |
| STRIPS | — Separate trading of registered interest and |
| TAN | — Tax anticipation notes |
| TIPS | — Treasury inflation-protected securities |
| TRAN | — Tax revenue anticipation notes |
| TTFA | — Transportation Trust Fund Authority |
| TVA | — Tennessee Valley Authority |
This page is intentionally left blank.
This page is intentionally left blank.
This page is intentionally left blank.

For more information
More information about Wells Fargo Funds is available free upon request. To obtain literature, please write, email, visit the Fund’s website, or call:
Wells Fargo Funds
P.O. Box 8266
Boston, MA 02266-8266
Email: fundservice@wellsfargo.com
Website: wellsfargofunds.com
Individual investors: 1-800-222-8222
Retail investment professionals: 1-888-877-9275
Institutional investment professionals: 1-866-765-0778
This report and the financial statements contained herein are submitted for the general information of the shareholders of the Fund. If this report is used for promotional purposes, distribution of the report must be accompanied or preceded by a current prospectus. Before investing, please consider the investment objectives, risks, charges, and expenses of the investment. For a current prospectus and, if available, a summary prospectus, containing this information, call 1-800-222-8222 or visit the Fund’s website at wellsfargofunds.com. Read the prospectus carefully before you invest or send money.
Wells Fargo Asset Management (WFAM) is a trade name used by the asset management businesses of Wells Fargo & Company. Wells Fargo Funds Management, LLC, a wholly owned subsidiary of Wells Fargo & Company, provides investment advisory and administrative services for Wells Fargo Funds. Other affiliates of Wells Fargo & Company provide subadvisory and other services for the funds. The funds are distributed by Wells Fargo Funds Distributor, LLC, Member FINRA, an affiliate of Wells Fargo & Company. Neither Wells Fargo Funds Management nor Wells Fargo Funds Distributor has Fund customer accounts/assets, and neither provides investment advice/recommendations or acts as an investment advice fiduciary to any investor.
NOT FDIC INSURED ◾ NO BANK GUARANTEE ◾ MAY LOSE VALUE
© 2017 Wells Fargo Funds Management, LLC. All rights reserved.
| | |
 | | 301461 03-17 SA209/SAR209 01-17 |
Semi-Annual Report
January 31, 2017

Wells Fargo Large Company Value Fund


Reduce clutter. Save trees.
Sign up for electronic delivery of prospectuses and shareholder reports at wellsfargo.com/advantagedelivery
Contents
The views expressed and any forward-looking statements are as of January 31, 2017, unless otherwise noted, and are those of the Fund managers and/or Wells Fargo Funds Management, LLC. Discussions of individual securities, or the markets generally, or any Wells Fargo Fund are not intended as individual recommendations. Future events or results may vary significantly from those expressed in any forward-looking statements. The views expressed are subject to change at any time in response to changing circumstances in the market. Wells Fargo Funds Management, LLC and the Fund disclaim any obligation to publicly update or revise any views expressed or forward-looking statements.
NOT FDIC INSURED ◾ NO BANK GUARANTEE ◾ MAY LOSE VALUE
| | | | |
| 2 | | Wells Fargo Large Company Value Fund | | Letter to shareholders (unaudited) |

Andrew Owen
President
Wells Fargo Funds
U.S. and international stocks returned 5.96% and 4.16% for the six-month period, respectively; within fixed income, the Bloomberg Barclays U.S. Aggregate Bond Index3 returned -2.95%.
Dear Shareholder:
As the new president of Wells Fargo Funds now that Karla Rabusch is retiring from that position after nearly 14 years, I am pleased to offer you this semi-annual report for the Wells Fargo Large Company Value Fund for the six-month period that ended January 31, 2017. Despite heightened market volatility, global stocks delivered favorable results overall. U.S. and international stocks returned 5.96% and 4.16% for the six-month period, respectively, as measured by the S&P 500 Index1 and the MSCI ACWI ex USA Index (Net)2; within fixed income, the Bloomberg Barclays U.S. Aggregate Bond Index3 returned -2.95%.
In August–September 2016, global stocks delivered generally positive results; bonds’ interest rates remained historically low.
From August into early September 2016, U.S. and international stocks generally trended upward. Ever since the Great Recession, markets worldwide have been supported to varying degrees by accommodative policies from leading central banks, including the Federal Reserve (Fed), European Central Bank, Bank of England, and Bank of Japan. As a result, investors have watched closely for any signs that global central banks might tighten their measures. In the U.S., early-September comments by several Fed officials appeared to suggest a September interest-rate increase, which sent stock and bond prices downward. However, stocks surged following the Fed’s September 20 meeting on news that the Fed had decided to delay a rate increase to later in 2016. In bond markets, interest rates remained at historically low levels as a result of easy monetary policies, subdued global growth, and modest inflation expectations. Yields rose, after bottoming in July, as market participants felt that yields had overshot the real risks of the U.K.’s Brexit vote and as economic activity strengthened. At the front end of the yield curve, anticipation of new money market fund rules resulted in significantly higher yields on many short-term securities.
During the fourth quarter of 2016, prospects for faster growth and higher interest rates in the U.S. largely influenced the markets.
Early in the fourth quarter of 2016, U.S. stocks tended to trade lower amid concerns such as a likely interest-rate increase and uncertainty over the approaching general election. However, following Donald Trump’s election as president in early November, U.S. stocks began to rally. Investors appeared optimistic that the new administration would usher in a series of pro-growth policies, and supportive economic news helped the rally carry through the quarter. The buoyant environment sent interest rates higher as well. At its mid-December meeting, Fed officials raised their short-term target interest rate for the first time in a year, by a quarter percentage point, to between 0.50% and 0.75%. The fourth quarter also saw the implementation of the Securities and Exchange Commission’s new rules for money market funds, which included floating net asset values (NAVs) for institutional prime and municipal money market funds as well as liquidity fees and redemption gates. In the year leading up to
| 1 | The S&P 500 Index consists of 500 stocks chosen for market size, liquidity, and industry group representation. It is a market-value-weighted index with each stock’s weight in the index proportionate to its market value. You cannot invest directly in an index. |
| 2 | The Morgan Stanley Capital International (MSCI) All Country World Index (ACWI) ex USA Index (Net) is a free-float-adjusted market-capitalization-weighted index that is designed to measure the equity market performance of developed markets, excluding the United States and Canada. Source: MSCI. MSCI makes no express or implied warranties or representations and shall have no liability whatsoever with respect to any MSCI data contained herein. The MSCI data may not be further redistributed or used as a basis for other indexes or any securities or financial products. This report is not approved, reviewed, or produced by MSCI. You cannot invest directly in an index. |
| 3 | The Bloomberg Barclays U.S. Aggregate Bond Index (formerly known as Barclays U.S. Aggregate Bond Index) is a broad-based benchmark that measures the investment-grade, U.S. dollar–denominated, fixed-rate taxable bond market, including Treasuries, government-related and corporate securities, mortgage-backed securities (agency fixed-rate and hybrid adjustable-rate mortgage pass-throughs), asset-backed securities, and commercial mortgage-backed securities. You cannot invest directly in an index. |
| | | | | | |
| Letter to shareholders (unaudited) | | Wells Fargo Large Company Value Fund | | | 3 | |
money fund reform implementation, nearly $1 trillion in assets moved from these types of money market funds into government money market funds, which continued to transact at a stable $1 NAV. Outside of the U.S., the prospects for faster U.S. growth appeared to trigger some acceleration in Europe. The improvement may be partly attributable to expectations for further strengthening of the U.S. dollar, which in turn could improve demand for European goods in the U.S. due to weakening of the euro relative to the dollar.
Investor optimism continued into January 2017.
January brought continued strength in global stock markets. Markets were lifted by factors such as strong trade data from Japan, robust earnings reports by businesses, and investors’ hopes that the U.S. government will approve a large fiscal stimulus package.
Don’t let short-term uncertainty derail long-term investment goals.
Periods of uncertainty can present challenges, but experience has taught us that maintaining long-term investment goals can be an effective way to plan for the future. To help you create a sound strategy based on your personal goals and risk tolerance, Wells Fargo Funds offers more than 100 mutual funds spanning a wide range of asset classes and investment styles. Although diversification cannot guarantee an investment profit or prevent losses, we believe it can be an effective way to manage investment risk and potentially smooth out overall portfolio performance. We encourage investors to know their investments and to understand that appropriate levels of risk-taking may unlock opportunities.
Thank you for choosing to invest in Wells Fargo Funds. We appreciate your confidence in us and remain committed to helping you meet your financial needs.
Sincerely,

Andrew Owen
President
Wells Fargo Funds
Although diversification cannot guarantee an investment profit or prevent losses, we believe it can be an effective way to manage investment risk and potentially smooth out overall portfolio performance.
For further information about your Fund, contact your investment professional, visit our website at wellsfargofunds.com, or call us directly at 1-800-222-8222. We are available 24 hours a day, 7 days a week.
| | | | |
| 4 | | Wells Fargo Large Company Value Fund | | Performance highlights (unaudited) |
Investment objective
The Fund seeks long-term capital appreciation.
Manager
Wells Fargo Funds Management, LLC
Subadviser
Analytic Investors, LLC*
Portfolio managers*
Dennis Bein, CFA®
Ryan Brown, CFA®
Hariandra de Silva, Ph.D., CFA®
Average annual total returns (%) as of January 31, 20171
| | | | | | | | | | | | | | | | | | | | | | | | | | | | | | | | | | |
| | | | | Including sales charge | | | Excluding sales charge | | | Expense ratios2 (%) | |
| | | Inception date | | 1 year | | | 5 year | | | 10 year | | | 1 year | | | 5 year | | | 10 year | | | Gross | | | Net3 | |
| Class A (WLCAX) | | 3-31-2008 | | | 14.78 | | | | 10.15 | | | | 4.28 | | | | 21.74 | | | | 11.45 | | | | 4.90 | | | | 0.94 | | | | 0.83 | |
| Class C (WFLVX) | | 3-31-2008 | | | 19.83 | | | | 10.65 | | | | 4.14 | | | | 20.83 | | | | 10.65 | | | | 4.14 | | | | 1.69 | | | | 1.58 | |
| Administrator Class (WWIDX) | | 12-31-2001 | | | – | | | | – | | | | – | | | | 21.82 | | | | 11.71 | | | | 5.18 | | | | 0.86 | | | | 0.75 | |
| Institutional Class (WLCIX) | | 3-31-2008 | | | – | | | | – | | | | – | | | | 22.22 | | | | 11.98 | | | | 5.39 | | | | 0.61 | | | | 0.50 | |
| Russell 1000® Value Index4 | | – | | | – | | | | – | | | | – | | | | 24.62 | | | | 14.11 | | | | 5.66 | | | | – | | | | – | |
Figures quoted represent past performance, which is no guarantee of future results, and do not reflect taxes that a shareholder may pay on fund distributions or the redemption of fund shares. Investment return and principal value of an investment will fluctuate so that an investor’s shares, when redeemed, may be worth more or less than their original cost. Performance shown without sales charges would be lower if sales charges were reflected. Current performance may be lower or higher than the performance data quoted, which assumes the reinvestment of dividends and capital gains. Current month-end performance is available on the Fund’s website, wellsfargofunds.com.
Index returns do not include transaction costs associated with buying and selling securities, any mutual fund fees or expenses, or any taxes. It is not possible to invest directly in an index.
For Class A shares, the maximum front-end sales charge is 5.75%. For Class C shares, the maximum contingent deferred sales charge is 1.00%. Performance including a contingent deferred sales charge assumes the sales charge for the corresponding time period. Administrator Class and Institutional Class shares are sold without a front-end sales charge or contingent deferred sales charge.
Stock values fluctuate in response to the activities of individual companies and general market and economic conditions. Certain investment strategies tend to increase the total risk of an investment (relative to the broader market). The Fund is exposed to foreign investment risk. Consult the Fund’s prospectus for additional information on these and other risks.
Please see footnotes on page 5.
| | | | | | |
| Performance highlights (unaudited) | | Wells Fargo Large Company Value Fund | | | 5 | |
| | | | |
| Ten largest holdings (%) as of January 31, 20175 | |
Johnson & Johnson | | | 4.29 | |
JPMorgan Chase & Company | | | 3.78 | |
Bank of America Corporation | | | 3.75 | |
Cisco Systems Incorporated | | | 3.37 | |
Citigroup Incorporated | | | 3.37 | |
Merck & Company Incorporated | | | 3.17 | |
Wal-Mart Stores Incorporated | | | 2.90 | |
Verizon Communications Incorporated | | | 2.86 | |
US Bancorp | | | 2.75 | |
United Technologies Corporation | | | 2.74 | |
|
| Sector distribution as of January 31, 20176 |
|
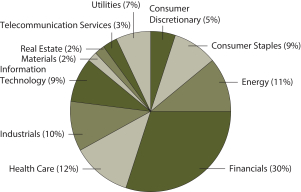
|
| * | The subadviser and portfolio managers began management of the Fund effective February 1, 2017. |
| 1 | Historical performance shown for Class A shares prior to their inception reflects the performance of the former Investor Class shares, and includes the higher expenses applicable to the former Investor Class shares (except during those periods in which the expenses of Class A shares would have been higher than those of the former Investor Class shares). If these expenses had not been included, returns would be higher. Historical performance shown for Class C shares prior to their inception reflects the performance of the former Investor Class shares, adjusted to reflect the higher expenses applicable to Class C shares. Historical performance shown for Institutional Class shares prior to their inception reflects the performance of the Administrator Class shares and includes the higher expenses applicable to the Administrator Class shares. If these expenses had not been included, returns would be higher. Historical performance shown for all classes of the Fund prior to March 21, 2008 does not reflect the Fund’s current investment objective and strategies. |
| 2 | Reflects the expense ratios as stated in the most recent prospectuses. The expense ratios shown are subject to change and may differ from the annualized expense ratios shown in the financial highlights of this report. |
| 3 | The manager has contractually committed through November 30, 2019, to waive fees and/or reimburse expenses to the extent necessary to cap the Fund’s Total Annual Fund Operating Expenses After Fee Waiver at the amounts shown. After this time, the cap may be increased or the commitment to maintain the cap may be terminated only with the approval of the Board of Trustees. Brokerage commissions, stamp duty fees, interest, taxes, acquired fund fees and expenses, and extraordinary expenses are excluded from the expense cap. Without this cap, the Fund’s returns would have been lower. |
| 4 | The Russell 1000® Value Index measures the performance of those Russell 1000 companies with lower price-to-book ratios and lower forecasted growth values. You cannot invest directly in an index. |
| 5 | The ten largest holdings, excluding cash and cash equivalents, are calculated based on the value of the investments divided by total net assets of the Fund. Holdings are subject to change and may have changed since the date specified. |
| 6 | Amounts are calculated based on the total long-term investments of the Fund. These amounts are subject to change and may have changed since the date specified. |
| | | | |
| 6 | | Wells Fargo Large Company Value Fund | | Fund expenses (unaudited) |
As a shareholder of the Fund, you incur two types of costs: (1) transaction costs, including sales charges (loads) on purchase payments and contingent deferred sales charges (if any) on redemptions and (2) ongoing costs, including management fees, distribution (12b-1) and/or shareholder servicing fees, and other Fund expenses. This example is intended to help you understand your ongoing costs (in dollars) of investing in the Fund and to compare these costs with the ongoing costs of investing in other mutual funds.
The example is based on an investment of $1,000 invested at the beginning of the six-month period and held for the entire period from August 1, 2016 to January 31, 2017.
Actual expenses
The “Actual” line of the table below provides information about actual account values and actual expenses. You may use the information in this line, together with the amount you invested, to estimate the expenses that you paid over the period. Simply divide your account value by $1,000 (for example, an $8,600 account value divided by $1,000 = 8.6), then multiply the result by the number in the “Actual” line under the heading entitled “Expenses paid during period” for your applicable class of shares to estimate the expenses you paid on your account during this period.
Hypothetical example for comparison purposes
The “Hypothetical” line of the table below provides information about hypothetical account values and hypothetical expenses based on the Fund’s actual expense ratio and an assumed rate of return of 5% per year before expenses, which is not the Fund’s actual return. The hypothetical account values and expenses may not be used to estimate the actual ending account balance or expenses you paid for the period. You may use this information to compare the ongoing costs of investing in the Fund and other funds. To do so, compare this 5% hypothetical example with the 5% hypothetical examples that appear in the shareholder reports of the other funds.
Please note that the expenses shown in the table are meant to highlight your ongoing costs only and do not reflect any transactional costs, such as sales charges (loads) and contingent deferred sales charges. Therefore, the “Hypothetical” line of the table is useful in comparing ongoing costs only and will not help you determine the relative total costs of owning different funds. In addition, if these transactional costs were included, your costs would have been higher.
| | | | | | | | | | | | | | | | |
| | | Beginning
account value
8-1-2016 | | | Ending
account value
1-31-2017 | | | Expenses
paid during
the period¹ | | | Annualized net
expense ratio | |
Class A | | | | | | | | | | | | | | | | |
Actual | | $ | 1,000.00 | | | $ | 1,081.06 | | | $ | 5.75 | | | | 1.10 | % |
Hypothetical (5% return before expenses) | | $ | 1,000.00 | | | $ | 1,019.61 | | | $ | 5.58 | | | | 1.10 | % |
Class C | | | | | | | | | | | | | | | | |
Actual | | $ | 1,000.00 | | | $ | 1,077.22 | | | $ | 9.66 | | | | 1.85 | % |
Hypothetical (5% return before expenses) | | $ | 1,000.00 | | | $ | 1,015.84 | | | $ | 9.37 | | | | 1.85 | % |
Administrator Class | | | | | | | | | | | | | | | | |
Actual | | $ | 1,000.00 | | | $ | 1,081.68 | | | $ | 5.13 | | | | 0.98 | % |
Hypothetical (5% return before expenses) | | $ | 1,000.00 | | | $ | 1,020.21 | | | $ | 4.98 | | | | 0.98 | % |
Institutional Class | | | | | | | | | | | | | | | | |
Actual | | $ | 1,000.00 | | | $ | 1,083.56 | | | $ | 3.93 | | | | 0.75 | % |
Hypothetical (5% return before expenses) | | $ | 1,000.00 | | | $ | 1,021.37 | | | $ | 3.81 | | | | 0.75 | % |
| 1 | Expenses paid is equal to the annualized net expense ratio of each class multiplied by the average account value over the period, multiplied by the number of days in the most recent fiscal half-year divided by the number of days in the fiscal year (to reflect the one-half-year period). |
| | | | | | |
| Portfolio of investments—January 31, 2017 (unaudited) | | Wells Fargo Large Company Value Fund | | | 7 | |
| | | | | | | | | | | | | | | | |
| Security name | | | | | | | | Shares | | | Value | |
| | | | |
Common Stocks: 98.79% | | | | | | | | | | | | | | | | |
| | | | |
Consumer Discretionary: 5.25% | | | | | | | | | | | | | | | | |
| | | | |
| Media: 1.37% | | | | | | | | | | | | | | | | |
Tegna Incorporated | | | | | | | | | | | 68,300 | | | $ | 1,564,753 | |
Time Warner Incorporated | | | | | | | | | | | 20,200 | | | | 1,956,370 | |
| | | | |
| | | | | | | | | | | | | | | 3,521,123 | |
| | | | | | | | | | | | | | | | |
| | | | |
| Multiline Retail: 1.47% | | | | | | | | | | | | | | | | |
Big Lots Incorporated | | | | | | | | | | | 18,680 | | | | 934,000 | |
Macy’s Incorporated | | | | | | | | | | | 1,190 | | | | 35,153 | |
Target Corporation | | | | | | | | | | | 43,240 | | | | 2,788,115 | |
| | | | |
| | | | | | | | | | | | | | | 3,757,268 | |
| | | | | | | | | | | | | | | | |
| | | | |
| Specialty Retail: 2.41% | | | | | | | | | | | | | | | | |
Best Buy Company Incorporated | | | | | | | | | | | 90,610 | | | | 4,033,957 | |
GameStop Corporation Class A | | | | | | | | | | | 20,400 | | | | 499,596 | |
Office Depot Incorporated | | | | | | | | | | | 133,060 | | | | 592,117 | |
Williams-Sonoma Incorporated | | | | | | | | | | | 21,450 | | | | 1,034,105 | |
| | | | |
| | | | | | | | | | | | | | | 6,159,775 | |
| | | | | | | | | | | | | | | | |
| | | | |
Consumer Staples: 8.74% | | | | | | | | | | | | | | | | |
| | | | |
| Beverages: 2.15% | | | | | | | | | | | | | | | | |
PepsiCo Incorporated | | | | | | | | | | | 52,990 | | | | 5,499,302 | |
| | | | | | | | | | | | | | | | |
| | | | |
| Food & Staples Retailing: 3.15% | | | | | | | | | | | | | | | | |
SpartanNash Company | | | | | | | | | | | 13,550 | | | | 513,003 | |
Wal-Mart Stores Incorporated | | | | | | | | | | | 111,140 | | | | 7,417,484 | |
Walgreens Boots Alliance Incorporated | | | | | | | | | | | 1,470 | | | | 120,452 | |
| | | | |
| | | | | | | | | | | | | | | 8,050,939 | |
| | | | | | | | | | | | | | | | |
| | | | |
| Food Products: 2.40% | | | | | | | | | | | | | | | | |
Archer Daniels Midland Company | | | | | | | | | | | 38,030 | | | | 1,683,208 | |
Bunge Limited | | | | | | | | | | | 720 | | | | 49,831 | |
ConAgra Foods Incorporated | | | | | | | | | | | 47,070 | | | | 1,839,966 | |
Darling Ingredients Incorporated † | | | | | | | | | | | 31,490 | | | | 377,880 | |
Ingredion Incorporated | | | | | | | | | | | 17,180 | | | | 2,202,304 | |
| | | | |
| | | | | | | | | | | | | | | 6,153,189 | |
| | | | | | | | | | | | | | | | |
| | | | |
| Household Products: 0.64% | | | | | | | | | | | | | | | | |
The Procter & Gamble Company | | | | | | | | | | | 18,720 | | | | 1,639,872 | |
| | | | | | | | | | | | | | | | |
| | | | |
| Tobacco: 0.40% | | | | | | | | | | | | | | | | |
Altria Group Incorporated | | | | | | | | | | | 14,520 | | | | 1,033,534 | |
| | | | | | | | | | | | | | | | |
| | | | |
Energy: 11.33% | | | | | | | | | | | | | | | | |
| | | | |
| Energy Equipment & Services: 1.35% | | | | | | | | | | | | | | | | |
Schlumberger Limited | | | | | | | | | | | 34,800 | | | | 2,913,108 | |
Unit Corporation † | | | | | | | | | | | 21,270 | | | | 553,020 | |
| | | | |
| | | | | | | | | | | | | | | 3,466,128 | |
| | | | | | | | | | | | | | | | |
The accompanying notes are an integral part of these financial statements.
| | | | |
| 8 | | Wells Fargo Large Company Value Fund | | Portfolio of investments—January 31, 2017 (unaudited) |
| | | | | | | | | | | | | | | | |
| Security name | | | | | | | | Shares | | | Value | |
| | | | |
| Oil, Gas & Consumable Fuels: 9.98% | | | | | | | | | | | | | | | | |
ConocoPhillips | | | | | | | | | | | 128,680 | | | $ | 6,274,437 | |
EOG Resources Incorporated | | | | | | | | | | | 26,790 | | | | 2,721,328 | |
Exxon Mobil Corporation | | | | | | | | | | | 35,870 | | | | 3,009,134 | |
Marathon Oil Corporation | | | | | | | | | | | 11,080 | | | | 185,590 | |
Marathon Petroleum Corporation | | | | | | | | | | | 105,760 | | | | 5,081,768 | |
Phillips 66 Company | | | | | | | | | | | 70,150 | | | | 5,725,643 | |
Valero Energy Corporation | | | | | | | | | | | 8,800 | | | | 578,688 | |
Western Refining Incorporated | | | | | | | | | | | 4,240 | | | | 148,442 | |
World Fuel Services Corporation | | | | | | | | | | | 23,500 | | | | 1,045,280 | |
WPX Energy Incorporated † | | | | | | | | | | | 54,240 | | | | 755,563 | |
| |
| | | | 25,525,873 | |
| | | | | | | | | | | | | | | | |
| | | | |
Financials: 27.35% | | | | | | | | | | | | | | | | |
| | | | |
| Banks: 13.74% | | | | | | | | | | | | | | | | |
Bank of America Corporation | | | | | | | | | | | 424,410 | | | | 9,608,642 | |
Citigroup Incorporated | | | | | | | | | | | 154,620 | | | | 8,632,435 | |
First Merchants Corporation | | | | | | | | | | | 4,840 | | | | 185,517 | |
JPMorgan Chase & Company | | | | | | | | | | | 114,290 | | | | 9,672,363 | |
US Bancorp | | | | | | | | | | | 133,890 | | | | 7,049,309 | |
| |
| | | | 35,148,266 | |
| | | | | | | | | | | | | | | | |
| | | | |
| Capital Markets: 1.80% | | | | | | | | | | | | | | | | |
Bank of New York Mellon Corporation | | | | | | | | | | | 97,060 | | | | 4,341,494 | |
BGC Partners Incorporated | | | | | | | | | | | 21,290 | | | | 235,680 | |
Franklin Resources Incorporated | | | | | | | | | | | 880 | | | | 34,971 | |
| |
| | | | 4,612,145 | |
| | | | | | | | | | | | | | | | |
| | | | |
| Consumer Finance: 4.55% | | | | | | | | | | | | | | | | |
Discover Financial Services | | | | | | | | | | | 40,000 | | | | 2,771,200 | |
Navient Corporation | | | | | | | | | | | 154,130 | | | | 2,318,115 | |
Santander Consumer USA Holdings Incorporated † | | | | | | | | | | | 59,910 | | | | 792,010 | |
Synchrony Financial | | | | | | | | | | | 161,070 | | | | 5,769,527 | |
| |
| | | | 11,650,852 | |
| | | | | | | | | | | | | | | | |
| | | | |
| Diversified Financial Services: 1.38% | | | | | | | | | | | | | | | | |
Berkshire Hathaway Incorporated Class B † | | | | | | | | | | | 21,510 | | | | 3,530,651 | |
| | | | | | | | | | | | | | | | |
| | | | |
| Insurance: 3.66% | | | | | | | | | | | | | | | | |
Assured Guaranty Limited | | | | | | | | | | | 51,480 | | | | 2,003,087 | |
Old Republic International Corporation | | | | | | | | | | | 155,870 | | | | 3,242,096 | |
The Allstate Corporation | | | | | | | | | | | 41,470 | | | | 3,118,959 | |
The Hartford Financial Services Group Incorporated | | | | | | | | | | | 20,580 | | | | 1,002,452 | |
| |
| | | | 9,366,594 | |
| | | | | | | | | | | | | | | | |
| | | | |
| Thrifts & Mortgage Finance: 2.22% | | | | | | | | | | | | | | | | |
MGIC Investment Corporation † | | | | | | | | | | | 239,540 | | | | 2,551,101 | |
Radian Group Incorporated | | | | | | | | | | | 169,720 | | | | 3,122,848 | |
| |
| | | | 5,673,949 | |
| | | | | | | | | | | | | | | | |
The accompanying notes are an integral part of these financial statements.
| | | | | | |
| Portfolio of investments—January 31, 2017 (unaudited) | | Wells Fargo Large Company Value Fund | | | 9 | |
| | | | | | | | | | | | | | | | |
| Security name | | | | | | | | Shares | | | Value | |
| | | | |
Health Care: 11.51% | | | | | | | | | | | | | | | | |
| | | | |
| Biotechnology: 2.46% | | | | | | | | | | | | | | | | |
Amgen Incorporated | | | | | | | | | | | 19,430 | | | $ | 3,044,292 | |
Biogen Incorporated | | | | | | | | | | | 190 | | | | 52,676 | |
Gilead Sciences Incorporated | | | | | | | | | | | 44,200 | | | | 3,202,290 | |
| |
| | | | 6,299,258 | |
| | | | | | | | | | | | | | | | |
| | | | |
| Pharmaceuticals: 9.05% | | | | | | | | | | | | | | | | |
Johnson & Johnson | | | | | | | | | | | 96,870 | | | | 10,970,528 | |
Merck & Company Incorporated | | | | | | | | | | | 131,010 | | | | 8,121,310 | |
Pfizer Incorporated | | | | | | | | | | | 128,400 | | | | 4,074,132 | |
| | | | |
| | | | | | | | | | | | | | | 23,165,970 | |
| | | | | | | | | | | | | | | | |
| | | | |
Industrials: 9.91% | | | | | | | | | | | | | | | | |
| | | | |
| Aerospace & Defense: 4.08% | | | | | | | | | | | | | | | | |
Arconic Incorporated | | | | | | | | | | | 8,380 | | | | 190,980 | |
Spirit AeroSystems Holdings Incorporated Class A | | | | | | | | | | | 53,450 | | | | 3,209,673 | |
Textron Incorporated | | | | | | | | | | | 880 | | | | 41,686 | |
United Technologies Corporation | | | | | | | | | | | 63,820 | | | | 6,999,139 | |
| | | | |
| | | | | | | | | | | | | | | 10,441,478 | |
| | | | | | | | | | | | | | | | |
| | | | |
| Air Freight & Logistics: 0.12% | | | | | | | | | | | | | | | | |
FedEx Corporation | | | | | | | | | | | 1,610 | | | | 304,467 | |
| | | | | | | | | | | | | | | | |
| | | | |
| Commercial Services & Supplies: 1.17% | | | | | | | | | | | | | | | | |
Deluxe Corporation | | | | | | | | | | | 14,380 | | | | 1,047,583 | |
HNI Corporation | | | | | | | | | | | 16,730 | | | | 843,359 | |
Steelcase Incorporated Class A | | | | | | | | | | | 66,070 | | | | 1,109,976 | |
| | | | |
| | | | | | | | | | | | | | | 3,000,918 | |
| | | | | | | | | | | | | | | | |
| | | | |
| Electrical Equipment: 1.02% | | | | | | | | | | | | | | | | |
Eaton Corporation plc | | | | | | | | | | | 18,160 | | | | 1,285,365 | |
EnerSys | | | | | | | | | | | 17,150 | | | | 1,336,843 | |
| | | | |
| | | | | | | | | | | | | | | 2,622,208 | |
| | | | | | | | | | | | | | | | |
| | | | |
| Industrial Conglomerates: 2.01% | | | | | | | | | | | | | | | | |
3M Company | | | | | | | | | | | 4,630 | | | | 809,417 | |
Carlisle Companies Incorporated | | | | | | | | | | | 1,970 | | | | 214,947 | |
Honeywell International Incorporated | | | | | | | | | | | 34,700 | | | | 4,105,704 | |
| | | | |
| | | | | | | | | | | | | | | 5,130,068 | |
| | | | | | | | | | | | | | | | |
| | | | |
| Professional Services: 1.00% | | | | | | | | | | | | | | | | |
Manpower Incorporated | | | | | | | | | | | 26,830 | | | | 2,561,192 | |
| | | | | | | | | | | | | | | | |
| | | | |
| Trading Companies & Distributors: 0.51% | | | | | | | | | | | | | | | | |
HD Supply Holdings Incorporated † | | | | | | | | | | | 30,630 | | | | 1,295,649 | |
| | | | | | | | | | | | | | | | |
| | | | |
Information Technology: 9.26% | | | | | | | | | | | | | | | | |
| | | | |
| Communications Equipment: 3.38% | | | | | | | | | | | | | | | | |
Cisco Systems Incorporated | | | | | | | | | | | 281,130 | | | | 8,636,314 | |
| | | | | | | | | | | | | | | | |
The accompanying notes are an integral part of these financial statements.
| | | | |
| 10 | | Wells Fargo Large Company Value Fund | | Portfolio of investments—January 31, 2017 (unaudited) |
| | | | | | | | | | | | | | | | |
| Security name | | | | | | | | Shares | | | Value | |
| | | | |
| Electronic Equipment, Instruments & Components: 0.24% | | | | | | | | | | | | | | | | |
Avnet Incorporated | | | | | | | | | | | 13,100 | | | $ | 608,364 | |
| | | | | | | | | | | | | | | | |
| | | | |
| IT Services: 0.16% | | | | | | | | | | | | | | | | |
Booz Allen Hamilton Holding Corporation | | | | | | | | | | | 12,330 | | | | 417,001 | |
| | | | | | | | | | | | | | | | |
| | | | |
| Semiconductors & Semiconductor Equipment: 2.61% | | | | | | | | | | | | | | | | |
Intel Corporation | | | | | | | | | | | 181,170 | | | | 6,670,679 | |
| | | | | | | | | | | | | | | | |
| | | | |
| Software: 2.87% | | | | | | | | | | | | | | | | |
CA Incorporated | | | | | | | | | | | 34,130 | | | | 1,067,245 | |
Oracle Corporation | | | | | | | | | | | 156,720 | | | | 6,286,039 | |
| | | | |
| | | | | | | | | | | | | | | 7,353,284 | |
| | | | | | | | | | | | | | | | |
| | | | |
Materials: 2.45% | | | | | | | | | | | | | | | | |
| | | | |
| Chemicals: 0.36% | | | | | | | | | | | | | | | | |
PolyOne Corporation | | | | | | | | | | | 25,730 | | | | 877,650 | |
Stepan Company | | | | | | | | | | | 570 | | | | 44,523 | |
| | | | |
| | | | | | | | | | | | | | | 922,173 | |
| | | | | | | | | | | | | | | | |
| | | | |
| Containers & Packaging: 0.79% | | | | | | | | | | | | | | | | |
Graphic Packaging Holding Company | | | | | | | | | | | 161,450 | | | | 2,019,740 | |
| | | | | | | | | | | | | | | | |
| | | | |
| Metals & Mining: 1.30% | | | | | | | | | | | | | | | | |
Compass Minerals International Incorporated | | | | | | | | | | | 14,160 | | | | 1,183,776 | |
Southern Copper Corporation | | | | | | | | | | | 38,820 | | | | 1,489,135 | |
Tahoe Resources Incorporated | | | | | | | | | | | 71,600 | | | | 654,424 | |
| | | | |
| | | | | | | | | | | | | | | 3,327,335 | |
| | | | | | | | | | | | | | | | |
| | | | |
Real Estate: 2.35% | | | | | | | | | | | | | | | | |
| | | | |
| Real Estate Management & Development: 2.35% | | | | | | | | | | | | | | | | |
CBRE Group Incorporated Class A † | | | | | | | | | | | 90,940 | | | | 2,760,938 | |
Jones Lang LaSalle Incorporated | | | | | | | | | | | 10,640 | | | | 1,096,239 | |
Realogy Holdings Corporation | | | | | | | | | | | 83,230 | | | | 2,156,489 | |
| | | | |
| | | | | | | | | | | | | | | 6,013,666 | |
| | | | | | | | | | | | | | | | |
| | | | |
Telecommunication Services: 3.34% | | | | | | | | | | | | | | | | |
| | | | |
| Diversified Telecommunication Services: 2.86% | | | | | | | | | | | | | | | | |
Verizon Communications Incorporated | | | | | | | | | | | 149,510 | | | | 7,327,485 | |
| | | | | | | | | | | | | | | | |
| | | | |
| Wireless Telecommunication Services: 0.48% | | | | | | | | | | | | | | | | |
Telephone & Data Systems Incorporated | | | | | | | | | | | 39,770 | | | | 1,218,951 | |
| | | | | | | | | | | | | | | | |
| | | | |
Utilities: 7.30% | | | | | | | | | | | | | | | | |
| | | | |
| Electric Utilities: 4.06% | | | | | | | | | | | | | | | | |
American Electric Power Company Incorporated | | | | | | | | | | | 60,440 | | | | 3,871,786 | |
Avangrid Incorporated | | | | | | | | | | | 45,400 | | | | 1,761,520 | |
Hawaiian Electric Industries Incorporated | | | | | | | | | | | 20,630 | | | | 690,692 | |
PG&E Corporation | | | | | | | | | | | 9,980 | | | | 617,662 | |
The accompanying notes are an integral part of these financial statements.
| | | | | | |
| Portfolio of investments—January 31, 2017 (unaudited) | | Wells Fargo Large Company Value Fund | | | 11 | |
| | | | | | | | | | | | | | | | |
| Security name | | | | | | | | Shares | | | Value | |
| | | | |
| Electric Utilities (continued) | | | | | | | | | | | | | | | | |
Pinnacle West Capital Corporation | | | | | | | | | | | 21,060 | | | $ | 1,634,888 | |
PPL Corporation | | | | | | | | | | | 50,310 | | | | 1,752,800 | |
Xcel Energy Incorporated | | | | | | | | | | | 1,300 | | | | 53,716 | |
| | | | |
| | | | | | | | | | | | | | | 10,383,064 | |
| | | | | | | | | | | | | | | | |
| | | | |
| Gas Utilities: 0.29% | | | | | | | | | | | | | | | | |
UGI Corporation | | | | | | | | | | | 15,970 | | | | 740,529 | |
| | | | | | | | | | | | | | | | |
| | | | |
| Multi-Utilities: 2.95% | | | | | | | | | | | | | | | | |
CMS Energy Corporation | | | | | | | | | | | 77,960 | | | | 3,321,096 | |
DTE Energy Company | | | | | | | | | | | 9,560 | | | | 942,998 | |
MDU Resources Group Incorporated | | | | | | | | | | | 48,200 | | | | 1,414,670 | |
Public Service Enterprise Group Incorporated | | | | | | | | | | | 42,160 | | | | 1,865,580 | |
| | | | |
| | | | | | | | | | | | | | | 7,544,344 | |
| | | | | | | | | | | | | | | | |
| | | | |
Total Common Stocks (Cost $234,670,479) | | | | | | | | | | | | | | | 252,793,597 | |
| | | | | | | | | | | | | | | | |
| | | | |
| | | Yield | | | | | | | | | | |
| Short-Term Investments: 1.51% | | | | | | | | | | | | | | | | |
| | | | |
| Investment Companies: 1.51% | | | | | | | | | | | | | | | | |
Wells Fargo Government Money Market Fund Select Class (l)(u) | | | 0.46 | % | | | | | | | 3,874,036 | | | | 3,874,036 | |
| | | | | | | | | | | | | | | | |
| | | | |
Total Short-Term Investments (Cost $3,874,036) | | | | | | | | | | | | | | | 3,874,036 | |
| | | | | | | | | | | | | | | | |
| | | | | | | | |
| Total investments in securities (Cost $238,544,515) * | | | 100.30 | % | | | 256,667,633 | |
Other assets and liabilities, net | | | (0.30 | ) | | | (766,900 | ) |
| | | | | | | | |
| Total net assets | | | 100.00 | % | | $ | 255,900,733 | |
| | | | | | | | |
| † | Non-income-earning security |
| (l) | The issuer of the security is an affiliated person of the Fund as defined in the Investment Company Act of 1940. |
| (u) | The rate represents the 7-day annualized yield at period end. |
| * | Cost for federal income tax purposes is $241,560,029 and unrealized gains (losses) consists of: |
| | | | |
Gross unrealized gains | | $ | 19,764,141 | |
Gross unrealized losses | | | (4,656,537 | ) |
| | | | |
Net unrealized gains | | $ | 15,107,604 | |
The accompanying notes are an integral part of these financial statements.
| | | | |
| 12 | | Wells Fargo Large Company Value Fund | | Statement of assets and liabilities—January 31, 2017 (unaudited) |
| | | | |
| | | | |
| |
Assets | | | | |
Investments | | | | |
In unaffiliated securities, at value (cost $234,670,479) | | $ | 252,793,597 | |
In affiliated securities, at value (cost $3,874,036) | | | 3,874,036 | |
| | | | |
Total investments, at value (cost $238,544,515) | | | 256,667,633 | |
Receivable for investments sold | | | 47,588,530 | |
Receivable for Fund shares sold | | | 8,760 | |
Receivable for dividends | | | 259,569 | |
Receivable for securities lending income | | | 2,267 | |
Prepaid expenses and other assets | | | 36,837 | |
| | | | |
Total assets | | | 304,563,596 | |
| | | | |
| |
Liabilities | | | | |
Payable for investments purchased | | | 45,150,202 | |
Payable for Fund shares redeemed | | | 422,163 | |
Due to custodian bank | | | 2,827,093 | |
Management fee payable | | | 122,572 | |
Distribution fee payable | | | 2,332 | |
Administration fees payable | | | 43,711 | |
Accrued expenses and other liabilities | | | 94,790 | |
| | | | |
Total liabilities | | | 48,662,863 | |
| | | | |
Total net assets | | $ | 255,900,733 | |
| | | | |
| |
NET ASSETS CONSIST OF | | | | |
Paid-in capital | | $ | 196,719,026 | |
Undistributed net investment income | | | 47,213 | |
Accumulated net realized gains on investments | | | 41,011,376 | |
Net unrealized gains on investments | | | 18,123,118 | |
| | | | |
Total net assets | | $ | 255,900,733 | |
| | | | |
| |
COMPUTATION OF NET ASSET VALUE AND OFFERING PRICE PER SHARE | | | | |
Net assets – Class A | | $ | 220,913,646 | |
Shares outstanding – Class A1 | | | 14,076,947 | |
Net asset value per share – Class A | | | $15.69 | |
Maximum offering price per share – Class A2 | | | $16.65 | |
Net assets – Class C | | $ | 3,562,011 | |
Shares outstanding – Class C1 | | | 222,245 | |
Net asset value per share – Class C | | | $16.03 | |
Net assets – Administrator Class | | $ | 20,470,212 | |
Shares outstanding – Administrator Class1 | | | 1,295,401 | |
Net asset value per share – Administrator Class | | | $15.80 | |
Net assets – Institutional Class | | $ | 10,954,864 | |
Shares outstanding – Institutional Class1 | | | 693,986 | |
Net asset value per share – Institutional Class | | | $15.79 | |
| 1 | The Fund has an unlimited number of authorized shares. |
| 2 | Maximum offering price is computed as 100/94.25 of net asset value. On investments of $50,000 or more, the offering price is reduced. |
The accompanying notes are an integral part of these financial statements.
| | | | | | |
| Statement of operations—six months ended January 31, 2017 (unaudited) | | Wells Fargo Large Company Value Fund | | | 13 | |
| | | | |
| | | | |
| |
Investment income | | | | |
Dividends | | $ | 2,584,617 | |
Securities lending income, net | | | 23,513 | |
Income from affiliated securities | | | 8,449 | |
| | | | |
Total investment income | | | 2,616,579 | |
| | | | |
| |
Expenses | | | | |
Management fee | | | 892,767 | |
Administration fees | | | | |
Class A | | | 229,664 | |
Class C | | | 3,748 | |
Administrator Class | | | 14,651 | |
Institutional Class | | | 6,655 | |
Shareholder servicing fees | | | | |
Class A | | | 273,410 | |
Class C | | | 4,462 | |
Administrator Class | | | 27,966 | |
Distribution fee | | | | |
Class C | | | 13,387 | |
Custody and accounting fees | | | 6,359 | |
Professional fees | | | 20,376 | |
Registration fees | | | 36,714 | |
Shareholder report expenses | | | 20,880 | |
Trustees’ fees and expenses | | | 7,952 | |
Other fees and expenses | | | 4,858 | |
| | | | |
Total expenses | | | 1,563,849 | |
Less: Fee waivers and/or expense reimbursements | | | (179,004 | ) |
| | | | |
Net expenses | | | 1,384,845 | |
| | | | |
Net investment income | | | 1,231,734 | |
| | | | |
| |
REALIZED AND UNREALIZED GAINS (LOSSES) ON INVESTMENTS | | | | |
| |
Net realized gains (losses) on: | | | | |
Unaffiliated securities | | | 48,408,790 | |
Affiliated securities | | | 388 | |
| | | | |
Net realized gains on investments | | | 48,409,178 | |
| | | | |
Net change in unrealized gains (losses) on investments | | | (29,864,149 | ) |
| | | | |
Net realized and unrealized gains (losses) on investments | | | 18,545,029 | |
| | | | |
Net increase in net assets resulting from operations | | $ | 19,776,763 | |
| | | | |
The accompanying notes are an integral part of these financial statements.
| | | | |
| 14 | | Wells Fargo Large Company Value Fund | | Statement of changes in net assets |
| | | | | | | | | | | | | | | | |
| | | Six months ended
January 31, 2017
(unaudited) | | | Year ended
July 31, 2016 | |
| | | |
Operations | | | | | | | | | | | | |
Net investment income | | | | | | $ | 1,231,734 | | | | | | | $ | 3,028,994 | |
Net realized gains (losses) on investments | | | | | | | 48,409,178 | | | | | | | | (969,698 | ) |
Net change in unrealized gains (losses) on investments | | | | | | | (29,864,149 | ) | | | | | | | (5,958,734 | ) |
| | | | |
Net increase (decrease) in net assets resulting from operations | | | | | | | 19,776,763 | | | | | | | | (3,899,438 | ) |
| | | | |
| | | |
Distributions to shareholders from | | | | | | | | | | | | |
Net investment income | | | | | | | | | | | | | | | | |
Class A | | | | | | | (993,160 | ) | | | | | | | (2,264,793 | ) |
Class C | | | | | | | (4,536 | ) | | | | | | | (13,093 | ) |
Administrator Class | | | | | | | (110,553 | ) | | | | | | | (337,098 | ) |
Institutional Class | | | | | | | (64,417 | ) | | | | | | | (111,852 | ) |
Investor Class | | | | | | | N/A | | | | | | | | (248,226 | )1 |
Net realized gains | | | | | | | | | | | | | | | | |
Class A | | | | | | | 0 | | | | | | | | (16,632,476 | ) |
Class C | | | | | | | 0 | | | | | | | | (275,850 | ) |
Administrator Class | | | | | | | 0 | | | | | | | | (1,889,643 | ) |
Institutional Class | | | | | | | 0 | | | | | | | | (642,971 | ) |
| | | | |
Total distributions to shareholders | | | | | | | (1,172,666 | ) | | | | | | | (22,416,002 | ) |
| | | | |
| | | | |
Capital share transactions | | | Shares | | | | | | | | Shares | | | | | |
Proceeds from shares sold | | | | | | | | | | | | | | | | |
Class A | | | 101,904 | | | | 1,522,334 | | | | 8,907,108 | | | | 138,160,256 | |
Class C | | | 4,001 | | | | 61,463 | | | | 31,550 | | | | 457,515 | |
Administrator Class | | | 11,729 | | | | 174,615 | | | | 71,607 | | | | 1,041,380 | |
Institutional Class | | | 143,074 | | | | 2,169,104 | | | | 547,916 | | | | 8,310,962 | |
Investor Class | | | N/A | | | | N/A | | | | 32,361 | 1 | | | 501,302 | 1 |
| | | | |
| | | | | | | 3,927,516 | | | | | | | | 148,471,415 | |
| | | | |
Reinvestment of distributions | | | | | | | | | | | | | | | | |
Class A | | | 64,054 | | | | 961,837 | | | | 1,321,571 | | | | 18,357,171 | |
Class C | | | 267 | | | | 4,004 | | | | 18,165 | | | | 257,417 | |
Administrator Class | | | 6,459 | | | | 97,409 | | | | 143,421 | | | | 2,009,265 | |
Institutional Class | | | 4,071 | | | | 61,827 | | | | 50,313 | | | | 702,990 | |
Investor Class | | | N/A | | | | N/A | | | | 15,819 | 1 | | | 239,184 | 1 |
| | | | |
| | | | | | | 1,125,077 | | | | | | | | 21,566,027 | |
| | | | |
Payment for shares redeemed | | | | | | | | | | | | | | | | |
Class A | | | (1,106,509 | ) | | | (16,490,143 | ) | | | (1,699,975 | ) | | | (24,158,609 | ) |
Class C | | | (28,690 | ) | | | (433,475 | ) | | | (76,521 | ) | | | (1,132,943 | ) |
Administrator Class | | | (369,342 | ) | | | (5,535,812 | ) | | | (431,324 | ) | | | (6,314,039 | ) |
Institutional Class | | | (90,558 | ) | | | (1,400,529 | ) | | | (52,523 | ) | | | (756,449 | ) |
Investor Class | | | N/A | | | | N/A | | | | (8,624,994 | )1 | | | (137,936,039 | )1 |
| | | | |
| | | | | | | (23,859,959 | ) | | | | | | | (170,298,079 | ) |
| | | | |
Net decrease in net assets resulting from capital share transactions | | | | | | | (18,807,366 | ) | | | | | | | (260,637 | ) |
| | | | |
Total decrease in net assets | | | | | | | (203,269 | ) | | | | | | | (26,576,077 | ) |
| | | | |
| | |
Net assets | | | | | | | | |
Beginning of period | | | | | | | 256,104,002 | | | | | | | | 282,680,079 | |
| | | | |
End of period | | | | | | $ | 255,900,733 | | | | | | | $ | 256,104,002 | |
| | | | |
Undistributed (overdistributed) net investment income | | | | | | $ | 47,213 | | | | | | | $ | (11,855 | ) |
| | | | |
| 1 | For the period from August 1, 2015 to October 23, 2015. Effective at the close of business on October 23, 2015, Investor Class shares were converted to Class A shares and are no longer offered by the Fund. |
The accompanying notes are an integral part of these financial statements.
| | | | | | |
| Financial highlights | | Wells Fargo Large Company Value Fund | | | 15 | |
(For a share outstanding throughout each period)
| | | | | | | | | | | | | | | | | | | | | | | | |
| | | Six months ended January 31, 2017 (unaudited) | | | Year ended July 31 | |
| CLASS A | | | 2016 | | | 2015 | | | 2014 | | | 2013 | | | 2012 | |
Net asset value, beginning of period | | | $14.58 | | | | $16.10 | | | | $16.82 | | | | $16.39 | | | | $12.96 | | | | $12.61 | |
Net investment income | | | 0.07 | | | | 0.17 | | | | 0.13 | 1 | | | 0.10 | | | | 0.14 | | | | 0.17 | |
Net realized and unrealized gains (losses) on investments | | | 1.11 | | | | (0.41 | ) | | | 0.78 | | | | 2.04 | | | | 3.48 | | | | 0.35 | |
| | | | | | | | | | | | | | | | | | | | | | | | |
Total from investment operations | | | 1.18 | | | | (0.24 | ) | | | 0.91 | | | | 2.14 | | | | 3.62 | | | | 0.52 | |
Distributions to shareholders from | | | | | | | | | | | | | | | | | | | | | | | | |
Net investment income | | | (0.07 | ) | | | (0.16 | ) | | | (0.13 | ) | | | (0.09 | ) | | | (0.19 | ) | | | (0.17 | ) |
Net realized gains | | | 0.00 | | | | (1.12 | ) | | | (1.50 | ) | | | (1.62 | ) | | | 0.00 | | | | 0.00 | |
| | | | | | | | | | | | | | | | | | | | | | | | |
Total distributions to shareholders | | | (0.07 | ) | | | (1.28 | ) | | | (1.63 | ) | | | (1.71 | ) | | | (0.19 | ) | | | (0.17 | ) |
Net asset value, end of period | | | $15.69 | | | | $14.58 | | | | $16.10 | | | | $16.82 | | | | $16.39 | | | | $12.96 | |
Total return2 | | | 8.11 | % | | | (0.98 | )% | | | 5.72 | % | | | 13.68 | % | | | 28.16 | % | | | 4.21 | % |
Ratios to average net assets (annualized) | | | | | | | | | | | | | | | | | | | | | | | | |
Gross expenses | | | 1.24 | % | | | 1.24 | % | | | 1.27 | % | | | 1.28 | % | | | 1.28 | % | | | 1.27 | % |
Net expenses | | | 1.10 | % | | | 1.10 | % | | | 1.10 | % | | | 1.10 | % | | | 1.10 | % | | | 1.10 | % |
Net investment income | | | 0.95 | % | | | 1.19 | % | | | 0.76 | % | | | 0.61 | % | | | 1.00 | % | | | 1.29 | % |
Supplemental data | | | | | | | | | | | | | | | | | | | | | | | | |
Portfolio turnover rate | | | 105 | % | | | 50 | % | | | 71 | % | | | 59 | % | | | 78 | % | | | 37 | % |
Net assets, end of period (000s omitted) | | | $220,914 | | | | $218,922 | | | | $104,453 | | | | $116,398 | | | | $115,895 | | | | $103,195 | |
| 1 | Calculated based upon average shares outstanding |
| 2 | Total return calculations do not include any sales charges. Returns for periods of less than one year are not annualized. |
The accompanying notes are an integral part of these financial statements.
| | | | |
| 16 | | Wells Fargo Large Company Value Fund | | Financial highlights |
(For a share outstanding throughout each period)
| | | | | | | | | | | | | | | | | | | | | | | | |
| | | Six months ended January 31, 2017 (unaudited) | | | Year ended July 31 | |
| CLASS C | | | 2016 | | | 2015 | | | 2014 | | | 2013 | | | 2012 | |
Net asset value, beginning of period | | | $14.90 | | | | $16.41 | | | | $17.12 | | | | $16.70 | | | | $13.21 | | | | $12.81 | |
Net investment income (loss) | | | 0.01 | | | | 0.06 | | | | 0.00 | 1 | | | (0.02 | ) | | | 0.04 | | | | 0.09 | |
Net realized and unrealized gains (losses) on investments | | | 1.14 | | | | (0.40 | ) | | | 0.80 | | | | 2.07 | | | | 3.54 | | | | 0.36 | |
| | | | | | | | | | | | | | | | | | | | | | | | |
Total from investment operations | | | 1.15 | | | | (0.34 | ) | | | 0.80 | | | | 2.05 | | | | 3.58 | | | | 0.45 | |
Distributions to shareholders from | | | | | | | | | | | | | | | | | | | | | | | | |
Net investment income | | | (0.02 | ) | | | (0.05 | ) | | | (0.01 | ) | | | (0.01 | ) | | | (0.09 | ) | | | (0.05 | ) |
Net realized gains | | | 0.00 | | | | (1.12 | ) | | | (1.50 | ) | | | (1.62 | ) | | | 0.00 | | | | 0.00 | |
| | | | | | | | | | | | | | | | | | | | | | | | |
Total distributions to shareholders | | | (0.02 | ) | | | (1.17 | ) | | | (1.51 | ) | | | (1.63 | ) | | | (0.09 | ) | | | (0.05 | ) |
Net asset value, end of period | | | $16.03 | | | | $14.90 | | | | $16.41 | | | | $17.12 | | | | $16.70 | | | | $13.21 | |
Total return2 | | | 7.72 | % | | | (1.68 | )% | | | 4.92 | % | | | 12.83 | % | | | 27.17 | % | | | 3.49 | % |
Ratios to average net assets (annualized) | | | | | | | | | | | | | | | | | | | | | | | | |
Gross expenses | | | 1.99 | % | | | 1.99 | % | | | 2.02 | % | | | 2.03 | % | | | 2.03 | % | | | 2.02 | % |
Net expenses | | | 1.85 | % | | | 1.84 | % | | | 1.85 | % | | | 1.85 | % | | | 1.85 | % | | | 1.85 | % |
Net investment income (loss) | | | 0.21 | % | | | 0.44 | % | | | 0.01 | % | | | (0.14 | )% | | | 0.25 | % | | | 0.54 | % |
Supplemental data | | | | | | | | | | | | | | | | | | | | | | | | |
Portfolio turnover rate | | | 105 | % | | | 50 | % | | | 71 | % | | | 59 | % | | | 78 | % | | | 37 | % |
Net assets, end of period (000s omitted) | | | $3,562 | | | | $3,674 | | | | $4,488 | | | | $4,659 | | | | $4,543 | | | | $4,022 | |
| 1 | Amount is less than $0.005. |
| 2 | Total return calculations do not include any sales charges. Returns for periods of less than one year are not annualized. |
The accompanying notes are an integral part of these financial statements.
| | | | | | |
| Financial highlights | | Wells Fargo Large Company Value Fund | | | 17 | |
(For a share outstanding throughout each period)
| | | | | | | | | | | | | | | | | | | | | | | | |
| | | Six months ended January 31, 2017 (unaudited) | | | Year ended July 31 | |
| ADMINISTRATOR CLASS | | | 2016 | | | 2015 | | | 2014 | | | 2013 | | | 2012 | |
Net asset value, beginning of period | | | $14.68 | | | | $16.20 | | | | $16.93 | | | | $16.47 | | | | $13.02 | | | | $12.68 | |
Net investment income | | | 0.08 | 1 | | | 0.20 | | | | 0.17 | | | | 0.15 | | | | 0.21 | | | | 0.19 | 1 |
Net realized and unrealized gains (losses) on investments | | | 1.12 | | | | (0.41 | ) | | | 0.78 | | | | 2.05 | | | | 3.46 | | | | 0.36 | |
| | | | | | | | | | | | | | | | | | | | | | | | |
Total from investment operations | | | 1.20 | | | | (0.21 | ) | | | 0.95 | | | | 2.20 | | | | 3.67 | | | | 0.55 | |
Distributions to shareholders from | | | | | | | | | | | | | | | | | | | | | | | | |
Net investment income | | | (0.08 | ) | | | (0.19 | ) | | | (0.18 | ) | | | (0.12 | ) | | | (0.22 | ) | | | (0.21 | ) |
Net realized gains | | | 0.00 | | | | (1.12 | ) | | | (1.50 | ) | | | (1.62 | ) | | | 0.00 | | | | 0.00 | |
| | | | | | | | | | | | | | | | | | | | | | | | |
Total distributions to shareholders | | | (0.08 | ) | | | (1.31 | ) | | | (1.68 | ) | | | (1.74 | ) | | | (0.22 | ) | | | (0.21 | ) |
Net asset value, end of period | | | $15.80 | | | | $14.68 | | | | $16.20 | | | | $16.93 | | | | $16.47 | | | | $13.02 | |
Total return2 | | | 8.17 | % | | | (0.79 | )% | | | 5.95 | % | | | 13.94 | % | | | 28.52 | % | | | 4.47 | % |
Ratios to average net assets (annualized) | | | | | | | | | | | | | | | | | | | | | | | | |
Gross expenses | | | 1.15 | % | | | 1.16 | % | | | 1.12 | % | | | 1.12 | % | | | 1.10 | % | | | 1.11 | % |
Net expenses | | | 0.98 | % | | | 0.93 | % | | | 0.85 | % | | | 0.85 | % | | | 0.85 | % | | | 0.85 | % |
Net investment income | | | 1.09 | % | | | 1.35 | % | | | 1.01 | % | | | 0.86 | % | | | 1.28 | % | | | 1.54 | % |
Supplemental data | | | | | | | | | | | | | | | | | | | | | | | | |
Portfolio turnover rate | | | 105 | % | | | 50 | % | | | 71 | % | | | 59 | % | | | 78 | % | | | 37 | % |
Net assets, end of period (000s omitted) | | | $20,470 | | | | $24,164 | | | | $30,177 | | | | $36,002 | | | | $38,798 | | | | $176,623 | |
| 1 | Calculated based upon average shares outstanding |
| 2 | Returns for periods of less than one year are not annualized. |
The accompanying notes are an integral part of these financial statements.
| | | | |
| 18 | | Wells Fargo Large Company Value Fund | | Financial highlights |
(For a share outstanding throughout each period)
| | | | | | | | | | | | | | | | | | | | | | | | |
| | | Six months ended January 31, 2017 (unaudited) | | | Year ended July 31 | |
| INSTITUTIONAL CLASS | | | 2016 | | | 2015 | | | 2014 | | | 2013 | | | 2012 | |
Net asset value, beginning of period | | | $14.66 | | | | $16.17 | | | | $16.91 | | | | $16.44 | | | | $13.00 | | | | $12.68 | |
Net investment income | | | 0.09 | | | | 0.21 | 1 | | | 0.20 | 1 | | | 0.18 | 1 | | | 0.26 | 1 | | | 0.22 | |
Net realized and unrealized gains (losses) on investments | | | 1.13 | | | | (0.38 | ) | | | 0.78 | | | | 2.05 | | | | 3.45 | | | | 0.35 | |
| | | | | | | | | | | | | | | | | | | | | | | | |
Total from investment operations | | | 1.22 | | | | (0.17 | ) | | | 0.98 | | | | 2.23 | | | | 3.71 | | | | 0.57 | |
Distributions to shareholders from | | | | | | | | | | | | | | | | | | | | | | | | |
Net investment income | | | (0.09 | ) | | | (0.22 | ) | | | (0.22 | ) | | | (0.14 | ) | | | (0.27 | ) | | | (0.25 | ) |
Net realized gains | | | 0.00 | | | | (1.12 | ) | | | (1.50 | ) | | | (1.62 | ) | | | 0.00 | | | | 0.00 | |
| | | | | | | | | | | | | | | | | | | | | | | | |
Total distributions to shareholders2 | | | (0.09 | ) | | | (1.34 | ) | | | (1.72 | ) | | | (1.76 | ) | | | (0.27 | ) | | | (0.25 | ) |
Net asset value, end of period | | | $15.79 | | | | $14.66 | | | | $16.17 | | | | $16.91 | | | | $16.44 | | | | $13.00 | |
Total return | | | 8.36 | % | | | (0.54 | )% | | | 6.14 | % | | | 14.16 | % | | | 28.93 | % | | | 4.67 | % |
Ratios to average net assets (annualized) | | | | | | | | | | | | | | | | | | | | | | | | |
Gross expenses | | | 0.91 | % | | | 0.91 | % | | | 0.85 | % | | | 0.85 | % | | | 0.84 | % | | | 0.85 | % |
Net expenses | | | 0.75 | % | | | 0.74 | % | | | 0.65 | % | | | 0.65 | % | | | 0.65 | % | | | 0.66 | % |
Net investment income | | | 1.26 | % | | | 1.50 | % | | | 1.23 | % | | | 1.10 | % | | | 1.83 | % | | | 1.80 | % |
Supplemental data | | | | | | | | | | | | | | | | | | | | | | | | |
Portfolio turnover rate | | | 105 | % | | | 50 | % | | | 71 | % | | | 59 | % | | | 78 | % | | | 37 | % |
Net assets, end of period (000s omitted) | | | $10,955 | | | | $9,343 | | | | $1,483 | | | | $863 | | | | $3,299 | | | | $15,924 | |
| 1 | Calculated based upon average shares outstanding |
| 2 | Returns for periods of less than one year are not annualized. |
The accompanying notes are an integral part of these financial statements.
| | | | | | |
| Notes to financial statements (unaudited) | | Wells Fargo Large Company Value Fund | | | 19 | |
1. ORGANIZATION
Wells Fargo Funds Trust (the “Trust”), a Delaware statutory trust organized on March 10, 1999, is an open-end management investment company registered under the Investment Company Act of 1940, as amended (the “1940 Act”). As an investment company, the Trust follows the accounting and reporting guidance in Financial Accounting Standards Board (“FASB”) Accounting Standards Codification Topic 946, Financial Services – Investment Companies. These financial statements report on the Wells Fargo Large Company Value Fund (the “Fund”) which is a diversified series of the Trust.
Effective at the close of business on October 23, 2015, Investor Class shares became Class A shares in a tax-free conversion. Shareholders of Investor Class received Class A shares at a value equal to the value of their Investor Class shares immediately prior to the conversion. Investor Class shares are no longer offered by the Fund.
2. SIGNIFICANT ACCOUNTING POLICIES
All investments are valued each business day as of the close of regular trading on the New York Stock Exchange (generally 4 p.m. Eastern Time), although the Fund may deviate from this calculation time under unusual or unexpected circumstances.
The following significant accounting policies, which are consistently followed in the preparation of the financial statements of the Fund, are in conformity with U.S. generally accepted accounting principles which require management to make estimates and assumptions that affect the reported amounts of assets and liabilities, disclosure of contingent assets and liabilities at the date of the financial statements, and the reported amounts of revenues and expenses during the reporting period. Actual results could differ from those estimates.
Securities valuation
Equity securities that are listed on a foreign or domestic exchange or market are valued at the official closing price or, if none, the last sales price. If no sale occurs on the principal exchange or market that day, the prior day’s price will be deemed “stale” and a fair value price will be determined in accordance with the Fund’s Valuation Procedures.
Investments in registered open-end investment companies are valued at net asset value. Interests in non-registered investment vehicles that are redeemable at net asset value are fair valued normally at net asset value.
Investments which are not valued using any of the methods discussed above are valued at their fair value, as determined in good faith by the Board of Trustees of the Fund. The Board of Trustees has established a Valuation Committee comprised of the Trustees and has delegated to it the authority to take any actions regarding the valuation of portfolio securities that the Valuation Committee deems necessary or appropriate, including determining the fair value of portfolio securities, unless the determination has been delegated to the Management Valuation Team of Wells Fargo Funds Management, LLC (“Funds Management”). The Board of Trustees retains the authority to make or ratify any valuation decisions or approve any changes to the Valuation Procedures as it deems appropriate. On a quarterly basis, the Board of Trustees receives reports on any valuation actions taken by the Valuation Committee or the Management Valuation Team which may include items for ratification.
Valuations of fair valued securities are compared to the next actual sales price when available, or other appropriate market values, to assess the continued appropriateness of the fair valuation methodologies used. These securities are fair valued on a day-to-day basis, taking into consideration changes to appropriate market information and any significant changes to the inputs considered in the valuation process until there is a readily available price provided on an exchange or by an independent pricing service. Valuations received from an independent pricing service or independent broker-dealer quotes are periodically validated by comparisons to most recent trades and valuations provided by other independent pricing services in addition to the review of prices by the manager and/or subadviser. Unobservable inputs used in determining fair valuations are identified based on the type of security, taking into consideration factors utilized by market participants in valuing the investment, knowledge about the issuer and the current market environment.
Security loans
The Fund may lend its securities from time to time in order to earn additional income in the form of fees or interest on securities received as collateral or the investment of any cash received as collateral. The Fund continues to receive interest or dividends on the securities loaned. The Fund receives collateral in the form of cash or securities with a value at least equal to the value of the securities on loan. The value of the loaned securities is determined at the close of each business day and any additional required collateral is delivered to the Fund on the next business day. In a securities lending transaction, the net asset value of the Fund will be affected by an increase or decrease in the value of the securities loaned and by an increase or decrease in the value of the instrument in which collateral is invested. The amount of securities lending activity undertaken by the Fund fluctuates from time to time. In the event of default or bankruptcy by the borrower, the Fund may be prevented from recovering the loaned securities or gaining access to the collateral or may experience delays or costs in doing so. In addition, the investment of any cash collateral received may lose all or part of its value. The Fund has the right under the lending agreement to recover the securities from the borrower on demand.
| | | | |
| 20 | | Wells Fargo Large Company Value Fund | | Notes to financial statements (unaudited) |
The Fund lends its securities through an unaffiliated securities lending agent. Cash collateral received in connection with its securities lending transactions is invested in Securities Lending Cash Investments, LLC (the “Securities Lending Fund”). The Securities Lending Fund is exempt from registration under Section 3(c)(7) of the 1940 Act and is managed by Funds Management and is subadvised by Wells Capital Management Incorporated (“WellsCap”), an affiliate of Funds Management and an indirect wholly owned subsidiary of Wells Fargo & Company (“Wells Fargo”). Funds Management receives an advisory fee starting at 0.05% and declining to 0.01% as the average daily net assets of the Securities Lending Fund increase. All of the fees received by Funds Management are paid to WellsCap for its services as subadviser. The Securities Lending Fund seeks to provide a positive return compared to the daily Fed Funds Open Rate by investing in high-quality, U.S. dollar-denominated short-term money market instruments. Securities Lending Fund investments are valued at the evaluated bid price provided by an independent pricing service. Income earned from investment in the Securities Lending Fund is included in securities lending income on the Statement of Operations.
Security transactions and income recognition
Securities transactions are recorded on a trade date basis. Realized gains or losses are recorded on the basis of identified cost.
Dividend income is recognized on the ex-dividend date.
Distributions to shareholders
Distributions to shareholders from net investment income and net realized gains, if any, are recorded on the ex-dividend date. Such distributions are determined in conformity with federal income tax regulations, which may differ in amount or character from net investment income and realized gains recognized for purposes of U.S. generally accepted accounting principles.
Federal and other taxes
The Fund intends to continue to qualify as a regulated investment company by distributing substantially all of its investment company taxable income and any net realized capital gains (after reduction for capital loss carryforwards) sufficient to relieve it from all, or substantially all, federal income taxes. Accordingly, no provision for federal income taxes was required.
The Fund’s income and federal excise tax returns and all financial records supporting those returns for the prior three fiscal years are subject to examination by the federal and Delaware revenue authorities. Management has analyzed the Fund’s tax positions taken on federal, state, and foreign tax returns for all open tax years and does not believe that there are any uncertain tax positions that require recognition of a tax liability.
As of July 31, 2016, the Fund had current year deferred post-October capital losses and a qualified late-year ordinary loss which were both recognized on the first day of the current fiscal year in the following amounts:
| | | | |
Deferred post-October capital losses | | Late-year ordinary losses deferred |
| Short-term | | Long-term | |
| $(2,154,994) | | $(1,283,211) | | $(361) |
Class allocations
The separate classes of shares offered by the Fund differ principally in applicable sales charges, distribution, shareholder servicing, and administration fees. Class specific expenses are charged directly to that share class. Investment income, common expenses, and realized and unrealized gains (losses) on investments are allocated daily to each class of shares based on the relative proportion of net assets of each class.
3. FAIR VALUATION MEASUREMENTS
Fair value measurements of investments are determined within a framework that has established a fair value hierarchy based upon the various data inputs utilized in determining the value of the Fund’s investments. The three-level hierarchy gives the highest priority to unadjusted quoted prices in active markets for identical assets or liabilities (Level 1) and the lowest priority to significant unobservable inputs (Level 3). The Fund’s investments are classified within the fair value hierarchy based on the lowest level of input that is significant to the fair value measurement. The inputs are summarized into three broad levels as follows:
| ∎ | | Level 1 – quoted prices in active markets for identical securities |
| ∎ | | Level 2 – other significant observable inputs (including quoted prices for similar securities, interest rates, prepayment speeds, credit risk, etc.) |
| ∎ | | Level 3 – significant unobservable inputs (including the Fund’s own assumptions in determining the fair value of investments) |
| | | | | | |
| Notes to financial statements (unaudited) | | Wells Fargo Large Company Value Fund | | | 21 | |
The inputs or methodologies used for valuing investments in securities are not necessarily an indication of the risk associated with investing in those securities.
The following is a summary of the inputs used in valuing the Fund’s assets and liabilities as of January 31, 2017:
| | | | | | | | | | | | | | | | |
| | | Quoted prices
(Level 1) | | | Other significant
observable inputs
(Level 2) | | | Significant
unobservable inputs (Level 3) | | | Total | |
Assets | | | | | | | | | | | | | | | | |
Investments in: | | | | | | | | | | | | | | | | |
| | | | |
Common stocks | | | | | | | | | | | | | | | | |
Consumer discretionary | | $ | 13,438,166 | | | $ | 0 | | | $ | 0 | | | $ | 13,438,166 | |
Consumer staples | | | 22,376,836 | | | | 0 | | | | 0 | | | | 22,376,836 | |
Energy | | | 28,992,001 | | | | 0 | | | | 0 | | | | 28,992,001 | |
Financials | | | 69,982,457 | | | | 0 | | | | 0 | | | | 69,982,457 | |
Health care | | | 29,465,228 | | | | 0 | | | | 0 | | | | 29,465,228 | |
Industrials | | | 25,355,980 | | | | 0 | | | | 0 | | | | 25,355,980 | |
Information technology | | | 23,685,642 | | | | 0 | | | | 0 | | | | 23,685,642 | |
Materials | | | 6,269,248 | | | | 0 | | | | 0 | | | | 6,269,248 | |
Real estate | | | 6,013,666 | | | | 0 | | | | 0 | | | | 6,013,666 | |
Telecommunication services | | | 8,546,436 | | | | 0 | | | | 0 | | | | 8,546,436 | |
Utilities | | | 18,667,937 | | | | 0 | | | | 0 | | | | 18,667,937 | |
| | | | |
Short-term investments | | | | | | | | | | | | | | | | |
Investment companies | | | 3,874,036 | | | | 0 | | | | 0 | | | | 3,874,036 | |
Total assets | | $ | 256,667,633 | | | $ | 0 | | | $ | 0 | | | $ | 256,667,633 | |
The Fund recognizes transfers between levels within the fair value hierarchy at the end of the reporting period. At January 31, 2017, the Fund did not have any transfers into/out of Level 1, Level 2, or Level 3.
4. TRANSACTIONS WITH AFFILIATES AND OTHER EXPENSES
Management fee
Funds Management, an indirect wholly owned subsidiary of Wells Fargo, is the manager of the Fund and provides advisory and fund-level administrative services under an investment management agreement. Under the investment management agreement, Funds Management is responsible for, among other services, implementing the investment objectives and strategies of the Fund, supervising the subadviser, providing fund-level administrative services in connection with the Fund’s operations, and providing any other fund-level administrative services reasonably necessary for the operation of the Fund. As compensation for its services under the investment management agreement, Funds Management is entitled to receive an annual management fee starting at 0.70% and declining to 0.505% as the average daily net assets of the Fund increase. For the six months ended January 31, 2017, the management fee was equivalent to an annual rate of 0.70% of the Fund’s average daily net assets.
Funds Management has retained the services of a subadviser to provide daily portfolio management to the Fund. The fee for subadvisory services is borne by Funds Management. Phocas Financial Corporation, which is not an affiliate of Funds Management, is the subadviser to the Fund and is entitled to receive a fee from Funds Management at an annual rate starting at 0.29% and declining to 0.20% as the average daily net assets of the Fund increase.
Administration fees
Under a class-level administration agreement, Funds Management provides class-level administrative services to the Fund, which includes paying fees and expenses for services provided by the transfer agent, sub-transfer agents, omnibus account servicers and record-keepers. As compensation for its services under the class-level administration agreement, Funds Management receives an annual fee which is calculated based on the average daily net assets of each class as follows:
| | | | |
| | | Class-level
administration fee | |
Class A, Class C | | | 0.21 | % |
Administrator Class, Institutional Class | | | 0.13 | |
| | | | |
| 22 | | Wells Fargo Large Company Value Fund | | Notes to financial statements (unaudited) |
Funds Management has contractually waived and/or reimbursed management and administration fees to the extent necessary to maintain certain net operating expense ratios for the Fund. Waiver of fees and/or reimbursement of expenses by Funds Management were made first from fund level expenses on a proportionate basis and then from class specific expenses. Funds Management has committed through November 30, 2017 to waive fees and/or reimburse expenses to the extent necessary to cap the Fund’s expenses at 1.10% for Class A shares 1.85% for Class C shares, 0.98% for Administrator Class shares and 0.75% for Institutional Class shares. After this time, the cap may be increased or the commitment to maintain the cap may be terminated only with the approval of the Board of Trustees.
During the six months ended January 31, 2017, State Street Bank and Trust Company, the Fund’s custodian, reimbursed the Fund $5,985 for certain out-of-pocket expenses that were billed to the Fund in error from 1998-2015. This amount is included in dividend income on the Statement of Operations. In addition, Funds Management was also reimbursed $26,900 for waivers/reimbursements it made to the Fund during the period the Fund was erroneously billed.
Distribution fee
The Trust has adopted a distribution plan for Class C shares of the Fund pursuant to Rule 12b-1 under the 1940 Act. A distribution fee is charged to Class C shares and paid to Wells Fargo Funds Distributor, LLC (“Funds Distributor”), the principal underwriter, at an annual rate of 0.75% of the average daily net assets of Class C shares.
In addition, Funds Distributor is entitled to receive the front-end sales charge from the purchase of Class A shares and a contingent deferred sales charge on the redemption of certain Class A shares. Funds Distributor is also entitled to receive the contingent deferred sales charges from redemptions of Class C shares. For the six months ended January 31, 2017, Funds Distributor received $1,164 from the sale of Class A shares.
Shareholder servicing fees
The Trust has entered into contracts with one or more shareholder servicing agents, whereby Class A, Class C and Administrator Class of the Fund are charged a fee at an annual rate of 0.25% of the average daily net assets of each respective class.
A portion of these total shareholder servicing fees were paid to affiliates of Wells Fargo.
5. INVESTMENT PORTFOLIO TRANSACTIONS
Purchases and sales of investments, excluding U.S. government obligations (if any) and short-term securities, for the six months ended January 31, 2017 were $264,671,071 and $279,400,289, respectively.
The Fund may purchase or sell investment securities to other Wells Fargo funds under procedures adopted by the Board of Trustees. The procedures have been designed to ensure that these interfund transactions, which generally do not incur broker commissions, are effected at current market prices. Interfund trades are included within the respective purchases and sales amounts shown.
6. BANK BORROWINGS
The Trust (excluding the money market funds and certain other funds) and Wells Fargo Variable Trust are parties to a $250,000,000 revolving credit agreement whereby the Fund is permitted to use bank borrowings for temporary or emergency purposes, such as to fund shareholder redemption requests. Interest under the credit agreement is charged to the Fund based on a borrowing rate equal to the higher of the Federal Funds rate in effect on that day plus 1.25% or the overnight LIBOR rate in effect on that day plus 1.25%. In addition, an annual commitment fee equal to 0.25% of the unused balance is allocated to each participating fund. Prior to August 30, 2016, the revolving credit agreement amount was $200,000,000 and the annual commitment fee was equal to 0.20% of the unused balance which was allocated to each participating fund.
For the six months ended January 31, 2017, there were no borrowings by the Fund under the agreement.
7. CONCENTRATION RISK
Concentration risks result from exposure to a limited number of sectors. A fund that invests a substantial portion of its assets in any sector may be more affected by changes in that sector than would be a fund whose investments are not heavily weighted in any sector.
| | | | | | |
| Notes to financial statements (unaudited) | | Wells Fargo Large Company Value Fund | | | 23 | |
8. INDEMNIFICATION
Under the Trust’s organizational documents, the officers and Trustees have been granted certain indemnification rights against certain liabilities that may arise out of performance of their duties to the Trust. Additionally, in the normal course of business, the Trust may enter into contracts with service providers that contain a variety of indemnification clauses. The Trust’s maximum exposure under these arrangements is dependent on future claims that may be made against the Fund and, therefore, cannot be estimated.
9. NEW ACCOUNTING PRONOUNCEMENT
In December 2016, the Financial Accounting Standards Board (“FASB”) issued Accounting Standard Update (“ASU”) No. 2016-19, Technical Corrections and Improvements. ASU 2016-19 includes an amendment to FASB ASC Topic 820, Fair Value Measurement which clarifies the difference between a valuation approach and a valuation technique. The amendment also requires an entity to disclose when there has been a change in either or both a valuation approach and/or a valuation technique. The disclosure requirements are effective for fiscal years and interim periods within those fiscal years beginning after December 15, 2016. Management is currently evaluating the potential impact of this new guidance to the financial statements.
10. REGULATORY CHANGES
In October 2016, the Securities and Exchange Commission (“SEC”) adopted new rules and forms and amended existing rules and forms (together, “final rules”) intended to modernize and enhance the reporting and disclosure of information by registered investment companies and to enhance liquidity risk management by open-end mutual funds and exchange-traded funds. The final rules will enhance the quality of information available to investors and will allow the SEC to more effectively collect and use data reported by funds. In part, the final rules amend Regulation S-X and require standardized, enhanced disclosure about derivatives in the Fund’s financial statements, as well as other amendments. The compliance date for the amendments to Regulation S-X is August 1, 2017 while the compliance date for the new form types is June 1, 2018 and the compliance date for the liquidity risk management program requirements is December 1, 2018. Management is currently assessing the potential impact of these enhancements and their impact on the financial statement disclosures and reporting requirements.
11. SUBSEQUENT DISTRIBUTIONS
On March 23, 2017, the Fund declared distributions from net investment income to shareholders of record on March 22, 2017. The per share amounts payable on March 24, 2017 were as follows:
| | |
| | | Net investment income |
Class A | | $0.03885 |
Class C | | 0.01393 |
Administrator Class | | 0.04193 |
Institutional Class | | 0.04977 |
These distributions are not reflected in the accompanying financial statements. The final determination of the source of all distributions is subject to change and made after the Fund’s tax year-end.
| | | | |
| 24 | | Wells Fargo Large Company Value Fund | | Other information (unaudited) |
PROXY VOTING INFORMATION
A description of the policies and procedures that the Fund uses to determine how to vote proxies relating to portfolio securities is available, upon request, by calling 1-800-222-8222, visiting our website at wellsfargofunds.com, or visiting the SEC website at sec.gov. Information regarding how the Fund voted proxies relating to portfolio securities during the most recent 12-month period ended June 30 is available on the Fund’s website at wellsfargofunds.com or by visiting the SEC website at sec.gov.
PORTFOLIO HOLDINGS INFORMATION
The complete portfolio holdings for the Fund are publicly available monthly on the Fund’s website (wellsfargofunds.com), on a one-month delayed basis. In addition, top ten holdings information (excluding derivative positions) for the Fund is publicly available on the Fund’s website on a monthly, seven-day or more delayed basis. The Fund files its complete schedule of portfolio holdings with the SEC for the first and third quarters of each fiscal year on Form N-Q, which is available by visiting the SEC website at sec.gov. In addition, the Fund’s Form N-Q may be reviewed and copied at the SEC’s Public Reference Room in Washington, DC, and at regional offices in New York City, at 233 Broadway, and in Chicago, at 175 West Jackson Boulevard, Suite 900. Information about the Public Reference Room may be obtained by calling 1-800-SEC-0330.
| | | | | | |
| Other information (unaudited) | | Wells Fargo Large Company Value Fund | | | 25 | |
BOARD OF TRUSTEES AND OFFICERS
Each of the Trustees and Officers1 listed in the table below acts in identical capacities for each fund in the Wells Fargo family of funds, which consists of 138 mutual funds comprising the Wells Fargo Funds Trust, Wells Fargo Variable Trust, Wells Fargo Master Trust and four closed-end funds (collectively the “Fund Complex”). This table should be read in conjunction with the Prospectus and the Statement of Additional Information2. The mailing address of each Trustee and Officer is 525 Market Street, 12th Floor, San Francisco, CA 94105. Each Trustee and Officer serves an indefinite term, however, each Trustee serves such term until reaching the mandatory retirement age established by the Trustees.
Independent Trustees
| | | | | | |
Name and year of birth | | Position held and length of service* | | Principal occupations during past five years or longer | | Current other public company or
investment company directorships |
William R. Ebsworth (Born 1957) | | Trustee, since 2015 | | Retired. From 1984 to 2013, equities analyst, portfolio manager, research director and chief financial officer at Fidelity Management and Research Company in Boston, Tokyo, and Hong Kong and retired in 2013 as Chief Investment Officer of Fidelity Strategic Advisers, Inc. where he lead a team of investment professionals managing client assets. Prior thereto, Board member of Hong Kong Securities Clearing Co., Hong Kong Options Clearing Corp., the Thailand International Fund, Ltd., Fidelity Investments Life Insurance Company, and Empire Fidelity Investments Life Insurance Company. Board member of the Fonté Foundation (non-profit organization) and the Vincent Memorial Hospital Endowment (non-profit organization), where he serves on the Investment Committee and as a Chair of the Audit Committee. Mr. Ebsworth is a CFA® charterholder and an Adjunct Lecturer, Finance, at Babson College. | | Asset Allocation Trust |
Jane A. Freeman (Born 1953) | | Trustee, since 2015 | | Retired. From 2012 to 2014 and 1999 to 2008, Chief Financial Officer of Scientific Learning Corporation. From 2008 to 2012, Ms. Freeman provided consulting services related to strategic business projects. Prior to 1999, Portfolio Manager at Rockefeller & Co. and Scudder, Stevens & Clark. Board member of the Harding Loevner Funds from 1996 to 2014, serving as both Lead Independent Director and chair of the Audit Committee. Board member of the Russell Exchange Traded Funds Trust from 2011 to 2012 and the chair of the Audit Committee. Ms. Freeman is Chair of Taproot Foundation (non-profit organization), a Board Member of Ruth Bancroft Garden (non-profit organization) and an inactive chartered financial analyst. | | Asset Allocation Trust |
Peter G. Gordon** (Born 1942) | | Trustee, since 1998; Chairman, since 2005 | | Co-Founder, Retired Chairman, President and CEO of Crystal Geyser Water Company. Trustee Emeritus, Colby College. | | Asset Allocation Trust |
Isaiah Harris, Jr. (Born 1952) | | Trustee, since 2009 | | Retired. Chairman of the Board of CIGNA Corporation since 2009, and Director since 2005. From 2003 to 2011, Director of Deluxe Corporation. Prior thereto, President and CEO of BellSouth Advertising and Publishing Corp. from 2005 to 2007, President and CEO of BellSouth Enterprises from 2004 to 2005 and President of BellSouth Consumer Services from 2000 to 2003. Emeritus member of the Iowa State University Foundation Board of Governors. Emeritus Member of the Advisory Board of Iowa State University School of Business. Advisory Board Member, Palm Harbor Academy (charter school). Advisory Board Member, Child Evangelism Fellowship (non-profit). Mr. Harris is a certified public accountant (inactive status). | | CIGNA Corporation; Asset Allocation Trust |
Judith M. Johnson (Born 1949) | | Trustee, since 2008; Audit Committee Chairman, since 2008 | | Retired. Prior thereto, Chief Executive Officer and Chief Investment Officer of Minneapolis Employees Retirement Fund from 1996 to 2008. Ms. Johnson is an attorney, certified public accountant and a certified managerial accountant. | | Asset Allocation Trust |
David F. Larcker (Born 1950) | | Trustee, since 2009 | | James Irvin Miller Professor of Accounting at the Graduate School of Business, Stanford University, Director of the Corporate Governance Research Initiative and Senior Faculty of The Rock Center for Corporate Governance since 2006. From 2005 to 2008, Professor of Accounting at the Graduate School of Business, Stanford University. Prior thereto, Ernst & Young Professor of Accounting at The Wharton School, University of Pennsylvania from 1985 to 2005. | | Asset Allocation Trust |
| | | | |
| 26 | | Wells Fargo Large Company Value Fund | | Other information (unaudited) |
| | | | | | |
Name and year of birth | | Position held and length of service* | | Principal occupations during past five years or longer | | Current other public company or
investment company directorships |
Olivia S. Mitchell (Born 1953) | | Trustee, since 2006 | | International Foundation of Employee Benefit Plans Professor, Wharton School of the University of Pennsylvania since 1993. Director of Wharton’s Pension Research Council and Boettner Center on Pensions & Retirement Research, and Research Associate at the National Bureau of Economic Research. Previously, Cornell University Professor from 1978 to 1993. | | Asset Allocation Trust |
Timothy J. Penny (Born 1951) | | Trustee, since 1996 | | President and Chief Executive Officer of Southern Minnesota Initiative Foundation, a non-profit organization, since 2007 and Senior Fellow at the Humphrey Institute Policy Forum at the University of Minnesota since 1995. Member of the Board of Trustees of NorthStar Education Finance, Inc., a non-profit organization, since 2007. | | Asset Allocation Trust |
Michael S. Scofield (Born 1943) | | Trustee, since 2010 | | Served on the Investment Company Institute’s Board of Governors and Executive Committee from 2008-2011 as well the Governing Council of the Independent Directors Council from 2006-2011 and the Independent Directors Council Executive Committee from 2008-2011. Chairman of the IDC from 2008-2010. Institutional Investor (Fund Directions) Trustee of Year in 2007. Trustee of the Evergreen Funds complex (and its predecessors) from 1984 to 2010. Chairman of the Evergreen Funds from 2000-2010. Former Trustee of the Mentor Funds. Retired Attorney, Law Offices of Michael S. Scofield. | | Asset Allocation Trust |
| * | Length of service dates reflect the Trustee’s commencement of service with the Trust’s predecessor entities, where applicable. |
| ** | Peter Gordon is expected to retire on December 31, 2017. |
Officers
| | | | | | |
Name and year of birth | | Position held and length of service | | Principal occupations during past five years or longer | | |
Andrew Owen (Born 1960) | | President, since 2017 | | Executive Vice President of Wells Fargo Bank, N.A. and President of Wells Fargo & Company and Head of Affiliated Managers, Wells Fargo Asset Management, since 2014. Executive Vice President responsible for marketing, investments and product development for Wells Fargo Funds Management, LLC, from 2009 to 2014. | | |
Jeremy DePalma1 (Born 1974) | | Treasurer, since 2012 | | Senior Vice President of Wells Fargo Funds Management, LLC since 2009. Senior Vice President of Evergreen Investment Management Company, LLC from 2008 to 2010 and head of the Fund Reporting and Control Team within Fund Administration from 2005 to 2010. | | |
C. David Messman (Born 1960) | | Secretary, since 2000; Chief Legal Officer, since 2003 | | Senior Vice President and Secretary of Wells Fargo Funds Management, LLC since 2001. Assistant General Counsel of Wells Fargo Bank, N.A. since 2013 and Vice President and Managing Counsel of Wells Fargo Bank, N.A. from 1996 to 2013. | | |
Michael Whitaker (Born 1967) | | Chief Compliance Officer, since 2016 | | Executive Vice President of Wells Fargo Funds Management, LLC since 2016. Chief Compliance Officer of Fidelity’s Fixed Income Funds and Asset Allocation Funds from 2008 to 2016, Compliance Officer of FMR Co., Inc. from 2014 to 2016, Fidelity Investments Money Management, Inc. from 2014 to 2016, Fidelity Investments from 2007 to 2016. | | |
David Berardi (Born 1975) | | Assistant Treasurer, since 2009 | | Vice President of Wells Fargo Funds Management, LLC since 2009. Vice President of Evergreen Investment Management Company, LLC from 2008 to 2010. Manager of Fund Reporting and Control for Evergreen Investment Management Company, LLC from 2004 to 2010. | | |
| 1 | Jeremy DePalma acts as Treasurer of 69 funds and Assistant Treasurer of 69 funds in the Fund Complex. |
| 2 | The Statement of Additional Information includes additional information about the Trustees and is available, without charge, upon request, by calling 1-800-222-8222 or by visiting the website at wellsfargofunds.com. |
| | | | | | |
| List of abbreviations | | Wells Fargo Large Company Value Fund | | | 27 | |
The following is a list of common abbreviations for terms and entities that may have appeared in this report.
| ACA | — ACA Financial Guaranty Corporation |
| ADR | — American depositary receipt |
| ADS | — American depositary shares |
| AGC | — Assured Guaranty Corporation |
| AGM | — Assured Guaranty Municipal |
| Ambac | — Ambac Financial Group Incorporated |
| AMT | — Alternative minimum tax |
| BAN | — Bond anticipation notes |
| BHAC | — Berkshire Hathaway Assurance Corporation |
| CAB | — Capital appreciation bond |
| CCAB | — Convertible capital appreciation bond |
| CDA | — Community Development Authority |
| CDO | — Collateralized debt obligation |
| DRIVER | — Derivative inverse tax-exempt receipts |
| DW&P | — Department of Water & Power |
| DWR | — Department of Water Resources |
| ECFA | — Educational & Cultural Facilities Authority |
| EDA | — Economic Development Authority |
| EDFA | — Economic Development Finance Authority |
| ETF | — Exchange-traded fund |
| FDIC | — Federal Deposit Insurance Corporation |
| FFCB | — Federal Farm Credit Banks |
| FGIC | — Financial Guaranty Insurance Corporation |
| FHA | — Federal Housing Administration |
| FHLB | — Federal Home Loan Bank |
| FHLMC | — Federal Home Loan Mortgage Corporation |
| FICO | — The Financing Corporation |
| FNMA | — Federal National Mortgage Association |
| GDR | — Global depositary receipt |
| GNMA | — Government National Mortgage Association |
| HCFR | — Healthcare facilities revenue |
| HEFA | — Health & Educational Facilities Authority |
| HEFAR | — Higher education facilities authority revenue |
| HFA | — Housing Finance Authority |
| HFFA | — Health Facilities Financing Authority |
| HUD | — Department of Housing and Urban Development |
| IDA | — Industrial Development Authority |
| IDAG | — Industrial Development Agency |
| KRW | — Republic of Korea won |
| LIBOR | — London Interbank Offered Rate |
| LIFER | — Long Inverse Floating Exempt Receipts |
| LLC | — Limited liability company |
| LLLP | — Limited liability limited partnership |
| LLP | — Limited liability partnership |
| MBIA | — Municipal Bond Insurance Association |
| MFHR | — Multifamily housing revenue |
| MSTR | — Municipal securities trust receipts |
| MUD | — Municipal Utility District |
| National | — National Public Finance Guarantee Corporation |
| PCFA | — Pollution Control Financing Authority |
| PCL | — Public Company Limited |
| PCR | — Pollution control revenue |
| PFA | — Public Finance Authority |
| PFFA | — Public Facilities Financing Authority |
| PFOTER | — Puttable floating option tax-exempt receipts |
| plc | — Public limited company |
| PUTTER | — Puttable tax-exempt receipts |
| R&D | — Research & development |
| Radian | — Radian Asset Assurance |
| RAN | — Revenue anticipation notes |
| RDA | — Redevelopment Authority |
| RDFA | — Redevelopment Finance Authority |
| REIT | — Real estate investment trust |
| ROC | — Reset option certificates |
| SAVRS | — Select auction variable rate securities |
| SBA | — Small Business Authority |
| SDR | — Swedish depositary receipt |
| SFHR | — Single-family housing revenue |
| SFMR | — Single-family mortgage revenue |
| SPA | — Standby purchase agreement |
| SPDR | — Standard & Poor’s Depositary Receipts |
| SPEAR | — Short Puttable Exempt Adjustable Receipts |
| STRIPS | — Separate trading of registered interest and |
| TAN | — Tax anticipation notes |
| TIPS | — Treasury inflation-protected securities |
| TRAN | — Tax revenue anticipation notes |
| TTFA | — Transportation Trust Fund Authority |
| TVA | — Tennessee Valley Authority |
This page is intentionally left blank.

For more information
More information about Wells Fargo Funds is available free upon request. To obtain literature, please write, email, visit the Fund’s website, or call:
Wells Fargo Funds
P.O. Box 8266
Boston, MA 02266-8266
Email: fundservice@wellsfargo.com
Website: wellsfargofunds.com
Individual investors: 1-800-222-8222
Retail investment professionals: 1-888-877-9275
Institutional investment professionals: 1-866-765-0778
This report and the financial statements contained herein are submitted for the general information of the shareholders of the Fund. If this report is used for promotional purposes, distribution of the report must be accompanied or preceded by a current prospectus. Before investing, please consider the investment objectives, risks, charges, and expenses of the investment. For a current prospectus and, if available, a summary prospectus, containing this information, call 1-800-222-8222 or visit the Fund’s website at wellsfargofunds.com. Read the prospectus carefully before you invest or send money.
Wells Fargo Asset Management (WFAM) is a trade name used by the asset management businesses of Wells Fargo & Company. Wells Fargo Funds Management, LLC, a wholly owned subsidiary of Wells Fargo & Company, provides investment advisory and administrative services for Wells Fargo Funds. Other affiliates of Wells Fargo & Company provide subadvisory and other services for the funds. The funds are distributed by Wells Fargo Funds Distributor, LLC, Member FINRA, an affiliate of Wells Fargo & Company. Neither Wells Fargo Funds Management nor Wells Fargo Funds Distributor has Fund customer accounts/assets, and neither provides investment advice/recommendations or acts as an investment advice fiduciary to any investor.
NOT FDIC INSURED ◾ NO BANK GUARANTEE ◾ MAY LOSE VALUE
© 2017 Wells Fargo Funds Management, LLC. All rights reserved.
| | |
 | | 301462 03-17 SA210/SAR210 01-17 |
Semi-Annual Report
January 31, 2017

Wells Fargo Low Volatility U.S. Equity Fund


Reduce clutter. Save trees.
Sign up for electronic delivery of prospectuses and shareholder reports at wellsfargo.com/advantagedelivery
Contents
The views expressed and any forward-looking statements are as of January 31, 2017, unless otherwise noted, and are those of the Fund managers and/or Wells Fargo Funds Management, LLC. Discussions of individual securities, or the markets generally, or any Wells Fargo Fund are not intended as individual recommendations. Future events or results may vary significantly from those expressed in any forward-looking statements. The views expressed are subject to change at any time in response to changing circumstances in the market. Wells Fargo Funds Management, LLC and the Fund disclaim any obligation to publicly update or revise any views expressed or forward-looking statements.
NOT FDIC INSURED ◾ NO BANK GUARANTEE ◾ MAY LOSE VALUE
| | | | |
| 2 | | Wells Fargo Low Volatility U.S. Equity Fund | | Letter to shareholders (unaudited) |

Andrew Owen
President
Wells Fargo Funds
U.S. and international stocks returned 5.96% and 4.16% for the six-month period, respectively; within fixed income, the Bloomberg Barclays U.S. Aggregate Bond Index3 returned -2.95%.
Dear Shareholder:
As the new president of Wells Fargo Funds now that Karla Rabusch is retiring from that position after nearly 14 years, I am pleased to offer you this semi-annual report for the Wells Fargo Low Volatility U.S. Equity Fund since commencement of operation on October 31, 2016 through January 31, 2017. Despite heightened market volatility, global stocks delivered favorable results overall. U.S. and international stocks returned 5.96% and 4.16% for the six-month period, respectively, as measured by the S&P 500 Index1 and the MSCI ACWI ex USA Index (Net)2; within fixed income, the Bloomberg Barclays U.S. Aggregate Bond Index3 returned -2.95%.
In August–September 2016, global stocks delivered generally positive results; bonds’ interest rates remained historically low.
From August into early September 2016, U.S. and international stocks generally trended upward. Ever since the Great Recession, markets worldwide have been supported to varying degrees by accommodative policies from leading central banks, including the Federal Reserve (Fed), European Central Bank, Bank of England, and Bank of Japan. As a result, investors have watched closely for any signs that global central banks might tighten their measures. In the U.S., early-September comments by several Fed officials appeared to suggest a September interest-rate increase, which sent stock and bond prices downward. However, stocks surged following the Fed’s September 20 meeting on news that the Fed had decided to delay a rate increase to later in 2016. In bond markets, interest rates remained at historically low levels as a result of easy monetary policies, subdued global growth, and modest inflation expectations. Yields rose, after bottoming in July, as market participants felt that yields had overshot the real risks of the U.K.’s Brexit vote and as economic activity strengthened. At the front end of the yield curve, anticipation of new money market fund rules resulted in significantly higher yields on many short-term securities.
During the fourth quarter of 2016, prospects for faster growth and higher interest rates in the U.S. largely influenced the markets.
Early in the fourth quarter of 2016, U.S. stocks tended to trade lower amid concerns such as a likely interest-rate increase and uncertainty over the approaching general election. However, following Donald Trump’s election as president in early November, U.S. stocks began to rally. Investors appeared optimistic that the new administration would usher in a series of pro-growth policies, and supportive economic news helped the rally carry through the quarter. The buoyant environment sent interest rates higher as well. At its mid-December meeting, Fed officials raised their short-term target interest rate for the first time in a year, by a quarter percentage point, to between 0.50% and 0.75%. The fourth quarter also saw the implementation of the Securities and Exchange Commission’s new rules for money market funds, which included floating net asset values (NAVs) for institutional prime and municipal money market funds as well as liquidity fees and redemption gates. In the year leading up to
| 1 | The S&P 500 Index consists of 500 stocks chosen for market size, liquidity, and industry group representation. It is a market-value-weighted index with each stock’s weight in the index proportionate to its market value. You cannot invest directly in an index. |
| 2 | The Morgan Stanley Capital International (MSCI) All Country World Index (ACWI) ex USA Index (Net) is a free-float-adjusted market-capitalization-weighted index that is designed to measure the equity market performance of developed markets, excluding the United States and Canada. Source: MSCI. MSCI makes no express or implied warranties or representations and shall have no liability whatsoever with respect to any MSCI data contained herein. The MSCI data may not be further redistributed or used as a basis for other indexes or any securities or financial products. This report is not approved, reviewed, or produced by MSCI. You cannot invest directly in an index. |
| 3 | The Bloomberg Barclays U.S. Aggregate Bond Index (formerly known as Barclays U.S. Aggregate Bond Index) is a broad-based benchmark that measures the investment-grade, U.S. dollar–denominated, fixed-rate taxable bond market, including Treasuries, government-related and corporate securities, mortgage-backed securities (agency fixed-rate and hybrid adjustable-rate mortgage pass-throughs), asset-backed securities, and commercial mortgage-backed securities. You cannot invest directly in an index. |
| | | | | | |
| Letter to shareholders (unaudited) | | Wells Fargo Low Volatility U.S. Equity Fund | | | 3 | |
money fund reform implementation, nearly $1 trillion in assets moved from these types of money market funds into government money market funds, which continued to transact at a stable $1 NAV. Outside of the U.S., the prospects for faster U.S. growth appeared to trigger some acceleration in Europe. The improvement may be partly attributable to expectations for further strengthening of the U.S. dollar, which in turn could improve demand for European goods in the U.S. due to weakening of the euro relative to the dollar.
Investor optimism continued into January 2017.
January brought continued strength in global stock markets. Markets were lifted by factors such as strong trade data from Japan, robust earnings reports by businesses, and investors’ hopes that the U.S. government will approve a large fiscal stimulus package.
Don’t let short-term uncertainty derail long-term investment goals.
Periods of uncertainty can present challenges, but experience has taught us that maintaining long-term investment goals can be an effective way to plan for the future. To help you create a sound strategy based on your personal goals and risk tolerance, Wells Fargo Funds offers more than 100 mutual funds spanning a wide range of asset classes and investment styles. Although diversification cannot guarantee an investment profit or prevent losses, we believe it can be an effective way to manage investment risk and potentially smooth out overall portfolio performance. We encourage investors to know their investments and to understand that appropriate levels of risk-taking may unlock opportunities.
Thank you for choosing to invest in Wells Fargo Funds. We appreciate your confidence in us and remain committed to helping you meet your financial needs.
Sincerely,

Andrew Owen
President
Wells Fargo Funds
Although diversification cannot guarantee an investment profit or prevent losses, we believe it can be an effective way to manage investment risk and potentially smooth out overall portfolio performance.
For further information about your Fund, contact your investment professional, visit our website at wellsfargofunds.com, or call us directly at 1-800-222-8222. We are available 24 hours a day, 7 days a week.
| | | | |
| 4 | | Wells Fargo Low Volatility U.S. Equity Fund | | Performance highlights (unaudited) |
Investment objective
The Fund seeks long-term capital appreciation.
Manager
Wells Fargo Funds Management, LLC
Subadviser
Analytic Investors, LLC
Portfolio managers
Dennis Bein, CFA®
Ryan Brown, CFA®
Harindra de Silva, Ph.D., CFA®
Average annual total returns (%) as of January 31, 2017
| | | | | | | | | | | | | | | | | | |
| | | | | Including sales charge | | | Excluding sales charge | | | Expense ratios1 (%) | |
| | | Inception date | | Since
inception | | | Since
inception | | | Gross | | | Net2 | |
| Class A (WLVLX) | | 10-31-2016 | | | (0.28 | ) | | | 5.80 | | | | 1.03 | | | | 0.83 | |
| Class C (WLVKX) | | 10-31-2016 | | | 4.50 | | | | 5.50 | | | | 1.78 | | | | 1.58 | |
| Class R (WLVMX) | | 10-31-2016 | | | – | | | | 5.68 | | | | 1.28 | | | | 1.08 | |
| Class R6 (WLVJX) | | 10-31-2016 | | | – | | | | 5.81 | | | | 0.60 | | | | 0.40 | |
| Administrator Class (WLVDX) | | 10-31-2016 | | | – | | | | 5.74 | | | | 0.95 | | | | 0.75 | |
| Institutional Class (WLVOX) | | 10-31-2016 | | | – | | | | 5.79 | | | | 0.70 | | | | 0.50 | |
| Russell 1000® Index3 | | – | | | – | | | | 8.02 | | | | – | | | | – | |
Figures quoted represent past performance, which is no guarantee of future results, and do not reflect taxes that a shareholder may pay on fund distributions or the redemption of fund shares. Investment return and principal value of an investment will fluctuate so that an investor’s shares, when redeemed, may be worth more or less than their original cost. Performance shown without sales charges would be lower if sales charges were reflected. Current performance may be lower or higher than the performance data quoted, which assumes the reinvestment of dividends and capital gains. Current month-end performance is available on the Fund’s website, wellsfargofunds.com.
Index returns do not include transaction costs associated with buying and selling securities, any mutual fund fees or expenses, or any taxes. It is not possible to invest directly in an index.
For Class A shares, the maximum front-end sales charge is 5.75%. For Class C shares, the maximum contingent deferred sales charge is 1.00%. Performance including a contingent deferred sales charge assumes the sales charge for the corresponding time period. Class R, Class R6, Administrator Class, and Institutional Class shares are sold without a front-end sales charge or contingent deferred sales charge.
Stock values fluctuate in response to the activities of individual companies and general market and economic conditions. Certain investment strategies tend to increase the total risk of an investment (relative to the broader market). The Fund is exposed to smaller-company securities risk. Consult the Fund’s prospectus for additional information on these and other risks.
Please see footnotes on page 5.
| | | | | | |
| Performance highlights (unaudited) | | Wells Fargo Low Volatility U.S. Equity Fund | | | 5 | |
| | | | |
| Ten largest holdings (%) as of January 31, 20174 | |
PepsiCo Incorporated | | | 2.41 | |
Altria Group Incorporated | | | 2.40 | |
Validus Holdings Limited | | | 2.39 | |
Waste Management Incorporated | | | 2.36 | |
RenaissanceRe Holdings Limited | | | 2.35 | |
Axis Capital Holdings Limited | | | 2.31 | |
Johnson & Johnson | | | 2.30 | |
United Parcel Service Incorporated Class B | | | 2.27 | |
Everest Reinsurance Group Limited | | | 2.24 | |
Philip Morris International | | | 2.21 | |
|
| Sector distribution as of January 31, 20175 |
|
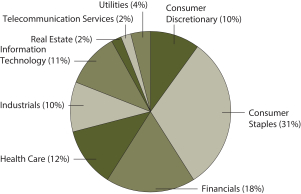 |
| 1 | Reflects the expense ratios as stated in the most recent prospectuses. The expense ratios shown are subject to change and may differ from the annualized expense ratios shown in the financial highlights of this report. |
| 2 | The manager has contractually committed through November 30, 2017, to waive fees and/or reimburse expenses to the extent necessary to cap the Fund’s Total Annual Fund Operating Expenses After Fee Waiver at the amounts shown. After this time, the cap may be increased or the commitment to maintain the cap may be terminated only with the approval of the Board of Trustees. Brokerage commissions, stamp duty fees, interest, taxes, acquired fund fees and expenses, and extraordinary expenses are excluded from the expense cap. Without this cap, the Fund’s returns would have been lower. |
| 3 | The Russell 1000® Index measures the performance of the 1,000 largest companies in the Russell 3000® Index, which represents approximately 92% of the total market capitalization of the Russell 3000® Index. You cannot invest directly in an index. |
| 4 | The ten largest holdings, excluding cash and cash equivalents, are calculated based on the value of the investments divided by total net assets of the Fund. Holdings are subject to change and may have changed since the date specified. |
| 5 | Amounts are calculated based on the total long-term investments of the Fund. These amounts are subject to change and may have changed since the date specified. |
| | | | |
| 6 | | Wells Fargo Low Volatility U.S. Equity Fund | | Fund expenses (unaudited) |
As a shareholder of the Fund, you incur two types of costs: (1) transaction costs, including sales charges (loads) on purchase payments and contingent deferred sales charges (if any) on redemptions and (2) ongoing costs, including management fees, distribution (12b-1) and/or shareholder servicing fees, and other Fund expenses. This example is intended to help you understand your ongoing costs (in dollars) of investing in the Fund and to compare these costs with the ongoing costs of investing in other mutual funds.
The example is based on an investment of $1,000 invested at the beginning of the six-month period and held for the entire period from August 1, 2016 to January 31, 2017.
Actual expenses
The “Actual” line of the table below provides information about actual account values and actual expenses. You may use the information in this line, together with the amount you invested, to estimate the expenses that you paid over the period. Simply divide your account value by $1,000 (for example, an $8,600 account value divided by $1,000 = 8.6), then multiply the result by the number in the “Actual” line under the heading entitled “Expenses paid during period” for your applicable class of shares to estimate the expenses you paid on your account during this period.
Hypothetical example for comparison purposes
The “Hypothetical” line of the table below provides information about hypothetical account values and hypothetical expenses based on the Fund’s actual expense ratio and an assumed rate of return of 5% per year before expenses, which is not the Fund’s actual return. The hypothetical account values and expenses may not be used to estimate the actual ending account balance or expenses you paid for the period. You may use this information to compare the ongoing costs of investing in the Fund and other funds. To do so, compare this 5% hypothetical example with the 5% hypothetical examples that appear in the shareholder reports of the other funds.
Please note that the expenses shown in the table are meant to highlight your ongoing costs only and do not reflect any transactional costs, such as sales charges (loads) and contingent deferred sales charges. Therefore, the “Hypothetical” line of the table is useful in comparing ongoing costs only and will not help you determine the relative total costs of owning different funds. In addition, if these transactional costs were included, your costs would have been higher.
| | | | | | | | | | | | | | | | |
| | | Beginning
account value
8-1-2016 | | | Ending
account value
1-31-2017 | | | Expenses
paid during
the period¹ | | | Annualized net
expense ratio | |
Class A | | | | | | | | | | | | | | | | |
Actual | | $ | 1,000.00 | | | $ | 1,058.01 | | | $ | 4.29 | | | | 0.83 | % |
Hypothetical (5% return before expenses) | | $ | 1,000.00 | | | $ | 1,020.96 | | | $ | 4.22 | | | | 0.83 | % |
Class C | | | | | | | | | | | | | | | | |
Actual | | $ | 1,000.00 | | | $ | 1,054.96 | | | $ | 8.16 | | | | 1.58 | % |
Hypothetical (5% return before expenses) | | $ | 1,000.00 | | | $ | 1,017.19 | | | $ | 8.01 | | | | 1.58 | % |
Class R | | | | | | | | | | | | | | | | |
Actual | | $ | 1,000.00 | | | $ | 1,056.84 | | | $ | 5.58 | | | | 1.08 | % |
Hypothetical (5% return before expenses) | | $ | 1,000.00 | | | $ | 1,019.71 | | | $ | 5.48 | | | | 1.08 | % |
Class R6 | | | | | | | | | | | | | | | | |
Actual | | $ | 1,000.00 | | | $ | 1,058.06 | | | $ | 2.07 | | | | 0.40 | % |
Hypothetical (5% return before expenses) | | $ | 1,000.00 | | | $ | 1,023.13 | | | $ | 2.03 | | | | 0.40 | % |
Administrator Class | | | | | | | | | | | | | | | | |
Actual | | $ | 1,000.00 | | | $ | 1,057.44 | | | $ | 3.88 | | | | 0.75 | % |
Hypothetical (5% return before expenses) | | $ | 1,000.00 | | | $ | 1,021.37 | | | $ | 3.81 | | | | 0.75 | % |
Institutional Class | | | | | | | | | | | | | | | | |
Actual | | $ | 1,000.00 | | | $ | 1,057.88 | | | $ | 2.59 | | | | 0.50 | % |
Hypothetical (5% return before expenses) | | $ | 1,000.00 | | | $ | 1,022.62 | | | $ | 2.54 | | | | 0.50 | % |
| 1 | Expenses paid is equal to the annualized net expense ratio of each class multiplied by the average account value over the period, multiplied by the number of days in the most recent fiscal half-year divided by the number of days in the fiscal year (to reflect the one-half-year period). |
| | | | | | |
| Portfolio of investments—January 31, 2017 (unaudited) | | Wells Fargo Low Volatility U.S. Equity Fund | | | 7 | |
| | | | | | | | | | | | | | | | |
| Security name | | | | | | | | Shares | | | Value | |
| | | | |
Common Stocks: 94.38% | | | | | | | | | | | | | | | | |
| | | | |
Consumer Discretionary: 9.33% | | | | | | | | | | | | | | | | |
| | | | |
| Distributors: 0.11% | | | | | | | | | | | | | | | | |
Genuine Parts Company | | | | | | | | | | | 302 | | | $ | 29,237 | |
| | | | | | | | | | | | | | | | |
| | | | |
| Hotels, Restaurants & Leisure: 5.83% | | | | | | | | | | | | | | | | |
Aramark | | | | | | | | | | | 13,611 | | | | 460,596 | |
Darden Restaurants Incorporated | | | | | | | | | | | 4,095 | | | | 300,082 | |
McDonald’s Corporation | | | | | | | | | | | 3,082 | | | | 377,761 | |
Yum! Brands Incorporated | | | | | | | | | | | 7,074 | | | | 463,559 | |
| | | | |
| | | | | | | | | | | | | | | 1,601,998 | |
| | | | | | | | | | | | | | | | |
| | | | |
| Media: 0.42% | | | | | | | | | | | | | | | | |
Regal Entertainment Group Class A | | | | | | | | | | | 5,104 | | | | 115,657 | |
| | | | | | | | | | | | | | | | |
| | | | |
| Multiline Retail: 1.83% | | | | | | | | | | | | | | | | |
Dollar General Corporation | | | | | | | | | | | 755 | | | | 55,734 | |
Target Corporation | | | | | | | | | | | 6,960 | | | | 448,781 | |
| | | | |
| | | | | | | | | | | | | | | 504,515 | |
| | | | | | | | | | | | | | | | |
| | | | |
| Specialty Retail: 0.17% | | | | | | | | | | | | | | | | |
Dick’s Sporting Goods Incorporated | | | | | | | | | | | 380 | | | | 19,608 | |
Murphy USA Incorporated † | | | | | | | | | | | 437 | | | | 27,837 | |
| | | | |
| | | | | | | | | | | | | | | 47,445 | |
| | | | | | | | | | | | | | | | |
| | | | |
| Textiles, Apparel & Luxury Goods: 0.97% | | | | | | | | | | | | | | | | |
Michael Kors Holdings Limited † | | | | | | | | | | | 6,263 | | | | 268,119 | |
| | | | | | | | | | | | | | | | |
| | | | |
Consumer Staples: 28.70% | | | | | | | | | | | | | | | | |
| | | | |
| Beverages: 6.78% | | | | | | | | | | | | | | | | |
Dr Pepper Snapple Group Incorporated | | | | | | | | | | | 6,609 | | | | 602,741 | |
PepsiCo Incorporated | | | | | | | | | | | 6,380 | | | | 662,116 | |
The Coca-Cola Company | | | | | | | | | | | 14,403 | | | | 598,733 | |
| | | | |
| | | | | | | | | | | | | | | 1,863,590 | |
| | | | | | | | | | | | | | | | |
| | | | |
| Food & Staples Retailing: 5.97% | | | | | | | | | | | | | | | | |
Costco Wholesale Corporation | | | | | | | | | | | 2,759 | | | | 452,338 | |
Sysco Corporation | | | | | | | | | | | 10,888 | | | | 571,184 | |
The Kroger Company | | | | | | | | | | | 1,969 | | | | 66,867 | |
Wal-Mart Stores Incorporated | | | | | | | | | | | 8,272 | | | | 552,073 | |
| | | | |
| | | | | | | | | | | | | | | 1,642,462 | |
| | | | | | | | | | | | | | | | |
| | | | |
| Food Products: 5.57% | | | | | | | | | | | | | | | | |
Flowers Foods Incorporated | | | | | | | | | | | 12,847 | | | | 258,353 | |
General Mills Incorporated | | | | | | | | | | | 359 | | | | 22,430 | |
Ingredion Incorporated | | | | | | | | | | | 1,078 | | | | 138,189 | |
Kellogg Company | | | | | | | | | | | 7,637 | | | | 555,286 | |
McCormick & Company Incorporated | | | | | | | | | | | 5,273 | | | | 503,835 | |
The accompanying notes are an integral part of these financial statements.
| | | | |
| 8 | | Wells Fargo Low Volatility U.S. Equity Fund | | Portfolio of investments—January 31, 2017 (unaudited) |
| | | | | | | | | | | | | | | | |
| Security name | | | | | | | | Shares | | | Value | |
| | | | |
| Food Products (continued) | | | | | | | | | | | | | | | | |
The Hershey Company | | | | | | | | | | | 313 | | | $ | 33,012 | |
Tyson Foods Incorporated Class A | | | | | | | | | | | 312 | | | | 19,590 | |
| | | | |
| | | | | | | | | | | | | | | 1,530,695 | |
| | | | | | | | | | | | | | | | |
| | | | |
| Household Products: 5.78% | | | | | | | | | | | | | | | | |
Colgate-Palmolive Company | | | | | | | | | | | 8,543 | | | | 551,707 | |
Kimberly-Clark Corporation | | | | | | | | | | | 4,419 | | | | 535,273 | |
The Clorox Company | | | | | | | | | | | 3,736 | | | | 448,320 | |
The Procter & Gamble Company | | | | | | | | | | | 622 | | | | 54,487 | |
| | | | |
| | | | | | | | | | | | | | | 1,589,787 | |
| | | | | | | | | | | | | | | | |
| | | | |
| Tobacco: 4.60% | | | | | | | | | | | | | | | | |
Altria Group Incorporated | | | | | | | | | | | 9,258 | | | | 658,984 | |
Philip Morris International | | | | | | | | | | | 6,311 | | | | 606,676 | |
| | | | |
| | | | | | | | | | | | | | | 1,265,660 | |
| | | | | | | | | | | | | | | | |
| | | | |
Financials: 16.58% | | | | | | | | | | | | | | | | |
| | | | |
| Banks: 2.07% | | | | | | | | | | | | | | | | |
BankUnited Incorporated | | | | | | | | | | | 7,907 | | | | 302,047 | |
US Bancorp | | | | | | | | | | | 5,095 | | | | 268,252 | |
| | | | |
| | | | | | | | | | | | | | | 570,299 | |
| | | | | | | | | | | | | | | | |
| | | | |
| Capital Markets: 1.10% | | | | | | | | | | | | | | | | |
Donnelley Financial Solutions † | | | | | | | | | | | 2,957 | | | | 71,205 | |
Thomson Reuters Corporation | | | | | | | | | | | 5,135 | | | | 230,253 | |
| | | | |
| | | | | | | | | | | | | | | 301,458 | |
| | | | | | | | | | | | | | | | |
| | | | |
| Insurance: 11.08% | | | | | | | | | | | | | | | | |
American National Insurance Company | | | | | | | | | | | 626 | | | | 72,985 | |
Aspen Insurance Holdings Limited | | | | | | | | | | | 4,170 | | | | 235,188 | |
Axis Capital Holdings Limited | | | | | | | | | | | 9,918 | | | | 634,851 | |
Everest Reinsurance Group Limited | | | | | | | | | | | 2,796 | | | | 614,924 | |
ProAssurance Corporation | | | | | | | | | | | 324 | | | | 17,626 | |
RenaissanceRe Holdings Limited | | | | | | | | | | | 4,738 | | | | 645,884 | |
Validus Holdings Limited | | | | | | | | | | | 11,510 | | | | 656,070 | |
White Mountain Insurance Group Limited | | | | | | | | | | | 185 | | | | 168,306 | |
| | | | |
| | | | | | | | | | | | | | | 3,045,834 | |
| | | | | | | | | | | | | | | | |
| | | | |
| Mortgage REITs: 2.33% | | | | | | | | | | | | | | | | |
AGNC Investment Corporation | | | | | | | | | | | 814 | | | | 15,197 | |
Chimera Investment Corporation | | | | | | | | | | | 16,726 | | | | 294,879 | |
MFA Financial Incorporated | | | | | | | | | | | 42,071 | | | | 331,940 | |
| | | | |
| | | | | | | | | | | | | | | 642,016 | |
| | | | | | | | | | | | | | | | |
| | | | |
Health Care: 11.54% | | | | | | | | | | | | | | | | |
| | | | |
| Health Care Equipment & Supplies: 3.35% | | | | | | | | | | | | | | | | |
Baxter International Incorporated | | | | | | | | | | | 11,002 | | | | 527,106 | |
Teleflex Incorporated | | | | | | | | | | | 2,355 | | | | 395,004 | |
| | | | |
| | | | | | | | | | | | | | | 922,110 | |
| | | | | | | | | | | | | | | | |
The accompanying notes are an integral part of these financial statements.
| | | | | | |
| Portfolio of investments—January 31, 2017 (unaudited) | | Wells Fargo Low Volatility U.S. Equity Fund | | | 9 | |
| | | | | | | | | | | | | | | | |
| Security name | | | | | | | | Shares | | | Value | |
| | | | |
| Health Care Providers & Services: 1.02% | | | | | | | | | | | | | | | | |
AmerisourceBergen Corporation | | | | | | | | | | | 660 | | | $ | 57,605 | |
Laboratory Corporation of America Holdings † | | | | | | | | | | | 200 | | | | 26,842 | |
McKesson Corporation | | | | | | | | | | | 529 | | | | 73,610 | |
Quest Diagnostics Incorporated | | | | | | | | | | | 1,320 | | | | 121,334 | |
| | | | |
| | | | | | | | | | | | | | | 279,391 | |
| | | | | | | | | | | | | | | | |
| | | | |
| Life Sciences Tools & Services: 1.63% | | | | | | | | | | | | | | | | |
Quintiles Transnational Holdings Incorporated † | | | | | | | | | | | 5,722 | | | | 449,120 | |
| | | | | | | | | | | | | | | | |
| | | | |
| Pharmaceuticals: 5.54% | | | | | | | | | | | | | | | | |
Bristol-Myers Squibb Company | | | | | | | | | | | 3,462 | | | | 170,192 | |
Johnson & Johnson | | | | | | | | | | | 5,576 | | | | 631,482 | |
Merck & Company Incorporated | | | | | | | | | | | 3,832 | | | | 237,546 | |
Pfizer Incorporated | | | | | | | | | | | 15,232 | | | | 483,311 | |
| | | | |
| | | | | | | | | | | | | | | 1,522,531 | |
| | | | | | | | | | | | | | | | |
| | | | |
Industrials: 9.56% | | | | | | | | | | | | | | | | |
| | | | |
| Aerospace & Defense: 2.54% | | | | | | | | | | | | | | | | |
Lockheed Martin Corporation | | | | | | | | | | | 1,308 | | | | 328,740 | |
Raytheon Company | | | | | | | | | | | 2,555 | | | | 368,329 | |
| | | | |
| | | | | | | | | | | | | | | 697,069 | |
| | | | | | | | | | | | | | | | |
| | | | |
| Air Freight & Logistics: 2.27% | | | | | | | | | | | | | | | | |
United Parcel Service Incorporated Class B | | | | | | | | | | | 5,712 | | | | 623,351 | |
| | | | | | | | | | | | | | | | |
| | | | |
| Commercial Services & Supplies: 3.51% | | | | | | | | | | | | | | | | |
Republic Services Incorporated | | | | | | | | | | | 5,506 | | �� | | 315,934 | |
Waste Management Incorporated | | | | | | | | | | | 9,344 | | | | 649,408 | |
| | | | |
| | | | | | | | | | | | | | | 965,342 | |
| | | | | | | | | | | | | | | | |
| | | | |
| Industrial Conglomerates: 0.32% | | | | | | | | | | | | | | | | |
3M Company | | | | | | | | | | | 505 | | | | 88,284 | |
| | | | | | | | | | | | | | | | |
| | | | |
| Road & Rail: 0.72% | | | | | | | | | | | | | | | | |
Landstar System Incorporated | | | | | | | | | | | 2,336 | | | | 197,626 | |
| | | | | | | | | | | | | | | | |
| | | | |
| Transportation Infrastructure: 0.20% | | | | | | | | | | | | | | | | |
Macquarie Infrastructure Company LLC | | | | | | | | | | | 750 | | | | 56,243 | |
| | | | | | | | | | | | | | | | |
| | | | |
Information Technology: 9.81% | | | | | | | | | | | | | | | | |
| | | | |
| Communications Equipment: 1.38% | | | | | | | | | | | | | | | | |
Cisco Systems Incorporated | | | | | | | | | | | 10,122 | | | | 310,948 | |
Motorola Solutions Incorporated | | | | | | | | | | | 853 | | | | 68,846 | |
| | | | |
| | | | | | | | | | | | | | | 379,794 | |
| | | | | | | | | | | | | | | | |
| | | | |
| Internet Software & Services: 0.75% | | | | | | | | | | | | | | | | |
eBay Incorporated † | | | | | | | | | | | 6,479 | | | | 206,227 | |
| | | | | | | | | | | | | | | | |
| | | | |
| IT Services: 5.86% | | | | | | | | | | | | | | | | |
Accenture plc Class A | | | | | | | | | | | 1,678 | | | | 191,074 | |
Amdocs Limited | | | | | | | | | | | 10,291 | | | | 604,185 | |
Booz Allen Hamilton Holding Corporation | | | | | | | | | | | 6,302 | | | | 213,134 | |
The accompanying notes are an integral part of these financial statements.
| | | | |
| 10 | | Wells Fargo Low Volatility U.S. Equity Fund | | Portfolio of investments—January 31, 2017 (unaudited) |
| | | | | | | | | | | | | | | | |
| Security name | | | | | | | | Shares | | | Value | |
| | | | |
| IT Services (continued) | | | | | | | | | | | | | | | | |
International Business Machines Corporation | | | | | | | | | | | 2,093 | | | $ | 365,270 | |
Square Incorporated Class A † | | | | | | | | | | | 16,318 | | | | 238,569 | |
| | | | |
| | | | | | | | | | | | | | | 1,612,232 | |
| | | | | | | | | | | | | | | | |
| | | | |
| Software: 1.82% | | | | | | | | | | | | | | | | |
Symantec Corporation | | | | | | | | | | | 18,151 | | | | 500,060 | |
| | | | | | | | | | | | | | | | |
| | | | |
Materials: 0.37% | | | | | | | | | | | | | | | | |
| | | | |
| Metals & Mining: 0.37% | | | | | | | | | | | | | | | | |
Compass Minerals International Incorporated | | | | | | | | | | | 1,226 | | | | 102,494 | |
| | | | | | | | | | | | | | | | |
| | | | |
Real Estate: 2.13% | | | | | | | | | | | | | | | | |
| | | | |
| Equity REITs: 2.13% | | | | | | | | | | | | | | | | |
Apple Hospitality REIT Incorporated | | | | | | | | | | | 25,360 | | | | 507,707 | |
The Macerich Company | | | | | | | | | | | 1,123 | | | | 77,139 | |
| | | | |
| | | | | | | | | | | | | | | 584,846 | |
| | | | | | | | | | | | | | | | |
| | | | |
Telecommunication Services: 2.19% | | | | | | | | | | | | | | | | |
| | | | |
| Diversified Telecommunication Services: 2.19% | | | | | | | | | | | | | | | | |
Verizon Communications Incorporated | | | | | | | | | | | 12,280 | | | | 601,843 | |
| | | | | | | | | | | | | | | | |
| | | | |
Utilities: 4.17% | | | | | | | | | | | | | | | | |
| | | | |
| Electric Utilities: 4.17% | | | | | | | | | | | | | | | | |
Hawaiian Electric Industries Incorporated | | | | | | | | | | | 13,320 | | | | 445,954 | |
Pinnacle West Capital Corporation | | | | | | | | | | | 4,568 | | | | 354,614 | |
The Southern Company | | | | | | | | | | | 3,532 | | | | 174,587 | |
Xcel Energy Incorporated | | | | | | | | | | | 4,132 | | | | 170,734 | |
| | | | |
| | | | | | | | | | | | | | | 1,145,889 | |
| | | | | | | | | | | | | | | | |
| | | | |
Total Common Stocks (Cost $24,731,427) | | | | | | | | | | | | | | | 25,953,224 | |
| | | | | | | | | | | | | | | | |
| | | | |
| | | Yield | | | | | | | | | | |
| Short-Term Investments: 5.04% | | | | | | | | | | | | | | | | |
| | | | |
| Investment Companies: 5.04% | | | | | | | | | | | | | | | | |
Wells Fargo Government Money Market Fund Select Class (l)(u) | | | 0.46 | % | | | | | | | 1,384,333 | | | | 1,384,333 | |
| | | | | | | | | | | | | | | | |
| | | | |
Total Short-Term Investments (Cost $1,384,333) | | | | | | | | | | | | | | | 1,384,333 | |
| | | | | | | | | | | | | | | | |
| | | | | | | | |
| Total investments in securities (Cost $26,115,760) * | | | 99.42 | % | | | 27,337,557 | |
Other assets and liabilities, net | | | 0.58 | | | | 160,027 | |
| | | | | | | | |
| Total net assets | | | 100.00 | % | | $ | 27,497,584 | |
| | | | | | | | |
| † | Non-income-earning security |
| (l) | The issuer of the security is an affiliated person of the Fund as defined in the Investment Company Act of 1940. |
| (u) | The rate represents the 7-day annualized yield at period end. |
| * | Cost for federal income tax purposes is $26,115,912 and unrealized gains (losses) consists of: |
| | | | |
Gross unrealized gains | | $ | 1,515,904 | |
Gross unrealized losses | | | (294,259 | ) |
| | | | |
Net unrealized gains | | $ | 1,221,645 | |
The accompanying notes are an integral part of these financial statements.
| | | | | | |
| Statement of assets and liabilities—January 31, 2017 (unaudited) | | Wells Fargo Low Volatility U.S. Equity Fund | | | 11 | |
| | | | |
| | | | |
| |
Assets | | | | |
Investments | | | | |
In unaffiliated securities, at value (cost $24,731,427) | | $ | 25,953,224 | |
In affiliated securities, at value (cost $1,384,333) | | | 1,384,333 | |
| | | | |
Total investments, at value (cost $26,115,760) | | | 27,337,557 | |
Receivable for investments sold | | | 28,411 | |
Receivable for dividends | | | 23,325 | |
Receivable from manager | | | 12,312 | |
Prepaid expenses and other assets | | | 115,794 | |
| | | | |
Total assets | | | 27,517,399 | |
| | | | |
| |
Liabilities | | | | |
Distribution fees payable | | | 90 | |
Administration fees payable | | | 2,943 | |
Trustees’ fees and expenses payable | | | 2,634 | |
Custodian and accounting fees payable | | | 3,131 | |
Professional fees payable | | | 9,959 | |
Accrued expenses and other liabilities | | | 1,058 | |
| | | | |
Total liabilities | | | 19,815 | |
| | | | |
Total net assets | | $ | 27,497,584 | |
| | | | |
| |
NET ASSETS CONSIST OF | | | | |
Paid-in capital | | $ | 26,155,160 | |
Undistributed net investment income | | | 17,628 | |
Accumulated net realized gains on investments | | | 102,999 | |
Net unrealized gains on investments | | | 1,221,797 | |
| | | | |
Total net assets | | $ | 27,497,584 | |
| | | | |
| |
COMPUTATION OF NET ASSET VALUE AND OFFERING PRICE PER SHARE | | | | |
Net assets – Class A | | $ | 547,899 | |
Shares outstanding – Class A1 | | | 52,007 | |
Net asset value per share – Class A | | | $10.54 | |
Maximum offering price per share – Class A2 | | | $11.18 | |
Net assets – Class C | | $ | 105,539 | |
Shares outstanding – Class C1 | | | 10,028 | |
Net asset value per share – Class C | | | $10.52 | |
Net assets – Class R | | $ | 105,672 | |
Shares outstanding – Class R1 | | | 10,037 | |
Net asset value per share – Class R | | | $10.53 | |
Net assets – Class R6 | | $ | 1,058,528 | |
Shares outstanding – Class R61 | | | 100,480 | |
Net asset value per share – Class R6 | | | $10.53 | |
Net assets – Administrator Class | | $ | 105,759 | |
Shares outstanding – Administrator Class1 | | | 10,042 | |
Net asset value per share – Administrator Class | | | $10.53 | |
Net assets – Institutional Class | | $ | 25,574,187 | |
Shares outstanding – Institutional Class1 | | | 2,427,807 | |
Net asset value per share – Institutional Class | | | $10.53 | |
| 1 | The Fund has an unlimited number of authorized shares. |
| 2 | Maximum offering price is computed as 100/94.25 of net asset value. On investments of $50,000 or more, the offering price is reduced. |
The accompanying notes are an integral part of these financial statements.
| | | | |
| 12 | | Wells Fargo Low Volatility U.S. Equity Fund | | Statement of operations—period ended January 31, 20171 (unaudited) |
| | | | |
| | | | |
| |
Investment income | | | | |
Dividends (net of foreign withholding taxes of $262) | | $ | 172,024 | |
Income from affiliated securities | | | 1,876 | |
| | | | |
Total investment income | | | 173,900 | |
| | | | |
| |
Expenses | | | | |
Management fee | | | 26,581 | |
Administration fees | | | | |
Class A | | | 218 | |
Class C | | | 55 | |
Class R | | | 55 | |
Class R6 | | | 79 | |
Administrator Class | | | 34 | |
Institutional Class | | | 8,061 | |
Shareholder servicing fees | | | | |
Class A | | | 259 | |
Class C | | | 65 | |
Class R | | | 66 | |
Administrator Class | | | 66 | |
Distribution fees | | | | |
Class C | | | 196 | |
Class R | | | 66 | |
Custody and accounting fees | | | 3,131 | |
Professional fees | | | 13,445 | |
Registration fees | | | 22,466 | |
Shareholder report expenses | | | 17,751 | |
Trustees’ fees and expenses | | | 3,640 | |
Other fees and expenses | | | 1,278 | |
| | | | |
Total expenses | | | 97,512 | |
Less: Fee waivers and/or expense reimbursements | | | (63,706 | ) |
| | | | |
Net expenses | | | 33,806 | |
| | | | |
Net investment income | | | 140,094 | |
| | | | |
| |
REALIZED AND UNREALIZED GAINS (LOSSES) ON INVESTMENTS | | | | |
Net realized gains on investments | | | 102,999 | |
Net change in unrealized gains (losses) on investments | | | 1,221,797 | |
| | | | |
Net realized and unrealized gains (losses) on investments | | | 1,324,796 | |
| | | | |
Net increase in net assets resulting from operations | | $ | 1,464,890 | |
| | | | |
| 1 | For the period from October 31, 2016 (commencement of operations) to January 31, 2017 |
The accompanying notes are an integral part of these financial statements.
| | | | | | |
| Statement of changes in net assets | | Wells Fargo Low Volatility U.S. Equity Fund | | | 13 | |
| | | | | | | | |
| | | Period ended
January 31, 20171
(unaudited) | |
| | |
Operations | | | | | | | | |
Net investment income | | | | | | $ | 140,094 | |
Net realized gains on investments | | | | | | | 102,999 | |
Net change in unrealized gains (losses) on investments | | | | | | | 1,221,797 | |
| | | | |
Net increase in net assets resulting from operations | | | | | | | 1,464,890 | |
| | | | |
| | |
Distributions to shareholders from | | | | | | | | |
Net investment income | | | | | | | | |
Class A | | | | | | | (1,837 | ) |
Class C | | | | | | | (295 | ) |
Class R | | | | | | | (382 | ) |
Class R6 | | | | | | | (5,028 | ) |
Administrator Class | | | | | | | (441 | ) |
Institutional Class | | | | | | | (114,483 | ) |
| | | | |
Total distributions to shareholders | | | | | | | (122,466 | ) |
| | | | |
| | |
Capital share transactions | | | Shares | | | | | |
Proceeds from shares sold | | | | | | | | |
Class A | | | 51,831 | | | | 532,694 | |
Class C | | | 10,000 | | | | 100,000 | |
Class R | | | 10,000 | | | | 100,000 | |
Class R6 | | | 100,000 | | | | 1,000,000 | |
Administrator Class | | | 10,000 | | | | 100,000 | |
Institutional Class | | | 2,417,820 | | | | 24,210,000 | |
| | | | |
| | | | | | | 26,042,694 | |
| | | | |
Reinvestment of distributions | | | | | | | | |
Class A | | | 176 | | | | 1,837 | |
Class C | | | 28 | | | | 295 | |
Class R | | | 37 | | | | 382 | |
Class R6 | | | 480 | | | | 5,028 | |
Administrator Class | | | 42 | | | | 441 | |
Institutional Class | | | 10,934 | | | | 114,483 | |
| | | | |
| | | | | | | 122,466 | |
| | | | |
Payment for shares redeemed | | | | | | | | |
Institutional Class | | | (947 | ) | | | (10,000 | ) |
| | | | |
Net increase in net assets resulting from capital share transactions | | | | | | | 26,155,160 | |
| | | | |
Total increase in net assets | | | | | | | 27,497,584 | |
| | | | |
| | |
Net assets | | | | | | | | |
Beginning of period | | | | | | | 0 | |
| | | | |
End of period | | | | | | $ | 27,497,584 | |
| | | | |
Undistributed net investment income | | | | | | $ | 17,628 | |
| | | | |
| 1 | For the period from October 31, 2016 (commencement of operations) to January 31, 2017 |
The accompanying notes are an integral part of these financial statements.
| | | | |
| 14 | | Wells Fargo Low Volatility U.S. Equity Fund | | Financial highlights |
(For a share outstanding throughout the period)
| | | | |
| CLASS A | | Period ended
January 31, 20171
(unaudited) | |
Net asset value, beginning of period | | | $10.00 | |
Net investment income | | | 0.04 | |
Net realized and unrealized gains (losses) on investments | | | 0.54 | |
| | | | |
Total from investment operations | | | 0.58 | |
Distributions to shareholders from | | | | |
Net investment income | | | (0.04 | ) |
Net asset value, end of period | | | $10.54 | |
Total return2 | | | 5.80 | % |
Ratios to average net assets (annualized) | | | | |
Gross expenses | | | 1.78 | % |
Net expenses | | | 0.83 | % |
Net investment income | | | 1.78 | % |
Supplemental data | | | | |
Portfolio turnover rate | | | 6 | % |
Net assets, end of period (000s omitted) | | | $548 | |
| 1 | For the period from October 31, 2016 (commencement of class operations) to January 31, 2017 |
| 2 | Total return calculations do not include any sales charges. Returns for periods of less than one year are not annualized. |
The accompanying notes are an integral part of these financial statements.
| | | | | | |
| Financial highlights | | Wells Fargo Low Volatility U.S. Equity Fund | | | 15 | |
(For a share outstanding throughout the period)
| | | | |
| CLASS C | | Period ended
January 31, 20171
(unaudited) | |
Net asset value, beginning of period | | | $10.00 | |
Net investment income | | | 0.03 | |
Net realized and unrealized gains (losses) on investments | | | 0.52 | |
| | | | |
Total from investment operations | | | 0.55 | |
Distributions to shareholders from | | | | |
Net investment income | | | (0.03 | ) |
Net asset value, end of period | | | $10.52 | |
Total return2 | | | 5.50 | % |
Ratios to average net assets (annualized) | | | | |
Gross expenses | | | 2.54 | % |
Net expenses | | | 1.58 | % |
Net investment income | | | 1.04 | % |
Supplemental data | | | | |
Portfolio turnover rate | | | 6 | % |
Net assets, end of period (000s omitted) | | | $106 | |
| 1 | For the period from October 31, 2016 (commencement of class operations) to January 31, 2017 |
| 2 | Total return calculations do not include any sales charges. Returns for periods of less than one year are not annualized. |
The accompanying notes are an integral part of these financial statements.
| | | | |
| 16 | | Wells Fargo Low Volatility U.S. Equity Fund | | Financial highlights |
(For a share outstanding throughout the period)
| | | | |
| CLASS R | | Period ended
January 31, 20171
(unaudited) | |
Net asset value, beginning of period | | | $10.00 | |
Net investment income | | | 0.04 | |
Net realized and unrealized gains (losses) on investments | | | 0.53 | |
| | | | |
Total from investment operations | | | 0.57 | |
Distributions to shareholders from | | | | |
Net investment income | | | (0.04 | ) |
Net asset value, end of period | | | $10.53 | |
Total return2 | | | 5.68 | % |
Ratios to average net assets (annualized) | | | | |
Gross expenses | | | 2.04 | % |
Net expenses | | | 1.08 | % |
Net investment income | | | 1.54 | % |
Supplemental data | | | | |
Portfolio turnover rate | | | 6 | % |
Net assets, end of period (000s omitted) | | | $106 | |
| 1 | For the period from October 31, 2016 (commencement of class operations) to January 31, 2017 |
| 2 | Returns for periods of less than one year are not annualized. |
The accompanying notes are an integral part of these financial statements.
| | | | | | |
| Financial highlights | | Wells Fargo Low Volatility U.S. Equity Fund | | | 17 | |
(For a share outstanding throughout the period)
| | | | |
| CLASS R6 | | Period ended
January 31, 20171
(unaudited) | |
Net asset value, beginning of period | | | $10.00 | |
Net investment income | | | 0.06 | |
Net realized and unrealized gains (losses) on investments | | | 0.52 | |
| | | | |
Total from investment operations | | | 0.58 | |
Distributions to shareholders from | | | | |
Net investment income | | | (0.05 | ) |
Net asset value, end of period | | | $10.53 | |
Total return2 | | | 5.81 | % |
Ratios to average net assets (annualized) | | | | |
Gross expenses | | | 1.36 | % |
Net expenses | | | 0.40 | % |
Net investment income | | | 2.22 | % |
Supplemental data | | | | |
Portfolio turnover rate | | | 6 | % |
Net assets, end of period (000s omitted) | | | $1,059 | |
| 1 | For the period from October 31, 2016 (commencement of class operations) to January 31, 2017 |
| 2 | Returns for periods of less than one year are not annualized. |
The accompanying notes are an integral part of these financial statements.
| | | | |
| 18 | | Wells Fargo Low Volatility U.S. Equity Fund | | Financial highlights |
(For a share outstanding throughout the period)
| | | | |
| ADMINISTRATOR CLASS | | Period ended
January 31, 20171
(unaudited) | |
Net asset value, beginning of period | | | $10.00 | |
Net investment income | | | 0.05 | |
Net realized and unrealized gains (losses) on investments | | | 0.52 | |
| | | | |
Total from investment operations | | | 0.57 | |
Distributions to shareholders from | | | | |
Net investment income | | | (0.04 | ) |
Net asset value, end of period | | | $10.53 | |
Total return2 | | | 5.74 | % |
Ratios to average net assets (annualized) | | | | |
Gross expenses | | | 1.71 | % |
Net expenses | | | 0.75 | % |
Net investment income | | | 1.87 | % |
Supplemental data | | | | |
Portfolio turnover rate | | | 6 | % |
Net assets, end of period (000s omitted) | | | $106 | |
| 1 | For the period from October 31, 2016 (commencement of class operations) to January 31, 2017 |
| 2 | Returns for periods of less than one year are not annualized. |
The accompanying notes are an integral part of these financial statements.
| | | | | | |
| Financial highlights | | Wells Fargo Low Volatility U.S. Equity Fund | | | 19 | |
(For a share outstanding throughout the period)
| | | | |
| INSTITUTIONAL CLASS | | Period ended
January 31, 20171
(unaudited) | |
Net asset value, beginning of period | | | $10.00 | |
Net investment income | | | 0.06 | |
Net realized and unrealized gains (losses) on investments | | | 0.52 | |
| | | | |
Total from investment operations | | | 0.58 | |
Distributions to shareholders from | | | | |
Net investment income | | | (0.05 | ) |
Net asset value, end of period | | | $10.53 | |
Total return2 | | | 5.79 | % |
Ratios to average net assets (annualized) | | | | |
Gross expenses | | | 1.46 | % |
Net expenses | | | 0.50 | % |
Net investment income | | | 2.12 | % |
Supplemental data | | | | |
Portfolio turnover rate | | | 6 | % |
Net assets, end of period (000s omitted) | | | $25,574 | |
| 1 | For the period from October 31, 2016 (commencement of class operations) to January 31, 2017 |
| 2 | Returns for periods of less than one year are not annualized. |
The accompanying notes are an integral part of these financial statements.
| | | | |
| 20 | | Wells Fargo Low Volatility U.S. Equity Fund | | Notes to financial statements (unaudited) |
1. ORGANIZATION
Wells Fargo Funds Trust (the “Trust”), a Delaware statutory trust organized on March 10, 1999, is an open-end management investment company registered under the Investment Company Act of 1940, as amended (the “1940 Act”). As an investment company, the Trust follows the accounting and reporting guidance in Financial Accounting Standards Board (“FASB”) Accounting Standards Codification Topic 946, Financial Services – Investment Companies. These financial statements report on the Wells Fargo Low Volatility U.S. Equity Fund (the “Fund”) which is a diversified series of the Trust.
2. SIGNIFICANT ACCOUNTING POLICIES
The following significant accounting policies, which are consistently followed in the preparation of the financial statements of the Fund, are in conformity with U.S. generally accepted accounting principles which require management to make estimates and assumptions that affect the reported amounts of assets and liabilities, disclosure of contingent assets and liabilities at the date of the financial statements, and the reported amounts of revenues and expenses during the reporting period. Actual results could differ from those estimates.
Securities valuation
All investments are valued each business day as of the close of regular trading on the New York Stock Exchange (generally 4 p.m. Eastern Time), although the Fund may deviate from this calculation time under unusual or unexpected circumstances.
Equity securities that are listed on a foreign or domestic exchange or market are valued at the official closing price or, if none, the last sales price. If no sale occurs on the principal exchange or market that day, the prior day’s price will be deemed “stale” and a fair value price will be determined in accordance with the Fund’s Valuation Procedures.
Investments in registered open-end investment companies are valued at net asset value.
Investments which are not valued using any of the methods discussed above are valued at their fair value, as determined in good faith by the Board of Trustees of the Fund. The Board of Trustees has established a Valuation Committee comprised of the Trustees and has delegated to it the authority to take any actions regarding the valuation of portfolio securities that the Valuation Committee deems necessary or appropriate, including determining the fair value of portfolio securities, unless the determination has been delegated to the Management Valuation Team of Wells Fargo Funds Management, LLC (“Funds Management”). The Board of Trustees retains the authority to make or ratify any valuation decisions or approve any changes to the Valuation Procedures as it deems appropriate. On a quarterly basis, the Board of Trustees receives reports on any valuation actions taken by the Valuation Committee or the Management Valuation Team which may include items for ratification.
Valuations of fair valued securities are compared to the next actual sales price when available, or other appropriate market values, to assess the continued appropriateness of the fair valuation methodologies used. These securities are fair valued on a day-to-day basis, taking into consideration changes to appropriate market information and any significant changes to the inputs considered in the valuation process until there is a readily available price provided on an exchange or by an independent pricing service. Valuations received from an independent pricing service or independent broker-dealer quotes are periodically validated by comparisons to most recent trades and valuations provided by other independent pricing services in addition to the review of prices by the manager and/or subadviser. Unobservable inputs used in determining fair valuations are identified based on the type of security, taking into consideration factors utilized by market participants in valuing the investment, knowledge about the issuer and the current market environment.
Security transactions and income recognition
Securities transactions are recorded on a trade date basis. Realized gains or losses are recorded on the basis of identified cost.
Dividend income is recognized on the ex-dividend date. Dividend income is recorded net of foreign taxes withheld where recovery of such taxes is not assured.
Distributions to shareholders
Distributions to shareholders from net investment income and net realized gains, if any, are recorded on the ex-dividend date. Such distributions are determined in conformity with federal income tax regulations, which may differ in amount or character from net investment income and realized gains recognized for purposes of U.S. generally accepted accounting principles.
| | | | | | |
| Notes to financial statements (unaudited) | | Wells Fargo Low Volatility U.S. Equity Fund | | | 21 | |
Federal and other taxes
The Fund intends to continue to qualify as a regulated investment company by distributing substantially all of its investment company taxable income and any net realized capital gains (after reduction for capital loss carryforwards) sufficient to relieve it from all, or substantially all, federal income taxes. Accordingly, no provision for federal income taxes was required.
The Fund’s income and federal excise tax returns and all financial records supporting those returns for the prior three fiscal years are subject to examination by the federal and Delaware revenue authorities. Management has analyzed the Fund’s tax positions taken on federal, state, and foreign tax returns for all open tax years and does not believe that there are any uncertain tax positions that require recognition of a tax liability.
Class allocations
The separate classes of shares offered by the Fund differ principally in applicable sales charges, distribution, shareholder servicing, and administration fees. Class specific expenses are charged directly to that share class. Investment income, common expenses, and realized and unrealized gains (losses) on investments are allocated daily to each class of shares based on the relative proportion of net assets of each class.
3. FAIR VALUATION MEASUREMENTS
Fair value measurements of investments are determined within a framework that has established a fair value hierarchy based upon the various data inputs utilized in determining the value of the Fund’s investments. The three-level hierarchy gives the highest priority to unadjusted quoted prices in active markets for identical assets or liabilities (Level 1) and the lowest priority to significant unobservable inputs (Level 3). The Fund’s investments are classified within the fair value hierarchy based on the lowest level of input that is significant to the fair value measurement. The inputs are summarized into three broad levels as follows:
| ∎ | | Level 1 – quoted prices in active markets for identical securities |
| ∎ | | Level 2 – other significant observable inputs (including quoted prices for similar securities, interest rates, prepayment speeds, credit risk, etc.) |
| ∎ | | Level 3 – significant unobservable inputs (including the Fund’s own assumptions in determining the fair value of investments) |
The inputs or methodologies used for valuing investments in securities are not necessarily an indication of the risk associated with investing in those securities.
The following is a summary of the inputs used in valuing the Fund’s assets and liabilities as of January 31, 2017:
| | | | | | | | | | | | | | | | |
| | | Quoted prices
(Level 1) | | | Other significant
observable inputs
(Level 2) | | | Significant
unobservable inputs (Level 3) | | | Total | |
Assets | | | | | | | | | | | | | | | | |
Investments in: | | | | | | | | | | | | | | | | |
| | | | |
Common stocks | | | | | | | | | | | | | | | | |
Consumer discretionary | | $ | 2,566,971 | | | $ | 0 | | | $ | 0 | | | $ | 2,566,971 | |
Consumer staples | | | 7,892,194 | | | | 0 | | | | 0 | | | | 7,892,194 | |
Financials | | | 4,559,607 | | | | 0 | | | | 0 | | | | 4,559,607 | |
Health care | | | 3,173,152 | | | | 0 | | | | 0 | | | | 3,173,152 | |
Industrials | | | 2,627,915 | | | | 0 | | | | 0 | | | | 2,627,915 | |
Information technology | | | 2,698,313 | | | | 0 | | | | 0 | | | | 2,698,313 | |
Materials | | | 102,494 | | | | 0 | | | | 0 | | | | 102,494 | |
Real estate | | | 584,846 | | | | 0 | | | | 0 | | | | 584,846 | |
Telecommunication services | | | 601,843 | | | | 0 | | | | 0 | | | | 601,843 | |
Utilities | | | 1,145,889 | | | | 0 | | | | 0 | | | | 1,145,889 | |
| | | | |
Short-term investments | | | | | | | | | | | | | | | | |
Investment companies | | | 1,384,333 | | | | 0 | | | | 0 | | | | 1,384,333 | |
Total assets | | $ | 27,337,557 | | | $ | 0 | | | $ | 0 | | | $ | 27,337,557 | |
| | | | |
| 22 | | Wells Fargo Low Volatility U.S. Equity Fund | | Notes to financial statements (unaudited) |
The Fund recognizes transfers between levels within the fair value hierarchy at the end of the reporting period. At January 31, 2017, the Fund did not have any transfers into/out of Level 1, Level 2, or Level 3.
4. TRANSACTIONS WITH AFFILIATES AND OTHER EXPENSES
Management fee
Funds Management, an indirect wholly owned subsidiary of Wells Fargo & Company (“Wells Fargo”), is the manager of the Fund and provides advisory and fund-level administrative services under an investment management agreement. Under the investment management agreement, Funds Management is responsible for, among other services, implementing the investment objectives and strategies of the Fund, supervising the subadviser, providing fund-level administrative services in connection with the Fund’s operations, and providing any other fund-level administrative services reasonably necessary for the operation of the Fund. As compensation for its services under the investment management agreement, Funds Management is entitled to receive an annual management fee starting at 0.40% and declining to 0.33% as the average daily net assets of the Fund increase. For the period from October 31, 2016 to January 31, 2017, the management fee was equivalent to an annual rate of 0.40% of the Fund’s average daily net assets.
Funds Management has retained the services of a subadviser to provide daily portfolio management to the Fund. The fee for subadvisory services is borne by Funds Management. Analytic Investors, LLC, which is not an affiliate of Funds Management, is the subadviser to the Fund and is entitled to receive a fee from Funds Management at an annual rate starting at 0.20% and declining to 0.12% as the average daily net assets of the Fund increase.
Administration fees
Under a class-level administration agreement, Funds Management provides class-level administrative services to the Fund, which includes paying fees and expenses for services provided by the transfer agent, sub-transfer agents, omnibus account servicers and record-keepers. As compensation for its services under the class-level administration agreement, Funds Management receives an annual fee which is calculated based on the average daily net assets of each class as follows:
| | | | |
| | | Class-level
administration fee | |
Class A, Class C, Class R | | | 0.21 | % |
Class R6 | | | 0.03 | |
Administrator Class, Institutional Class | | | 0.13 | |
Funds Management has contractually waived and/or reimbursed management and administration fees to the extent necessary to maintain certain net operating expense ratios for the Fund. Waiver of fees and/or reimbursement of expenses by Funds Management were made first from fund level expenses on a proportionate basis and then from class specific expenses. Funds Management has committed through November 30, 2017 to waive fees and/or reimburse expenses to the extent necessary to cap the Fund’s expenses at 0.83% for Class A shares, 1.58% for Class C shares, 1.08% for Class R shares, 0.40% for Class R6 shares, 0.75% for Administrator Class shares, and 0.50% for Institutional Class shares. After this time, the cap may be increased or the commitment to maintain the cap may be terminated only with the approval of the Board of Trustees.
Distribution fees
The Trust has adopted a distribution plan for Class C and Class R shares of the Fund pursuant to Rule 12b-1 under the 1940 Act. Distribution fees are charged to Class C and Class R shares and paid to Wells Fargo Funds Distributor, LLC (“Funds Distributor”), the principal underwriter, at an annual rate of 0.75% of the average daily net assets of Class C shares and 0.25% of the average daily net assets of Class R shares.
In addition, Funds Distributor is entitled to receive the front-end sales charge from the purchase of Class A shares and a contingent deferred sales charge on the redemption of certain Class A shares. Funds Distributor is also entitled to receive the contingent deferred sales charges from redemptions of Class C shares.
Shareholder servicing fees
The Trust has entered into contracts with one or more shareholder servicing agents, whereby Class A, Class C, Class R, and Administrator Class of the Fund are charged a fee at an annual rate of 0.25% of the average daily net assets of each respective class.
A portion of these total shareholder servicing fees were paid to affiliates of Wells Fargo.
| | | | | | |
| Notes to financial statements (unaudited) | | Wells Fargo Low Volatility U.S. Equity Fund | | | 23 | |
5. INVESTMENT PORTFOLIO TRANSACTIONS
Purchases and sales of investments, excluding U.S. government obligations (if any) and short-term securities, for the period from October 31, 2016 to January 31, 2017 were $26,199,401 and $1,570,973, respectively.
The Fund may purchase or sell investment securities to other Wells Fargo funds under procedures adopted by the Board of Trustees. The procedures have been designed to ensure that these interfund transactions, which generally do not incur broker commissions, are effected at current market prices. Interfund trades are included within the respective purchases and sales amounts shown.
6. CONCENTRATION RISK
Concentration risks result from exposure to a limited number of sectors. A fund that invests a substantial portion of its assets in any sector may be more affected by changes in that sector than would be a fund whose investments are not heavily weighted in any sector.
7. INDEMNIFICATION
Under the Trust’s organizational documents, the officers and Trustees have been granted certain indemnification rights against certain liabilities that may arise out of performance of their duties to the Trust. Additionally, in the normal course of business, the Trust may enter into contracts with service providers that contain a variety of indemnification clauses. The Trust’s maximum exposure under these arrangements is dependent on future claims that may be made against the Fund and, therefore, cannot be estimated.
8. NEW ACCOUNTING PRONOUNCEMENT
In December 2016, the Financial Accounting Standards Board (“FASB”) issued Accounting Standard Update (“ASU”) No. 2016-19, Technical Corrections and Improvements. ASU 2016-19 includes an amendment to FASB ASC Topic 820, Fair Value Measurement which clarifies the difference between a valuation approach and a valuation technique. The amendment also requires an entity to disclose when there has been a change in either or both a valuation approach and/or a valuation technique. The disclosure requirements are effective for fiscal years and interim periods within those fiscal years beginning after December 15, 2016. Management is currently evaluating the potential impact of this new guidance to the financial statements.
9. REGULATORY CHANGES
In October 2016, the Securities and Exchange Commission (“SEC”) adopted new rules and forms and amended existing rules and forms (together, “final rules”) intended to modernize and enhance the reporting and disclosure of information by registered investment companies and to enhance liquidity risk management by open-end mutual funds and exchange-traded funds. The final rules will enhance the quality of information available to investors and will allow the SEC to more effectively collect and use data reported by funds. In part, the final rules amend Regulation S-X and require standardized, enhanced disclosure about derivatives in the Fund’s financial statements, as well as other amendments. The compliance date for the amendments to Regulation S-X is August 1, 2017 while the compliance date for the new form types is June 1, 2018 and the compliance date for the liquidity risk management program requirements is December 1, 2018. Management is currently assessing the potential impact of these enhancements and their impact on the financial statement disclosures and reporting requirements.
| | | | |
| 24 | | Wells Fargo Low Volatility U.S. Equity Fund | | Other information (unaudited) |
PROXY VOTING INFORMATION
A description of the policies and procedures that the Fund uses to determine how to vote proxies relating to portfolio securities is available, upon request, by calling 1-800-222-8222, visiting our website at wellsfargofunds.com, or visiting the SEC website at sec.gov. Information regarding how the Fund voted proxies relating to portfolio securities during the most recent 12-month period ended June 30 is available on the Fund’s website at wellsfargofunds.com or by visiting the SEC website at sec.gov.
PORTFOLIO HOLDINGS INFORMATION
The complete portfolio holdings for the Fund are publicly available monthly on the Fund’s website (wellsfargofunds.com), on a one-month delayed basis. In addition, top ten holdings information (excluding derivative positions) for the Fund is publicly available on the Fund’s website on a monthly, seven-day or more delayed basis. The Fund files its complete schedule of portfolio holdings with the SEC for the first and third quarters of each fiscal year on Form N-Q, which is available by visiting the SEC website at sec.gov. In addition, the Fund’s Form N-Q may be reviewed and copied at the SEC’s Public Reference Room in Washington, DC, and at regional offices in New York City, at 233 Broadway, and in Chicago, at 175 West Jackson Boulevard, Suite 900. Information about the Public Reference Room may be obtained by calling 1-800-SEC-0330.
| | | | | | |
| Other information (unaudited) | | Wells Fargo Low Volatility U.S. Equity Fund | | | 25 | |
BOARD OF TRUSTEES AND OFFICERS
Each of the Trustees and Officers1 listed in the table below acts in identical capacities for each fund in the Wells Fargo family of funds, which consists of 138 mutual funds comprising the Wells Fargo Funds Trust, Wells Fargo Variable Trust, Wells Fargo Master Trust and four closed-end funds (collectively the “Fund Complex”). This table should be read in conjunction with the Prospectus and the Statement of Additional Information2. The mailing address of each Trustee and Officer is 525 Market Street, 12th Floor, San Francisco, CA 94105. Each Trustee and Officer serves an indefinite term, however, each Trustee serves such term until reaching the mandatory retirement age established by the Trustees.
Independent Trustees
| | | | | | |
Name and year of birth | | Position held and
length of service* | | Principal occupations during past five years or longer | | Current other public company or investment company
directorships |
William R. Ebsworth (Born 1957) | | Trustee, since 2015 | | Retired. From 1984 to 2013, equities analyst, portfolio manager, research director and chief financial officer at Fidelity Management and Research Company in Boston, Tokyo, and Hong Kong and retired in 2013 as Chief Investment Officer of Fidelity Strategic Advisers, Inc. where he lead a team of investment professionals managing client assets. Prior thereto, Board member of Hong Kong Securities Clearing Co., Hong Kong Options Clearing Corp., the Thailand International Fund, Ltd., Fidelity Investments Life Insurance Company, and Empire Fidelity Investments Life Insurance Company. Board member of the Fonté Foundation (non-profit organization) and the Vincent Memorial Hospital Endowment (non-profit organization), where he serves on the Investment Committee and as a Chair of the Audit Committee. Mr. Ebsworth is a CFA® charterholder and an Adjunct Lecturer, Finance, at Babson College. | | Asset Allocation Trust |
Jane A. Freeman (Born 1953) | | Trustee, since 2015 | | Retired. From 2012 to 2014 and 1999 to 2008, Chief Financial Officer of Scientific Learning Corporation. From 2008 to 2012, Ms. Freeman provided consulting services related to strategic business projects. Prior to 1999, Portfolio Manager at Rockefeller & Co. and Scudder, Stevens & Clark. Board member of the Harding Loevner Funds from 1996 to 2014, serving as both Lead Independent Director and chair of the Audit Committee. Board member of the Russell Exchange Traded Funds Trust from 2011 to 2012 and the chair of the Audit Committee. Ms. Freeman is Chair of Taproot Foundation (non-profit organization), a Board Member of Ruth Bancroft Garden (non-profit organization) and an inactive chartered financial analyst. | | Asset Allocation Trust |
Peter G. Gordon** (Born 1942) | | Trustee, since 1998; Chairman, since 2005 | | Co-Founder, Retired Chairman, President and CEO of Crystal Geyser Water Company. Trustee Emeritus, Colby College. | | Asset Allocation Trust |
Isaiah Harris, Jr. (Born 1952) | | Trustee, since 2009 | | Retired. Chairman of the Board of CIGNA Corporation since 2009, and Director since 2005. From 2003 to 2011, Director of Deluxe Corporation. Prior thereto, President and CEO of BellSouth Advertising and Publishing Corp. from 2005 to 2007, President and CEO of BellSouth Enterprises from 2004 to 2005 and President of BellSouth Consumer Services from 2000 to 2003. Emeritus member of the Iowa State University Foundation Board of Governors. Emeritus Member of the Advisory Board of Iowa State University School of Business. Advisory Board Member, Palm Harbor Academy (charter school). Advisory Board Member, Child Evangelism Fellowship (non-profit). Mr. Harris is a certified public accountant (inactive status). | | CIGNA Corporation; Asset Allocation Trust |
Judith M. Johnson (Born 1949) | | Trustee, since 2008; Audit Committee Chairman, since 2008 | | Retired. Prior thereto, Chief Executive Officer and Chief Investment Officer of Minneapolis Employees Retirement Fund from 1996 to 2008. Ms. Johnson is an attorney, certified public accountant and a certified managerial accountant. | | Asset Allocation Trust |
David F. Larcker (Born 1950) | | Trustee, since 2009 | | James Irvin Miller Professor of Accounting at the Graduate School of Business, Stanford University, Director of the Corporate Governance Research Initiative and Senior Faculty of The Rock Center for Corporate Governance since 2006. From 2005 to 2008, Professor of Accounting at the Graduate School of Business, Stanford University. Prior thereto, Ernst & Young Professor of Accounting at The Wharton School, University of Pennsylvania from 1985 to 2005. | | Asset Allocation Trust |
| | | | |
| 26 | | Wells Fargo Low Volatility U.S. Equity Fund | | Other information (unaudited) |
| | | | | | |
Name and year of birth | | Position held and
length of service* | | Principal occupations during past five years or longer | | Current other public company or investment company
directorships |
Olivia S. Mitchell (Born 1953) | | Trustee, since 2006 | | International Foundation of Employee Benefit Plans Professor, Wharton School of the University of Pennsylvania since 1993. Director of Wharton’s Pension Research Council and Boettner Center on Pensions & Retirement Research, and Research Associate at the National Bureau of Economic Research. Previously, Cornell University Professor from 1978 to 1993. | | Asset Allocation Trust |
Timothy J. Penny (Born 1951) | | Trustee, since 1996 | | President and Chief Executive Officer of Southern Minnesota Initiative Foundation, a non-profit organization, since 2007 and Senior Fellow at the Humphrey Institute Policy Forum at the University of Minnesota since 1995. Member of the Board of Trustees of NorthStar Education Finance, Inc., a non-profit organization, since 2007. | | Asset Allocation Trust |
Michael S. Scofield (Born 1943) | | Trustee, since 2010 | | Served on the Investment Company Institute’s Board of Governors and Executive Committee from 2008-2011 as well the Governing Council of the Independent Directors Council from 2006-2011 and the Independent Directors Council Executive Committee from 2008-2011. Chairman of the IDC from 2008-2010. Institutional Investor (Fund Directions) Trustee of Year in 2007. Trustee of the Evergreen Funds complex (and its predecessors) from 1984 to 2010. Chairman of the Evergreen Funds from 2000-2010. Former Trustee of the Mentor Funds. Retired Attorney, Law Offices of Michael S. Scofield. | | Asset Allocation Trust |
| * | Length of service dates reflect the Trustee’s commencement of service with the Trust’s predecessor entities, where applicable. |
| ** | Peter Gordon is expected to retire on December 31, 2017. |
Officers
| | | | | | |
Name and year of birth | | Position held and length of service | | Principal occupations during past five years or longer | | |
Andrew Owen (Born 1960) | | President, since 2017 | | Executive Vice President of Wells Fargo Bank, N.A. and President of Wells Fargo & Company and Head of Affiliated Managers, Wells Fargo Asset Management, since 2014. Executive Vice President responsible for marketing, investments and product development for Wells Fargo Funds Management, LLC, from 2009 to 2014. | | |
Jeremy DePalma1 (Born 1974) | | Treasurer, since 2012 | | Senior Vice President of Wells Fargo Funds Management, LLC since 2009. Senior Vice President of Evergreen Investment Management Company, LLC from 2008 to 2010 and head of the Fund Reporting and Control Team within Fund Administration from 2005 to 2010. | | |
C. David Messman (Born 1960) | | Secretary, since 2000; Chief Legal Officer, since 2003 | | Senior Vice President and Secretary of Wells Fargo Funds Management, LLC since 2001. Assistant General Counsel of Wells Fargo Bank, N.A. since 2013 and Vice President and Managing Counsel of Wells Fargo Bank, N.A. from 1996 to 2013. | | |
Michael Whitaker (Born 1967) | | Chief Compliance Officer, since 2016 | | Executive Vice President of Wells Fargo Funds Management, LLC since 2016. Chief Compliance Officer of Fidelity’s Fixed Income Funds and Asset Allocation Funds from 2008 to 2016, Compliance Officer of FMR Co., Inc. from 2014 to 2016, Fidelity Investments Money Management, Inc. from 2014 to 2016, Fidelity Investments from 2007 to 2016. | | |
David Berardi (Born 1975) | | Assistant Treasurer, since 2009 | | Vice President of Wells Fargo Funds Management, LLC since 2009. Vice President of Evergreen Investment Management Company, LLC from 2008 to 2010. Manager of Fund Reporting and Control for Evergreen Investment Management Company, LLC from 2004 to 2010. | | |
| 1 | Jeremy DePalma acts as Treasurer of 69 funds and Assistant Treasurer of 69 funds in the Fund Complex. |
| 2 | The Statement of Additional Information includes additional information about the Trustees and is available, without charge, upon request, by calling 1-800-222-8222 or by visiting the website at wellsfargofunds.com. |
| | | | | | |
| List of abbreviations | | Wells Fargo Low Volatility U.S. Equity Fund | | | 27 | |
The following is a list of common abbreviations for terms and entities that may have appeared in this report.
| ACA | — ACA Financial Guaranty Corporation |
| ADR | — American depositary receipt |
| ADS | — American depositary shares |
| AGC | — Assured Guaranty Corporation |
| AGM | — Assured Guaranty Municipal |
| Ambac | — Ambac Financial Group Incorporated |
| AMT | — Alternative minimum tax |
| BAN | — Bond anticipation notes |
| BHAC | — Berkshire Hathaway Assurance Corporation |
| CAB | — Capital appreciation bond |
| CCAB | — Convertible capital appreciation bond |
| CDA | — Community Development Authority |
| CDO | — Collateralized debt obligation |
| DRIVER | — Derivative inverse tax-exempt receipts |
| DW&P | — Department of Water & Power |
| DWR | — Department of Water Resources |
| ECFA | — Educational & Cultural Facilities Authority |
| EDA | — Economic Development Authority |
| EDFA | — Economic Development Finance Authority |
| ETF | — Exchange-traded fund |
| FDIC | — Federal Deposit Insurance Corporation |
| FFCB | — Federal Farm Credit Banks |
| FGIC | — Financial Guaranty Insurance Corporation |
| FHA | — Federal Housing Administration |
| FHLB | — Federal Home Loan Bank |
| FHLMC | — Federal Home Loan Mortgage Corporation |
| FICO | — The Financing Corporation |
| FNMA | — Federal National Mortgage Association |
| GDR | — Global depositary receipt |
| GNMA | — Government National Mortgage Association |
| HCFR | — Healthcare facilities revenue |
| HEFA | — Health & Educational Facilities Authority |
| HEFAR | — Higher education facilities authority revenue |
| HFA | — Housing Finance Authority |
| HFFA | — Health Facilities Financing Authority |
| HUD | — Department of Housing and Urban Development |
| IDA | — Industrial Development Authority |
| IDAG | — Industrial Development Agency |
| KRW | — Republic of Korea won |
| LIBOR | — London Interbank Offered Rate |
| LIFER | — Long Inverse Floating Exempt Receipts |
| LLC | — Limited liability company |
| LLLP | — Limited liability limited partnership |
| LLP | — Limited liability partnership |
| MBIA | — Municipal Bond Insurance Association |
| MFHR | — Multifamily housing revenue |
| MSTR | — Municipal securities trust receipts |
| MUD | — Municipal Utility District |
| National | — National Public Finance Guarantee Corporation |
| PCFA | — Pollution Control Financing Authority |
| PCL | — Public Company Limited |
| PCR | — Pollution control revenue |
| PFA | — Public Finance Authority |
| PFFA | — Public Facilities Financing Authority |
| PFOTER | — Puttable floating option tax-exempt receipts |
| plc | — Public limited company |
| PUTTER | — Puttable tax-exempt receipts |
| R&D | — Research & development |
| Radian | — Radian Asset Assurance |
| RAN | — Revenue anticipation notes |
| RDA | — Redevelopment Authority |
| RDFA | — Redevelopment Finance Authority |
| REIT | — Real estate investment trust |
| ROC | — Reset option certificates |
| SAVRS | — Select auction variable rate securities |
| SBA | — Small Business Authority |
| SDR | — Swedish depositary receipt |
| SFHR | — Single-family housing revenue |
| SFMR | — Single-family mortgage revenue |
| SPA | — Standby purchase agreement |
| SPDR | — Standard & Poor’s Depositary Receipts |
| SPEAR | — Short Puttable Exempt Adjustable Receipts |
| STRIPS | — Separate trading of registered interest and |
| TAN | — Tax anticipation notes |
| TIPS | — Treasury inflation-protected securities |
| TRAN | — Tax revenue anticipation notes |
| TTFA | — Transportation Trust Fund Authority |
| TVA | — Tennessee Valley Authority |
This page is intentionally left blank.

For more information
More information about Wells Fargo Funds is available free upon request. To obtain literature, please write, email, visit the Fund’s website, or call:
Wells Fargo Funds
P.O. Box 8266
Boston, MA 02266-8266
Email: fundservice@wellsfargo.com
Website: wellsfargofunds.com
Individual investors: 1-800-222-8222
Retail investment professionals: 1-888-877-9275
Institutional investment professionals: 1-866-765-0778
This report and the financial statements contained herein are submitted for the general information of the shareholders of the Fund. If this report is used for promotional purposes, distribution of the report must be accompanied or preceded by a current prospectus. Before investing, please consider the investment objectives, risks, charges, and expenses of the investment. For a current prospectus and, if available, a summary prospectus, containing this information, call 1-800-222-8222 or visit the Fund’s website at wellsfargofunds.com. Read the prospectus carefully before you invest or send money.
Wells Fargo Asset Management (WFAM) is a trade name used by the asset management businesses of Wells Fargo & Company. Wells Fargo Funds Management, LLC, a wholly owned subsidiary of Wells Fargo & Company, provides investment advisory and administrative services for Wells Fargo Funds. Other affiliates of Wells Fargo & Company provide subadvisory and other services for the funds. The funds are distributed by Wells Fargo Funds Distributor, LLC, Member FINRA, an affiliate of Wells Fargo & Company. Neither Wells Fargo Funds Management nor Wells Fargo Funds Distributor has Fund customer accounts/assets, and neither provides investment advice/recommendations or acts as an investment advice fiduciary to any investor.
NOT FDIC INSURED ◾ NO BANK GUARANTEE ◾ MAY LOSE VALUE
© 2017 Wells Fargo Funds Management, LLC. All rights reserved.
| | |
 | | 301463 03-17 SA270/SAR270 01-17 |
Semi-Annual Report
January 31, 2017

Wells Fargo Omega Growth Fund


Reduce clutter. Save trees.
Sign up for electronic delivery of prospectuses and shareholder reports at wellsfargo.com/advantagedelivery
Contents
The views expressed and any forward-looking statements are as of January 31, 2017, unless otherwise noted, and are those of the Fund managers and/or Wells Fargo Funds Management, LLC. Discussions of individual securities, or the markets generally, or any Wells Fargo Fund are not intended as individual recommendations. Future events or results may vary significantly from those expressed in any forward-looking statements. The views expressed are subject to change at any time in response to changing circumstances in the market. Wells Fargo Funds Management, LLC and the Fund disclaim any obligation to publicly update or revise any views expressed or forward-looking statements.
NOT FDIC INSURED ◾ NO BANK GUARANTEE ◾ MAY LOSE VALUE
| | | | |
| 2 | | Wells Fargo Omega Growth Fund | | Letter to shareholders (unaudited) |

Andrew Owen
President
Wells Fargo Funds
U.S. and international stocks returned 5.96% and 4.16% for the six-month period, respectively; within fixed income, the Bloomberg Barclays U.S. Aggregate Bond Index3 returned -2.95%.
Dear Shareholder:
As the new president of Wells Fargo Funds now that Karla Rabusch is retiring from that position after nearly 14 years, I am pleased to offer you this semi-annual report for the Wells Fargo Omega Growth Fund for the six-month period that ended January 31, 2017. Despite heightened market volatility, global stocks delivered favorable results overall. U.S. and international stocks returned 5.96% and 4.16% for the six-month period, respectively, as measured by the S&P 500 Index1 and the MSCI ACWI ex USA Index (Net)2; within fixed income, the Bloomberg Barclays U.S. Aggregate Bond Index3 returned -2.95%.
In August–September 2016, global stocks delivered generally positive results; bonds’ interest rates remained historically low.
From August into early September 2016, U.S. and international stocks generally trended upward. Ever since the Great Recession, markets worldwide have been supported to varying degrees by accommodative policies from leading central banks, including the Federal Reserve (Fed), European Central Bank, Bank of England, and Bank of Japan. As a result, investors have watched closely for any signs that global central banks might tighten their measures. In the U.S., early-September comments by several Fed officials appeared to suggest a September interest-rate increase, which sent stock and bond prices downward. However, stocks surged following the Fed’s September 20 meeting on news that the Fed had decided to delay a rate increase to later in 2016. In bond markets, interest rates remained at historically low levels as a result of easy monetary policies, subdued global growth, and modest inflation expectations. Yields rose, after bottoming in July, as market participants felt that yields had overshot the real risks of the U.K.’s Brexit vote and as economic activity strengthened. At the front end of the yield curve, anticipation of new money market fund rules resulted in significantly higher yields on many short-term securities.
During the fourth quarter of 2016, prospects for faster growth and higher interest rates in the U.S. largely influenced the markets.
Early in the fourth quarter of 2016, U.S. stocks tended to trade lower amid concerns such as a likely interest-rate increase and uncertainty over the approaching general election. However, following Donald Trump’s election as president in early November, U.S. stocks began to rally. Investors appeared optimistic that the new administration would usher in a series of pro-growth policies, and supportive economic news helped the rally carry through the quarter. The buoyant environment sent interest rates higher as well. At its mid-December meeting, Fed officials raised their short-term target interest rate for the first time in a year, by a quarter percentage point, to between 0.50% and 0.75%. The fourth quarter also saw the implementation of the Securities and Exchange Commission’s new rules for money market funds, which included floating net asset values (NAVs) for institutional prime and municipal money market funds as well as liquidity fees and redemption gates. In the year leading up to
| 1 | The S&P 500 Index consists of 500 stocks chosen for market size, liquidity, and industry group representation. It is a market-value-weighted index with each stock’s weight in the index proportionate to its market value. You cannot invest directly in an index. |
| 2 | The Morgan Stanley Capital International (MSCI) All Country World Index (ACWI) ex USA Index (Net) is a free-float-adjusted market-capitalization-weighted index that is designed to measure the equity market performance of developed markets, excluding the United States and Canada. Source: MSCI. MSCI makes no express or implied warranties or representations and shall have no liability whatsoever with respect to any MSCI data contained herein. The MSCI data may not be further redistributed or used as a basis for other indexes or any securities or financial products. This report is not approved, reviewed, or produced by MSCI. You cannot invest directly in an index. |
| 3 | The Bloomberg Barclays U.S. Aggregate Bond Index (formerly known as Barclays U.S. Aggregate Bond Index) is a broad-based benchmark that measures the investment-grade, U.S. dollar–denominated, fixed-rate taxable bond market, including Treasuries, government-related and corporate securities, mortgage-backed securities (agency fixed-rate and hybrid adjustable-rate mortgage pass-throughs), asset-backed securities, and commercial mortgage-backed securities. You cannot invest directly in an index. |
| | | | | | |
| Letter to shareholders (unaudited) | | Wells Fargo Omega Growth Fund | | | 3 | |
money fund reform implementation, nearly $1 trillion in assets moved from these types of money market funds into government money market funds, which continued to transact at a stable $1 NAV. Outside of the U.S., the prospects for faster U.S. growth appeared to trigger some acceleration in Europe. The improvement may be partly attributable to expectations for further strengthening of the U.S. dollar, which in turn could improve demand for European goods in the U.S. due to weakening of the euro relative to the dollar.
Investor optimism continued into January 2017.
January brought continued strength in global stock markets. Markets were lifted by factors such as strong trade data from Japan, robust earnings reports by businesses, and investors’ hopes that the U.S. government will approve a large fiscal stimulus package.
Don’t let short-term uncertainty derail long-term investment goals.
Periods of uncertainty can present challenges, but experience has taught us that maintaining long-term investment goals can be an effective way to plan for the future. To help you create a sound strategy based on your personal goals and risk tolerance, Wells Fargo Funds offers more than 100 mutual funds spanning a wide range of asset classes and investment styles. Although diversification cannot guarantee an investment profit or prevent losses, we believe it can be an effective way to manage investment risk and potentially smooth out overall portfolio performance. We encourage investors to know their investments and to understand that appropriate levels of risk-taking may unlock opportunities.
Thank you for choosing to invest in Wells Fargo Funds. We appreciate your confidence in us and remain committed to helping you meet your financial needs.
Sincerely,

Andrew Owen
President
Wells Fargo Funds
Although diversification cannot guarantee an investment profit or prevent losses, we believe it can be an effective way to manage investment risk and potentially smooth out overall portfolio performance.
For further information about your Fund, contact your investment professional, visit our website at wellsfargofunds.com, or call us directly at 1-800-222-8222. We are available 24 hours a day, 7 days a week.
| | | | |
| 4 | | Wells Fargo Omega Growth Fund | | Performance highlights (unaudited) |
Investment objective
The Fund seeks long-term capital appreciation.
Manager
Wells Fargo Funds Management, LLC
Subadviser
Wells Capital Management Incorporated
Portfolio managers
Michael T. Smith, CFA®
Chrisopher J. Warner, CFA®
Average annual total returns (%) as of January 31, 20171
| | | | | | | | | | | | | | | | | | | | | | | | | | | | | | | | | | |
| | | | | Including sales charge | | | Excluding sales charge | | | Expense ratios2 (%) | |
| | | Inception date | | 1 year | | | 5 year | | | 10 year | | | 1 year | | | 5 year | | | 10 year | | | Gross | | | Net3 | |
| Class A (EKOAX) | | 4-29-1968 | | | 8.34 | | | | 9.93 | | | | 8.14 | | | | 14.95 | | | | 11.24 | | | | 8.78 | | | | 1.28 | | | | 1.28 | |
| Class B (EKOBX)* | | 8-2-1993 | | | 9.08 | | | | 10.14 | | | | 8.21 | | | | 14.08 | | | | 10.41 | | | | 8.21 | | | | 2.03 | | | | 2.03 | |
| Class C (EKOCX) | | 8-2-1993 | | | 13.06 | | | | 10.41 | | | | 7.97 | | | | 14.06 | | | | 10.41 | | | | 7.97 | | | | 2.03 | | | | 2.03 | |
| Class R (EKORX) | | 10-10-2003 | | | – | | | | – | | | | – | | | | 14.65 | | | | 10.96 | | | | 8.51 | | | | 1.53 | | | | 1.53 | |
| Administrator Class (EOMYX) | | 1-13-1997 | | | – | | | | – | | | | – | | | | 15.15 | | | | 11.50 | | | | 9.04 | | | | 1.20 | | | | 1.10 | |
| Institutional Class (EKONX) | | 7-30-2010 | | | – | | | | – | | | | – | | | | 15.45 | | | | 11.78 | | | | 9.22 | | | | 0.95 | | | | 0.85 | |
| Russell 3000® Growth Index4 | | – | | | – | | | | – | | | | – | | | | 17.91 | | | | 13.81 | | | | 8.36 | | | | – | | | | – | |
| * | | Class B shares are closed to investment, except in connections with reinvestment of any distributions and permitted exchanges. |
Figures quoted represent past performance, which is no guarantee of future results, and do not reflect taxes that a shareholder may pay on fund distributions or the redemption of fund shares. Investment return and principal value of an investment will fluctuate so that an investor’s shares, when redeemed, may be worth more or less than their original cost. Performance shown without sales charges would be lower if sales charges were reflected. Current performance may be lower or higher than the performance data quoted, which assumes the reinvestment of dividends and capital gains. Current month-end performance is available on the Fund’s website, wellsfargofunds.com.
Index returns do not include transaction costs associated with buying and selling securities, any mutual fund fees or expenses, or any taxes. It is not possible to invest directly in an index.
For Class A shares, the maximum front-end sales charge is 5.75%. For Class B shares, the maximum contingent deferred sales charge is 5.00%. For Class C shares, the maximum contingent deferred sales charge is 1.00%. Performance including a contingent deferred sales charge assumes the sales charge for the corresponding time period. Class R, Administrator Class, and Institutional Class shares are sold without a front-end sales charge or contingent deferred sales charge.
Stock values fluctuate in response to the activities of individual companies and general market and economic conditions. Certain investment strategies tend to increase the total risk of an investment (relative to the broader market). The Fund is exposed to foreign investment risk and smaller-company securities risk. Consult the Fund’s prospectus for additional information on these and other risks.
Please see footnotes on page 5.
| | | | | | |
| Performance highlights (unaudited) | | Wells Fargo Omega Growth Fund | | | 5 | |
| | | | |
| Ten largest holdings (%) as of January 31, 20175 | |
Amazon.com Incorporated | | | 5.22 | |
Alphabet Incorporated Class A | | | 3.71 | |
Visa Incorporated Class A | | | 3.26 | |
The Home Depot Incorporated | | | 2.99 | |
UnitedHealth Group Incorporated | | | 2.93 | |
Waste Connections Incorporated | | | 2.78 | |
Celgene Corporation | | | 2.65 | |
Microsoft Corporation | | | 2.48 | |
Alphabet Incorporated Class C | | | 2.47 | |
Facebook Incorporated Class A | | | 2.45 | |
|
| Sector distribution as of January 31, 20176 |
|
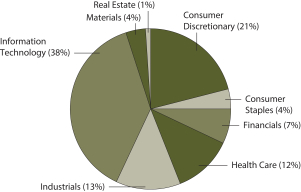
|
| 1 | Historical performance shown for Institutional Class shares prior to their inception reflects the performance of Administrator Class shares, and includes the higher expenses applicable to Administrator Class shares. If these expenses had not been included, returns would be higher. Historical performance shown for all classes of the Fund prior to July 19, 2010, is based on the performance of the Fund’s predecessor, Evergreen Omega Fund. |
| 2 | Reflects the expense ratios as stated in the most recent prospectuses. The expense ratios shown are subject to change and may differ from the annualized expense ratios shown in the financial highlights of this report. |
| 3 | The manager has contractually committed through November 30, 2017, to waive fees and/or reimburse expenses to the extent necessary to cap the Fund’s Total Annual Fund Operating Expenses After Fee Waiver at 1.30% for Class A, 2.05% for Class B, 2.05% for Class C, 1.55% for Class R, 1.10% for Administrator Class, and 0.85% for Institutional Class. After this time, the cap may be increased or the commitment to maintain the cap may be terminated only with the approval of the Board of Trustees. Brokerage commissions, stamp duty fees, interest, taxes, acquired fund fees and expenses, and extraordinary expenses are excluded from the expense cap. Without this cap, the Fund’s returns would have been lower. |
| 4 | The Russell 3000® Growth Index measures the performance of those Russell 3000® Index companies with higher price/book ratios and higher forecasted growth values. You cannot invest directly in an index. |
| 5 | The ten largest holdings, excluding cash and cash equivalents, are calculated based on the value of the investments divided by total net assets of the Fund. Holdings are subject to change and may have changed since the date specified. |
| 6 | Amounts are calculated based on the total long-term investments of the Fund. These amounts are subject to change and may have changed since the date specified. |
| | | | |
| 6 | | Wells Fargo Omega Growth Fund | | Fund expenses (unaudited) |
As a shareholder of the Fund, you incur two types of costs: (1) transaction costs, including sales charges (loads) on purchase payments and contingent deferred sales charges (if any) on redemptions and (2) ongoing costs, including management fees, distribution (12b-1) and/or shareholder servicing fees, and other Fund expenses. This example is intended to help you understand your ongoing costs (in dollars) of investing in the Fund and to compare these costs with the ongoing costs of investing in other mutual funds.
The example is based on an investment of $1,000 invested at the beginning of the six-month period and held for the entire period from August 1, 2016 to January 31, 2017.
Actual expenses
The “Actual” line of the table below provides information about actual account values and actual expenses. You may use the information in this line, together with the amount you invested, to estimate the expenses that you paid over the period. Simply divide your account value by $1,000 (for example, an $8,600 account value divided by $1,000 = 8.6), then multiply the result by the number in the “Actual” line under the heading entitled “Expenses paid during period” for your applicable class of shares to estimate the expenses you paid on your account during this period.
Hypothetical example for comparison purposes
The “Hypothetical” line of the table below provides information about hypothetical account values and hypothetical expenses based on the Fund’s actual expense ratio and an assumed rate of return of 5% per year before expenses, which is not the Fund’s actual return. The hypothetical account values and expenses may not be used to estimate the actual ending account balance or expenses you paid for the period. You may use this information to compare the ongoing costs of investing in the Fund and other funds. To do so, compare this 5% hypothetical example with the 5% hypothetical examples that appear in the shareholder reports of the other funds.
Please note that the expenses shown in the table are meant to highlight your ongoing costs only and do not reflect any transactional costs, such as sales charges (loads) and contingent deferred sales charges. Therefore, the “Hypothetical” line of the table is useful in comparing ongoing costs only and will not help you determine the relative total costs of owning different funds. In addition, if these transactional costs were included, your costs would have been higher.
| | | | | | | | | | | | | | | | |
| | | Beginning
account value
8-1-2016 | | | Ending
account value
1-31-2017 | | | Expenses
paid during
the period¹ | | | Annualized net
expense ratio | |
Class A | | | | | | | | | | | | | | | | |
Actual | | $ | 1,000.00 | | | $ | 1,032.73 | | | $ | 6.54 | | | | 1.28 | % |
Hypothetical (5% return before expenses) | | $ | 1,000.00 | | | $ | 1,018.70 | | | $ | 6.50 | | | | 1.28 | % |
Class B | | | | | | | | | | | | | | | | |
Actual | | $ | 1,000.00 | | | $ | 1,028.70 | | | $ | 10.35 | | | | 2.03 | % |
Hypothetical (5% return before expenses) | | $ | 1,000.00 | | | $ | 1,014.93 | | | $ | 10.28 | | | | 2.03 | % |
Class C | | | | | | | | | | | | | | | | |
Actual | | $ | 1,000.00 | | | $ | 1,028.60 | | | $ | 10.35 | | | | 2.03 | % |
Hypothetical (5% return before expenses) | | $ | 1,000.00 | | | $ | 1,014.93 | | | $ | 10.28 | | | | 2.03 | % |
Class R | | | | | | | | | | | | | | | | |
Actual | | $ | 1,000.00 | | | $ | 1,031.39 | | | $ | 7.81 | | | | 1.53 | % |
Hypothetical (5% return before expenses) | | $ | 1,000.00 | | | $ | 1,017.44 | | | $ | 7.76 | | | | 1.53 | % |
Administrator Class | | | | | | | | | | | | | | | | |
Actual | | $ | 1,000.00 | | | $ | 1,033.49 | | | $ | 5.62 | | | | 1.10 | % |
Hypothetical (5% return before expenses) | | $ | 1,000.00 | | | $ | 1,019.61 | | | $ | 5.58 | | | | 1.10 | % |
Institutional Class | | | | | | | | | | | | | | | | |
Actual | | $ | 1,000.00 | | | $ | 1,035.00 | | | $ | 4.35 | | | | 0.85 | % |
Hypothetical (5% return before expenses) | | $ | 1,000.00 | | | $ | 1,020.86 | | | $ | 4.32 | | | | 0.85 | % |
| 1 | Expenses paid is equal to the annualized net expense ratio of each class multiplied by the average account value over the period, multiplied by the number of days in the most recent fiscal half-year divided by the number of days in the fiscal year (to reflect the one-half-year period). |
| | | | | | |
| Portfolio of investments—January 31, 2017 (unaudited) | | Wells Fargo Omega Growth Fund | | | 7 | |
| | | | | | | | | | | | | | | | |
| Security name | | | | | | | | Shares | | | Value | |
| | | | |
Common Stocks: 99.65% | | | | | | | | | | | | | | | | |
| | | | |
Consumer Discretionary: 20.44% | | | | | | | | | | | | | | | | |
| | | | |
| Hotels, Restaurants & Leisure: 7.50% | | | | | | | | | | | | | | | | |
Royal Caribbean Cruises Limited | | | | | | | | | | | 82,500 | | | $ | 7,724,475 | |
Six Flags Entertainment Corporation | | | | | | | | | | | 161,000 | | | | 9,592,380 | |
Starbucks Corporation | | | | | | | | | | | 210,200 | | | | 11,607,244 | |
Vail Resorts Incorporated | | | | | | | | | | | 57,002 | | | | 9,778,123 | |
Wingstop Incorporated « | | | | | | | | | | | 180,045 | | | | 5,125,881 | |
Yum! Brands Incorporated | | | | | | | | | | | 139,900 | | | | 9,167,647 | |
| |
| | | | 52,995,750 | |
| | | | | | | | | | | | | | | | |
| | | | |
| Internet & Direct Marketing Retail: 5.22% | | | | | | | | | | | | | | | | |
Amazon.com Incorporated † | | | | | | | | | | | 44,800 | | | | 36,891,904 | |
| | | | | | | | | | | | | | | | |
| | | | |
| Media: 3.60% | | | | | | | | | | | | | | | | |
Charter Communications Incorporated Class A † | | | | | | | | | | | 42,700 | | | | 13,832,665 | |
Cinemark Holdings Incorporated | | | | | | | | | | | 271,856 | | | | 11,553,880 | |
| |
| | | | 25,386,545 | |
| | | | | | | | | | | | | | | | |
| | | | |
| Specialty Retail: 4.12% | | | | | | | | | | | | | | | | |
O’Reilly Automotive Incorporated † | | | | | | | | | | | 30,400 | | | | 7,973,008 | |
The Home Depot Incorporated | | | | | | | | | | | 153,400 | | | | 21,104,772 | |
| |
| | | | 29,077,780 | |
| | | | | | | | | | | | | | | | |
| | | | |
Consumer Staples: 4.08% | | | | | | | | | | | | | | | | |
| | | | |
| Beverages: 2.49% | | | | | | | | | | | | | | | | |
Constellation Brands Incorporated Class A | | | | | | | | | | | 63,800 | | | | 9,554,688 | |
Monster Beverage Corporation † | | | | | | | | | | | 188,400 | | | | 8,025,840 | |
| |
| | | | 17,580,528 | |
| | | | | | | | | | | | | | | | |
| | | | |
| Tobacco: 1.59% | | | | | | | | | | | | | | | | |
Reynolds American Incorporated | | | | | | | | | | | 186,900 | | | | 11,238,297 | |
| | | | | | | | | | | | | | | | |
| | | | |
Financials: 7.06% | | | | | | | | | | | | | | | | |
| | | | |
| Capital Markets: 4.99% | | | | | | | | | | | | | | | | |
Intercontinental Exchange Incorporated | | | | | | | | | | | 294,100 | | | | 17,163,676 | |
Raymond James Financial Incorporated | | | | | | | | | | | 115,502 | | | | 8,654,565 | |
SEI Investments Company | | | | | | | | | | | 194,557 | | | | 9,437,960 | |
| |
| | | | 35,256,201 | |
| | | | | | | | | | | | | | | | |
| | | | |
| Consumer Finance: 1.31% | | | | | | | | | | | | | | | | |
SLM Corporation † | | | | | | | | | | | 778,800 | | | | 9,252,144 | |
| | | | | | | | | | | | | | | | |
| | | | |
| Thrifts & Mortgage Finance: 0.76% | | | | | | | | | | | | | | | | |
Radian Group Incorporated | | | | | | | | | | | 289,000 | | | | 5,317,600 | |
| | | | | | | | | | | | | | | | |
The accompanying notes are an integral part of these financial statements.
| | | | |
| 8 | | Wells Fargo Omega Growth Fund | | Portfolio of investments—January 31, 2017 (unaudited) |
| | | | | | | | | | | | | | | | |
| Security name | | | | | | | | Shares | | | Value | |
| | | | |
Health Care: 12.46% | | | | | | | | | | | | | | | | |
| | | | |
| Biotechnology: 3.47% | | | | | | | | | | | | | | | | |
Celgene Corporation † | | | | | | | | | | | 161,275 | | | $ | 18,732,091 | |
Gilead Sciences Incorporated | | | | | | | | | | | 79,300 | | | | 5,745,285 | |
| |
| | | | 24,477,376 | |
| | | | | | | | | | | | | | | | |
| | | | |
| Health Care Equipment & Supplies: 4.00% | | | | | | | | | | | | | | | | |
Baxter International Incorporated | | | | | | | | | | | 177,200 | | | | 8,489,652 | |
Integra LifeSciences Holdings Corporation † | | | | | | | | | | | 265,400 | | | | 11,075,142 | |
Intuitive Surgical Incorporated † | | | | | | | | | | | 12,492 | | | | 8,653,083 | |
| |
| | | | 28,217,877 | |
| | | | | | | | | | | | | | | | |
| | | | |
| Health Care Providers & Services: 4.99% | | | | | | | | | | | | | | | | |
Amedisys Incorporated † | | | | | | | | | | | 170,689 | | | | 7,820,970 | |
Surgical Care Affiliates Incorporated † | | | | | | | | | | | 119,593 | | | | 6,757,005 | |
UnitedHealth Group Incorporated | | | | | | | | | | | 127,700 | | | | 20,700,170 | |
| |
| | | | 35,278,145 | |
| | | | | | | | | | | | | | | | |
| | | | |
Industrials: 12.58% | | | | | | | | | | | | | | | | |
| | | | |
| Aerospace & Defense: 0.84% | | | | | | | | | | | | | | | | |
Orbital ATK Incorporated | | | | | | | | | | | 68,500 | | | | 5,956,075 | |
| | | | | | | | | | | | | | | | |
| | | | |
| Airlines: 0.91% | | | | | | | | | | | | | | | | |
Spirit Airlines Incorporated † | | | | | | | | | | | 119,100 | | | | 6,436,164 | |
| | | | | | | | | | | | | | | | |
| | | | |
| Building Products: 1.56% | | | | | | | | | | | | | | | | |
Johnson Controls International plc | | | | | | | | | | | 250,858 | | | | 11,032,735 | |
| | | | | | | | | | | | | | | | |
| | | | |
| Commercial Services & Supplies: 3.95% | | | | | | | | | | | | | | | | |
KAR Auction Services Incorporated | | | | | | | | | | | 181,148 | | | | 8,251,291 | |
Waste Connections Incorporated | | | | | | | | | | | 244,515 | | | | 19,634,555 | |
| |
| | | | 27,885,846 | |
| | | | | | | | | | | | | | | | |
| | | | |
| Electrical Equipment: 0.89% | | | | | | | | | | | | | | | | |
Acuity Brands Incorporated | | | | | | | | | | | 30,400 | | | | 6,299,792 | |
| | | | | | | | | | | | | | | | |
| | | | |
| Industrial Conglomerates: 1.21% | | | | | | | | | | | | | | | | |
Carlisle Companies Incorporated | | | | | | | | | | | 78,500 | | | | 8,565,135 | |
| | | | | | | | | | | | | | | | |
| | | | |
| Professional Services: 1.12% | | | | | | | | | | | | | | | | |
TransUnion † | | | | | | | | | | | 250,635 | | | | 7,902,522 | |
| | | | | | | | | | | | | | | | |
| | | | |
| Road & Rail: 0.78% | | | | | | | | | | | | | | | | |
Kansas City Southern | | | | | | | | | | | 63,800 | | | | 5,481,058 | |
| | | | | | | | | | | | | | | | |
| | | | |
| Trading Companies & Distributors: 1.32% | | | | | | | | | | | | | | | | |
HD Supply Holdings Incorporated † | | | | | | | | | | | 219,477 | | | | 9,283,877 | |
| | | | | | | | | | | | | | | | |
| | | | |
Information Technology: 37.59% | | | | | | | | | | | | | | | | |
| | | | |
| Communications Equipment: 1.42% | | | | | | | | | | | | | | | | |
Harris Corporation | | | | | | | | | | | 97,900 | | | | 10,055,309 | |
| | | | | | | | | | | | | | | | |
The accompanying notes are an integral part of these financial statements.
| | | | | | |
| Portfolio of investments—January 31, 2017 (unaudited) | | Wells Fargo Omega Growth Fund | | | 9 | |
| | | | | | | | | | | | | | | | |
| Security name | | | | | | | | Shares | | | Value | |
| | | | |
| Internet Software & Services: 11.52% | | | | | | | | | | | | | | | | |
Alphabet Incorporated Class A † | | | | | | | | | | | 31,900 | | | $ | 26,164,061 | |
Alphabet Incorporated Class C † | | | | | | | | | | | 21,885 | | | | 17,437,749 | |
CoStar Group Incorporated † | | | | | | | | | | | 35,800 | | | | 7,235,180 | |
Facebook Incorporated Class A † | | | | | | | | | | | 132,700 | | | | 17,293,464 | |
MercadoLibre Incorporated | | | | | | | | | | | 19,900 | | | | 3,689,261 | |
Tencent Holdings Limited ADR | | | | | | | | | | | 363,000 | | | | 9,505,155 | |
| |
| | | | 81,324,870 | |
| | | | | | | | | | | | | | | | |
| | | | |
| IT Services: 11.00% | | | | | | | | | | | | | | | | |
Acxiom Corporation † | | | | | | | | | | | 375,783 | | | | 9,807,936 | |
EPAM Systems Incorporated † | | | | | | | | | | | 110,741 | | | | 7,127,291 | |
Fidelity National Information Services Incorporated | | | | | | | | | | | 99,700 | | | | 7,918,174 | |
PayPal Holdings Incorporated † | | | | | | | | | | | 285,200 | | | | 11,345,256 | |
Total System Services Incorporated | | | | | | | | | | | 142,300 | | | | 7,211,764 | |
Visa Incorporated Class A | | | | | | | | | | | 278,104 | | | | 23,001,982 | |
WEX Incorporated † | | | | | | | | | | | 98,295 | | | | 11,238,067 | |
| | | | |
| | | | | | | | | | | | | | | 77,650,470 | |
| | | | | | | | | | | | | | | | |
| | | | |
| Semiconductors & Semiconductor Equipment: 2.01% | | | | | | | | | | | | | | | | |
Broadcom Limited | | | | | | | | | | | 71,300 | | | | 14,224,350 | |
| | | | | | | | | | | | | | | | |
| | | | |
| Software: 11.64% | | | | | | | | | | | | | | | | |
Adobe Systems Incorporated † | | | | | | | | | | | 93,600 | | | | 10,612,368 | |
Microsoft Corporation | | | | | | | | | | | 271,200 | | | | 17,533,080 | |
Nintendo Company Limited « | | | | | | | | | | | 276,938 | | | | 6,848,677 | |
Salesforce.com Incorporated † | | | | | | | | | | | 130,900 | | | | 10,354,190 | |
ServiceNow Incorporated † | | | | | | | | | | | 67,400 | | | | 6,107,788 | |
Symantec Corporation | | | | | | | | | | | 454,500 | | | | 12,521,475 | |
Take-Two Interactive Software Incorporated † | | | | | | | | | | | 207,700 | | | | 11,143,105 | |
Ultimate Software Group Incorporated † | | | | | | | | | | | 36,500 | | | | 7,068,590 | |
| | | | |
| | | | | | | | | | | | | | | 82,189,273 | |
| | | | | | | | | | | | | | | | |
| | | | |
Materials: 4.33% | | | | | | | | | | | | | | | | |
| | | | |
| Chemicals: 1.27% | | | | | | | | | | | | | | | | |
The Sherwin-Williams Company | | | | | | | | | | | 29,400 | | | | 8,932,014 | |
| | | | | | | | | | | | | | | | |
| | | | |
| Construction Materials: 1.41% | | | | | | | | | | | | | | | | |
Vulcan Materials Company | | | | | | | | | | | 77,800 | | | | 9,984,074 | |
| | | | | | | | | | | | | | | | |
| | | | |
| Containers & Packaging: 1.65% | | | | | | | | | | | | | | | | |
Berry Plastics Group Incorporated † | | | | | | | | | | | 228,800 | | | | 11,675,664 | |
| | | | | | | | | | | | | | | | |
| | | | |
Real Estate: 1.11% | | | | | | | | | | | | | | | | |
| | | | |
| Real Estate Management & Development: 1.11% | | | | | | | | | | | | | | | | |
CBRE Group Incorporated Class A † | | | | | | | | | | | 259,000 | | | | 7,863,239 | |
| | | | | | | | | | | | | | | | |
| | | | |
Total Common Stocks (Cost $549,522,504) | | | | | | | | | | | | | | | 703,712,614 | |
| | | | | | | | | | | | | | | | |
The accompanying notes are an integral part of these financial statements.
| | | | |
| 10 | | Wells Fargo Omega Growth Fund | | Portfolio of investments—January 31, 2017 (unaudited) |
| | | | | | | | | | | | | | | | |
| Security name | | Yield | | | | | | Shares | | | Value | |
| | | | |
Short-Term Investments: 1.19% | | | | | | | | | | | | | | | | |
| | | | |
| Investment Companies: 1.19% | | | | | | | | | | | | | | | | |
Securities Lending Cash Investment LLC (l)(r)(u) | | | 0.86 | % | | | | | | | 4,971,794 | | | $ | 4,972,292 | |
Wells Fargo Government Money Market Fund Select Class (l)(u) | | | 0.46 | | | | | | | | 3,396,550 | | | | 3,396,550 | |
| | | | |
Total Short-Term Investments (Cost $8,368,840) | | | | | | | | | | | | | | | 8,368,842 | |
| | | | | | | | | | | | | | | | |
| | | | | | | | |
| Total investments in securities (Cost $557,891,344) * | | | 100.84 | % | | | 712,081,456 | |
Other assets and liabilities, net | | | (0.84 | ) | | | (5,912,337 | ) |
| | | | | | | | |
| Total net assets | | | 100.00 | % | | $ | 706,169,119 | |
| | | | | | | | |
| « | All or a portion of this security is on loan. |
| † | Non-income-earning security |
| (l) | The issuer of the security is an affiliated person of the Fund as defined in the Investment Company Act of 1940. |
| (r) | The investment is a non-registered investment vehicle purchased with cash collateral received from securities on loan. |
| (u) | The rate represents the 7-day annualized yield at period end. |
| * | Cost for federal income tax purposes is $557,792,065 and unrealized gains (losses) consists of: |
| | | | |
Gross unrealized gains | | $ | 161,902,677 | |
Gross unrealized losses | | | (7,613,286 | ) |
| | | | |
Net unrealized gains | | $ | 154,289,391 | |
The accompanying notes are an integral part of these financial statements.
| | | | | | |
| Statement of assets and liabilities—January 31, 2017 (unaudited) | | Wells Fargo Omega Growth Fund | | | 11 | |
| | | | |
| | | | |
| |
Assets | | | | |
Investments | | | | |
In unaffiliated securities (including $4,845,398 of securities loaned), at value (cost $549,522,504) | | $ | 703,712,614 | |
In affiliated securities, at value (cost $8,368,840) | | | 8,368,842 | |
| | | | |
Total investments, at value (cost $557,891,344) | | | 712,081,456 | |
Receivable for investments sold | | | 3,024,828 | |
Receivable for Fund shares sold | | | 72,743 | |
Receivable for dividends | | | 58,127 | |
Receivable for securities lending income | | | 2,051 | |
Prepaid expenses and other assets | | | 52,470 | |
| | | | |
Total assets | | | 715,291,675 | |
| | | | |
| |
Liabilities | | | | |
Payable for investments purchased | | | 2,560,790 | |
Payable for Fund shares redeemed | | | 708,412 | |
Payable upon receipt of securities loaned | | | 4,972,250 | |
Management fee payable | | | 460,023 | |
Distribution fees payable | | | 42,760 | |
Administration fees payable | | | 118,797 | |
Accrued expenses and other liabilities | | | 259,524 | |
| | | | |
Total liabilities | | | 9,122,556 | |
| | | | |
Total net assets | | $ | 706,169,119 | |
| | | | |
| |
NET ASSETS CONSIST OF | | | | |
Paid-in capital | | $ | 532,315,257 | |
Accumulated net investment loss | | | (7,487,365 | ) |
Accumulated net realized gains on investments | | | 27,151,115 | |
Net unrealized gains on investments | | | 154,190,112 | |
| | | | |
Total net assets | | $ | 706,169,119 | |
| | | | |
| |
COMPUTATION OF NET ASSET VALUE AND OFFERING PRICE PER SHARE | | | | |
Net assets – Class A | | $ | 540,938,044 | |
Shares outstanding – Class A1 | | | 12,597,113 | |
Net asset value per share – Class A | | | $42.94 | |
Maximum offering price per share – Class A2 | | | $45.56 | |
Net assets – Class B | | $ | 1,597,897 | |
Shares outstanding – Class B1 | | | 50,421 | |
Net asset value per share – Class B | | | $31.69 | |
Net assets – Class C | | $ | 63,393,800 | |
Shares outstanding – Class C1 | | | 1,993,243 | |
Net asset value per share – Class C | | | $31.80 | |
Net assets – Class R | | $ | 6,159,404 | |
Shares outstanding – Class R1 | | | 149,731 | |
Net asset value per share – Class R | | | $41.14 | |
Net assets – Administrator Class | | $ | 18,740,402 | |
Shares outstanding – Administrator Class1 | | | 407,450 | |
Net asset value per share – Administrator Class | | | $45.99 | |
Net assets – Institutional Class | | $ | 75,339,572 | |
Shares outstanding – Institutional Class1 | | | 1,603,280 | |
Net asset value per share – Institutional Class | | | $46.99 | |
| 1 | The Fund has an unlimited number of authorized shares. |
| 2 | Maximum offering price is computed as 100/94.25 of net asset value. On investments of $50,000 or more, the offering price is reduced. |
The accompanying notes are an integral part of these financial statements.
| | | | |
| 12 | | Wells Fargo Omega Growth Fund | | Statement of operations—six months ended January 31, 2017 (unaudited) |
| | | | |
| | | | |
| |
Investment income | | | | |
Dividends (net of foreign withholding taxes of $17,899) | | $ | 3,753,275 | |
Income from affiliated securities | | | 9,350 | |
Securities lending income, net | | | 7,493 | |
| | | | |
Total investment income | | | 3,770,118 | |
| | | | |
| |
Expenses | | | | |
Management fee | | | 2,857,914 | |
Administration fees | | | | |
Class A | | | 575,306 | |
Class B | | | 2,658 | |
Class C | | | 70,971 | |
Class R | | | 7,998 | |
Administrator Class | | | 18,873 | |
Institutional Class | | | 47,981 | |
Shareholder servicing fees | | | | |
Class A | | | 684,888 | |
Class B | | | 3,164 | |
Class C | | | 84,490 | |
Class R | | | 9,521 | |
Administrator Class | | | 36,035 | |
Distribution fees | | | | |
Class B | | | 9,493 | |
Class C | | | 253,469 | |
Class R | | | 9,521 | |
Custody and accounting fees | | | 21,426 | |
Professional fees | | | 26,293 | |
Registration fees | | | 42,638 | |
Shareholder report expenses | | | 20,133 | |
Trustees’ fees and expenses | | | 14,860 | |
Other fees and expenses | | | 7,058 | |
| | | | |
Total expenses | | | 4,804,690 | |
Less: Fee waivers and/or expense reimbursements | | | (51,411 | ) |
| | | | |
Net expenses | | | 4,753,279 | |
| | | | |
Net investment loss | | | (983,161 | ) |
| | | | |
| |
REALIZED AND UNREALIZED GAINS (LOSSES) ON INVESTMENTS | | | | |
| |
Net realized gains on: | | | | |
Unaffiliated securities | | | 52,933,383 | |
Affiliated securities | | | 40 | |
| | | | |
Net realized gains on investments | | | 52,933,423 | |
| | | | |
| |
Net change in unrealized gains (losses) on: | | | | |
Unaffiliated securities | | | (30,718,044 | ) |
Affiiliated securities | | | 2 | |
| | | | |
Net change in unrealized gains (losses) on investments | | | (30,718,042 | ) |
| | | | |
Net realized and unrealized gains (losses) on investments | | | 22,215,381 | |
| | | | |
Net increase in net assets resulting from operations | | $ | 21,232,220 | |
| | | | |
The accompanying notes are an integral part of these financial statements.
| | | | | | |
| Statement of changes in net assets | | Wells Fargo Omega Growth Fund | | | 13 | |
| | | | | | | | | | | | | | | | |
| | | Six months ended
January 31, 2017
(unaudited) | | | Year ended
July 31, 2016 | |
| | | | |
Operations | | | | | | | | | | | | | | | | |
Net investment loss | | | | | | $ | (983,161 | ) | | | | | | $ | (4,021,589 | ) |
Net realized gains (losses) on investments | | | | | | | 52,933,423 | | | | | | | | (4,017,597 | ) |
Net change in unrealized gains (losses) on investments | | | | | | | (30,718,042 | ) | | | | | | | (30,592,986 | ) |
| | | | |
Net increase (decrease) in net assets resulting from operations | | | | | | | 21,232,220 | | | | | | | | (38,632,172 | ) |
| | | | |
| | | | |
Distributions to shareholders from | | | | | | | | | | | | | | | | |
Net realized gains | | | | | | | | | | | | | | | | |
Class A | | | | | | | (14,517,010 | ) | | | | | | | (53,442,331 | ) |
Class B | | | | | | | (74,045 | ) | | | | | | | (648,915 | ) |
Class C | | | | | | | (2,315,756 | ) | | | | | | | (9,667,016 | ) |
Class R | | | | | | | (182,366 | ) | | | | | | | (1,155,110 | ) |
Administrator Class | | | | | | | (492,743 | ) | | | | | | | (4,963,941 | ) |
Institutional Class | �� | | | | | | (1,888,610 | ) | | | | | | | (5,527,216 | ) |
| | | | |
Total distributions to shareholders | | | | | | | (19,470,530 | ) | | | | | | | (75,404,529 | ) |
| | | | |
| | | | |
Capital share transactions | | | Shares | | | | | | | | Shares | | | | | |
Proceeds from shares sold | | | | | | | | | | | | | | | | |
Class A | | | 154,514 | | | | 6,493,640 | | | | 636,040 | | | | 26,983,625 | |
Class B | | | 11 | | | | 310 | | | | 592 | | | | 18,253 | |
Class C | | | 44,497 | | | | 1,390,967 | | | | 129,265 | | | | 4,127,591 | |
Class R | | | 15,278 | | | | 614,780 | | | | 78,841 | | | | 3,191,728 | |
Administrator Class | | | 15,599 | | | | 699,201 | | | | 117,203 | | | | 5,396,775 | |
Institutional Class | | | 391,882 | | | | 18,077,807 | | | | 421,170 | | | | 18,380,976 | |
| | | | |
| | | | | | | 27,276,705 | | | | | | | | 58,098,948 | |
| | | | |
Reinvestment of distributions | | | | | | | | | | | | | | | | |
Class A | | | 328,192 | | | | 13,633,094 | | | | 1,213,454 | | | | 49,860,826 | |
Class B | | | 2,395 | | | | 73,511 | | | | 20,867 | | | | 644,380 | |
Class C | | | 68,889 | | | | 2,121,773 | | | | 278,845 | | | | 8,638,611 | |
Class R | | | 1,939 | | | | 77,183 | | | | 11,870 | | | | 469,234 | |
Administrator Class | | | 10,178 | | | | 452,700 | | | | 110,013 | | | | 4,822,974 | |
Institutional Class | | | 40,190 | | | | 1,825,826 | | | | 110,554 | | | | 4,935,146 | |
| | | | |
| | | | | | | 18,184,087 | | | | | | | | 69,371,171 | |
| | | | |
Payment for shares redeemed | | | | | | | | | | | | | | | | |
Class A | | | (1,301,539 | ) | | | (54,617,195 | ) | | | (2,617,353 | ) | | | (109,288,473 | ) |
Class B | | | (60,793 | ) | | | (1,898,191 | ) | | | (121,453 | ) | | | (3,865,675 | ) |
Class C | | | (438,255 | ) | | | (13,755,634 | ) | | | (728,858 | ) | | | (22,930,898 | ) |
Class R | | | (114,125 | ) | | | (4,625,114 | ) | | | (212,709 | ) | | | (8,667,886 | ) |
Administrator Class | | | (451,663 | ) | | | (20,410,797 | ) | | | (1,088,227 | ) | | | (49,198,465 | ) |
Institutional Class | | | (482,406 | ) | | | (22,005,875 | ) | | | (552,473 | ) | | | (26,185,870 | ) |
| | | | |
| | | | | | | (117,312,806 | ) | | | | | | | (220,137,267 | ) |
| | | | |
Net decrease in net assets resulting from capital share transactions | | | | | | | (71,852,014 | ) | | | | | | | (92,667,148 | ) |
| | | | |
Total decrease in net assets | | | | | | | (70,090,324 | ) | | | | | | | (206,703,849 | ) |
| | | | |
| | | | |
Net assets | | | | | | | | | | | | | | | | |
Beginning of period | | | | | | | 776,259,443 | | | | | | | | 982,963,292 | |
| | | | |
End of period | | | | | | $ | 706,169,119 | | | | | | | $ | 776,259,443 | |
| | | | |
Accumulated net investment loss | | | | | | $ | (7,487,365 | ) | | | | | | $ | (6,504,204 | ) |
| | | | |
The accompanying notes are an integral part of these financial statements.
| | | | |
| 14 | | Wells Fargo Omega Growth Fund | | Financial highlights |
(For a share outstanding throughout each period)
| | | | | | | | | | | | | | | | | | | | | | | | |
| | | Six months ended January 31, 2017 (unaudited) | | | Year ended July 31 | |
| CLASS A | | | 2016 | | | 2015 | | | 2014 | | | 2013 | | | 2012 | |
Net asset value, beginning of period | | | $42.73 | | | | $48.29 | | | | $49.99 | | | | $47.97 | | | | $39.09 | | | | $38.29 | |
Net investment loss | | | (0.05 | )1 | | | (0.19 | )1 | | | (0.28 | )1 | | | (0.49 | ) | | | (0.02 | ) | | | (0.28 | )1 |
Net realized and unrealized gains (losses) on investments | | | 1.41 | | | | (1.44 | ) | | | 5.12 | | | | 8.28 | | | | 10.31 | | | | 1.08 | |
| | | | | | | | | | | | | | | | | | | | | | | | |
Total from investment operations | | | 1.36 | | | | (1.63 | ) | | | 4.84 | | | | 7.79 | | | | 10.29 | | | | 0.80 | |
Distributions to shareholders from | | | | | | | | | | | | | | | | | | | | | | | | |
Net realized gains | | | (1.15 | ) | | | (3.93 | ) | | | (6.54 | ) | | | (5.77 | ) | | | (1.41 | ) | | | 0.00 | |
Net asset value, end of period | | | $42.94 | | | | $42.73 | | | | $48.29 | | | | $49.99 | | | | $47.97 | | | | $39.09 | |
Total return2 | | | 3.27 | % | | | (3.07 | )% | | | 10.65 | % | | | 16.58 | % | | | 27.07 | % | | | 2.09 | % |
Ratios to average net assets (annualized) | | | | | | | | | | | | | | | | | | | | | | | | |
Gross expenses | | | 1.28 | % | | | 1.28 | % | | | 1.32 | % | | | 1.32 | % | | | 1.34 | % | | | 1.35 | % |
Net expenses | | | 1.28 | % | | | 1.28 | % | | | 1.30 | % | | | 1.30 | % | | | 1.30 | % | | | 1.30 | % |
Net investment loss | | | (0.25 | )% | | | (0.47 | )% | | | (0.58 | )% | | | (0.84 | )% | | | (0.08 | )% | | | (0.75 | )% |
Supplemental data | | | | | | | | | | | | | | | | | | | | | | | | |
Portfolio turnover rate | | | 43 | % | | | 84 | % | | | 94 | % | | | 101 | % | | | 88 | % | | | 101 | % |
Net assets, end of period (000s omitted) | | | $540,938 | | | | $573,304 | | | | $685,005 | | | | $724,071 | | | | $668,992 | | | | $550,758 | |
| 1 | Calculated based upon average shares outstanding |
| 2 | Total return calculations do not include any sales charges. Returns for periods of less than one year are not annualized. |
The accompanying notes are an integral part of these financial statements.
| | | | | | |
| Financial highlights | | Wells Fargo Omega Growth Fund | | | 15 | |
(For a share outstanding throughout each period)
| | | | | | | | | | | | | | | | | | | | | | | | |
| | | Six months ended January 31, 2017 (unaudited) | | | Year ended July 31 | |
| CLASS B | | | 2016 | | | 2015 | | | 2014 | | | 2013 | | | 2012 | |
Net asset value, beginning of period | | | $31.96 | | | | $37.44 | | | | $40.45 | | | | $40.07 | | | | $33.12 | | | | $32.68 | |
Net investment loss | | | (0.15 | )1 | | | (0.39 | )1 | | | (0.51 | )1 | | | (0.65 | )1 | | | (0.28 | )1 | | | (0.47 | )1 |
Net realized and unrealized gains (losses) on investments | | | 1.03 | | | | (1.16 | ) | | | 4.04 | | | | 6.80 | | | | 8.64 | | | | 0.91 | |
| | | | | | | | | | | | | | | | | | | | | | | | |
Total from investment operations | | | 0.88 | | | | (1.55 | ) | | | 3.53 | | | | 6.15 | | | | 8.36 | | | | 0.44 | |
Distributions to shareholders from | | | | | | | | | | | | | | | | | | | | | | | | |
Net realized gains | | | (1.15 | ) | | | (3.93 | ) | | | (6.54 | ) | | | (5.77 | ) | | | (1.41 | ) | | | 0.00 | |
Net asset value, end of period | | | $31.69 | | | | $31.96 | | | | $37.44 | | | | $40.45 | | | | $40.07 | | | | $33.12 | |
Total return2 | | | 2.87 | % | | | (3.77 | )% | | | 9.82 | % | | | 15.71 | % | | | 26.11 | % | | | 1.32 | % |
Ratios to average net assets (annualized) | | | | | | | | | | | | | | | | | | | | | | | | |
Gross expenses | | | 2.03 | % | | | 2.03 | % | | | 2.07 | % | | | 2.07 | % | | | 2.09 | % | | | 2.10 | % |
Net expenses | | | 2.03 | % | | | 2.03 | % | | | 2.05 | % | | | 2.05 | % | | | 2.05 | % | | | 2.05 | % |
Net investment loss | | | (0.93 | )% | | | (1.22 | )% | | | (1.32 | )% | | | (1.58 | )% | | | (0.78 | )% | | | (1.51 | )% |
Supplemental data | | | | | | | | | | | | | | | | | | | | | | | | |
Portfolio turnover rate | | | 43 | % | | | 84 | % | | | 94 | % | | �� | 101 | % | | | 88 | % | | | 101 | % |
Net assets, end of period (000s omitted) | | | $1,598 | | | | $3,477 | | | | $7,817 | | | | $12,526 | | | | $17,476 | | | | $22,271 | |
| 1 | Calculated based upon average shares outstanding |
| 2 | Total return calculations do not include any sales charges. Returns for periods of less than one year are not annualized. |
The accompanying notes are an integral part of these financial statements.
| | | | |
| 16 | | Wells Fargo Omega Growth Fund | | Financial highlights |
(For a share outstanding throughout each period)
| | | | | | | | | | | | | | | | | | | | | | | | |
| | | Six months ended January 31, 2017 (unaudited) | | | Year ended July 31 | |
| CLASS C | | | 2016 | | | 2015 | | | 2014 | | | 2013 | | | 2012 | |
Net asset value, beginning of period | | | $32.07 | | | | $37.55 | | | | $40.56 | | | | $40.15 | | | | $33.18 | | | | $32.75 | |
Net investment loss | | | (0.16 | )1 | | | (0.39 | )1 | | | (0.51 | )1 | | | (0.65 | )1 | | | (0.31 | )1 | | | (0.47 | )1 |
Net realized and unrealized gains (losses) on investments | | | 1.04 | | | | (1.16 | ) | | | 4.04 | | | | 6.83 | | | | 8.69 | | | | 0.90 | |
| | | | | | | | | | | | | | | | | | | | | | | | |
Total from investment operations | | | 0.88 | | | | (1.55 | ) | | | 3.53 | | | | 6.18 | | | | 8.38 | | | | 0.43 | |
Distributions to shareholders from | | | | | | | | | | | | | | | | | | | | | | | | |
Net realized gains | | | (1.15 | ) | | | (3.93 | ) | | | (6.54 | ) | | | (5.77 | ) | | | (1.41 | ) | | | 0.00 | |
Net asset value, end of period | | | $31.80 | | | | $32.07 | | | | $37.55 | | | | $40.56 | | | | $40.15 | | | | $33.18 | |
Total return2 | | | 2.86 | % | | | (3.75 | )% | | | 9.79 | % | | | 15.73 | % | | | 26.11 | % | | | 1.31 | % |
Ratios to average net assets (annualized) | | | | | | | | | | | | | | | | | | | | | | | | |
Gross expenses | | | 2.03 | % | | | 2.03 | % | | | 2.07 | % | | | 2.07 | % | | | 2.09 | % | | | 2.10 | % |
Net expenses | | | 2.03 | % | | | 2.03 | % | | | 2.05 | % | | | 2.05 | % | | | 2.05 | % | | | 2.05 | % |
Net investment loss | | | (0.99 | )% | | | (1.22 | )% | | | (1.33 | )% | | | (1.59 | )% | | | (0.85 | )% | | | (1.49 | )% |
Supplemental data | | | | | | | | | | | | | | | | | | | | | | | | |
Portfolio turnover rate | | | 43 | % | | | 84 | % | | | 94 | % | | | 101 | % | | | 88 | % | | | 101 | % |
Net assets, end of period (000s omitted) | | | $63,394 | | | | $74,337 | | | | $99,100 | | | | $108,073 | | | | $83,206 | | | | $59,481 | |
| 1 | Calculated based upon average shares outstanding |
| 2 | Total return calculations do not include any sales charges. Returns for periods of less than one year are not annualized. |
The accompanying notes are an integral part of these financial statements.
| | | | | | |
| Financial highlights | | Wells Fargo Omega Growth Fund | | | 17 | |
(For a share outstanding throughout each period)
| | | | | | | | | | | | | | | | | | | | | | | | |
| | | Six months ended January 31, 2017 (unaudited) | | | Year ended July 31 | |
| CLASS R | | | 2016 | | | 2015 | | | 2014 | | | 2013 | | | 2012 | |
Net asset value, beginning of period | | | $41.04 | | | | $46.66 | | | | $48.62 | | | | $46.90 | | | | $38.35 | | | | $37.66 | |
Net investment loss | | | (0.10 | )1 | | | (0.29 | )1 | | | (0.39 | )1 | | | (0.53 | )1 | | | (0.09 | ) | | | (0.36 | )1 |
Net realized and unrealized gains (losses) on investments | | | 1.35 | | | | (1.40 | ) | | | 4.97 | | | | 8.02 | | | | 10.05 | | | | 1.05 | |
| | | | | | | | | | | | | | | | | | | | | | | | |
Total from investment operations | | | 1.25 | | | | (1.69 | ) | | | 4.58 | | | | 7.49 | | | | 9.96 | | | | 0.69 | |
Distributions to shareholders from | | | | | | | | | | | | | | | | | | | | | | | | |
Net realized gains | | | (1.15 | ) | | | (3.93 | ) | | | (6.54 | ) | | | (5.77 | ) | | | (1.41 | ) | | | 0.00 | |
Net asset value, end of period | | | $41.14 | | | | $41.04 | | | | $46.66 | | | | $48.62 | | | | $46.90 | | | | $38.35 | |
Total return2 | | | 3.14 | % | | | (3.30 | )% | | | 10.38 | % | | | 16.30 | % | | | 26.73 | % | | | 1.83 | % |
Ratios to average net assets (annualized) | | | | | | | | | | | | | | | | | | | | | | | | |
Gross expenses | | | 1.53 | % | | | 1.53 | % | | | 1.57 | % | | | 1.57 | % | | | 1.59 | % | | | 1.60 | % |
Net expenses | | | 1.53 | % | | | 1.53 | % | | | 1.55 | % | | | 1.55 | % | | | 1.55 | % | | | 1.55 | % |
Net investment loss | | | (0.48 | )% | | | (0.71 | )% | | | (0.83 | )% | | | (1.09 | )% | | | (0.38 | )% | | | (0.99 | )% |
Supplemental data | | | | | | | | | | | | | | | | | | | | | | | | |
Portfolio turnover rate | | | 43 | % | | | 84 | % | | | 94 | % | | | 101 | % | | | 88 | % | | | 101 | % |
Net assets, end of period (000s omitted) | | | $6,159 | | | | $10,122 | | | | $17,199 | | | | $20,095 | | | | $23,745 | | | | $15,408 | |
| 1 | Calculated based upon average shares outstanding |
| 2 | Returns for periods of less than one year are not annualized. |
The accompanying notes are an integral part of these financial statements.
| | | | |
| 18 | | Wells Fargo Omega Growth Fund | | Financial highlights |
(For a share outstanding throughout each period)
| | | | | | | | | | | | | | | | | | | | | | | | |
| | | Six months ended January 31, 2017 (unaudited) | | | Year ended July 31 | |
| ADMINISTRATOR CLASS | | | 2016 | | | 2015 | | | 2014 | | | 2013 | | | 2012 | |
Net asset value, beginning of period | | | $45.65 | | | | $51.20 | | | | $52.50 | | | | $50.00 | | | | $40.60 | | | | $39.67 | |
Net investment income (loss) | | | 0.00 | 1,2 | | | (0.12 | )1 | | | (0.17 | )1 | | | (0.31 | )1 | | | 0.07 | 1 | | | (0.19 | )1 |
Net realized and unrealized gains (losses) on investments | | | 1.49 | | | | (1.50 | ) | | | 5.41 | | | | 8.58 | | | | 10.74 | | | | 1.12 | |
| | | | | | | | | | | | | | | | | | | | | | | | |
Total from investment operations | | | 1.49 | | | | (1.62 | ) | | | 5.24 | | | | 8.27 | | | | 10.81 | | | | 0.93 | |
Distributions to shareholders from | | | | | | | | | | | | | | | | | | | | | | | | |
Net realized gains | | | (1.15 | ) | | | (3.93 | ) | | | (6.54 | ) | | | (5.77 | ) | | | (1.41 | ) | | | 0.00 | |
Net asset value, end of period | | | $45.99 | | | | $45.65 | | | | $51.20 | | | | $52.50 | | | | $50.00 | | | | $40.60 | |
Total return3 | | | 3.35 | % | | | (2.84 | )% | | | 10.91 | % | | | 16.89 | % | | | 27.35 | % | | | 2.34 | % |
Ratios to average net assets (annualized) | | | | | | | | | | | | | | | | | | | | | | | | |
Gross expenses | | | 1.20 | % | | | 1.19 | % | | | 1.15 | % | | | 1.15 | % | | | 1.17 | % | | | 1.17 | % |
Net expenses | | | 1.10 | % | | | 1.08 | % | | | 1.05 | % | | | 1.05 | % | | | 1.05 | % | | | 1.05 | % |
Net investment income (loss) | | | 0.00 | % | | | (0.27 | )% | | | (0.33 | )% | | | (0.59 | )% | | | 0.16 | % | | | (0.49 | )% |
Supplemental data | | | | | | | | | | | | | | | | | | | | | | | | |
Portfolio turnover rate | | | 43 | % | | | 84 | % | | | 94 | % | | | 101 | % | | | 88 | % | | | 101 | % |
Net assets, end of period (000s omitted) | | | $18,740 | | | | $38,039 | | | | $86,756 | | | | $115,281 | | | | $69,264 | | | | $51,560 | |
| 1 | Calculated based upon average shares outstanding |
| 2 | Amount is less than $0.005. |
| 3 | Returns for periods of less than one year are not annualized. |
The accompanying notes are an integral part of these financial statements.
| | | | | | |
| Financial highlights | | Wells Fargo Omega Growth Fund | | | 19 | |
(For a share outstanding throughout each period)
| | | | | | | | | | | | | | | | | | | | | | | | |
| | | Six months ended January 31, 2017 (unaudited) | | | Year ended July 31 | |
| INSTITUTIONAL CLASS | | | 2016 | | | 2015 | | | 2014 | | | 2013 | | | 2012 | |
Net asset value, beginning of period | | | $46.55 | | | | $52.01 | | | | $53.10 | | | | $50.40 | | | | $40.81 | | | | $39.77 | |
Net investment income (loss) | | | 0.04 | 1 | | | (0.00 | )2 | | | (0.04 | )1 | | | (0.24 | ) | | | 0.11 | 1 | | | (0.10 | ) |
Net realized and unrealized gains (losses) on investments | | | 1.55 | | | | (1.53 | ) | | | 5.49 | | | | 8.71 | | | | 10.89 | | | | 1.14 | |
| | | | | | | | | | | | | | | | | | | | | | | | |
Total from investment operations | | | 1.59 | | | | (1.53 | ) | | | 5.45 | | | | 8.47 | | | | 11.00 | | | | 1.04 | |
Distributions to shareholders from | | | | | | | | | | | | | | | | | | | | | | | | |
Net realized gains | | | (1.15 | ) | | | (3.93 | ) | | | (6.54 | ) | | | (5.77 | ) | | | (1.41 | ) | | | 0.00 | |
Net asset value, end of period | | | $46.99 | | | | $46.55 | | | | $52.01 | | | | $53.10 | | | | $50.40 | | | | $40.81 | |
Total return3 | | | 3.50 | % | | | (2.61 | )% | | | 11.20 | % | | | 17.17 | % | | | 27.68 | % | | | 2.62 | % |
Ratios to average net assets (annualized) | | | | | | | | | | | | | | | | | | | | | | | | |
Gross expenses | | | 0.95 | % | | | 0.95 | % | | | 0.90 | % | | | 0.89 | % | | | 0.91 | % | | | 0.92 | % |
Net expenses | | | 0.85 | % | | | 0.83 | % | | | 0.80 | % | | | 0.80 | % | | | 0.80 | % | | | 0.80 | % |
Net investment income (loss) | | | 0.18 | % | | | (0.01 | )% | | | (0.09 | )% | | | (0.36 | )% | | | 0.24 | % | | | (0.24 | )% |
Supplemental data | | | | | | | | | | | | | | | | | | | | | | | | |
Portfolio turnover rate | | | 43 | % | | | 84 | % | | | 94 | % | | | 101 | % | | | 88 | % | | | 101 | % |
Net assets, end of period (000s omitted) | | | $75,340 | | | | $76,980 | | | | $87,085 | | | | $49,960 | | | | $3,507 | | | | $779 | |
| 1 | Calculated based upon average shares outstanding |
| 2 | Amount is less than $0.005. |
| 3 | Returns for periods of less than one year are not annualized. |
The accompanying notes are an integral part of these financial statements.
| | | | |
| 20 | | Wells Fargo Omega Growth Fund | | Notes to financial statements (unaudited) |
1. ORGANIZATION
Wells Fargo Funds Trust (the “Trust”), a Delaware statutory trust organized on March 10, 1999, is an open-end management investment company registered under the Investment Company Act of 1940, as amended (the “1940 Act”). As an investment company, the Trust follows the accounting and reporting guidance in Financial Accounting Standards Board (“FASB”) Accounting Standards Codification Topic 946, Financial Services – Investment Companies. These financial statements report on the Wells Fargo Omega Growth Fund (the “Fund”) which is a diversified series of the Trust.
2. SIGNIFICANT ACCOUNTING POLICIES
The following significant accounting policies, which are consistently followed in the preparation of the financial statements of the Fund, are in conformity with U.S. generally accepted accounting principles which require management to make estimates and assumptions that affect the reported amounts of assets and liabilities, disclosure of contingent assets and liabilities at the date of the financial statements, and the reported amounts of revenues and expenses during the reporting period. Actual results could differ from those estimates.
Securities valuation
All investments are valued each business day as of the close of regular trading on the New York Stock Exchange (generally 4 p.m. Eastern Time), although the Fund may deviate from this calculation time under unusual or unexpected circumstances.
Equity securities that are listed on a foreign or domestic exchange or market are valued at the official closing price or, if none, the last sales price. If no sale occurs on the principal exchange or market that day, the prior day’s price will be deemed “stale” and a fair value price will be determined in accordance with the Fund’s Valuation Procedures.
Investments in registered open-end investment companies are valued at net asset value. Interests in non-registered investment vehicles that are redeemable at net asset value are fair valued normally at net asset value.
Investments which are not valued using any of the methods discussed above are valued at their fair value, as determined in good faith by the Board of Trustees of the Fund. The Board of Trustees has established a Valuation Committee comprised of the Trustees and has delegated to it the authority to take any actions regarding the valuation of portfolio securities that the Valuation Committee deems necessary or appropriate, including determining the fair value of portfolio securities, unless the determination has been delegated to the Management Valuation Team of Wells Fargo Funds Management, LLC (“Funds Management”). The Board of Trustees retains the authority to make or ratify any valuation decisions or approve any changes to the Valuation Procedures as it deems appropriate. On a quarterly basis, the Board of Trustees receives reports on any valuation actions taken by the Valuation Committee or the Management Valuation Team which may include items for ratification.
Valuations of fair valued securities are compared to the next actual sales price when available, or other appropriate market values, to assess the continued appropriateness of the fair valuation methodologies used. These securities are fair valued on a day-to-day basis, taking into consideration changes to appropriate market information and any significant changes to the inputs considered in the valuation process until there is a readily available price provided on an exchange or by an independent pricing service. Valuations received from an independent pricing service or independent broker-dealer quotes are periodically validated by comparisons to most recent trades and valuations provided by other independent pricing services in addition to the review of prices by the manager and/or subadviser. Unobservable inputs used in determining fair valuations are identified based on the type of security, taking into consideration factors utilized by market participants in valuing the investment, knowledge about the issuer and the current market environment.
Security loans
The Fund may lend its securities from time to time in order to earn additional income in the form of fees or interest on securities received as collateral or the investment of any cash received as collateral. The Fund continues to receive interest or dividends on the securities loaned. The Fund receives collateral in the form of cash or securities with a value at least equal to the value of the securities on loan. The value of the loaned securities is determined at the close of each business day and any additional required collateral is delivered to the Fund on the next business day. In a securities lending transaction, the net asset value of the Fund will be affected by an increase or decrease in the value of the securities loaned and by an increase or decrease in the value of the instrument in which collateral is invested. The amount of securities lending activity undertaken by the Fund fluctuates from time to time. In the event of default or bankruptcy by the borrower, the Fund may be prevented from recovering the loaned securities or gaining access to the collateral or may experience delays or costs in doing so. In addition, the investment of any cash collateral received may lose all or part of its value. The Fund has the right under the lending agreement to recover the securities from the borrower on demand.
| | | | | | |
| Notes to financial statements (unaudited) | | Wells Fargo Omega Growth Fund | | | 21 | |
The Fund lends its securities through an unaffiliated securities lending agent. Cash collateral received in connection with its securities lending transactions is invested in Securities Lending Cash Investments, LLC (the “Securities Lending Fund”). The Securities Lending Fund is exempt from registration under Section 3(c)(7) of the 1940 Act and is managed by Funds Management and is subadvised by Wells Capital Management Incorporated (“WellsCap”), an affiliate of Funds Management and an indirect wholly owned subsidiary of Wells Fargo & Company (“Wells Fargo”). Funds Management receives an advisory fee starting at 0.05% and declining to 0.01% as the average daily net assets of the Securities Lending Fund increase. All of the fees received by Funds Management are paid to WellsCap for its services as subadviser. The Securities Lending Fund seeks to provide a positive return compared to the daily Fed Funds Open Rate by investing in high-quality, U.S. dollar-denominated short-term money market instruments. Securities Lending Fund investments are valued at the evaluated bid price provided by an independent pricing service. Income earned from investment in the Securities Lending Fund is included in securities lending income on the Statement of Operations.
Security transactions and income recognition
Securities transactions are recorded on a trade date basis. Realized gains or losses are recorded on the basis of identified cost.
Dividend income is recognized on the ex-dividend date. Dividend income is recorded net of foreign taxes withheld where recovery of such taxes is not assured.
Distributions to shareholders
Distributions to shareholders from net investment income and net realized gains, if any, are recorded on the ex-dividend date. Such distributions are determined in conformity with federal income tax regulations, which may differ in amount or character from net investment income and realized gains recognized for purposes of U.S. generally accepted accounting principles.
Federal and other taxes
The Fund intends to continue to qualify as a regulated investment company by distributing substantially all of its investment company taxable income and any net realized capital gains (after reduction for capital loss carryforwards) sufficient to relieve it from all, or substantially all, federal income taxes. Accordingly, no provision for federal income taxes was required.
The Fund’s income and federal excise tax returns and all financial records supporting those returns for the prior three fiscal years are subject to examination by the federal and Delaware revenue authorities. Management has analyzed the Fund’s tax positions taken on federal, state, and foreign tax returns for all open tax years and does not believe that there are any uncertain tax positions that require recognition of a tax liability.
As of July 31, 2016, the Fund had current year deferred post-October capital losses and a qualified late-year ordinary loss which were both recognized on the first day of the current fiscal year in the following amounts:
| | |
Deferred post-October capital losses | | Late-year ordinary losses deferred |
| $(5,015,077) | | $(6,480,064) |
Class allocations
The separate classes of shares offered by the Fund differ principally in applicable sales charges, distribution, shareholder servicing, and administration fees. Class specific expenses are charged directly to that share class. Investment income, common expenses, and realized and unrealized gains (losses) on investments are allocated daily to each class of shares based on the relative proportion of net assets of each class.
3. FAIR VALUATION MEASUREMENTS
Fair value measurements of investments are determined within a framework that has established a fair value hierarchy based upon the various data inputs utilized in determining the value of the Fund’s investments. The three-level hierarchy gives the highest priority to unadjusted quoted prices in active markets for identical assets or liabilities (Level 1) and the lowest priority to significant unobservable inputs (Level 3). The Fund’s investments are classified within the fair value hierarchy based on the lowest level of input that is significant to the fair value measurement. The inputs are summarized into three broad levels as follows:
| | | | |
| 22 | | Wells Fargo Omega Growth Fund | | Notes to financial statements (unaudited) |
| ∎ | | Level 1 – quoted prices in active markets for identical securities |
| ∎ | | Level 2 – other significant observable inputs (including quoted prices for similar securities, interest rates, prepayment speeds, credit risk, etc.) |
| ∎ | | Level 3 – significant unobservable inputs (including the Fund’s own assumptions in determining the fair value of investments) |
The inputs or methodologies used for valuing investments in securities are not necessarily an indication of the risk associated with investing in those securities.
The following is a summary of the inputs used in valuing the Fund’s assets and liabilities as of January 31, 2017:
| | | | | | | | | | | | | | | | |
| | | Quoted prices
(Level 1) | | | Other significant observable inputs
(Level 2) | | | Significant
unobservable inputs (Level 3) | | | Total | |
Assets | | | | | | | | | | | | | | | | |
Investments in: | | | | | | | | | | | | | | | | |
| | | | |
Common stocks | | | | | | | | | | | | | | | | |
Consumer discretionary | | $ | 144,351,979 | | | $ | 0 | | | $ | 0 | | | $ | 144,351,979 | |
Consumer staples | | | 28,818,825 | | | | 0 | | | | 0 | | | | 28,818,825 | |
Financials | | | 49,825,945 | | | | 0 | | | | 0 | | | | 49,825,945 | |
Health care | | | 87,973,398 | | | | 0 | | | | 0 | | | | 87,973,398 | |
Industrials | | | 88,843,204 | | | | 0 | | | | 0 | | | | 88,843,204 | |
Information technology | | | 265,444,272 | | | | 0 | | | | 0 | | | | 265,444,272 | |
Materials | | | 30,591,752 | | | | 0 | | | | 0 | | | | 30,591,752 | |
Real estate | | | 7,863,239 | | | | 0 | | | | 0 | | | | 7,863,239 | |
| | | | |
Short-term investments | | | | | | | | | | | | | | | | |
Investment companies | | | 3,396,550 | | | | 0 | | | | 0 | | | | 3,396,550 | |
Investments measured at net asset value* | | | | | | | | | | | | | | | 4,972,292 | |
Total assets | | $ | 707,109,164 | | | $ | 0 | | | $ | 0 | | | $ | 712,081,456 | |
| * | Investments that are measured at fair value using the net asset value per share (or its equivalent) as a practical expedient have not been categorized in the fair value hierarchy. The fair value amount presented in the table is intended to permit reconciliation of the fair value hierarchy to the amounts presented in the Statement of Assets and Liabilities. The Fund’s investment in Securities Lending Cash Investments, LLC valued at $4,972,292 does not have a redemption period notice, can be redeemed daily and does not have any unfunded commitments. |
The Fund recognizes transfers between levels within the fair value hierarchy at the end of the reporting period. At January 31, 2017, the Fund did not have any transfers into/out of Level 1, Level 2, or Level 3.
4. TRANSACTIONS WITH AFFILIATES AND OTHER EXPENSES
Management fee
Funds Management, an indirect wholly owned subsidiary of Wells Fargo, is the manager of the Fund and provides advisory and fund-level administrative services under an investment management agreement. Under the investment management agreement, Funds Management is responsible for, among other services, implementing the investment objectives and strategies of the Fund, supervising the subadviser, providing fund-level administrative services in connection with the Fund’s operations, and providing any other fund-level administrative services reasonably necessary for the operation of the Fund. As compensation for its services under the investment management agreement, Funds Management is entitled to receive an annual management fee starting at 0.80% and declining to 0.555% as the average daily net assets of the Fund increase. For the six months ended January 31, 2017, the management fee was equivalent to an annual rate of 0.78% of the Fund’s average daily net assets.
Funds Management has retained the services of a subadviser to provide daily portfolio management to the Fund. The fee for subadvisory services is borne by Funds Management. WellsCap is the subadviser to the Fund and is entitled to receive a fee from Funds Management at an annual rate starting at 0.45% and declining to 0.30% as the average daily net assets of the Fund increase.
| | | | | | |
| Notes to financial statements (unaudited) | | Wells Fargo Omega Growth Fund | | | 23 | |
Administration fees
Under a class-level administration agreement, Funds Management provides class-level administrative services to the Fund, which includes paying fees and expenses for services provided by the transfer agent, sub-transfer agents, omnibus account servicers and record-keepers. As compensation for its services under the class-level administration agreement, Funds Management receives an annual fee which is calculated based on the average daily net assets of each class as follows:
| | | | |
| | | Class-level
administration fee | |
Class A, Class B, Class C, Class R | | | 0.21 | % |
Administrator Class, Institutional Class | | | 0.13 | |
Funds Management has contractually waived and/or reimbursed management and administration fees to the extent necessary to maintain certain net operating expense ratios for the Fund. Waiver of fees and/or reimbursement of expenses by Funds Management were made first from fund level expenses on a proportionate basis and then from class specific expenses. Funds Management has committed through November 30, 2017 to waive fees and/or reimburse expenses to the extent necessary to cap the Fund’s expenses at 1.30% for Class A shares, 2.05% for Class B shares, 2.05% for Class C shares, 1.55% for Class R shares, 1.10% for Administrator Class shares, and 0.85% for Institutional Class shares. After this time, the cap may be increased or the commitment to maintain the cap may be terminated only with the approval of the Board of Trustees.
During the six months ended January 31, 2017, State Street Bank and Trust Company, the Fund’s custodian, reimbursed the Fund $2,522 for certain out-of-pocket expenses that were billed to the Fund in error from 1998-2015. This amount is included in dividend income on the Statement of Operations. In addition, Funds Management was also reimbursed $10,547 for waivers/reimbursements it made to the Fund during the period the Fund was erroneously billed.
Distribution fees
The Trust has adopted a distribution plan for Class B, Class C, and Class R shares of the Fund pursuant to Rule 12b-1 under the 1940 Act. Distribution fees are charged to Class B, Class C, and Class R shares and paid to Wells Fargo Funds Distributor, LLC (“Funds Distributor”), the principal underwriter, at an annual rate of 0.75% of the average daily net assets of Class B and Class C shares and 0.25% of the average daily net assets of Class R shares.
In addition, Funds Distributor is entitled to receive the front-end sales charge from the purchase of Class A shares and a contingent deferred sales charge on the redemption of certain Class A shares. Funds Distributor is also entitled to receive the contingent deferred sales charges from redemptions of Class B and Class C shares. For the six months ended January 31, 2017, Funds Distributor received $4,596 from the sale of Class A shares and $268 in contingent deferred sales charges from redemptions of Class C shares.
Shareholder servicing fees
The Trust has entered into contracts with one or more shareholder servicing agents, whereby Class A, Class B, Class C, Class R, and Administrator Class of the Fund are charged a fee at an annual rate of 0.25% of the average daily net assets of each respective class.
A portion of these total shareholder servicing fees were paid to affiliates of Wells Fargo.
5. INVESTMENT PORTFOLIO TRANSACTIONS
Purchases and sales of investments, excluding U.S. government obligations (if any) and short-term securities, for the six months ended January 31, 2017 were $312,423,583 and $403,122,683, respectively.
The Fund may purchase or sell investment securities to other Wells Fargo funds under procedures adopted by the Board of Trustees. The procedures have been designed to ensure that these interfund transactions, which generally do not incur broker commissions, are effected at current market prices. Interfund trades are included within the respective purchases and sales amounts shown.
6. BANK BORROWINGS
The Trust (excluding the money market funds and certain other funds) and Wells Fargo Variable Trust are parties to a $250,000,000 revolving credit agreement whereby the Fund is permitted to use bank borrowings for temporary or emergency purposes, such as to fund shareholder redemption requests. Interest under the credit agreement is charged to the Fund based on a borrowing rate equal to the higher of the Federal Funds rate in effect on that day plus 1.25% or
| | | | |
| 24 | | Wells Fargo Omega Growth Fund | | Notes to financial statements (unaudited) |
the overnight LIBOR rate in effect on that day plus 1.25%. In addition, an annual commitment fee equal to 0.25% of the unused balance is allocated to each participating fund. Prior to August 30, 2016, the revolving credit agreement amount was $200,000,000 and the annual commitment fee was equal to 0.20% of the unused balance which was allocated to each participating fund.
For the six months ended January 31, 2017, there were no borrowings by the Fund under the agreement.
7. CONCENTRATION RISK
Concentration risks result from exposure to a limited number of sectors. A fund that invests a substantial portion of its assets in any sector may be more affected by changes in that sector than would be a fund whose investments are not heavily weighted in any sector.
8. INDEMNIFICATION
Under the Trust’s organizational documents, the officers and Trustees have been granted certain indemnification rights against certain liabilities that may arise out of performance of their duties to the Trust. Additionally, in the normal course of business, the Trust may enter into contracts with service providers that contain a variety of indemnification clauses. The Trust’s maximum exposure under these arrangements is dependent on future claims that may be made against the Fund and, therefore, cannot be estimated.
9. NEW ACCOUNTING PRONOUNCEMENT
In December 2016, the Financial Accounting Standards Board (“FASB”) issued Accounting Standard Update (“ASU”) No. 2016-19, Technical Corrections and Improvements. ASU 2016-19 includes an amendment to FASB ASC Topic 820, Fair Value Measurement which clarifies the difference between a valuation approach and a valuation technique. The amendment also requires an entity to disclose when there has been a change in either or both a valuation approach and/or a valuation technique. The disclosure requirements are effective for fiscal years and interim periods within those fiscal years beginning after December 15, 2016. Management is currently evaluating the potential impact of this new guidance to the financial statements.
10. REGULATORY CHANGES
In October 2016, the Securities and Exchange Commission (“SEC”) adopted new rules and forms and amended existing rules and forms (together, “final rules”) intended to modernize and enhance the reporting and disclosure of information by registered investment companies and to enhance liquidity risk management by open-end mutual funds and exchange-traded funds. The final rules will enhance the quality of information available to investors and will allow the SEC to more effectively collect and use data reported by funds. In part, the final rules amend Regulation S-X and require standardized, enhanced disclosure about derivatives in the Fund’s financial statements, as well as other amendments. The compliance date for the amendments to Regulation S-X is August 1, 2017 while the compliance date for the new form types is June 1, 2018 and the compliance date for the liquidity risk management program requirements is December 1, 2018. Management is currently assessing the potential impact of these enhancements and their impact on the financial statement disclosures and reporting requirements.
| | | | | | |
| Other information (unaudited) | | Wells Fargo Omega Growth Fund | | | 25 | |
PROXY VOTING INFORMATION
A description of the policies and procedures that the Fund uses to determine how to vote proxies relating to portfolio securities is available, upon request, by calling 1-800-222-8222, visiting our website at wellsfargofunds.com, or visiting the SEC website at sec.gov. Information regarding how the Fund voted proxies relating to portfolio securities during the most recent 12-month period ended June 30 is available on the Fund’s website at wellsfargofunds.com or by visiting the SEC website at sec.gov.
PORTFOLIO HOLDINGS INFORMATION
The complete portfolio holdings for the Fund are publicly available monthly on the Fund’s website (wellsfargofunds.com), on a one-month delayed basis. In addition, top ten holdings information (excluding derivative positions) for the Fund is publicly available on the Fund’s website on a monthly, seven-day or more delayed basis. The Fund files its complete schedule of portfolio holdings with the SEC for the first and third quarters of each fiscal year on Form N-Q, which is available by visiting the SEC website at sec.gov. In addition, the Fund’s Form N-Q may be reviewed and copied at the SEC’s Public Reference Room in Washington, DC, and at regional offices in New York City, at 233 Broadway, and in Chicago, at 175 West Jackson Boulevard, Suite 900. Information about the Public Reference Room may be obtained by calling 1-800-SEC-0330.
| | | | |
| 26 | | Wells Fargo Omega Growth Fund | | Other information (unaudited) |
BOARD OF TRUSTEES AND OFFICERS
Each of the Trustees and Officers1 listed in the table below acts in identical capacities for each fund in the Wells Fargo family of funds, which consists of 138 mutual funds comprising the Wells Fargo Funds Trust, Wells Fargo Variable Trust, Wells Fargo Master Trust and four closed-end funds (collectively the “Fund Complex”). This table should be read in conjunction with the Prospectus and the Statement of Additional Information2. The mailing address of each Trustee and Officer is 525 Market Street, 12th Floor, San Francisco, CA 94105. Each Trustee and Officer serves an indefinite term, however, each Trustee serves such term until reaching the mandatory retirement age established by the Trustees.
Independent Trustees
| | | | | | |
Name and year of birth | | Position held and length of service* | | Principal occupations during past five years or longer | | Current other public company or investment company directorships |
William R. Ebsworth (Born 1957) | | Trustee, since 2015 | | Retired. From 1984 to 2013, equities analyst, portfolio manager, research director and chief financial officer at Fidelity Management and Research Company in Boston, Tokyo, and Hong Kong and retired in 2013 as Chief Investment Officer of Fidelity Strategic Advisers, Inc. where he lead a team of investment professionals managing client assets. Prior thereto, Board member of Hong Kong Securities Clearing Co., Hong Kong Options Clearing Corp., the Thailand International Fund, Ltd., Fidelity Investments Life Insurance Company, and Empire Fidelity Investments Life Insurance Company. Board member of the Fonté Foundation (non-profit organization) and the Vincent Memorial Hospital Endowment (non-profit organization), where he serves on the Investment Committee and as a Chair of the Audit Committee. Mr. Ebsworth is a CFA® charterholder and an Adjunct Lecturer, Finance, at Babson College. | | Asset Allocation Trust |
Jane A. Freeman (Born 1953) | | Trustee, since 2015 | | Retired. From 2012 to 2014 and 1999 to 2008, Chief Financial Officer of Scientific Learning Corporation. From 2008 to 2012, Ms. Freeman provided consulting services related to strategic business projects. Prior to 1999, Portfolio Manager at Rockefeller & Co. and Scudder, Stevens & Clark. Board member of the Harding Loevner Funds from 1996 to 2014, serving as both Lead Independent Director and chair of the Audit Committee. Board member of the Russell Exchange Traded Funds Trust from 2011 to 2012 and the chair of the Audit Committee. Ms. Freeman is Chair of Taproot Foundation (non-profit organization), a Board Member of Ruth Bancroft Garden (non-profit organization) and an inactive chartered financial analyst. | | Asset Allocation Trust |
Peter G. Gordon** (Born 1942) | | Trustee, since 1998; Chairman, since 2005 | | Co-Founder, Retired Chairman, President and CEO of Crystal Geyser Water Company. Trustee Emeritus, Colby College. | | Asset Allocation Trust |
Isaiah Harris, Jr. (Born 1952) | | Trustee, since 2009 | | Retired. Chairman of the Board of CIGNA Corporation since 2009, and Director since 2005. From 2003 to 2011, Director of Deluxe Corporation. Prior thereto, President and CEO of BellSouth Advertising and Publishing Corp. from 2005 to 2007, President and CEO of BellSouth Enterprises from 2004 to 2005 and President of BellSouth Consumer Services from 2000 to 2003. Emeritus member of the Iowa State University Foundation Board of Governors. Emeritus Member of the Advisory Board of Iowa State University School of Business. Advisory Board Member, Palm Harbor Academy (charter school). Advisory Board Member, Child Evangelism Fellowship (non-profit). Mr. Harris is a certified public accountant (inactive status). | | CIGNA Corporation; Asset Allocation Trust |
Judith M. Johnson (Born 1949) | | Trustee, since 2008; Audit Committee Chairman, since 2008 | | Retired. Prior thereto, Chief Executive Officer and Chief Investment Officer of Minneapolis Employees Retirement Fund from 1996 to 2008. Ms. Johnson is an attorney, certified public accountant and a certified managerial accountant. | | Asset Allocation Trust |
David F. Larcker (Born 1950) | | Trustee, since 2009 | | James Irvin Miller Professor of Accounting at the Graduate School of Business, Stanford University, Director of the Corporate Governance Research Initiative and Senior Faculty of The Rock Center for Corporate Governance since 2006. From 2005 to 2008, Professor of Accounting at the Graduate School of Business, Stanford University. Prior thereto, Ernst & Young Professor of Accounting at The Wharton School, University of Pennsylvania from 1985 to 2005. | | Asset Allocation Trust |
| | | | | | |
| Other information (unaudited) | | Wells Fargo Omega Growth Fund | | | 27 | |
| | | | | | |
Name and year of birth | | Position held and length of service* | | Principal occupations during past five years or longer | | Current other public company or investment company directorships |
Olivia S. Mitchell (Born 1953) | | Trustee, since 2006 | | International Foundation of Employee Benefit Plans Professor, Wharton School of the University of Pennsylvania since 1993. Director of Wharton’s Pension Research Council and Boettner Center on Pensions & Retirement Research, and Research Associate at the National Bureau of Economic Research. Previously, Cornell University Professor from 1978 to 1993. | | Asset Allocation Trust |
Timothy J. Penny (Born 1951) | | Trustee, since 1996 | | President and Chief Executive Officer of Southern Minnesota Initiative Foundation, a non-profit organization, since 2007 and Senior Fellow at the Humphrey Institute Policy Forum at the University of Minnesota since 1995. Member of the Board of Trustees of NorthStar Education Finance, Inc., a non-profit organization, since 2007. | | Asset Allocation Trust |
Michael S. Scofield (Born 1943) | | Trustee, since 2010 | | Served on the Investment Company Institute’s Board of Governors and Executive Committee from 2008-2011 as well the Governing Council of the Independent Directors Council from 2006-2011 and the Independent Directors Council Executive Committee from 2008-2011. Chairman of the IDC from 2008-2010. Institutional Investor (Fund Directions) Trustee of Year in 2007. Trustee of the Evergreen Funds complex (and its predecessors) from 1984 to 2010. Chairman of the Evergreen Funds from 2000-2010. Former Trustee of the Mentor Funds. Retired Attorney, Law Offices of Michael S. Scofield. | | Asset Allocation Trust |
| * | Length of service dates reflect the Trustee’s commencement of service with the Trust’s predecessor entities, where applicable. |
| ** | Peter Gordon is expected to retire on December 31, 2017. |
Officers
| | | | | | |
Name and year of birth | | Position held and length of service | | Principal occupations during past five years or longer | | |
Andrew Owen (Born 1960) | | President, since 2017 | | Executive Vice President of Wells Fargo Bank, N.A. and President of Wells Fargo & Company and Head of Affiliated Managers, Wells Fargo Asset Management, since 2014. Executive Vice President responsible for marketing, investments and product development for Wells Fargo Funds Management, LLC, from 2009 to 2014. | | |
Jeremy DePalma1 (Born 1974) | | Treasurer, since 2012 | | Senior Vice President of Wells Fargo Funds Management, LLC since 2009. Senior Vice President of Evergreen Investment Management Company, LLC from 2008 to 2010 and head of the Fund Reporting and Control Team within Fund Administration from 2005 to 2010. | | |
C. David Messman (Born 1960) | | Secretary, since 2000; Chief Legal Officer, since 2003 | | Senior Vice President and Secretary of Wells Fargo Funds Management, LLC since 2001. Assistant General Counsel of Wells Fargo Bank, N.A. since 2013 and Vice President and Managing Counsel of Wells Fargo Bank, N.A. from 1996 to 2013. | | |
Michael Whitaker (Born 1967) | | Chief Compliance Officer, since 2016 | | Executive Vice President of Wells Fargo Funds Management, LLC since 2016. Chief Compliance Officer of Fidelity’s Fixed Income Funds and Asset Allocation Funds from 2008 to 2016, Compliance Officer of FMR Co., Inc. from 2014 to 2016, Fidelity Investments Money Management, Inc. from 2014 to 2016, Fidelity Investments from 2007 to 2016. | | |
David Berardi (Born 1975) | | Assistant Treasurer, since 2009 | | Vice President of Wells Fargo Funds Management, LLC since 2009. Vice President of Evergreen Investment Management Company, LLC from 2008 to 2010. Manager of Fund Reporting and Control for Evergreen Investment Management Company, LLC from 2004 to 2010. | | |
| 1 | Jeremy DePalma acts as Treasurer of 69 funds and Assistant Treasurer of 69 funds in the Fund Complex. |
| 2 | The Statement of Additional Information includes additional information about the Trustees and is available, without charge, upon request, by calling 1-800-222-8222 or by visiting the website at wellsfargofunds.com. |
| | | | |
| 28 | | Wells Fargo Omega Growth Fund | | List of abbreviations |
The following is a list of common abbreviations for terms and entities that may have appeared in this report.
| ACA | — ACA Financial Guaranty Corporation |
| ADR | — American depositary receipt |
| ADS | — American depositary shares |
| AGC | — Assured Guaranty Corporation |
| AGM | — Assured Guaranty Municipal |
| Ambac | — Ambac Financial Group Incorporated |
| AMT | — Alternative minimum tax |
| BAN | — Bond anticipation notes |
| BHAC | — Berkshire Hathaway Assurance Corporation |
| CAB | — Capital appreciation bond |
| CCAB | — Convertible capital appreciation bond |
| CDA | — Community Development Authority |
| CDO | — Collateralized debt obligation |
| DRIVER | — Derivative inverse tax-exempt receipts |
| DW&P | — Department of Water & Power |
| DWR | — Department of Water Resources |
| ECFA | — Educational & Cultural Facilities Authority |
| EDA | — Economic Development Authority |
| EDFA | — Economic Development Finance Authority |
| ETF | — Exchange-traded fund |
| FDIC | — Federal Deposit Insurance Corporation |
| FFCB | — Federal Farm Credit Banks |
| FGIC | — Financial Guaranty Insurance Corporation |
| FHA | — Federal Housing Administration |
| FHLB | — Federal Home Loan Bank |
| FHLMC | — Federal Home Loan Mortgage Corporation |
| FICO | — The Financing Corporation |
| FNMA | — Federal National Mortgage Association |
| GDR | — Global depositary receipt |
| GNMA | — Government National Mortgage Association |
| HCFR | — Healthcare facilities revenue |
| HEFA | — Health & Educational Facilities Authority |
| HEFAR | — Higher education facilities authority revenue |
| HFA | — Housing Finance Authority |
| HFFA | — Health Facilities Financing Authority |
| HUD | — Department of Housing and Urban Development |
| IDA | — Industrial Development Authority |
| IDAG | — Industrial Development Agency |
| KRW | — Republic of Korea won |
| LIBOR | — London Interbank Offered Rate |
| LIFER | — Long Inverse Floating Exempt Receipts |
| LLC | — Limited liability company |
| LLLP | — Limited liability limited partnership |
| LLP | — Limited liability partnership |
| MBIA | — Municipal Bond Insurance Association |
| MFHR | — Multifamily housing revenue |
| MSTR | — Municipal securities trust receipts |
| MUD | — Municipal Utility District |
| National | — National Public Finance Guarantee Corporation |
| PCFA | — Pollution Control Financing Authority |
| PCL | — Public Company Limited |
| PCR | — Pollution control revenue |
| PFA | — Public Finance Authority |
| PFFA | — Public Facilities Financing Authority |
| PFOTER | — Puttable floating option tax-exempt receipts |
| plc | — Public limited company |
| PUTTER | — Puttable tax-exempt receipts |
| R&D | — Research & development |
| Radian | — Radian Asset Assurance |
| RAN | — Revenue anticipation notes |
| RDA | — Redevelopment Authority |
| RDFA | — Redevelopment Finance Authority |
| REIT | — Real estate investment trust |
| ROC | — Reset option certificates |
| SAVRS | — Select auction variable rate securities |
| SBA | — Small Business Authority |
| SDR | — Swedish depositary receipt |
| SFHR | — Single-family housing revenue |
| SFMR | — Single-family mortgage revenue |
| SPA | — Standby purchase agreement |
| SPDR | — Standard & Poor’s Depositary Receipts |
| SPEAR | — Short Puttable Exempt Adjustable Receipts |
| STRIPS | — Separate trading of registered interest and |
| TAN | — Tax anticipation notes |
| TIPS | — Treasury inflation-protected securities |
| TRAN | — Tax revenue anticipation notes |
| TTFA | — Transportation Trust Fund Authority |
| TVA | — Tennessee Valley Authority |

For more information
More information about Wells Fargo Funds is available free upon request. To obtain literature, please write, email, visit the Fund’s website, or call:
Wells Fargo Funds
P.O. Box 8266
Boston, MA 02266-8266
Email: fundservice@wellsfargo.com
Website: wellsfargofunds.com
Individual investors: 1-800-222-8222
Retail investment professionals: 1-888-877-9275
Institutional investment professionals: 1-866-765-0778
This report and the financial statements contained herein are submitted for the general information of the shareholders of the Fund. If this report is used for promotional purposes, distribution of the report must be accompanied or preceded by a current prospectus. Before investing, please consider the investment objectives, risks, charges, and expenses of the investment. For a current prospectus and, if available, a summary prospectus, containing this information, call 1-800-222-8222 or visit the Fund’s website at wellsfargofunds.com. Read the prospectus carefully before you invest or send money.
Wells Fargo Asset Management (WFAM) is a trade name used by the asset management businesses of Wells Fargo & Company. Wells Fargo Funds Management, LLC, a wholly owned subsidiary of Wells Fargo & Company, provides investment advisory and administrative services for Wells Fargo Funds. Other affiliates of Wells Fargo & Company provide subadvisory and other services for the funds. The funds are distributed by Wells Fargo Funds Distributor, LLC, Member FINRA, an affiliate of Wells Fargo & Company. Neither Wells Fargo Funds Management nor Wells Fargo Funds Distributor has Fund customer accounts/assets, and neither provides investment advice/recommendations or acts as an investment advice fiduciary to any investor.
NOT FDIC INSURED ◾ NO BANK GUARANTEE ◾ MAY LOSE VALUE
© 2017 Wells Fargo Funds Management, LLC. All rights reserved.
| | |
 | | 301464 03-17 SA211/SAR211 01-17 |
Semi-Annual Report
January 31, 2017

Wells Fargo
Premier Large Company Growth Fund


Reduce clutter. Save trees.
Sign up for electronic delivery of prospectuses and shareholder reports at wellsfargo.com/advantagedelivery
Contents
The views expressed and any forward-looking statements are as of January 31, 2017, unless otherwise noted, and are those of the Fund managers and/or Wells Fargo Funds Management, LLC. Discussions of individual securities, or the markets generally, or any Wells Fargo Fund are not intended as individual recommendations. Future events or results may vary significantly from those expressed in any forward-looking statements. The views expressed are subject to change at any time in response to changing circumstances in the market. Wells Fargo Funds Management, LLC and the Fund disclaim any obligation to publicly update or revise any views expressed or forward-looking statements.
NOT FDIC INSURED ◾ NO BANK GUARANTEE ◾ MAY LOSE VALUE
| | | | |
| 2 | | Wells Fargo Premier Large Company Growth Fund | | Letter to shareholders (unaudited) |

Andrew Owen
President
Wells Fargo Funds
U.S. and international stocks returned 5.96% and 4.16% for the six-month period, respectively; within fixed income, the Bloomberg Barclays U.S. Aggregate Bond Index3 returned -2.95%.
Dear Shareholder:
As the new president of Wells Fargo Funds now that Karla Rabusch is retiring from that position after nearly 14 years, I am pleased to offer you this semi-annual report for the Wells Fargo Premier Large Company Growth Fund for the six-month period that ended January 31, 2017. Despite heightened market volatility, global stocks delivered favorable results overall. U.S. and international stocks returned 5.96% and 4.16% for the six-month period, respectively, as measured by the S&P 500 Index1 and the MSCI ACWI ex USA Index (Net)2; within fixed income, the Bloomberg Barclays U.S. Aggregate Bond Index3 returned -2.95%.
In August–September 2016, global stocks delivered generally positive results; bonds’ interest rates remained historically low.
From August into early September 2016, U.S. and international stocks generally trended upward. Ever since the Great Recession, markets worldwide have been supported to varying degrees by accommodative policies from leading central banks, including the Federal Reserve (Fed), European Central Bank, Bank of England, and Bank of Japan. As a result, investors have watched closely for any signs that global central banks might tighten their measures. In the U.S., early-September comments by several Fed officials appeared to suggest a September interest-rate increase, which sent stock and bond prices downward. However, stocks surged following the Fed’s September 20 meeting on news that the Fed had decided to delay a rate increase to later in 2016. In bond markets, interest rates remained at historically low levels as a result of easy monetary policies, subdued global growth, and modest inflation expectations. Yields rose, after bottoming in July, as market participants felt that yields had overshot the real risks of the U.K.’s Brexit vote and as economic activity strengthened. At the front end of the yield curve, anticipation of new money market fund rules resulted in significantly higher yields on many short-term securities.
During the fourth quarter of 2016, prospects for faster growth and higher interest rates in the U.S. largely influenced the markets.
Early in the fourth quarter of 2016, U.S. stocks tended to trade lower amid concerns such as a likely interest-rate increase and uncertainty over the approaching general election. However, following Donald Trump’s election as president in early November, U.S. stocks began to rally. Investors appeared optimistic that the new administration would usher in a series of pro-growth policies, and supportive economic news helped the rally carry through the quarter. The buoyant environment sent interest rates higher as well. At its mid-December meeting, Fed officials raised their short-term target interest rate for the first time in a year, by a quarter percentage point, to between 0.50% and 0.75%. The fourth quarter also saw the implementation of the Securities and Exchange Commission’s new rules for money market funds, which included floating net asset values (NAVs) for institutional prime and municipal money market funds as well as liquidity fees and redemption gates. In the year leading up to
| 1 | The S&P 500 Index consists of 500 stocks chosen for market size, liquidity, and industry group representation. It is a market-value-weighted index with each stock’s weight in the index proportionate to its market value. You cannot invest directly in an index. |
| 2 | The Morgan Stanley Capital International (MSCI) All Country World Index (ACWI) ex USA Index (Net) is a free-float-adjusted market-capitalization-weighted index that is designed to measure the equity market performance of developed markets, excluding the United States and Canada. Source: MSCI. MSCI makes no express or implied warranties or representations and shall have no liability whatsoever with respect to any MSCI data contained herein. The MSCI data may not be further redistributed or used as a basis for other indexes or any securities or financial products. This report is not approved, reviewed, or produced by MSCI. You cannot invest directly in an index. |
| 3 | The Bloomberg Barclays U.S. Aggregate Bond Index (formerly known as Barclays U.S. Aggregate Bond Index) is a broad-based benchmark that measures the investment-grade, U.S. dollar–denominated, fixed-rate taxable bond market, including Treasuries, government-related and corporate securities, mortgage-backed securities (agency fixed-rate and hybrid adjustable-rate mortgage pass-throughs), asset-backed securities, and commercial mortgage-backed securities. You cannot invest directly in an index. |
| | | | | | |
| Letter to shareholders (unaudited) | | Wells Fargo Premier Large Company Growth Fund | | | 3 | |
money fund reform implementation, nearly $1 trillion in assets moved from these types of money market funds into government money market funds, which continued to transact at a stable $1 NAV. Outside of the U.S., the prospects for faster U.S. growth appeared to trigger some acceleration in Europe. The improvement may be partly attributable to expectations for further strengthening of the U.S. dollar, which in turn could improve demand for European goods in the U.S. due to weakening of the euro relative to the dollar.
Investor optimism continued into January 2017.
January brought continued strength in global stock markets. Markets were lifted by factors such as strong trade data from Japan, robust earnings reports by businesses, and investors’ hopes that the U.S. government will approve a large fiscal stimulus package.
Don’t let short-term uncertainty derail long-term investment goals.
Periods of uncertainty can present challenges, but experience has taught us that maintaining long-term investment goals can be an effective way to plan for the future. To help you create a sound strategy based on your personal goals and risk tolerance, Wells Fargo Funds offers more than 100 mutual funds spanning a wide range of asset classes and investment styles. Although diversification cannot guarantee an investment profit or prevent losses, we believe it can be an effective way to manage investment risk and potentially smooth out overall portfolio performance. We encourage investors to know their investments and to understand that appropriate levels of risk-taking may unlock opportunities.
Thank you for choosing to invest in Wells Fargo Funds. We appreciate your confidence in us and remain committed to helping you meet your financial needs.
Sincerely,

Andrew Owen
President
Wells Fargo Funds
Although diversification cannot guarantee an investment profit or prevent losses, we believe it can be an effective way to manage investment risk and potentially smooth out overall portfolio performance.
For further information about your Fund, contact your investment professional, visit our website at wellsfargofunds.com, or call us directly at 1-800-222-8222. We are available 24 hours a day, 7 days a week.
| | | | |
| 4 | | Wells Fargo Premier Large Company Growth Fund | | Performance highlights (unaudited) |
Investment objective
The Fund seeks long-term capital appreciation.
Manager
Wells Fargo Funds Management, LLC
Subadviser
Wells Capital Management Incorporated
Portfolio managers
Joseph M. Eberhardy, CFA®, CPA
Thomas C. Ognar, CFA®
Bruce C. Olson, CFA®
Average annual total returns (%) as of January 31, 20171
| | | | | | | | | | | | | | | | | | | | | | | | | | | | | | | | | | |
| | | | | Including sales charge | | | Excluding sales charge | | | Expense ratios2 (%) | |
| | | Inception date | | 1 year | | | 5 year | | | 10 year | | | 1 year | | | 5 year | | | 10 year | | | Gross | | | Net3 | |
| Class A (EKJAX) | | 1-20-1998 | | | 4.51 | | | | 8.98 | | | | 7.64 | | | | 10.86 | | | | 10.28 | | | | 8.28 | | | | 1.13 | | | | 1.11 | |
| Class B (EKJBX)* | | 9-11-1935 | | | 5.14 | | | | 9.17 | | | | 7.71 | | | | 10.00 | | | | 9.46 | | | | 7.71 | | | | 1.88 | | | | 1.86 | |
| Class C (EKJCX) | | 1-22-1998 | | | 9.04 | | | | 9.46 | | | | 7.47 | | | | 10.04 | | | | 9.46 | | | | 7.47 | | | | 1.88 | | | | 1.86 | |
| Class R4 (EKJRX) | | 11-30-2012 | | | – | | | | – | | | | – | | | | 11.17 | | | | 10.65 | | | | 8.61 | | | | 0.85 | | | | 0.80 | |
| Class R6 (EKJFX) | | 11-30-2012 | | | – | | | | – | | | | – | | | | 11.42 | | | | 10.80 | | | | 8.68 | | | | 0.70 | | | | 0.65 | |
| Administrator Class (WFPDX) | | 7-16-2010 | | | – | | | | – | | | | – | | | | 10.99 | | | | 10.47 | | | | 8.41 | | | | 1.05 | | | | 1.00 | |
| Institutional Class (EKJYX) | | 6-30-1999 | | | – | | | | – | | | | – | | | | 11.27 | | | | 10.76 | | | | 8.66 | | | | 0.80 | | | | 0.70 | |
| Russell 1000® Growth Index4 | | – | | | – | | | | – | | | | – | | | | 17.23 | | | | 13.93 | | | | 8.42 | | | | – | | | | – | |
| * | | Class B shares are closed to investment, except in connection with the reinvestment of any distributions and permitted exchanges. |
Figures quoted represent past performance, which is no guarantee of future results, and do not reflect taxes that a shareholder may pay on fund distributions or the redemption of fund shares. Investment return and principal value of an investment will fluctuate so that an investor’s shares, when redeemed, may be worth more or less than their original cost. Performance shown without sales charges would be lower if sales charges were reflected. Current performance may be lower or higher than the performance data quoted, which assumes the reinvestment of dividends and capital gains. Current month-end performance is available on the Fund’s website, wellsfargofunds.com.
Index returns do not include transaction costs associated with buying and selling securities, any mutual fund fees or expenses, or any taxes. It is not possible to invest directly in an index.
For Class A shares, the maximum front-end sales charge is 5.75%. For Class B shares, the maximum contingent deferred sales charge is 5.00%. For Class C shares, the maximum contingent deferred sales charge is 1.00%. Performance including a contingent deferred sales charge assumes the sales charge for the corresponding time period. Class R4, Class R6, Administrator Class, and Institutional Class shares are sold without a front-end sales charge or contingent deferred sales charge.
Stock values fluctuate in response to the activities of individual companies and general market and economic conditions. Certain investment strategies tend to increase the total risk of an investment (relative to the broader market). The Fund is exposed to foreign investment risk. Consult the Fund’s prospectus for additional information on these and other risks.
Please see footnotes on page 5.
| | | | | | |
| Performance highlights (unaudited) | | Wells Fargo Premier Large Company Growth Fund | | | 5 | |
| | | | |
| Ten largest holdings (%) as of January 31, 20175 | |
Facebook Incorporated Class A | | | 6.49 | |
Amazon.com Incorporated | | | 6.20 | |
Alphabet Incorporated Class A | | | 5.37 | |
Microsoft Corporation | | | 3.78 | |
Visa Incorporated Class A | | | 3.20 | |
Microchip Technology Incorporated | | | 3.05 | |
Celgene Corporation | | | 2.76 | |
Acadia Healthcare Company Incorporated | | | 2.59 | |
Union Pacific Corporation | | | 2.51 | |
The Home Depot Incorporated | | | 2.45 | |
|
| Sector distribution as of January 31, 20176 |
|
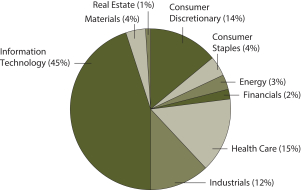 |
| 1 | Historical performance shown for Class R4 shares prior to their inception reflects the performance of Institutional Class shares, adjusted to reflect the higher expenses applicable to Class R4 shares. Historical performance shown for Class R6 shares prior to their inception reflects the performance of Institutional Class shares, and includes the higher expenses applicable to Institutional Class shares. If these expenses had not been included, returns would be higher. Historical performance shown for Administrator Class shares prior to their inception reflects the performance of Institutional Class shares, adjusted to reflect the higher expenses applicable to Administrator Class shares. Historical performance shown for all classes of the Fund prior to July 19, 2010, is based on the performance of the Fund’s predecessor, Evergreen Large Company Growth Fund. |
| 2 | Reflects the expense ratios as stated in the most recent prospectuses. The expense ratios shown are subject to change and may differ from the annualized expense ratios shown in the financial highlights of this report. |
| 3 | The manager has contractually committed through November 30, 2017, to waive fees and/or reimburse expenses to the extent necessary to cap the Fund’s Total Annual Fund Operating Expenses After Fee Waiver at the amounts shown. After this time, the cap may be increased or the commitment to maintain the cap may be terminated only with the approval of the Board of Trustees. Brokerage commissions, stamp duty fees, interest, taxes, acquired fund fees and expenses, and extraordinary expenses are excluded from the expense cap. Without this cap, the Fund’s returns would have been lower. |
| 4 | The Russell 1000® Growth Index measures the performance of those Russell 1000 companies with higher price-to-book ratios and higher forecasted growth values. You cannot invest directly in an index. |
| 5 | The ten largest holdings, excluding cash and cash equivalents, are calculated based on the value of the investments divided by total net assets of the Fund. Holdings are subject to change and may have changed since the date specified. |
| 6 | Amounts are calculated based on the total long-term investments of the Fund. These amounts are subject to change and may have changed since the date specified. |
| | | | |
| 6 | | Wells Fargo Premier Large Company Growth Fund | | Fund expenses (unaudited) |
As a shareholder of the Fund, you incur two types of costs: (1) transaction costs, including sales charges (loads) on purchase payments and contingent deferred sales charges (if any) on redemptions and (2) ongoing costs, including management fees, distribution (12b-1) and/or shareholder servicing fees, and other Fund expenses. This example is intended to help you understand your ongoing costs (in dollars) of investing in the Fund and to compare these costs with the ongoing costs of investing in other mutual funds.
The example is based on an investment of $1,000 invested at the beginning of the six-month period and held for the entire period from August 1, 2016 to January 31, 2017.
Actual expenses
The “Actual” line of the table below provides information about actual account values and actual expenses. You may use the information in this line, together with the amount you invested, to estimate the expenses that you paid over the period. Simply divide your account value by $1,000 (for example, an $8,600 account value divided by $1,000 = 8.6), then multiply the result by the number in the “Actual” line under the heading entitled “Expenses paid during period” for your applicable class of shares to estimate the expenses you paid on your account during this period.
Hypothetical example for comparison purposes
The “Hypothetical” line of the table below provides information about hypothetical account values and hypothetical expenses based on the Fund’s actual expense ratio and an assumed rate of return of 5% per year before expenses, which is not the Fund’s actual return. The hypothetical account values and expenses may not be used to estimate the actual ending account balance or expenses you paid for the period. You may use this information to compare the ongoing costs of investing in the Fund and other funds. To do so, compare this 5% hypothetical example with the 5% hypothetical examples that appear in the shareholder reports of the other funds.
Please note that the expenses shown in the table are meant to highlight your ongoing costs only and do not reflect any transactional costs, such as sales charges (loads) and contingent deferred sales charges. Therefore, the “Hypothetical” line of the table is useful in comparing ongoing costs only and will not help you determine the relative total costs of owning different funds. In addition, if these transactional costs were included, your costs would have been higher.
| | | | | | | | | | | | | | | | |
| | | Beginning
account value
8-1-2016 | | | Ending
account value
1-31-2017 | | | Expenses
paid during
the period¹ | | | Annualized net
expense ratio | |
Class A | | | | | | | | | | | | | | | | |
Actual | | $ | 1,000.00 | | | $ | 1,006.62 | | | $ | 5.60 | | | | 1.11 | % |
Hypothetical (5% return before expenses) | | $ | 1,000.00 | | | $ | 1,019.56 | | | $ | 5.63 | | | | 1.11 | % |
Class B | | | | | | | | | | | | | | | | |
Actual | | $ | 1,000.00 | | | $ | 1,002.81 | | | $ | 9.36 | | | | 1.86 | % |
Hypothetical (5% return before expenses) | | $ | 1,000.00 | | | $ | 1,015.79 | | | $ | 9.42 | | | | 1.86 | % |
Class C | | | | | | | | | | | | | | | | |
Actual | | $ | 1,000.00 | | | $ | 1,002.93 | | | $ | 9.36 | | | | 1.86 | % |
Hypothetical (5% return before expenses) | | $ | 1,000.00 | | | $ | 1,015.79 | | | $ | 9.42 | | | | 1.86 | % |
Class R4 | | | | | | | | | | | | | | | | |
Actual | | $ | 1,000.00 | | | $ | 1,007.90 | | | $ | 4.04 | | | | 0.80 | % |
Hypothetical (5% return before expenses) | | $ | 1,000.00 | | | $ | 1,021.11 | | | $ | 4.06 | | | | 0.80 | % |
Class R6 | | | | | | | | | | | | | | | | |
Actual | | $ | 1,000.00 | | | $ | 1,009.24 | | | $ | 3.28 | | | | 0.65 | % |
Hypothetical (5% return before expenses) | | $ | 1,000.00 | | | $ | 1,021.87 | | | $ | 3.30 | | | | 0.65 | % |
Administrator Class | | | | | | | | | | | | | | | | |
Actual | | $ | 1,000.00 | | | $ | 1,007.28 | | | $ | 5.05 | | | | 1.00 | % |
Hypothetical (5% return before expenses) | | $ | 1,000.00 | | | $ | 1,020.11 | | | $ | 5.08 | | | | 1.00 | % |
Institutional Class | | | | | | | | | | | | | | | | |
Actual | | $ | 1,000.00 | | | $ | 1,008.52 | | | $ | 3.53 | | | | 0.70 | % |
Hypothetical (5% return before expenses) | | $ | 1,000.00 | | | $ | 1,021.62 | | | $ | 3.56 | | | | 0.70 | % |
| 1 | Expenses paid is equal to the annualized net expense ratio of each class multiplied by the average account value over the period, multiplied by the number of days in the most recent fiscal half-year divided by the number of days in the fiscal year (to reflect the one-half-year period). |
| | | | | | |
| Portfolio of investments—January 31, 2017 (unaudited) | | Wells Fargo Premier Large Company Growth Fund | | | 7 | |
| | | | | | | | | | | | | | | | |
| Security name | | | | | | | | Shares | | | Value | |
| | | | |
Common Stocks: 99.75% | | | | | | | | | | | | | | | | |
| | | | |
Consumer Discretionary: 14.20% | | | | | | | | | | | | | | | | |
| | | | |
| Hotels, Restaurants & Leisure: 1.24% | | | | | | | | | | | | | | | | |
Starbucks Corporation | | | | | | | | | | | 603,510 | | | $ | 33,325,822 | |
| | | | | | | | | | | | | | | | |
| | | | |
| Internet & Direct Marketing Retail: 6.19% | | | | | | | | | | | | | | | | |
Amazon.com Incorporated † | | | | | | | | | | | 202,530 | | | | 166,779,404 | |
| | | | | | | | | | | | | | | | |
| | | | |
| Media: 0.23% | | | | | | | | | | | | | | | | |
The Walt Disney Company | | | | | | | | | | | 55,940 | | | | 6,189,761 | |
| | | | | | | | | | | | | | | | |
| | | | |
| Multiline Retail: 1.84% | | | | | | | | | | | | | | | | |
Dollar Tree Incorporated † | | | | | | | | | | | 641,610 | | | | 49,525,876 | |
| | | | | | | | | | | | | | | | |
| | | | |
| Specialty Retail: 4.70% | | | | | | | | | | | | | | | | |
Burlington Stores Incorporated † | | | | | | | | | | | 324,040 | | | | 27,122,148 | |
O’Reilly Automotive Incorporated † | | | | | | | | | | | 87,220 | | | | 22,875,189 | |
The Home Depot Incorporated | | | | | | | | | | | 478,800 | | | | 65,873,304 | |
Tractor Supply Company | | | | | | | | | | | 143,710 | | | | 10,587,116 | |
| | | | |
| | | | | | | | | | | | | | | 126,457,757 | |
| | | | | | | | | | | | | | | | |
| | | | |
Consumer Staples: 3.95% | | | | | | | | | | | | | | | | |
| | | | |
| Beverages: 1.82% | | | | | | | | | | | | | | | | |
Constellation Brands Incorporated Class A | | | | | | | | | | | 218,000 | | | | 32,647,680 | |
The Coca-Cola Company | | | | | | | | | | | 391,740 | | | | 16,284,632 | |
| | | | |
| | | | | | | | | | | | | | | 48,932,312 | |
| | | | | | | | | | | | | | | | |
| | | | |
| Food & Staples Retailing: 0.82% | | | | | | | | | | | | | | | | |
Costco Wholesale Corporation | | | | | | | | | | | 135,590 | | | | 22,229,981 | |
| | | | | | | | | | | | | | | | |
| | | | |
| Household Products: 0.10% | | | | | | | | | | | | | | | | |
Colgate-Palmolive Company | | | | | | | | | | | 41,470 | | | | 2,678,133 | |
| | | | | | | | | | | | | | | | |
| | | | |
| Personal Products: 1.21% | | | | | | | | | | | | | | | | |
The Estee Lauder Companies Incorporated Class A | | | | | | | | | | | 401,120 | | | | 32,574,955 | |
| | | | | | | | | | | | | | | | |
| | | | |
Energy: 2.31% | | | | | | | | | | | | | | | | |
| | | | |
| Energy Equipment & Services: 0.44% | | | | | | | | | | | | | | | | |
Schlumberger Limited | | | | | | | | | | | 140,820 | | | | 11,788,042 | |
| | | | | | | | | | | | | | | | |
| | | | |
| Oil, Gas & Consumable Fuels: 1.87% | | | | | | | | | | | | | | | | |
Concho Resources Incorporated † | | | | | | | | | | | 234,040 | | | | 32,634,538 | |
EOG Resources Incorporated | | | | | | | | | | | 163,820 | | | | 16,640,836 | |
Extraction Oil & Gas Incorporated †« | | | | | | | | | | | 60,831 | | | | 1,090,092 | |
| | | | |
| | | | | | | | | | | | | | | 50,365,466 | |
| | | | | | | | | | | | | | | | |
| | | | |
Financials: 2.31% | | | | | | | | | | | | | | | | |
| | | | |
| Capital Markets: 2.31% | | | | | | | | | | | | | | | | |
Goldman Sachs Group Incorporated | | | | | | | | | | | 132,790 | | | | 30,451,403 | |
Morgan Stanley | | | | | | | | | | | 387,470 | | | | 16,463,600 | |
TD Ameritrade Holding Corporation | | | | | | | | | | | 329,910 | | | | 15,225,347 | |
| | | | |
| | | | | | | | | | | | | | | 62,140,350 | |
| | | | | | | | | | | | | | | | |
The accompanying notes are an integral part of these financial statements.
| | | | |
| 8 | | Wells Fargo Premier Large Company Growth Fund | | Portfolio of investments—January 31, 2017 (unaudited) |
| | | | | | | | | | | | | | | | |
| Security name | | | | | | | | Shares | | | Value | |
| | | | |
Health Care: 15.21% | | | | | | | | | | | | | | | | |
| | | | |
| Biotechnology: 7.83% | | | | | | | | | | | | | | | | |
Alexion Pharmaceuticals Incorporated † | | | | | | | | | | | 140,304 | | | $ | 18,334,927 | |
BioMarin Pharmaceutical Incorporated † | | | | | | | | | | | 463,120 | | | | 40,583,206 | |
Celgene Corporation † | | | | | | | | | | | 639,468 | | | | 74,274,208 | |
Incyte Corporation † | | | | | | | | | | | 188,730 | | | | 22,875,963 | |
Regeneron Pharmaceuticals Incorporated † | | | | | | | | | | | 47,590 | | | | 17,098,611 | |
Tesaro Incorporated †« | | | | | | | | | | | 90,500 | | | | 14,737,020 | |
Vertex Pharmaceuticals Incorporated † | | | | | | | | | | | 265,550 | | | | 22,802,779 | |
| | | | |
| | | | | | | | | | | | | | | 210,706,714 | |
| | | | | | | | | | | | | | | | |
| | | | |
| Health Care Equipment & Supplies: 2.36% | | | | | | | | | | | | | | | | |
Boston Scientific Corporation † | | | | | | | | | | | 860,570 | | | | 20,705,314 | |
Danaher Corporation | | | | | | | | | | | 270,580 | | | | 22,707,074 | |
Edwards Lifesciences Corporation † | | | | | | | | | | | 128,670 | | | | 12,383,201 | |
Intuitive Surgical Incorporated † | | | | | | | | | | | 11,300 | | | | 7,827,397 | |
| | | | |
| | | | | | | | | | | | | | | 63,622,986 | |
| | | | | | | | | | | | | | | | |
| | | | |
| Health Care Providers & Services: 2.99% | | | | | | | | | | | | | | | | |
Acadia Healthcare Company Incorporated †« | | | | | | | | | | | 1,817,980 | | | | 69,755,893 | |
VCA Incorporated † | | | | | | | | | | | 117,950 | | | | 10,686,270 | |
| | | | |
| | | | | | | | | | | | | | | 80,442,163 | |
| | | | | | | | | | | | | | | | |
| | | | |
| Life Sciences Tools & Services: 0.41% | | | | | | | | | | | | | | | | |
Patheon NV † | | | | | | | | | | | 241,700 | | | | 6,934,373 | |
PRA Health Sciences Incorporated † | | | | | | | | | | | 72,000 | | | | 4,218,480 | |
| | | | |
| | | | | | | | | | | | | | | 11,152,853 | |
| | | | | | | | | | | | | | | | |
| | | | |
| Pharmaceuticals: 1.62% | | | | | | | | | | | | | | | | |
Zoetis Incorporated | | | | | | | | | | | 791,548 | | | | 43,487,647 | |
| | | | | | | | | | | | | | | | |
| | | | |
Industrials: 12.00% | | | | | | | | | | | | | | | | |
| | | | |
| Aerospace & Defense: 0.72% | | | | | | | | | | | | | | | | |
The Boeing Company | | | | | | | | | | | 118,700 | | | | 19,397,954 | |
| | | | | | | | | | | | | | | | |
| | | | |
| Air Freight & Logistics: 2.07% | | | | | | | | | | | | | | | | |
FedEx Corporation | | | | | | | | | | | 136,870 | | | | 25,883,486 | |
United Parcel Service Incorporated Class B | | | | | | | | | | | 272,650 | | | | 29,754,295 | |
| | | | |
| | | | | | | | | | | | | | | 55,637,781 | |
| | | | | | | | | | | | | | | | |
| | | | |
| Commercial Services & Supplies: 3.03% | | | | | | | | | | | | | | | | |
KAR Auction Services Incorporated | | | | | | | | | | | 1,128,549 | | | | 51,405,407 | |
Waste Connections Incorporated | | | | | | | | | | | 375,840 | | | | 30,179,952 | |
| | | | |
| | | | | | | | | | | | | | | 81,585,359 | |
| | | | | | | | | | | | | | | | |
| | | | |
| Electrical Equipment: 0.13% | | | | | | | | | | | | | | | | |
Acuity Brands Incorporated | | | | | | | | | | | 17,626 | | | | 3,652,636 | |
| | | | | | | | | | | | | | | | |
The accompanying notes are an integral part of these financial statements.
| | | | | | |
| Portfolio of investments—January 31, 2017 (unaudited) | | Wells Fargo Premier Large Company Growth Fund | | | 9 | |
| | | | | | | | | | | | | | | | |
| Security name | | | | | | | | Shares | | | Value | |
| | | | |
| Industrial Conglomerates: 1.03% | | | | | | | | | | | | | | | | |
Honeywell International Incorporated | | | | | | | | | | | 233,370 | | | $ | 27,612,338 | |
| | | | | | | | | | | | | | | | |
| | | | |
| Machinery: 0.54% | | | | | | | | | | | | | | | | |
Fortive Corporation | | | | | | | | | | | 263,765 | | | | 14,588,842 | |
| | | | | | | | | | | | | | | | |
| | | | |
| Professional Services: 0.51% | | | | | | | | | | | | | | | | |
IHS Markit Limited † | | | | | | | | | | | 349,200 | | | | 13,775,940 | |
| | | | | | | | | | | | | | | | |
| | | | |
| Road & Rail: 3.97% | | | | | | | | | | | | | | | | |
CSX Corporation | | | | | | | | | | | 183,530 | | | | 8,513,957 | |
Norfolk Southern Corporation | | | | | | | | | | | 261,480 | | | | 30,713,441 | |
Union Pacific Corporation | | | | | | | | | | | 633,620 | | | | 67,531,220 | |
| | | | |
| | | | | | | | | | | | | | | 106,758,618 | |
| | | | | | | | | | | | | | | | |
| | | | |
Information Technology: 45.18% | | | | | | | | | | | | | | | | |
| | | | |
| Internet Software & Services: 15.95% | | | | | | | | | | | | | | | | |
Akamai Technologies Incorporated † | | | | | | | | | | | 197,050 | | | | 13,515,660 | |
Alphabet Incorporated Class A † | | | | | | | | | | | 176,260 | | | | 144,566,689 | |
Alphabet Incorporated Class C † | | | | | | | | | | | 34,608 | | | | 27,575,308 | |
CoStar Group Incorporated † | | | | | | | | | | | 86,250 | | | | 17,431,125 | |
eBay Incorporated † | | | | | | | | | | | 1,181,800 | | | | 37,616,694 | |
Facebook Incorporated Class A † | | | | | | | | | | | 1,339,900 | | | | 174,615,762 | |
MercadoLibre Incorporated | | | | | | | | | | | 43,700 | | | | 8,101,543 | |
Trivago NV ADR † | | | | | | | | | | | 516,068 | | | | 5,986,389 | |
| | | | |
| | | | | | | | | | | | | | | 429,409,170 | |
| | | | | | | | | | | | | | | | |
| | | | |
| IT Services: 9.49% | | | | | | | | | | | | | | | | |
Accenture plc Class A | | | | | | | | | | | 163,470 | | | | 18,614,329 | |
Fidelity National Information Services Incorporated | | | | | | | | | | | 70,790 | | | | 5,622,142 | |
FleetCor Technologies Incorporated † | | | | | | | | | | | 199,410 | | | | 29,410,981 | |
Global Payments Incorporated | | | | | | | | | | | 119,150 | | | | 9,207,912 | |
MasterCard Incorporated Class A | | | | | | | | | | | 602,080 | | | | 64,019,166 | |
PayPal Holdings Incorporated † | | | | | | | | | | | 1,066,750 | | | | 42,435,315 | |
Visa Incorporated Class A | | | | | | | | | | | 1,042,410 | | | | 86,217,731 | |
| | | | |
| | | | | | | | | | | | | | | 255,527,576 | |
| | | | | | | | | | | | | | | | |
| | | | |
| Semiconductors & Semiconductor Equipment: 7.24% | | | | | | | | | | | | | | | | |
Broadcom Limited | | | | | | | | | | | 212,433 | | | | 42,380,384 | |
Microchip Technology Incorporated « | | | | | | | | | | | 1,217,940 | | | | 82,028,259 | |
NXP Semiconductors NV † | | | | | | | | | | | 139,290 | | | | 13,629,527 | |
Texas Instruments Incorporated | | | | | | | | | | | 750,740 | | | | 56,710,900 | |
| | | | |
| | | | | | | | | | | | | | | 194,749,070 | |
| | | | | | | | | | | | | | | | |
| | | | |
| Software: 10.29% | | | | | | | | | | | | | | | | |
Adobe Systems Incorporated † | | | | | | | | | | | 408,189 | | | | 46,280,469 | |
Microsoft Corporation | | | | | | | | | | | 1,575,320 | | | | 101,844,438 | |
Salesforce.com Incorporated † | | | | | | | | | | | 355,410 | | | | 28,112,931 | |
ServiceNow Incorporated † | | | | | | | | | | | 323,260 | | | | 29,293,821 | |
The accompanying notes are an integral part of these financial statements.
| | | | |
| 10 | | Wells Fargo Premier Large Company Growth Fund | | Portfolio of investments—January 31, 2017 (unaudited) |
| | | | | | | | | | | | | | | | |
| Security name | | | | | | | | Shares | | | Value | |
| | | | |
| Software (continued) | | | | | | | | | | | | | | | | |
Splunk Incorporated † | | | | | | | | | | | 594,775 | | | $ | 34,413,682 | |
Ultimate Software Group Incorporated † | | | | | | | | | | | 190,592 | | | | 36,910,047 | |
| | | | |
| | | | | | | | | | | | | | | 276,855,388 | |
| | | | | | | | | | | | | | | | |
| | | | |
| Technology Hardware, Storage & Peripherals: 2.21% | | | | | | | | | | | | | | | | |
Apple Incorporated | | | | | | | | | | | 488,940 | | | | 59,332,869 | |
| | | | | | | | | | | | | | | | |
| | | | |
Materials: 3.74% | | | | | | | | | | | | | | | | |
| | | | |
| Chemicals: 3.74% | | | | | | | | | | | | | | | | |
Ecolab Incorporated | | | | | | | | | | | 414,350 | | | | 49,775,866 | |
Praxair Incorporated | | | | | | | | | | | 429,660 | | | | 50,888,930 | |
| | | | |
| | | | | | | | | | | | | | | 100,664,796 | |
| | | | | | | | | | | | | | | | |
| | | | |
Real Estate: 0.85% | | | | | | | | | | | | | | | | |
| | | | |
| Equity REITs: 0.85% | | | | | | | | | | | | | | | | |
American Tower Corporation | | | | | | | | | | | 219,790 | | | | 22,748,265 | |
| | | | | | | | | | | | | | | | |
| | | | |
Total Common Stocks (Cost $1,738,670,788) | | | | | | | | | | | | | | | 2,684,696,824 | |
| | | | | | | | | | | | | | | | |
| | | | |
| | | Yield | | | | | | | | | | |
| Short-Term Investments: 3.33% | | | | | | | | | | | | | | | | |
| | | | |
| Investment Companies: 3.33% | | | | | | | | | | | | | | | | |
Securities Lending Cash Investment LLC (l)(r)(u) | | | 0.86 | % | | | | | | | 79,596,850 | | | | 79,604,809 | |
Wells Fargo Government Money Market Fund Select Class (l)(u) | | | 0.46 | | | | | | | | 10,069,617 | | | | 10,069,617 | |
| | | | |
Total Short-Term Investments (Cost $89,672,712) | | | | | | | | | | | | | | | 89,674,426 | |
| | | | | | | | | | | | | | | | |
| | | | | | | | |
| Total investments in securities (Cost $1,828,343,500) * | | | 103.08 | % | | | 2,774,371,250 | |
Other assets and liabilities, net | | | (3.08 | ) | | | (82,818,778 | ) |
| | | | | | | | |
| Total net assets | | | 100.00 | % | | $ | 2,691,552,472 | |
| | | | | | | | |
| † | Non-income-earning security |
| « | All or a portion of this security is on loan. |
| (l) | The issuer of the security is an affiliated person of the Fund as defined in the Investment Company Act of 1940. |
| (r) | The investment is a non-registered investment vehicle purchased with cash collateral received from securities on loan. |
| (u) | The rate represents the 7-day annualized yield at period end. |
| * | Cost for federal income tax purposes is $1,831,324,545 and unrealized gains (losses) consists of: |
| | | | |
Gross unrealized gains | | $ | 968,759,890 | |
Gross unrealized losses | | | (25,713,185 | ) |
| | | | |
Net unrealized gains | | $ | 943,046,705 | |
The accompanying notes are an integral part of these financial statements.
| | | | | | |
| Statement of assets and liabilities—January 31, 2017 (unaudited) | | Wells Fargo Premier Large Company Growth Fund | | | 11 | |
| | | | |
| | | | |
| |
Assets | | | | |
Investments | | | | |
In unaffiliated securities (including $77,620,156 of securities loaned), at value (cost $1,738,670,788) | | $ | 2,684,696,824 | |
In affiliated securities, at value (cost $89,672,712) | | | 89,674,426 | |
| | | | |
Total investments, at value (cost $1,828,343,500) | �� | | 2,774,371,250 | |
Receivable for investments sold | | | 37,316,266 | |
Receivable for Fund shares sold | | | 4,107,378 | |
Receivable for dividends | | | 860,246 | |
Receivable for securities lending income | | | 57,109 | |
Prepaid expenses and other assets | | | 197,373 | |
| | | | |
Total assets | | | 2,816,909,622 | |
| | | | |
| |
Liabilities | | | | |
Payable for investments purchased | | | 26,853,225 | |
Payable for Fund shares redeemed | | | 16,329,526 | |
Payable upon receipt of securities loaned | | | 79,603,050 | |
Management fee payable | | | 1,385,872 | |
Distribution fees payable | | | 144,480 | |
Administration fees payable | | | 396,985 | |
Accrued expenses and other liabilities | | | 644,012 | |
| | | | |
Total liabilities | | | 125,357,150 | |
| | | | |
Total net assets | | $ | 2,691,552,472 | |
| | | | |
| |
NET ASSETS CONSIST OF | | | | |
Paid-in capital | | $ | 1,595,747,315 | |
Accumulated net investment loss | | | (3,696,672 | ) |
Accumulated net realized gains on investments | | | 153,474,079 | |
Net unrealized gains on investments | | | 946,027,750 | |
| | | | |
Total net assets | | $ | 2,691,552,472 | |
| | | | |
| |
COMPUTATION OF NET ASSET VALUE AND OFFERING PRICE PER SHARE | | | | |
Net assets – Class A | | $ | 1,341,134,131 | |
Shares outstanding – Class A1 | | | 100,749,292 | |
Net asset value per share – Class A | | | $13.31 | |
Maximum offering price per share – Class A2 | | | $14.12 | |
Net assets – Class B | | $ | 480,831 | |
Shares outstanding – Class B1 | | | 42,771 | |
Net asset value per share – Class B | | | $11.24 | |
Net assets – Class C | | $ | 221,187,943 | |
Shares outstanding – Class C1 | | | 19,739,334 | |
Net asset value per share – Class C | | | $11.21 | |
Net assets – Class R4 | | $ | 4,226,324 | |
Share outstanding – Class R41 | | | 309,570 | |
Net asset value per share – Class R4 | | | $13.65 | |
Net assets – Class R6 | | $ | 149,601,949 | |
Shares outstanding – Class R61 | | | 10,883,483 | |
Net asset value per share – Class R6 | | | $13.75 | |
Net assets – Administrator Class | | $ | 97,375,635 | |
Shares outstanding – Administrator Class1 | | | 7,234,110 | |
Net asset value per share – Administrator Class | | | $13.46 | |
Net assets – Institutional Class | | $ | 877,545,659 | |
Shares outstanding – Institutional Class1 | | | 63,946,732 | |
Net asset value per share – Institutional Class | | | $13.72 | |
| 1 | The Fund has an unlimited number of authorized shares. |
| 2 | Maximum offering price is computed as 100/94.25 of net asset value. On investments of $50,000 or more, the offering price is reduced. |
The accompanying notes are an integral part of these financial statements.
| | | | |
| 12 | | Wells Fargo Premier Large Company Growth Fund | | Statement of operations—six months ended January 31, 2017 (unaudited) |
| | | | |
| | | | |
| |
Investment income | | | | |
Dividends (net of foreign withholding taxes of $19,951) | | $ | 14,559,804 | |
Securities lending income, net | | | 240,994 | |
Income from affiliated securities | | | 42,197 | |
| | | | |
Total investment income | | | 14,842,995 | |
| | | | |
| |
Expenses | | | | |
Management fee | | | 10,244,463 | |
Administration fees | | | | |
Class A | | | 1,585,146 | |
Class B | | | 711 | |
Class C | | | 274,602 | |
Class R4 | | | 1,527 | |
Class R6 | | | 24,166 | |
Administrator Class | | | 133,481 | |
Institutional Class | | | 646,705 | |
Shareholder servicing fees | | | | |
Class A | | | 1,887,079 | |
Class B | | | 847 | |
Class C | | | 326,908 | |
Class R4 | | | 1,909 | |
Administrator Class | | | 255,256 | |
Distribution fees | | | | |
Class B | | | 2,540 | |
Class C | | | 980,723 | |
Custody and accounting fees | | | 85,865 | |
Professional fees | | | 27,199 | |
Registration fees | | | 65,752 | |
Shareholder report expenses | | | 107,021 | |
Trustees’ fees and expenses | | | 14,345 | |
Other fees and expenses | | | 39,988 | |
| | | | |
Total expenses | | | 16,706,233 | |
Less: Fee waivers and/or expense reimbursements | | | (841,342 | ) |
| | | | |
Net expenses | | | 15,864,891 | |
| | | | |
Net investment loss | | | (1,021,896 | ) |
| | | | |
| |
REALIZED AND UNREALIZED GAINS (LOSSES) ON INVESTMENTS | | | | |
| |
Net realized gains on: | | | | |
Unaffiliated securities | | | 258,319,515 | |
Affiliated securities | | | 45 | |
| | | | |
Net realized gains on investments | | | 258,319,560 | |
| | | | |
| |
Net change in unrealized gains (losses) on: | | | | |
Unaffiliated securities | | | (254,378,458 | ) |
Affiliated securities | | | 1,714 | |
| | | | |
Net change in unrealized gains (losses) on investments | | | (254,376,744 | ) |
| | | | |
Net realized and unrealized gains (losses) on investments | | | 3,942,816 | |
| | | | |
Net increase in net assets resulting from operations | | $ | 2,920,920 | |
| | | | |
The accompanying notes are an integral part of these financial statements.
| | | | | | |
| Statement of changes in net assets | | Wells Fargo Premier Large Company Growth Fund | | | 13 | |
| | | | | | | | | | | | | | | | |
| | | Six months ended
January 31, 2017 (unaudited) | | | Year ended
July 31, 2016 | |
| | | | |
Operations | | | | | | | | | | | | | | | | |
Net investment loss | | | | | | $ | (1,021,896 | ) | | | | | | $ | (3,092,329 | ) |
Net realized gains on investments | | | | | | | 258,319,560 | | | | | | | | 354,287,986 | |
Net change in unrealized gains (losses) on investments | | | | | | | (254,376,744 | ) | | | | | | | (628,644,827 | ) |
| | | | |
Net increase (decrease) in net assets resulting from operations | | | | | | | 2,920,920 | | | | | | | | (277,449,170 | ) |
| | | | |
| | | | |
Distributions to shareholders from | | | | | | | | | | | | | | | | |
Net realized gains | | | | | | | | | | | | | | | | |
Class A | | | | | | | (141,609,478 | ) | | | | | | | (154,141,985 | ) |
Class B | | | | | | | (64,503 | ) | | | | | | | (115,925 | ) |
Class C | | | | | | | (28,218,921 | ) | | | | | | | (27,659,123 | ) |
Class R4 | | | | | | | (356,581 | ) | | | | | | | (138,255 | ) |
Class R6 | | | | | | | (14,601,788 | ) | | | | | | | (12,437,527 | ) |
Administrator Class | | | | | | | (11,817,935 | ) | | | | | | | (51,332,185 | ) |
Institutional Class | | | | | | | (94,245,557 | ) | | | | | | | (90,311,280 | ) |
| | | | |
Total distributions to shareholders | | | | | | | (290,914,763 | ) | | | | | | | (336,136,280 | ) |
| | | | |
| | | | |
Capital share transactions | | | Shares | | | | | | | | Shares | | | | | |
Proceeds from shares sold | | | | | | | | | | | | | | | | |
Class A | | | 3,885,974 | | | | 53,561,647 | | | | 33,396,591 | | | | 499,630,054 | |
Class B | | | 657 | | | | 7,221 | | | | 6,032 | | | | 75,914 | |
Class C | | | 844,993 | | | | 9,532,201 | | | | 2,643,388 | | | | 33,651,473 | |
Class R4 | | | 53,112 | | | | 724,372 | | | | 147,562 | | | | 2,106,423 | |
Class R6 | | | 432,243 | | | | 6,181,984 | | | | 3,017,767 | | | | 46,660,260 | |
Administrator Class | | | 618,980 | | | | 8,836,203 | | | | 3,919,148 | | | | 57,602,147 | |
Institutional Class | | | 13,951,052 | | | | 203,250,191 | | | | 27,347,396 | | | | 409,718,053 | |
Investor Class | | | N/A | | | | N/A | | | | 204,065 | 1 | | | 3,092,911 | 1 |
| | | | |
| | | | | | | 282,093,819 | | | | | | | | 1,052,537,235 | |
| | | | |
Reinvestment of distributions | | | | | | | | | | | | | | | | |
Class A | | | 10,164,417 | | | | 132,137,416 | | | | 10,119,274 | | | | 145,413,973 | |
Class B | | | 4,868 | | | | 53,503 | | | | 7,422 | | | | 92,480 | |
Class C | | | 2,029,580 | | | | 22,223,900 | | | | 1,715,487 | | | | 21,323,504 | |
Class R4 | | | 26,770 | | | | 356,581 | | | | 9,437 | | | | 138,255 | |
Class R6 | | | 1,045,351 | | | | 14,018,149 | | | | 813,689 | | | | 11,977,506 | |
Administrator Class | | | 870,110 | | | | 11,433,242 | | | | 3,513,370 | | | | 50,943,861 | |
Institutional Class | | | 5,849,310 | | | | 78,322,263 | | | | 4,638,850 | | | | 68,237,489 | |
| | | | |
| | | | | | | 258,545,054 | | | | | | | | 298,127,068 | |
| | | | |
Payment for shares redeemed | | | | | | | | | | | | | | | | |
Class A | | | (28,924,645 | ) | | | (404,118,010 | ) | | | (67,943,982 | ) | | | (948,979,782 | ) |
Class B | | | (31,398 | ) | | | (378,448 | ) | | | (96,549 | ) | | | (1,234,246 | ) |
Class C | | | (6,625,325 | ) | | | (78,369,070 | ) | | | (8,078,699 | ) | | | (100,085,119 | ) |
Class R4 | | | (36,198 | ) | | | (514,125 | ) | | | (19,668 | ) | | | (274,630 | ) |
Class R6 | | | (2,477,193 | ) | | | (36,071,052 | ) | | | (1,984,285 | ) | | | (28,819,972 | ) |
Administrator Class | | | (14,016,099 | ) | | | (201,243,034 | ) | | | (56,550,448 | ) | | | (817,362,391 | ) |
Institutional Class | | | (28,750,160 | ) | | | (409,972,713 | ) | | | (38,166,413 | ) | | | (557,212,931 | ) |
Investor Class | | | N/A | | | | N/A | | | | (12,187,103 | )1 | | | (190,582,272 | )1 |
| | | | |
| | | | | | | (1,130,666,452 | ) | | | | | | | (2,644,551,343 | ) |
| | | | |
Net decrease in net assets resulting from capital share transactions | | | | | | | (590,027,579 | ) | | | | | | | (1,293,887,040 | ) |
| | | | |
Total decrease in net assets | | | | | | | (878,021,422 | ) | | | | | | | (1,907,472,490 | ) |
| | | | |
| | | | |
Net assets | | | | | | | | | | | | | | | | |
Beginning of period | | | | | | | 3,569,573,894 | | | | | | | | 5,477,046,384 | |
| | | | |
End of period | | | | | | $ | 2,691,552,472 | | | | | | | $ | 3,569,573,894 | |
| | | | |
Accumulated net investment loss | | | | | | $ | (3,696,672 | ) | | | | | | $ | (2,674,776 | ) |
| | | | |
| 1 | For the period from August 1, 2015 to October 23, 2015. Effective at the close of business on October 23, 2015, Investor Class shares were converted to Class A shares and are no longer offered by the Fund. |
The accompanying notes are an integral part of these financial statements.
| | | | |
| 14 | | Wells Fargo Premier Large Company Growth Fund | | Financial highlights |
(For a share outstanding throughout each period)
| | | | | | | | | | | | | | | | | | | | | | | | |
| | | Six months ended
January 31, 2017 (unaudited) | | | Year ended July 31 | |
| CLASS A | | | 2016 | | | 2015 | | | 2014 | | | 2013 | | | 2012 | |
Net asset value, beginning of period | | | $14.68 | | | | $16.28 | | | | $14.55 | | | | $12.57 | | | | $10.21 | | | | $9.89 | |
Net investment loss | | | (0.02 | ) | | | (0.03 | ) | | | (0.03 | ) | | | (0.05 | ) | | | (0.02 | ) | | | (0.03 | )1 |
Net realized and unrealized gains (losses) on investments | | | 0.08 | | | | (0.52 | ) | | | 1.97 | | | | 2.03 | | | | 2.38 | | | | 0.60 | |
| | | | | | | | | | | | | | | | | | | | | | | | |
Total from investment operations | | | 0.06 | | | | (0.55 | ) | | | 1.94 | | | | 1.98 | | | | 2.36 | | | | 0.57 | |
Distributions to shareholders from | | | | | | | | | | | | | | | | | | | | | | | | |
Net realized gains | | | (1.43 | ) | | | (1.05 | ) | | | (0.21 | ) | | | 0.00 | | | | 0.00 | | | | (0.25 | ) |
Net asset value, end of period | | | $13.31 | | | | $14.68 | | | | $16.28 | | | | $14.55 | | | | $12.57 | | | | $10.21 | |
Total return2 | | | 0.66 | % | | | (3.22 | )% | | | 13.46 | % | | | 15.75 | % | | | 23.11 | % | | | 6.08 | % |
Ratios to average net assets (annualized) | | | | | | | | | | | | | | | | | | | | | | | | |
Gross expenses | | | 1.14 | % | | | 1.13 | % | | | 1.16 | % | | | 1.17 | % | | | 1.19 | % | | | 1.23 | % |
Net expenses | | | 1.11 | % | | | 1.11 | % | | | 1.12 | % | | | 1.12 | % | | | 1.12 | % | | | 1.12 | % |
Net investment loss | | | (0.16 | )% | | | (0.17 | )% | | | (0.18 | )% | | | (0.36 | )% | | | (0.15 | )% | | | (0.30 | )% |
Supplemental data | | | | | | | | | | | | | | | | | | | | | | | | |
Portfolio turnover rate | | | 42 | % | | | 47 | % | | | 44 | % | | | 37 | % | | | 32 | % | | | 51 | % |
Net assets, end of period (000s omitted) | | | $1,341,134 | | | | $1,697,746 | | | | $2,280,107 | | | | $1,908,455 | | | | $1,515,862 | | | | $932,106 | |
| 1 | Calculated based upon average shares outstanding |
| 2 | Total return calculations do not include any sales charges. Returns for periods of less than one year are not annualized. |
The accompanying notes are an integral part of these financial statements.
| | | | | | |
| Financial highlights | | Wells Fargo Premier Large Company Growth Fund | | | 15 | |
(For a share outstanding throughout each period)
| | | | | | | | | | | | | | | | | | | | | | | | |
| | | Six months ended
January 31, 2017 (unaudited) | | | Year ended July 31 | |
| CLASS B | | | 2016 | | | 2015 | | | 2014 | | | 2013 | | | 2012 | |
Net asset value, beginning of period | | | $12.67 | | | | $14.30 | | | | $12.90 | | | | $11.23 | | | | $9.19 | | | | $8.99 | |
Net investment loss | | | (0.05 | )1 | | | (0.11 | )1 | | | (0.13 | )1 | | | (0.13 | )1 | | | (0.09 | )1 | | | (0.09 | )1 |
Net realized and unrealized gains (losses) on investments | | | 0.05 | | | | (0.47 | ) | | | 1.74 | | | | 1.80 | | | | 2.13 | | | | 0.54 | |
| | | | | | | | | | | | | | | | | | | | | | | | |
Total from investment operations | | | 0.00 | | | | (0.58 | ) | | | 1.61 | | | | 1.67 | | | | 2.04 | | | | 0.45 | |
Distributions to shareholders from | | | | | | | | | | | | | | | | | | | | | | | | |
Net realized gains | | | (1.43 | ) | | | (1.05 | ) | | | (0.21 | ) | | | 0.00 | | | | 0.00 | | | | (0.25 | ) |
Net asset value, end of period | | | $11.24 | | | | $12.67 | | | | $14.30 | | | | $12.90 | | | | $11.23 | | | | $9.19 | |
Total return2 | | | 0.28 | % | | | (3.92 | )% | | | 12.61 | % | | | 14.87 | % | | | 22.20 | % | | | 5.22 | % |
Ratios to average net assets (annualized) | | | | | | | | | | | | | | | | | | | | | | | | |
Gross expenses | | | 1.88 | % | | | 1.87 | % | | | 1.91 | % | | | 1.91 | % | | | 1.94 | % | | | 1.97 | % |
Net expenses | | | 1.86 | % | | | 1.86 | % | | | 1.87 | % | | | 1.87 | % | | | 1.87 | % | | | 1.87 | % |
Net investment loss | | | (0.89 | )% | | | (0.91 | )% | | | (0.92 | )% | | | (1.09 | )% | | | (0.87 | )% | | | (1.04 | )% |
Supplemental data | | | | | | | | | | | | | | | | | | | | | | | | |
Portfolio turnover rate | | | 42 | % | | | 47 | % | | | 44 | % | | | 37 | % | | | 32 | % | | | 51 | % |
Net assets, end of period (000s omitted) | | | $481 | | | | $870 | | | | $2,170 | | | | $4,001 | | | | $5,637 | | | | $6,962 | |
| 1 | Calculated based upon average shares outstanding |
| 2 | Total return calculations do not include any sales charges. Returns for periods of less than one year are not annualized. |
The accompanying notes are an integral part of these financial statements.
| | | | |
| 16 | | Wells Fargo Premier Large Company Growth Fund | | Financial highlights |
(For a share outstanding throughout each period)
| | | | | | | | | | | | | | | | | | | | | | | | |
| | | Six months ended
January 31, 2017 (unaudited) | | | Year ended July 31 | |
| CLASS C | | | 2016 | | | 2015 | | | 2014 | | | 2013 | | | 2012 | |
Net asset value, beginning of period | | | $12.64 | | | | $14.27 | | | | $12.87 | | | | $11.20 | | | | $9.17 | | | | $8.97 | |
Net investment loss | | | (0.06 | )1 | | | (0.12 | )1 | | | (0.13 | )1 | | | (0.14 | )1 | | | (0.09 | )1 | | | (0.10 | )1 |
Net realized and unrealized gains (losses) on investments | | | 0.06 | | | | (0.46 | ) | | | 1.74 | | | | 1.81 | | | | 2.12 | | | | 0.55 | |
| | | | | | | | | | | | | | | | | | | | | | | | |
Total from investment operations | | | 0.00 | | | | (0.58 | ) | | | 1.61 | | | | 1.67 | | | | 2.03 | | | | 0.45 | |
Distributions to shareholders from | | | | | | | | | | | | | | | | | | | | | | | | |
Net realized gains | | | (1.43 | ) | | | (1.05 | ) | | | (0.21 | ) | | | 0.00 | | | | 0.00 | | | | (0.25 | ) |
Net asset value, end of period | | | $11.21 | | | | $12.64 | | | | $14.27 | | | | $12.87 | | | | $11.20 | | | | $9.17 | |
Total return2 | | | 0.29 | % | | | (3.92 | )% | | | 12.65 | % | | | 14.91 | % | | | 22.14 | % | | | 5.24 | % |
Ratios to average net assets (annualized) | | | | | | | | | | | | | | | | | | | | | | | | |
Gross expenses | | | 1.88 | % | | | 1.88 | % | | | 1.91 | % | | | 1.92 | % | | | 1.94 | % | | | 1.98 | % |
Net expenses | | | 1.86 | % | | | 1.86 | % | | | 1.87 | % | | | 1.87 | % | | | 1.87 | % | | | 1.87 | % |
Net investment loss | | | (0.91 | )% | | | (0.92 | )% | | | (0.93 | )% | | | (1.11 | )% | | | (0.91 | )% | | | (1.07 | )% |
Supplemental data | | | | | | | | | | | | | | | | | | | | | | | | |
Portfolio turnover rate | | | 42 | % | | | 47 | % | | | 44 | % | | | 37 | % | | | 32 | % | | | 51 | % |
Net assets, end of period (000s omitted) | | | $221,188 | | | | $296,896 | | | | $388,290 | | | | $374,136 | | | | $279,203 | | | | $129,980 | |
| 1 | Calculated based upon average shares outstanding |
| 2 | Total return calculations do not include any sales charges. Returns for periods of less than one year are not annualized. |
The accompanying notes are an integral part of these financial statements.
| | | | | | |
| Financial highlights | | Wells Fargo Premier Large Company Growth Fund | | | 17 | |
(For a share outstanding throughout each period)
| | | | | | | | | | | | | | | | | | | | |
| | | Six months ended
January 31, 2017 (unaudited) | | | Year ended July 31 | |
| CLASS R4 | | | 2016 | | | 2015 | | | 2014 | | | 20131 | |
Net asset value, beginning of period | | | $15.00 | | | | $16.56 | | | | $14.75 | | | | $12.70 | | | | $10.81 | |
Net investment income (loss) | | | 0.01 | 2 | | | 0.02 | 2 | | | 0.02 | | | | (0.01 | ) | | | 0.00 | 3 |
Net realized and unrealized gains (losses) on investments | | | 0.07 | | | | (0.53 | ) | | | 2.00 | | | | 2.06 | | | | 1.89 | |
| | | | | | | | | | | | | | | | | | | | |
Total from investment operations | | | 0.08 | | | | (0.51 | ) | | | 2.02 | | | | 2.05 | | | | 1.89 | |
Distributions to shareholders from | | | | | | | | | | | | | | | | | | | | |
Net realized gains | | | (1.43 | ) | | | (1.05 | ) | | | (0.21 | ) | | | 0.00 | | | | 0.00 | |
Net asset value, end of period | | | $13.65 | | | | $15.00 | | | | $16.56 | | | | $14.75 | | | | $12.70 | |
Total return4 | | | 0.79 | % | | | (2.91 | )% | | | 13.82 | % | | | 16.14 | % | | | 17.48 | % |
Ratios to average net assets (annualized) | | | | | | | | | | | | | | | | | | | | |
Gross expenses | | | 0.86 | % | | | 0.85 | % | | | 0.83 | % | | | 0.84 | % | | | 0.85 | % |
Net expenses | | | 0.80 | % | | | 0.80 | % | | | 0.80 | % | | | 0.80 | % | | | 0.80 | % |
Net investment income (loss) | | | 0.14 | % | | | 0.13 | % | | | 0.13 | % | | | (0.11 | )% | | | 0.06 | % |
Supplemental data | | | | | | | | | | | | | | | | | | | | |
Portfolio turnover rate | | | 42 | % | | | 47 | % | | | 44 | % | | | 37 | % | | | 32 | % |
Net assets, end of period (000s omitted) | | | $4,226 | | | | $3,988 | | | | $2,129 | | | | $765 | | | | $131 | |
| 1 | For the period from November 30, 2012 (commencement of class operations) to July 31, 2013 |
| 2 | Calculated based upon average shares outstanding |
| 3 | Amount is less than $0.005. |
| 4 | Returns for periods of less than one year are not annualized. |
The accompanying notes are an integral part of these financial statements.
| | | | |
| 18 | | Wells Fargo Premier Large Company Growth Fund | | Financial highlights |
(For a share outstanding throughout each period)
| | | | | | | | | | | | | | | | | | | | |
| | | Six months ended
January 31, 2017 (unaudited) | | | Year ended July 31 | |
| CLASS R6 | | | 2016 | | | 2015 | | | 2014 | | | 20131 | |
Net asset value, beginning of period | | | $15.08 | | | | $16.62 | | | | $14.77 | | | | $12.71 | | | | $10.81 | |
Net investment income | | | 0.04 | | | | 0.04 | 2 | | | 0.05 | | | | 0.01 | | | | 0.00 | 3 |
Net realized and unrealized gains (losses) on investments | | | 0.06 | | | | (0.53 | ) | | | 2.01 | | | | 2.05 | | | | 1.90 | |
| | | | | | | | | | | | | | | | | | | | |
Total from investment operations | | | 0.10 | | | | (0.49 | ) | | | 2.06 | | | | 2.06 | | | | 1.90 | |
Distributions to shareholders from | | | | | | | | | | | | | | | | | | | | |
Net realized gains | | | (1.43 | ) | | | (1.05 | ) | | | (0.21 | ) | | | 0.00 | | | | 0.00 | |
Net asset value, end of period | | | $13.75 | | | | $15.08 | | | | $16.62 | | | | $14.77 | | | | $12.71 | |
Total return4 | | | 0.92 | % | | | (2.78 | )% | | | 14.00 | % | | | 16.29 | % | | | 17.58 | % |
Ratios to average net assets (annualized) | | | | | | | | | | | | | | | | | | | | |
Gross expenses | | | 0.70 | % | | | 0.70 | % | | | 0.68 | % | | | 0.69 | % | | | 0.71 | % |
Net expenses | | | 0.65 | % | | | 0.65 | % | | | 0.65 | % | | | 0.65 | % | | | 0.65 | % |
Net investment income | | | 0.30 | % | | | 0.28 | % | | | 0.29 | % | | | 0.09 | % | | | 0.05 | % |
Supplemental data | | | | | | | | | | | | | | | | | | | | |
Portfolio turnover rate | | | 42 | % | | | 47 | % | | | 44 | % | | | 37 | % | | | 32 | % |
Net assets, end of period (000s omitted) | | | $149,602 | | | | $179,198 | | | | $166,768 | | | | $163,871 | | | | $4,629 | |
| 1 | For the period from November 30, 2012 (commencement of class operations) to July 31, 2013 |
| 2 | Calculated based upon average shares outstanding |
| 3 | Amount is less than $0.005. |
| 4 | Returns for periods of less than one year are not annualized. |
The accompanying notes are an integral part of these financial statements.
| | | | | | |
| Financial highlights | | Wells Fargo Premier Large Company Growth Fund | | | 19 | |
(For a share outstanding throughout each period)
| | | | | | | | | | | | | | | | | | | | | | | | |
| | | Six months ended
January 31, 2017 (unaudited) | | | Year ended July 31 | |
| ADMINISTRATOR CLASS | | | 2016 | | | 2015 | | | 2014 | | | 2013 | | | 2012 | |
Net asset value, beginning of period | | | $14.82 | | | | $16.41 | | | | $14.63 | | | | $12.62 | | | | $10.24 | | | | $9.90 | |
Net investment loss | | | (0.00 | )1,2 | | | (0.00 | )1,2 | | | (0.00 | )1 | | | (0.02 | ) | | | (0.00 | )1 | | | (0.02 | ) |
Net realized and unrealized gains (losses) on investments | | | 0.07 | | | | (0.54 | ) | | | 1.99 | | | | 2.03 | | | | 2.38 | | | | 0.61 | |
| | | | | | | | | | | | | | | | | | | | | | | | |
Total from investment operations | | | 0.07 | | | | (0.54 | ) | | | 1.99 | | | | 2.01 | | | | 2.38 | | | | 0.59 | |
Distributions to shareholders from | | | | | | | | | | | | | | | | | | | | | | | | |
Net realized gains | | | (1.43 | ) | | | (1.05 | ) | | | (0.21 | ) | | | 0.00 | | | | 0.00 | | | | (0.25 | ) |
Net asset value, end of period | | | $13.46 | | | | $14.82 | | | | $16.41 | | | | $14.63 | | | | $12.62 | | | | $10.24 | |
Total return3 | | | 0.73 | % | | | (3.13 | )% | | | 13.73 | % | | | 15.93 | % | | | 23.24 | % | | | 6.28 | % |
Ratios to average net assets (annualized) | | | | | | | | | | | | | | | | | | | | | | | | |
Gross expenses | | | 1.05 | % | | | 1.04 | % | | | 1.00 | % | | | 1.00 | % | | | 1.04 | % | | | 1.07 | % |
Net expenses | | | 1.00 | % | | | 0.98 | % | | | 0.95 | % | | | 0.95 | % | | | 0.95 | % | | | 0.95 | % |
Net investment loss | | | (0.01 | )% | | | (0.02 | )% | | | (0.01 | )% | | | (0.19 | )% | | | (0.01 | )% | | | (0.16 | )% |
Supplemental data | | | | | | | | | | | | | | | | | | | | | | | | |
Portfolio turnover rate | | | 42 | % | | | 47 | % | | | 44 | % | | | 37 | % | | | 32 | % | | | 51 | % |
Net assets, end of period (000s omitted) | | | $97,376 | | | | $292,900 | | | | $1,129,970 | | | | $1,325,864 | | | | $640,494 | | | | $251,759 | |
| 1 | Amount is less than $0.005. |
| 2 | Calculated based upon average shares outstanding |
| 3 | Returns for periods of less than one year are not annualized. |
The accompanying notes are an integral part of these financial statements.
| | | | |
| 20 | | Wells Fargo Premier Large Company Growth Fund | | Financial highlights |
(For a share outstanding throughout each period)
| | | | | | | | | | | | | | | | | | | | | | | | |
| | | Six months ended
January 31, 2017 (unaudited) | | | Year ended July 31 | |
| INSTITUTIONAL CLASS | | | 2016 | | | 2015 | | | 2014 | | | 2013 | | | 2012 | |
Net asset value, beginning of period | | | $15.06 | | | | $16.61 | | | | $14.77 | | | | $12.71 | | | | $10.28 | | | | $9.91 | |
Net investment income | | | 0.02 | 1 | | | 0.03 | 1 | | | 0.03 | | | | 0.01 | 1 | | | 0.00 | 2 | | | 0.00 | 1,2 |
Net realized and unrealized gains (losses) on investments | | | 0.07 | | | | (0.53 | ) | | | 2.02 | | | | 2.05 | | | | 2.43 | | | | 0.62 | |
| | | | | | | | | | | | | | | | | | | | | | | | |
Total from investment operations | | | 0.09 | | | | (0.50 | ) | | | 2.05 | | | | 2.06 | | | | 2.43 | | | | 0.62 | |
Distributions to shareholders from | | | | | | | | | | | | | | | | | | | | | | | | |
Net realized gains | | | (1.43 | ) | | | (1.05 | ) | | | (0.21 | ) | | | 0.00 | | | | 0.00 | | | | (0.25 | ) |
Net asset value, end of period | | | $13.72 | | | | $15.06 | | | | $16.61 | | | | $14.77 | | | | $12.71 | | | | $10.28 | |
Total return3 | | | 0.85 | % | | | (2.85 | )% | | | 14.01 | % | | | 16.21 | % | | | 23.64 | % | | | 6.48 | % |
Ratios to average net assets (annualized) | | | | | | | | | | | | | | | | | | | | | | | | |
Gross expenses | | | 0.81 | % | | | 0.80 | % | | | 0.74 | % | | | 0.74 | % | | | 0.76 | % | | | 0.79 | % |
Net expenses | | | 0.70 | % | | | 0.70 | % | | | 0.70 | % | | | 0.70 | % | | | 0.71 | % | | | 0.75 | % |
Net investment income | | | 0.24 | % | | | 0.23 | % | | | 0.23 | % | | | 0.07 | % | | | 0.16 | % | | | 0.04 | % |
Supplemental data | | | | | | | | | | | | | | | | | | | | | | | | |
Portfolio turnover rate | | | 42 | % | | | 47 | % | | | 44 | % | | | 37 | % | | | 32 | % | | | 51 | % |
Net assets, end of period (000s omitted) | | | $877,546 | | | | $1,097,976 | | | | $1,313,281 | | | | $1,031,979 | | | | $1,328,994 | | | | $223,616 | |
| 1 | Calculated based upon average shares outstanding |
| 2 | Amount is less than $0.005. |
| 3 | Returns for periods of less than one year are not annualized. |
The accompanying notes are an integral part of these financial statements.
| | | | | | |
| Notes to financial statements (unaudited) | | Wells Fargo Premier Large Company Growth Fund | | | 21 | |
1. ORGANIZATION
Wells Fargo Funds Trust (the “Trust”), a Delaware statutory trust organized on March 10, 1999, is an open-end management investment company registered under the Investment Company Act of 1940, as amended (the “1940 Act”). As an investment company, the Trust follows the accounting and reporting guidance in Financial Accounting Standards Board (“FASB”) Accounting Standards Codification Topic 946, Financial Services – Investment Companies. These financial statements report on the Wells Fargo Premier Large Company Growth Fund (the “Fund”) which is a diversified series of the Trust.
Effective at the close of business on October 23, 2015, Investor Class shares became Class A shares in a tax-free conversion. Shareholders of Investor Class received Class A shares at a value equal to the value of their Investor Class shares immediately prior to the conversion. Investor Class shares are no longer offered by the Fund.
2. SIGNIFICANT ACCOUNTING POLICIES
The following significant accounting policies, which are consistently followed in the preparation of the financial statements of the Fund, are in conformity with U.S. generally accepted accounting principles which require management to make estimates and assumptions that affect the reported amounts of assets and liabilities, disclosure of contingent assets and liabilities at the date of the financial statements, and the reported amounts of revenues and expenses during the reporting period. Actual results could differ from those estimates.
Securities valuation
All investments are valued each business day as of the close of regular trading on the New York Stock Exchange (generally 4 p.m. Eastern Time), although the Fund may deviate from this calculation time under unusual or unexpected circumstances.
Equity securities that are listed on a foreign or domestic exchange or market are valued at the official closing price or, if none, the last sales price. If no sale occurs on the principal exchange or market that day, the prior day’s price will be deemed “stale” and a fair value price will be determined in accordance with the Fund’s Valuation Procedures.
Investments in registered open-end investment companies are valued at net asset value. Interests in non-registered investment vehicles that are redeemable at net asset value are fair valued normally at net asset value.
Investments which are not valued using any of the methods discussed above are valued at their fair value, as determined in good faith by the Board of Trustees of the Fund. The Board of Trustees has established a Valuation Committee comprised of the Trustees and has delegated to it the authority to take any actions regarding the valuation of portfolio securities that the Valuation Committee deems necessary or appropriate, including determining the fair value of portfolio securities, unless the determination has been delegated to the Management Valuation Team of Wells Fargo Funds Management, LLC (“Funds Management”). The Board of Trustees retains the authority to make or ratify any valuation decisions or approve any changes to the Valuation Procedures as it deems appropriate. On a quarterly basis, the Board of Trustees receives reports on any valuation actions taken by the Valuation Committee or the Management Valuation Team which may include items for ratification.
Valuations of fair valued securities are compared to the next actual sales price when available, or other appropriate market values, to assess the continued appropriateness of the fair valuation methodologies used. These securities are fair valued on a day-to-day basis, taking into consideration changes to appropriate market information and any significant changes to the inputs considered in the valuation process until there is a readily available price provided on an exchange or by an independent pricing service. Valuations received from an independent pricing service or independent broker-dealer quotes are periodically validated by comparisons to most recent trades and valuations provided by other independent pricing services in addition to the review of prices by the manager and/or subadviser. Unobservable inputs used in determining fair valuations are identified based on the type of security, taking into consideration factors utilized by market participants in valuing the investment, knowledge about the issuer and the current market environment.
Security loans
The Fund may lend its securities from time to time in order to earn additional income in the form of fees or interest on securities received as collateral or the investment of any cash received as collateral. The Fund continues to receive interest or dividends on the securities loaned. The Fund receives collateral in the form of cash or securities with a value at least equal to the value of the securities on loan. The value of the loaned securities is determined at the close of each business day and any additional required collateral is delivered to the Fund on the next business day. In a securities lending transaction, the net asset value of the Fund will be affected by an increase or decrease in the value of the securities loaned and by an increase or decrease in the value of the instrument in which collateral is invested. The amount of securities lending activity undertaken by the Fund fluctuates from time to time. In the event of default or bankruptcy
| | | | |
| 22 | | Wells Fargo Premier Large Company Growth Fund | | Notes to financial statements (unaudited) |
by the borrower, the Fund may be prevented from recovering the loaned securities or gaining access to the collateral or may experience delays or costs in doing so. In addition, the investment of any cash collateral received may lose all or part of its value. The Fund has the right under the lending agreement to recover the securities from the borrower on demand.
The Fund lends its securities through an unaffiliated securities lending agent. Cash collateral received in connection with its securities lending transactions is invested in Securities Lending Cash Investments, LLC (the “Securities Lending Fund”). The Securities Lending Fund is exempt from registration under Section 3(c)(7) of the 1940 Act and is managed by Funds Management and is subadvised by Wells Capital Management Incorporated (“WellsCap”), an affiliate of Funds Management and an indirect wholly owned subsidiary of Wells Fargo & Company (“Wells Fargo”). Funds Management receives an advisory fee starting at 0.05% and declining to 0.01% as the average daily net assets of the Securities Lending Fund increase. All of the fees received by Funds Management are paid to WellsCap for its services as subadviser. The Securities Lending Fund seeks to provide a positive return compared to the daily Fed Funds Open Rate by investing in high-quality, U.S. dollar-denominated short-term money market instruments. Securities Lending Fund investments are valued at the evaluated bid price provided by an independent pricing service. Income earned from investment in the Securities Lending Fund is included in securities lending income on the Statement of Operations.
Security transactions and income recognition
Securities transactions are recorded on a trade date basis. Realized gains or losses are recorded on the basis of identified cost.
Dividend income is recognized on the ex-dividend date. Dividend income from foreign securities is recorded net of foreign taxes withheld where recovery of such taxes is not assured.
Distributions to shareholders
Distributions to shareholders from net investment income and net realized gains, if any, are recorded on the ex-dividend date. Such distributions are determined in conformity with federal income tax regulations, which may differ in amount or character from net investment income and realized gains recognized for purposes of U.S. generally accepted accounting principles.
Federal and other taxes
The Fund intends to continue to qualify as a regulated investment company by distributing substantially all of its investment company taxable income and any net realized capital gains (after reduction for capital loss carryforwards) sufficient to relieve it from all, or substantially all, federal income taxes. Accordingly, no provision for federal income taxes was required.
The Fund’s income and federal excise tax returns and all financial records supporting those returns for the prior three fiscal years are subject to examination by the federal and Delaware revenue authorities. Management has analyzed the Fund’s tax positions taken on federal, state, and foreign tax returns for all open tax years and does not believe that there are any uncertain tax positions that require recognition of a tax liability.
As of July 31, 2016, the Fund had capital loss carryforwards available to offset future net realized capital gains in the amount of $12,303,738 expiring in 2017.
As of July 31, 2016, the Fund had a qualified late-year ordinary loss of $2,656,167 which was recognized on the first day of the current fiscal year.
Class allocations
The separate classes of shares offered by the Fund differ principally in applicable sales charges, distribution, shareholder servicing, and administration fees. Class specific expenses are charged directly to that share class. Investment income, common expenses, and realized and unrealized gains (losses) on investments are allocated daily to each class of shares based on the relative proportion of net assets of each class.
3. FAIR VALUATION MEASUREMENTS
Fair value measurements of investments are determined within a framework that has established a fair value hierarchy based upon the various data inputs utilized in determining the value of the Fund’s investments. The three-level hierarchy gives the highest priority to unadjusted quoted prices in active markets for identical assets or liabilities (Level 1) and the lowest priority to significant unobservable inputs (Level 3). The Fund’s investments are classified within the fair value hierarchy based on the lowest level of input that is significant to the fair value measurement. The inputs are summarized into three broad levels as follows:
| | | | | | |
| Notes to financial statements (unaudited) | | Wells Fargo Premier Large Company Growth Fund | | | 23 | |
| ∎ | | Level 1 – quoted prices in active markets for identical securities |
| ∎ | | Level 2 – other significant observable inputs (including quoted prices for similar securities, interest rates, prepayment speeds, credit risk, etc.) |
| ∎ | | Level 3 – significant unobservable inputs (including the Fund’s own assumptions in determining the fair value of investments) |
The inputs or methodologies used for valuing investments in securities are not necessarily an indication of the risk associated with investing in those securities.
The following is a summary of the inputs used in valuing the Fund’s assets and liabilities as of January 31, 2017:
| | | | | | | | | | | | | | | | |
| | | Quoted prices
(Level 1) | | | Other significant
observable inputs
(Level 2) | | | Significant
unobservable inputs (Level 3) | | | Total | |
Assets | | | | | | | | | | | | | | | | |
Investments in: | | | | | | | | | | | | | | | | |
| | | | |
Common stocks | | | | | | | | | | | | | | | | |
Consumer discretionary | | $ | 382,278,620 | | | $ | 0 | | | $ | 0 | | | $ | 382,278,620 | |
Consumer staples | | | 106,415,381 | | | | 0 | | | | 0 | | | | 106,415,381 | |
Energy | | | 62,153,508 | | | | 0 | | | | 0 | | | | 62,153,508 | |
Financials | | | 62,140,350 | | | | 0 | | | | 0 | | | | 62,140,350 | |
Health care | | | 409,412,363 | | | | 0 | | | | 0 | | | | 409,412,363 | |
Industrials | | | 323,009,468 | | | | 0 | | | | 0 | | | | 323,009,468 | |
Information technology | | | 1,215,874,073 | | | | 0 | | | | 0 | | | | 1,215,874,073 | |
Materials | | | 100,664,796 | | | | 0 | | | | 0 | | | | 100,664,796 | |
Real estate | | | 22,748,265 | | | | 0 | | | | 0 | | | | 22,748,265 | |
| | | | |
Short-term investments | | | | | | | | | | | | | | | | |
Investment companies | | | 10,069,617 | | | | 0 | | | | 0 | | | | 10,069,617 | |
Investments measured at net asset value* | | | | | | | | | | | | | | | 79,604,809 | |
Total assets | | $ | 2,694,766,441 | | | $ | 0 | | | $ | 0 | | | $ | 2,774,371,250 | |
| * | Investments that are measured at fair value using the net asset value per share (or its equivalent) as a practical expedient have not been categorized in the fair value hierarchy. The fair value amount presented in the table is intended to permit reconciliation of the fair value hierarchy to the amounts presented in the Statement of Assets and Liabilities. The Fund’s investment in Securities Lending Cash Investments, LLC valued at $79,604,809 does not have a redemption period notice, can be redeemed daily and does not have any unfunded commitments. |
The Fund recognizes transfers between levels within the fair value hierarchy at the end of the reporting period. At January 31, 2017, the Fund did not have any transfers into/out of Level 1, Level 2, or Level 3.
4. TRANSACTIONS WITH AFFILIATES AND OTHER EXPENSES
Management fee
Funds Management, an indirect wholly owned subsidiary of Wells Fargo, is the manager of the Fund and provides advisory and fund-level administrative services under an investment management agreement. Under the investment management agreement, Funds Management is responsible for, among other services, implementing the investment objectives and strategies of the Fund, supervising the subadviser, providing fund-level administrative services in connection with the Fund’s operations, and providing any other fund-level administrative services reasonably necessary for the operation of the Fund. As compensation for its services under the investment management agreement, Funds Management is entitled to receive an annual management fee starting at 0.70% and declining to 0.505% as the average daily net assets of the Fund increase. For the six months ended January 31, 2017, the management fee was equivalent to an annual rate of 0.65% of the Fund’s average daily net assets.
Funds Management has retained the services of a subadviser to provide daily portfolio management to the Fund. The fee for subadvisory services is borne by Funds Management. WellsCap is the subadviser to the Fund and is entitled to receive a fee from Funds Management at an annual rate starting at 0.35% and declining to 0.275% as the average daily net assets of the Fund increase.
| | | | |
| 24 | | Wells Fargo Premier Large Company Growth Fund | | Notes to financial statements (unaudited) |
Administration fees
Under a class-level administration agreement, Funds Management provides class-level administrative services to the Fund, which includes paying fees and expenses for services provided by the transfer agent, sub-transfer agents, omnibus account servicers and record-keepers. As compensation for its services under the class-level administration agreement, Funds Management receives an annual fee which is calculated based on the average daily net assets of each class as follows:
| | | | |
| | | Class-level
administration fee | |
Class A, Class B, Class C | | | 0.21 | % |
Class R4 | | | 0.08 | |
Class R6 | | | 0.03 | |
Administrator Class, Institutional Class | | | 0.13 | |
Funds Management has contractually waived and/or reimbursed management and administration fees to the extent necessary to maintain certain net operating expense ratios for the Fund. Waiver of fees and/or reimbursement of expenses by Funds Management were made first from fund level expenses on a proportionate basis and then from class specific expenses. Funds Management has committed through November 30, 2017 to waive fees and/or reimburse expenses to the extent necessary to cap the Fund’s expenses at 1.11% for Class A shares, 1.86% for Class B shares, 1.86% for Class C shares, 0.80% for Class R4 shares, 0.65% for Class R6 shares, 1.00% for Administrator Class shares, and 0.70% for Institutional Class shares. After this time, the cap may be increased or the commitment to maintain the cap may be terminated only with the approval of the Board of Trustees.
During the six months ended January 31, 2017, State Street Bank and Trust Company, the Fund’s custodian, reimbursed the Fund $9,311 for certain out-of-pocket expenses that were billed to the Fund in error from 1998-2015. This amount is included in dividend income on the Statement of Operations. In addition, Funds Management was also reimbursed $4,740 for waivers/reimbursements it made to the Fund during the period the Fund was erroneously billed.
Distribution fees
The Trust has adopted a distribution plan for Class B and Class C shares of the Fund pursuant to Rule 12b-1 under the 1940 Act. Distribution fees are charged to Class B and Class C shares and paid to Wells Fargo Funds Distributor, LLC (“Funds Distributor”), the principal underwriter, at an annual rate of 0.75% of the average daily net assets of Class B and Class C shares.
In addition, Funds Distributor is entitled to receive the front-end sales charge from the purchase of Class A shares and a contingent deferred sales charge on the redemption of certain Class A shares. Funds Distributor is also entitled to receive the contingent deferred sales charges from redemptions of Class B and Class C shares. For the six months ended January 31, 2017, Funds Distributor received $16,529 from the sale of Class A shares and $478 in contingent deferred sales charges from redemptions of Class C shares.
Shareholder servicing fees
The Trust has entered into contracts with one or more shareholder servicing agents, whereby Class A, Class B, Class C, and Administrator Class of the Fund are charged a fee at an annual rate of 0.25% of the average daily net assets of each respective class. Class R4 is charged a fee at an annual rate of 0.10% of its average daily net assets.
A portion of these total shareholder servicing fees were paid to affiliates of Wells Fargo.
5. INVESTMENT PORTFOLIO TRANSACTIONS
Purchases and sales of investments, excluding U.S. government obligations (if any) and short-term securities, for the six months ended January 31, 2017 were $1,303,292,179 and $1,961,859,852, respectively.
The Fund may purchase or sell investment securities to other Wells Fargo funds under procedures adopted by the Board of Trustees. The procedures have been designed to ensure that these interfund transactions, which generally do not incur broker commissions, are effected at current market prices. Interfund trades are included within the respective purchases and sales amounts shown.
| | | | | | |
| Notes to financial statements (unaudited) | | Wells Fargo Premier Large Company Growth Fund | | | 25 | |
6. BANK BORROWINGS
The Trust (excluding the money market funds and certain other funds) and Wells Fargo Variable Trust are parties to a $250,000,000 revolving credit agreement whereby the Fund is permitted to use bank borrowings for temporary or emergency purposes, such as to fund shareholder redemption requests. Interest under the credit agreement is charged to the Fund based on a borrowing rate equal to the higher of the Federal Funds rate in effect on that day plus 1.25% or the overnight LIBOR rate in effect on that day plus 1.25%. In addition, an annual commitment fee equal to 0.25% of the unused balance is allocated to each participating fund. Prior to August 30, 2016, the revolving credit agreement amount was $200,000,000 and the annual commitment fee was equal to 0.20% of the unused balance which was allocated to each participating fund.
For the six months ended January 31, 2017, there were no borrowings by the Fund under the agreement.
7. CONCENTRATION RISK
Concentration risks result from exposure to a limited number of sectors. A fund that invests a substantial portion of its assets in any sector may be more affected by changes in that sector than would be a fund whose investments are not heavily weighted in any sector.
8. INDEMNIFICATION
Under the Trust’s organizational documents, the officers and Trustees have been granted certain indemnification rights against certain liabilities that may arise out of performance of their duties to the Trust. Additionally, in the normal course of business, the Trust may enter into contracts with service providers that contain a variety of indemnification clauses. The Trust’s maximum exposure under these arrangements is dependent on future claims that may be made against the Fund and, therefore, cannot be estimated.
9. NEW ACCOUNTING PRONOUNCEMENT
In December 2016, the Financial Accounting Standards Board (“FASB”) issued Accounting Standard Update (“ASU”) No. 2016-19, Technical Corrections and Improvements. ASU 2016-19 includes an amendment to FASB ASC Topic 820, Fair Value Measurement which clarifies the difference between a valuation approach and a valuation technique. The amendment also requires an entity to disclose when there has been a change in either or both a valuation approach and/or a valuation technique. The disclosure requirements are effective for fiscal years and interim periods within those fiscal years beginning after December 15, 2016. Management is currently evaluating the potential impact of this new guidance to the financial statements.
10. REGULATORY CHANGES
In October 2016, the Securities and Exchange Commission (“SEC”) adopted new rules and forms and amended existing rules and forms (together, “final rules”) intended to modernize and enhance the reporting and disclosure of information by registered investment companies and to enhance liquidity risk management by open-end mutual funds and exchange-traded funds. The final rules will enhance the quality of information available to investors and will allow the SEC to more effectively collect and use data reported by funds. In part, the final rules amend Regulation S-X and require standardized, enhanced disclosure about derivatives in the Fund’s financial statements, as well as other amendments. The compliance date for the amendments to Regulation S-X is August 1, 2017 while the compliance date for the new form types is June 1, 2018 and the compliance date for the liquidity risk management program requirements is December 1, 2018. Management is currently assessing the potential impact of these enhancements and their impact on the financial statement disclosures and reporting requirements.
| | | | |
| 26 | | Wells Fargo Premier Large Company Growth Fund | | Other information (unaudited) |
PROXY VOTING INFORMATION
A description of the policies and procedures that the Fund uses to determine how to vote proxies relating to portfolio securities is available, upon request, by calling 1-800-222-8222, visiting our website at wellsfargofunds.com, or visiting the SEC website at sec.gov. Information regarding how the Fund voted proxies relating to portfolio securities during the most recent 12-month period ended June 30 is available on the Fund’s website at wellsfargofunds.com or by visiting the SEC website at sec.gov.
PORTFOLIO HOLDINGS INFORMATION
The complete portfolio holdings for the Fund are publicly available monthly on the Fund’s website (wellsfargofunds.com), on a one-month delayed basis. In addition, top ten holdings information (excluding derivative positions) for the Fund is publicly available on the Fund’s website on a monthly, seven-day or more delayed basis. The Fund files its complete schedule of portfolio holdings with the SEC for the first and third quarters of each fiscal year on Form N-Q, which is available by visiting the SEC website at sec.gov. In addition, the Fund’s Form N-Q may be reviewed and copied at the SEC’s Public Reference Room in Washington, DC, and at regional offices in New York City, at 233 Broadway, and in Chicago, at 175 West Jackson Boulevard, Suite 900. Information about the Public Reference Room may be obtained by calling 1-800-SEC-0330.
| | | | | | |
| Other information (unaudited) | | Wells Fargo Premier Large Company Growth Fund | | | 27 | |
BOARD OF TRUSTEES AND OFFICERS
Each of the Trustees and Officers1 listed in the table below acts in identical capacities for each fund in the Wells Fargo family of funds, which consists of 138 mutual funds comprising the Wells Fargo Funds Trust, Wells Fargo Variable Trust, Wells Fargo Master Trust and four closed-end funds (collectively the “Fund Complex”). This table should be read in conjunction with the Prospectus and the Statement of Additional Information2. The mailing address of each Trustee and Officer is 525 Market Street, 12th Floor, San Francisco, CA 94105. Each Trustee and Officer serves an indefinite term, however, each Trustee serves such term until reaching the mandatory retirement age established by the Trustees.
Independent Trustees
| | | | | | |
Name and year of birth | | Position held and length of service* | | Principal occupations during past five years or longer | | Current other
public company or
investment company directorships |
William R. Ebsworth
(Born 1957) | | Trustee, since 2015 | | Retired. From 1984 to 2013, equities analyst, portfolio manager, research director and chief financial officer at Fidelity Management and Research Company in Boston, Tokyo, and Hong Kong and retired in 2013 as Chief Investment Officer of Fidelity Strategic Advisers, Inc. where he lead a team of investment professionals managing client assets. Prior thereto, Board member of Hong Kong Securities Clearing Co., Hong Kong Options Clearing Corp., the Thailand International Fund, Ltd., Fidelity Investments Life Insurance Company, and Empire Fidelity Investments Life Insurance Company. Board member of the Fonté Foundation (non-profit organization) and the Vincent Memorial Hospital Endowment (non-profit organization), where he serves on the Investment Committee and as a Chair of the Audit Committee. Mr. Ebsworth is a CFA® charterholder and an Adjunct Lecturer, Finance, at Babson College. | | Asset Allocation Trust |
Jane A. Freeman
(Born 1953) | | Trustee, since 2015 | | Retired. From 2012 to 2014 and 1999 to 2008, Chief Financial Officer of Scientific Learning Corporation. From 2008 to 2012, Ms. Freeman provided consulting services related to strategic business projects. Prior to 1999, Portfolio Manager at Rockefeller & Co. and Scudder, Stevens & Clark. Board member of the Harding Loevner Funds from 1996 to 2014, serving as both Lead Independent Director and chair of the Audit Committee. Board member of the Russell Exchange Traded Funds Trust from 2011 to 2012 and the chair of the Audit Committee. Ms. Freeman is Chair of Taproot Foundation (non-profit organization), a Board Member of Ruth Bancroft Garden (non-profit organization) and an inactive chartered financial analyst. | | Asset Allocation Trust |
Peter G. Gordon**
(Born 1942) | | Trustee, since 1998; Chairman, since 2005 | | Co-Founder, Retired Chairman, President and CEO of Crystal Geyser Water Company. Trustee Emeritus, Colby College. | | Asset Allocation Trust |
Isaiah Harris, Jr.
(Born 1952) | | Trustee, since 2009 | | Retired. Chairman of the Board of CIGNA Corporation since 2009, and Director since 2005. From 2003 to 2011, Director of Deluxe Corporation. Prior thereto, President and CEO of BellSouth Advertising and Publishing Corp. from 2005 to 2007, President and CEO of BellSouth Enterprises from 2004 to 2005 and President of BellSouth Consumer Services from 2000 to 2003. Emeritus member of the Iowa State University Foundation Board of Governors. Emeritus Member of the Advisory Board of Iowa State University School of Business. Advisory Board Member, Palm Harbor Academy (charter school). Advisory Board Member, Child Evangelism Fellowship (non-profit). Mr. Harris is a certified public accountant (inactive status). | | CIGNA Corporation; Asset Allocation Trust |
Judith M. Johnson
(Born 1949) | | Trustee, since 2008; Audit Committee Chairman, since 2008 | | Retired. Prior thereto, Chief Executive Officer and Chief Investment Officer of Minneapolis Employees Retirement Fund from 1996 to 2008. Ms. Johnson is an attorney, certified public accountant and a certified managerial accountant. | | Asset Allocation Trust |
David F. Larcker
(Born 1950) | | Trustee, since 2009 | | James Irvin Miller Professor of Accounting at the Graduate School of Business, Stanford University, Director of the Corporate Governance Research Initiative and Senior Faculty of The Rock Center for Corporate Governance since 2006. From 2005 to 2008, Professor of Accounting at the Graduate School of Business, Stanford University. Prior thereto, Ernst & Young Professor of Accounting at The Wharton School, University of Pennsylvania from 1985 to 2005. | | Asset Allocation Trust |
| | | | |
| 28 | | Wells Fargo Premier Large Company Growth Fund | | Other information (unaudited) |
| | | | | | |
Name and year of birth | | Position held and length of service* | | Principal occupations during past five years or longer | | Current other
public company or
investment company directorships |
Olivia S. Mitchell
(Born 1953) | | Trustee, since 2006 | | International Foundation of Employee Benefit Plans Professor, Wharton School of the University of Pennsylvania since 1993. Director of Wharton’s Pension Research Council and Boettner Center on Pensions & Retirement Research, and Research Associate at the National Bureau of Economic Research. Previously, Cornell University Professor from 1978 to 1993. | | Asset Allocation Trust |
Timothy J. Penny
(Born 1951) | | Trustee, since 1996 | | President and Chief Executive Officer of Southern Minnesota Initiative Foundation, a non-profit organization, since 2007 and Senior Fellow at the Humphrey Institute Policy Forum at the University of Minnesota since 1995. Member of the Board of Trustees of NorthStar Education Finance, Inc., a non-profit organization, since 2007. | | Asset Allocation Trust |
Michael S. Scofield
(Born 1943) | | Trustee, since 2010 | | Served on the Investment Company Institute’s Board of Governors and Executive Committee from 2008-2011 as well the Governing Council of the Independent Directors Council from 2006-2011 and the Independent Directors Council Executive Committee from 2008-2011. Chairman of the IDC from 2008-2010. Institutional Investor (Fund Directions) Trustee of Year in 2007. Trustee of the Evergreen Funds complex (and its predecessors) from 1984 to 2010. Chairman of the Evergreen Funds from 2000-2010. Former Trustee of the Mentor Funds. Retired Attorney, Law Offices of Michael S. Scofield. | | Asset Allocation Trust |
| * | Length of service dates reflect the Trustee’s commencement of service with the Trust’s predecessor entities, where applicable. |
| ** | Peter Gordon is expected to retire on December 31, 2017. |
Officers
| | | | | | |
Name and
year of birth | | Position held and
length of service | | Principal occupations during past five years or longer | | |
Andrew Owen
(Born 1960) | | President, since 2017 | | Executive Vice President of Wells Fargo Bank, N.A. and President of Wells Fargo & Company and Head of Affiliated Managers, Wells Fargo Asset Management, since 2014. Executive Vice President responsible for marketing, investments and product development for Wells Fargo Funds Management, LLC, from 2009 to 2014. | | |
Jeremy DePalma1
(Born 1974) | | Treasurer, since 2012 | | Senior Vice President of Wells Fargo Funds Management, LLC since 2009. Senior Vice President of Evergreen Investment Management Company, LLC from 2008 to 2010 and head of the Fund Reporting and Control Team within Fund Administration from 2005 to 2010. | | |
C. David Messman
(Born 1960) | | Secretary, since 2000; Chief Legal Officer, since 2003 | | Senior Vice President and Secretary of Wells Fargo Funds Management, LLC since 2001. Assistant General Counsel of Wells Fargo Bank, N.A. since 2013 and Vice President and Managing Counsel of Wells Fargo Bank, N.A. from 1996 to 2013. | | |
Michael Whitaker
(Born 1967) | | Chief Compliance Officer, since 2016 | | Executive Vice President of Wells Fargo Funds Management, LLC since 2016. Chief Compliance Officer of Fidelity’s Fixed Income Funds and Asset Allocation Funds from 2008 to 2016, Compliance Officer of FMR Co., Inc. from 2014 to 2016, Fidelity Investments Money Management, Inc. from 2014 to 2016, Fidelity Investments from 2007 to 2016. | | |
David Berardi
(Born 1975) | | Assistant Treasurer, since 2009 | | Vice President of Wells Fargo Funds Management, LLC since 2009. Vice President of Evergreen Investment Management Company, LLC from 2008 to 2010. Manager of Fund Reporting and Control for Evergreen Investment Management Company, LLC from 2004 to 2010. | | |
| 1 | Jeremy DePalma acts as Treasurer of 69 funds and Assistant Treasurer of 69 funds in the Fund Complex. |
| 2 | The Statement of Additional Information includes additional information about the Trustees and is available, without charge, upon request, by calling 1-800-222-8222 or by visiting the website at wellsfargofunds.com. |
| | | | | | |
| List of abbreviations | | Wells Fargo Premier Large Company Growth Fund | | | 29 | |
The following is a list of common abbreviations for terms and entities that may have appeared in this report.
| ACA | — ACA Financial Guaranty Corporation |
| ADR | — American depositary receipt |
| ADS | — American depositary shares |
| AGC | — Assured Guaranty Corporation |
| AGM | — Assured Guaranty Municipal |
| Ambac | — Ambac Financial Group Incorporated |
| AMT | — Alternative minimum tax |
| BAN | — Bond anticipation notes |
| BHAC | — Berkshire Hathaway Assurance Corporation |
| CAB | — Capital appreciation bond |
| CCAB | — Convertible capital appreciation bond |
| CDA | — Community Development Authority |
| CDO | — Collateralized debt obligation |
| DRIVER | — Derivative inverse tax-exempt receipts |
| DW&P | — Department of Water & Power |
| DWR | — Department of Water Resources |
| ECFA | — Educational & Cultural Facilities Authority |
| EDA | — Economic Development Authority |
| EDFA | — Economic Development Finance Authority |
| ETF | — Exchange-traded fund |
| FDIC | — Federal Deposit Insurance Corporation |
| FFCB | — Federal Farm Credit Banks |
| FGIC | — Financial Guaranty Insurance Corporation |
| FHA | — Federal Housing Administration |
| FHLB | — Federal Home Loan Bank |
| FHLMC | — Federal Home Loan Mortgage Corporation |
| FICO | — The Financing Corporation |
| FNMA | — Federal National Mortgage Association |
| GDR | — Global depositary receipt |
| GNMA | — Government National Mortgage Association |
| HCFR | — Healthcare facilities revenue |
| HEFA | — Health & Educational Facilities Authority |
| HEFAR | — Higher education facilities authority revenue |
| HFA | — Housing Finance Authority |
| HFFA | — Health Facilities Financing Authority |
| HUD | — Department of Housing and Urban Development |
| IDA | — Industrial Development Authority |
| IDAG | — Industrial Development Agency |
| KRW | — Republic of Korea won |
| LIBOR | — London Interbank Offered Rate |
| LIFER | — Long Inverse Floating Exempt Receipts |
| LLC | — Limited liability company |
| LLLP | — Limited liability limited partnership |
| LLP | — Limited liability partnership |
| MBIA | — Municipal Bond Insurance Association |
| MFHR | — Multifamily housing revenue |
| MSTR | — Municipal securities trust receipts |
| MUD | — Municipal Utility District |
| National | — National Public Finance Guarantee Corporation |
| PCFA | — Pollution Control Financing Authority |
| PCL | — Public Company Limited |
| PCR | — Pollution control revenue |
| PFA | — Public Finance Authority |
| PFFA | — Public Facilities Financing Authority |
| PFOTER | — Puttable floating option tax-exempt receipts |
| plc | — Public limited company |
| PUTTER | — Puttable tax-exempt receipts |
| R&D | — Research & development |
| Radian | — Radian Asset Assurance |
| RAN | — Revenue anticipation notes |
| RDA | — Redevelopment Authority |
| RDFA | — Redevelopment Finance Authority |
| REIT | — Real estate investment trust |
| ROC | — Reset option certificates |
| SAVRS | — Select auction variable rate securities |
| SBA | — Small Business Authority |
| SDR | — Swedish depositary receipt |
| SFHR | — Single-family housing revenue |
| SFMR | — Single-family mortgage revenue |
| SPA | — Standby purchase agreement |
| SPDR | — Standard & Poor’s Depositary Receipts |
| SPEAR | — Short Puttable Exempt Adjustable Receipts |
| STRIPS | — Separate trading of registered interest and |
| TAN | — Tax anticipation notes |
| TIPS | — Treasury inflation-protected securities |
| TRAN | — Tax revenue anticipation notes |
| TTFA | — Transportation Trust Fund Authority |
| TVA | — Tennessee Valley Authority |
This page is intentionally left blank.
This page is intentionally left blank.
This page is intentionally left blank.

For more information
More information about Wells Fargo Funds is available free upon request. To obtain literature, please write, email, visit the Fund’s website, or call:
Wells Fargo Funds
P.O. Box 8266
Boston, MA 02266-8266
Email: fundservice@wellsfargo.com
Website: wellsfargofunds.com
Individual investors: 1-800-222-8222
Retail investment professionals: 1-888-877-9275
Institutional investment professionals: 1-866-765-0778
This report and the financial statements contained herein are submitted for the general information of the shareholders of the Fund. If this report is used for promotional purposes, distribution of the report must be accompanied or preceded by a current prospectus. Before investing, please consider the investment objectives, risks, charges, and expenses of the investment. For a current prospectus and, if available, a summary prospectus, containing this information, call 1-800-222-8222 or visit the Fund’s website at wellsfargofunds.com. Read the prospectus carefully before you invest or send money.
Wells Fargo Asset Management (WFAM) is a trade name used by the asset management businesses of Wells Fargo & Company. Wells Fargo Funds Management, LLC, a wholly owned subsidiary of Wells Fargo & Company, provides investment advisory and administrative services for Wells Fargo Funds. Other affiliates of Wells Fargo & Company provide subadvisory and other services for the funds. The funds are distributed by Wells Fargo Funds Distributor, LLC, Member FINRA, an affiliate of Wells Fargo & Company. Neither Wells Fargo Funds Management nor Wells Fargo Funds Distributor has Fund customer accounts/assets, and neither provides investment advice/recommendations or acts as an investment advice fiduciary to any investor.
NOT FDIC INSURED ◾ NO BANK GUARANTEE ◾ MAY LOSE VALUE
© 2017 Wells Fargo Funds Management, LLC. All rights reserved.
| | |
 | | 301465 03-17 SA212/SAR212 01-17 |
Not applicable.
| ITEM 3. | AUDIT COMMITTEE FINANCIAL EXPERT |
Not applicable.
| ITEM 4. | PRINCIPAL ACCOUNTANT FEES AND SERVICES |
Not applicable.
| ITEM 5. | AUDIT COMMITTEE OF LISTED REGISTRANTS |
Not applicable.
A Portfolio of Investments for each series of Wells Fargo Funds Trust is included as part of the report to shareholders filed under Item 1 of this Form.
| ITEM 7. | DISCLOSURE OF PROXY VOTING POLICIES AND PROCEDURES FOR CLOSED-END MANAGEMENT INVESTMENT COMPANIES |
Not applicable.
| ITEM 8. | PORTFOLIO MANAGERS OF CLOSED-END MANAGEMENT INVESTMENT COMPANIES |
Not applicable.
| ITEM 9. | PURCHASES OF EQUITY SECURITIES BY CLOSED-END MANAGEMEENT INVESTMENT COMPANY AND AFFILIATED PURCHASERS |
Not applicable.
| ITEM 10. | SUBMISSION OF MATTERS TO A VOTE OF SECURITY HOLDERS |
There have been no material changes to the procedures by which shareholders may recommend nominees to the registrant’s Board of Trustees that have been implemented since the registrant’s last provided disclosure in response to the requirements of this Item.
| ITEM 11. | CONTROLS AND PROCEDURES |
(a) The President and Treasurer have concluded that the Wells Fargo Funds Trust (the “Trust”) disclosure controls and procedures (as defined in Rule 30a-3(c) under the Investment Company Act of 1940) provide reasonable assurances that material information relating to the Trust is made known to them by the appropriate persons, based on their evaluation of these controls and procedures as of a date within 90 days of the filing of this report.
(b) There were no significant changes in the Trust’s internal controls over financial reporting (as defined in Rule 30a-3(d) under the Investment Company Act of 1940) that occurred during the second fiscal quarter of the period covered by this report that materially affected, or is reasonably likely to materially affect, the registrant’s internal control over financial reporting.
(a)(1) Not applicable.
(a)(2) Certification pursuant to Rule 30a-2(a) under the Investment Company Act of 1940 (17 CFR 270.30a-2(a)) is filed and attached hereto as Exhibit 99.CERT.
(a)(3) Not applicable.
(b) Certification pursuant to Rule 30a-2(b) under the Investment Company Act of 1940 (17 CFR 270.30a-2(b)) is filed and attached hereto as Exhibit 99.906CERT.
SIGNATURES
Pursuant to the requirements of the Securities Exchange Act of 1934 and the Investment Company Act of 1940, the registrant has duly caused this report to be signed on its behalf by the undersigned, thereunto duly authorized.
| | |
| Wells Fargo Funds Trust |
| |
| By: | | /s/ Andrew Owen |
| | Andrew Owen |
| | President |
Pursuant to the requirements of the Securities Exchange Act of 1934 and the Investment Company Act of 1940, this report has been signed below by the following persons on behalf of the registrant and in the capacities and on the date indicated.
| | |
| Wells Fargo Funds Trust |
| |
| By: | | /s/ Andrew Owen |
| | Andrew Owen |
| | President |
| | |
| |
| By: | | /s/ Jeremy DePalma |
| | Jeremy DePalma |
| | Treasurer |