
UNITED STATES
SECURITIES AND EXCHANGE COMMISSION
Washington, D.C. 20549
FORM N-CSRS
CERTIFIED SHAREHOLDER REPORT OF REGISTERED
MANAGEMENT INVESTMENT COMPANIES
Investment Company Act file number: 811-09253
Wells Fargo Funds Trust
(Exact name of registrant as specified in charter)
525 Market St., San Francisco, CA 94105
(Address of principal executive offices) (Zip code)
C. David Messman
Wells Fargo Funds Management, LLC
525 Market St., San Francisco, CA 94105
(Name and address of agent for service)
Registrant’s telephone number, including area code: 800-222-8222
Date of fiscal year end: September 30
Registrant is making a filing for 11 of its series:
Wells Fargo Diversified Capital Builder Fund, Wells Fargo Diversified Income Builder Fund, Wells Fargo Index Asset Allocation Fund, Wells Fargo International Bond Fund, Wells Fargo Strategic Income Fund, Wells Fargo C&B Mid Cap Value Fund, Wells Fargo Common Stock Fund, Wells Fargo Discovery Fund, Wells Fargo Enterprise Fund, Wells Fargo Opportunity Fund, and Wells Fargo Special Mid Cap Value Fund.
Date of reporting period: Mach 31, 2017
| ITEM 1. | REPORT TO STOCKHOLDERS |
Semi-Annual Report
March 31, 2017

Wells Fargo Diversified Capital Builder Fund


Reduce clutter. Save trees.
Sign up for electronic delivery of prospectuses and shareholder reports at wellsfargo.com/advantagedelivery
Contents
The views expressed and any forward-looking statements are as of March 31, 2017, unless otherwise noted, and are those of the Fund managers and/or Wells Fargo Funds Management, LLC. Discussions of individual securities, or the markets generally, or any Wells Fargo Fund are not intended as individual recommendations. Future events or results may vary significantly from those expressed in any forward-looking statements. The views expressed are subject to change at any time in response to changing circumstances in the market. Wells Fargo Funds Management, LLC and the Fund disclaim any obligation to publicly update or revise any views expressed or forward-looking statements.
NOT FDIC INSURED ◾ NO BANK GUARANTEE ◾ MAY LOSE VALUE
| | | | |
| 2 | | Wells Fargo Diversified Capital Builder Fund | | Letter to shareholders (unaudited) |

Andrew Owen
President
Wells Fargo Funds
U.S. and international stocks returned 10.12% and 8.18% for the six-month period; within fixed income, the Bloomberg Barclays U.S. Aggregate Bond Index3 returned -2.18%.
Dear Shareholder:
As the new president of Wells Fargo Funds now that Karla Rabusch is retiring from that position after nearly 14 years, I am pleased to offer you this semi-annual report for the Wells Fargo Diversified Capital Builder Fund for the six-month period that ended March 31, 2017. During this period, global stocks delivered favorable results overall. U.S. and international stocks returned 10.12% and 8.18% for the six-month period, respectively, as measured by the S&P 500 Index1 and the MSCI ACWI ex USA Index (Net)2; within fixed income, the Bloomberg Barclays U.S. Aggregate Bond Index3 returned -2.18%.
During the fourth quarter of 2016, prospects for faster growth and higher interest rates in the U.S. influenced markets.
Early in the fourth quarter of 2016, U.S. stocks tended to trade lower amid concerns such as a likely interest-rate increase and uncertainty over the approaching general election. However, following Donald Trump’s election as president in early November, U.S. stocks began to rally. Investors appeared optimistic that the new administration would usher in a series of progrowth policies, and supportive economic news helped the rally carry through the quarter. The buoyant environment sent interest rates higher as well. At its mid-December meeting, Fed officials raised their short-term target interest rate for the first time in a year by a quarter percentage point to between 0.50% and 0.75%. The fourth quarter also saw the implementation of the U.S. Securities and Exchange Commission’s new rules for money market funds, which included floating net asset values (NAVs) for institutional prime and municipal money market funds as well as liquidity fees and redemption gates. In the year leading up to money market fund reform implementation, nearly $1 trillion in assets moved from these types of money market funds into government money market funds, which continued to transact at a stable $1 NAV. Outside of the U.S., the prospects for faster U.S. growth appeared to trigger some acceleration in Europe. The improvement may be partly attributable to expectations for further strengthening of the U.S. dollar, which in turn could improve demand for European goods in the U.S. due to weakening of the euro relative to the dollar. Meanwhile, rising inflation across the eurozone and Japan caused an upward shift in yield curves in those areas although developed-country bond yields remained significantly lower than U.S. Treasury yields.
Globally, stocks delivered positive results and economies showed some improvement in the first quarter of 2017.
Stocks rallied globally through the first quarter of 2017, supported by signs of improvement in the U.S. and global economies. U.S. economic data released during the quarter reflected a healthy economy. Hiring remained strong, and business and consumer sentiment improved. Meanwhile, inflation inched up during the quarter. Along with the pickup in inflation, investors appeared to shift
| 1 | The S&P 500 Index consists of 500 stocks chosen for market size, liquidity, and industry group representation. It is a market-value-weighted index with each stock’s weight in the index proportionate to its market value. You cannot invest directly in an index. |
| 2 | The Morgan Stanley Capital International (MSCI) All Country World Index (ACWI) ex USA Index (Net) is a free-float-adjusted market-capitalization-weighted index that is designed to measure the equity market performance of developed markets, excluding the United States and Canada. Source: MSCI. MSCI makes no express or implied warranties or representations and shall have no liability whatsoever with respect to any MSCI data contained herein. The MSCI data may not be further redistributed or used as a basis for other indexes or any securities or financial products. This report is not approved, reviewed, or produced by MSCI. You cannot invest directly in an index. |
| 3 | The Bloomberg Barclays U.S. Aggregate Bond Index (formerly known as Barclays U.S. Aggregate Bond Index) is a broad-based benchmark that measures the investment-grade, U.S. dollar–denominated, fixed-rate taxable bond market, including Treasuries, government-related and corporate securities, mortgage-backed securities (agency fixed-rate and hybrid adjustable-rate mortgage pass-throughs), asset-backed securities, and commercial mortgage-backed securities. You cannot invest directly in an index. |
| | | | | | |
| Letter to shareholders (unaudited) | | Wells Fargo Diversified Capital Builder Fund | | | 3 | |
from a mindset of very gradual interest-rate increases by the Fed to an anticipation of three or four increases in 2017. The first of these occurred in March; Fed officials raised their short-term target rate by a quarter percentage point to between 0.75% and 1.00%. With the Fed’s target-rate increase, short-term bond yields rose during the quarter. Meanwhile, longer-term Treasury yields were little changed, leading to positive performance. Investment-grade and high-yield bonds benefited from strong demand. Municipal bond returns were positive in the quarter, helped by strong demand and constrained new-issue supply. Outside of the U.S., credit spreads narrowed, helping lower-quality credit outperform amid a strong demand for yield. Also, stocks in emerging markets generally outperformed stocks in the U.S. and international developed markets. Thus far in 2017, emerging markets overall have benefited from both global economic growth and recent weakening in the U.S. dollar. European stocks also outperformed the U.S. market, despite investors’ concern over uncertainties such as the potential impact of an upcoming election in France; a contender for president of France, Marine Le Pen, favored exiting the European Union, which could potentially destabilize or topple the organization.
Don’t let short-term uncertainty derail long-term investment goals.
Periods of uncertainty can present challenges, but experience has taught us that maintaining long-term investment goals can be an effective way to plan for the future. To help you create a sound strategy based on your personal goals and risk tolerance, Wells Fargo Funds offers more than 100 mutual funds spanning a wide range of asset classes and investment styles. Although diversification cannot guarantee an investment profit or prevent losses, we believe it can be an effective way to manage investment risk and potentially smooth out overall portfolio performance. We encourage investors to know their investments and to understand that appropriate levels of risk-taking may unlock opportunities.
Thank you for choosing to invest in Wells Fargo Funds. We appreciate your confidence in us and remain committed to helping you meet your financial needs.
Sincerely,

Andrew Owen
President
Wells Fargo Funds
Although diversification cannot guarantee an investment profit or prevent losses, we believe it can be an effective way to manage investment risk and potentially smooth out overall portfolio performance.
For further information about your Fund, contact your investment professional, visit our website at wellsfargofunds.com, or call us directly at 1-800-222-8222. We are available 24 hours a day, 7 days a week.
| | | | |
| 4 | | Wells Fargo Diversified Capital Builder Fund | | Performance highlights (unaudited) |
Investment objective
The Fund seeks long-term total return, consisting of capital appreciation and current income.
Manager
Wells Fargo Funds Management, LLC
Subadviser
Wells Fargo Capital Management Incorporated
Portfolio manager
Margaret Patel
Average annual total returns (%) as of March 31, 20171
| | | | | | | | | | | | | | | | | | | | | | | | | | | | | | | | | | |
| | | | | Including sales charge | | | Excluding sales charge | | | Expense ratios2 (%) | |
| | | Inception date | | 1 year | | | 5 year | | | 10 year | | | 1 year | | | 5 year | | | 10 year | | | Gross | | | Net3 | |
| Class A (EKBAX) | | 1-20-1998 | | | 13.78 | | | | 11.85 | | | | 5.97 | | | | 20.73 | | | | 13.19 | | | | 6.60 | | | | 1.14 | | | | 1.14 | |
| Class B (EKBBX)* | | 9-11-1935 | | | 14.88 | | | | 12.09 | | | | 6.07 | | | | 19.88 | | | | 12.34 | | | | 6.07 | | | | 1.89 | | | | 1.89 | |
| Class C (EKBCX) | | 1-22-1998 | | | 18.80 | | | | 12.35 | | | | 5.80 | | | | 19.80 | | | | 12.35 | | | | 5.80 | | | | 1.89 | | | | 1.89 | |
| Administrator Class (EKBDX) | | 7-30-2010 | | | – | | | | – | | | | – | | | | 20.82 | | | | 13.40 | | | | 6.78 | | | | 1.06 | | | | 1.05 | |
| Institutional Class (EKBYX) | | 1-26-1998 | | | – | | | | – | | | | – | | | | 21.16 | | | | 13.64 | | | | 6.97 | | | | 0.81 | | | | 0.78 | |
| Diversified Capital Builder Blended Index4 | | – | | | – | | | | – | | | | – | | | | 17.31 | | | | 11.68 | | | | 7.61 | | | | – | | | | – | |
| BofA Merrill Lynch High Yield U.S. Corporates, Cash Pay Index5 | | – | | | – | | | | – | | | | – | | | | 16.75 | | | | 6.82 | | | | 7.28 | | | | – | | | | – | |
| Russell 1000® Index6 | | – | | | – | | | | – | | | | – | | | | 17.43 | | | | 13.26 | | | | 7.58 | | | | – | | | | – | |
| * | | At the close of business on May 5, 2017, existing Class B shareholders were converted to Class A shareholders. Effective May 6, 2017, Class B shares are no longer offered by the Fund. |
Figures quoted represent past performance, which is no guarantee of future results, and do not reflect taxes that a shareholder may pay on fund distributions or the redemption of fund shares. Investment return and principal value of an investment will fluctuate so that an investor’s shares, when redeemed, may be worth more or less than their original cost. Performance shown without sales charges would be lower if sales charges were reflected. Current performance may be lower or higher than the performance data quoted, which assumes the reinvestment of dividends and capital gains. Current month-end performance is available on the Fund’s website, wellsfargofunds.com.
Index returns do not include transaction costs associated with buying and selling securities, any mutual fund fees or expenses, or any taxes. It is not possible to invest directly in an index.
For Class A shares, the maximum front-end sales charge is 5.75%. For Class B shares, the maximum contingent deferred sales charge is 5.00%. For Class C shares, the maximum contingent deferred sales charge is 1.00%. Performance including a contingent deferred sales charge assumes the sales charge for the corresponding time period. Administrator Class and Institutional Class shares are sold without a front-end sales charge or contingent deferred sales charge.
Balanced funds may invest in stocks and bonds. Stock values fluctuate in response to the activities of individual companies and general market and economic conditions. Bond values fluctuate in response to the financial condition of individual issuers, general market and economic conditions, and changes in interest rates. Changes in market conditions and government policies may lead to periods of heightened volatility in the bond market and reduced liquidity for certain bonds held by the Fund. In general, when interest rates rise, bond values fall and investors may lose principal value. Interest-rate changes and their impact on the Fund and its share price can be sudden and unpredictable. Certain investment strategies tend to increase the total risk of an investment (relative to the broader market). The Fund is exposed to foreign investment risk, high-yield securities risk, and smaller-company securities risk. Consult the Fund’s prospectus for additional information on these and other risks.
Please see footnotes on page 5.
| | | | | | |
| Performance highlights (unaudited) | | Wells Fargo Diversified Capital Builder Fund | | | 5 | |
| | | | |
| Ten largest holdings (%) as of March 31, 20177 | |
Crown Castle International Corporation | | | 4.80 | |
Kinder Morgan Incorporated | | | 4.17 | |
Microsoft Corporation | | | 4.05 | |
Plains All American Pipeline LP | | | 4.03 | |
Broadcom Limited | | | 3.36 | |
Tesoro Logistics LP | | | 3.19 | |
CVS Health Corporation | | | 3.15 | |
Tronox Finance LLC, 6.38%, 8-15-2020 | | | 3.03 | |
The Williams Companies Incorporated | | | 2.83 | |
Amphenol Corporation Class A | | | 2.73 | |
|
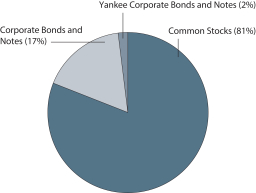
| Portfolio allocation as of March 31, 20178 |
|
|
| 1 | Historical performance shown for Administrator Class shares prior to their inception reflects the performance of Institutional Class shares and has been adjusted to reflect the higher expenses applicable to Administrator Class shares. Historical performance shown for all classes of the Fund prior to July 12, 2010, is based on the performance of the Fund’s predecessor, Evergreen Diversified Capital Builder Fund. |
| 2 | Reflects the expense ratios as stated in the most recent prospectuses. The expense ratios shown are subject to change and may differ from the annualized expense ratios shown in the financial highlights of this report. |
| 3 | The manager has contractually committed through January 31, 2018, to waive fees and/or reimburse expenses to the extent necessary to cap the Fund’s Total Annual Fund Operating Expenses After Fee Waivers at 1.20% for Class A, 1.95% for Class B, 1.95% for Class C, 1.05% for Administrator Class, and 0.78% for Institutional Class. After this time, the cap may be increased or the commitment to maintain the cap may be terminated only with the approval of the Board of Trustees. Brokerage commissions, stamp duty fees, interest, taxes, acquired fund fees and expenses, and extraordinary expenses are excluded from the expense cap. Without this cap, the Fund’s returns would have been lower. The expense ratio paid by an investor is the net expense ratio or the Fund’s Total Annual Fund Operating Expenses After Fee Waivers, as stated in the prospectuses. |
| 4 | Source: Wells Fargo Funds Management, LLC. The Diversified Capital Builder Blended Index is composed of the Russell 1000® Index (75%) and the BofA Merrill Lynch High Yield U.S. Corporates, Cash Pay Index (25%). You cannot invest directly in an index. |
| 5 | The BofA Merrill Lynch High Yield U.S. Corporates, Cash Pay Index is an unmanaged market index that provides a broad-based performance measure of the non-investment grade U.S. domestic bond index. You cannot invest directly in an index. |
| 6 | The Russell 1000® Index measures the performance of the 1,000 largest companies in the Russell 3000® Index, which represents approximately 92% of the total market capitalization of the Russell 3000® Index. You cannot invest directly in an index. |
| 7 | The ten largest holdings, excluding cash and cash equivalents, are calculated based on the value of the investments divided by total net assets of the Fund. Holdings are subject to change and may have changed since the date specified. |
| 8 | Amounts are calculated based on the total long-term investments of the Fund. These amounts are subject to change and may have changed since the date specified. |
| | | | |
| 6 | | Wells Fargo Diversified Capital Builder Fund | | Fund expenses (unaudited) |
As a shareholder of the Fund, you incur two types of costs: (1) transaction costs, including sales charges (loads) on purchase payments and contingent deferred sales charges (if any) on redemptions and (2) ongoing costs, including management fees, distribution (12b-1) and/or shareholder servicing fees, and other Fund expenses. This example is intended to help you understand your ongoing costs (in dollars) of investing in the Fund and to compare these costs with the ongoing costs of investing in other mutual funds.
The example is based on an investment of $1,000 invested at the beginning of the six-month period and held for the entire period from October 1, 2016 to March 31, 2017.
Actual expenses
The “Actual” line of the table below provides information about actual account values and actual expenses. You may use the information in this line, together with the amount you invested, to estimate the expenses that you paid over the period. Simply divide your account value by $1,000 (for example, an $8,600 account value divided by $1,000 = 8.6), then multiply the result by the number in the “Actual” line under the heading entitled “Expenses paid during period” for your applicable class of shares to estimate the expenses you paid on your account during this period.
Hypothetical example for comparison purposes
The “Hypothetical” line of the table below provides information about hypothetical account values and hypothetical expenses based on the Fund’s actual expense ratio and an assumed rate of return of 5% per year before expenses, which is not the Fund’s actual return. The hypothetical account values and expenses may not be used to estimate the actual ending account balance or expenses you paid for the period. You may use this information to compare the ongoing costs of investing in the Fund and other funds. To do so, compare this 5% hypothetical example with the 5% hypothetical examples that appear in the shareholder reports of the other funds.
Please note that the expenses shown in the table are meant to highlight your ongoing costs only and do not reflect any transactional costs, such as sales charges (loads) and contingent deferred sales charges. Therefore, the “Hypothetical” line of the table is useful in comparing ongoing costs only and will not help you determine the relative total costs of owning different funds. In addition, if these transactional costs were included, your costs would have been higher.
| | | | | | | | | | | | | | | | |
| | | Beginning
account value
10-1-2016 | | | Ending
account value
3-31-2017 | | | Expenses
paid during
the period¹ | | | Annualized net
expense ratio | |
Class A | | | | | | | | | | | | | | | | |
Actual | | $ | 1,000.00 | | | $ | 1,079.34 | | | $ | 5.81 | | | | 1.12 | % |
Hypothetical (5% return before expenses) | | $ | 1,000.00 | | | $ | 1,019.35 | | | $ | 5.64 | | | | 1.12 | % |
Class B | | | | | | | | | | | | | | | | |
Actual | | $ | 1,000.00 | | | $ | 1,074.40 | | | $ | 9.67 | | | | 1.87 | % |
Hypothetical (5% return before expenses) | | $ | 1,000.00 | | | $ | 1,015.61 | | | $ | 9.40 | | | | 1.87 | % |
Class C | | | | | | | | | | | | | | | | |
Actual | | $ | 1,000.00 | | | $ | 1,074.89 | | | $ | 9.67 | | | | 1.87 | % |
Hypothetical (5% return before expenses) | | $ | 1,000.00 | | | $ | 1,015.61 | | | $ | 9.40 | | | | 1.87 | % |
Administrator Class | | | | | | | | | | | | | | | | |
Actual | | $ | 1,000.00 | | | $ | 1,078.44 | | | $ | 5.39 | | | | 1.04 | % |
Hypothetical (5% return before expenses) | | $ | 1,000.00 | | | $ | 1,019.75 | | | $ | 5.24 | | | | 1.04 | % |
Institutional Class | | | | | | | | | | | | | | | | |
Actual | | $ | 1,000.00 | | | $ | 1,080.50 | | | $ | 4.05 | | | | 0.78 | % |
Hypothetical (5% return before expenses) | | $ | 1,000.00 | | | $ | 1,021.04 | | | $ | 3.93 | | | | 0.78 | % |
| 1 | Expenses paid is equal to the annualized net expense ratio of each class multiplied by the average account value over the period, multiplied by the number of days in the most recent fiscal half-year divided by the number of days in the fiscal year (to reflect the one-half-year period). |
| | | | | | |
| Portfolio of investments—March 31, 2017 (unaudited) | | Wells Fargo Diversified Capital Builder Fund | | | 7 | |
| | | | | | | | | | | | | | | | |
| Security name | | | | | | | | Shares | | | Value | |
| | | | |
Common Stocks: 80.19% | | | | | | | | | | | | | | | | |
| | | | |
Consumer Discretionary: 2.66% | | | | | | | | | | | | | | | | |
| | | | |
| Auto Components: 1.13% | | | | | | | | | | | | | | | | |
Gentex Corporation | | | | | | | | | | | 450,000 | | | $ | 9,598,500 | |
| | | | | | | | | | | | | | | | |
| | | | |
| Household Durables: 1.53% | | | | | | | | | | | | | | | | |
Leggett & Platt Incorporated | | | | | | | | | | | 210,000 | | | | 10,567,200 | |
Newell Rubbermaid Incorporated | | | | | | | | | | | 50,000 | | | | 2,358,500 | |
| | | | |
| | | | | | | | | | | | | | | 12,925,700 | |
| | | | | | | | | | | | | | | | |
| | | | |
Consumer Staples: 10.11% | | | | | | | | | | | | | | | | |
| | | | |
| Food & Staples Retailing: 4.13% | | | | | | | | | | | | | | | | |
CVS Health Corporation | | | | | | | | | | | 340,000 | | | | 26,690,000 | |
Sysco Corporation | | | | | | | | | | | 160,000 | | | | 8,307,200 | |
| | | | |
| | | | | | | | | | | | | | | 34,997,200 | |
| | | | | | | | | | | | | | | | |
| | | | |
| Food Products: 4.68% | | | | | | | | | | | | | | | | |
ConAgra Foods Incorporated | | | | | | | | | | | 460,000 | | | | 18,556,400 | |
Lamb Weston Holdings Incorporated | | | | | | | | | | | 500,001 | | | | 21,030,042 | |
| | | | |
| | | | | | | | | | | | | | | 39,586,442 | |
| | | | | | | | | | | | | | | | |
| | | | |
| Personal Products: 1.30% | | | | | | | | | | | | | | | | |
The Estee Lauder Companies Incorporated Class A | | | | | | | | | | | 130,000 | | | | 11,022,700 | |
| | | | | | | | | | | | | | | | |
| | | | |
Energy: 15.42% | | | | | | | | | | | | | | | | |
| | | | |
| Oil, Gas & Consumable Fuels: 15.42% | | | | | | | | | | | | | | | | |
Cabot Oil & Gas Corporation | | | | | | | | | | | 25,000 | | | | 597,750 | |
EOG Resources Incorporated | | | | | | | | | | | 35,000 | | | | 3,414,250 | |
EQT Corporation | | | | | | | | | | | 100,000 | | | | 6,110,000 | |
Kinder Morgan Incorporated | | | | | | | | | | | 1,625,000 | | | | 35,327,500 | |
Plains All American Pipeline LP | | | | | | | | | | | 1,080,000 | | | | 34,138,800 | |
Tesoro Logistics LP | | | | | | | | | | | 495,000 | | | | 26,962,650 | |
The Williams Companies Incorporated | | | | | | | | | | | 810,000 | | | | 23,967,900 | |
| | | | |
| | | | | | | | | | | | | | | 130,518,850 | |
| | | | | | | | | | | | | | | | |
| | | | |
Health Care: 3.06% | | | | | | | | | | | | | | | | |
| | | | |
| Biotechnology: 0.20% | | | | | | | | | | | | | | | | |
Shire plc ADR | | | | | | | | | | | 10,000 | | | | 1,742,300 | |
| | | | | | | | | | | | | | | | |
| | | | |
| Health Care Equipment & Supplies: 1.44% | | | | | | | | | | | | | | | | |
Becton Dickinson & Company | | | | | | | | | | | 10,000 | | | | 1,834,400 | |
C.R. Bard Incorporated | | | | | | | | | | | 5,000 | | | | 1,242,700 | |
Teleflex Incorporated | | | | | | | | | | | 43,000 | | | | 8,330,390 | |
West Pharmaceutical Services Incorporated | | | | | | | | | | | 10,000 | | | | 816,100 | |
| | | | |
| | | | | | | | | | | | | | | 12,223,590 | |
| | | | | | | | | | | | | | | | |
The accompanying notes are an integral part of these financial statements.
| | | | |
| 8 | | Wells Fargo Diversified Capital Builder Fund | | Portfolio of investments—March 31, 2017 (unaudited) |
| | | | | | | | | | | | | | | | |
| Security name | | | | | | | | Shares | | | Value | |
| | | | |
| Life Sciences Tools & Services: 0.37% | | | | | | | | | | | | | | | | |
Thermo Fisher Scientific Incorporated | | | | | | | | | | | 10,000 | | | $ | 1,536,000 | |
Waters Corporation † | | | | | | | | | | | 10,000 | | | | 1,563,100 | |
| | | | |
| | | | | | | | | | | | | | | 3,099,100 | |
| | | | | | | | | | | | | | | | |
| | | | |
| Pharmaceuticals: 1.05% | | | | | | | | | | | | | | | | |
Eli Lilly & Company | | | | | | | | | | | 100,000 | | | | 8,411,000 | |
Mallinckrodt plc † | | | | | | | | | | | 10,000 | | | | 445,700 | |
| | | | |
| | | | | | | | | | | | | | | 8,856,700 | |
| | | | | | | | | | | | | | | | |
| | | | |
Industrials: 9.95% | | | | | | | | | | | | | | | | |
| | | | |
| Aerospace & Defense: 6.31% | | | | | | | | | | | | | | | | |
Curtiss-Wright Corporation | | | | | | | | | | | 130,000 | | | | 11,863,800 | |
Huntington Ingalls Industries Incorporated | | | | | | | | | | | 65,000 | | | | 13,015,600 | |
Lockheed Martin Corporation | | | | | | | | | | | 29,000 | | | | 7,760,400 | |
Raytheon Company | | | | | | | | | | | 100,000 | | | | 15,250,000 | |
TransDigm Group Incorporated « | | | | | | | | | | | 25,000 | | | | 5,504,000 | |
| | | | |
| | | | | | | | | | | | | | | 53,393,800 | |
| | | | | | | | | | | | | | | | |
| | | | |
| Building Products: 0.41% | | | | | | | | | | | | | | | | |
Apogee Enterprises Incorporated | | | | | | | | | | | 30,000 | | | | 1,788,300 | |
Lennox International Incorporated | | | | | | | | | | | 10,000 | | | | 1,673,000 | |
| | | | |
| | | | | | | | | | | | | | | 3,461,300 | |
| | | | | | | | | | | | | | | | |
| | | | |
| Electrical Equipment: 0.28% | | | | | | | | | | | | | | | | |
AMETEK Incorporated | | | | | | | | | | | 45,000 | | | | 2,433,600 | |
| | | | | | | | | | | | | | | | |
| | | | |
| Machinery: 2.66% | | | | | | | | | | | | | | | | |
IDEX Corporation | | | | | | | | | | | 95,000 | | | | 8,883,450 | |
John Bean Technologies Corporation | | | | | | | | | | | 155,000 | | | | 13,632,250 | |
| | | | |
| | | | | | | | | | | | | | | 22,515,700 | |
| | | | | | | | | | | | | | | | |
| | | | |
| Trading Companies & Distributors: 0.29% | | | | | | | | | | | | | | | | |
HD Supply Holdings Incorporated † | | | | | | | | | | | 60,000 | | | | 2,467,500 | |
| | | | | | | | | | | | | | | | |
| | | | |
Information Technology: 24.98% | | | | | | | | | | | | | | | | |
| | | | |
| Communications Equipment: 0.34% | | | | | | | | | | | | | | | | |
CommScope Holdings Incorporated † | | | | | | | | | | | 70,000 | | | | 2,919,700 | |
| | | | | | | | | | | | | | | | |
| | | | |
| Electronic Equipment, Instruments & Components: 2.86% | | | | | | | | | | | | | | | | |
Amphenol Corporation Class A | | | | | | | | | | | 325,000 | | | | 23,130,250 | |
Belden Incorporated | | | | | | | | | | | 15,000 | | | | 1,037,850 | |
| | | | |
| | | | | | | | | | | | | | | 24,168,100 | |
| | | | | | | | | | | | | | | | |
| | | | |
| Internet Software & Services: 0.99% | | | | | | | | | | | | | | | | |
Akamai Technologies Incorporated † | | | | | | | | | | | 140,000 | | | | 8,358,000 | |
| | | | | | | | | | | | | | | | |
The accompanying notes are an integral part of these financial statements.
| | | | | | |
| Portfolio of investments—March 31, 2017 (unaudited) | | Wells Fargo Diversified Capital Builder Fund | | | 9 | |
| | | | | | | | | | | | | | | | |
| Security name | | | | | | | | Shares | | | Value | |
| | | | |
| IT Services: 3.68% | | | | | | | | | | | | | | | | |
Computer Sciences Corporation | | | | | | | | | | | 140,000 | | | $ | 9,661,400 | |
Leidos Holdings Incorporated | | | | | | | | | | | 420,000 | | | | 21,478,800 | |
| | | | |
| | | | | | | | | | | | | | | 31,140,200 | |
| | | | | | | | | | | | | | | | |
| | | | |
| Semiconductors & Semiconductor Equipment: 9.59% | | | | | | | | | | | | | | | | |
Broadcom Limited | | | | | | | | | | | 130,000 | | | | 28,464,800 | |
Intel Corporation | | | | | | | | | | | 100,000 | | | | 3,607,000 | |
Microsemi Corporation † | | | | | | | | | | | 290,000 | | | | 14,943,700 | |
QUALCOMM Incorporated | | | | | | | | | | | 85,000 | | | | 4,873,900 | |
Texas Instruments Incorporated | | | | | | | | | | | 105,000 | | | | 8,458,800 | |
Versum Materials Incorporated | | | | | | | | | | | 170,000 | | | | 5,202,000 | |
Xilinx Incorporated | | | | | | | | | | | 270,000 | | | | 15,630,300 | |
| | | | |
| | | | | | | | | | | | | | | 81,180,500 | |
| | | | | | | | | | | | | | | | |
| | | | |
| Software: 6.12% | | | | | | | | | | | | | | | | |
Adobe Systems Incorporated † | | | | | | | | | | | 135,000 | | | | 17,567,550 | |
Microsoft Corporation | | | | | | | | | | | 520,000 | | | | 34,247,200 | |
| | | | |
| | | | | | | | | | | | | | | 51,814,750 | |
| | | | | | | | | | | | | | | | |
| | | | |
| Technology Hardware, Storage & Peripherals: 1.40% | | | | | | | | | | | | | | | | |
Diebold Incorporated | | | | | | | | | | | 10,000 | | | | 307,000 | |
Western Digital Corporation | | | | | | | | | | | 140,000 | | | | 11,554,200 | |
| | | | |
| | | | | | | | | | | | | | | 11,861,200 | |
| | | | | | | | | | | | | | | | |
| | | | |
Materials: 3.83% | | | | | | | | | | | | | | | | |
| | | | |
| Chemicals: 1.10% | | | | | | | | | | | | | | | | |
Celanese Corporation Series A | | | | | | | | | | | 90,000 | | | | 8,086,500 | |
Kooper Holdings Incorporated † | | | | | | | | | | | 10,000 | | | | 423,500 | |
Olin Corporation | | | | | | | | | | | 25,000 | | | | 821,750 | |
| | | | |
| | | | | | | | | | | | | | | 9,331,750 | |
| | | | | | | | | | | | | | | | |
| | | | |
| Containers & Packaging: 2.73% | | | | | | | | | | | | | | | | |
Sealed Air Corporation | | | | | | | | | | | 530,000 | | | | 23,097,400 | |
| | | | | | | | | | | | | | | | |
| | | | |
Real Estate: 8.31% | | | | | | | | | | | | | | | | |
| | | | |
| Equity REITs: 8.31% | | | | | | | | | | | | | | | | |
Crown Castle International Corporation | | | | | | | | | | | 430,000 | | | | 40,613,500 | |
Equinix Incorporated | | | | | | | | | | | 55,000 | | | | 22,020,350 | |
Saul Centers Incorporated | | | | | | | | | | | 125,000 | | | | 7,702,500 | |
| | | | |
| | | | | | | | | | | | | | | 70,336,350 | |
| | | | | | | | | | | | | | | | |
| | | | |
Utilities: 1.87% | | | | | | | | | | | | | | | | |
| | | | |
| Gas Utilities: 1.87% | | | | | | | | | | | | | | | | |
Atmos Energy Corporation | | | | | | | | | | | 200,000 | | | | 15,798,000 | |
| | | | | | | | | | | | | | | | |
| | | | |
Total Common Stocks (Cost $586,349,643) | | | | | | | | | | | | | | | 678,848,932 | |
| | | | | | | | | | | | | | | | |
The accompanying notes are an integral part of these financial statements.
| | | | |
| 10 | | Wells Fargo Diversified Capital Builder Fund | | Portfolio of investments—March 31, 2017 (unaudited) |
| | | | | | | | | | | | | | | | |
| Security name | | Interest rate | | | Maturity date | | | Principal | | | Value | |
| | | | |
Corporate Bonds and Notes: 16.71% | | | | | | | | | | | | | | | | |
| | | | |
Consumer Discretionary: 0.97% | | | | | | | | | | | | | | | | |
| | | | |
| Auto Components: 0.06% | | | | | | | | | | | | | | | | |
Dana Holding Corporation | | | 5.50 | % | | | 12-15-2024 | | | $ | 500,000 | | | $ | 506,250 | |
| | | | | | | | | | | | | | | | |
| | | | |
| Hotels, Restaurants & Leisure: 0.24% | | | | | | | | | | | | | | | | |
Speedway Motorsports Incorporated | | | 5.13 | | | | 2-1-2023 | | | | 2,000,000 | | | | 2,020,000 | |
| | | | | | | | | | | | | | | | |
| | | | |
| Media: 0.34% | | | | | | | | | | | | | | | | |
McGraw-Hill Global Education Holdings LLC «144A | | | 7.88 | | | | 5-15-2024 | | | | 3,000,000 | | | | 2,902,500 | |
| | | | | | | | | | | | | | | | |
| | | | |
| Specialty Retail: 0.33% | | | | | | | | | | | | | | | | |
Group 1 Automotive Incorporated | | | 5.00 | | | | 6-1-2022 | | | | 500,000 | | | | 503,750 | |
Penske Auto Group Incorporated | | | 5.75 | | | | 10-1-2022 | | | | 2,200,000 | | | | 2,277,000 | |
| | | | |
| | | | | | | | | | | | | | | 2,780,750 | |
| | | | | | | | | | | | | | | | |
| | | | |
Consumer Staples: 0.12% | | | | | | | | | | | | | | | | |
| | | | |
| Food Products: 0.12% | | | | | | | | | | | | | | | | |
Lamb Weston Holdings Incorporated 144A | | | 4.63 | | | | 11-1-2024 | | | | 1,000,000 | | | | 1,020,000 | |
| | | | | | | | | | | | | | | | |
| | | | |
Energy: 0.80% | | | | | | | | | | | | | | | | |
| | | | |
| Oil, Gas & Consumable Fuels: 0.80% | | | | | | | | | | | | | | | | |
Plains All American Pipeline LP | | | 4.65 | | | | 10-15-2025 | | | | 6,000,000 | | | | 6,180,012 | |
Tennessee Gas Pipeline Company | | | 7.00 | | | | 3-15-2027 | | | | 534,000 | | | | 633,121 | |
| | | | |
| | | | | | | | | | | | | | | 6,813,133 | |
| | | | | | | | | | | | | | | | |
| | | | |
Health Care: 1.87% | | | | | | | | | | | | | | | | |
| | | | |
| Health Care Equipment & Supplies: 0.30% | | | | | | | | | | | | | | | | |
Teleflex Incorporated | | | 4.88 | | | | 6-1-2026 | | | | 2,500,000 | | | | 2,512,500 | |
| | | | | | | | | | | | | | | | |
| | | | |
| Health Care Providers & Services: 1.38% | | | | | | | | | | | | | | | | |
AMN Healthcare Incorporated 144A | | | 5.13 | | | | 10-1-2024 | | | | 7,512,000 | | | | 7,587,120 | |
DaVita HealthCare Partners Incorporated | | | 5.13 | | | | 7-15-2024 | | | | 1,000,000 | | | | 1,010,000 | |
HCA Incorporated | | | 5.25 | | | | 6-15-2026 | | | | 2,000,000 | | | | 2,095,200 | |
HealthSouth Corporation | | | 5.13 | | | | 3-15-2023 | | | | 1,000,000 | | | | 1,000,000 | |
| | | | |
| | | | | | | | | | | | | | | 11,692,320 | |
| | | | | | | | | | | | | | | | |
| | | | |
| Health Care Technology: 0.19% | | | | | | | | | | | | | | | | |
QuintilesIMS Holdings Incorporated 144A | | | 4.88 | | | | 5-15-2023 | | | | 1,600,000 | | | | 1,622,000 | |
| | | | | | | | | | | | | | | | |
| | | | |
Industrials: 3.04% | | | | | | | | | | | | | | | | |
| | | | |
| Aerospace & Defense: 1.63% | | | | | | | | | | | | | | | | |
Huntington Ingalls Industries Incorporated 144A | | | 5.00 | | | | 11-15-2025 | | | | 6,926,000 | | | | 7,237,670 | |
Moog Incorporated 144A | | | 5.25 | | | | 12-1-2022 | | | | 1,500,000 | | | | 1,537,500 | |
TransDigm Group Incorporated | | | 6.38 | | | | 6-15-2026 | | | | 3,500,000 | | | | 3,502,065 | |
TransDigm Group Incorporated | | | 6.50 | | | | 5-15-2025 | | | | 1,500,000 | | | | 1,513,125 | |
| | | | |
| | | | | | | | | | | | | | | 13,790,360 | |
| | | | | | | | | | | | | | | | |
The accompanying notes are an integral part of these financial statements.
| | | | | | |
| Portfolio of investments—March 31, 2017 (unaudited) | | Wells Fargo Diversified Capital Builder Fund | | | 11 | |
| | | | | | | | | | | | | | | | |
| Security name | | Interest rate | | | Maturity date | | | Principal | | | Value | |
| | | | |
| Commercial Services & Supplies: 0.18% | | | | | | | | | | | | | | | | |
ACCO Brands Corporation 144A | | | 5.25 | % | | | 12-15-2024 | | | $ | 1,500,000 | | | $ | 1,507,500 | |
| | | | | | | | | | | | | | | | |
| | | | |
| Machinery: 0.36% | | | | | | | | | | | | | | | | |
Oshkosh Corporation | | | 5.38 | | | | 3-1-2025 | | | | 2,000,000 | | | | 2,065,000 | |
SPX FLOW Incorporated 144A | | | 5.88 | | | | 8-15-2026 | | | | 1,000,000 | | | | 1,008,750 | |
| | | | |
| | | | | | | | | | | | | | | 3,073,750 | |
| | | | | | | | | | | | | | | | |
| | | | |
| Trading Companies & Distributors: 0.87% | | | | | | | | | | | | | | | | |
HD Supply Incorporated 144A | | | 5.75 | | | | 4-15-2024 | | | | 5,015,000 | | | | 5,274,777 | |
Wesco Distribution Incorporated | | | 5.38 | | | | 6-15-2024 | | | | 2,000,000 | | | | 2,050,000 | |
| | | | |
| | | | | | | | | | | | | | | 7,324,777 | |
| | | | | | | | | | | | | | | | |
| | | | |
Information Technology: 2.57% | | | | | | | | | | | | | | | | |
| | | | |
| Communications Equipment: 0.73% | | | | | | | | | | | | | | | | |
CommScope Incorporated 144A | | | 5.50 | | | | 6-15-2024 | | | | 6,000,000 | | | | 6,204,420 | |
| | | | | | | | | | | | | | | | |
| | | | |
| Electronic Equipment, Instruments & Components: 0.48% | | | | | | | | | | | | | | | | |
Belden Incorporated 144A | | | 5.25 | | | | 7-15-2024 | | | | 3,000,000 | | | | 2,992,500 | |
Belden Incorporated 144A | | | 5.50 | | | | 9-1-2022 | | | | 1,000,000 | | | | 1,020,000 | |
| | | | |
| | | | | | | | | | | | | | | 4,012,500 | |
| | | | | | | | | | | | | | | | |
| | | | |
| Semiconductors & Semiconductor Equipment: 0.38% | | | | | | | | | | | | | | | | |
Micron Technology Incorporated 144A | | | 5.25 | | | | 8-1-2023 | | | | 1,500,000 | | | | 1,537,500 | |
Microsemi Corporation 144A | | | 9.13 | | | | 4-15-2023 | | | | 1,000,000 | | | | 1,148,750 | |
Versum Materials Incorporated 144A | | | 5.50 | | | | 9-30-2024 | | | | 500,000 | | | | 516,875 | |
| | | | |
| | | | | | | | | | | | | | | 3,203,125 | |
| | | | | | | | | | | | | | | | |
| | | | |
| Software: 0.85% | | | | | | | | | | | | | | | | |
Nuance Communications Company 144A | | | 6.00 | | | | 7-1-2024 | | | | 2,000,000 | | | | 2,070,000 | |
Symantec Corporation 144A | | | 5.00 | | | | 4-15-2025 | | | | 5,000,000 | | | | 5,116,640 | |
| | | | |
| | | | | | | | | | | | | | | 7,186,640 | |
| | | | | | | | | | | | | | | | |
| | | | |
| Technology Hardware, Storage & Peripherals: 0.13% | | | | | | | | | | | | | | | | |
Diebold Incorporated | | | 8.50 | | | | 4-15-2024 | | | | 1,000,000 | | | | 1,105,000 | |
| | | | | | | | | | | | | | | | |
| | | | |
Materials: 6.92% | | | | | | | | | | | | | | | | |
| | | | |
| Chemicals: 6.54% | | | | | | | | | | | | | | | | |
A Schulman Incorporated | | | 6.88 | | | | 6-1-2023 | | | | 6,375,000 | | | | 6,614,063 | |
Koppers Incorporated 144A | | | 6.00 | | | | 2-15-2025 | | | | 8,190,000 | | | | 8,456,175 | |
Olin Corporation | | | 5.50 | | | | 8-15-2022 | | | | 6,000,000 | | | | 6,240,000 | |
Rayonier Advanced Materials Products Incorporated 144A | | | 5.50 | | | | 6-1-2024 | | | | 6,835,000 | | | | 6,151,500 | |
Scotts Miracle-Gro Company | | | 6.00 | | | | 10-15-2023 | | | | 2,100,000 | | | | 2,231,250 | |
Tronox Finance LLC | | | 6.38 | | | | 8-15-2020 | | | | 25,588,000 | | | | 25,683,955 | |
| | | | |
| | | | | | | | | | | | | | | 55,376,943 | |
| | | | | | | | | | | | | | | | |
| | | | |
| Containers & Packaging: 0.38% | | | | | | | | | | | | | | | | |
Berry Plastics Corporation | | | 5.13 | | | | 7-15-2023 | | | | 3,120,000 | | | | 3,198,000 | |
| | | | | | | | | | | | | | | | |
The accompanying notes are an integral part of these financial statements.
| | | | |
| 12 | | Wells Fargo Diversified Capital Builder Fund | | Portfolio of investments—March 31, 2017 (unaudited) |
| | | | | | | | | | | | | | | | |
| Security name | | Interest rate | | | Maturity date | | | Principal | | | Value | |
| | | | |
Real Estate: 0.42% | | | | | | | | | | | | | | | | |
| | | | |
| Equity REITs: 0.42% | | | | | | | | | | | | | | | | |
Equinix Incorporated | | | 5.75 | % | | | 1-1-2025 | | | $ | 1,000,000 | | | $ | 1,057,500 | |
Iron Mountain Incorporated 144A | | | 5.38 | | | | 6-1-2026 | | | | 2,000,000 | | | | 1,995,000 | |
Iron Mountain Incorporated | | | 5.75 | | | | 8-15-2024 | | | | 500,000 | | | | 510,000 | |
| | | | |
| | | | | | | | | | | | | | | 3,562,500 | |
| | | | | | | | | | | | | | | | |
| | | | |
Total Corporate Bonds and Notes (Cost $139,663,127) | | | | | | | | | | | | | | | 141,414,968 | |
| | | | | | | | | | | | | | | | |
| | | | |
Yankee Corporate Bonds and Notes: 2.40% | | | | | | | | | | | | | | | | |
| | | | |
Health Care: 0.33% | | | | | | | | | | | | | | | | |
| | | | |
| Pharmaceuticals: 0.33% | | | | | | | | | | | | | | | | |
Mallinckrodt plc 144A« | | | 5.50 | | | | 4-15-2025 | | | | 3,000,000 | | | | 2,760,000 | |
| | | | | | | | | | | | | | | | |
| | | | |
Industrials: 0.24% | | | | | | | | | | | | | | | | |
| | | | |
| Electrical Equipment: 0.24% | | | | | | | | | | | | | | | | |
Sensata Technologies BV 144A | | | 4.88 | | | | 10-15-2023 | | | | 2,000,000 | | | | 2,003,740 | |
| | | | | | | | | | | | | | | | |
| | | | |
Information Technology: 1.83% | | | | | | | | | | | | | | | | |
| | | | |
| Technology Hardware, Storage & Peripherals: 1.83% | | | | | | | | | | | | | | | | |
Seagate HDD | | | 4.75 | | | | 6-1-2023 | | | | 9,500,000 | | | | 9,547,500 | |
Seagate HDD | | | 4.88 | | | | 6-1-2027 | | | | 6,396,000 | | | | 5,987,238 | |
| | | | |
| | | | | | | | | | | | | | | 15,534,738 | |
| | | | | | | | | | | | | | | | |
| | | | |
Total Yankee Corporate Bonds and Notes (Cost $19,285,082) | | | | | | | | | | | | | | | 20,298,478 | |
| | | | | | | | | | | | | | | | |
| | | | |
| | | Yield | | | | | | Shares | | | | |
| Short-Term Investments: 1.10% | | | | | | | | | | | | | | | | |
| | | | |
| Investment Companies: 1.10% | | | | | | | | | | | | | | | | |
Securities Lending Cash Investment LLC (l)(r)(u) | | | 0.98 | | | | | | | | 6,198,788 | | | | 6,199,407 | |
Wells Fargo Government Money Market Fund Select Class (l)(u) | | | 0.63 | | | | | | | | 3,096,035 | | | | 3,096,035 | |
| | | | |
Total Short-Term Investments (Cost $9,295,422) | | | | | | | | | | | | | | | 9,295,442 | |
| | | | | | | | | | | | | | | | |
| | | | | | | | |
| Total investments in securities (Cost $754,593,274) * | | | 100.40 | % | | | 849,857,820 | |
Other assets and liabilities, net | | | (0.40 | ) | | | (3,353,097 | ) |
| | | | | | | | |
| Total net assets | | | 100.00 | % | | $ | 846,504,723 | |
| | | | | | | | |
| † | Non-income-earning security |
| « | All or a portion of this security is on loan. |
| 144A | The security may be resold in transactions exempt from registration, normally to qualified institutional buyers, pursuant to Rule 144A under the Securities Act of 1933. |
| (l) | The issuer of the security is an affiliated person of the Fund as defined in the Investment Company Act of 1940. |
| (r) | The investment is a non-registered investment vehicle purchased with cash collateral received from securities on loan. |
| (u) | The rate represents the 7-day annualized yield at period end. |
| * | Cost for federal income tax purposes is $753,932,497 and unrealized gains (losses) consists of: |
| | | | |
Gross unrealized gains | | $ | 106,114,583 | |
Gross unrealized losses | | | (10,189,260 | ) |
| | | | |
Net unrealized gains | | $ | 95,925,323 | |
The accompanying notes are an integral part of these financial statements.
| | | | | | |
| Statement of assets and liabilities—March 31, 2017 (unaudited) | | Wells Fargo Diversified Capital Builder Fund | | | 13 | |
| | | | |
| | | | |
| |
Assets | | | | |
Investments | | | | |
In unaffiliated securities (including $6,074,073 of securities loaned), at value (cost $745,297,852) | | $ | 840,562,378 | |
In affiliated securities, at value (cost $9,295,422) | | | 9,295,442 | |
| | | | |
Total investments, at value (cost $754,593,274) | | | 849,857,820 | |
Receivable for Fund shares sold | | | 3,936,285 | |
Receivable for dividends and interest | | | 2,818,253 | |
Receivable for securities lending income | | | 2,092 | |
Prepaid expenses and other assets | | | 166,337 | |
| | | | |
Total assets | | | 856,780,787 | |
| | | | |
| |
Liabilities | | | | |
Payable for investments purchased | | | 2,222,409 | |
Payable for Fund shares redeemed | | | 875,981 | |
Payable upon receipt of securities loaned | | | 6,197,209 | |
Management fee payable | | | 475,090 | |
Distribution fees payable | | | 64,024 | |
Administration fees payable | | | 143,711 | |
Accrued expenses and other liabilities | | | 297,640 | |
| | | | |
Total liabilities | | | 10,276,064 | |
| | | | |
Total net assets | | $ | 846,504,723 | |
| | | | |
| |
NET ASSETS CONSIST OF | | | | |
Paid-in capital | | $ | 723,437,354 | |
Undistributed net investment income | | | 377,678 | |
Accumulated net realized gains on investments | | | 27,425,145 | |
Net unrealized gains on investments | | | 95,264,546 | |
| | | | |
Total net assets | | $ | 846,504,723 | |
| | | | |
| |
COMPUTATION OF NET ASSET VALUE AND OFFERING PRICE PER SHARE | | | | |
Net assets – Class A | | $ | 534,211,248 | |
Shares outstanding – Class A1 | | | 54,369,509 | |
Net asset value per share – Class A | | | $9.83 | |
Maximum offering price per share – Class A2 | | | $10.43 | |
Net assets – Class B | | $ | 719,730 | |
Shares outstanding – Class B1 | | | 72,341 | |
Net asset value per share – Class B | | | $9.95 | |
Net assets – Class C | | $ | 96,823,189 | |
Shares outstanding – Class C1 | | | 9,856,400 | |
Net asset value per share – Class C | | | $9.82 | |
Net assets – Administrator Class | | $ | 20,476,395 | |
Shares outstanding – Administrator Class1 | | | 2,082,261 | |
Net asset value per share – Administrator Class | | | $9.83 | |
Net assets – Institutional Class | | $ | 194,274,161 | |
Shares outstanding – Institutional Class1 | | | 19,896,503 | |
Net asset value per share – Institutional Class | | | $9.76 | |
| 1 | The Fund has an unlimited number of authorized shares. |
| 2 | Maximum offering price is computed as 100/94.25 of net asset value. On investments of $50,000 or more, the offering price is reduced. |
The accompanying notes are an integral part of these financial statements.
| | | | |
| 14 | | Wells Fargo Diversified Capital Builder Fund | | Statement of operations—six months ended March 31, 2017 (unaudited) |
| | | | |
| | | | |
| |
Investment income | | | | |
Dividends | | $ | 7,382,359 | |
Interest | | | 4,764,568 | |
Securities lending income, net | | | 23,422 | |
Income from affiliated securities | | | 16,806 | |
| | | | |
Total investment income | | | 12,187,155 | |
| | | | |
| |
Expenses | | | | |
Management fee | | | 2,369,375 | |
Administration fees | | | | |
Class A | | | 521,602 | |
Class B | | | 1,117 | |
Class C | | | 82,844 | |
Administrator Class | | | 13,256 | |
Institutional Class | | | 98,227 | |
Shareholder servicing fees | | | | |
Class A | | | 620,955 | |
Class B | | | 1,330 | |
Class C | | | 98,624 | |
Administrator Class | | | 25,492 | |
Distribution fees | | | | |
Class B | | | 3,989 | |
Class C | | | 295,871 | |
Custody and accounting fees | | | 22,693 | |
Professional fees | | | 22,992 | |
Registration fees | | | 32,230 | |
Shareholder report expenses | | | 21,767 | |
Trustees’ fees and expenses | | | 10,059 | |
Other fees and expenses | | | 2,599 | |
| | | | |
Total expenses | | | 4,245,022 | |
Less: Fee waivers and/or expense reimbursements | | | (10,600 | ) |
| | | | |
Net expenses | | | 4,234,422 | |
| | | | |
Net investment income | | | 7,952,733 | |
| | | | |
| |
REALIZED AND UNREALIZED GAINS (LOSSES) ON INVESTMENTS | | | | |
| |
Net realized gains on: | | | | |
Unaffiliated securities | | | 26,764,087 | |
Affiliated securities | | | 690 | |
| | | | |
Net realized gains on investments | | | 26,764,777 | |
| | | | |
| |
Net change in unrealized gains (losses) on: | | | | |
Unaffiliated securities | | | 22,761,609 | |
Affiliated securities | | | 20 | |
| | | | |
Net change in unrealized gains (losses) on investments | | | 22,761,629 | |
| | | | |
Net realized and unrealized gains (losses) on investments | | | 49,526,406 | |
| | | | |
Net increase in net assets resulting from operations | | $ | 57,479,139 | |
| | | | |
The accompanying notes are an integral part of these financial statements.
| | | | | | |
| Statement of changes in net assets | | Wells Fargo Diversified Capital Builder Fund | | | 15 | |
| | | | | | | | | | | | | | | | |
| | | Six months ended
March 31, 2017 (unaudited) | | | Year ended
September 30, 2016 | |
| | | | |
Operations | | | | | | | | | | | | | | | | |
Net investment income | | | | | | $ | 7,952,733 | | | | | | | $ | 10,579,137 | |
Net realized gains on investments | | | | | | | 26,764,777 | | | | | | | | 56,562,113 | |
Net change in unrealized gains (losses) on investments | | | | | | | 22,761,629 | | | | | | | | 57,125,458 | |
| | | | |
Net increase in net assets resulting from operations | | | | | | | 57,479,139 | | | | | | | | 124,266,708 | |
| | | | |
| | | | |
Distributions to shareholders from | | | | | | | | | | | | | | | | |
Net investment income | | | | | | | | | | | | | | | | |
Class A | | | | | | | (5,159,782 | ) | | | | | | | (7,154,781 | ) |
Class B | | | | | | | (3,723 | ) | | | | | | | (13,202 | ) |
Class C | | | | | | | (610,736 | ) | | | | | | | (576,356 | ) |
Administrator Class | | | | | | | (196,529 | ) | | | | | | | (281,790 | ) |
Institutional Class | | | | | | | (2,027,261 | ) | | | | | | | (2,192,889 | ) |
Net realized gains | | | | | | | | | | | | | | | | |
Class A | | | | | | | (37,599,085 | ) | | | | | | | (38,200,806 | ) |
Class B | | | | | | | (82,941 | ) | | | | | | | (258,301 | ) |
Class C | | | | | | | (5,700,242 | ) | | | | | | | (5,148,475 | ) |
Administrator Class | | | | | | | (1,444,857 | ) | | | | | | | (504,792 | ) |
Institutional Class | | | | | | | (11,035,158 | ) | | | | | | | (9,439,938 | ) |
| | | | |
Total distributions to shareholders | | | | | | | (63,860,314 | ) | | | | | | | (63,771,330 | ) |
| | | | |
| | | | |
Capital share transactions | | | Shares | | | | | | | | Shares | | | | | |
Proceeds from shares sold | | | | | | | | | | | | | | | | |
Class A | | | 7,502,464 | | | | 73,243,579 | | | | 3,675,778 | | | | 34,640,601 | |
Class B | | | 8,989 | | | | 89,544 | | | | 6,490 | | | | 57,479 | |
Class C | | | 3,493,942 | | | | 34,050,361 | | | | 1,407,777 | | | | 13,010,103 | |
Administrator Class | | | 736,413 | | | | 7,168,210 | | | | 1,842,765 | | | | 16,600,389 | |
Institutional Class | | | 7,595,203 | | | | 73,895,717 | | | | 2,616,107 | | | | 24,432,480 | |
| | | | |
| | | | | | | 188,447,411 | | | | | | | | 88,741,052 | |
| | | | |
Reinvestment of distributions | | | | | | | | | | | | | | | | |
Class A | | | 4,297,385 | | | | 40,747,585 | | | | 5,090,728 | | | | 43,117,960 | |
Class B | | | 7,409 | | | | 70,848 | | | | 25,632 | | | | 216,784 | |
Class C | | | 599,537 | | | | 5,674,913 | | | | 606,197 | | | | 5,111,831 | |
Administrator Class | | | 171,849 | | | | 1,629,643 | | | | 89,236 | | | | 775,222 | |
Institutional Class | | | 1,287,009 | | | | 12,135,285 | | | | 1,260,658 | | | | 10,654,067 | |
| | | | |
| | | | | | | 60,258,274 | | | | | | | | 59,875,864 | |
| | | | |
Payment for shares redeemed | | | | | | | | | | | | | | | | |
Class A | | | (4,365,300 | ) | | | (42,695,006 | ) | | | (5,956,354 | ) | | | (54,335,024 | ) |
Class B | | | (94,554 | ) | | | (941,535 | ) | | | (212,484 | ) | | | (1,934,449 | ) |
Class C | | | (1,024,054 | ) | | | (9,982,561 | ) | | | (1,077,109 | ) | | | (9,826,218 | ) |
Administrator Class | | | (972,961 | ) | | | (9,626,881 | ) | | | (650,695 | ) | | | (5,982,660 | ) |
Institutional Class | | | (1,382,346 | ) | | | (13,387,459 | ) | | | (2,203,621 | ) | | | (20,087,169 | ) |
| | | | |
| | | | | | | (76,633,442 | ) | | | | | | | (92,165,520 | ) |
| | | | |
Net increase in net assets resulting from capital share transactions | | | | | | | 172,072,243 | | | | | | | | 56,451,396 | |
| | | | |
Total increase in net assets | | | | | | | 165,691,068 | | | | | | | | 116,946,774 | |
| | | | |
| | | | |
Net assets | | | | | | | | | | | | | | | | |
Beginning of period | | | | | | | 680,813,655 | | | | | | | | 563,866,881 | |
| | | | |
End of period | | | | | | $ | 846,504,723 | | | | | | | $ | 680,813,655 | |
| | | | |
Undistributed net investment income | | | | | | $ | 377,678 | | | | | | | $ | 422,976 | |
| | | | |
The accompanying notes are an integral part of these financial statements.
| | | | |
| 16 | | Wells Fargo Diversified Capital Builder Fund | | Financial highlights |
(For a share outstanding throughout each period)
| | | | | | | | | | | | | | | | | | | | | | | | |
| | | Six months ended
March 31, 2017 (unaudited) | | | Year ended September 30 | |
| CLASS A | | | 2016 | | | 2015 | | | 2014 | | | 2013 | | | 2012 | |
Net asset value, beginning of period | | | $9.96 | | | | $9.12 | | | | $9.31 | | | | $7.89 | | | | $6.93 | | | | $5.65 | |
Net investment income | | | 0.11 | | | | 0.17 | | | | 0.11 | | | | 0.09 | | | | 0.12 | | | | 0.15 | |
Net realized and unrealized gains (losses) on investments | | | 0.64 | | | | 1.71 | | | | (0.20 | ) | | | 1.41 | | | | 0.96 | | | | 1.29 | |
| | | | | | | | | | | | | | | | | | | | | | | | |
Total from investment operations | | | 0.75 | | | | 1.88 | | | | (0.09 | ) | | | 1.50 | | | | 1.08 | | | | 1.44 | |
Distributions to shareholders from | | | | | | | | | | | | | | | | | | | | | | | | |
Net investment income | | | (0.10 | ) | | | (0.15 | ) | | | (0.10 | ) | | | (0.08 | ) | | | (0.12 | ) | | | (0.16 | ) |
Net realized gains | | | (0.78 | ) | | | (0.89 | ) | | | 0.00 | | | | 0.00 | | | | 0.00 | | | | 0.00 | |
| | | | | | | | | | | | | | | | | | | | | | | | |
Total distributions to shareholders | | | (0.88 | ) | | | (1.04 | ) | | | (0.10 | ) | | | (0.08 | ) | �� | | (0.12 | ) | | | (0.16 | ) |
Net asset value, end of period | | | $9.83 | | | | $9.96 | | | | $9.12 | | | | $9.31 | | | | $7.89 | | | | $6.93 | |
Total return1 | | | 7.93 | % | | | 22.85 | % | | | (1.05 | )% | | | 19.10 | % | | | 15.75 | % | | | 25.58 | % |
Ratios to average net assets (annualized) | | | | | | | | | | | | | | | | | | | | | | | | |
Gross expenses | | | 1.12 | % | | | 1.14 | % | | | 1.19 | % | | | 1.21 | % | | | 1.20 | % | | | 1.21 | % |
Net expenses | | | 1.12 | % | | | 1.14 | % | | | 1.19 | % | | | 1.20 | % | | | 1.20 | % | | | 1.20 | % |
Net investment income | | | 2.14 | % | | | 1.77 | % | | | 1.17 | % | | | 1.09 | % | | | 1.66 | % | | | 2.40 | % |
Supplemental data | | | | | | | | | | | | | | | | | | | | | | | | |
Portfolio turnover rate | | | 29 | % | | | 73 | % | | | 69 | % | | | 82 | % | | | 70 | % | | | 79 | % |
Net assets, end of period (000s omitted) | | | $534,211 | | | | $467,503 | | | | $402,303 | | | | $431,388 | | | | $399,535 | | | | $390,705 | |
| 1 | Total return calculations do not include any sales charges. Returns for periods of less than one year are not annualized. |
The accompanying notes are an integral part of these financial statements.
| | | | | | |
| Financial highlights | | Wells Fargo Diversified Capital Builder Fund | | | 17 | |
(For a share outstanding throughout each period)
| | | | | | | | | | | | | | | | | | | | | | | | |
| | | Six months ended
March 31, 2017 (unaudited) | | | Year ended September 30 | |
| CLASS B | | | 2016 | | | 2015 | | | 2014 | | | 2013 | | | 2012 | |
Net asset value, beginning of period | | | $10.07 | | | | $9.19 | | | | $9.38 | | | | $7.95 | | | | $6.98 | | | | $5.69 | |
Net investment income | | | 0.07 | 1 | | | 0.09 | 1 | | | 0.04 | 1 | | | 0.03 | 1 | | | 0.07 | 1 | | | 0.11 | 1 |
Net realized and unrealized gains (losses) on investments | | | 0.64 | | | | 1.75 | | | | (0.21 | ) | | | 1.41 | | | | 0.96 | | | | 1.28 | |
| | | | | | | | | | | | | | | | | | | | | | | | |
Total from investment operations | | | 0.71 | | | | 1.84 | | | | (0.17 | ) | | | 1.44 | | | | 1.03 | | | | 1.39 | |
Distributions to shareholders from | | | | | | | | | | | | | | | | | | | | | | | | |
Net investment income | | | (0.05 | ) | | | (0.07 | ) | | | (0.02 | ) | | | (0.01 | ) | | | (0.06 | ) | | | (0.10 | ) |
Net realized gains | | | (0.78 | ) | | | (0.89 | ) | | | 0.00 | | | | 0.00 | | | | 0.00 | | | | 0.00 | |
| | | | | | | | | | | | | | | | | | | | | | | | |
Total distributions to shareholders | | | (0.83 | ) | | | (0.96 | ) | | | (0.02 | ) | | | (0.01 | ) | | | (0.06 | ) | | | (0.10 | ) |
Net asset value, end of period | | | $9.95 | | | | $10.07 | | | | $9.19 | | | | $9.38 | | | | $7.95 | | | | $6.98 | |
Total return2 | | | 7.44 | % | | | 22.06 | % | | | (1.86 | )% | | | 18.15 | % | | | 14.87 | % | | | 24.62 | % |
Ratios to average net assets (annualized) | | | | | | | | | | | | | | | | | | | | | | | | |
Gross expenses | | | 1.87 | % | | | 1.89 | % | | | 1.94 | % | | | 1.96 | % | | | 1.95 | % | | | 1.96 | % |
Net expenses | | | 1.87 | % | | | 1.89 | % | | | 1.94 | % | | | 1.95 | % | | | 1.95 | % | | | 1.95 | % |
Net investment income | | | 1.50 | % | | | 0.99 | % | | | 0.44 | % | | | 0.34 | % | | | 0.94 | % | | | 1.65 | % |
Supplemental data | | | | | | | | | | | | | | | | | | | | | | | | |
Portfolio turnover rate | | | 29 | % | | | 73 | % | | | 69 | % | | | 82 | % | | | 70 | % | | | 79 | % |
Net assets, end of period (000s omitted) | | | $720 | | | | $1,515 | | | | $3,042 | | | | $5,180 | | | | $6,502 | | | | $8,077 | |
| 1 | Calculated based upon average shares outstanding |
| 2 | Total return calculations do not include any sales charges. Returns for periods of less than one year are not annualized. |
The accompanying notes are an integral part of these financial statements.
| | | | |
| 18 | | Wells Fargo Diversified Capital Builder Fund | | Financial highlights |
(For a share outstanding throughout each period)
| | | | | | | | | | | | | | | | | | | | | | | | |
| | | Six months ended
March 31, 2017 (unaudited) | | | Year ended September 30 | |
| CLASS C | | | 2016 | | | 2015 | | | 2014 | | | 2013 | | | 2012 | |
Net asset value, beginning of period | | | $9.96 | | | | $9.12 | | | | $9.32 | | | | $7.90 | | | | $6.94 | | | | $5.66 | |
Net investment income | | | 0.07 | | | | 0.10 | | | | 0.05 | | | | 0.03 | | | | 0.07 | | | | 0.10 | |
Net realized and unrealized gains (losses) on investments | | | 0.64 | | | | 1.72 | | | | (0.22 | ) | | | 1.41 | | | | 0.96 | | | | 1.29 | |
| | | | | | | | | | | | | | | | | | | | | | | | |
Total from investment operations | | | 0.71 | | | | 1.82 | | | | (0.17 | ) | | | 1.44 | | | | 1.03 | | | | 1.39 | |
Distributions to shareholders from | | | | | | | | | | | | | | | | | | | | | | | | |
Net investment income | | | (0.07 | ) | | | (0.09 | ) | | | (0.03 | ) | | | (0.02 | ) | | | (0.07 | ) | | | (0.11 | ) |
Net realized gains | | | (0.78 | ) | | | (0.89 | ) | | | 0.00 | | | | 0.00 | | | | 0.00 | | | | 0.00 | |
| | | | | | | | | | | | | | | | | | | | | | | | |
Total distributions to shareholders | | | (0.85 | ) | | | (0.98 | ) | | | (0.03 | ) | | | (0.02 | ) | | | (0.07 | ) | | | (0.11 | ) |
Net asset value, end of period | | | $9.82 | | | | $9.96 | | | | $9.12 | | | | $9.32 | | | | $7.90 | | | | $6.94 | |
Total return1 | | | 7.49 | % | | | 21.96 | % | | | (1.88 | )% | | | 18.21 | % | | | 14.86 | % | | | 24.63 | % |
Ratios to average net assets (annualized) | | | | | | | | | | | | | | | | | | | | | | | | |
Gross expenses | | | 1.87 | % | | | 1.89 | % | | | 1.94 | % | | | 1.96 | % | | | 1.95 | % | | | 1.96 | % |
Net expenses | | | 1.87 | % | | | 1.89 | % | | | 1.94 | % | | | 1.95 | % | | | 1.95 | % | | | 1.95 | % |
Net investment income | | | 1.37 | % | | | 1.03 | % | | | 0.41 | % | | | 0.34 | % | | | 0.91 | % | | | 1.65 | % |
Supplemental data | | | | | | | | | | | | | | | | | | | | | | | | |
Portfolio turnover rate | | | 29 | % | | | 73 | % | | | 69 | % | | | 82 | % | | | 70 | % | | | 79 | % |
Net assets, end of period (000s omitted) | | | $96,823 | | | | $67,630 | | | | $53,373 | | | | $45,670 | | | | $39,758 | | | | $38,279 | |
| 1 | Total return calculations do not include any sales charges. Returns for periods of less than one year are not annualized. |
The accompanying notes are an integral part of these financial statements.
| | | | | | |
| Financial highlights | | Wells Fargo Diversified Capital Builder Fund | | | 19 | |
(For a share outstanding throughout each period)
| | | | | | | | | | | | | | | | | | | | | | | | |
| | | Six months ended
March 31, 2017 (unaudited) | | | Year ended September 30 | |
| ADMINISTRATOR CLASS | | | 2016 | | | 2015 | | | 2014 | | | 2013 | | | 2012 | |
Net asset value, beginning of period | | | $9.97 | | | | $9.12 | | | | $9.32 | | | | $7.90 | | | | $6.94 | | | | $5.66 | |
Net investment income | | | 0.12 | | | | 0.18 | 1 | | | 0.14 | 1 | | | 0.12 | 1 | | | 0.14 | 1 | | | 0.17 | 1 |
Net realized and unrealized gains (losses) on investments | | | 0.62 | | | | 1.73 | | | | (0.22 | ) | | | 1.41 | | | | 0.96 | | | | 1.28 | |
| | | | | | | | | | | | | | | | | | | | | | | | |
Total from investment operations | | | 0.74 | | | | 1.91 | | | | (0.08 | ) | | | 1.53 | | | | 1.10 | | | | 1.45 | |
Distributions to shareholders from | | | | | | | | | | | | | | | | | | | | | | | | |
Net investment income | | | (0.10 | ) | | | (0.17 | ) | | | (0.12 | ) | | | (0.11 | ) | | | (0.14 | ) | | | (0.17 | ) |
Net realized gains | | | (0.78 | ) | | | (0.89 | ) | | | 0.00 | | | | 0.00 | | | | 0.00 | | | | 0.00 | |
| | | | | | | | | | | | | | | | | | | | | | | | |
Total distributions to shareholders | | | (0.88 | ) | | | (1.06 | ) | | | (0.12 | ) | | | (0.11 | ) | | | (0.14 | ) | | | (0.17 | ) |
Net asset value, end of period | | | $9.83 | | | | $9.97 | | | | $9.12 | | | | $9.32 | | | | $7.90 | | | | $6.94 | |
Total return2 | | | 7.84 | % | | | 23.14 | % | | | (0.92 | )% | | | 19.39 | % | | | 16.06 | % | | | 25.84 | % |
Ratios to average net assets (annualized) | | | | | | | | | | | | | | | | | | | | | | | | |
Gross expenses | | | 1.04 | % | | | 1.06 | % | | | 1.05 | % | | | 1.04 | % | | | 1.04 | % | | | 1.03 | % |
Net expenses | | | 1.04 | % | | | 1.03 | % | | | 0.95 | % | | | 0.95 | % | | | 0.95 | % | | | 0.95 | % |
Net investment income | | | 2.27 | % | | | 1.89 | % | | | 1.41 | % | | | 1.33 | % | | | 1.84 | % | | | 2.65 | % |
Supplemental data | | | | | | | | | | | | | | | | | | | | | | | | |
Portfolio turnover rate | | | 29 | % | | | 73 | % | | | 69 | % | | | 82 | % | | | 70 | % | | | 79 | % |
Net assets, end of period (000s omitted) | | | $20,476 | | | | $21,398 | | | | $7,898 | | | | $9,411 | | | | $6,836 | | | | $3,015 | |
| 1 | Calculated based upon average shares outstanding |
| 2 | Returns for periods of less than one year are not annualized. |
The accompanying notes are an integral part of these financial statements.
| | | | |
| 20 | | Wells Fargo Diversified Capital Builder Fund | | Financial highlights |
(For a share outstanding throughout each period)
| | | | | | | | | | | | | | | | | | | | | | | | |
| | | Six months ended
March 31, 2017 (unaudited) | | | Year ended September 30 | |
| INSTITUTIONAL CLASS | | | 2016 | | | 2015 | | | 2014 | | | 2013 | | | 2012 | |
Net asset value, beginning of period | | | $9.90 | | | | $9.07 | | | | $9.27 | | | | $7.85 | | | | $6.90 | | | | $5.62 | |
Net investment income | | | 0.13 | | | | 0.20 | | | | 0.15 | | | | 0.13 | 1 | | | 0.15 | | | | 0.18 | 1 |
Net realized and unrealized gains (losses) on investments | | | 0.62 | | | | 1.71 | | | | (0.21 | ) | | | 1.41 | | | | 0.95 | | | | 1.28 | |
| | | | | | | | | | | | | | | | | | | | | | | | |
Total from investment operations | | | 0.75 | | | | 1.91 | | | | (0.06 | ) | | | 1.54 | | | | 1.10 | | | | 1.46 | |
Distributions to shareholders from | | | | | | | | | | | | | | | | | | | | | | | | |
Net investment income | | | (0.11 | ) | | | (0.19 | ) | | | (0.14 | ) | | | (0.12 | ) | | | (0.15 | ) | | | (0.18 | ) |
Net realized gains | | | (0.78 | ) | | | (0.89 | ) | | | 0.00 | | | | 0.00 | | | | 0.00 | | | | 0.00 | |
| | | | | | | | | | | | | | | | | | | | | | | | |
Total distributions to shareholders | | | (0.89 | ) | | | (1.08 | ) | | | (0.14 | ) | | | (0.12 | ) | | | (0.15 | ) | | | (0.18 | ) |
Net asset value, end of period | | | $9.76 | | | | $9.90 | | | | $9.07 | | | | $9.27 | | | | $7.85 | | | | $6.90 | |
Total return2 | | | 8.05 | % | | | 23.28 | % | | | (0.75 | )% | | | 19.68 | % | | | 16.17 | % | | | 26.23 | % |
Ratios to average net assets (annualized) | | | | | | | | | | | | | | | | | | | | | | | | |
Gross expenses | | | 0.79 | % | | | 0.81 | % | | | 0.79 | % | | | 0.78 | % | | | 0.77 | % | | | 0.78 | % |
Net expenses | | | 0.78 | % | | | 0.78 | % | | | 0.77 | % | | | 0.78 | % | | | 0.77 | % | | | 0.78 | % |
Net investment income | | | 2.45 | % | | | 2.14 | % | | | 1.58 | % | | | 1.52 | % | | | 2.08 | % | | | 2.80 | % |
Supplemental data | | | | | | | | | | | | | | | | | | | | | | | | |
Portfolio turnover rate | | | 29 | % | | | 73 | % | | | 69 | % | | | 82 | % | | | 70 | % | | | 79 | % |
Net assets, end of period (000s omitted) | | | $194,274 | | | | $122,769 | | | | $97,251 | | | | $100,160 | | | | $149,790 | | | | $142,256 | |
| 1 | Calculated based upon average shares outstanding |
| 2 | Returns for periods of less than one year are not annualized. |
The accompanying notes are an integral part of these financial statements.
| | | | | | |
| Notes to financial statements (unaudited) | | Wells Fargo Diversified Capital Builder Fund | | | 21 | |
1. ORGANIZATION
Wells Fargo Funds Trust (the “Trust”), a Delaware statutory trust organized on March 10, 1999, is an open-end management investment company registered under the Investment Company Act of 1940, as amended (the “1940 Act”). As an investment company, the Trust follows the accounting and reporting guidance in Financial Accounting Standards Board (“FASB”) Accounting Standards Codification (“ASC”) Topic 946, Financial Services – Investment Companies. These financial statements report on the Wells Fargo Diversified Capital Builder Fund (the “Fund”) which is a diversified series of the Trust.
2. SIGNIFICANT ACCOUNTING POLICIES
The following significant accounting policies, which are consistently followed in the preparation of the financial statements of the Fund, are in conformity with U.S. generally accepted accounting principles which require management to make estimates and assumptions that affect the reported amounts of assets and liabilities, disclosure of contingent assets and liabilities at the date of the financial statements, and the reported amounts of revenues and expenses during the reporting period. Actual results could differ from those estimates.
Securities valuation
All investments are valued each business day as of the close of regular trading on the New York Stock Exchange (generally 4 p.m. Eastern Time), although the Fund may deviate from this calculation time under unusual or unexpected circumstances.
Equity securities that are listed on a foreign or domestic exchange or market are valued at the official closing price or, if none, the last sales price. If no sale occurs on the principal exchange or market that day, the prior day’s price will be deemed “stale” and a fair value price will be determined in accordance with the Fund’s Valuation Procedures.
Debt securities are valued at the evaluated bid price provided by an independent pricing service or, if a reliable price is not available, the quoted bid price from an independent broker-dealer.
Investments in registered open-end investment companies are valued at net asset value. Interests in non-registered investment companies that are redeemable at net asset value are fair valued normally at net asset value.
Investments which are not valued using any of the methods discussed above are valued at their fair value, as determined in good faith by the Board of Trustees of the Fund. The Board of Trustees has established a Valuation Committee comprised of the Trustees and has delegated to it the authority to take any actions regarding the valuation of portfolio securities that the Valuation Committee deems necessary or appropriate, including determining the fair value of portfolio securities, unless the determination has been delegated to the Management Valuation Team of Wells Fargo Funds Management, LLC (“Funds Management”). The Board of Trustees retains the authority to make or ratify any valuation decisions or approve any changes to the Valuation Procedures as it deems appropriate. On a quarterly basis, the Board of Trustees receives reports on any valuation actions taken by the Valuation Committee or the Management Valuation Team which may include items for ratification.
Valuations of fair valued securities are compared to the next actual sales price when available, or other appropriate market values, to assess the continued appropriateness of the fair valuation methodologies used. These securities are fair valued on a day-to-day basis, taking into consideration changes to appropriate market information and any significant changes to the inputs considered in the valuation process until there is a readily available price provided on an exchange or by an independent pricing service. Valuations received from an independent pricing service or independent broker-dealer quotes are periodically validated by comparisons to most recent trades and valuations provided by other independent pricing services in addition to the review of prices by the manager and/or subadviser. Unobservable inputs used in determining fair valuations are identified based on the type of security, taking into consideration factors utilized by market participants in valuing the investment, knowledge about the issuer and the current market environment.
Security loans
The Fund may lend its securities from time to time in order to earn additional income in the form of fees or interest on securities received as collateral or the investment of any cash received as collateral. The Fund continues to receive interest or dividends on the securities loaned. The Fund receives collateral in the form of cash or securities with a value at least equal to the value of the securities on loan. The value of the loaned securities is determined at the close of each business day and any additional required collateral is delivered to the Fund on the next business day. In a securities lending transaction, the net asset value of the Fund will be affected by an increase or decrease in the value of the securities loaned and by an increase or decrease in the value of the instrument in which collateral is invested. The amount of securities lending activity undertaken by the Fund fluctuates from time to time. In the event of default or bankruptcy
| | | | |
| 22 | | Wells Fargo Diversified Capital Builder Fund | | Notes to financial statements (unaudited) |
by the borrower, the Fund may be prevented from recovering the loaned securities or gaining access to the collateral or may experience delays or costs in doing so. In addition, the investment of any cash collateral received may lose all or part of its value. The Fund has the right under the lending agreement to recover the securities from the borrower on demand.
The Fund lends its securities through an unaffiliated securities lending agent. Cash collateral received in connection with its securities lending transactions is invested in Securities Lending Cash Investments, LLC (the “Securities Lending Fund”). The Securities Lending Fund is exempt from registration under Section 3(c)(7) of the 1940 Act and is managed by Funds Management and is subadvised by Wells Capital Management Incorporated (“WellsCap”), an affiliate of Funds Management and an indirect wholly owned subsidiary of Wells Fargo & Company (“Wells Fargo”). Funds Management receives an advisory fee starting at 0.05% and declining to 0.01% as the average daily net assets of the Securities Lending Fund increase. All of the fees received by Funds Management are paid to WellsCap for its services as subadviser. The Securities Lending Fund seeks to provide a positive return compared to the daily Fed Funds Open Rate by investing in high-quality, U.S. dollar-denominated short-term money market instruments. Securities Lending Fund investments are valued at the evaluated bid price provided by an independent pricing service. Income earned from investment in the Securities Lending Fund is included in securities lending income on the Statement of Operations.
When-issued transactions
The Fund may purchase securities on a forward commitment or when-issued basis. The Fund records a when-issued transaction on the trade date and will segregate assets in an amount at least equal in value to the Fund’s commitment to purchase when-issued securities. Securities purchased on a when-issued basis are marked-to-market daily and the Fund begins earning interest on the settlement date. Losses may arise due to changes in the market value of the underlying securities or if the counterparty does not perform under the contract.
Security transactions and income recognition
Securities transactions are recorded on a trade date basis. Realized gains or losses are recorded on the basis of identified cost.
Dividend income is recognized on the ex-dividend date.
Interest income is accrued daily and bond discounts are accreted and premiums are amortized daily based on the effective interest method. To the extent debt obligations are placed on non-accrual status, any related interest income may be reduced by writing off interest receivables when the collection of all or a portion of interest has been determined to be doubtful based on consistently applied procedures and the fair value has decreased. If the issuer subsequently resumes interest payments or when the collectability of interest is reasonably assured, the debt obligation is removed from non-accrual status.
Distributions to shareholders
Distributions to shareholders from net investment income and net realized gains, if any, are recorded on the ex-dividend date. Such distributions are determined in accordance with income tax regulations and may differ from U.S. generally accepted accounting principles. Dividend sources are estimated at the time of declaration. The tax character of distributions is determined as of the Fund’s fiscal year end. Therefore, a portion of the Fund’s distributions made prior the Fund’s fiscal year end may be categorized as a tax return of capital.
Federal and other taxes
The Fund intends to continue to qualify as a regulated investment company by distributing substantially all of its investment company taxable income and any net realized capital gains (after reduction for capital loss carryforwards) sufficient to relieve it from all, or substantially all, federal income taxes. Accordingly, no provision for federal income taxes was required.
The Fund’s income and federal excise tax returns and all financial records supporting those returns for the prior three fiscal years are subject to examination by the federal and Delaware revenue authorities. Management has analyzed the Fund’s tax positions taken on federal, state, and foreign tax returns for all open tax years and does not believe that there are any uncertain tax positions that require recognition of a tax liability.
Class allocations
The separate classes of shares offered by the Fund differ principally in applicable sales charges, distribution, shareholder servicing, and administration fees. Class specific expenses are charged directly to that share class. Investment income, common expenses, and realized and unrealized gains (losses) on investments are allocated daily to each class of shares based on the relative proportion of net assets of each class.
| | | | | | |
| Notes to financial statements (unaudited) | | Wells Fargo Diversified Capital Builder Fund | | | 23 | |
3. FAIR VALUATION MEASUREMENTS
Fair value measurements of investments are determined within a framework that has established a fair value hierarchy based upon the various data inputs utilized in determining the value of the Fund’s investments. The three-level hierarchy gives the highest priority to unadjusted quoted prices in active markets for identical assets or liabilities (Level 1) and the lowest priority to unobservable inputs (Level 3). The Fund’s investments are classified within the fair value hierarchy based on the lowest level of input that is significant to the fair value measurement. The inputs are summarized into three broad levels as follows:
| ∎ | | Level 1 – quoted prices in active markets for identical securities |
| ∎ | | Level 2 – other significant observable inputs (including quoted prices for similar securities, interest rates, prepayment speeds, credit risk, etc.) |
| ∎ | | Level 3 – significant unobservable inputs (including the Fund’s own assumptions in determining the fair value of investments) |
The inputs or methodologies used for valuing investments in securities are not necessarily an indication of the risk associated with investing in those securities.
The following is a summary of the inputs used in valuing the Fund’s assets and liabilities as of March 31, 2017:
| | | | | | | | | | | | | | | | |
| | | Quoted prices
(Level 1) | | | Other significant
observable inputs
(Level 2) | | | Significant
unobservable inputs (Level 3) | | | Total | |
Assets | | | | | | | | | | | | | | | | |
Investments in: | | | | | | | | | | | | | | | | |
| | | | |
Common stocks | | | | | | | | | | | | | | | | |
Consumer discretionary | | $ | 22,524,200 | | | $ | 0 | | | $ | 0 | | | $ | 22,524,200 | |
Consumer staples | | | 85,606,342 | | | | 0 | | | | 0 | | | | 85,606,342 | |
Energy | | | 130,518,850 | | | | 0 | | | | 0 | | | | 130,518,850 | |
Health care | | | 25,921,690 | | | | 0 | | | | 0 | | | | 25,921,690 | |
Industrials | | | 84,271,900 | | | | 0 | | | | 0 | | | | 84,271,900 | |
Information technology | | | 211,442,450 | | | | 0 | | | | 0 | | | | 211,442,450 | |
Materials | | | 32,429,150 | | | | 0 | | | | 0 | | | | 32,429,150 | |
Real estate | | | 70,336,350 | | | | 0 | | | | 0 | | | | 70,336,350 | |
Utilities | | | 15,798,000 | | | | 0 | | | | 0 | | | | 15,798,000 | |
| | | | |
Corporate bonds and notes | | | 0 | | | | 141,414,968 | | | | 0 | | | | 141,414,968 | |
| | | | |
Yankee corporate bonds and notes | | | 0 | | | | 20,298,478 | | | | 0 | | | | 20,298,478 | |
| | | | |
Short-term investments | | | | | | | | | | | | | | | | |
Investment companies | | | 3,096,035 | | | | 0 | | | | 0 | | | | 3,096,035 | |
Investments measured at net asset value* | | | | | | | | | | | | | | | 6,199,407 | |
Total assets | | $ | 681,944,967 | | | $ | 161,713,446 | | | $ | 0 | | | $ | 849,857,820 | |
| * | Investments that are measured at fair value using the net asset value per share (or its equivalent) as a practical expedient have not been categorized in the fair value hierarchy. The fair value amount presented in the table is intended to permit reconciliation of the fair value hierarchy to the amounts presented in the Statement of Assets and Liabilities. The Fund’s investment in Securities Lending Cash Investments, LLC valued at $6,199,407 does not have a redemption period notice, can be redeemed daily and does not have any unfunded commitments. |
The Fund recognizes transfers between levels within the fair value hierarchy at the end of the reporting period. At March 31, 2017, the Fund did not have any transfers into/out of Level 1, Level 2, or Level 3.
4. TRANSACTIONS WITH AFFILIATES AND OTHER EXPENSES
Management fee
Funds Management, an indirect wholly owned subsidiary of Wells Fargo, is the manager of the Fund and provides advisory and fund-level administrative services under an investment management agreement. Under the investment management agreement, Funds Management is responsible for, among other services, implementing the investment objectives and strategies of the Fund, supervising the subadviser, providing fund-level administrative services in connection with the
| | | | |
| 24 | | Wells Fargo Diversified Capital Builder Fund | | Notes to financial statements (unaudited) |
Fund’s operations, and providing any other fund-level administrative services reasonably necessary for the operation of the Fund. As compensation for its services under the investment management agreement, Funds Management is entitled to receive an annual management fee starting at 0.65% and declining to 0.48% as the average daily net assets of the Fund increase. For the six months ended March 31, 2017, the management fee was equivalent to an annual rate of 0.63% of the Fund’s average daily net assets.
Funds Management has retained the services of a subadviser to provide daily portfolio management to the Fund. The fee for subadvisory services is borne by Funds Management. WellsCap is the subadviser to the Fund and is entitled to receive a fee from Funds Management at an annual rate starting at 0.35% and declining to 0.20% as the average daily net assets of the Fund increase.
Administration fees
Under a class-level administration agreement, Funds Management provides class-level administrative services to the Fund, which includes paying fees and expenses for services provided by the transfer agent, sub-transfer agents, omnibus account servicers and record-keepers. As compensation for its services under the class-level administration agreement, Funds Management receives an annual fee which is calculated based on the average daily net assets of each class as follows:
| | | | |
| | | Class-level
administration fee | |
Class A, Class B, Class C | | | 0.21 | % |
Administrator Class, Institutional Class | | | 0.13 | |
Funds Management has contractually waived and/or reimbursed management and administration fees to the extent necessary to maintain certain net operating expense ratios for the Fund. Waiver of fees and/or reimbursement of expenses by Funds Management were made first from fund level expenses on a proportionate basis and then from class specific expenses. Funds Management has committed through January 31, 2018 to waive fees and/or reimburse expenses to the extent necessary to cap the Fund’s expenses at 1.20% for Class A shares, 1.95% for Class B shares, 1.95% for Class C shares, 1.05% for Administrator Class shares, and 0.78% for Institutional Class shares. After this time, the cap may be increased or the commitment to maintain the cap may be terminated only with the approval of the Board of Trustees.
During the six months ended March 31, 2017, State Street Bank and Trust Company, the Fund’s custodian, reimbursed the Fund $6,540 for certain out-of-pocket expenses that were billed to the Fund in error from 1998-2015. This amount is included in dividend income on the Statement of Operations. In addition, Funds Management was also reimbursed $14,537 for waivers/reimbursements it made to the Fund during the period the Fund was erroneously billed.
Distribution fees
The Trust has adopted a distribution plan for Class B and Class C shares of the Fund pursuant to Rule 12b-1 under the 1940 Act. Distribution fees are charged to Class B and Class C shares and paid to Wells Fargo Funds Distributor, LLC (“Funds Distributor”), the principal underwriter, at an annual rate of 0.75% of the average daily net assets of Class B and Class C shares.
In addition, Funds Distributor is entitled to receive the front-end sales charge from the purchase of Class A shares and a contingent deferred sales charge on the redemption of certain Class A shares. Funds Distributor is also entitled to receive the contingent deferred sales charges from redemptions of Class B and Class C shares. For the six months ended March 31, 2017, Funds Distributor received $60,743 from the sale of Class A shares and $37 in contingent deferred sales charges from redemptions of Class C shares.
Shareholder servicing fees
The Trust has entered into contracts with one or more shareholder servicing agents, whereby Class A, Class B, Class C, and Administrator Class of the Fund are charged a fee at an annual rate of 0.25% of the average daily net assets of each respective class.
A portion of these total shareholder servicing fees were paid to affiliates of Wells Fargo.
5. INVESTMENT PORTFOLIO TRANSACTIONS
Purchases and sales of investments, excluding U.S. government obligations (if any) and short-term securities, for the six months ended March 31, 2017 were $339,360,072 and $218,202,345, respectively.
| | | | | | |
| Notes to financial statements (unaudited) | | Wells Fargo Diversified Capital Builder Fund | | | 25 | |
The Fund may purchase or sell investment securities to other Wells Fargo affiliates pursuant to Rule 17a-7 of the 1940 Act and under procedures adopted by the Board of Trustees. The procedures have been designed to ensure that these interfund transactions, which generally do not incur broker commissions, are effected at current market prices. Interfund trades are included within the respective purchases and sales amounts shown.
6. BANK BORROWINGS
The Trust (excluding the money market funds and certain other funds) and Wells Fargo Variable Trust are parties to a $250,000,000 revolving credit agreement whereby the Fund is permitted to use bank borrowings for temporary or emergency purposes, such as to fund shareholder redemption requests. Interest under the credit agreement is charged to the Fund based on a borrowing rate equal to the higher of the Federal Funds rate in effect on that day plus 1.25% or the overnight LIBOR rate in effect on that day plus 1.25%. In addition, an annual commitment fee equal to 0.25% of the unused balance is allocated to each participating fund.
For the six months ended March 31, 2017, there were no borrowings by the Fund under the agreement.
7. INDEMNIFICATION
Under the Trust’s organizational documents, the officers and Trustees have been granted certain indemnification rights against certain liabilities that may arise out of performance of their duties to the Trust. Additionally, in the normal course of business, the Trust may enter into contracts with service providers that contain a variety of indemnification clauses. The Trust’s maximum exposure under these arrangements is dependent on future claims that may be made against the Fund and, therefore, cannot be estimated.
8. NEW ACCOUNTING PRONOUNCEMENT
In December 2016, FASB issued Accounting Standards Update (“ASU”) No. 2016-19, Technical Corrections and Improvements. ASU 2016-19 includes an amendment to FASB ASC Topic 820, Fair Value Measurement which clarifies the difference between a valuation approach and a valuation technique. The amendment also requires an entity to disclose when there has been a change in either or both a valuation approach and/or a valuation technique. The disclosure requirements are effective for fiscal years and interim periods within those fiscal years beginning after December 15, 2016. Management is currently evaluating the potential impact of this new guidance to the financial statements.
9. REGULATORY CHANGES
In October 2016, the Securities and Exchange Commission (“SEC”) adopted new rules and forms and amended existing rules and forms (together, “final rules”) intended to modernize and enhance the reporting and disclosure of information by registered investment companies and to enhance liquidity risk management by open-end mutual funds and exchange-traded funds. The final rules will enhance the quality of information available to investors and will allow the SEC to more effectively collect and use data reported by funds. In part, the final rules amend Regulation S-X and require standardized, enhanced disclosure about derivatives in the Fund’s financial statements, as well as other amendments. The compliance date for the amendments to Regulation S-X is August 1, 2017 while the compliance date for the new form types is June 1, 2018 and the compliance date for the liquidity risk management program requirements is December 1, 2018. Management is currently assessing the potential impact of these enhancements and their impact on the financial statement disclosures and reporting requirements.
| | | | |
| 26 | | Wells Fargo Diversified Capital Builder Fund | | Other information (unaudited) |
PROXY VOTING INFORMATION
A description of the policies and procedures that the Fund uses to determine how to vote proxies relating to portfolio securities is available, upon request, by calling 1-800-222-8222, visiting our website at wellsfargofunds.com, or visiting the SEC website at sec.gov. Information regarding how the Fund voted proxies relating to portfolio securities during the most recent 12-month period ended June 30 is available on the Fund’s website at wellsfargofunds.com or by visiting the SEC website at sec.gov.
PORTFOLIO HOLDINGS INFORMATION
The complete portfolio holdings for the Fund are publicly available monthly on the Fund’s website (wellsfargofunds.com), on a one-month delayed basis. In addition, top ten holdings information (excluding derivative positions) for the Fund is publicly available on the Fund’s website on a monthly, seven-day or more delayed basis. The Fund files its complete schedule of portfolio holdings with the SEC for the first and third quarters of each fiscal year on Form N-Q, which is available by visiting the SEC website at sec.gov. In addition, the Fund’s Form N-Q may be reviewed and copied at the SEC’s Public Reference Room in Washington, DC, and at regional offices in New York City, at 233 Broadway, and in Chicago, at 175 West Jackson Boulevard, Suite 900. Information about the Public Reference Room may be obtained by calling 1-800-SEC-0330.
| | | | | | |
| Other information (unaudited) | | Wells Fargo Diversified Capital Builder Fund | | | 27 | |
BOARD OF TRUSTEES AND OFFICERS
Each of the Trustees and Officers1 listed in the table below acts in identical capacities for each fund in the Wells Fargo family of funds, which consists of 138 mutual funds comprising the Wells Fargo Funds Trust, Wells Fargo Variable Trust, Wells Fargo Master Trust and four closed-end funds (collectively the “Fund Complex”). This table should be read in conjunction with the Prospectus and the Statement of Additional Information2. The mailing address of each Trustee and Officer is 525 Market Street, 12th Floor, San Francisco, CA 94105. Each Trustee and Officer serves an indefinite term, however, each Trustee serves such term until reaching the mandatory retirement age established by the Trustees.
Independent Trustees
| | | | | | |
Name and year of birth | | Position held and length of service* | | Principal occupations during past five years or longer | | Current other
public company or
investment company directorships |
| William R. Ebsworth (Born 1957) | | Trustee, since 2015 | | Retired. From 1984 to 2013, equities analyst, portfolio manager, research director and chief financial officer at Fidelity Management and Research Company in Boston, Tokyo, and Hong Kong and retired in 2013 as Chief Investment Officer of Fidelity Strategic Advisers, Inc. where he lead a team of investment professionals managing client assets. Prior thereto, Board member of Hong Kong Securities Clearing Co., Hong Kong Options Clearing Corp., the Thailand International Fund, Ltd., Fidelity Investments Life Insurance Company, and Empire Fidelity Investments Life Insurance Company. Board member of the Fonté Foundation (non-profit organization) and the Vincent Memorial Hospital Endowment (non-profit organization), where he serves on the Investment Committee and as a Chair of the Audit Committee. Mr. Ebsworth is a CFA® charterholder and an Adjunct Lecturer, Finance, at Babson College. | | Asset Allocation Trust |
| Jane A. Freeman (Born 1953) | | Trustee, since 2015 | | Retired. From 2012 to 2014 and 1999 to 2008, Chief Financial Officer of Scientific Learning Corporation. From 2008 to 2012, Ms. Freeman provided consulting services related to strategic business projects. Prior to 1999, Portfolio Manager at Rockefeller & Co. and Scudder, Stevens & Clark. Board member of the Harding Loevner Funds from 1996 to 2014, serving as both Lead Independent Director and chair of the Audit Committee. Board member of the Russell Exchange Traded Funds Trust from 2011 to 2012 and the chair of the Audit Committee. Ms. Freeman is Chair of Taproot Foundation (non-profit organization), a Board Member of Ruth Bancroft Garden (non-profit organization) and an inactive chartered financial analyst. | | Asset Allocation Trust |
| Peter G. Gordon** (Born 1942) | | Trustee, since 1998; Chairman, since 2005 | | Co-Founder, Retired Chairman, President and CEO of Crystal Geyser Water Company. Trustee Emeritus, Colby College. | | Asset Allocation Trust |
| Isaiah Harris, Jr. (Born 1952) | | Trustee, since 2009 | | Retired. Chairman of the Board of CIGNA Corporation since 2009, and Director since 2005. From 2003 to 2011, Director of Deluxe Corporation. Prior thereto, President and CEO of BellSouth Advertising and Publishing Corp. from 2005 to 2007, President and CEO of BellSouth Enterprises from 2004 to 2005 and President of BellSouth Consumer Services from 2000 to 2003. Emeritus member of the Iowa State University Foundation Board of Governors. Emeritus Member of the Advisory Board of Iowa State University School of Business. Advisory Board Member, Palm Harbor Academy (charter school). Advisory Board Member, Child Evangelism Fellowship (non-profit). Mr. Harris is a certified public accountant (inactive status). | | CIGNA Corporation; Asset Allocation Trust |
| Judith M. Johnson (Born 1949) | | Trustee, since 2008; Audit Committee Chairman, since 2008 | | Retired. Prior thereto, Chief Executive Officer and Chief Investment Officer of Minneapolis Employees Retirement Fund from 1996 to 2008. Ms. Johnson is an attorney, certified public accountant and a certified managerial accountant. | | Asset Allocation Trust |
| David F. Larcker (Born 1950) | | Trustee, since 2009 | | James Irvin Miller Professor of Accounting at the Graduate School of Business, Stanford University, Director of the Corporate Governance Research Initiative and Senior Faculty of The Rock Center for Corporate Governance since 2006. From 2005 to 2008, Professor of Accounting at the Graduate School of Business, Stanford University. Prior thereto, Ernst & Young Professor of Accounting at The Wharton School, University of Pennsylvania from 1985 to 2005. | | Asset Allocation Trust |
| | | | |
| 28 | | Wells Fargo Diversified Capital Builder Fund | | Other information (unaudited) |
| | | | | | |
Name and year of birth | | Position held and length of service* | | Principal occupations during past five years or longer | | Current other
public company or
investment company directorships |
| Olivia S. Mitchell (Born 1953) | | Trustee, since 2006 | | International Foundation of Employee Benefit Plans Professor, Wharton School of the University of Pennsylvania since 1993. Director of Wharton’s Pension Research Council and Boettner Center on Pensions & Retirement Research, and Research Associate at the National Bureau of Economic Research. Previously, Cornell University Professor from 1978 to 1993. | | Asset Allocation Trust |
| Timothy J. Penny (Born 1951) | | Trustee, since 1996 | | President and Chief Executive Officer of Southern Minnesota Initiative Foundation, a non-profit organization, since 2007 and Senior Fellow at the Humphrey Institute Policy Forum at the University of Minnesota since 1995. Member of the Board of Trustees of NorthStar Education Finance, Inc., a non-profit organization, since 2007. | | Asset Allocation Trust |
| Michael S. Scofield (Born 1943) | | Trustee, since 2010 | | Served on the Investment Company Institute’s Board of Governors and Executive Committee from 2008-2011 as well the Governing Council of the Independent Directors Council from 2006-2011 and the Independent Directors Council Executive Committee from 2008-2011. Chairman of the IDC from 2008-2010. Institutional Investor (Fund Directions) Trustee of Year in 2007. Trustee of the Evergreen Funds complex (and its predecessors) from 1984 to 2010. Chairman of the Evergreen Funds from 2000-2010. Former Trustee of the Mentor Funds. Retired Attorney, Law Offices of Michael S. Scofield. | | Asset Allocation Trust |
| * | Length of service dates reflect the Trustee’s commencement of service with the Trust’s predecessor entities, where applicable. |
| ** | Peter Gordon is expected to retire on December 31, 2017. |
Officers
| | | | | | |
Name and
year of birth | | Position held and length of service | | Principal occupations during past five years or longer | | |
Andrew Owen
(Born 1960) | | President, since 2017 | | Executive Vice President of Wells Fargo Bank, N.A. and President of Wells Fargo & Company and Head of Affiliated Managers, Wells Fargo Asset Management, since 2014. Executive Vice President responsible for marketing, investments and product development for Wells Fargo Funds Management, LLC, from 2009 to 2014. | | |
| Jeremy DePalma1 (Born 1974) | | Treasurer, since 2012 | | Senior Vice President of Wells Fargo Funds Management, LLC since 2009. Senior Vice President of Evergreen Investment Management Company, LLC from 2008 to 2010 and head of the Fund Reporting and Control Team within Fund Administration from 2005 to 2010. | | |
| C. David Messman (Born 1960) | | Secretary, since 2000; Chief Legal Officer, since 2003 | | Senior Vice President and Secretary of Wells Fargo Funds Management, LLC since 2001. Assistant General Counsel of Wells Fargo Bank, N.A. since 2013 and Vice President and Managing Counsel of Wells Fargo Bank, N.A. from 1996 to 2013. | | |
| Michael Whitaker (Born 1967) | | Chief Compliance Officer, since 2016 | | Executive Vice President of Wells Fargo Funds Management, LLC since 2016. Chief Compliance Officer of Fidelity’s Fixed Income Funds and Asset Allocation Funds from 2008 to 2016, Compliance Officer of FMR Co., Inc. from 2014 to 2016, Fidelity Investments Money Management, Inc. from 2014 to 2016, Fidelity Investments from 2007 to 2016. | | |
David Berardi
(Born 1975) | | Assistant Treasurer, since 2009 | | Vice President of Wells Fargo Funds Management, LLC since 2009. Vice President of Evergreen Investment Management Company, LLC from 2008 to 2010. Manager of Fund Reporting and Control for Evergreen Investment Management Company, LLC from 2004 to 2010. | | |
| 1 | Jeremy DePalma acts as Treasurer of 69 funds and Assistant Treasurer of 69 funds in the Fund Complex. |
| 2 | The Statement of Additional Information includes additional information about the Trustees and is available, without charge, upon request, by calling 1-800-222-8222 or by visiting the website at wellsfargofunds.com. |
| | | | | | |
| List of abbreviations | | Wells Fargo Diversified Capital Builder Fund | | | 29 | |
The following is a list of common abbreviations for terms and entities that may have appeared in this report.
| ACA | — ACA Financial Guaranty Corporation |
| ADR | — American depositary receipt |
| ADS | — American depositary shares |
| AGC | — Assured Guaranty Corporation |
| AGM | — Assured Guaranty Municipal |
| Ambac | — Ambac Financial Group Incorporated |
| AMT | — Alternative minimum tax |
| BAN | — Bond anticipation notes |
| BHAC | — Berkshire Hathaway Assurance Corporation |
| CAB | — Capital appreciation bond |
| CCAB | — Convertible capital appreciation bond |
| CDA | — Community Development Authority |
| CDO | — Collateralized debt obligation |
| DRIVER | — Derivative inverse tax-exempt receipts |
| DW&P | — Department of Water & Power |
| DWR | — Department of Water Resources |
| ECFA | — Educational & Cultural Facilities Authority |
| EDA | — Economic Development Authority |
| EDFA | — Economic Development Finance Authority |
| ETF | — Exchange-traded fund |
| FDIC | — Federal Deposit Insurance Corporation |
| FFCB | — Federal Farm Credit Banks |
| FGIC | — Financial Guaranty Insurance Corporation |
| FHA | — Federal Housing Administration |
| FHLB | — Federal Home Loan Bank |
| FHLMC | — Federal Home Loan Mortgage Corporation |
| FICO | — The Financing Corporation |
| FNMA | — Federal National Mortgage Association |
| GDR | — Global depositary receipt |
| GNMA | — Government National Mortgage Association |
| HCFR | — Healthcare facilities revenue |
| HEFA | — Health & Educational Facilities Authority |
| HEFAR | — Higher education facilities authority revenue |
| HFA | — Housing Finance Authority |
| HFFA | — Health Facilities Financing Authority |
| HUD | — Department of Housing and Urban Development |
| IDA | — Industrial Development Authority |
| IDAG | — Industrial Development Agency |
| KRW | — Republic of Korea won |
| LIBOR | — London Interbank Offered Rate |
| LIFER | — Long Inverse Floating Exempt Receipts |
| LLC | — Limited liability company |
| LLLP | — Limited liability limited partnership |
| LLP | — Limited liability partnership |
| MBIA | — Municipal Bond Insurance Association |
| MFHR | — Multifamily housing revenue |
| MSTR | — Municipal securities trust receipts |
| MUD | — Municipal Utility District |
| National | — National Public Finance Guarantee Corporation |
| PCFA | — Pollution Control Financing Authority |
| PCL | — Public Company Limited |
| PCR | — Pollution control revenue |
| PFA | — Public Finance Authority |
| PFFA | — Public Facilities Financing Authority |
| PFOTER | — Puttable floating option tax-exempt receipts |
| plc | — Public limited company |
| PUTTER | — Puttable tax-exempt receipts |
| R&D | — Research & development |
| Radian | — Radian Asset Assurance |
| RAN | — Revenue anticipation notes |
| RDA | — Redevelopment Authority |
| RDFA | — Redevelopment Finance Authority |
| REIT | — Real estate investment trust |
| ROC | — Reset option certificates |
| SAVRS | — Select auction variable rate securities |
| SBA | — Small Business Authority |
| SDR | — Swedish depositary receipt |
| SFHR | — Single-family housing revenue |
| SFMR | — Single-family mortgage revenue |
| SPA | — Standby purchase agreement |
| SPDR | — Standard & Poor’s Depositary Receipts |
| SPEAR | — Short Puttable Exempt Adjustable Receipts |
| STRIPS | — Separate trading of registered interest and |
| TAN | — Tax anticipation notes |
| TIPS | — Treasury inflation-protected securities |
| TRAN | — Tax revenue anticipation notes |
| TTFA | — Transportation Trust Fund Authority |
| TVA | — Tennessee Valley Authority |
This page is intentionally left blank.
This page is intentionally left blank.
This page is intentionally left blank.

For more information
More information about Wells Fargo Funds is available free upon request. To obtain literature, please write, email, visit the Fund’s website, or call:
Wells Fargo Funds
P.O. Box 8266
Boston, MA 02266-8266
Email: fundservice@wellsfargo.com
Website: wellsfargofunds.com
Individual investors: 1-800-222-8222
Retail investment professionals: 1-888-877-9275
Institutional investment professionals: 1-866-765-0778
This report and the financial statements contained herein are submitted for the general information of the shareholders of the Fund. If this report is used for promotional purposes, distribution of the report must be accompanied or preceded by a current prospectus. Before investing, please consider the investment objectives, risks, charges, and expenses of the investment. For a current prospectus and, if available, a summary prospectus, containing this information, call 1-800-222-8222 or visit the Fund’s website at wellsfargofunds.com. Read the prospectus carefully before you invest or send money.
Wells Fargo Asset Management (WFAM) is a trade name used by the asset management businesses of Wells Fargo & Company. Wells Fargo Funds Management, LLC, a wholly owned subsidiary of Wells Fargo & Company, provides investment advisory and administrative services for Wells Fargo Funds. Other affiliates of Wells Fargo & Company provide subadvisory and other services for the funds. The funds are distributed by Wells Fargo Funds Distributor, LLC, Member FINRA, an affiliate of Wells Fargo & Company. Neither Wells Fargo Funds Management nor Wells Fargo Funds Distributor has Fund customer accounts/assets, and neither provides investment advice/recommendations or acts as an investment advice fiduciary to any investor.
NOT FDIC INSURED ◾ NO BANK GUARANTEE ◾ MAY LOSE VALUE
© 2017 Wells Fargo Funds Management, LLC. All rights reserved.
| | |
 | | 302881 05-17 SA225/SAR225 03-17 |
Semi-Annual Report
March 31, 2017

Wells Fargo Diversified Income Builder Fund


Reduce clutter. Save trees.
Sign up for electronic delivery of prospectuses and shareholder reports at wellsfargo.com/advantagedelivery
Contents
The views expressed and any forward-looking statements are as of March 31, 2017, unless otherwise noted, and are those of the Fund managers and/or Wells Fargo Funds Management, LLC. Discussions of individual securities, or the markets generally, or any Wells Fargo Fund are not intended as individual recommendations. Future events or results may vary significantly from those expressed in any forward-looking statements. The views expressed are subject to change at any time in response to changing circumstances in the market. Wells Fargo Funds Management, LLC and the Fund disclaim any obligation to publicly update or revise any views expressed or forward-looking statements.
NOT FDIC INSURED ◾ NO BANK GUARANTEE ◾ MAY LOSE VALUE
| | | | |
| 2 | | Wells Fargo Diversified Income Builder Fund | | Letter to shareholders (unaudited) |

Andrew Owen
President
Wells Fargo Funds
U.S. and international stocks returned 10.12% and 8.18% for the six-month period; within fixed income, the Bloomberg Barclays U.S. Aggregate Bond Index3 returned -2.18%.
Dear Shareholder:
As the new president of Wells Fargo Funds now that Karla Rabusch is retiring from that position after nearly 14 years, I am pleased to offer you this semi-annual report for the Wells Fargo Diversified Income Builder Fund for the six-month period that ended March 31, 2017. During this period, global stocks delivered favorable results overall. U.S. and international stocks returned 10.12% and 8.18% for the six-month period, respectively, as measured by the S&P 500 Index1 and the MSCI ACWI ex USA Index (Net)2; within fixed income, the Bloomberg Barclays U.S. Aggregate Bond Index3 returned -2.18%.
During the fourth quarter of 2016, prospects for faster growth and higher interest rates in the U.S. influenced markets.
Early in the fourth quarter of 2016, U.S. stocks tended to trade lower amid concerns such as a likely interest-rate increase and uncertainty over the approaching general election. However, following Donald Trump’s election as president in early November, U.S. stocks began to rally. Investors appeared optimistic that the new administration would usher in a series of progrowth policies, and supportive economic news helped the rally carry through the quarter. The buoyant environment sent interest rates higher as well. At its mid-December meeting, Fed officials raised their short-term target interest rate for the first time in a year by a quarter percentage point to between 0.50% and 0.75%. The fourth quarter also saw the implementation of the U.S. Securities and Exchange Commission’s new rules for money market funds, which included floating net asset values (NAVs) for institutional prime and municipal money market funds as well as liquidity fees and redemption gates. In the year leading up to money market fund reform implementation, nearly $1 trillion in assets moved from these types of money market funds into government money market funds, which continued to transact at a stable $1 NAV. Outside of the U.S., the prospects for faster U.S. growth appeared to trigger some acceleration in Europe. The improvement may be partly attributable to expectations for further strengthening of the U.S. dollar, which in turn could improve demand for European goods in the U.S. due to weakening of the euro relative to the dollar. Meanwhile, rising inflation across the eurozone and Japan caused an upward shift in yield curves in those areas although developed-country bond yields remained significantly lower than U.S. Treasury yields.
Globally, stocks delivered positive results and economies showed some improvement in the first quarter of 2017.
Stocks rallied globally through the first quarter of 2017, supported by signs of improvement in the U.S. and global economies. U.S. economic data released during the quarter reflected a healthy economy. Hiring remained strong, and business and consumer sentiment improved. Meanwhile, inflation inched up during the quarter. Along with the pickup in inflation, investors appeared to shift
| 1 | The S&P 500 Index consists of 500 stocks chosen for market size, liquidity, and industry group representation. It is a market-value-weighted index with each stock’s weight in the index proportionate to its market value. You cannot invest directly in an index. |
| 2 | The Morgan Stanley Capital International (MSCI) All Country World Index (ACWI) ex USA Index (Net) is a free-float-adjusted market-capitalization-weighted index that is designed to measure the equity market performance of developed markets, excluding the United States and Canada. Source: MSCI. MSCI makes no express or implied warranties or representations and shall have no liability whatsoever with respect to any MSCI data contained herein. The MSCI data may not be further redistributed or used as a basis for other indexes or any securities or financial products. This report is not approved, reviewed, or produced by MSCI. You cannot invest directly in an index. |
| 3 | The Bloomberg Barclays U.S. Aggregate Bond Index (formerly known as Barclays U.S. Aggregate Bond Index) is a broad-based benchmark that measures the investment-grade, U.S. dollar–denominated, fixed-rate taxable bond market, including Treasuries, government-related and corporate securities, mortgage-backed securities (agency fixed-rate and hybrid adjustable-rate mortgage pass-throughs), asset-backed securities, and commercial mortgage-backed securities. You cannot invest directly in an index. |
| | | | | | |
| Letter to shareholders (unaudited) | | Wells Fargo Diversified Income Builder Fund | | | 3 | |
from a mindset of very gradual interest-rate increases by the Fed to an anticipation of three or four increases in 2017. The first of these occurred in March; Fed officials raised their short-term target rate by a quarter percentage point to between 0.75% and 1.00%. With the Fed’s target-rate increase, short-term bond yields rose during the quarter. Meanwhile, longer-term Treasury yields were little changed, leading to positive performance. Investment-grade and high-yield bonds benefited from strong demand. Municipal bond returns were positive in the quarter, helped by strong demand and constrained new-issue supply. Outside of the U.S., credit spreads narrowed, helping lower-quality credit outperform amid a strong demand for yield. Also, stocks in emerging markets generally outperformed stocks in the U.S. and international developed markets. Thus far in 2017, emerging markets overall have benefited from both global economic growth and recent weakening in the U.S. dollar. European stocks also outperformed the U.S. market, despite investors’ concern over uncertainties such as the potential impact of an upcoming election in France; a contender for president of France, Marine Le Pen, favored exiting the European Union, which could potentially destabilize or topple the organization.
Don’t let short-term uncertainty derail long-term investment goals.
Periods of uncertainty can present challenges, but experience has taught us that maintaining long-term investment goals can be an effective way to plan for the future. To help you create a sound strategy based on your personal goals and risk tolerance, Wells Fargo Funds offers more than 100 mutual funds spanning a wide range of asset classes and investment styles. Although diversification cannot guarantee an investment profit or prevent losses, we believe it can be an effective way to manage investment risk and potentially smooth out overall portfolio performance. We encourage investors to know their investments and to understand that appropriate levels of risk-taking may unlock opportunities.
Thank you for choosing to invest in Wells Fargo Funds. We appreciate your confidence in us and remain committed to helping you meet your financial needs.
Sincerely,

Andrew Owen
President
Wells Fargo Funds
Although diversification cannot guarantee an investment profit or prevent losses, we believe it can be an effective way to manage investment risk and potentially smooth out overall portfolio performance.
For further information about your Fund, contact your investment professional, visit our website at wellsfargofunds.com, or call us directly at 1-800-222-8222. We are available 24 hours a day, 7 days a week.
| | | | |
| 4 | | Wells Fargo Diversified Income Builder Fund | | Performance highlights (unaudited) |
Investment objective
The Fund seeks long-term total return, consisting of current income and capital appreciation.
Manager
Wells Fargo Funds Management, LLC
Subadviser
Wells Fargo Capital Management Incorporated
Portfolio manager
Margaret Patel
Average annual total returns (%) as of March 31, 20171
| | | | | | | | | | | | | | | | | | | | | | | | | | | | | | | | | | |
| | | | | Including sales charge | | | Excluding sales charge | | | Expense ratios2 (%) | |
| | | Inception date | | 1 year | | | 5 year | | | 10 year | | | 1 year | | | 5 year | | | 10 year | | | Gross | | | Net3 | |
| Class A (EKSAX) | | 4-14-1987 | | | 6.89 | | | | 6.58 | | | | 5.02 | | | | 13.40 | | | | 7.87 | | | | 5.64 | | | | 1.08 | | | | 1.08 | |
| Class B (EKSBX)* | | 2-1-1993 | | | 7.71 | | | | 6.78 | | | | 5.11 | | | | 12.71 | | | | 7.08 | | | | 5.11 | | | | 1.83 | | | | 1.83 | |
| Class C (EKSCX) | | 2-1-1993 | | | 11.73 | | | | 7.09 | | | | 4.87 | | | | 12.73 | | | | 7.09 | | | | 4.87 | | | | 1.83 | | | | 1.83 | |
| Administrator Class (EKSDX) | | 7-30-2010 | | | – | | | | – | | | | – | | | | 13.62 | | | | 8.07 | | | | 5.76 | | | | 1.00 | | | | 0.90 | |
| Institutional Class (EKSYX) | | 1-13-1997 | | | – | | | | – | | | | – | | | | 14.04 | | | | 8.29 | | | | 5.97 | | | | 0.75 | | | | 0.71 | |
| Diversified Income Builder Blended Index4 | | – | | | – | | | | – | | | | – | | | | 16.97 | | | | 8.46 | | | | 7.46 | | | | – | | | | – | |
| BofA Merrill Lynch High Yield U.S. Corporates, Cash Pay Index5 | | – | | | – | | | | – | | | | – | | | | 16.75 | | | | 6.82 | | | | 7.28 | | | | – | | | | – | |
| Russell 1000® Index6 | | – | | | – | | | | – | | | | – | | | | 17.43 | | | | 13.26 | | | | 7.58 | | | | – | | | | – | |
| * | | At the close of business on May 5, 2017, existing Class B shareholders were converted to Class A shareholders. Effective May 6, 2017, Class B shares are no longer offered by the Fund. |
Figures quoted represent past performance, which is no guarantee of future results, and do not reflect taxes that a shareholder may pay on fund distributions or the redemption of fund shares. Investment return and principal value of an investment will fluctuate so that an investor’s shares, when redeemed, may be worth more or less than their original cost. Performance shown without sales charges would be lower if sales charges were reflected. Current performance may be lower or higher than the performance data quoted, which assumes the reinvestment of dividends and capital gains. Current month-end performance is available on the Fund’s website, wellsfargofunds.com.
Index returns do not include transaction costs associated with buying and selling securities, any mutual fund fees or expenses, or any taxes. It is not possible to invest directly in an index.
For Class A shares, the maximum front-end sales charge is 5.75%. For Class B shares, the maximum contingent deferred sales charge is 5.00%. For Class C shares, the maximum contingent deferred sales charge is 1.00%. Performance including a contingent deferred sales charge assumes the sales charge for the corresponding time period. Administrator Class and Institutional Class shares are sold without a front-end sales charge or contingent deferred sales charge.
Balanced funds may invest in stocks and bonds. Stock values fluctuate in response to the activities of individual companies and general market and economic conditions. Bond values fluctuate in response to the financial condition of individual issuers, general market and economic conditions, and changes in interest rates. Changes in market conditions and government policies may lead to periods of heightened volatility in the bond market and reduced liquidity for certain bonds held by the Fund. In general, when interest rates rise, bond values fall and investors may lose principal value. Interest-rate changes and their impact on the Fund and its share price can be sudden and unpredictable. Certain investment strategies tend to increase the total risk of an investment (relative to the broader market). The Fund is exposed to foreign investment risk, high-yield securities risk, and smaller-company securities risk. Consult the Fund’s prospectus for additional information on these and other risks.
Please see footnotes on page 5.
| | | | | | |
| Performance highlights (unaudited) | | Wells Fargo Diversified Income Builder Fund | | | 5 | |
| | | | |
| Ten largest holdings (%) as of March 31, 20177 | |
Tronox Finance LLC, 6.38%, 8-15-2020 | | | 3.02 | |
AMN Healthcare Incorporated, 5.13%, 10-1-2024 | | | 2.27 | |
Lamb Weston Holdings Incorporated, 4.63%, 11-1-2024 | | | 2.17 | |
Crown Castle International Corporation | | | 2.16 | |
National Fuel Gas Company | | | 2.08 | |
HD Supply Incorporated, 5.75%, 4-15-2024 | | | 1.97 | |
TransDigm Group Incorporated, 6.38%, 6-15-2026 | | | 1.93 | |
Koppers Incorporated, 6.00%, 2-15-2025 | | | 1.90 | |
Penske Auto Group Incorporated, 5.75%, 10-1-2022 | | | 1.83 | |
Orbital ATK Incorporated, 5.50%, 10-1-2023 | | | 1.79 | |
|
| Portfolio allocation as of March 31, 20178 |
|
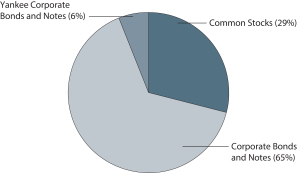 |
| 1 | Historical performance shown for Administrator Class shares prior to their inception reflects the performance of Institutional Class shares and has been adjusted to reflect the higher expenses applicable to Administrator Class shares. Historical performance shown for all classes of the Fund prior to July 12, 2010, is based on the performance of the Fund’s predecessor, Evergreen Diversified Income Builder Fund. |
| 2 | Reflects the expense ratios as stated in the most recent prospectuses. The expense ratios shown are subject to change and may differ from the annualized expense ratios shown in the financial highlights of this report. |
| 3 | The manager has contractually committed through January 31, 2018, to waive fees and/or reimburse expenses to the extent necessary to cap the Fund’s Total Annual Fund Operating Expenses After Fee Waivers at the amounts shown. After this time, the cap may be increased or the commitment to maintain the cap may be terminated only with the approval of the Board of Trustees. Brokerage commissions, stamp duty fees, interest, taxes, acquired fund fees and expenses, and extraordinary expenses are excluded from the expense cap. Without this cap, the Fund’s returns would have been lower. The expense ratio paid by an investor is the net expense ratio or the Fund’s Total Annual Fund Operating Expenses After Fee Waivers, as stated in the prospectuses. |
| 4 | Source: Wells Fargo Funds Management, LLC. The Diversified Income Builder Blended Index is composed of the BofA Merrill Lynch High Yield U.S. Corporates, Cash Pay Index (75%) and Russell 1000® Index (25%). You cannot invest directly in an index. |
| 5 | The BofA Merrill Lynch High Yield U.S. Corporates, Cash Pay Index is an unmanaged market index that provides a broad-based performance measure of the non-investment grade U.S. domestic bond index. You cannot invest directly in an index. |
| 6 | The Russell 1000® Index measures the performance of the 1,000 largest companies in the Russell 3000® Index, which represents approximately 92% of the total market capitalization of the Russell 3000® Index. You cannot invest directly in an index. |
| 7 | The ten largest holdings, excluding cash and cash equivalents, are calculated based on the value of the investments divided by total net assets of the Fund. Holdings are subject to change and may have changed since the date specified. |
| 8 | Amounts are calculated based on the total long-term investments of the Fund. These amounts are subject to change and may have changed since the date specified. |
| | | | |
| 6 | | Wells Fargo Diversified Income Builder Fund | | Fund expenses (unaudited) |
As a shareholder of the Fund, you incur two types of costs: (1) transaction costs, including sales charges (loads) on purchase payments and contingent deferred sales charges (if any) on redemptions and (2) ongoing costs, including management fees, distribution (12b-1) and/or shareholder servicing fees, and other Fund expenses. This example is intended to help you understand your ongoing costs (in dollars) of investing in the Fund and to compare these costs with the ongoing costs of investing in other mutual funds.
The example is based on an investment of $1,000 invested at the beginning of the six-month period and held for the entire period from October 1, 2016 to March 31, 2017.
Actual expenses
The “Actual” line of the table below provides information about actual account values and actual expenses. You may use the information in this line, together with the amount you invested, to estimate the expenses that you paid over the period. Simply divide your account value by $1,000 (for example, an $8,600 account value divided by $1,000 = 8.6), then multiply the result by the number in the “Actual” line under the heading entitled “Expenses paid during period” for your applicable class of shares to estimate the expenses you paid on your account during this period.
Hypothetical example for comparison purposes
The “Hypothetical” line of the table below provides information about hypothetical account values and hypothetical expenses based on the Fund’s actual expense ratio and an assumed rate of return of 5% per year before expenses, which is not the Fund’s actual return. The hypothetical account values and expenses may not be used to estimate the actual ending account balance or expenses you paid for the period. You may use this information to compare the ongoing costs of investing in the Fund and other funds. To do so, compare this 5% hypothetical example with the 5% hypothetical examples that appear in the shareholder reports of the other funds.
Please note that the expenses shown in the table are meant to highlight your ongoing costs only and do not reflect any transactional costs, such as sales charges (loads) and contingent deferred sales charges. Therefore, the “Hypothetical” line of the table is useful in comparing ongoing costs only and will not help you determine the relative total costs of owning different funds. In addition, if these transactional costs were included, your costs would have been higher.
| | | | | | | | | | | | | | | | |
| | | Beginning
account value
10-1-2016 | | | Ending
account value
3-31-2017 | | | Expenses
paid during
the period¹ | | | Annualized net
expense ratio | |
Class A | | | | | | | | | | | | | | | | |
Actual | | $ | 1,000.00 | | | $ | 1,043.37 | | | $ | 5.40 | | | | 1.06 | % |
Hypothetical (5% return before expenses) | | $ | 1,000.00 | | | $ | 1,019.65 | | | $ | 5.34 | | | | 1.06 | % |
Class B | | | | | | | | | | | | | | | | |
Actual | | $ | 1,000.00 | | | $ | 1,041.06 | | | $ | 9.21 | | | | 1.81 | % |
Hypothetical (5% return before expenses) | | $ | 1,000.00 | | | $ | 1,015.91 | | | $ | 9.10 | | | | 1.81 | % |
Class C | | | | | | | | | | | | | | | | |
Actual | | $ | 1,000.00 | | | $ | 1,041.11 | | | $ | 9.21 | | | | 1.81 | % |
Hypothetical (5% return before expenses) | | $ | 1,000.00 | | | $ | 1,015.91 | | | $ | 9.10 | | | | 1.81 | % |
Administrator Class | | | | | | | | | | | | | | | | |
Actual | | $ | 1,000.00 | | | $ | 1,044.75 | | | $ | 4.59 | | | | 0.90 | % |
Hypothetical (5% return before expenses) | | $ | 1,000.00 | | | $ | 1,020.44 | | | $ | 4.53 | | | | 0.90 | % |
Institutional Class | | | | | | | | | | | | | | | | |
Actual | | $ | 1,000.00 | | | $ | 1,045.75 | | | $ | 3.62 | | | | 0.71 | % |
Hypothetical (5% return before expenses) | | $ | 1,000.00 | | | $ | 1,021.39 | | | $ | 3.58 | | | | 0.71 | % |
| 1 | Expenses paid is equal to the annualized net expense ratio of each class multiplied by the average account value over the period, multiplied by the number of days in the most recent fiscal half-year divided by the number of days in the fiscal year (to reflect the one-half-year period). |
| | | | | | |
| Portfolio of investments—March 31, 2017 (unaudited) | | Wells Fargo Diversified Income Builder Fund | | | 7 | |
| | | | | | | | | | | | | | | | |
| Security name | | | | | | | | Shares | | | Value | |
| | | | |
Common Stocks: 28.78% | | | | | | | | | | | | | | | | |
| | | | |
Consumer Discretionary: 1.00% | | | | | | | | | | | | | | | | |
| | | | |
| Auto Components: 0.35% | | | | | | | | | | | | | | | | |
Gentex Corporation | | | | | | | | | | | 100,000 | | | $ | 2,133,000 | |
| | | | | | | | | | | | | | | | |
| | | | |
| Household Durables: 0.65% | | | | | | | | | | | | | | | | |
Leggett & Platt Incorporated | | | | | | | | | | | 65,000 | | | | 3,270,800 | |
Newell Rubbermaid Incorporated | | | | | | | | | | | 15,000 | | | | 707,550 | |
| | | | |
| | | | | | | | | | | | | | | 3,978,350 | |
| | | | | | | | | | | | | | | | |
| | | | |
Consumer Staples: 4.24% | | | | | | | | | | | | | | | | |
| | | | |
| Food & Staples Retailing: 1.96% | | | | | | | | | | | | | | | | |
CVS Health Corporation | | | | | | | | | | | 120,000 | | | | 9,420,000 | |
Sysco Corporation | | | | | | | | | | | 50,000 | | | | 2,596,000 | |
| | | | |
| | | | | | | | | | | | | | | 12,016,000 | |
| | | | | | | | | | | | | | | | |
| | | | |
| Food Products: 1.79% | | | | | | | | | | | | | | | | |
ConAgra Foods Incorporated | | | | | | | | | | | 125,000 | | | | 5,042,500 | |
Lamb Weston Holdings Incorporated | | | | | | | | | | | 140,000 | | | | 5,888,400 | |
| | | | |
| | | | | | | | | | | | | | | 10,930,900 | |
| | | | | | | | | | | | | | | | |
| | | | |
| Personal Products: 0.49% | | | | | | | | | | | | | | | | |
The Estee Lauder Companies Incorporated Class A | | | | | | | | | | | 35,000 | | | | 2,967,650 | |
| | | | | | | | | | | | | | | | |
| | | | |
Energy: 5.76% | | | | | | | | | | | | | | | | |
| | | | |
| Oil, Gas & Consumable Fuels: 5.76% | | | | | | | | | | | | | | | | |
EOG Resources Incorporated | | | | | | | | | | | 10,000 | | | | 975,500 | |
EQT Corporation | | | | | | | | | | | 30,000 | | | | 1,833,000 | |
Kinder Morgan Incorporated | | | | | | | | | | | 460,000 | | | | 10,000,400 | |
Plains All American Pipeline LP | | | | | | | | | | | 310,000 | | | | 9,799,100 | |
Tesoro Logistics LP | | | | | | | | | | | 145,000 | | | | 7,898,150 | |
The Williams Companies Incorporated | | | | | | | | | | | 160,000 | | | | 4,734,400 | |
| | | | |
| | | | | | | | | | | | | | | 35,240,550 | |
| | | | | | | | | | | | | | | | |
| | | | |
Health Care: 0.67% | | | | | | | | | | | | | | | | |
| | | | |
| Health Care Equipment & Supplies: 0.54% | | | | | | | | | | | | | | | | |
Teleflex Incorporated | | | | | | | | | | | 15,000 | | | | 2,905,950 | |
West Pharmaceutical Services Incorporated | | | | | | | | | | | 5,000 | | | | 408,050 | |
| | | | |
| | | | | | | | | | | | | | | 3,314,000 | |
| | | | | | | | | | | | | | | | |
| | | | |
| Life Sciences Tools & Services: 0.13% | | | | | | | | | | | | | | | | |
Thermo Fisher Scientific Incorporated | | | | | | | | | | | 5,000 | | | | 768,000 | |
| | | | | | | | | | | | | | | | |
| | | | |
Industrials: 2.90% | | | | | | | | | | | | | | | | |
| | | | |
| Aerospace & Defense: 2.28% | | | | | | | | | | | | | | | | |
Curtiss-Wright Corporation | | | | | | | | | | | 40,000 | | | | 3,650,400 | |
Huntington Ingalls Industries Incorporated | | | | | | | | | | | 20,000 | | | | 4,004,800 | |
The accompanying notes are an integral part of these financial statements.
| | | | |
| 8 | | Wells Fargo Diversified Income Builder Fund | | Portfolio of investments—March 31, 2017 (unaudited) |
| | | | | | | | | | | | | | | | |
| Security name | | | | | | | | Shares | | | Value | |
| | | | |
| Aerospace & Defense (continued) | | | | | | | | | | | | | | | | |
Lockheed Martin Corporation | | | | | | | | | | | 1,000 | | | $ | 267,600 | |
Raytheon Company | | | | | | | | | | | 25,000 | | | | 3,812,500 | |
TransDigm Group Incorporated † | | | | | | | | | | | 10,000 | | | | 2,201,600 | |
| | | | |
| | | | | | | | | | | | | | | 13,936,900 | |
| | | | | | | | | | | | | | | | |
| | | | |
| Building Products: 0.13% | | | | | | | | | | | | | | | | |
Lennox International Incorporated | | | | | | | | | | | 5,000 | | | | 836,500 | |
| | | | | | | | | | | | | | | | |
| | | | |
| Machinery: 0.29% | | | | | | | | | | | | | | | | |
John Bean Technologies Corporation | | | | | | | | | | | 20,000 | | | | 1,759,000 | |
| | | | | | | | | | | | | | | | |
| | | | |
| Trading Companies & Distributors: 0.20% | | | | | | | | | | | | | | | | |
HD Supply Holdings Incorporated † | | | | | | | | | | | 30,000 | | | | 1,233,750 | |
| | | | | | | | | | | | | | | | |
| | | | |
Information Technology: 8.21% | | | | | | | | | | | | | | | | |
| | | | |
| Electronic Equipment, Instruments & Components: 0.58% | | | | | | | | | | | | | | | | |
Amphenol Corporation Class A | | | | | | | | | | | 50,000 | | | | 3,558,500 | |
| | | | | | | | | | | | | | | | |
| | | | |
| Internet Software & Services: 0.15% | | | | | | | | | | | | | | | | |
Akamai Technologies Incorporated † | | | | | | | | | | | 15,000 | | | | 895,500 | |
| | | | | | | | | | | | | | | | |
| | | | |
| IT Services: 0.75% | | | | | | | | | | | | | | | | |
Leidos Holdings Incorporated | | | | | | | | | | | 90,000 | | | | 4,602,600 | |
| | | | | | | | | | | | | | | | |
| | | | |
| Semiconductors & Semiconductor Equipment: 3.84% | | | | | | | | | | | | | | | | |
Broadcom Limited | | | | | | | | | | | 40,000 | | | | 8,758,400 | |
Intel Corporation | | | | | | | | | | | 50,000 | | | | 1,803,500 | |
Microsemi Corporation † | | | | | | | | | | | 80,000 | | | | 4,122,400 | |
QUALCOMM Incorporated | | | | | | | | | | | 25,000 | | | | 1,433,500 | |
Texas Instruments Incorporated | | | | | | | | | | | 30,000 | | | | 2,416,800 | |
Versum Materials Incorporated | | | | | | | | | | | 30,000 | | | | 918,000 | |
Xilinx Incorporated | | | | | | | | | | | 70,000 | | | | 4,052,300 | |
| | | | |
| | | | | | | | | | | | | | | 23,504,900 | |
| | | | | | | | | | | | | | | | |
| | | | |
| Software: 2.42% | | | | | | | | | | | | | | | | |
Adobe Systems Incorporated † | | | | | | | | | | | 35,000 | | | | 4,554,550 | |
Microsoft Corporation | | | | | | | | | | | 155,000 | | | | 10,208,300 | |
| | | | |
| | | | | | | | | | | | | | | 14,762,850 | |
| | | | | | | | | | | | | | | | |
| | | | |
| Technology Hardware, Storage & Peripherals: 0.47% | | | | | | | | | | | | | | | | |
Western Digital Corporation | | | | | | | | | | | 35,000 | | | | 2,888,550 | |
| | | | | | | | | | | | | | | | |
| | | | |
Materials: 1.47% | | | | | | | | | | | | | | | | |
| | | | |
| Chemicals: 0.33% | | | | | | | | | | | | | | | | |
Celanese Corporation Series A | | | | | | | | | | | 20,000 | | | | 1,797,000 | |
Kooper Holdings Incorporated † | | | | | | | | | | | 5,000 | | | | 211,750 | |
| | | | |
| | | | | | | | | | | | | | | 2,008,750 | |
| | | | | | | | | | | | | | | | |
The accompanying notes are an integral part of these financial statements.
| | | | | | |
| Portfolio of investments—March 31, 2017 (unaudited) | | Wells Fargo Diversified Income Builder Fund | | | 9 | |
| | | | | | | | | | | | | | | | |
| Security name | | | | | | | | Shares | | | Value | |
| | | | |
| Containers & Packaging: 1.14% | | | | | | | | | | | | | | | | |
Sealed Air Corporation | | | | | | | | | | | 160,000 | | | $ | 6,972,800 | |
| | | | | | | | | | | | | | | | |
| | | | |
Real Estate: 3.50% | | | | | | | | | | | | | | | | |
| | | | |
| Equity REITs: 3.50% | | | | | | | | | | | | | | | | |
Crown Castle International Corporation | | | | | | | | | | | 140,000 | | | | 13,223,000 | |
Equinix Incorporated | | | | | | | | | | | 15,000 | | | | 6,005,550 | |
Saul Centers Incorporated | | | | | | | | | | | 35,000 | | | | 2,156,700 | |
| | | | |
| | | | | | | | | | | | | | | 21,385,250 | |
| | | | | | | | | | | | | | | | |
| | | | |
Utilities: 1.03% | | | | | | | | | | | | | | | | |
| | | | |
| Gas Utilities: 1.03% | | | | | | | | | | | | | | | | |
Atmos Energy Corporation | | | | | | | | | | | 80,000 | | | | 6,319,200 | |
| | | | | | | | | | | | | | | | |
| | | | |
Total Common Stocks (Cost $158,205,238) | | | | | | | | | | | | | | | 176,013,500 | |
| | | | | | | | | | | | | | | | |
| | | | |
| | | Interest rate | | | Maturity date | | | Principal | | | | |
| | | | |
Corporate Bonds and Notes: 63.58% | | | | | | | | | | | | | | | | |
| | | | |
Consumer Discretionary: 7.14% | | | | | | | | | | | | | | | | |
| | | | |
| Auto Components: 2.44% | | | | | | | | | | | | | | | | |
Dana Holding Corporation | | | 5.50 | % | | | 12-15-2024 | | | $ | 3,925,000 | | | | 3,974,063 | |
Lear Corporation | | | 4.75 | | | | 1-15-2023 | | | | 4,875,000 | | | | 5,049,715 | |
Tenneco Incorporated | | | 5.00 | | | | 7-15-2026 | | | | 6,000,000 | | | | 5,876,220 | |
| | | | |
| | | | | | | | | | | | | | | 14,899,998 | |
| | | | | | | | | | | | | | | | |
| | | | |
| Hotels, Restaurants & Leisure: 0.78% | | | | | | | | | | | | | | | | |
Speedway Motorsports Incorporated | | | 5.13 | | | | 2-1-2023 | | | | 4,700,000 | | | | 4,747,000 | |
| | | | | | | | | | | | | | | | |
| | | | |
| Media: 1.36% | | | | | | | | | | | | | | | | |
McGraw-Hill Global Education Holdings LLC 144A « | | | 7.88 | | | | 5-15-2024 | | | | 8,598,000 | | | | 8,318,565 | |
| | | | | | | | | | | | | | | | |
| | | | |
| Specialty Retail: 2.56% | | | | | | | | | | | | | | | | |
Group 1 Automotive Incorporated | | | 5.00 | | | | 6-1-2022 | | | | 4,453,000 | | | | 4,486,398 | |
Penske Auto Group Incorporated | | | 5.75 | | | | 10-1-2022 | | | | 10,813,000 | | | | 11,191,455 | |
| | | | |
| | | | | | | | | | | | | | | 15,677,853 | |
| | | | | | | | | | | | | | | | |
| | | | |
Consumer Staples: 2.48% | | | | | | | | | | | | | | | | |
| | | | |
| Food Products: 2.48% | | | | | | | | | | | | | | | | |
Lamb Weston Holdings Incorporated 144A | | | 4.63 | | | | 11-1-2024 | | | | 13,000,000 | | | | 13,260,000 | |
Post Holdings Incorporated 144A | | | 5.00 | | | | 8-15-2026 | | | | 2,000,000 | | | | 1,915,000 | |
| | | | |
| | | | | | | | | | | | | | | 15,175,000 | |
| | | | | | | | | | | | | | | | |
| | | | |
Energy: 2.17% | | | | | | | | | | | | | | | | |
| | | | |
| Oil, Gas & Consumable Fuels: 2.17% | | | | | | | | | | | | | | | | |
Kinder Morgan Energy Partners LP | | | 4.30 | | | | 6-1-2025 | | | | 3,500,000 | | | | 3,575,306 | |
ONEOK Incorporated | | | 4.25 | | | | 2-1-2022 | | | | 3,737,000 | | | | 3,811,740 | |
Plains All American Pipeline LP | | | 3.85 | | | | 10-15-2023 | | | | 2,345,000 | | | | 2,351,106 | |
The accompanying notes are an integral part of these financial statements.
| | | | |
| 10 | | Wells Fargo Diversified Income Builder Fund | | Portfolio of investments—March 31, 2017 (unaudited) |
| | | | | | | | | | | | | | | | |
| Security name | | Interest rate | | | Maturity date | | | Principal | | | Value | |
| | | | |
| Oil, Gas & Consumable Fuels (continued) | | | | | | | | | | | | | | | | |
Tennessee Gas Pipeline Company | | | 7.00 | % | | | 3-15-2027 | | | $ | 3,000,000 | | | $ | 3,556,857 | |
| | | | |
| | | | | | | | | | | | | | | 13,295,009 | |
| | | | | | | | | | | | | | | | |
| | | | |
Health Care: 7.36% | | | | | | | | | | | | | | | | |
| | | | |
| Health Care Equipment & Supplies: 1.15% | | | | | | | | | | | | | | | | |
Halyard Health Incorporated | | | 6.25 | | | | 10-15-2022 | | | | 1,000,000 | | | | 1,030,000 | |
Teleflex Incorporated | | | 4.88 | | | | 6-1-2026 | | | | 6,000,000 | | | | 6,030,000 | |
| | | | |
| | | | | | | | | | | | | | | 7,060,000 | |
| | | | | | | | | | | | | | | | |
| | | | |
| Health Care Providers & Services: 4.89% | | | | | | | | | | | | | | | | |
AMN Healthcare Incorporated 144A | | | 5.13 | | | | 10-1-2024 | | | | 13,750,000 | | | | 13,887,500 | |
DaVita HealthCare Partners Incorporated | | | 5.13 | | | | 7-15-2024 | | | | 3,000,000 | | | | 3,030,000 | |
HCA Incorporated | | | 5.25 | | | | 6-15-2026 | | | | 5,000,000 | | | | 5,238,000 | |
HCA Incorporated | | | 5.38 | | | | 2-1-2025 | | | | 5,500,000 | | | | 5,720,000 | |
HealthSouth Corporation | | | 5.13 | | | | 3-15-2023 | | | | 2,000,000 | | | | 2,000,000 | |
| | | | |
| | | | | | | | | | | | | | | 29,875,500 | |
| | | | | | | | | | | | | | | | |
| | | | |
| Health Care Technology: 1.32% | | | | | | | | | | | | | | | | |
QuintilesIMS Holdings Incorporated 144A | | | 4.88 | | | | 5-15-2023 | | | | 7,000,000 | | | | 7,096,250 | |
QuintilesIMS Holdings Incorporated 144A | | | 5.00 | | | | 10-15-2026 | | | | 1,000,000 | | | | 1,003,750 | |
| | | | |
| | | | | | | | | | | | | | | 8,100,000 | |
| | | | | | | | | | | | | | | | |
| | | | |
Industrials: 14.16% | | | | | | | | | | | | | | | | |
| | | | |
| Aerospace & Defense: 6.67% | | | | | | | | | | | | | | | | |
Huntington Ingalls Industries Incorporated 144A | | | 5.00 | | | | 11-15-2025 | | | | 8,000,000 | | | | 8,360,000 | |
Moog Incorporated 144A | | | 5.25 | | | | 12-1-2022 | | | | 5,500,000 | | | | 5,637,500 | |
Orbital ATK Incorporated | | | 5.50 | | | | 10-1-2023 | | | | 10,640,000 | | | | 10,959,200 | |
TransDigm Group Incorporated | | | 6.38 | | | | 6-15-2026 | | | | 11,800,000 | | | | 11,806,962 | |
TransDigm Group Incorporated | | | 6.50 | | | | 5-15-2025 | | | | 4,000,000 | | | | 4,035,000 | |
| | | | |
| | | | | | | | | | | | | | | 40,798,662 | |
| | | | | | | | | | | | | | | | |
| | | | |
| Commercial Services & Supplies: 0.82% | | | | | | | | | | | | | | | | |
ACCO Brands Corporation 144A | | | 5.25 | | | | 12-15-2024 | | | | 5,000,000 | | | | 5,025,000 | |
| | | | | | | | | | | | | | | | |
| | | | |
| Construction & Engineering: 0.33% | | | | | | | | | | | | | | | | |
Aecom Company 144A | | | 5.13 | | | | 3-15-2027 | | | | 2,000,000 | | | | 2,005,000 | |
| | | | | | | | | | | | | | | | |
| | | | |
| Machinery: 2.44% | | | | | | | | | | | | | | | | |
Actuant Corporation | | | 5.63 | | | | 6-15-2022 | | | | 1,165,000 | | | | 1,195,581 | |
Oshkosh Corporation | | | 5.38 | | | | 3-1-2025 | | | | 3,675,000 | | | | 3,794,438 | |
SPX FLOW Incorporated 144A | | | 5.63 | | | | 8-15-2024 | | | | 4,500,000 | | | | 4,539,375 | |
SPX FLOW Incorporated 144A | | | 5.88 | | | | 8-15-2026 | | | | 5,328,000 | | | | 5,374,620 | |
| | | | |
| | | | | | | | | | | | | | | 14,904,014 | |
| | | | | | | | | | | | | | | | |
| | | | |
| Road & Rail: 0.43% | | | | | | | | | | | | | | | | |
The Hertz Corporation 144A « | | | 5.50 | | | | 10-15-2024 | | | | 3,000,000 | | | | 2,606,250 | |
| | | | | | | | | | | | | | | | |
The accompanying notes are an integral part of these financial statements.
| | | | | | |
| Portfolio of investments—March 31, 2017 (unaudited) | | Wells Fargo Diversified Income Builder Fund | | | 11 | |
| | | | | | | | | | | | | | | | |
| Security name | | Interest rate | | | Maturity date | | | Principal | | | Value | |
| | | | |
| Trading Companies & Distributors: 3.47% | | | | | | | | | | | | | | | | |
HD Supply Incorporated 144A | | | 5.75 | % | | | 4-15-2024 | | | $ | 11,450,000 | | | $ | 12,043,110 | |
Wesco Distribution Incorporated | | | 5.38 | | | | 6-15-2024 | | | | 8,974,000 | | | | 9,198,350 | |
| | | | |
| | | | | | | | | | | | | | | 21,241,460 | |
| | | | | | | | | | | | | | | | |
| | | | |
Information Technology: 11.82% | | | | | | | | | | | | | | | | |
| | | | |
| Communications Equipment: 1.60% | | | | | | | | | | | | | | | | |
CommScope Incorporated 144A | | | 5.50 | | | | 6-15-2024 | | | | 9,479,000 | | | | 9,801,950 | |
| | | | | | | | | | | | | | | | |
| | | | |
| Electronic Equipment, Instruments & Components: 1.92% | | | | | | | | | | | | | | | | |
Anixter International Incorporated | | | 5.13 | | | | 10-1-2021 | | | | 4,000,000 | | | | 4,160,000 | |
Belden Incorporated 144A | | | 5.25 | | | | 7-15-2024 | | | | 3,485,000 | | | | 3,476,288 | |
Belden Incorporated 144A | | | 5.50 | | | | 9-1-2022 | | | | 4,000,000 | | | | 4,080,000 | |
| | | | |
| | | | | | | | | | | | | | | 11,716,288 | |
| | | | | | | | | | | | | | | | |
| | | | |
| IT Services: 0.33% | | | | | | | | | | | | | | | | |
Gartner Incorporated 144A | | | 5.13 | | | | 4-1-2025 | | | | 2,000,000 | | | | 2,037,500 | |
| | | | | | | | | | | | | | | | |
| | | | |
| Semiconductors & Semiconductor Equipment: 4.63% | | | | | | | | | | | | | | | | |
Micron Technology Incorporated 144A | | | 5.25 | | | | 8-1-2023 | | | | 3,700,000 | | | | 3,792,500 | |
Micron Technology Incorporated 144A | | | 5.25 | | | | 1-15-2024 | | | | 3,000,000 | | | | 3,081,570 | |
Micron Technology Incorporated | | | 5.50 | | | | 2-1-2025 | | | | 6,750,000 | | | | 7,003,125 | |
Micron Technology Incorporated 144A | | | 7.50 | | | | 9-15-2023 | | | | 1,000,000 | | | | 1,116,250 | |
Microsemi Corporation 144A | | | 9.13 | | | | 4-15-2023 | | | | 3,328,000 | | | | 3,823,040 | |
Versum Materials Incorporated 144A | | | 5.50 | | | | 9-30-2024 | | | | 9,196,000 | | | | 9,506,365 | |
| | | | |
| | | | | | | | | | | | | | | 28,322,850 | |
| | | | | | | | | | | | | | | | |
| | | | |
| Software: 1.62% | | | | | | | | | | | | | | | | |
CommScope Technologies LLC 144A | | | 5.00 | | | | 3-15-2027 | | | | 1,000,000 | | | | 998,450 | |
Nuance Communications Company 144A | | | 6.00 | | | | 7-1-2024 | | | | 2,000,000 | | | | 2,070,000 | |
Symantec Corporation 144A | | | 5.00 | | | | 4-15-2025 | | | | 6,705,000 | | | | 6,861,414 | |
| | | | |
| | | | | | | | | | | | | | | 9,929,864 | |
| | | | | | | | | | | | | | | | |
| | | | |
| Technology Hardware, Storage & Peripherals: 1.72% | | | | | | | | | | | | | | | | |
Diebold Incorporated | | | 8.50 | | | | 4-15-2024 | | | | 8,500,000 | | | | 9,392,500 | |
Western Digital Corporation 144A | | | 7.38 | | | | 4-1-2023 | | | | 1,000,000 | | | | 1,096,250 | |
| | | | |
| | | | | | | | | | | | | | | 10,488,750 | |
| | | | | | | | | | | | | | | | |
| | | | |
Materials: 13.65% | | | | | | | | | | | | | | | | |
| | | | |
| Chemicals: 7.73% | | | | | | | | | | | | | | | | |
A. Schulman Incorporated | | | 6.88 | | | | 6-1-2023 | | | | 7,500,000 | | | | 7,781,250 | |
Koppers Incorporated 144A | | | 6.00 | | | | 2-15-2025 | | | | 11,250,000 | | | | 11,615,625 | |
Olin Corporation | | | 5.50 | | | | 8-15-2022 | | | | 8,500,000 | | | | 8,840,000 | |
Rayonier Advanced Materials Products Incorporated 144A | | | 5.50 | | | | 6-1-2024 | | | | 8,945,000 | | | | 8,050,500 | |
Scotts Miracle-Gro Company 144A | | | 5.25 | | | | 12-15-2026 | | | | 4,000,000 | | | | 4,050,000 | |
Scotts Miracle-Gro Company | | | 6.00 | | | | 10-15-2023 | | | | 6,000,000 | | | | 6,375,000 | |
Valvoline Incorporated 144A | | | 5.50 | | | | 7-15-2024 | | | | 500,000 | | | | 525,000 | |
| | | | |
| | | | | | | | | | | | | | | 47,237,375 | |
| | | | | | | | | | | | | | | | |
The accompanying notes are an integral part of these financial statements.
| | | | |
| 12 | | Wells Fargo Diversified Income Builder Fund | | Portfolio of investments—March 31, 2017 (unaudited) |
| | | | | | | | | | | | | | | | |
| Security name | | Interest rate | | | Maturity date | | | Principal | | | Value | |
| | | | |
| Containers & Packaging: 2.54% | | | | | | | | | | | | | | | | |
Ball Corporation | | | 5.00 | % | | | 3-15-2022 | | | $ | 2,500,000 | | | $ | 2,637,500 | |
Berry Plastics Corporation | | | 5.13 | | | | 7-15-2023 | | | | 2,500,000 | | | | 2,562,500 | |
Berry Plastics Corporation | | | 6.00 | | | | 10-15-2022 | | | | 4,100,000 | | | | 4,335,750 | |
Greif Incorporated | | | 7.75 | | | | 8-1-2019 | | | | 545,000 | | | | 603,586 | |
Sealed Air Corporation 144A | | | 5.25 | | | | 4-1-2023 | | | | 4,650,000 | | | | 4,882,500 | |
Sealed Air Corporation 144A | | | 5.50 | | | | 9-15-2025 | | | | 500,000 | | | | 530,000 | |
| | | | |
| | | | | | | | | | | | | | | 15,551,836 | |
| | | | | | | | | | | | | | | | |
| | | | |
| Metals & Mining: 3.38% | | | | | | | | | | | | | | | | |
Commercial Metals Company | | | 4.88 | | | | 5-15-2023 | | | | 2,150,000 | | | | 2,193,000 | |
Tronox Finance LLC « | | | 6.38 | | | | 8-15-2020 | | | | 18,400,000 | | | | 18,469,000 | |
| | | | |
| | | | | | | | | | | | | | | 20,662,000 | |
| | | | | | | | | | | | | | | | |
| | | | |
Real Estate: 2.72% | | | | | | | | | | | | | | | | |
| | | | |
| Equity REITs: 2.72% | | | | | | | | | | | | | | | | |
Equinix Incorporated | | | 5.38 | | | | 5-15-2027 | | | | 3,000,000 | | | | 3,097,500 | |
Equinix Incorporated | | | 5.75 | | | | 1-1-2025 | | | | 1,500,000 | | | | 1,586,250 | |
Iron Mountain Incorporated 144A | | | 5.38 | | | | 6-1-2026 | | | | 6,500,000 | | | | 6,483,750 | |
Iron Mountain Incorporated | | | 5.75 | | | | 8-15-2024 | | | | 3,927,000 | | | | 4,005,540 | |
Sabra Health Care REIT Incorporated | | | 5.38 | | | | 6-1-2023 | | | | 1,500,000 | | | | 1,477,500 | |
| | | | |
| | | | | | | | | | | | | | | 16,650,540 | |
| | | | | | | | | | | | | | | | |
| | | | |
Utilities: 2.08% | | | | | | | | | | | | | | | | |
| | | | |
| Gas Utilities: 2.08% | | | | | | | | | | | | | | | | |
National Fuel Gas Company | | | 4.90 | | | | 12-1-2021 | | | | 12,000,000 | | | | 12,702,540 | |
| | | | | | | | | | | | | | | | |
| | | | |
Total Corporate Bonds and Notes (Cost $382,917,563) | | | | | | | | | | | | | | | 388,830,804 | |
| | | | | | | | | | | | | | | | |
| | | | |
Yankee Corporate Bonds and Notes: 6.06% | | | | | | | | | | | | | | | | |
| | | | |
Health Care: 1.70% | | | | | | | | | | | | | | | | |
| | | | |
| Pharmaceuticals: 1.70% | | | | | | | | | | | | | | | | |
Mallinckrodt plc 144A « | | | 5.50 | | | | 4-15-2025 | | | | 5,655,000 | | | | 5,202,600 | |
Mallinckrodt plc 144A « | | | 5.63 | | | | 10-15-2023 | | | | 5,500,000 | | | | 5,225,000 | |
| | | | |
| | | | | | | | | | | | | | | 10,427,600 | |
| | | | | | | | | | | | | | | | |
| | | | |
Industrials: 1.74% | | | | | | | | | | | | | | | | |
| | | | |
| Electrical Equipment: 1.74% | | | | | | | | | | | | | | | | |
Sensata Technologies BV 144A | | | 4.88 | | | | 10-15-2023 | | | | 6,700,000 | | | | 6,712,529 | |
Sensata Technologies BV 144A | | | 5.63 | | | | 11-1-2024 | | | | 3,750,000 | | | | 3,909,375 | |
| | | | |
| | | | | | | | | | | | | | | 10,621,904 | |
| | | | | | | | | | | | | | | | |
| | | | |
Information Technology: 2.62% | | | | | | | | | | | | | | | | |
| | | | |
| Technology Hardware, Storage & Peripherals: 2.62% | | | | | | | | | | | | | | | | |
Seagate HDD | | | 4.75 | | | | 6-1-2023 | | | | 8,500,000 | | | | 8,542,500 | |
Seagate HDD | | | 4.88 | | | | 6-1-2027 | | | | 8,000,000 | | | | 7,488,728 | |
| | | | |
| | | | | | | | | | | | | | | 16,031,228 | |
| | | | | | | | | | | | | | | | |
| | | | |
Total Yankee Corporate Bonds and Notes (Cost $36,708,445) | | | | | | | | | | | | | | | 37,080,732 | |
| | | | | | | | | | | | | | | | |
The accompanying notes are an integral part of these financial statements.
| | | | | | |
| Portfolio of investments—March 31, 2017 (unaudited) | | Wells Fargo Diversified Income Builder Fund | | | 13 | |
| | | | | | | | | | | | | | | | |
| Security name | | Yield | | | | | | Shares | | | Value | |
| | | | |
Short-Term Investments: 4.62% | | | | | | | | | | | | | | | | |
| | | | |
| Investment Companies: 4.62% | | | | | | | | | | | | | | | | |
Securities Lending Cash Investment LLC (l)(r)(u) | | | 0.98 | % | | | | | | | 23,963,123 | | | $ | 23,965,519 | |
Wells Fargo Government Money Market Fund Select Class (l)(u) | | | 0.63 | | | | | | | | 4,250,236 | | | | 4,250,236 | |
| | | | |
Total Short-Term Investments (Cost $28,215,146) | | | | | | | | | | | | | | | 28,215,755 | |
| | | | | | | | | | | | | | | | |
| | | | | | | | |
| Total investments in securities (Cost $606,046,392) * | | | 103.04 | % | | | 630,140,791 | |
Other assets and liabilities, net | | | (3.04 | ) | | | (18,586,482 | ) |
| | | | | | | | |
| Total net assets | | | 100.00 | % | | $ | 611,554,309 | |
| | | | | | | | |
| † | Non-income-earning security |
| 144A | The security may be resold in transactions exempt from registration, normally to qualified institutional buyers, pursuant to Rule 144A under the Securities Act of 1933. |
| « | All or a portion of this security is on loan. |
| (l) | The issuer of the security is an affiliated person of the Fund as defined in the Investment Company Act of 1940. |
| (r) | The investment is a non-registered investment vehicle purchased with cash collateral received from securities on loan. |
| (u) | The rate represents the 7-day annualized yield at period end. |
| * | Cost for federal income tax purposes is $606,046,392 and unrealized gains (losses) consists of: |
| | | | |
Gross unrealized gains | | $ | 29,658,442 | |
Gross unrealized losses | | | (5,564,043 | ) |
| | | | |
Net unrealized gains | | $ | 24,094,399 | |
The accompanying notes are an integral part of these financial statements.
| | | | |
| 14 | | Wells Fargo Diversified Income Builder Fund | | Statement of assets and liabilities—March 31, 2017 (unaudited) |
| | | | |
| | | | |
| |
Assets | | | | |
Investments | | | | |
In unaffiliated securities (including $23,347,526 of securities loaned), at value (cost $577,831,246) | | $ | 601,925,036 | |
In affiliated securities, at value (cost $28,215,146) | | | 28,215,755 | |
| | | | |
Total investments, at value (cost $606,046,392) | | | 630,140,791 | |
Receivable for Fund shares sold | | | 3,194,764 | |
Receivable for dividends and interest | | | 7,255,563 | |
Receivable for securities lending income | | | 10,523 | |
Prepaid expenses and other assets | | | 113,687 | |
| | | | |
Total assets | | | 640,715,328 | |
| | | | |
| |
Liabilities | | | | |
Distributions payable | | | 199,349 | |
Payable for investments purchased | | | 2,759,859 | |
Payable for Fund shares redeemed | | | 1,622,761 | |
Payable upon receipt of securities loaned | | | 23,964,910 | |
Management fee payable | | | 287,766 | |
Distribution fees payable | | | 98,864 | |
Administration fees payable | | | 93,721 | |
Accrued expenses and other liabilities | | | 133,789 | |
| | | | |
Total liabilities | | | 29,161,019 | |
| | | | |
Total net assets | | $ | 611,554,309 | |
| | | | |
| |
NET ASSETS CONSIST OF | | | | |
Paid-in capital | | $ | 578,768,676 | |
Overdistributed net investment income | | | (153,910 | ) |
Accumulated net realized gains on investments | | | 8,845,144 | |
Net unrealized gains on investments | | | 24,094,399 | |
| | | | |
Total net assets | | $ | 611,554,309 | |
| | | | |
| |
COMPUTATION OF NET ASSET VALUE AND OFFERING PRICE PER SHARE | | | | |
Net assets – Class A | | $ | 183,194,849 | |
Shares outstanding – Class A1 | | | 29,346,886 | |
Net asset value per share – Class A | | | $6.24 | |
Maximum offering price per share – Class A2 | | | $6.62 | |
Net assets – Class B | | $ | 325,929 | |
Shares outstanding – Class B1 | | | 51,996 | |
Net asset value per share – Class B | | | $6.27 | |
Net assets – Class C | | $ | 146,937,834 | |
Shares outstanding – Class C1 | | | 23,485,682 | |
Net asset value per share – Class C | | | $6.26 | |
Net assets – Administrator Class | | $ | 46,360,162 | |
Shares outstanding – Administrator Class1 | | | 7,582,222 | |
Net asset value per share – Administrator Class | | | $6.11 | |
Net assets – Institutional Class | | $ | 234,735,535 | |
Shares outstanding – Institutional Class1 | | | 38,431,210 | |
Net asset value per share – Institutional Class | | | $6.11 | |
| 1 | The Fund has an unlimited number of authorized shares. |
| 2 | Maximum offering price is computed as 100/94.25 of net asset value. On investments of $50,000 or more, the offering price is reduced. |
The accompanying notes are an integral part of these financial statements.
| | | | | | |
| Statement of operations—six months ended March 31, 2017 (unaudited) | | Wells Fargo Diversified Income Builder Fund | | | 15 | |
| | | | |
| | | | |
| |
Investment income | | | | |
Interest | | $ | 10,218,532 | |
Dividends | | | 2,048,185 | |
Securities lending income, net | | | 73,349 | |
Income from affiliated securities | | | 18,078 | |
| | | | |
Total investment income | | | 12,358,144 | |
| | | | |
| |
Expenses | | | | |
Management fee | | | 1,452,145 | |
Administration fees | | | | |
Class A | | | 181,126 | |
Class B | | | 389 | |
Class C | | | 143,645 | |
Administrator Class | | | 33,114 | |
Institutional Class | | | 109,920 | |
Shareholder servicing fees | | | | |
Class A | | | 215,626 | |
Class B | | | 463 | |
Class C | | | 171,006 | |
Administrator Class | | | 63,404 | |
Distribution fees | | | | |
Class B | | | 1,389 | |
Class C | | | 513,017 | |
Custody and accounting fees | | | 16,845 | |
Professional fees | | | 28,951 | |
Registration fees | | | 54,100 | |
Shareholder report expenses | | | 23,230 | |
Trustees’ fees and expenses | | | 7,558 | |
Other fees and expenses | | | 5,475 | |
| | | | |
Total expenses | | | 3,021,403 | |
Less: Fee waivers and/or expense reimbursements | | | (37,509 | ) |
| | | | |
Net expenses | | | 2,983,894 | |
| | | | |
Net investment income | | | 9,374,250 | |
| | | | |
| |
REALIZED AND UNREALIZED GAINS (LOSSES) ON INVESTMENTS | | | | |
| |
Net realized gains on investments | | | 8,845,570 | |
| |
Net change in unrealized gains (losses) on: | | | | |
Unaffiliated securities | | | 5,158,578 | |
Affiiliated securities | | | 609 | |
| | | | |
Net change in unrealized gains (losses) on investments | | | 5,159,187 | |
| | | | |
Net realized and unrealized gains (losses) on investments | | | 14,004,757 | |
| | | | |
Net increase in net assets resulting from operations | | $ | 23,379,007 | |
| | | | |
The accompanying notes are an integral part of these financial statements.
| | | | |
| 16 | | Wells Fargo Diversified Income Builder Fund | | Statement of changes in net assets |
| | | | | | | | | | | | | | | | |
| | | Six months ended
March 31, 2017
(unaudited) | | | Year ended
September 30, 2016 | |
| | | | |
Operations | | | | | | | | | | | | | | | | |
Net investment income | | | | | | $ | 9,374,250 | | | | | | | $ | 13,285,487 | |
Net realized gains on investments | | | | | | | 8,845,570 | | | | | | | | 3,608,586 | |
Net change in unrealized gains (losses) on investments | | | | | | | 5,159,187 | | | | | | | | 38,971,424 | |
| | | | |
Net increase in net assets resulting from operations | | | | | | | 23,379,007 | | | | | | | | 55,865,497 | |
| | | | |
| | | | |
Distributions to shareholders from | | | | | | | | | | | | | | | | |
Net investment income | | | | | | | | | | | | | | | | |
Class A | | | | | | | (3,103,915 | ) | | | | | | | (4,830,169 | ) |
Class B | | | | | | | (5,292 | ) | | | | | | | (26,929 | ) |
Class C | | | | | | | (1,950,084 | ) | | | | | | | (3,170,739 | ) |
Administrator Class | | | | | | | (976,122 | ) | | | | | | | (1,702,969 | ) |
Institutional Class | | | | | | | (3,324,303 | ) | | | | | | | (3,550,714 | ) |
Net realized gains | | | | | | | | | | | | | | | | |
Class A | | | | | | | (1,136,813 | ) | | | | | | | (4,558,034 | ) |
Class B | | | | | | | (2,603 | ) | | | | | | | (41,594 | ) |
Class C | | | | | | | (905,222 | ) | | | | | | | (3,924,833 | ) |
Administrator Class | | | | | | | (289,153 | ) | | | | | | | (1,131,639 | ) |
Institutional Class | | | | | | | (1,137,209 | ) | | | | | | | (2,810,835 | ) |
| | | | |
Total distributions to shareholders | | | | | | | (12,830,716 | ) | | | | | | | (25,748,455 | ) |
| | | | |
| | | | |
Capital share transactions | | | Shares | | | | | | | | Shares | | | | | |
Proceeds from shares sold | | | | | | | | | | | | | | | | |
Class A | | | 9,966,412 | | | | 61,353,599 | | | | 7,444,175 | | | | 43,402,347 | |
Class B | | | 784 | | | | 4,818 | | | | 9,699 | | | | 56,089 | |
Class C | | | 4,900,178 | | | | 30,199,985 | | | | 5,591,017 | | | | 32,728,412 | |
Administrator Class | | | 3,069,878 | | | | 18,484,674 | | | | 10,156,014 | | | | 57,752,782 | |
Institutional Class | | | 21,738,228 | | | | 130,934,010 | | | | 12,005,792 | | | | 68,220,100 | |
| | | | |
| | | | | | | 240,977,086 | | | | | | | | 202,159,730 | |
| | | | |
Reinvestment of distributions | | | | | | | | | | | | | | | | |
Class A | | | 645,736 | | | | 3,970,448 | | | | 1,540,577 | | | | 8,715,930 | |
Class B | | | 985 | | | | 6,070 | | | | 8,851 | | | | 49,757 | |
Class C | | | 398,611 | | | | 2,455,542 | | | | 1,039,282 | | | | 5,870,456 | |
Administrator Class | | | 202,079 | | | | 1,215,021 | | | | 501,237 | | | | 2,803,982 | |
Institutional Class | | | 624,310 | | | | 3,760,299 | | | | 916,214 | | | | 5,097,329 | |
| | | | |
| | | | | | | 11,407,380 | | | | | | | | 22,537,454 | |
| | | | |
Payment for shares redeemed | | | | | | | | | | | | | | | | |
Class A | | | (6,481,286 | ) | | | (40,313,221 | ) | | | (6,057,888 | ) | | | (35,108,089 | ) |
Class B | | | (25,573 | ) | | | (158,082 | ) | | | (186,708 | ) | | | (1,095,883 | ) |
Class C | | | (2,960,931 | ) | | | (18,265,796 | ) | | | (4,790,025 | ) | | | (27,491,552 | ) |
Administrator Class | | | (7,360,122 | ) | | | (43,833,033 | ) | | | (4,588,670 | ) | | | (25,939,656 | ) |
Institutional Class | | | (4,631,045 | ) | | | (27,793,278 | ) | | | (6,093,878 | ) | | | (34,215,881 | ) |
| | | | |
| | | | | | | (130,363,410 | ) | | | | | | | (123,851,061 | ) |
| | | | |
Net increase in net assets resulting from capital share transactions | | | | | | | 122,021,056 | | | | | | | | 100,846,123 | |
| | | | |
Total increase in net assets | | | | | | | 132,569,347 | | | | | | | | 130,963,165 | |
| | | | |
| | | | |
Net assets | | | | | | | | | | | | | | | | |
Beginning of period | | | | | | | 478,984,962 | | | | | | | | 348,021,797 | |
| | | | |
End of period | | | | | | $ | 611,554,309 | | | | | | | $ | 478,984,962 | |
| | | | |
Overdistributed net investment income | | | | | | $ | (153,910 | ) | | | | | | $ | (168,444 | ) |
| | | | |
The accompanying notes are an integral part of these financial statements.
| | | | | | |
| Financial highlights | | Wells Fargo Diversified Income Builder Fund | | | 17 | |
(For a share outstanding throughout each period)
| | | | | | | | | | | | | | | | | | | | | | | | |
| | | Six months ended
March 31, 2017 (unaudited) | | | Year ended September 30 | |
| CLASS A | | | 2016 | | | 2015 | | | 2014 | | | 2013 | | | 2012 | |
Net asset value, beginning of period | | | $6.13 | | | | $5.71 | | | | $6.37 | | | | $6.13 | | | | $6.00 | | | | $5.26 | |
Net investment income | | | 0.11 | | | | 0.20 | | | | 0.21 | | | | 0.23 | | | | 0.25 | | | | 0.28 | |
Net realized and unrealized gains (losses) on investments | | | 0.15 | | | | 0.64 | | | | (0.31 | ) | | | 0.38 | | | | 0.13 | | | | 0.74 | |
| | | | | | | | | | | | | | | | | | | | | | | | |
Total from investment operations | | | 0.26 | | | | 0.84 | | | | (0.10 | ) | | | 0.61 | | | | 0.38 | | | | 1.02 | |
Distributions to shareholders from | | | | | | | | | | | | | | | | | | | | | | | | |
Net investment income | | | (0.11 | ) | | | (0.21 | ) | | | (0.21 | ) | | | (0.23 | ) | | | (0.25 | ) | | | (0.28 | ) |
Net realized gains | | | (0.04 | ) | | | (0.21 | ) | | | (0.35 | ) | | | (0.14 | ) | | | 0.00 | | | | 0.00 | |
| | | | | | | | | | | | | | | | | | | | | | | | |
Total distributions to shareholders | | | (0.15 | ) | | | (0.42 | ) | | | (0.56 | ) | | | (0.37 | ) | | | (0.25 | ) | | | (0.28 | ) |
Net asset value, end of period | | | $6.24 | | | | $6.13 | | | | $5.71 | | | | $6.37 | | | | $6.13 | | | | $6.00 | |
Total return1 | | | 4.34 | % | | | 15.39 | % | | | (1.92 | )% | | | 10.13 | % | | | 6.37 | % | | | 19.86 | % |
Ratios to average net assets (annualized) | | | | | | | | | | | | | | | | | | | | | | | | |
Gross expenses | | | 1.06 | % | | | 1.08 | % | | | 1.11 | % | | | 1.13 | % | | | 1.12 | % | | | 1.14 | % |
Net expenses | | | 1.06 | % | | | 1.08 | % | | | 1.08 | % | | | 1.08 | % | | | 1.08 | % | | | 1.08 | % |
Net investment income | | | 3.60 | % | | | 3.55 | % | | | 3.38 | % | | | 3.60 | % | | | 4.03 | % | | | 4.93 | % |
Supplemental data | | | | | | | | | | | | | | | | | | | | | | | | |
Portfolio turnover rate | | | 26 | % | | | 38 | % | | | 63 | % | | | 52 | % | | | 60 | % | | | 72 | % |
Net assets, end of period (000s omitted) | | | $183,195 | | | | $154,496 | | | | $127,242 | | | | $143,062 | | | | $159,229 | | | | $145,156 | |
| 1 | Total return calculations do not include any sales charges. Returns for periods of less than one year are not annualized. |
The accompanying notes are an integral part of these financial statements.
| | | | |
| 18 | | Wells Fargo Diversified Income Builder Fund | | Financial highlights |
(For a share outstanding throughout each period)
| | | | | | | | | | | | | | | | | | | | | | | | |
| | | Six months ended
March 31, 2017 (unaudited) | | | Year ended September 30 | |
| CLASS B | | | 2016 | | | 2015 | | | 2014 | | | 2013 | | | 2012 | |
Net asset value, beginning of period | | | $6.15 | | | | $5.73 | | | | $6.40 | | | | $6.15 | | | | $6.02 | | | | $5.28 | |
Net investment income | | | 0.09 | 1 | | | 0.16 | 1 | | | 0.16 | 1 | | | 0.18 | 1 | | | 0.21 | 1 | | | 0.24 | 1 |
Net realized and unrealized gains (losses) on investments | | | 0.16 | | | | 0.63 | | | | (0.32 | ) | | | 0.39 | | | | 0.12 | | | | 0.74 | |
| | | | | | | | | | | | | | | | | | | | | | | | |
Total from investment operations | | | 0.25 | | | | 0.79 | | | | (0.16 | ) | | | 0.57 | | | | 0.33 | | | | 0.98 | |
Distributions to shareholders from | | | | | | | | | | | | | | | | | | | | | | | | |
Net investment income | | | (0.09 | ) | | | (0.16 | ) | | | (0.16 | ) | | | (0.18 | ) | | | (0.20 | ) | | | (0.24 | ) |
Net realized gains | | | (0.04 | ) | | | (0.21 | ) | | | (0.35 | ) | | | (0.14 | ) | | | 0.00 | | | | 0.00 | |
| | | | | | | | | | | | | | | | | | | | | | | | |
Total distributions to shareholders | | | (0.13 | ) | | | (0.37 | ) | | | (0.51 | ) | | | (0.32 | ) | | | (0.20 | ) | | | (0.24 | ) |
Net asset value, end of period | | | $6.27 | | | | $6.15 | | | | $5.73 | | | | $6.40 | | | | $6.15 | | | | $6.02 | |
Total return2 | | | 4.11 | % | | | 14.49 | % | | | (2.80 | )% | | | 9.46 | % | | | 5.57 | % | | | 18.92 | % |
Ratios to average net assets (annualized) | | | | | | | | | | | | | | | | | | | | | | | | |
Gross expenses | | | 1.81 | % | | | 1.83 | % | | | 1.86 | % | | | 1.88 | % | | | 1.87 | % | | | 1.88 | % |
Net expenses | | | 1.81 | % | | | 1.83 | % | | | 1.83 | % | | | 1.83 | % | | | 1.83 | % | | | 1.83 | % |
Net investment income | | | 2.88 | % | | | 2.80 | % | | | 2.65 | % | | | 2.86 | % | | | 3.31 | % | | | 4.21 | % |
Supplemental data | | | | | | | | | | | | | | | | | | | | | | | | |
Portfolio turnover rate | | | 26 | % | | | 38 | % | | | 63 | % | | | 52 | % | | | 60 | % | | | 72 | % |
Net assets, end of period (000s omitted) | | | $326 | | | | $466 | | | | $1,398 | | | | $3,256 | | | | $4,557 | | | | $6,449 | |
| 1 | Calculated based upon average shares outstanding |
| 2 | Total return calculations do not include any sales charges. Returns for periods of less than one year are not annualized. |
The accompanying notes are an integral part of these financial statements.
| | | | | | |
| Financial highlights | | Wells Fargo Diversified Income Builder Fund | | | 19 | |
(For a share outstanding throughout each period)
| | | | | | | | | | | | | | | | | | | | | | | | |
| | | Six months ended
March 31, 2017 (unaudited) | | | Year ended September 30 | |
| CLASS C | | | 2016 | | | 2015 | | | 2014 | | | 2013 | | | 2012 | |
Net asset value, beginning of period | | | $6.14 | | | | $5.72 | | | | $6.39 | | | | $6.14 | | | | $6.01 | | | | $5.27 | |
Net investment income | | | 0.09 | 1 | | | 0.16 | 1 | | | 0.16 | 1 | | | 0.18 | | | | 0.20 | | | | 0.24 | |
Net realized and unrealized gains (losses) on investments | | | 0.16 | | | | 0.63 | | | | (0.32 | ) | | | 0.39 | | | | 0.13 | | | | 0.74 | |
| | | | | | | | | | | | | | | | | | | | | | | | |
Total from investment operations | | | 0.25 | | | | 0.79 | | | | (0.16 | ) | | | 0.57 | | | | 0.33 | | | | 0.98 | |
Distributions to shareholders from | | | | | | | | | | | | | | | | | | | | | | | | |
Net investment income | | | (0.09 | ) | | | (0.16 | ) | | | (0.16 | ) | | | (0.18 | ) | | | (0.20 | ) | | | (0.24 | ) |
Net realized gains | | | (0.04 | ) | | | (0.21 | ) | | | (0.35 | ) | | | (0.14 | ) | | | 0.00 | | | | 0.00 | |
| | | | | | | | | | | | | | | | | | | | | | | | |
Total distributions to shareholders | | | (0.13 | ) | | | (0.37 | ) | | | (0.51 | ) | | | (0.32 | ) | | | (0.20 | ) | | | (0.24 | ) |
Net asset value, end of period | | | $6.26 | | | | $6.14 | | | | $5.72 | | | | $6.39 | | | | $6.14 | | | | $6.01 | |
Total return2 | | | 4.11 | % | | | 14.51 | % | | | (2.81 | )% | | | 9.47 | % | | | 5.58 | % | | | 18.94 | % |
Ratios to average net assets (annualized) | | | | | | | | | | | | | | | | | | | | | | | | |
Gross expenses | | | 1.81 | % | | | 1.83 | % | | | 1.86 | % | | | 1.88 | % | | | 1.87 | % | | | 1.89 | % |
Net expenses | | | 1.81 | % | | | 1.83 | % | | | 1.83 | % | | | 1.83 | % | | | 1.83 | % | | | 1.83 | % |
Net investment income | | | 2.86 | % | | | 2.80 | % | | | 2.62 | % | | | 2.85 | % | | | 3.29 | % | | | 4.18 | % |
Supplemental data | | | | | | | | | | | | | | | | | | | | | | | | |
Portfolio turnover rate | | | 26 | % | | | 38 | % | | | 63 | % | | | 52 | % | | | 60 | % | | | 72 | % |
Net assets, end of period (000s omitted) | | | $146,938 | | | | $129,856 | | | | $110,457 | | | | $111,045 | | | | $112,113 | | | | $114,896 | |
| 1 | Calculated based upon average shares outstanding |
| 2 | Total return calculations do not include any sales charges. Returns for periods of less than one year are not annualized. |
The accompanying notes are an integral part of these financial statements.
| | | | |
| 20 | | Wells Fargo Diversified Income Builder Fund | | Financial highlights |
(For a share outstanding throughout each period)
| | | | | | | | | | | | | | | | | | | | | | | | |
| | | Six months ended
March 31, 2017 (unaudited) | | | Year ended September 30 | |
| ADMINISTRATOR CLASS | | | 2016 | | | 2015 | | | 2014 | | | 2013 | | | 2012 | |
Net asset value, beginning of period | | | $6.00 | | | | $5.60 | | | | $6.25 | | | | $6.01 | | | | $5.89 | | | | $5.16 | |
Net investment income | | | 0.11 | 1 | | | 0.21 | 1 | | | 0.21 | 1 | | | 0.24 | | | | 0.26 | | | | 0.28 | |
Net realized and unrealized gains (losses) on investments | | | 0.15 | | | | 0.61 | | | | (0.30 | ) | | | 0.38 | | | | 0.12 | | | | 0.74 | |
| | | | | | | | | | | | | | | | | | | | | | | | |
Total from investment operations | | | 0.26 | | | | 0.82 | | | | (0.09 | ) | | | 0.62 | | | | 0.38 | | | | 1.02 | |
Distributions to shareholders from | | | | | | | | | | | | | | | | | | | | | | | | |
Net investment income | | | (0.11 | ) | | | (0.21 | ) | | | (0.21 | ) | | | (0.24 | ) | | | (0.26 | ) | | | (0.29 | ) |
Net realized gains | | | (0.04 | ) | | | (0.21 | ) | | | (0.35 | ) | | | (0.14 | ) | | | 0.00 | | | | 0.00 | |
| | | | | | | | | | | | | | | | | | | | | | | | |
Total distributions to shareholders | | | (0.15 | ) | | | (0.42 | ) | | | (0.56 | ) | | | (0.38 | ) | | | (0.26 | ) | | | (0.29 | ) |
Net asset value, end of period | | | $6.11 | | | | $6.00 | | | | $5.60 | | | | $6.25 | | | | $6.01 | | | | $5.89 | |
Total return2 | | | 4.48 | % | | | 15.45 | % | | | (1.69 | )% | | | 10.46 | % | | | 6.43 | % | | | 20.15 | % |
Ratios to average net assets (annualized) | | | | | | | | | | | | | | | | | | | | | | | | |
Gross expenses | | | 0.98 | % | | | 1.00 | % | | | 0.97 | % | | | 0.96 | % | | | 0.96 | % | | | 0.97 | % |
Net expenses | | | 0.90 | % | | | 0.90 | % | | | 0.90 | % | | | 0.90 | % | | | 0.90 | % | | | 0.90 | % |
Net investment income | | | 3.85 | % | | | 3.72 | % | | | 3.56 | % | | | 3.77 | % | | | 4.21 | % | | | 5.10 | % |
Supplemental data | | | | | | | | | | | | | | | | | | | | | | | | |
Portfolio turnover rate | | | 26 | % | | | 38 | % | | | 63 | % | | | 52 | % | | | 60 | % | | | 72 | % |
Net assets, end of period (000s omitted) | | | $46,360 | | | | $70,051 | | | | $31,367 | | | | $48,690 | | | | $43,135 | | | | $35,727 | |
| 1 | Calculated based upon average shares outstanding |
| 2 | Returns for periods of less than one year are not annualized. |
The accompanying notes are an integral part of these financial statements.
| | | | | | |
| Financial highlights | | Wells Fargo Diversified Income Builder Fund | | | 21 | |
(For a share outstanding throughout each period)
| | | | | | | | | | | | | | | | | | | | | | | | |
| | | Six months ended
March 31, 2017 (unaudited) | | | Year ended September 30 | |
| INSTITUTIONAL CLASS | | | 2016 | | | 2015 | | | 2014 | | | 2013 | | | 2012 | |
Net asset value, beginning of period | | | $6.00 | | | | $5.59 | | | | $6.25 | | | | $6.01 | | | | $5.88 | | | | $5.16 | |
Net investment income | | | 0.12 | 1 | | | 0.23 | | | | 0.24 | | | | 0.25 | 1 | | | 0.27 | 1 | | | 0.30 | 1 |
Net realized and unrealized gains (losses) on investments | | | 0.15 | | | | 0.61 | | | | (0.32 | ) | | | 0.38 | | | | 0.13 | | | | 0.72 | |
| | | | | | | | | | | | | | | | | | | | | | | | |
Total from investment operations | | | 0.27 | | | | 0.84 | | | | (0.08 | ) | | | 0.63 | | | | 0.40 | | | | 1.02 | |
Distributions to shareholders from | | | | | | | | | | | | | | | | | | | | | | | | |
Net investment income | | | (0.12 | ) | | | (0.22 | ) | | | (0.23 | ) | | | (0.25 | ) | | | (0.27 | ) | | | (0.30 | ) |
Net realized gains | | | (0.04 | ) | | | (0.21 | ) | | | (0.35 | ) | | | (0.14 | ) | | | 0.00 | | | | 0.00 | |
| | | | | | | | | | | | | | | | | | | | | | | | |
Total distributions to shareholders | | | (0.16 | ) | | | (0.43 | ) | | | (0.58 | ) | | | (0.39 | ) | | | (0.27 | ) | | | (0.30 | ) |
Net asset value, end of period | | | $6.11 | | | | $6.00 | | | | $5.59 | | | | $6.25 | | | | $6.01 | | | | $5.88 | |
Total return2 | | | 4.58 | % | | | 15.88 | % | | | (1.65 | )% | | | 10.68 | % | | | 6.83 | % | | | 20.18 | % |
Ratios to average net assets (annualized) | | | | | | | | | | | | | | | | | | | | | | | | |
Gross expenses | | | 0.73 | % | | | 0.75 | % | | | 0.71 | % | | | 0.70 | % | | | 0.69 | % | | | 0.71 | % |
Net expenses | | | 0.71 | % | | | 0.71 | % | | | 0.69 | % | | | 0.70 | % | | | 0.69 | % | | | 0.71 | % |
Net investment income | | | 3.93 | % | | | 3.92 | % | | | 3.76 | % | | | 3.98 | % | | | 4.43 | % | | | 5.32 | % |
Supplemental data | | | | | | | | | | | | | | | | | | | | | | | | |
Portfolio turnover rate | | | 26 | % | | | 38 | % | | | 63 | % | | | 52 | % | | | 60 | % | | | 72 | % |
Net assets, end of period (000s omitted) | | | $234,736 | | | | $124,116 | | | | $77,558 | | | | $61,133 | | | | $49,807 | | | | $59,031 | |
| 1 | Calculated based upon average shares outstanding |
| 2 | Returns for periods of less than one year are not annualized. |
The accompanying notes are an integral part of these financial statements.
| | | | |
| 22 | | Wells Fargo Diversified Income Builder Fund | | Notes to financial statements (unaudited) |
1. ORGANIZATION
Wells Fargo Funds Trust (the “Trust”), a Delaware statutory trust organized on March 10, 1999, is an open-end management investment company registered under the Investment Company Act of 1940, as amended (the “1940 Act”). As an investment company, the Trust follows the accounting and reporting guidance in Financial Accounting Standards Board (“FASB”) Accounting Standards Codification (“ASC”) Topic 946, Financial Services – Investment Companies. These financial statements report on the Wells Fargo Diversified Income Builder Fund (the “Fund”) which is a diversified series of the Trust.
2. SIGNIFICANT ACCOUNTING POLICIES
The following significant accounting policies, which are consistently followed in the preparation of the financial statements of the Fund, are in conformity with U.S. generally accepted accounting principles which require management to make estimates and assumptions that affect the reported amounts of assets and liabilities, disclosure of contingent assets and liabilities at the date of the financial statements, and the reported amounts of revenues and expenses during the reporting period. Actual results could differ from those estimates.
Securities valuation
All investments are valued each business day as of the close of regular trading on the New York Stock Exchange (generally 4 p.m. Eastern Time), although the Fund may deviate from this calculation time under unusual or unexpected circumstances.
Debt securities are valued at the evaluated bid price provided by an independent pricing service or, if a reliable price is not available, the quoted bid price from an independent broker-dealer.
Equity securities that are listed on a foreign or domestic exchange or market are valued at the official closing price or, if none, the last sales price. If no sale occurs on the principal exchange or market that day, the prior day’s price will be deemed “stale” and a fair value price will be determined in accordance with the Fund’s Valuation Procedures.
Investments in registered open-end investment companies are valued at net asset value. Interests in non-registered investment companies that are redeemable at net asset value are fair valued normally at net asset value.
Investments which are not valued using any of the methods discussed above are valued at their fair value, as determined in good faith by the Board of Trustees of the Fund. The Board of Trustees has established a Valuation Committee comprised of the Trustees and has delegated to it the authority to take any actions regarding the valuation of portfolio securities that the Valuation Committee deems necessary or appropriate, including determining the fair value of portfolio securities, unless the determination has been delegated to the Management Valuation Team of Wells Fargo Funds Management, LLC (“Funds Management”). The Board of Trustees retains the authority to make or ratify any valuation decisions or approve any changes to the Valuation Procedures as it deems appropriate. On a quarterly basis, the Board of Trustees receives reports on any valuation actions taken by the Valuation Committee or the Management Valuation Team which may include items for ratification.
Valuations of fair valued securities are compared to the next actual sales price when available, or other appropriate market values, to assess the continued appropriateness of the fair valuation methodologies used. These securities are fair valued on a day-to-day basis, taking into consideration changes to appropriate market information and any significant changes to the inputs considered in the valuation process until there is a readily available price provided on an exchange or by an independent pricing service. Valuations received from an independent pricing service or independent broker-dealer quotes are periodically validated by comparisons to most recent trades and valuations provided by other independent pricing services in addition to the review of prices by the manager and/or subadviser. Unobservable inputs used in determining fair valuations are identified based on the type of security, taking into consideration factors utilized by market participants in valuing the investment, knowledge about the issuer and the current market environment.
Security loans
The Fund may lend its securities from time to time in order to earn additional income in the form of fees or interest on securities received as collateral or the investment of any cash received as collateral. The Fund continues to receive interest or dividends on the securities loaned. The Fund receives collateral in the form of cash or securities with a value at least equal to the value of the securities on loan. The value of the loaned securities is determined at the close of each business day and any additional required collateral is delivered to the Fund on the next business day. In a securities lending transaction, the net asset value of the Fund will be affected by an increase or decrease in the value of the securities loaned and by an increase or decrease in the value of the instrument in which collateral is invested. The amount of securities lending activity undertaken by the Fund fluctuates from time to time. In the event of default or bankruptcy
| | | | | | |
| Notes to financial statements (unaudited) | | Wells Fargo Diversified Income Builder Fund | | | 23 | |
by the borrower, the Fund may be prevented from recovering the loaned securities or gaining access to the collateral or may experience delays or costs in doing so. In addition, the investment of any cash collateral received may lose all or part of its value. The Fund has the right under the lending agreement to recover the securities from the borrower on demand.
The Fund lends its securities through an unaffiliated securities lending agent. Cash collateral received in connection with its securities lending transactions is invested in Securities Lending Cash Investments, LLC (the “Securities Lending Fund”). The Securities Lending Fund is exempt from registration under Section 3(c)(7) of the 1940 Act and is managed by Funds Management and is subadvised by Wells Capital Management Incorporated (“WellsCap”), an affiliate of Funds Management and an indirect wholly owned subsidiary of Wells Fargo & Company (“Wells Fargo”). Funds Management receives an advisory fee starting at 0.05% and declining to 0.01% as the average daily net assets of the Securities Lending Fund increase. All of the fees received by Funds Management are paid to WellsCap for its services as subadviser. The Securities Lending Fund seeks to provide a positive return compared to the daily Fed Funds Open Rate by investing in high-quality, U.S. dollar-denominated short-term money market instruments. Securities Lending Fund investments are valued at the evaluated bid price provided by an independent pricing service. Income earned from investment in the Securities Lending Fund is included in securities lending income on the Statement of Operations.
When-issued transactions
The Fund may purchase securities on a forward commitment or when-issued basis. The Fund records a when-issued transaction on the trade date and will segregate assets in an amount at least equal in value to the Fund’s commitment to purchase when-issued securities. Securities purchased on a when-issued basis are marked-to-market daily and the Fund begins earning interest on the settlement date. Losses may arise due to changes in the market value of the underlying securities or if the counterparty does not perform under the contract.
Security transactions and income recognition
Securities transactions are recorded on a trade date basis. Realized gains or losses are recorded on the basis of identified cost.
Interest income is accrued daily and bond discounts are accreted and premiums are amortized daily based on the effective interest method. To the extent debt obligations are placed on non-accrual status, any related interest income may be reduced by writing off interest receivables when the collection of all or a portion of interest has been determined to be doubtful based on consistently applied procedures and the fair value has decreased. If the issuer subsequently resumes interest payments or when the collectability of interest is reasonably assured, the debt obligation is removed from non-accrual status.
Dividend income is recognized on the ex-dividend date.
Distributions to shareholders
Distributions to shareholders from net investment income are accrued daily and paid monthly. Distributions from net realized gains, if any, are recorded on the ex-dividend date. Such distributions are determined in accordance with income tax regulations and may differ from U.S. generally accepted accounting principles. Dividend sources are estimated at the time of declaration. The tax character of distributions is determined as of the Fund’s fiscal year end. Therefore, a portion of the Fund’s distributions made prior the Fund’s fiscal year end may be categorized as a tax return of capital.
Federal and other taxes
The Fund intends to continue to qualify as a regulated investment company by distributing substantially all of its investment company taxable income and any net realized capital gains (after reduction for capital loss carryforwards) sufficient to relieve it from all, or substantially all, federal income taxes. Accordingly, no provision for federal income taxes was required.
The Fund’s income and federal excise tax returns and all financial records supporting those returns for the prior three fiscal years are subject to examination by the federal and Delaware revenue authorities. Management has analyzed the Fund’s tax positions taken on federal, state, and foreign tax returns for all open tax years and does not believe that there are any uncertain tax positions that require recognition of a tax liability.
Class allocations
The separate classes of shares offered by the Fund differ principally in applicable sales charges, distribution, shareholder servicing, and administration fees. Class specific expenses are charged directly to that share class. Investment income, common expenses, and realized and unrealized gains (losses) on investments are allocated daily to each class of shares based on the relative proportion of net assets of each class.
| | | | |
| 24 | | Wells Fargo Diversified Income Builder Fund | | Notes to financial statements (unaudited) |
3. FAIR VALUATION MEASUREMENTS
Fair value measurements of investments are determined within a framework that has established a fair value hierarchy based upon the various data inputs utilized in determining the value of the Fund’s investments. The three-level hierarchy gives the highest priority to unadjusted quoted prices in active markets for identical assets or liabilities (Level 1) and the lowest priority to unobservable inputs (Level 3). The Fund’s investments are classified within the fair value hierarchy based on the lowest level of input that is significant to the fair value measurement. The inputs are summarized into three broad levels as follows:
| ∎ | | Level 1 – quoted prices in active markets for identical securities |
| ∎ | | Level 2 – other significant observable inputs (including quoted prices for similar securities, interest rates, prepayment speeds, credit risk, etc.) |
| ∎ | | Level 3 – significant unobservable inputs (including the Fund’s own assumptions in determining the fair value of investments) |
The inputs or methodologies used for valuing investments in securities are not necessarily an indication of the risk associated with investing in those securities.
The following is a summary of the inputs used in valuing the Fund’s assets and liabilities as of March 31, 2017:
| | | | | | | | | | | | | | | | |
| | | Quoted prices
(Level 1) | | | Other significant
observable inputs (Level 2) | | | Significant
unobservable inputs (Level 3) | | | Total | |
Assets | | | | | | | | | | | | | | | | |
Investments in: | | | | | | | | | | | | | | | | |
| | | | |
Common stocks | | | | | | | | | | | | | | | | |
Consumer discretionary | | $ | 6,111,350 | | | $ | 0 | | | $ | 0 | | | $ | 6,111,350 | |
Consumer staples | | | 25,914,550 | | | | 0 | | | | 0 | | | | 25,914,550 | |
Energy | | | 35,240,550 | | | | 0 | | | | 0 | | | | 35,240,550 | |
Health care | | | 4,082,000 | | | | 0 | | | | 0 | | | | 4,082,000 | |
Industrials | | | 17,766,150 | | | | 0 | | | | 0 | | | | 17,766,150 | |
Information technology | | | 50,212,900 | | | | 0 | | | | 0 | | | | 50,212,900 | |
Materials | | | 8,981,550 | | | | 0 | | | | 0 | | | | 8,981,550 | |
Real estate | | | 21,385,250 | | | | 0 | | | | 0 | | | | 21,385,250 | |
Utilities | | | 6,319,200 | | | | 0 | | | | 0 | | | | 6,319,200 | |
| | | | |
Corporate bonds and notes | | | 0 | | | | 388,830,804 | | | | 0 | | | | 388,830,804 | |
| | | | |
Yankee corporate bonds and notes | | | 0 | | | | 37,080,732 | | | | 0 | | | | 37,080,732 | |
| | | | |
Short-term investments | | | | | | | | | | | | | | | | |
Investment companies | | | 4,250,236 | | | | 0 | | | | 0 | | | | 4,250,236 | |
Investments measured at net asset value* | | | | | | | | | | | | | | | 23,965,519 | |
Total assets | | $ | 180,263,736 | | | $ | 425,911,536 | | | $ | 0 | | | $ | 630,140,791 | |
| * | Investments that are measured at fair value using the net asset value per share (or its equivalent) as a practical expedient have not been categorized in the fair value hierarchy. The fair value amount presented in the table is intended to permit reconciliation of the fair value hierarchy to the amounts presented in the Statement of Assets and Liabilities. The Fund’s investment in Securities Lending Cash Investments, LLC valued at $23,965,519 does not have a redemption period notice, can be redeemed daily and does not have any unfunded commitments. |
The Fund recognizes transfers between levels within the fair value hierarchy at the end of the reporting period. At March 31, 2017, the Fund did not have any transfers into/out of Level 1, Level 2, or Level 3.
4. TRANSACTIONS WITH AFFILIATES AND OTHER EXPENSES
Management fee
Funds Management, an indirect wholly owned subsidiary of Wells Fargo, is the manager of the Fund and provides advisory and fund-level administrative services under an investment management agreement. Under the investment management agreement, Funds Management is responsible for, among other services, implementing the investment objectives and strategies of the Fund, supervising the subadviser, providing fund-level administrative services in
| | | | | | |
| Notes to financial statements (unaudited) | | Wells Fargo Diversified Income Builder Fund | | | 25 | |
connection with the Fund’s operations, and providing any other fund-level administrative services reasonably necessary for the operation of the Fund. As compensation for its services under the investment management agreement, Funds Management is entitled to receive an annual management fee starting at 0.55% and declining to 0.43% as the average daily net assets of the Fund increase. For the six months ended March 31, 2017, the management fee was equivalent to an annual rate of 0.55% of the Fund’s average daily net assets.
Funds Management has retained the services of a subadviser to provide daily portfolio management to the Fund. The fee for subadvisory services is borne by Funds Management. WellsCap is the subadviser to the Fund and is entitled to receive a fee from Funds Management at an annual rate starting at 0.35% and declining to 0.20% as the average daily net assets of the Fund increase
Administration fees
Under a class-level administration agreement, Funds Management provides class-level administrative services to the Fund, which includes paying fees and expenses for services provided by the transfer agent, sub-transfer agents, omnibus account servicers and record-keepers. As compensation for its services under the class-level administration agreement, Funds Management receives an annual fee which is calculated based on the average daily net assets of each class as follows:
| | | | |
| | | Class-level
administration fee | |
Class A, Class B, Class C | | | 0.21 | % |
Administrator Class, Institutional Class | | | 0.13 | |
Funds Management has contractually waived and/or reimbursed management and administration fees to the extent necessary to maintain certain net operating expense ratios for the Fund. Waiver of fees and/or reimbursement of expenses by Funds Management were made first from fund level expenses on a proportionate basis and then from class specific expenses. Funds Management has committed through January 31, 2018 to waive fees and/or reimburse expenses to the extent necessary to cap the Fund’s expenses at 1.08% for Class A shares, 1.83% for Class B shares, 1.83% for Class C shares, 0.90% for Administrator Class shares, and 0.71% for Institutional Class shares. After this time, the cap may be increased or the commitment to maintain the cap may be terminated only with the approval of the Board of Trustees.
During the six months ended March 31, 2017, State Street Bank and Trust Company, the Fund’s custodian, reimbursed the Fund $13,663 for certain out-of-pocket expenses that were billed to the Fund in error from 1998-2015. This amount is included in interest income on the Statement of Operations. In addition, Funds Management was also reimbursed $10,871 for waivers/reimbursements it made to the Fund during the period the Fund was erroneously billed.
Distribution fees
The Trust has adopted a distribution plan for Class B and Class C shares of the Fund pursuant to Rule 12b-1 under the 1940 Act. Distribution fees are charged to Class B and Class C shares and paid to Wells Fargo Funds Distributor, LLC (“Funds Distributor”), the principal underwriter, at an annual rate of 0.75% of the average daily net assets of Class B and Class C shares.
In addition, Funds Distributor is entitled to receive the front-end sales charge from the purchase of Class A shares and a contingent deferred sales charge on the redemption of certain Class A shares. Funds Distributor is also entitled to receive the contingent deferred sales charges from redemptions of Class B and Class C shares. For the six months ended March 31, 2017, Funds Distributor received $56,255 from the sale of Class A shares and $124 in contingent deferred sales charges from redemptions of Class C shares.
Shareholder servicing fees
The Trust has entered into contracts with one or more shareholder servicing agents, whereby Class A, Class B, Class C, and Administrator Class of the Fund are charged a fee at an annual rate of 0.25% of the average daily net assets of each respective class.
A portion of these total shareholder servicing fees were paid to affiliates of Wells Fargo.
| | | | |
| 26 | | Wells Fargo Diversified Income Builder Fund | | Notes to financial statements (unaudited) |
5. INVESTMENT PORTFOLIO TRANSACTIONS
Purchases and sales of investments, excluding U.S. government obligations (if any) and short-term securities, for the six months ended March 31, 2017 were $279,899,666 and $142,775,826 respectively.
The Fund may purchase or sell investment securities to other Wells Fargo affiliates pursuant to Rule 17a-7 of the 1940 Act and under procedures adopted by the Board of Trustees. The procedures have been designed to ensure that these interfund transactions, which generally do not incur broker commissions, are effected at current market prices. Interfund trades are included within the respective purchases and sales amounts shown.
6. BANK BORROWINGS
The Trust (excluding the money market funds and certain other funds) and Wells Fargo Variable Trust are parties to a $250,000,000 revolving credit agreement whereby the Fund is permitted to use bank borrowings for temporary or emergency purposes, such as to fund shareholder redemption requests. Interest under the credit agreement is charged to the Fund based on a borrowing rate equal to the higher of the Federal Funds rate in effect on that day plus 1.25% or the overnight LIBOR rate in effect on that day plus 1.25%. In addition, an annual commitment fee equal to 0.25% of the unused balance is allocated to each participating fund.
For the six months ended March 31, 2017, there were no borrowings by the Fund under the agreement.
7. INDEMNIFICATION
Under the Trust’s organizational documents, the officers and Trustees have been granted certain indemnification rights against certain liabilities that may arise out of performance of their duties to the Trust. Additionally, in the normal course of business, the Trust may enter into contracts with service providers that contain a variety of indemnification clauses. The Trust’s maximum exposure under these arrangements is dependent on future claims that may be made against the Fund and, therefore, cannot be estimated.
8. NEW ACCOUNTING PRONOUNCEMENT
In December 2016, FASB issued Accounting Standards Update (“ASU”) No. 2016-19, Technical Corrections and Improvements. ASU 2016-19 includes an amendment to FASB ASC Topic 820, Fair Value Measurement which clarifies the difference between a valuation approach and a valuation technique. The amendment also requires an entity to disclose when there has been a change in either or both a valuation approach and/or a valuation technique. The disclosure requirements are effective for fiscal years and interim periods within those fiscal years beginning after December 15, 2016. Management is currently evaluating the potential impact of this new guidance to the financial statements.
9. REGULATORY CHANGES
In October 2016, the Securities and Exchange Commission (“SEC”) adopted new rules and forms and amended existing rules and forms (together, “final rules”) intended to modernize and enhance the reporting and disclosure of information by registered investment companies and to enhance liquidity risk management by open-end mutual funds and exchange-traded funds. The final rules will enhance the quality of information available to investors and will allow the SEC to more effectively collect and use data reported by funds. In part, the final rules amend Regulation S-X and require standardized, enhanced disclosure about derivatives in the Fund’s financial statements, as well as other amendments. The compliance date for the amendments to Regulation S-X is August 1, 2017 while the compliance date for the new form types is June 1, 2018 and the compliance date for the liquidity risk management program requirements is December 1, 2018. Management is currently assessing the potential impact of these enhancements and their impact on the financial statement disclosures and reporting requirements.
| | | | | | |
| Other information (unaudited) | | Wells Fargo Diversified Income Builder Fund | | | 27 | |
PROXY VOTING INFORMATION
A description of the policies and procedures that the Fund uses to determine how to vote proxies relating to portfolio securities is available, upon request, by calling 1-800-222-8222, visiting our website at wellsfargofunds.com, or visiting the SEC website at sec.gov. Information regarding how the Fund voted proxies relating to portfolio securities during the most recent 12-month period ended June 30 is available on the Fund’s website at wellsfargofunds.com or by visiting the SEC website at sec.gov.
PORTFOLIO HOLDINGS INFORMATION
The complete portfolio holdings for the Fund are publicly available monthly on the Fund’s website (wellsfargofunds.com), on a one-month delayed basis. In addition, top ten holdings information (excluding derivative positions) for the Fund is publicly available on the Fund’s website on a monthly, seven-day or more delayed basis. The Fund files its complete schedule of portfolio holdings with the SEC for the first and third quarters of each fiscal year on Form N-Q, which is available by visiting the SEC website at sec.gov. In addition, the Fund’s Form N-Q may be reviewed and copied at the SEC’s Public Reference Room in Washington, DC, and at regional offices in New York City, at 233 Broadway, and in Chicago, at 175 West Jackson Boulevard, Suite 900. Information about the Public Reference Room may be obtained by calling 1-800-SEC-0330.
| | | | |
| 28 | | Wells Fargo Diversified Income Builder Fund | | Other information (unaudited) |
BOARD OF TRUSTEES AND OFFICERS
Each of the Trustees and Officers1 listed in the table below acts in identical capacities for each fund in the Wells Fargo family of funds, which consists of 138 mutual funds comprising the Wells Fargo Funds Trust, Wells Fargo Variable Trust, Wells Fargo Master Trust and four closed-end funds (collectively the “Fund Complex”). This table should be read in conjunction with the Prospectus and the Statement of Additional Information2. The mailing address of each Trustee and Officer is 525 Market Street, 12th Floor, San Francisco, CA 94105. Each Trustee and Officer serves an indefinite term, however, each Trustee serves such term until reaching the mandatory retirement age established by the Trustees.
Independent Trustees
| | | | | | |
| Name and | | Position held and | | Principal occupations during past five years or longer | | Current other public company or investment company |
William R. Ebsworth (Born 1957) | | Trustee, since 2015 | | Retired. From 1984 to 2013, equities analyst, portfolio manager, research director and chief financial officer at Fidelity Management and Research Company in Boston, Tokyo, and Hong Kong and retired in 2013 as Chief Investment Officer of Fidelity Strategic Advisers, Inc. where he lead a team of investment professionals managing client assets. Prior thereto, Board member of Hong Kong Securities Clearing Co., Hong Kong Options Clearing Corp., the Thailand International Fund, Ltd., Fidelity Investments Life Insurance Company, and Empire Fidelity Investments Life Insurance Company. Board member of the Fonté Foundation (non-profit organization) and the Vincent Memorial Hospital Endowment (non-profit organization), where he serves on the Investment Committee and as a Chair of the Audit Committee. Mr. Ebsworth is a CFA® charterholder and an Adjunct Lecturer, Finance, at Babson College. | | Asset Allocation Trust |
Jane A. Freeman (Born 1953) | | Trustee, since 2015 | | Retired. From 2012 to 2014 and 1999 to 2008, Chief Financial Officer of Scientific Learning Corporation. From 2008 to 2012, Ms. Freeman provided consulting services related to strategic business projects. Prior to 1999, Portfolio Manager at Rockefeller & Co. and Scudder, Stevens & Clark. Board member of the Harding Loevner Funds from 1996 to 2014, serving as both Lead Independent Director and chair of the Audit Committee. Board member of the Russell Exchange Traded Funds Trust from 2011 to 2012 and the chair of the Audit Committee. Ms. Freeman is Chair of Taproot Foundation (non-profit organization), a Board Member of Ruth Bancroft Garden (non-profit organization) and an inactive chartered financial analyst. | | Asset Allocation Trust |
Peter G. Gordon** (Born 1942) | | Trustee, since 1998; Chairman, since 2005 | | Co-Founder, Retired Chairman, President and CEO of Crystal Geyser Water Company. Trustee Emeritus, Colby College. | | Asset Allocation Trust |
Isaiah Harris, Jr. (Born 1952) | | Trustee, since 2009 | | Retired. Chairman of the Board of CIGNA Corporation since 2009, and Director since 2005. From 2003 to 2011, Director of Deluxe Corporation. Prior thereto, President and CEO of BellSouth Advertising and Publishing Corp. from 2005 to 2007, President and CEO of BellSouth Enterprises from 2004 to 2005 and President of BellSouth Consumer Services from 2000 to 2003. Emeritus member of the Iowa State University Foundation Board of Governors. Emeritus Member of the Advisory Board of Iowa State University School of Business. Advisory Board Member, Palm Harbor Academy (charter school). Advisory Board Member, Child Evangelism Fellowship (non-profit). Mr. Harris is a certified public accountant (inactive status). | | CIGNA Corporation; Asset Allocation Trust |
| Judith M. Johnson (Born 1949) | | Trustee, since 2008; Audit Committee Chairman, since 2008 | | Retired. Prior thereto, Chief Executive Officer and Chief Investment Officer of Minneapolis Employees Retirement Fund from 1996 to 2008. Ms. Johnson is an attorney, certified public accountant and a certified managerial accountant. | | Asset Allocation Trust |
| David F. Larcker (Born 1950) | | Trustee, since 2009 | | James Irvin Miller Professor of Accounting at the Graduate School of Business, Stanford University, Director of the Corporate Governance Research Initiative and Senior Faculty of The Rock Center for Corporate Governance since 2006. From 2005 to 2008, Professor of Accounting at the Graduate School of Business, Stanford University. Prior thereto, Ernst & Young Professor of Accounting at The Wharton School, University of Pennsylvania from 1985 to 2005. | | Asset Allocation Trust |
| | | | | | |
| Other information (unaudited) | | Wells Fargo Diversified Income Builder Fund | | | 29 | |
| | | | | | |
| Name and | | Position held and | | Principal occupations during past five years or longer | | Current other public company or investment company |
| Olivia S. Mitchell (Born 1953) | | Trustee, since 2006 | | International Foundation of Employee Benefit Plans Professor, Wharton School of the University of Pennsylvania since 1993. Director of Wharton’s Pension Research Council and Boettner Center on Pensions & Retirement Research, and Research Associate at the National Bureau of Economic Research. Previously, Cornell University Professor from 1978 to 1993. | | Asset Allocation Trust |
| Timothy J. Penny (Born 1951) | | Trustee, since 1996 | | President and Chief Executive Officer of Southern Minnesota Initiative Foundation, a non-profit organization, since 2007 and Senior Fellow at the Humphrey Institute Policy Forum at the University of Minnesota since 1995. Member of the Board of Trustees of NorthStar Education Finance, Inc., a non-profit organization, since 2007. | | Asset Allocation Trust |
| Michael S. Scofield (Born 1943) | | Trustee, since 2010 | | Served on the Investment Company Institute’s Board of Governors and Executive Committee from 2008-2011 as well the Governing Council of the Independent Directors Council from 2006-2011 and the Independent Directors Council Executive Committee from 2008-2011. Chairman of the IDC from 2008-2010. Institutional Investor (Fund Directions) Trustee of Year in 2007. Trustee of the Evergreen Funds complex (and its predecessors) from 1984 to 2010. Chairman of the Evergreen Funds from 2000-2010. Former Trustee of the Mentor Funds. Retired Attorney, Law Offices of Michael S. Scofield. | | Asset Allocation Trust |
| * | Length of service dates reflect the Trustee’s commencement of service with the Trust’s predecessor entities, where applicable. |
| ** | Peter Gordon is expected to retire on December 31, 2017. |
Officers
| | | | | | |
Name and year of birth | | Position held and
length of service | | Principal occupations during past five years or longer | | |
Andrew Owen (Born 1960) | | President, since 2017 | | Executive Vice President of Wells Fargo Bank, N.A. and President of Wells Fargo & Company and Head of Affiliated Managers, Wells Fargo Asset Management, since 2014. Executive Vice President responsible for marketing, investments and product development for Wells Fargo Funds Management, LLC, from 2009 to 2014. | | |
Jeremy DePalma1 (Born 1974) | | Treasurer, since 2012 | | Senior Vice President of Wells Fargo Funds Management, LLC since 2009. Senior Vice President of Evergreen Investment Management Company, LLC from 2008 to 2010 and head of the Fund Reporting and Control Team within Fund Administration from 2005 to 2010. | | |
| C. David Messman (Born 1960) | | Secretary, since 2000; Chief Legal Officer, since 2003 | | Senior Vice President and Secretary of Wells Fargo Funds Management, LLC since 2001. Assistant General Counsel of Wells Fargo Bank, N.A. since 2013 and Vice President and Managing Counsel of Wells Fargo Bank, N.A. from 1996 to 2013. | | |
Michael Whitaker (Born 1967) | | Chief Compliance Officer, since 2016 | | Executive Vice President of Wells Fargo Funds Management, LLC since 2016. Chief Compliance Officer of Fidelity’s Fixed Income Funds and Asset Allocation Funds from 2008 to 2016, Compliance Officer of FMR Co., Inc. from 2014 to 2016, Fidelity Investments Money Management, Inc. from 2014 to 2016, Fidelity Investments from 2007 to 2016. | | |
David Berardi (Born 1975) | | Assistant Treasurer, since 2009 | | Vice President of Wells Fargo Funds Management, LLC since 2009. Vice President of Evergreen Investment Management Company, LLC from 2008 to 2010. Manager of Fund Reporting and Control for Evergreen Investment Management Company, LLC from 2004 to 2010. | | |
| 1 | Jeremy DePalma acts as Treasurer of 69 funds and Assistant Treasurer of 69 funds in the Fund Complex. |
| 2 | The Statement of Additional Information includes additional information about the Trustees and is available, without charge, upon request, by calling 1-800-222-8222 or by visiting the website at wellsfargofunds.com. |
| | | | |
| 30 | | Wells Fargo Diversified Income Builder Fund | | List of abbreviations |
The following is a list of common abbreviations for terms and entities that may have appeared in this report.
| ACA | — ACA Financial Guaranty Corporation |
| ADR | — American depositary receipt |
| ADS | — American depositary shares |
| AGC | — Assured Guaranty Corporation |
| AGM | — Assured Guaranty Municipal |
| Ambac | — Ambac Financial Group Incorporated |
| AMT | — Alternative minimum tax |
| BAN | — Bond anticipation notes |
| BHAC | — Berkshire Hathaway Assurance Corporation |
| CAB | — Capital appreciation bond |
| CCAB | — Convertible capital appreciation bond |
| CDA | — Community Development Authority |
| CDO | — Collateralized debt obligation |
| DRIVER | — Derivative inverse tax-exempt receipts |
| DW&P | — Department of Water & Power |
| DWR | — Department of Water Resources |
| ECFA | — Educational & Cultural Facilities Authority |
| EDA | — Economic Development Authority |
| EDFA | — Economic Development Finance Authority |
| ETF | — Exchange-traded fund |
| FDIC | — Federal Deposit Insurance Corporation |
| FFCB | — Federal Farm Credit Banks |
| FGIC | — Financial Guaranty Insurance Corporation |
| FHA | — Federal Housing Administration |
| FHLB | — Federal Home Loan Bank |
| FHLMC | — Federal Home Loan Mortgage Corporation |
| FICO | — The Financing Corporation |
| FNMA | — Federal National Mortgage Association |
| GDR | — Global depositary receipt |
| GNMA | — Government National Mortgage Association |
| HCFR | — Healthcare facilities revenue |
| HEFA | — Health & Educational Facilities Authority |
| HEFAR | — Higher education facilities authority revenue |
| HFA | — Housing Finance Authority |
| HFFA | — Health Facilities Financing Authority |
| HUD | — Department of Housing and Urban Development |
| IDA | — Industrial Development Authority |
| IDAG | — Industrial Development Agency |
| KRW | — Republic of Korea won |
| LIBOR | — London Interbank Offered Rate |
| LIFER | — Long Inverse Floating Exempt Receipts |
| LLC | — Limited liability company |
| LLLP | — Limited liability limited partnership |
| LLP | — Limited liability partnership |
| MBIA | — Municipal Bond Insurance Association |
| MFHR | — Multifamily housing revenue |
| MSTR | — Municipal securities trust receipts |
| MUD | — Municipal Utility District |
| National | — National Public Finance Guarantee Corporation |
| PCFA | — Pollution Control Financing Authority |
| PCL | — Public Company Limited |
| PCR | — Pollution control revenue |
| PFA | — Public Finance Authority |
| PFFA | — Public Facilities Financing Authority |
| PFOTER | — Puttable floating option tax-exempt receipts |
| plc | — Public limited company |
| PUTTER | — Puttable tax-exempt receipts |
| R&D | — Research & development |
| Radian | — Radian Asset Assurance |
| RAN | — Revenue anticipation notes |
| RDA | — Redevelopment Authority |
| RDFA | — Redevelopment Finance Authority |
| REIT | — Real estate investment trust |
| ROC | — Reset option certificates |
| SAVRS | — Select auction variable rate securities |
| SBA | — Small Business Authority |
| SDR | — Swedish depositary receipt |
| SFHR | — Single-family housing revenue |
| SFMR | — Single-family mortgage revenue |
| SPA | — Standby purchase agreement |
| SPDR | — Standard & Poor’s Depositary Receipts |
| SPEAR | — Short Puttable Exempt Adjustable Receipts |
| STRIPS | — Separate trading of registered interest and |
| TAN | — Tax anticipation notes |
| TIPS | — Treasury inflation-protected securities |
| TRAN | — Tax revenue anticipation notes |
| TTFA | — Transportation Trust Fund Authority |
| TVA | — Tennessee Valley Authority |
This page is intentionally left blank.
This page is intentionally left blank.

For more information
More information about Wells Fargo Funds is available free upon request. To obtain literature, please write, email, visit the Fund’s website, or call:
Wells Fargo Funds
P.O. Box 8266
Boston, MA 02266-8266
Email: fundservice@wellsfargo.com
Website: wellsfargofunds.com
Individual investors: 1-800-222-8222
Retail investment professionals: 1-888-877-9275
Institutional investment professionals: 1-866-765-0778
This report and the financial statements contained herein are submitted for the general information of the shareholders of the Fund. If this report is used for promotional purposes, distribution of the report must be accompanied or preceded by a current prospectus. Before investing, please consider the investment objectives, risks, charges, and expenses of the investment. For a current prospectus and, if available, a summary prospectus, containing this information, call 1-800-222-8222 or visit the Fund’s website at wellsfargofunds.com. Read the prospectus carefully before you invest or send money.
Wells Fargo Asset Management (WFAM) is a trade name used by the asset management businesses of Wells Fargo & Company. Wells Fargo Funds Management, LLC, a wholly owned subsidiary of Wells Fargo & Company, provides investment advisory and administrative services for Wells Fargo Funds. Other affiliates of Wells Fargo & Company provide subadvisory and other services for the funds. The funds are distributed by Wells Fargo Funds Distributor, LLC, Member FINRA, an affiliate of Wells Fargo & Company. Neither Wells Fargo Funds Management nor Wells Fargo Funds Distributor has Fund customer accounts/assets, and neither provides investment advice/recommendations or acts as an investment advice fiduciary to any investor.
NOT FDIC INSURED ◾ NO BANK GUARANTEE ◾ MAY LOSE VALUE
© 2017 Wells Fargo Funds Management, LLC. All rights reserved.
| | |
 | | 302882 05-17 SA226/SAR226 03-17 |
Semi-Annual Report
March 31, 2017

Wells Fargo Index Asset Allocation Fund


Reduce clutter. Save trees.
Sign up for electronic delivery of prospectuses and shareholder reports at wellsfargo.com/advantagedelivery
Contents
The views expressed and any forward-looking statements are as of March 31, 2017, unless otherwise noted, and are those of the Fund managers and/or Wells Fargo Funds Management, LLC. Discussions of individual securities, or the markets generally, or any Wells Fargo Fund are not intended as individual recommendations. Future events or results may vary significantly from those expressed in any forward-looking statements. The views expressed are subject to change at any time in response to changing circumstances in the market. Wells Fargo Funds Management, LLC and the Fund disclaim any obligation to publicly update or revise any views expressed or forward-looking statements.
NOT FDIC INSURED ◾ NO BANK GUARANTEE ◾ MAY LOSE VALUE
| | | | |
| 2 | | Wells Fargo Index Asset Allocation Fund | | Letter to shareholders (unaudited) |

Andrew Owen
President
Wells Fargo Funds
U.S. and international stocks returned 10.12% and 8.18% for the six-month period; within fixed income, the Bloomberg Barclays U.S. Aggregate Bond Index3 returned -2.18%.
Dear Shareholder:
As the new president of Wells Fargo Funds now that Karla Rabusch is retiring from that position after nearly 14 years, I am pleased to offer you this semi-annual report for the Wells Fargo Index Asset Allocation Fund for the six-month period that ended March 31, 2017. During this period, global stocks delivered favorable results overall. U.S. and international stocks returned 10.12% and 8.18% for the six-month period, respectively, as measured by the S&P 500 Index1 and the MSCI ACWI ex USA Index (Net)2; within fixed income, the Bloomberg Barclays U.S. Aggregate Bond Index3 returned -2.18%.
During the fourth quarter of 2016, prospects for faster growth and higher interest rates in the U.S. influenced markets.
Early in the fourth quarter of 2016, U.S. stocks tended to trade lower amid concerns such as a likely interest-rate increase and uncertainty over the approaching general election. However, following Donald Trump’s election as president in early November, U.S. stocks began to rally. Investors appeared optimistic that the new administration would usher in a series of progrowth policies, and supportive economic news helped the rally carry through the quarter. The buoyant environment sent interest rates higher as well. At its mid-December meeting, Fed officials raised their short-term target interest rate for the first time in a year by a quarter percentage point to between 0.50% and 0.75%. The fourth quarter also saw the implementation of the U.S. Securities and Exchange Commission’s new rules for money market funds, which included floating net asset values (NAVs) for institutional prime and municipal money market funds as well as liquidity fees and redemption gates. In the year leading up to money market fund reform implementation, nearly $1 trillion in assets moved from these types of money market funds into government money market funds, which continued to transact at a stable $1 NAV. Outside of the U.S., the prospects for faster U.S. growth appeared to trigger some acceleration in Europe. The improvement may be partly attributable to expectations for further strengthening of the U.S. dollar, which in turn could improve demand for European goods in the U.S. due to weakening of the euro relative to the dollar.
Globally, stocks delivered positive results and economies showed some improvement in the first quarter of 2017.
Stocks rallied globally through the first quarter of 2017, supported by signs of improvement in the U.S. and global economies. U.S. economic data released during the quarter reflected a healthy economy. Hiring remained strong, and business and consumer sentiment improved. Meanwhile, inflation inched up during the quarter. Along with the pickup in inflation, investors appeared to shift from a mindset of very gradual interest-rate increases by the Fed to an anticipation of three or four increases in 2017. The first of these occurred in March; Fed officials raised their short-term target rate by a quarter percentage point to
| 1 | The S&P 500 Index consists of 500 stocks chosen for market size, liquidity, and industry group representation. It is a market-value-weighted index with each stock’s weight in the index proportionate to its market value. You cannot invest directly in an index. |
| 2 | The Morgan Stanley Capital International (MSCI) All Country World Index (ACWI) ex USA Index (Net) is a free-float-adjusted market-capitalization-weighted index that is designed to measure the equity market performance of developed markets, excluding the United States and Canada. Source: MSCI. MSCI makes no express or implied warranties or representations and shall have no liability whatsoever with respect to any MSCI data contained herein. The MSCI data may not be further redistributed or used as a basis for other indexes or any securities or financial products. This report is not approved, reviewed, or produced by MSCI. You cannot invest directly in an index. |
| 3 | The Bloomberg Barclays U.S. Aggregate Bond Index (formerly known as Barclays U.S. Aggregate Bond Index) is a broad-based benchmark that measures the investment-grade, U.S. dollar–denominated, fixed-rate taxable bond market, including Treasuries, government-related and corporate securities, mortgage-backed securities (agency fixed-rate and hybrid adjustable-rate mortgage pass-throughs), asset-backed securities, and commercial mortgage-backed securities. You cannot invest directly in an index. |
| | | | | | |
| Letter to shareholders (unaudited) | | Wells Fargo Index Asset Allocation Fund | | | 3 | |
between 0.75% and 1.00%. With the Fed’s target-rate increase, short-term bond yields rose during the quarter. Meanwhile, longer-term Treasury yields were little changed, leading to positive performance. Investment-grade and high-yield bonds benefited from strong demand. Municipal bond returns were positive in the quarter, helped by strong demand and constrained new-issue supply. Outside of the U.S., stocks in emerging markets generally outperformed stocks in the U.S. and international developed markets. Thus far in 2017, emerging markets overall have benefited from both global economic growth and recent weakening in the U.S. dollar. European stocks also outperformed the U.S. market, despite investors’ concern over uncertainties such as the potential impact of an upcoming election in France; a contender for president of France, Marine Le Pen, favored exiting the European Union, which could potentially destabilize or topple the organization.
Don’t let short-term uncertainty derail long-term investment goals.
Periods of uncertainty can present challenges, but experience has taught us that maintaining long-term investment goals can be an effective way to plan for the future. To help you create a sound strategy based on your personal goals and risk tolerance, Wells Fargo Funds offers more than 100 mutual funds spanning a wide range of asset classes and investment styles. Although diversification cannot guarantee an investment profit or prevent losses, we believe it can be an effective way to manage investment risk and potentially smooth out overall portfolio performance. We encourage investors to know their investments and to understand that appropriate levels of risk-taking may unlock opportunities.
Thank you for choosing to invest in Wells Fargo Funds. We appreciate your confidence in us and remain committed to helping you meet your financial needs.
Sincerely,

Andrew Owen
President
Wells Fargo Funds
Although diversification cannot guarantee an investment profit or prevent losses, we believe it can be an effective way to manage investment risk and potentially smooth out overall portfolio performance.
For further information about your Fund, contact your investment professional, visit our website at wellsfargofunds.com, or call us directly at 1-800-222-8222. We are available 24 hours a day, 7 days a week.
| | | | |
| 4 | | Wells Fargo Index Asset Allocation Fund | | Performance highlights (unaudited) |
Investment objective
The Fund seeks long-term total return, consisting of capital appreciation and current income.
Manager
Wells Fargo Funds Management, LLC
Subadviser
Wells Capital Management Incorporated
Portfolio managers
Kandarp R. Acharya, CFA®, FRM
Petros Bocray, CFA®, FRM‡
Christian L. Chan, CFA®
Average annual total returns (%) as of March 31, 20171
| | | | | | | | | | | | | | | | | | | | | | | | | | | | | | | | | | |
| | | | | Including sales charge | | | Excluding sales charge | | | Expense ratios2 (%) | |
| | | Inception date | | 1 year | | | 5 year | | | 10 year | | | 1 year | | | 5 year | | | 10 year | | | Gross | | | Net3 | |
| Class A (SFAAX) | | 11-13-1986 | | | 3.12 | | | | 9.12 | | | | 5.89 | | | | 9.40 | | | | 10.42 | | | | 6.52 | | | | 1.10 | | | | 1.10 | |
| Class C (WFALX) | | 4-1-1998 | | | 7.63 | | | | 9.60 | | | | 5.73 | | | | 8.63 | | | | 9.60 | | | | 5.73 | | | | 1.85 | | | | 1.85 | |
| Administrator Class (WFAIX) | | 11-8-1999 | | | – | | | | – | | | | – | | | | 9.61 | | | | 10.67 | | | | 6.79 | | | | 1.02 | | | | 0.90 | |
| Institutional Class (WFATX) | | 10-31-2016 | | | – | | | | – | | | | – | | | | 9.69 | | | | 10.69 | | | | 6.79 | | | | 0.77 | | | | 0.75 | |
| Index Asset Allocation Blended Index4 | | – | | | – | | | | – | | | | – | | | | 9.44 | | | | 10.28 | | | | 8.09 | | | | – | | | | – | |
| Bloomberg Barclays U.S. Treasury Index5 | | – | | | – | | | | – | | | | – | | | | (1.44 | ) | | | 1.61 | | | | 3.89 | | | | – | | | | – | |
| S&P 500 Index6 | | – | | | – | | | | – | | | | – | | | | 17.17 | | | | 13.30 | | | | 7.51 | | | | – | | | | – | |
Figures quoted represent past performance, which is no guarantee of future results, and do not reflect taxes that a shareholder may pay on fund distributions or the redemption of fund shares. Investment return and principal value of an investment will fluctuate so that an investor’s shares, when redeemed, may be worth more or less than their original cost. Performance shown without sales charges would be lower if sales charges were reflected. Current performance may be lower or higher than the performance data quoted, which assumes the reinvestment of dividends and capital gains. Current month-end performance is available on the Fund’s website, wellsfargofunds.com.
Index returns do not include transaction costs associated with buying and selling securities, any mutual fund fees or expenses, or any taxes. It is not possible to invest directly in an index.
For Class A shares, the maximum front-end sales charge is 5.75%. For Class C shares, the maximum contingent deferred sales charge is 1.00%. Performance including a contingent deferred sales charge assumes the sales charge for the corresponding time period. Administrator Class and Institutional Class shares are sold without a front-end sales charge or contingent deferred sales charge.
Balanced funds may invest in stocks and bonds. Stock values fluctuate in response to the activities of individual companies and general market and economic conditions. Bond values fluctuate in response to the financial condition of individual issuers, general market and economic conditions, and changes in interest rates. Changes in market conditions and government policies may lead to periods of heightened volatility in the bond market and reduced liquidity for certain bonds held by the Fund. In general, when interest rates rise, bond values fall and investors may lose principal value. Interest-rate changes and their impact on the Fund and its share price can be sudden and unpredictable. The use of derivatives may reduce returns and/or increase volatility. Consult the Fund’s prospectus for additional information on these and other risks.
Please see footnotes on page 5.
| | | | | | |
| Performance highlights (unaudited) | | Wells Fargo Index Asset Allocation Fund | | | 5 | |
| | | | |
| Ten largest holdings (%) as of March 31, 20177 | |
Apple Incorporated | | | 2.22 | |
Microsoft Corporation | | | 1.50 | |
Amazon.com Incorporated | | | 1.03 | |
Exxon Mobil Corporation | | | 1.00 | |
Johnson & Johnson | | | 0.99 | |
Facebook Incorporated Class A | | | 0.98 | |
Berkshire Hathaway Incorporated Class B | | | 0.93 | |
JPMorgan Chase & Company | | | 0.92 | |
General Electric Company | | | 0.76 | |
AT&T Incorporated | | | 0.75 | |
|
| Sector distribution as of March 31, 20178 |
|
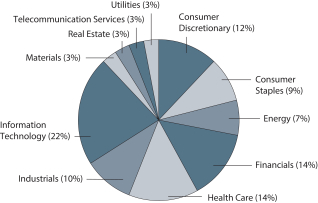 |
|
| Neutral target allocation |
|
 |
|
| Current target allocation as of March 31, 20179 |
|
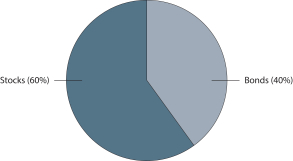 |
| ‡ | Mr. Bocray became the portfolio manager of the Fund on October 1, 2016. |
| 1 | Historical performance shown for the Institutional Class shares prior to their inception reflects the performance of the Administrator Class shares, and is not adjusted to reflect the expenses of the Institutional Class shares. If these expenses had been included, returns for Institutional Class shares would be higher. |
| 2 | Reflects the expense ratios as stated in the most recent prospectuses. The expense ratios shown are subject to change and may differ from the annualized expense ratios shown in the financial highlights of this report. |
| 3 | The manager has contractually committed through January 31, 2018, to waive fees and/or reimburse expenses to the extent necessary to cap the Fund’s Total Annual Fund Operating Expenses After Fee Waivers at 1.15% for Class A, 1.90% for Class C, 0.90% for Administrator Class, and 0.75% for Institutional Class. After this time, the cap may be increased or the commitment to maintain the cap may be terminated only with the approval of the Board of Trustees. Brokerage commissions, stamp duty fees, interest, taxes, acquired fund fees and expenses, and extraordinary expenses are excluded from the expense cap. Without this cap, the Fund’s returns would have been lower. The expense ratio paid by an investor is the net expense ratio or the Fund’s Total Annual Fund Operating Expenses After Fee Waivers, as stated in the prospectuses. |
| 4 | Source: Wells Fargo Funds Management, LLC. Effective April 1, 2015, the Index Asset Allocation Blended Index is weighted 60% in the S&P 500 Index and 40% in the Bloomberg Barclays U.S. Treasury Index. Prior to April 1, 2015, the Index Asset Allocation Blended Index was weighted 60% in the S&P 500 Index and 40% in the Bloomberg Barclays U.S. Treasury 20+ Year Index (formerly known as Barclays U.S. Treasury 20+ Year Index). You cannot invest directly in an index. |
| 5 | The Bloomberg Barclays U.S. Treasury Index (formerly known as Barclays U.S. Treasury Index) is an unmanaged index of prices of U.S. Treasury bonds with maturities of 1 to 30 years. You cannot invest directly in an index. |
| 6 | The S&P 500 Index consists of 500 stocks chosen for market size, liquidity, and industry group representation. It is a market-value weighted index with each stock’s weight in the index proportionate to its market value. You cannot invest directly in an index. |
| 7 | The ten largest holdings, excluding cash and cash equivalents, are calculated based on the value of the investments divided by total net assets of the Fund. Holdings are subject to change and may have changed since the date specified. |
| 8 | Amounts are calculated based on the total long-term investments of the Fund. These amounts are subject to change and may have changed since the date specified. |
| 9 | Current target allocation includes the effect of any tactical futures overlay that may be in place. These amounts are subject to change and may have changed since the date specified. |
| | | | |
| 6 | | Wells Fargo Index Asset Allocation Fund | | Fund expenses (unaudited) |
As a shareholder of the Fund, you incur two types of costs: (1) transaction costs, including sales charges (loads) on purchase payments and contingent deferred sales charges (if any) on redemptions and (2) ongoing costs, including management fees, distribution (12b-1) and/or shareholder servicing fees, and other Fund expenses. This example is intended to help you understand your ongoing costs (in dollars) of investing in the Fund and to compare these costs with the ongoing costs of investing in other mutual funds.
The example is based on an investment of $1,000 invested at the beginning of the six-month period and held for the entire period from October 1, 2016 to March 31, 2017.
Actual expenses
The “Actual” line of the table below provides information about actual account values and actual expenses. You may use the information in this line, together with the amount you invested, to estimate the expenses that you paid over the period. Simply divide your account value by $1,000 (for example, an $8,600 account value divided by $1,000 = 8.6), then multiply the result by the number in the “Actual” line under the heading entitled “Expenses paid during period” for your applicable class of shares to estimate the expenses you paid on your account during this period.
Hypothetical example for comparison purposes
The “Hypothetical” line of the table below provides information about hypothetical account values and hypothetical expenses based on the Fund’s actual expense ratio and an assumed rate of return of 5% per year before expenses, which is not the Fund’s actual return. The hypothetical account values and expenses may not be used to estimate the actual ending account balance or expenses you paid for the period. You may use this information to compare the ongoing costs of investing in the Fund and other funds. To do so, compare this 5% hypothetical example with the 5% hypothetical examples that appear in the shareholder reports of the other funds.
Please note that the expenses shown in the table are meant to highlight your ongoing costs only and do not reflect any transactional costs, such as sales charges (loads) and contingent deferred sales charges. Therefore, the “Hypothetical” line of the table is useful in comparing ongoing costs only and will not help you determine the relative total costs of owning different funds. In addition, if these transactional costs were included, your costs would have been higher.
| | | | | | | | | | | | | | | | |
| | | Beginning account value 10-1-2016 | | | Ending account value 3-31-2017 | | | Expenses paid during the period¹ | | | Annualized net expense ratio | |
Class A | | | | | | | | | | | | | | | | |
Actual | | $ | 1,000.00 | | | $ | 1,053.59 | | | $ | 5.53 | | | | 1.08 | % |
Hypothetical (5% return before expenses) | | $ | 1,000.00 | | | $ | 1,019.55 | | | $ | 5.44 | | | | 1.08 | % |
Class C | | | | | | | | | | | | | | | | |
Actual | | $ | 1,000.00 | | | $ | 1,049.86 | | | $ | 9.35 | | | | 1.83 | % |
Hypothetical (5% return before expenses) | | $ | 1,000.00 | | | $ | 1,015.81 | | | $ | 9.20 | | | | 1.83 | % |
Administrator Class | | | | | | | | | | | | | | | | |
Actual | | $ | 1,000.00 | | | $ | 1,054.67 | | | $ | 4.61 | | | | 0.90 | % |
Hypothetical (5% return before expenses) | | $ | 1,000.00 | | | $ | 1,020.44 | | | $ | 4.53 | | | | 0.90 | % |
Institutional Class | | | | | | | | | | | | | | | | |
Actual | | $ | 1,000.00 | | | $ | 1,055.51 | | | $ | 3.84 | | | | 0.75 | % |
Hypothetical (5% return before expenses) | | $ | 1,000.00 | | | $ | 1,021.19 | | | $ | 3.78 | | | | 0.75 | % |
| 1 | Expenses paid is equal to the annualized net expense ratio of each class multiplied by the average account value over the period, multiplied by the number of days in the most recent fiscal half-year divided by the number of days in the fiscal year (to reflect the one-half-year period). |
| | | | | | |
| Portfolio of investments—March 31, 2017 (unaudited) | | Wells Fargo Index Asset Allocation Fund | | | 7 | |
| | | | | | | | | | | | | | | | |
| Security name | | Interest rate | | | Maturity date | | | Principal | | | Value | |
| | | | |
Agency Securities: 0.01% | | | | | | | | | | | | | | | | |
FNMA Series 2002-T1 Class A4 | | | 9.50 | % | | | 11-25-2031 | | | $ | 56,020 | | | $ | 67,017 | |
| | | | | | | | | | | | | | | | |
| | | | |
Total Agency Securities (Cost $57,042) | | | | | | | | | | | | | | | 67,017 | |
| | | | | | | | | | | | | | | | |
| | | | |
| | | | | | | | | Shares | | | | |
| Common Stocks: 59.57% | | | | | | | | | | | | | | | | |
| | | | |
Consumer Discretionary: 7.35% | | | | | | | | | | | | | | | | |
| | | | |
| Auto Components: 0.12% | | | | | | | | | | | | | | | | |
BorgWarner Incorporated | | | | | | | | | | | 7,352 | | | | 307,240 | |
Delphi Automotive plc | | | | | | | | | | | 9,913 | | | | 797,897 | |
The Goodyear Tire & Rubber Company | | | | | | | | | | | 9,255 | | | | 333,180 | |
| | | | |
| | | | | | | | | | | | | | | 1,438,317 | |
| | | | | | | | | | | | | | | | |
| | | | |
| Automobiles: 0.31% | | | | | | | | | | | | | | | | |
Ford Motor Company | | | | | | | | | | | 143,561 | | | | 1,671,050 | |
General Motors Company | | | | | | | | | | | 50,133 | | | | 1,772,703 | |
Harley-Davidson Incorporated | | | | | | | | | | | 6,485 | | | | 392,343 | |
| | | | |
| | | | | | | | | | | | | | | 3,836,096 | |
| | | | | | | | | | | | | | | | |
| | | | |
| Distributors: 0.07% | | | | | | | | | | | | | | | | |
Genuine Parts Company | | | | | | | | | | | 5,456 | | | | 504,189 | |
LKQ Corporation † | | | | | | | | | | | 11,328 | | | | 331,571 | |
| | | | |
| | | | | | | | | | | | | | | 835,760 | |
| | | | | | | | | | | | | | | | |
| | | | |
| Diversified Consumer Services: 0.01% | | | | | | | | | | | | | | | | |
H&R Block Incorporated | | | | | | | | | | | 7,616 | | | | 177,072 | |
| | | | | | | | | | | | | | | | |
| | | | |
| Hotels, Restaurants & Leisure: 0.95% | | | | | | | | | | | | | | | | |
Carnival Corporation | | | | | | | | | | | 15,371 | | | | 905,506 | |
Chipotle Mexican Grill Incorporated † | | | | | | | | | | | 1,057 | | | | 470,915 | |
Darden Restaurants Incorporated | | | | | | | | | | | 4,566 | | | | 382,037 | |
Marriott International Incorporated Class A | | | | | | | | | | | 11,567 | | | | 1,089,380 | |
McDonald’s Corporation | | | | | | | | | | | 30,121 | | | | 3,903,983 | |
Royal Caribbean Cruises Limited | | | | | | | | | | | 6,162 | | | | 604,554 | |
Starbucks Corporation | | | | | | | | | | | 53,600 | | | | 3,129,704 | |
Wyndham Worldwide Corporation | | | | | | | | | | | 3,860 | | | | 325,359 | |
Wynn Resorts Limited « | | | | | | | | | | | 2,923 | | | | 335,005 | |
Yum! Brands Incorporated | | | | | | | | | | | 12,362 | | | | 789,932 | |
| | | | |
| | | | | | | | | | | | | | | 11,936,375 | |
| | | | | | | | | | | | | | | | |
| | | | |
| Household Durables: 0.27% | | | | | | | | | | | | | | | | |
D.R. Horton Incorporated | | | | | | | | | | | 12,497 | | | | 416,275 | |
Garmin Limited « | | | | | | | | | | | 4,230 | | | | 216,195 | |
Leggett & Platt Incorporated | | | | | | | | | | | 4,919 | | | | 247,524 | |
Lennar Corporation Class A | | | | | | | | | | | 7,472 | | | | 382,492 | |
Mohawk Industries Incorporated † | | | | | | | | | | | 2,318 | | | | 531,958 | |
Newell Rubbermaid Incorporated | | | | | | | | | | | 17,742 | | | | 836,890 | |
The accompanying notes are an integral part of these financial statements.
| | | | |
| 8 | | Wells Fargo Index Asset Allocation Fund | | Portfolio of investments—March 31, 2017 (unaudited) |
| | | | | | | | | | | | | | | | |
| Security name | | | | | | | | Shares | | | Value | |
| | | | |
| Household Durables (continued) | | | | | | | | | | | | | | | | |
PulteGroup Incorporated | | | | | | | | | | | 10,520 | | | $ | 247,746 | |
Whirlpool Corporation | | | | | | | | | | | 2,739 | | | | 469,273 | |
| | | | |
| | | | | | | | | | | | | | | 3,348,353 | |
| | | | | | | | | | | | | | | | |
| | | | |
| Internet & Direct Marketing Retail: 1.54% | | | | | | | | | | | | | | | | |
Amazon.com Incorporated † | | | | | | | | | | | 14,566 | | | | 12,913,342 | |
Expedia Incorporated | | | | | | | | | | | 4,433 | | | | 559,312 | |
Netflix Incorporated † | | | | | | | | | | | 15,830 | | | | 2,339,832 | |
The Priceline Group Incorporated † | | | | | | | | | | | 1,808 | | | | 3,218,186 | |
TripAdvisor Incorporated † | | | | | | | | | | | 4,153 | | | | 179,243 | |
| | | | |
| | | | | | | | | | | | | | | 19,209,915 | |
| | | | | | | | | | | | | | | | |
| | | | |
| Leisure Products: 0.06% | | | | | | | | | | | | | | | | |
Hasbro Incorporated | | | | | | | | | | | 4,114 | | | | 410,659 | |
Mattel Incorporated | | | | | | | | | | | 12,594 | | | | 322,532 | |
| | | | |
| | | | | | | | | | | | | | | 733,191 | |
| | | | | | | | | | | | | | | | |
| | | | |
| Media: 1.92% | | | | | | | | | | | | | | | | |
CBS Corporation Class B | | | | | | | | | | | 13,678 | | | | 948,706 | |
Charter Communications Incorporated Class A † | | | | | | | | | | | 7,911 | | | | 2,589,429 | |
Comcast Corporation Class A | | | | | | | | | | | 174,060 | | | | 6,542,915 | |
Discovery Communications Incorporated Class A † | | | | | | | | | | | 5,612 | | | | 163,253 | |
Discovery Communications Incorporated Class C † | | | | | | | | | | | 7,934 | | | | 224,612 | |
DISH Network Corporation Class A † | | | | | | | | | | | 8,345 | | | | 529,824 | |
Interpublic Group of Companies Incorporated | | | | | | | | | | | 14,442 | | | | 354,840 | |
News Corporation Class A | | | | | | | | | | | 14,037 | | | | 182,481 | |
News Corporation Class B | | | | | | | | | | | 4,405 | | | | 59,468 | |
Omnicom Group Incorporated | | | | | | | | | | | 8,625 | | | | 743,561 | |
Scripps Networks Interactive Incorporated Class A | | | | | | | | | | | 3,513 | | | | 275,314 | |
Tegna Incorporated | | | | | | | | | | | 7,897 | | | | 202,321 | |
The Walt Disney Company | | | | | | | | | | | 53,502 | | | | 6,066,592 | |
Time Warner Incorporated | | | | | | | | | | | 28,478 | | | | 2,782,585 | |
Twenty-First Century Fox Incorporated Class A | | | | | | | | | | | 38,702 | | | | 1,253,558 | |
Twenty-First Century Fox Incorporated Class B | | | | | | | | | | | 17,914 | | | | 569,307 | |
Viacom Incorporated Class B | | | | | | | | | | | 12,779 | | | | 595,757 | |
| | | | |
| | | | | | | | | | | | | | | 24,084,523 | |
| | | | | | | | | | | | | | | | |
| | | | |
| Multiline Retail: 0.26% | | | | | | | | | | | | | | | | |
Dollar General Corporation | | | | | | | | | | | 9,347 | | | | 651,766 | |
Dollar Tree Incorporated † | | | | | | | | | | | 8,682 | | | | 681,190 | |
Kohl’s Corporation | | | | | | | | | | | 6,490 | | | | 258,367 | |
Macy’s Incorporated | | | | | | | | | | | 11,184 | | | | 331,494 | |
Nordstrom Incorporated « | | | | | | | | | | | 4,188 | | | | 195,035 | |
Target Corporation | | | | | | | | | | | 20,453 | | | | 1,128,801 | |
| | | | |
| | | | | | | | | | | | | | | 3,246,653 | |
| | | | | | | | | | | | | | | | |
| | | | |
| Specialty Retail: 1.44% | | | | | | | | | | | | | | | | |
Advance Auto Parts Incorporated | | | | | | | | | | | 2,712 | | | | 402,081 | |
AutoNation Incorporated † | | | | | | | | | | | 2,411 | | | | 101,961 | |
The accompanying notes are an integral part of these financial statements.
| | | | | | |
| Portfolio of investments—March 31, 2017 (unaudited) | | Wells Fargo Index Asset Allocation Fund | | | 9 | |
| | | | | | | | | | | | | | | | |
| Security name | | | | | | | | Shares | | | Value | |
| | | | |
| Specialty Retail (continued) | | | | | | | | | | | | | | | | |
AutoZone Incorporated † | | | | | | | | | | | 1,046 | | | $ | 756,310 | |
Bed Bath & Beyond Incorporated | | | | | | | | | | | 5,528 | | | | 218,135 | |
Best Buy Company Incorporated | | | | | | | | | | | 9,959 | | | | 489,485 | |
CarMax Incorporated †« | | | | | | | | | | | 6,881 | | | | 407,493 | |
Foot Locker Incorporated | | | | | | | | | | | 4,867 | | | | 364,100 | |
L Brands Incorporated | | | | | | | | | | | 8,834 | | | | 416,081 | |
Lowe’s Companies Incorporated | | | | | | | | | | | 31,850 | | | | 2,618,389 | |
O’Reilly Automotive Incorporated † | | | | | | | | | | | 3,370 | | | | 909,361 | |
Ross Stores Incorporated | | | | | | | | | | | 14,495 | | | | 954,786 | |
Signet Jewelers Limited | | | | | | | | | | | 2,559 | | | | 177,262 | |
Staples Incorporated | | | | | | | | | | | 23,926 | | | | 209,831 | |
The Gap Incorporated | | | | | | | | | | | 8,068 | | | | 195,972 | |
The Home Depot Incorporated | | | | | | | | | | | 44,801 | | | | 6,578,131 | |
The TJX Companies Incorporated | | | | | | | | | | | 23,975 | | | | 1,895,943 | |
Tiffany & Company | | | | | | | | | | | 3,936 | | | | 375,101 | |
Tractor Supply Company | | | | | | | | | | | 4,808 | | | | 331,608 | |
ULTA Salon Cosmetics & Fragrance Incorporated † | | | | | | | | | | | 2,151 | | | | 613,530 | |
| | | | |
| | | | | | | | | | | | | | | 18,015,560 | |
| | | | | | | | | | | | | | | | |
| | | | |
| Textiles, Apparel & Luxury Goods: 0.40% | | | | | | | | | | | | | | | | |
Coach Incorporated | | | | | | | | | | | 10,320 | | | | 426,526 | |
HanesBrands Incorporated « | | | | | | | | | | | 13,928 | | | | 289,145 | |
Michael Kors Holdings Limited † | | | | | | | | | | | 5,974 | | | | 227,669 | |
Nike Incorporated Class B | | | | | | | | | | | 48,739 | | | | 2,716,224 | |
PVH Corporation | | | | | | | | | | | 2,915 | | | | 301,615 | |
Ralph Lauren Corporation | | | | | | | | | | | 2,071 | | | | 169,035 | |
Under Armour Incorporated Class A †« | | | | | | | | | | | 6,757 | | | | 133,653 | |
Under Armour Incorporated Class C †« | | | | | | | | | | | 6,779 | | | | 124,056 | |
VF Corporation | | | | | | | | | | | 12,184 | | | | 669,754 | |
| | | | |
| | | | | | | | | | | | | | | 5,057,677 | |
| | | | | | | | | | | | | | | | |
| | | | |
Consumer Staples: 5.54% | | | | | | | | | | | | | | | | |
| | | | |
| Beverages: 1.22% | | | | | | | | | | | | | | | | |
Brown-Forman Corporation Class B | | | | | | | | | | | 6,505 | | | | 300,401 | |
Constellation Brands Incorporated Class A | | | | | | | | | | | 6,352 | | | | 1,029,469 | |
Dr Pepper Snapple Group Incorporated | | | | | | | | | | | 6,733 | | | | 659,295 | |
Molson Coors Brewing Company Class B | | | | | | | | | | | 6,781 | | | | 649,010 | |
Monster Beverage Corporation † | | | | | | | | | | | 14,796 | | | | 683,131 | |
PepsiCo Incorporated | | | | | | | | | | | 52,490 | | | | 5,871,531 | |
The Coca-Cola Company | | | | | | | | | | | 142,114 | | | | 6,031,318 | |
| | | | |
| | | | | | | | | | | | | | | 15,224,155 | |
| | | | | | | | | | | | | | | | |
| | | | |
| Food & Staples Retailing: 1.16% | | | | | | | | | | | | | | | | |
Costco Wholesale Corporation | | | | | | | | | | | 16,144 | | | | 2,707,187 | |
CVS Health Corporation | | | | | | | | | | | 37,723 | | | | 2,961,256 | |
Sysco Corporation | | | | | | | | | | | 18,278 | | | | 948,994 | |
The Kroger Company | | | | | | | | | | | 33,982 | | | | 1,002,129 | |
Wal-Mart Stores Incorporated | | | | | | | | | | | 55,383 | | | | 3,992,007 | |
The accompanying notes are an integral part of these financial statements.
| | | | |
| 10 | | Wells Fargo Index Asset Allocation Fund | | Portfolio of investments—March 31, 2017 (unaudited) |
| | | | | | | | | | | | | | | | |
| Security name | | | | | | | | Shares | | | Value | |
| | | | |
| Food & Staples Retailing (continued) | | | | | | | | | | | | | | | | |
Walgreens Boots Alliance Incorporated | | | | | | | | | | | 31,361 | | | $ | 2,604,531 | |
Whole Foods Market Incorporated | | | | | | | | | | | 11,716 | | | | 348,200 | |
| | | | |
| | | | | | | | | | | | | | | 14,564,304 | |
| | | | | | | | | | | | | | | | |
| | | | |
| Food Products: 0.92% | | | | | | | | | | | | | | | | |
Archer Daniels Midland Company | | | | | | | | | | | 21,003 | | | | 966,978 | |
Campbell Soup Company | | | | | | | | | | | 7,114 | | | | 407,205 | |
ConAgra Foods Incorporated | | | | | | | | | | | 15,205 | | | | 613,370 | |
General Mills Incorporated | | | | | | | | | | | 21,331 | | | | 1,258,742 | |
Hormel Foods Corporation | | | | | | | | | | | 9,918 | | | | 343,460 | |
Kellogg Company | | | | | | | | | | | 9,298 | | | | 675,128 | |
McCormick & Company Incorporated | | | | | | | | | | | 4,180 | | | | 407,759 | |
Mead Johnson Nutrition Company | | | | | | | | | | | 6,746 | | | | 600,934 | |
Mondelez International Incorporated Class A | | | | | | | | | | | 56,146 | | | | 2,418,770 | |
The Hershey Company | | | | | | | | | | | 5,136 | | | | 561,108 | |
The J.M. Smucker Company | | | | | | | | | | | 4,281 | | | | 561,153 | |
The Kraft Heinz Company | | | | | | | | | | | 21,934 | | | | 1,991,827 | |
Tyson Foods Incorporated Class A | | | | | | | | | | | 10,553 | | | | 651,226 | |
| | | | |
| | | | | | | | | | | | | | | 11,457,660 | |
| | | | | | | | | | | | | | | | |
| | | | |
| Household Products: 1.09% | | | | | | | | | | | | | | | | |
Church & Dwight Company Incorporated | | | | | | | | | | | 9,365 | | | | 467,033 | |
Colgate-Palmolive Company | | | | | | | | | | | 32,469 | | | | 2,376,406 | |
Kimberly-Clark Corporation | | | | | | | | | | | 13,084 | | | | 1,722,247 | |
The Clorox Company | | | | | | | | | | | 4,717 | | | | 635,993 | |
The Procter & Gamble Company | | | | | | | | | | | 94,022 | | | | 8,447,877 | |
| | | | |
| | | | | | | | | | | | | | | 13,649,556 | |
| | | | | | | | | | | | | | | | |
| | | | |
| Personal Products: 0.08% | | | | | | | | | | | | | | | | |
Coty Incorporated Class A | | | | | | | | | | | 17,311 | | | | 313,848 | |
The Estee Lauder Companies Incorporated Class A | | | | | | | | | | | 8,175 | | | | 693,158 | |
| | | | |
| | | | | | | | | | | | | | | 1,007,006 | |
| | | | | | | | | | | | | | | | |
| | | | |
| Tobacco: 1.07% | | | | | | | | | | | | | | | | |
Altria Group Incorporated | | | | | | | | | | | 71,328 | | | | 5,094,246 | |
Philip Morris International | | | | | | | | | | | 57,057 | | | | 6,441,735 | |
Reynolds American Incorporated | | | | | | | | | | | 30,417 | | | | 1,916,879 | |
| | | | |
| | | | | | | | | | | | | | | 13,452,860 | |
| | | | | | | | | | | | | | | | |
| | | | |
Energy: 3.92% | | | | | | | | | | | | | | | | |
| | | | |
| Energy Equipment & Services: 0.64% | | | | | | | | | | | | | | | | |
Baker Hughes Incorporated | | | | | | | | | | | 15,642 | | | | 935,704 | |
Halliburton Company | | | | | | | | | | | 31,885 | | | | 1,569,061 | |
Helmerich & Payne Incorporated « | | | | | | | | | | | 3,992 | | | | 265,747 | |
National Oilwell Varco Incorporated | | | | | | | | | | | 13,929 | | | | 558,414 | |
Schlumberger Limited | | | | | | | | | | | 51,273 | | | | 4,004,421 | |
TechnipFMC plc † | | | | | | | | | | | 17,161 | | | | 557,733 | |
Transocean Limited †« | | | | | | | | | | | 14,317 | | | | 178,247 | |
| | | | |
| | | | | | | | | | | | | | | 8,069,327 | |
| | | | | | | | | | | | | | | | |
The accompanying notes are an integral part of these financial statements.
| | | | | | |
| Portfolio of investments—March 31, 2017 (unaudited) | | Wells Fargo Index Asset Allocation Fund | | | 11 | |
| | | | | | | | | | | | | | | | |
| Security name | | | | | | | | Shares | | | Value | |
| | | | |
| Oil, Gas & Consumable Fuels: 3.28% | | | | | | | | | | | | | | | | |
Anadarko Petroleum Corporation | | | | | | | | | | | 20,558 | | | $ | 1,274,596 | |
Apache Corporation | | | | | | | | | | | 13,964 | | | | 717,610 | |
Cabot Oil & Gas Corporation | | | | | | | | | | | 17,475 | | | | 417,827 | |
Chesapeake Energy Corporation †« | | | | | | | | | | | 28,014 | | | | 166,403 | |
Chevron Corporation | | | | | | | | | | | 69,625 | | | | 7,475,636 | |
Cimarex Energy Company | | | | | | | | | | | 3,497 | | | | 417,857 | |
Concho Resources Incorporated † | | | | | | | | | | | 5,448 | | | | 699,196 | |
ConocoPhillips | | | | | | | | | | | 45,452 | | | | 2,266,691 | |
Devon Energy Corporation | | | | | | | | | | | 19,293 | | | | 804,904 | |
EOG Resources Incorporated | | | | | | | | | | | 21,215 | | | | 2,069,523 | |
EQT Corporation | | | | | | | | | | | 6,374 | | | | 389,451 | |
Exxon Mobil Corporation | | | | | | | | | | | 152,501 | | | | 12,506,607 | |
Hess Corporation | | | | | | | | | | | 9,895 | | | | 477,038 | |
Kinder Morgan Incorporated | | | | | | | | | | | 70,610 | | | | 1,535,061 | |
Marathon Oil Corporation | | | | | | | | | | | 31,158 | | | | 492,296 | |
Marathon Petroleum Corporation | | | | | | | | | | | 19,411 | | | | 981,032 | |
Murphy Oil Corporation | | | | | | | | | | | 5,959 | | | | 170,368 | |
Newfield Exploration Company † | | | | | | | | | | | 7,314 | | | | 269,960 | |
Noble Energy Incorporated | | | | | | | | | | | 16,015 | | | | 549,955 | |
Occidental Petroleum Corporation | | | | | | | | | | | 28,109 | | | | 1,780,986 | |
ONEOK Incorporated | | | | | | | | | | | 7,751 | | | | 429,715 | |
Phillips 66 Company | | | | | | | | | | | 16,225 | | | | 1,285,345 | |
Pioneer Natural Resources Company | | | | | | | | | | | 6,244 | | | | 1,162,820 | |
Range Resources Corporation | | | | | | | | | | | 6,918 | | | | 201,314 | |
Southwestern Energy Company † | | | | | | | | | | | 18,313 | | | | 149,617 | |
Tesoro Corporation | | | | | | | | | | | 4,301 | | | | 348,639 | |
The Williams Companies Incorporated | | | | | | | | | | | 30,372 | | | | 898,707 | |
Valero Energy Corporation | | | | | | | | | | | 16,588 | | | | 1,099,619 | |
| | | | |
| | | | | | | | | | | | | | | 41,038,773 | |
| | | | | | | | | | | | | | | | |
| | | | |
Financials: 8.56% | | | | | | | | | | | | | | | | |
| | | | |
| Banks: 3.85% | | | | | | | | | | | | | | | | |
Bank of America Corporation | | | | | | | | | | | 368,704 | | | | 8,697,727 | |
BB&T Corporation | | | | | | | | | | | 29,731 | | | | 1,328,976 | |
Citigroup Incorporated | | | | | | | | | | | 101,901 | | | | 6,095,718 | |
Citizens Financial Group Incorporated | | | | | | | | | | | 18,724 | | | | 646,914 | |
Comerica Incorporated | | | | | | | | | | | 6,468 | | | | 443,575 | |
Fifth Third Bancorp | | | | | | | | | | | 27,601 | | | | 701,065 | |
Huntington Bancshares Incorporated | | | | | | | | | | | 39,936 | | | | 534,743 | |
JPMorgan Chase & Company | | | | | | | | | | | 131,370 | | | | 11,539,541 | |
KeyCorp | | | | | | | | | | | 39,442 | | | | 701,279 | |
M&T Bank Corporation | | | | | | | | | | | 5,669 | | | | 877,164 | |
People’s United Financial Incorporated | | | | | | | | | | | 11,655 | | | | 212,121 | |
PNC Financial Services Group Incorporated | | | | | | | | | | | 17,880 | | | | 2,149,891 | |
Regions Financial Corporation | | | | | | | | | | | 44,327 | | | | 644,071 | |
SunTrust Banks Incorporated | | | | | | | | | | | 18,074 | | | | 999,492 | |
US Bancorp | | | | | | | | | | | 58,567 | | | | 3,016,201 | |
Wells Fargo & Company (l) | | | | | | | | | | | 165,612 | | | | 9,217,964 | |
Zions Bancorporation | | | | | | | | | | | 7,444 | | | | 312,648 | |
| | | | |
| | | | | | | | | | | | | | | 48,119,090 | |
| | | | | | | | | | | | | | | | |
The accompanying notes are an integral part of these financial statements.
| | | | |
| 12 | | Wells Fargo Index Asset Allocation Fund | | Portfolio of investments—March 31, 2017 (unaudited) |
| | | | | | | | | | | | | | | | |
| Security name | | | | | | | | Shares | | | Value | |
| | | | |
| Capital Markets: 1.69% | | | | | | | | | | | | | | | | |
Affiliated Managers Group Incorporated | | | | | | | | | | | 2,084 | | | $ | 341,651 | |
Ameriprise Financial Incorporated | | | | | | | | | | | 5,666 | | | | 734,767 | |
Bank of New York Mellon Corporation | | | | | | | | | | | 38,155 | | | | 1,802,061 | |
BlackRock Incorporated | | | | | | | | | | | 4,474 | | | | 1,715,824 | |
CBOE Holdings Incorporated | | | | | | | | | | | 3,373 | | | | 273,449 | |
Charles Schwab Corporation | | | | | | | | | | | 44,679 | | | | 1,823,350 | |
CME Group Incorporated | | | | | | | | | | | 12,491 | | | | 1,483,931 | |
E*TRADE Financial Corporation † | | | | | | | | | | | 10,102 | | | | 352,459 | |
Franklin Resources Incorporated | | | | | | | | | | | 12,683 | | | | 534,462 | |
Goldman Sachs Group Incorporated | | | | | | | | | | | 13,626 | | | | 3,130,165 | |
Intercontinental Exchange Incorporated | | | | | | | | | | | 21,907 | | | | 1,311,572 | |
Invesco Limited | | | | | | | | | | | 14,842 | | | | 454,610 | |
Moody’s Corporation | | | | | | | | | | | 6,105 | | | | 684,004 | |
Morgan Stanley | | | | | | | | | | | 52,848 | | | | 2,264,008 | |
Northern Trust Corporation | | | | | | | | | | | 7,909 | | | | 684,761 | |
Raymond James Financial Incorporated | | | | | | | | | | | 4,702 | | | | 358,575 | |
S&P Global Incorporated | | | | | | | | | | | 9,504 | | | | 1,242,553 | |
State Street Corporation | | | | | | | | | | | 13,204 | | | | 1,051,170 | |
T. Rowe Price Group Incorporated | | | | | | | | | | | 8,952 | | | | 610,079 | |
The NASDAQ OMX Group Incorporated | | | | | | | | | | | 4,231 | | | | 293,843 | |
| | | | |
| | | | | | | | | | | | | | | 21,147,294 | |
| | | | | | | | | | | | | | | | |
| | | | |
| Consumer Finance: 0.47% | | | | | | | | | | | | | | | | |
American Express Company | | | | | | | | | | | 27,843 | | | | 2,202,660 | |
Capital One Financial Corporation | | | | | | | | | | | 17,677 | | | | 1,531,889 | |
Discover Financial Services | | | | | | | | | | | 14,178 | | | | 969,633 | |
Navient Corporation | | | | | | | | | | | 10,702 | | | | 157,962 | |
Synchrony Financial | | | | | | | | | | | 28,327 | | | | 971,616 | |
| | | | |
| | | | | | | | | | | | | | | 5,833,760 | |
| | | | | | | | | | | | | | | | |
| | | | |
| Diversified Financial Services: 0.95% | | | | | | | | | | | | | | | | |
Berkshire Hathaway Incorporated Class B † | | | | | | | | | | | 69,852 | | | | 11,642,931 | |
Leucadia National Corporation | | | | | | | | | | | 11,909 | | | | 309,634 | |
| | | | |
| | | | | | | | | | | | | | | 11,952,565 | |
| | | | | | | | | | | | | | | | |
| | | | |
| Insurance: 1.60% | | | | | | | | | | | | | | | | |
AFLAC Incorporated | | | | | | | | | | | 14,763 | | | | 1,069,136 | |
American International Group Incorporated | | | | | | | | | | | 34,224 | | | | 2,136,604 | |
Aon plc | | | | | | | | | | | 9,658 | | | | 1,146,308 | |
Arthur J. Gallagher & Company | | | | | | | | | | | 6,569 | | | | 371,411 | |
Assurant Incorporated | | | | | | | | | | | 2,046 | | | | 195,741 | |
Chubb Limited | | | | | | | | | | | 17,130 | | | | 2,333,963 | |
Cincinnati Financial Corporation | | | | | | | | | | | 5,512 | | | | 398,352 | |
Lincoln National Corporation | | | | | | | | | | | 8,283 | | | | 542,122 | |
Loews Corporation | | | | | | | | | | | 10,152 | | | | 474,809 | |
Marsh & McLennan Companies Incorporated | | | | | | | | | | | 18,940 | | | | 1,399,477 | |
MetLife Incorporated | | | | | | | | | | | 39,987 | | | | 2,112,113 | |
Principal Financial Group Incorporated | | | | | | | | | | | 9,833 | | | | 620,561 | |
Prudential Financial Incorporated | | | | | | | | | | | 15,814 | | | | 1,687,038 | |
The accompanying notes are an integral part of these financial statements.
| | | | | | |
| Portfolio of investments—March 31, 2017 (unaudited) | | Wells Fargo Index Asset Allocation Fund | | | 13 | |
| | | | | | | | | | | | | | | | |
| Security name | | | | | | | | Shares | | | Value | |
| | | | |
| Insurance (continued) | | | | | | | | | | | | | | | | |
The Allstate Corporation | | | | | | | | | | | 13,429 | | | $ | 1,094,329 | |
The Hartford Financial Services Group Incorporated | | | | | | | | | | | 13,751 | | | | 661,011 | |
The Progressive Corporation | | | | | | | | | | | 21,361 | | | | 836,924 | |
The Travelers Companies Incorporated | | | | | | | | | | | 10,286 | | | | 1,239,874 | |
Torchmark Corporation | | | | | | | | | | | 4,027 | | | | 310,240 | |
Unum Group | | | | | | | | | | | 8,430 | | | | 395,283 | |
Willis Towers Watson plc | | | | | | | | | | | 4,685 | | | | 613,220 | |
XL Group Limited | | | | | | | | | | | 9,744 | | | | 388,396 | |
| | | | |
| | | | | | | | | | | | | | | 20,026,912 | |
| | | | | | | | | | | | | | | | |
| | | | |
Health Care: 8.28% | | | | | | | | | | | | | | | | |
| | | | |
| Biotechnology: 1.69% | | | | | | | | | | | | | | | | |
AbbVie Incorporated | | | | | | | | | | | 58,620 | | | | 3,819,679 | |
Alexion Pharmaceuticals Incorporated † | | | | | | | | | | | 8,260 | | | | 1,001,442 | |
Amgen Incorporated | | | | | | | | | | | 27,085 | | | | 4,443,836 | |
Biogen Incorporated | | | | | | | | | | | 7,940 | | | | 2,170,955 | |
Celgene Corporation † | | | | | | | | | | | 28,612 | | | | 3,560,191 | |
Gilead Sciences Incorporated | | | | | | | | | | | 48,071 | | | | 3,264,982 | |
Incyte Corporation † | | | | | | | | | | | 6,478 | | | | 865,914 | |
Regeneron Pharmaceuticals Incorporated † | | | | | | | | | | | 2,796 | | | | 1,083,478 | |
Vertex Pharmaceuticals Incorporated † | | | | | | | | | | | 9,137 | | | | 999,131 | |
| | | | |
| | | | | | | | | | | | | | | 21,209,608 | |
| | | | | | | | | | | | | | | | |
| | | | |
| Health Care Equipment & Supplies: 1.55% | | | | | | | | | | | | | | | | |
Abbott Laboratories | | | | | | | | | | | 63,552 | | | | 2,822,344 | |
Baxter International Incorporated | | | | | | | | | | | 17,877 | | | | 927,101 | |
Becton Dickinson & Company | | | | | | | | | | | 7,827 | | | | 1,435,785 | |
Boston Scientific Corporation † | | | | | | | | | | | 50,146 | | | | 1,247,131 | |
C.R. Bard Incorporated | | | | | | | | | | | 2,648 | | | | 658,134 | |
Danaher Corporation | | | | | | | | | | | 22,438 | | | | 1,919,122 | |
Dentsply Sirona Incorporated | | | | | | | | | | | 8,447 | | | | 527,431 | |
Edwards Lifesciences Corporation † | | | | | | | | | | | 7,815 | | | | 735,157 | |
Hologic Incorporated † | | | | | | | | | | | 10,272 | | | | 437,074 | |
IDEXX Laboratories Incorporated † | | | | | | | | | | | 3,236 | | | | 500,318 | |
Intuitive Surgical Incorporated † | | | | | | | | | | | 1,350 | | | | 1,034,735 | |
Medtronic plc | | | | | | | | | | | 50,345 | | | | 4,055,793 | |
Stryker Corporation | | | | | | | | | | | 11,381 | | | | 1,498,309 | |
The Cooper Companies Incorporated | | | | | | | | | | | 1,799 | | | | 359,602 | |
Varian Medical Systems Incorporated | | | | | | | | | | | 3,436 | | | | 313,123 | |
Zimmer Biomet Holdings Incorporated | | | | | | | | | | | 7,395 | | | | 903,003 | |
| | | | |
| | | | | | | | | | | | | | | 19,374,162 | |
| | | | | | | | | | | | | | | | |
| | | | |
| Health Care Providers & Services: 1.58% | | | | | | | | | | | | | | | | |
Aetna Incorporated | | | | | | | | | | | 12,935 | | | | 1,649,859 | |
AmerisourceBergen Corporation | | | | | | | | | | | 6,072 | | | | 537,372 | |
Anthem Incorporated | | | | | | | | | | | 9,723 | | | | 1,607,990 | |
Cardinal Health Incorporated | | | | | | | | | | | 11,602 | | | | 946,143 | |
Centene Corporation † | | | | | | | | | | | 6,326 | | | | 450,791 | |
The accompanying notes are an integral part of these financial statements.
| | | | |
| 14 | | Wells Fargo Index Asset Allocation Fund | | Portfolio of investments—March 31, 2017 (unaudited) |
| | | | | | | | | | | | | | | | |
| Security name | | | | | | | | Shares | | | Value | |
| | | | |
| Health Care Providers & Services (continued) | | | | | | | | | | | | | | | | |
Cigna Corporation | | | | | | | | | | | 9,453 | | | $ | 1,384,770 | |
DaVita HealthCare Partners Incorporated † | | | | | | | | | | | 5,725 | | | | 389,128 | |
Envision Healthcare Corporation † | | | | | | | | | | | 4,319 | | | | 264,841 | |
Express Scripts Holding Company † | | | | | | | | | | | 22,276 | | | | 1,468,211 | |
HCA Holdings Incorporated † | | | | | | | | | | | 10,618 | | | | 944,896 | |
Henry Schein Incorporated † | | | | | | | | | | | 2,912 | | | | 494,953 | |
Humana Incorporated | | | | | | | | | | | 5,492 | | | | 1,132,121 | |
Laboratory Corporation of America Holdings † | | | | | | | | | | | 3,762 | | | | 539,734 | |
McKesson Corporation | | | | | | | | | | | 7,798 | | | | 1,156,131 | |
Patterson Companies Incorporated « | | | | | | | | | | | 3,024 | | | | 136,776 | |
Quest Diagnostics Incorporated | | | | | | | | | | | 5,056 | | | | 496,449 | |
UnitedHealth Group Incorporated | | | | | | | | | | | 34,982 | | | | 5,737,398 | |
Universal Health Services Incorporated Class B | | | | | | | | | | | 3,284 | | | | 408,694 | |
| | | | |
| | | | | | | | | | | | | | | 19,746,257 | |
| | | | | | | | | | | | | | | | |
| | | | |
| Health Care Technology: 0.05% | | | | | | | | | | | | | | | | |
Cerner Corporation † | | | | | | | | | | | 10,792 | | | | 635,109 | |
| | | | | | | | | | | | | | | | |
| | | | |
| Life Sciences Tools & Services: 0.39% | | | | | | | | | | | | | | | | |
Agilent Technologies Incorporated | | | | | | | | | | | 11,844 | | | | 626,192 | |
Illumina Incorporated † | | | | | | | | | | | 5,380 | | | | 918,043 | |
Mettler-Toledo International Incorporated † | | | | | | | | | | | 953 | | | | 456,401 | |
PerkinElmer Incorporated | | | | | | | | | | | 4,037 | | | | 234,388 | |
Thermo Fisher Scientific Incorporated | | | | | | | | | | | 14,357 | | | | 2,205,235 | |
Waters Corporation † | | | | | | | | | | | 2,945 | | | | 460,333 | |
| | | | |
| | | | | | | | | | | | | | | 4,900,592 | |
| | | | | | | | | | | | | | | | |
| | | | |
| Pharmaceuticals: 3.02% | | | | | | | | | | | | | | | | |
Allergan plc | | | | | | | | | | | 12,329 | | | | 2,945,645 | |
Bristol-Myers Squibb Company | | | | | | | | | | | 61,519 | | | | 3,345,403 | |
Eli Lilly & Company | | | | | | | | | | | 35,710 | | | | 3,003,568 | |
Johnson & Johnson | | | | | | | | | | | 99,792 | | | | 12,429,094 | |
Mallinckrodt plc † | | | | | | | | | | | 3,853 | | | | 171,728 | |
Merck & Company Incorporated | | | | | | | | | | | 100,976 | | | | 6,416,015 | |
Mylan NV † | | | | | | | | | | | 16,938 | | | | 660,413 | |
Perrigo Company plc | | | | | | | | | | | 5,272 | | | | 350,008 | |
Pfizer Incorporated | | | | | | | | | | | 218,898 | | | | 7,488,501 | |
Zoetis Incorporated | | | | | | | | | | | 18,093 | | | | 965,623 | |
| | | | |
| | | | | | | | | | | | | | | 37,775,998 | |
| | | | | | | | | | | | | | | | |
| | | | |
Industrials: 6.01% | | | | | | | | | | | | | | | | |
| | | | |
| Aerospace & Defense: 1.33% | | | | | | | | | | | | | | | | |
Arconic Incorporated | | | | | | | | | | | 16,202 | | | | 426,761 | |
General Dynamics Corporation | | | | | | | | | | | 10,466 | | | | 1,959,235 | |
L-3 Technologies Incorporated | | | | | | | | | | | 2,861 | | | | 472,895 | |
Lockheed Martin Corporation | | | | | | | | | | | 9,182 | | | | 2,457,103 | |
Northrop Grumman Corporation | | | | | | | | | | | 6,420 | | | | 1,526,933 | |
Raytheon Company | | | | | | | | | | | 10,771 | | | | 1,642,578 | |
Rockwell Collins Incorporated | | | | | | | | | | | 4,810 | | | | 467,340 | |
The accompanying notes are an integral part of these financial statements.
| | | | | | |
| Portfolio of investments—March 31, 2017 (unaudited) | | Wells Fargo Index Asset Allocation Fund | | | 15 | |
| | | | | | | | | | | | | | | | |
| Security name | | | | | | | | Shares | | | Value | |
| | | | |
| Aerospace & Defense (continued) | | | | | | | | | | | | | | | | |
Textron Incorporated | | | | | | | | | | | 9,933 | | | $ | 472,711 | |
The Boeing Company | | | | | | | | | | | 20,949 | | | | 3,705,040 | |
TransDigm Group Incorporated « | | | | | | | | | | | 1,826 | | | | 402,012 | |
United Technologies Corporation | | | | | | | | | | | 27,563 | | | | 3,092,844 | |
| | | | |
| | | | | | | | | | | | | | | 16,625,452 | |
| | | | | | | | | | | | | | | | |
| | | | |
| Air Freight & Logistics: 0.42% | | | | | | | | | | | | | | | | |
C.H. Robinson Worldwide Incorporated | | | | | | | | | | | 5,199 | | | | 401,831 | |
Expeditors International of Washington Incorporated | | | | | | | | | | | 6,624 | | | | 374,190 | |
FedEx Corporation | | | | | | | | | | | 9,017 | | | | 1,759,668 | |
United Parcel Service Incorporated Class B | | | | | | | | | | | 25,348 | | | | 2,719,840 | |
| | | | |
| | | | | | | | | | | | | | | 5,255,529 | |
| | | | | | | | | | | | | | | | |
| | | | |
| Airlines: 0.35% | | | | | | | | | | | | | | | | |
Alaska Air Group Incorporated | | | | | | | | | | | 4,540 | | | | 418,679 | |
American Airlines Group Incorporated | | | | | | | | | | | 18,541 | | | | 784,284 | |
Delta Air Lines Incorporated | | | | | | | | | | | 26,876 | | | | 1,235,221 | |
Southwest Airlines Company | | | | | | | | | | | 22,628 | | | | 1,216,481 | |
United Continental Holdings Incorporated † | | | | | | | | | | | 10,529 | | | | 743,769 | |
| | | | |
| | | | | | | | | | | | | | | 4,398,434 | |
| | | | | | | | | | | | | | | | |
| | | | |
| Building Products: 0.20% | | | | | | | | | | | | | | | | |
Allegion plc | | | | | | | | | | | 3,510 | | | | 265,707 | |
Fortune Brands Home & Security Incorporated | | | | | | | | | | | 5,629 | | | | 342,525 | |
Johnson Controls International plc | | | | | | | | | | | 34,524 | | | | 1,454,151 | |
Masco Corporation | | | | | | | | | | | 11,780 | | | | 400,402 | |
| | | | |
| | | | | | | | | | | | | | | 2,462,785 | |
| | | | | | | | | | | | | | | | |
| | | | |
| Commercial Services & Supplies: 0.18% | | | | | | | | | | | | | | | | |
Cintas Corporation | | | | | | | | | | | 3,167 | | | | 400,752 | |
Republic Services Incorporated | | | | | | | | | | | 8,480 | | | | 532,629 | |
Stericycle Incorporated † | | | | | | | | | | | 3,129 | | | | 259,363 | |
Waste Management Incorporated | | | | | | | | | | | 14,877 | | | | 1,084,831 | |
| | | | |
| | | | | | | | | | | | | | | 2,277,575 | |
| | | | | | | | | | | | | | | | |
| | | | |
| Construction & Engineering: 0.06% | | | | | | | | | | | | | | | | |
Fluor Corporation | | | | | | | | | | | 5,125 | | | | 269,678 | |
Jacobs Engineering Group Incorporated | | | | | | | | | | | 4,452 | | | | 246,107 | |
Quanta Services Incorporated † | | | | | | | | | | | 5,561 | | | | 206,369 | |
| | | | |
| | | | | | | | | | | | | | | 722,154 | |
| | | | | | | | | | | | | | | | |
| | | | |
| Electrical Equipment: 0.33% | | | | | | | | | | | | | | | | |
Acuity Brands Incorporated | | | | | | | | | | | 1,621 | | | | 330,684 | |
AMETEK Incorporated | | | | | | | | | | | 8,439 | | | | 456,381 | |
Eaton Corporation plc | | | | | | | | | | | 16,539 | | | | 1,226,367 | |
Emerson Electric Company | | | | | | | | | | | 23,725 | | | | 1,420,179 | |
Rockwell Automation Incorporated | | | | | | | | | | | 4,729 | | | | 736,353 | |
| | | | |
| | | | | | | | | | | | | | | 4,169,964 | |
| | | | | | | | | | | | | | | | |
The accompanying notes are an integral part of these financial statements.
| | | | |
| 16 | | Wells Fargo Index Asset Allocation Fund | | Portfolio of investments—March 31, 2017 (unaudited) |
| | | | | | | | | | | | | | | | |
| Security name | | | | | | | | Shares | | | Value | |
| | | | |
| Industrial Conglomerates: 1.44% | | | | | | | | | | | | | | | | |
3M Company | | | | | | | | | | | 21,927 | | | $ | 4,195,293 | |
General Electric Company | | | | | | | | | | | 320,880 | | | | 9,562,224 | |
Honeywell International Incorporated | | | | | | | | | | | 27,996 | | | | 3,495,861 | |
Roper Industries Incorporated | | | | | | | | | | | 3,746 | | | | 773,512 | |
| | | | |
| | | | | | | | | | | | | | | 18,026,890 | |
| | | | | | | | | | | | | | | | |
| | | | |
| Machinery: 0.89% | | | | | | | | | | | | | | | | |
Caterpillar Incorporated | | | | | | | | | | | 21,569 | | | | 2,000,740 | |
Cummins Incorporated | | | | | | | | | | | 5,689 | | | | 860,177 | |
Deere & Company | | | | | | | | | | | 10,778 | | | | 1,173,293 | |
Dover Corporation | | | | | | | | | | | 5,719 | | | | 459,522 | |
Flowserve Corporation | | | | | | | | | | | 4,800 | | | | 232,416 | |
Fortive Corporation | | | | | | | | | | | 11,071 | | | | 666,696 | |
Illinois Tool Works Incorporated | | | | | | | | | | | 11,471 | | | | 1,519,563 | |
Ingersoll-Rand plc | | | | | | | | | | | 9,544 | | | | 776,118 | |
Paccar Incorporated | | | | | | | | | | | 12,905 | | | | 867,216 | |
Parker-Hannifin Corporation | | | | | | | | | | | 4,902 | | | | 785,889 | |
Pentair plc | | | | | | | | | | | 6,149 | | | | 386,034 | |
Snap-on Incorporated | | | | | | | | | | | 2,131 | | | | 359,436 | |
Stanley Black & Decker Incorporated | | | | | | | | | | | 5,612 | | | | 745,666 | |
Xylem Incorporated | | | | | | | | | | | 6,600 | | | | 331,452 | |
| | | | |
| | | | | | | | | | | | | | | 11,164,218 | |
| | | | | | | | | | | | | | | | |
| | | | |
| Professional Services: 0.16% | | | | | | | | | | | | | | | | |
Dun & Bradstreet Corporation | | | | | | | | | | | 1,353 | | | | 146,043 | |
Equifax Incorporated | | | | | | | | | | | 4,409 | | | | 602,887 | |
Nielsen Holdings plc | | | | | | | | | | | 12,361 | | | | 510,633 | |
Robert Half International Incorporated | | | | | | | | | | | 4,699 | | | | 229,452 | |
Verisk Analytics Incorporated † | | | | | | | | | | | 5,689 | | | | 461,605 | |
| | | | |
| | | | | | | | | | | | | | | 1,950,620 | |
| | | | | | | | | | | | | | | | |
| | | | |
| Road & Rail: 0.54% | | | | | | | | | | | | | | | | |
CSX Corporation | | | | | | | | | | | 34,073 | | | | 1,586,098 | |
J.B. Hunt Transport Services Incorporated | | | | | | | | | | | 3,193 | | | | 292,926 | |
Kansas City Southern | | | | | | | | | | | 3,921 | | | | 336,265 | |
Norfolk Southern Corporation | | | | | | | | | | | 10,686 | | | | 1,196,511 | |
Ryder System Incorporated | | | | | | | | | | | 1,965 | | | | 148,240 | |
Union Pacific Corporation | | | | | | | | | | | 29,929 | | | | 3,170,080 | |
| | | | |
| | | | | | | | | | | | | | | 6,730,120 | |
| | | | | | | | | | | | | | | | |
| | | | |
| Trading Companies & Distributors: 0.11% | | | | | | | | | | | | | | | | |
Fastenal Company | | | | | | | | | | | 10,638 | | | | 547,857 | |
United Rentals Incorporated † | | | | | | | | | | | 3,100 | | | | 387,655 | |
W.W. Grainger Incorporated | | | | | | | | | | | 1,990 | | | | 463,192 | |
| | | | |
| | | | | | | | | | | | | | | 1,398,704 | |
| | | | | | | | | | | | | | | | |
| | | | |
Information Technology: 13.16% | | | | | | | | | | | | | | | | |
| | | | |
| Communications Equipment: 0.64% | | | | | | | | | | | | | | | | |
Cisco Systems Incorporated | | | | | | | | | | | 184,179 | | | | 6,225,250 | |
F5 Networks Incorporated † | | | | | | | | | | | 2,382 | | | | 339,602 | |
The accompanying notes are an integral part of these financial statements.
| | | | | | |
| Portfolio of investments—March 31, 2017 (unaudited) | | Wells Fargo Index Asset Allocation Fund | | | 17 | |
| | | | | | | | | | | | | | | | |
| Security name | | | | | | | | Shares | | | Value | |
| | | | |
| Communications Equipment (continued) | | | | | | | | | | | | | | | | |
Harris Corporation | | | | | | | | | | | 4,577 | | | $ | 509,283 | |
Juniper Networks Incorporated | | | | | | | | | | | 14,048 | | | | 390,956 | |
Motorola Solutions Incorporated | | | | | | | | | | | 6,059 | | | | 522,407 | |
| | | | |
| | | | | | | | | | | | | | | 7,987,498 | |
| | | | | | | | | | | | | | | | |
| | | | |
| Electronic Equipment, Instruments & Components: 0.23% | | | | | | | | | | | | | | | | |
Amphenol Corporation Class A | | | | | | | | | | | 11,315 | | | | 805,289 | |
Corning Incorporated | | | | | | | | | | | 34,133 | | | | 921,591 | |
FLIR Systems Incorporated | | | | | | | | | | | 5,014 | | | | 181,908 | |
TE Connectivity Limited | | | | | | | | | | | 13,067 | | | | 974,145 | |
| | | | |
| | | | | | | | | | | | | | | 2,882,933 | |
| | | | | | | | | | | | | | | | |
| | | | |
| Internet Software & Services: 2.72% | | | | | | | | | | | | | | | | |
Akamai Technologies Incorporated † | | | | | | | | | | | 6,369 | | | | 380,229 | |
Alphabet Incorporated Class A † | | | | | | | | | | | 10,927 | | | | 9,263,911 | |
Alphabet Incorporated Class C † | | | | | | | | | | | 10,867 | | | | 9,014,829 | |
eBay Incorporated † | | | | | | | | | | | 37,180 | | | | 1,248,133 | |
Facebook Incorporated Class A † | | | | | | | | | | | 86,618 | | | | 12,304,087 | |
VeriSign Incorporated †« | | | | | | | | | | | 3,273 | | | | 285,111 | |
Yahoo! Incorporated † | | | | | | | | | | | 32,284 | | | | 1,498,300 | |
| | | | |
| | | | | | | | | | | | | | | 33,994,600 | |
| | | | | | | | | | | | | | | | |
| | | | |
| IT Services: 2.22% | | | | | | | | | | | | | | | | |
Accenture plc Class A | | | | | | | | | | | 22,899 | | | | 2,745,132 | |
Alliance Data Systems Corporation | | | | | | | | | | | 2,056 | | | | 511,944 | |
Automatic Data Processing Incorporated | | | | | | | | | | | 16,510 | | | | 1,690,459 | |
Cognizant Technology Solutions Corporation Class A † | | | | | | | | | | | 22,384 | | | | 1,332,296 | |
CSRA Incorporated | | | | | | | | | | | 5,338 | | | | 156,350 | |
Fidelity National Information Services Incorporated | | | | | | | | | | | 12,091 | | | | 962,685 | |
Fiserv Incorporated † | | | | | | | | | | | 7,891 | | | | 909,911 | |
Global Payments Incorporated | | | | | | | | | | | 5,600 | | | | 451,808 | |
International Business Machines Corporation | | | | | | | | | | | 31,567 | | | | 5,497,077 | |
MasterCard Incorporated Class A | | | | | | | | | | | 34,651 | | | | 3,897,198 | |
Paychex Incorporated | | | | | | | | | | | 11,745 | | | | 691,781 | |
PayPal Holdings Incorporated † | | | | | | | | | | | 41,303 | | | | 1,776,855 | |
Teradata Corporation † | | | | | | | | | | | 4,813 | | | | 149,781 | |
The Western Union Company « | | | | | | | | | | | 17,686 | | | | 359,910 | |
Total System Services Incorporated | | | | | | | | | | | 6,069 | | | | 324,449 | |
Visa Incorporated Class A | | | | | | | | | | | 68,334 | | | | 6,072,843 | |
Xerox Corporation | | | | | | | | | | | 31,406 | | | | 230,520 | |
| | | | |
| | | | | | | | | | | | | | | 27,760,999 | |
| | | | | | | | | | | | | | | | |
| | | | |
| Semiconductors & Semiconductor Equipment: 2.04% | | | | | | | | | | | | | | | | |
Advanced Micro Devices Incorporated † | | | | | | | | | | | 28,371 | | | | 412,798 | |
Analog Devices Incorporated | | | | | | | | | | | 13,386 | | | | 1,096,983 | |
Applied Materials Incorporated | | | | | | | | | | | 39,714 | | | | 1,544,875 | |
Broadcom Limited | | | | | | | | | | | 14,749 | | | | 3,229,441 | |
Intel Corporation | | | | | | | | | | | 173,886 | | | | 6,272,068 | |
KLA-Tencor Corporation | | | | | | | | | | | 5,764 | | | | 547,983 | |
The accompanying notes are an integral part of these financial statements.
| | | | |
| 18 | | Wells Fargo Index Asset Allocation Fund | | Portfolio of investments—March 31, 2017 (unaudited) |
| | | | | | | | | | | | | | | | |
| Security name | | | | | | | | Shares | | | Value | |
| | | | |
| Semiconductors & Semiconductor Equipment (continued) | | | | | | | | | | | | | | | | |
Lam Research Corporation | | | | | | | | | | | 5,989 | | | $ | 768,748 | |
Microchip Technology Incorporated | | | | | | | | | | | 7,959 | | | | 587,215 | |
Micron Technology Incorporated † | | | | | | | | | | | 38,123 | | | | 1,101,755 | |
NVIDIA Corporation | | | | | | | | | | | 21,662 | | | | 2,359,642 | |
Qorvo Incorporated † | | | | | | | | | | | 4,650 | | | | 318,804 | |
QUALCOMM Incorporated | | | | | | | | | | | 54,322 | | | | 3,114,823 | |
Skyworks Solutions Incorporated | | | | | | | | | | | 6,801 | | | | 666,362 | |
Texas Instruments Incorporated | | | | | | | | | | | 36,765 | | | | 2,961,788 | |
Xilinx Incorporated | | | | | | | | | | | 9,155 | | | | 529,983 | |
| | | | |
| | | | | | | | | | | | | | | 25,513,268 | |
| | | | | | | | | | | | | | | | |
| | | | |
| Software: 2.75% | | | | | | | | | | | | | | | | |
Activision Blizzard Incorporated | | | | | | | | | | | 25,440 | | | | 1,268,438 | |
Adobe Systems Incorporated † | | | | | | | | | | | 18,230 | | | | 2,372,270 | |
Autodesk Incorporated † | | | | | | | | | | | 7,203 | | | | 622,843 | |
CA Incorporated | | | | | | | | | | | 11,529 | | | | 365,700 | |
Citrix Systems Incorporated | | | | | | | | | | | 5,750 | | | | 479,493 | |
Electronic Arts Incorporated † | | | | | | | | | | | 11,337 | | | | 1,014,888 | |
Intuit Incorporated | | | | | | | | | | | 8,936 | | | | 1,036,487 | |
Microsoft Corporation | | | | | | | | | | | 284,203 | | | | 18,717,610 | |
Oracle Corporation | | | | | | | | | | | 110,226 | | | | 4,917,182 | |
Red Hat Incorporated † | | | | | | | | | | | 6,557 | | | | 567,181 | |
Salesforce.com Incorporated † | | | | | | | | | | | 24,086 | | | | 1,986,854 | |
Symantec Corporation | | | | | | | | | | | 22,759 | | | | 698,246 | |
Synopsys Incorporated † | | | | | | | | | | | 5,535 | | | | 399,240 | |
| | | | |
| | | | | | | | | | | | | | | 34,446,432 | |
| | | | | | | | | | | | | | | | |
| | | | |
| Technology Hardware, Storage & Peripherals: 2.56% | | | | | | | | | | | | | | | | |
Apple Incorporated | | | | | | | | | | | 192,958 | | | | 27,720,346 | |
Hewlett Packard Enterprise Company | | | | | | | | | | | 61,229 | | | | 1,451,127 | |
HP Incorporated | | | | | | | | | | | 62,279 | | | | 1,113,549 | |
NetApp Incorporated | | | | | | | | | | | 9,964 | | | | 416,993 | |
Seagate Technology plc | | | | | | | | | | | 10,856 | | | | 498,616 | |
Western Digital Corporation | | | | | | | | | | | 10,594 | | | | 874,323 | |
| | | | |
| | | | | | | | | | | | | | | 32,074,954 | |
| | | | | | | | | | | | | | | | |
| | | | |
Materials: 1.69% | | | | | | | | | | | | | | | | |
| | | | |
| Chemicals: 1.26% | | | | | | | | | | | | | | | | |
Air Products & Chemicals Incorporated | | | | | | | | | | | 8,002 | | | | 1,082,591 | |
Albemarle Corporation | | | | | | | | | | | 4,139 | | | | 437,244 | |
CF Industries Holdings Incorporated | | | | | | | | | | | 8,573 | | | | 251,618 | |
E.I. du Pont de Nemours & Company | | | | | | | | | | | 31,797 | | | | 2,554,253 | |
Eastman Chemical Company | | | | | | | | | | | 5,387 | | | | 435,270 | |
Ecolab Incorporated | | | | | | | | | | | 9,656 | | | | 1,210,283 | |
FMC Corporation | | | | | | | | | | | 4,917 | | | | 342,174 | |
International Flavors & Fragrances Incorporated | | | | | | | | | | | 2,906 | | | | 385,132 | |
LyondellBasell Industries NV Class A | | | | | | | | | | | 12,139 | | | | 1,106,955 | |
Monsanto Company | | | | | | | | | | | 16,127 | | | | 1,825,576 | |
PPG Industries Incorporated | | | | | | | | | | | 9,455 | | | | 993,531 | |
The accompanying notes are an integral part of these financial statements.
| | | | | | |
| Portfolio of investments—March 31, 2017 (unaudited) | | Wells Fargo Index Asset Allocation Fund | | | 19 | |
| | | | | | | | | | | | | | | | |
| Security name | | | | | | | | Shares | | | Value | |
| | | | |
| Chemicals (continued) | | | | | | | | | | | | | | | | |
Praxair Incorporated | | | | | | | | | | | 10,484 | | | $ | 1,243,402 | |
The Dow Chemical Company | | | | | | | | | | | 41,053 | | | | 2,608,508 | |
The Mosaic Company | | | | | | | | | | | 12,880 | | | | 375,838 | |
The Sherwin-Williams Company | | | | | | | | | | | 2,984 | | | | 925,607 | |
| | | | |
| | | | | | | | | | | | | | | 15,777,982 | |
| | | | | | | | | | | | | | | | |
| | | | |
| Construction Materials: 0.09% | | | | | | | | | | | | | | | | |
Martin Marietta Materials Incorporated | | | | | | | | | | | 2,319 | | | | 506,122 | |
Vulcan Materials Company | | | | | | | | | | | 4,867 | | | | 586,376 | |
| | | | |
| | | | | | | | | | | | | | | 1,092,498 | |
| | | | | | | | | | | | | | | | |
| | | | |
| Containers & Packaging: 0.18% | | | | | | | | | | | | | | | | |
Avery Dennison Corporation | | | | | | | | | | | 3,288 | | | | 265,013 | |
Ball Corporation | | | | | | | | | | | 6,438 | | | | 478,086 | |
International Paper Company | | | | | | | | | | | 15,125 | | | | 768,048 | |
Sealed Air Corporation | | | | | | | | | | | 7,115 | | | | 310,072 | |
WestRock Company | | | | | | | | | | | 9,209 | | | | 479,144 | |
| | | | |
| | | | | | | | | | | | | | | 2,300,363 | |
| | | | | | | | | | | | | | | | |
| | | | |
| Metals & Mining: 0.16% | | | | | | | | | | | | | | | | |
Freeport-McMoRan Incorporated † | | | | | | | | | | | 48,905 | | | | 653,371 | |
Newmont Mining Corporation | | | | | | | | | | | 19,548 | | | | 644,302 | |
Nucor Corporation | | | | | | | | | | | 11,727 | | | | 700,336 | |
| | | | |
| | | | | | | | | | | | | | | 1,998,009 | |
| | | | | | | | | | | | | | | | |
| | | | |
Real Estate: 1.74% | | | | | | | | | | | | | | | | |
| | | | |
| Equity REITs: 1.71% | | | | | | | | | | | | | | | | |
Alexandria Real Estate Equities Incorporated | | | | | | | | | | | 3,267 | | | | 361,069 | |
American Tower Corporation | | | | | | | | | | | 15,711 | | | | 1,909,515 | |
Apartment Investment & Management Company Class A | | | | | | | | | | | 5,775 | | | | 256,121 | |
AvalonBay Communities Incorporated | | | | | | | | | | | 5,050 | | | | 927,180 | |
Boston Properties Incorporated | | | | | | | | | | | 5,657 | | | | 749,043 | |
Crown Castle International Corporation | | | | | | | | | | | 13,260 | | | | 1,252,407 | |
Digital Realty Trust Incorporated | | | | | | | | | | | 5,857 | | | | 623,126 | |
Equinix Incorporated | | | | | | | | | | | 2,634 | | | | 1,054,575 | |
Equity Residential | | | | | | | | | | | 13,501 | | | | 840,032 | |
Essex Property Trust Incorporated | | | | | | | | | | | 2,410 | | | | 557,987 | |
Extra Space Storage Incorporated | | | | | | | | | | | 4,630 | | | | 344,426 | |
Federal Realty Investment Trust | | | | | | | | | | | 2,651 | | | | 353,909 | |
GGP Incorporated | | | | | | | | | | | 21,481 | | | | 497,930 | |
HCP Incorporated | | | | | | | | | | | 17,219 | | | | 538,610 | |
Host Hotels & Resorts Incorporated | | | | | | | | | | | 27,188 | | | | 507,328 | |
Iron Mountain Incorporated | | | | | | | | | | | 9,020 | | | | 321,743 | |
Kimco Realty Corporation | | | | | | | | | | | 15,654 | | | | 345,797 | |
Mid-America Apartment Communities Incorporated | | | | | | | | | | | 4,176 | | | | 424,866 | |
Prologis Incorporated | | | | | | | | | | | 19,468 | | | | 1,010,000 | |
Public Storage Incorporated | | | | | | | | | | | 5,492 | | | | 1,202,254 | |
Realty Income Corporation | | | | | | | | | | | 9,970 | | | | 593,514 | |
The accompanying notes are an integral part of these financial statements.
| | | | |
| 20 | | Wells Fargo Index Asset Allocation Fund | | Portfolio of investments—March 31, 2017 (unaudited) |
| | | | | | | | | | | | | | | | |
| Security name | | | | | | | | Shares | | | Value | |
| | | | |
| Equity REITs (continued) | | | | | | | | | | | | | | | | |
Regency Centers Corporation | | | | | | | | | | | 5,370 | | | $ | 356,514 | |
Simon Property Group Incorporated | | | | | | | | | | | 11,762 | | | | 2,023,417 | |
SL Green Realty Corporation | | | | | | | | | | | 3,698 | | | | 394,281 | |
The Macerich Company | | | | | | | | | | | 4,445 | | | | 286,258 | |
UDR Incorporated | | | | | | | | | | | 9,829 | | | | 356,400 | |
Ventas Incorporated | | | | | | | | | | | 13,042 | | | | 848,252 | |
Vornado Realty Trust | | | | | | | | | | | 6,330 | | | | 634,962 | |
Welltower Incorporated | | | | | | | | | | | 13,334 | | | | 944,314 | |
Weyerhaeuser Company | | | | | | | | | | | 27,547 | | | | 936,047 | |
| | | | |
| | | | | | | | | | | | | | | 21,451,877 | |
| | | | | | | | | | | | | | | | |
| | | | |
| Real Estate Management & Development: 0.03% | | | | | | | | | | | | | | | | |
CBRE Group Incorporated Class A † | | | | | | | | | | | 11,057 | | | | 384,673 | |
| | | | | | | | | | | | | | | | |
| | | | |
Telecommunication Services: 1.42% | | | | | | | | | | | | | | | | |
| | | | |
| Diversified Telecommunication Services: 1.42% | | | | | | | | | | | | | | | | |
AT&T Incorporated | | | | | | | | | | | 225,875 | | | | 9,385,106 | |
CenturyLink Incorporated « | | | | | | | | | | | 20,102 | | | | 473,804 | |
Level 3 Communications Incorporated † | | | | | | | | | | | 10,745 | | | | 614,829 | |
Verizon Communications Incorporated | | | | | | | | | | | 149,918 | | | | 7,308,503 | |
| | | | |
| | | | | | | | | | | | | | | 17,782,242 | |
| | | | | | | | | | | | | | | | |
| | | | |
Utilities: 1.90% | | | | | | | | | | | | | | | | |
| | | | |
| Electric Utilities: 1.19% | | | | | | | | | | | | | | | | |
Alliant Energy Corporation | | | | | | | | | | | 8,373 | | | | 331,655 | |
American Electric Power Company Incorporated | | | | | | | | | | | 18,084 | | | | 1,213,979 | |
Duke Energy Corporation | | | | | | | | | | | 25,730 | | | | 2,110,117 | |
Edison International | | | | | | | | | | | 11,982 | | | | 953,887 | |
Entergy Corporation | | | | | | | | | | | 6,597 | | | | 501,108 | |
Eversource Energy | | | | | | | | | | | 11,654 | | | | 685,022 | |
Exelon Corporation | | | | | | | | | | | 34,078 | | | | 1,226,126 | |
FirstEnergy Corporation | | | | | | | | | | | 16,273 | | | | 517,807 | |
NextEra Energy Incorporated | | | | | | | | | | | 17,197 | | | | 2,207,579 | |
PG&E Corporation | | | | | | | | | | | 18,643 | | | | 1,237,149 | |
Pinnacle West Capital Corporation | | | | | | | | | | | 4,094 | | | | 341,358 | |
PPL Corporation | | | | | | | | | | | 24,999 | | | | 934,713 | |
The Southern Company | | | | | | | | | | | 36,449 | | | | 1,814,431 | |
Xcel Energy Incorporated | | | | | | | | | | | 18,655 | | | | 829,215 | |
| | | | |
| | | | | | | | | | | | | | | 14,904,146 | |
| | | | | | | | | | | | | | | | |
| | | | |
| Independent Power & Renewable Electricity Producers: 0.04% | | | | | | | | | | | | | | | | |
AES Corporation | | | | | | | | | | | 24,244 | | | | 271,048 | |
NRG Energy Incorporated | | | | | | | | | | | 11,620 | | | | 217,294 | |
| | | | |
| | | | | | | | | | | | | | | 488,342 | |
| | | | | | | | | | | | | | | | |
| | | | |
| Multi-Utilities: 0.63% | | | | | | | | | | | | | | | | |
Ameren Corporation | | | | | | | | | | | 8,924 | | | | 487,161 | |
CenterPoint Energy Incorporated | | | | | | | | | | | 15,840 | | | | 436,709 | |
The accompanying notes are an integral part of these financial statements.
| | | | | | |
| Portfolio of investments—March 31, 2017 (unaudited) | | Wells Fargo Index Asset Allocation Fund | | | 21 | |
| | | | | | | | | | | | | | | | |
| Security name | | | | | | | | Shares | | | Value | |
| | | | |
| Multi-Utilities (continued) | | | | | | | | | | | | | | | | |
CMS Energy Corporation | | | | | | | | | | | 10,294 | | | $ | 460,554 | |
Consolidated Edison Incorporated | | | | | | | | | | | 11,220 | | | | 871,345 | |
Dominion Resources Incorporated | | | | | | | | | | | 23,101 | | | | 1,791,945 | |
DTE Energy Company | | | | | | | | | | | 6,598 | | | | 673,722 | |
NiSource Incorporated | | | | | | | | | | | 11,896 | | | | 283,006 | |
Public Service Enterprise Group Incorporated | | | | | | | | | | | 18,618 | | | | 825,708 | |
SCANA Corporation | | | | | | | | | | | 5,256 | | | | 343,480 | |
Sempra Energy | | | | | | | | | | | 9,215 | | | | 1,018,258 | |
WEC Energy Group Incorporated | | | | | | | | | | | 11,607 | | | | 703,732 | |
| | | | |
| | | | | | | | | | | | | | | 7,895,620 | |
| | | | | | | | | | | | | | | | |
| | | | |
| Water Utilities: 0.04% | | | | | | | | | | | | | | | | |
American Water Works Company Incorporated | | | | | | | | | | | 6,554 | | | | 509,705 | |
| | | | | | | | | | | | | | | | |
| | | | |
Total Common Stocks (Cost $426,243,617) | | | | | | | | | | | | | | | 745,533,066 | |
| | | | | | | | | | | | | | | | |
| | | | |
| | | Interest rate | | | Maturity date | | | Principal | | | | |
| Non-Agency Mortgage-Backed Securities: 0.00% | | | | | | | | | | | | | | | | |
Citigroup Mortgage Loan Trust Incorporated Series 2004-HYB4 Class AA ± | | | 1.31 | % | | | 12-25-2034 | | | $ | 15,748 | | | | 13,868 | |
| | | | | | | | | | | | | | | | |
| | | | |
Total Non-Agency Mortgage-Backed Securities (Cost $15,748) | | | | | | | | | | | | | | | 13,868 | |
| | | | | | | | | | | | | | | | |
| | | | |
| | | | | | Expiration date | | | Shares | | | | |
| Rights: 0.00% | | | | | | | | | | | | | | | | |
| | | | |
Consumer Staples: 0.00% | | | | | | | | | | | | | | | | |
| | | | |
| Food & Staples Retailing: 0.00% | | | | | | | | | | | | | | | | |
Safeway Casa Ley Contingent Value Rights †(a)(i) | | | | | | | 1-30-2019 | | | | 6,765 | | | | 0 | |
Safeway PDC LLC Contingent Value Rights †(a)(i) | | | | | | | 1-30-2017 | | | | 6,765 | | | | 0 | |
| | | | |
| | | | | | | | | | | | | | | 0 | |
| | | | | | | | | | | | | | | | |
| | | | |
Total Rights (Cost $7,171) | | | | | | | | | | | | | | | 0 | |
| | | | | | | | | | | | | | | | |
| | | | |
| | | | | | Maturity date | | | Principal | | | | |
| U.S. Treasury Securities: 38.12% | | | | | | | | | | | | | | | | |
U.S. Treasury Bond | | | 2.75 | | | | 8-15-2042 | | | $ | 1,340,000 | | | | 1,277,083 | |
U.S. Treasury Bond | | | 2.75 | | | | 11-15-2042 | | | | 1,781,000 | | | | 1,695,359 | |
U.S. Treasury Bond | | | 2.88 | | | | 5-15-2043 | | | | 2,534,000 | | | | 2,466,591 | |
U.S. Treasury Bond | | | 3.00 | | | | 5-15-2042 | | | | 904,000 | | | | 903,611 | |
U.S. Treasury Bond | | | 3.13 | | | | 11-15-2041 | | | | 846,000 | | | | 865,564 | |
U.S. Treasury Bond | | | 3.13 | | | | 2-15-2042 | | | | 1,066,000 | | | | 1,090,443 | |
U.S. Treasury Bond | | | 3.13 | | | | 2-15-2043 | | | | 1,783,000 | | | | 1,817,963 | |
U.S. Treasury Bond | | | 3.50 | | | | 2-15-2039 | | | | 731,000 | | | | 804,300 | |
U.S. Treasury Bond | | | 3.63 | | | | 8-15-2043 | | | | 2,200,000 | | | | 2,449,132 | |
U.S. Treasury Bond | | | 3.75 | | | | 8-15-2041 | | | | 929,000 | | | | 1,053,435 | |
U.S. Treasury Bond | | | 3.88 | | | | 8-15-2040 | | | | 946,000 | | | | 1,093,332 | |
U.S. Treasury Bond | | | 4.25 | | | | 5-15-2039 | | | | 681,000 | | | | 831,405 | |
U.S. Treasury Bond | | | 4.25 | | | | 11-15-2040 | | | | 977,000 | | | | 1,192,513 | |
U.S. Treasury Bond | | | 4.38 | | | | 2-15-2038 | | | | 381,000 | | | | 475,298 | |
U.S. Treasury Bond | | | 4.38 | | | | 11-15-2039 | | | | 757,000 | | | | 939,301 | |
The accompanying notes are an integral part of these financial statements.
| | | | |
| 22 | | Wells Fargo Index Asset Allocation Fund | | Portfolio of investments—March 31, 2017 (unaudited) |
| | | | | | | | | | | | | | | | |
| Security name | | Interest rate | | | Maturity date | | | Principal | | | Value | |
| | | | |
U.S. Treasury Securities (continued) | | | | | | | | | | | | | | | | |
U.S. Treasury Bond | | | 4.38 | % | | | 5-15-2040 | | | $ | 1,078,000 | | | $ | 1,338,152 | |
U.S. Treasury Bond | | | 4.38 | | | | 5-15-2041 | | | | 842,000 | | | | 1,048,323 | |
U.S. Treasury Bond | | | 4.50 | | | | 2-15-2036 | | | | 837,000 | | | | 1,061,255 | |
U.S. Treasury Bond | | | 4.50 | | | | 5-15-2038 | | | | 428,000 | | | | 542,691 | |
U.S. Treasury Bond | | | 4.50 | | | | 8-15-2039 | | | | 721,000 | | | | 910,375 | |
U.S. Treasury Bond | | | 4.63 | | | | 2-15-2040 | | | | 1,276,000 | | | | 1,638,514 | |
U.S. Treasury Bond | | | 4.75 | | | | 2-15-2037 | | | | 264,000 | | | | 344,602 | |
U.S. Treasury Bond | | | 4.75 | | | | 2-15-2041 | | | | 1,084,000 | | | | 1,419,109 | |
U.S. Treasury Bond | | | 5.00 | | | | 5-15-2037 | | | | 375,000 | | | | 504,228 | |
U.S. Treasury Bond | | | 5.25 | | | | 11-15-2028 | | | | 479,000 | | | | 611,979 | |
U.S. Treasury Bond | | | 5.25 | | | | 2-15-2029 | | | | 349,000 | | | | 447,374 | |
U.S. Treasury Bond | | | 5.38 | | | | 2-15-2031 | | | | 752,000 | | | | 1,003,949 | |
U.S. Treasury Bond | | | 5.50 | | | | 8-15-2028 | | | | 369,000 | | | | 479,037 | |
U.S. Treasury Bond | | | 6.00 | | | | 2-15-2026 | | | | 445,000 | | | | 575,110 | |
U.S. Treasury Bond | | | 6.13 | | | | 11-15-2027 | | | | 525,000 | | | | 706,248 | |
U.S. Treasury Bond | | | 6.13 | | | | 8-15-2029 | | | | 293,000 | | | | 405,736 | |
U.S. Treasury Bond | | | 6.25 | | | | 5-15-2030 | | | | 478,000 | | | | 677,378 | |
U.S. Treasury Bond | | | 6.38 | | | | 8-15-2027 | | | | 224,000 | | | | 305,165 | |
U.S. Treasury Note | | | 0.50 | | | | 7-31-2017 | | | | 1,713,000 | | | | 1,711,390 | |
U.S. Treasury Note | | | 0.63 | | | | 6-30-2017 | | | | 1,440,000 | | | | 1,439,325 | |
U.S. Treasury Note | | | 0.63 | | | | 7-31-2017 | | | | 1,401,000 | | | | 1,400,014 | |
U.S. Treasury Note | | | 0.63 | | | | 8-31-2017 | | | | 3,435,000 | | | | 3,431,510 | |
U.S. Treasury Note | | | 0.63 | | | | 9-30-2017 | | | | 3,180,000 | | | | 3,175,529 | |
U.S. Treasury Note | | | 0.63 | | | | 11-30-2017 | | | | 1,966,000 | | | | 1,961,315 | |
U.S. Treasury Note | | | 0.63 | | | | 4-30-2018 | | | | 1,753,000 | | | | 1,743,825 | |
U.S. Treasury Note | | | 0.63 | | | | 6-30-2018 | | | | 1,609,000 | | | | 1,598,881 | |
U.S. Treasury Note | | | 0.75 | | | | 6-30-2017 | | | | 1,845,000 | | | | 1,844,568 | |
U.S. Treasury Note | | | 0.75 | | | | 10-31-2017 | | | | 3,139,000 | | | | 3,135,321 | |
U.S. Treasury Note | | | 0.75 | | | | 12-31-2017 | | | | 1,742,000 | | | | 1,738,462 | |
U.S. Treasury Note | | | 0.75 | | | | 1-31-2018 | | | | 1,502,000 | | | | 1,498,362 | |
U.S. Treasury Note | | | 0.75 | | | | 2-28-2018 | | | | 3,204,000 | | | | 3,194,612 | |
U.S. Treasury Note | | | 0.75 | | | | 3-31-2018 | | | | 1,422,000 | | | | 1,417,224 | |
U.S. Treasury Note | | | 0.75 | | | | 4-15-2018 | | | | 1,350,000 | | | | 1,345,253 | |
U.S. Treasury Note | | | 0.75 | | | | 4-30-2018 | | | | 1,588,000 | | | | 1,581,921 | |
U.S. Treasury Note | | | 0.75 | | | | 7-31-2018 | | | | 1,717,000 | | | | 1,707,946 | |
U.S. Treasury Note | | | 0.75 | | | | 8-31-2018 | | | | 1,718,000 | | | | 1,708,135 | |
U.S. Treasury Note | | | 0.75 | | | | 9-30-2018 | | | | 1,732,000 | | | | 1,720,770 | |
U.S. Treasury Note | | | 0.75 | | | | 10-31-2018 | | | | 1,732,000 | | | | 1,719,687 | |
U.S. Treasury Note | | | 0.75 | | | | 2-15-2019 | | | | 1,392,000 | | | | 1,379,386 | |
U.S. Treasury Note | | | 0.75 | | | | 7-15-2019 | | | | 1,583,000 | | | | 1,561,976 | |
U.S. Treasury Note | | | 0.75 | | | | 8-15-2019 | | | | 1,584,000 | | | | 1,561,601 | |
U.S. Treasury Note | | | 0.88 | | | | 7-15-2017 | | | | 1,515,000 | | | | 1,515,118 | |
U.S. Treasury Note | | | 0.88 | | | | 8-15-2017 | | | | 1,518,000 | | | | 1,518,118 | |
U.S. Treasury Note | | | 0.88 | | | | 10-15-2017 | | | | 1,521,000 | | | | 1,520,405 | |
U.S. Treasury Note | | | 0.88 | | | | 11-15-2017 | | | | 1,445,000 | | | | 1,444,210 | |
U.S. Treasury Note | | | 0.88 | | | | 11-30-2017 | | | | 1,474,000 | | | | 1,472,964 | |
U.S. Treasury Note | | | 0.88 | | | | 1-15-2018 | | | | 1,339,000 | | | | 1,337,431 | |
U.S. Treasury Note | | | 0.88 | | | | 1-31-2018 | | | | 1,231,000 | | | | 1,229,268 | |
U.S. Treasury Note | | | 0.88 | | | | 3-31-2018 | | | | 1,577,000 | | | | 1,573,797 | |
U.S. Treasury Note | | | 0.88 | | | | 5-31-2018 | | | | 1,585,000 | | | | 1,580,418 | |
The accompanying notes are an integral part of these financial statements.
| | | | | | |
| Portfolio of investments—March 31, 2017 (unaudited) | | Wells Fargo Index Asset Allocation Fund | | | 23 | |
| | | | | | | | | | | | | | | | |
| Security name | | Interest rate | | | Maturity date | | | Principal | | | Value | |
| | | | |
U.S. Treasury Securities (continued) | | | | | | | | | | | | | | | | |
U.S. Treasury Note | | | 0.88 | % | | | 7-15-2018 | | | $ | 1,294,000 | | | $ | 1,289,501 | |
U.S. Treasury Note | | | 0.88 | | | | 10-15-2018 | | | | 1,390,000 | | | | 1,383,321 | |
U.S. Treasury Note | | | 0.88 | | | | 4-15-2019 | | | | 1,460,000 | | | | 1,448,024 | |
U.S. Treasury Note | | | 0.88 | | | | 5-15-2019 | | | | 1,466,000 | | | | 1,452,944 | |
U.S. Treasury Note | | | 0.88 | | | | 6-15-2019 | | | | 1,485,000 | | | | 1,470,555 | |
U.S. Treasury Note | | | 0.88 | | | | 7-31-2019 | | | | 811,000 | | | | 802,320 | |
U.S. Treasury Note | | | 0.88 | | | | 9-15-2019 | | | | 1,550,000 | | | | 1,530,867 | |
U.S. Treasury Note | | | 1.00 | | | | 9-15-2017 | | | | 1,515,000 | | | | 1,515,711 | |
U.S. Treasury Note | | | 1.00 | | | | 12-15-2017 | | | | 1,405,000 | | | | 1,404,945 | |
U.S. Treasury Note | | | 1.00 | | | | 12-31-2017 | | | | 1,473,000 | | | | 1,472,770 | |
U.S. Treasury Note | | | 1.00 | | | | 2-15-2018 | | | | 1,336,000 | | | | 1,335,321 | |
U.S. Treasury Note | | | 1.00 | | | | 3-15-2018 | | | | 1,338,000 | | | | 1,336,955 | |
U.S. Treasury Note | | | 1.00 | | | | 5-15-2018 | | | | 1,328,000 | | | | 1,326,236 | |
U.S. Treasury Note | | | 1.00 | | | | 5-31-2018 | | | | 1,878,000 | | | | 1,875,213 | |
U.S. Treasury Note | | | 1.00 | | | | 8-15-2018 | | | | 1,291,000 | | | | 1,288,175 | |
U.S. Treasury Note | | | 1.00 | | | | 9-15-2018 | | | | 1,292,000 | | | | 1,288,669 | |
U.S. Treasury Note | | | 1.00 | | | | 11-30-2018 | | | | 1,540,000 | | | | 1,534,585 | |
U.S. Treasury Note | | | 1.00 | | | | 3-15-2019 | | | | 1,383,000 | | | | 1,375,815 | |
U.S. Treasury Note | | | 1.00 | | | | 6-30-2019 | | | | 622,000 | | | | 617,529 | |
U.S. Treasury Note | | | 1.00 | | | | 8-31-2019 | | | | 1,842,000 | | | | 1,825,523 | |
U.S. Treasury Note | | | 1.00 | | | | 9-30-2019 | | | | 1,695,000 | | | | 1,678,513 | |
U.S. Treasury Note | | | 1.00 | | | | 10-15-2019 | | | | 1,596,000 | | | | 1,579,916 | |
U.S. Treasury Note | | | 1.00 | | | | 11-15-2019 | | | | 1,433,000 | | | | 1,417,046 | |
U.S. Treasury Note | | | 1.00 | | | | 11-30-2019 | | | | 1,985,000 | | | | 1,963,056 | |
U.S. Treasury Note | | | 1.13 | | | | 6-15-2018 | | | | 1,326,000 | | | | 1,325,741 | |
U.S. Treasury Note | | | 1.13 | | | | 1-15-2019 | | | | 1,444,000 | | | | 1,441,180 | |
U.S. Treasury Note | | | 1.13 | | | | 1-31-2019 | | | | 1,783,000 | | | | 1,779,309 | |
U.S. Treasury Note | | | 1.13 | | | | 5-31-2019 | | | | 690,000 | | | | 687,413 | |
U.S. Treasury Note | | | 1.13 | | | | 12-31-2019 | | | | 1,247,000 | | | | 1,236,186 | |
U.S. Treasury Note | | | 1.13 | | | | 3-31-2020 | | | | 1,987,000 | | | | 1,963,869 | |
U.S. Treasury Note | | | 1.13 | | | | 4-30-2020 | | | | 1,330,000 | | | | 1,313,064 | |
U.S. Treasury Note | | | 1.13 | | | | 2-28-2021 | | | | 3,264,000 | | | | 3,184,313 | |
U.S. Treasury Note | | | 1.13 | | | | 6-30-2021 | | | | 3,343,000 | | | | 3,245,976 | |
U.S. Treasury Note | | | 1.13 | | | | 7-31-2021 | | | | 2,232,000 | | | | 2,164,431 | |
U.S. Treasury Note | | | 1.13 | | | | 8-31-2021 | | | | 2,233,000 | | | | 2,163,219 | |
U.S. Treasury Note | | | 1.13 | | | | 9-30-2021 | | | | 2,188,000 | | | | 2,116,634 | |
U.S. Treasury Note | | | 1.25 | | | | 10-31-2018 | | | | 1,759,000 | | | | 1,760,237 | |
U.S. Treasury Note | | | 1.25 | | | | 11-15-2018 | | | | 1,370,000 | | | | 1,370,856 | |
U.S. Treasury Note | | | 1.25 | | | | 11-30-2018 | | | | 1,654,000 | | | | 1,654,969 | |
U.S. Treasury Note | | | 1.25 | | | | 12-15-2018 | | | | 1,363,000 | | | | 1,363,639 | |
U.S. Treasury Note | | | 1.25 | | | | 12-31-2018 | | | | 1,788,000 | | | | 1,788,699 | |
U.S. Treasury Note | | | 1.25 | | | | 1-31-2019 | | | | 1,335,000 | | | | 1,335,312 | |
U.S. Treasury Note | | | 1.25 | | | | 4-30-2019 | | | | 586,000 | | | | 585,611 | |
U.S. Treasury Note | | | 1.25 | | | | 10-31-2019 | | | | 804,000 | | | | 800,766 | |
U.S. Treasury Note | | | 1.25 | | | | 1-31-2020 | | | | 3,442,000 | | | | 3,419,548 | |
U.S. Treasury Note | | | 1.25 | | | | 2-29-2020 | | | | 1,745,000 | | | | 1,732,389 | |
U.S. Treasury Note | | | 1.25 | | | | 3-31-2021 | | | | 3,250,000 | | | | 3,182,462 | |
U.S. Treasury Note | | | 1.25 | | | | 10-31-2021 | | | | 2,188,000 | | | | 2,126,548 | |
U.S. Treasury Note | | | 1.25 | | | | 7-31-2023 | | | | 1,829,000 | | | | 1,730,763 | |
U.S. Treasury Note | | | 1.38 | | | | 6-30-2018 | | | | 1,357,000 | | | | 1,360,976 | |
The accompanying notes are an integral part of these financial statements.
| | | | |
| 24 | | Wells Fargo Index Asset Allocation Fund | | Portfolio of investments—March 31, 2017 (unaudited) |
| | | | | | | | | | | | | | | | |
| Security name | | Interest rate | | | Maturity date | | | Principal | | | Value | |
| | | | |
U.S. Treasury Securities (continued) | | | | | | | | | | | | | | | | |
U.S. Treasury Note | | | 1.38 | % | | | 7-31-2018 | | | $ | 1,610,000 | | | $ | 1,614,592 | |
U.S. Treasury Note | | | 1.38 | | | | 9-30-2018 | | | | 2,875,000 | | | | 2,883,200 | |
U.S. Treasury Note | | | 1.38 | | | | 11-30-2018 | | | | 787,000 | | | | 789,152 | |
U.S. Treasury Note | | | 1.38 | | | | 12-31-2018 | | | | 968,000 | | | | 970,420 | |
U.S. Treasury Note | | | 1.38 | | | | 2-28-2019 | | | | 1,295,000 | | | | 1,297,985 | |
U.S. Treasury Note | | | 1.38 | | | | 12-15-2019 | | | | 1,651,000 | | | | 1,647,647 | |
U.S. Treasury Note | | | 1.38 | | | | 1-15-2020 | | | | 1,638,000 | | | | 1,633,969 | |
U.S. Treasury Note | | | 1.38 | | | | 1-31-2020 | | | | 2,293,000 | | | | 2,286,731 | |
U.S. Treasury Note | | | 1.38 | | | | 2-29-2020 | | | | 3,442,000 | | | | 3,428,421 | |
U.S. Treasury Note | | | 1.38 | | | | 3-31-2020 | | | | 3,442,000 | | | | 3,426,673 | |
U.S. Treasury Note | | | 1.38 | | | | 4-30-2020 | | | | 3,442,000 | | | | 3,423,176 | |
U.S. Treasury Note | | | 1.38 | | | | 5-31-2020 | | | | 1,380,000 | | | | 1,371,160 | |
U.S. Treasury Note | | | 1.38 | | | | 8-31-2020 | | | | 3,350,000 | | | | 3,318,724 | |
U.S. Treasury Note | | | 1.38 | | | | 9-30-2020 | | | | 3,356,000 | | | | 3,322,178 | |
U.S. Treasury Note | | | 1.38 | | | | 10-31-2020 | | | | 3,178,000 | | | | 3,142,991 | |
U.S. Treasury Note | | | 1.38 | | | | 1-31-2021 | | | | 3,192,000 | | | | 3,146,986 | |
U.S. Treasury Note | | | 1.38 | | | | 4-30-2021 | | | | 3,245,000 | | | | 3,190,241 | |
U.S. Treasury Note | | | 1.38 | | | | 5-31-2021 | | | | 3,248,000 | | | | 3,189,890 | |
U.S. Treasury Note | | | 1.38 | | | | 6-30-2023 | | | | 1,733,000 | | | | 1,655,285 | |
U.S. Treasury Note | | | 1.38 | | | | 8-31-2023 | | | | 1,817,000 | | | | 1,731,118 | |
U.S. Treasury Note | | | 1.38 | | | | 9-30-2023 | | | | 1,778,000 | | | | 1,691,948 | |
U.S. Treasury Note | | | 1.50 | | | | 8-31-2018 | | | | 2,781,000 | | | | 2,793,275 | |
U.S. Treasury Note | | | 1.50 | | | | 12-31-2018 | | | | 1,855,000 | | | | 1,863,550 | |
U.S. Treasury Note | | | 1.50 | | | | 1-31-2019 | | | | 1,716,000 | | | | 1,723,842 | |
U.S. Treasury Note | | | 1.50 | | | | 2-28-2019 | | | | 1,826,000 | | | | 1,834,416 | |
U.S. Treasury Note | | | 1.50 | | | | 3-31-2019 | | | | 645,000 | | | | 648,024 | |
U.S. Treasury Note | | | 1.50 | | | | 5-31-2019 | | | | 2,387,000 | | | | 2,396,885 | |
U.S. Treasury Note | | | 1.50 | | | | 10-31-2019 | | | | 3,442,000 | | | | 3,448,320 | |
U.S. Treasury Note | | | 1.50 | | | | 11-30-2019 | | | | 3,133,000 | | | | 3,137,894 | |
U.S. Treasury Note | | | 1.50 | | | | 5-31-2020 | | | | 3,442,000 | | | | 3,432,992 | |
U.S. Treasury Note | | | 1.50 | | | | 1-31-2022 | | | | 1,625,000 | | | | 1,592,817 | |
U.S. Treasury Note | | | 1.50 | | | | 2-28-2023 | | | | 1,635,000 | | | | 1,580,265 | |
U.S. Treasury Note | | | 1.50 | | | | 3-31-2023 | | | | 1,679,000 | | | | 1,620,693 | |
U.S. Treasury Note | | | 1.50 | | | | 8-15-2026 | | | | 4,143,000 | | | | 3,832,760 | |
U.S. Treasury Note | | | 1.63 | | | | 3-31-2019 | | | | 2,104,000 | | | | 2,118,547 | |
U.S. Treasury Note | | | 1.63 | | | | 4-30-2019 | | | | 1,703,000 | | | | 1,714,575 | |
U.S. Treasury Note | | | 1.63 | | | | 6-30-2019 | | | | 2,157,000 | | | | 2,170,734 | |
U.S. Treasury Note | | | 1.63 | | | | 7-31-2019 | | | | 2,128,000 | | | | 2,141,217 | |
U.S. Treasury Note | | | 1.63 | | | | 8-31-2019 | | | | 3,442,000 | | | | 3,462,167 | |
U.S. Treasury Note | | | 1.63 | | | | 12-31-2019 | | | | 3,442,000 | | | | 3,457,193 | |
U.S. Treasury Note | | | 1.63 | | | | 6-30-2020 | | | | 3,442,000 | | | | 3,444,554 | |
U.S. Treasury Note | | | 1.63 | | | | 7-31-2020 | | | | 3,213,000 | | | | 3,213,125 | |
U.S. Treasury Note | | | 1.63 | | | | 11-30-2020 | | | | 2,166,000 | | | | 2,159,400 | |
U.S. Treasury Note | | | 1.63 | | | | 8-15-2022 | | | | 1,250,000 | | | | 1,224,316 | |
U.S. Treasury Note | | | 1.63 | | | | 11-15-2022 | | | | 2,108,000 | | | | 2,059,170 | |
U.S. Treasury Note | | | 1.63 | | | | 4-30-2023 | | | | 1,711,000 | | | | 1,662,209 | |
U.S. Treasury Note | | | 1.63 | | | | 5-31-2023 | | | | 1,714,000 | | | | 1,663,384 | |
U.S. Treasury Note | | | 1.63 | | | | 10-31-2023 | | | | 1,824,000 | | | | 1,762,369 | |
U.S. Treasury Note | | | 1.63 | | | | 2-15-2026 | | | | 4,269,000 | | | | 4,013,193 | |
U.S. Treasury Note | | | 1.63 | | | | 5-15-2026 | | | | 4,111,000 | | | | 3,855,345 | |
The accompanying notes are an integral part of these financial statements.
| | | | | | |
| Portfolio of investments—March 31, 2017 (unaudited) | | Wells Fargo Index Asset Allocation Fund | | | 25 | |
| | | | | | | | | | | | | | | | |
| Security name | | Interest rate | | | Maturity date | | | Principal | | | Value | |
| | | | |
U.S. Treasury Securities (continued) | | | | | | | | | | | | | | | | |
U.S. Treasury Note | | | 1.75 | % | | | 10-31-2018 | | | $ | 704,000 | | | $ | 710,105 | |
U.S. Treasury Note | | | 1.75 | | | | 9-30-2019 | | | | 3,441,000 | | | | 3,470,975 | |
U.S. Treasury Note | | | 1.75 | | | | 10-31-2020 | | | | 1,585,000 | | | | 1,588,468 | |
U.S. Treasury Note | | | 1.75 | | | | 12-31-2020 | | | | 3,353,000 | | | | 3,355,226 | |
U.S. Treasury Note | | | 1.75 | | | | 11-30-2021 | | | | 2,003,000 | | | | 1,989,776 | |
U.S. Treasury Note | | | 1.75 | | | | 2-28-2022 | | | | 1,637,000 | | | | 1,622,357 | |
U.S. Treasury Note | | | 1.75 | | | | 3-31-2022 | | | | 1,640,000 | | | | 1,624,305 | |
U.S. Treasury Note | | | 1.75 | | | | 4-30-2022 | | | | 1,612,000 | | | | 1,595,250 | |
U.S. Treasury Note | | | 1.75 | | | | 5-15-2022 | | | | 1,448,000 | | | | 1,432,502 | |
U.S. Treasury Note | | | 1.75 | | | | 9-30-2022 | | | | 1,771,000 | | | | 1,743,882 | |
U.S. Treasury Note | | | 1.75 | | | | 1-31-2023 | | | | 1,684,000 | | | | 1,652,425 | |
U.S. Treasury Note | | | 1.75 | | | | 5-15-2023 | | | | 3,117,000 | | | | 3,048,816 | |
U.S. Treasury Note | | | 1.88 | | | | 8-31-2017 | | | | 1,517,000 | | | | 1,523,044 | |
U.S. Treasury Note | | | 1.88 | | | | 9-30-2017 | | | | 1,307,000 | | | | 1,313,075 | |
U.S. Treasury Note | | | 1.88 | | | | 10-31-2017 | | | | 1,485,000 | | | | 1,492,657 | |
U.S. Treasury Note | | | 1.88 | | | | 6-30-2020 | | | | 1,888,000 | | | | 1,905,109 | |
U.S. Treasury Note | | | 1.88 | | | | 11-30-2021 | | | | 1,649,000 | | | | 1,646,939 | |
U.S. Treasury Note | | | 1.88 | | | | 1-31-2022 | | | | 2,358,000 | | | | 2,352,657 | |
U.S. Treasury Note | | | 1.88 | | | | 5-31-2022 | | | | 1,795,000 | | | | 1,786,305 | |
U.S. Treasury Note | | | 1.88 | | | | 8-31-2022 | | | | 1,754,000 | | | | 1,740,298 | |
U.S. Treasury Note | | | 1.88 | | | | 10-31-2022 | | | | 1,650,000 | | | | 1,634,145 | |
U.S. Treasury Note | | | 2.00 | | | | 7-31-2020 | | | | 1,306,000 | | | | 1,322,223 | |
U.S. Treasury Note | | | 2.00 | | | | 9-30-2020 | | | | 2,093,000 | | | | 2,117,283 | |
U.S. Treasury Note | | | 2.00 | | | | 11-30-2020 | | | | 2,266,000 | | | | 2,289,102 | |
U.S. Treasury Note | | | 2.00 | | | | 2-28-2021 | | | | 2,421,000 | | | | 2,442,184 | |
U.S. Treasury Note | | | 2.00 | | | | 5-31-2021 | | | | 1,559,000 | | | | 1,570,693 | |
U.S. Treasury Note | | | 2.00 | | | | 8-31-2021 | | | | 1,641,000 | | | | 1,649,911 | |
U.S. Treasury Note | | | 2.00 | | | | 10-31-2021 | | | | 1,649,000 | | | | 1,656,343 | |
U.S. Treasury Note | | | 2.00 | | | | 11-15-2021 | | | | 2,485,000 | | | | 2,496,163 | |
U.S. Treasury Note | | | 2.00 | | | | 12-31-2021 | | | | 2,300,000 | | | | 2,308,625 | |
U.S. Treasury Note | | | 2.00 | | | | 2-15-2022 | | | | 1,679,000 | | | | 1,685,953 | |
U.S. Treasury Note | | | 2.00 | | | | 7-31-2022 | | | | 1,778,000 | | | | 1,777,166 | |
U.S. Treasury Note | | | 2.00 | | | | 11-30-2022 | | | | 1,625,000 | | | | 1,618,653 | |
U.S. Treasury Note | | | 2.00 | | | | 2-15-2023 | | | | 3,077,000 | | | | 3,060,655 | |
U.S. Treasury Note | | | 2.00 | | | | 2-15-2025 | | | | 4,486,000 | | | | 4,385,590 | |
U.S. Treasury Note | | | 2.00 | | | | 8-15-2025 | | | | 4,495,000 | | | | 4,376,130 | |
U.S. Treasury Note | | | 2.00 | | | | 11-15-2026 | | | | 4,255,000 | | | | 4,109,398 | |
U.S. Treasury Note | | | 2.13 | | | | 8-31-2020 | | | | 1,477,000 | | | | 1,500,078 | |
U.S. Treasury Note | | | 2.13 | | | | 1-31-2021 | | | | 1,409,000 | | | | 1,428,209 | |
U.S. Treasury Note | | | 2.13 | | | | 6-30-2021 | | | | 1,516,000 | | | | 1,533,943 | |
U.S. Treasury Note | | | 2.13 | | | | 8-15-2021 | | | | 2,440,000 | | | | 2,468,594 | |
U.S. Treasury Note | | | 2.13 | | | | 9-30-2021 | | | | 1,633,000 | | | | 1,649,712 | |
U.S. Treasury Note | | | 2.13 | | | | 12-31-2021 | | | | 1,626,000 | | | | 1,641,117 | |
U.S. Treasury Note | | | 2.13 | | | | 6-30-2022 | | | | 1,615,000 | | | | 1,625,851 | |
U.S. Treasury Note | | | 2.13 | | | | 12-31-2022 | | | | 1,678,000 | | | | 1,681,737 | |
U.S. Treasury Note | | | 2.13 | | | | 11-30-2023 | | | | 1,638,000 | | | | 1,632,049 | |
U.S. Treasury Note | | | 2.13 | | | | 5-15-2025 | | | | 4,466,000 | | | | 4,397,617 | |
U.S. Treasury Note | | | 2.25 | | | | 11-30-2017 | | | | 1,250,000 | | | | 1,260,205 | |
U.S. Treasury Note | | | 2.25 | | | | 7-31-2018 | | | | 521,000 | | | | 528,489 | |
U.S. Treasury Note | | | 2.25 | | | | 3-31-2021 | | | | 1,440,000 | | | | 1,465,481 | |
The accompanying notes are an integral part of these financial statements.
| | | | |
| 26 | | Wells Fargo Index Asset Allocation Fund | | Portfolio of investments—March 31, 2017 (unaudited) |
| | | | | | | | | | | | | | | | |
| Security name | | Interest rate | | | Maturity date | | | Principal | | | Value | |
| | | | |
U.S. Treasury Securities (continued) | | | | | | | | | | | | | | | | |
U.S. Treasury Note | | | 2.25 | % | | | 4-30-2021 | | | $ | 1,514,000 | | | $ | 1,540,554 | |
U.S. Treasury Note | | | 2.25 | | | | 7-31-2021 | | | | 2,618,000 | | | | 2,660,951 | |
U.S. Treasury Note | | | 2.25 | | | | 12-31-2023 | | | | 1,886,000 | | | | 1,892,335 | |
U.S. Treasury Note | | | 2.25 | | | | 1-31-2024 | | | | 1,914,000 | | | | 1,919,459 | |
U.S. Treasury Note | | | 2.25 | | | | 11-15-2024 | | | | 4,492,000 | | | | 4,479,369 | |
U.S. Treasury Note | | | 2.25 | | | | 11-15-2025 | | | | 4,512,000 | | | | 4,472,696 | |
U.S. Treasury Note | | | 2.38 | | | | 7-31-2017 | | | | 1,253,000 | | | | 1,259,457 | |
U.S. Treasury Note | | | 2.38 | | | | 5-31-2018 | | | | 621,000 | | | | 629,733 | |
U.S. Treasury Note | | | 2.38 | | | | 6-30-2018 | | | | 795,000 | | | | 807,018 | |
U.S. Treasury Note | | | 2.38 | | | | 12-31-2020 | | | | 1,317,000 | | | | 1,347,919 | |
U.S. Treasury Note | | | 2.38 | | | | 8-15-2024 | | | | 4,465,000 | | | | 4,499,532 | |
U.S. Treasury Note | | | 2.50 | | | | 6-30-2017 | | | | 1,144,000 | | | | 1,148,602 | |
U.S. Treasury Note | | | 2.50 | | | | 8-15-2023 | | | | 2,662,000 | | | | 2,715,344 | |
U.S. Treasury Note | | | 2.50 | | | | 5-15-2024 | | | | 4,360,000 | | | | 4,436,810 | |
U.S. Treasury Note | | | 2.63 | | | | 1-31-2018 | | | | 861,000 | | | | 872,233 | |
U.S. Treasury Note | | | 2.63 | | | | 4-30-2018 | | | | 657,000 | | | | 667,625 | |
U.S. Treasury Note | | | 2.63 | | | | 8-15-2020 | | | | 3,367,000 | | | | 3,475,111 | |
U.S. Treasury Note | | | 2.63 | | | | 11-15-2020 | | | | 5,315,000 | | | | 5,487,517 | |
U.S. Treasury Note | | | 2.75 | | | | 12-31-2017 | | | | 960,000 | | | | 972,150 | |
U.S. Treasury Note | | | 2.75 | | | | 2-28-2018 | | | | 756,000 | | | | 767,163 | |
U.S. Treasury Note | | | 2.75 | | | | 2-15-2019 | | | | 1,365,000 | | | | 1,403,231 | |
U.S. Treasury Note | | | 2.75 | | | | 11-15-2023 | | | | 3,936,000 | | | | 4,074,528 | |
U.S. Treasury Note | | | 2.75 | | | | 2-15-2024 | | | | 3,410,000 | | | | 3,527,884 | |
U.S. Treasury Note | | | 2.88 | | | | 3-31-2018 | | | | 858,000 | | | | 872,915 | |
U.S. Treasury Note | | | 3.13 | | | | 5-15-2019 | | | | 1,768,000 | | | | 1,835,474 | |
U.S. Treasury Note | | | 3.13 | | | | 5-15-2021 | | | | 1,657,000 | | | | 1,743,086 | |
U.S. Treasury Note | | | 3.38 | | | | 11-15-2019 | | | | 3,180,000 | | | | 3,340,739 | |
U.S. Treasury Note | | | 3.50 | | | | 2-15-2018 | | | | 1,278,000 | | | | 1,304,759 | |
U.S. Treasury Note | | | 3.50 | | | | 5-15-2020 | | | | 2,864,000 | | | | 3,032,260 | |
U.S. Treasury Note | | | 3.63 | | | | 8-15-2019 | | | | 1,545,000 | | | | 1,626,958 | |
U.S. Treasury Note | | | 3.63 | | | | 2-15-2020 | | | | 2,648,000 | | | | 2,807,915 | |
U.S. Treasury Note | | | 3.63 | | | | 2-15-2021 | | | | 2,765,000 | | | | 2,960,062 | |
U.S. Treasury Note | | | 3.75 | | | | 11-15-2018 | | | | 1,505,000 | | | | 1,566,258 | |
U.S. Treasury Note | | | 3.88 | | | | 5-15-2018 | | | | 689,000 | | | | 710,370 | |
U.S. Treasury Note | | | 4.00 | | | | 8-15-2018 | | | | 788,000 | | | | 818,719 | |
U.S. Treasury Note | | | 4.25 | | | | 11-15-2017 | | | | 919,000 | | | | 937,380 | |
U.S. Treasury Note | | | 4.75 | | | | 8-15-2017 | | | | 857,000 | | | | 869,253 | |
U.S. Treasury Note | | | 6.25 | | | | 8-15-2023 | | | | 378,000 | | | | 470,935 | |
U.S. Treasury Note | | | 6.50 | | | | 11-15-2026 | | | | 296,000 | | | | 400,618 | |
U.S. Treasury Note | | | 6.63 | | | | 2-15-2027 | | | | 215,000 | | | | 295,037 | |
U.S. Treasury Note | | | 6.75 | | | | 8-15-2026 | | | | 221,000 | | | | 302,433 | |
U.S. Treasury Note | | | 6.88 | | | | 8-15-2025 | | | | 224,000 | | | | 302,059 | |
U.S. Treasury Note | | | 7.13 | | | | 2-15-2023 | | | | 260,000 | | | | 332,668 | |
U.S. Treasury Note | | | 7.25 | | | | 8-15-2022 | | | | 261,000 | | | | 330,328 | |
U.S. Treasury Note | | | 7.50 | | | | 11-15-2024 | | | | 240,000 | | | | 328,716 | |
U.S. Treasury Note | | | 7.63 | | | | 11-15-2022 | | | | 140,000 | | | | 181,398 | |
U.S. Treasury Note | | | 7.63 | | | | 2-15-2025 | | | | 216,000 | | | | 299,666 | |
U.S. Treasury Note | | | 7.88 | | | | 2-15-2021 | | | | 180,000 | | | | 221,055 | |
U.S. Treasury Note | | | 8.00 | | | | 11-15-2021 | | | | 511,000 | | | | 648,690 | |
U.S. Treasury Note | | | 8.13 | | | | 8-15-2019 | | | | 307,000 | | | | 355,305 | |
The accompanying notes are an integral part of these financial statements.
| | | | | | |
| Portfolio of investments—March 31, 2017 (unaudited) | | Wells Fargo Index Asset Allocation Fund | | | 27 | |
| | | | | | | | | | | | | | | | |
| Security name | | Interest rate | | | Maturity date | | | Principal | | | Value | |
| | | | |
U.S. Treasury Securities (continued) | | | | | | | | | | | | | | | | |
U.S. Treasury Note | | | 8.13 | % | | | 5-15-2021 | | | $ | 181,000 | | | $ | 226,165 | |
U.S. Treasury Note | | | 8.13 | | | | 8-15-2021 | | | | 175,000 | | | | 220,862 | |
U.S. Treasury Note | | | 8.50 | | | | 2-15-2020 | | | | 162,000 | | | | 194,033 | |
U.S. Treasury Note | | | 8.75 | | | | 5-15-2020 | | | | 130,000 | | | | 158,351 | |
U.S. Treasury Note | | | 8.75 | | | | 8-15-2020 | | | | 288,000 | | | | 355,016 | |
U.S. Treasury Note | | | 8.88 | | | | 8-15-2017 | | | | 271,000 | | | | 278,981 | |
U.S. Treasury Note | | | 8.88 | | | | 2-15-2019 | | | | 306,000 | | | | 349,820 | |
U.S. Treasury Note | | | 9.00 | | | | 11-15-2018 | | | | 193,000 | | | | 217,381 | |
U.S. Treasury Note | | | 9.13 | | | | 5-15-2018 | | | | 169,000 | | | | 184,118 | |
| | | | |
Total U.S. Treasury Securities (Cost $478,842,142) | | | | | | | | | | | | | | | 477,025,109 | |
| | | | | | | | | | | | | | | | |
| | | | |
| | | Yield | | | | | | Shares | | | | |
| Short-Term Investments: 2.34% | | | | | | | | | | | | | | | | |
| | | | |
| Investment Companies: 2.22% | | | | | | | | | | | | | | | | |
Securities Lending Cash Investment LLC (l)(r)(u) | | | 0.98 | | | | | | | | 3,314,482 | | | | 3,314,813 | |
Wells Fargo Government Money Market Select Class (l)(u) | | | 0.63 | | | | | | | | 24,425,716 | | | | 24,425,716 | |
| | | | |
| | | | | | | | | | | | | | | 27,740,529 | |
| | | | | | | | | | | | | | | | |
| | | | |
| | | | | | | | | Principal | | | | |
| U.S. Treasury Securities: 0.12% | | | | | | | | | | | | | | | | |
Treasury Bill (z)# | | | 0.72 | | | | 6-22-2017 | | | $ | 1,544,000 | | | | 1,541,440 | |
| | | | | | | | | | | | | | | | |
| | | | |
Total Short-Term Investments (Cost $29,281,884) | | | | | | | | | | | | | | | 29,281,969 | |
| | | | | | | | | | | | | | | | |
| | | | | | | | |
| Total investments in securities (Cost $934,447,604) * | | | 100.04 | % | | | 1,251,921,029 | |
Other assets and liabilities, net | | | (0.04 | ) | | | (511,053 | ) |
| | | | | | | | |
| Total net assets | | | 100.00 | % | | $ | 1,251,409,976 | |
| | | | | | | | |
| † | Non-income-earning security |
| « | All or a portion of this security is on loan. |
| (l) | The issuer of the security is an affiliated person of the Fund as defined in the Investment Company Act of 1940. |
| ± | Variable rate investment. The rate shown is the rate in effect at period end. |
| (a) | The security is fair valued in accordance with procedures approved by the Board of Trustees. |
| (r) | The investment is a non-registered investment vehicle purchased with cash collateral received from securities on loan. |
| (u) | The rate represents the 7-day annualized yield at period end. |
| (z) | Zero coupon security. The rate represents the current yield to maturity. |
| # | All or a portion of this security is segregated as collateral for investments in derivative instruments. |
| * | Cost for federal income tax purposes is $934,861,785 and unrealized gains (losses) consists of: |
| | | | |
Gross unrealized gains | | $ | 329,182,372 | |
Gross unrealized losses | | | (12,123,128 | ) |
| | | | |
Net unrealized gains | | $ | 317,059,244 | |
The accompanying notes are an integral part of these financial statements.
| | | | |
| 28 | | Wells Fargo Index Asset Allocation Fund | | Statement of assets and liabilities—March 31, 2017 (unaudited) |
| | | | |
| | | | |
| |
Assets | | | | |
Investments | | | | |
In unaffiliated securities (including $3,238,441 of securities loaned), at value (cost $901,080,778) | | $ | 1,214,962,536 | |
In affiliated securities, at value (cost $33,366,826) | | | 36,958,493 | |
| | | | |
Total investments, at value (cost $934,447,604) | | | 1,251,921,029 | |
Cash | | | 765 | |
Receivable for Fund shares sold | | | 2,739,046 | |
Receivable for dividends and interest | | | 2,877,997 | |
Receivable for daily variation margin on open futures contracts | | | 25,594 | |
Receivable for securities lending income | | | 1,230 | |
Prepaid expenses and other assets | | | 287,505 | |
| | | | |
Total assets | | | 1,257,853,166 | |
| | | | |
| |
Liabilities | | | | |
Payable for investments purchased | | | 1,997 | |
Payable for Fund shares redeemed | | | 1,585,616 | |
Payable upon receipt of securities loaned | | | 3,314,813 | |
Payable for daily variation margin on open futures contracts | | | 176,753 | |
Management fee payable | | | 669,617 | |
Distribution fees payable | | | 104,360 | |
Administration fees payable | | | 217,409 | |
Accrued expenses and other liabilities | | | 372,625 | |
| | | | |
Total liabilities | | | 6,443,190 | |
| | | | |
Total net assets | | $ | 1,251,409,976 | |
| | | | |
| |
NET ASSETS CONSIST OF | | | | |
Paid-in capital | | $ | 954,198,764 | |
Undistributed net investment income | | | 2,695 | |
Accumulated net realized losses on investments | | | (20,299,475 | ) |
Net unrealized gains on investments | | | 317,507,992 | |
| | | | |
Total net assets | | $ | 1,251,409,976 | |
| | | | |
| |
COMPUTATION OF NET ASSET VALUE AND OFFERING PRICE PER SHARE | | | | |
Net assets – Class A | | $ | 816,532,007 | |
Shares outstanding – Class A1 | | | 26,551,046 | |
Net asset value per share – Class A | | | $30.75 | |
Maximum offering price per share – Class A2 | | | $32.63 | |
Net assets – Class C | | $ | 153,587,976 | |
Shares outstanding – Class C1 | | | 8,210,280 | |
Net asset value per share – Class C | | | $18.71 | |
Net assets – Administrator Class | | $ | 228,130,993 | |
Shares outstanding – Administrator Class1 | | | 7,416,641 | |
Net asset value per share – Administrator Class | | | $30.76 | |
Net assets – Institutional Class | | $ | 53,159,000 | |
Shares outstanding – Institutional Class | | | 1,730,034 | |
Net asset value per share – Institutional Class1 | | | $30.73 | |
| 1 | The Fund has an unlimited number of authorized shares. |
| 2 | Maximum offering price is computed as 100/94.25 of net asset value. On investments of $50,000 or more, the offering price is reduced. |
The accompanying notes are an integral part of these financial statements.
| | | | | | |
| Statement of operations—six months ended March 31, 2017 (unaudited) | | Wells Fargo Index Asset Allocation Fund | | | 29 | |
| | | | |
| | | | |
| |
Investment income | | | | |
Dividends | | $ | 7,745,936 | |
Interest | | | 3,336,430 | |
Income from affiliated securities | | | 162,601 | |
Securities lending income, net | | | 11,944 | |
| | | | |
Total investment income | | | 11,256,911 | |
| | | | |
| |
Expenses | | | | |
Management fee | | | 3,674,524 | |
Administration fees | | | | |
Class A | | | 862,824 | |
Class B | | | 74 | 1 |
Class C | | | 152,048 | |
Administrator Class | | | 138,367 | |
Institutional Class | | | 13,463 | 2 |
Shareholder servicing fees | | | | |
Class A | | | 1,027,171 | |
Class B | | | 88 | 1 |
Class C | | | 181,009 | |
Administrator Class | | | 265,803 | |
Distribution fees | | | | |
Class B | | | 265 | 1 |
Class C | | | 543,028 | |
Custody and accounting fees | | | 13,363 | |
Professional fees | | | 240 | |
Registration fees | | | 217 | |
Shareholder report expenses | | | 255 | |
Trustees’ fees and expenses | | | 9,860 | |
Other fees and expenses | | | 480 | |
| | | | |
Total expenses | | | 6,883,079 | |
Less: Fee waivers and/or expense reimbursements | | | (102,746 | ) |
| | | | |
Net expenses | | | 6,780,333 | |
| | | | |
Net investment income | | | 4,476,578 | |
| | | | |
| |
REALIZED AND UNREALIZED GAINS (LOSSES) ON INVESTMENTS | | | | |
| |
Net realized gains on: | | | | |
Unaffiliated securities | | | 573,980 | |
Affiliated securities | | | 11,617 | |
Futures transactions | | | 9,165,472 | |
| | | | |
Net realized gains on investments | | | 9,751,069 | |
| | | | |
| |
Net change in unrealized gains (losses) on: | | | | |
Unaffiliated securities | | | 47,259,215 | |
Affiliated securities | | | 1,922,307 | |
Futures transactions | | | (333,685 | ) |
| | | | |
Net change in unrealized gains (losses) on investments | | | 48,847,837 | |
| | | | |
Net realized and unrealized gains (losses) on investments | | | 58,598,906 | |
| | | | |
Net increase in net assets resulting from operations | | $ | 63,075,484 | |
| | | | |
| 1 | For the period from October 1, 2016 to December 5, 2016. Effective at the close of business on December 5, 2016, Class B shares were converted to Class A shares and are no longer offered by the Fund. |
| 2 | For the period from October 31, 2016 (commencement of class operations) to March 31, 2017 |
The accompanying notes are an integral part of these financial statements.
| | | | |
| 30 | | Wells Fargo Index Asset Allocation Fund | | Statement of changes in net assets |
| | | | | | | | | | | | | | | | |
| | | Six months ended
March 31, 2017
(unaudited) | | | Year ended
September 30, 2016 | |
| | | | |
Operations | | | | | | | | | | | | | | | | |
Net investment income | | | | | | $ | 4,476,578 | | | | | | | $ | 7,739,055 | |
Net realized gains on investments | | | | | | | 9,751,069 | | | | | | | | 9,092,899 | |
Net change in unrealized gains (losses) on investments | | | | | | | 48,847,837 | | | | | | | | 77,072,669 | |
| | | | |
Net increase in net assets resulting from operations | | | | | | | 63,075,484 | | | | | | | | 93,904,623 | |
| | | | |
| | | | |
Distributions to shareholders from | | | | | | | | | | | | | | | | |
Net investment income | | | | | | | | | | | | | | | | |
Class A | | | | | | | (4,493,929 | ) | | | | | | | (5,683,773 | ) |
Class B | | | | | | | 0 | 1 | | | | | | | (266 | ) |
Class C | | | | | | | (70,275 | ) | | | | | | | (93,279 | ) |
Administrator Class | | | | | | | (1,446,168 | ) | | | | | | | (1,345,968 | ) |
Institutional Class | | | | | | | (260,388 | )2 | | | | | | | N/A | |
Net realized gains | | | | | | | | | | | | | | | | |
Class A | | | | | | | (7,379,070 | ) | | | | | | | (40,013,880 | ) |
Class B | | | | | | | 0 | 1 | | | | | | | (8,382 | ) |
Class C | | | | | | | (1,277,133 | ) | | | | | | | (3,781,718 | ) |
Administrator Class | | | | | | | (1,816,976 | ) | | | | | | | (5,677,540 | ) |
Institutional Class | | | | | | | (193,189 | )2 | | | | | | | N/A | |
| | | | |
Total distributions to shareholders | | | | | | | (16,937,128 | ) | | | | | | | (56,604,806 | ) |
| | | | |
| | | | |
Capital share transactions | | | Shares | | | | | | | | Shares | | | | | |
Proceeds from shares sold | | | | | | | | | | | | | | | | |
Class A | | | 1,351,359 | | | | 40,535,962 | | | | 4,200,951 | | | | 120,374,602 | |
Class B | | | 0 | 1 | | | 0 | 1 | | | 15,531 | | | | 269,837 | |
Class C | | | 1,517,108 | | | | 27,683,713 | | | | 4,802,237 | | | | 84,206,499 | |
Administrator Class | | | 2,310,650 | | | | 69,456,636 | | | | 5,938,408 | | | | 170,655,831 | |
Institutional Class | | | 1,816,093 | 2 | | | 55,232,909 | 2 | | | N/A | | | | N/A | |
| | | | |
| | | | | | | 192,909,220 | | | | | | | | 375,506,769 | |
| | | | |
Reinvestment of distributions | | | | | | | | | | | | | | | | |
Class A | | | 386,202 | | | | 11,584,253 | | | | 1,593,398 | | | | 44,672,620 | |
Class B | | | 0 | 1 | | | 0 | 1 | | | 338 | | | | 5,803 | |
Class C | | | 62,399 | | | | 1,135,663 | | | | 192,234 | | | | 3,269,192 | |
Administrator Class | | | 95,630 | | | | 2,871,205 | | | | 187,396 | | | | 5,266,424 | |
Institutional Class | | | 15,072 | 2 | | | 453,577 | 2 | | | N/A | | | | N/A | |
| | | | |
| | | | | | | 16,044,698 | | | | | | | | 53,214,039 | |
| | | | |
Payment for shares redeemed | | | | | | | | | | | | | | | | |
Class A | | | (3,168,195 | ) | | | (95,619,885 | ) | | | (3,450,379 | ) | | | (99,644,371 | ) |
Class B | | | (11,694 | )1 | | | (213,027 | )1 | | | (12,802 | ) | | | (225,638 | ) |
Class C | | | (979,420 | ) | | | (17,919,826 | ) | | | (934,641 | ) | | | (16,428,230 | ) |
Administrator Class | | | (1,973,414 | ) | | | (59,273,987 | ) | | | (2,111,814 | ) | | | (61,128,010 | ) |
Institutional Class | | | (101,131 | )2 | | | (3,077,345 | )2 | | | N/A | | | | N/A | |
| | | | |
| | | | | | | (176,104,070 | ) | | | | | | | (177,426,249 | ) |
| | | | |
Net increase in net assets resulting from capital share transactions | | | | | | | 32,849,848 | | | | | | | | 251,294,559 | |
| | | | |
Total increase in net assets | | | | | | | 78,988,204 | | | | | | | | 288,594,376 | |
| | | | |
| | | | |
Net assets | | | | | | | | | | | | | | | | |
Beginning of period | | | | | | | 1,172,421,772 | | | | | | | | 883,827,396 | |
| | | | |
End of period | | | | | | $ | 1,251,409,976 | | | | | | | $ | 1,172,421,772 | |
| | | | |
Undistributed net investment income | | | | | | $ | 2,695 | | | | | | | $ | 1,796,877 | |
| | | | |
| 1 | For the period from October 1, 2016 to December 5, 2016. Effective at the close of business on December 5, 2016, Class B shares were converted to Class A shares and are no longer offered by the Fund. |
| 2 | For the period from October 31, 2016 (commencement of class operations) to March 31, 2017 |
The accompanying notes are an integral part of these financial statements.
| | | | | | |
| Financial highlights | | Wells Fargo Index Asset Allocation Fund | | | 31 | |
(For a share outstanding throughout each period)
| | | | | | | | | | | | | | | | | | | | | | | | |
| | | Six months ended
March 31, 2017
(unaudited) | | | Year ended September 30 | |
| CLASS A | | | 2016 | | | 2015 | | | 2014 | | | 2013 | | | 2012 | |
Net asset value, beginning of period | | | $29.61 | | | | $28.72 | | | | $28.20 | | | | $24.48 | | | | $22.17 | | | | $18.12 | |
Net investment income | | | 0.12 | | | | 0.22 | | | | 0.27 | | | | 0.38 | | | | 0.34 | | | | 0.29 | |
Net realized and unrealized gains (losses) on investments | | | 1.45 | | | | 2.45 | | | | 0.76 | | | | 3.72 | | | | 2.31 | | | | 4.05 | |
| | | | | | | | | | | | | | | | | | | | | | | | |
Total from investment operations | | | 1.57 | | | | 2.67 | | | | 1.03 | | | | 4.10 | | | | 2.65 | | | | 4.34 | |
Distributions to shareholders from | | | | | | | | | | | | | | | | | | | | | | | | |
Net investment income | | | (0.16 | ) | | | (0.21 | ) | | | (0.22 | ) | | | (0.38 | ) | | | (0.34 | ) | | | (0.29 | ) |
Net realized gains | | | (0.27 | ) | | | (1.57 | ) | | | (0.29 | ) | | | 0.00 | | | | 0.00 | | | | 0.00 | |
| | | | | | | | | | | | | | | | | | | | | | | | |
Total distributions to shareholders | | | (0.43 | ) | | | (1.78 | ) | | | (0.51 | ) | | | (0.38 | ) | | | (0.34 | ) | | | (0.29 | ) |
Net asset value, end of period | | | $30.75 | | | | $29.61 | | | | $28.72 | | | | $28.20 | | | | $24.48 | | | | $22.17 | |
Total return1 | | | 5.36 | % | | | 9.68 | % | | | 3.62 | % | | | 16.83 | % | | | 12.02 | % | | | 24.07 | % |
Ratios to average net assets (annualized) | | | | | | | | | | | | | | | | | | | | | | | | |
Gross expenses | | | 1.08 | % | | | 1.10 | % | | | 1.22 | % | | | 1.20 | % | | | 1.18 | % | | | 1.17 | % |
Net expenses | | | 1.08 | % | | | 1.10 | % | | | 1.15 | % | | | 1.15 | % | | | 1.15 | % | | | 1.15 | % |
Net investment income | | | 0.80 | % | | | 0.79 | % | | | 0.90 | % | | | 1.42 | % | | | 1.43 | % | | | 1.39 | % |
Supplemental data | | | | | | | | | | | | | | | | | | | | | | | | |
Portfolio turnover rate | | | 6 | % | | | 8 | % | | | 43 | % | | | 9 | % | | | 11 | % | | | 16 | % |
Net assets, end of period (000s omitted) | | | $816,532 | | | | $828,421 | | | | $736,276 | | | | $708,873 | | | | $657,702 | | | | $644,365 | |
| 1 | Total return calculations do not include any sales charges. Returns for periods of less than one year are not annualized. |
The accompanying notes are an integral part of these financial statements.
| | | | |
| 32 | | Wells Fargo Index Asset Allocation Fund | | Financial highlights |
(For a share outstanding throughout each period)
| | | | | | | | | | | | | | | | | | | | | | | | |
| | | Six months ended
March 31, 2017 (unaudited) | | | Year ended September 30 | |
| CLASS C | | | 2016 | | | 2015 | | | 2014 | | | 2013 | | | 2012 | |
Net asset value, beginning of period | | | $17.99 | | | | $17.47 | | | | $17.20 | | | | $14.94 | | | | $13.53 | | | | $11.06 | |
Net investment income | | | 0.01 | | | | 0.01 | 1 | | | 0.05 | | | | 0.11 | | | | 0.10 | | | | 0.08 | |
Net realized and unrealized gains (losses) on investments | | | 0.88 | | | | 1.48 | | | | 0.45 | | | | 2.27 | | | | 1.41 | | | | 2.47 | |
| | | | | | | | | | | | | | | | | | | | | | | | |
Total from investment operations | | | 0.89 | | | | 1.49 | | | | 0.50 | | | | 2.38 | | | | 1.51 | | | | 2.55 | |
Distributions to shareholders from | | | | | | | | | | | | | | | | | | | | | | | | |
Net investment income | | | (0.01 | ) | | | (0.02 | ) | | | (0.05 | ) | | | (0.12 | ) | | | (0.10 | ) | | | (0.08 | ) |
Net realized gains | | | (0.16 | ) | | | (0.95 | ) | | | (0.18 | ) | | | 0.00 | | | | 0.00 | | | | 0.00 | |
| | | | | | | | | | | | | | | | | | | | | | | | |
Total distributions to shareholders | | | (0.17 | ) | | | (0.97 | ) | | | (0.23 | ) | | | (0.12 | ) | | | (0.10 | ) | | | (0.08 | ) |
Net asset value, end of period | | | $18.71 | | | | $17.99 | | | | $17.47 | | | | $17.20 | | | | $14.94 | | | | $13.53 | |
Total return2 | | | 4.99 | % | | | 8.86 | % | | | 2.86 | % | | | 15.96 | % | | | 11.20 | % | | | 23.11 | % |
Ratios to average net assets (annualized) | | | | | | | | | | | | | | | | | | | | | | | | |
Gross expenses | | | 1.83 | % | | | 1.85 | % | | | 1.98 | % | | | 1.95 | % | | | 1.93 | % | | | 1.92 | % |
Net expenses | | | 1.83 | % | | | 1.85 | % | | | 1.90 | % | | | 1.90 | % | | | 1.90 | % | | | 1.90 | % |
Net investment income | | | 0.05 | % | | | 0.03 | % | | | 0.10 | % | | | 0.67 | % | | | 0.68 | % | | | 0.64 | % |
Supplemental data | | | | | | | | | | | | | | | | | | | | | | | | |
Portfolio turnover rate | | | 6 | % | | | 8 | % | | | 43 | % | | | 9 | % | | | 11 | % | | | 16 | % |
Net assets, end of period (000s omitted) | | | $153,588 | | | | $136,881 | | | | $62,019 | | | | $24,093 | | | | $19,164 | | | | $16,699 | |
| 1 | Calculated based upon average shares outstanding |
| 2 | Total return calculations do not include any sales charges. Returns for periods of less than one year are not annualized. |
The accompanying notes are an integral part of these financial statements.
| | | | | | |
| Financial highlights | | Wells Fargo Index Asset Allocation Fund | | | 33 | |
(For a share outstanding throughout each period)
| | | | | | | | | | | | | | | | | | | | | | | | |
| | | Six months ended
March 31, 2017 (unaudited) | | | Year ended September 30 | |
| ADMINISTRATOR CLASS | | | 2016 | | | 2015 | | | 2014 | | | 2013 | | | 2012 | |
Net asset value, beginning of period | | | $29.63 | | | | $28.75 | | | | $28.21 | | | | $24.49 | | | | $22.18 | | | | $18.14 | |
Net investment income | | | 0.15 | | | | 0.28 | | | | 0.35 | | | | 0.45 | | | | 0.40 | | | | 0.34 | |
Net realized and unrealized gains (losses) on investments | | | 1.46 | | | | 2.45 | | | | 0.76 | | | | 3.72 | | | | 2.30 | | | | 4.04 | |
| | | | | | | | | | | | | | | | | | | | | | | | |
Total from investment operations | | | 1.61 | | | | 2.73 | | | | 1.11 | | | | 4.17 | | | | 2.70 | | | | 4.38 | |
Distributions to shareholders from | | | | | | | | | | | | | | | | | | | | | | | | |
Net investment income | | | (0.21 | ) | | | (0.28 | ) | | | (0.28 | ) | | | (0.45 | ) | | | (0.39 | ) | | | (0.34 | ) |
Net realized gains | | | (0.27 | ) | | | (1.57 | ) | | | (0.29 | ) | | | 0.00 | | | | 0.00 | | | | 0.00 | |
| | | | | | | | | | | | | | | | | | | | | | | | |
Total distributions to shareholders | | | (0.48 | ) | | | (1.85 | ) | | | (0.57 | ) | | | (0.45 | ) | | | (0.39 | ) | | | (0.34 | ) |
Net asset value, end of period | | | $30.76 | | | | $29.63 | | | | $28.75 | | | | $28.21 | | | | $24.49 | | | | $22.18 | |
Total return1 | | | 5.47 | % | | | 9.91 | % | | | 3.89 | % | | | 17.12 | % | | | 12.31 | % | | | 24.30 | % |
Ratios to average net assets (annualized) | | | | | | | | | | | | | | | | | | | | | | | | |
Gross expenses | | | 1.00 | % | | | 1.02 | % | | | 1.09 | % | | | 1.04 | % | | | 1.02 | % | | | 1.01 | % |
Net expenses | | | 0.90 | % | | | 0.90 | % | | | 0.90 | % | | | 0.90 | % | | | 0.90 | % | | | 0.90 | % |
Net investment income | | | 0.98 | % | | | 0.98 | % | | | 1.12 | % | | | 1.68 | % | | | 1.69 | % | | | 1.63 | % |
Supplemental data | | | | | | | | | | | | | | | | | | | | | | | | |
Portfolio turnover rate | | | 6 | % | | | 8 | % | | | 43 | % | | | 9 | % | | | 11 | % | | | 16 | % |
Net assets, end of period (000s omitted) | | | $228,131 | | | | $206,908 | | | | $85,380 | | | | $59,783 | | | | $34,536 | | | | $29,920 | |
| 1 | Returns for periods of less than one year are not annualized. |
The accompanying notes are an integral part of these financial statements.
| | | | |
| 34 | | Wells Fargo Index Asset Allocation Fund | | Financial highlights |
(For a share outstanding throughout the period)
| | | | |
| INSTITUTIONAL CLASS | | Period ended
March 31, 20171
(unaudited) | |
Net asset value, beginning of period | | | $29.27 | |
Net investment income | | | 0.17 | 2 |
Net realized and unrealized gains (losses) on investments | | | 1.82 | |
| | | | |
Total from investment operations | | | 1.99 | |
Distributions to shareholders from | | | | |
Net investment income | | | (0.26 | ) |
Net realized gains | | | (0.27 | ) |
| | | | |
Total distributions to shareholders | | | (0.53 | ) |
Net asset value, end of period | | | $30.73 | |
Total return3 | | | 6.85 | % |
Ratios to average net assets (annualized) | | | | |
Gross expenses | | | 0.75 | % |
Net expenses | | | 0.75 | % |
Net investment income | | | 1.00 | % |
Supplemental data | | | | |
Portfolio turnover rate | | | 6 | % |
Net assets, end of period (000s omitted) | | | $53,159 | |
| 1 | For the period from October 31, 2016 (commencement of class operations) to March 31, 2017 |
| 2 | Calculated based upon average shares outstanding |
| 3 | Returns for periods of less than one year are not annualized. |
The accompanying notes are an integral part of these financial statements.
| | | | | | |
| Notes to financial statements (unaudited) | | Wells Fargo Index Asset Allocation Fund | | | 35 | |
1. ORGANIZATION
Wells Fargo Funds Trust (the “Trust”), a Delaware statutory trust organized on March 10, 1999, is an open-end management investment company registered under the Investment Company Act of 1940, as amended (the “1940 Act”). As an investment company, the Trust follows the accounting and reporting guidance in Financial Accounting Standards Board (“FASB”) Accounting Standards Codification (“ASC”) Topic 946, Financial Services – Investment Companies. These financial statements report on the Wells Fargo Index Asset Allocation Fund (the “Fund”) which is a diversified series of the Trust.
Effective at the close of business on December 5, 2016, Class B shares were converted to Class A shares and are no longer offered by the Fund. Information for Class B shares reflected in the financial statements represents activity through December 5, 2016.
2. SIGNIFICANT ACCOUNTING POLICIES
The following significant accounting policies, which are consistently followed in the preparation of the financial statements of the Fund, are in conformity with U.S. generally accepted accounting principles which require management to make estimates and assumptions that affect the reported amounts of assets and liabilities, disclosure of contingent assets and liabilities at the date of the financial statements, and the reported amounts of revenues and expenses during the reporting period. Actual results could differ from those estimates.
Securities valuation
All investments are valued each business day as of the close of regular trading on the New York Stock Exchange (generally 4 p.m. Eastern Time), although the Fund may deviate from this calculation time under unusual or unexpected circumstances.
Equity securities and futures that are listed on a foreign or domestic exchange or market are valued at the official closing price or, if none, the last sales price. If no sale occurs on the principal exchange or market that day, the prior day’s price will be deemed “stale” and a fair value price will be determined in accordance with the Fund’s Valuation Procedures.
Debt securities are valued at the evaluated bid price provided by an independent pricing service or, if a reliable price is not available, the quoted bid price from an independent broker-dealer.
Investments in registered open-end investment companies are valued at net asset value. Interests in non-registered investment companies that are redeemable at net asset value are fair valued normally at net asset value.
Investments which are not valued using any of the methods discussed above are valued at their fair value, as determined in good faith by the Board of Trustees of the Fund. The Board of Trustees has established a Valuation Committee comprised of the Trustees and has delegated to it the authority to take any actions regarding the valuation of portfolio securities that the Valuation Committee deems necessary or appropriate, including determining the fair value of portfolio securities, unless the determination has been delegated to the Management Valuation Team of Wells Fargo Funds Management, LLC (“Funds Management”). The Board of Trustees retains the authority to make or ratify any valuation decisions or approve any changes to the Valuation Procedures as it deems appropriate. On a quarterly basis, the Board of Trustees receives reports on any valuation actions taken by the Valuation Committee or the Management Valuation Team which may include items for ratification.
Valuations of fair valued securities are compared to the next actual sales price when available, or other appropriate market values, to assess the continued appropriateness of the fair valuation methodologies used. These securities are fair valued on a day-to-day basis, taking into consideration changes to appropriate market information and any significant changes to the inputs considered in the valuation process until there is a readily available price provided on an exchange or by an independent pricing service. Valuations received from an independent pricing service or independent broker-dealer quotes are periodically validated by comparisons to most recent trades and valuations provided by other independent pricing services in addition to the review of prices by the manager and/or subadviser. Unobservable inputs used in determining fair valuations are identified based on the type of security, taking into consideration factors utilized by market participants in valuing the investment, knowledge about the issuer and the current market environment.
Security loans
The Fund may lend its securities from time to time in order to earn additional income in the form of fees or interest on securities received as collateral or the investment of any cash received as collateral. The Fund continues to receive interest or dividends on the securities loaned. The Fund receives collateral in the form of cash or securities with a value at least equal to the value of the securities on loan. The value of the loaned securities is determined at the close of each business day and any additional required collateral is delivered to the Fund on the next business day. In a securities lending transaction, the net asset value of the Fund will be affected by an increase or decrease in the value of the securities loaned and by an increase or decrease in the value of the instrument in which collateral is invested. The amount of securities lending activity undertaken by the Fund fluctuates from time to time. In the event of default or bankruptcy by the borrower, the Fund may be prevented from recovering the loaned securities or gaining access to the collateral or
| | | | |
| 36 | | Wells Fargo Index Asset Allocation Fund | | Notes to financial statements (unaudited) |
may experience delays or costs in doing so. In addition, the investment of any cash collateral received may lose all or part of its value. The Fund has the right under the lending agreement to recover the securities from the borrower on demand.
The Fund lends its securities through an unaffiliated securities lending agent. Cash collateral received in connection with its securities lending transactions is invested in Securities Lending Cash Investments, LLC (the “Securities Lending Fund”). The Securities Lending Fund is exempt from registration under Section 3(c)(7) of the 1940 Act and is managed by Funds Management and is subadvised by Wells Capital Management Incorporated (“WellsCap”), an affiliate of Funds Management and an indirect wholly owned subsidiary of Wells Fargo & Company (“Wells Fargo”). Funds Management receives an advisory fee starting at 0.05% and declining to 0.01% as the average daily net assets of the Securities Lending Fund increase. All of the fees received by Funds Management are paid to WellsCap for its services as subadviser. The Securities Lending Fund seeks to provide a positive return compared to the daily Fed Funds Open Rate by investing in high-quality, U.S. dollar-denominated short-term money market instruments. Securities Lending Fund investments are valued at the evaluated bid price provided by an independent pricing service. Income earned from investment in the Securities Lending Fund is included in securities lending income on the Statement of Operations.
Futures contracts
The Fund is subject to interest rate risk and equity price risk in the normal course of pursuing its investment objectives. The Fund may buy and sell futures contracts in order to gain exposure to, or protect against, changes in interest rates and security values. The primary risks associated with the use of futures contracts are the imperfect correlation between changes in market values of securities held by the Fund and the prices of futures contracts, and the possibility of an illiquid market.
The aggregate principal amounts of the contracts are not recorded in the financial statements. Fluctuations in the value of the contracts are recorded in the Statement of Assets and Liabilities as an asset or liability and in the Statement of Operations as unrealized gains or losses until the contracts are closed, at which point they are recorded as net realized gains or losses on futures contracts. With futures contracts, there is minimal counterparty risk to the Fund since futures are exchange traded and the exchange’s clearinghouse, as counterparty to all exchange traded futures, guarantees the futures against default.
Security transactions and income recognition
Securities transactions are recorded on a trade date basis. Realized gains or losses are recorded on the basis of identified cost.
Dividend income is recognized on the ex-dividend date.
Interest income is accrued daily and bond discounts are accreted and premiums are amortized daily based on the effective interest method. To the extent debt obligations are placed on non-accrual status, any related interest income may be reduced by writing off interest receivables when the collection of all or a portion of interest has been determined to be doubtful based on consistently applied procedures and the fair value has decreased. If the issuer subsequently resumes interest payments or when the collectability of interest is reasonably assured, the debt obligation is removed from non-accrual status.
Distributions to shareholders
Distributions to shareholders from net investment income and net realized gains, if any, are recorded on the ex-dividend date. Such distributions are determined in accordance with income tax regulations and may differ from U.S. generally accepted accounting principles. Dividend sources are estimated at the time of declaration. The tax character of distributions is determined as of the Fund’s fiscal year end. Therefore, a portion of the Fund’s distributions made prior the Fund’s fiscal year end may be categorized as a tax return of capital.
Federal and other taxes
The Fund intends to continue to qualify as a regulated investment company by distributing substantially all of its investment company taxable income and any net realized capital gains (after reduction for capital loss carryforwards) sufficient to relieve it from all, or substantially all, federal income taxes. Accordingly, no provision for federal income taxes was required.
The Fund’s income and federal excise tax returns and all financial records supporting those returns for the prior three fiscal years are subject to examination by the federal and Delaware revenue authorities. Management has analyzed the Fund’s tax positions taken on federal, state, and foreign tax returns for all open tax years and does not believe that there are any uncertain tax positions that require recognition of a tax liability.
Class allocations
The separate classes of shares offered by the Fund differ principally in applicable sales charges, distribution, shareholder servicing, and administration fees. Class specific expenses are charged directly to that share class. Investment income, common expenses, and realized and unrealized gains (losses) on investments are allocated daily to each class of shares based on the relative proportion of net assets of each class.
| | | | | | |
| Notes to financial statements (unaudited) | | Wells Fargo Index Asset Allocation Fund | | | 37 | |
3. FAIR VALUATION MEASUREMENTS
Fair value measurements of investments are determined within a framework that has established a fair value hierarchy based upon the various data inputs utilized in determining the value of the Fund’s investments. The three-level hierarchy gives the highest priority to unadjusted quoted prices in active markets for identical assets or liabilities (Level 1) and the lowest priority to unobservable inputs (Level 3). The Fund’s investments are classified within the fair value hierarchy based on the lowest level of input that is significant to the fair value measurement. The inputs are summarized into three broad levels as follows:
| ∎ | | Level 1 – quoted prices in active markets for identical securities |
| ∎ | | Level 2 – other significant observable inputs (including quoted prices for similar securities, interest rates, prepayment speeds, credit risk, etc.) |
| ∎ | | Level 3 – significant unobservable inputs (including the Fund’s own assumptions in determining the fair value of investments) |
The inputs or methodologies used for valuing investments in securities are not necessarily an indication of the risk associated with investing in those securities.
The following is a summary of the inputs used in valuing the Fund’s assets and liabilities as of March 31, 2017:
| | | | | | | | | | | | | | | | |
| | | Quoted prices
(Level 1) | | | Other significant
observable inputs
(Level 2) | | | Significant
unobservable inputs
(Level 3) | | | Total | |
Assets | | | | | | | | | | | | | | | | |
Investments in: | | | | | | | | | | | | | | | | |
| | | | |
Agency securities | | $ | 0 | | | $ | 67,017 | | | $ | 0 | | | $ | 67,017 | |
| | | | |
Common stocks | | | | | | | | | | | | | | | | |
Consumer discretionary | | | 91,919,492 | | | | 0 | | | | 0 | | | | 91,919,492 | |
Consumer staples | | | 69,355,541 | | | | 0 | | | | 0 | | | | 69,355,541 | |
Energy | | | 49,108,100 | | | | 0 | | | | 0 | | | | 49,108,100 | |
Financials | | | 107,079,621 | | | | 0 | | | | 0 | | | | 107,079,621 | |
Health care | | | 103,641,726 | | | | 0 | | | | 0 | | | | 103,641,726 | |
Industrials | | | 75,182,445 | | | | 0 | | | | 0 | | | | 75,182,445 | |
Information technology | | | 164,660,684 | | | | 0 | | | | 0 | | | | 164,660,684 | |
Materials | | | 21,168,852 | | | | | | | | | | | | 21,168,852 | |
Real estate | | | 21,836,550 | | | | 0 | | | | 0 | | | | 21,836,550 | |
Telecommunication services | | | 17,782,242 | | | | 0 | | | | 0 | | | | 17,782,242 | |
Utilities | | | 23,797,813 | | | | 0 | | | | 0 | | | | 23,797,813 | |
| | | | |
Rights | | | | | | | | | | | | | | | | |
Consumer staples | | | 0 | | | | 0 | | | | 0 | | | | 0 | |
| | | | |
Non-agency mortgage-backed securities | | | 0 | | | | 13,868 | | | | 0 | | | | 13,868 | |
| | | | |
U.S. Treasury securities | | | 477,025,109 | | | | 0 | | | | 0 | | | | 477,025,109 | |
| | | | |
Short-term investments | | | | | | | | | | | | | | | | |
Investment companies | | | 24,425,716 | | | | 0 | | | | 0 | | | | 24,425,716 | |
U.S. Treasury securities | | | 1,541,440 | | | | 0 | | | | 0 | | | | 1,541,440 | |
Investments measured at net asset value* | | | | | | | | | | | | | | | 3,314,813 | |
| | | | |
| | | 1,248,525,331 | | | | 80,885 | | | | 0 | | | | 1,251,921,029 | |
Futures contracts | | | 25,594 | | | | 0 | | | | 0 | | | | 25,594 | |
Total assets | | $ | 1,248,550,925 | | | $ | 80,885 | | | $ | 0 | | | $ | 1,251,946,623 | |
Liabilities | | | | | | | | | | | | | | | | |
Futures contracts | | $ | 176,753 | | | $ | 0 | | | $ | 0 | | | $ | 176,753 | |
Total liabilities | | $ | 176,753 | | | $ | 0 | | | $ | 0 | | | $ | 176,753 | |
| * | Investments that are measured at fair value using the net asset value per share (or its equivalent) as a practical expedient have not been categorized in the fair value hierarchy. The fair value amount presented in the table is intended to permit reconciliation of the fair value hierarchy to the amounts presented in the Statement of Assets and Liabilities. The Fund’s investment in Securities Lending Cash Investments LLC valued at $3,314,813 does not have a redemption period notice, can be redeemed daily and does not have any unfunded commitments. |
| | | | |
| 38 | | Wells Fargo Index Asset Allocation Fund | | Notes to financial statements (unaudited) |
Futures contracts are reported at their variation margin at measurement date, which represents the amount due to/from the Fund at that date. All other assets and liabilities are reported at their market value at measurement date.
The Fund recognizes transfers between levels within the fair value hierarchy at the end of the reporting period. At March 31, 2017, the Fund did not have any transfers into/out of Level 1, Level 2, or Level 3.
4. TRANSACTIONS WITH AFFILIATES AND OTHER EXPENSES
Management fee
Funds Management, an indirect wholly owned subsidiary of Wells Fargo, is the manager of the Fund and provides advisory and fund-level administrative services under an investment management agreement. Under the investment management agreement, Funds Management is responsible for, among other services, implementing the investment objectives and strategies of the Fund, supervising the subadviser, providing fund-level administrative services in connection with the Fund’s operations, and providing any other fund-level administrative services reasonably necessary for the operation of the Fund. As compensation for its services under the investment management agreement, Funds Management is entitled to receive an annual management fee starting at 0.65% and declining to 0.48% as the average daily net assets of the Fund increase. For the six months ended March 31, 2017, the management fee was equivalent to an annual rate of 0.61% of the Fund’s average daily net assets.
Funds Management has retained the services of a subadviser to provide daily portfolio management to the Fund. The fee for subadvisory services is borne by Funds Management. WellsCap is the subadviser to the Fund and is entitled to receive a fee from Funds Management at an annual rate starting at 0.15% and declining to 0.10% as the average daily net assets of the Fund increase.
Administration fees
Under a class-level administration agreement, Funds Management provides class-level administrative services to the Fund, which includes paying fees and expenses for services provided by the transfer agent, sub-transfer agents, omnibus account servicers and record-keepers. As compensation for its services under the class-level administration agreement, Funds Management receives an annual fee which is calculated based on the average daily net assets of each class as follows:
| | | | |
| | | Class-level
administration fee | |
Class A, Class B, Class C | | | 0.21 | % |
Administrator Class, Institutional Class | | | 0.13 | |
Funds Management has contractually waived and/or reimbursed management and administration fees to the extent necessary to maintain certain net operating expense ratios for the Fund. Waiver of fees and/or reimbursement of expenses by Funds Management were made first from fund level expenses on a proportionate basis and then from class specific expenses. Funds Management has committed through January 31, 2018 to waive fees and/or reimburse expenses to the extent necessary to cap the Fund’s expenses at 1.15% for Class A shares, 1.90% for Class C shares, 0.90% for Administrator Class shares, and 0.75% for Institutional Class shares. After this time, the cap may be increased or the commitment to maintain the cap may be terminated only with the approval of the Board of Trustees.
During the six months ended March 31, 2017, State Street Bank and Trust Company, the Fund’s custodian, reimbursed the Fund $1,111 for certain out-of-pocket expenses that were billed to the Fund in error from 1998-2015. This amount is included in dividend income on the Statement of Operations. In addition, Funds Management was also reimbursed $3,063 for waivers/reimbursements it made to the Fund during the period the Fund was erroneously billed.
Distribution fees
The Trust has adopted a distribution plan for Class B and Class C shares of the Fund pursuant to Rule 12b-1 under the 1940 Act. Distribution fees are charged to Class B and Class C shares and paid to Wells Fargo Funds Distributor, LLC (“Funds Distributor”), the principal underwriter, at an annual rate of 0.75% of the average daily net assets of Class B and Class C shares.
In addition, Funds Distributor is entitled to receive the front-end sales charge from the purchase of Class A shares and a contingent deferred sales charge on the redemption of certain Class A shares. Funds Distributor is also entitled to receive the contingent deferred sales charges from redemptions of Class B and Class C shares. For the six months ended March 31, 2017, Funds Distributor received $53,497 from the sale of Class A shares and $595 in contingent deferred sales charges from redemptions of Class C shares.
| | | | | | |
| Notes to financial statements (unaudited) | | Wells Fargo Index Asset Allocation Fund | | | 39 | |
Shareholder servicing fees
The Trust has entered into contracts with one or more shareholder servicing agents, whereby Class A, Class B, Class C, and Administrator Class of the Fund are charged a fee at an annual rate of 0.25% of the average daily net assets of each respective class.
A portion of these total shareholder servicing fees were paid to affiliates of Wells Fargo.
5. INVESTMENT PORTFOLIO TRANSACTIONS
Purchases and sales of investments, excluding short-term securities, for the six months ended March 31, 2017 were as follows:
| | | | | | |
Purchases at cost | | Sales proceeds |
U.S.
government | | Non-U.S.
government | | U.S.
government | | Non-U.S.
government |
| $51,480,066 | | $41,126,209 | | $18,304,974 | | $50,554,403 |
The Fund may purchase or sell investment securities to other Wells Fargo affiliates pursuant to Rule 17a-7 of the 1940 Act and under procedures adopted by the Board of Trustees. The procedures have been designed to ensure that these interfund transactions, which generally do not incur broker commissions, are effected at current market prices. Interfund trades are included within the respective purchases and sales amounts shown.
6. INVESTMENTS IN AFFILIATES
An affiliated investment is a company which is under common ownership or control of the Fund or which the Fund has ownership of at least 5% of the outstanding voting shares. The following is a summary of transactions for the long-term holdings of issuers that were either affiliates of the Fund at the beginning of the period or the end of the period.
| | | | | | | | | | | | | | | | | | | | | | | | | | | | |
| | | Shares,
beginning of period | | | Shares
purchased | | | Shares
sold | | | Shares, end of period | | | Value, end
of period | | | Income
from affiliated
securities | | | Realized
gains | |
Wells Fargo & Company | | | 168,853 | | | | 1,238 | | | | 4,479 | | | | 165,612 | | | $ | 9,217,964 | | | $ | 128,212 | | | $ | 11,442 | |
7. DERIVATIVE TRANSACTIONS
During the six months ended March 31, 2017, the Fund entered into futures contracts to gain market exposure to certain asset classes in accordance with an active asset allocation strategy.
At March 31, 2017, the Fund had long/short futures contracts outstanding as follows:
| | | | | | | | | | | | | | |
| Expiration date | | Counterparty | | Contracts | | Type | | Contract value at March 31, 2017 | | | Unrealized
gains (losses) | |
6-16-2017 | | GoldmanSachs | | 47 Long | | S&P 500 E-Mini Index | | $ | 5,544,120 | | | $ | 31,719 | |
6-21-2017 | | GoldmanSachs | | 750 Short | | 10-Year U.S. Treasury Notes | | | 93,421,875 | | | | (91,338 | ) |
6-30-2017 | | Goldman Sachs | | 156 Long | | 5-Year U.S. Treasury Notes | | | 18,365,344 | | | | 94,186 | |
The Fund had an average notional amount of $16,301,553 and $64,977,212 in long and short futures contracts, respectively, during the six months ended March 31, 2017.
On March 31, 2017, the cumulative unrealized gains on futures contracts in the amount of $34,567 are reflected in net unrealized gains on investments on the Statement of Assets and Liabilities. The receivable and payable for daily variation margin on open futures contracts reflected in the Statement of Assets and Liabilities only represents the current day’s variation margin. The realized gains and change in unrealized gains (losses) on futures contracts are reflected in the Statement of Operations.
| | | | |
| 40 | | Wells Fargo Index Asset Allocation Fund | | Notes to financial statements (unaudited) |
A summary of the location of derivative instruments on the financial statements by primary risk exposure is outlined following tables.
The fair value of derivative instruments as of March 31, 2017 was as follows for the Fund:
| | | | | | | | | | | | |
| | | Asset derivatives | | | Liability derivatives | |
| | | Statement of Assets and
Liabilities location | | Fair value | | | Statement of Assets and
Liabilities location | | Fair value | |
Equity contracts | | Receivable for daily variation margin on open futures contracts | | $ | 0 | * | | Payable for daily variation margin on open futures contracts | | $ | 12,690 | * |
Interest rate contracts | | Receivable for daily variation margin on open futures contracts | | | 25,594 | * | | Payable for daily variation margin on open futures contracts | | | 164,063 | * |
| | | $ | 25,594 | | | | | $ | 176,753 | |
| * | Only the current day’s variation margin as of March 31, 2017 is reported separately on the Statement of Assets and Liabilities. |
The effect of derivative instruments on the Statement of Operations for the six months ended March 31, 2017 was as follows for the Fund:
| | | | | | | | |
| | | Amount of realized
gains on
derivatives | | | Change in unrealized
gains (losses) on
derivatives | |
Equity contracts | | $ | 1,715,945 | | | $ | 12,599 | |
Interest rate contracts | | | 7,449,527 | | | | (346,284 | ) |
| | | $ | 9,165,472 | | | $ | (333,685 | ) |
For certain types of derivative transactions, the Fund has entered into International Swaps and Derivatives Association, Inc. master agreements (“ISDA Master Agreements”) or similar agreements with approved counterparties. The ISDA Master Agreements or similar agreements may have requirements to deliver/deposit securities or cash to/with an exchange or broker-dealer as collateral and allows the Fund to offset, with each counterparty, certain derivative financial instrument’s assets and/or liabilities with collateral held or pledged. Collateral requirements differ by type of derivative. Collateral or margin requirements are set by the broker or exchange clearing house for exchange traded derivatives while collateral terms are contract specific for over-the-counter traded derivatives. Cash collateral that has been pledged to cover obligations of the Fund under ISDA Master Agreements or similar agreements, if any, will be reported separately in the Statement of Assets and Liabilities. Securities pledged as collateral, if any, for the same purpose are noted in the Portfolio of Investments. With respect to balance sheet offsetting, absent an event of default by the counterparty or a termination of the agreement, the reported amounts of financial assets and financial liabilities in the Statement of Assets and Liabilities are not offset across transactions between the Fund and the applicable counterparty. A reconciliation of the gross amounts on the Statement of Assets and Liabilities to the net amounts by derivative type, including any collateral exposure, is as follows:
| | | | | | | | | | | | | | | | |
| Derivative type | | Counterparty | | Gross amounts
of assets in the
Statement of
Assets and
Liabilities | | Amounts
subject to
netting
agreements | | | Collateral
received | | | Net amount
of assets | |
Futures – variation margin | | Goldman Sachs | | $25,594 | | $ | (25,594 | ) | | $ | 0 | | | $ | 0 | |
| | | | | | | | | | | | | | | | |
| Derivative type | | Counterparty | | Gross amounts
of liabilities in the
Statement of
Assets and
Liabilities | | Amounts
subject to
netting
agreements | | | Collateral
pledged1 | | | Net amount
of liabilities | |
Futures – variation margin | | Goldman Sachs | | $176,753 | | $ | (25,594 | ) | | $ | (151,159 | ) | | $ | 0 | |
| | 1 | Collateral pledged within this table is limited to the collateral for the net transaction with the counterparty. | |
| | | | | | |
| Notes to financial statements (unaudited) | | Wells Fargo Index Asset Allocation Fund | | | 41 | |
7. BANK BORROWINGS
The Trust (excluding the money market funds and certain other funds) and Wells Fargo Variable Trust are parties to a $250,000,000 revolving credit agreement whereby the Fund is permitted to use bank borrowings for temporary or emergency purposes, such as to fund shareholder redemption requests. Interest under the credit agreement is charged to the Fund based on a borrowing rate equal to the higher of the Federal Funds rate in effect on that day plus 1.25% or the overnight LIBOR rate in effect on that day plus 1.25%. In addition, an annual commitment fee equal to 0.25% of the unused balance is allocated to each participating fund.
For the six months ended March 31, 2017, there were no borrowings by the Fund under the agreement.
8. INDEMNIFICATION
Under the Trust’s organizational documents, the officers and Trustees have been granted certain indemnification rights against certain liabilities that may arise out of performance of their duties to the Trust. Additionally, in the normal course of business, the Trust may enter into contracts with service providers that contain a variety of indemnification clauses. The Trust’s maximum exposure under these arrangements is dependent on future claims that may be made against the Fund and, therefore, cannot be estimated.
9. NEW ACCOUNTING PRONOUNCEMENT
In December 2016, FASB issued Accounting Standards Update (“ASU”) No. 2016-19, Technical Corrections and Improvements. ASU 2016-19 includes an amendment to FASB ASC Topic 820, Fair Value Measurement which clarifies the difference between a valuation approach and a valuation technique. The amendment also requires an entity to disclose when there has been a change in either or both a valuation approach and/or a valuation technique. The disclosure requirements are effective for fiscal years and interim periods within those fiscal years beginning after December 15, 2016. Management is currently evaluating the potential impact of this new guidance to the financial statements.
10. REGULATORY CHANGES
In October 2016, the Securities and Exchange Commission (“SEC”) adopted new rules and forms and amended existing rules and forms (together, “final rules”) intended to modernize and enhance the reporting and disclosure of information by registered investment companies and to enhance liquidity risk management by open-end mutual funds and exchange-traded funds. The final rules will enhance the quality of information available to investors and will allow the SEC to more effectively collect and use data reported by funds. In part, the final rules amend Regulation S-X and require standardized, enhanced disclosure about derivatives in the Fund’s financial statements, as well as other amendments. The compliance date for the amendments to Regulation S-X is August 1, 2017 while the compliance date for the new form types is June 1, 2018 and the compliance date for the liquidity risk management program requirements is December 1, 2018. Management is currently assessing the potential impact of these enhancements and their impact on the financial statement disclosures and reporting requirements.
| | | | |
| 42 | | Wells Fargo Index Asset Allocation Fund | | Other information (unaudited) |
PROXY VOTING INFORMATION
A description of the policies and procedures that the Fund uses to determine how to vote proxies relating to portfolio securities is available, upon request, by calling 1-800-222-8222, visiting our website at wellsfargofunds.com, or visiting the SEC website at sec.gov. Information regarding how the Fund voted proxies relating to portfolio securities during the most recent 12-month period ended June 30 is available on the Fund’s website at wellsfargofunds.com or by visiting the SEC website at sec.gov.
PORTFOLIO HOLDINGS INFORMATION
The complete portfolio holdings for the Fund are publicly available monthly on the Fund’s website (wellsfargofunds.com), on a one-month delayed basis. In addition, top ten holdings information (excluding derivative positions) for the Fund is publicly available on the Fund’s website on a monthly, seven-day or more delayed basis. The Fund files its complete schedule of portfolio holdings with the SEC for the first and third quarters of each fiscal year on Form N-Q, which is available by visiting the SEC website at sec.gov. In addition, the Fund’s Form N-Q may be reviewed and copied at the SEC’s Public Reference Room in Washington, DC, and at regional offices in New York City, at 233 Broadway, and in Chicago, at 175 West Jackson Boulevard, Suite 900. Information about the Public Reference Room may be obtained by calling 1-800-SEC-0330.
| | | | | | |
| Other information (unaudited) | | Wells Fargo Index Asset Allocation Fund | | | 43 | |
BOARD OF TRUSTEES AND OFFICERS
Each of the Trustees and Officers1 listed in the table below acts in identical capacities for each fund in the Wells Fargo family of funds, which consists of 138 mutual funds comprising the Wells Fargo Funds Trust, Wells Fargo Variable Trust, Wells Fargo Master Trust and four closed-end funds (collectively the “Fund Complex”). This table should be read in conjunction with the Prospectus and the Statement of Additional Information2. The mailing address of each Trustee and Officer is 525 Market Street, 12th Floor, San Francisco, CA 94105. Each Trustee and Officer serves an indefinite term, however, each Trustee serves such term until reaching the mandatory retirement age established by the Trustees.
Independent Trustees
| | | | | | |
Name and year of birth | | Position held and length of service* | | Principal occupations during past five years or longer | | Current other public company or investment company directorships |
William R. Ebsworth (Born 1957) | | Trustee, since 2015 | | Retired. From 1984 to 2013, equities analyst, portfolio manager, research director and chief financial officer at Fidelity Management and Research Company in Boston, Tokyo, and Hong Kong and retired in 2013 as Chief Investment Officer of Fidelity Strategic Advisers, Inc. where he lead a team of investment professionals managing client assets. Prior thereto, Board member of Hong Kong Securities Clearing Co., Hong Kong Options Clearing Corp., the Thailand International Fund, Ltd., Fidelity Investments Life Insurance Company, and Empire Fidelity Investments Life Insurance Company. Board member of the Fonté Foundation (non-profit organization) and the Vincent Memorial Hospital Endowment (non-profit organization), where he serves on the Investment Committee and as a Chair of the Audit Committee. Mr. Ebsworth is a CFA® charterholder and an Adjunct Lecturer, Finance, at Babson College. | | Asset Allocation Trust |
Jane A. Freeman (Born 1953) | | Trustee, since 2015 | | Retired. From 2012 to 2014 and 1999 to 2008, Chief Financial Officer of Scientific Learning Corporation. From 2008 to 2012, Ms. Freeman provided consulting services related to strategic business projects. Prior to 1999, Portfolio Manager at Rockefeller & Co. and Scudder, Stevens & Clark. Board member of the Harding Loevner Funds from 1996 to 2014, serving as both Lead Independent Director and chair of the Audit Committee. Board member of the Russell Exchange Traded Funds Trust from 2011 to 2012 and the chair of the Audit Committee. Ms. Freeman is Chair of Taproot Foundation (non-profit organization), a Board Member of Ruth Bancroft Garden (non-profit organization) and an inactive chartered financial analyst. | | Asset Allocation Trust |
Peter G. Gordon** (Born 1942) | | Trustee, since 1998; Chairman, since 2005 | | Co-Founder, Retired Chairman, President and CEO of Crystal Geyser Water Company. Trustee Emeritus, Colby College. | | Asset Allocation Trust |
Isaiah Harris, Jr. (Born 1952) | | Trustee, since 2009 | | Retired. Chairman of the Board of CIGNA Corporation since 2009, and Director since 2005. From 2003 to 2011, Director of Deluxe Corporation. Prior thereto, President and CEO of BellSouth Advertising and Publishing Corp. from 2005 to 2007, President and CEO of BellSouth Enterprises from 2004 to 2005 and President of BellSouth Consumer Services from 2000 to 2003. Emeritus member of the Iowa State University Foundation Board of Governors. Emeritus Member of the Advisory Board of Iowa State University School of Business. Advisory Board Member, Palm Harbor Academy (charter school). Advisory Board Member, Child Evangelism Fellowship (non-profit). Mr. Harris is a certified public accountant (inactive status). | | CIGNA Corporation; Asset Allocation Trust |
Judith M. Johnson (Born 1949) | | Trustee, since 2008; Audit Committee Chairman, since 2008 | | Retired. Prior thereto, Chief Executive Officer and Chief Investment Officer of Minneapolis Employees Retirement Fund from 1996 to 2008. Ms. Johnson is an attorney, certified public accountant and a certified managerial accountant. | | Asset Allocation Trust |
David F. Larcker (Born 1950) | | Trustee, since 2009 | | James Irvin Miller Professor of Accounting at the Graduate School of Business, Stanford University, Director of the Corporate Governance Research Initiative and Senior Faculty of The Rock Center for Corporate Governance since 2006. From 2005 to 2008, Professor of Accounting at the Graduate School of Business, Stanford University. Prior thereto, Ernst & Young Professor of Accounting at The Wharton School, University of Pennsylvania from 1985 to 2005. | | Asset Allocation Trust |
| | | | |
| 44 | | Wells Fargo Index Asset Allocation Fund | | Other information (unaudited) |
| | | | | | |
Name and year of birth | | Position held and length of service* | | Principal occupations during past five years or longer | | Current other public company or investment company directorships |
Olivia S. Mitchell (Born 1953) | | Trustee, since 2006 | | International Foundation of Employee Benefit Plans Professor, Wharton School of the University of Pennsylvania since 1993. Director of Wharton’s Pension Research Council and Boettner Center on Pensions & Retirement Research, and Research Associate at the National Bureau of Economic Research. Previously, Cornell University Professor from 1978 to 1993. | | Asset Allocation Trust |
Timothy J. Penny (Born 1951) | | Trustee, since 1996 | | President and Chief Executive Officer of Southern Minnesota Initiative Foundation, a non-profit organization, since 2007 and Senior Fellow at the Humphrey Institute Policy Forum at the University of Minnesota since 1995. Member of the Board of Trustees of NorthStar Education Finance, Inc., a non-profit organization, since 2007. | | Asset Allocation Trust |
Michael S. Scofield (Born 1943) | | Trustee, since 2010 | | Served on the Investment Company Institute’s Board of Governors and Executive Committee from 2008-2011 as well the Governing Council of the Independent Directors Council from 2006-2011 and the Independent Directors Council Executive Committee from 2008-2011. Chairman of the IDC from 2008-2010. Institutional Investor (Fund Directions) Trustee of Year in 2007. Trustee of the Evergreen Funds complex (and its predecessors) from 1984 to 2010. Chairman of the Evergreen Funds from 2000-2010. Former Trustee of the Mentor Funds. Retired Attorney, Law Offices of Michael S. Scofield. | | Asset Allocation Trust |
| * | Length of service dates reflect the Trustee’s commencement of service with the Trust’s predecessor entities, where applicable. |
| ** | Peter Gordon is expected to retire on December 31, 2017. |
Officers
| | | | | | |
Name and year of birth | | Position held and length of service | | Principal occupations during past five years or longer | | |
Andrew Owen (Born 1960) | | President, since 2017 | | Executive Vice President of Wells Fargo Bank, N.A. and President of Wells Fargo & Company and Head of Affiliated Managers, Wells Fargo Asset Management, since 2014. Executive Vice President responsible for marketing, investments and product development for Wells Fargo Funds Management, LLC, from 2009 to 2014. | | |
Jeremy DePalma1 (Born 1974) | | Treasurer, since 2012 | | Senior Vice President of Wells Fargo Funds Management, LLC since 2009. Senior Vice President of Evergreen Investment Management Company, LLC from 2008 to 2010 and head of the Fund Reporting and Control Team within Fund Administration from 2005 to 2010. | | |
C. David Messman (Born 1960) | | Secretary, since 2000; Chief Legal Officer, since 2003 | | Senior Vice President and Secretary of Wells Fargo Funds Management, LLC since 2001. Assistant General Counsel of Wells Fargo Bank, N.A. since 2013 and Vice President and Managing Counsel of Wells Fargo Bank, N.A. from 1996 to 2013. | | |
Michael Whitaker (Born 1967) | | Chief Compliance Officer, since 2016 | | Executive Vice President of Wells Fargo Funds Management, LLC since 2016. Chief Compliance Officer of Fidelity’s Fixed Income Funds and Asset Allocation Funds from 2008 to 2016, Compliance Officer of FMR Co., Inc. from 2014 to 2016, Fidelity Investments Money Management, Inc. from 2014 to 2016, Fidelity Investments from 2007 to 2016. | | |
David Berardi (Born 1975) | | Assistant Treasurer, since 2009 | | Vice President of Wells Fargo Funds Management, LLC since 2009. Vice President of Evergreen Investment Management Company, LLC from 2008 to 2010. Manager of Fund Reporting and Control for Evergreen Investment Management Company, LLC from 2004 to 2010. | | |
| 1 | Jeremy DePalma acts as Treasurer of 69 funds and Assistant Treasurer of 69 funds in the Fund Complex. |
| 2 | The Statement of Additional Information includes additional information about the Trustees and is available, without charge, upon request, by calling
1-800-222-8222 or by visiting the website at wellsfargofunds.com. |
| | | | | | |
| List of abbreviations | | Wells Fargo Index Asset Allocation Fund | | | 45 | |
The following is a list of common abbreviations for terms and entities that may have appeared in this report.
| ACA | — ACA Financial Guaranty Corporation |
| ADR | — American depositary receipt |
| ADS | — American depositary shares |
| AGC | — Assured Guaranty Corporation |
| AGM | — Assured Guaranty Municipal |
| Ambac | — Ambac Financial Group Incorporated |
| AMT | — Alternative minimum tax |
| BAN | — Bond anticipation notes |
| BHAC | — Berkshire Hathaway Assurance Corporation |
| CAB | — Capital appreciation bond |
| CCAB | — Convertible capital appreciation bond |
| CDA | — Community Development Authority |
| CDO | — Collateralized debt obligation |
| DRIVER | — Derivative inverse tax-exempt receipts |
| DW&P | — Department of Water & Power |
| DWR | — Department of Water Resources |
| ECFA | — Educational & Cultural Facilities Authority |
| EDA | — Economic Development Authority |
| EDFA | — Economic Development Finance Authority |
| ETF | — Exchange-traded fund |
| FDIC | — Federal Deposit Insurance Corporation |
| FFCB | — Federal Farm Credit Banks |
| FGIC | — Financial Guaranty Insurance Corporation |
| FHA | — Federal Housing Administration |
| FHLB | — Federal Home Loan Bank |
| FHLMC | — Federal Home Loan Mortgage Corporation |
| FICO | — The Financing Corporation |
| FNMA | — Federal National Mortgage Association |
| GDR | — Global depositary receipt |
| GNMA | — Government National Mortgage Association |
| HCFR | — Healthcare facilities revenue |
| HEFA | — Health & Educational Facilities Authority |
| HEFAR | — Higher education facilities authority revenue |
| HFA | — Housing Finance Authority |
| HFFA | — Health Facilities Financing Authority |
| HUD | — Department of Housing and Urban Development |
| IDA | — Industrial Development Authority |
| IDAG | — Industrial Development Agency |
| KRW | — Republic of Korea won |
| LIBOR | — London Interbank Offered Rate |
| LIFER | — Long Inverse Floating Exempt Receipts |
| LLC | — Limited liability company |
| LLLP | — Limited liability limited partnership |
| LLP | — Limited liability partnership |
| MBIA | — Municipal Bond Insurance Association |
| MFHR | — Multifamily housing revenue |
| MSTR | — Municipal securities trust receipts |
| MUD | — Municipal Utility District |
| National | — National Public Finance Guarantee Corporation |
| PCFA | — Pollution Control Financing Authority |
| PCL | — Public Company Limited |
| PCR | — Pollution control revenue |
| PFA | — Public Finance Authority |
| PFFA | — Public Facilities Financing Authority |
| PFOTER | — Puttable floating option tax-exempt receipts |
| plc | — Public limited company |
| PUTTER | — Puttable tax-exempt receipts |
| R&D | — Research & development |
| Radian | — Radian Asset Assurance |
| RAN | — Revenue anticipation notes |
| RDA | — Redevelopment Authority |
| RDFA | — Redevelopment Finance Authority |
| REIT | — Real estate investment trust |
| ROC | — Reset option certificates |
| SAVRS | — Select auction variable rate securities |
| SBA | — Small Business Authority |
| SDR | — Swedish depositary receipt |
| SFHR | — Single-family housing revenue |
| SFMR | — Single-family mortgage revenue |
| SPA | — Standby purchase agreement |
| SPDR | — Standard & Poor’s Depositary Receipts |
| SPEAR | — Short Puttable Exempt Adjustable Receipts |
| STRIPS | — Separate trading of registered interest and |
| TAN | — Tax anticipation notes |
| TIPS | — Treasury inflation-protected securities |
| TRAN | — Tax revenue anticipation notes |
| TTFA | — Transportation Trust Fund Authority |
| TVA | — Tennessee Valley Authority |
This page is intentionally left blank.
This page is intentionally left blank.
This page is intentionally left blank.

For more information
More information about Wells Fargo Funds is available free upon request. To obtain literature, please write, email, visit the Fund’s website, or call:
Wells Fargo Funds
P.O. Box 8266
Boston, MA 02266-8266
Email: fundservice@wellsfargo.com
Website: wellsfargofunds.com
Individual investors: 1-800-222-8222
Retail investment professionals: 1-888-877-9275
Institutional investment professionals: 1-866-765-0778
This report and the financial statements contained herein are submitted for the general information of the shareholders of the Fund. If this report is used for promotional purposes, distribution of the report must be accompanied or preceded by a current prospectus. Before investing, please consider the investment objectives, risks, charges, and expenses of the investment. For a current prospectus and, if available, a summary prospectus, containing this information, call 1-800-222-8222 or visit the Fund’s website at wellsfargofunds.com. Read the prospectus carefully before you invest or send money.
Wells Fargo Asset Management (WFAM) is a trade name used by the asset management businesses of Wells Fargo & Company. Wells Fargo Funds Management, LLC, a wholly owned subsidiary of Wells Fargo & Company, provides investment advisory and administrative services for Wells Fargo Funds. Other affiliates of Wells Fargo & Company provide subadvisory and other services for the funds. The funds are distributed by Wells Fargo Funds Distributor, LLC, Member FINRA, an affiliate of Wells Fargo & Company. Neither Wells Fargo Funds Management nor Wells Fargo Funds Distributor has Fund customer accounts/assets, and neither provides investment advice/recommendations or acts as an investment advice fiduciary to any investor.
NOT FDIC INSURED ◾ NO BANK GUARANTEE ◾ MAY LOSE VALUE
© 2017 Wells Fargo Funds Management, LLC. All rights reserved.
| | |
 | | 302883 05-17 SA227/SAR227 03-17 |
Semi-Annual Report
March 31, 2017

Wells Fargo International Bond Fund


Reduce clutter. Save trees.
Sign up for electronic delivery of prospectuses and shareholder reports at wellsfargo.com/advantagedelivery
Contents
The views expressed and any forward-looking statements are as of March 31, 2017, unless otherwise noted, and are those of the Fund managers and/or Wells Fargo Funds Management, LLC. Discussions of individual securities, or the markets generally, or any Wells Fargo Fund are not intended as individual recommendations. Future events or results may vary significantly from those expressed in any forward-looking statements. The views expressed are subject to change at any time in response to changing circumstances in the market. Wells Fargo Funds Management, LLC and the Fund disclaim any obligation to publicly update or revise any views expressed or forward-looking statements.
NOT FDIC INSURED ◾ NO BANK GUARANTEE ◾ MAY LOSE VALUE
| | | | |
| 2 | | Wells Fargo International Bond Fund | | Letter to shareholders (unaudited) |

Andrew Owen
President
Wells Fargo Funds
U.S. and international stocks returned 10.12% and 8.18% for the six-month period; within fixed income, the Bloomberg Barclays U.S. Aggregate Bond Index3 returned -2.18%.
Dear Shareholder:
As the new president of Wells Fargo Funds now that Karla Rabusch is retiring from that position after nearly 14 years, I am pleased to offer you this semi-annual report for the Wells Fargo International Bond Fund for the six-month period that ended March 31, 2017. During this period, global stocks delivered favorable results overall. U.S. and international stocks returned 10.12% and 8.18% for the six-month period, respectively, as measured by the S&P 500 Index1 and the MSCI ACWI ex USA Index (Net)2; within fixed income, the Bloomberg Barclays U.S. Aggregate Bond Index3 returned -2.18%.
During the fourth quarter of 2016, prospects for faster growth and higher interest rates in the U.S. influenced markets.
Early in the fourth quarter of 2016, U.S. stocks tended to trade lower amid concerns such as a likely interest-rate increase and uncertainty over the approaching general election. However, following Donald Trump’s election as president in early November, U.S. stocks began to rally. Investors appeared optimistic that the new administration would usher in a series of progrowth policies, and supportive economic news helped the rally carry through the quarter. The buoyant environment sent interest rates higher as well. At its mid-December meeting, Fed officials raised their short-term target interest rate for the first time in a year by a quarter percentage point to between 0.50% and 0.75%. The fourth quarter also saw the implementation of the U.S. Securities and Exchange Commission’s new rules for money market funds, which included floating net asset values (NAVs) for institutional prime and municipal money market funds as well as liquidity fees and redemption gates. In the year leading up to money market fund reform implementation, nearly $1 trillion in assets moved from these types of money market funds into government money market funds, which continued to transact at a stable $1 NAV. Outside of the U.S., the prospects for faster U.S. growth appeared to trigger some acceleration in Europe. The improvement may be partly attributable to expectations for further strengthening of the U.S. dollar, which in turn could improve demand for European goods in the U.S. due to weakening of the euro relative to the dollar. Meanwhile, rising inflation across the eurozone and Japan caused an upward shift in yield curves in those areas although developed-country bond yields remained significantly lower than U.S. Treasury yields.
Globally, stocks delivered positive results and economies showed some improvement in the first quarter of 2017.
Stocks rallied globally through the first quarter of 2017, supported by signs of improvement in the U.S. and global economies. U.S. economic data released during the quarter reflected a healthy economy. Hiring remained strong, and business and consumer sentiment improved. Meanwhile, inflation inched up during the quarter. Along with the pickup in inflation, investors appeared to shift
| 1 | The S&P 500 Index consists of 500 stocks chosen for market size, liquidity, and industry group representation. It is a market-value-weighted index with each stock’s weight in the index proportionate to its market value. You cannot invest directly in an index. |
| 2 | The Morgan Stanley Capital International (MSCI) All Country World Index (ACWI) ex USA Index (Net) is a free-float-adjusted market-capitalization-weighted index that is designed to measure the equity market performance of developed markets, excluding the United States and Canada. Source: MSCI. MSCI makes no express or implied warranties or representations and shall have no liability whatsoever with respect to any MSCI data contained herein. The MSCI data may not be further redistributed or used as a basis for other indexes or any securities or financial products. This report is not approved, reviewed, or produced by MSCI. You cannot invest directly in an index. |
| 3 | The Bloomberg Barclays U.S. Aggregate Bond Index (formerly known as Barclays U.S. Aggregate Bond Index) is a broad-based benchmark that measures the investment-grade, U.S. dollar–denominated, fixed-rate taxable bond market, including Treasuries, government-related and corporate securities, mortgage-backed securities (agency fixed-rate and hybrid adjustable-rate mortgage pass-throughs), asset-backed securities, and commercial mortgage-backed securities. You cannot invest directly in an index. |
| | | | | | |
| Letter to shareholders (unaudited) | | Wells Fargo International Bond Fund | | | 3 | |
from a mindset of very gradual interest-rate increases by the Fed to an anticipation of three or four increases in 2017. The first of these occurred in March; Fed officials raised their short-term target rate by a quarter percentage point to between 0.75% and 1.00%. With the Fed’s target-rate increase, short-term bond yields rose during the quarter. Meanwhile, longer-term Treasury yields were little changed, leading to positive performance. Investment-grade and high-yield bonds benefited from strong demand. Municipal bond returns were positive in the quarter, helped by strong demand and constrained new-issue supply. Outside of the U.S., credit spreads narrowed, helping lower-quality credit outperform amid a strong demand for yield. Also, stocks in emerging markets generally outperformed stocks in the U.S. and international developed markets. Thus far in 2017, emerging markets overall have benefited from both global economic growth and recent weakening in the U.S. dollar. European stocks also outperformed the U.S. market, despite investors’ concern over uncertainties such as the potential impact of an upcoming election in France; a contender for president of France, Marine Le Pen, favored exiting the European Union, which could potentially destabilize or topple the organization.
Don’t let short-term uncertainty derail long-term investment goals.
Periods of uncertainty can present challenges, but experience has taught us that maintaining long-term investment goals can be an effective way to plan for the future. To help you create a sound strategy based on your personal goals and risk tolerance, Wells Fargo Funds offers more than 100 mutual funds spanning a wide range of asset classes and investment styles. Although diversification cannot guarantee an investment profit or prevent losses, we believe it can be an effective way to manage investment risk and potentially smooth out overall portfolio performance. We encourage investors to know their investments and to understand that appropriate levels of risk-taking may unlock opportunities.
Thank you for choosing to invest in Wells Fargo Funds. We appreciate your confidence in us and remain committed to helping you meet your financial needs.
Sincerely,

Andrew Owen
President
Wells Fargo Funds
Although diversification cannot guarantee an investment profit or prevent losses, we believe it can be an effective way to manage investment risk and potentially smooth out overall portfolio performance.
For further information about your Fund, contact your investment professional, visit our website at wellsfargofunds.com, or call us directly at 1-800-222-8222. We are available 24 hours a day, 7 days a week.
| | | | |
| 4 | | Wells Fargo International Bond Fund | | Performance highlights (unaudited) |
Investment objective
The Fund seeks total return, consisting of income and capital appreciation.
Manager
Wells Fargo Funds Management, LLC
Subadviser
First International Advisors, LLC
Portfolio managers
Michael Lee
Tony Norris
Alex Perrin
Christopher Wightman
Peter Wilson
Average annual total returns (%) as of March 31, 20171
| | | | | | | | | | | | | | | | | | | | | | | | | | | | | | | | | | |
| | | | | Including sales charge | | | Excluding sales charge | | | Expense ratios2 (%) | |
| | | Inception date | | 1 year | | | 5 year | | | 10 year | | | 1 year | | | 5 year | | | 10 year | | | Gross | | | Net3 | |
| Class A (ESIYX) | | 9-30-2003 | | | (7.94 | ) | | | (2.07 | ) | | | 2.61 | | | | (3.61 | ) | | | (1.16 | ) | | | 3.08 | | | | 1.08 | | | | 1.03 | |
| Class C (ESIVX) | | 9-30-2003 | | | (5.29 | ) | | | (1.90 | ) | | | 2.31 | | | | (4.29 | ) | | | (1.90 | ) | | | 2.31 | | | | 1.83 | | | | 1.78 | |
| Class R6 (ESIRX) | | 11-30-2012 | | | – | | | | – | | | | – | | | | (3.19 | ) | | | (0.77 | ) | | | 3.43 | | | | 0.70 | | | | 0.65 | |
| Administrator Class (ESIDX) | | 7-30-2010 | | | – | | | | – | | | | – | | | | (3.51 | ) | | | (1.00 | ) | | | 3.25 | | | | 1.02 | | | | 0.85 | |
| Institutional Class (ESICX) | | 12-15-1993 | | | – | | | | – | | | | – | | | | (3.30 | ) | | | (0.84 | ) | | | 3.39 | | | | 0.75 | | | | 0.70 | |
| Bloomberg Barclays Global Aggregate ex-USD Index (unhedged)4 | | – | | | – | | | | – | | | | – | | | | (3.93 | ) | | | (1.13 | ) | | | 2.58 | | | | – | | | | – | |
Figures quoted represent past performance, which is no guarantee of future results, and do not reflect taxes that a shareholder may pay on fund distributions or the redemption of fund shares. Investment return and principal value of an investment will fluctuate so that an investor’s shares, when redeemed, may be worth more or less than their original cost. Performance shown without sales charges would be lower if sales charges were reflected. Current performance may be lower or higher than the performance data quoted, which assumes the reinvestment of dividends and capital gains. Current month-end performance is available on the Fund’s website, wellsfargofunds.com.
Index returns do not include transaction costs associated with buying and selling securities, any mutual fund fees or expenses, or any taxes. It is not possible to invest directly in an index.
For Class A shares, the maximum front-end sales charge is 4.50%. For Class C shares, the maximum contingent deferred sales charge is 1.00%. Performance including a contingent deferred sales charge assumes the sales charge for the corresponding time period. Class R6, Administrator Class, and Institutional Class shares are sold without a front-end sales charge or contingent deferred sales charge.
Bond values fluctuate in response to the financial condition of individual issuers, general market and economic conditions, and changes in interest rates. Changes in market conditions and government policies may lead to periods of heightened volatility in the bond market and reduced liquidity for certain bonds held by the Fund. In general, when interest rates rise, bond values fall and investors may lose principal value. Interest-rate changes and their impact on the fund and its share price can be sudden and unpredictable. Foreign investments are especially volatile and can rise or fall dramatically due to differences in the political and economic conditions of the host country. These risks are generally intensified in emerging markets. The use of derivatives may reduce returns and/or increase volatility. Securities issued by U.S. government agencies or government-sponsored entities may not be guaranteed by the U.S. Treasury. Certain investment strategies tend to increase the total risk of an investment (relative to the broader market). The Fund is exposed to high-yield securities risk and geographic risk. Consult the Fund’s prospectus for additional information on these and other risks.
Please see footnotes on page 5.
| | | | | | |
| Performance highlights (unaudited) | | Wells Fargo International Bond Fund | | | 5 | |
| | | | |
| Ten largest holdings (%) as of March 31, 20175 | |
Poland, 1.50%, 4-25-2020 | | | 5.09 | |
New Zealand, 4.50%, 4-15-2027 | | | 4.59 | |
Mexico, 7.75%, 11-13-2042 | | | 4.48 | |
Malaysia, 3.96%, 9-15-2025 | | | 3.86 | |
Thailand, 3.85%, 12-12-2025 | | | 3.20 | |
Singapore, 3.00%, 9-1-2024 | | | 2.91 | |
U.S. Treasury Note, 2.13%, 12-31-2022 | | | 2.76 | |
U.S. Treasury Note, 1.50%, 8-15-2026 | | | 2.53 | |
Australian Government Bond Series 138, 3.25%, 4-21-2029 | | | 2.42 | |
Brazil, 10.00%, 1-1-2025 | | | 2.26 | |
|
| Portfolio allocation as of March 31, 20176 |
|
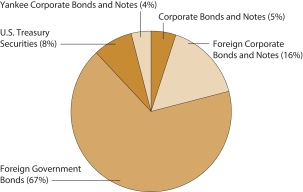 |
| 1 | Historical performance shown for Class R6 shares prior to their inception reflects the performance of Institutional Class shares and includes the higher expenses applicable to Institutional Class shares. If these expenses had not been included, returns for Class R6 shares would be higher. Historical performance shown for Administrator Class shares prior to their inception reflects the performance of Institutional Class shares and has been adjusted to reflect the higher expenses applicable to Administrator Class shares. Historical performance shown for all classes of the Fund prior to July 12, 2010, is based on the performance of the Fund’s predecessor, Evergreen International Bond Fund. |
| 2 | Reflects the expense ratios as stated in the most recent prospectuses. The expense ratios shown are subject to change and may differ from the annualized expense ratios shown in the financial highlights of this report. |
| 3 | The manager has contractually committed through January 31, 2018, to waive fees and/or reimburse expenses to the extent necessary to cap the Fund’s Total Annual Fund Operating Expenses After Fee Waivers at the amounts shown. After this time, the cap may be increased or the commitment to maintain the cap may be terminated only with the approval of the Board of Trustees. Brokerage commissions, stamp duty fees, interest, taxes, acquired fund fees and expenses, and extraordinary expenses are excluded from the expense cap. Without this cap, the Fund’s returns would have been lower. The expense ratio paid by an investor is the net expense ratio or the Fund’s Total Annual Fund Operating Expenses After Fee Waivers, as stated in the prospectuses. |
| 4 | The Bloomberg Barclays Global Aggregate ex-USD Index (unhedged) (formerly known as Barclays Global Aggregate ex-USD Index (unhedged)) is an unmanaged index that provides a broad-based measure of the global investment grade fixed income markets excluding the U.S. dollar denominated debt market. You cannot invest directly in an index. |
| 5 | The ten largest holdings, excluding cash and cash equivalents, are calculated based on the value of the investments divided by total net assets of the Fund. Holdings are subject to change and may have changed since the date specified. |
| 6 | Amounts are calculated based on the total long-term investments of the Fund. These amounts are subject to change and may have changed since the date specified. |
| | | | |
| 6 | | Wells Fargo International Bond Fund | | Fund expenses (unaudited) |
As a shareholder of the Fund, you incur two types of costs: (1) transaction costs, including sales charges (loads) on purchase payments and contingent deferred sales charges (if any) on redemptions and (2) ongoing costs, including management fees, distribution (12b-1) and/or shareholder servicing fees, and other Fund expenses. This example is intended to help you understand your ongoing costs (in dollars) of investing in the Fund and to compare these costs with the ongoing costs of investing in other mutual funds.
The example is based on an investment of $1,000 invested at the beginning of the six-month period and held for the entire period from October 1, 2016 to March 31, 2017.
Actual expenses
The “Actual” line of the table below provides information about actual account values and actual expenses. You may use the information in this line, together with the amount you invested, to estimate the expenses that you paid over the period. Simply divide your account value by $1,000 (for example, an $8,600 account value divided by $1,000 = 8.6), then multiply the result by the number in the “Actual” line under the heading entitled “Expenses paid during period” for your applicable class of shares to estimate the expenses you paid on your account during this period.
Hypothetical example for comparison purposes
The “Hypothetical” line of the table below provides information about hypothetical account values and hypothetical expenses based on the Fund’s actual expense ratio and an assumed rate of return of 5% per year before expenses, which is not the Fund’s actual return. The hypothetical account values and expenses may not be used to estimate the actual ending account balance or expenses you paid for the period. You may use this information to compare the ongoing costs of investing in the Fund and other funds. To do so, compare this 5% hypothetical example with the 5% hypothetical examples that appear in the shareholder reports of the other funds.
Please note that the expenses shown in the table are meant to highlight your ongoing costs only and do not reflect any transactional costs, such as sales charges (loads) and contingent deferred sales charges. Therefore, the “Hypothetical” line of the table is useful in comparing ongoing costs only and will not help you determine the relative total costs of owning different funds. In addition, if these transactional costs were included, your costs would have been higher.
| | | | | | | | | | | | | | | | |
| | | Beginning
account value
10-1-2016 | | | Ending
account value
3-31-2017 | | | Expenses
paid during
the period¹ | | | Annualized net
expense ratio | |
Class A | | | | | | | | | | | | | | | | |
Actual | | $ | 1,000.00 | | | $ | 914.65 | | | $ | 4.92 | | | | 1.03 | % |
Hypothetical (5% return before expenses) | | $ | 1,000.00 | | | $ | 1,019.80 | | | $ | 5.19 | | | | 1.03 | % |
Class C | | | | | | | | | | | | | | | | |
Actual | | $ | 1,000.00 | | | $ | 911.63 | | | $ | 8.48 | | | | 1.78 | % |
Hypothetical (5% return before expenses) | | $ | 1,000.00 | | | $ | 1,016.06 | | | $ | 8.95 | | | | 1.78 | % |
Class R6 | | | | | | | | | | | | | �� | | | |
Actual | | $ | 1,000.00 | | | $ | 916.45 | | | $ | 3.11 | | | | 0.65 | % |
Hypothetical (5% return before expenses) | | $ | 1,000.00 | | | $ | 1,021.69 | | | $ | 3.28 | | | | 0.65 | % |
Administrator Class | | | | | | | | | | | | | | | | |
Actual | | $ | 1,000.00 | | | $ | 914.88 | | | $ | 4.06 | | | | 0.85 | % |
Hypothetical (5% return before expenses) | | $ | 1,000.00 | | | $ | 1,020.69 | | | $ | 4.28 | | | | 0.85 | % |
Institutional Class | | | | | | | | | | | | | | | | |
Actual | | $ | 1,000.00 | | | $ | 915.36 | | | $ | 3.34 | | | | 0.70 | % |
Hypothetical (5% return before expenses) | | $ | 1,000.00 | | | $ | 1,021.44 | | | $ | 3.53 | | | | 0.70 | % |
| 1 | Expenses paid is equal to the annualized net expense ratio of each class multiplied by the average account value over the period, multiplied by the number of days in the most recent fiscal half-year divided by the number of days in the fiscal year (to reflect the one-half-year period). |
| | | | | | |
| Portfolio of investments—March 31, 2017 (unaudited) | | Wells Fargo International Bond Fund | | | 7 | |
| | | | | | | | | | | | | | | | |
| Security name | | Interest rate | | | Maturity date | | | Principal | | | Value | |
| | | | |
Corporate Bonds and Notes: 4.58% | | | | | | | | | | | | | | | | |
| | | | |
| United States: 4.58% | | | | | | | | | | | | | | | | |
AbbVie Incorporated (Health Care, Biotechnology) | | | 3.20 | % | | | 5-14-2026 | | | $ | 900,000 | | | $ | 865,058 | |
Amazon.com Incorporated (Consumer Discretionary, Internet & Direct Marketing Retail) | | | 3.80 | | | | 12-5-2024 | | | | 2,300,000 | | | | 2,435,114 | |
Anheuser-Busch InBev Finance Incorporated (Consumer Staples, Beverages) | | | 3.65 | | | | 2-1-2026 | | | | 2,200,000 | | | | 2,224,420 | |
Apple Incorporated (Information Technology, Technology Hardware, Storage & Peripherals) | | | 2.45 | | | | 8-4-2026 | | | | 2,000,000 | | | | 1,891,684 | |
Federal Mogul Corporation (Consumer Discretionary, Auto Components) 144A | | | 4.88 | | | | 4-15-2022 | | | | 550,000 | | | | 582,779 | |
Ford Motor Credit Company LLC (Finance, Consumer Finance) | | | 2.46 | | | | 3-27-2020 | | | | 2,600,000 | | | | 2,590,905 | |
Gilead Sciences Incorporated (Health Care, Biotechnology) | | | 2.95 | | | | 3-1-2027 | | | | 2,000,000 | | | | 1,896,356 | |
Goldman Sachs Group Incorporated (Financials, Capital Markets) | | | 3.75 | | | | 2-25-2026 | | | | 3,000,000 | | | | 3,018,948 | |
Johnson & Johnson (Health Care, Pharmaceuticals) | | | 2.95 | | | | 3-3-2027 | | | | 2,000,000 | | | | 1,999,614 | |
JPMorgan Chase & Company (Financials, Banks) | | | 3.30 | | | | 4-1-2026 | | | | 2,575,000 | | | | 2,524,278 | |
Kraft Heinz Foods Company (Consumer Staples, Food Products) | | | 3.00 | | | | 6-1-2026 | | | | 2,000,000 | | | | 1,879,286 | |
Microsoft Corporation (Information Technology, Software) | | | 2.40 | | | | 8-8-2026 | | | | 2,000,000 | | | | 1,891,022 | |
Oracle Corporation (Information Technology, Software) | | | 2.65 | | | | 7-15-2026 | | | | 1,900,000 | | | | 1,808,998 | |
| | | | |
Total Corporate Bonds and Notes (Cost $26,327,116) | | | | | | | | | | | | | | | 25,608,462 | |
| | | | | | | | | | | | | | | | |
| | | |
Foreign Corporate Bonds and Notes @: 15.00% | | | | | | | | | | | | | |
| | | | |
| Australia: 0.20% | | | | | | | | | | | | | | | | |
General Electric Capital Corporation (Financials, Diversified Financial Services, AUD) | | | 6.00 | | | | 3-15-2019 | | | | 1,367,000 | | | | 1,111,020 | |
| | | | | | | | | | | | | | | | |
| | | | |
| Brazil: 0.28% | | | | | | | | | | | | | | | | |
BRF SA (Consumer Staples, Food Products, BRL) 144A | | | 7.75 | | | | 5-22-2018 | | | | 5,137,000 | | | | 1,562,957 | |
| | | | | | | | | | | | | | | | |
| | | | |
| Denmark: 6.96% | | | | | | | | | | | | | | | | |
Nordea Kredit Realkredit (Financials, Thrifts & Mortgage Finance, DKK) | | | 2.00 | | | | 10-1-2047 | | | | 71,538,372 | | | | 10,027,641 | |
Nordea Kredit Realkredit (Financials, Thrifts & Mortgage Finance, DKK) | | | 2.50 | | | | 10-1-2047 | | | | 17,710,566 | | | | 2,578,389 | |
Nykredit Realkredit AS (Financials, Thrifts & Mortgage Finance, DKK) | | | 2.00 | | | | 10-1-2047 | | | | 75,650,000 | | | | 10,601,262 | |
Nykredit Realkredit AS (Financials, Thrifts & Mortgage Finance, DKK) | | | 2.50 | | | | 10-1-2047 | | | | 17,742,974 | | | | 2,582,471 | |
Realkredit Danmark AS (Financials, Thrifts & Mortgage Finance, DKK) | | | 2.00 | | | | 10-1-2047 | | | | 75,283,644 | | | | 10,549,923 | |
Realkredit Danmark AS (Financials, Thrifts & Mortgage Finance, DKK) | | | 2.50 | | | | 10-1-2047 | | | | 17,762,469 | | | | 2,593,930 | |
| | | | |
| | | | | | | | | | | | | | | 38,933,616 | |
| | | | | | | | | | | | | | | | |
| | | | |
| France: 0.17% | | | | | | | | | | | | | | | | |
Casino Guichard Perrachon SA (Consumer Staples, Food & Staples Retailing, EUR) | | | 4.50 | | | | 3-7-2024 | | | | 800,000 | | | | 924,826 | |
| | | | | | | | | | | | | | | | |
| | | | |
| Germany: 1.39% | | | | | | | | | | | | | | | | |
HP Pelzer Holding GmbH (Consumer Discretionary, Auto Components, EUR) 144A%% | | | 4.13 | | | | 4-1-2024 | | | | 550,000 | | | | 590,524 | |
KfW (Financials, Banks, AUD) | | | 5.00 | | | | 3-19-2024 | | | | 6,900,000 | | | | 5,921,064 | |
Landwirtschaftliche Rentenbank (Financials, Banks, ZAR) | | | 8.25 | | | | 5-23-2022 | | | | 5,400,000 | | | | 398,472 | |
Senvion Holding (Energy, Energy Equipment & Services, EUR) | | | 6.63 | | | | 11-15-2020 | | | | 800,000 | | | | 877,814 | |
| | | | |
| | | | | | | | | | | | | | | 7,787,874 | |
| | | | | | | | | | | | | | | | |
| | | | |
| Ireland: 0.51% | | | | | | | | | | | | | | | | |
GE Capital UK Funding Company (Financials, Capital Markets, GBP) | | | 5.13 | | | | 5-24-2023 | | | | 1,000,000 | | | | 1,526,689 | |
Virgin Media Receivable (Consumer Discretionary, Media, GBP) | | | 5.50 | | | | 9-15-2024 | | | | 1,000,000 | | | | 1,300,825 | |
| | | | |
| | | | | | | | | | | | | | | 2,827,514 | |
| | | | | | | | | | | | | | | | |
The accompanying notes are an integral part of these financial statements.
| | | | |
| 8 | | Wells Fargo International Bond Fund | | Portfolio of investments—March 31, 2017 (unaudited) |
| | | | | | | | | | | | | | | | |
| Security name | | Interest rate | | | Maturity date | | | Principal | | | Value | |
| | | | |
| Luxembourg: 0.08% | | | | | | | | | | | | | | | | |
European Investment Bank (Financials, Banks, ZAR) | | | 9.00 | % | | | 3-31-2021 | | | | 5,790,000 | | | $ | 443,434 | |
| | | | | | | | | | | | | | | | |
| | | | |
| Mexico: 0.35% | | | | | | | | | | | | | | | | |
America Movil SAB de CV (Telecommunication Services, Wireless Telecommunication Services, MXN) | | | 7.13 | | | | 12-9-2024 | | | | 7,250,000 | | | | 366,073 | |
Nemak SAB de CV (Consumer Discretionary, Auto Components, EUR) 144A | | | 3.25 | | | | 3-15-2024 | | | | 225,000 | | | | 240,990 | |
Petroleos Mexicanos (Energy, Oil, Gas & Consumable Fuels, MXN) 144A | | | 7.19 | | | | 9-12-2024 | | | | 6,532,000 | | | | 308,593 | |
Sigma Alimentos SA de CV (Consumer Discretionary, Food Products, EUR) 144A | | | 2.63 | | | | 2-7-2024 | | | | 950,000 | | | | 1,039,653 | |
| | | | |
| | | | | | | | | | | | | | | 1,955,309 | |
| | | | | | | | | | | | | | | | |
| | | | |
| Netherlands: 0.18% | | | | | | | | | | | | | | | | |
Cemex Finance LLC (Financials, Consumer Finance, EUR) | | | 4.63 | | | | 6-15-2024 | | | | 900,000 | | | | 1,015,308 | |
| | | | | | | | | | | | | | | | |
| | | | |
| Norway: 1.00% | | | | | | | | | | | | | | | | |
Kommunalbanken AS (Financials, Banks, AUD) | | | 5.25 | | | | 7-15-2024 | | | | 6,500,000 | | | | 5,620,701 | |
| | | | | | | | | | | | | | | | |
| | | | |
| Philippines: 1.03% | | | | | | | | | | | | | | | | |
Asian Development Bank (Financials, Banks, AUD) | | | 3.75 | | | | 3-12-2025 | | | | 7,231,000 | | | | 5,751,759 | |
| | | | | | | | | | | | | | | | |
| | | | |
| Spain: 0.16% | | | | | | | | | | | | | | | | |
Ence Energia y Celulosa (Materials, Paper & Forest Products, EUR) | | | 5.38 | | | | 11-1-2022 | | | | 800,000 | | | | 914,152 | |
| | | | | | | | | | | | | | | | |
| | | | |
| United Kingdom: 2.08% | | | | | | | | | | | | | | | | |
AA Bond Company Limited (Financials, Diversified Financial Services, GBP) | | | 5.50 | | | | 7-31-2043 | | | | 600,000 | | | | 770,609 | |
Adient Global Holdings Company (Consumer Discretionary, Auto Components, EUR) | | | 3.50 | | | | 8-15-2024 | | | | 725,000 | | | | 778,418 | |
Alliance Automotive Finance plc (Financials, EUR) 144A | | | 6.25 | | | | 12-1-2021 | | | | 1,000,000 | | | | 1,131,608 | |
FirstGroup plc (Industrials, Road & Rail, GBP) | | | 5.25 | | | | 11-29-2022 | | | | 1,300,000 | | | | 1,900,814 | |
Heathrow Funding Limited (Industrials, Transportation Infrastructure, EUR) | | | 1.88 | | | | 5-23-2024 | | | | 561,000 | | | | 638,025 | |
Heathrow Funding Limited (Industrials, Transportation Infrastructure, GBP) | | | 7.13 | | | | 2-14-2024 | | | | 1,900,000 | | | | 3,094,074 | |
Jaguar Land Rover plc (Consumer Discretionary, Automobiles, GBP) | | | 5.00 | | | | 2-15-2022 | | | | 600,000 | | | | 821,276 | |
Tesco plc (Consumer Staples, Food & Staples Retailing, GBP) | | | 6.13 | | | | 2-24-2022 | | | | 700,000 | | | | 1,009,895 | |
Twinkle Pizza plc (Consumer Discretionary, Hotels, Restaurants & Leisure, GBP) | | | 6.63 | | | | 8-1-2021 | | | | 700,000 | | | | 898,943 | |
Wagamama Finance plc (Financials, Diversified Financial Services, GBP) | | | 7.88 | | | | 2-1-2020 | | | | 450,000 | | | | 587,767 | |
| | | | |
| | | | | | | | | | | | | | | 11,631,429 | |
| | | | | | | | | | | | | | | | |
| | | | |
| United States: 0.61% | | | | | | | | | | | | | | | | |
Albemarle Corporation (Materials, Chemicals, EUR) | | | 1.88 | | | | 12-8-2021 | | | | 987,000 | | | | 1,106,478 | |
Verizon Communications Incorporated (Telecommunication Services, Diversified Telecommunication Services, EUR) | | | 3.25 | | | | 2-17-2026 | | | | 589,000 | | | | 723,627 | |
VF Corporation (Consumer Discretionary, Textiles, Apparel & Luxury Goods, EUR) | | | 0.63 | | | | 9-20-2023 | | | | 1,525,000 | | | | 1,599,852 | |
| | | | |
| | | | | | | | | | | | | | | 3,429,957 | |
| | | | | | | | | | | | | | | | |
| | | | |
Total Foreign Corporate Bonds and Notes (Cost $88,949,264) | | | | | | | | | | | | | | | 83,909,856 | |
| | | | | | | | | | | | | | | | |
| | | | |
Foreign Government Bonds @: 64.68% | | | | | | | | | | | | | | | | |
Australian Government Bond Series 138 (AUD) | | | 3.25 | | | | 4-21-2029 | | | | 17,050,000 | | | | 13,534,139 | |
Australian Government Bond Series 148 (AUD) | | | 2.75 | | | | 11-21-2027 | | | | 15,000,000 | | | | 11,441,408 | |
Brazil (BRL) | | | 10.00 | | | | 1-1-2019 | | | | 19,505,000 | | | | 6,287,465 | |
Brazil (BRL) | | | 10.00 | | | | 1-1-2025 | | | | 38,640,000 | | | | 12,344,458 | |
Canada 144A (CAD) | | | 2.90 | | | | 6-15-2024 | | | | 11,000,000 | | | | 8,837,553 | |
Colombia (COP) | | | 7.00 | | | | 5-4-2022 | | | | 11,100,000,000 | | | | 3,989,406 | |
The accompanying notes are an integral part of these financial statements.
| | | | | | |
| Portfolio of investments—March 31, 2017 (unaudited) | | Wells Fargo International Bond Fund | | | 9 | |
| | | | | | | | | | | | | | | | |
| Security name | | Interest rate | | | Maturity date | | | Principal | | | Value | |
| | | | |
Foreign Government Bonds @ (continued) | | | | | | | | | | | | | | | | |
Hungary (HUF) | | | 1.75 | % | | | 10-26-2022 | | | | 1,865,000,000 | | | $ | 6,292,795 | |
Hungary (HUF) | | | 7.00 | | | | 6-24-2022 | | | | 1,665,000,000 | | | | 7,173,205 | |
Indonesia (IDR) | | | 8.38 | | | | 3-15-2024 | | | | 13,750,000,000 | | | | 1,097,806 | |
Indonesia (IDR) | | | 8.38 | | | | 9-15-2026 | | | | 45,000,000,000 | | | | 3,664,028 | |
Korea (KRW) | | | 3.00 | | | | 9-10-2024 | | | | 12,100,000,000 | | | | 11,488,724 | |
Korea (KRW) | | | 3.13 | | | | 3-10-2019 | | | | 6,400,000,000 | | | | 5,887,577 | |
Malaysia (MYR) | | | 3.66 | | | | 10-15-2020 | | | | 7,650,000 | | | | 1,723,999 | |
Malaysia (MYR) | | | 3.90 | | | | 11-30-2026 | | | | 14,250,000 | | | | 3,153,805 | |
Malaysia (MYR) | | | 3.96 | | | | 9-15-2025 | | | | 97,325,000 | | | | 21,612,945 | |
Malaysia (MYR) | | | 4.50 | | | | 4-15-2030 | | | | 8,950,000 | | | | 2,022,809 | |
Mexico (MXN) | | | 5.75 | | | | 3-5-2026 | | | | 76,500,000 | | | | 3,740,000 | |
Mexico (MXN) | | | 7.75 | | | | 11-13-2042 | | | | 453,000,000 | | | | 25,030,807 | |
Mexico (MXN) | | | 8.00 | | | | 11-7-2047 | | | | 32,000,000 | | | | 1,812,263 | |
Mexico (MXN) | | | 10.00 | | | | 12-5-2024 | | | | 10,850,000 | | | | 681,729 | |
New Zealand (NZD) | | | 4.50 | | | | 4-15-2027 | | | | 33,000,000 | | | | 25,674,637 | |
Norway 144A (NOK) ¤ | | | 0.00 | | | | 9-20-2017 | | | | 107,825,000 | | | | 12,533,353 | |
Norway 144A (NOK) | | | 4.25 | | | | 5-19-2017 | | | | 100,277,000 | | | | 11,730,244 | |
Poland (PLN) | | | 1.50 | | | | 4-25-2020 | | | | 115,700,000 | | | | 28,445,798 | |
Province of British Columbia (AUD) | | | 4.25 | | | | 11-27-2024 | | | | 7,590,000 | | | | 6,137,695 | |
Province of Ontario (AUD) | | | 6.25 | | | | 9-29-2020 | | | | 6,000,000 | | | | 5,105,281 | |
Queensland Treasury 144A (AUD) | | | 3.25 | | | | 7-21-2026 | | | | 7,350,000 | | | | 5,673,753 | |
Queensland Treasury (AUD) | | | 5.75 | | | | 7-22-2024 | | | | 9,000,000 | | | | 8,186,879 | |
Republic of Peru (PEN) | | | 5.70 | | | | 8-12-2024 | | | | 5,000,000 | | | | 1,571,456 | |
Republic of Philippines (PHP) | | | 3.90 | | | | 11-26-2022 | | | | 40,000,000 | | | | 772,496 | |
Republic of South Africa (ZAR) | | | 7.75 | | | | 2-28-2023 | | | | 160,531,000 | | | | 11,660,536 | |
Republic of South Africa (ZAR) | | | 10.50 | | | | 12-21-2026 | | | | 82,350,000 | | | | 6,786,874 | |
Romania (RON) | | | 5.75 | | | | 4-29-2020 | | | | 22,600,000 | | | | 5,865,983 | |
Singapore (SGD) | | | 2.88 | | | | 9-1-2030 | | | | 12,900,000 | | | | 9,737,732 | |
Singapore (SGD) | | | 3.00 | | | | 9-1-2024 | | | | 21,440,000 | | | | 16,277,142 | |
State of New South Wales Australia (AUD) | | | 5.00 | | | | 8-20-2024 | | | | 11,250,000 | | | | 9,920,457 | |
Thailand (THB) | | | 3.85 | | | | 12-12-2025 | | | | 560,025,000 | | | | 17,885,288 | |
Turkey (TRY) | | | 8.70 | | | | 7-11-2018 | | | | 3,500,000 | | | | 935,802 | |
Turkey (TRY) | | | 9.40 | | | | 7-8-2020 | | | | 3,500,000 | | | | 921,116 | |
Turkey (TRY) | | | 10.70 | | | | 2-17-2021 | | | | 4,000,000 | | | | 1,089,573 | |
United Kingdom Gilt (GBP) | | | 1.50 | | | | 7-22-2026 | | | | 5,175,000 | | | | 6,736,043 | |
United Kingdom Gilt (GBP) | | | 2.00 | | | | 9-7-2025 | | | | 5,600,000 | | | | 7,630,066 | |
United Kingdom Gilt (GBP) | | | 4.25 | | | | 6-7-2032 | | | | 5,000,000 | | | | 8,615,871 | |
| | | |
Total Foreign Government Bonds (Cost $365,241,305) | | | | | | | | | | | | 361,710,996 | |
| | | | | | | | | | | | | | | | |
| | | | |
U.S. Treasury Securities: 7.90% | | | | | | | | | | | | | | | | |
U.S. Treasury Bond | | | 3.00 | | | | 11-15-2045 | | | $ | 7,850,000 | | | | 7,799,101 | |
U.S. Treasury Note | | | 1.38 | | | | 10-31-2020 | | | | 6,900,000 | | | | 6,823,990 | |
U.S. Treasury Note | | | 1.50 | | | | 8-15-2026 | | | | 15,300,000 | | | | 14,154,290 | |
U.S. Treasury Note | | | 2.13 | | | | 12-31-2022 | | | | 15,400,000 | | | | 15,434,296 | |
| | | |
Total U.S. Treasury Securities (Cost $45,236,240) | | | | | | | | | | | | 44,211,677 | |
| | | | | | | | | | | | | | | | |
| | | | |
Yankee Corporate Bonds and Notes: 3.94% | | | | | | | | | | | | | | | | |
| | | | |
| Cayman Islands: 0.22% | | | | | | | | | | | | | | | | |
UPCB Finance IV Limited (Financials, Diversified Financial Services) 144A | | | 5.38 | | | | 1-15-2025 | | | | 1,200,000 | | | | 1,207,500 | |
| | | | | | | | | | | | | | | | |
The accompanying notes are an integral part of these financial statements.
| | | | |
| 10 | | Wells Fargo International Bond Fund | | Portfolio of investments—March 31, 2017 (unaudited) |
| | | | | | | | | | | | | | | | |
| Security name | | Interest rate | | | Maturity date | | | Principal | | | Value | |
| | | | |
| France: 0.34% | | | | | | | | | | | | | | | | |
Danone SA (Consumer Staples, Food Products) 144A | | | 2.95 | % | | | 11-2-2026 | | | $ | 2,000,000 | | | $ | 1,911,704 | |
| | | | | | | | | | | | | | | | |
| | | | |
| Ireland: 0.18% | | | | | | | | | | | | | | | | |
Ardagh Packaging Finance plc (Financials, Diversified Financial Services) 144A | | | 4.63 | | | | 5-15-2023 | | | | 1,000,000 | | | | 1,007,500 | |
| | | | | | | | | | | | | | | | |
| | | | |
| Netherlands: 1.38% | | | | | | | | | | | | | | | | |
Fiat Chrysler Automobiles NV (Consumer Discretionary, Automobiles) | | | 5.25 | | | | 4-15-2023 | | | | 1,650,000 | | | | 1,697,025 | |
Mubadala Development Company (Energy, Oil, Gas & Consumable Fuels) | | | 5.50 | | | | 4-20-2021 | | | | 1,700,000 | | | | 1,876,460 | |
Myriad International Holdings BV (Consumer Discretionary, Media) | | | 6.00 | | | | 7-18-2020 | | | | 1,950,000 | | | | 2,099,078 | |
Siemens Financieringsmat Company (Financials, Diversified Financial Services) 144A | | | 2.35 | | | | 10-15-2026 | | | | 2,200,000 | | | | 2,043,058 | |
| | | | |
| | | | | | | | | | | | | | | 7,715,621 | |
| | | | | | | | | | | | | | | | |
| | | | |
| Spain: 0.13% | | | | | | | | | | | | | | | | |
Telefonica Emisiones SAU (Telecommunication Services, Diversified Telecommunication Services) | | | 4.10 | | | | 3-8-2027 | | | | 750,000 | | | | 754,862 | |
| | | | | | | | | | | | | | | | |
| | | | |
| Switzerland: 0.44% | | | | | | | | | | | | | | | | |
Credit Suisse Group Funding Limited (Financials, Diversified Financial Services) | | | 3.80 | | | | 9-15-2022 | | | | 2,400,000 | | | | 2,434,176 | |
| | | | | | | | | | | | | | | | |
| | | | |
| United Kingdom: 1.25% | | | | | | | | | | | | | | | | |
BP Capital Markets plc (Financials, Capital Markets) | | | 3.22 | | | | 4-14-2024 | | | | 4,725,000 | | | | 4,726,523 | |
International Game Technology plc (Consumer Discretionary, Hotels, Restaurants & Leisure) 144A | | | 6.25 | | | | 2-15-2022 | | | | 1,000,000 | | | | 1,067,500 | |
Jaguar Land Rover Automobiles plc (Consumer Discretionary, Automobiles) 144A | | | 3.50 | | | | 3-15-2020 | | | | 1,200,000 | | | | 1,209,000 | |
| | | | |
| | | | | | | | | | | | | | | 7,003,023 | |
| | | | | | | | | | | | | | | | |
| | | | |
Total Yankee Corporate Bonds and Notes (Cost $21,786,304) | | | | | | | | | | | | | | | 22,034,386 | |
| | | | | | | | | | | | | | | | |
| | | | |
| | | Yield | | | | | | Shares | | | | |
| Short-Term Investments: 1.79% | | | | | | | | | | | | | | | | |
| | | | |
| Investment Companies: 1.79% | | | | | | | | | | | | | | | | |
Wells Fargo Government Money Market Fund Select Class (l)(u)## | | | 0.63 | | | | | | | | 9,985,374 | | | | 9,985,374 | |
| | | | | | | | | | | | | | | | |
| | | | |
Total Short-Term Investments (Cost $9,985,374) | | | | | | | | | | | | | | | 9,985,374 | |
| | | | | | | | | | | | | | | | |
| | | | | | | | |
| Total investments in securities (Cost $557,525,603) * | | | 97.89 | % | | | 547,460,751 | |
Other assets and liabilities, net | | | 2.11 | | | | 11,788,750 | |
| | | | | | | | |
| Total net assets | | | 100.00 | % | | $ | 559,249,501 | |
| | | | | | | | |
| 144A | The security may be resold in transactions exempt from registration, normally to qualified institutional buyers, pursuant to Rule 144A under the Securities Act of 1933. |
| @ | Foreign bond principal is denominated in the local currency of the issuer. |
| %% | The security is issued on a when-issued basis. |
| ¤ | The security is issued in zero coupon form with no periodic interest payments. |
| (l) | The issuer of the security is an affiliated person of the Fund as defined in the Investment Company Act of 1940. |
| (u) | The rate represents the 7-day annualized yield at period end. |
| ## | All or a portion of this security is segregated for when-issued securities. |
| * | Cost for federal income tax purposes is $560,614,555 and unrealized gains (losses) consists of: |
| | | | |
Gross unrealized gains | | $ | 10,771,418 | |
Gross unrealized losses | | | (23,925,222 | ) |
| | | | |
Net unrealized losses | | $ | (13,153,804 | ) |
The accompanying notes are an integral part of these financial statements.
| | | | | | |
| Statement of assets and liabilities—March 31, 2017 (unaudited) | | Wells Fargo International Bond Fund | | | 11 | |
| | | | |
| | | | |
| |
Assets | | | | |
Investments | | | | |
In unaffiliated securities, at value (cost $547,540,229) | | $ | 537,475,377 | |
In affiliated securities, at value (cost $9,985,374) | | | 9,985,374 | |
| | | | |
Total investments, at value (cost $557,525,603) | | | 547,460,751 | |
Cash | | | 12,421 | |
Foreign currency, at value (cost $4,377,812) | | | 4,324,690 | |
Receivable for investments sold | | | 245,494 | |
Receivable for Fund shares sold | | | 3,223,908 | |
Receivable for interest | | | 6,077,242 | |
Unrealized gains on forward foreign currency contracts | | | 3,338,982 | |
Prepaid expenses and other assets | | | 129,545 | |
| | | | |
Total assets | | | 564,813,033 | |
| | | | |
| |
Liabilities | | | | |
Payable for investments purchased | | | 587,616 | |
Payable for Fund shares redeemed | | | 1,686,402 | |
Unrealized losses on forward foreign currency contracts | | | 2,796,167 | |
Management fee payable | | | 294,932 | |
Distribution fees payable | | | 2,768 | |
Administration fees payable | | | 44,517 | |
Accrued expenses and other liabilities | | | 151,130 | |
| | | | |
Total liabilities | | | 5,563,532 | |
| | | | |
Total net assets | | $ | 559,249,501 | |
| | | | |
| |
NET ASSETS CONSIST OF | | | | |
Paid-in capital | | $ | 617,143,812 | |
Undistributed net investment income | | | 8,527,257 | |
Accumulated net realized losses on investments | | | (56,856,023 | ) |
Net unrealized losses on investments | | | (9,565,545 | ) |
| | | | |
Total net assets | | $ | 559,249,501 | |
| | | | |
| |
COMPUTATION OF NET ASSET VALUE AND OFFERING PRICE PER SHARE1 | | | | |
Net assets – Class A | | $ | 56,009,497 | |
Shares outstanding – Class A1 | | | 5,774,668 | |
Net asset value per share – Class A | | | $9.70 | |
Maximum offering price per share – Class A2 | | | $10.16 | |
Net assets – Class C | | $ | 3,994,332 | |
Shares outstanding – Class C1 | | | 423,254 | |
Net asset value per share – Class C | | | $9.44 | |
Net assets – Class R6 | | $ | 7,210,849 | |
Shares outstanding – Class R61 | | | 734,670 | |
Net asset value per share – Class R6 | | | $9.82 | |
Net assets – Administrator Class | | $ | 33,892,041 | |
Shares outstanding – Administrator Class1 | | | 3,482,731 | |
Net asset value per share – Administrator Class | | | $9.73 | |
Net assets – Institutional Class | | $ | 458,142,782 | |
Shares outstanding – Institutional Class1 | | | 46,781,652 | |
Net asset value per share – Institutional Class | | | $9.79 | |
| 1 | The Fund has an unlimited number of authorized shares. |
| 2 | Maximum offering price is computed as 100/95.50 of net asset value. On investments of $50,000 or more, the offering price is reduced. |
The accompanying notes are an integral part of these financial statements.
| | | | |
| 12 | | Wells Fargo International Bond Fund | | Statement of operations—six months ended March 31, 2017 (unaudited) |
| | | | |
| | | | |
| |
Investment income | | | | |
Interest (net of foreign interest withholding taxes of $69,858) | | $ | 11,104,294 | |
Securities lending income, net | | | 2,624 | |
| | | | |
Total investment income | | | 11,106,918 | |
| | | | |
| |
Expenses | | | | |
Management fee | | | 1,757,974 | |
Administration fees | | | | |
Class A | | | 39,406 | |
Class B | | | 42 | 1 |
Class C | | | 3,633 | |
Class R6 | | | 1,486 | |
Administrator Class | | | 20,909 | |
Institutional Class | | | 193,686 | |
Shareholder servicing fees | | | | |
Class A | | | 61,571 | |
Class B | | | 66 | 1 |
Class C | | | 5,677 | |
Administrator Class | | | 52,272 | |
Distribution fees | | | | |
Class B | | | 198 | 1 |
Class C | | | 17,030 | |
Custody and accounting fees | | | 17,800 | |
Professional fees | | | 43,087 | |
Registration fees | | | 191 | |
Shareholder report expenses | | | 229 | |
Trustees’ fees and expenses | | | 346 | |
Other fees and expenses | | | 9,567 | |
| | | | |
Total expenses | | | 2,225,170 | |
Less: Fee waivers and/or expense reimbursements | | | (28,652 | ) |
| | | | |
Net expenses | | | 2,196,518 | |
| | | | |
Net investment income | | | 8,910,400 | |
| | | | |
| |
REALIZED AND UNREALIZED GAINS (LOSSES) ON INVESTMENTS | | | | |
| |
Net realized losses on: | | | | |
Unaffiliated securities | | | (13,412,951 | ) |
Forward foreign currency contract transactions | | | (42,294,323 | ) |
| | | | |
Net realized losses on investments | | | (55,707,274 | ) |
| | | | |
| |
Net change in unrealized gains (losses) on: | | | | |
Unaffiliated securities | | | (13,772,273 | ) |
Forward foreign currency contract transactions | | | 2,297,060 | |
| | | | |
Net change in unrealized gains (losses) on investments | | | (11,475,213 | ) |
| | | | |
Net realized and unrealized gains (losses) on investments | | | (67,182,487 | ) |
| | | | |
Net decrease in net assets resulting from operations | | $ | (58,272,087 | ) |
| | | | |
| 1 | For the period from October 1, 2016 to December 5, 2016. Effective at the close of business on December 5, 2016, Class B shares were converted to Class A shares and are no longer offered by the Fund. |
The accompanying notes are an integral part of these financial statements.
| | | | | | |
| Statement of changes in net assets | | Wells Fargo International Bond Fund | | | 13 | |
| | | | | | | | | | | | | | | | | | | | | | | | |
| | | Six months ended
March 31, 2017
(unaudited) | | | Year ended
September 30, 20161 | | | Year ended October 31, 2015 | |
| | | | | | |
Operations | | | | | | | | | | | | | | | | | | | | | | | | |
Net investment income | | | | | | $ | 8,910,400 | | | | | | | $ | 22,566,834 | | | | | | | $ | 39,938,003 | |
Net realized losses on investments | | | | | | | (55,707,274 | ) | | | | | | | (40,208,825 | ) | | | | | | | (103,876,702 | ) |
Net change in unrealized gains (losses) on investments | | | | | | | (11,475,213 | ) | | | | | | | 103,284,914 | | | | | | | | (56,804,032 | ) |
| | | | |
Net increase (decrease) in net assets resulting from operations | | | | | | | (58,272,087 | ) | | | | | | | 85,642,923 | | | | | | | | (120,742,731 | ) |
| | | | |
| | | | | | |
Distributions to shareholders from | | | | | | | | | | | | | | | | | | | | | | | | |
Net investment income | | | | | | | | | | | | | | | | | | | | | | | | |
Class A | | | | | | | 0 | | | | | | | | 0 | | | | | | | | (423,572 | ) |
Class B | | | | | | | 0 | 2 | | | | | | | 0 | | | | | | | | 0 | |
Class R6 | | | | | | | 0 | | | | | | | | 0 | | | | | | | | (48,140 | ) |
Administrator Class | | | | | | | 0 | | | | | | | | 0 | | | | | | | | (1,661,619 | ) |
Institutional Class | | | | | | | 0 | | | | | | | | 0 | | | | | | | | (4,268,266 | ) |
Net realized gains | | | | | | | | | | | | | | | | | | | | | | | | |
Class A | | | | | | | (739,477 | ) | | | | | | | (400,990 | ) | | | | | | | (287,937 | ) |
Class B | | | | | | | 0 | 2 | | | | | | | (2,261 | ) | | | | | | | (2,272 | ) |
Class C | | | | | | | (73,043 | ) | | | | | | | (38,344 | ) | | | | | | | (31,156 | ) |
Class R6 | | | | | | | (164,164 | ) | | | | | | | (83,111 | ) | | | | | | | (18,411 | ) |
Administrator Class | | | | | | | (631,824 | ) | | | | | | | (1,513,668 | ) | | | | | | | (1,004,296 | ) |
Institutional Class | | | | | | | (7,408,479 | ) | | | | | | | (3,929,124 | ) | | | | | | | (2,298,056 | ) |
| | | | |
Total distributions to shareholders | | | | | | | (9,016,987 | ) | | | | | | | (5,967,498 | ) | | | | | | | (10,043,725 | ) |
| | | | |
| | | | | | |
Capital share transactions | | | Shares | | | | | | | | Shares | | | | | | | | Shares | | | | | |
Proceeds from shares sold | | | | | | | | | | | | | | | | | | | | | | | | |
Class A | | | 2,451,816 | | | | 23,719,820 | | | | 1,868,356 | | | | 19,443,142 | | | | 4,376,785 | | | | 44,490,295 | |
Class B | | | 0 | 2 | | | 0 | 2 | | | 0 | | | | 0 | | | | 2 | | | | 19 | |
Class C | | | 4,763 | | | | 44,748 | | | | 23,455 | | | | 236,461 | | | | 29,172 | | | | 297,439 | |
Class R6 | | | 140,594 | | | | 1,394,985 | | | | 895,392 | | | | 8,893,640 | | | | 1,089,162 | | | | 11,067,245 | |
Administrator Class | | | 790,529 | | | | 7,661,331 | | | | 4,435,890 | | | | 44,153,170 | | | | 7,459,622 | | | | 76,084,803 | |
Institutional Class | | | 8,231,078 | | | | 80,446,134 | | | | 16,131,984 | | | | 163,749,468 | | | | 21,605,888 | | | | 222,681,252 | |
| | | | |
| | | | | | | 113,267,018 | | | | | | | | 236,475,881 | | | | | | | | 354,621,053 | |
| | | | |
Reinvestment of distributions | | | | | | | | | | | | | | | | | | | | | | | | |
Class A | | | 77,736 | | | | 729,940 | | | | 41,796 | | | | 395,809 | | | | 66,631 | | | | 705,372 | |
Class B | | | 0 | 2 | | | 0 | 2 | | | 202 | | | | 1,896 | | | | 185 | | | | 1,968 | |
Class C | | | 7,033 | | | | 64,420 | | | | 3,463 | | | | 32,237 | | | | 2,403 | | | | 25,233 | |
Class R6 | | | 17,299 | | | | 164,164 | | | | 8,721 | | | | 83,111 | | | | 6,273 | | | | 66,551 | |
Administrator Class | | | 66,753 | | | | 628,812 | | | | 158,255 | | | | 1,500,258 | | | | 250,106 | | | | 2,645,484 | |
Institutional Class | | | 690,923 | | | | 6,543,042 | | | | 345,507 | | | | 3,289,229 | | | | 440,841 | | | | 4,675,573 | |
| | | | |
| | | | | | | 8,130,378 | | | | | | | | 5,302,540 | | | | | | | | 8,120,181 | |
| | | | |
Payment for shares redeemed | | | | | | | | | | | | | | | | | | | | | | | | |
Class A | | | (1,805,443 | ) | | | (17,423,560 | ) | | | (5,046,620 | ) | | | (49,633,874 | ) | | | (5,719,183 | ) | | | (57,542,516 | ) |
Class B | | | (16,076 | )2 | | | (153,471 | )2 | | | (25,770 | ) | | | (256,696 | ) | | | (41,312 | ) | | | (422,819 | ) |
Class C | | | (113,072 | ) | | | (1,059,230 | ) | | | (222,003 | ) | | | (2,168,648 | ) | | | (395,376 | ) | | | (3,980,181 | ) |
Class R6 | | | (572,536 | ) | | | (5,550,328 | ) | | | (1,096,795 | ) | | | (11,289,059 | ) | | | (279,791 | ) | | | (2,789,621 | ) |
Administrator Class | | | (2,081,756 | ) | | | (20,188,102 | ) | | | (27,263,086 | ) | | | (278,792,881 | ) | | | (13,481,584 | ) | | | (136,684,425 | ) |
Institutional Class | | | (13,097,709 | ) | | | (127,107,786 | ) | | | (36,026,612 | ) | | | (359,679,067 | ) | | | (28,068,413 | ) | | | (285,845,548 | ) |
| | | | |
| | | | | | | (171,482,477 | ) | | | | | | | (701,820,225 | ) | | | | | | | (487,265,110 | ) |
| | | | |
Net decrease in net assets resulting from capital share transactions | | | | | | | (50,085,081 | ) | | | | | | | (460,041,804 | ) | | | | | | | (124,523,876 | ) |
| | | | |
Total decrease in net assets | | | | | | | (117,374,155 | ) | | | | | | | (380,366,379 | ) | | | | | | | (255,310,332 | ) |
| | | | |
| | | | | | |
Net assets | | | | | | | | | | | | | | | | | | | | | | | | |
Beginning of period | | | | | | | 676,623,656 | | | | | | | | 1,056,990,035 | | | | | | | | 1,312,300,367 | |
| | | | |
End of period | | | | | | $ | 559,249,501 | | | | | | | $ | 676,623,656 | | | | | | | $ | 1,056,990,035 | |
| | | | |
Undistributed (overdistributed) (accumulated) net investment income (loss) | | | | | | $ | 8,527,257 | | | | | | | $ | (383,143 | ) | | | | | | $ | (48,221,909 | ) |
| | | | |
| 1 | For the eleven months ended September 30, 2016. The Fund changed its fiscal year end from October 31 to September 30, effective September 30, 2016. |
| 2 | For the period from October 1, 2016 to December 5, 2016. Effective at the close of business on December 5, 2016, Class B shares were converted to Class A shares and are no longer offered by the Fund. |
The accompanying notes are an integral part of these financial statements.
| | | | |
| 14 | | Wells Fargo International Bond Fund | | Financial highlights |
(For a share outstanding throughout each period)
| | | | | | | | | | | | | | | | | | | | | | | | | | | | |
| | | Six months ended
March 31, 2017
(unaudited) | | | Year ended
September 30,
20161 | | | Year ended October 31 | |
| CLASS A | | | | 2015 | | | 2014 | | | 2013 | | | 2012 | | | 2011 | |
Net asset value, beginning of period | | | $10.77 | | | | $9.74 | | | | $10.84 | | | | $11.32 | | | | $11.83 | | | | $11.85 | | | | $12.23 | |
Net investment income | | | 0.13 | 2 | | | 0.24 | 2 | | | 0.31 | 2 | | | 0.37 | 2 | | | 0.36 | 2 | | | 0.33 | 2 | | | 0.39 | 2 |
Net realized and unrealized gains (losses) on investments | | | (1.05 | ) | | | 0.85 | | | | (1.33 | ) | | | (0.34 | ) | | | (0.73 | ) | | | 0.08 | | | | (0.18 | ) |
| | | | | | | | | | | | | | | | | | | | | | | | | | | | |
Total from investment operations | | | (0.92 | ) | | | 1.09 | | | | (1.02 | ) | | | 0.03 | | | | (0.37 | ) | | | 0.41 | | | | 0.21 | |
Distributions to shareholders from | | | | | | | | | | | | | | | | | | | | | | | | | | | | |
Net investment income | | | 0.00 | | | | 0.00 | | | | (0.05 | ) | | | (0.12 | ) | | | (0.02 | ) | | | (0.29 | ) | | | (0.51 | ) |
Net realized gains | | | (0.15 | ) | | | (0.06 | ) | | | (0.03 | ) | | | (0.39 | ) | | | (0.12 | ) | | | (0.14 | ) | | | (0.08 | ) |
| | | | | | | | | | | | | | | | | | | | | | | | | | | | |
Total distributions to shareholders | | | (0.15 | ) | | | (0.06 | ) | | | (0.08 | ) | | | (0.51 | ) | | | (0.14 | ) | | | (0.43 | ) | | | (0.59 | ) |
Net asset value, end of period | | | $9.70 | | | | $10.77 | | | | $9.74 | | | | $10.84 | | | | $11.32 | | | | $11.83 | | | | $11.85 | |
Total return3 | | | (8.54 | )% | | | 11.24 | % | | | (9.50 | )% | | | 0.26 | % | | | (3.18 | )% | | | 3.66 | % | | | 1.93 | % |
Ratios to average net assets (annualized) | | | | | | | | | | | | | | | | | | | | | | | | | | | | |
Gross expenses | | | 1.03 | % | | | 1.08 | % | | | 1.06 | % | | | 1.05 | % | | | 1.05 | % | | | 1.04 | % | | | 1.02 | % |
Net expenses | | | 1.03 | % | | | 1.03 | % | | | 1.03 | % | | | 1.03 | % | | | 1.03 | % | | | 1.03 | % | | | 1.02 | % |
Net investment income | | | 2.74 | % | | | 2.64 | % | | | 3.07 | % | | | 3.29 | % | | | 2.93 | % | | | 2.88 | % | | | 3.26 | % |
Supplemental data | | | | | | | | | | | | | | | | | | | | | | | | | | | | |
Portfolio turnover rate | | | 37 | % | | | 96 | % | | | 136 | % | | | 103 | % | | | 129 | % | | | 79 | % | | | 88 | % |
Net assets, end of period (000s omitted) | | | $56,009 | | | | $54,399 | | | | $79,727 | | | | $102,624 | | | | $113,846 | | | | $139,600 | | | | $286,577 | |
| 1 | For the eleven months ended September 30, 2016. The Fund changed its fiscal year end from October 31 to September 30, effective September 30, 2016. |
| 2 | Calculated based upon average shares outstanding |
| 3 | Total return calculations do not include any sales charges. Returns for periods of less than one year are not annualized. |
The accompanying notes are an integral part of these financial statements.
| | | | | | |
| Financial highlights | | Wells Fargo International Bond Fund | | | 15 | |
(For a share outstanding throughout each period)
| | | | | | | | | | | | | | | | | | | | | | | | | | | | |
| | | Six months ended
March 31, 2017
(unaudited) | | | Year ended
September 30,
20161 | | | Year ended October 31 | |
| CLASS C | | | | 2015 | | | 2014 | | | 2013 | | | 2012 | | | 2011 | |
Net asset value, beginning of period | | | $10.52 | | | | $9.58 | | | | $10.70 | | | | $11.19 | | | | $11.76 | | | | $11.81 | | | | $12.20 | |
Net investment income | | | 0.09 | 2 | | | 0.17 | 2 | | | 0.23 | 2 | | | 0.28 | 2 | | | 0.26 | 2 | | | 0.24 | 2 | | | 0.31 | 2 |
Net realized and unrealized gains (losses) on investments | | | (1.02 | ) | | | 0.83 | | | | (1.32 | ) | | | (0.34 | ) | | | (0.71 | ) | | | 0.08 | | | | (0.19 | ) |
| | | | | | | | | | | | | | | | | | | | | | | | | | | | |
Total from investment operations | | | (0.93 | ) | | | 1.00 | | | | (1.09 | ) | | | (0.06 | ) | | | (0.45 | ) | | | 0.32 | | | | 0.12 | |
Distributions to shareholders from | | | | | | | | | | | | | | | | | | | | | | | | | | | | |
Net investment income | | | 0.00 | | | | 0.00 | | | | 0.00 | | | | (0.04 | ) | | | (0.00 | )3 | | | (0.23 | ) | | | (0.43 | ) |
Net realized gains | | | (0.15 | ) | | | (0.06 | ) | | | (0.03 | ) | | | (0.39 | ) | | | (0.12 | ) | | | (0.14 | ) | | | (0.08 | ) |
| | | | | | | | | | | | | | | | | | | | | | | | | | | | |
Total distributions to shareholders | | | (0.15 | ) | | | (0.06 | ) | | | (0.03 | ) | | | (0.43 | ) | | | (0.12 | ) | | | (0.37 | ) | | | (0.51 | ) |
Net asset value, end of period | | | $9.44 | | | | $10.52 | | | | $9.58 | | | | $10.70 | | | | $11.19 | | | | $11.76 | | | | $11.81 | |
Total return4 | | | (8.84 | )% | | | 10.49 | % | | | (10.21 | )% | | | (0.52 | )% | | | (3.84 | )% | | | 2.86 | % | | | 1.11 | % |
Ratios to average net assets (annualized) | | | | | | | | | | | | | | | | | | | | | | | | | | | | |
Gross expenses | | | 1.78 | % | | | 1.83 | % | | | 1.81 | % | | | 1.80 | % | | | 1.80 | % | | | 1.79 | % | | | 1.77 | % |
Net expenses | | | 1.78 | % | | | 1.78 | % | | | 1.78 | % | | | 1.78 | % | | | 1.78 | % | | | 1.78 | % | | | 1.77 | % |
Net investment income | | | 1.98 | % | | | 1.86 | % | | | 2.33 | % | | | 2.54 | % | | | 2.15 | % | | | 2.12 | % | | | 2.50 | % |
Supplemental data | | | | | | | | | | | | | | | | | | | | | | | | | | | | |
Portfolio turnover rate | | | 37 | % | | | 96 | % | | | 136 | % | | | 103 | % | | | 129 | % | | | 79 | % | | | 88 | % |
Net assets, end of period (000s omitted) | | | $3,994 | | | | $5,520 | | | | $6,895 | | | | $11,597 | | | | $16,097 | | | | $23,448 | | | | $27,861 | |
| 1 | For the eleven months ended September 30, 2016. The Fund changed its fiscal year end from October 31 to September 30, effective September 30, 2016. |
| 2 | Calculated based upon average shares outstanding |
| 3 | Amount is less than $0.005 per share. |
| 4 | Total return calculations do not include any sales charges. Returns for periods of less than one year are not annualized. |
The accompanying notes are an integral part of these financial statements.
| | | | |
| 16 | | Wells Fargo International Bond Fund | | Financial highlights |
(For a share outstanding throughout each period)
| | | | | | | | | | | | | | | | | | | | |
| | | Six months ended
March 31, 2017
(unaudited) | | | Year ended
September 30,
20161 | | | Year ended October 31 | |
| CLASS R6 | | | | 2015 | | | 2014 | | | 20132 | |
Net asset value, beginning of period | | | $10.88 | | | | $9.80 | | | | $10.88 | | | | $11.36 | | | | $11.80 | |
Net investment income | | | 0.15 | 3 | | | 0.28 | 3 | | | 0.35 | 3 | | | 0.42 | 3 | | | 0.39 | 3 |
Net realized and unrealized gains (losses) on investments | | | (1.06 | ) | | | 0.86 | | | | (1.34 | ) | | | (0.35 | ) | | | (0.69 | ) |
| | | | | | | | | | | | | | | | | | | | |
Total from investment operations | | | (0.91 | ) | | | 1.14 | | | | (0.99 | ) | | | 0.07 | | | | (0.30 | ) |
Distributions to shareholders from | | | | | | | | | | | | |
Net investment income | | | 0.00 | | | | 0.00 | | | | (0.06 | ) | | | (0.16 | ) | | | (0.02 | ) |
Net realized gains | | | (0.15 | ) | | | (0.06 | ) | | | (0.03 | ) | | | (0.39 | ) | | | (0.12 | ) |
| | | | | | | | | | | | | | | | | | | | |
Total distributions to shareholders | | | (0.15 | ) | | | (0.06 | ) | | | (0.09 | ) | | | (0.55 | ) | | | (0.14 | ) |
Net asset value, end of period | | | $9.82 | | | | $10.88 | | | | $9.80 | | | | $10.88 | | | | $11.36 | |
Total return4 | | | (8.35 | )% | | | 11.69 | % | | | (9.18 | )% | | | 0.60 | % | | | (2.52 | )% |
Ratios to average net assets (annualized) | | | | | | | | | | | | | | | | | | | | |
Gross expenses | | | 0.65 | % | | | 0.70 | % | | | 0.68 | % | | | 0.67 | % | | | 0.68 | % |
Net expenses | | | 0.65 | % | | | 0.65 | % | | | 0.65 | % | | | 0.65 | % | | | 0.65 | % |
Net investment income | | | 3.12 | % | | | 3.00 | % | | | 3.46 | % | | | 3.64 | % | | | 3.70 | % |
Supplemental data | | | | | | | | | | | | | | | | | | | | |
Portfolio turnover rate | | | 37 | % | | | 96 | % | | | 136 | % | | | 103 | % | | | 129 | % |
Net assets, end of period (000s omitted) | | | $7,211 | | | | $12,501 | | | | $13,152 | | | | $5,729 | | | | $2,433 | |
| 1 | For the eleven months ended September 30, 2016. The Fund changed its fiscal year end from October 31 to September 30, effective September 30, 2016. |
| 2 | For the period from November 30, 2012 (commencement of class operations) to October 31, 2013 |
| 3 | Calculated based upon average shares outstanding |
| 4 | Returns for periods of less than one year are not annualized. |
The accompanying notes are an integral part of these financial statements.
| | | | | | |
| Financial highlights | | Wells Fargo International Bond Fund | | | 17 | |
(For a share outstanding throughout each period)
| | | | | | | | | | | | | | | | | | | | | | | | | | | | |
| | | Six months ended
March 31, 2017
(unaudited) | | | Year ended
September 30,
20161 | | | Year ended October 31 | |
| ADMINISTRATOR CLASS | | | | 2015 | | | 2014 | | | 20132 | | | 2012 | | | 2011 | |
Net asset value, beginning of period | | | $10.80 | | | | $9.75 | | | | $10.84 | | | | $11.32 | | | | $11.81 | | | | $11.83 | | | | $12.23 | |
Net investment income | | | 0.14 | 2 | | | 0.26 | 2 | | | 0.33 | 2 | | | 0.39 | 2 | | | 0.36 | 2 | | | 0.35 | 2 | | | 0.38 | 2 |
Net realized and unrealized gains (losses) on investments | | | (1.06 | ) | | | 0.85 | | | | (1.34 | ) | | | (0.34 | ) | | | (0.71 | ) | | | 0.08 | | | | (0.16 | ) |
| | | | | | | | | | | | | | | | | | | | | | | | | | | | |
Total from investment operations | | | (0.92 | ) | | | 1.11 | | | | (1.01 | ) | | | 0.05 | | | | (0.35 | ) | | | 0.43 | | | | 0.22 | |
Distributions to shareholders from | | | | | | | | | | | | | | | | |
Net investment income | | | 0.00 | | | | 0.00 | | | | (0.05 | ) | | | (0.14 | ) | | | (0.02 | ) | | | (0.31 | ) | | | (0.54 | ) |
Net realized gains | | | (0.15 | ) | | | (0.06 | ) | | | (0.03 | ) | | | (0.39 | ) | | | (0.12 | ) | | | (0.14 | ) | | | (0.08 | ) |
| | | | | | | | | | | | | | | | | | | | | | | | | | | | |
Total distributions to shareholders | | | (0.15 | ) | | | (0.06 | ) | | | (0.08 | ) | | | (0.53 | ) | | | (0.14 | ) | | | (0.45 | ) | | | (0.62 | ) |
Net asset value, end of period | | | $9.73 | | | | $10.80 | | | | $9.75 | | | | $10.84 | | | | $11.32 | | | | $11.81 | | | | $11.83 | |
Total return3 | | | (8.51 | )% | | | 11.44 | % | | | (9.36 | )% | | | 0.43 | % | | | (2.98 | )% | | | 3.89 | % | | | 2.03 | % |
Ratios to average net assets (annualized) | | | | | | | | | |
Gross expenses | | | 0.97 | % | | | 1.02 | % | | | 0.99 | % | | | 0.99 | % | | | 0.99 | % | | | 0.97 | % | | | 0.95 | % |
Net expenses | | | 0.85 | % | | | 0.85 | % | | | 0.85 | % | | | 0.85 | % | | | 0.85 | % | | | 0.85 | % | | | 0.85 | % |
Net investment income | | | 2.90 | % | | | 2.85 | % | | | 3.26 | % | | | 3.47 | % | | | 3.15 | % | | | 3.04 | % | | | 3.21 | % |
Supplemental data | | | | | | | | | | | | | | | | |
Portfolio turnover rate | | | 37 | % | | | 96 | % | | | 136 | % | | | 103 | % | | | 129 | % | | | 79 | % | | | 88 | % |
Net assets, end of period (000s omitted) | | | $33,892 | | | | $50,825 | | | | $266,849 | | | | $359,383 | | | | $334,778 | | | | $294,330 | | | | $170,836 | |
| 1 | For the eleven months ended September 30, 2016. The Fund changed its fiscal year end from October 31 to September 30, effective September 30, 2016. |
| 2 | Calculated based upon average shares outstanding |
| 3 | Returns for periods of less than one year are not annualized. |
The accompanying notes are an integral part of these financial statements.
| | | | |
| 18 | | Wells Fargo International Bond Fund | | Financial highlights |
(For a share outstanding throughout each period)
| | | | | | | | | | | | | | | | | | | | | | | | | | | | |
| | | Six months ended
March 31, 2017
(unaudited) | | | Year ended
September 30,
20161 | | | Year ended October 31 | |
| INSTITUTIONAL CLASS | | | | 2015 | | | 2014 | | | 2013 | | | 2012 | | | 2011 | |
Net asset value, beginning of period | | | $10.86 | | | | $9.79 | | | | $10.87 | | | | $11.35 | | | | $11.82 | | | | $11.84 | | | | $12.23 | |
Net investment income | | | 0.15 | 2 | | | 0.27 | 2 | | | 0.35 | 2 | | | 0.41 | 2 | | | 0.37 | | | | 0.36 | | | | 0.44 | |
Net realized and unrealized gains (losses) on investments | | | (1.07 | ) | | | 0.86 | | | | (1.34 | ) | | | (0.35 | ) | | | (0.70 | ) | | | 0.09 | | | | (0.20 | ) |
| | | | | | | | | | | | | | | | | | | | | | | | | | | | |
Total from investment operations | | | (0.92 | ) | | | 1.13 | | | | (0.99 | ) | | | 0.06 | | | | (0.33 | ) | | | 0.45 | | | | 0.24 | |
Distributions to shareholders from | | | | | | | | | | | | | | | | | | | | | | | | | | | | |
Net investment income | | | 0.00 | | | | 0.00 | | | | (0.06 | ) | | | (0.15 | ) | | | (0.02 | ) | | | (0.33 | ) | | | (0.55 | ) |
Net realized gains | | | (0.15 | ) | | | (0.06 | ) | | | (0.03 | ) | | | (0.39 | ) | | | (0.12 | ) | | | (0.14 | ) | | | (0.08 | ) |
| | | | | | | | | | | | | | | | | | | | | | | | | | | | |
Total distributions to shareholders | | | (0.15 | ) | | | (0.06 | ) | | | (0.09 | ) | | | (0.54 | ) | | | (0.14 | ) | | | (0.47 | ) | | | (0.63 | ) |
Net asset value, end of period | | | $9.79 | | | | $10.86 | | | | $9.79 | | | | $10.87 | | | | $11.35 | | | | $11.82 | | | | $11.84 | |
Total return3 | | | (8.46 | )% | | | 11.60 | % | | | (9.20 | )% | | | 0.55 | % | | | (2.78 | )% | | | 3.99 | % | | | 2.19 | % |
Ratios to average net assets (annualized) | | | | | | | | | | | | | | | | | | | | | | | | | | | | |
Gross expenses | | | 0.70 | % | | | 0.75 | % | | | 0.73 | % | | | 0.72 | % | | | 0.72 | % | | | 0.71 | % | | | 0.69 | % |
Net expenses | | | 0.70 | % | | | 0.70 | % | | | 0.70 | % | | | 0.70 | % | | | 0.70 | % | | | 0.71 | % | | | 0.69 | % |
Net investment income | | | 3.07 | % | | | 2.95 | % | | | 3.41 | % | | | 3.62 | % | | | 3.26 | % | | | 3.19 | % | | | 3.60 | % |
Supplemental data | | | | | | | | | | | | | | | | | | | | | | | | | | | | |
Portfolio turnover rate | | | 37 | % | | | 96 | % | | | 136 | % | | | 103 | % | | | 129 | % | | | 79 | % | | | 88 | % |
Net assets, end of period (000s omitted) | | | $458,143 | | | | $553,208 | | | | $689,964 | | | | $832,072 | | | | $1,115,163 | | | | $1,270,164 | | | | $1,228,793 | |
| 1 | For the eleven months ended September 30, 2016. The Fund changed its fiscal year end from October 31 to September 30, effective September 30, 2016. |
| 2 | Calculated based upon average shares outstanding |
| 3 | Returns for periods of less than one year are not annualized. |
The accompanying notes are an integral part of these financial statements.
| | | | | | |
| Notes to financial statements (unaudited) | | Wells Fargo International Bond Fund | | | 19 | |
1. ORGANIZATION
Wells Fargo Funds Trust (the “Trust”), a Delaware statutory trust organized on March 10, 1999, is an open-end management investment company registered under the Investment Company Act of 1940, as amended (the “1940 Act”). As an investment company, the Trust follows the accounting and reporting guidance in Financial Accounting Standards Board (“FASB”) Accounting Standards Codification (“ASC”) Topic 946, Financial Services – Investment Companies. These financial statements report on the Wells Fargo International Bond Fund (the “Fund”) which is a diversified series of the Trust.
Effective at the close of business on December 5, 2016, Class B shares were converted to Class A shares and are no longer offered by the Fund. Information for Class B shares reflected in the financial statements represents activity through December 5, 2016.
2. SIGNIFICANT ACCOUNTING POLICIES
The following significant accounting policies, which are consistently followed in the preparation of the financial statements of the Fund, are in conformity with U.S. generally accepted accounting principles which require management to make estimates and assumptions that affect the reported amounts of assets and liabilities, disclosure of contingent assets and liabilities at the date of the financial statements, and the reported amounts of revenues and expenses during the reporting period. Actual results could differ from those estimates.
Securities valuation
All investments are valued each business day as of the close of regular trading on the New York Stock Exchange (generally 4 p.m. Eastern Time), although the Fund may deviate from this calculation time under unusual or unexpected circumstances.
Debt securities are valued at the evaluated bid price provided by an independent pricing service or, if a reliable price is not available, the quoted bid price from an independent broker-dealer.
The values of securities denominated in foreign currencies are translated into U.S. dollars at rates provided by an independent foreign currency pricing source at a time each business day specified by the Management Valuation Team of Wells Fargo Funds Management, LLC (“Funds Management”).
Investments in registered open-end investment companies are valued at net asset value. Interests in non-registered investment companies that are redeemable at net asset value are fair valued normally at net asset value.
Investments which are not valued using any of the methods discussed above are valued at their fair value, as determined in good faith by the Board of Trustees of the Fund. The Board of Trustees has established a Valuation Committee comprised of the Trustees and has delegated to it the authority to take any actions regarding the valuation of portfolio securities that the Valuation Committee deems necessary or appropriate, including determining the fair value of portfolio securities, unless the determination has been delegated to the Management Valuation Team. The Board of Trustees retains the authority to make or ratify any valuation decisions or approve any changes to the Valuation Procedures as it deems appropriate. On a quarterly basis, the Board of Trustees receives reports on any valuation actions taken by the Valuation Committee or the Management Valuation Team which may include items for ratification.
Valuations of fair valued securities are compared to the next actual sales price when available, or other appropriate market values, to assess the continued appropriateness of the fair valuation methodologies used. These securities are fair valued on a day-to-day basis, taking into consideration changes to appropriate market information and any significant changes to the inputs considered in the valuation process until there is a readily available price provided on an exchange or by an independent pricing service. Valuations received from an independent pricing service or independent broker-dealer quotes are periodically validated by comparisons to most recent trades and valuations provided by other independent pricing services in addition to the review of prices by the manager and/or subadviser. Unobservable inputs used in determining fair valuations are identified based on the type of security, taking into consideration factors utilized by market participants in valuing the investment, knowledge about the issuer and the current market environment.
Foreign currency translation
The accounting records of the Fund are maintained in U.S. dollars. The values of other assets and liabilities denominated in foreign currencies are translated into U.S. dollars at rates provided by an independent foreign currency pricing source at a time each business day specified by the Management Valuation Team. Purchases and sales of securities, and income and expenses are converted at the rate of exchange on the respective dates of such transactions. Net realized foreign exchange gains or losses arise from sales of foreign currencies, currency gains or losses realized between the trade and
| | | | |
| 20 | | Wells Fargo International Bond Fund | | Notes to financial statements (unaudited) |
settlement dates on securities transactions, and the difference between the amounts of dividends, interest and foreign withholding taxes recorded and the U.S. dollar equivalent of the amounts actually paid or received. Net unrealized foreign exchange gains and losses arise from changes in the fair value of assets and liabilities other than investments in securities resulting from changes in exchange rates. The changes in net assets arising from changes in exchange rates of securities and the changes in net assets resulting from changes in market prices of securities are not separately presented. Such changes are included in net realized and unrealized gains or losses from investments.
Forward foreign currency contracts
The Fund is subject to foreign currency exchange rate risk in the normal course of pursuing its investment objectives. A forward foreign currency contract is an agreement between two parties to purchase or sell a specific currency for an agreed-upon price at a future date. The Fund enters into forward foreign currency contracts to facilitate transactions in foreign-denominated securities and to attempt to minimize the risk to the Fund from adverse changes in the relationship between currencies. Forward foreign currency contracts are recorded at the forward rate and marked-to-market daily. When the contracts are closed, realized gains and losses arising from such transactions are recorded as realized gains or losses on forward foreign currency contract transactions. The Fund could be exposed to risks if the counterparties to the contracts are unable to meet the terms of their contracts or if the value of the foreign currency changes unfavorably. The Fund’s maximum risk of loss from counterparty credit risk is the unrealized gains on the contracts. This risk may be mitigated if there is a master netting arrangement between the Fund and the counterparty.
Security loans
The Fund may lend its securities from time to time in order to earn additional income in the form of fees or interest on securities received as collateral or the investment of any cash received as collateral. The Fund continues to receive interest or dividends on the securities loaned. The Fund receives collateral in the form of cash or securities with a value at least equal to the value of the securities on loan. The value of the loaned securities is determined at the close of each business day and any additional required collateral is delivered to the Fund on the next business day. In a securities lending transaction, the net asset value of the Fund will be affected by an increase or decrease in the value of the securities loaned and by an increase or decrease in the value of the instrument in which collateral is invested. The amount of securities lending activity undertaken by the Fund fluctuates from time to time. In the event of default or bankruptcy by the borrower, the Fund may be prevented from recovering the loaned securities or gaining access to the collateral or may experience delays or costs in doing so. In addition, the investment of any cash collateral received may lose all or part of its value. The Fund has the right under the lending agreement to recover the securities from the borrower on demand.
The Fund lends its securities through an unaffiliated securities lending agent. Cash collateral received in connection with its securities lending transactions is invested in Securities Lending Cash Investments, LLC (the “Securities Lending Fund”). The Securities Lending Fund is exempt from registration under Section 3(c)(7) of the 1940 Act and is managed by Funds Management and is subadvised by Wells Capital Management Incorporated (“WellsCap”), an affiliate of Funds Management and an indirect wholly owned subsidiary of Wells Fargo & Company (“Wells Fargo”). Funds Management receives an advisory fee starting at 0.05% and declining to 0.01% as the average daily net assets of the Securities Lending Fund increase. All of the fees received by Funds Management are paid to WellsCap for its services as subadviser. The Securities Lending Fund seeks to provide a positive return compared to the daily Fed Funds Open rate by investing in high-quality, U.S. dollar-denominated short-term money market instruments. Securities Lending Fund investments are fair valued at the evaluated bid price provided by an independent pricing service. Income earned from investment in the Securities Lending Fund is included in securities lending income on the Statement of Operations.
When-issued transactions
The Fund may purchase securities on a forward commitment or when-issued basis. The Fund records a when-issued transaction on the trade date and will segregate assets in an amount at least equal in value to the Fund’s commitment to purchase when-issued securities. Securities purchased on a when-issued basis are marked-to-market daily and the Fund begins earning interest on the settlement date. Losses may arise due to changes in the market value of the underlying securities or if the counterparty does not perform under the contract.
Security transactions and income recognition
Securities transactions are recorded on a trade date basis. Realized gains or losses are recorded on the basis of identified cost.
Interest income is accrued daily and bond discounts are accreted and premiums are amortized daily based on the effective interest method. To the extent debt obligations are placed on non-accrual status, any related interest income may be reduced by writing off interest receivables when the collection of all or a portion of interest has been determined
| | | | | | |
| Notes to financial statements (unaudited) | | Wells Fargo International Bond Fund | | | 21 | |
to be doubtful based on consistently applied procedures and the fair value has decreased. If the issuer subsequently resumes interest payments or when the collectability of interest is reasonably assured, the debt obligation is removed from non-accrual status.
Income from foreign securities is recorded net of foreign taxes withheld where recovery of such taxes is not assured.
Distributions to shareholders
Distributions to shareholders from net investment income and net realized gains, if any, are recorded on the ex-dividend date. Such distributions are determined in accordance with income tax regulations and may differ from U.S. generally accepted accounting principles. Dividend sources are estimated at the time of declaration. The tax character of distributions is determined as of the Fund’s fiscal year end. Therefore, a portion of the Fund’s distributions made prior the Fund’s fiscal year end may be categorized as a tax return of capital.
Federal and other taxes
The Fund intends to continue to qualify as a regulated investment company by distributing substantially all of its investment company taxable income and any net realized capital gains (after reduction for capital loss carryforwards) sufficient to relieve it from all, or substantially all, federal income taxes. Accordingly, no provision for federal income taxes was required.
The Fund’s income and federal excise tax returns and all financial records supporting those returns for the prior three fiscal years are subject to examination by the federal and Delaware revenue authorities. Management has analyzed the Fund’s tax positions taken on federal, state, and foreign tax returns for all open tax years and does not believe that there are any uncertain tax positions that require recognition of a tax liability.
Class allocations
The separate classes of shares offered by the Fund differ principally in applicable sales charges, distribution, shareholder servicing, and administration fees. Class specific expenses are charged directly to that share class. Investment income, common expenses, and realized and unrealized gains (losses) on investments are allocated daily to each class of shares based on the relative proportion of net assets of each class.
3. FAIR VALUATION MEASUREMENTS
Fair value measurements of investments are determined within a framework that has established a fair value hierarchy based upon the various data inputs utilized in determining the value of the Fund’s investments. The three-level hierarchy gives the highest priority to unadjusted quoted prices in active markets for identical assets or liabilities (Level 1) and the lowest priority to unobservable inputs (Level 3). The Fund’s investments are classified within the fair value hierarchy based on the lowest level of input that is significant to the fair value measurement. The inputs are summarized into three broad levels as follows:
| ∎ | | Level 1 – quoted prices in active markets for identical securities |
| ∎ | | Level 2 – other significant observable inputs (including quoted prices for similar securities, interest rates, prepayment speeds, credit risk, etc.) |
| ∎ | | Level 3 – significant unobservable inputs (including the Fund’s own assumptions in determining the fair value of investments) |
The inputs or methodologies used for valuing investments in securities are not necessarily an indication of the risk associated with investing in those securities.
| | | | |
| 22 | | Wells Fargo International Bond Fund | | Notes to financial statements (unaudited) |
The following is a summary of the inputs used in valuing the Fund’s assets and liabilities as of March 31, 2017:
| | | | | | | | | | | | | | | | |
| | | Quoted prices
(Level 1) | | | Other significant
observable inputs
(Level 2) | | | Significant
unobservable inputs (Level 3) | | | Total | |
Assets | | | | | | | | | | | | | | | | |
Investments in: | | | | | | | | | | | | | | | | |
| | | | |
Corporate bonds and notes | | $ | 0 | | | $ | 25,608,462 | | | $ | 0 | | | $ | 25,608,462 | |
| | | | |
Foreign corporate bonds and notes | | | 0 | | | | 83,909,856 | | | | 0 | | | | 83,909,856 | |
| | | | |
Foreign government bonds | | | 0 | | | | 361,710,996 | | | | 0 | | | | 361,710,996 | |
| | | | |
U.S. Treasury securities | | | 44,211,677 | | | | 0 | | | | 0 | | | | 44,211,677 | |
| | | | |
Yankee corporate bonds and notes | | | 0 | | | | 22,034,386 | | | | 0 | | | | 22,034,386 | |
| | | | |
Short-term investments | | | | | | | | | | | | | | | | |
Investment companies | | | 9,985,374 | | | | 0 | | | | 0 | | | | 9,985,374 | |
| | | 54,197,051 | | | | 493,263,700 | | | | 0 | | | | 547,460,751 | |
| | | | |
Forward foreign currency contracts | | | 0 | | | | 3,338,982 | | | | 0 | | | | 3,338,982 | |
Total assets | | $ | 54,197,051 | | | $ | 496,602,682 | | | $ | 0 | | | $ | 550,799,733 | |
Liabilities | | | | | | | | | | | | | | | | |
| | | | |
Forward foreign currency contracts | | | 0 | | | | 2,796,167 | | | | 0 | | | | 2,796,167 | |
Total liabilities | | $ | 0 | | | $ | 2,796,167 | | | $ | 0 | | | $ | 2,796,167 | |
Forward foreign currency contracts are reported at their unrealized gains (losses) at measurement date, which represents the change in the contract’s value from trade date. All other assets and liabilities are reported at their market value at measurement date.
The Fund recognizes transfers between levels within the fair value hierarchy at the end of the reporting period. At March 31, 2017, the Fund did not have any transfers into/out of Level 1, Level 2, or Level 3.
4. TRANSACTIONS WITH AFFILIATES AND OTHER EXPENSES
Management fee
Funds Management, an indirect wholly owned subsidiary of Wells Fargo, is the manager of the Fund and provides advisory and fund-level administrative services under an investment management agreement. Under the investment management agreement, Funds Management is responsible for, among other services, implementing the investment objectives and strategies of the Fund, supervising the subadviser, providing fund-level administrative services in connection with the Fund’s operations, and providing any other fund-level administrative services reasonably necessary for the operation of the Fund. As compensation for its services under the investment management agreement, Funds Management is entitled to receive an annual management fee starting at 0.60% and declining to 0.48% as the average daily net assets of the Fund increase. For the six months ended March 31, 2017, the management fee was equivalent to an annual rate of 0.60% of the Fund’s average daily net assets.
Funds Management has retained the services of a subadviser to provide daily portfolio management to the Fund. The fee for subadvisory services is borne by Funds Management. First International Advisors, LLC, an affiliate of Funds Management and an indirect wholly owned subsidiary of Wells Fargo, is the subadviser to the Fund and is entitled to receive a fee from Funds Management at an annual rate starting at 0.35% and declining to 0.20% as the average daily net assets of the Fund increase.
| | | | | | |
| Notes to financial statements (unaudited) | | Wells Fargo International Bond Fund | | | 23 | |
Administration fees
Under a class-level administration agreement, Funds Management provides class-level administrative services to the Fund, which includes paying fees and expenses for services provided by the transfer agent, sub-transfer agents, omnibus account servicers and record-keepers. As compensation for its services under the class-level administration agreement, Funds Management receives an annual fee which is calculated based on the average daily net assets of each class as follows:
| | | | |
| | | Class-level
administration fee | |
Class A, Class B, Class C | | | 0.16 | % |
Class R6 | | | 0.03 | |
Administrator Class | | | 0.10 | |
Institutional Class | | | 0.08 | |
Funds Management has contractually waived and/or reimbursed management and administration fees to the extent necessary to maintain certain net operating expense ratios for the Fund. Waiver of fees and/or reimbursement of expenses by Funds Management were made first from fund level expenses on a proportionate basis and then from class specific expenses. Funds Management has committed through January 31, 2018 to waive fees and/or reimburse expenses to the extent necessary to cap the Fund’s expenses at 1.03% for Class A shares, 1.78% for Class C shares, 0.65% for Class R6 shares, 0.85% for Administrator Class shares, and 0.70% for Institutional Class shares. After this time, the cap may be increased or the commitment to maintain the cap may be terminated only with the approval of the Board of Trustees.
During the six months ended March 31, 2017, State Street Bank and Trust Company, the Fund’s custodian, reimbursed the Fund $46,421 for certain out-of-pocket expenses that were billed to the Fund in error from 1998-2015. This amount is included in interest income on the Statement of Operations. In addition, Funds Management was also reimbursed $56,652 for waivers/reimbursements it made to the Fund during the period the Fund was erroneously billed.
Distribution fees
The Trust has adopted a distribution plan for Class B and Class C shares of the Fund pursuant to Rule 12b-1 under the 1940 Act. Distribution fees are charged to Class B and Class C shares and paid to Wells Fargo Funds Distributor, LLC (“Funds Distributor”), the principal underwriter, at an annual rate of 0.75% of the average daily net assets of Class B and Class C shares.
In addition, Funds Distributor is entitled to receive the front-end sales charge from the purchase of Class A shares and a contingent deferred sales charge on the redemption of certain Class A shares. Funds Distributor is also entitled to receive the contingent deferred sales charges from redemptions of Class B and Class C shares. For the six months ended March 31, 2017, Funds Distributor received $445 from the sale of Class A shares.
Shareholder servicing fees
The Trust has entered into contracts with one or more shareholder servicing agents, whereby Class A, Class B, Class C, and Administrator Class of the Fund are charged a fee at an annual rate of 0.25% of the average daily net assets of each respective class.
A portion of these total shareholder servicing fees were paid to affiliates of Wells Fargo.
5. INVESTMENT PORTFOLIO TRANSACTIONS
Purchases and sales of investments, excluding short-term securities, for the six months ended March 31, 2017 were as follows:
| | | | | | |
Purchases at cost | | Sales proceeds |
U.S.
government | | Non-U.S.
government | | U.S.
government | | Non-U.S.
government |
| $ 6,461,356 | | $ 208,823,954 | | $ 20,453,314 | | $ 276,313,872 |
The Fund may purchase or sell investment securities to other Wells Fargo affiliates pursuant to Rule 17a-7 of the 1940 Act and under procedures adopted by the Board of Trustees. The procedures have been designed to ensure that these
| | | | |
| 24 | | Wells Fargo International Bond Fund | | Notes to financial statements (unaudited) |
interfund transactions, which generally do not incur broker commissions, are effected at current market prices. Interfund trades are included within the respective purchases and sales amounts shown.
6. DERIVATIVE TRANSACTIONS
During the six months ended March 31, 2017, the Fund entered into forward foreign currency contracts for economic hedging purposes.
At March 31, 2017, the Fund had forward foreign currency contracts outstanding as follows:
Forward foreign currency contracts to buy:
| | | | | | | | | | | | | | | | | | |
| Exchange date | | Counterparty | | Contracts to
receive | | | U.S. value at
March 31, 2017 | | | In exchange
for U.S. $ | | | Unrealized
gains
(losses) | |
| 4-17-2017 | | State Street Bank | | | 6,650,000,000 | JPY | | $ | 59,758,927 | | | $ | 58,543,010 | | | $ | 1,215,917 | |
| 4-18-2017 | | State Street Bank | | | 23,200,000 | EUR | | | 24,765,082 | | | | 24,765,768 | | | | (686 | ) |
| 4-26-2017 | | State Street Bank | | | 19,600,000 | CAD | | | 14,743,527 | | | | 14,967,431 | | | | (223,904 | ) |
| 5-9-2017 | | State Street Bank | | | 66,000,000 | MYR | | | 14,893,566 | | | | 14,886,658 | | | | 6,908 | |
| 5-15-2017 | | State Street Bank | | | 6,850,000,000 | JPY | | | 61,619,837 | | | | 60,487,254 | | | | 1,132,583 | |
| 5-22-2017 | | State Street Bank | | | 456,575,000 | HUF | | | 1,580,779 | | | | 1,594,019 | | | | (13,240 | ) |
| 5-24-2017 | | State Street Bank | | | 42,700,000 | EUR | | | 45,656,249 | | | | 46,333,557 | | | | (677,308 | ) |
| 6-13-2017 | | State Street Bank | | | 9,500,000 | GBP | | | 11,922,123 | | | | 11,569,832 | | | | 352,291 | |
| 6-16-2017 | | State Street Bank | | | 64,500,000 | EUR | | | 69,044,187 | | | | 68,926,635 | | | | 117,552 | |
Forward foreign currency contracts to sell:
| | | | | | | | | | | | | | | | | | |
| Exchange date | | Counterparty | | Contracts to
deliver | | | U.S. value at
March 31, 2017 | | | In exchange
for U.S. $ | | | Unrealized
gains
(losses) | |
| 4-17-2017 | | State Street Bank | | | 572,000,000 | JPY | | $ | 5,140,166 | | | $ | 4,993,357 | | | $ | (146,809 | ) |
| 5-9-2017 | | State Street Bank | | | 66,000,000 | MYR | | | 14,893,566 | | | | 14,822,134 | | | | (71,432 | ) |
| 5-11-2017 | | State Street Bank | | | 575,000,000 | THB | | | 16,727,965 | | | | 16,394,377 | | | | (333,588 | ) |
| 5-22-2017 | | State Street Bank | | | 3,960,000,000 | HUF | | | 13,710,533 | | | | 13,688,024 | | | | (22,509 | ) |
| 5-22-2017 | | State Street Bank | | | 100,500,000 | PLN | | | 25,330,250 | | | | 24,671,991 | | | | (658,259 | ) |
| 6-2-2017 | | State Street Bank | | | 19,000,000 | BRL | | | 5,987,797 | | | | 5,972,213 | | | | (15,584 | ) |
| 6-6-2017 | | State Street Bank | | | 72,250,000 | ZAR | | | 5,327,175 | | | | 5,439,242 | | | | 112,067 | |
| 6-13-2017 | | State Street Bank | | | 1,000,000 | GBP | | | 1,254,960 | | | | 1,225,616 | | | | (29,344 | ) |
| 6-13-2017 | | State Street Bank | | | 92,500,000 | DKK | | | 13,310,570 | | | | 13,200,896 | | | | (109,674 | ) |
| 6-13-2017 | | State Street Bank | | | 12,500,000 | GBP | | | 15,687,004 | | | | 15,542,875 | | | | (144,129 | ) |
| 6-14-2017 | | State Street Bank | | | 36,685,000 | NZD | | | 25,669,761 | | | | 25,320,060 | | | | (349,701 | ) |
| 6-20-2017 | | State Street Bank | | | 85,600,000 | AUD | | | 65,306,779 | | | | 65,708,443 | | | | 401,664 | |
The Fund had average contract amounts of $375,745,633 and $289,018,135 in forward foreign currency contracts to buy and forward foreign currency contracts to sell, respectively, during the six months ended March 31, 2017.
The fair value, realized gains or losses and change in unrealized gains or losses, if any, on derivative instruments are reflected in the corresponding financial statement captions.
For certain types of derivative transactions, the Fund has entered into International Swaps and Derivatives Association, Inc. master agreements (“ISDA Master Agreements”) or similar agreements with approved counterparties. The ISDA Master Agreements or similar agreements may have requirements to deliver/deposit securities or cash to/with an exchange or broker-dealer as collateral and allows the Fund to offset, with each counterparty, certain derivative financial instrument’s assets and/or liabilities with collateral held or pledged. Collateral requirements differ by type of derivative. Collateral or margin requirements are set by the broker or exchange clearing house for exchange traded derivatives while collateral terms are contract specific for over-the-counter traded derivatives. Cash collateral that has been pledged to cover obligations of the Fund under ISDA Master Agreements or similar agreements, if any, are reported separately in the
| | | | | | |
| Notes to financial statements (unaudited) | | Wells Fargo International Bond Fund | | | 25 | |
Statement of Assets and Liabilities. Securities pledged as collateral, if any, are noted in the Portfolio of Investments. With respect to balance sheet offsetting, absent an event of default by the counterparty or a termination of the agreement, the reported amounts of financial assets and financial liabilities in the Statement of Assets and Liabilities are not offset across transactions between the Fund and the applicable counterparty. A reconciliation of the gross amounts on the Statement of Assets and Liabilities to the net amounts by derivative type, including any collateral exposure, is as follows:
| | | | | | | | | | | | | | | | |
| Derivative type | | Counterparty | | Gross amounts
of assets in the
Statement of
Assets and
Liabilities | | Amounts
subject to
netting agreements | | | Collateral
received | | | Net amount
of assets | |
Forward foreign currency contracts | | State Street Bank | | $3,338,982* | | $ | 2,796,167 | | | $ | 0 | | | $ | 542,815 | |
| * | Amount represents net unrealized gains. |
| | | | | | | | | | | | | | | | |
| Derivative type | | Counterparty | | Gross amounts
of liabilities in the
Statement of
Assets and
Liabilities | | Amounts subject to netting
agreements | | | Collateral
pledged | | | Net amount
of liabilities | |
Forward foreign currency contracts | | State Street Bank | | $2,796,167** | | $ | (2,796,167 | ) | | $ | 0 | | | $ | 0 | |
| ** | Amount represents net unrealized losses. |
7. BANK BORROWINGS
The Trust (excluding the money market funds and certain other funds) and Wells Fargo Variable Trust are parties to a $250,000,000 revolving credit agreement whereby the Fund is permitted to use bank borrowings for temporary or emergency purposes, such as to fund shareholder redemption requests. Interest under the credit agreement is charged to the Fund based on a borrowing rate equal to the higher of the Federal Funds rate in effect on that day plus 1.25% or the overnight LIBOR rate in effect on that day plus 1.25%. In addition, an annual commitment fee equal to 0.25% of the unused balance is allocated to each participating fund.
For the six months ended March 31, 2017, there were no borrowings by the Fund under the agreement.
8. INDEMNIFICATION
Under the Trust’s organizational documents, the officers and Trustees have been granted certain indemnification rights against certain liabilities that may arise out of performance of their duties to the Trust. Additionally, in the normal course of business, the Trust may enter into contracts with service providers that contain a variety of indemnification clauses. The Trust’s maximum exposure under these arrangements is dependent on future claims that may be made against the Fund and, therefore, cannot be estimated.
9. NEW ACCOUNTING PRONOUNCEMENT
In December 2016, FASB issued Accounting Standards Update (“ASU”) No. 2016-19, Technical Corrections and Improvements. ASU 2016-19 includes an amendment to FASB ASC Topic 820, Fair Value Measurement which clarifies the difference between a valuation approach and a valuation technique. The amendment also requires an entity to disclose when there has been a change in either or both a valuation approach and/or a valuation technique. The disclosure requirements are effective for fiscal years and interim periods within those fiscal years beginning after December 15, 2016. Management is currently evaluating the potential impact of this new guidance to the financial statements.
10. REGULATORY CHANGES
In October 2016, the Securities and Exchange Commission (“SEC”) adopted new rules and forms and amended existing rules and forms (together, “final rules”) intended to modernize and enhance the reporting and disclosure of information by registered investment companies and to enhance liquidity risk management by open-end mutual funds and exchange-traded funds. The final rules will enhance the quality of information available to investors and will allow the SEC to more effectively collect and use data reported by funds. In part, the final rules amend Regulation S-X and require standardized, enhanced disclosure about derivatives in the Fund’s financial statements, as well as other amendments. The compliance date for the amendments to Regulation S-X is August 1, 2017 while the compliance date for the new form types is June 1, 2018 and the compliance date for the liquidity risk management program requirements is December 1, 2018. Management is currently assessing the potential impact of these enhancements and their impact on the financial statement disclosures and reporting requirements.
| | | | |
| 26 | | Wells Fargo International Bond Fund | | Other information (unaudited) |
PROXY VOTING INFORMATION
A description of the policies and procedures that the Fund uses to determine how to vote proxies relating to portfolio securities is available, upon request, by calling 1-800-222-8222, visiting our website at wellsfargofunds.com, or visiting the SEC website at sec.gov. Information regarding how the Fund voted proxies relating to portfolio securities during the most recent 12-month period ended June 30 is available on the Fund’s website at wellsfargofunds.com or by visiting the SEC website at sec.gov.
PORTFOLIO HOLDINGS INFORMATION
The complete portfolio holdings for the Fund are publicly available monthly on the Fund’s website (wellsfargofunds.com), on a one-month delayed basis. In addition, top ten holdings information (excluding derivative positions) for the Fund is publicly available on the Fund’s website on a monthly, seven-day or more delayed basis. The Fund files its complete schedule of portfolio holdings with the SEC for the first and third quarters of each fiscal year on Form N-Q, which is available by visiting the SEC website at sec.gov. In addition, the Fund’s Form N-Q may be reviewed and copied at the SEC’s Public Reference Room in Washington, DC, and at regional offices in New York City, at 233 Broadway, and in Chicago, at 175 West Jackson Boulevard, Suite 900. Information about the Public Reference Room may be obtained by calling 1-800-SEC-0330.
| | | | | | |
| Other information (unaudited) | | Wells Fargo International Bond Fund | | | 27 | |
BOARD OF TRUSTEES AND OFFICERS
Each of the Trustees and Officers1 listed in the table below acts in identical capacities for each fund in the Wells Fargo family of funds, which consists of 138 mutual funds comprising the Wells Fargo Funds Trust, Wells Fargo Variable Trust, Wells Fargo Master Trust and four closed-end funds (collectively the “Fund Complex”). This table should be read in conjunction with the Prospectus and the Statement of Additional Information2. The mailing address of each Trustee and Officer is 525 Market Street, 12th Floor, San Francisco, CA 94105. Each Trustee and Officer serves an indefinite term, however, each Trustee serves such term until reaching the mandatory retirement age established by the Trustees.
Independent Trustees
| | | | | | |
Name and
year of birth | | Position held and
length of service* | | Principal occupations during past five years or longer | | Current other
public company or
investment company
directorships |
| William R. Ebsworth (Born 1957) | | Trustee, since 2015 | | Retired. From 1984 to 2013, equities analyst, portfolio manager, research director and chief financial officer at Fidelity Management and Research Company in Boston, Tokyo, and Hong Kong and retired in 2013 as Chief Investment Officer of Fidelity Strategic Advisers, Inc. where he lead a team of investment professionals managing client assets. Prior thereto, Board member of Hong Kong Securities Clearing Co., Hong Kong Options Clearing Corp., the Thailand International Fund, Ltd., Fidelity Investments Life Insurance Company, and Empire Fidelity Investments Life Insurance Company. Board member of the Fonté Foundation (non-profit organization) and the Vincent Memorial Hospital Endowment (non-profit organization), where he serves on the Investment Committee and as a Chair of the Audit Committee. Mr. Ebsworth is a CFA® charterholder and an Adjunct Lecturer, Finance, at Babson College. | | Asset Allocation Trust |
| Jane A. Freeman (Born 1953) | | Trustee, since 2015 | | Retired. From 2012 to 2014 and 1999 to 2008, Chief Financial Officer of Scientific Learning Corporation. From 2008 to 2012, Ms. Freeman provided consulting services related to strategic business projects. Prior to 1999, Portfolio Manager at Rockefeller & Co. and Scudder, Stevens & Clark. Board member of the Harding Loevner Funds from 1996 to 2014, serving as both Lead Independent Director and chair of the Audit Committee. Board member of the Russell Exchange Traded Funds Trust from 2011 to 2012 and the chair of the Audit Committee. Ms. Freeman is a Board Member of Ruth Bancroft Garden (non-profit organization) and an inactive chartered financial analyst. | | Asset Allocation Trust |
| Peter G. Gordon** (Born 1942) | | Trustee, since 1998; Chairman, since 2005 | | Co-Founder, Retired Chairman, President and CEO of Crystal Geyser Water Company. Trustee Emeritus, Colby College. | | Asset Allocation Trust |
| Isaiah Harris, Jr. (Born 1952) | | Trustee, since 2009 | | Retired. Chairman of the Board of CIGNA Corporation since 2009, and Director since 2005. From 2003 to 2011, Director of Deluxe Corporation. Prior thereto, President and CEO of BellSouth Advertising and Publishing Corp. from 2005 to 2007, President and CEO of BellSouth Enterprises from 2004 to 2005 and President of BellSouth Consumer Services from 2000 to 2003. Emeritus member of the Iowa State University Foundation Board of Governors. Emeritus Member of the Advisory Board of Iowa State University School of Business. Advisory Board Member, Palm Harbor Academy (charter school). Advisory Board Member, Child Evangelism Fellowship (non-profit). Mr. Harris is a certified public accountant (inactive status). | | CIGNA Corporation; Asset Allocation Trust |
| Judith M. Johnson (Born 1949) | | Trustee, since 2008; Audit Committee Chairman, since 2008 | | Retired. Prior thereto, Chief Executive Officer and Chief Investment Officer of Minneapolis Employees Retirement Fund from 1996 to 2008. Ms. Johnson is an attorney, certified public accountant and a certified managerial accountant. | | Asset Allocation Trust |
| David F. Larcker (Born 1950) | | Trustee, since 2009 | | James Irvin Miller Professor of Accounting at the Graduate School of Business, Stanford University, Director of the Corporate Governance Research Initiative and Senior Faculty of The Rock Center for Corporate Governance since 2006. From 2005 to 2008, Professor of Accounting at the Graduate School of Business, Stanford University. Prior thereto, Ernst & Young Professor of Accounting at The Wharton School, University of Pennsylvania from 1985 to 2005. | | Asset Allocation Trust |
| | | | |
| 28 | | Wells Fargo International Bond Fund | | Other information (unaudited) |
| | | | | | |
Name and
year of birth | | Position held and
length of service* | | Principal occupations during past five years or longer | | Current other
public company or
investment company
directorships |
| Olivia S. Mitchell (Born 1953) | | Trustee, since 2006 | | International Foundation of Employee Benefit Plans Professor, Wharton School of the University of Pennsylvania since 1993. Director of Wharton’s Pension Research Council and Boettner Center on Pensions & Retirement Research, and Research Associate at the National Bureau of Economic Research. Previously, Cornell University Professor from 1978 to 1993. | | Asset Allocation Trust |
| Timothy J. Penny (Born 1951) | | Trustee, since 1996 | | President and Chief Executive Officer of Southern Minnesota Initiative Foundation, a non-profit organization, since 2007 and Senior Fellow at the Humphrey Institute Policy Forum at the University of Minnesota since 1995. Member of the Board of Trustees of NorthStar Education Finance, Inc., a non-profit organization, since 2007. | | Asset Allocation Trust |
| Michael S. Scofield (Born 1943) | | Trustee, since 2010 | | Served on the Investment Company Institute’s Board of Governors and Executive Committee from 2008-2011 as well the Governing Council of the Independent Directors Council from 2006-2011 and the Independent Directors Council Executive Committee from 2008-2011. Chairman of the IDC from 2008-2010. Institutional Investor (Fund Directions) Trustee of Year in 2007. Trustee of the Evergreen Funds complex (and its predecessors) from 1984 to 2010. Chairman of the Evergreen Funds from 2000-2010. Former Trustee of the Mentor Funds. Retired Attorney, Law Offices of Michael S. Scofield. | | Asset Allocation Trust |
| * | Length of service dates reflect the Trustee’s commencement of service with the Trust’s predecessor entities, where applicable. |
| ** | Peter Gordon is expected to retire on December 31, 2017. |
Officers
| | | | | | |
Name and
year of birth | | Position held and
length of service | | Principal occupations during past five years or longer | | |
Andrew Owen (Born 1960) | | President, since 2017 | | Executive Vice President of Wells Fargo Bank, N.A. and President of Wells Fargo & Company and Head of Affiliated Managers, Wells Fargo Asset Management, since 2014. Executive Vice President responsible for marketing, investments and product development for Wells Fargo Funds Management, LLC, from 2009 to 2014. | | |
Nancy Wiser1 (Born 1967) | | Treasurer, since 2012 | | Executive Vice President of Wells Fargo Funds Management, LLC since 2011. Chief Operating Officer and Chief Compliance Officer at LightBox Capital Management LLC, from 2008 to 2011. | | |
| C. David Messman (Born 1960) | | Secretary, since 2000; Chief Legal Officer, since 2003 | | Senior Vice President and Secretary of Wells Fargo Funds Management, LLC since 2001. Assistant General Counsel of Wells Fargo Bank, N.A. since 2013 and Vice President and Managing Counsel of Wells Fargo Bank, N.A. from 1996 to 2013. | | |
| Michael Whitaker (Born 1967) | | Chief Compliance Officer, since 2016 | | Executive Vice President of Wells Fargo Funds Management, LLC since 2016. Chief Compliance Officer of Fidelity’s Fixed Income Funds and Asset Allocation Funds from 2008 to 2016, Compliance Officer of FMR Co., Inc. from 2014 to 2016, Fidelity Investments Money Management, Inc. from 2014 to 2016, Fidelity Investments from 2007 to 2016. | | |
David Berardi (Born 1975) | | Assistant Treasurer, since 2009 | | Vice President of Wells Fargo Funds Management, LLC since 2009. Vice President of Evergreen Investment Management Company, LLC from 2008 to 2010. Manager of Fund Reporting and Control for Evergreen Investment Management Company, LLC from 2004 to 2010. | | |
| Jeremy DePalma1 (Born 1974) | | Assistant Treasurer, since 2009 | | Senior Vice President of Wells Fargo Funds Management, LLC since 2009. Senior Vice President of Evergreen Investment Management Company, LLC from 2008 to 2010 and head of the Fund Reporting and Control Team within Fund Administration from 2005 to 2010. | | |
| 1 | Nancy Wiser acts as Treasurer of 69 funds in the Fund Complex. Jeremy DePalma acts as Treasurer of 69 funds and Assistant Treasurer of 69 funds in the Fund Complex. |
| 2 | The Statement of Additional Information includes additional information about the Trustees and is available, without charge, upon request, by calling 1-800-222-8222 or by visiting the website at wellsfargofunds.com. |
| | | | | | |
| List of abbreviations | | Wells Fargo International Bond Fund | | | 29 | |
The following is a list of common abbreviations for terms and entities that may have appeared in this report.
| ACA | — ACA Financial Guaranty Corporation |
| ADR | — American depositary receipt |
| ADS | — American depositary shares |
| AGC | — Assured Guaranty Corporation |
| AGM | — Assured Guaranty Municipal |
| Ambac | — Ambac Financial Group Incorporated |
| AMT | — Alternative minimum tax |
| BAN | — Bond anticipation notes |
| BHAC | — Berkshire Hathaway Assurance Corporation |
| CAB | — Capital appreciation bond |
| CCAB | — Convertible capital appreciation bond |
| CDA | — Community Development Authority |
| CDO | — Collateralized debt obligation |
| DRIVER | — Derivative inverse tax-exempt receipts |
| DW&P | — Department of Water & Power |
| DWR | — Department of Water Resources |
| ECFA | — Educational & Cultural Facilities Authority |
| EDA | — Economic Development Authority |
| EDFA | — Economic Development Finance Authority |
| ETF | — Exchange-traded fund |
| FDIC | — Federal Deposit Insurance Corporation |
| FFCB | — Federal Farm Credit Banks |
| FGIC | — Financial Guaranty Insurance Corporation |
| FHA | — Federal Housing Administration |
| FHLB | — Federal Home Loan Bank |
| FHLMC | — Federal Home Loan Mortgage Corporation |
| FICO | — The Financing Corporation |
| FNMA | — Federal National Mortgage Association |
| GDR | — Global depositary receipt |
| GNMA | — Government National Mortgage Association |
| HCFR | — Healthcare facilities revenue |
| HEFA | — Health & Educational Facilities Authority |
| HEFAR | — Higher education facilities authority revenue |
| HFA | — Housing Finance Authority |
| HFFA | — Health Facilities Financing Authority |
| HUD | — Department of Housing and Urban Development |
| IDA | — Industrial Development Authority |
| IDAG | — Industrial Development Agency |
| KRW | — Republic of Korea won |
| LIBOR | — London Interbank Offered Rate |
| LIFER | — Long Inverse Floating Exempt Receipts |
| LLC | — Limited liability company |
| LLLP | — Limited liability limited partnership |
| LLP | — Limited liability partnership |
| MBIA | — Municipal Bond Insurance Association |
| MFHR | — Multifamily housing revenue |
| MSTR | — Municipal securities trust receipts |
| MUD | — Municipal Utility District |
| National | — National Public Finance Guarantee Corporation |
| PCFA | — Pollution Control Financing Authority |
| PCL | — Public Company Limited |
| PCR | — Pollution control revenue |
| PFA | — Public Finance Authority |
| PFFA | — Public Facilities Financing Authority |
| PFOTER | — Puttable floating option tax-exempt receipts |
| plc | — Public limited company |
| PUTTER | — Puttable tax-exempt receipts |
| R&D | — Research & development |
| Radian | — Radian Asset Assurance |
| RAN | — Revenue anticipation notes |
| RDA | — Redevelopment Authority |
| RDFA | — Redevelopment Finance Authority |
| REIT | — Real estate investment trust |
| ROC | — Reset option certificates |
| SAVRS | — Select auction variable rate securities |
| SBA | — Small Business Authority |
| SDR | — Swedish depositary receipt |
| SFHR | — Single-family housing revenue |
| SFMR | — Single-family mortgage revenue |
| SPA | — Standby purchase agreement |
| SPDR | — Standard & Poor’s Depositary Receipts |
| SPEAR | — Short Puttable Exempt Adjustable Receipts |
| STRIPS | — Separate trading of registered interest and |
| TAN | — Tax anticipation notes |
| TIPS | — Treasury inflation-protected securities |
| TRAN | — Tax revenue anticipation notes |
| TTFA | — Transportation Trust Fund Authority |
| TVA | — Tennessee Valley Authority |
This page is intentionally left blank.
This page is intentionally left blank.
This page is intentionally left blank.

For more information
More information about Wells Fargo Funds is available free upon request. To obtain literature, please write, email, visit the Fund’s website, or call:
Wells Fargo Funds
P.O. Box 8266
Boston, MA 02266-8266
Email: fundservice@wellsfargo.com
Website: wellsfargofunds.com
Individual investors: 1-800-222-8222
Retail investment professionals: 1-888-877-9275
Institutional investment professionals: 1-866-765-0778
This report and the financial statements contained herein are submitted for the general information of the shareholders of the Fund. If this report is used for promotional purposes, distribution of the report must be accompanied or preceded by a current prospectus. Before investing, please consider the investment objectives, risks, charges, and expenses of the investment. For a current prospectus and, if available, a summary prospectus, containing this information, call 1-800-222-8222 or visit the Fund’s website at wellsfargofunds.com. Read the prospectus carefully before you invest or send money.
Wells Fargo Asset Management (WFAM) is a trade name used by the asset management businesses of Wells Fargo & Company. Wells Fargo Funds Management, LLC, a wholly owned subsidiary of Wells Fargo & Company, provides investment advisory and administrative services for Wells Fargo Funds. Other affiliates of Wells Fargo & Company provide subadvisory and other services for the funds. The funds are distributed by Wells Fargo Funds Distributor, LLC, Member FINRA, an affiliate of Wells Fargo & Company. Neither Wells Fargo Funds Management nor Wells Fargo Funds Distributor has Fund customer accounts/assets, and neither provides investment advice/recommendations or acts as an investment advice fiduciary to any investor.
NOT FDIC INSURED ◾ NO BANK GUARANTEE ◾ MAY LOSE VALUE
© 2017 Wells Fargo Funds Management, LLC. All rights reserved.
| | |
 | | 302884 05-17 SA235/SAR235 03-17 |
Semi-Annual Report
March 31, 2017

Wells Fargo Strategic Income Fund


Reduce clutter. Save trees.
Sign up for electronic delivery of prospectuses and shareholder reports at wellsfargo.com/advantagedelivery
Contents
The views expressed and any forward-looking statements are as of March 31, 2017, unless otherwise noted, and are those of the Fund managers and/or Wells Fargo Funds Management, LLC. Discussions of individual securities, or the markets generally, or any Wells Fargo Fund are not intended as individual recommendations. Future events or results may vary significantly from those expressed in any forward-looking statements. The views expressed are subject to change at any time in response to changing circumstances in the market. Wells Fargo Funds Management, LLC and the Fund disclaim any obligation to publicly update or revise any views expressed or forward-looking statements.
NOT FDIC INSURED ◾ NO BANK GUARANTEE ◾ MAY LOSE VALUE
| | | | |
| 2 | | Wells Fargo Strategic Income Fund | | Letter to shareholders (unaudited) |

Andrew Owen
President
Wells Fargo Funds
U.S. and international stocks returned 10.12% and 8.18% for the six-month period; within fixed income, the Bloomberg Barclays U.S. Aggregate Bond Index3 returned -2.18%.
Dear Shareholder:
As the new president of Wells Fargo Funds now that Karla Rabusch is retiring from that position after nearly 14 years, I am pleased to offer you this semi-annual report for the Wells Fargo Strategic Income Fund for the six-month period that ended March 31, 2017. During this period, global stocks delivered favorable results overall. U.S. and international stocks returned 10.12% and 8.18% for the six-month period, respectively, as measured by the S&P 500 Index1 and the MSCI ACWI ex USA Index (Net)2; within fixed income, the Bloomberg Barclays U.S. Aggregate Bond Index3 returned -2.18%.
During the fourth quarter of 2016, prospects for faster growth and higher interest rates in the U.S. influenced markets.
Early in the fourth quarter of 2016, U.S. stocks tended to trade lower amid concerns such as a likely interest-rate increase and uncertainty over the approaching general election. However, following Donald Trump’s election as president in early November, U.S. stocks began to rally. Investors appeared optimistic that the new administration would usher in a series of progrowth policies, and supportive economic news helped the rally carry through the quarter. The buoyant environment sent interest rates higher as well. At its mid-December meeting, Fed officials raised their short-term target interest rate for the first time in a year by a quarter percentage point to between 0.50% and 0.75%. The fourth quarter also saw the implementation of the U.S. Securities and Exchange Commission’s new rules for money market funds, which included floating net asset values (NAVs) for institutional prime and municipal money market funds as well as liquidity fees and redemption gates. In the year leading up to money market fund reform implementation, nearly $1 trillion in assets moved from these types of money market funds into government money market funds, which continued to transact at a stable $1 NAV. Outside of the U.S., the prospects for faster U.S. growth appeared to trigger some acceleration in Europe. The improvement may be partly attributable to expectations for further strengthening of the U.S. dollar, which in turn could improve demand for European goods in the U.S. due to weakening of the euro relative to the dollar. Meanwhile, rising inflation across the eurozone and Japan caused an upward shift in yield curves in those areas although developed-country bond yields remained significantly lower than U.S. Treasury yields.
Globally, stocks delivered positive results and economies showed some improvement in the first quarter of 2017.
Stocks rallied globally through the first quarter of 2017, supported by signs of improvement in the U.S. and global economies. U.S. economic data released during the quarter reflected a healthy economy. Hiring remained strong, and business and consumer sentiment improved. Meanwhile, inflation inched up during the quarter. Along with the pickup in inflation, investors appeared to shift
| 1 | The S&P 500 Index consists of 500 stocks chosen for market size, liquidity, and industry group representation. It is a market-value-weighted index with each stock’s weight in the index proportionate to its market value. You cannot invest directly in an index. |
| 2 | The Morgan Stanley Capital International (MSCI) All Country World Index (ACWI) ex USA Index (Net) is a free-float-adjusted market-capitalization-weighted index that is designed to measure the equity market performance of developed markets, excluding the United States and Canada. Source: MSCI. MSCI makes no express or implied warranties or representations and shall have no liability whatsoever with respect to any MSCI data contained herein. The MSCI data may not be further redistributed or used as a basis for other indexes or any securities or financial products. This report is not approved, reviewed, or produced by MSCI. You cannot invest directly in an index. |
| 3 | The Bloomberg Barclays U.S. Aggregate Bond Index (formerly known as Barclays U.S. Aggregate Bond Index) is a broad-based benchmark that measures the investment-grade, U.S. dollar–denominated, fixed-rate taxable bond market, including Treasuries, government-related and corporate securities, mortgage-backed securities (agency fixed-rate and hybrid adjustable-rate mortgage pass-throughs), asset-backed securities, and commercial mortgage-backed securities. You cannot invest directly in an index. |
| | | | | | |
| Letter to shareholders (unaudited) | | Wells Fargo Strategic Income Fund | | | 3 | |
from a mindset of very gradual interest-rate increases by the Fed to an anticipation of three or four increases in 2017. The first of these occurred in March; Fed officials raised their short-term target rate by a quarter percentage point to between 0.75% and 1.00%. With the Fed’s target-rate increase, short-term bond yields rose during the quarter. Meanwhile, longer-term Treasury yields were little changed, leading to positive performance. Investment-grade and high-yield bonds benefited from strong demand. Municipal bond returns were positive in the quarter, helped by strong demand and constrained new-issue supply. Outside of the U.S., credit spreads narrowed, helping lower-quality credit outperform amid a strong demand for yield. Also, stocks in emerging markets generally outperformed stocks in the U.S. and international developed markets. Thus far in 2017, emerging markets overall have benefited from both global economic growth and recent weakening in the U.S. dollar. European stocks also outperformed the U.S. market, despite investors’ concern over uncertainties such as the potential impact of an upcoming election in France; a contender for president of France, Marine Le Pen, favored exiting the European Union, which could potentially destabilize or topple the organization.
Don’t let short-term uncertainty derail long-term investment goals.
Periods of uncertainty can present challenges, but experience has taught us that maintaining long-term investment goals can be an effective way to plan for the future. To help you create a sound strategy based on your personal goals and risk tolerance, Wells Fargo Funds offers more than 100 mutual funds spanning a wide range of asset classes and investment styles. Although diversification cannot guarantee an investment profit or prevent losses, we believe it can be an effective way to manage investment risk and potentially smooth out overall portfolio performance. We encourage investors to know their investments and to understand that appropriate levels of risk-taking may unlock opportunities.
Thank you for choosing to invest in Wells Fargo Funds. We appreciate your confidence in us and remain committed to helping you meet your financial needs.
Sincerely,

Andrew Owen
President
Wells Fargo Funds
Although diversification cannot guarantee an investment profit or prevent losses, we believe it can be an effective way to manage investment risk and potentially smooth out overall portfolio performance.
For further information about your Fund, contact your investment professional, visit our website at wellsfargofunds.com, or call us directly at 1-800-222-8222. We are available 24 hours a day, 7 days a week.
| | | | |
| 4 | | Wells Fargo Strategic Income Fund | | Performance highlights (unaudited) |
Investment objective
The Fund seeks total return, consisting of a high level of current income and capital appreciation.
Manager
Wells Fargo Funds Management, LLC
Subadvisers
First International Advisors, LLC
Wells Capital Management Incorporated
Portfolio managers
Ashok Bhatia, CFA®
David Germany, Ph.D.
Niklas Nordenfelt, CFA®
Tony Norris
Alex Perrin
Thomas M. Price, CFA®
Scott M. Smith, CFA®
Noah Wise, CFA®
Average annual total returns (%) as of March 31, 2017
| | | | | | | | | | | | | | | | | | | | | | | | | | |
| | | | | Including sales charge | | | Excluding sales charge | | | Expense ratios1 (%) | |
| | | Inception date | | 1 year | | | Since inception | | | 1 year | | | Since inception | | | Gross | | | Net2 | |
| Class A (WSIAX) | | 1-31-2013 | | | 2.84 | | | | 0.10 | | | | 7.09 | | | | 1.09 | | | | 1.80 | | | | 0.91 | |
| Class C (WSICX) | | 1-31-2013 | | | 5.32 | | | | 0.33 | | | | 6.32 | | | | 0.33 | | | | 2.55 | | | | 1.66 | |
| Administrator Class (WSIDX) | | 1-31-2013 | | | – | | | | – | | | | 6.98 | | | | 1.19 | | | | 1.74 | | | | 0.76 | |
| Institutional Class (WSINX) | | 1-31-2013 | | | – | | | | – | | | | 7.44 | | | | 1.39 | | | | 1.47 | | | | 0.61 | |
| Bloomberg Barclays U.S. Universal Bond Index3 | | – | | | – | | | | – | | | | 1.92 | | | | 2.41 | | | | – | | | | – | |
| BofA Merrill Lynch 3 Month U.S. Dollar LIBOR Constant Maturity Index4 | | – | | | – | | | | – | | | | 0.74 | | | | 0.39 | | | | – | | | | – | |
Figures quoted represent past performance, which is no guarantee of future results, and do not reflect taxes that a shareholder may pay on fund distributions or the redemption of fund shares. Investment return and principal value of an investment will fluctuate so that an investor’s shares, when redeemed, may be worth more or less than their original cost. Performance shown without sales charges would be lower if sales charges were reflected. Current performance may be lower or higher than the performance data quoted, which assumes the reinvestment of dividends and capital gains. Current month-end performance is available on the Fund’s website,wellsfargofunds.com.
Index returns do not include transaction costs associated with buying and selling securities, any mutual fund fees or expenses, or any taxes. It is not possible to invest directly in an index.
For Class A shares, the maximum front-end sales charge is 4.00%. For Class C shares, the maximum contingent deferred sales charge is 1.00%. Performance including a contingent deferred sales charge assumes the sales charge for the corresponding time period. Administrator Class and Institutional Class shares are sold without a front-end sales charge or contingent deferred sales charge.
Bond values fluctuate in response to the financial condition of individual issuers, general market and economic conditions, and changes in interest rates. Changes in market conditions and government policies may lead to periods of heightened volatility in the bond market and reduced liquidity for certain bonds held by the Fund. In general, when interest rates rise, bond values fall and investors may lose principal value. Interest-rate changes and their impact on the Fund and its share price can be sudden and unpredictable. High-yield securities have a greater risk of default and tend to be more volatile than higher-rated debt securities. Loans are subject to risks similar to those associated with other below investment- grade bond investments, such as credit risk (for example, risk of issuer default), below-investment-grade bond risk (for example, risk of greater volatility in value), and risk that the loan may become illiquid or difficult to price. Foreign investments are especially volatile and can rise or fall dramatically due to differences in the political and economic conditions of the host country. These risks are generally intensified in emerging markets. The use of derivatives may reduce returns and/or increase volatility. Certain investment strategies tend to increase the total risk of an investment (relative to the broader market). The Fund is exposed to mortgage- and asset-backed securities risk, regulatory risk, and geographic risk. Consult the Fund’s prospectus for additional information on these and other risks.
Please see footnotes on page 5.
| | | | | | |
| Performance highlights (unaudited) | | Wells Fargo Strategic Income Fund | | | 5 | |
| | | | |
| Ten largest holdings (%) as of March 31, 20175 | |
Avis Budget Rental Car Funding LLC Series 2017-1A Class C , 4.15% 9-20-2023 | | | 1.59 | |
Hertz Fleet Lease Funding LP Series 2014-1 Class C, 2.01%, 4-10-2028 | | | 1.46 | |
SoFi Consumer Loan Program Trust Series 2016-3A , 3.05%, 12-26-2025 | | | 1.26 | |
Textainer Marine Containers Limited Series 2014-1A Class A , 3.27%, 10-20-2039 | | | 1.26 | |
ACAS CLO Limited Trust Series 2015-1A Class B, 3.12%, 4-18-2027 | | | 1.22 | |
Longtrain Leasing III LLC Series 2015-1A Class A2, 4.06%, 1-15-2045 | | | 1.16 | |
Citi Held For Asset Issuance Trust Series 2015-PM3 Class B, 4.31%, 5-16-2022 | | | 1.1 | |
Chicago Skyscraper Trust Series 2017-SKY Class C, 2.16%, 4-15-2030 | | | 1.06 | |
321 Henderson Receivables LLC Series 2015-2A Class A, 3.87%, 3-15-2058 | | | 1.06 | |
JPMBB Commercial Mortgage Securities Trust Series 2014-C19 Class D, 4.67%, 4-15-2047 | | | 1.06 | |
|
| Portfolio allocation as of March 31, 20176 |
|
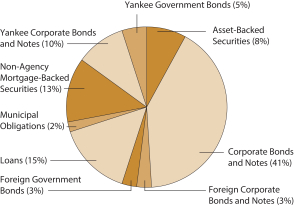 |
| 1 | Reflects the expense ratios as stated in the most recent prospectuses, which include the impact of 0.01% in acquired fund fees and expenses. The expense ratios shown are subject to change and may differ from the annualized expense ratios shown in the financial highlights of this report, which do not include acquired fund fees and expenses. |
| 2 | The manager has contractually committed through January 31, 2018, to waive fees and/or reimburse expenses to the extent necessary to cap the Fund’s Total Annual Fund Operating Expenses After Fee Waivers at 0.90% for Class A, 1.65% for Class C, 0.75% for Administrator Class, and 0.60% for Institutional Class. After this time, the cap may be increased or the commitment to maintain the cap may be terminated only with the approval of the Board of Trustees. Brokerage commissions, stamp duty fees, interest, taxes, acquired fund fees and expenses, and extraordinary expenses are excluded from the expense cap. Without this cap, the Fund’s returns would have been lower. The expense ratio paid by an investor is the net expense ratio or the Fund’s Total Annual Fund Operating Expenses After Fee Waivers, as stated in the prospectuses. |
| 3 | The Bloomberg Barclays U.S. Universal Bond Index (formerly known as Barclays U.S. Universal Bond Index) is an unmanaged market-value-weighted performance benchmark for the U.S. dollar–denominated bond market, which includes investment-grade, high-yield, and emerging markets debt securities with maturities of one year or more. You cannot invest directly in an index. |
| 4 | The BofA Merrill Lynch 3 Month U.S. Dollar LIBOR Constant Maturity Index is based on the assumed purchase of a synthetic instrument having 3 months to maturity and with a coupon equal to the closing quote for 3-Month LIBOR. That issue is sold the following day (priced at a yield equal to the current day closing 3-Month LIBOR rate) and is rolled into a new 3-Month instrument. The index, therefore, will always have a constant maturity equal to exactly 3 months. You cannot invest directly in an index. |
| 5 | The ten largest holdings, excluding cash and cash equivalents, are calculated based on the value of the investments divided by total net assets of the Fund. Holdings are subject to change and may have changed since the date specified. |
| 6 | Amounts are calculated based on the total long-term investments of the Fund. These amounts are subject to change and may have changed since the date specified. |
| | | | |
| 6 | | Wells Fargo Strategic Income Fund | | Fund expenses (unaudited) |
As a shareholder of the Fund, you incur two types of costs: (1) transaction costs, including sales charges (loads) on purchase payments and contingent deferred sales charges (if any) on redemptions and (2) ongoing costs, including management fees, distribution (12b-1) and/or shareholder servicing fees, and other Fund expenses. This example is intended to help you understand your ongoing costs (in dollars) of investing in the Fund and to compare these costs with the ongoing costs of investing in other mutual funds.
The example is based on an investment of $1,000 invested at the beginning of the six-month period and held for the entire period from October 1, 2016 to March 31, 2017.
Actual expenses
The “Actual” line of the table below provides information about actual account values and actual expenses. You may use the information in this line, together with the amount you invested, to estimate the expenses that you paid over the period. Simply divide your account value by $1,000 (for example, an $8,600 account value divided by $1,000 = 8.6), then multiply the result by the number in the “Actual” line under the heading entitled “Expenses paid during period” for your applicable class of shares to estimate the expenses you paid on your account during this period.
Hypothetical example for comparison purposes
The “Hypothetical” line of the table below provides information about hypothetical account values and hypothetical expenses based on the Fund’s actual expense ratio and an assumed rate of return of 5% per year before expenses, which is not the Fund’s actual return. The hypothetical account values and expenses may not be used to estimate the actual ending account balance or expenses you paid for the period. You may use this information to compare the ongoing costs of investing in the Fund and other funds. To do so, compare this 5% hypothetical example with the 5% hypothetical examples that appear in the shareholder reports of the other funds.
Please note that the expenses shown in the table are meant to highlight your ongoing costs only and do not reflect any transactional costs, such as sales charges (loads) and contingent deferred sales charges. Therefore, the “Hypothetical” line of the table is useful in comparing ongoing costs only and will not help you determine the relative total costs of owning different funds. In addition, if these transactional costs were included, your costs would have been higher.
| | | | | | | | | | | | | | | | |
| | | Beginning
account value
10-1-2016 | | | Ending
account value
3-31-2017 | | | Expenses
paid during
the period¹ | | | Annualized net
expense ratio | |
Class A | | | | | | | | | | | | | | | | |
Actual | | $ | 1,000.00 | | | $ | 1,025.56 | | | $ | 4.55 | | | | 0.90 | % |
Hypothetical (5% return before expenses) | | $ | 1,000.00 | | | $ | 1,020.44 | | | $ | 4.53 | | | | 0.90 | % |
Class C | | | | | | | | | | | | | | | | |
Actual | | $ | 1,000.00 | | | $ | 1,021.66 | | | $ | 8.32 | | | | 1.65 | % |
Hypothetical (5% return before expenses) | | $ | 1,000.00 | | | $ | 1,016.70 | | | $ | 8.30 | | | | 1.65 | % |
Administrator Class | | | | | | | | | | | | | | | | |
Actual | | $ | 1,000.00 | | | $ | 1,023.38 | | | $ | 3.78 | | | | 0.75 | % |
Hypothetical (5% return before expenses) | | $ | 1,000.00 | | | $ | 1,021.19 | | | $ | 3.78 | | | | 0.75 | % |
Institutional Class | | | | | | | | | | | | | | | | |
Actual | | $ | 1,000.00 | | | $ | 1,027.54 | | | $ | 3.03 | | | | 0.60 | % |
Hypothetical (5% return before expenses) | | $ | 1,000.00 | | | $ | 1,021.94 | | | $ | 3.02 | | | | 0.60 | % |
| 1 | Expenses paid is equal to the annualized net expense ratio of each class multiplied by the average account value over the period, multiplied by the number of days in the most recent fiscal half-year divided by the number of days in the fiscal year (to reflect the one-half-year period). |
| | | | | | |
| Portfolio of investments—March 31, 2017 (unaudited) | | Wells Fargo Strategic Income Fund | | | 7 | |
| | | | | | | | | | | | | | | | |
| Security name | | Interest rate | | | Maturity date | | | Principal | | | Value | |
| | | | | | | | | | | | | | | | |
| | | | |
Asset-Backed Securities: 7.48% | | | | | | | | | | | | | | | | |
AmeriCredit Automobile Receivables Trust Series 2015-4 Class D | | | 3.72 | % | | | 12-8-2021 | | | $ | 300,000 | | | $ | 307,534 | |
Ascentium Equipment Receivables LLC Series 2016-1A Class B 144A | | | 2.85 | | | | 7-10-2020 | | | | 400,000 | | | | 404,443 | |
Avis Budget Rental Car Funding LLC Series 2012-3A Class B 144A | | | 3.04 | | | | 3-20-2019 | | | | 250,000 | | | | 251,894 | |
Avis Budget Rental Car Funding LLC Series 2017-1A Class C 144A | | | 4.15 | | | | 9-20-2023 | | | | 650,000 | | | | 653,062 | |
Hertz Fleet Lease Funding LP Series 2014-1 Class C 144A± | | | 2.01 | | | | 4-10-2028 | | | | 600,000 | | | | 598,958 | |
Social Professional Loan Program LLC Series 2016-A Class A2 144A | | | 2.76 | | | | 12-26-2036 | | | | 339,425 | | | | 342,025 | |
SoFi Consumer Loan Program Trust Series 2016-3A 144A | | | 3.05 | | | | 12-26-2025 | | | | 518,899 | | | | 519,147 | |
| | | | |
Total Asset-Backed Securities (Cost $3,067,303) | | | | | | | | | | | | | | | 3,077,063 | |
| | | | | | | | | | | | | | | | |
| | | | |
| | | | | | | | | Shares | | | | |
Common Stocks: 0.26% | | | | | | | | | | | | | | | | |
| | | | |
Utilities: 0.26% | | | | | | | | | | | | | | | | |
| | | | |
| Electric Utilities: 0.26% | | | | | | | | | | | | | | | | |
Vistra Energy Corporation | | | | | | | | | | | 6,516 | | | | 106,211 | |
| | | | | | | | | | | | | | | | |
| | | | |
Total Common Stocks (Cost $384,648) | | | | | | | | | | | | | | | 106,211 | |
| | | | | | | | | | | | | | | | |
| | | | |
| | | | | | | | | Principal | | | | |
Corporate Bonds and Notes: 36.00% | | | | | | | | | | | | | | | | |
| | | | |
Consumer Discretionary: 9.78% | | | | | | | | | | | | | | | | |
| | | | |
| Auto Components: 0.12% | | | | | | | | | | | | | | | | |
Allison Transmission Incorporated 144A | | | 5.00 | | | | 10-1-2024 | | | $ | 50,000 | | | | 50,500 | |
| | | | | | | | | | | | | | | | |
| | | | |
| Automobiles: 0.81% | | | | | | | | | | | | | | | | |
Ford Motor Company | | | 7.45 | | | | 7-16-2031 | | | | 265,000 | | | | 334,200 | |
| | | | | | | | | | | | | | | | |
| | | | |
| Distributors: 0.42% | | | | | | | | | | | | | | | | |
LKQ Corporation | | | 4.75 | | | | 5-15-2023 | | | | 175,000 | | | | 174,125 | |
| | | | | | | | | | | | | | | | |
| | | | |
| Diversified Consumer Services: 0.51% | | | | | | | | | | | | | | | | |
Service Corporation International | | | 5.38 | | | | 5-15-2024 | | | | 200,000 | | | | 208,070 | |
| | | | | | | | | | | | | | | | |
| | | | |
| Hotels, Restaurants & Leisure: 0.57% | | | | | | | | | | | | | | | | |
Brinker International Incorporated 144A | | | 5.00 | | | | 10-1-2024 | | | | 25,000 | | | | 24,688 | |
Greektown Holdings LLC 144A | | | 8.88 | | | | 3-15-2019 | | | | 200,000 | | | | 209,350 | |
| | | | |
| | | | | | | | | | | | | | | 234,038 | |
| | | | | | | | | | | | | | | | |
| | | | |
| Household Durables: 0.51% | | | | | | | | | | | | | | | | |
D.R. Horton Incorporated | | | 4.38 | | | | 9-15-2022 | | | | 200,000 | | | | 210,486 | |
| | | | | | | | | | | | | | | | |
| | | | |
| Media: 5.13% | | | | | | | | | | | | | | | | |
Altice US Finance I Corporation 144A | | | 5.50 | | | | 5-15-2026 | | | | 275,000 | | | | 282,563 | |
CCO Holdings LLC 144A | | | 5.13 | | | | 5-1-2023 | | | | 35,000 | | | | 36,050 | |
CCO Holdings LLC | | | 5.25 | | | | 9-30-2022 | | | | 50,000 | | | | 51,875 | |
CCO Holdings LLC 144A | | | 5.38 | | | | 5-1-2025 | | | | 225,000 | | | | 230,906 | |
Charter Communications Operating LLC | | | 4.91 | | | | 7-23-2025 | | | | 400,000 | | | | 422,371 | |
Discovery Communications LLC | | | 3.80 | | | | 3-13-2024 | | | | 265,000 | | | | 261,911 | |
Gray Television Incorporated 144A | | | 5.13 | | | | 10-15-2024 | | | | 50,000 | | | | 49,375 | |
Gray Television Incorporated 144A | | | 5.88 | | | | 7-15-2026 | | | | 50,000 | | | | 50,875 | |
The accompanying notes are an integral part of these financial statements.
| | | | |
| 8 | | Wells Fargo Strategic Income Fund | | Portfolio of investments—March 31, 2017 (unaudited) |
| | | | | | | | | | | | | | | | |
| Security name | | Interest rate | | | Maturity date | | | Principal | | | Value | |
| | | | | | | | | | | | | | | | |
| | | | |
| Media (continued) | | | | | | | | | | | | | | | | |
Interpublic Group Company | | | 4.20 | % | | | 4-15-2024 | | | $ | 250,000 | | | $ | 257,906 | |
National CineMedia LLC | | | 5.75 | | | | 8-15-2026 | | | | 50,000 | | | | 50,600 | |
Nexstar Broadcasting Group Incorporated 144A | | | 6.13 | | | | 2-15-2022 | | | | 50,000 | | | | 52,000 | |
Nielsen Finance LLC 144A | | | 5.00 | | | | 4-15-2022 | | | | 100,000 | | | | 102,250 | |
Time Warner Incorporated | | | 3.80 | | | | 2-15-2027 | | | | 265,000 | | | | 262,081 | |
| | | | |
| | | | | | | | | | | | | | | 2,110,763 | |
| | | | | | | | | | | | | | | | |
| | | | |
| Multiline Retail: 1.06% | | | | | | | | | | | | | | | | |
Macy’s Retail Holdings Incorporated | | | 3.88 | | | | 1-15-2022 | | | | 250,000 | | | | 247,520 | |
Nordstrom Incorporated | | | 5.00 | | | | 1-15-2044 | | | | 200,000 | | | | 188,879 | |
| | | | |
| | | | | | | | | | | | | | | 436,399 | |
| | | | | | | | | | | | | | | | |
| | | | |
| Specialty Retail: 0.53% | | | | | | | | | | | | | | | | |
Asbury Automotive Group Incorporated | | | 6.00 | | | | 12-15-2024 | | | | 75,000 | | | | 77,438 | |
Group 1 Automotive Incorporated | | | 5.00 | | | | 6-1-2022 | | | | 25,000 | | | | 25,188 | |
Penske Auto Group Incorporated | | | 5.75 | | | | 10-1-2022 | | | | 50,000 | | | | 51,750 | |
Sonic Automotive Incorporated | | | 5.00 | | | | 5-15-2023 | | | | 65,000 | | | | 63,172 | |
| | | | |
| | | | | | | | | | | | | | | 217,548 | |
| | | | | | | | | | | | | | | | |
| | | | |
| Textiles, Apparel & Luxury Goods: 0.12% | | | | | | | | | | | | | | | | |
Wolverine World Wide Company 144A | | | 5.00 | | | | 9-1-2026 | | | | 50,000 | | | | 47,000 | |
| | | | | | | | | | | | | | | | |
| | | | |
Consumer Staples: 0.65% | | | | | | | | | | | | | | | | |
| | | | |
| Beverages: 0.65% | | | | | | | | | | | | | | | | |
Anheuser-Busch InBev Finance Company | | | 3.65 | | | | 2-1-2026 | | | | 265,000 | | | | 267,942 | |
| | | | | | | | | | | | | | | | |
| | | | |
Energy: 3.87% | | | | | | | | | | | | | | | | |
| | | | |
| Energy Equipment & Services: 1.26% | | | | | | | | | | | | | | | | |
Bristow Group Incorporated | | | 6.25 | | | | 10-15-2022 | | | | 100,000 | | | | 80,500 | |
Era Group Incorporated | | | 7.75 | | | | 12-15-2022 | | | | 40,000 | | | | 38,100 | |
Hilcorp Energy Company 144A | | | 5.75 | | | | 10-1-2025 | | | | 75,000 | | | | 72,375 | |
Hornbeck Offshore Services Incorporated | | | 1.50 | | | | 9-1-2019 | | | | 25,000 | | | | 16,250 | |
NGPL PipeCo LLC 144A | | | 7.77 | | | | 12-15-2037 | | | | 175,000 | | | | 197,750 | |
PHI Incorporated | | | 5.25 | | | | 3-15-2019 | | | | 120,000 | | | | 113,400 | |
| | | | |
| | | | | | | | | | | | | | | 518,375 | |
| | | | | | | | | | | | | | | | |
| | | | |
| Oil, Gas & Consumable Fuels: 2.61% | | | | | | | | | | | | | | | | |
Crestwood Midstream Partners LP | | | 6.25 | | | | 4-1-2023 | | | | 50,000 | | | | 51,875 | |
Enable Midstream Partner LP | | | 3.90 | | | | 5-15-2024 | | | | 100,000 | | | | 97,584 | |
EnLink Midstream LLC | | | 4.40 | | | | 4-1-2024 | | | | 50,000 | | | | 50,593 | |
Exterran Partners LP | | | 6.00 | | | | 4-1-2021 | | | | 50,000 | | | | 49,625 | |
Gulfport Energy Corporation | | | 6.63 | | | | 5-1-2023 | | | | 75,000 | | | | 75,844 | |
Murphy Oil Corporation | | | 4.70 | | | | 12-1-2022 | | | | 25,000 | | | | 24,250 | |
Rockies Express Pipeline LLC 144A | | | 6.88 | | | | 4-15-2040 | | | | 200,000 | | | | 208,500 | |
Rose Rock Midstream LP | | | 5.63 | | | | 11-15-2023 | | | | 100,000 | | | | 98,000 | |
Sabine Pass Liquefaction LLC | | | 5.63 | | | | 2-1-2021 | | | | 100,000 | | | | 107,737 | |
Sabine Pass Liquefaction LLC 144A | | | 5.88 | | | | 6-30-2026 | | | | 75,000 | | | | 82,686 | |
Southwestern Energy Company | | | 6.70 | | | | 1-23-2025 | | | | 75,000 | | | | 74,250 | |
The accompanying notes are an integral part of these financial statements.
| | | | | | |
| Portfolio of investments—March 31, 2017 (unaudited) | | Wells Fargo Strategic Income Fund | | | 9 | |
| | | | | | | | | | | | | | | | |
| Security name | | Interest rate | | | Maturity date | | | Principal | | | Value | |
| | | | | | | | | | | | | | | | |
| | | | |
| Oil, Gas & Consumable Fuels (continued) | | | | | | | | | | | | | | | | |
Tallgrass Energy Partners LP 144A | | | 5.50 | % | | | 9-15-2024 | | | $ | 125,000 | | | $ | 125,625 | |
Tesoro Logistics LP | | | 5.25 | | | | 1-15-2025 | | | | 25,000 | | | | 26,094 | |
| | | | |
| | | | | | | | | | | | | | | 1,072,663 | |
| | | | | | | | | | | | | | | | |
| | | | |
Financials: 7.46% | | | | | | | | | | | | | | | | |
| | | | |
| Banks: 2.01% | | | | | | | | | | | | | | | | |
Bank of America Corporation ± | | | 6.30 | | | | 12-29-2049 | | | | 265,000 | | | | 288,188 | |
CIT Group Incorporated | | | 5.00 | | | | 8-1-2023 | | | | 100,000 | | | | 104,250 | |
JPMorgan Chase & Company ± | | | 6.00 | | | | 12-31-2049 | | | | 180,000 | | | | 187,704 | |
PNC Financial Services ± | | | 5.00 | | | | 12-29-2049 | | | | 250,000 | | | | 248,750 | |
| | | | |
| | | | | | | | | | | | | | | 828,892 | |
| | | | | | | | | | | | | | | | |
| | | | |
| Capital Markets: 1.31% | | | | | | | | | | | | | | | | |
Goldman Sachs Group Incorporated | | | 4.25 | | | | 10-21-2025 | | | | 265,000 | | | | 270,091 | |
Morgan Stanley | | | 5.00 | | | | 11-24-2025 | | | | 250,000 | | | | 268,420 | |
| | | | |
| | | | | | | | | | | | | | | 538,511 | |
| | | | | | | | | | | | | | | | |
| | | | |
| Consumer Finance: 0.90% | | | | | | | | | | | | | | | | |
Arch Capital Finance LLC | | | 4.01 | | | | 12-15-2026 | | | | 125,000 | | | | 128,160 | |
General Motors Financial Company Incorporated | | | 3.20 | | | | 7-6-2021 | | | | 200,000 | | | | 200,739 | |
Springleaf Finance Corporation | | | 8.25 | | | | 10-1-2023 | | | | 40,000 | | | | 42,150 | |
| | | | |
| | | | | | | | | | | | | | | 371,049 | |
| | | | | | | | | | | | | | | | |
| | | | |
| Diversified Financial Services: 0.92% | | | | | | | | | | | | | | | | |
Brookfield Finance LLC | | | 4.00 | | | | 4-1-2024 | | | | 200,000 | | | | 201,141 | |
LPL Holdings Incorporated 144A | | | 5.75 | | | | 9-15-2025 | | | | 175,000 | | | | 177,494 | |
| | | | |
| | | | | | | | | | | | | | | 378,635 | |
| | | | | | | | | | | | | | | | |
| | | | |
| Insurance: 2.32% | | | | | | | | | | | | | | | | |
Fairfax US Incorporated 144A | | | 4.88 | | | | 8-13-2024 | | | | 265,000 | | | | 269,851 | |
Guardian Life Insurance Company 144A | | | 4.85 | | | | 1-24-2077 | | | | 200,000 | | | | 195,405 | |
Hub Holdings LLC (PIK at 8.88%) 144A¥ | | | 8.13 | | | | 7-15-2019 | | | | 30,000 | | | | 30,000 | |
Hub International Limited 144A | | | 7.88 | | | | 10-1-2021 | | | | 100,000 | | | | 104,250 | |
Lincoln National Corporation | | | 7.00 | | | | 6-15-2040 | | | | 105,000 | | | | 135,611 | |
MetLife Incorporated | | | 6.40 | | | | 12-15-2066 | | | | 200,000 | | | | 219,500 | |
| | | | |
| | | | | | | | | | | | | | | 954,617 | |
| | | | | | | | | | | | | | | | |
| | | | |
Health Care: 2.34% | | | | | | | | | | | | | | | | |
| | | | |
| Health Care Providers & Services: 2.28% | | | | | | | | | | | | | | | | |
Community Health Systems Incorporated | | | 6.25 | | | | 3-31-2023 | | | | 200,000 | | | | 204,000 | |
DaVita HealthCare Partners Incorporated | | | 5.00 | | | | 5-1-2025 | | | | 100,000 | | | | 99,688 | |
DaVita HealthCare Partners Incorporated | | | 5.13 | | | | 7-15-2024 | | | | 200,000 | | | | 202,000 | |
Express Scripts Holding Company | | | 3.40 | | | | 3-1-2027 | | | | 250,000 | | | | 235,435 | |
MPH Acquisition Holdings LLC 144A | | | 7.13 | | | | 6-1-2024 | | | | 75,000 | | | | 80,634 | |
Vizient Incorporated 144A | | | 10.38 | | | | 3-1-2024 | | | | 100,000 | | | | 114,125 | |
| | | | |
| | | | | | | | | | | | | | | 935,882 | |
| | | | | | | | | | | | | | | | |
The accompanying notes are an integral part of these financial statements.
| | | | |
| 10 | | Wells Fargo Strategic Income Fund | | Portfolio of investments—March 31, 2017 (unaudited) |
| | | | | | | | | | | | | | | | |
| Security name | | Interest rate | | | Maturity date | | | Principal | | | Value | |
| | | | | | | | | | | | | | | | |
| | | | |
| Pharmaceuticals: 0.06% | | | | | | | | | | | | | | | | |
Valeant Pharmaceuticals International Incorporated 144A | | | 7.00 | % | | | 3-15-2024 | | | $ | 25,000 | | | $ | 25,656 | |
| | | | | | | | | | | | | | | | |
| | | | |
Industrials: 0.85% | | | | | | | | | | | | | | | | |
| | | | |
| Airlines: 0.25% | | | | | | | | | | | | | | | | |
American Airlines Incorporated | | | 4.38 | | | | 4-1-2024 | | | | 102,670 | | | | 103,184 | |
| | | | | | | | | | | | | | | | |
| | | | |
| Commercial Services & Supplies: 0.60% | | | | | | | | | | | | | | | | |
Advanced Disposal Services Incorporated 144A | | | 5.63 | | | | 11-15-2024 | | | | 100,000 | | | | 101,000 | |
Covanta Holding Corporation | | | 5.88 | | | | 3-1-2024 | | | | 145,000 | | | | 147,175 | |
| | | | |
| | | | | | | | | | | | | | | 248,175 | |
| | | | | | | | | | | | | | | | |
| | | | |
Information Technology: 3.94% | | | | | | | | | | | | | | | | |
| | | | |
| Electronic Equipment, Instruments & Components: 0.67% | | | | | | | | | | | | | | | | |
Arrow Electronics Incorporated | | | 3.50 | | | | 4-1-2022 | | | | 165,000 | | | | 166,292 | |
Zebra Technologies Corporation « | | | 7.25 | | | | 10-15-2022 | | | | 100,000 | | | | 108,125 | |
| | | | |
| | | | | | | | | | | | | | | 274,417 | |
| | | | | | | | | | | | | | | | |
| | | | |
| Internet Software & Services: 0.20% | | | | | | | | | | | | | | | | |
Zayo Group LLC | | | 6.38 | | | | 5-15-2025 | | | | 75,000 | | | | 80,953 | |
| | | | | | | | | | | | | | | | |
| | | | |
| IT Services: 0.61% | | | | | | | | | | | | | | | | |
Cardtronics Incorporated | | | 5.13 | | | | 8-1-2022 | | | | 150,000 | | | | 151,875 | |
Cardtronics Incorporated 144A%% | | | 5.50 | | | | 5-1-2025 | | | | 25,000 | | | | 25,313 | |
Gartner Incorporated 144A | | | 5.13 | | | | 4-1-2025 | | | | 75,000 | | | | 76,406 | |
| | | | |
| | | | | | | | | | | | | | | 253,594 | |
| | | | | | | | | | | | | | | | |
| | | | |
| Semiconductors & Semiconductor Equipment: 0.93% | | | | | | | | | | | | | | | | |
KLA-Tencor Corporation | | | 4.13 | | | | 11-1-2021 | | | | 265,000 | | | | 277,417 | |
Micron Technology Incorporated 144A | | | 5.63 | | | | 1-15-2026 | | | | 100,000 | | | | 105,250 | |
| | | | |
| | | | | | | | | | | | | | | 382,667 | |
| | | | | | | | | | | | | | | | |
| | | | |
| Technology Hardware, Storage & Peripherals: 1.53% | | | | | | | | | | | | | | | | |
Diamond 1 Finance Corporation 144A | | | 7.13 | | | | 6-15-2024 | | | | 275,000 | | | | 303,998 | |
Diamond 1 Finance Corporation 144A | | | 8.35 | | | | 7-15-2046 | | | | 75,000 | | | | 97,310 | |
NCR Corporation | | | 5.88 | | | | 12-15-2021 | | | | 210,000 | | | | 218,925 | |
NCR Corporation | | | 6.38 | | | | 12-15-2023 | | | | 10,000 | | | | 10,525 | |
| | | | |
| | | | | | | | | | | | | | | 630,758 | |
| | | | | | | | | | | | | | | | |
| | | | |
Materials: 0.52% | | | | | | | | | | | | | | | | |
| | | | |
| Containers & Packaging: 0.52% | | | | | | | | | | | | | | | | |
Owens-Illinois Incorporated 144A | | | 6.38 | | | | 8-15-2025 | | | | 200,000 | | | | 213,750 | |
| | | | | | | | | | | | | | | | |
| | | | |
Real Estate: 2.69% | | | | | | | | | | | | | | | | |
| | | | |
| Equity REITs: 1.81% | | | | | | | | | | | | | | | | |
American Tower Corporation | | | 4.00 | | | | 6-1-2025 | | | | 250,000 | | | | 252,925 | |
DuPont Fabros Technology Incorporated LP | | | 5.88 | | | | 9-15-2021 | | | | 85,000 | | | | 88,400 | |
ESH Hospitality Incorporated 144A | | | 5.25 | | | | 5-1-2025 | | | | 125,000 | | | | 126,015 | |
The accompanying notes are an integral part of these financial statements.
| | | | | | |
| Portfolio of investments—March 31, 2017 (unaudited) | | Wells Fargo Strategic Income Fund | | | 11 | |
| | | | | | | | | | | | | | | | |
| Security name | | Interest rate | | | Maturity date | | | Principal | | | Value | |
| | | | | | | | | | | | | | | | |
| | | | |
| Equity REITs (continued) | | | | | | | | | | | | | | | | |
Omega Healthcare Investors Incorporated | | | 4.50 | % | | | 1-15-2025 | | | $ | 175,000 | | | $ | 174,632 | |
The Geo Group Incorporated | | | 5.88 | | | | 10-15-2024 | | | | 100,000 | | | | 102,250 | |
| | | | |
| | | | | | | | | | | | | | | 744,222 | |
| | | | | | | | | | | | | | | | |
| | | | |
| Real Estate Management & Development: 0.88% | | | | | | | | | | | | | | | | |
CBRE Services Incorporated | | | 5.00 | | | | 3-15-2023 | | | | 250,000 | | | | 260,027 | |
Onex Corporation 144A | | | 7.75 | | | | 1-15-2021 | | | | 100,000 | | | | 101,750 | |
| | | | |
| | | | | | | | | | | | | | | 361,777 | |
| | | | | | | | | | | | | | | | |
| | | | |
Telecommunication Services: 2.61% | | | | | | | | | | | | | | | | |
| | | | |
| Diversified Telecommunication Services: 1.17% | | | | | | | | | | | | | | | | |
AT&T Incorporated | | | 5.25 | | | | 3-1-2037 | | | | 135,000 | | | | 137,494 | |
GCI Incorporated | | | 6.75 | | | | 6-1-2021 | | | | 90,000 | | | | 92,250 | |
Level 3 Financing Incorporated | | | 5.38 | | | | 5-1-2025 | | | | 150,000 | | | | 152,625 | |
SBA Communications Corporation | | | 4.88 | | | | 7-15-2022 | | | | 100,000 | | | | 101,500 | |
| | | | |
| | | | | | | | | | | | | | | 483,869 | |
| | | | | | | | | | | | | | | | |
| | | | |
| Wireless Telecommunication Services: 1.44% | | | | | | | | | | | | | | | | |
CC Holdings GS V LLC | | | 3.85 | | | | 4-15-2023 | | | | 265,000 | | | | 271,378 | |
Sprint Communications Incorporated 144A | | | 7.00 | | | | 3-1-2020 | | | | 150,000 | | | | 163,500 | |
T-Mobile USA Incorporated | | | 6.38 | | | | 3-1-2025 | | | | 20,000 | | | | 21,550 | |
T-Mobile USA Incorporated | | | 6.50 | | | | 1-15-2024 | | | | 100,000 | | | | 108,000 | |
T-Mobile USA Incorporated | | | 6.84 | | | | 4-28-2023 | | | | 25,000 | | | | 26,750 | |
| | | | |
| | | | | | | | | | | | | | | 591,178 | |
| | | | | | | | | | | | | | | | |
| | | | |
Utilities: 1.29% | | | | | | | | | | | | | | | | |
| | | | |
| Independent Power & Renewable Electricity Producers: 0.62% | | | | | | | | | | | | | | | | |
NSG Holdings LLC 144A | | | 7.75 | | | | 12-15-2025 | | | | 94,419 | | | | 101,501 | |
Pattern Energy Group Incorporated 144A | | | 5.88 | | | | 2-1-2024 | | | | 150,000 | | | | 151,875 | |
| | | | |
| | | | | | | | | | | | | | | 253,376 | |
| | | | | | | | | | | | | | | | |
| | | | |
| Multi-Utilities: 0.67% | | | | | | | | | | | | | | | | |
Puget Energy Incorporated | | | 5.63 | | | | 7-15-2022 | | | | 250,000 | | | | 276,584 | |
| | | | | | | | | | | | | | | | |
| | | | |
Total Corporate Bonds and Notes (Cost $14,575,516) | | | | | | | | | | | | | | | 14,813,855 | |
| | | | | | | | | | | | | | | | |
| | | | |
Foreign Corporate Bonds and Notes @: 2.77% | | | | | | | | | | | | | | | | |
| | | | |
Consumer Discretionary: 0.73% | | | | | | | | | | | | | | | | |
| | | | |
| Hotels, Restaurants & Leisure: 0.73% | | | | | | | | | | | | | | | | |
Schumann SpA 144A (EUR) | | | 7.00 | | | | 7-31-2023 | | | | 125,000 | | | | 135,194 | |
William Hill plc (GBP) | | | 4.88 | | | | 9-7-2023 | | | | 125,000 | | | | 163,034 | |
| | | | |
| | | | | | | | | | | | | | | 298,228 | |
| | | | | | | | | | | | | | | | |
| | | | |
Financials: 1.36% | | | | | | | | | | | | | | | | |
| | | | |
| Banks: 0.63% | | | | | | | | | | | | | | | | |
ABN AMRO Bank NV (EUR) | | | 6.38 | | | | 4-27-2021 | | | | 200,000 | | | | 259,864 | |
| | | | | | | | | | | | | | | | |
The accompanying notes are an integral part of these financial statements.
| | | | |
| 12 | | Wells Fargo Strategic Income Fund | | Portfolio of investments—March 31, 2017 (unaudited) |
| | | | | | | | | | | | | | | | |
| Security name | | Interest rate | | | Maturity date | | | Principal | | | Value | |
| | | | | | | | | | | | | | | | |
| | | | |
| Diversified Financial Services: 0.73% | | | | | | | | | | | | | | | | |
Arrow Global Finance plc 144A (GBP) | | | 5.13 | % | | | 9-15-2024 | | | | 125,000 | | | $ | 162,125 | |
Ineos Finance plc 144A (EUR) | | | 4.00 | | | | 5-1-2023 | | | | 125,000 | | | | 137,162 | |
| | | | |
| | | | | | | | | | | | | | | 299,287 | |
| | | | | | | | | | | | | | | | |
| | | | |
Materials: 0.34% | | | | | | | | | | | | | | | | |
| | | | |
| Paper & Forest Products: 0.34% | | | | | | | | | | | | | | | | |
Lecta SA 144A (EUR) | | | 6.50 | | | | 8-1-2023 | | | | 125,000 | | | | 139,242 | |
| | | | | | | | | | | | | | | | |
| | | | |
Telecommunication Services: 0.34% | | | | | | | | | | | | | | | | |
| | | | |
| Diversified Telecommunication Services: 0.34% | | | | | | | | | | | | | | | | |
SFR Group SA 144A (EUR) | | | 5.63 | | | | 5-15-2024 | | | | 125,000 | | | | 141,524 | |
| | | | | | | | | | | | | | | | |
| | | | |
Total Foreign Corporate Bonds and Notes (Cost $1,164,588) | | | | | | | | | | | | | | | 1,138,145 | |
| | | | | | | | | | | | | | | | |
| | | | |
Foreign Government Bonds @: 2.90% | | | | | | | | | | | | | | | | |
Brazil (BRL) | | | 10.00 | | | | 1-1-2027 | | | | 615,000 | | | | 196,087 | |
Colombia (COP) | | | 7.00 | | | | 9-11-2019 | | | | 720,000,000 | | | | 256,223 | |
Indonesia (IDR) | | | 7.88 | | | | 4-15-2019 | | | | 4,100,000,000 | | | | 314,450 | |
Mexico (MXN) | | | 4.75 | | | | 6-14-2018 | | | | 4,565,000 | | | | 238,722 | |
Republic of South Africa (ZAR) | | | 6.75 | | | | 3-31-2021 | | | | 2,600,000 | | | | 186,334 | |
| | | | |
Total Foreign Government Bonds (Cost $1,243,056) | | | | | | | | | | | | | | | 1,191,816 | |
| | | | | | | | | | | | | | | | |
| | | | |
Loans: 12.62% | | | | | | | | | | | | | | | | |
| | | | |
Consumer Discretionary: 3.33% | | | | | | | | | | | | | | | | |
| | | | |
| Auto Components: 0.21% | | | | | | | | | | | | | | | | |
Allison Transmission Incorporated ± | | | 2.99 | | | | 9-23-2022 | | | $ | 84,610 | | | | 85,256 | |
| | | | | | | | | | | | | | | | |
| | | | |
| Distributors: 0.74% | | | | | | | | | | | | | | | | |
Spin Holdco Incorporated ± | | | 4.29 | | | | 11-14-2019 | | | | 306,364 | | | | 306,199 | |
| | | | | | | | | | | | | | | | |
| | | | |
| Hotels, Restaurants & Leisure: 1.08% | | | | | | | | | | | | | | | | |
Belmond Interfin Limited ± | | | 4.15 | | | | 3-21-2021 | | | | 101,778 | | | | 101,842 | |
CCM Merger Incorporated ± | | | 4.23 | | | | 8-8-2021 | | | | 241,871 | | | | 242,979 | |
La Quinta Intermediate Holdings LLC ± | | | 3.77 | | | | 4-14-2021 | | | | 99,242 | | | | 99,759 | |
| | | | |
| | | | | | | | | | | | | | | 444,580 | |
| | | | | | | | | | | | | | | | |
| | | | |
| Household Products: 0.18% | | | | | | | | | | | | | | | | |
Anchor Glass Container Corporation ± | | | 4.25 | | | | 12-7-2023 | | | | 74,813 | | | | 75,234 | |
| | | | | | | | | | | | | | | | |
| | | | |
| Media: 0.79% | | | | | | | | | | | | | | | | |
Altice US Finance I Corporation ± | | | 3.98 | | | | 1-15-2025 | | | | 149,249 | | | | 148,970 | |
Learfield Communications Incorporated ± | | | 4.25 | | | | 12-1-2023 | | | | 149,625 | | | | 151,121 | |
Salem Communications Corporation ± | | | 4.50 | | | | 3-16-2020 | | | | 25,800 | | | | 25,187 | |
| | | | |
| | | | | | | | | | | | | | | 325,278 | |
| | | | | | | | | | | | | | | | |
| | | | |
| Specialty Retail: 0.33% | | | | | | | | | | | | | | | | |
Focus Brands Incorporated ± | | | 5.00 | | | | 10-3-2023 | | | | 133,402 | | | | 133,402 | |
| | | | | | | | | | | | | | | | |
The accompanying notes are an integral part of these financial statements.
| | | | | | |
| Portfolio of investments—March 31, 2017 (unaudited) | | Wells Fargo Strategic Income Fund | | | 13 | |
| | | | | | | | | | | | | | | | |
| Security name | | Interest rate | | | Maturity date | | | Principal | | | Value | |
| | | | | | | | | | | | | | | | |
| | | | |
Energy: 0.61% | | | | | | | | | | | | | | | | |
| | | | |
| Energy Equipment & Services: 0.30% | | | | | | | | | | | | | | | | |
ExGen Renewables I LLC ± | | | 5.27 | % | | | 2-14-2021 | | | $ | 15,589 | | | $ | 15,667 | |
Hummel Station LLC ± | | | 7.00 | | | | 10-27-2022 | | | | 112,613 | | | | 108,812 | |
| | | | |
| | | | | | | | | | | | | | | 124,479 | |
| | | | | | | | | | | | | | | | |
| | | | |
| Oil, Gas & Consumable Fuels: 0.31% | | | | | | | | | | | | | | | | |
Veresen Midstream LP ± | | | 4.50 | | | | 3-31-2022 | | | | 124,051 | | | | 125,136 | |
| | | | | | | | | | | | | | | | |
| | | | |
Financials: 0.85% | | | | | | | | | | | | | | | | |
| | | | |
| Diversified Financial Services: 0.36% | | | | | | | | | | | | | | | | |
LPL Holdings Incorporated < | | | 0.00 | | | | 3-10-2024 | | | | 150,000 | | | | 150,095 | |
| | | | | | | | | | | | | | | | |
| | | | |
| Insurance: 0.49% | | | | | | | | | | | | | | | | |
Alliant Holdings I LLC ± | | | 4.39 | | | | 8-12-2022 | | | | 199,493 | | | | 200,349 | |
| | | | | | | | | | | | | | | | |
| | | | |
Health Care: 2.02% | | | | | | | | | | | | | | | | |
| | | | |
| Health Care Equipment & Supplies: 0.61% | | | | | | | | | | | | | | | | |
Kinetic Concepts Incorporated ± | | | 4.40 | | | | 2-2-2024 | | | | 250,000 | | | | 250,000 | |
| | | | | | | | | | | | | | | | |
| | | | |
| Health Care Providers & Services: 0.52% | | | | | | | | | | | | | | | | |
Community Health Systems Incorporated ± | | | 4.05 | | | | 1-27-2021 | | | | 66,626 | | | | 65,677 | |
Surgery Center Holdings Incorporated ± | | | 4.75 | | | | 11-3-2020 | | | | 48,875 | | | | 49,395 | |
TeamHealth Incorporated ± | | | 3.75 | | | | 2-6-2024 | | | | 100,000 | | | | 99,208 | |
| | | | |
| | | | | | | | | | | | | | | 214,280 | |
| | | | | | | | | | | | | | | | |
| | | | |
| Health Care Technology: 0.61% | | | | | | | | | | | | | | | | |
Change Healthcare Holdings Incorporated ± | | | 3.75 | | | | 3-1-2024 | | | | 250,000 | | | | 250,313 | |
| | | | | | | | | | | | | | | | |
| | | | |
| Pharmaceuticals: 0.28% | | | | | | | | | | | | | | | | |
Valeant Pharmaceuticals International Incorporated ± | | | 5.57 | | | | 4-1-2022 | | | | 117,151 | | | | 117,410 | |
| | | | | | | | | | | | | | | | |
| | | | |
Industrials: 1.08% | | | | | | | | | | | | | | | | |
| | | | |
| Aerospace & Defense: 0.24% | | | | | | | | | | | | | | | | |
TransDigm Incorporated ± | | | 4.14 | | | | 6-4-2021 | | | | 99,235 | | | | 98,898 | |
| | | | | | | | | | | | | | | | |
| | | | |
| Commercial Services & Supplies: 0.57% | | | | | | | | | | | | | | | | |
KAR Auction Services Incorporated ± | | | 4.19 | | | | 3-9-2021 | | | | 133,053 | | | | 134,161 | |
Sedgwick Claims Management Services Incorporated ± | | | 3.75 | | | | 3-1-2021 | | | | 99,233 | | | | 99,078 | |
| | | | |
| | | | | | | | | | | | | | | 233,239 | |
| | | | | | | | | | | | | | | | |
| | | | |
| Transportation Infrastructure: 0.27% | | | | | | | | | | | | | | | | |
OSG Bulk Ships Incorporated ± | | | 5.29 | | | | 8-5-2019 | | | | 11,865 | | | | 11,746 | |
OSG International Incorporated ± | | | 5.79 | | | | 8-5-2019 | | | | 98,513 | | | | 98,206 | |
| | | | |
| | | | | | | | | | | | | | | 109,952 | |
| | | | | | | | | | | | | | | | |
| | | | |
Information Technology: 2.12% | | | | | | | | | | | | | | | | |
| | | | |
| Electronic Equipment, Instruments & Components: 0.97% | | | | | | | | | | | | | | | | |
Dell International LLC < | | | 0.00 | | | | 9-7-2023 | | | | 400,000 | | | | 401,332 | |
| | | | | | | | | | | | | | | | |
The accompanying notes are an integral part of these financial statements.
| | | | |
| 14 | | Wells Fargo Strategic Income Fund | | Portfolio of investments—March 31, 2017 (unaudited) |
| | | | | | | | | | | | | | | | |
| Security name | | Interest rate | | | Maturity date | | | Principal | | | Value | |
| | | | | | | | | | | | | | | | |
| | | | |
| Internet Software & Services: 0.35% | | | | | | | | | | | | | | | | |
Applied Systems Incorporated ± | | | 4.40 | % | | | 1-25-2021 | | | $ | 142,848 | | | $ | 143,526 | |
| | | | | | | | | | | | | | | | |
| | | | |
| IT Services: 0.80% | | | | | | | | | | | | | | | | |
First Data Corporation ± | | | 3.98 | | | | 7-10-2022 | | | | 326,534 | | | | 328,914 | |
| | | | | | | | | | | | | | | | |
| | | | |
Materials: 0.58% | | | | | | | | | | | | | | | | |
| | | | |
| Containers & Packaging: 0.58% | | | | | | | | | | | | | | | | |
Berry Plastics Corporation ± | | | 3.50 | | | | 10-1-2022 | | | | 89,974 | | | | 90,498 | |
Reynolds Group Holdings Incorporated ± | | | 3.98 | | | | 2-5-2023 | | | | 149,251 | | | | 149,764 | |
| | | | |
| | | | | | | | | | | | | | | 240,262 | |
| | | | | | | | | | | | | | | | |
| | | | |
Real Estate: 0.68% | | | | | | | | | | | | | | | | |
| | | | |
| Equity REITs: 0.49% | | | | | | | | | | | | | | | | |
The Geo Group Incorporated < | | | 0.00 | | | | 3-17-2024 | | | | 200,000 | | | | 200,876 | |
| | | | | | | | | | | | | | | | |
| | | | |
| Real Estate Management & Development: 0.19% | | | | | | | | | | | | | | | | |
Capital Automotive LP ± | | | 4.00 | | | | 3-17-2024 | | | | 77,825 | | | | 78,603 | |
| | | | | | | | | | | | | | | | |
| | | | |
Telecommunication Services: 1.35% | | | | | | | | | | | | | | | | |
| | | | |
| Diversified Telecommunication Services: 0.82% | | | | | | | | | | | | | | | | |
Intelsat Jackson Holdings SA ± | | | 3.89 | | | | 6-30-2019 | | | | 240,332 | | | | 235,059 | |
Level 3 Financing Incorporated ± | | | 3.23 | | | | 2-22-2024 | | | | 101,410 | | | | 101,537 | |
| | | | |
| | | | | | | | | | | | | | | 336,596 | |
| | | | | | | | | | | | | | | | |
| | | | |
| Wireless Telecommunication Services: 0.53% | | | | | | | | | | | | | | | | |
Syniverse Holdings Incorporated ± | | | 4.00 | | | | 4-23-2019 | | | | 236,570 | | | | 216,831 | |
| | | | | | | | | | | | | | | | |
| | | | |
Total Loans (Cost $5,215,625) | | | | | | | | | | | | | | | 5,191,040 | |
| | | | | | | | | | | | | | | | |
| | | | |
Municipal Obligations: 1.84% | | | | | | | | | | | | | | | | |
| | | | |
| Idaho: 0.11% | | | | | | | | | | | | | | | | |
Idaho Housing & Finance Association Legacy Public Charter School Series B (Education Revenue) | | | 7.00 | | | | 5-1-2017 | | | | 45,000 | | | | 44,983 | |
| | | | | | | | | | | | | | | | |
| | | | |
| Illinois: 0.78% | | | | | | | | | | | | | | | | |
Chicago IL Refunding Bonds Taxable Project Series E (GO Revenue) | | | 6.05 | | | | 1-1-2029 | | | | 200,000 | | | | 198,084 | |
Chicago IL Transit Authority Taxable Pension Funding Series A (Tax Revenue) | | | 6.90 | | | | 12-1-2040 | | | | 100,000 | | | | 124,629 | |
| | | | |
| | | | | | | | | | | | | | | 322,713 | |
| | | | | | | | | | | | | | | | |
| | | | |
| Michigan: 0.12% | | | | | | | | | | | | | | | | |
Wayne County MI Series 2016 (GO Revenue) | | | 4.25 | | | | 12-1-2018 | | | | 47,000 | | | | 47,645 | |
| | | | | | | | | | | | | | | | |
| | | | |
| New York: 0.24% | | | | | | | | | | | | | | | | |
Oyster Bay NY (GO Revenue) | | | 3.25 | | | | 2-1-2018 | | | | 100,000 | | | | 100,117 | |
| | | | | | | | | | | | | | | | |
| | | | | | | | | | | | | | | | |
| | | | |
| Texas: 0.59% | | | | | | | | | | | | | | | | |
North Texas Tollway Authority Build America Bonds Sub Lien Series B-2 (Transportation Revenue) | | | 8.91 | | | | 2-1-2030 | | | | 210,000 | | | | 242,920 | |
| | | | | | | | | | | | | | | | |
| | | | |
Total Municipal Obligations (Cost $771,351) | | | | | | | | | | | | | | | 758,378 | |
| | | | | | | | | | | | | | | | |
The accompanying notes are an integral part of these financial statements.
| | | | | | |
| Portfolio of investments—March 31, 2017 (unaudited) | | Wells Fargo Strategic Income Fund | | | 15 | |
| | | | | | | | | | | | | | | | |
| Security name | | Interest rate | | | Maturity date | | | Principal | | | Value | |
| | | | | | | | | | | | | | | | |
| | | | |
Non-Agency Mortgage-Backed Securities: 11.48% | | | | | | | | | | | | | | | | |
321 Henderson Receivables LLC Series 2015-2A Class A 144A | | | 3.87 | % | | | 3-15-2058 | | | $ | 438,687 | | | $ | 435,309 | |
ACAS CLO Limited Trust Series 2015-1A Class B 144A± | | | 3.12 | | | | 4-18-2027 | | | | 500,000 | | | | 499,996 | |
BB-UBS Trust Series 2012-TFT Class C 144A± | | | 3.47 | | | | 6-5-2030 | | | | 150,000 | | | | 144,484 | |
BCC Funding Corporation Series 2016-1 Class B 144A | | | 2.73 | | | | 4-20-2022 | | | | 400,000 | | | | 394,943 | |
Chicago Skyscraper Trust Series 2017-SKY Class C 144A± | | | 2.16 | | | | 4-15-2030 | | | | 436,000 | | | | 436,807 | |
Citi Held For Asset Issuance Trust Series 2015-PM3 Class B 144A | | | 4.31 | | | | 5-16-2022 | | | | 450,000 | | | | 454,670 | |
Commercial Mortgage Trust Series 2015-LC23 Class C ± | | | 4.65 | | | | 10-10-2048 | | | | 300,000 | | | | 294,033 | |
FREMF Mortgage Trust Series 2017-K724 Class B 144A± | | | 3.50 | | | | 11-25-2023 | | | | 400,000 | | | | 378,309 | |
GS Mortgage Securities Trust Series 2014-GC24 Class D 144A± | | | 4.53 | | | | 9-10-2047 | | | | 325,000 | | | | 253,912 | |
JPMBB Commercial Mortgage Securities Trust Series 2014-C19 Class D 144A± | | | 4.67 | | | | 4-15-2047 | | | | 493,000 | | | | 435,052 | |
Longtrain Leasing III LLC Series 2015-1A Class A2 144A | | | 4.06 | | | | 1-15-2045 | | | | 500,000 | | | | 479,363 | |
Textainer Marine Containers Limited Series 2014-1A Class A 144A | | | 3.27 | | | | 10-20-2039 | | | | 530,833 | | | | 518,847 | |
| | | | |
Total Non-Agency Mortgage-Backed Securities (Cost $4,784,357) | | | | | | | | | | | | | | | 4,725,725 | |
| | | | | | | | | | | | | | | | |
| | | | |
| | | | | | Expiration date | | | Shares | | | | |
Rights: 0.02% | | | | | | | | | | | | | | | | |
| | | | |
Utilities: 0.02% | | | | | | | | | | | | | | | | |
| | | | |
| Electric Utilities: 0.02% | | | | | | | | | | | | | | | | |
Texas Competitive Electric Holdings Company LLC Rights †(i) | | | | | | | 10-10-2024 | | | | 6,516 | | | | 7,331 | |
| | | | | | | | | | | | | | | | |
| | | | |
Total Rights (Cost $7,168) | | | | | | | | | | | | | | | 7,331 | |
| | | | | | | | | | | | | | | | |
| | | | |
| | | | | | Maturity date | | | Principal | | | | |
U.S. Treasury Securities: 0.30% | | | | | | | | | | | | | | | | |
U.S. Treasury Note | | | 1.63 | | | | 2-15-2026 | | | $ | 130,000 | | | | 122,210 | |
| | | | | | | | | | | | | | | | |
| | | | |
Total U.S. Treasury Securities (Cost $126,823) | | | | | | | | | | | | | | | 122,210 | |
| | | | | | | | | | | | | | | | |
| | | | |
Yankee Corporate Bonds and Notes: 8.27% | | | | | | | | | | | | | | | | |
| | | | |
Consumer Staples: 0.37% | | | | | | | | | | | | | | | | |
| | | | |
| Food & Staples Retailing: 0.37% | | | | | | | | | | | | | | | | |
Delhaize Group SA | | | 5.70 | | | | 10-1-2040 | | | | 135,000 | | | | 153,860 | |
| | | | | | | | | | | | | | | | |
| | | | |
Energy: 0.79% | | | | | | | | | | | | | | | | |
| | | | |
| Oil, Gas & Consumable Fuels: 0.79% | | | | | | | | | | | | | | | | |
Comision Federal de Electric 144A | | | 4.75 | | | | 2-23-2027 | | | | 250,000 | | | | 250,625 | |
Teekay Corporation | | | 8.50 | | | | 1-15-2020 | | | | 75,000 | | | | 74,250 | |
| | | | |
| | | | | | | | | | | | | | | 324,875 | |
| | | | | | | | | | | | | | | | |
| | | | |
Financials: 5.07% | | | | | | | | | | | | | | | | |
| | | | |
| Banks: 3.74% | | | | | | | | | | | | | | | | |
BNP Paribas 144A | | | 3.80 | | | | 1-10-2024 | | | | 200,000 | | | | 198,982 | |
BPCE SA 144A | | | 5.15 | | | | 7-21-2024 | | | | 305,000 | | | | 313,226 | |
Credit Agricole SA 144A± | | | 8.13 | | | | 12-29-2049 | | | | 265,000 | | | | 282,225 | |
Intesa Sanpaolo SpA 144A | | | 5.71 | | | | 1-15-2026 | | | | 135,000 | | | | 130,816 | |
Nielsen Holding and Finance BV 144A | | | 5.50 | | | | 10-1-2021 | | | | 100,000 | | | | 103,875 | |
Perrigo Finance Unlimited Company | | | 4.38 | | | | 3-15-2026 | | | | 250,000 | | | | 254,257 | |
The accompanying notes are an integral part of these financial statements.
| | | | |
| 16 | | Wells Fargo Strategic Income Fund | | Portfolio of investments—March 31, 2017 (unaudited) |
| | | | | | | | | | | | | | | | |
| Security name | | Interest rate | | | Maturity date | | | Principal | | | Value | |
| | | | | | | | | | | | | | | | |
| | | | |
| Banks (continued) | | | | | | | | | | | | | | | | |
UBS Group Funding (Jersey) Limited 144A | | | 4.13 | % | | | 9-24-2025 | | | $ | 250,000 | | | $ | 254,206 | |
| | | | |
| | | | | | | | | | | | | | | 1,537,587 | |
| | | | | | | | | | | | | | | | |
| | | | |
| Capital Markets: 0.63% | | | | | | | | | | | | | | | | |
Credit Suisse Group AG 144A | | | 3.57 | | | | 1-9-2023 | | | | 260,000 | | | | 259,477 | |
| | | | | | | | | | | | | | | | |
| | | | |
| Diversified Financial Services: 0.70% | | | | | | | | | | | | | | | | |
Deutsche Bank AG | | | 6.00 | | | | 9-1-2017 | | | | 285,000 | | | | 289,962 | |
| | | | | | | | | | | | | | | | |
| | | | |
Health Care: 0.71% | | | | | | | | | | | | | | | | |
| | | | |
| Pharmaceuticals: 0.71% | | | | | | | | | | | | | | | | |
Teva Pharmaceutical Finance BV | | | 2.20 | | | | 7-21-2021 | | | | 265,000 | | | | 254,960 | |
Valeant Pharmaceuticals International Incorporated 144A | | | 6.13 | | | | 4-15-2025 | | | | 50,000 | | | | 38,500 | |
| | | | |
| | | | | | | | | | | | | | | 293,460 | |
| | | | | | | | | | | | | | | | |
| | | | |
Industrials: 1.00% | | | | | | | | | | | | | | | | |
| | | | |
| Commercial Services & Supplies: 0.50% | | | | | | | | | | | | | | | | |
GFL Environmental Incorporated 144A | | | 7.88 | | | | 4-1-2020 | | | | 50,000 | | | | 51,875 | |
Ritchie Brothers Auctioneers Incorporated 144A | | | 5.38 | | | | 1-15-2025 | | | | 150,000 | | | | 153,375 | |
| | | | |
| | | | | | | | | | | | | | | 205,250 | |
| | | | | | | | | | | | | | | | |
| | | | |
| Professional Services: 0.50% | | | | | | | | | | | | | | | | |
IHS Markit Limited 144A | | | 4.75 | | | | 2-15-2025 | | | | 200,000 | | | | 206,000 | |
| | | | | | | | | | | | | | | | |
| | | | |
Telecommunication Services: 0.33% | | | | | | | | | | | | | | | | |
| | | | |
| Diversified Telecommunication Services: 0.33% | | | | | | | | | | | | | | | | |
Intelsat Jackson Holdings SA | | | 5.50 | | | | 8-1-2023 | | | | 100,000 | | | | 82,125 | |
Intelsat Luxembourg SA | | | 8.13 | | | | 6-1-2023 | | | | 85,000 | | | | 51,372 | |
| | | | |
| | | | | | | | | | | | | | | 133,497 | |
| | | | | | | | | | | | | | | | |
| | | | |
Total Yankee Corporate Bonds and Notes (Cost $3,424,884) | | | | | | | | | | | | | | | 3,403,968 | |
| | | | | | | | | | | | | | | | |
| | | | |
Yankee Government Bonds: 4.08% | | | | | | | | | | | | | | | | |
Arab Republic of Egypt 144A | | | 6.13 | | | | 1-31-2022 | | | | 200,000 | | | | 208,000 | |
Bermuda 144A | | | 3.72 | | | | 1-25-2027 | | | | 250,000 | | | | 240,633 | |
Federal Democratic Republic of Ethiopia | | | 6.63 | | | | 12-11-2024 | | | | 200,000 | | | | 191,856 | |
Republic of Honduras | | | 6.25 | | | | 1-19-2027 | | | | 200,000 | | | | 202,424 | |
Republic of Ghana | | | 9.25 | | | | 9-15-2022 | | | | 200,000 | | | | 208,000 | |
Republic of Sri Lanka | | | 5.75 | | | | 1-18-2022 | | | | 200,000 | | | | 205,208 | |
Socialist Republic of Vietnam | | | 4.80 | | | | 11-19-2024 | | | | 200,000 | | | | 203,839 | |
The Dominican Republic | | | 6.88 | | | | 1-29-2026 | | | | 200,000 | | | | 219,000 | |
| | | | |
Total Yankee Government Bonds (Cost $1,645,331) | | | | | | | | | | | | | | | 1,678,960 | |
| | | | | | | | | | | | | | | | |
| | | | |
| | | Yield | | | | | | Shares | | | | |
Short-Term Investments: 9.48% | | | | | | | | | | | | | | | | |
| | | | |
| Investment Companies: 8.97% | | | | | | | | | | | | | | | | |
Securities Lending Cash Investment LLC (l)(r)(u) | | | 0.98 | | | | | | | | 108,289 | | | | 108,300 | |
Wells Fargo Government Money Market Fund Select Class (l)(u)## | | | 0.63 | | | | | | | | 3,584,787 | | | | 3,584,787 | |
| | | | |
| | | | | | | | | | | | | | | 3,693,087 | |
| | | | | | | | | | | | | | | | |
The accompanying notes are an integral part of these financial statements.
| | | | | | |
| Portfolio of investments—March 31, 2017 (unaudited) | | Wells Fargo Strategic Income Fund | | | 17 | |
| | | | | | | | | | | | | | | | |
| Security name | | Yield | | | Maturity date | | | Principal | | | Value | |
| | | | | | | | | | | | | | | | |
| U.S. Treasury Securities: 0.51% | | | | | | | | | | | | | | | | |
U.S. Treasury Bill #(z) | | | 0.72 | % | | | 6-15-2017 | | | $ | 210,000 | | | $ | 209,692 | |
| | | | | | | | | | | | | | | | |
| | | | |
Total Short-Term Investments (Cost $3,902,767) | | | | | | | | | | | | | | | 3,902,779 | |
| | | | | | | | | | | | | | | | |
| | | | | | | | |
| Total investments in securities (Cost $40,313,417) * | | | 97.50 | % | | | 40,117,481 | |
Other assets and liabilities, net | | | 2.50 | | | | 1,030,412 | |
| | | | | | | | |
| Total net assets | | | 100.00 | % | | $ | 41,147,893 | |
| | | | | | | | |
| 144A | The security may be resold in transactions exempt from registration, normally to qualified institutional buyers, pursuant to Rule 144A under the Securities Act of 1933. |
| ± | Variable rate investment. The rate shown is the rate in effect at period end. |
| ¥ | A payment-in-kind (PIK) security is a security in which the issuer may make interest or dividend payments in cash or additional securities. These additional securities generally have the same terms as the original holdings. |
| « | All or a portion of this security is on loan. |
| %% | The security is issued on a when-issued basis. |
| @ | Foreign bond principal is denominated in the local currency of the issuer. |
| < | All or a portion of the position represents an unfunded loan commitment. |
| † | Non-income-earning security |
| (l) | The issuer of the security is an affiliated person of the Fund as defined in the Investment Company Act of 1940. |
| (r) | The investment is a non-registered investment vehicle purchased with cash collateral received from securities on loan. |
| (u) | The rate represents the 7-day annualized yield at period end. |
| ## | All or a portion of this security is segregated for when-issued securities and unfunded loans. |
| # | All or a portion of this security is segregated as collateral for investments in derivative instruments. |
| (z) | Zero coupon security. The rate represents the current yield to maturity. |
| * | Cost for federal income tax purposes is $40,316,223 and unrealized gains (losses) consists of: |
| | | | |
Gross unrealized gains | | $ | 453,990 | |
Gross unrealized losses | | | (652,732 | ) |
| | | | |
Net unrealized losses | | $ | (198,742 | ) |
The accompanying notes are an integral part of these financial statements.
| | | | |
| 18 | | Wells Fargo Strategic Income Fund | | Statement of assets and liabilities—March 31, 2017 (unaudited) |
| | | | |
| | | | |
| |
Assets | | | | |
Investments | | | | |
In unaffiliated securities (including $106,102 of securities loaned), at value (cost $36,620,330) | | $ | 36,424,394 | |
In affiliated securities, at value (cost $3,693,087) | | | 3,693,087 | |
| | | | |
Total investments, at value (cost $40,313,417) | | | 40,117,481 | |
Cash | | | 54,502 | |
Foreign currency, at value (cost $6,670) | | | 6,560 | |
Receivable for investments sold | | | 85,757 | |
Receivable for Fund shares sold | | | 1,447,254 | |
Receivable for interest | | | 346,215 | |
Receivable for daily variation margin on open futures contracts | | | 313 | |
Receivable for securities lending income | | | 42 | |
Unrealized gains on forward foreign currency contracts | | | 17,460 | |
Receivable from manager | | | 7,493 | |
Prepaid expenses and other assets | | | 48,532 | |
| | | | |
Total assets | | | 42,131,609 | |
| | | | |
| |
Liabilities | | | | |
Payable for investments purchased | | | 778,938 | |
Unrealized losses on forward foreign currency contracts | | | 8,501 | |
Payable upon receipt of securities loaned | | | 108,300 | |
Payable for daily variation margin on open futures contracts | | | 8,906 | |
Distribution fee payable | | | 309 | |
Administration fees payable | | | 2,849 | |
Accrued expenses and other liabilities | | | 75,913 | |
| | | | |
Total liabilities | | | 983,716 | |
| | | | |
Total net assets | | $ | 41,147,893 | |
| | | | |
| |
NET ASSETS CONSIST OF | | | | |
Paid-in capital | | $ | 42,657,168 | |
Undistributed net investment income | | | 281,939 | |
Accumulated net realized losses on investments | | | (1,610,468 | ) |
Net unrealized losses on investments | | | (180,746 | ) |
| | | | |
Total net assets | | $ | 41,147,893 | |
| | | | |
| |
COMPUTATION OF NET ASSET VALUE AND OFFERING PRICE PER SHARE | | | | |
Net assets – Class A | | $ | 1,533,771 | |
Shares outstanding – Class A1 | | | 163,548 | |
Net asset value per share – Class A | | | $9.38 | |
Maximum offering price per share – Class A2 | | | $9.77 | |
Net assets – Class C | | $ | 364,903 | |
Shares outstanding – Class C1 | | | 39,117 | |
Net asset value per share – Class C | | | $9.33 | |
Net assets – Administrator Class | | $ | 477,747 | |
Shares outstanding – Administrator Class1 | | | 50,832 | |
Net asset value per share – Administrator Class | | | $9.40 | |
Net assets – Institutional Class | | $ | 38,771,472 | |
Shares outstanding – Institutional Class1 | | | 4,132,349 | |
Net asset value per share – Institutional Class | | | $9.38 | |
| 1 | The Fund has an unlimited number of authorized shares. |
| 2 | Maximum offering price is computed as 100/96 of net asset value. On investments of $50,000 or more, the offering price is reduced. |
The accompanying notes are an integral part of these financial statements.
| | | | | | |
| Statement of operations—six months ended March 31, 2017 (unaudited) | | Wells Fargo Strategic Income Fund | | | 19 | |
| | | | |
| | | | |
| |
Investment income | | | | |
Interest (net of foreign interest withholding taxes of $3,662) | | $ | 613,220 | |
Dividends | | | 15,117 | |
Income from affiliated securities | | | 5,815 | |
Securities lending income, net | | | 242 | |
| | | | |
Total investment income | | | 634,394 | |
| | | | |
| |
Expenses | | | | |
Management fee | | | 73,845 | |
Administration fees | | | | |
Class A | | | 1,101 | |
Class C | | | 587 | |
Administrator Class | | | 243 | |
Institutional Class | | | 10,214 | |
Shareholder servicing fees | | | | |
Class A | | | 1,720 | |
Class C | | | 918 | |
Administrator Class | | | 609 | |
Distribution fee | | | | |
Class C | | | 2,753 | |
Custody and accounting fees | | | 43,782 | |
Professional fees | | | 26,368 | |
Registration fees | | | 29,222 | |
Shareholder report expenses | | | 25,229 | |
Trustees’ fees and expenses | | | 7,984 | |
Other fees and expenses | | | 5,485 | |
| | | | |
Total expenses | | | 230,060 | |
Less: Fee waivers and/or expense reimbursements | | | (139,383 | ) |
| | | | |
Net expenses | | | 90,677 | |
| | | | |
Net investment income | | | 543,717 | |
| | | | |
| |
REALIZED AND UNREALIZED GAINS (LOSSES) ON INVESTMENTS | | | | |
| |
Net realized gains (losses) on: | | | | |
Unaffiliated securities | | | (148,559 | ) |
Futures transactions | | | 246,693 | |
Forward foreign currency contract transactions | | | (48,952 | ) |
| | | | |
Net realized gains on investments | | | 49,182 | |
| | | | |
| |
Net change in unrealized gains (losses) on: | | | | |
Unaffiliated securities | | | 65,030 | |
Futures transactions | | | 19,119 | |
Forward foreign currency contract transactions | | | 59,059 | |
| | | | |
Net change in unrealized gains (losses) on investments | | | 143,208 | |
| | | | |
Net realized and unrealized gains (losses) on investments | | | 192,390 | |
| | | | |
Net increase in net assets resulting from operations | | $ | 736,107 | |
| | | | |
The accompanying notes are an integral part of these financial statements.
| | | | |
| 20 | | Wells Fargo Strategic Income Fund | | Statement of changes in net assets |
| | | | | | | | | | | | | | | | | | | | | | | | |
| | | Six months ended
March 31, 2017
(unaudited) | | | Year ended
September 30, 20161 | | | Year ended
October 31, 2015 | |
| | | | | | |
Operations | | | | | | | | | | | | | | | | | | | | | | | | |
Net investment income | | | | | | $ | 543,717 | | | | | | | $ | 890,629 | | | | | | | $ | 1,317,175 | |
Net realized gains (losses) on investments | | | | | | | 49,182 | | | | | | | | (919,157 | ) | | | | | | | (1,296,981 | ) |
Net change in unrealized gains (losses) on investments | | | | | | | 143,208 | | | | | | | | 988,102 | | | | | | | | (666,689 | ) |
| | | | |
Net increase (decrease) in net assets resulting from operations | | | | | | | 736,107 | | | | | | | | 959,574 | | | | | | | | (646,495 | ) |
| | | | |
| | | | | | |
Distributions to shareholders from | | | | | | | | | | | | | | | | | | | | | | | | |
Net investment income | | | | | | | | | | | | | | | | | | | | | | | | |
Class A | | | | | | | (14,956 | ) | | | | | | | (13,014 | ) | | | | | | | (21,334 | ) |
Class C | | | | | | | (7,769 | ) | | | | | | | (6,442 | ) | | | | | | | (14,917 | ) |
Administrator Class | | | | | | | (5,975 | ) | | | | | | | (7,355 | ) | | | | | | | (12,399 | ) |
Institutional Class | | | | | | | (282,116 | ) | | | | | | | (365,738 | ) | | | | | | | (935,496 | ) |
Tax basis return of capital | | | | | | | | | | | | | | | | | | | | | | | | |
Class A | | | | | | | 0 | | | | | | | | (5,130 | ) | | | | | | | (2,416 | ) |
Class C | | | | | | | 0 | | | | | | | | (2,540 | ) | | | | | | | (1,689 | ) |
Administrator Class | | | | | | | 0 | | | | | | | | (2,900 | ) | | | | | | | (1,404 | ) |
Institutional Class | | | | | | | 0 | | | | | | | | (144,185 | ) | | | | | | | (105,941 | ) |
| | | | |
Total distributions to shareholders | | | | | | | (310,816 | ) | | | | | | | (547,304 | ) | | | | | | | (1,095,596 | ) |
| | | | |
| | | | | | |
Capital share transactions | | | Shares | | | | | | | | Shares | | | | | | | | Shares | | | | | |
Proceeds from shares sold | | | | | | | | | | | | | | | | | | | | | | | | |
Class A | | | 266,825 | | | | 2,480,570 | | | | 117,382 | | | | 1,055,716 | | | | 44,768 | | | | 426,513 | |
Class C | | | 10,397 | | | | 95,740 | | | | 12,099 | | | | 109,873 | | | | 5,907 | | | | 55,667 | |
Administrator Class | | | 48,560 | | �� | | 455,420 | | | | 9,037 | | | | 83,300 | | | | 0 | | | | 0 | |
Institutional Class | | | 1,842,213 | | | | 17,242,802 | | | | 621,194 | | | | 5,533,801 | | | | 190,379 | | | | 1,736,500 | |
| | | | |
| | | | | | | 20,274,532 | | | | | | | | 6,782,690 | | | | | | | | 2,218,680 | |
| | | | |
Reinvestment of distributions | | | | | | | | | | | | | | | | | | | | | | | | |
Class A | | | 1,617 | | | | 14,847 | | | | 1,995 | | | | 17,957 | | | | 2,260 | | | | 21,553 | |
Class C | | | 848 | | | | 7,769 | | | | 979 | | | | 8,774 | | | | 1,740 | | | | 16,606 | |
Administrator Class | | | 648 | | | | 5,975 | | | | 1,137 | | | | 10,255 | | | | 1,443 | | | | 13,803 | |
Institutional Class | | | 30,741 | | | | 282,116 | | | | 56,806 | | | | 509,923 | | | | 109,213 | | | | 1,041,437 | |
| | | | |
| | | | | | | 310,707 | | | | | | | | 546,909 | | | | | | | | 1,093,399 | |
| | | | |
Payment for shares redeemed | | | | | | | | | | | | | | | | | | | | | | | | |
Class A | | | (218,087 | ) | | | (2,029,930 | ) | | | (107,748 | ) | | | (971,689 | ) | | | (18,900 | ) | | | (178,898 | ) |
Class C | | | (55,223 | ) | | | (514,066 | ) | | | (8,141 | ) | | | (73,072 | ) | | | (15,520 | ) | | | (148,738 | ) |
Administrator Class | | | (62,652 | ) | | | (588,268 | ) | | | (14 | ) | | | (129 | ) | | | (4,192 | ) | | | (39,990 | ) |
Institutional Class | | | (249,050 | ) | | | (2,330,209 | ) | | | (90,476 | ) | | | (795,724 | ) | | | (2,358,709 | ) | | | (22,270,242 | ) |
| | | | |
| | | | | | | (5,462,473 | ) | | | | | | | (1,840,614 | ) | | | | | | | (22,637,868 | ) |
| | | | |
Net increase (decrease) in net assets resulting from capital share transactions | | | | | | | 15,122,766 | | | | | | | | 5,488,985 | | | | | | | | (19,325,789 | ) |
| | | | | | | | | | | | | | | | | | | | | | | | |
Total increase (decrease) in net assets | | | | | | | 15,548,057 | | | | | | | | 5,901,255 | | | | | | | | (21,067,880 | ) |
| | | | | | | | | | | | | | | | | | | | | | | | |
| | | | | | |
Net assets | | | | | | | | | | | | | | | | | | | | | | | | |
Beginning of period | | | | | | | 25,599,836 | | | | | | | | 19,698,581 | | | | | | | | 40,766,461 | |
| | | | |
End of period | | | | | | $ | 41,147,893 | | | | | | | $ | 25,599,836 | | | | | | | $ | 19,698,581 | |
| | | | |
Undistributed net investment income | | | | | | $ | 281,939 | | | | | | | $ | 49,038 | | | | | | | $ | 44,882 | |
| | | | |
| 1 | For the eleven months ended September 30, 2016. The Fund changed its fiscal year end from October 31 to September 30, effective September 30, 2016. |
The accompanying notes are an integral part of these financial statements.
| | | | | | |
| Financial highlights | | Wells Fargo Strategic Income Fund | | | 21 | |
(For a share outstanding throughout each period)
| | | | | | | | | | | | | | | | | | | | |
| | | Six months ended
March 31, 2017
(unaudited) | | | Year ended
September 30, 20161 | | | Year ended October 31 | |
| CLASS A | | | | 2015 | | | 2014 | | | 20132 | |
Net asset value, beginning of period | | | $9.25 | | | | $9.13 | | | | $9.72 | | | | $9.66 | | | | $10.00 | |
Net investment income | | | 0.15 | | | | 0.31 | | | | 0.34 | | | | 0.37 | | | | 0.27 | |
Net realized and unrealized gains (losses) on investments | | | 0.08 | | | | (0.01 | ) | | | (0.69 | ) | | | (0.05 | ) | | | (0.36 | ) |
| | | | | | | | | | | | | | | | | | | | |
Total from investment operations | | | 0.23 | | | | 0.30 | | | | (0.35 | ) | | | 0.32 | | | | (0.09 | ) |
Distributions to shareholders from | | | | | | | | | | | | | | | | | | | | |
Net investment income | | | (0.10 | ) | | | (0.13 | ) | | | (0.22 | ) | | | (0.26 | ) | | | (0.25 | ) |
Tax basis return of capital | | | 0.00 | | | | (0.05 | ) | | | (0.02 | ) | | | 0.00 | | | | 0.00 | |
| | | | | | | | | | | | | | | | | | | | |
Total distributions to shareholders | | | (0.10 | ) | | | (0.18 | ) | | | (0.24 | ) | | | (0.26 | ) | | | (0.25 | ) |
Net asset value, end of period | | | $9.38 | | | | $9.25 | | | | $9.13 | | | | $9.72 | | | | $9.66 | |
Total return3 | | | 2.56 | % | | | 3.34 | % | | | (3.64 | )% | | | 3.36 | % | | | (0.89 | )% |
Ratios to average net assets (annualized) | | | | | | | | | | | | | | | | | | | | |
Gross expenses | | | 1.94 | % | | | 1.80 | % | | | 1.63 | % | | | 1.51 | % | | | 1.85 | % |
Net expenses | | | 0.90 | % | | | 0.90 | % | | | 0.90 | % | | | 0.90 | % | | | 0.90 | % |
Net investment income | | | 3.64 | % | | | 3.85 | % | | | 3.77 | % | | | 4.02 | % | | | 3.76 | % |
Supplemental data | | | | | | | | | | | | | | | | | | | | |
Portfolio turnover rate | | | 22 | % | | | 52 | % | | | 53 | % | | | 51 | % | | | 39 | % |
Net assets, end of period (000s omitted) | | | $1,534 | | | | $1,047 | | | | $928 | | | | $714 | | | | $518 | |
| 1 | For the eleven months ended September 30, 2016. The Fund changed its fiscal year end from October 31 to September 30, effective September 30, 2016. |
| 2 | For the period from January 31, 2013 (commencement of class operations) to October 31, 2013 |
| 3 | Total return calculations do not include any sales charges. Returns for periods of less than one year are not annualized. |
The accompanying notes are an integral part of these financial statements.
| | | | |
| 22 | | Wells Fargo Strategic Income Fund | | Financial highlights |
(For a share outstanding throughout each period)
| | | | | | | | | | | | | | | | | | | | |
| | | Six months ended
March 31, 2017
(unaudited) | | | Year ended
September 30, 20161 | | | Year ended October 31 | |
| CLASS C | | | | 2015 | | | 2014 | | | 20132 | |
Net asset value, beginning of period | | | $9.22 | | | | $9.10 | | | | $9.71 | | | | $9.65 | | | | $10.00 | |
Net investment income | | | 0.13 | 3 | | | 0.25 | | | | 0.28 | | | | 0.31 | | | | 0.21 | |
Net realized and unrealized gains (losses) on investments | | | 0.07 | | | | (0.02 | ) | | | (0.68 | ) | | | (0.06 | ) | | | (0.37 | ) |
| | | | | | | | | | | | | | | | | | | | |
Total from investment operations | | | 0.20 | | | | 0.23 | | | | (0.40 | ) | | | 0.25 | | | | (0.16 | ) |
Distributions to shareholders from | | | | | | | | | | | | | | | | | | | | |
Net investment income | | | (0.09 | ) | | | (0.08 | ) | | | (0.19 | ) | | | (0.19 | ) | | | (0.19 | ) |
Tax basis return of capital | | | 0.00 | | | | (0.03 | ) | | | (0.02 | ) | | | 0.00 | | | | 0.00 | |
| | | | | | | | | | | | | | | | | | | | |
Total distributions to shareholders | | | (0.09 | ) | | | (0.11 | ) | | | (0.21 | ) | | | (0.19 | ) | | | (0.19 | ) |
Net asset value, end of period | | | $9.33 | | | | $9.22 | | | | $9.10 | | | | $9.71 | | | | $9.65 | |
Total return4 | | | 2.17 | % | | | 2.67 | % | | | (4.35 | )% | | | 2.61 | % | | | (1.51 | )% |
Ratios to average net assets (annualized) | | | | | | | | | | | | | | | | | | | | |
Gross expenses | | | 2.71 | % | | | 2.54 | % | | | 2.37 | % | | | 2.25 | % | | | 2.60 | % |
Net expenses | | | 1.65 | % | | | 1.65 | % | | | 1.65 | % | | | 1.65 | % | | | 1.65 | % |
Net investment income | | | 2.94 | % | | | 3.10 | % | | | 3.02 | % | | | 3.25 | % | | | 3.01 | % |
Supplemental data | | | | | | | | | | | | | | | | | | | | |
Portfolio turnover rate | | | 22 | % | | | 52 | % | | | 53 | % | | | 51 | % | | | 39 | % |
Net assets, end of period (000s omitted) | | | $365 | | | | $766 | | | | $711 | | | | $835 | | | | $518 | |
| 1 | For the eleven months ended September 30, 2016. The Fund changed its fiscal year end from October 31 to September 30, effective September 30, 2016. |
| 2 | For the period from January 31, 2013 (commencement of class operations) to October 31, 2013 |
| 3 | Calculated based upon average shares outstanding |
| 4 | Total return calculations do not include any sales charges. Returns for periods of less than one year are not annualized. |
The accompanying notes are an integral part of these financial statements.
| | | | | | |
| Financial highlights | | Wells Fargo Strategic Income Fund | | | 23 | |
(For a share outstanding throughout each period)
| | | | | | | | | | | | | | | | | | | | |
| | | Six months ended
March 31, 2017
(unaudited) | | | Year ended
September 30, 20161 | | | Year ended October 31 | |
| ADMINISTRATOR CLASS | | | | 2015 | | | 2014 | | | 20132 | |
Net asset value, beginning of period | | | $9.29 | | | | $9.16 | | | | $9.74 | | | | $9.66 | | | | $10.00 | |
Net investment income | | | 0.18 | 3 | | | 0.33 | 3 | | | 0.37 | | | | 0.39 | | | | 0.28 | |
Net realized and unrealized gains (losses) on investments | | | 0.04 | | | | (0.01 | ) | | | (0.70 | ) | | | (0.05 | ) | | | (0.37 | ) |
| | | | | | | | | | | | | | | | | | | | |
Total from investment operations | | | 0.22 | | | | 0.32 | | | | (0.33 | ) | | | 0.34 | | | | (0.09 | ) |
Distributions to shareholders from | | | | | | | | | | | | | | | | | | | | |
Net investment income | | | (0.11 | ) | | | (0.14 | ) | | | (0.22 | ) | | | (0.26 | ) | | | (0.25 | ) |
Tax basis return of capital | | | 0.00 | | | | (0.05 | ) | | | (0.03 | ) | | | 0.00 | | | | 0.00 | |
| | | | | | | | | | | | | | | | | | | | |
Total distributions to shareholders | | | (0.11 | ) | | | (0.19 | ) | | | (0.25 | ) | | | (0.26 | ) | | | (0.25 | ) |
Net asset value, end of period | | | $9.40 | | | | $9.29 | | | | $9.16 | | | | $9.74 | | | | $9.66 | |
Total return4 | | | 2.34 | % | | | 3.52 | % | | | (3.51 | )% | | | 3.63 | % | | | (0.85 | )% |
Ratios to average net assets (annualized) | | | | | | | | | | | | | | | | | | | | |
Gross expenses | | | 1.91 | % | | | 1.74 | % | | | 1.56 | % | | | 1.46 | % | | | 1.79 | % |
Net expenses | | | 0.75 | % | | | 0.75 | % | | | 0.75 | % | | | 0.75 | % | | | 0.75 | % |
Net investment income | | | 3.86 | % | | | 4.00 | % | | | 3.92 | % | | | 4.18 | % | | | 3.90 | % |
Supplemental data | | | | | | | | | | | | | | | | | | | | |
Portfolio turnover rate | | | 22 | % | | | 52 | % | | | 53 | % | | | 51 | % | | | 39 | % |
Net assets, end of period (000s omitted) | | | $478 | | | | $597 | | | | $496 | | | | $554 | | | | $496 | |
| 1 | For the eleven months ended September 30, 2016. The Fund changed its fiscal year end from October 31 to September 30, effective September 30, 2016. |
| 2 | For the period from January 31, 2013 (commencement of class operations) to October 31, 2013 |
| 3 | Calculated based upon average shares outstanding |
| 4 | Returns for periods of less than one year are not annualized. |
The accompanying notes are an integral part of these financial statements.
| | | | |
| 24 | | Wells Fargo Strategic Income Fund | | Financial highlights |
(For a share outstanding throughout each period)
| | | | | | | | | | | | | | | | | | | | |
| | | Six months ended
March 31, 2017
(unaudited) | | | Year ended
September 30, 20161 | | | Year ended October 31 | |
| INSTITUTIONAL CLASS | | | | 2015 | | | 2014 | | | 20132 | |
Net asset value, beginning of period | | | $9.24 | | | | $9.14 | | | | $9.71 | | | | $9.66 | | | | $10.00 | |
Net investment income | | | 0.18 | 3 | | | 0.34 | | | | 0.40 | | | | 0.41 | 3 | | | 0.29 | |
Net realized and unrealized gains (losses) on investments | | | 0.07 | | | | (0.02 | ) | | | (0.71 | ) | | | (0.07 | ) | | | (0.36 | ) |
| | | | | | | | | | | | | | | | | | | | |
Total from investment operations | | | 0.25 | | | | 0.32 | | | | (0.31 | ) | | | 0.34 | | | | (0.07 | ) |
Distributions to shareholders from | | | | | | | | | | | | | | | | | | | | |
Net investment income | | | (0.11 | ) | | | (0.16 | ) | | | (0.23 | ) | | | (0.29 | ) | | | (0.27 | ) |
Tax basis return of capital | | | 0.00 | | | | (0.06 | ) | | | (0.03 | ) | | | 0.00 | | | | 0.00 | |
| | | | | | | | | | | | | | | | | | | | |
Total distributions to shareholders | | | (0.11 | ) | | | (0.22 | ) | | | (0.26 | ) | | | (0.29 | ) | | | (0.27 | ) |
Net asset value, end of period | | | $9.38 | | | | $9.24 | | | | $9.14 | | | | $9.71 | | | | $9.66 | |
Total return4 | | | 2.75 | % | | | 3.55 | % | | | (3.28 | )% | | | 3.60 | % | | | (0.66 | )% |
Ratios to average net assets (annualized) | | | | | | | | | | | | | | | | | | | | |
Gross expenses | | | 1.58 | % | | | 1.46 | % | | | 1.19 | % | | | 1.14 | % | | | 1.52 | % |
Net expenses | | | 0.60 | % | | | 0.60 | % | | | 0.60 | % | | | 0.60 | % | | | 0.60 | % |
Net investment income | | | 3.90 | % | | | 4.16 | % | | | 4.04 | % | | | 4.25 | % | | | 4.05 | % |
Supplemental data | | | | | | | | | | | | | | | | | | | | |
Portfolio turnover rate | | | 22 | % | | | 52 | % | | | 53 | % | | | 51 | % | | | 39 | % |
Net assets, end of period (000s omitted) | | | $38,771 | | | | $23,190 | | | | $17,564 | | | | $38,664 | | | | $23,338 | |
| 1 | For the eleven months ended September 30, 2016. The Fund changed its fiscal year end from October 31 to September 30, effective September 30, 2016. |
| 2 | For the period from January 31, 2013 (commencement of class operations) to October 31, 2013 |
| 3 | Calculated based upon average shares outstanding |
| 4 | Returns for periods of less than one year are not annualized. |
The accompanying notes are an integral part of these financial statements.
| | | | | | |
| Notes to financial statements (unaudited) | | Wells Fargo Strategic Income Fund | | | 25 | |
1. ORGANIZATION
Wells Fargo Funds Trust (the “Trust”), a Delaware statutory trust organized on March 10, 1999, is an open-end management investment company registered under the Investment Company Act of 1940, as amended (the “1940 Act”). As an investment company, the Trust follows the accounting and reporting guidance in Financial Accounting Standards Board (“FASB”) Accounting Standards Codification (“ASC”) Topic 946, Financial Services – Investment Companies. These financial statements report on the Wells Fargo Strategic Income Fund (the “Fund”) which is a diversified series of the Trust.
2. SIGNIFICANT ACCOUNTING POLICIES
The following significant accounting policies, which are consistently followed in the preparation of the financial statements of the Fund, are in conformity with U.S. generally accepted accounting principles which require management to make estimates and assumptions that affect the reported amounts of assets and liabilities, disclosure of contingent assets and liabilities at the date of the financial statements, and the reported amounts of revenues and expenses during the reporting period. Actual results could differ from those estimates.
Securities valuation
All investments are valued each business day as of the close of regular trading on the New York Stock Exchange (generally 4 p.m. Eastern Time), although the Fund may deviate from this calculation time under unusual or unexpected circumstances.
Debt securities are valued at the evaluated bid price provided by an independent pricing service or, if a reliable price is not available, the quoted bid price from an independent broker-dealer.
Equity securities and futures that are listed on a foreign or domestic exchange or market are valued at the official closing price or, if none, the last sales price. If no sale occurs on the principal exchange or market that day, the prior day’s price will be deemed “stale” and a fair value price will be determined in accordance with the Fund’s Valuation Procedures.
Non-listed swaps are valued at the evaluated price provided by an independent pricing service or, if a reliable price is not available, the quoted bid price from an independent broker-dealer.
The values of securities denominated in foreign currencies are translated into U.S. dollars at rates provided by an independent foreign currency pricing source at a time each business day specified by the Management Valuation Team of Wells Fargo Funds Management, LLC (“Funds Management”).
Investments in registered open-end investment companies are valued at net asset value. Interests in non-registered investment companies that are redeemable at net asset value are fair valued normally at net asset value.
Investments which are not valued using any of the methods discussed above are valued at their fair value, as determined in good faith by the Board of Trustees of the Fund. The Board of Trustees has established a Valuation Committee comprised of the Trustees and has delegated to it the authority to take any actions regarding the valuation of portfolio securities that the Valuation Committee deems necessary or appropriate, including determining the fair value of portfolio securities, unless the determination has been delegated to the Management Valuation Team. The Board of Trustees retains the authority to make or ratify any valuation decisions or approve any changes to the Valuation Procedures as it deems appropriate. On a quarterly basis, the Board of Trustees receives reports on any valuation actions taken by the Valuation Committee or the Management Valuation Team which may include items for ratification.
Valuations of fair valued securities are compared to the next actual sales price when available, or other appropriate market values, to assess the continued appropriateness of the fair valuation methodologies used. These securities are fair valued on a day-to-day basis, taking into consideration changes to appropriate market information and any significant changes to the inputs considered in the valuation process until there is a readily available price provided on an exchange or by an independent pricing service. Valuations received from an independent pricing service or independent broker-dealer quotes are periodically validated by comparisons to most recent trades and valuations provided by other independent pricing services in addition to the review of prices by the manager and/or subadviser. Unobservable inputs used in determining fair valuations are identified based on the type of security, taking into consideration factors utilized by market participants in valuing the investment, knowledge about the issuer and the current market environment.
Foreign currency translation
The accounting records of the Fund are maintained in U.S. dollars. The values of other assets and liabilities denominated in foreign currencies are translated into U.S. dollars at rates provided by an independent foreign currency pricing source at a time each business day specified by the Management Valuation Team. Purchases and sales of securities, and income and expenses are converted at the rate of exchange on the respective dates of such transactions. Net realized foreign exchange gains or losses arise from sales of foreign currencies, currency gains or losses realized between the trade and
| | | | |
| 26 | | Wells Fargo Strategic Income Fund | | Notes to financial statements (unaudited) |
settlement dates on securities transactions, and the difference between the amounts of dividends, interest and foreign withholding taxes recorded and the U.S. dollar equivalent of the amounts actually paid or received. Net unrealized foreign exchange gains and losses arise from changes in the fair value of assets and liabilities other than investments in securities resulting from changes in exchange rates. The changes in net assets arising from changes in exchange rates of securities and the changes in net assets resulting from changes in market prices of securities are not separately presented. Such changes are included in net realized and unrealized gains or losses from investments.
Forward foreign currency contracts
The Fund is subject to foreign currency risk in the normal course of pursuing its investment objectives. A forward foreign currency contract is an agreement between two parties to purchase or sell a specific currency for an agreed-upon price at a future date. The Fund enters into forward foreign currency contracts to facilitate transactions in foreign-denominated securities and to attempt to minimize the risk to the Fund from adverse changes in the relationship between currencies. Forward foreign currency contracts are recorded at the forward rate and marked-to-market daily. When the contracts are closed, realized gains and losses arising from such transactions are recorded as realized gains or losses on forward foreign currency contract transactions. The Fund could be exposed to risks if the counterparties to the contracts are unable to meet the terms of their contracts or if the value of the foreign currency changes unfavorably. The Fund’s maximum risk of loss from counterparty credit risk is the unrealized gains on the contracts. This risk may be mitigated if there is a master netting arrangement between the Fund and the counterparty.
Security loans
The Fund may lend its securities from time to time in order to earn additional income in the form of fees or interest on securities received as collateral or the investment of any cash received as collateral. The Fund continues to receive interest or dividends on the securities loaned. The Fund receives collateral in the form of cash or securities with a value at least equal to the value of the securities on loan. The value of the loaned securities is determined at the close of each business day and any additional required collateral is delivered to the Fund on the next business day. In a securities lending transaction, the net asset value of the Fund will be affected by an increase or decrease in the value of the securities loaned and by an increase or decrease in the value of the instrument in which collateral is invested. The amount of securities lending activity undertaken by the Fund fluctuates from time to time. In the event of default or bankruptcy by the borrower, the Fund may be prevented from recovering the loaned securities or gaining access to the collateral or may experience delays or costs in doing so. In addition, the investment of any cash collateral received may lose all or part of its value. The Fund has the right under the lending agreement to recover the securities from the borrower on demand.
The Fund lends its securities through an unaffiliated securities lending agent. Cash collateral received in connection with its securities lending transactions is invested in Securities Lending Cash Investments, LLC (the “Securities Lending Fund”). The Securities Lending Fund is exempt from registration under Section 3(c)(7) of the 1940 Act and is managed by Funds Management and is subadvised by Wells Capital Management Incorporated (“WellsCap”), an affiliate of Funds Management and an indirect wholly owned subsidiary of Wells Fargo & Company (“Wells Fargo”). Funds Management receives an advisory fee starting at 0.05% and declining to 0.01% as the average daily net assets of the Securities Lending Fund increase. All of the fees received by Funds Management are paid to WellsCap for its services as subadviser. The Securities Lending Fund seeks to provide a positive return compared to the daily Fed Funds Open Rate by investing in high-quality, U.S. dollar-denominated short-term money market instruments. Securities Lending Fund investments are valued at the evaluated bid price provided by an independent pricing service. Income earned from investment in the Securities Lending Fund is included in securities lending income on the Statement of Operations.
When-issued transactions
The Fund may purchase securities on a forward commitment or when-issued basis. The Fund records a when-issued transaction on the trade date and will segregate assets in an amount at least equal in value to the Fund’s commitment to purchase when-issued securities. Securities purchased on a when-issued basis are marked-to-market daily and the Fund begins earning interest on the settlement date. Losses may arise due to changes in the market value of the underlying securities or if the counterparty does not perform under the contract.
Loans
The Fund may invest in direct debt instruments which are interests in amounts owed to lenders by corporate or other borrowers. The loans pay interest at rates which are periodically reset by reference to a base lending rate plus a spread. Investments in loans may be in the form of participations in loans or assignments of all or a portion of loans from third parties. When the Fund purchases participations, it generally has no rights to enforce compliance with terms of the loan agreement with the borrower. As a result, the Fund assumes the credit risk of both the borrower and the lender that is selling the participation. When the Fund purchases assignments from lenders, it acquires direct rights against the borrower
| | | | | | |
| Notes to financial statements (unaudited) | | Wells Fargo Strategic Income Fund | | | 27 | |
on the loan and may enforce compliance by the borrower with the terms of the loan agreement. Loans may include fully funded term loans or unfunded loan commitments, which are contractual obligations for future funding.
Futures contracts
The Fund is subject to interest rate risk in the normal course of pursuing its investment objectives. The Fund may buy and sell futures contracts in order to gain exposure to, or protect against, changes in interest rates. The primary risks associated with the use of futures contracts are the imperfect correlation between changes in market values of securities held by the Fund and the prices of futures contracts, and the possibility of an illiquid market.
The aggregate principal amounts of the contracts are not recorded in the financial statements. Fluctuations in the value of the contracts are recorded in the Statement of Assets and Liabilities as an asset or liability and in the Statement of Operations as unrealized gains or losses until the contracts are closed, at which point they are recorded as net realized gains or losses on futures contracts. With futures contracts, there is minimal counterparty risk to the Fund since futures are exchange traded and the exchange’s clearinghouse, as counterparty to all exchange traded futures, guarantees the futures against default.
Credit default swaps
The Fund is subject to credit risk in the normal course of pursuing its investment objectives. The Fund may enter into credit default swap contracts for hedging or speculative purposes to provide or receive a measure of protection against default on a referenced entity, obligation or index or for investment gains. Credit default swaps involve an exchange of a stream of payments for protection against the loss in value of an underlying security or index. Under the terms of the swap, one party acts as a guarantor (referred to as the seller of protection) and receives a periodic stream of payments, provided that there is no credit event, from another party (referred to as the buyer of protection) that is a fixed percentage applied to a notional principal amount over the term of the swap. An index credit default swap references all the names in the index, and if a credit event is triggered, the credit event is settled based on that name’s weight in the index. A credit event includes bankruptcy, failure to pay, obligation default, obligation acceleration, repudiation/moratorium, and restructuring. The Fund may enter into credit default swaps as either the seller of protection or the buyer of protection. As the seller of protection, the Fund is subject to investment exposure on the notional amount of the swap and has assumed the risk of default of the underlying security or index. As the buyer of protection, the Fund could be exposed to risks if the seller of the protection defaults on its obligation to perform, or if there are unfavorable changes in the fluctuation of interest rates. The maximum potential amount of future payments (undiscounted) that the Fund as the seller of protection could be required to make under the credit default swap contract would be an amount equal to the notional amount of the swap contract. The Fund’s maximum risk of loss from counterparty risk, either as the protection seller or as the protection buyer, is the fair value of the contract. This risk is mitigated by having a master netting arrangement between the Fund and the counterparty and by having the counterparty post collateral to cover the Fund’s exposure to the counterparty.
If the Fund is the seller of protection and a credit event occurs, as defined under the terms of that particular swap agreement, the Fund will pay to the buyer of protection the notional amount of the swap and take delivery of the referenced obligation or underlying securities comprising the referenced index. If the Fund is the buyer of protection and a credit event occurs, as defined under the terms of that particular swap agreement, the Fund will receive from the seller of protection the notional amount of the swap and deliver the referenced obligation or underlying securities comprising the referenced index.
Any premiums paid or received on the transactions are recorded as an asset or liability on the Statement of Assets and Liabilities and amortized. The value of the swap contract is marked-to-market daily based on quotations from an independent pricing service or an independent broker-dealer and any change in value is recorded as an unrealized gain or loss. Periodic payments made or received are recorded as realized gains or losses. In addition, payments received or made as a result of a credit event or termination of the contract are recognized as realized gains or losses.
Certain credit default swap contracts entered into by the Fund provide for conditions that result in events of default or termination that enable the counterparty to the agreement to cause an early termination of the transactions under those agreements.
Security transactions and income recognition
Securities transactions are recorded on a trade date basis. Realized gains or losses are recorded on the basis of identified cost.
| | | | |
| 28 | | Wells Fargo Strategic Income Fund | | Notes to financial statements (unaudited) |
Interest income is accrued daily and bond discounts are accreted and premiums are amortized daily based on the effective interest method. To the extent debt obligations are placed on non-accrual status, any related interest income may be reduced by writing off interest receivables when the collection of all or a portion of interest has been determined to be doubtful based on consistently applied procedures and the fair value has decreased. If the issuer subsequently resumes interest payments or when the collectability of interest is reasonably assured, the debt obligation is removed from non-accrual status.
Dividend income is recognized on the ex-dividend.
Income from foreign securities is recorded net of foreign taxes withheld where recovery of such taxes is not assured.
Distributions to shareholders
Distributions to shareholders from net investment income and net realized gains, if any, are recorded on the ex-dividend date. Such distributions are determined in accordance with income tax regulations and may differ from U.S. generally accepted accounting principles. Dividend sources are estimated at the time of declaration. The tax character of distributions is determined as of the Fund’s fiscal year end. Therefore, a portion of the Fund’s distributions made prior the Fund’s fiscal year end may be categorized as a tax return of capital.
Federal and other taxes
The Fund intends to continue to qualify as a regulated investment company by distributing substantially all of its investment company taxable income and any net realized capital gains (after reduction for capital loss carryforwards) sufficient to relieve it from all, or substantially all, federal income taxes. Accordingly, no provision for federal income taxes was required.
The Fund’s income and federal excise tax returns and all financial records supporting those returns for the prior three fiscal years are subject to examination by the federal and Delaware revenue authorities. Management has analyzed the Fund’s tax positions taken on federal, state, and foreign tax returns for all open tax years and does not believe that there are any uncertain tax positions that require recognition of a tax liability.
As of September 30, 2016, the Fund had capital loss carryforwards which consisted of $588,918 in short-term capital losses and $1,081,979 in long-term capital losses.
Class allocations
The separate classes of shares offered by the Fund differ principally in applicable sales charges, distribution, shareholder servicing, and administration fees. Class specific expenses are charged directly to that share class. Investment income, common expenses, and realized and unrealized gains (losses) on investments are allocated daily to each class of shares based on the relative proportion of net assets of each class.
3. FAIR VALUATION MEASUREMENTS
Fair value measurements of investments are determined within a framework that has established a fair value hierarchy based upon the various data inputs utilized in determining the value of the Fund’s investments. The three-level hierarchy gives the highest priority to unadjusted quoted prices in active markets for identical assets or liabilities (Level 1) and the lowest priority to unobservable inputs (Level 3). The Fund’s investments are classified within the fair value hierarchy based on the lowest level of input that is significant to the fair value measurement. The inputs are summarized into three broad levels as follows:
| ∎ | | Level 1 – quoted prices in active markets for identical securities |
| ∎ | | Level 2 – other significant observable inputs (including quoted prices for similar securities, interest rates, prepayment speeds, credit risk, etc.) |
| ∎ | | Level 3 – significant unobservable inputs (including the Fund’s own assumptions in determining the fair value of investments) |
The inputs or methodologies used for valuing investments in securities are not necessarily an indication of the risk associated with investing in those securities.
| | | | | | |
| Notes to financial statements (unaudited) | | Wells Fargo Strategic Income Fund | | | 29 | |
The following is a summary of the inputs used in valuing the Fund’s assets and liabilities as of March 31, 2017:
| | | | | | | | | | | | | | | | |
| | | Quoted prices
(Level 1) | | | Other significant
observable inputs
(Level 2) | | | Significant
unobservable inputs (Level 3) | | | Total | |
Assets | | | | | | | | | | | | | | | | |
Investments in: | | | | | | | | | | | | | | | | |
| | | | |
Asset-backed securities | | $ | 0 | | | $ | 3,077,063 | | | $ | 0 | | | $ | 3,077,063 | |
| | | | |
Common stocks | | | | | | | | | | | | | | | | |
Utilities | | | 106,211 | | | | 0 | | | | 0 | | | | 106,211 | |
| | | | |
Corporate bonds and notes | | | 0 | | | | 14,813,855 | | | | 0 | | | | 14,813,855 | |
| | | | |
Foreign corporate bonds and notes | | | 0 | | | | 1,138,145 | | | | 0 | | | | 1,138,145 | |
| | | | |
Foreign government bonds | | | 0 | | | | 1,191,816 | | | | 0 | | | | 1,191,816 | |
| | | | |
Loans | | | 0 | | | | 4,529,972 | | | | 661,068 | | | | 5,191,040 | |
| | | | |
Municipal obligations | | | 0 | | | | 758,378 | | | | 0 | | | | 758,378 | |
| | | | |
Non-agency mortgage-backed securities | | | 0 | | | | 4,725,725 | | | | 0 | | | | 4,725,725 | |
| | | | |
Rights | | | | | | | | | | | | | | | | |
Utilities | | | 0 | | | | 7,331 | | | | 0 | | | | 7,331 | |
| | | | |
U.S. Treasury securities | | | 122,210 | | | | 0 | | | | 0 | | | | 122,210 | |
| | | | |
Yankee corporate bonds and notes | | | 0 | | | | 3,403,968 | | | | 0 | | | | 3,403,968 | |
| | | | |
Yankee government bonds | | | 0 | | | | 1,678,960 | | | | 0 | | | | 1,678,960 | |
| | | | |
Short-term investments | | | | | | | | | | | | | | | | |
Investment companies | | | 3,584,787 | | | | 0 | | | | 0 | | | | 3,584,787 | |
U.S. Treasury securities | | | 209,692 | | | | 0 | | | | 0 | | | | 209,692 | |
Investments measured at net asset value* | | | | | | | | | | | | | | | 108,300 | |
| | | | |
| | | 4,022,900 | | | | 35,325,213 | | | | 661,068 | | | | 40,117,481 | |
| | | | |
Forward foreign currency contracts | | | 0 | | | | 17,460 | | | | 0 | | | | 17,460 | |
Futures contracts | | | 313 | | | | 0 | | | | 0 | | | | 313 | |
Total assets | | $ | 4,023,213 | | | $ | 35,342,673 | | | $ | 661,068 | | | $ | 40,135,254 | |
Liabilities | | | | | | | | | | | | | | | | |
| | | | |
Forward foreign currency contracts | | $ | 0 | | | $ | 8,501 | | | $ | 0 | | | $ | 8,501 | |
Futures contracts | | | 8,906 | | | | 0 | | | | 0 | | | | 8,906 | |
Total liabilities | | $ | 8,906 | | | $ | 8,501 | | | $ | 0 | | | $ | 17,407 | |
Forward foreign currency contracts are reported at their unrealized gains (losses) at measurement date, which represents the change in the contract’s value from trade date. Futures contracts are reported at their variation margin at measurement date, which represents the amount due to/from the Fund at that date. All other assets and liabilities are reported at their market value at measurement date
The Fund recognizes transfers between levels within the fair value hierarchy at the end of the reporting period. At March 31, 2017, the Fund did not have any transfers between Level 1 and Level 2.
| | | | |
| 30 | | Wells Fargo Strategic Income Fund | | Notes to financial statements (unaudited) |
The following is a reconciliation of assets in which significant unobservable inputs (Level 3) were used in determining fair value:
| | | | |
| | | Loans | |
Balance as of September 30, 2016 | | $ | 349,964 | |
Accrued discounts (premiums) | | | (32 | ) |
Realized gains (losses) | | | (590 | ) |
Change in unrealized gains (losses) | | | 4,198 | |
Purchases | | | 423,232 | |
Sales | | | (102,065 | ) |
Transfers into Level 3 | | | 134,000 | |
Transfers out of Level 3 | | | (147,639 | ) |
Balance as of March 31, 2017 | | $ | 661,068 | |
Change in unrealized gains (losses) relating to securities still held at March 31, 2017 | | $ | 3,794 | |
The investment type categorized above was valued using indicative broker quotes. These indicative broker quotes are considered Level 3 inputs. Quantitative unobservable inputs used by the brokers are often proprietary and not provided to the Fund and therefore the disclosure that would address these inputs is not included above.
4. TRANSACTIONS WITH AFFILIATES AND OTHER EXPENSES
Management fee
Funds Management, an indirect wholly owned subsidiary of Wells Fargo, is the manager of the Fund and provides advisory and fund-level administrative services under an investment management agreement. Under the investment management agreement, Funds Management is responsible for, among other services, implementing the investment objectives and strategies of the Fund, supervising the subadvisers, providing fund-level administrative services in connection with the Fund’s operations, and providing any other fund-level administrative services reasonably necessary for the operation of the Fund. As compensation for its services under the investment management agreement, Funds Management is entitled to receive an annual management fee starting at 0.525% and declining to 0.405% as the average daily net assets of the Fund increase. For the six months ended March 31, 2017, the management fee was equivalent to an annual rate of 0.525% of the Fund’s average daily net assets.
Funds Management has retained the services of a certain subadvisers to provide daily portfolio management to the Fund. The fee for subadvisory services is borne by Funds Management. WellsCap is a subadviser to the Fund and is entitled to receive a fee from Funds Management at an annual rate starting at 0.30% and declining to 0.15% as the average daily net assets of the Fund increase. First International Advisors, LLC, an affiliate of Funds Management and an indirect wholly owned subsidiary of Wells Fargo, is also a subadviser to the Fund and is entitled to receive a fee from Funds Management at an annual rate starting at 0.35% and declining to 0.20% as the average daily net assets of the Fund increase.
Administration fees
Under a class-level administration agreement, Funds Management provides class-level administrative services to the Fund, which includes paying fees and expenses for services provided by the transfer agent, sub-transfer agents, omnibus account servicers and record-keepers. As compensation for its services under the class-level administration agreement, Funds Management receives an annual fee which is calculated based on the average daily net assets of each class as follows:
| | | | |
| | | Class-level
administration fee | |
Class A, Class C | | | 0.16 | % |
Administrator Class | | | 0.10 | |
Institutional Class | | | 0.08 | |
Funds Management has contractually waived and/or reimbursed management and administration fees to the extent necessary to maintain certain net operating expense ratios for the Fund. Waiver of fees and/or reimbursement of expenses by Funds Management were made first from fund level expenses on a proportionate basis and then from class specific expenses. Funds Management has committed through January 31, 2018 to waive fees and/or reimburse expenses to the extent necessary to cap the Fund’s expenses at 0.90% for Class A shares, 1.65% for Class C shares, 0.75% for Administrator Class shares, and 0.60% for Institutional Class shares. After this time, the cap may be increased or the commitment to maintain the cap may be terminated only with the approval of the Board of Trustees.
| | | | | | |
| Notes to financial statements (unaudited) | | Wells Fargo Strategic Income Fund | | | 31 | |
During the six months ended March 31, 2017, State Street Bank and Trust Company, the Fund’s custodian, reimbursed the Fund $42 for certain out-of-pocket expenses that were billed to the Fund in error from 1998-2015. This amount is included in interest income on the Statement of Operations. In addition, Funds Management was also reimbursed $4,509 for waivers/reimbursements it made to the Fund during the period the Fund was erroneously billed.
Distribution fee
The Trust has adopted a distribution plan for Class C shares of the Fund pursuant to Rule 12b-1 under the 1940 Act. A distribution fee is charged to Class C shares and paid to Wells Fargo Funds Distributor, LLC (“Funds Distributor”), the principal underwriter, at an annual rate of 0.75% of the average daily net assets of Class C shares.
In addition, Funds Distributor is entitled to receive the front-end sales charge from the purchase of Class A shares and a contingent deferred sales charge on the redemption of certain Class A shares. Funds Distributor is also entitled to receive the contingent deferred sales charges from redemptions of Class C shares. For the six months ended March 31, 2017, Funds Distributor received $26 from the sale of Class A shares.
Shareholder servicing fees
The Trust has entered into contracts with one or more shareholder servicing agents, whereby Class A, Class C, and Administrator Class of the Fund are charged a fee at an annual rate of 0.25% of the average daily net assets of each respective class.
A portion of these total shareholder servicing fees were paid to affiliates of Wells Fargo.
5. INVESTMENT PORTFOLIO TRANSACTIONS
Purchases and sales of investments, excluding U.S. government obligations (if any) and short-term securities, for the six months ended March 31, 2017 were $19,763,759 and $5,540,755, respectively.
The Fund may purchase or sell investment securities to other Wells Fargo affiliates pursuant to Rule 17a-7 of the 1940 Act and under procedures adopted by the Board of Trustees. The procedures have been designed to ensure that these interfund transactions, which generally do not incur broker commissions, are effected at current market prices. Interfund trades are included within the respective purchases and sales amounts shown.
As of March 31, 2017, the Fund had unfunded term loan commitments of $753,938.
6. DERIVATIVE TRANSACTIONS
During the six months ended March 31, 2017, the Fund entered into futures contracts to manage duration exposure.
At March 31, 2017, the Fund had long and short futures contracts outstanding as follows:
| | | | | | | | | | | | | | |
| Expiration date | | Counterparty | | Contracts | | Type | | Contract value at March 31, 2017 | | | Unrealized
gains
(losses) | |
| 6-21-2017 | | JPMorgan | | 3 Short | | Ultra U.S. Treasury Bonds | | $ | 481,875 | | | $ | 3,652 | |
| 6-21-2017 | | JPMorgan | | 11 Short | | 10-Year U.S. Treasury Notes | | | 1,370,188 | | | | 1,700 | |
| 6-21-2017 | | JPMorgan | | 1 Long | | U.S. Treasury Bonds | | | 150,844 | | | | 426 | |
| 6-30-2017 | | JPMorgan | | 4 Short | | 2-Year U.S. Treasury Notes | | | 865,813 | | | | (136 | ) |
| 6-30-2017 | | JPMorgan | | 32 Short | | 5-Year U.S. Treasury Notes | | | 3,767,250 | | | | 472 | |
The Fund had an average notional amount of $430,729 in long futures contracts and $5,722,486 in short futures contracts during the six months ended March 31, 2017.
During the six months ended March 31, 2017, the Fund entered into forward foreign currency contracts for economic hedging purposes.
| | | | |
| 32 | | Wells Fargo Strategic Income Fund | | Notes to financial statements (unaudited) |
At March 31, 2017, the Fund had forward foreign currency contracts outstanding as follows:
Forward foreign currency contracts to buy:
| | | | | | | | | | | | | | | | | | |
| Exchange date | | Counterparty | | Contracts to
receive | | | U.S. value at March 31, 2017 | | | In exchange
for U.S. $ | | | Unrealized gains
(losses) | |
| 4-21-2017 | | State Street Bank | | | 170,000 | CAD | | $ | 127,868 | | | $ | 127,509 | | | $ | 359 | |
| 5-2-2017 | | State Street Bank | | | 1,469,020 | MXN | | | 78,125 | | | | 70,000 | | | | 8,125 | |
| 5-2-2017 | | State Street Bank | | | 129,250 | EUR | | | 138,058 | | | | 140,107 | | | | (2,049 | ) |
Forward foreign currency contracts to sell:
| | | | | | | | | | | | | | | | | | |
| Exchange date | | Counterparty | | Contracts to
deliver | | | U.S. value at March 31, 2017 | | | In exchange for U.S. $ | | | Unrealized
gains
(losses) | |
| 4-21-2017 | | State Street Bank | | | 5,840,000 | JPY | | $ | 52,488 | | | $ | 51,707 | | | $ | (781 | ) |
| 5-2-2017 | | State Street Bank | | | 129,250 | EUR | | | 138,058 | | | | 140,000 | | | | 1,942 | |
| 6-1-2017 | | State Street Bank | | | 752,500,000 | COP | | | 259,669 | | | | 256,738 | | | | (2,931 | ) |
| 6-2-2017 | | State Street Bank | | | 4,250,000,000 | IDR | | | 316,871 | | | | 315,165 | | | | (1,706 | ) |
| 6-30-2017 | | Citibank NA | | | 500,000 | EUR | | | 535,623 | | | | 542,657 | | | | 7,034 | |
| 6-30-2017 | | Citibank NA | | | 250,000 | GBP | | | 313,889 | | | | 312,855 | | | | (1,034 | ) |
The Fund had average contract amounts of $646,911 and $2,253,485 in forward foreign currency contracts to buy and forward foreign currency contracts to sell, respectively, during the six months ended March 31, 2017.
A summary of derivative instruments by primary risk exposure is outlined in the following tables.
The fair value of derivative instruments as of March 31, 2017 was as follows for the Fund:
| | | | | | | | | | | | |
| | | Asset derivatives | | | Liability derivatives | |
| | | Statement of Assets and
Liabilities location | | Fair value | | | Statement of Assets and
Liabilities location | | Fair value | |
Interest rate risk | | Receivable for daily variation margin on open futures contracts | | $ | 313 | * | | Payable for daily variation margin on open futures contracts | | $ | 8,906 | * |
Foreign currency risk | | Unrealized gains on forward foreign currency contracts | | | 17,460 | | | Unrealized losses on forward foreign currency contracts | | | 8,501 | |
| | | | | $ | 17,773 | | | | | $ | 17,407 | |
| * | Only the current day’s variation margin as of March 31, 2017 is reported separately on the Statement of Assets and Liabilities. |
The effect of derivative instruments on the Statement of Operations for the six months ended March 31, 2017 was as follows for the Fund:
| | | | | | | | | | | | |
| | | Amount of realized gains (losses) on derivatives | | | | |
| | | Futures Contracts | | | Forward currency contracts | | | | |
Interest rate risk | | $ | 246,693 | | | $ | 0 | | | | | |
Foreign currency risk | | | 0 | | | | (48,952 | ) | | | | |
| | | $ | 246,693 | | | $ | (48,952 | ) | | | | |
| | | Change in unrealized gains (losses) on derivatives | | | | |
| | | Futures Contracts | | | Forward currency contracts | | | | |
Interest rate risk | | $ | 19,119 | | | $ | 0 | | | | | |
Foreign currency risk | | | 0 | | | | 59,059 | | | | | |
| | | $ | 19,119 | | | $ | 59,059 | | | | | |
| | | | | | |
| Notes to financial statements (unaudited) | | Wells Fargo Strategic Income Fund | | | 33 | |
For certain types of derivative transactions, the Fund has entered into International Swaps and Derivatives Association, Inc. master agreements (“ISDA Master Agreements”) or similar agreements with approved counterparties. The ISDA Master Agreements or similar agreements may have requirements to deliver/deposit securities or cash to/with an exchange or broker-dealer as collateral and allows the Fund to offset, with each counterparty, certain derivative financial instrument’s assets and/or liabilities with collateral held or pledged. Collateral requirements differ by type of derivative. Collateral or margin requirements are set by the broker or exchange clearing house for exchange traded derivatives while collateral terms are contract specific for over-the-counter traded derivatives. Cash collateral that has been pledged to cover obligations of the Fund under ISDA Master Agreements or similar agreements, if any, are reported separately in the Statement of Assets and Liabilities. Securities pledged as collateral, if any, are noted in the Portfolio of Investments. With respect to balance sheet offsetting, absent an event of default by the counterparty or a termination of the agreement, the reported amounts of financial assets and financial liabilities in the Statement of Assets and Liabilities are not offset across transactions between the Fund and the applicable counterparty. A reconciliation of the gross amounts on the Statement of Assets and Liabilities to the net amounts by derivative type, including any collateral exposure, is as follows:
| | | | | | | | | | | | | | | | | | |
| Derivative type | | Counterparty | | Gross amounts
of assets in the
Statement of
Assets and
Liabilities | | | Amounts
subject to
netting
agreements | | | Collateral
received | | | Net amount
of assets | |
Futures – variation margin | | JPMorgan | | $ | 313 | | | $ | (313 | ) | | $ | 0 | | | $ | 0 | |
Forward foreign currency contracts | | State Street | | | 10,426 | * | | | (7,467 | ) | | | 0 | | | | 2,959 | |
Forward foreign currency contracts | | Citibank | | | 7,034 | * | | | (1,034 | ) | | | 0 | | | | 6,000 | |
| | * | Amount represents net unrealized gains. | |
| | | | | | | | | | | | | | | | | | |
| Derivative type | | Counterparty | | Gross amounts
of liabilities in the
Statement of
Assets and
Liabilities | | | Amounts
subject to
netting
agreements | | | Collateral
pledged1 | | | Net amount
of liabilities | |
Futures – variation margin | | JPMorgan | | $ | 8,906 | | | $ | (313 | ) | | $ | (8,593 | ) | | $ | 0 | |
Forward foreign currency contracts | | State Street | | | 7,467 | ** | | | (7,467 | ) | | | 0 | | | | 0 | |
Forward foreign currency contracts | | Citibank | | | 1,034 | ** | | | (1,034 | ) | | | 0 | | | | 0 | |
| | ** | Amount represents net unrealized losses. | |
| | 1 | Collateral pledged within this table is limited to the collateral for the net transaction with the counterparty by derivative type. | |
7. BANK BORROWINGS
The Trust (excluding the money market funds and certain other funds) and Wells Fargo Variable Trust are parties to a $250,000,000 revolving credit agreement whereby the Fund is permitted to use bank borrowings for temporary or emergency purposes, such as to fund shareholder redemption requests. Interest under the credit agreement is charged to the Fund based on a borrowing rate equal to the higher of the Federal Funds rate in effect on that day plus 1.25% or the overnight LIBOR rate in effect on that day plus 1.25%. In addition, an annual commitment fee equal to 0.25% of the unused balance is allocated to each participating fund.
For the six months ended March 31, 2017, there were no borrowings by the Fund under the agreement.
8. INDEMNIFICATION
Under the Trust’s organizational documents, the officers and Trustees have been granted certain indemnification rights against certain liabilities that may arise out of performance of their duties to the Trust. Additionally, in the normal course of business, the Trust may enter into contracts with service providers that contain a variety of indemnification clauses. The Trust’s maximum exposure under these arrangements is dependent on future claims that may be made against the Fund and, therefore, cannot be estimated.
9. NEW ACCOUNTING PRONOUNCEMENT
In December 2016, FASB issued Accounting Standards Update (“ASU”) No. 2016-19, Technical Corrections and Improvements. ASU 2016-19 includes an amendment to FASB ASC Topic 820, Fair Value Measurement which clarifies the difference between a valuation approach and a valuation technique. The amendment also requires an entity to disclose when there has been a change in either or both a valuation approach and/or a valuation technique. The disclosure requirements are effective for
| | | | |
| 34 | | Wells Fargo Strategic Income Fund | | Notes to financial statements (unaudited) |
fiscal years and interim periods within those fiscal years beginning after December 15, 2016. Management is currently evaluating the potential impact of this new guidance to the financial statements.
10. REGULATORY CHANGES
In October 2016, the Securities and Exchange Commission (“SEC”) adopted new rules and forms and amended existing rules and forms (together, “final rules”) intended to modernize and enhance the reporting and disclosure of information by registered investment companies and to enhance liquidity risk management by open-end mutual funds and exchange-traded funds. The final rules will enhance the quality of information available to investors and will allow the SEC to more effectively collect and use data reported by funds. In part, the final rules amend Regulation S-X and require standardized, enhanced disclosure about derivatives in the Fund’s financial statements, as well as other amendments. The compliance date for the amendments to Regulation S-X is August 1, 2017 while the compliance date for the new form types is June 1, 2018 and the compliance date for the liquidity risk management program requirements is December 1, 2018. Management is currently assessing the potential impact of these enhancements and their impact on the financial statement disclosures and reporting requirements.
11. SUBSEQUENT DISTRIBUTIONS
On April 24, 2017, the Fund declared distributions from net investment income to shareholders of record on April 21, 2017. The per share amounts payable on April 25, 2017 were as follows:
| | | | |
| | | Net investment income | |
Class A | | | $0.02597 | |
Administrator Class | | | 0.02968 | |
Institutional Class | | | 0.03599 | |
On May 24, 2017, the Fund declared distributions from net investment income to shareholders of record on May 23, 2017. The per share amounts payable on May 25, 2017 were as follows:
| | | | |
| | | Net investment income | |
Class A | | | $0.01075 | |
Administrator Class | | | 0.01137 | |
Institutional Class | | | 0.01341 | |
These distributions are not reflected in the accompanying financial statements. The final determination of the source of all distributions is subject to change and made after the Fund’s tax year-end.
| | | | | | |
| Other information (unaudited) | | Wells Fargo Strategic Income Fund | | | 35 | |
PROXY VOTING INFORMATION
A description of the policies and procedures that the Fund uses to determine how to vote proxies relating to portfolio securities is available, upon request, by calling 1-800-222-8222, visiting our website at wellsfargofunds.com, or visiting the SEC website at sec.gov. Information regarding how the Fund voted proxies relating to portfolio securities during the most recent 12-month period ended June 30 is available on the Fund’s website at wellsfargofunds.com or by visiting the SEC website at sec.gov.
PORTFOLIO HOLDINGS INFORMATION
The complete portfolio holdings for the Fund are publicly available monthly on the Fund’s website (wellsfargofunds.com), on a one-month delayed basis. In addition, top ten holdings information (excluding derivative positions) for the Fund is publicly available on the Fund’s website on a monthly, seven-day or more delayed basis. The Fund files its complete schedule of portfolio holdings with the SEC for the first and third quarters of each fiscal year on Form N-Q, which is available by visiting the SEC website at sec.gov. In addition, the Fund’s Form N-Q may be reviewed and copied at the SEC’s Public Reference Room in Washington, DC, and at regional offices in New York City, at 233 Broadway, and in Chicago, at 175 West Jackson Boulevard, Suite 900. Information about the Public Reference Room may be obtained by calling 1-800-SEC-0330.
| | | | |
| 36 | | Wells Fargo Strategic Income Fund | | Other information (unaudited) |
BOARD OF TRUSTEES AND OFFICERS
Each of the Trustees and Officers1 listed in the table below acts in identical capacities for each fund in the Wells Fargo family of funds, which consists of 138 mutual funds comprising the Wells Fargo Funds Trust, Wells Fargo Variable Trust, Wells Fargo Master Trust and four closed-end funds (collectively the “Fund Complex”). This table should be read in conjunction with the Prospectus and the Statement of Additional Information2. The mailing address of each Trustee and Officer is 525 Market Street, 12th Floor, San Francisco, CA 94105. Each Trustee and Officer serves an indefinite term, however, each Trustee serves such term until reaching the mandatory retirement age established by the Trustees.
Independent Trustees
| | | | | | |
Name and year of birth | | Position held and length of service* | | Principal occupations during past five years or longer | | Current other public company or investment company directorships |
William R. Ebsworth (Born 1957) | | Trustee, since 2015 | | Retired. From 1984 to 2013, equities analyst, portfolio manager, research director and chief financial officer at Fidelity Management and Research Company in Boston, Tokyo, and Hong Kong and retired in 2013 as Chief Investment Officer of Fidelity Strategic Advisers, Inc. where he lead a team of investment professionals managing client assets. Prior thereto, Board member of Hong Kong Securities Clearing Co., Hong Kong Options Clearing Corp., the Thailand International Fund, Ltd., Fidelity Investments Life Insurance Company, and Empire Fidelity Investments Life Insurance Company. Board member of the Fonté Foundation (non-profit organization) and the Vincent Memorial Hospital Endowment (non-profit organization), where he serves on the Investment Committee and as a Chair of the Audit Committee. Mr. Ebsworth is a CFA® charterholder and an Adjunct Lecturer, Finance, at Babson College. | | Asset Allocation Trust |
Jane A. Freeman (Born 1953) | | Trustee, since 2015 | | Retired. From 2012 to 2014 and 1999 to 2008, Chief Financial Officer of Scientific Learning Corporation. From 2008 to 2012, Ms. Freeman provided consulting services related to strategic business projects. Prior to 1999, Portfolio Manager at Rockefeller & Co. and Scudder, Stevens & Clark. Board member of the Harding Loevner Funds from 1996 to 2014, serving as both Lead Independent Director and chair of the Audit Committee. Board member of the Russell Exchange Traded Funds Trust from 2011 to 2012 and the chair of the Audit Committee. Ms. Freeman is a Board Member of Ruth Bancroft Garden (non-profit organization) and an inactive chartered financial analyst. | | Asset Allocation Trust |
Peter G. Gordon** (Born 1942) | | Trustee, since 1998; Chairman, since 2005 | | Co-Founder, Retired Chairman, President and CEO of Crystal Geyser Water Company. Trustee Emeritus, Colby College. | | Asset Allocation Trust |
Isaiah Harris, Jr. (Born 1952) | | Trustee, since 2009 | | Retired. Chairman of the Board of CIGNA Corporation since 2009, and Director since 2005. From 2003 to 2011, Director of Deluxe Corporation. Prior thereto, President and CEO of BellSouth Advertising and Publishing Corp. from 2005 to 2007, President and CEO of BellSouth Enterprises from 2004 to 2005 and President of BellSouth Consumer Services from 2000 to 2003. Emeritus member of the Iowa State University Foundation Board of Governors. Emeritus Member of the Advisory Board of Iowa State University School of Business. Advisory Board Member, Palm Harbor Academy (charter school). Advisory Board Member, Child Evangelism Fellowship (non-profit). Mr. Harris is a certified public accountant (inactive status). | | CIGNA Corporation; Asset Allocation Trust |
Judith M. Johnson (Born 1949) | | Trustee, since 2008; Audit Committee Chairman, since 2008 | | Retired. Prior thereto, Chief Executive Officer and Chief Investment Officer of Minneapolis Employees Retirement Fund from 1996 to 2008. Ms. Johnson is an attorney, certified public accountant and a certified managerial accountant. | | Asset Allocation Trust |
David F. Larcker (Born 1950) | | Trustee, since 2009 | | James Irvin Miller Professor of Accounting at the Graduate School of Business, Stanford University, Director of the Corporate Governance Research Initiative and Senior Faculty of The Rock Center for Corporate Governance since 2006. From 2005 to 2008, Professor of Accounting at the Graduate School of Business, Stanford University. Prior thereto, Ernst & Young Professor of Accounting at The Wharton School, University of Pennsylvania from 1985 to 2005. | | Asset Allocation Trust |
| | | | | | |
| Other information (unaudited) | | Wells Fargo Strategic Income Fund | | | 37 | |
| | | | | | |
Name and year of birth | | Position held and length of service* | | Principal occupations during past five years or longer | | Current other public company or investment company directorships |
Olivia S. Mitchell (Born 1953) | | Trustee, since 2006 | | International Foundation of Employee Benefit Plans Professor, Wharton School of the University of Pennsylvania since 1993. Director of Wharton’s Pension Research Council and Boettner Center on Pensions & Retirement Research, and Research Associate at the National Bureau of Economic Research. Previously, Cornell University Professor from 1978 to 1993. | | Asset Allocation Trust |
Timothy J. Penny (Born 1951) | | Trustee, since 1996 | | President and Chief Executive Officer of Southern Minnesota Initiative Foundation, a non-profit organization, since 2007 and Senior Fellow at the Humphrey Institute Policy Forum at the University of Minnesota since 1995. Member of the Board of Trustees of NorthStar Education Finance, Inc., a non-profit organization, since 2007. | | Asset Allocation Trust |
Michael S. Scofield (Born 1943) | | Trustee, since 2010 | | Served on the Investment Company Institute’s Board of Governors and Executive Committee from 2008-2011 as well the Governing Council of the Independent Directors Council from 2006-2011 and the Independent Directors Council Executive Committee from 2008-2011. Chairman of the IDC from 2008-2010. Institutional Investor (Fund Directions) Trustee of Year in 2007. Trustee of the Evergreen Funds complex (and its predecessors) from 1984 to 2010. Chairman of the Evergreen Funds from 2000-2010. Former Trustee of the Mentor Funds. Retired Attorney, Law Offices of Michael S. Scofield. | | Asset Allocation Trust |
| * | Length of service dates reflect the Trustee’s commencement of service with the Trust’s predecessor entities, where applicable. |
| ** | Peter Gordon is expected to retire on December 31, 2017. |
Officers
| | | | | | |
Name and year of birth | | Position held and length of service | | Principal occupations during past five years or longer | | |
Andrew Owen (Born 1960) | | President, since 2017 | | Executive Vice President of Wells Fargo Bank, N.A. and President of Wells Fargo & Company and Head of Affiliated Managers, Wells Fargo Asset Management, since 2014. Executive Vice President responsible for marketing, investments and product development for Wells Fargo Funds Management, LLC, from 2009 to 2014. | | |
Nancy Wiser1 (Born 1967) | | Treasurer, since 2012 | | Executive Vice President of Wells Fargo Funds Management, LLC since 2011. Chief Operating Officer and Chief Compliance Officer at LightBox Capital Management LLC, from 2008 to 2011. | | |
C. David Messman (Born 1960) | | Secretary, since 2000; Chief Legal Officer, since 2003 | | Senior Vice President and Secretary of Wells Fargo Funds Management, LLC since 2001. Assistant General Counsel of Wells Fargo Bank, N.A. since 2013 and Vice President and Managing Counsel of Wells Fargo Bank, N.A. from 1996 to 2013. | | |
Michael Whitaker (Born 1967) | | Chief Compliance Officer, since 2016 | | Executive Vice President of Wells Fargo Funds Management, LLC since 2016. Chief Compliance Officer of Fidelity’s Fixed Income Funds and Asset Allocation Funds from 2008 to 2016, Compliance Officer of FMR Co., Inc. from 2014 to 2016, Fidelity Investments Money Management, Inc. from 2014 to 2016, Fidelity Investments from 2007 to 2016. | | |
David Berardi (Born 1975) | | Assistant Treasurer, since 2009 | | Vice President of Wells Fargo Funds Management, LLC since 2009. Vice President of Evergreen Investment Management Company, LLC from 2008 to 2010. Manager of Fund Reporting and Control for Evergreen Investment Management Company, LLC from 2004 to 2010. | | |
Jeremy DePalma1 (Born 1974) | | Assistant Treasurer, since 2009 | | Senior Vice President of Wells Fargo Funds Management, LLC since 2009. Senior Vice President of Evergreen Investment Management Company, LLC from 2008 to 2010 and head of the Fund Reporting and Control Team within Fund Administration from 2005 to 2010. | | |
| 1 | Nancy Wiser acts as Treasurer of 69 funds in the Fund Complex. Jeremy DePalma acts as Treasurer of 69 funds and Assistant Treasurer of 69 funds in the Fund Complex. |
| 2 | The Statement of Additional Information includes additional information about the Trustees and is available, without charge, upon request, by calling 1-800-222-8222 or by visiting the website at wellsfargofunds.com. |
| | | | |
| 38 | | Wells Fargo Strategic Income Fund | | List of abbreviations |
The following is a list of common abbreviations for terms and entities that may have appeared in this report.
| ACA | — ACA Financial Guaranty Corporation |
| ADR | — American depositary receipt |
| ADS | — American depositary shares |
| AGC | — Assured Guaranty Corporation |
| AGM | — Assured Guaranty Municipal |
| Ambac | — Ambac Financial Group Incorporated |
| AMT | — Alternative minimum tax |
| BAN | — Bond anticipation notes |
| BHAC | — Berkshire Hathaway Assurance Corporation |
| CAB | — Capital appreciation bond |
| CCAB | — Convertible capital appreciation bond |
| CDA | — Community Development Authority |
| CDO | — Collateralized debt obligation |
| DRIVER | — Derivative inverse tax-exempt receipts |
| DW&P | — Department of Water & Power |
| DWR | — Department of Water Resources |
| ECFA | — Educational & Cultural Facilities Authority |
| EDA | — Economic Development Authority |
| EDFA | — Economic Development Finance Authority |
| ETF | — Exchange-traded fund |
| FDIC | — Federal Deposit Insurance Corporation |
| FFCB | — Federal Farm Credit Banks |
| FGIC | — Financial Guaranty Insurance Corporation |
| FHA | — Federal Housing Administration |
| FHLB | — Federal Home Loan Bank |
| FHLMC | — Federal Home Loan Mortgage Corporation |
| FICO | — The Financing Corporation |
| FNMA | — Federal National Mortgage Association |
| GDR | — Global depositary receipt |
| GNMA | — Government National Mortgage Association |
| HCFR | — Healthcare facilities revenue |
| HEFA | — Health & Educational Facilities Authority |
| HEFAR | — Higher education facilities authority revenue |
| HFA | — Housing Finance Authority |
| HFFA | — Health Facilities Financing Authority |
| HUD | — Department of Housing and Urban Development |
| IDA | — Industrial Development Authority |
| IDAG | — Industrial Development Agency |
| KRW | — Republic of Korea won |
| LIBOR | — London Interbank Offered Rate |
| LIFER | — Long Inverse Floating Exempt Receipts |
| LLC | — Limited liability company |
| LLLP | — Limited liability limited partnership |
| LLP | — Limited liability partnership |
| MBIA | — Municipal Bond Insurance Association |
| MFHR | — Multifamily housing revenue |
| MSTR | — Municipal securities trust receipts |
| MUD | — Municipal Utility District |
| National | — National Public Finance Guarantee Corporation |
| PCFA | — Pollution Control Financing Authority |
| PCL | — Public Company Limited |
| PCR | — Pollution control revenue |
| PFA | — Public Finance Authority |
| PFFA | — Public Facilities Financing Authority |
| PFOTER | — Puttable floating option tax-exempt receipts |
| plc | — Public limited company |
| PUTTER | — Puttable tax-exempt receipts |
| R&D | — Research & development |
| Radian | — Radian Asset Assurance |
| RAN | — Revenue anticipation notes |
| RDA | — Redevelopment Authority |
| RDFA | — Redevelopment Finance Authority |
| REIT | — Real estate investment trust |
| ROC | — Reset option certificates |
| SAVRS | — Select auction variable rate securities |
| SBA | — Small Business Authority |
| SDR | — Swedish depositary receipt |
| SFHR | — Single-family housing revenue |
| SFMR | — Single-family mortgage revenue |
| SPA | — Standby purchase agreement |
| SPDR | — Standard & Poor’s Depositary Receipts |
| SPEAR | — Short Puttable Exempt Adjustable Receipts |
| STRIPS | — Separate trading of registered interest and |
| TAN | — Tax anticipation notes |
| TIPS | — Treasury inflation-protected securities |
| TRAN | — Tax revenue anticipation notes |
| TTFA | — Transportation Trust Fund Authority |
| TVA | — Tennessee Valley Authority |
This page is intentionally left blank.
This page is intentionally left blank.

For more information
More information about Wells Fargo Funds is available free upon request. To obtain literature, please write, email, visit the Fund’s website, or call:
Wells Fargo Funds
P.O. Box 8266
Boston, MA 02266-8266
Email: fundservice@wellsfargo.com
Website: wellsfargofunds.com
Individual investors: 1-800-222-8222
Retail investment professionals: 1-888-877-9275
Institutional investment professionals: 1-866-765-0778
This report and the financial statements contained herein are submitted for the general information of the shareholders of the Fund. If this report is used for promotional purposes, distribution of the report must be accompanied or preceded by a current prospectus. Before investing, please consider the investment objectives, risks, charges, and expenses of the investment. For a current prospectus and, if available, a summary prospectus, containing this information, call 1-800-222-8222 or visit the Fund’s website at wellsfargofunds.com. Read the prospectus carefully before you invest or send money.
Wells Fargo Asset Management (WFAM) is a trade name used by the asset management businesses of Wells Fargo & Company. Wells Fargo Funds Management, LLC, a wholly owned subsidiary of Wells Fargo & Company, provides investment advisory and administrative services for Wells Fargo Funds. Other affiliates of Wells Fargo & Company provide subadvisory and other services for the funds. The funds are distributed by Wells Fargo Funds Distributor, LLC, Member FINRA, an affiliate of Wells Fargo & Company. Neither Wells Fargo Funds Management nor Wells Fargo Funds Distributor has Fund customer accounts/assets, and neither provides investment advice/recommendations or acts as an investment advice fiduciary to any investor.
NOT FDIC INSURED ◾ NO BANK GUARANTEE ◾ MAY LOSE VALUE
© 2017 Wells Fargo Funds Management, LLC. All rights reserved.
| | |
 | | 302885 05-17 SA263/SAR263 03-17 |
Semi-Annual Report
March 31, 2017

Wells Fargo C&B Mid Cap Value Fund


Reduce clutter. Save trees.
Sign up for electronic delivery of prospectuses and shareholder reports at wellsfargo.com/advantagedelivery
Contents
The views expressed and any forward-looking statements are as of March 31, 2017, unless otherwise noted, and are those of the Fund managers and/or Wells Fargo Funds Management, LLC. Discussions of individual securities, or the markets generally, or any Wells Fargo Fund are not intended as individual recommendations. Future events or results may vary significantly from those expressed in any forward-looking statements. The views expressed are subject to change at any time in response to changing circumstances in the market. Wells Fargo Funds Management, LLC and the Fund disclaim any obligation to publicly update or revise any views expressed or forward-looking statements.
NOT FDIC INSURED ◾ NO BANK GUARANTEE ◾ MAY LOSE VALUE
| | | | |
| 2 | | Wells Fargo C&B Mid Cap Value Fund | | Letter to shareholders (unaudited) |

Andrew Owen
President
Wells Fargo Funds
U.S. and international stocks returned 10.12% and 8.18% for the six-month period; within fixed income, the Bloomberg Barclays U.S. Aggregate Bond Index3 returned -2.18%.
Dear Shareholder:
As the new president of Wells Fargo Funds now that Karla Rabusch is retiring from that position after nearly 14 years, I am pleased to offer you this semi-annual report for the Wells Fargo C&B Mid Cap Value Fund for the six-month period that ended March 31, 2017. During this period, global stocks delivered favorable results overall. U.S. and international stocks returned 10.12% and 8.18% for the six-month period, respectively, as measured by the S&P 500 Index1 and the MSCI ACWI ex USA Index (Net)2; within fixed income, the Bloomberg Barclays U.S. Aggregate Bond Index3 returned -2.18%.
During the fourth quarter of 2016, prospects for faster growth and higher interest rates in the U.S. influenced markets.
Early in the fourth quarter of 2016, U.S. stocks tended to trade lower amid concerns such as a likely interest-rate increase and uncertainty over the approaching general election. However, following Donald Trump’s election as president in early November, U.S. stocks began to rally. Investors appeared optimistic that the new administration would usher in a series of progrowth policies, and supportive economic news helped the rally carry through the quarter. The buoyant environment sent interest rates higher as well. At its mid-December meeting, Fed officials raised their short-term target interest rate for the first time in a year by a quarter percentage point to between 0.50% and 0.75%. The fourth quarter also saw the implementation of the U.S. Securities and Exchange Commission’s new rules for money market funds, which included floating net asset values (NAVs) for institutional prime and municipal money market funds as well as liquidity fees and redemption gates. In the year leading up to money market fund reform implementation, nearly $1 trillion in assets moved from these types of money market funds into government money market funds, which continued to transact at a stable $1 NAV. Outside of the U.S., the prospects for faster U.S. growth appeared to trigger some acceleration in Europe. The improvement may be partly attributable to expectations for further strengthening of the U.S. dollar, which in turn could improve demand for European goods in the U.S. due to weakening of the euro relative to the dollar. Meanwhile, rising inflation across the eurozone and Japan caused an upward shift in yield curves in those areas although developed-country bond yields remained significantly lower than U.S. Treasury yields.
Globally, stocks delivered positive results and economies showed some improvement in the first quarter of 2017.
Stocks rallied globally through the first quarter of 2017, supported by signs of improvement in the U.S. and global economies. U.S. economic data released during the quarter reflected a healthy economy. Hiring remained strong, and business and consumer sentiment improved. Meanwhile, inflation inched up during the quarter. Along with the pickup in inflation, investors appeared to shift
| 1 | The S&P 500 Index consists of 500 stocks chosen for market size, liquidity, and industry group representation. It is a market-value-weighted index with each stock’s weight in the index proportionate to its market value. You cannot invest directly in an index. |
| 2 | The Morgan Stanley Capital International (MSCI) All Country World Index (ACWI) ex USA Index (Net) is a free-float-adjusted market-capitalization-weighted index that is designed to measure the equity market performance of developed markets, excluding the United States and Canada. Source: MSCI. MSCI makes no express or implied warranties or representations and shall have no liability whatsoever with respect to any MSCI data contained herein. The MSCI data may not be further redistributed or used as a basis for other indexes or any securities or financial products. This report is not approved, reviewed, or produced by MSCI. You cannot invest directly in an index. |
| 3 | The Bloomberg Barclays U.S. Aggregate Bond Index (formerly known as Barclays U.S. Aggregate Bond Index) is a broad-based benchmark that measures the investment-grade, U.S. dollar–denominated, fixed-rate taxable bond market, including Treasuries, government-related and corporate securities, mortgage-backed securities (agency fixed-rate and hybrid adjustable-rate mortgage pass-throughs), asset-backed securities, and commercial mortgage-backed securities. You cannot invest directly in an index. |
| | | | | | |
| Letter to shareholders (unaudited) | | Wells Fargo C&B Mid Cap Value Fund | | | 3 | |
from a mindset of very gradual interest-rate increases by the Fed to an anticipation of three or four increases in 2017. The first of these occurred in March; Fed officials raised their short-term target rate by a quarter percentage point to between 0.75% and 1.00%. With the Fed’s target-rate increase, short-term bond yields rose during the quarter. Meanwhile, longer-term Treasury yields were little changed, leading to positive performance. Investment-grade and high-yield bonds benefited from strong demand. Municipal bond returns were positive in the quarter, helped by strong demand and constrained new-issue supply. Outside of the U.S., credit spreads narrowed, helping lower-quality credit outperform amid a strong demand for yield. Also, stocks in emerging markets generally outperformed stocks in the U.S. and international developed markets. Thus far in 2017, emerging markets overall have benefited from both global economic growth and recent weakening in the U.S. dollar. European stocks also outperformed the U.S. market, despite investors’ concern over uncertainties such as the potential impact of an upcoming election in France; a contender for president of France, Marine Le Pen, favored exiting the European Union, which could potentially destabilize or topple the organization.
Don’t let short-term uncertainty derail long-term investment goals.
Periods of uncertainty can present challenges, but experience has taught us that maintaining long-term investment goals can be an effective way to plan for the future. To help you create a sound strategy based on your personal goals and risk tolerance, Wells Fargo Funds offers more than 100 mutual funds spanning a wide range of asset classes and investment styles. Although diversification cannot guarantee an investment profit or prevent losses, we believe it can be an effective way to manage investment risk and potentially smooth out overall portfolio performance. We encourage investors to know their investments and to understand that appropriate levels of risk-taking may unlock opportunities.
Thank you for choosing to invest in Wells Fargo Funds. We appreciate your confidence in us and remain committed to helping you meet your financial needs.
Sincerely,

Andrew Owen
President
Wells Fargo Funds
Although diversification cannot guarantee an investment profit or prevent losses, we believe it can be an effective way to manage investment risk and potentially smooth out overall portfolio performance.
For further information about your Fund, contact your investment professional, visit our website at wellsfargofunds.com, or call us directly at 1-800-222-8222. We are available 24 hours a day, 7 days a week.
| | | | |
| 4 | | Wells Fargo C&B Mid Cap Value Fund | | Performance highlights (unaudited) |
Investment objective
The Fund seeks maximum long-term total return (current income and capital appreciation), consistent with minimizing risk to principal.
Manager
Wells Fargo Funds Management, LLC
Subadviser
Cooke and Bieler, L.P.
Portfolio managers
Andrew B. Armstrong, CFA®
Steve Lyons, CFA®
Michael M. Meyer, CFA®
Edward W. O’Connor, CFA®
R. James O’Neil, CFA®
Mehul Trivedi, CFA®
William Weber, CFA®
Average annual total returns (%) as of March 31, 2017
| | | | | | | | | | | | | | | | | | | | | | | | | | | | | | | | | | |
| | | | | Including sales charge | | | Excluding sales charge | | | Expense ratios1 (%) | |
| | | Inception date | | 1 year | | | 5 year | | | 10 year | | | 1 year | | | 5 year | | | 10 year | | | Gross | | | Net2 | |
| Class A (CBMAX) | | 7-26-2004 | | | 15.05 | | | | 12.00 | | | | 6.02 | | | | 22.09 | | | | 13.33 | | | | 6.65 | | | | 1.33 | | | | 1.25 | |
| Class C (CBMCX) | | 7-26-2004 | | | 20.16 | | | | 12.48 | | | | 5.85 | | | | 21.16 | | | | 12.48 | | | | 5.85 | | | | 2.08 | | | | 2.00 | |
| Administrator Class (CBMIX) | | 7-26-2004 | | | – | | | | – | | | | – | | | | 22.19 | | | | 13.40 | | | | 6.73 | | | | 1.25 | | | | 1.15 | |
| Institutional Class (CBMSX) | | 7-26-2004 | | | – | | | | – | | | | – | | | | 22.50 | | | | 13.69 | | | | 7.00 | | | | 1.00 | | | | 0.90 | |
| Russell Midcap® Value Index3 | | – | | | – | | | | – | | | | – | | | | 19.82 | | | | 14.07 | | | | 7.47 | | | | – | | | | – | |
Figures quoted represent past performance, which is no guarantee of future results, and do not reflect taxes that a shareholder may pay on fund distributions or the redemption of fund shares. Investment return and principal value of an investment will fluctuate so that an investor’s shares, when redeemed, may be worth more or less than their original cost. Performance shown without sales charges would be lower if sales charges were reflected. Current performance may be lower or higher than the performance data quoted, which assumes the reinvestment of dividends and capital gains. Current month-end performance is available on the Fund’s website, wellsfargofunds.com.
Index returns do not include transaction costs associated with buying and selling securities, any mutual fund fees or expenses, or any taxes. It is not possible to invest directly in an index.
For Class A shares, the maximum front-end sales charge is 5.75%. For Class C shares, the maximum contingent deferred sales charge is 1.00%. Performance including a contingent deferred sales charge assumes the sales charge for the corresponding time period. Administrator Class and Institutional Class shares are sold without a front-end sales charge or contingent deferred sales charge.
Stock values fluctuate in response to the activities of individual companies and general market and economic conditions. Smaller-company stocks tend to be more volatile and less liquid than those of larger companies. Consult the Fund’s prospectus for additional information on these and other risks.
Please see footnotes on page 5.
| | | | | | |
| Performance highlights (unaudited) | | Wells Fargo C&B Mid Cap Value Fund | | | 5 | |
| | | | |
| Ten largest holdings (%) as of March 31, 20174 | |
Gildan Activewear Incorporated | | | 3.34 | |
First Cash Financial Services Incorporated | | | 3.27 | |
AerCap Holdings NV | | | 3.03 | |
Laboratory Corporation of America Holdings | | | 2.96 | |
FNF Group | | | 2.91 | |
MEDNAX Incorporated | | | 2.81 | |
RenaissanceRe Holdings Limited | | | 2.80 | |
Axalta Coating Systems Limited | | | 2.61 | |
Omnicom Group Incorporated | | | 2.56 | |
Whirlpool Corporation | | | 2.51 | |
|
| Sector distribution as of March 31, 20175 |
|
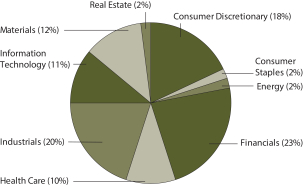 |
| 1 | Reflects the expense ratios as stated in the most recent prospectuses. The expense ratios shown are subject to change and may differ from the annualized expense ratios shown in the financial highlights of this report. |
| 2 | The manager has contractually committed through January 31, 2018, to waive fees and/or reimburse expenses to the extent necessary to cap the Fund’s Total Annual Fund Operating Expenses After Fee Waivers at the amounts shown. After this time, the cap may be increased or the commitment to maintain the cap may be terminated only with the approval of the Board of Trustees. Brokerage commissions, stamp duty fees, interest, taxes, acquired fund fees and expenses, and extraordinary expenses are excluded from the expense cap. Without this cap, the Fund’s returns would have been lower. The expense ratio paid by an investor is the net expense ratio or the Fund’s Total Annual Fund Operating Expenses After Fee Waivers, as stated in the prospectuses. |
| 3 | The Russell Midcap® Value Index measures the performance of those Russell Midcap companies with lower price/book ratios and lower forecasted growth values. The stocks are also members of the Russell 1000® Value Index. You cannot invest directly in an index. |
| 4 | The ten largest holdings, excluding cash and cash equivalents, are calculated based on the value of the investments divided by total net assets of the Fund. Holdings are subject to change and may have changed since the date specified. |
| 5 | Amounts are calculated based on the total long-term investments of the Fund. These amounts are subject to change and may have changed since the date specified. |
| | | | |
| 6 | | Wells Fargo C&B Mid Cap Value Fund | | Fund expenses (unaudited) |
As a shareholder of the Fund, you incur two types of costs: (1) transaction costs, including sales charges (loads) on purchase payments and contingent deferred sales charges (if any) on redemptions and (2) ongoing costs, including management fees, distribution (12b-1) and/or shareholder servicing fees, and other Fund expenses. This example is intended to help you understand your ongoing costs (in dollars) of investing in the Fund and to compare these costs with the ongoing costs of investing in other mutual funds.
The example is based on an investment of $1,000 invested at the beginning of the six-month period and held for the entire period from October 1, 2016 to March 31, 2017.
Actual expenses
The “Actual” line of the table below provides information about actual account values and actual expenses. You may use the information in this line, together with the amount you invested, to estimate the expenses that you paid over the period. Simply divide your account value by $1,000 (for example, an $8,600 account value divided by $1,000 = 8.6), then multiply the result by the number in the “Actual” line under the heading entitled “Expenses paid during period” for your applicable class of shares to estimate the expenses you paid on your account during this period.
Hypothetical example for comparison purposes
The “Hypothetical” line of the table below provides information about hypothetical account values and hypothetical expenses based on the Fund’s actual expense ratio and an assumed rate of return of 5% per year before expenses, which is not the Fund’s actual return. The hypothetical account values and expenses may not be used to estimate the actual ending account balance or expenses you paid for the period. You may use this information to compare the ongoing costs of investing in the Fund and other funds. To do so, compare this 5% hypothetical example with the 5% hypothetical examples that appear in the shareholder reports of the other funds.
Please note that the expenses shown in the table are meant to highlight your ongoing costs only and do not reflect any transactional costs, such as sales charges (loads) and contingent deferred sales charges. Therefore, the “Hypothetical” line of the table is useful in comparing ongoing costs only and will not help you determine the relative total costs of owning different funds. In addition, if these transactional costs were included, your costs would have been higher.
| | | | | | | | | | | | | | | | |
| | | Beginning
account value
10-1-2016 | | | Ending
account value
3-31-2017 | | | Expenses
paid during
the period¹ | | | Annualized net
expense ratio | |
Class A | | | | | | | | | | | | | | | | |
Actual | | $ | 1,000.00 | | | $ | 1,125.77 | | | $ | 6.62 | | | | 1.25 | % |
Hypothetical (5% return before expenses) | | $ | 1,000.00 | | | $ | 1,018.70 | | | $ | 6.29 | | | | 1.25 | % |
Class C | | | | | | | | | | | | | | | | |
Actual | | $ | 1,000.00 | | | $ | 1,121.45 | | | $ | 10.58 | | | | 2.00 | % |
Hypothetical (5% return before expenses) | | $ | 1,000.00 | | | $ | 1,014.96 | | | $ | 10.05 | | | | 2.00 | % |
Administrator Class | | | | | | | | | | | | | | | | |
Actual | | $ | 1,000.00 | | | $ | 1,126.24 | | | $ | 6.10 | | | | 1.15 | % |
Hypothetical (5% return before expenses) | | $ | 1,000.00 | | | $ | 1,019.20 | | | $ | 5.79 | | | | 1.15 | % |
Institutional Class | | | | | | | | | | | | | | | | |
Actual | | $ | 1,000.00 | | | $ | 1,127.54 | | | $ | 4.77 | | | | 0.90 | % |
Hypothetical (5% return before expenses) | | $ | 1,000.00 | | | $ | 1,020.44 | | | $ | 4.53 | | | | 0.90 | % |
| 1 | Expenses paid is equal to the annualized net expense ratio of each class multiplied by the average account value over the period, multiplied by the number of days in the most recent fiscal half-year divided by the number of days in the fiscal year (to reflect the one-half-year period). |
| | | | | | |
| Portfolio of investments—March 31, 2017 (unaudited) | | Wells Fargo C&B Mid Cap Value Fund | | | 7 | |
| | | | | | | | | | | | | | | | |
| Security name | | | | | | | | Shares | | | Value | |
| | | | |
Common Stocks: 95.12% | | | | | | | | | | | | | | | | |
| | | | |
Consumer Discretionary: 16.87% | | | | | | | | | | | | | | | | |
| | | | |
| Automobiles: 1.13% | | | | | | | | | | | | | | | | |
Winnebago Industries Incorporated « | | | | | | | | | | | 96,600 | | | $ | 2,825,550 | |
| | | | | | | | | | | | | | | | |
| | | | |
| Hotels, Restaurants & Leisure: 1.10% | | | | | | | | | | | | | | | | |
Brinker International Incorporated « | | | | | | | | | | | 62,700 | | | | 2,756,292 | |
| | | | | | | | | | | | | | | | |
| | | | |
| Household Durables: 4.07% | | | | | | | | | | | | | | | | |
Helen of Troy Limited † | | | | | | | | | | | 41,400 | | | | 3,899,880 | |
Whirlpool Corporation | | | | | | | | | | | 36,700 | | | | 6,287,811 | |
| | | | |
| | | | | | | | | | | | | | | 10,187,691 | |
| | | | | | | | | | | | | | | | |
| | | | |
| Media: 2.56% | | | | | | | | | | | | | | | | |
Omnicom Group Incorporated | | | | | | | | | | | 74,500 | | | | 6,422,645 | |
| | | | | | | | | | | | | | | | |
| | | | |
| Specialty Retail: 2.57% | | | | | | | | | | | | | | | | |
Penske Auto Group Incorporated | | | | | | | | | | | 34,100 | | | | 1,596,221 | |
Sally Beauty Holdings Incorporated † | | | | | | | | | | | 236,300 | | | | 4,829,972 | |
| | | | |
| | | | | | | | | | | | | | | 6,426,193 | |
| | | | | | | | | | | | | | | | |
| | | | |
| Textiles, Apparel & Luxury Goods: 5.44% | | | | | | | | | | | | | | | | |
Gildan Activewear Incorporated | | | | | | | | | | | 309,600 | | | | 8,371,584 | |
HanesBrands Incorporated « | | | | | | | | | | | 253,400 | | | | 5,260,584 | |
| | | | |
| | | | | | | | | | | | | | | 13,632,168 | |
| | | | | | | | | | | | | | | | |
| | | | |
Consumer Staples: 1.93% | | | | | | | | | | | | | | | | |
| | | | |
| Food & Staples Retailing: 1.93% | | | | | | | | | | | | | | | | |
United Natural Foods Incorporated † | | | | | | | | | | | 112,000 | | | | 4,841,760 | |
| | | | | | | | | | | | | | | | |
| | | | |
Energy: 1.64% | | | | | | | | | | | | | | | | |
| | | | |
| Oil, Gas & Consumable Fuels: 1.64% | | | | | | | | | | | | | | | | |
World Fuel Services Corporation | | | | | | | | | | | 113,300 | | | | 4,107,125 | |
| | | | | | | | | | | | | | | | |
| | | | |
Financials: 22.04% | | | | | | | | | | | | | | | | |
| | | | |
| Banks: 4.86% | | | | | | | | | | | | | | | | |
Commerce Bancshares Incorporated | | | | | | | | | | | 43,003 | | | | 2,415,048 | |
SVB Financial Group † | | | | | | | | | | | 19,400 | | | | 3,610,146 | |
TCF Financial Corporation | | | | | | | | | | | 360,600 | | | | 6,137,412 | |
| | | | |
| | | | | | | | | | | | | | | 12,162,606 | |
| | | | | | | | | | | | | | | | |
| | | | |
| Capital Markets: 2.38% | | | | | | | | | | | | | | | | |
State Street Corporation | | | | | | | | | | | 74,800 | | | | 5,954,828 | |
| | | | | | | | | | | | | | | | |
| | | | |
| Consumer Finance: 5.61% | | | | | | | | | | | | | | | | |
First Cash Financial Services Incorporated | | | | | | | | | | | 166,700 | | | | 8,193,305 | |
PRA Group Incorporated † | | | | | | | | | | | 177,100 | | | | 5,870,865 | |
| | | | |
| | | | | | | | | | | | | | | 14,064,170 | |
| | | | | | | | | | | | | | | | |
The accompanying notes are an integral part of these financial statements.
| | | | |
| 8 | | Wells Fargo C&B Mid Cap Value Fund | | Portfolio of investments—March 31, 2017 (unaudited) |
| | | | | | | | | | | | | | | | |
| Security name | | | | | | | | Shares | | | Value | |
| | | | |
| Insurance: 9.19% | | | | | | | | | | | | | | | | |
FNF Group | | | | | | | | | | | 187,400 | | | $ | 7,297,356 | |
RenaissanceRe Holdings Limited | | | | | | | | | | | 48,500 | | | | 7,015,525 | |
The Progressive Corporation | | | | | | | | | | | 157,700 | | | | 6,178,686 | |
Torchmark Corporation | | | | | | | | | | | 32,800 | | | | 2,526,912 | |
| | | | |
| | | | | | | | | | | | | | | 23,018,479 | |
| | | | | | | | | | | | | | | | |
| | | | |
Health Care: 9.95% | | | | | | | | | | | | | | | | |
| | | | |
| Health Care Providers & Services: 8.09% | | | | | | | | | | | | | | | | |
Cardinal Health Incorporated | | | | | | | | | | | 71,200 | | | | 5,806,360 | |
Laboratory Corporation of America Holdings † | | | | | | | | | | | 51,700 | | | | 7,417,399 | |
MEDNAX Incorporated † | | | | | | | | | | | 101,400 | | | | 7,035,132 | |
| | | | |
| | | | | | | | | | | | | | | 20,258,891 | |
| | | | | | | | | | | | | | | | |
| | | | |
| Pharmaceuticals: 1.86% | | | | | | | | | | | | | | | | |
Perrigo Company plc « | | | | | | | | | | | 70,400 | | | | 4,673,856 | |
| | | | | | | | | | | | | | | | |
| | | | |
Industrials: 19.59% | | | | | | | | | | | | | | | | |
| | | | |
| Aerospace & Defense: 2.06% | | | | | | | | | | | | | | | | |
Rockwell Collins Incorporated | | | | | | | | | | | 53,000 | | | | 5,149,480 | |
| | | | | | | | | | | | | | | | |
| | | | |
| Building Products: 2.06% | | | | | | | | | | | | | | | | |
Quanex Building Products Corporation | | | | | | | | | | | 254,700 | | | | 5,157,675 | |
| | | | | | | | | | | | | | | | |
| | | | |
| Commercial Services & Supplies: 1.65% | | | | | | | | | | | | | | | | |
Tetra Tech Incorporated | | | | | | | | | | | 101,200 | | | | 4,134,020 | |
| | | | | | | | | | | | | | | | |
| | | | |
| Electrical Equipment: 4.52% | | | | | | | | | | | | | | | | |
AMETEK Incorporated | | | | | | | | | | | 95,500 | | | | 5,164,640 | |
Eaton Corporation plc | | | | | | | | | | | 83,000 | | | | 6,154,450 | |
| |
| | | | 11,319,090 | |
| | | | | | | | | | | | | | | | |
| | | | |
| Machinery: 6.27% | | | | | | | | | | | | | | | | |
Donaldson Company Incorporated | | | | | | | | | | | 76,600 | | | | 3,486,832 | |
Graco Incorporated | | | | | | | | | | | 41,500 | | | | 3,906,810 | |
Parker-Hannifin Corporation | | | | | | | | | | | 23,000 | | | | 3,687,360 | |
Woodward Governor Company | | | | | | | | | | | 67,900 | | | | 4,611,768 | |
| |
| | | | 15,692,770 | |
| | | | | | | | | | | | | | | | |
| | | | |
| Trading Companies & Distributors: 3.03% | | | | | | | | | | | | | | | | |
AerCap Holdings NV † | | | | | | | | | | | 165,300 | | | | 7,598,841 | |
| | | | | | | | | | | | | | | | |
| | | | |
Information Technology: 10.13% | | | | | | | | | | | | | | | | |
| | | | |
| Electronic Equipment, Instruments & Components: 1.04% | | | | | | | | | | | | | | | | |
TE Connectivity Limited | | | | | | | | | | | 35,000 | | | | 2,609,250 | |
| | | | | | | | | | | | | | | | |
| | | | |
| IT Services: 7.24% | | | | | | | | | | | | | | | | |
Alliance Data Systems Corporation | | | | | | | | | | | 20,800 | | | | 5,179,200 | |
Genpact Limited | | | | | | | | | | | 210,500 | | | | 5,211,980 | |
Moneygram International Incorporated † | | | | | | | | | | | 309,400 | | | | 5,201,014 | |
The Western Union Company « | | | | | | | | | | | 124,700 | | | | 2,537,645 | |
| |
| | | | 18,129,839 | |
| | | | | | | | | | | | | | | | |
The accompanying notes are an integral part of these financial statements.
| | | | | | |
| Portfolio of investments—March 31, 2017 (unaudited) | | Wells Fargo C&B Mid Cap Value Fund | | | 9 | |
| | | | | | | | | | | | | | | | |
| Security name | | | | | | | | Shares | | | Value | |
| | | | |
| Semiconductors & Semiconductor Equipment: 1.85% | | | | | | | | | | | | | | | | |
Analog Devices Incorporated | | | | | | | | | | | 11,140 | | | $ | 912,923 | |
Entegris Incorporated † | | | | | | | | | | | 158,700 | | | | 3,713,580 | |
| |
| | | | 4,626,503 | |
| | | | | | | | | | | | | | | | |
| | | | |
Materials: 11.20% | | | | | | | | | | | | | | | | |
| | | | |
| Chemicals: 2.61% | | | | | | | | | | | | | | | | |
Axalta Coating Systems Limited † | | | | | | | | | | | 203,000 | | | | 6,536,600 | |
| | | | | | | | | | | | | | | | |
| | | | |
| Containers & Packaging: 4.45% | | | | | | | | | | | | | | | | |
Ball Corporation | | | | | | | | | | | 77,300 | | | | 5,740,298 | |
Crown Holdings Incorporated † | | | | | | | | | | | 102,300 | | | | 5,416,785 | |
| | | | |
| | | | | | | | | | | | | | | 11,157,083 | |
| | | | | | | | | | | | | | | | |
| | | | |
| Metals & Mining: 1.80% | | | | | | | | | | | | | | | | |
Reliance Steel & Aluminum Company | | | | | | | | | | | 56,200 | | | | 4,497,124 | |
| | | | | | | | | | | | | | | | |
| | | | |
| Paper & Forest Products: 2.34% | | | | | | | | | | | | | | | | |
Schweitzer-Mauduit International Incorporated | | | | | | | | | | | 141,200 | | | | 5,848,504 | |
| | | | | | | | | | | | | | | | |
| | | | |
Real Estate: 1.77% | | | | | | | | | | | | | | | | |
| | | | |
| Real Estate Management & Development: 1.77% | | | | | | | | | | | | | | | | |
CBRE Group Incorporated Class A † | | | | | | | | | | | 127,200 | | | | 4,425,288 | |
| | | | | | | | | | | | | | | | |
| |
Total Common Stocks (Cost $198,858,296) | | | | 238,214,321 | |
| | | | | | | | | | | | | | | | |
| | | | |
| | | Yield | | | | | | | | | | |
| Short-Term Investments: 12.49% | | | | | | | | | | | | | | | | |
| | | | |
| Investment Companies: 12.49% | | | | | | | | | | | | | | | | |
Securities Lending Cash Investment LLC (l)(r)(u) | | | 0.98 | % | | | | | | | 17,406,440 | | | | 17,408,181 | |
Wells Fargo Government Money Market Fund Select Class (l)(u) | | | 0.63 | | | | | | | | 13,888,929 | | | | 13,888,929 | |
| |
Total Short-Term Investments (Cost $31,296,871) | | | | 31,297,110 | |
| | | | | | | | | | | | | | | | |
| | | | | | | | |
| Total investments in securities (Cost $230,155,167) * | | | 107.61 | % | | | 269,511,431 | |
Other assets and liabilities, net | | | (7.61 | ) | | | (19,067,584 | ) |
| | | | | | | | |
| Total net assets | | | 100.00 | % | | $ | 250,443,847 | |
| | | | | | | | |
| « | All or a portion of this security is on loan. |
| † | Non-income-earning security |
| (l) | The issuer of the security is an affiliated person of the Fund as defined in the Investment Company Act of 1940. |
| (r) | The investment is a non-registered investment vehicle purchased with cash collateral received from securities on loan. |
| (u) | The rate represents the 7-day annualized yield at period end. |
| * | Cost for federal income tax purposes is $230,841,962 and unrealized gains (losses) consists of: |
| | | | |
Gross unrealized gains | | $ | 42,640,377 | |
Gross unrealized losses | | | (3,970,908 | ) |
| | | | |
Net unrealized gains | | $ | 38,669,469 | |
The accompanying notes are an integral part of these financial statements.
| | | | |
| 10 | | Wells Fargo C&B Mid Cap Value Fund | | Statement of assets and liabilities—March 31, 2017 (unaudited) |
| | | | |
| | | | |
| |
Assets | | | | |
Investments | | | | |
In unaffiliated securities (including $16,990,292 of securities loaned), at value (cost $198,858,296) | | $ | 238,214,321 | |
In affiliated securities, at value (cost $31,296,871) | | | 31,297,110 | |
| | | | |
Total investments, at value (cost $230,155,167) | | | 269,511,431 | |
Receivable for Fund shares sold | | | 459,508 | |
Receivable for dividends | | | 195,673 | |
Receivable for securities lending income | | | 3,527 | |
Prepaid expenses and other assets | | | 31,823 | |
| | | | |
Total assets | | | 270,201,962 | |
| | | | |
| |
Liabilities | | | | |
Payable for investments purchased | | | 1,457,544 | |
Payable for Fund shares redeemed | | | 603,064 | |
Payable upon receipt of securities loaned | | | 17,407,575 | |
Management fee payable | | | 156,754 | |
Distribution fees payable | | | 5,868 | |
Administration fees payable | | | 38,224 | |
Accrued expenses and other liabilities | | | 89,086 | |
| | | | |
Total liabilities | | | 19,758,115 | |
| | | | |
Total net assets | | $ | 250,443,847 | |
| | | | |
| |
NET ASSETS CONSIST OF | | | | |
Paid-in capital | | $ | 273,413,023 | |
Undistributed net investment income | | | 141,545 | |
Accumulated net realized losses on investments | | | (62,466,985 | ) |
Net unrealized gains on investments | | | 39,356,264 | |
| | | | |
Total net assets | | $ | 250,443,847 | |
| | | | |
| |
COMPUTATION OF NET ASSET VALUE AND OFFERING PRICE PER SHARE | | | | |
Net assets – Class A | | $ | 112,617,096 | |
Shares outstanding – Class A1 | | | 3,420,338 | |
Net asset value per share – Class A | | | $32.93 | |
Maximum offering price per share – Class A2 | | | $34.94 | |
Net assets – Class C | | $ | 8,679,905 | |
Shares outstanding – Class C1 | | | 278,110 | |
Net asset value per share – Class C | | | $31.21 | |
Net assets – Administrator Class | | $ | 10,002,819 | |
Shares outstanding – Administrator Class1 | | | 300,124 | |
Net asset value per share – Administrator Class | | | $33.33 | |
Net assets – Institutional Class | | $ | 119,144,027 | |
Shares outstanding – Institutional Class1 | | | 3,589,913 | |
Net asset value per share – Institutional Class | | | $33.19 | |
| 1 | The Fund has an unlimited number of authorized shares. |
| 2 | Maximum offering price is computed as 100/94.25 of net asset value. On investments of $50,000 or more, the offering price is reduced. |
The accompanying notes are an integral part of these financial statements.
| | | | | | |
| Statement of operations—six months ended March 31, 2017 (unaudited) | | Wells Fargo C&B Mid Cap Value Fund | | | 11 | |
| | | | |
| | | | |
|
Investment income | |
Dividends (net of foreign withholding taxes of $5,887) | | $ | 1,269,759 | |
Income from affiliated securities | | | 23,907 | |
Securities lending income, net | | | 19,445 | |
| | | | |
Total investment income | | | 1,313,111 | |
| | | | |
| |
Expenses | | | | |
Management fee | | | 751,435 | |
Administration fees | | | | |
Class A | | | 129,117 | |
Class B | | | 22 | 1 |
Class C | | | 8,471 | |
Administrator Class | | | 5,244 | |
Institutional Class | | | 39,818 | |
Shareholder servicing fees | | | | |
Class A | | | 153,711 | |
Class B | | | 26 | 1 |
Class C | | | 10,085 | |
Administrator Class | | | 10,084 | |
Distribution fees | | | | |
Class B | | | 78 | 1 |
Class C | | | 30,254 | |
Custody and accounting fees | | | 9,837 | |
Professional fees | | | 19,916 | |
Registration fees | | | 33,938 | |
Shareholder report expenses | | | 24,552 | |
Trustees’ fees and expenses | | | 7,884 | |
Other fees and expenses | | | 4,610 | |
| | | | |
Total expenses | | | 1,239,082 | |
Less: Fee waivers and/or expense reimbursements | | | (67,594 | ) |
| | | | |
Net expenses | | | 1,171,488 | |
| | | | |
Net investment income | | | 141,623 | |
| | | | |
| |
REALIZED AND UNREALIZED GAINS (LOSSES) ON INVESTMENTS | | | | |
| |
Net realized gains on: | | | | |
Unaffiliated securities | | | 12,141,149 | |
Affiliated securities | | | 367 | |
| | | | |
Net realized gains on investments | | | 12,141,516 | |
| | | | |
| |
Net change in unrealized gains (losses) on: | | | | |
Unaffiliated securities | | | 9,821,542 | |
Affiliated securities | | | 239 | |
| | | | |
Net change in unrealized gains (losses) on investments | | | 9,821,781 | |
| | | | |
Net realized and unrealized gains (losses) on investments | | | 21,963,297 | |
| | | | |
Net increase in net assets resulting from operations | | $ | 22,104,920 | |
| | | | |
| 1 | For the period from October 1, 2016 to December 5, 2016. Effective at the close of business on December 5, 2016, Class B shares were converted to Class A shares and are no longer offered by the Fund. |
The accompanying notes are an integral part of these financial statements.
| | | | |
| 12 | | Wells Fargo C&B Mid Cap Value Fund | | Statement of changes in net assets |
| | | | | | | | | | | | | | | | |
| | | Six months ended
March 31, 2017
(unaudited) | | | Year ended
September 30, 2016 | |
| | | | |
Operations | | | | | | | | | | | | | | | | |
Net investment income | | | | | | $ | 141,623 | | | | | | | $ | 366,395 | |
Net realized gains on investments | | | | | | | 12,141,516 | | | | | | | | 7,300,682 | |
Net change in unrealized gains (losses) on investments | | | | | | | 9,821,781 | | | | | | | | 17,600,698 | |
| | | | |
Net increase in net assets resulting from operations | | | | | | | 22,104,920 | | | | | | | | 25,267,775 | |
| | | | |
| | | | |
Distributions to shareholders from | | | | | | | | | | | | | | | | |
Net investment income | | | | | | | | | | | | | | | | |
Class A | | | | | | | (83,058 | ) | | | | | | | (221,257 | ) |
Administrator Class | | | | | | | (9,681 | ) | | | | | | | (20,557 | ) |
Institutional Class | | | | | | | (150,215 | ) | | | | | | | (109,235 | ) |
| | | | |
Total distributions to shareholders | | | | | | | (242,954 | ) | | | | | | | (351,049 | ) |
| | | | |
| | | | |
Capital share transactions | | | Shares | | | | | | | | Shares | | | | | |
Proceeds from shares sold | | | | | | | | | | | | | | | | |
Class A | | | 214,476 | | | | 6,805,462 | | | | 4,470,268 | | | | 119,152,053 | |
Class C | | | 40,144 | | | | 1,217,157 | | | | 34,688 | | | | 897,420 | |
Administrator Class | | | 96,223 | | | | 3,111,745 | | | | 23,525 | | | | 632,143 | |
Institutional Class | | | 2,606,757 | | | | 85,446,079 | | | | 948,461 | | | | 26,675,954 | |
Investor Class | | | NA | | | | NA | | | | 29,800 | 1 | | | 784,378 | 1 |
| | | | |
| | | | | | | 96,580,443 | | | | | | | | 148,141,948 | |
| | | | |
Reinvestment of distributions | | | | | | | | | | | | | | | | |
Class A | | | 2,574 | | | | 82,120 | | | | 8,427 | | | | 219,598 | |
Administrator Class | | | 154 | | | | 4,968 | | | | 474 | | | | 12,485 | |
Institutional Class | | | 3,867 | | | | 124,207 | | | | 2,752 | | | | 72,162 | |
| | | | |
| | | | | | | 211,295 | | | | | | | | 304,245 | |
| | | | |
Payment for shares redeemed | | | | | | | | | | | | | | | | |
Class A | | | (896,894 | ) | | | (28,818,259 | ) | | | (1,169,247 | ) | | | (32,299,187 | ) |
Class B | | | (2,793 | )2 | | | (82,744 | )2 | | | (1,734 | ) | | | (44,690 | ) |
Class C | | | (24,830 | ) | | | (743,841 | ) | | | (52,342 | ) | | | (1,354,172 | ) |
Administrator Class | | | (76,431 | ) | | | (2,444,437 | ) | | | (126,420 | ) | | | (3,361,427 | ) |
Institutional Class | | | (312,961 | ) | | | (9,995,955 | ) | | | (378,243 | ) | | | (10,129,726 | ) |
Investor Class | | | NA | | | | NA | | | | (4,103,703 | )1 | | | (109,800,701 | )1 |
| | | | |
| | | | | | | (42,085,236 | ) | | | | | | | (156,989,903 | ) |
| | | | |
Net increase (decrease) in net assets resulting from capital share transactions | | | | | | | 54,706,502 | | | | | | | | (8,543,710 | ) |
| | | | |
Total increase in net assets | | | | | | | 76,568,468 | | | | | | | | 16,373,016 | |
| | | | |
| | | |
Net assets | | | | | | | | | | | | |
Beginning of period | | | | | | | 173,875,379 | | | | | | | | 157,502,363 | |
| | | | |
End of period | | | | | | $ | 250,443,847 | | | | | | | $ | 173,875,379 | |
| | | | |
Undistributed net investment income | | | | | | $ | 141,545 | | | | | | | $ | 242,876 | |
| | | | |
| 1 | For the period from October 1, 2015 to October 23, 2015. Effective at the close of business on October 23, 2015, Investor Class shares were converted to Class A shares and are no longer offered by the Fund. |
| 2 | For the period from October 1, 2016 to December 5, 2016. Effective at the close of business on December 5, 2016, Class B shares were converted to Class A shares and are no longer offered by the Fund. |
The accompanying notes are an integral part of these financial statements.
| | | | | | |
| Financial highlights | | Wells Fargo C&B Mid Cap Value Fund | | | 13 | |
(For a share outstanding throughout each period)
| | | | | | | | | | | | | | | | | | | | | | | | |
| | | Six months ended
March 31, 2017 (unaudited) | | | Year ended September 30 | |
| CLASS A | | | 2016 | | | 2015 | | | 2014 | | | 2013 | | | 2012 | |
Net asset value, beginning of period | | | $29.27 | | | | $25.12 | | | | $25.26 | | | | $23.74 | | | | $18.22 | | | | $14.06 | |
Net investment income | | | 0.00 | 1,2 | | | 0.07 | 1 | | | 0.05 | 1 | | | 0.06 | | | | 0.10 | 1 | | | 0.16 | |
Net realized and unrealized gains (losses) on investments | | | 3.68 | | | | 4.13 | | | | (0.14 | ) | | | 1.55 | | | | 5.60 | | | | 4.10 | |
| | | | | | | | | | | | | | | | | | | | | | | | |
Total from investment operations | | | 3.68 | | | | 4.20 | | | | (0.09 | ) | | | 1.61 | | | | 5.70 | | | | 4.26 | |
Distributions to shareholders from | | | | | | | | | | | | | | | | | | | | |
Net investment income | | | (0.02 | ) | | | (0.05 | ) | | | (0.05 | ) | | | (0.09 | ) | | | (0.18 | ) | | | (0.10 | ) |
Net asset value, end of period | | | $32.93 | | | | $29.27 | | | | $25.12 | | | | $25.26 | | | | $23.74 | | | | $18.22 | |
Total return3 | | | 12.58 | % | | | 16.73 | % | | | (0.36 | )% | | | 6.78 | % | | | 31.59 | % | | | 30.42 | % |
Ratios to average net assets (annualized) | | | | | | | | | | | | | | | | | | | | |
Gross expenses | | | 1.31 | % | | | 1.33 | % | | | 1.35 | % | | | 1.35 | % | | | 1.38 | % | | | 1.38 | % |
Net expenses | | | 1.25 | % | | | 1.24 | % | | | 1.20 | % | | | 1.20 | % | | | 1.20 | % | | | 1.20 | % |
Net investment income | | | 0.01 | % | | | 0.27 | % | | | 0.18 | % | | | 0.24 | % | | | 0.49 | % | | | 0.97 | % |
Supplemental data | | | | | | | | | | | | | | | | | | | | |
Portfolio turnover rate | | | 58 | % | | | 35 | % | | | 41 | % | | | 55 | % | | | 48 | % | | | 25 | % |
Net assets, end of period (000s omitted) | | | $112,617 | | | | $120,020 | | | | $19,862 | | | | $21,465 | | | | $19,468 | | | | $13,466 | |
| 1 | Calculated based upon average shares outstanding |
| 2 | Amount is less than $0.005. |
| 3 | Total return calculations do not include any sales charges. Returns for periods of less than one year are not annualized. |
The accompanying notes are an integral part of these financial statements.
| | | | |
| 14 | | Wells Fargo C&B Mid Cap Value Fund | | Financial highlights |
(For a share outstanding throughout each period)
| | | | | | | | | | | | | | | | | | | | | | | | |
| | | Six months ended
March 31, 2017 (unaudited) | | | Year ended September 30 | |
| CLASS C | | | 2016 | | | 2015 | | | 2014 | | | 2013 | | | 2012 | |
Net asset value, beginning of period | | | $27.83 | | | | $24.02 | | | | $24.29 | | | | $22.92 | | | | $17.60 | | | | $13.59 | |
Net investment income (loss) | | | (0.03 | ) | | | (0.14 | )1 | | | (0.15 | )1 | | | (0.13 | )1 | | | (0.05 | )1 | | | 0.03 | 1 |
Net realized and unrealized gains (losses) on investments | | | 3.41 | | | | 3.95 | | | | (0.12 | ) | | | 1.50 | | | | 5.42 | | | | 3.98 | |
| | | | | | | | | | | | | | | | | | | | | | | | |
Total from investment operations | | | 3.38 | | | | 3.81 | | | | (0.27 | ) | | | 1.37 | | | | 5.37 | | | | 4.01 | |
Distributions to shareholders from | | | | | | | | | | | | | | | | | | | | |
Net investment income | | | 0.00 | | | | 0.00 | | | | 0.00 | | | | 0.00 | | | | (0.05 | ) | | | 0.00 | |
Net asset value, end of period | | | $31.21 | | | | $27.83 | | | | $24.02 | | | | $24.29 | | | | $22.92 | | | | $17.60 | |
Total return2 | | | 12.15 | % | | | 15.86 | % | | | (1.11 | )% | | | 5.98 | % | | | 30.58 | % | | | 29.51 | % |
Ratios to average net assets (annualized) | | | | | | | | | | | | | | | | | | | | |
Gross expenses | | | 2.06 | % | | | 2.08 | % | | | 2.10 | % | | | 2.10 | % | | | 2.13 | % | | | 2.13 | % |
Net expenses | | | 2.00 | % | | | 1.98 | % | | | 1.95 | % | | | 1.95 | % | | | 1.95 | % | | | 1.95 | % |
Net investment income (loss) | | | (0.71 | )% | | | (0.55 | )% | | | (0.57 | )% | | | (0.52 | )% | | | (0.26 | )% | | | 0.21 | % |
Supplemental data | | | | | | | | | | | | | | | | | | | | |
Portfolio turnover rate | | | 58 | % | | | 35 | % | | | 41 | % | | | 55 | % | | | 48 | % | | | 25 | % |
Net assets, end of period (000s omitted) | | | $8,680 | | | | $7,314 | | | | $6,737 | | | | $7,531 | | | | $7,598 | | | | $5,254 | |
| 1 | Calculated based upon average shares outstanding |
| 2 | Total return calculations do not include any sales charges. Returns for periods of less than one year are not annualized. |
The accompanying notes are an integral part of these financial statements.
| | | | | | |
| Financial highlights | | Wells Fargo C&B Mid Cap Value Fund | | | 15 | |
(For a share outstanding throughout each period)
| | | | | | | | | | | | | | | | | | | | | | | | |
| | | Six months ended
March 31, 2017 (unaudited) | | | Year ended September 30 | |
| ADMINISTRATOR CLASS | | | 2016 | | | 2015 | | | 2014 | | | 2013 | | | 2012 | |
Net asset value, beginning of period | | | $29.63 | | | | $25.42 | | | | $25.54 | | | | $24.01 | | | | $18.42 | | | | $14.22 | |
Net investment income | | | 0.02 | 1 | | | 0.08 | 1 | | | 0.06 | 1 | | | 0.07 | 1 | | | 0.11 | 1 | | | 0.17 | 1 |
Net realized and unrealized gains (losses) on investments | | | 3.72 | | | | 4.19 | | | | (0.13 | ) | | | 1.56 | | | | 5.67 | | | | 4.14 | |
| | | | | | | | | | | | | | | | | | | | | | | | |
Total from investment operations | | | 3.74 | | | | 4.27 | | | | (0.07 | ) | | | 1.63 | | | | 5.78 | | | | 4.31 | |
Distributions to shareholders from | | | | | | | | | | | | | | | | | | | | |
Net investment income | | | (0.04 | ) | | | (0.06 | ) | | | (0.05 | ) | | | (0.10 | ) | | | (0.19 | ) | | | (0.11 | ) |
Net asset value, end of period | | | $33.33 | | | | $29.63 | | | | $25.42 | | | | $25.54 | | | | $24.01 | | | | $18.42 | |
Total return2 | | | 12.62 | % | | | 16.82 | % | | | (0.30 | )% | | | 6.82 | % | | | 31.65 | % | | | 30.44 | % |
Ratios to average net assets (annualized) | | | | | | | | | | | | | | | | | | | | |
Gross expenses | | | 1.23 | % | | | 1.25 | % | | | 1.21 | % | | | 1.19 | % | | | 1.21 | % | | | 1.21 | % |
Net expenses | | | 1.15 | % | | | 1.15 | % | | | 1.15 | % | | | 1.15 | % | | | 1.15 | % | | | 1.15 | % |
Net investment income | | | 0.12 | % | | | 0.28 | % | | | 0.22 | % | | | 0.26 | % | | | 0.53 | % | | | 1.00 | % |
Supplemental data | | | | | | | | | | | | | | | | | | | | |
Portfolio turnover rate | | | 58 | % | | | 35 | % | | | 41 | % | | | 55 | % | | | 48 | % | | | 25 | % |
Net assets, end of period (000s omitted) | | | $10,003 | | | | $8,302 | | | | $9,725 | | | | $12,830 | | | | $19,525 | | | | $10,636 | |
| 1 | Calculated based upon average shares outstanding |
| 2 | Returns for periods of less than one year are not annualized. |
The accompanying notes are an integral part of these financial statements.
| | | | |
| 16 | | Wells Fargo C&B Mid Cap Value Fund | | Financial highlights |
(For a share outstanding throughout each period)
| | | | | | | | | | | | | | | | | | | | | | | | |
| | | Six months ended
March 31, 2017 (unaudited) | | | Year ended September 30 | |
| INSTITUTIONAL CLASS | | | 2016 | | | 2015 | | | 2014 | | | 2013 | | | 2012 | |
Net asset value, beginning of period | | | $29.53 | | | | $25.34 | | | | $25.49 | | | | $23.95 | | | | $18.38 | | | | $14.19 | |
Net investment income | | | 0.08 | 1 | | | 0.16 | | | | 0.10 | | | | 0.14 | | | | 0.17 | 1 | | | 0.23 | |
Net realized and unrealized gains (losses) on investments | | | 3.68 | | | | 4.17 | | | | (0.12 | ) | | | 1.55 | | | | 5.64 | | | | 4.11 | |
| | | | | | | | | | | | | | | | | | | | | | | | |
Total from investment operations | | | 3.76 | | | | 4.33 | | | | (0.02 | ) | | | 1.69 | | | | 5.81 | | | | 4.34 | |
Distributions to shareholders from | | | | | | | | | | | | | | | | | | | | |
Net investment income | | | (0.10 | ) | | | (0.14 | ) | | | (0.13 | ) | | | (0.15 | ) | | | (0.24 | ) | | | (0.15 | ) |
Net asset value, end of period | | | $33.19 | | | | $29.53 | | | | $25.34 | | | | $25.49 | | | | $23.95 | | | | $18.38 | |
Total return2 | | | 12.75 | % | | | 17.11 | % | | | (0.09 | )%3 | | | 7.09 | % | | | 31.98 | % | | | 30.80 | % |
Ratios to average net assets (annualized) | | | | | | | | | | | | | | | | | | | | |
Gross expenses | | | 0.98 | % | | | 1.00 | % | | | 0.94 | % | | | 0.92 | % | | | 0.95 | % | | | 0.95 | % |
Net expenses | | | 0.90 | % | | | 0.90 | % | | | 0.90 | % | | | 0.90 | % | | | 0.90 | % | | | 0.90 | % |
Net investment income | | | 0.51 | % | | | 0.54 | % | | | 0.47 | % | | | 0.54 | % | | | 0.82 | % | | | 1.31 | % |
Supplemental data | | | | | | | | | | | | | | | | | | | | |
Portfolio turnover rate | | | 58 | % | | | 35 | % | | | 41 | % | | | 55 | % | | | 48 | % | | | 25 | % |
Net assets, end of period (000s omitted) | | | $119,144 | | | | $38,161 | | | | $18,229 | | | | $33,881 | | | | $24,628 | | | | $24,983 | |
| 1 | Calculated based upon average shares outstanding |
| 2 | Returns for periods of less than one year are not annualized. |
| 3 | Total return reflects adjustments to conform with generally accepted accounting principles. |
The accompanying notes are an integral part of these financial statements.
| | | | | | |
| Notes to financial statements (unaudited) | | Wells Fargo C&B Mid Cap Value Fund | | | 17 | |
1. ORGANIZATION
Wells Fargo Funds Trust (the “Trust”), a Delaware statutory trust organized on March 10, 1999, is an open-end management investment company registered under the Investment Company Act of 1940, as amended (the “1940 Act”). As an investment company, the Trust follows the accounting and reporting guidance in Financial Accounting Standards Board (“FASB”) Accounting Standards Codification (“ASC”) Topic 946, Financial Services – Investment Companies. These financial statements report on the Wells Fargo C&B Mid Cap Value Fund (the “Fund”) which is a diversified series of the Trust.
Effective at the close of business on October 23, 2015, Investor Class shares became Class A shares in a tax-free conversion. Shareholders of Investor Class received Class A shares at a value equal to the value of their Investor Class shares immediately prior to the conversion. Investor Class shares are no longer offered by the Fund.
Effective at the close of business on December 5, 2016, Class B shares were converted to Class A shares and are no longer offered by the Fund. Information for Class B shares reflected in the financial statements represents activity through December 5, 2016.
2. SIGNIFICANT ACCOUNTING POLICIES
The following significant accounting policies, which are consistently followed in the preparation of the financial statements of the Fund, are in conformity with U.S. generally accepted accounting principles which require management to make estimates and assumptions that affect the reported amounts of assets and liabilities, disclosure of contingent assets and liabilities at the date of the financial statements, and the reported amounts of revenues and expenses during the reporting period. Actual results could differ from those estimates.
Securities valuation
All investments are valued each business day as of the close of regular trading on the New York Stock Exchange (generally 4 p.m. Eastern Time), although the Fund may deviate from this calculation time under unusual or unexpected circumstances.
Equity securities that are listed on a foreign or domestic exchange or market are valued at the official closing price or, if none, the last sales price. If no sale occurs on the principal exchange or market that day, the prior day’s price will be deemed “stale” and a fair value price will be determined in accordance with the Fund’s Valuation Procedures.
Investments in registered open-end investment companies are valued at net asset value. Interests in non-registered investment companies that are redeemable at net asset value are fair valued normally at net asset value.
Investments which are not valued using any of the methods discussed above are valued at their fair value, as determined in good faith by the Board of Trustees of the Fund. The Board of Trustees has established a Valuation Committee comprised of the Trustees and has delegated to it the authority to take any actions regarding the valuation of portfolio securities that the Valuation Committee deems necessary or appropriate, including determining the fair value of portfolio securities, unless the determination has been delegated to the Management Valuation Team of Wells Fargo Funds Management, LLC (“Funds Management”). The Board of Trustees retains the authority to make or ratify any valuation decisions or approve any changes to the Valuation Procedures as it deems appropriate. On a quarterly basis, the Board of Trustees receives reports on any valuation actions taken by the Valuation Committee or the Management Valuation Team which may include items for ratification.
Valuations of fair valued securities are compared to the next actual sales price when available, or other appropriate market values, to assess the continued appropriateness of the fair valuation methodologies used. These securities are fair valued on a day-to-day basis, taking into consideration changes to appropriate market information and any significant changes to the inputs considered in the valuation process until there is a readily available price provided on an exchange or by an independent pricing service. Valuations received from an independent pricing service or independent broker-dealer quotes are periodically validated by comparisons to most recent trades and valuations provided by other independent pricing services in addition to the review of prices by the manager and/or subadviser. Unobservable inputs used in determining fair valuations are identified based on the type of security, taking into consideration factors utilized by market participants in valuing the investment, knowledge about the issuer and the current market environment.
Security loans
The Fund may lend its securities from time to time in order to earn additional income in the form of fees or interest on securities received as collateral or the investment of any cash received as collateral. The Fund continues to receive interest or dividends on the securities loaned. The Fund receives collateral in the form of cash or securities with a value at least equal to the value of the securities on loan. The value of the loaned securities is determined at the close of each business day and any additional required collateral is delivered to the Fund on the next business day. In a securities lending transaction, the net asset value of the Fund will be affected by an increase or decrease in the value of the
| | | | |
| 18 | | Wells Fargo C&B Mid Cap Value Fund | | Notes to financial statements (unaudited) |
securities loaned and by an increase or decrease in the value of the instrument in which collateral is invested. The amount of securities lending activity undertaken by the Fund fluctuates from time to time. In the event of default or bankruptcy by the borrower, the Fund may be prevented from recovering the loaned securities or gaining access to the collateral or may experience delays or costs in doing so. In addition, the investment of any cash collateral received may lose all or part of its value. The Fund has the right under the lending agreement to recover the securities from the borrower on demand.
The Fund lends its securities through an unaffiliated securities lending agent. Cash collateral received in connection with its securities lending transactions is invested in Securities Lending Cash Investments, LLC (the “Securities Lending Fund”). The Securities Lending Fund is exempt from registration under Section 3(c)(7) of the 1940 Act and is managed by Funds Management and is subadvised by Wells Capital Management Incorporated (“WellsCap”), an affiliate of Funds Management and an indirect wholly owned subsidiary of Wells Fargo & Company (“Wells Fargo”). Funds Management receives an advisory fee starting at 0.05% and declining to 0.01% as the average daily net assets of the Securities Lending Fund increase. All of the fees received by Funds Management are paid to WellsCap for its services as subadviser. The Securities Lending Fund seeks to provide a positive return compared to the daily Fed Funds Open Rate by investing in high-quality, U.S. dollar-denominated short-term money market instruments. Securities Lending Fund investments are valued at the evaluated bid price provided by an independent pricing service. Income earned from investment in the Securities Lending Fund is included in securities lending income on the Statement of Operations.
Security transactions and income recognition
Securities transactions are recorded on a trade date basis. Realized gains or losses are recorded on the basis of identified cost.
Dividend income is recognized on the ex-dividend date. Dividend income is recorded net of foreign taxes withheld where recovery of such taxes is not assured.
Distributions to shareholders
Distributions to shareholders from net investment income and net realized gains, if any, are recorded on the ex-dividend date. Such distributions are determined in accordance with income tax regulations and may differ from U.S. generally accepted accounting principles. Dividend sources are estimated at the time of declaration. The tax character of distributions is determined as of the Fund’s fiscal year end. Therefore, a portion of the Fund’s distributions made prior the Fund’s fiscal year end may be categorized as a tax return of capital.
Federal and other taxes
The Fund intends to continue to qualify as a regulated investment company by distributing substantially all of its investment company taxable income and any net realized capital gains (after reduction for capital loss carryforwards) sufficient to relieve it from all, or substantially all, federal income taxes. Accordingly, no provision for federal income taxes was required.
The Fund’s income and federal excise tax returns and all financial records supporting those returns for the prior three fiscal years are subject to examination by the federal and Delaware revenue authorities. Management has analyzed the Fund’s tax positions taken on federal, state, and foreign tax returns for all open tax years and does not believe that there are any uncertain tax positions that require recognition of a tax liability.
As of September 30, 2016, the Fund had capital loss carryforwards available to offset future net realized capital gains in the amount of $74,123,891 with $54,905,219 expiring in 2017 and $19,218,672 expiring in 2018.
Class allocations
The separate classes of shares offered by the Fund differ principally in applicable sales charges, distribution, shareholder servicing, and administration fees. Class specific expenses are charged directly to that share class. Investment income, common expenses, and realized and unrealized gains (losses) on investments are allocated daily to each class of shares based on the relative proportion of net assets of each class.
3. FAIR VALUATION MEASUREMENTS
Fair value measurements of investments are determined within a framework that has established a fair value hierarchy based upon the various data inputs utilized in determining the value of the Fund’s investments. The three-level hierarchy gives the highest priority to unadjusted quoted prices in active markets for identical assets or liabilities (Level 1) and the lowest priority to unobservable inputs (Level 3). The Fund’s investments are classified within the fair value hierarchy based on the lowest level of input that is significant to the fair value measurement. The inputs are summarized into three broad levels as follows:
| | | | | | |
| Notes to financial statements (unaudited) | | Wells Fargo C&B Mid Cap Value Fund | | | 19 | |
| ∎ | | Level 1 – quoted prices in active markets for identical securities |
| ∎ | | Level 2 – other significant observable inputs (including quoted prices for similar securities, interest rates, prepayment speeds, credit risk, etc.) |
| ∎ | | Level 3 – significant unobservable inputs (including the Fund’s own assumptions in determining the fair value of investments) |
The inputs or methodologies used for valuing investments in securities are not necessarily an indication of the risk associated with investing in those securities.
The following is a summary of the inputs used in valuing the Fund’s assets and liabilities as of March 31, 2017:
| | | | | | | | | | | | | | | | |
| | | Quoted prices
(Level 1) | | | Other significant
observable inputs
(Level 2) | | | Significant
unobservable inputs (Level 3) | | | Total | |
Assets | | | | | | | | | | | | | | | | |
Investments in: | | | | | |
| | | | |
Common stocks | | | | | | | | | | | | | | | | |
Consumer discretionary | | $ | 42,250,539 | | | $ | 0 | | | $ | 0 | | | $ | 42,250,539 | |
Consumer staples | | | 4,841,760 | | | | 0 | | | | 0 | | | | 4,841,760 | |
Energy | | | 4,107,125 | | | | 0 | | | | 0 | | | | 4,107,125 | |
Financials | | | 55,200,083 | | | | 0 | | | | 0 | | | | 55,200,083 | |
Health care | | | 24,932,747 | | | | 0 | | | | 0 | | | | 24,932,747 | |
Industrials | | | 49,051,876 | | | | 0 | | | | 0 | | | | 49,051,876 | |
Information technology | | | 25,365,592 | | | | 0 | | | | 0 | | | | 25,365,592 | |
Materials | | | 28,039,311 | | | | 0 | | | | 0 | | | | 28,039,311 | |
Real estate | | | 4,425,288 | | | | 0 | | | | 0 | | | | 4,425,288 | |
| | | | |
Short-term investments | | | | | | | | | | | | | | | | |
Investment companies | | | 13,888,929 | | | | 0 | | | | 0 | | | | 13,888,929 | |
Investments measured at net asset value* | | | | | | | | | | | | | | | 17,408,181 | |
Total assets | | $ | 252,103,250 | | | $ | 0 | | | $ | 0 | | | $ | 269,511,431 | |
| * | Investments that are measured at fair value using the net asset value per share (or its equivalent) as a practical expedient have not been categorized in the fair value hierarchy. The fair value amount presented in the table is intended to permit reconciliation of the fair value hierarchy to the amounts presented in the Statement of Assets and Liabilities. The Fund’s investment in Securities Lending Cash Investments, LLC valued at $17,408,181 does not have a redemption period notice, can be redeemed daily and does not have any unfunded commitments. |
The Fund recognizes transfers between levels within the fair value hierarchy at the end of the reporting period. At March 31, 2017, the Fund did not have any transfers into/out of Level 1, Level 2, or Level 3.
4. TRANSACTIONS WITH AFFILIATES AND OTHER EXPENSES
Management fee
Funds Management, an indirect wholly owned subsidiary of Wells Fargo, is the manager of the Fund and provides advisory and fund-level administrative services under an investment management agreement. Under the investment management agreement, Funds Management is responsible for, among other services, implementing the investment objectives and strategies of the Fund, supervising the applicable subadviser, providing fund-level administrative services in connection with the Fund’s operations, and providing any other fund-level administrative services reasonably necessary for the operation of the Fund. As compensation for its services under the investment management agreement, Funds Management is entitled to receive an annual management fee starting at 0.75% and declining to 0.63% as the average daily net assets of the Fund increase. For the six months ended March 31, 2017, the management fee was equivalent to an annual rate of 0.75% of the Fund’s average daily net assets.
Funds Management has retained the services of a subadviser to provide daily portfolio management to the Fund. The fee for subadvisory services is borne by Funds Management. Cooke & Bieler, L.P. which is not an affiliate of Funds Management, is the subadviser to the Fund and is entitled to receive a fee from Funds Management at an annual rate starting at 0.45% and declining to 0.35% as the average daily net assets of the Fund increase.
| | | | |
| 20 | | Wells Fargo C&B Mid Cap Value Fund | | Notes to financial statements (unaudited) |
Administration fees
Under a class-level administration agreement, Funds Management provides class-level administrative services to the Fund, which includes paying fees and expenses for services provided by the transfer agent, sub-transfer agents, omnibus account servicers and record-keepers. As compensation for its services under the class-level administration agreement, Funds Management receives an annual fee which is calculated based on the average daily net assets of each class as follows:
| | | | |
| | | Class-level
administration fee | |
Class A, Class B, Class C | | | 0.21 | % |
Administrator Class, Institutional Class | | | 0.13 | |
Funds Management has contractually waived and/or reimbursed management and administration fees to the extent necessary to maintain certain net operating expense ratios for the Fund. Waiver of fees and/or reimbursement of expenses by Funds Management were made first from fund level expenses on a proportionate basis and then from class specific expenses. Funds Management has committed through January 31, 2018 to waive fees and/or reimburse expenses to the extent necessary to cap the Fund’s expenses at 1.25% for Class A shares, 2.00% for Class C shares, 1.15% for Administrator Class shares, and 0.90% for Institutional Class shares. After this time, the cap may be increased or the commitment to maintain the cap may be terminated only with the approval of the Board of Trustees.
During the six months ended March 31, 2017, State Street Bank and Trust Company, the Fund’s custodian, reimbursed the Fund $184 for certain out-of-pocket expenses that were billed to the Fund in error from 1998-2015. This amount is included in dividend income on the Statement of Operations. In addition, Funds Management was also reimbursed $3,033 for waivers/reimbursements it made to the Fund during the period the Fund was erroneously billed.
Distribution fees
The Trust has adopted a distribution plan for Class B and Class C shares of the Fund pursuant to Rule 12b-1 under the 1940 Act. Distribution fees are charged to Class B and Class C shares and paid to Wells Fargo Funds Distributor, LLC (“Funds Distributor”), the principal underwriter, at an annual rate of 0.75% of the average daily net assets of Class B and Class C shares.
In addition, Funds Distributor is entitled to receive the front-end sales charge from the purchase of Class A shares and a contingent deferred sales charge on the redemption of certain Class A shares. Funds Distributor is also entitled to receive the contingent deferred sales charges from redemptions of Class B and Class C shares. For the six months ended March 31, 2017, Funds Distributor received $1,450 from the sale of Class A shares.
Shareholder servicing fees
The Trust has entered into contracts with one or more shareholder servicing agents, whereby Class A, Class B, Class C, and Administrator Class of the Fund are charged a fee at an annual rate of 0.25% of the average daily net assets of each respective class.
A portion of these total shareholder servicing fees were paid to affiliates of Wells Fargo.
5. INVESTMENT PORTFOLIO TRANSACTIONS
Purchases and sales of investments, excluding U.S. government obligations (if any) and short-term securities, for the six months ended March 31, 2017 were $184,263,217 and $116,427,852, respectively.
The Fund may purchase or sell investment securities to other Wells Fargo affiliates pursuant to Rule 17a-7 of the 1940 Act and under procedures adopted by the Board of Trustees. The procedures have been designed to ensure that these interfund transactions, which generally do not incur broker commissions, are effected at current market prices. Interfund trades are included within the respective purchases and sales amounts shown.
6. BANK BORROWINGS
The Trust (excluding the money market funds and certain other funds) and Wells Fargo Variable Trust are parties to a $250,000,000 revolving credit agreement whereby the Fund is permitted to use bank borrowings for temporary or emergency purposes, such as to fund shareholder redemption requests. Interest under the credit agreement is charged to the Fund based on a borrowing rate equal to the higher of the Federal Funds rate in effect on that day plus 1.25% or the overnight LIBOR rate in effect on that day plus 1.25%. In addition, an annual commitment fee equal to 0.25% of the unused balance is allocated to each participating fund.
For the six months ended March 31, 2017, there were no borrowings by the Fund under the agreement.
| | | | | | |
| Notes to financial statements (unaudited) | | Wells Fargo C&B Mid Cap Value Fund | | | 21 | |
7. INDEMNIFICATION
Under the Trust’s organizational documents, the officers and Trustees have been granted certain indemnification rights against certain liabilities that may arise out of performance of their duties to the Trust. Additionally, in the normal course of business, the Trust may enter into contracts with service providers that contain a variety of indemnification clauses. The Trust’s maximum exposure under these arrangements is dependent on future claims that may be made against the Fund and, therefore, cannot be estimated.
8. NEW ACCOUNTING PRONOUNCEMENT
In December 2016, FASB issued Accounting Standards Update (“ASU”) No. 2016-19, Technical Corrections and Improvements. ASU 2016-19 includes an amendment to FASB ASC Topic 820, Fair Value Measurement which clarifies the difference between a valuation approach and a valuation technique. The amendment also requires an entity to disclose when there has been a change in either or both a valuation approach and/or a valuation technique. The disclosure requirements are effective for fiscal years and interim periods within those fiscal years beginning after December 15, 2016. Management is currently evaluating the potential impact of this new guidance to the financial statements.
9. REGULATORY CHANGES
In October 2016, the Securities and Exchange Commission (“SEC”) adopted new rules and forms and amended existing rules and forms (together, “final rules”) intended to modernize and enhance the reporting and disclosure of information by registered investment companies and to enhance liquidity risk management by open-end mutual funds and exchange-traded funds. The final rules will enhance the quality of information available to investors and will allow the SEC to more effectively collect and use data reported by funds. In part, the final rules amend Regulation S-X and require standardized, enhanced disclosure about derivatives in the Fund’s financial statements, as well as other amendments. The compliance date for the amendments to Regulation S-X is August 1, 2017 while the compliance date for the new form types is June 1, 2018 and the compliance date for the liquidity risk management program requirements is December 1, 2018. Management is currently assessing the potential impact of these enhancements and their impact on the financial statement disclosures and reporting requirements.
| | | | |
| 22 | | Wells Fargo C&B Mid Cap Value Fund | | Other information (unaudited) |
PROXY VOTING INFORMATION
A description of the policies and procedures that the Fund uses to determine how to vote proxies relating to portfolio securities is available, upon request, by calling 1-800-222-8222, visiting our website at wellsfargofunds.com, or visiting the SEC website at sec.gov. Information regarding how the Fund voted proxies relating to portfolio securities during the most recent 12-month period ended June 30 is available on the Fund’s website at wellsfargofunds.com or by visiting the SEC website at sec.gov.
PORTFOLIO HOLDINGS INFORMATION
The complete portfolio holdings for the Fund are publicly available monthly on the Fund’s website (wellsfargofunds.com), on a one-month delayed basis. In addition, top ten holdings information (excluding derivative positions) for the Fund is publicly available on the Fund’s website on a monthly, seven-day or more delayed basis. The Fund files its complete schedule of portfolio holdings with the SEC for the first and third quarters of each fiscal year on Form N-Q, which is available by visiting the SEC website at sec.gov. In addition, the Fund’s Form N-Q may be reviewed and copied at the SEC’s Public Reference Room in Washington, DC, and at regional offices in New York City, at 233 Broadway, and in Chicago, at 175 West Jackson Boulevard, Suite 900. Information about the Public Reference Room may be obtained by calling 1-800-SEC-0330.
| | | | | | |
| Other information (unaudited) | | Wells Fargo C&B Mid Cap Value Fund | | | 23 | |
BOARD OF TRUSTEES AND OFFICERS
Each of the Trustees and Officers1 listed in the table below acts in identical capacities for each fund in the Wells Fargo family of funds, which consists of 138 mutual funds comprising the Wells Fargo Funds Trust, Wells Fargo Variable Trust, Wells Fargo Master Trust and four closed-end funds (collectively the “Fund Complex”). This table should be read in conjunction with the Prospectus and the Statement of Additional Information2. The mailing address of each Trustee and Officer is 525 Market Street, 12th Floor, San Francisco, CA 94105. Each Trustee and Officer serves an indefinite term, however, each Trustee serves such term until reaching the mandatory retirement age established by the Trustees.
Independent Trustees
| | | | | | |
Name and year of birth | | Position held and length of service* | | Principal occupations during past five years or longer | | Current other public company or investment company directorships |
William R. Ebsworth (Born 1957) | | Trustee, since 2015 | | Retired. From 1984 to 2013, equities analyst, portfolio manager, research director and chief financial officer at Fidelity Management and Research Company in Boston, Tokyo, and Hong Kong and retired in 2013 as Chief Investment Officer of Fidelity Strategic Advisers, Inc. where he lead a team of investment professionals managing client assets. Prior thereto, Board member of Hong Kong Securities Clearing Co., Hong Kong Options Clearing Corp., the Thailand International Fund, Ltd., Fidelity Investments Life Insurance Company, and Empire Fidelity Investments Life Insurance Company. Board member of the Fonté Foundation (non-profit organization) and the Vincent Memorial Hospital Endowment (non-profit organization), where he serves on the Investment Committee and as a Chair of the Audit Committee. Mr. Ebsworth is a CFA® charterholder and an Adjunct Lecturer, Finance, at Babson College. | | Asset Allocation Trust |
Jane A. Freeman (Born 1953) | | Trustee, since 2015 | | Retired. From 2012 to 2014 and 1999 to 2008, Chief Financial Officer of Scientific Learning Corporation. From 2008 to 2012, Ms. Freeman provided consulting services related to strategic business projects. Prior to 1999, Portfolio Manager at Rockefeller & Co. and Scudder, Stevens & Clark. Board member of the Harding Loevner Funds from 1996 to 2014, serving as both Lead Independent Director and chair of the Audit Committee. Board member of the Russell Exchange Traded Funds Trust from 2011 to 2012 and the chair of the Audit Committee. Ms. Freeman is a Board Member of Ruth Bancroft Garden (non-profit organization) and an inactive chartered financial analyst. | | Asset Allocation Trust |
Peter G. Gordon** (Born 1942) | | Trustee, since 1998; Chairman, since 2005 | | Co-Founder, Retired Chairman, President and CEO of Crystal Geyser Water Company. Trustee Emeritus, Colby College. | | Asset Allocation Trust |
Isaiah Harris, Jr. (Born 1952) | | Trustee, since 2009 | | Retired. Chairman of the Board of CIGNA Corporation since 2009, and Director since 2005. From 2003 to 2011, Director of Deluxe Corporation. Prior thereto, President and CEO of BellSouth Advertising and Publishing Corp. from 2005 to 2007, President and CEO of BellSouth Enterprises from 2004 to 2005 and President of BellSouth Consumer Services from 2000 to 2003. Emeritus member of the Iowa State University Foundation Board of Governors. Emeritus Member of the Advisory Board of Iowa State University School of Business. Advisory Board Member, Palm Harbor Academy (charter school). Advisory Board Member, Child Evangelism Fellowship (non-profit). Mr. Harris is a certified public accountant (inactive status). | | CIGNA Corporation; Asset Allocation Trust |
Judith M. Johnson (Born 1949) | | Trustee, since 2008; Audit Committee Chairman, since 2008 | | Retired. Prior thereto, Chief Executive Officer and Chief Investment Officer of Minneapolis Employees Retirement Fund from 1996 to 2008. Ms. Johnson is an attorney, certified public accountant and a certified managerial accountant. | | Asset Allocation Trust |
David F. Larcker (Born 1950) | | Trustee, since 2009 | | James Irvin Miller Professor of Accounting at the Graduate School of Business, Stanford University, Director of the Corporate Governance Research Initiative and Senior Faculty of The Rock Center for Corporate Governance since 2006. From 2005 to 2008, Professor of Accounting at the Graduate School of Business, Stanford University. Prior thereto, Ernst & Young Professor of Accounting at The Wharton School, University of Pennsylvania from 1985 to 2005. | | Asset Allocation Trust |
| | | | |
| 24 | | Wells Fargo C&B Mid Cap Value Fund | | Other information (unaudited) |
| | | | | | |
Name and year of birth | | Position held and length of service* | | Principal occupations during past five years or longer | | Current other public company or investment company directorships |
Olivia S. Mitchell (Born 1953) | | Trustee, since 2006 | | International Foundation of Employee Benefit Plans Professor, Wharton School of the University of Pennsylvania since 1993. Director of Wharton’s Pension Research Council and Boettner Center on Pensions & Retirement Research, and Research Associate at the National Bureau of Economic Research. Previously, Cornell University Professor from 1978 to 1993. | | Asset Allocation Trust |
Timothy J. Penny (Born 1951) | | Trustee, since 1996 | | President and Chief Executive Officer of Southern Minnesota Initiative Foundation, a non-profit organization, since 2007 and Senior Fellow at the Humphrey Institute Policy Forum at the University of Minnesota since 1995. Member of the Board of Trustees of NorthStar Education Finance, Inc., a non-profit organization, since 2007. | | Asset Allocation Trust |
Michael S. Scofield (Born 1943) | | Trustee, since 2010 | | Served on the Investment Company Institute’s Board of Governors and Executive Committee from 2008-2011 as well the Governing Council of the Independent Directors Council from 2006-2011 and the Independent Directors Council Executive Committee from 2008-2011. Chairman of the IDC from 2008-2010. Institutional Investor (Fund Directions) Trustee of Year in 2007. Trustee of the Evergreen Funds complex (and its predecessors) from 1984 to 2010. Chairman of the Evergreen Funds from 2000-2010. Former Trustee of the Mentor Funds. Retired Attorney, Law Offices of Michael S. Scofield. | | Asset Allocation Trust |
| * | Length of service dates reflect the Trustee’s commencement of service with the Trust’s predecessor entities, where applicable. |
| ** | Peter Gordon is expected to retire on December 31, 2017. |
Officers
| | | | | | |
Name and year of birth | | Position held and length of service | | Principal occupations during past five years or longer | | |
Andrew Owen (Born 1960) | | President, since 2017 | | Executive Vice President of Wells Fargo Bank, N.A. and President of Wells Fargo & Company and Head of Affiliated Managers, Wells Fargo Asset Management, since 2014. Executive Vice President responsible for marketing, investments and product development for Wells Fargo Funds Management, LLC, from 2009 to 2014. | | |
Nancy Wiser1 (Born 1967) | | Treasurer, since 2012 | | Executive Vice President of Wells Fargo Funds Management, LLC since 2011. Chief Operating Officer and Chief Compliance Officer at LightBox Capital Management LLC, from 2008 to 2011. | | |
C. David Messman (Born 1960) | | Secretary, since 2000; Chief Legal Officer, since 2003 | | Senior Vice President and Secretary of Wells Fargo Funds Management, LLC since 2001. Assistant General Counsel of Wells Fargo Bank, N.A. since 2013 and Vice President and Managing Counsel of Wells Fargo Bank, N.A. from 1996 to 2013. | | |
| Michael Whitaker (Born 1967) | | Chief Compliance Officer, since 2016 | | Executive Vice President of Wells Fargo Funds Management, LLC since 2016. Chief Compliance Officer of Fidelity’s Fixed Income Funds and Asset Allocation Funds from 2008 to 2016, Compliance Officer of FMR Co., Inc. from 2014 to 2016, Fidelity Investments Money Management, Inc. from 2014 to 2016, Fidelity Investments from 2007 to 2016. | | |
David Berardi (Born 1975) | | Assistant Treasurer, since 2009 | | Vice President of Wells Fargo Funds Management, LLC since 2009. Vice President of Evergreen Investment Management Company, LLC from 2008 to 2010. Manager of Fund Reporting and Control for Evergreen Investment Management Company, LLC from 2004 to 2010. | | |
Jeremy DePalma1 (Born 1974) | | Assistant Treasurer, since 2009 | | Senior Vice President of Wells Fargo Funds Management, LLC since 2009. Senior Vice President of Evergreen Investment Management Company, LLC from 2008 to 2010 and head of the Fund Reporting and Control Team within Fund Administration from 2005 to 2010. | | |
| 1 | Nancy Wiser acts as Treasurer of 69 funds in the Fund Complex. Jeremy DePalma acts as Treasurer of 69 funds and Assistant Treasurer of 69 funds in the Fund Complex. |
| 2 | The Statement of Additional Information includes additional information about the Trustees and is available, without charge, upon request, by calling 1-800-222-8222 or by visiting the website at wellsfargofunds.com. |
| | | | | | |
| List of abbreviations | | Wells Fargo C&B Mid Cap Value Fund | | | 25 | |
The following is a list of common abbreviations for terms and entities that may have appeared in this report.
| ACA | — ACA Financial Guaranty Corporation |
| ADR | — American depositary receipt |
| ADS | — American depositary shares |
| AGC | — Assured Guaranty Corporation |
| AGM | — Assured Guaranty Municipal |
| Ambac | — Ambac Financial Group Incorporated |
| AMT | — Alternative minimum tax |
| BAN | — Bond anticipation notes |
| BHAC | — Berkshire Hathaway Assurance Corporation |
| CAB | — Capital appreciation bond |
| CCAB | — Convertible capital appreciation bond |
| CDA | — Community Development Authority |
| CDO | — Collateralized debt obligation |
| DRIVER | — Derivative inverse tax-exempt receipts |
| DW&P | — Department of Water & Power |
| DWR | — Department of Water Resources |
| ECFA | — Educational & Cultural Facilities Authority |
| EDA | — Economic Development Authority |
| EDFA | — Economic Development Finance Authority |
| ETF | — Exchange-traded fund |
| FDIC | — Federal Deposit Insurance Corporation |
| FFCB | — Federal Farm Credit Banks |
| FGIC | — Financial Guaranty Insurance Corporation |
| FHA | — Federal Housing Administration |
| FHLB | — Federal Home Loan Bank |
| FHLMC | — Federal Home Loan Mortgage Corporation |
| FICO | — The Financing Corporation |
| FNMA | — Federal National Mortgage Association |
| GDR | — Global depositary receipt |
| GNMA | — Government National Mortgage Association |
| HCFR | — Healthcare facilities revenue |
| HEFA | — Health & Educational Facilities Authority |
| HEFAR | — Higher education facilities authority revenue |
| HFA | — Housing Finance Authority |
| HFFA | — Health Facilities Financing Authority |
| HUD | — Department of Housing and Urban Development |
| IDA | — Industrial Development Authority |
| IDAG | — Industrial Development Agency |
| KRW | — Republic of Korea won |
| LIBOR | — London Interbank Offered Rate |
| LIFER | — Long Inverse Floating Exempt Receipts |
| LLC | — Limited liability company |
| LLLP | — Limited liability limited partnership |
| LLP | — Limited liability partnership |
| MBIA | — Municipal Bond Insurance Association |
| MFHR | — Multifamily housing revenue |
| MSTR | — Municipal securities trust receipts |
| MUD | — Municipal Utility District |
| National | — National Public Finance Guarantee Corporation |
| PCFA | — Pollution Control Financing Authority |
| PCL | — Public Company Limited |
| PCR | — Pollution control revenue |
| PFA | — Public Finance Authority |
| PFFA | — Public Facilities Financing Authority |
| PFOTER | — Puttable floating option tax-exempt receipts |
| plc | — Public limited company |
| PUTTER | — Puttable tax-exempt receipts |
| R&D | — Research & development |
| Radian | — Radian Asset Assurance |
| RAN | — Revenue anticipation notes |
| RDA | — Redevelopment Authority |
| RDFA | — Redevelopment Finance Authority |
| REIT | — Real estate investment trust |
| ROC | — Reset option certificates |
| SAVRS | — Select auction variable rate securities |
| SBA | — Small Business Authority |
| SDR | — Swedish depositary receipt |
| SFHR | — Single-family housing revenue |
| SFMR | — Single-family mortgage revenue |
| SPA | — Standby purchase agreement |
| SPDR | — Standard & Poor’s Depositary Receipts |
| SPEAR | — Short Puttable Exempt Adjustable Receipts |
| STRIPS | — Separate trading of registered interest and |
| TAN | — Tax anticipation notes |
| TIPS | — Treasury inflation-protected securities |
| TRAN | — Tax revenue anticipation notes |
| TTFA | — Transportation Trust Fund Authority |
| TVA | — Tennessee Valley Authority |
This page is intentionally left blank.
This page is intentionally left blank.
This page is intentionally left blank.

For more information
More information about Wells Fargo Funds is available free upon request. To obtain literature, please write, email, visit the Fund’s website, or call:
Wells Fargo Funds
P.O. Box 8266
Boston, MA 02266-8266
Email: fundservice@wellsfargo.com
Website: wellsfargofunds.com
Individual investors: 1-800-222-8222
Retail investment professionals: 1-888-877-9275
Institutional investment professionals: 1-866-765-0778
This report and the financial statements contained herein are submitted for the general information of the shareholders of the Fund. If this report is used for promotional purposes, distribution of the report must be accompanied or preceded by a current prospectus. Before investing, please consider the investment objectives, risks, charges, and expenses of the investment. For a current prospectus and, if available, a summary prospectus, containing this information, call 1-800-222-8222 or visit the Fund’s website at wellsfargofunds.com. Read the prospectus carefully before you invest or send money.
Wells Fargo Asset Management (WFAM) is a trade name used by the asset management businesses of Wells Fargo & Company. Wells Fargo Funds Management, LLC, a wholly owned subsidiary of Wells Fargo & Company, provides investment advisory and administrative services for Wells Fargo Funds. Other affiliates of Wells Fargo & Company provide subadvisory and other services for the funds. The funds are distributed by Wells Fargo Funds Distributor, LLC, Member FINRA, an affiliate of Wells Fargo & Company. Neither Wells Fargo Funds Management nor Wells Fargo Funds Distributor has Fund customer accounts/assets, and neither provides investment advice/recommendations or acts as an investment advice fiduciary to any investor.
NOT FDIC INSURED ◾ NO BANK GUARANTEE ◾ MAY LOSE VALUE
© 2017 Wells Fargo Funds Management, LLC. All rights reserved.
| | |
 | | 302886 05-17 SA228/SAR228 03-17 |
Semi-Annual Report
March 31, 2017

Wells Fargo Common Stock Fund


Reduce clutter. Save trees.
Sign up for electronic delivery of prospectuses and shareholder reports at wellsfargo.com/advantagedelivery
Contents
The views expressed and any forward-looking statements are as of March 31, 2017, unless otherwise noted, and are those of the Fund managers and/or Wells Fargo Funds Management, LLC. Discussions of individual securities, or the markets generally, or any Wells Fargo Fund are not intended as individual recommendations. Future events or results may vary significantly from those expressed in any forward-looking statements. The views expressed are subject to change at any time in response to changing circumstances in the market. Wells Fargo Funds Management, LLC and the Fund disclaim any obligation to publicly update or revise any views expressed or forward-looking statements.
NOT FDIC INSURED ◾ NO BANK GUARANTEE ◾ MAY LOSE VALUE
| | | | |
| 2 | | Wells Fargo Common Stock Fund | | Letter to shareholders (unaudited) |

Andrew Owen
President
Wells Fargo Funds
U.S. and international stocks returned 10.12% and 8.18% for the six-month period; within fixed income, the Bloomberg Barclays U.S. Aggregate Bond Index3 returned -2.18%.
Dear Shareholder:
As the new president of Wells Fargo Funds now that Karla Rabusch is retiring from that position after nearly 14 years, I am pleased to offer you this semi-annual report for the Wells Fargo Common Stock Fund for the six-month period that ended March 31, 2017. During this period, global stocks delivered favorable results overall. U.S. and international stocks returned 10.12% and 8.18% for the six-month period, respectively, as measured by the S&P 500 Index1 and the MSCI ACWI ex USA Index (Net)2; within fixed income, the Bloomberg Barclays U.S. Aggregate Bond Index3 returned -2.18%.
During the fourth quarter of 2016, prospects for faster growth and higher interest rates in the U.S. influenced markets.
Early in the fourth quarter of 2016, U.S. stocks tended to trade lower amid concerns such as a likely interest-rate increase and uncertainty over the approaching general election. However, following Donald Trump’s election as president in early November, U.S. stocks began to rally. Investors appeared optimistic that the new administration would usher in a series of progrowth policies, and supportive economic news helped the rally carry through the quarter. The buoyant environment sent interest rates higher as well. At its mid-December meeting, Fed officials raised their short-term target interest rate for the first time in a year by a quarter percentage point to between 0.50% and 0.75%. The fourth quarter also saw the implementation of the U.S. Securities and Exchange Commission’s new rules for money market funds, which included floating net asset values (NAVs) for institutional prime and municipal money market funds as well as liquidity fees and redemption gates. In the year leading up to money market fund reform implementation, nearly $1 trillion in assets moved from these types of money market funds into government money market funds, which continued to transact at a stable $1 NAV. Outside of the U.S., the prospects for faster U.S. growth appeared to trigger some acceleration in Europe. The improvement may be partly attributable to expectations for further strengthening of the U.S. dollar, which in turn could improve demand for European goods in the U.S. due to weakening of the euro relative to the dollar. Meanwhile, rising inflation across the eurozone and Japan caused an upward shift in yield curves in those areas although developed-country bond yields remained significantly lower than U.S. Treasury yields.
Globally, stocks delivered positive results and economies showed some improvement in the first quarter of 2017.
Stocks rallied globally through the first quarter of 2017, supported by signs of improvement in the U.S. and global economies. U.S. economic data released during the quarter reflected a healthy economy. Hiring remained strong, and business and consumer sentiment improved. Meanwhile, inflation inched up during the quarter. Along with the pickup in inflation, investors appeared to shift
| 1 | The S&P 500 Index consists of 500 stocks chosen for market size, liquidity, and industry group representation. It is a market-value-weighted index with each stock’s weight in the index proportionate to its market value. You cannot invest directly in an index. |
| 2 | The Morgan Stanley Capital International (MSCI) All Country World Index (ACWI) ex USA Index (Net) is a free-float-adjusted market-capitalization-weighted index that is designed to measure the equity market performance of developed markets, excluding the United States and Canada. Source: MSCI. MSCI makes no express or implied warranties or representations and shall have no liability whatsoever with respect to any MSCI data contained herein. The MSCI data may not be further redistributed or used as a basis for other indexes or any securities or financial products. This report is not approved, reviewed, or produced by MSCI. You cannot invest directly in an index. |
| 3 | The Bloomberg Barclays U.S. Aggregate Bond Index (formerly known as Barclays U.S. Aggregate Bond Index) is a broad-based benchmark that measures the investment-grade, U.S. dollar–denominated, fixed-rate taxable bond market, including Treasuries, government-related and corporate securities, mortgage-backed securities (agency fixed-rate and hybrid adjustable-rate mortgage pass-throughs), asset-backed securities, and commercial mortgage-backed securities. You cannot invest directly in an index. |
| | | | | | |
| Letter to shareholders (unaudited) | | Wells Fargo Common Stock Fund | | | 3 | |
from a mindset of very gradual interest-rate increases by the Fed to an anticipation of three or four increases in 2017. The first of these occurred in March; Fed officials raised their short-term target rate by a quarter percentage point to between 0.75% and 1.00%. With the Fed’s target-rate increase, short-term bond yields rose during the quarter. Meanwhile, longer-term Treasury yields were little changed, leading to positive performance. Investment-grade and high-yield bonds benefited from strong demand. Municipal bond returns were positive in the quarter, helped by strong demand and constrained new-issue supply. Outside of the U.S., credit spreads narrowed, helping lower-quality credit outperform amid a strong demand for yield. Also, stocks in emerging markets generally outperformed stocks in the U.S. and international developed markets. Thus far in 2017, emerging markets overall have benefited from both global economic growth and recent weakening in the U.S. dollar. European stocks also outperformed the U.S. market, despite investors’ concern over uncertainties such as the potential impact of an upcoming election in France; a contender for president of France, Marine Le Pen, favored exiting the European Union, which could potentially destabilize or topple the organization.
Don’t let short-term uncertainty derail long-term investment goals.
Periods of uncertainty can present challenges, but experience has taught us that maintaining long-term investment goals can be an effective way to plan for the future. To help you create a sound strategy based on your personal goals and risk tolerance, Wells Fargo Funds offers more than 100 mutual funds spanning a wide range of asset classes and investment styles. Although diversification cannot guarantee an investment profit or prevent losses, we believe it can be an effective way to manage investment risk and potentially smooth out overall portfolio performance. We encourage investors to know their investments and to understand that appropriate levels of risk-taking may unlock opportunities.
Thank you for choosing to invest in Wells Fargo Funds. We appreciate your confidence in us and remain committed to helping you meet your financial needs.
Sincerely,

Andrew Owen
President
Wells Fargo Funds
Although diversification cannot guarantee an investment profit or prevent losses, we believe it can be an effective way to manage investment risk and potentially smooth out overall portfolio performance.
For further information about your Fund, contact your investment professional, visit our website at wellsfargofunds.com, or call us directly at 1-800-222-8222. We are available 24 hours a day, 7 days a week.
| | | | |
| 4 | | Wells Fargo Common Stock Fund | | Performance highlights (unaudited) |
Investment objective
The Fund seeks long-term capital appreciation.
Manager
Wells Fargo Funds Management, LLC
Subadviser
Wells Capital Management Incorporated
Portfolio managers
Ann M. Miletti
Christopher G. Miller, CFA®‡
Average annual total returns (%) as of March 31, 20171
| | | | | | | | | | | | | | | | | | | | | | | | | | | | | | | | | | |
| | | | | Including sales charge | | | Excluding sales charge | | | Expense ratios2 (%) | |
| | | Inception date | | 1 year | | | 5 year | | | 10 year | | | 1 year | | | 5 year | | | 10 year | | | Gross | | | Net3 | |
| Class A (SCSAX) | | 11-30-2000 | | | 12.19 | | | | 9.84 | | | | 7.78 | | | | 19.03 | | | | 11.15 | | | | 8.42 | | | | 1.26 | | | | 1.26 | |
| Class C (STSAX) | | 11-30-2000 | | | 17.19 | | | | 10.31 | | | | 7.60 | | | | 18.19 | | | | 10.31 | | | | 7.60 | | | | 2.01 | | | | 2.01 | |
| Class R6 (SCSRX) | | 6-28-2013 | | | – | | | | – | | | | – | | | | 19.55 | | | | 11.62 | | | | 8.73 | | | | 0.83 | | | | 0.83 | |
| Administrator Class (SCSDX) | | 7-30-2010 | | | – | | | | – | | | | – | | | | 19.19 | | | | 11.32 | | | | 8.53 | | | | 1.18 | | | | 1.11 | |
| Institutional Class (SCNSX) | | 7-30-2010 | | | – | | | | – | | | | – | | | | 19.54 | | | | 11.58 | | | | 8.71 | | | | 0.93 | | | | 0.86 | |
| Russell 2500TM Index4 | | – | | | – | | | | – | | | | – | | | | 21.53 | | | | 12.60 | | | | 7.71 | | | | – | | | | – | |
Figures quoted represent past performance, which is no guarantee of future results, and do not reflect taxes that a shareholder may pay on fund distributions or the redemption of fund shares. Investment return and principal value of an investment will fluctuate so that an investor’s shares, when redeemed, may be worth more or less than their original cost. Performance shown without sales charges would be lower if sales charges were reflected. Current performance may be lower or higher than the performance data quoted, which assumes the reinvestment of dividends and capital gains. Current month-end performance is available on the Fund’s website, wellsfargofunds.com.
Index returns do not include transaction costs associated with buying and selling securities, any mutual fund fees or expenses, or any taxes. It is not possible to invest directly in an index.
For Class A shares, the maximum front-end sales charge is 5.75%. For Class C shares, the maximum contingent deferred sales charge is 1.00%. Performance including a contingent deferred sales charge assumes the sales charge for the corresponding time period. Class R6, Administrator Class, and Institutional Class shares are sold without a front-end sales charge or contingent deferred sales charge.
Stock values fluctuate in response to the activities of individual companies and general market and economic conditions. Smaller-company stocks tend to be more volatile and less liquid than those of larger companies. Certain investment strategies tend to increase the total risk of an investment (relative to the broader market). The Fund is exposed to foreign investment risk. Consult the Fund’s prospectus for additional information on these and other risks.
Please see footnotes on page 5.
| | | | | | |
| Performance highlights (unaudited) | | Wells Fargo Common Stock Fund | | | 5 | |
| | | | |
| Ten largest holdings (%) as of March 31, 20175 | |
Haemonetics Corporation | | | 2.18 | |
E*TRADE Financial Corporation | | | 2.16 | |
CNO Financial Group Incorporated | | | 2.05 | |
Raymond James Financial Incorporated | | | 2.03 | |
Bank of the Ozarks Incorporated | | | 1.89 | |
Laboratory Corporation of America Holdings | | | 1.82 | |
Red Hat Incorporated | | | 1.76 | |
SBA Communications Corporation | | | 1.75 | |
Skyworks Solutions Incorporated | | | 1.72 | |
ON Semiconductor Corporation | | | 1.67 | |
|
| Portfolio allocation as of March 31, 20176 |
|
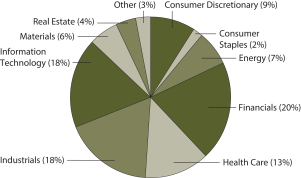
|
| ‡ | Mr. Miller became the portfolio manager of the Fund on March 1, 2017. |
| 1 | Historical performance shown for Class R6 shares prior to their inception reflects the performance of Institutional Class shares, and includes the higher expenses applicable to Institutional Class shares. If these expenses had not been included, the returns for Class R6 shares would be higher. Historical performance shown for Administrator Class and Institutional Class shares prior to their inception reflects the performance of Class A shares, and includes the higher expenses applicable to Class A shares. If these expenses had not been included, the returns would be higher. |
| 2 | Reflects the expense ratios as stated in the most recent prospectuses, which include the impact of 0.01% in acquired fund fees and expenses. The expense ratios shown are subject to change and may differ from the annualized expense ratios shown in the financial highlights of this report, which do not include acquired fund fees and expenses. |
| 3 | The manager has contractually committed through January 31, 2018, to waive fees and/or reimburse expenses to the extent necessary to cap the Fund’s Total Annual Fund Operating Expenses After Fee Waivers at 1.26% for Class A, 2.01% for Class C, 0.85% for Class R6, 1.10% for Administrator Class, and 0.85% for Institutional Class. After this time, the cap may be increased or the commitment to maintain the cap may be terminated only with the approval of the Board of Trustees. Brokerage commissions, stamp duty fees, interest, taxes, acquired fund fees and expenses, and extraordinary expenses are excluded from the expense cap. Without this cap, the Fund’s returns would have been lower. The expense ratio paid by an investor is the net expense ratio or the Fund’s Total Annual Fund Operating Expenses After Fee Waivers, as stated in the prospectuses. |
| 4 | The Russell 2500TM Index measures the performance of the 2,500 smallest companies in the Russell 3000® Index, which represents approximately 16% of the total market capitalization of the Russell 3000® Index. You cannot invest directly in an index. |
| 5 | The ten largest holdings, excluding cash and cash equivalents, are calculated based on the value of the investments divided by total net assets of the Fund. Holdings are subject to change and may have changed since the date specified. |
| 6 | Amounts are calculated based on the total long-term investments of the Fund. These amounts are subject to change and may have changed since the date specified. |
| | | | |
| 6 | | Wells Fargo Common Stock Fund | | Fund expenses (unaudited) |
As a shareholder of the Fund, you incur two types of costs: (1) transaction costs, including sales charges (loads) on purchase payments and contingent deferred sales charges (if any) on redemptions and (2) ongoing costs, including management fees, distribution (12b-1) and/or shareholder servicing fees, and other Fund expenses. This example is intended to help you understand your ongoing costs (in dollars) of investing in the Fund and to compare these costs with the ongoing costs of investing in other mutual funds.
The example is based on an investment of $1,000 invested at the beginning of the six-month period and held for the entire period from October 1, 2016 to March 31, 2017.
Actual expenses
The “Actual” line of the table below provides information about actual account values and actual expenses. You may use the information in this line, together with the amount you invested, to estimate the expenses that you paid over the period. Simply divide your account value by $1,000 (for example, an $8,600 account value divided by $1,000 = 8.6), then multiply the result by the number in the “Actual” line under the heading entitled “Expenses paid during period” for your applicable class of shares to estimate the expenses you paid on your account during this period.
Hypothetical example for comparison purposes
The “Hypothetical” line of the table below provides information about hypothetical account values and hypothetical expenses based on the Fund’s actual expense ratio and an assumed rate of return of 5% per year before expenses, which is not the Fund’s actual return. The hypothetical account values and expenses may not be used to estimate the actual ending account balance or expenses you paid for the period. You may use this information to compare the ongoing costs of investing in the Fund and other funds. To do so, compare this 5% hypothetical example with the 5% hypothetical examples that appear in the shareholder reports of the other funds.
Please note that the expenses shown in the table are meant to highlight your ongoing costs only and do not reflect any transactional costs, such as sales charges (loads) and contingent deferred sales charges. Therefore, the “Hypothetical” line of the table is useful in comparing ongoing costs only and will not help you determine the relative total costs of owning different funds. In addition, if these transactional costs were included, your costs would have been higher.
| | | | | | | | | | | | | | | | |
| | | Beginning
account value
10-1-2016 | | | Ending
account value
3-31-2017 | | | Expenses
paid during
the period¹ | | | Annualized net
expense ratio | |
Class A | | | | | | | | | | | | | | | | |
Actual | | $ | 1,000.00 | | | $ | 1,108.38 | | | $ | 6.57 | | | | 1.25 | % |
Hypothetical (5% return before expenses) | | $ | 1,000.00 | | | $ | 1,018.70 | | | $ | 6.29 | | | | 1.25 | % |
Class C | | | | | | | | | | | | | | | | |
Actual | | $ | 1,000.00 | | | $ | 1,104.94 | | | $ | 10.50 | | | | 2.00 | % |
Hypothetical (5% return before expenses) | | $ | 1,000.00 | | | $ | 1,014.96 | | | $ | 10.05 | | | | 2.00 | % |
Class R6 | | | | | | | | | | | | | | | | |
Actual | | $ | 1,000.00 | | | $ | 1,110.62 | | | $ | 4.31 | | | | 0.82 | % |
Hypothetical (5% return before expenses) | | $ | 1,000.00 | | | $ | 1,020.84 | | | $ | 4.13 | | | | 0.82 | % |
Administrator Class | | | | | | | | | | | | | | | | |
Actual | | $ | 1,000.00 | | | $ | 1,109.29 | | | $ | 5.78 | | | | 1.10 | % |
Hypothetical (5% return before expenses) | | $ | 1,000.00 | | | $ | 1,019.45 | | | $ | 5.54 | | | | 1.10 | % |
Institutional Class | | | | | | | | | | | | | | | | |
Actual | | $ | 1,000.00 | | | $ | 1,110.87 | | | $ | 4.47 | | | | 0.85 | % |
Hypothetical (5% return before expenses) | | $ | 1,000.00 | | | $ | 1,020.69 | | | $ | 4.28 | | | | 0.85 | % |
| 1 | Expenses paid is equal to the annualized net expense ratio of each class multiplied by the average account value over the period, multiplied by the number of days in the most recent fiscal half-year divided by the number of days in the fiscal year (to reflect the one-half-year period). |
| | | | | | |
| Portfolio of investments—March 31, 2017 (unaudited) | | Wells Fargo Common Stock Fund | | | 7 | |
| | | | | | | | | | | | | | | | |
| Security name | | | | | | | | Shares | | | Value | |
| | | | |
Common Stocks: 96.46% | | | | | | | | | | | | | | | | |
| | | | |
Consumer Discretionary: 8.54% | | | | | | | | | | | | | | | | |
| | | | |
| Auto Components: 1.39% | | | | | | | | | | | | | | | | |
Dana Incorporated | | | | | | | | | | | 917,650 | | | $ | 17,719,822 | |
| | | | | | | | | | | | | | | | |
| | | | |
| Diversified Consumer Services: 0.91% | | | | | | | | | | | | | | | | |
Houghton Mifflin Harcourt Company † | | | | | | | | | | | 1,144,230 | | | | 11,613,935 | |
| | | | | | | | | | | | | | | | |
| | | | |
| Hotels, Restaurants & Leisure: 1.19% | | | | | | | | | | | | | | | | |
Buffalo Wild Wings Incorporated † | | | | | | | | | | | 99,945 | | | | 15,266,599 | |
| | | | | | | | | | | | | | | | |
| | | | |
| Household Durables: 1.42% | | | | | | | | | | | | | | | | |
Mohawk Industries Incorporated † | | | | | | | | | | | 78,930 | | | | 18,113,646 | |
| | | | | | | | | | | | | | | | |
| | | | |
| Media: 1.14% | | | | | | | | | | | | | | | | |
Interpublic Group of Companies Incorporated | | | | | | | | | | | 594,282 | | | | 14,601,509 | |
| | | | | | | | | | | | | | | | |
| | | | |
| Specialty Retail: 2.49% | | | | | | | | | | | | | | | | |
Tractor Supply Company | | | | | | | | | | | 270,190 | | | | 18,635,004 | |
Urban Outfitters Incorporated † | | | | | | | | | | | 552,803 | | | | 13,134,599 | |
| | | | |
| | | | | | | | | | | | | | | 31,769,603 | |
| | | | | | | | | | | | | | | | |
| | | | |
Consumer Staples: 1.68% | | | | | | | | | | | | | | | | |
| | | | |
| Household Products: 1.08% | | | | | | | | | | | | | | | | |
Church & Dwight Company Incorporated | | | | | | | | | | | 275,325 | | | | 13,730,458 | |
| | | | | | | | | | | | | | | | |
| | | | |
| Personal Products: 0.60% | | | | | | | | | | | | | | | | |
Edgewell Personal Care Company † | | | | | | | | | | | 105,148 | | | | 7,690,525 | |
| | | | | | | | | | | | | | | | |
| | | | |
Energy: 7.37% | | | | | | | | | | | | | | | | |
| | | | |
| Energy Equipment & Services: 0.93% | | | | | | | | | | | | | | | | |
Weatherford International plc Ǡ | | | | | | | | | | | 1,787,774 | | | | 11,888,697 | |
| | | | | | | | | | | | | | | | |
| | | | |
| Oil, Gas & Consumable Fuels: 6.44% | | | | | | | | | | | | | | | | |
Cimarex Energy Company | | | | | | | | | | | 145,204 | | | | 17,350,426 | |
Matador Resources Company Ǡ | | | | | | | | | | | 626,807 | | | | 14,911,739 | |
Parsley Energy Incorporated Class A † | | | | | | | | | | | 498,052 | | | | 16,191,671 | |
Pioneer Natural Resources Company | | | | | | | | | | | 51,023 | | | | 9,502,013 | |
Range Resources Corporation | | | | | | | | | | | 269,892 | | | | 7,853,857 | |
RSP Permian Incorporated † | | | | | | | | | | | 397,480 | | | | 16,467,596 | |
| | | | |
| | | | | | | | | | | | | | | 82,277,302 | |
| | | | | | | | | | | | | | | | |
| | | | |
Financials: 19.61% | | | | | | | | | | | | | | | | |
| | | | |
| Banks: 6.83% | | | | | | | | | | | | | | | | |
Bank of the Ozarks Incorporated | | | | | | | | | | | 463,432 | | | | 24,103,098 | |
First Horizon National Corporation | | | | | | | | | | | 602,745 | | | | 11,150,783 | |
MB Financial Incorporated | | | | | | | | | | | 298,164 | | | | 12,767,382 | |
PacWest Bancorp | | | | | | | | | | | 393,754 | | | | 20,971,338 | |
Sterling BanCorp | | | | | | | | | | | 771,961 | | | | 18,295,476 | |
| | | | |
| | | | | | | | | | | | | | | 87,288,077 | |
| | | | | | | | | | | | | | | | |
The accompanying notes are an integral part of these financial statements.
| | | | |
| 8 | | Wells Fargo Common Stock Fund | | Portfolio of investments—March 31, 2017 (unaudited) |
| | | | | | | | | | | | | | | | |
| Security name | | | | | | | | Shares | | | Value | |
| | | | |
| Capital Markets: 4.19% | | | | | | | | | | | | | | | | |
E*TRADE Financial Corporation † | | | | | | | | | | | 790,257 | | | $ | 27,572,067 | |
Raymond James Financial Incorporated | | | | | | | | | | | 340,557 | | | | 25,970,877 | |
| | | | |
| | | | | | | | | | | | | | | 53,542,944 | |
| | | | | | | | | | | | | | | | |
| | | | |
| Insurance: 8.59% | | | | | | | | | | | | | | | | |
Arch Capital Group Limited † | | | | | | | | | | | 160,706 | | | | 15,230,108 | |
CNO Financial Group Incorporated | | | | | | | | | | | 1,279,369 | | | | 26,227,065 | |
Reinsurance Group of America Incorporated | | | | | | | | | | | 123,122 | | | | 15,634,032 | |
RenaissanceRe Holdings Limited | | | | | | | | | | | 102,383 | | | | 14,809,701 | |
The Progressive Corporation | | | | | | | | | | | 436,844 | | | | 17,115,548 | |
Willis Towers Watson plc | | | | | | | | | | | 158,127 | | | | 20,697,243 | |
| | | | |
| | | | | | | | | | | | | | | 109,713,697 | |
| | | | | | | | | | | | | | | | |
| | | | |
Health Care: 13.37% | | | | | | | | | | | | | | | | |
| | | | |
| Biotechnology: 1.53% | | | | | | | | | | | | | | | | |
Alkermes plc † | | | | | | | | | | | 199,298 | | | | 11,658,933 | |
BioMarin Pharmaceutical Incorporated † | | | | | | | | | | | 90,117 | | | | 7,910,470 | |
| | | | |
| | | | | | | | | | | | | | | 19,569,403 | |
| | | | | | | | | | | | | | | | |
| | | | |
| Health Care Equipment & Supplies: 4.87% | | | | | | | | | | | | | | | | |
Haemonetics Corporation † | | | | | | | | | | | 686,219 | | | | 27,839,905 | |
Hologic Incorporated † | | | | | | | | | | | 422,715 | | | | 17,986,523 | |
LivaNova plc † | | | | | | | | | | | 332,906 | | | | 16,315,723 | |
| | | | |
| | | | | | | | | | | | | | | 62,142,151 | |
| | | | | | | | | | | | | | | | |
| | | | |
| Health Care Providers & Services: 4.19% | | | | | | | | | | | | | | | | |
Humana Incorporated | | | | | | | | | | | 72,352 | | | | 14,914,641 | |
Laboratory Corporation of America Holdings † | | | | | | | | | | | 162,115 | | | | 23,258,639 | |
Universal Health Services Incorporated Class B | | | | | | | | | | | 123,633 | | | | 15,386,127 | |
| | | | |
| | | | | | | | | | | | | | | 53,559,407 | |
| | | | | | | | | | | | | | | | |
| | | | |
| Life Sciences Tools & Services: 2.78% | | | | | | | | | | | | | | | | |
Agilent Technologies Incorporated | | | | | | | | | | | 376,744 | | | | 19,918,455 | |
PerkinElmer Incorporated | | | | | | | | | | | 269,256 | | | | 15,633,003 | |
| | | | |
| | | | | | | | | | | | | | | 35,551,458 | |
| | | | | | | | | | | | | | | | |
| | | | |
Industrials: 18.17% | | | | | | | | | | | | | | | | |
| | | | |
| Airlines: 1.20% | | | | | | | | | | | | | | | | |
Spirit Airlines Incorporated † | | | | | | | | | | | 289,820 | | | | 15,380,747 | |
| | | | | | | | | | | | | | | | |
| | | | |
| Commercial Services & Supplies: 3.62% | | | | | | | | | | | | | | | | |
Republic Services Incorporated | | | | | | | | | | | 243,771 | | | | 15,311,257 | |
Steelcase Incorporated Class A | | | | | | | | | | | 1,066,541 | | | | 17,864,562 | |
Stericycle Incorporated † | | | | | | | | | | | 156,851 | | | | 13,001,379 | |
| | | | |
| | | | | | | | | | | | | | | 46,177,198 | |
| | | | | | | | | | | | | | | | |
The accompanying notes are an integral part of these financial statements.
| | | | | | |
| Portfolio of investments—March 31, 2017 (unaudited) | | Wells Fargo Common Stock Fund | | | 9 | |
| | | | | | | | | | | | | | | | |
| Security name | | | | | | | | Shares | | | Value | |
| | | | |
| Electrical Equipment: 4.87% | | | | | | | | | | | | | | | | |
AMETEK Incorporated | | | | | | | | | | | 365,863 | | | $ | 19,785,871 | |
Babcock & Wilcox Enterprises Incorporated † | | | | | | | | | | | 427,437 | | | | 3,992,262 | |
Hubbell Incorporated | | | | | | | | | | | 146,727 | | | | 17,614,576 | |
Sensata Technologies Holding NV † | | | | | | | | | | | 477,564 | | | | 20,855,220 | |
| | | | |
| | | | | | | | | | | | | | | 62,247,929 | |
| | | | | | | | | | | | | | | | |
| | | | |
| Machinery: 3.57% | | | | | | | | | | | | | | | | |
Allison Transmission Holdings Incorporated | | | | | | | | | | | 371,223 | | | | 13,386,301 | |
Colfax Corporation † | | | | | | | | | | | 435,757 | | | | 17,107,820 | |
Wabtec Corporation « | | | | | | | | | | | 194,479 | | | | 15,169,362 | |
| | | | |
| | | | | | | | | | | | | | | 45,663,483 | |
| | | | | | | | | | | | | | | | |
| | | | |
| Road & Rail: 2.12% | | | | | | | | | | | | | | | | |
Hertz Global Holdings Incorporated « | | | | | | | | | | | 546,308 | | | | 9,582,242 | |
Ryder System Incorporated | | | | | | | | | | | 231,275 | | | | 17,447,386 | |
| | | | |
| | | | | | | | | | | | | | | 27,029,628 | |
| | | | | | | | | | | | | | | | |
| | | | |
| Trading Companies & Distributors: 2.79% | | | | | | | | | | | | | | | | |
GATX Corporation « | | | | | | | | | | | 263,979 | | | | 16,092,160 | |
MRC Global Incorporated † | | | | | | | | | | | 1,062,711 | | | | 19,479,493 | |
| | | | |
| | | | | | | | | | | | | | | 35,571,653 | |
| | | | | | | | | | | | | | | | |
| | | | |
Information Technology: 18.09% | | | | | | | | | | | | | | | | |
| | | | |
| Internet Software & Services: 0.96% | | | | | | | | | | | | | | | | |
Cornerstone OnDemand Incorporated † | | | | | | | | | | | 314,085 | | | | 12,214,766 | |
| | | | | | | | | | | | | | | | |
| | | | |
| IT Services: 4.57% | | | | | | | | | | | | | | | | |
Amdocs Limited | | | | | | | | | | | 223,932 | | | | 13,657,613 | |
CoreLogic Incorporated † | | | | | | | | | | | 399,644 | | | | 16,273,504 | |
Gartner Incorporated † | | | | | | | | | | | 105,095 | | | | 11,349,209 | |
Global Payments Incorporated | | | | | | | | | | | 212,554 | | | | 17,148,857 | |
| | | | |
| | | | | | | | | | | | | | | 58,429,183 | |
| | | | | | | | | | | | | | | | |
| | | | |
| Semiconductors & Semiconductor Equipment: 5.14% | | | | | | | | | | | | | | | | |
Integrated Device Technology Incorporated † | | | | | | | | | | | 554,339 | | | | 13,121,204 | |
Maxim Integrated Products Incorporated | | | | | | | | | | | 206,194 | | | | 9,270,482 | |
ON Semiconductor Corporation † | | | | | | | | | | | 1,373,314 | | | | 21,272,634 | |
Skyworks Solutions Incorporated | | | | | | | | | | | 224,361 | | | | 21,982,891 | |
| | | | |
| | | | | | | | | | | | | | | 65,647,211 | |
| | | | | | | | | | | | | | | | |
| | | | |
| Software: 5.76% | | | | | | | | | | | | | | | | |
Fortinet Incorporated † | | | | | | | | | | | 395,806 | | | | 15,179,160 | |
Nuance Communications Incorporated † | | | | | | | | | | | 937,101 | | | | 16,221,218 | |
Red Hat Incorporated † | | | | | | | | | | | 259,849 | | | | 22,476,939 | |
Zendesk Incorporated † | | | | | | | | | | | 704,293 | | | | 19,748,376 | |
| | | | |
| | | | | | | | | | | | | | | 73,625,693 | |
| | | | | | | | | | | | | | | | |
The accompanying notes are an integral part of these financial statements.
| | | | |
| 10 | | Wells Fargo Common Stock Fund | | Portfolio of investments—March 31, 2017 (unaudited) |
| | | | | | | | | | | | | | | | |
| Security name | | | | | | | | Shares | | | Value | |
| | | | |
| Technology Hardware, Storage & Peripherals: 1.66% | | | | | | | | | | | | | | | | |
Diebold Incorporated | | | | | | | | | | | 690,769 | | | $ | 21,206,608 | |
| | | | | | | | | | | | | | | | |
| | | | |
Materials: 5.77% | | | | | | | | | | | | | | | | |
| | | | |
| Chemicals: 2.17% | | | | | | | | | | | | | | | | |
Axalta Coating Systems Limited † | | | | | | | | | | | 463,947 | | | | 14,939,093 | |
International Flavors & Fragrances Incorporated | | | | | | | | | | | 96,279 | | | | 12,759,856 | |
| | | | |
| | | | | | | | | | | | | | | 27,698,949 | |
| | | | | | | | | | | | | | | | |
| | | | |
| Containers & Packaging: 1.04% | | | | | | | | | | | | | | | | |
Crown Holdings Incorporated † | | | | | | | | | | | 251,589 | | | | 13,321,638 | |
| | | | | | | | | | | | | | | | |
| | | | |
| Metals & Mining: 2.56% | | | | | | | | | | | | | | | | |
Royal Gold Incorporated | | | | | | | | | | | 248,158 | | | | 17,383,468 | |
Steel Dynamics Incorporated | | | | | | | | | | | 441,900 | | | | 15,360,444 | |
| | | | |
| | | | | | | | | | | | | | | 32,743,912 | |
| | | | | | | | | | | | | | | | |
| | | | |
Real Estate: 3.86% | | | | | | | | | | | | | | | | |
| | | | |
| Equity REITs: 3.86% | | | | | | | | | | | | | | | | |
Camden Property Trust | | | | | | | | | | | 113,066 | | | | 9,097,290 | |
Hudson Pacific Properties Incorporated | | | | | | | | | | | 279,660 | | | | 9,687,422 | |
Physicians Realty Trust | | | | | | | | | | | 413,602 | | | | 8,218,272 | |
SBA Communications Corporation † | | | | | | | | | | | 185,642 | | | | 22,345,723 | |
| | | | |
| | | | | | | | | | | | | | | 49,348,707 | |
| | | | | | | | | | | | | | | | |
| | | | |
Total Common Stocks (Cost $863,349,170) | | | | | | | | | | | | | | | 1,232,346,538 | |
| | | | | | | | | | | | | | | | |
| | | | |
Exchange-Traded Funds: 2.58% | | | | | | | | | | | | | | | | |
SPDR Dow Jones REIT ETF « | | | | | | | | | | | 141,502 | | | | 13,057,805 | |
SPDR S&P Biotech ETF « | | | | | | | | | | | 286,446 | | | | 19,862,166 | |
| | | | |
Total Exchange-Traded Funds (Cost $26,668,228) | | | | | | | | | | | | | | | 32,919,971 | |
| | | | | | | | | | | | | | | | |
| | | | |
| | | Yield | | | | | | | | | | |
| Short-Term Investments: 6.80% | | | | | | | | | | | | | | | | |
| | | | |
| Investment Companies: 6.80% | | | | | | | | | | | | | | | | |
Securities Lending Cash Investment LLC (l)(r)(u) | | | 0.98 | % | | | | | | | 72,030,583 | | | | 72,037,786 | |
Wells Fargo Government Money Market Fund Select Class (l)(u) | | | 0.63 | | | | | | | | 14,869,412 | | | | 14,869,412 | |
| | | | |
Total Short-Term Investments (Cost $86,904,901) | | | | | | | | | | | | | | | 86,907,198 | |
| | | | | | | | | | | | | | | | |
| | | | | | | | |
| Total investments in securities (Cost $976,922,299) * | | | 105.84 | % | | | 1,352,173,707 | |
Other assets and liabilities, net | | | (5.84 | ) | | | (74,566,290 | ) |
| | | | | | | | |
| Total net assets | | | 100.00 | % | | $ | 1,277,607,417 | |
| | | | | | | | |
The accompanying notes are an integral part of these financial statements.
| | | | | | |
| Portfolio of investments—March 31, 2017 (unaudited) | | Wells Fargo Common Stock Fund | | | 11 | |
| † | Non-income-earning security |
| « | All or a portion of this security is on loan. |
| (l) | The issuer of the security is an affiliated person of the Fund as defined in the Investment Company Act of 1940. |
| (r) | The investment is a non-registered investment vehicle purchased with cash collateral received from securities on loan. |
| (u) | The rate represents the 7-day annualized yield at period end. |
| * | Cost for federal income tax purposes is $974,573,545 and unrealized gains (losses) consists of: |
| | | | |
Gross unrealized gains | | $ | 411,842,924 | |
Gross unrealized losses | | | (34,242,762 | ) |
| | | | |
Net unrealized gains | | $ | 377,600,162 | |
The accompanying notes are an integral part of these financial statements.
| | | | |
| 12 | | Wells Fargo Common Stock Fund | | Statement of assets and liabilities—March 31, 2017 (unaudited) |
| | | | |
| | | | |
| |
Assets | | | | |
Investments | | | | |
In unaffiliated securities, at value (including $70,453,205 of securities loaned), at value (cost $890,017,398) | | $ | 1,265,266,509 | |
In affiliated securities, at value (cost $86,904,901) | | | 86,907,198 | |
| | | | |
Total investments, at value (cost $976,922,299) | | | 1,352,173,707 | |
Receivable for investments sold | | | 3,205,125 | |
Receivable for Fund shares sold | | | 1,248,873 | |
Receivable for dividends | | | 848,694 | |
Receivable for securities lending income | | | 29,162 | |
Prepaid expenses and other assets | | | 13,884 | |
| | | | |
Total assets | | | 1,357,519,445 | |
| | | | |
| |
Liabilities | | | | |
Payable for investments purchased | | | 5,968,520 | |
Payable for Fund shares redeemed | | | 499,802 | |
Payable upon receipt of securities loaned | | | 72,034,550 | |
Management fee payable | | | 861,289 | |
Distribution fees payable | | | 14,971 | |
Administration fees payable | | | 209,386 | |
Accrued expenses and other liabilities | | | 323,510 | |
| | | | |
Total liabilities | | | 79,912,028 | |
| | | | |
Total net assets | | $ | 1,277,607,417 | |
| | | | |
| |
NET ASSETS CONSIST OF | | | | |
Paid-in capital | | $ | 835,888,531 | |
Accumulated net investment loss | | | (1,268,187 | ) |
Accumulated net realized gains on investments | | | 67,735,665 | |
Net unrealized gains on investments | | | 375,251,408 | |
| | | | |
Total net assets | | $ | 1,277,607,417 | |
| | | | |
| |
COMPUTATION OF NET ASSET VALUE AND OFFERING PRICE PER SHARE | | | | |
Net assets – Class A | | $ | 940,892,558 | |
Shares outstanding – Class A1 | | | 40,955,365 | |
Net asset value per share – Class A | | | $22.97 | |
Maximum offering price per share – Class A2 | | | $24.37 | |
Net assets – Class C | | $ | 21,940,090 | |
Shares outstanding – Class C1 | | | 1,221,076 | |
Net asset value per share – Class C | | | $17.97 | |
Net assets – Class R6 | | $ | 111,756,192 | |
Shares outstanding – Class R61 | | | 4,684,913 | |
Net asset value per share – Class R6 | | | $23.85 | |
Net assets – Administrator Class | | $ | 7,453,413 | |
Shares outstanding – Administrator Class1 | | | 319,851 | |
Net asset value per share – Administrator Class | | | $23.30 | |
Net assets – Institutional Class | | $ | 195,565,164 | |
Shares outstanding – Institutional Class1 | | | 8,216,964 | |
Net asset value per share – Institutional Class | | | $23.80 | |
| 1 | The Fund has an unlimited number of authorized shares. |
| 2 | Maximum offering price is computed as 100/94.25 of net asset value. On investments of $50,000 or more, the offering price is reduced. |
The accompanying notes are an integral part of these financial statements.
| | | | | | |
| Statement of operations—six months ended March 31, 2017 (unaudited) | | Wells Fargo Common Stock Fund | | | 13 | |
| | | | |
| | | | |
| |
Investment income | | | | |
Dividends | | $ | 5,833,982 | |
Securities lending income, net | | | 163,101 | |
Income from affiliated securities | | | 42,971 | |
| | | | |
Total investment income | | | 6,040,054 | |
| | | | |
| |
Expenses | | | | |
Management fee | | | 4,750,204 | |
Administration fees | | | | |
Class A | | | 980,813 | |
Class B | | | 12 | 1 |
Class C | | | 23,550 | |
Class R6 | | | 15,831 | |
Administrator Class | | | 6,799 | |
Institutional Class | | | 115,571 | |
Shareholder servicing fees | | | | |
Class A | | | 1,167,635 | |
Class B | | | 14 | 1 |
Class C | | | 28,036 | |
Administrator Class | | | 13,076 | |
Distribution fees | | | | |
Class B | | | 41 | 1 |
Class C | | | 84,108 | |
Custody and accounting fees | | | 37,314 | |
Professional fees | | | 25,826 | |
Registration fees | | | 55,588 | |
Shareholder report expenses | | | 35,181 | |
Trustees’ fees and expenses | | | 12,451 | |
Other fees and expenses | | | 17,938 | |
| | | | |
Total expenses | | | 7,369,988 | |
Less: Fee waivers and/or expense reimbursements | | | (65,606 | ) |
| | | | |
Net expenses | | | 7,304,382 | |
| | | | |
Net investment loss | | | (1,264,328 | ) |
| | | | |
| |
REALIZED AND UNREALIZED GAINS (LOSSES) ON INVESTMENTS | | | | |
| |
Net realized gains on: | | | | |
Unaffiliated securities | | | 80,581,691 | |
Affiliated securities | | | 939 | |
| | | | |
Net realized gains on investments | | | 80,582,630 | |
| | | | |
| |
Net change in unrealized gains (losses) on: | | | | |
Unaffiliated securities | | | 50,230,676 | |
Affiliated securities | | | 2,297 | |
| | | | |
Net change in unrealized gains (losses) on investments | | | 50,232,973 | |
| | | | |
Net realized and unrealized gains (losses) on investments | | | 130,815,603 | |
| | | | |
Net increase in net assets resulting from operations | | $ | 129,551,275 | |
| | | | |
| 1 | For the period from October 1, 2016 to December 5, 2016. Effective at the close of business on December 5, 2016, Class B shares were converted to Class A shares and are no longer offered by the Fund. |
The accompanying notes are an integral part of these financial statements.
| | | | |
| 14 | | Wells Fargo Common Stock Fund | | Statement of changes in net assets |
| | | | | | | | | | | | | | | | |
| | | Six months ended
March 31, 2017
(unaudited) | | | Year ended
September 30, 2016 | |
| | | | |
Operations | | | | | | | | | | | | | | | | |
Net investment loss | | | | | | $ | (1,264,328 | ) | | | | | | $ | (418,110 | ) |
Net realized gains on investments | | | | | | | 80,582,630 | | | | | | | | 58,412,227 | |
Net change in unrealized gains (losses) on investments | | | | | | | 50,232,973 | | | | | | | | 87,367,906 | |
| | | | |
Net increase in net assets resulting from operations | | | | | | | 129,551,275 | | | | | | | | 145,362,023 | |
| | | | |
| | | | |
Distributions to shareholders from | | | | | | | | | | | | | | | | |
Net realized gains | | | | | | | | | | | | | | | | |
Class A | | | | | | | (34,833,443 | ) | | | | | | | (110,146,894 | ) |
Class B | | | | | | | 0 | 1 | | | | | | | (12,735 | ) |
Class C | | | | | | | (1,072,237 | ) | | | | | | | (3,575,460 | ) |
Class R6 | | | | | | | (3,722,906 | ) | | | | | | | (10,822,850 | ) |
Administrator Class | | | | | | | (308,980 | ) | | | | | | | (1,979,080 | ) |
Institutional Class | | | | | | | (6,486,421 | ) | | | | | | | (25,614,461 | ) |
| | | | |
Total distributions to shareholders | | | | | | | (46,423,987 | ) | | | | | | | (152,151,480 | ) |
| | | | |
| | | | |
Capital share transactions | | | Shares | | | | | | | | Shares | | | | | |
Proceeds from shares sold | | | | | | | | | | | | | | | | |
Class A | | | 622,413 | | | | 13,607,925 | | | | 39,544,860 | | | | 906,361,116 | |
Class C | | | 39,541 | | | | 693,828 | | | | 87,982 | | | | 1,399,266 | |
Class R6 | | | 530,885 | | | | 12,278,380 | | | | 727,868 | | | | 15,356,332 | |
Administrator Class | | | 43,736 | | | | 959,779 | | | | 93,356 | | | | 1,876,928 | |
Institutional Class | | | 1,485,160 | | | | 34,812,983 | | | | 1,569,307 | | | | 33,234,939 | |
Investor Class | | | N/A | | | | N/A | | | | 38,960 | 2 | | | 902,899 | 2 |
| | | | |
| | | | | | | 62,352,895 | | | | | | | | 959,131,480 | |
| | | | |
Reinvestment of distributions | | | | | | | | | | | | | | | | |
Class A | | | 1,499,510 | | | | 33,259,140 | | | | 5,376,198 | | | | 105,588,529 | |
Class B | | | 0 | 1 | | | 0 | 1 | | | 812 | | | | 12,735 | |
Class C | | | 52,926 | | | | 920,375 | | | | 193,065 | | | | 3,025,330 | |
Class R6 | | | 161,865 | | | | 3,722,906 | | | | 534,462 | | | | 10,822,850 | |
Administrator Class | | | 13,054 | | | | 293,584 | | | | 97,753 | | | | 1,942,357 | |
Institutional Class | | | 279,367 | | | | 6,411,478 | | | | 1,256,619 | | | | 25,408,844 | |
| | | | |
| | | | | | | 44,607,483 | | | | | | | | 146,800,645 | |
| | | | |
Payment for shares redeemed | | | | | | | | | | | | | | | | |
Class A | | | (4,188,293 | ) | | | (93,119,040 | ) | | | (7,807,939 | ) | | | (160,174,152 | ) |
Class B | | | (1,872 | )1 | | | (33,351 | )1 | | | (5,487 | ) | | | (91,427 | ) |
Class C | | | (215,028 | ) | | | (3,751,886 | ) | | | (381,490 | ) | | | (6,231,682 | ) |
Class R6 | | | (567,671 | ) | | | (12,995,972 | ) | | | (984,239 | ) | | | (20,831,726 | ) |
Administrator Class | | | (504,604 | ) | | | (11,403,999 | ) | | | (249,908 | ) | | | (5,213,466 | ) |
Institutional Class | | | (1,348,257 | ) | | | (30,305,140 | ) | | | (5,255,616 | ) | | | (106,700,641 | ) |
Investor Class | | | N/A | | | | N/A | | | | (37,451,779 | )2 | | | (884,694,693 | )2 |
| | | | |
| | | | | | | (151,609,388 | ) | | | | | | | (1,183,937,787 | ) |
| | | | |
Net decrease in net assets resulting from capital share transactions | | | | | | | (44,649,010 | ) | | | | | | | (78,005,662 | ) |
| | | | |
Total increase (decrease) in net assets | | | | | | | 38,478,278 | | | | | | | | (84,795,119 | ) |
| | | | |
| | | | |
Net assets | | | | | | | | | | | | | | | | |
Beginning of period | | | | | | | 1,239,129,139 | | | | | | | | 1,323,924,258 | |
| | | | |
End of period | | | | | | $ | 1,277,607,417 | | | | | | | $ | 1,239,129,139 | |
| | | | |
Accumulated net investment loss | | | | | | $ | (1,268,187 | ) | | | | | | $ | (3,859 | ) |
| | | | |
| 1 | For the period from October 1, 2016 to December 5, 2016. Effective at the close of business on December 5, 2016, Class B shares were converted to Class A shares and are no longer offered by the Fund. |
| 2 | For the period from October 1, 2015 to October 23, 2015. Effective at the close of business on October 23, 2015, Investor Class shares were converted to Class A shares and are no longer offered by the Fund. |
The accompanying notes are an integral part of these financial statements.
| | | | | | |
| Financial highlights | | Wells Fargo Common Stock Fund | | | 15 | |
(For a share outstanding throughout each period)
| | | | | | | | | | | | | | | | | | | | | | | | |
| | | Six months ended
March 31, 2017
(unaudited) | | | Year ended September 30 | |
| CLASS A | | | 2016 | | | 2015 | | | 2014 | | | 2013 | | | 2012 | |
Net asset value, beginning of period | | | $21.50 | | | | $21.62 | | | | $24.79 | | | | $24.45 | | | | $21.18 | | | | $17.15 | |
Net investment loss | | | (0.03 | ) | | | (0.01 | )1 | | | (0.04 | )1 | | | (0.07 | ) | | | (0.02 | ) | | | (0.04 | ) |
Net realized and unrealized gains (losses) on investments | | | 2.33 | | | | 2.45 | | | | (0.32 | ) | | | 2.48 | | | | 4.72 | | | | 5.33 | |
| | | | | | | | | | | | | | | | | | | | | | | | |
Total from investment operations | | | 2.30 | | | | 2.44 | | | | (0.36 | ) | | | 2.41 | | | | 4.70 | | | | 5.29 | |
Distributions to shareholders from | | | | | | | | | | | | | | | | | | | | | | | | |
Net realized gains | | | (0.83 | ) | | | (2.56 | ) | | | (2.81 | ) | | | (2.07 | ) | | | (1.43 | ) | | | (1.26 | ) |
Net asset value, end of period | | | $22.97 | | | | $21.50 | | | | $21.62 | | | | $24.79 | | | | $24.45 | | | | $21.18 | |
Total return2 | | | 10.84 | % | | | 12.43 | % | | | (1.76 | )% | | | 10.26 | % | | | 23.72 | % | | | 31.90 | % |
Ratios to average net assets (annualized) | | | | | | | | | | | | | | | | | | | | | | | | |
Gross expenses | | | 1.25 | % | | | 1.25 | % | | | 1.27 | % | | | 1.28 | % | | | 1.30 | % | | | 1.31 | % |
Net expenses | | | 1.25 | % | | | 1.25 | % | | | 1.26 | % | | | 1.26 | % | | | 1.26 | % | | | 1.26 | % |
Net investment loss | | | (0.28 | )% | | | (0.05 | )% | | | (0.19 | )% | | | (0.27 | )% | | | (0.05 | )% | | | (0.16 | )% |
Supplemental data | | | | | | | | | | | | | | | | | | | | | | | | |
Portfolio turnover rate | | | 36 | % | | | 32 | % | | | 51 | % | | | 38 | % | | | 40 | % | | | 30 | % |
Net assets, end of period (000s omitted) | | | $940,893 | | | | $924,864 | | | | $127,732 | | | | $277,517 | | | | $292,806 | | | | $207,668 | |
| 1 | Calculated based upon average shares outstanding |
| 2 | Total return calculations do not include any sales charges. Returns for periods of less than one year are not annualized. |
The accompanying notes are an integral part of these financial statements.
| | | | |
| 16 | | Wells Fargo Common Stock Fund | | Financial highlights |
(For a share outstanding throughout each period)
| | | | | | | | | | | | | | | | | | | | | | | | |
| | | Six months ended
March 31, 2017 (unaudited) | | | Year ended September 30 | |
| CLASS C | | | 2016 | | | 2015 | | | 2014 | | | 2013 | | | 2012 | |
Net asset value, beginning of period | | | $17.04 | | | | $17.77 | | | | $21.02 | | | | $21.18 | | | | $18.67 | | | | $15.35 | |
Net investment loss | | | (0.29 | ) | | | (0.14 | )1 | | | (0.18 | ) | | | (0.22 | )1 | | | (0.16 | )1 | | | (0.16 | )1 |
Net realized and unrealized gains (losses) on investments | | | 2.05 | | | | 1.97 | | | | (0.26 | ) | | | 2.13 | | | | 4.10 | | | | 4.74 | |
| | | | | | | | | | | | | | | | | | | | | | | | |
Total from investment operations | | | 1.76 | | | | 1.83 | | | | (0.44 | ) | | | 1.91 | | | | 3.94 | | | | 4.58 | |
Distributions to shareholders from | | | | | | | | | | | | | | | | | | | | | | | | |
Net realized gains | | | (0.83 | ) | | | (2.56 | ) | | | (2.81 | ) | | | (2.07 | ) | | | (1.43 | ) | | | (1.26 | ) |
Net asset value, end of period | | | $17.97 | | | | $17.04 | | | | $17.77 | | | | $21.02 | | | | $21.18 | | | | $18.67 | |
Total return2 | | | 10.49 | % | | | 11.52 | % | | | (2.49 | )% | | | 9.42 | % | | | 22.78 | % | | | 30.95 | % |
Ratios to average net assets (annualized) | | | | | | | | | | | | | | | | | | | | | | | | |
Gross expenses | | | 2.00 | % | | | 2.00 | % | | | 2.02 | % | | | 2.03 | % | | | 2.05 | % | | | 2.06 | % |
Net expenses | | | 2.00 | % | | | 2.00 | % | | | 2.00 | % | | | 2.01 | % | | | 2.01 | % | | | 2.01 | % |
Net investment loss | | | (1.04 | )% | | | (0.87 | )% | | | (0.93 | )% | | | (1.01 | )% | | | (0.81 | )% | | | (0.92 | )% |
Supplemental data | | | | | | | | | | | | | | | | | | | | | | | | |
Portfolio turnover rate | | | 36 | % | | | 32 | % | | | 51 | % | | | 38 | % | | | 40 | % | | | 30 | % |
Net assets, end of period (000s omitted) | | | $21,940 | | | | $22,902 | | | | $25,668 | | | | $30,245 | | | | $29,483 | | | | $20,080 | |
| 1 | Calculated based upon average shares outstanding |
| 2 | Total return calculations do not include any sales charges. Returns for periods of less than one year are not annualized. |
The accompanying notes are an integral part of these financial statements.
| | | | | | |
| Financial highlights | | Wells Fargo Common Stock Fund | | | 17 | |
(For a share outstanding throughout each period)
| | | | | | | | | | | | | | | | | | | | |
| | | Six months ended
March 31, 2017
(unaudited) | | | Year ended September 30 | |
| CLASS R6 | | | 2016 | | | 2015 | | | 2014 | | | 20131 | |
Net asset value, beginning of period | | | $22.25 | | | | $22.20 | | | | $25.27 | | | | $24.78 | | | | $22.83 | |
Net investment income | | | 0.02 | 2 | | | 0.07 | 2 | | | 0.05 | | | | 0.07 | 2 | | | 0.01 | |
Net realized and unrealized gains (losses) on investments | | | 2.41 | | | | 2.54 | | | | (0.31 | ) | | | 2.49 | | | | 1.94 | |
| | | | | | | | | | | | | | | | | | | | |
Total from investment operations | | | 2.43 | | | | 2.61 | | | | (0.26 | ) | | | 2.56 | | | | 1.95 | |
Distributions to shareholders from | | | | | | | | | | | | | | | | | | | | |
Net realized gains | | | (0.83 | ) | | | (2.56 | ) | | | (2.81 | ) | | | (2.07 | ) | | | 0.00 | |
Net asset value, end of period | | | $23.85 | | | | $22.25 | | | | $22.20 | | | | $25.27 | | | | $24.78 | |
Total return3 | | | 11.06 | % | | | 12.91 | % | | | (1.29 | )% | | | 10.76 | % | | | 8.54 | % |
Ratios to average net assets (annualized) | | | | | | | | | | | | | | | | | | | | |
Gross expenses | | | 0.82 | % | | | 0.82 | % | | | 0.80 | % | | | 0.80 | % | | | 0.81 | % |
Net expenses | | | 0.82 | % | | | 0.82 | % | | | 0.80 | % | | | 0.80 | % | | | 0.81 | % |
Net investment income | | | 0.15 | % | | | 0.32 | % | | | 0.28 | % | | | 0.27 | % | | | 0.18 | % |
Supplemental data | | | | | | | | | | | | | | | | | | | | |
Portfolio turnover rate | | | 36 | % | | | 32 | % | | | 51 | % | | | 38 | % | | | 40 | % |
Net assets, end of period (000s omitted) | | | $111,756 | | | | $101,436 | | | | $95,037 | | | | $95,213 | | | | $27 | |
| 1 | For the period from June 28, 2013 (commencement of class operations) to September 30, 2013 |
| 2 | Calculated based upon average shares outstanding |
| 3 | Returns for periods of less than one year are not annualized. |
The accompanying notes are an integral part of these financial statements.
| | | | |
| 18 | | Wells Fargo Common Stock Fund | | Financial highlights |
(For a share outstanding throughout each period)
| | | | | | | | | | | | | | | | | | | | | | | | |
| | | Six months ended
March 31, 2017
(unaudited) | | | Year ended September 30 | |
| ADMINISTRATOR CLASS | | | 2016 | | | 2015 | | | 2014 | | | 2013 | | | 2012 | |
Net asset value, beginning of period | | | $21.78 | | | | $21.84 | | | | $24.98 | | | | $24.59 | | | | $21.26 | | | | $17.18 | |
Net investment income (loss) | | | (0.02 | )1 | | | 0.02 | | | | (0.01 | )1 | | | (0.02 | )1 | | | 0.01 | | | | 0.01 | |
Net realized and unrealized gains (losses) on investments | | | 2.37 | | | | 2.48 | | | | (0.32 | ) | | | 2.48 | | | | 4.75 | | | | 5.33 | |
| | | | | | | | | | | | | | | | | | | | | | | | |
Total from investment operations | | | 2.35 | | | | 2.50 | | | | (0.33 | ) | | | 2.46 | | | | 4.76 | | | | 5.34 | |
Distributions to shareholders from | | | | | | | | | | | | | | | | | | | | | | | | |
Net realized gains | | | (0.83 | ) | | | (2.56 | ) | | | (2.81 | ) | | | (2.07 | ) | | | (1.43 | ) | | | (1.26 | ) |
Net asset value, end of period | | | $23.30 | | | | $21.78 | | | | $21.84 | | | | $24.98 | | | | $24.59 | | | | $21.26 | |
Total return2 | | | 10.93 | % | | | 12.59 | % | | | (1.62 | )% | | | 10.41 | % | | | 23.92 | % | | | 32.15 | % |
Ratios to average net assets (annualized) | | | | | | | | | | | | | | | | | | | | | | | | |
Gross expenses | | | 1.17 | % | | | 1.17 | % | | | 1.12 | % | | | 1.11 | % | | | 1.11 | % | | | 1.10 | % |
Net expenses | | | 1.10 | % | | | 1.10 | % | | | 1.10 | % | | | 1.09 | % | | | 1.09 | % | | | 1.07 | % |
Net investment income (loss) | | | (0.19 | )% | | | 0.03 | % | | | (0.03 | )% | | | (0.07 | )% | | | 0.11 | % | | | 0.01 | % |
Supplemental data | | | | | | | | | | | | | | | | | | | | | | | | |
Portfolio turnover rate | | | 36 | % | | | 32 | % | | | 51 | % | | | 38 | % | | | 40 | % | | | 30 | % |
Net assets, end of period (000s omitted) | | | $7,453 | | | | $16,720 | | | | $18,050 | | | | $45,364 | | | | $24,871 | | | | $19,428 | |
| 1 | Calculated based upon average shares outstanding |
| 2 | Returns for periods of less than one year are not annualized. |
The accompanying notes are an integral part of these financial statements.
| | | | | | |
| Financial highlights | | Wells Fargo Common Stock Fund | | | 19 | |
(For a share outstanding throughout each period)
| | | | | | | | | | | | | | | | | | | | | | | | |
| | | Six months ended
March 31, 2017
(unaudited) | | | Year ended September 30 | |
| INSTITUTIONAL CLASS | | | 2016 | | | 2015 | | | 2014 | | | 2013 | | | 2012 | |
Net asset value, beginning of period | | | $22.20 | | | | $22.16 | | | | $25.25 | | | | $24.77 | | | | $21.37 | | | | $17.23 | |
Net investment income | | | 0.01 | 1 | | | 0.06 | 1 | | | 0.03 | | | | 0.03 | | | | 0.07 | 1 | | | 0.06 | 1 |
Net realized and unrealized gains (losses) on investments | | | 2.42 | | | | 2.54 | | | | (0.31 | ) | | | 2.52 | | | | 4.76 | | | | 5.34 | |
| | | | | | | | | | | | | | | | | | | | | | | | |
Total from investment operations | | | 2.43 | | | | 2.60 | | | | (0.28 | ) | | | 2.55 | | | | 4.83 | | | | 5.40 | |
Distributions to shareholders from | | | | | | | | | | | | | | | | | | | | | | | | |
Net realized gains | | | (0.83 | ) | | | (2.56 | ) | | | (2.81 | ) | | | (2.07 | ) | | | (1.43 | ) | | | (1.26 | ) |
Net asset value, end of period | | | $23.80 | | | | $22.20 | | | | $22.16 | | | | $25.25 | | | | $24.77 | | | | $21.37 | |
Total return2 | | | 11.09 | % | | | 12.88 | % | | | (1.38 | )% | | | 10.72 | % | | | 24.14 | % | | | 32.42 | % |
Ratios to average net assets (annualized) | | | | | | | | | | | | | | | | | | | | | | | | |
Gross expenses | | | 0.92 | % | | | 0.92 | % | | | 0.86 | % | | | 0.85 | % | | | 0.87 | % | | | 0.88 | % |
Net expenses | | | 0.85 | % | | | 0.85 | % | | | 0.85 | % | | | 0.85 | % | | | 0.87 | % | | | 0.88 | % |
Net investment income | | | 0.12 | % | | | 0.28 | % | | | 0.24 | % | | | 0.14 | % | | | 0.33 | % | | | 0.28 | % |
Supplemental data | | | | | | | | | | | | | | | | | | | | | | | | |
Portfolio turnover rate | | | 36 | % | | | 32 | % | | | 51 | % | | | 38 | % | | | 40 | % | | | 30 | % |
Net assets, end of period (000s omitted) | | | $195,565 | | | | $173,175 | | | | $226,729 | | | | $223,525 | | | | $197,453 | | | | $86,645 | |
| 1 | Calculated based upon average shares outstanding |
| 2 | Returns for periods of less than one year are not annualized. |
The accompanying notes are an integral part of these financial statements.
| | | | |
| 20 | | Wells Fargo Common Stock Fund | | Notes to financial statements (unaudited) |
1. ORGANIZATION
Wells Fargo Funds Trust (the “Trust”), a Delaware statutory trust organized on March 10, 1999, is an open-end management investment company registered under the Investment Company Act of 1940, as amended (the “1940 Act”). As an investment company, the Trust follows the accounting and reporting guidance in Financial Accounting Standards Board (“FASB”) Accounting Standards Codification (“ASC”) Topic 946, Financial Services – Investment Companies. These financial statements report on the Wells Fargo Common Stock Fund (the “Fund”) which is a diversified series of the Trust.
Effective at the close of business on October 23, 2015, Investor Class shares became Class A shares in a tax-free conversion. Shareholders of Investor Class received Class A shares at a value equal to the value of their Investor Class shares immediately prior to the conversion. Investor Class shares are no longer offered by the Fund.
Effective at the close of business on December 5, 2016, Class B shares were converted to Class A shares and are no longer offered by the Fund. Information for Class B shares reflected in the financial statements represents activity through December 5, 2016.
2. SIGNIFICANT ACCOUNTING POLICIES
The following significant accounting policies, which are consistently followed in the preparation of the financial statements of the Fund, are in conformity with U.S. generally accepted accounting principles which require management to make estimates and assumptions that affect the reported amounts of assets and liabilities, disclosure of contingent assets and liabilities at the date of the financial statements, and the reported amounts of revenues and expenses during the reporting period. Actual results could differ from those estimates.
Securities valuation
All investments are valued each business day as of the close of regular trading on the New York Stock Exchange (generally 4 p.m. Eastern Time), although the Fund may deviate from this calculation time under unusual or unexpected circumstances.
Equity securities that are listed on a foreign or domestic exchange or market are valued at the official closing price or, if none, the last sales price. If no sale occurs on the principal exchange or market that day, the prior day’s price will be deemed “stale” and a fair value price will be determined in accordance with the Fund’s Valuation Procedures.
Investments in registered open-end investment companies are valued at net asset value. Interests in non-registered investment companies that are redeemable at net asset value are fair valued normally at net asset value.
Investments which are not valued using any of the methods discussed above are valued at their fair value, as determined in good faith by the Board of Trustees of the Fund. The Board of Trustees has established a Valuation Committee comprised of the Trustees and has delegated to it the authority to take any actions regarding the valuation of portfolio securities that the Valuation Committee deems necessary or appropriate, including determining the fair value of portfolio securities, unless the determination has been delegated to the Management Valuation Team of Wells Fargo Funds Management, LLC (“Funds Management”). The Board of Trustees retains the authority to make or ratify any valuation decisions or approve any changes to the Valuation Procedures as it deems appropriate. On a quarterly basis, the Board of Trustees receives reports on any valuation actions taken by the Valuation Committee or the Management Valuation Team which may include items for ratification.
Valuations of fair valued securities are compared to the next actual sales price when available, or other appropriate market values, to assess the continued appropriateness of the fair valuation methodologies used. These securities are fair valued on a day-to-day basis, taking into consideration changes to appropriate market information and any significant changes to the inputs considered in the valuation process until there is a readily available price provided on an exchange or by an independent pricing service. Valuations received from an independent pricing service or independent broker-dealer quotes are periodically validated by comparisons to most recent trades and valuations provided by other independent pricing services in addition to the review of prices by the manager and/or subadviser. Unobservable inputs used in determining fair valuations are identified based on the type of security, taking into consideration factors utilized by market participants in valuing the investment, knowledge about the issuer and the current market environment.
Security loans
The Fund may lend its securities from time to time in order to earn additional income in the form of fees or interest on securities received as collateral or the investment of any cash received as collateral. The Fund continues to receive interest or dividends on the securities loaned. The Fund receives collateral in the form of cash or securities with a value
| | | | | | |
| Notes to financial statements (unaudited) | | Wells Fargo Common Stock Fund | | | 21 | |
at least equal to the value of the securities on loan. The value of the loaned securities is determined at the close of each business day and any additional required collateral is delivered to the Fund on the next business day. In a securities lending transaction, the net asset value of the Fund will be affected by an increase or decrease in the value of the securities loaned and by an increase or decrease in the value of the instrument in which collateral is invested. The amount of securities lending activity undertaken by the Fund fluctuates from time to time. In the event of default or bankruptcy by the borrower, the Fund may be prevented from recovering the loaned securities or gaining access to the collateral or may experience delays or costs in doing so. In addition, the investment of any cash collateral received may lose all or part of its value. The Fund has the right under the lending agreement to recover the securities from the borrower on demand.
The Fund lends its securities through an unaffiliated securities lending agent. Cash collateral received in connection with its securities lending transactions is invested in Securities Lending Cash Investments, LLC (the “Securities Lending Fund”). The Securities Lending Fund is exempt from registration under Section 3(c)(7) of the 1940 Act and is managed by Funds Management and is subadvised by Wells Capital Management Incorporated (“WellsCap”), an affiliate of Funds Management and an indirect wholly owned subsidiary of Wells Fargo & Company (“Wells Fargo”). Funds Management receives an advisory fee starting at 0.05% and declining to 0.01% as the average daily net assets of the Securities Lending Fund increase. All of the fees received by Funds Management are paid to WellsCap for its services as subadviser. The Securities Lending Fund seeks to provide a positive return compared to the daily Fed Funds Open Rate by investing in high-quality, U.S. dollar-denominated short-term money market instruments. Securities Lending Fund investments are valued at the evaluated bid price provided by an independent pricing service. Income earned from investment in the Securities Lending Fund is included in securities lending income on the Statement of Operations.
Security transactions and income recognition
Securities transactions are recorded on a trade date basis. Realized gains or losses are recorded on the basis of identified cost.
Dividend income is recognized on the ex-dividend date.
Distributions to shareholders
Distributions to shareholders from net investment income and net realized gains, if any, are recorded on the ex-dividend date. Such distributions are determined in accordance with income tax regulations and may differ from U.S. generally accepted accounting principles. Dividend sources are estimated at the time of declaration. The tax character of distributions is determined as of the Fund’s fiscal year end. Therefore, a portion of the Fund’s distributions made prior the Fund’s fiscal year end may be categorized as a tax return of capital.
Federal and other taxes
The Fund intends to continue to qualify as a regulated investment company by distributing substantially all of its investment company taxable income and any net realized capital gains (after reduction for capital loss carryforwards) sufficient to relieve it from all, or substantially all, federal income taxes. Accordingly, no provision for federal income taxes was required.
The Fund’s income and federal excise tax returns and all financial records supporting those returns for the prior three fiscal years are subject to examination by the federal and Delaware revenue authorities. Management has analyzed the Fund’s tax positions taken on federal, state, and foreign tax returns for all open tax years and does not believe that there are any uncertain tax positions that require recognition of a tax liability.
Class allocations
The separate classes of shares offered by the Fund differ principally in applicable sales charges, distribution, shareholder servicing, and administration fees. Class specific expenses are charged directly to that share class. Investment income, common expenses, and realized and unrealized gains (losses) on investments are allocated daily to each class of shares based on the relative proportion of net assets of each class.
3. FAIR VALUATION MEASUREMENTS
Fair value measurements of investments are determined within a framework that has established a fair value hierarchy based upon the various data inputs utilized in determining the value of the Fund’s investments. The three-level hierarchy gives the highest priority to unadjusted quoted prices in active markets for identical assets or liabilities (Level 1) and the
| | | | |
| 22 | | Wells Fargo Common Stock Fund | | Notes to financial statements (unaudited) |
lowest priority to unobservable inputs (Level 3). The Fund’s investments are classified within the fair value hierarchy based on the lowest level of input that is significant to the fair value measurement. The inputs are summarized into three broad levels as follows:
| ∎ | | Level 1 – quoted prices in active markets for identical securities |
| ∎ | | Level 2 – other significant observable inputs (including quoted prices for similar securities, interest rates, prepayment speeds, credit risk, etc.) |
| ∎ | | Level 3 – significant unobservable inputs (including the Fund’s own assumptions in determining the fair value of investments) |
The inputs or methodologies used for valuing investments in securities are not necessarily an indication of the risk associated with investing in those securities.
The following is a summary of the inputs used in valuing the Fund’s assets and liabilities as of March 31, 2017:
| | | | | | | | | | | | | | | | |
| | | Quoted prices (Level 1) | | | Other significant
observable inputs
(Level 2) | | | Significant
unobservable inputs (Level 3) | | | Total | |
Assets | | | | | | | | | | | | | | | | |
Investments in: | | | | | | | | | | | | | | | | |
| | | | |
Common stocks | | | | | | | | | | | | | | | | |
Consumer discretionary | | $ | 109,085,114 | | | $ | 0 | | | $ | 0 | | | $ | 109,085,114 | |
Consumer staples | | | 21,420,983 | | | | 0 | | | | 0 | | | | 21,420,983 | |
Energy | | | 94,165,999 | | | | 0 | | | | 0 | | | | 94,165,999 | |
Financials | | | 250,544,718 | | | | 0 | | | | 0 | | | | 250,544,718 | |
Health care | | | 170,822,419 | | | | 0 | | | | 0 | | | | 170,822,419 | |
Industrials | | | 232,070,638 | | | | 0 | | | | 0 | | | | 232,070,638 | |
Information technology | | | 231,123,461 | | | | 0 | | | | 0 | | | | 231,123,461 | |
Materials | | | 73,764,499 | | | | 0 | | | | 0 | | | | 73,764,499 | |
Real estate | | | 49,348,707 | | | | 0 | | | | 0 | | | | 49,348,707 | |
| | | | |
Exchange-traded funds | | | 32,919,971 | | | | 0 | | | | 0 | | | | 32,919,971 | |
| | | | |
Short-term investments | | | | | | | | | | | | | | | | |
Investment companies | | | 14,869,412 | | | | 0 | | | | 0 | | | | 14,869,412 | |
Investments measured at net asset value* | | | | | | | | | | | | | | | 72,037,786 | |
Total assets | | $ | 1,280,135,921 | | | $ | 0 | | | $ | 0 | | | $ | 1,352,173,707 | |
| * | Investments that are measured at fair value using the net asset value per share (or its equivalent) as a practical expedient have not been categorized in the fair value hierarchy. The fair value amount presented in the table is intended to permit reconciliation of the fair value hierarchy to the amounts presented in the Statement of Assets and Liabilities. The Fund’s investment in Securities Lending Cash Investments, LLC valued at $72,037,786 does not have a redemption period notice, can be redeemed daily and does not have any unfunded commitments. |
The Fund recognizes transfers between levels within the fair value hierarchy at the end of the reporting period. At March 31, 2017, the Fund did not have any transfers into/out of Level 1, Level 2, or Level 3.
4. TRANSACTIONS WITH AFFILIATES AND OTHER EXPENSES
Management fee
Funds Management, an indirect wholly owned subsidiary of Wells Fargo, is the manager of the Fund and provides advisory and fund-level administrative services under an investment management agreement. Under the investment management agreement, Funds Management is responsible for, among other services, implementing the investment objectives and strategies of the Fund, supervising the subadviser, providing fund-level administrative services in connection with the Fund’s operations, and providing any other fund-level administrative services reasonably necessary for the operation of the Fund. As compensation for its services under the investment management agreement, Funds Management is entitled to receive an annual management fee starting at 0.80% and declining to 0.63% as the average daily net assets of the Fund increase. For the six months ended March 31, 2017, the management fee was equivalent to an annual rate of 0.76% of the Fund’s average daily net assets.
| | | | | | |
| Notes to financial statements (unaudited) | | Wells Fargo Common Stock Fund | | | 23 | |
Funds Management has retained the services of a subadviser to provide daily portfolio management to the Fund. The fee for subadvisory services is borne by Funds Management. WellsCap is the subadviser to the Fund and is entitled to receive a fee from Funds Management at an annual rate starting at 0.45% and declining to 0.30% as the average daily net assets of the Fund increase.
Administration fees
Under a class-level administration agreement, Funds Management provides class-level administrative services to the Fund, which includes paying fees and expenses for services provided by the transfer agent, sub-transfer agents, omnibus account servicers and record-keepers. As compensation for its services under the class-level administration agreement, Funds Management receives an annual fee which is calculated based on the average daily net assets of each class as follows:
| | | | |
| | | Class-level
administration fee | |
Class A, Class B, Class C | | | 0.21 | % |
Class R6 | | | 0.03 | |
Administrator Class, Institutional Class | | | 0.13 | |
Funds Management has contractually waived and/or reimbursed management and administration fees to the extent necessary to maintain certain net operating expense ratios for the Fund. Waiver of fees and/or reimbursement of expenses by Funds Management were made first from fund level expenses on a proportionate basis and then from class specific expenses. Funds Management has committed through January 31, 2018 to waive fees and/or reimburse expenses to the extent necessary to cap the Fund’s expenses at 1.26% for Class A shares, 2.01% for Class C shares, 0.85% for Class R6 shares, 1.10% for Administrator Class shares, and 0.85% for Institutional Class shares. After this time, the cap may be increased or the commitment to maintain the cap may be terminated only with the approval of the Board of Trustees.
During the six months ended March 31, 2017, State Street Bank and Trust Company, the Fund’s custodian, reimbursed the Fund $32,093 certain out-of-pocket expenses that were billed to the Fund in error from 1998-2015. This amount is included in dividend income on the Statement of Operations. In addition, Funds Management was also reimbursed $5,736 for waivers/reimbursements it made to the Fund during the period the Fund was erroneously billed.
Distribution fees
The Trust has adopted a distribution plan for Class B and Class C shares of the Fund pursuant to Rule 12b-1 under the 1940 Act. Distribution fees are charged to Class B and Class C shares and paid to Wells Fargo Funds Distributor, LLC (“Funds Distributor”), the principal underwriter, at an annual rate of 0.75% of the average daily net assets of Class B and Class C shares.
In addition, Funds Distributor is entitled to receive the front-end sales charge from the purchase of Class A shares and a contingent deferred sales charge on the redemption of certain Class A shares. Funds Distributor is also entitled to receive the contingent deferred sales charges from redemptions of Class B and Class C shares. For the six months ended March 31, 2017, Funds Distributor received $3,125 from the sale of Class A shares and $10 in contingent deferred sales charges from redemptions of Class C shares.
Shareholder servicing fees
The Trust has entered into contracts with one or more shareholder servicing agents, whereby Class A, Class B, Class C, and Administrator Class of the Fund are charged a fee at an annual rate of 0.25% of the average daily net assets of each respective class.
A portion of these total shareholder servicing fees were paid to affiliates of Wells Fargo.
5. INVESTMENT PORTFOLIO TRANSACTIONS
Purchases and sales of investments, excluding U.S. government obligations (if any) and short-term securities, for the six months ended March 31, 2017 were $452,750,640 and $463,545,122, respectively.
The Fund may purchase or sell investment securities to other Wells Fargo affiliates pursuant to Rule 17a-7 of the 1940 Act and under procedures adopted by the Board of Trustees. The procedures have been designed to ensure that these interfund transactions, which generally do not incur broker commissions, are effected at current market prices. Interfund trades are included within the respective purchases and sales amounts shown.
| | | | |
| 24 | | Wells Fargo Common Stock Fund | | Notes to financial statements (unaudited) |
6. BANK BORROWINGS
The Trust (excluding the money market funds and certain other funds) and Wells Fargo Variable Trust are parties to a $250,000,000 revolving credit agreement whereby the Fund is permitted to use bank borrowings for temporary or emergency purposes, such as to fund shareholder redemption requests. Interest under the credit agreement is charged to the Fund based on a borrowing rate equal to the higher of the Federal Funds rate in effect on that day plus 1.25% or the overnight LIBOR rate in effect on that day plus 1.25%. In addition, an annual commitment fee equal to 0.25% of the unused balance is allocated to each participating fund.
For the six months ended March 31, 2017, there were no borrowings by the Fund under the agreement.
7. INDEMNIFICATION
Under the Trust’s organizational documents, the officers and Trustees have been granted certain indemnification rights against certain liabilities that may arise out of performance of their duties to the Trust. Additionally, in the normal course of business, the Trust may enter into contracts with service providers that contain a variety of indemnification clauses. The Trust’s maximum exposure under these arrangements is dependent on future claims that may be made against the Fund and, therefore, cannot be estimated.
8. NEW ACCOUNTING PRONOUNCEMENT
In December 2016, FASB issued Accounting Standards Update (“ASU”) No. 2016-19, Technical Corrections and Improvements. ASU 2016-19 includes an amendment to FASB ASC Topic 820, Fair Value Measurement which clarifies the difference between a valuation approach and a valuation technique. The amendment also requires an entity to disclose when there has been a change in either or both a valuation approach and/or a valuation technique. The disclosure requirements are effective for fiscal years and interim periods within those fiscal years beginning after December 15, 2016. Management is currently evaluating the potential impact of this new guidance to the financial statements.
9. REGULATORY CHANGES
In October 2016, the Securities and Exchange Commission (“SEC”) adopted new rules and forms and amended existing rules and forms (together, “final rules”) intended to modernize and enhance the reporting and disclosure of information by registered investment companies and to enhance liquidity risk management by open-end mutual funds and exchange-traded funds. The final rules will enhance the quality of information available to investors and will allow the SEC to more effectively collect and use data reported by funds. In part, the final rules amend Regulation S-X and require standardized, enhanced disclosure about derivatives in the Fund’s financial statements, as well as other amendments. The compliance date for the amendments to Regulation S-X is August 1, 2017 while the compliance date for the new form types is June 1, 2018 and the compliance date for the liquidity risk management program requirements is December 1, 2018. Management is currently assessing the potential impact of these enhancements and their impact on the financial statement disclosures and reporting requirements.
| | | | | | |
| Other information (unaudited) | | Wells Fargo Common Stock Fund | | | 25 | |
PROXY VOTING INFORMATION
A description of the policies and procedures that the Fund uses to determine how to vote proxies relating to portfolio securities is available, upon request, by calling 1-800-222-8222, visiting our website at wellsfargofunds.com, or visiting the SEC website at sec.gov. Information regarding how the Fund voted proxies relating to portfolio securities during the most recent 12-month period ended June 30 is available on the Fund’s website at wellsfargofunds.com or by visiting the SEC website at sec.gov.
PORTFOLIO HOLDINGS INFORMATION
The complete portfolio holdings for the Fund are publicly available monthly on the Fund’s website (wellsfargofunds.com), on a one-month delayed basis. In addition, top ten holdings information (excluding derivative positions) for the Fund is publicly available on the Fund’s website on a monthly, seven-day or more delayed basis. The Fund files its complete schedule of portfolio holdings with the SEC for the first and third quarters of each fiscal year on Form N-Q, which is available by visiting the SEC website at sec.gov. In addition, the Fund’s Form N-Q may be reviewed and copied at the SEC’s Public Reference Room in Washington, DC, and at regional offices in New York City, at 233 Broadway, and in Chicago, at 175 West Jackson Boulevard, Suite 900. Information about the Public Reference Room may be obtained by calling 1-800-SEC-0330.
| | | | |
| 26 | | Wells Fargo Common Stock Fund | | Other information (unaudited) |
BOARD OF TRUSTEES AND OFFICERS
Each of the Trustees and Officers1 listed in the table below acts in identical capacities for each fund in the Wells Fargo family of funds, which consists of 138 mutual funds comprising the Wells Fargo Funds Trust, Wells Fargo Variable Trust, Wells Fargo Master Trust and four closed-end funds (collectively the “Fund Complex”). This table should be read in conjunction with the Prospectus and the Statement of Additional Information2. The mailing address of each Trustee and Officer is 525 Market Street, 12th Floor, San Francisco, CA 94105. Each Trustee and Officer serves an indefinite term, however, each Trustee serves such term until reaching the mandatory retirement age established by the Trustees.
Independent Trustees
| | | | | | |
Name and year of birth | | Position held and length of service* | | Principal occupations during past five years or longer | | Current other public company or
investment company
directorships |
William R. Ebsworth (Born 1957) | | Trustee, since 2015 | | Retired. From 1984 to 2013, equities analyst, portfolio manager, research director and chief financial officer at Fidelity Management and Research Company in Boston, Tokyo, and Hong Kong and retired in 2013 as Chief Investment Officer of Fidelity Strategic Advisers, Inc. where he lead a team of investment professionals managing client assets. Prior thereto, Board member of Hong Kong Securities Clearing Co., Hong Kong Options Clearing Corp., the Thailand International Fund, Ltd., Fidelity Investments Life Insurance Company, and Empire Fidelity Investments Life Insurance Company. Board member of the Fonté Foundation (non-profit organization) and the Vincent Memorial Hospital Endowment (non-profit organization), where he serves on the Investment Committee and as a Chair of the Audit Committee. Mr. Ebsworth is a CFA® charterholder and an Adjunct Lecturer, Finance, at Babson College. | | Asset Allocation Trust |
Jane A. Freeman (Born 1953) | | Trustee, since 2015 | | Retired. From 2012 to 2014 and 1999 to 2008, Chief Financial Officer of Scientific Learning Corporation. From 2008 to 2012, Ms. Freeman provided consulting services related to strategic business projects. Prior to 1999, Portfolio Manager at Rockefeller & Co. and Scudder, Stevens & Clark. Board member of the Harding Loevner Funds from 1996 to 2014, serving as both Lead Independent Director and chair of the Audit Committee. Board member of the Russell Exchange Traded Funds Trust from 2011 to 2012 and the chair of the Audit Committee. Ms. Freeman is a Board Member of Ruth Bancroft Garden (non-profit organization) and an inactive chartered financial analyst. | | Asset Allocation Trust |
Peter G. Gordon** (Born 1942) | | Trustee, since 1998; Chairman, since 2005 | | Co-Founder, Retired Chairman, President and CEO of Crystal Geyser Water Company. Trustee Emeritus, Colby College. | | Asset Allocation Trust |
Isaiah Harris, Jr. (Born 1952) | | Trustee, since 2009 | | Retired. Chairman of the Board of CIGNA Corporation since 2009, and Director since 2005. From 2003 to 2011, Director of Deluxe Corporation. Prior thereto, President and CEO of BellSouth Advertising and Publishing Corp. from 2005 to 2007, President and CEO of BellSouth Enterprises from 2004 to 2005 and President of BellSouth Consumer Services from 2000 to 2003. Emeritus member of the Iowa State University Foundation Board of Governors. Emeritus Member of the Advisory Board of Iowa State University School of Business. Advisory Board Member, Palm Harbor Academy (charter school). Advisory Board Member, Child Evangelism Fellowship (non-profit). Mr. Harris is a certified public accountant (inactive status). | | CIGNA Corporation; Asset Allocation Trust |
Judith M. Johnson (Born 1949) | | Trustee, since 2008; Audit Committee Chairman, since 2008 | | Retired. Prior thereto, Chief Executive Officer and Chief Investment Officer of Minneapolis Employees Retirement Fund from 1996 to 2008. Ms. Johnson is an attorney, certified public accountant and a certified managerial accountant. | | Asset Allocation Trust |
David F. Larcker (Born 1950) | | Trustee, since 2009 | | James Irvin Miller Professor of Accounting at the Graduate School of Business, Stanford University, Director of the Corporate Governance Research Initiative and Senior Faculty of The Rock Center for Corporate Governance since 2006. From 2005 to 2008, Professor of Accounting at the Graduate School of Business, Stanford University. Prior thereto, Ernst & Young Professor of Accounting at The Wharton School, University of Pennsylvania from 1985 to 2005. | | Asset Allocation Trust |
| | | | | | |
| Other information (unaudited) | | Wells Fargo Common Stock Fund | | | 27 | |
| | | | | | |
Name and year of birth | | Position held and length of service* | | Principal occupations during past five years or longer | | Current other public company or
investment company
directorships |
Olivia S. Mitchell (Born 1953) | | Trustee, since 2006 | | International Foundation of Employee Benefit Plans Professor, Wharton School of the University of Pennsylvania since 1993. Director of Wharton’s Pension Research Council and Boettner Center on Pensions & Retirement Research, and Research Associate at the National Bureau of Economic Research. Previously, Cornell University Professor from 1978 to 1993. | | Asset Allocation Trust |
Timothy J. Penny (Born 1951) | | Trustee, since 1996 | | President and Chief Executive Officer of Southern Minnesota Initiative Foundation, a non-profit organization, since 2007 and Senior Fellow at the Humphrey Institute Policy Forum at the University of Minnesota since 1995. Member of the Board of Trustees of NorthStar Education Finance, Inc., a non-profit organization, since 2007. | | Asset Allocation Trust |
Michael S. Scofield (Born 1943) | | Trustee, since 2010 | | Served on the Investment Company Institute’s Board of Governors and Executive Committee from 2008-2011 as well the Governing Council of the Independent Directors Council from 2006-2011 and the Independent Directors Council Executive Committee from 2008-2011. Chairman of the IDC from 2008-2010. Institutional Investor (Fund Directions) Trustee of Year in 2007. Trustee of the Evergreen Funds complex (and its predecessors) from 1984 to 2010. Chairman of the Evergreen Funds from 2000-2010. Former Trustee of the Mentor Funds. Retired Attorney, Law Offices of Michael S. Scofield. | | Asset Allocation Trust |
| * | Length of service dates reflect the Trustee’s commencement of service with the Trust’s predecessor entities, where applicable. |
| ** | Peter Gordon is expected to retire on December 31, 2017. |
Officers
| | | | | | |
Name and year of birth | | Position held and length of service | | Principal occupations during past five years or longer | | |
Andrew Owen (Born 1960) | | President, since 2017 | | Executive Vice President of Wells Fargo Bank, N.A. and President of Wells Fargo & Company and Head of Affiliated Managers, Wells Fargo Asset Management, since 2014. Executive Vice President responsible for marketing, investments and product development for Wells Fargo Funds Management, LLC, from 2009 to 2014. | | |
Nancy Wiser1 (Born 1967) | | Treasurer, since 2012 | | Executive Vice President of Wells Fargo Funds Management, LLC since 2011. Chief Operating Officer and Chief Compliance Officer at LightBox Capital Management LLC, from 2008 to 2011. | | |
C. David Messman (Born 1960) | | Secretary, since 2000; Chief Legal Officer, since 2003 | | Senior Vice President and Secretary of Wells Fargo Funds Management, LLC since 2001. Assistant General Counsel of Wells Fargo Bank, N.A. since 2013 and Vice President and Managing Counsel of Wells Fargo Bank, N.A. from 1996 to 2013. | | |
Michael Whitaker (Born 1967) | | Chief Compliance Officer, since 2016 | | Executive Vice President of Wells Fargo Funds Management, LLC since 2016. Chief Compliance Officer of Fidelity’s Fixed Income Funds and Asset Allocation Funds from 2008 to 2016, Compliance Officer of FMR Co., Inc. from 2014 to 2016, Fidelity Investments Money Management, Inc. from 2014 to 2016, Fidelity Investments from 2007 to 2016. | | |
David Berardi (Born 1975) | | Assistant Treasurer, since 2009 | | Vice President of Wells Fargo Funds Management, LLC since 2009. Vice President of Evergreen Investment Management Company, LLC from 2008 to 2010. Manager of Fund Reporting and Control for Evergreen Investment Management Company, LLC from 2004 to 2010. | | |
Jeremy DePalma1 (Born 1974) | | Assistant Treasurer, since 2009 | | Senior Vice President of Wells Fargo Funds Management, LLC since 2009. Senior Vice President of Evergreen Investment Management Company, LLC from 2008 to 2010 and head of the Fund Reporting and Control Team within Fund Administration from 2005 to 2010. | | |
| 1 | Nancy Wiser acts as Treasurer of 69 funds in the Fund Complex. Jeremy DePalma acts as Treasurer of 69 funds and Assistant Treasurer of 69 funds in the Fund Complex. |
| 2 | The Statement of Additional Information includes additional information about the Trustees and is available, without charge, upon request, by calling 1-800-222-8222 or by visiting the website at wellsfargofunds.com. |
| | | | |
| 28 | | Wells Fargo Common Stock Fund | | List of abbreviations |
The following is a list of common abbreviations for terms and entities that may have appeared in this report.
| ACA | — ACA Financial Guaranty Corporation |
| ADR | — American depositary receipt |
| ADS | — American depositary shares |
| AGC | — Assured Guaranty Corporation |
| AGM | — Assured Guaranty Municipal |
| Ambac | — Ambac Financial Group Incorporated |
| AMT | — Alternative minimum tax |
| BAN | — Bond anticipation notes |
| BHAC | — Berkshire Hathaway Assurance Corporation |
| CAB | — Capital appreciation bond |
| CCAB | — Convertible capital appreciation bond |
| CDA | — Community Development Authority |
| CDO | — Collateralized debt obligation |
| DRIVER | — Derivative inverse tax-exempt receipts |
| DW&P | — Department of Water & Power |
| DWR | — Department of Water Resources |
| ECFA | — Educational & Cultural Facilities Authority |
| EDA | — Economic Development Authority |
| EDFA | — Economic Development Finance Authority |
| ETF | — Exchange-traded fund |
| FDIC | — Federal Deposit Insurance Corporation |
| FFCB | — Federal Farm Credit Banks |
| FGIC | — Financial Guaranty Insurance Corporation |
| FHA | — Federal Housing Administration |
| FHLB | — Federal Home Loan Bank |
| FHLMC | — Federal Home Loan Mortgage Corporation |
| FICO | — The Financing Corporation |
| FNMA | — Federal National Mortgage Association |
| GDR | — Global depositary receipt |
| GNMA | — Government National Mortgage Association |
| HCFR | — Healthcare facilities revenue |
| HEFA | — Health & Educational Facilities Authority |
| HEFAR | — Higher education facilities authority revenue |
| HFA | — Housing Finance Authority |
| HFFA | — Health Facilities Financing Authority |
| HUD | — Department of Housing and Urban Development |
| IDA | — Industrial Development Authority |
| IDAG | — Industrial Development Agency |
| KRW | — Republic of Korea won |
| LIBOR | — London Interbank Offered Rate |
| LIFER | — Long Inverse Floating Exempt Receipts |
| LLC | — Limited liability company |
| LLLP | — Limited liability limited partnership |
| LLP | — Limited liability partnership |
| MBIA | — Municipal Bond Insurance Association |
| MFHR | — Multifamily housing revenue |
| MSTR | — Municipal securities trust receipts |
| MUD | — Municipal Utility District |
| National | — National Public Finance Guarantee Corporation |
| PCFA | — Pollution Control Financing Authority |
| PCL | — Public Company Limited |
| PCR | — Pollution control revenue |
| PFA | — Public Finance Authority |
| PFFA | — Public Facilities Financing Authority |
| PFOTER | — Puttable floating option tax-exempt receipts |
| plc | — Public limited company |
| PUTTER | — Puttable tax-exempt receipts |
| R&D | — Research & development |
| Radian | — Radian Asset Assurance |
| RAN | — Revenue anticipation notes |
| RDA | — Redevelopment Authority |
| RDFA | — Redevelopment Finance Authority |
| REIT | — Real estate investment trust |
| ROC | — Reset option certificates |
| SAVRS | — Select auction variable rate securities |
| SBA | — Small Business Authority |
| SDR | — Swedish depositary receipt |
| SFHR | — Single-family housing revenue |
| SFMR | — Single-family mortgage revenue |
| SPA | — Standby purchase agreement |
| SPDR | — Standard & Poor’s Depositary Receipts |
| SPEAR | — Short Puttable Exempt Adjustable Receipts |
| STRIPS | — Separate trading of registered interest and |
| TAN | —�� Tax anticipation notes |
| TIPS | — Treasury inflation-protected securities |
| TRAN | — Tax revenue anticipation notes |
| TTFA | — Transportation Trust Fund Authority |
| TVA | — Tennessee Valley Authority |

For more information
More information about Wells Fargo Funds is available free upon request. To obtain literature, please write, email, visit the Fund’s website, or call:
Wells Fargo Funds
P.O. Box 8266
Boston, MA 02266-8266
Email: fundservice@wellsfargo.com
Website: wellsfargofunds.com
Individual investors: 1-800-222-8222
Retail investment professionals: 1-888-877-9275
Institutional investment professionals: 1-866-765-0778
This report and the financial statements contained herein are submitted for the general information of the shareholders of the Fund. If this report is used for promotional purposes, distribution of the report must be accompanied or preceded by a current prospectus. Before investing, please consider the investment objectives, risks, charges, and expenses of the investment. For a current prospectus and, if available, a summary prospectus, containing this information, call 1-800-222-8222 or visit the Fund’s website at wellsfargofunds.com. Read the prospectus carefully before you invest or send money.
Wells Fargo Asset Management (WFAM) is a trade name used by the asset management businesses of Wells Fargo & Company. Wells Fargo Funds Management, LLC, a wholly owned subsidiary of Wells Fargo & Company, provides investment advisory and administrative services for Wells Fargo Funds. Other affiliates of Wells Fargo & Company provide subadvisory and other services for the funds. The funds are distributed by Wells Fargo Funds Distributor, LLC, Member FINRA, an affiliate of Wells Fargo & Company. Neither Wells Fargo Funds Management nor Wells Fargo Funds Distributor has Fund customer accounts/assets, and neither provides investment advice/recommendations or acts as an investment advice fiduciary to any investor.
NOT FDIC INSURED ◾ NO BANK GUARANTEE ◾ MAY LOSE VALUE
© 2017 Wells Fargo Funds Management, LLC. All rights reserved.
| | |
 | | 302887 05-17 SA229/SAR229 03-17 |
Semi-Annual Report
March 31, 2017

Wells Fargo Discovery Fund


Reduce clutter. Save trees.
Sign up for electronic delivery of prospectuses and shareholder reports at wellsfargo.com/advantagedelivery
Contents
The views expressed and any forward-looking statements are as of March 31, 2017, unless otherwise noted, and are those of the Fund managers and/or Wells Fargo Funds Management, LLC. Discussions of individual securities, or the markets generally, or any Wells Fargo Fund are not intended as individual recommendations. Future events or results may vary significantly from those expressed in any forward-looking statements. The views expressed are subject to change at any time in response to changing circumstances in the market. Wells Fargo Funds Management, LLC and the Fund disclaim any obligation to publicly update or revise any views expressed or forward-looking statements.
NOT FDIC INSURED ◾ NO BANK GUARANTEE ◾ MAY LOSE VALUE
| | | | |
| 2 | | Wells Fargo Discovery Fund | | Letter to shareholders (unaudited) |

Andrew Owen
President
Wells Fargo Funds
U.S. and international stocks returned 10.12% and 8.18% for the six-month period; within fixed income, the Bloomberg Barclays U.S. Aggregate Bond Index3 returned -2.18%.
Dear Shareholder:
As the new president of Wells Fargo Funds now that Karla Rabusch is retiring from that position after nearly 14 years, I am pleased to offer you this semi-annual report for the Wells Fargo Discovery Fund for the six-month period that ended March 31, 2017. During this period, global stocks delivered favorable results overall. U.S. and international stocks returned 10.12% and 8.18% for the six-month period, respectively, as measured by the S&P 500 Index1 and the MSCI ACWI ex USA Index (Net)2; within fixed income, the Bloomberg Barclays U.S. Aggregate Bond Index3 returned -2.18%.
During the fourth quarter of 2016, prospects for faster growth and higher interest rates in the U.S. influenced markets.
Early in the fourth quarter of 2016, U.S. stocks tended to trade lower amid concerns such as a likely interest-rate increase and uncertainty over the approaching general election. However, following Donald Trump’s election as president in early November, U.S. stocks began to rally. Investors appeared optimistic that the new administration would usher in a series of progrowth policies, and supportive economic news helped the rally carry through the quarter. The buoyant environment sent interest rates higher as well. At its mid-December meeting, Fed officials raised their short-term target interest rate for the first time in a year by a quarter percentage point to between 0.50% and 0.75%. The fourth quarter also saw the implementation of the U.S. Securities and Exchange Commission’s new rules for money market funds, which included floating net asset values (NAVs) for institutional prime and municipal money market funds as well as liquidity fees and redemption gates. In the year leading up to money market fund reform implementation, nearly $1 trillion in assets moved from these types of money market funds into government money market funds, which continued to transact at a stable $1 NAV. Outside of the U.S., the prospects for faster U.S. growth appeared to trigger some acceleration in Europe. The improvement may be partly attributable to expectations for further strengthening of the U.S. dollar, which in turn could improve demand for European goods in the U.S. due to weakening of the euro relative to the dollar. Meanwhile, rising inflation across the eurozone and Japan caused an upward shift in yield curves in those areas although developed-country bond yields remained significantly lower than U.S. Treasury yields.
Globally, stocks delivered positive results and economies showed some improvement in the first quarter of 2017.
Stocks rallied globally through the first quarter of 2017, supported by signs of improvement in the U.S. and global economies. U.S. economic data released during the quarter reflected a healthy economy. Hiring remained strong, and business and consumer sentiment improved. Meanwhile, inflation inched up during the quarter. Along with the pickup in inflation, investors appeared to shift
| 1 | The S&P 500 Index consists of 500 stocks chosen for market size, liquidity, and industry group representation. It is a market-value-weighted index with each stock’s weight in the index proportionate to its market value. You cannot invest directly in an index. |
| 2 | The Morgan Stanley Capital International (MSCI) All Country World Index (ACWI) ex USA Index (Net) is a free-float-adjusted market-capitalization-weighted index that is designed to measure the equity market performance of developed markets, excluding the United States and Canada. Source: MSCI. MSCI makes no express or implied warranties or representations and shall have no liability whatsoever with respect to any MSCI data contained herein. The MSCI data may not be further redistributed or used as a basis for other indexes or any securities or financial products. This report is not approved, reviewed, or produced by MSCI. You cannot invest directly in an index. |
| 3 | The Bloomberg Barclays U.S. Aggregate Bond Index (formerly known as Barclays U.S. Aggregate Bond Index) is a broad-based benchmark that measures the investment-grade, U.S. dollar–denominated, fixed-rate taxable bond market, including Treasuries, government-related and corporate securities, mortgage-backed securities (agency fixed-rate and hybrid adjustable-rate mortgage pass-throughs), asset-backed securities, and commercial mortgage-backed securities. You cannot invest directly in an index. |
| | | | | | |
| Letter to shareholders (unaudited) | | Wells Fargo Discovery Fund | | | 3 | |
from a mindset of very gradual interest-rate increases by the Fed to an anticipation of three or four increases in 2017. The first of these occurred in March; Fed officials raised their short-term target rate by a quarter percentage point to between 0.75% and 1.00%. With the Fed’s target-rate increase, short-term bond yields rose during the quarter. Meanwhile, longer-term Treasury yields were little changed, leading to positive performance. Investment-grade and high-yield bonds benefited from strong demand. Municipal bond returns were positive in the quarter, helped by strong demand and constrained new-issue supply. Outside of the U.S., credit spreads narrowed, helping lower-quality credit outperform amid a strong demand for yield. Also, stocks in emerging markets generally outperformed stocks in the U.S. and international developed markets. Thus far in 2017, emerging markets overall have benefited from both global economic growth and recent weakening in the U.S. dollar. European stocks also outperformed the U.S. market, despite investors’ concern over uncertainties such as the potential impact of an upcoming election in France; a contender for president of France, Marine Le Pen, favored exiting the European Union, which could potentially destabilize or topple the organization.
Don’t let short-term uncertainty derail long-term investment goals.
Periods of uncertainty can present challenges, but experience has taught us that maintaining long-term investment goals can be an effective way to plan for the future. To help you create a sound strategy based on your personal goals and risk tolerance, Wells Fargo Funds offers more than 100 mutual funds spanning a wide range of asset classes and investment styles. Although diversification cannot guarantee an investment profit or prevent losses, we believe it can be an effective way to manage investment risk and potentially smooth out overall portfolio performance. We encourage investors to know their investments and to understand that appropriate levels of risk-taking may unlock opportunities.
Thank you for choosing to invest in Wells Fargo Funds. We appreciate your confidence in us and remain committed to helping you meet your financial needs.
Sincerely,

Andrew Owen
President
Wells Fargo Funds
Although diversification cannot guarantee an investment profit or prevent losses, we believe it can be an effective way to manage investment risk and potentially smooth out overall portfolio performance.
For further information about your Fund, contact your investment professional, visit our website at wellsfargofunds.com, or call us directly at 1-800-222-8222. We are available 24 hours a day, 7 days a week.
| | | | |
| 4 | | Wells Fargo Discovery Fund | | Performance highlights (unaudited) |
Investment objective
The Fund seeks long-term capital appreciation.
Manager
Wells Fargo Funds Management, LLC
Subadviser
Wells Capital Management Incorporated
Portfolio managers
Michael T. Smith, CFA®
Christopher J. Warner, CFA®
Average annual total returns (%) as of March 31, 20171
| | | | | | | | | | | | | | | | | | | | | | | | | | | | | | | | | | |
| | | | | Including sales charge | | | Excluding sales charge | | | Expense ratios2 (%) | |
| | | Inception date | | 1 year | | | 5 year | | | 10 year | | | 1 year | | | 5 year | | | 10 year | | | Gross | | | Net3 | |
| Class A (WFDAX) | | 7-31-2007 | | | 15.76 | | | | 9.12 | | | | 8.29 | | | | 22.84 | | | | 10.41 | | | | 8.94 | | | | 1.20 | | | | 1.20 | |
| Class C (WDSCX) | | 7-31-2007 | | | 20.91 | | | | 9.59 | | | | 8.11 | | | | 21.91 | | | | 9.59 | | | | 8.11 | | | | 1.95 | | | | 1.95 | |
| Class R6 (WFDRX) | | 6-28-2013 | | | – | | | | – | | | | – | | | | 23.36 | | | | 10.87 | | | | 9.37 | | | | 0.77 | | | | 0.77 | |
| Administrator Class (WFDDX) | | 4-8-2005 | | | – | | | | – | | | | – | | | | 22.93 | | | | 10.53 | | | | 9.07 | | | | 1.12 | | | | 1.12 | |
| Institutional Class (WFDSX) | | 8-31-2006 | | | – | | | | – | | | | – | | | | 23.23 | | | | 10.81 | | | | 9.34 | | | | 0.87 | | | | 0.87 | |
| Russell 2500TM Growth Index4 | | – | | | – | | | | – | | | | – | | | | 19.77 | | | | 12.17 | | | | 8.47 | | | | – | | | | – | |
Figures quoted represent past performance, which is no guarantee of future results, and do not reflect taxes that a shareholder may pay on fund distributions or the redemption of fund shares. Investment return and principal value of an investment will fluctuate so that an investor’s shares, when redeemed, may be worth more or less than their original cost. Performance shown without sales charges would be lower if sales charges were reflected. Current performance may be lower or higher than the performance data quoted, which assumes the reinvestment of dividends and capital gains. Current month-end performance is available on the Fund’s website, wellsfargofunds.com.
Index returns do not include transaction costs associated with buying and selling securities, any mutual fund fees or expenses, or any taxes. It is not possible to invest directly in an index.
For Class A shares, the maximum front-end sales charge is 5.75%. For Class C shares, the maximum contingent deferred sales charge is 1.00%. Performance including a contingent deferred sales charge assumes the sales charge for the corresponding time period. Class R6, Administrator Class, and Institutional Class shares are sold without a front-end sales charge or contingent deferred sales charge.
Stock values fluctuate in response to the activities of individual companies and general market and economic conditions. Smaller-company stocks tend to be more volatile and less liquid than those of larger companies. Certain investment strategies tend to increase the total risk of an investment (relative to the broader market). The Fund is exposed to foreign investment risk. Consult the Fund’s prospectus for additional information on these and other risks.
Please see footnotes on page 5.
| | | | | | |
| Performance highlights (unaudited) | | Wells Fargo Discovery Fund | | | 5 | |
| | | | |
| Ten largest holdings (%) as of March 31, 20175 | |
Waste Connections Incorporated | | | 2.89 | |
Take-Two Interactive Software Incorporated | | | 1.94 | |
Berry Plastics Group Incorporated | | | 1.87 | |
Vail Resorts Incorporated | | | 1.86 | |
Allegion plc | | | 1.81 | |
Ultimate Software Group Incorporated | | | 1.79 | |
Bright Horizons Family Solutions Incorporated | | | 1.75 | |
TransUnion | | | 1.74 | |
Masonite International Corporation | | | 1.73 | |
Cinemark Holdings Incorporated | | | 1.72 | |
|
| Sector distribution as of March 31, 20176 |
|
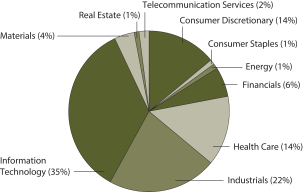 |
| 1 | Historical performance shown for Class A shares prior to their inception reflects the performance of the former Investor Class shares and includes the higher expenses applicable to the former Investor Class shares. If these expenses had not been included, returns for Class A shares would be higher. Historical performance shown for Class C shares prior to their inception reflects the performance of the former Investor Class shares and has been adjusted to reflect the higher expenses applicable to Class C shares. Historical performance shown for Class R6 shares prior to their inception reflects the performance of Institutional Class shares, and includes the higher expenses applicable to Institutional Class shares. If these expenses had not been included, the returns for Class R6 shares would be higher. |
| 2 | Reflects the expense ratios as stated in the most recent prospectuses. The expense ratios shown are subject to change and may differ from the annualized expense ratios shown in the financial highlights of this report. |
| 3 | The manager has contractually committed through January 31, 2018, to waive fees and/or reimburse expenses to the extent necessary to cap the Fund’s Total Annual Fund Operating Expenses After Fee Waivers at 1.22% for Class A, 1.97% for Class C, 0.84% for Class R6, 1.15% for Administrator Class, and 0.89% for Institutional Class. After this time, the cap may be increased or the commitment to maintain the cap may be terminated only with the approval of the Board of Trustees. Brokerage commissions, stamp duty fees, interest, taxes, acquired fund fees and expenses, and extraordinary expenses are excluded from the expense cap. Without this cap, the Fund’s returns would have been lower. The expense ratio paid by an investor is the net expense ratio or the Fund’s Total Annual Fund Operating Expenses After Fee Waivers, as stated in the prospectuses. |
| 4 | The Russell 2500™ Growth Index measures the performance of those Russell 2500 companies with higher price-to-book ratios and higher forecasted growth values. You cannot invest directly in an index. |
| 5 | The ten largest holdings, excluding cash and cash equivalents, are calculated based on the value of the investments divided by total net assets of the Fund. Holdings are subject to change and may have changed since the date specified. |
| 6 | Amounts are calculated based on the total long-term investments of the Fund. These amounts are subject to change and may have changed since the date specified. |
| | | | |
| 6 | | Wells Fargo Discovery Fund | | Fund expenses (unaudited) |
As a shareholder of the Fund, you incur two types of costs: (1) transaction costs, including sales charges (loads) on purchase payments and contingent deferred sales charges (if any) on redemptions and (2) ongoing costs, including management fees, distribution (12b-1) and/or shareholder servicing fees, and other Fund expenses. This example is intended to help you understand your ongoing costs (in dollars) of investing in the Fund and to compare these costs with the ongoing costs of investing in other mutual funds.
The example is based on an investment of $1,000 invested at the beginning of the six-month period and held for the entire period from October 1, 2016 to March 31, 2017.
Actual expenses
The “Actual” line of the table below provides information about actual account values and actual expenses. You may use the information in this line, together with the amount you invested, to estimate the expenses that you paid over the period. Simply divide your account value by $1,000 (for example, an $8,600 account value divided by $1,000 = 8.6), then multiply the result by the number in the “Actual” line under the heading entitled “Expenses paid during period” for your applicable class of shares to estimate the expenses you paid on your account during this period.
Hypothetical example for comparison purposes
The “Hypothetical” line of the table below provides information about hypothetical account values and hypothetical expenses based on the Fund’s actual expense ratio and an assumed rate of return of 5% per year before expenses, which is not the Fund’s actual return. The hypothetical account values and expenses may not be used to estimate the actual ending account balance or expenses you paid for the period. You may use this information to compare the ongoing costs of investing in the Fund and other funds. To do so, compare this 5% hypothetical example with the 5% hypothetical examples that appear in the shareholder reports of the other funds.
Please note that the expenses shown in the table are meant to highlight your ongoing costs only and do not reflect any transactional costs, such as sales charges (loads) and contingent deferred sales charges. Therefore, the “Hypothetical” line of the table is useful in comparing ongoing costs only and will not help you determine the relative total costs of owning different funds. In addition, if these transactional costs were included, your costs would have been higher.
| | | | | | | | | | | | | | | | |
| | | Beginning
account value
10-1-2016 | | | Ending
account value
3-31-2017 | | | Expenses
paid during
the period¹ | | | Annualized net
expense ratio | |
Class A | | | | | | | | | | | | | | | | |
Actual | | $ | 1,000.00 | | | $ | 1,114.73 | | | $ | 6.38 | | | | 1.21 | % |
Hypothetical (5% return before expenses) | | $ | 1,000.00 | | | $ | 1,018.90 | | | $ | 6.09 | | | | 1.21 | % |
Class C | | | | | | | | | | | | | | | | |
Actual | | $ | 1,000.00 | | | $ | 1,110.68 | | | $ | 10.31 | | | | 1.96 | % |
Hypothetical (5% return before expenses) | | $ | 1,000.00 | | | $ | 1,015.16 | | | $ | 9.85 | | | | 1.96 | % |
Class R6 | | | | | | | | | | | | | | | | |
Actual | | $ | 1,000.00 | | | $ | 1,117.18 | | | $ | 4.12 | | | | 0.78 | % |
Hypothetical (5% return before expenses) | | $ | 1,000.00 | | | $ | 1,021.04 | | | $ | 3.93 | | | | 0.78 | % |
Administrator Class | | | | | | | | | | | | | | | | |
Actual | | $ | 1,000.00 | | | $ | 1,115.15 | | | $ | 5.96 | | | | 1.13 | % |
Hypothetical (5% return before expenses) | | $ | 1,000.00 | | | $ | 1,019.30 | | | $ | 5.69 | | | | 1.13 | % |
Institutional Class | | | | | | | | | | | | | | | | |
Actual | | $ | 1,000.00 | | | $ | 1,116.85 | | | $ | 4.64 | | | | 0.88 | % |
Hypothetical (5% return before expenses) | | $ | 1,000.00 | | | $ | 1,020.54 | | | $ | 4.43 | | | | 0.88 | % |
| 1 | Expenses paid is equal to the annualized net expense ratio of each class multiplied by the average account value over the period, multiplied by the number of days in the most recent fiscal half-year divided by the number of days in the fiscal year (to reflect the one-half-year period). |
| | | | | | |
| Portfolio of investments—March 31, 2017 (unaudited) | | Wells Fargo Discovery Fund | | | 7 | |
| | | | | | | | | | | | | | | | |
| Security name | | | | | | | | Shares | | | Value | |
| | | | |
Common Stocks: 98.82% | | | | | | | | | | | | | | | | |
| | | | |
Consumer Discretionary: 14.31% | | | | | | | | | | | | | | | | |
| | | | |
| Auto Components: 1.14% | | | | | | | | | | | | | | | | |
Tenneco Automotive Incorporated | | | | | | | | | | | 445,700 | | | $ | 27,820,594 | |
| | | | | | | | | | | | | | | | |
| | | | |
| Distributors: 1.40% | | | | | | | | | | | | | | | | |
Pool Corporation | | | | | | | | | | | 285,089 | | | | 34,019,670 | |
| | | | | | | | | | | | | | | | |
| | | | |
| Diversified Consumer Services: 1.75% | | | | | | | | | | | | | | | | |
Bright Horizons Family Solutions Incorporated † | | | | | | | | | | | 587,607 | | | | 42,595,631 | |
| | | | | | | | | | | | | | | | |
| | | | |
| Hotels, Restaurants & Leisure: 6.77% | | | | | | | | | | | | | | | | |
Dave & Buster’s Entertainment Incorporated † | | | | | | | | | | | 454,494 | | | | 27,765,038 | |
Norwegian Cruise Line Holdings Limited † | | | | | | | | | | | 603,100 | | | | 30,595,263 | |
Six Flags Entertainment Corporation | | | | | | | | | | | 648,140 | | | | 38,557,849 | |
Vail Resorts Incorporated | | | | | | | | | | | 236,114 | | | | 45,310,277 | |
Wingstop Incorporated « | | | | | | | | | | | 802,425 | | | | 22,692,579 | |
| |
| | | | 164,921,006 | |
| | | | | | | | | | | | | | | | |
| | | | |
| Media: 1.71% | | | | | | | | | | | | | | | | |
Cinemark Holdings Incorporated | | | | | | | | | | | 942,605 | | | | 41,795,106 | |
| | | | | | | | | | | | | | | | |
| | | | |
| Specialty Retail: 1.54% | | | | | | | | | | | | | | | | |
Burlington Stores Incorporated † | | | | | | | | | | | 386,965 | | | | 37,647,825 | |
| | | | | | | | | | | | | | | | |
| | | | |
Consumer Staples: 1.17% | | | | | | | | | | | | | | | | |
| | | | |
| Beverages: 1.17% | | | | | | | | | | | | | | | | |
Constellation Brands Incorporated Class A | | | | | | | | | | | 175,857 | | | | 28,501,144 | |
| | | | | | | | | | | | | | | | |
| | | | |
Energy: 0.91% | | | | | | | | | | | | | | | | |
| | | | |
| Oil, Gas & Consumable Fuels: 0.91% | | | | | | | | | | | | | | | | |
Diamondback Energy Incorporated † | | | | | | | | | | | 214,065 | | | | 22,201,751 | |
| | | | | | | | | | | | | | | | |
| | | | |
Financials: 6.13% | | | | | | | | | | | | | | | | |
| | | | |
| Capital Markets: 3.81% | | | | | | | | | | | | | | | | |
Evercore Partners Incorporated Class A | | | | | | | | | | | 324,830 | | | | 25,304,257 | |
Raymond James Financial Incorporated | | | | | | | | | | | 371,345 | | | | 28,318,770 | |
SEI Investments Company | | | | | | | | | | | 775,813 | | | | 39,132,008 | |
| |
| | | | 92,755,035 | |
| | | | | | | | | | | | | | | | |
| | | | |
| Consumer Finance: 1.37% | | | | | | | | | | | | | | | | |
SLM Corporation † | | | | | | | | | | | 2,767,400 | | | | 33,485,540 | |
| | | | | | | | | | | | | | | | |
| | | | |
| Thrifts & Mortgage Finance: 0.95% | | | | | | | | | | | | | | | | |
Radian Group Incorporated | | | | | | | | | | | 1,285,900 | | | | 23,094,764 | |
| | | | | | | | | | | | | | | | |
| | | | |
Health Care: 13.70% | | | | | | | | | | | | | | | | |
| | | | |
| Biotechnology: 3.03% | | | | | | | | | | | | | | | | |
Bioverativ Incorporated † | | | | | | | | | | | 470,000 | | | | 25,596,200 | |
bluebird bio Incorporated †« | | | | | | | | | | | 125,400 | | | | 11,398,860 | |
The accompanying notes are an integral part of these financial statements.
| | | | |
| 8 | | Wells Fargo Discovery Fund | | Portfolio of investments—March 31, 2017 (unaudited) |
| | | | | | | | | | | | | | | | |
| Security name | | | | | | | | Shares | | | Value | |
| | | | |
| Biotechnology (continued) | | | | | | | | | | | | | | | | |
Exelixis Incorporated † | | | | | | | | | | | 490,038 | | | $ | 10,619,123 | |
Neurocrine Biosciences Incorporated † | | | | | | | | | | | 102,900 | | | | 4,455,570 | |
Prothena Corporation plc †« | | | | | | | | | | | 158,168 | | | | 8,824,192 | |
Seattle Genetics Incorporated † | | | | | | | | | | | 121,900 | | | | 7,662,634 | |
Tesaro Incorporated †« | | | | | | | | | | | 34,300 | | | | 5,277,741 | |
| |
| | | | 73,834,320 | |
| | | | | | | | | | | | | | | | |
| | | | |
| Health Care Equipment & Supplies: 6.03% | | | | | | | | | | | | | | | | |
Cantel Medical Corporation | | | | | | | | | | | 347,717 | | | | 27,852,132 | |
DexCom Incorporated † | | | | | | | | | | | 334,073 | | | | 28,306,005 | |
Glaukos Corporation † | | | | | | | | | | | 356,600 | | | | 18,293,580 | |
ICU Medical Incorporated † | | | | | | | | | | | 164,161 | | | | 25,067,385 | |
Insulet Corporation † | | | | | | | | | | | 474,500 | | | | 20,446,205 | |
Integra LifeSciences Holdings Corporation † | | | | | | | | | | | 641,756 | | | | 27,037,180 | |
| |
| | | | 147,002,487 | |
| | | | | | | | | | | | | | | | |
| | | | |
| Health Care Providers & Services: 3.31% | | | | | | | | | | | | | | | | |
Amedisys Incorporated † | | | | | | | | | | | 599,729 | | | | 30,640,155 | |
HealthEquity Incorporated † | | | | | | | | | | | 329,434 | | | | 13,984,473 | |
Tivity Health Incorporated † | | | | | | | | | | | 1,240,569 | | | | 36,100,558 | |
| |
| | | | 80,725,186 | |
| | | | | | | | | | | | | | | | |
| | | | |
| Life Sciences Tools & Services: 1.33% | | | | | | | | | | | | | | | | |
Cambrex Corporation † | | | | | | | | | | | 587,781 | | | | 32,357,344 | |
| | | | | | | | | | | | | | | | |
| | | | |
Industrials: 21.60% | | | | | | | | | | | | | | | | |
| | | | |
| Aerospace & Defense: 1.30% | | | | | | | | | | | | | | | | |
Orbital ATK Incorporated | | | | | | | | | | | 322,700 | | | | 31,624,600 | |
| | | | | | | | | | | | | | | | |
| | | | |
| Airlines: 1.55% | | | | | | | | | | | | | | | | |
Spirit Airlines Incorporated † | | | | | | | | | | | 713,196 | | | | 37,849,312 | |
| | | | | | | | | | | | | | | | |
| | | | |
| Building Products: 4.90% | | | | | | | | | | | | | | | | |
A.O. Smith Corporation | | | | | | | | | | | 653,100 | | | | 33,412,596 | |
Allegion plc | | | | | | | | | | | 581,053 | | | | 43,985,712 | |
Masonite International Corporation † | | | | | | | | | | | 531,047 | | | | 42,085,475 | |
| |
| | | | 119,483,783 | |
| | | | | | | | | | | | | | | | |
| | | | |
| Commercial Services & Supplies: 4.57% | | | | | | | | | | | | | | | | |
Aqua Metals Incorporated †« | | | | | | | | | | | 354,500 | | | | 6,926,930 | |
The Brink’s Company | | | | | | | | | | | 637,400 | | | | 34,069,030 | |
Waste Connections Incorporated | | | | | | | | | | | 798,611 | | | | 70,453,462 | |
| |
| | | | 111,449,422 | |
| | | | | | | | | | | | | | | | |
| | | | |
| Electrical Equipment: 0.87% | | | | | | | | | | | | | | | | |
Acuity Brands Incorporated | | | | | | | | | | | 103,496 | | | | 21,113,184 | |
| | | | | | | | | | | | | | | | |
| | | | |
| Industrial Conglomerates: 0.96% | | | | | | | | | | | | | | | | |
Carlisle Companies Incorporated | | | | | | | | | | | 219,479 | | | | 23,354,760 | |
| | | | | | | | | | | | | | | | |
The accompanying notes are an integral part of these financial statements.
| | | | | | |
| Portfolio of investments—March 31, 2017 (unaudited) | | Wells Fargo Discovery Fund | | | 9 | |
| | | | | | | | | | | | | | | | |
| Security name | | | | | | | | Shares | | | Value | |
| | | | |
| Machinery: 1.90% | | | | | | | | | | | | | | | | |
Energy Recovery Incorporated †« | | | | | | | | | | | 801,454 | | | $ | 6,668,097 | |
John Bean Technologies Corporation | | | | | | | | | | | 451,895 | | | | 39,744,165 | |
| |
| | | | 46,412,262 | |
| | | | | | | | | | | | | | | | |
| | | | |
| Professional Services: 1.74% | | | | | | | | | | | | | | | | |
TransUnion † | | | | | | | | | | | 1,104,950 | | | | 42,374,833 | |
| | | | | | | | | | | | | | | | |
| | | | |
| Trading Companies & Distributors: 3.81% | | | | | | | | | | | | | | | | |
GMS Incorporated † | | | | | | | | | | | 366,000 | | | | 12,824,640 | |
HD Supply Holdings Incorporated † | | | | | | | | | | | 999,995 | | | | 41,124,794 | |
Univar Incorporated † | | | | | | | | | | | 1,265,200 | | | | 38,791,032 | |
| | | | |
| | | | | | | | | | | | | | | 92,740,466 | |
| | | | | | | | | | | | | | | | |
| | | | |
Information Technology: 34.84% | | | | | | | | | | | | | | | | |
| | | | |
| Communications Equipment: 2.37% | | | | | | | | | | | | | | | | |
Finisar Corporation † | | | | | | | | | | | 991,214 | | | | 27,099,791 | |
Harris Corporation | | | | | | | | | | | 276,300 | | | | 30,743,901 | |
| | | | |
| | | | | | | | | | | | | | | 57,843,692 | |
| | | | | | | | | | | | | | | | |
| | | | |
| Electronic Equipment, Instruments & Components: 5.63% | | | | | | | | | | | | | | | | |
Cognex Corporation | | | | | | | | | | | 406,090 | | | | 34,091,256 | |
FLIR Systems Incorporated | | | | | | | | | | | 776,597 | | | | 28,174,939 | |
Littelfuse Incorporated | | | | | | | | | | | 227,835 | | | | 36,433,095 | |
Universal Display Corporation « | | | | | | | | | | | 446,700 | | | | 38,460,870 | |
| | | | |
| | | | | | | | | | | | | | | 137,160,160 | |
| | | | | | | | | | | | | | | | |
| | | | |
| Internet Software & Services: 7.46% | | | | | | | | | | | | | | | | |
CoStar Group Incorporated † | | | | | | | | | | | 189,449 | | | | 39,257,622 | |
MercadoLibre Incorporated | | | | | | | | | | | 188,900 | | | | 39,946,683 | |
Momo Incorporated ADR † | | | | | | | | | | | 549,700 | | | | 18,728,279 | |
Q2 Holdings Incorporated † | | | | | | | | | | | 916,050 | | | | 31,924,343 | |
Twilio Incorporated Class A †« | | | | | | | | | | | 991,100 | | | | 28,613,057 | |
Yandex NV Class A † | | | | | | | | | | | 1,060,000 | | | | 23,245,800 | |
| | | | |
| | | | | | | | | | | | | | | 181,715,784 | |
| | | | | | | | | | | | | | | | |
| | | | |
| IT Services: 8.53% | | | | | | | | | | | | | | | | |
Acxiom Corporation † | | | | | | | | | | | 1,220,943 | | | | 34,760,247 | |
EPAM Systems Incorporated † | | | | | | | | | | | 522,496 | | | | 39,458,898 | |
Euronet Worldwide Incorporated † | | | | | | | | | | | 474,482 | | | | 40,577,701 | |
Square Incorporated Class A † | | | | | | | | | | | 789,550 | | | | 13,643,424 | |
Total System Services Incorporated | | | | | | | | | | | 712,100 | | | | 38,068,866 | |
WEX Incorporated † | | | | | | | | | | | 399,300 | | | | 41,327,550 | |
| | | | |
| | | | | | | | | | | | | | | 207,836,686 | |
| | | | | | | | | | | | | | | | |
| | | | |
| Semiconductors & Semiconductor Equipment: 2.00% | | | | | | | | | | | | | | | | |
Microsemi Corporation † | | | | | | | | | | | 554,800 | | | | 28,588,844 | |
Teradyne Incorporated | | | | | | | | | | | 644,100 | | | | 20,031,510 | |
| | | | |
| | | | | | | | | | | | | | | 48,620,354 | |
| | | | | | | | | | | | | | | | |
The accompanying notes are an integral part of these financial statements.
| | | | |
| 10 | | Wells Fargo Discovery Fund | | Portfolio of investments—March 31, 2017 (unaudited) |
| | | | | | | | | | | | | | | | |
| Security name | | | | | | | | Shares | | | Value | |
| | | | |
| Software: 6.90% | | | | | | | | | | | | | | | | |
Guidewire Software Incorporated † | | | | | | | | | | | 704,919 | | | $ | 39,708,087 | |
PTC Incorporated † | | | | | | | | | | | 681,500 | | | | 35,812,825 | |
Secureworks Corporation Class A † | | | | | | | | | | | 193,000 | | | | 1,833,500 | |
Take-Two Interactive Software Incorporated † | | | | | | | | | | | 797,600 | | | | 47,273,752 | |
Ultimate Software Group Incorporated † | | | | | | | | | | | 223,000 | | | | 43,531,830 | |
| | | | |
| | | | | | | | | | | | | | | 168,159,994 | |
| | | | | | | | | | | | | | | | |
| | | | |
| Technology Hardware, Storage & Peripherals: 1.95% | | | | | | | | | | | | | | | | |
3D Systems Corporation †« | | | | | | | | | | | 1,009,700 | | | | 15,105,112 | |
NCR Corporation † | | | | | | | | | | | 712,000 | | | | 32,524,160 | |
| | | | |
| | | | | | | | | | | | | | | 47,629,272 | |
| | | | | | | | | | | | | | | | |
| | | | |
Materials: 3.86% | | | | | | | | | | | | | | | | |
| | | | |
| Chemicals: 0.83% | | | | | | | | | | | | | | | | |
Albemarle Corporation | | | | | | | | | | | 191,000 | | | | 20,177,240 | |
| | | | | | | | | | | | | | | | |
| | | | |
| Construction Materials: 1.17% | | | | | | | | | | | | | | | | |
Vulcan Materials Company | | | | | | | | | | | 235,900 | | | | 28,421,232 | |
| | | | | | | | | | | | | | | | |
| | | | |
| Containers & Packaging: 1.86% | | | | | | | | | | | | | | | | |
Berry Plastics Group Incorporated † | | | | | | | | | | | 935,833 | | | | 45,453,409 | |
| | | | | | | | | | | | | | | | |
| | | | |
Real Estate: 0.74% | | | | | | | | | | | | | | | | |
| | | | |
| Real Estate Management & Development: 0.74% | | | | | | | | | | | | | | | | |
CBRE Group Incorporated Class A † | | | | | | | | | | | 517,700 | | | | 18,010,783 | |
| | | | | | | | | | | | | | | | |
| | | | |
Telecommunication Services: 1.56% | | | | | | | | | | | | | | | | |
| | | | |
| Diversified Telecommunication Services: 1.56% | | | | | | | | | | | | | | | | |
Zayo Group Holdings Incorporated † | | | | | | | | | | | 1,153,705 | | | | 37,956,895 | |
| | | | | | | | | | | | | | | | |
| | | | |
Total Common Stocks (Cost $1,876,590,588) | | | | | | | | | | | | | | | 2,408,145,526 | |
| | | | | | | | | | | | | | | | |
| | | | |
| | | Yield | | | | | | | | | | |
| Short-Term Investments: 4.84% | | | | | | | | | | | | | | | | |
| | | | |
| Investment Companies: 4.84% | | | | | | | | | | | | | | | | |
Securities Lending Cash Investment LLC (l)(r)(u) | | | 0.98 | % | | | | | | | 90,557,133 | | | | 90,566,189 | |
Wells Fargo Government Money Market Fund Select Class (l)(u) | | | 0.63 | | | | | | | | 27,327,935 | | | | 27,327,935 | |
| | | | |
Total Short-Term Investments (Cost $117,891,136) | | | | | | | | | | | | | | | 117,894,124 | |
| | | | | | | | | | | | | | | | |
| | | | | | | | |
| Total investments in securities (Cost $1,994,481,724) * | | | 103.66 | % | | | 2,526,039,650 | |
Other assets and liabilities, net | | | (3.66 | ) | | | (89,192,359 | ) |
| | | | | | | | |
| Total net assets | | | 100.00 | % | | $ | 2,436,847,291 | |
| | | | | | | | |
| † | Non-income-earning security |
| « | All or a portion of this security is on loan. |
| (l) | The issuer of the security is an affiliated person of the Fund as defined in the Investment Company Act of 1940. |
| (r) | The investment is a non-registered investment vehicle purchased with cash collateral received from securities on loan. |
| (u) | The rate represents the 7-day annualized yield at period end. |
| * | Cost for federal income tax purposes is $1,993,862,991 and unrealized gains (losses) consists of: |
| | | | |
Gross unrealized gains | | $ | 542,512,109 | |
Gross unrealized losses | | | (10,335,450 | ) |
| | | | |
Net unrealized gains | | $ | 532,176,659 | |
The accompanying notes are an integral part of these financial statements.
| | | | | | |
| Statement of assets and liabilities—March 31, 2017 (unaudited) | | Wells Fargo Discovery Fund | | | 11 | |
| | | | |
| | | | |
| |
Assets | | | | |
Investments | | | | |
In unaffiliated securities (including $88,402,231 of securities loaned), at value (cost $1,876,590,588) | | $ | 2,408,145,526 | |
In affiliated securities, at value (cost $117,891,136) | | | 117,894,124 | |
| | | | |
Total investments, at value (cost $1,994,481,724) | | | 2,526,039,650 | |
Receivable for investments sold | | | 7,288,024 | |
Receivable for Fund shares sold | | | 3,018,647 | |
Receivable for dividends | | | 586,791 | |
Receivable for securities lending income | | | 81,359 | |
Prepaid expenses and other assets | | | 18,566 | |
| | | | |
Total assets | | | 2,537,033,037 | |
| | | | |
| |
Liabilities | | | | |
Payable for investments purchased | | | 2,972,456 | |
Payable for Fund shares redeemed | | | 4,217,775 | |
Payable upon receipt of securities loaned | | | 90,561,300 | |
Management fee payable | | | 1,602,591 | |
Distribution fee payable | | | 29,631 | |
Administration fees payable | | | 306,533 | |
Accrued expenses and other liabilities | | | 495,460 | |
| | | | |
Total liabilities | | | 100,185,746 | |
| | | | |
Total net assets | | $ | 2,436,847,291 | |
| | | | |
| |
NET ASSETS CONSIST OF | | | | |
Paid-in capital | | $ | 1,770,914,580 | |
Accumulated net investment loss | | | (14,900,025 | ) |
Accumulated net realized gains on investments | | | 149,274,810 | |
Net unrealized gains on investments | | | 531,557,926 | |
| | | | |
Total net assets | | $ | 2,436,847,291 | |
| | | | |
| |
COMPUTATION OF NET ASSET VALUE AND OFFERING PRICE PER SHARE | | | | |
Net assets – Class A | | $ | 593,786,579 | |
Shares outstanding – Class A1 | | | 18,028,711 | |
Net asset value per share – Class A | | | $32.94 | |
Maximum offering price per share – Class A2 | | | $34.95 | |
Net assets – Class C | | $ | 42,430,516 | |
Shares outstanding – Class C1 | | | 1,418,813 | |
Net asset value per share – Class C | | | $29.91 | |
Net assets – Class R6 | | $ | 299,979,442 | |
Shares outstanding – Class R61 | | | 8,550,392 | |
Net asset value per share – Class R6 | | | $35.08 | |
Net assets – Administrator Class | | $ | 329,822,195 | |
Shares outstanding – Administrator Class1 | | | 9,757,802 | |
Net asset value per share – Administrator Class | | | $33.80 | |
Net assets – Institutional Class | | $ | 1,170,828,559 | |
Shares outstanding – Institutional Class1 | | | 33,474,495 | |
Net asset value per share – Institutional Class | | | $34.98 | |
| 1 | The Fund has an unlimited number of authorized shares. |
| 2 | Maximum offering price is computed as 100/94.25 of net asset value. On investments of $50,000 or more, the offering price is reduced. |
The accompanying notes are an integral part of these financial statements.
| | | | |
| 12 | | Wells Fargo Discovery Fund | | Statement of operations—six months ended March 31, 2017 (unaudited) |
| | | | |
| | | | |
| |
Investment income | | | | |
Dividends (net of foreign withholding taxes of $44,248) | | $ | 6,567,446 | |
Securities lending income, net | | | 286,359 | |
Income from affiliated securities | | | 82,281 | |
| | | | |
Total investment income | | | 6,936,086 | |
| | | | |
| |
Expenses | | | | |
Management fee | | | 9,135,834 | |
Administration fees | | | | |
Class A | | | 636,147 | |
Class C | | | 47,432 | |
Class R6 | | | 43,966 | |
Administrator Class | | | 229,811 | |
Institutional Class | | | 795,957 | |
Shareholder servicing fees | | | | |
Class A | | | 757,317 | |
Class C | | | 56,466 | |
Administrator Class | | | 441,163 | |
Distribution fee | | | | |
Class C | | | 169,399 | |
Custody and accounting fees | | | 76,261 | |
Professional fees | | | 21,638 | |
Registration fees | | | 106,605 | |
Shareholder report expenses | | | 96,642 | |
Trustees’ fees and expenses | | | 12,270 | |
Other fees and expenses | | | 34,386 | |
| | | | |
Total expenses | | | 12,661,294 | |
Less: Fee waivers and/or expense reimbursements | | | (55 | ) |
| | | | |
Net expenses | | | 12,661,239 | |
| | | | |
Net investment loss | | | (5,725,153 | ) |
| | | | |
| |
REALIZED AND UNREALIZED GAINS (LOSSES) ON INVESTMENTS | | | | |
| |
Net realized gains on: | | | | |
Unaffiliated securities | | | 195,573,039 | |
Affiliated securities | | | 1,901 | |
| | | | |
Net realized gains on investments | | | 195,574,940 | |
| | | | |
| |
Net change in unrealized gains (losses) on: | | | | |
Unaffiliated securities | | | 78,959,655 | |
Affiiliated securities | | | 2,988 | |
| | | | |
Net change in unrealized gains (losses) on investments | | | 78,962,643 | |
| | | | |
Net realized and unrealized gains (losses) on investments | | | 274,537,583 | |
| | | | |
Net increase in net assets resulting from operations | | $ | 268,812,430 | |
| | | | |
The accompanying notes are an integral part of these financial statements.
| | | | | | |
| Statement of changes in net assets | | Wells Fargo Discovery Fund | | | 13 | |
| | | | | | | | | | | | | | | | |
| | | Six months ended
March 31, 2017
(unaudited) | | | Year ended
September 30, 2016 | |
| | | |
Operations | | | | | | | | | | | | |
Net investment loss | | | | | | $ | (5,725,153 | ) | | | | | | $ | (13,341,712 | ) |
Net realized gains (losses) on investments | | | | | | | 195,574,940 | | | | | | | | (6,021,855 | ) |
Net change in unrealized gains (losses) on investments | | | | | | | 78,962,643 | | | | | | | | 207,908,464 | |
| | | | |
Net increase in net assets resulting from operations | | | | | | | 268,812,430 | | | | | | | | 188,544,897 | |
| | | | |
| | | |
Distributions to shareholders from | | | | | | | | | | | | |
Net realized gains | | | | | | | | | | | | | | | | |
Class A | | | | | | | (8,136,174 | ) | | | | | | | (67,195,832 | ) |
Class C | | | | | | | (671,858 | ) | | | | | | | (5,778,904 | ) |
Class R6 | | | | | | | (3,804,488 | ) | | | | | | | (23,478,672 | ) |
Administrator Class | | | | | | | (4,526,561 | ) | | | | | | | (47,459,845 | ) |
Institutional Class | | | | | | | (16,230,955 | ) | | | | | | | (114,235,168 | ) |
| | | | |
Total distributions to shareholders | | | | | | | (33,370,036 | ) | | | | | | | (258,148,421 | ) |
| | | | |
| | | | |
| | | Shares | | | | | | Shares | | | | |
Capital share transactions | | | | | | | | |
Proceeds from shares sold | | | | | | | | | | | | | | | | |
Class A | | | 671,506 | | | | 21,055,184 | | | | 18,576,523 | | | | 573,833,981 | |
Class C | | | 26,339 | | | | 748,705 | | | | 85,248 | | | | 2,195,640 | |
Class R6 | | | 648,584 | | | | 21,307,616 | | | | 2,705,304 | | | | 81,981,174 | |
Administrator Class | | | 487,685 | | | | 15,602,440 | | | | 1,929,217 | | | | 57,133,826 | |
Institutional Class | | | 3,392,262 | | | | 112,241,606 | | | | 5,696,148 | | | | 169,010,558 | |
Investor Class | | | N/A | | | | N/A | | | | 55,579 | 1 | | | 1,728,387 | 1 |
| | | | |
| | | | | | | 170,955,551 | | | | | | | | 885,883,566 | |
| | | | |
Reinvestment of distributions | | | | | | | | | | | | | | | | |
Class A | | | 255,886 | | | | 7,873,622 | | | | 2,330,578 | | | | 65,162,949 | |
Class C | | | 19,199 | | | | 537,750 | | | | 183,951 | | | | 4,722,020 | |
Class R6 | | | 116,203 | | | | 3,804,488 | | | | 793,466 | | | | 23,478,672 | |
Administrator Class | | | 142,683 | | | | 4,504,510 | | | | 1,650,359 | | | | 47,282,773 | |
Institutional Class | | | 471,707 | | | | 15,401,227 | | | | 3,798,743 | | | | 112,214,868 | |
| | | | |
| | | | | | | 32,121,597 | | | | | | | | 252,861,282 | |
| | | | |
Payment for shares redeemed | | | | | | | | | | | | | | | | |
Class A | | | (4,337,115 | ) | | | (134,055,303 | ) | | | (9,136,801 | ) | | | (255,432,871 | ) |
Class C | | | (440,024 | ) | | | (12,369,816 | ) | | | (820,726 | ) | | | (21,433,438 | ) |
Class R6 | | | (1,653,438 | ) | | | (53,428,408 | ) | | | (2,598,689 | ) | | | (77,229,246 | ) |
Administrator Class | | | (3,934,387 | ) | | | (124,297,992 | ) | | | (8,985,182 | ) | | | (255,827,949 | ) |
Institutional Class | | | (11,887,198 | ) | | | (386,066,608 | ) | | | (12,826,340 | ) | | | (384,667,531 | ) |
Investor Class | | | N/A | | | | N/A | | | | (17,797,151 | )1 | | | (549,387,039 | )1 |
| | | | |
| | | | | | | (710,218,127 | ) | | | | | | | (1,543,978,074 | ) |
| | | | |
Net decrease in net assets resulting from capital share transactions | | | | | | | (507,140,979 | ) | | | | | | | (405,233,226 | ) |
| | | | |
Total decrease in net assets | | | | | | | (271,698,585 | ) | | | | | | | (474,836,750 | ) |
| | | | |
| | |
Net assets | | | | | | | | |
Beginning of period | | | | | | | 2,708,545,876 | | | | | | | | 3,183,382,626 | |
| | | | |
End of period | | | | | | $ | 2,436,847,291 | | | | | | | $ | 2,708,545,876 | |
| | | | |
Accumulated net investment loss | | | | | | $ | (14,900,025 | ) | | | | | | $ | (9,174,872 | ) |
| | | | |
| 1 | For the period from October 1, 2015 to October 23, 2015. Effective at the close of business on October 23, 2015, Investor Class shares were converted to Class A shares and are no longer offered by the Fund. |
The accompanying notes are an integral part of these financial statements.
| | | | |
| 14 | | Wells Fargo Discovery Fund | | Financial highlights |
(For a share outstanding throughout each period)
| | | | | | | | | | | | | | | | | | | | | | | | |
| | | Six months ended
March 31, 2017 (unaudited) | | | Year ended September 30 | |
| CLASS A | | | 2016 | | | 2015 | | | 2014 | | | 2013 | | | 2012 | |
Net asset value, beginning of period | | | $29.94 | | | | $30.48 | | | | $32.35 | | | | $33.50 | | | | $26.89 | | | | $21.20 | |
Net investment loss | | | (0.10 | )1 | | | (0.18 | )1 | | | (0.24 | ) | | | (0.30 | ) | | | (0.08 | )1 | | | (0.14 | )1 |
Net realized and unrealized gains (losses) on investments | | | 3.51 | | | | 2.23 | | | | 0.96 | | | | 1.36 | | | | 8.14 | | | | 6.82 | |
| | | | | | | | | | | | | | | | | | | | | | | | |
Total from investment operations | | | 3.41 | | | | 2.05 | | | | 0.72 | | | | 1.06 | | | | 8.06 | | | | 6.68 | |
Distributions to shareholders from | | | | | | | | | | | | | | | | | | | | | | | | |
Net realized gains | | | (0.41 | ) | | | (2.59 | ) | | | (2.59 | ) | | | (2.21 | ) | | | (1.45 | ) | | | (0.99 | ) |
Net asset value, end of period | | | $32.94 | | | | $29.94 | | | | $30.48 | | | | $32.35 | | | | $33.50 | | | | $26.89 | |
Total return2 | | | 11.47 | % | | | 7.33 | % | | | 2.09 | % | | | 3.15 | % | | | 31.86 | % | | | 32.05 | % |
Ratios to average net assets (annualized) | | | | | | | | | | | | | | | | | | | | | | | | |
Gross expenses | | | 1.21 | % | | | 1.20 | % | | | 1.23 | % | | | 1.25 | % | | | 1.27 | % | | | 1.29 | % |
Net expenses | | | 1.21 | % | | | 1.20 | % | | | 1.21 | % | | | 1.22 | % | | | 1.22 | % | | | 1.22 | % |
Net investment loss | | | (0.66 | )% | | | (0.64 | )% | | | (0.64 | )% | | | (0.95 | )% | | | (0.29 | )% | | | (0.53 | )% |
Supplemental data | | | | | | | | | | | | | | | | | | | | | | | | |
Portfolio turnover rate | | | 47 | % | | | 78 | % | | | 87 | % | | | 84 | % | | | 86 | % | | | 104 | % |
Net assets, end of period (000s omitted) | | | $593,787 | | | | $641,786 | | | | $294,661 | | | | $335,221 | | | | $239,506 | | | | $114,882 | |
| 1 | Calculated based upon average shares outstanding |
| 2 | Total return calculations do not include any sales charges. Returns for periods of less than one year are not annualized. |
The accompanying notes are an integral part of these financial statements.
| | | | | | |
| Financial highlights | | Wells Fargo Discovery Fund | | | 15 | |
(For a share outstanding throughout each period)
| | | | | | | | | | | | | | | | | | | | | | | | |
| | | Six months ended
March 31, 2017 (unaudited) | | | Year ended September 30 | |
| CLASS C | | | 2016 | | | 2015 | | | 2014 | | | 2013 | | | 2012 | |
Net asset value, beginning of period | | | $27.32 | | | | $28.24 | | | | $30.37 | | | | $31.81 | | | | $25.79 | | | | $20.51 | |
Net investment loss | | | (0.20 | )1 | | | (0.37 | )1 | | | (0.43 | )1 | | | (0.35 | ) | | | (0.30 | )1 | | | (0.31 | )1 |
Net realized and unrealized gains (losses) on investments | | | 3.20 | | | | 2.04 | | | | 0.89 | | | | 1.12 | | | | 7.77 | | | | 6.58 | |
| | | | | | | | | | | | | | | | | | | | | | | | |
Total from investment operations | | | 3.00 | | | | 1.67 | | | | 0.46 | | | | 0.77 | | | | 7.47 | | | | 6.27 | |
Distributions to shareholders from | | | | | | | | | | | | | | | | | | | | | | | | |
Net realized gains | | | (0.41 | ) | | | (2.59 | ) | | | (2.59 | ) | | | (2.21 | ) | | | (1.45 | ) | | | (0.99 | ) |
Net asset value, end of period | | | $29.91 | | | | $27.32 | | | | $28.24 | | | | $30.37 | | | | $31.81 | | | | $25.79 | |
Total return2 | | | 11.07 | % | | | 6.51 | % | | | 1.35 | % | | | 2.33 | % | | | 30.89 | % | | | 31.10 | % |
Ratios to average net assets (annualized) | | | | | | | | | | | | | | | | | | | | | | | | |
Gross expenses | | | 1.96 | % | | | 1.95 | % | | | 1.98 | % | | | 2.00 | % | | | 2.02 | % | | | 2.04 | % |
Net expenses | | | 1.96 | % | | | 1.95 | % | | | 1.96 | % | | | 1.97 | % | | | 1.97 | % | | | 1.97 | % |
Net investment loss | | | (1.41 | )% | | | (1.41 | )% | | | (1.39 | )% | | | (1.70 | )% | | | (1.08 | )% | | | (1.28 | )% |
Supplemental data | | | | | | | | | | | | | | | | | | | | | | | | |
Portfolio turnover rate | | | 47 | % | | | 78 | % | | | 87 | % | | | 84 | % | | | 86 | % | | | 104 | % |
Net assets, end of period (000s omitted) | | | $42,431 | | | | $49,538 | | | | $66,772 | | | | $84,585 | | | | $48,768 | | | | $16,803 | |
| 1 | Calculated based upon average shares outstanding |
| 2 | Total return calculations do not include any sales charges. Returns for periods of less than one year are not annualized. |
The accompanying notes are an integral part of these financial statements.
| | | | |
| 16 | | Wells Fargo Discovery Fund | | Financial highlights |
(For a share outstanding throughout each period)
| | | | | | | | | | | | | | | | | | | | |
| | | Six months ended
March 31, 2017 (unaudited) | | | Year ended September 30 | |
| CLASS R6 | | | 2016 | | | 2015 | | | 2014 | | | 20131 | |
Net asset value, beginning of period | | | $31.80 | | | | $32.08 | | | | $33.78 | | | | $34.73 | | | | $31.03 | |
Net investment income (loss) | | | (0.02 | ) | | | (0.07 | ) | | | (0.07 | ) | | | (0.17 | ) | | | 0.02 | 2 |
Net realized and unrealized gains (losses) on investments | | | 3.71 | | | | 2.38 | | | | 0.96 | | | | 1.43 | | | | 3.68 | |
| | | | | | | | | | | | | | | | | | | | |
Total from investment operations | | | 3.69 | | | | 2.31 | | | | 0.89 | | | | 1.26 | | | | 3.70 | |
Distributions to shareholders from | | | | | | | | | | | | | | | | | | | | |
Net realized gains | | | (0.41 | ) | | | (2.59 | ) | | | (2.59 | ) | | | (2.21 | ) | | | 0.00 | |
Net asset value, end of period | | | $35.08 | | | | $31.80 | | | | $32.08 | | | | $33.78 | | | | $34.73 | |
Total return3 | | | 11.72 | % | | | 7.77 | % | | | 2.53 | % | | | 3.60 | % | | | 11.96 | % |
Ratios to average net assets (annualized) | | | | | | | | | | | | | | | | | | | | |
Gross expenses | | | 0.78 | % | | | 0.77 | % | | | 0.76 | % | | | 0.77 | % | | | 0.77 | % |
Net expenses | | | 0.78 | % | | | 0.77 | % | | | 0.76 | % | | | 0.77 | % | | | 0.77 | % |
Net investment income (loss) | | | (0.23 | )% | | | (0.22 | )% | | | (0.21 | )% | | | (0.45 | )% | | | 0.30 | % |
Supplemental data | | | | | | | | | | | | | | | | | | | | |
Portfolio turnover rate | | | 47 | % | | | 78 | % | | | 87 | % | | | 84 | % | | | 86 | % |
Net assets, end of period (000s omitted) | | | $299,979 | | | | $300,118 | | | | $273,941 | | | | $221,043 | | | | $28 | |
| 1 | For the period from June 28, 2013 (commencement of class operations) to September 30, 2013 |
| 2 | Calculated based upon average shares outstanding |
| 3 | Returns for periods of less than one year are not annualized. |
The accompanying notes are an integral part of these financial statements.
| | | | | | |
| Financial highlights | | Wells Fargo Discovery Fund | | | 17 | |
(For a share outstanding throughout each period)
| | | | | | | | | | | | | | | | | | | | | | | | |
| | | Six months ended
March 31, 2017 (unaudited) | | | Year ended September 30 | |
| ADMINISTRATOR CLASS | | | 2016 | | | 2015 | | | 2014 | | | 2013 | | | 2012 | |
Net asset value, beginning of period | | | $30.70 | | | | $31.17 | | | | $32.99 | | | | $34.08 | | | | $27.30 | | | | $21.50 | |
Net investment loss | | | (0.09 | )1 | | | (0.17 | )1 | | | (0.20 | ) | | | (0.27 | )1 | | | (0.04 | ) | | | (0.12 | )1 |
Net realized and unrealized gains (losses) on investments | | | 3.60 | | | | 2.29 | | | | 0.97 | | | | 1.39 | | | | 8.27 | | | | 6.91 | |
| | | | | | | | | | | | | | | | | | | | | | | | |
Total from investment operations | | | 3.51 | | | | 2.12 | | | | 0.77 | | | | 1.12 | | | | 8.23 | | | | 6.79 | |
Distributions to shareholders from | | | | | | | | | | | | | | | | | | | | | | | | |
Net realized gains | | | (0.41 | ) | | | (2.59 | ) | | | (2.59 | ) | | | (2.21 | ) | | | (1.45 | ) | | | (0.99 | ) |
Net asset value, end of period | | | $33.80 | | | | $30.70 | | | | $31.17 | | | | $32.99 | | | | $34.08 | | | | $27.30 | |
Total return2 | | | 11.51 | % | | | 7.40 | % | | | 2.24 | % | | | 3.25 | % | | | 32.01 | % | | | 32.12 | % |
Ratios to average net assets (annualized) | | | | | | | | | | | | | | | | | | | | | | | | |
Gross expenses | | | 1.13 | % | | | 1.12 | % | | | 1.09 | % | | | 1.08 | % | | | 1.10 | % | | | 1.13 | % |
Net expenses | | | 1.13 | % | | | 1.12 | % | | | 1.09 | % | | | 1.08 | % | | | 1.10 | % | | | 1.13 | % |
Net investment loss | | | (0.58 | )% | | | (0.58 | )% | | | (0.52 | )% | | | (0.81 | )% | | | (0.13 | )% | | | (0.45 | )% |
Supplemental data | | | | | | | | | | | | | | | | | | | | | | | | |
Portfolio turnover rate | | | 47 | % | | | 78 | % | | | 87 | % | | | 84 | % | | | 86 | % | | | 104 | % |
Net assets, end of period (000s omitted) | | | $329,822 | | | | $400,997 | | | | $575,568 | | | | $687,537 | | | | $648,228 | | | | $478,673 | |
| 1 | Calculated based upon average shares outstanding |
| 2 | Returns for periods of less than one year are not annualized. |
The accompanying notes are an integral part of these financial statements.
| | | | |
| 18 | | Wells Fargo Discovery Fund | | Financial highlights |
(For a share outstanding throughout each period)
| | | | | | | | | | | | | | | | | | | | | | | | |
| | | Six months ended
March 31, 2017 (unaudited) | | | Year ended September 30 | |
| INSTITUTIONAL CLASS | | | 2016 | | | 2015 | | | 2014 | | | 2013 | | | 2012 | |
Net asset value, beginning of period | | | $31.72 | | | | $32.04 | | | | $33.76 | | | | $34.74 | | | | $27.73 | | | | $21.76 | |
Net investment income (loss) | | | (0.05 | )1 | | | (0.10 | ) | | | (0.09 | ) | | | (0.20 | ) | | | 0.01 | | | | (0.07 | ) |
Net realized and unrealized gains (losses) on investments | | | 3.72 | | | | 2.37 | | | | 0.96 | | | | 1.43 | | | | 8.45 | | | | 7.03 | |
| | | | | | | | | | | | | | | | | | | | | | | | |
Total from investment operations | | | 3.67 | | | | 2.27 | | | | 0.87 | | | | 1.23 | | | | 8.46 | | | | 6.96 | |
Distributions to shareholders from | | | | | | | | | | | | | | | | | | | | | | | | |
Net realized gains | | | (0.41 | ) | | | (2.59 | ) | | | (2.59 | ) | | | (2.21 | ) | | | (1.45 | ) | | | (0.99 | ) |
Net asset value, end of period | | | $34.98 | | | | $31.72 | | | | $32.04 | | | | $33.76 | | | | $34.74 | | | | $27.73 | |
Total return2 | | | 11.68 | % | | | 7.68 | % | | | 2.47 | % | | | 3.51 | % | | | 32.36 | % | | | 32.53 | % |
Ratios to average net assets (annualized) | | | | | | | | | | | | | | | | | | | | | | | | |
Gross expenses | | | 0.88 | % | | | 0.87 | % | | | 0.82 | % | | | 0.82 | % | | | 0.84 | % | | | 0.86 | % |
Net expenses | | | 0.88 | % | | | 0.87 | % | | | 0.82 | % | | | 0.82 | % | | | 0.84 | % | | | 0.86 | % |
Net investment income (loss) | | | (0.33 | )% | | | (0.32 | )% | | | (0.26 | )% | | | (0.54 | )% | | | 0.11 | % | | | (0.19 | )% |
Supplemental data | | | | | | | | | | | | | | | | | | | | | | | | |
Portfolio turnover rate | | | 47 | % | | | 78 | % | | | 87 | % | | | 84 | % | | | 86 | % | | | 104 | % |
Net assets, end of period (000s omitted) | | | $1,170,829 | | | | $1,316,107 | | | | $1,436,125 | | | | $1,396,603 | | | | $988,615 | | | | $524,506 | |
| 1 | Calculated based upon average shares outstanding |
| 2 | Returns for periods of less than one year are not annualized. |
The accompanying notes are an integral part of these financial statements.
| | | | | | |
| Notes to financial statements (unaudited) | | Wells Fargo Discovery Fund | | | 19 | |
1. ORGANIZATION
Wells Fargo Funds Trust (the “Trust”), a Delaware statutory trust organized on March 10, 1999, is an open-end management investment company registered under the Investment Company Act of 1940, as amended (the “1940 Act”). As an investment company, the Trust follows the accounting and reporting guidance in Financial Accounting Standards Board (“FASB”) Accounting Standards Codification (“ASC”) Topic 946, Financial Services – Investment Companies. These financial statements report on the Wells Fargo Discovery Fund (the “Fund”) which is a diversified series of the Trust.
Effective at the close of business on October 23, 2015, Investor Class shares became Class A shares in a tax-free conversion. Shareholders of Investor Class received Class A shares at a value equal to the value of their Investor Class shares immediately prior to the conversion. Investor Class shares are no longer offered by the Fund.
2. SIGNIFICANT ACCOUNTING POLICIES
The following significant accounting policies, which are consistently followed in the preparation of the financial statements of the Fund, are in conformity with U.S. generally accepted accounting principles which require management to make estimates and assumptions that affect the reported amounts of assets and liabilities, disclosure of contingent assets and liabilities at the date of the financial statements, and the reported amounts of revenues and expenses during the reporting period. Actual results could differ from those estimates.
Securities valuation
All investments are valued each business day as of the close of regular trading on the New York Stock Exchange (generally 4 p.m. Eastern Time), although the Fund may deviate from this calculation time under unusual or unexpected circumstances.
Equity securities that are listed on a foreign or domestic exchange or market are valued at the official closing price or, if none, the last sales price. If no sale occurs on the principal exchange or market that day, the prior day’s price will be deemed “stale” and a fair value price will be determined in accordance with the Fund’s Valuation Procedures.
Investments in registered open-end investment companies are valued at net asset value. Interests in non-registered investment companies that are redeemable at net asset value are fair valued normally at net asset value.
Investments which are not valued using any of the methods discussed above are valued at their fair value, as determined in good faith by the Board of Trustees of the Fund. The Board of Trustees has established a Valuation Committee comprised of the Trustees and has delegated to it the authority to take any actions regarding the valuation of portfolio securities that the Valuation Committee deems necessary or appropriate, including determining the fair value of portfolio securities, unless the determination has been delegated to the Management Valuation Team of Wells Fargo Funds Management, LLC (“Funds Management”). The Board of Trustees retains the authority to make or ratify any valuation decisions or approve any changes to the Valuation Procedures as it deems appropriate. On a quarterly basis, the Board of Trustees receives reports on any valuation actions taken by the Valuation Committee or the Management Valuation Team which may include items for ratification.
Valuations of fair valued securities are compared to the next actual sales price when available, or other appropriate market values, to assess the continued appropriateness of the fair valuation methodologies used. These securities are fair valued on a day-to-day basis, taking into consideration changes to appropriate market information and any significant changes to the inputs considered in the valuation process until there is a readily available price provided on an exchange or by an independent pricing service. Valuations received from an independent pricing service or independent broker-dealer quotes are periodically validated by comparisons to most recent trades and valuations provided by other independent pricing services in addition to the review of prices by the manager and/or subadviser. Unobservable inputs used in determining fair valuations are identified based on the type of security, taking into consideration factors utilized by market participants in valuing the investment, knowledge about the issuer and the current market environment.
Security loans
The Fund may lend its securities from time to time in order to earn additional income in the form of fees or interest on securities received as collateral or the investment of any cash received as collateral. The Fund continues to receive interest or dividends on the securities loaned. The Fund receives collateral in the form of cash or securities with a value at least equal to the value of the securities on loan. The value of the loaned securities is determined at the close of each business day and any additional required collateral is delivered to the Fund on the next business day. In a securities lending transaction, the net asset value of the Fund will be affected by an increase or decrease in the value of the securities loaned and by an increase or decrease in the value of the instrument in which collateral is invested. The amount of securities lending activity undertaken by the Fund fluctuates from time to time. In the event of default or bankruptcy
| | | | |
| 20 | | Wells Fargo Discovery Fund | | Notes to financial statements (unaudited) |
by the borrower, the Fund may be prevented from recovering the loaned securities or gaining access to the collateral or may experience delays or costs in doing so. In addition, the investment of any cash collateral received may lose all or part of its value. The Fund has the right under the lending agreement to recover the securities from the borrower on demand.
The Fund lends its securities through an unaffiliated securities lending agent. Cash collateral received in connection with its securities lending transactions is invested in Securities Lending Cash Investments, LLC (the “Securities Lending Fund”). The Securities Lending Fund is exempt from registration under Section 3(c)(7) of the 1940 Act and is managed by Funds Management and is subadvised by Wells Capital Management Incorporated (“WellsCap”), an affiliate of Funds Management and an indirect wholly owned subsidiary of Wells Fargo & Company (“Wells Fargo”). Funds Management receives an advisory fee starting at 0.05% and declining to 0.01% as the average daily net assets of the Securities Lending Fund increase. All of the fees received by Funds Management are paid to WellsCap for its services as subadviser. The Securities Lending Fund seeks to provide a positive return compared to the daily Fed Funds Open Rate by investing in high-quality, U.S. dollar-denominated short-term money market instruments. Securities Lending Fund investments are valued at the evaluated bid price provided by an independent pricing service. Income earned from investment in the Securities Lending Fund is included in securities lending income on the Statement of Operations.
Security transactions and income recognition
Securities transactions are recorded on a trade date basis. Realized gains or losses are recorded on the basis of identified cost.
Dividend income is recognized on the ex-dividend date. Dividend income is recorded net of foreign taxes withheld where recovery of such taxes is not assured.
Distributions to shareholders
Distributions to shareholders from net investment income and net realized gains, if any, are recorded on the ex-dividend date. Such distributions are determined in accordance with income tax regulations and may differ from U.S. generally accepted accounting principles. Dividend sources are estimated at the time of declaration. The tax character of distributions is determined as of the Fund’s fiscal year end. Therefore, a portion of the Fund’s distributions made prior the Fund’s fiscal year end may be categorized as a tax return of capital.
Federal and other taxes
The Fund intends to continue to qualify as a regulated investment company by distributing substantially all of its investment company taxable income and any net realized capital gains (after reduction for capital loss carryforwards) sufficient to relieve it from all, or substantially all, federal income taxes. Accordingly, no provision for federal income taxes was required.
The Fund’s income and federal excise tax returns and all financial records supporting those returns for the prior three fiscal years are subject to examination by the federal and Delaware revenue authorities. Management has analyzed the Fund’s tax positions taken on federal, state, and foreign tax returns for all open tax years and does not believe that there are any uncertain tax positions that require recognition of a tax liability.
As of September 30, 2016, the Fund had current year deferred post-October capital losses and a qualified late-year ordinary loss which were recognized on the first day of the current fiscal year in the following amounts:
| | |
Deferred post-October
capital losses | | Late-year
ordinary losses
deferred |
| Short-term | |
| $(2,518,523) | | $(9,174,473) |
Class allocations
The separate classes of shares offered by the Fund differ principally in applicable sales charges, distribution, shareholder servicing, and administration fees. Class specific expenses are charged directly to that share class. Investment income, common expenses, and realized and unrealized gains (losses) on investments are allocated daily to each class of shares based on the relative proportion of net assets of each class.
3. FAIR VALUATION MEASUREMENTS
Fair value measurements of investments are determined within a framework that has established a fair value hierarchy based upon the various data inputs utilized in determining the value of the Fund’s investments. The three-level hierarchy gives the highest priority to unadjusted quoted prices in active markets for identical assets or liabilities (Level 1) and the
| | | | | | |
| Notes to financial statements (unaudited) | | Wells Fargo Discovery Fund | | | 21 | |
lowest priority to unobservable inputs (Level 3). The Fund’s investments are classified within the fair value hierarchy based on the lowest level of input that is significant to the fair value measurement. The inputs are summarized into three broad levels as follows:
| ∎ | | Level 1 – quoted prices in active markets for identical securities |
| ∎ | | Level 2 – other significant observable inputs (including quoted prices for similar securities, interest rates, prepayment speeds, credit risk, etc.) |
| ∎ | | Level 3 – significant unobservable inputs (including the Fund’s own assumptions in determining the fair value of investments) |
The inputs or methodologies used for valuing investments in securities are not necessarily an indication of the risk associated with investing in those securities.
The following is a summary of the inputs used in valuing the Fund’s assets and liabilities as of March 31, 2017:
| | | | | | | | | | | | | | | | |
| | | Quoted prices (Level 1) | | | Other significant
observable inputs
(Level 2) | | | Significant
unobservable inputs (Level 3) | | | Total | |
Assets | | | | | | | | | | | | | | | | |
Investments in: | | | | | | | | | | | | | | | | |
| | | | |
Common stocks | | | | | | | | | | | | | | | | |
Consumer discretionary | | $ | 348,799,832 | | | $ | 0 | | | $ | 0 | | | $ | 348,799,832 | |
Consumer staples | | | 28,501,144 | | | | 0 | | | | 0 | | | | 28,501,144 | |
Energy | | | 22,201,751 | | | | 0 | | | | 0 | | | | 22,201,751 | |
Financials | | | 149,335,339 | | | | 0 | | | | 0 | | | | 149,335,339 | |
Health care | | | 333,919,337 | | | | 0 | | | | 0 | | | | 333,919,337 | |
Industrials | | | 526,402,622 | | | | 0 | | | | 0 | | | | 526,402,622 | |
Information technology | | | 848,965,942 | | | | 0 | | | | 0 | | | | 848,965,942 | |
Materials | | | 94,051,881 | | | | 0 | | | | 0 | | | | 94,051,881 | |
Real estate | | | 18,010,783 | | | | 0 | | | | 0 | | | | 18,010,783 | |
Telecommunication services | | | 37,956,895 | | | | 0 | | | | 0 | | | | 37,956,895 | |
| | | | |
Short-term investments | | | | | | | | | | | | | | | | |
Investment companies | | | 27,327,935 | | | | 0 | | | | 0 | | | | 27,327,935 | |
Investments measured at net asset value* | | | | | | | | | | | | | | | 90,566,189 | |
Total assets | | $ | 2,435,473,461 | | | $ | 0 | | | $ | 0 | | | $ | 2,526,039,650 | |
| * | Investments that are measured at fair value using the net asset value per share (or its equivalent) as a practical expedient have not been categorized in the fair value hierarchy. The fair value amount presented in the table is intended to permit reconciliation of the fair value hierarchy to the amounts presented in the Statement of Assets and Liabilities. The Fund’s investment in Securities Lending Cash Investments, LLC valued at $90,566,189 does not have a redemption period notice, can be redeemed daily and does not have any unfunded commitments. |
The Fund recognizes transfers between levels within the fair value hierarchy at the end of the reporting period. At March 31, 2017, the Fund did not have any transfers into/out of Level 1, Level 2, or Level 3.
4. TRANSACTIONS WITH AFFILIATES AND OTHER EXPENSES
Management fee
Funds Management, an indirect wholly owned subsidiary of Wells Fargo, is the manager of the Fund and provides advisory and fund-level administrative services under an investment management agreement. Under the investment management agreement, Funds Management is responsible for, among other services, implementing the investment objectives and strategies of the Fund, supervising the subadviser, providing fund-level administrative services in connection with the Fund’s operations, and providing any other fund-level administrative services reasonably necessary for the operation of the Fund. As compensation for its services under the investment management agreement, Funds Management is entitled to receive an annual management fee starting at 0.80% and declining to 0.63% as the average daily net assets of the Fund increase. For the six months ended March 31, 2017, the management fee was equivalent to an annual rate of 0.72% of the Fund’s average daily net assets.
| | | | |
| 22 | | Wells Fargo Discovery Fund | | Notes to financial statements (unaudited) |
Funds Management has retained the services of a subadviser to provide daily portfolio management to the Fund. The fee for subadvisory services is borne by Funds Management. WellsCap is the subadviser to the Fund and is entitled to receive a fee from Funds Management at an annual rate starting at 0.45% and declining to 0.35% as the average daily net assets of the Fund increase
Administration fees
Under a class-level administration agreement, Funds Management provides class-level administrative services to the Fund, which includes paying fees and expenses for services provided by the transfer agent, sub-transfer agents, omnibus account servicers and record-keepers. As compensation for its services under the class-level administration agreement, Funds Management receives an annual fee which is calculated based on the average daily net assets of each class as follows:
| | | | |
| | | Class-level
administration fee | |
Class A, Class C | | | 0.21 | % |
Class R6 | | | 0.03 | |
Administrator Class, Institutional Class | | | 0.13 | |
Funds Management has contractually waived and/or reimbursed management and administration fees to the extent necessary to maintain certain net operating expense ratios for the Fund. Waiver of fees and/or reimbursement of expenses by Funds Management were made first from fund level expenses on a proportionate basis and then from class specific expenses. Funds Management has committed through January 31, 2018 to waive fees and/or reimburse expenses to the extent necessary to cap the Fund’s expenses at 1.22% for Class A shares, 1.97% for Class C shares, 0.84% for Class R6 shares, 1.15% for Administrator Class shares, and 0.89% for Institutional Class shares. After this time, the cap may be increased or the commitment to maintain the cap may be terminated only with the approval of the Board of Trustees.
During the six months ended March 31, 2017, State Street Bank and Trust Company, the Fund’s custodian, reimbursed the Fund $2,453 for certain out-of-pocket expenses that were billed to the Fund in error from 1998-2015. This amount is included in dividend income on the Statement of Operations. In addition, Funds Management was also reimbursed $31,004 for waivers/reimbursements it made to the Fund during the period the Fund was erroneously billed.
Distribution fee
The Trust has adopted a distribution plan for Class C shares of the Fund pursuant to Rule 12b-1 under the 1940 Act. A distribution fee is charged to Class C shares and paid to Wells Fargo Funds Distributor, LLC (“Funds Distributor”), the principal underwriter, at an annual rate of 0.75% of the average daily net assets of Class C shares.
In addition, Funds Distributor is entitled to receive the front-end sales charge from the purchase of Class A shares and a contingent deferred sales charge on the redemption of certain Class A shares. Funds Distributor is also entitled to receive the contingent deferred sales charges from redemptions of Class C shares. For the six months ended March 31, 2017, Funds Distributor received $2,986 from the sale of Class A shares and $50 in contingent deferred sales charges from redemptions of Class C shares.
Shareholder servicing fees
The Trust has entered into contracts with one or more shareholder servicing agents, whereby Class A, Class C, and Administrator Class of the Fund are charged a fee at an annual rate of 0.25% of the average daily net assets of each respective class.
A portion of these total shareholder servicing fees were paid to affiliates of Wells Fargo.
5. INVESTMENT PORTFOLIO TRANSACTIONS
Purchases and sales of investments, excluding U.S. government obligations (if any) and short-term securities, for the six months ended March 31, 2017 were $1,192,830,450 and $1,661,485,300, respectively.
The Fund may purchase or sell investment securities to other Wells Fargo affiliates pursuant to Rule 17a-7 of the 1940 Act and under procedures adopted by the Board of Trustees. The procedures have been designed to ensure that these interfund transactions, which generally do not incur broker commissions, are effected at current market prices. Interfund trades are included within the respective purchases and sales amounts shown.
| | | | | | |
| Notes to financial statements (unaudited) | | Wells Fargo Discovery Fund | | | 23 | |
6. BANK BORROWINGS
The Trust (excluding the money market funds and certain other funds) and Wells Fargo Variable Trust are parties to a $250,000,000 revolving credit agreement whereby the Fund is permitted to use bank borrowings for temporary or emergency purposes, such as to fund shareholder redemption requests. Interest under the credit agreement is charged to the Fund based on a borrowing rate equal to the higher of the Federal Funds rate in effect on that day plus 1.25% or the overnight LIBOR rate in effect on that day plus 1.25%. In addition, an annual commitment fee equal to 0.25% of the unused balance is allocated to each participating fund.
For the six months ended March 31, 2017, there were no borrowings by the Fund under the agreement.
7. CONCENTRATION RISK
Concentration risks result from exposure to a limited number of sectors. A fund that invests a substantial portion of its assets in any sector may be more affected by changes in that sector than would be a fund whose investments are not heavily weighted in any sector.
8. INDEMNIFICATION
Under the Trust’s organizational documents, the officers and Trustees have been granted certain indemnification rights against certain liabilities that may arise out of performance of their duties to the Trust. Additionally, in the normal course of business, the Trust may enter into contracts with service providers that contain a variety of indemnification clauses. The Trust’s maximum exposure under these arrangements is dependent on future claims that may be made against the Fund and, therefore, cannot be estimated.
9. NEW ACCOUNTING PRONOUNCEMENT
In December 2016, FASB issued Accounting Standards Update (“ASU”) No. 2016-19, Technical Corrections and Improvements. ASU 2016-19 includes an amendment to FASB ASC Topic 820, Fair Value Measurement which clarifies the difference between a valuation approach and a valuation technique. The amendment also requires an entity to disclose when there has been a change in either or both a valuation approach and/or a valuation technique. The disclosure requirements are effective for fiscal years and interim periods within those fiscal years beginning after December 15, 2016. Management is currently evaluating the potential impact of this new guidance to the financial statements.
10. REGULATORY CHANGES
In October 2016, the Securities and Exchange Commission (“SEC”) adopted new rules and forms and amended existing rules and forms (together, “final rules”) intended to modernize and enhance the reporting and disclosure of information by registered investment companies and to enhance liquidity risk management by open-end mutual funds and exchange-traded funds. The final rules will enhance the quality of information available to investors and will allow the SEC to more effectively collect and use data reported by funds. In part, the final rules amend Regulation S-X and require standardized, enhanced disclosure about derivatives in the Fund’s financial statements, as well as other amendments. The compliance date for the amendments to Regulation S-X is August 1, 2017 while the compliance date for the new form types is June 1, 2018 and the compliance date for the liquidity risk management program requirements is December 1, 2018. Management is currently assessing the potential impact of these enhancements and their impact on the financial statement disclosures and reporting requirements.
| | | | |
| 24 | | Wells Fargo Discovery Fund | | Other information (unaudited) |
PROXY VOTING INFORMATION
A description of the policies and procedures that the Fund uses to determine how to vote proxies relating to portfolio securities is available, upon request, by calling 1-800-222-8222, visiting our website at wellsfargofunds.com, or visiting the SEC website at sec.gov. Information regarding how the Fund voted proxies relating to portfolio securities during the most recent 12-month period ended June 30 is available on the Fund’s website at wellsfargofunds.com or by visiting the SEC website at sec.gov.
PORTFOLIO HOLDINGS INFORMATION
The complete portfolio holdings for the Fund are publicly available monthly on the Fund’s website (wellsfargofunds.com), on a one-month delayed basis. In addition, top ten holdings information (excluding derivative positions) for the Fund is publicly available on the Fund’s website on a monthly, seven-day or more delayed basis. The Fund files its complete schedule of portfolio holdings with the SEC for the first and third quarters of each fiscal year on Form N-Q, which is available by visiting the SEC website at sec.gov. In addition, the Fund’s Form N-Q may be reviewed and copied at the SEC’s Public Reference Room in Washington, DC, and at regional offices in New York City, at 233 Broadway, and in Chicago, at 175 West Jackson Boulevard, Suite 900. Information about the Public Reference Room may be obtained by calling 1-800-SEC-0330.
| | | | | | |
| Other information (unaudited) | | Wells Fargo Discovery Fund | | | 25 | |
BOARD OF TRUSTEES AND OFFICERS
Each of the Trustees and Officers1 listed in the table below acts in identical capacities for each fund in the Wells Fargo family of funds, which consists of 138 mutual funds comprising the Wells Fargo Funds Trust, Wells Fargo Variable Trust, Wells Fargo Master Trust and four closed-end funds (collectively the “Fund Complex”). This table should be read in conjunction with the Prospectus and the Statement of Additional Information2. The mailing address of each Trustee and Officer is 525 Market Street, 12th Floor, San Francisco, CA 94105. Each Trustee and Officer serves an indefinite term, however, each Trustee serves such term until reaching the mandatory retirement age established by the Trustees.
Independent Trustees
| | | | | | |
Name and
year of birth | | Position held and
length of service* | | Principal occupations during past five years or longer | | Current other
public company or
investment company
directorships |
William R. Ebsworth (Born 1957) | | Trustee, since 2015 | | Retired. From 1984 to 2013, equities analyst, portfolio manager, research director and chief financial officer at Fidelity Management and Research Company in Boston, Tokyo, and Hong Kong and retired in 2013 as Chief Investment Officer of Fidelity Strategic Advisers, Inc. where he lead a team of investment professionals managing client assets. Prior thereto, Board member of Hong Kong Securities Clearing Co., Hong Kong Options Clearing Corp., the Thailand International Fund, Ltd., Fidelity Investments Life Insurance Company, and Empire Fidelity Investments Life Insurance Company. Board member of the Fonté Foundation (non-profit organization) and the Vincent Memorial Hospital Endowment (non-profit organization), where he serves on the Investment Committee and as a Chair of the Audit Committee. Mr. Ebsworth is a CFA® charterholder and an Adjunct Lecturer, Finance, at Babson College. | | Asset Allocation Trust |
Jane A. Freeman (Born 1953) | | Trustee, since 2015 | | Retired. From 2012 to 2014 and 1999 to 2008, Chief Financial Officer of Scientific Learning Corporation. From 2008 to 2012, Ms. Freeman provided consulting services related to strategic business projects. Prior to 1999, Portfolio Manager at Rockefeller & Co. and Scudder, Stevens & Clark. Board member of the Harding Loevner Funds from 1996 to 2014, serving as both Lead Independent Director and chair of the Audit Committee. Board member of the Russell Exchange Traded Funds Trust from 2011 to 2012 and the chair of the Audit Committee. Ms. Freeman is a Board Member of Ruth Bancroft Garden (non-profit organization) and an inactive chartered financial analyst. | | Asset Allocation Trust |
Peter G. Gordon** (Born 1942) | | Trustee, since 1998; Chairman, since 2005 | | Co-Founder, Retired Chairman, President and CEO of Crystal Geyser Water Company. Trustee Emeritus, Colby College. | | Asset Allocation Trust |
Isaiah Harris, Jr. (Born 1952) | | Trustee, since 2009 | | Retired. Chairman of the Board of CIGNA Corporation since 2009, and Director since 2005. From 2003 to 2011, Director of Deluxe Corporation. Prior thereto, President and CEO of BellSouth Advertising and Publishing Corp. from 2005 to 2007, President and CEO of BellSouth Enterprises from 2004 to 2005 and President of BellSouth Consumer Services from 2000 to 2003. Emeritus member of the Iowa State University Foundation Board of Governors. Emeritus Member of the Advisory Board of Iowa State University School of Business. Advisory Board Member, Palm Harbor Academy (charter school). Advisory Board Member, Child Evangelism Fellowship (non-profit). Mr. Harris is a certified public accountant (inactive status). | | CIGNA Corporation; Asset Allocation Trust |
Judith M. Johnson (Born 1949) | | Trustee, since 2008;
Audit Committee Chairman, since 2008 | | Retired. Prior thereto, Chief Executive Officer and Chief Investment Officer of Minneapolis Employees Retirement Fund from 1996 to 2008. Ms. Johnson is an attorney, certified public accountant and a certified managerial accountant. | | Asset Allocation Trust |
David F. Larcker (Born 1950) | | Trustee, since 2009 | | James Irvin Miller Professor of Accounting at the Graduate School of Business, Stanford University, Director of the Corporate Governance Research Initiative and Senior Faculty of The Rock Center for Corporate Governance since 2006. From 2005 to 2008, Professor of Accounting at the Graduate School of Business, Stanford University. Prior thereto, Ernst & Young Professor of Accounting at The Wharton School, University of Pennsylvania from 1985 to 2005. | | Asset Allocation Trust |
| | | | |
| 26 | | Wells Fargo Discovery Fund | | Other information (unaudited) |
| | | | | | |
Name and
year of birth | | Position held and
length of service* | | Principal occupations during past five years or longer | | Current other
public company or
investment company
directorships |
Olivia S. Mitchell (Born 1953) | | Trustee, since 2006 | | International Foundation of Employee Benefit Plans Professor, Wharton School of the University of Pennsylvania since 1993. Director of Wharton’s Pension Research Council and Boettner Center on Pensions & Retirement Research, and Research Associate at the National Bureau of Economic Research. Previously, Cornell University Professor from 1978 to 1993. | | Asset Allocation Trust |
Timothy J. Penny (Born 1951) | | Trustee, since 1996 | | President and Chief Executive Officer of Southern Minnesota Initiative Foundation, a non-profit organization, since 2007 and Senior Fellow at the Humphrey Institute Policy Forum at the University of Minnesota since 1995. Member of the Board of Trustees of NorthStar Education Finance, Inc., a non-profit organization, since 2007. | | Asset Allocation Trust |
Michael S. Scofield (Born 1943) | | Trustee, since 2010 | | Served on the Investment Company Institute’s Board of Governors and Executive Committee from 2008-2011 as well the Governing Council of the Independent Directors Council from 2006-2011 and the Independent Directors Council Executive Committee from 2008-2011. Chairman of the IDC from 2008-2010. Institutional Investor (Fund Directions) Trustee of Year in 2007. Trustee of the Evergreen Funds complex (and its predecessors) from 1984 to 2010. Chairman of the Evergreen Funds from 2000-2010. Former Trustee of the Mentor Funds. Retired Attorney, Law Offices of Michael S. Scofield. | | Asset Allocation Trust |
| * | Length of service dates reflect the Trustee’s commencement of service with the Trust’s predecessor entities, where applicable. |
| ** | Peter Gordon is expected to retire on December 31, 2017. |
Officers
| | | | | | |
Name and year of birth | | Position held and
length of service | | Principal occupations during past five years or longer | | |
Andrew Owen (Born 1960) | | President, since 2017 | | Executive Vice President of Wells Fargo Bank, N.A. and President of Wells Fargo & Company and Head of Affiliated Managers, Wells Fargo Asset Management, since 2014. Executive Vice President responsible for marketing, investments and product development for Wells Fargo Funds Management, LLC, from 2009 to 2014. | | |
Nancy Wiser1 (Born 1967) | | Treasurer, since 2012 | | Executive Vice President of Wells Fargo Funds Management, LLC since 2011. Chief Operating Officer and Chief Compliance Officer at LightBox Capital Management LLC, from 2008 to 2011. | | |
C. David Messman (Born 1960) | | Secretary, since 2000; Chief Legal Officer, since 2003 | | Senior Vice President and Secretary of Wells Fargo Funds Management, LLC since 2001. Assistant General Counsel of Wells Fargo Bank, N.A. since 2013 and Vice President and Managing Counsel of Wells Fargo Bank, N.A. from 1996 to 2013. | | |
Michael Whitaker (Born 1967) | | Chief Compliance Officer, since 2016 | | Executive Vice President of Wells Fargo Funds Management, LLC since 2016. Chief Compliance Officer of Fidelity’s Fixed Income Funds and Asset Allocation Funds from 2008 to 2016, Compliance Officer of FMR Co., Inc. from 2014 to 2016, Fidelity Investments Money Management, Inc. from 2014 to 2016, Fidelity Investments from 2007 to 2016. | | |
David Berardi (Born 1975) | | Assistant Treasurer, since 2009 | | Vice President of Wells Fargo Funds Management, LLC since 2009. Vice President of Evergreen Investment Management Company, LLC from 2008 to 2010. Manager of Fund Reporting and Control for Evergreen Investment Management Company, LLC from 2004 to 2010. | | |
Jeremy DePalma1 (Born 1974) | | Assistant Treasurer, since 2009 | | Senior Vice President of Wells Fargo Funds Management, LLC since 2009. Senior Vice President of Evergreen Investment Management Company, LLC from 2008 to 2010 and head of the Fund Reporting and Control Team within Fund Administration from 2005 to 2010. | | |
| 1 | Nancy Wiser acts as Treasurer of 69 funds in the Fund Complex. Jeremy DePalma acts as Treasurer of 69 funds and Assistant Treasurer of 69 funds in the Fund Complex. |
| 2 | The Statement of Additional Information includes additional information about the Trustees and is available, without charge, upon request, by calling 1-800-222-8222 or by visiting the website at wellsfargofunds.com. |
| | | | | | |
| List of abbreviations | | Wells Fargo Discovery Fund | | | 27 | |
The following is a list of common abbreviations for terms and entities that may have appeared in this report.
| ACA | — ACA Financial Guaranty Corporation |
| ADR | — American depositary receipt |
| ADS | — American depositary shares |
| AGC | — Assured Guaranty Corporation |
| AGM | — Assured Guaranty Municipal |
| Ambac | — Ambac Financial Group Incorporated |
| AMT | — Alternative minimum tax |
| BAN | — Bond anticipation notes |
| BHAC | — Berkshire Hathaway Assurance Corporation |
| CAB | — Capital appreciation bond |
| CCAB | — Convertible capital appreciation bond |
| CDA | — Community Development Authority |
| CDO | — Collateralized debt obligation |
| DRIVER | — Derivative inverse tax-exempt receipts |
| DW&P | — Department of Water & Power |
| DWR | — Department of Water Resources |
| ECFA | — Educational & Cultural Facilities Authority |
| EDA | — Economic Development Authority |
| EDFA | — Economic Development Finance Authority |
| ETF | — Exchange-traded fund |
| FDIC | — Federal Deposit Insurance Corporation |
| FFCB | — Federal Farm Credit Banks |
| FGIC | — Financial Guaranty Insurance Corporation |
| FHA | — Federal Housing Administration |
| FHLB | — Federal Home Loan Bank |
| FHLMC | — Federal Home Loan Mortgage Corporation |
| FICO | — The Financing Corporation |
| FNMA | — Federal National Mortgage Association |
| GDR | — Global depositary receipt |
| GNMA | — Government National Mortgage Association |
| HCFR | — Healthcare facilities revenue |
| HEFA | — Health & Educational Facilities Authority |
| HEFAR | — Higher education facilities authority revenue |
| HFA | — Housing Finance Authority |
| HFFA | — Health Facilities Financing Authority |
| HUD | — Department of Housing and Urban Development |
| IDA | — Industrial Development Authority |
| IDAG | — Industrial Development Agency |
| KRW | — Republic of Korea won |
| LIBOR | — London Interbank Offered Rate |
| LIFER | — Long Inverse Floating Exempt Receipts |
| LLC | — Limited liability company |
| LLLP | — Limited liability limited partnership |
| LLP | — Limited liability partnership |
| MBIA | — Municipal Bond Insurance Association |
| MFHR | — Multifamily housing revenue |
| MSTR | — Municipal securities trust receipts |
| MUD | — Municipal Utility District |
| National | — National Public Finance Guarantee Corporation |
| PCFA | — Pollution Control Financing Authority |
| PCL | — Public Company Limited |
| PCR | — Pollution control revenue |
| PFA | — Public Finance Authority |
| PFFA | — Public Facilities Financing Authority |
| PFOTER | — Puttable floating option tax-exempt receipts |
| plc | — Public limited company |
| PUTTER | — Puttable tax-exempt receipts |
| R&D | — Research & development |
| Radian | — Radian Asset Assurance |
| RAN | — Revenue anticipation notes |
| RDA | — Redevelopment Authority |
| RDFA | — Redevelopment Finance Authority |
| REIT | — Real estate investment trust |
| ROC | — Reset option certificates |
| SAVRS | — Select auction variable rate securities |
| SBA | — Small Business Authority |
| SDR | — Swedish depositary receipt |
| SFHR | — Single-family housing revenue |
| SFMR | — Single-family mortgage revenue |
| SPA | — Standby purchase agreement |
| SPDR | — Standard & Poor’s Depositary Receipts |
| SPEAR | — Short Puttable Exempt Adjustable Receipts |
| STRIPS | — Separate trading of registered interest and |
| TAN | — Tax anticipation notes |
| TIPS | — Treasury inflation-protected securities |
| TRAN | — Tax revenue anticipation notes |
| TTFA | — Transportation Trust Fund Authority |
| TVA | — Tennessee Valley Authority |
This page is intentionally left blank.

For more information
More information about Wells Fargo Funds is available free upon request. To obtain literature, please write, email, visit the Fund’s website, or call:
Wells Fargo Funds
P.O. Box 8266
Boston, MA 02266-8266
Email: fundservice@wellsfargo.com
Website: wellsfargofunds.com
Individual investors: 1-800-222-8222
Retail investment professionals: 1-888-877-9275
Institutional investment professionals: 1-866-765-0778
This report and the financial statements contained herein are submitted for the general information of the shareholders of the Fund. If this report is used for promotional purposes, distribution of the report must be accompanied or preceded by a current prospectus. Before investing, please consider the investment objectives, risks, charges, and expenses of the investment. For a current prospectus and, if available, a summary prospectus, containing this information, call 1-800-222-8222 or visit the Fund’s website at wellsfargofunds.com. Read the prospectus carefully before you invest or send money.
Wells Fargo Asset Management (WFAM) is a trade name used by the asset management businesses of Wells Fargo & Company. Wells Fargo Funds Management, LLC, a wholly owned subsidiary of Wells Fargo & Company, provides investment advisory and administrative services for Wells Fargo Funds. Other affiliates of Wells Fargo & Company provide subadvisory and other services for the funds. The funds are distributed by Wells Fargo Funds Distributor, LLC, Member FINRA, an affiliate of Wells Fargo & Company. Neither Wells Fargo Funds Management nor Wells Fargo Funds Distributor has Fund customer accounts/assets, and neither provides investment advice/recommendations or acts as an investment advice fiduciary to any investor.
NOT FDIC INSURED ◾ NO BANK GUARANTEE ◾ MAY LOSE VALUE
© 2017 Wells Fargo Funds Management, LLC. All rights reserved.
| | |
 | | 302888 05-17 SA230/SAR230 03-17 |
Semi-Annual Report
March 31, 2017

Wells Fargo Enterprise Fund


Reduce clutter. Save trees.
Sign up for electronic delivery of prospectuses and shareholder reports at wellsfargo.com/advantagedelivery
Contents
The views expressed and any forward-looking statements are as of March 31, 2017, unless otherwise noted, and are those of the Fund managers and/or Wells Fargo Funds Management, LLC. Discussions of individual securities, or the markets generally, or any Wells Fargo Fund are not intended as individual recommendations. Future events or results may vary significantly from those expressed in any forward-looking statements. The views expressed are subject to change at any time in response to changing circumstances in the market. Wells Fargo Funds Management, LLC and the Fund disclaim any obligation to publicly update or revise any views expressed or forward-looking statements.
NOT FDIC INSURED ◾ NO BANK GUARANTEE ◾ MAY LOSE VALUE
| | | | |
| 2 | | Wells Fargo Enterprise Fund | | Letter to shareholders (unaudited) |

Andrew Owen
President
Wells Fargo Funds
U.S. and international stocks returned 10.12% and 8.18% for the six-month period; within fixed income, the Bloomberg Barclays U.S. Aggregate Bond Index3 returned -2.18%.
Dear Shareholder:
As the new president of Wells Fargo Funds now that Karla Rabusch is retiring from that position after nearly 14 years, I am pleased to offer you this semi-annual report for the Wells Fargo Enterprise Fund for the six-month period that ended March 31, 2017. During this period, global stocks delivered favorable results overall. U.S. and international stocks returned 10.12% and 8.18% for the six-month period, respectively, as measured by the S&P 500 Index1 and the MSCI ACWI ex USA Index (Net)2; within fixed income, the Bloomberg Barclays U.S. Aggregate Bond Index3 returned -2.18%.
During the fourth quarter of 2016, prospects for faster growth and higher interest rates in the U.S. influenced markets.
Early in the fourth quarter of 2016, U.S. stocks tended to trade lower amid concerns such as a likely interest-rate increase and uncertainty over the approaching general election. However, following Donald Trump’s election as president in early November, U.S. stocks began to rally. Investors appeared optimistic that the new administration would usher in a series of progrowth policies, and supportive economic news helped the rally carry through the quarter. The buoyant environment sent interest rates higher as well. At its mid-December meeting, Fed officials raised their short-term target interest rate for the first time in a year by a quarter percentage point to between 0.50% and 0.75%. The fourth quarter also saw the implementation of the U.S. Securities and Exchange Commission’s new rules for money market funds, which included floating net asset values (NAVs) for institutional prime and municipal money market funds as well as liquidity fees and redemption gates. In the year leading up to money market fund reform implementation, nearly $1 trillion in assets moved from these types of money market funds into government money market funds, which continued to transact at a stable $1 NAV. Outside of the U.S., the prospects for faster U.S. growth appeared to trigger some acceleration in Europe. The improvement may be partly attributable to expectations for further strengthening of the U.S. dollar, which in turn could improve demand for European goods in the U.S. due to weakening of the euro relative to the dollar. Meanwhile, rising inflation across the eurozone and Japan caused an upward shift in yield curves in those areas although developed-country bond yields remained significantly lower than U.S. Treasury yields.
Globally, stocks delivered positive results and economies showed some improvement in the first quarter of 2017.
Stocks rallied globally through the first quarter of 2017, supported by signs of improvement in the U.S. and global economies. U.S. economic data released during the quarter reflected a healthy economy. Hiring remained strong, and business and consumer sentiment improved. Meanwhile, inflation inched up during the quarter. Along with the pickup in inflation, investors appeared to shift
| 1 | The S&P 500 Index consists of 500 stocks chosen for market size, liquidity, and industry group representation. It is a market-value-weighted index with each stock’s weight in the index proportionate to its market value. You cannot invest directly in an index. |
| 2 | The Morgan Stanley Capital International (MSCI) All Country World Index (ACWI) ex USA Index (Net) is a free-float-adjusted market-capitalization-weighted index that is designed to measure the equity market performance of developed markets, excluding the United States and Canada. Source: MSCI. MSCI makes no express or implied warranties or representations and shall have no liability whatsoever with respect to any MSCI data contained herein. The MSCI data may not be further redistributed or used as a basis for other indexes or any securities or financial products. This report is not approved, reviewed, or produced by MSCI. You cannot invest directly in an index. |
| 3 | The Bloomberg Barclays U.S. Aggregate Bond Index (formerly known as Barclays U.S. Aggregate Bond Index) is a broad-based benchmark that measures the investment-grade, U.S. dollar–denominated, fixed-rate taxable bond market, including Treasuries, government-related and corporate securities, mortgage-backed securities (agency fixed-rate and hybrid adjustable-rate mortgage pass-throughs), asset-backed securities, and commercial mortgage-backed securities. You cannot invest directly in an index. |
| | | | | | |
| Letter to shareholders (unaudited) | | Wells Fargo Enterprise Fund | | | 3 | |
from a mindset of very gradual interest-rate increases by the Fed to an anticipation of three or four increases in 2017. The first of these occurred in March; Fed officials raised their short-term target rate by a quarter percentage point to between 0.75% and 1.00%. With the Fed’s target-rate increase, short-term bond yields rose during the quarter. Meanwhile, longer-term Treasury yields were little changed, leading to positive performance. Investment-grade and high-yield bonds benefited from strong demand. Municipal bond returns were positive in the quarter, helped by strong demand and constrained new-issue supply. Outside of the U.S., credit spreads narrowed, helping lower-quality credit outperform amid a strong demand for yield. Also, stocks in emerging markets generally outperformed stocks in the U.S. and international developed markets. Thus far in 2017, emerging markets overall have benefited from both global economic growth and recent weakening in the U.S. dollar. European stocks also outperformed the U.S. market, despite investors’ concern over uncertainties such as the potential impact of an upcoming election in France; a contender for president of France, Marine Le Pen, favored exiting the European Union, which could potentially destabilize or topple the organization.
Don’t let short-term uncertainty derail long-term investment goals.
Periods of uncertainty can present challenges, but experience has taught us that maintaining long-term investment goals can be an effective way to plan for the future. To help you create a sound strategy based on your personal goals and risk tolerance, Wells Fargo Funds offers more than 100 mutual funds spanning a wide range of asset classes and investment styles. Although diversification cannot guarantee an investment profit or prevent losses, we believe it can be an effective way to manage investment risk and potentially smooth out overall portfolio performance. We encourage investors to know their investments and to understand that appropriate levels of risk-taking may unlock opportunities.
Thank you for choosing to invest in Wells Fargo Funds. We appreciate your confidence in us and remain committed to helping you meet your financial needs.
Sincerely,

Andrew Owen
President
Wells Fargo Funds
Although diversification cannot guarantee an investment profit or prevent losses, we believe it can be an effective way to manage investment risk and potentially smooth out overall portfolio performance.
For further information about your Fund, contact your investment professional, visit our website at wellsfargofunds.com, or call us directly at 1-800-222-8222. We are available 24 hours a day, 7 days a week.
| | | | |
| 4 | | Wells Fargo Enterprise Fund | | Performance highlights (unaudited) |
Investment objective
The Fund seeks long-term capital appreciation.
Manager
Wells Fargo Funds Management, LLC
Subadviser
Wells Capital Management Incorporated
Portfolio managers
Michael T. Smith, CFA®
Christopher J. Warner, CFA®
Average annual total returns (%) as of March 31, 20171
| | | | | | | | | | | | | | | | | | | | | | | | | | | | | | | | | | |
| | | | | Including sales charge | | | Excluding sales charge | | | Expense ratios2 (%) | |
| | | Inception date | | 1 year | | | 5 year | | | 10 year | | | 1 year | | | 5 year | | | 10 year | | | Gross | | | Net3 | |
| Class A (SENAX) | | 2-24-2000 | | | 13.53 | | | | 8.47 | | | | 6.16 | | | | 20.46 | | | | 9.76 | | | | 6.79 | | | | 1.26 | | | | 1.18 | |
| Class C (WENCX) | | 3-31-2008 | | | 18.54 | | | | 8.94 | | | | 6.00 | | | | 19.54 | | | | 8.94 | | | | 6.00 | | | | 2.01 | | | | 1.93 | |
| Class R6 (WENRX) | | 10-31-2014 | | | – | | | | – | | | | – | | | | 20.93 | | | | 10.15 | | | | 7.23 | | | | 0.83 | | | | 0.80 | |
| Administrator Class (SEPKX) | | 8-30-2002 | | | – | | | | – | | | | – | | | | 20.55 | | | | 9.87 | | | | 6.96 | | | | 1.18 | | | | 1.10 | |
| Institutional Class (WFEIX) | | 6-30-2003 | | | – | | | | – | | | | – | | | | 20.87 | | | | 10.12 | | | | 7.22 | | | | 0.93 | | | | 0.85 | |
| Russell Midcap® Growth Index4 | | – | | | – | | | | – | | | | – | | | | 14.07 | | | | 11.95 | | | | 8.13 | | | | – | | | | – | |
Figures quoted represent past performance, which is no guarantee of future results, and do not reflect taxes that a shareholder may pay on fund distributions or the redemption of fund shares. Investment return and principal value of an investment will fluctuate so that an investor’s shares, when redeemed, may be worth more or less than their original cost. Performance shown without sales charges would be lower if sales charges were reflected. Current performance may be lower or higher than the performance data quoted, which assumes the reinvestment of dividends and capital gains. Current month-end performance is available on the Fund’s website, wellsfargofunds.com.
Index returns do not include transaction costs associated with buying and selling securities, any mutual fund fees or expenses, or any taxes. It is not possible to invest directly in an index.
For Class A shares, the maximum front-end sales charge is 5.75%. For Class C shares, the maximum contingent deferred sales charge is 1.00%. Performance including a contingent deferred sales charge assumes the sales charge for the corresponding time period. Class R6, Administrator Class, and Institutional Class shares are sold without a front-end sales charge or contingent deferred sales charge.
Stock values fluctuate in response to the activities of individual companies and general market and economic conditions. Smaller-company stocks tend to be more volatile and less liquid than those of larger companies. Certain investment strategies tend to increase the total risk of an investment (relative to the broader market). The Fund is exposed to foreign investment risk. Consult the Fund’s prospectus for additional information on these and other risks.
Please see footnotes on page 5.
| | | | | | |
| Performance highlights (unaudited) | | Wells Fargo Enterprise Fund | | | 5 | |
| | | | |
| Ten largest holdings (%) as of March 31, 20175 | |
Waste Connections Incorporated | | | 2.85 | |
O’Reilly Automotive Incorporated | | | 2.31 | |
Electronic Arts Incorporated | | | 2.22 | |
Fidelity National Information Services Incorporated | | | 2.16 | |
Intercontinental Exchange Incorporated | | | 2.11 | |
Intuitive Surgical Incorporated | | | 2.11 | |
Total System Services Incorporated | | | 1.88 | |
Delphi Automotive plc | | | 1.86 | |
Berry Plastics Group Incorporated | | | 1.80 | |
Vail Resorts Incorporated | | | 1.78 | |
|
| Sector distribution as of March 31, 20176 |
|
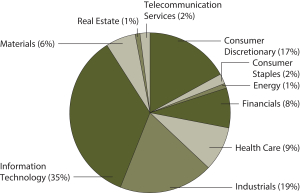 |
| 1 | Effective June 20, 2008, Advisor Class was renamed Class A and modified to assume the features and attributes of Class A. Historical performance shown for Class A shares through June 19, 2008, includes the expenses of the Advisor Class shares. Historical performance shown for Class B shares prior to their inception reflects the performance of Class C shares. Historical performance shown for Class C shares prior to their inception reflects the performance of the former Investor Class shares and has been adjusted to reflect the higher expenses applicable to Class C shares. Historical performance shown for Class R6 shares prior to their inception reflects the performance of the Institutional Class shares, and is not adjusted to reflect the expenses of Class R6. If these expenses had been included, returns for Class R6 shares would be higher. |
| 2 | Reflects the expense ratios as stated in the most recent prospectuses. The expense ratios shown are subject to change and may differ from the annualized expense ratios shown in the financial highlights of this report. |
| 3 | The manager has contractually committed through January 31, 2018, to waive fees and/or reimburse expenses to the extent necessary to cap the Fund’s Total Annual Fund Operating Expenses After Fee Waivers at the amounts shown. After this time, the cap may be increased or the commitment to maintain the cap may be terminated only with the approval of the Board of Trustees. Brokerage commissions, stamp duty fees, interest, taxes, acquired fund fees and expenses, and extraordinary expenses are excluded from the expense cap. Without this cap, the Fund’s returns would have been lower. The expense ratio paid by an investor is the net expense ratio or the Fund’s Total Annual Fund Operating Expenses After Fee Waivers, as stated in the prospectuses. |
| 4 | The Russell Midcap® Growth Index measures the performance of those Russell Midcap companies with higher price-to-book ratios and higher forecasted growth values. The stocks are also members of the Russell 1000® Growth index. You cannot invest directly in an index. |
| 5 | The ten largest holdings, excluding cash and cash equivalents, are calculated based on the value of the investments divided by total net assets of the Fund. Holdings are subject to change and may have changed since the date specified. |
| 6 | Amounts are calculated based on the total long-term investments of the Fund. These amounts are subject to change and may have changed since the date specified. |
| | | | |
| 6 | | Wells Fargo Enterprise Fund | | Fund expenses (unaudited) |
As a shareholder of the Fund, you incur two types of costs: (1) transaction costs, including sales charges (loads) on purchase payments and contingent deferred sales charges (if any) on redemptions and (2) ongoing costs, including management fees, distribution (12b-1) and/or shareholder servicing fees, and other Fund expenses. This example is intended to help you understand your ongoing costs (in dollars) of investing in the Fund and to compare these costs with the ongoing costs of investing in other mutual funds.
The example is based on an investment of $1,000 invested at the beginning of the six-month period and held for the entire period from October 1, 2016 to March 31, 2017.
Actual expenses
The “Actual” line of the table below provides information about actual account values and actual expenses. You may use the information in this line, together with the amount you invested, to estimate the expenses that you paid over the period. Simply divide your account value by $1,000 (for example, an $8,600 account value divided by $1,000 = 8.6), then multiply the result by the number in the “Actual” line under the heading entitled “Expenses paid during period” for your applicable class of shares to estimate the expenses you paid on your account during this period.
Hypothetical example for comparison purposes
The “Hypothetical” line of the table below provides information about hypothetical account values and hypothetical expenses based on the Fund’s actual expense ratio and an assumed rate of return of 5% per year before expenses, which is not the Fund’s actual return. The hypothetical account values and expenses may not be used to estimate the actual ending account balance or expenses you paid for the period. You may use this information to compare the ongoing costs of investing in the Fund and other funds. To do so, compare this 5% hypothetical example with the 5% hypothetical examples that appear in the shareholder reports of the other funds.
Please note that the expenses shown in the table are meant to highlight your ongoing costs only and do not reflect any transactional costs, such as sales charges (loads) and contingent deferred sales charges. Therefore, the “Hypothetical” line of the table is useful in comparing ongoing costs only and will not help you determine the relative total costs of owning different funds. In addition, if these transactional costs were included, your costs would have been higher.
| | | | | | | | | | | | | | | | |
| | | Beginning
account value
10-1-2016 | | | Ending
account value
3-31-2017 | | | Expenses
paid during
the period¹ | | | Annualized net
expense ratio | |
Class A | | | | | | | | | | | | | | | | |
Actual | | $ | 1,000.00 | | | $ | 1,094.95 | | | $ | 6.16 | | | | 1.18 | % |
Hypothetical (5% return before expenses) | | $ | 1,000.00 | | | $ | 1,019.05 | | | $ | 5.94 | | | | 1.18 | % |
Class C | | | | | | | | | | | | | | | | |
Actual | | $ | 1,000.00 | | | $ | 1,090.99 | | | $ | 10.06 | | | | 1.93 | % |
Hypothetical (5% return before expenses) | | $ | 1,000.00 | | | $ | 1,015.31 | | | $ | 9.70 | | | | 1.93 | % |
Class R6 | | | | | | | | | | | | | | | | |
Actual | | $ | 1,000.00 | | | $ | 1,097.08 | | | $ | 4.18 | | | | 0.80 | % |
Hypothetical (5% return before expenses) | | $ | 1,000.00 | | | $ | 1,020.94 | | | $ | 4.03 | | | | 0.80 | % |
Administrator Class | | | | | | | | | | | | | | | | |
Actual | | $ | 1,000.00 | | | $ | 1,095.47 | | | $ | 5.75 | | | | 1.10 | % |
Hypothetical (5% return before expenses) | | $ | 1,000.00 | | | $ | 1,019.45 | | | $ | 5.54 | | | | 1.10 | % |
Institutional Class | | | | | | | | | | | | | | | | |
Actual | | $ | 1,000.00 | | | $ | 1,096.98 | | | $ | 4.44 | | | | 0.85 | % |
Hypothetical (5% return before expenses) | | $ | 1,000.00 | | | $ | 1,020.69 | | | $ | 4.28 | | | | 0.85 | % |
| 1 | Expenses paid is equal to the annualized net expense ratio of each class multiplied by the average account value over the period, multiplied by the number of days in the most recent fiscal half-year divided by the number of days in the fiscal year (to reflect the one-half-year period). |
| | | | | | |
| Portfolio of investments—March 31, 2017 (unaudited) | | Wells Fargo Enterprise Fund | | | 7 | |
| | | | | | | | | | | | | | | | |
| Security name | | | | | | | | Shares | | | Value | |
| | | | |
Common Stocks: 99.08% | | | | | | | | | | | | | | | | |
| | | | |
Consumer Discretionary: 16.62% | | | | | | | | | | | | | | | | |
| | | | |
| Auto Components: 1.86% | | | | | | | | | | | | | | | | |
Delphi Automotive plc | | | | | | | | | | | 151,085 | | | $ | 12,160,832 | |
| | | | | | | | | | | | | | | | |
| | | | |
| Distributors: 1.19% | | | | | | | | | | | | | | | | |
Pool Corporation | | | | | | | | | | | 65,500 | | | | 7,816,115 | |
| | | | | | | | | | | | | | | | |
| | | | |
| Diversified Consumer Services: 1.31% | | | | | | | | | | | | | | | | |
Bright Horizons Family Solutions Incorporated † | | | | | | | | | | | 117,900 | | | | 8,546,571 | |
| | | | | | | | | | | | | | | | |
| | | | |
| Hotels, Restaurants & Leisure: 4.73% | | | | | | | | | | | | | | | | |
Royal Caribbean Cruises Limited | | | | | | | | | | | 90,900 | | | | 8,918,199 | |
Six Flags Entertainment Corporation | | | | | | | | | | | 174,100 | | | | 10,357,209 | |
Vail Resorts Incorporated | | | | | | | | | | | 60,517 | | | | 11,613,212 | |
| |
| | | | 30,888,620 | |
| | | | | | | | | | | | | | | | |
| | | | |
| Internet & Direct Marketing Retail: 0.50% | | | | | | | | | | | | | | | | |
Ctrip.com International Limited ADR † | | | | | | | | | | | 66,100 | | | | 3,248,815 | |
| | | | | | | | | | | | | | | | |
| | | | |
| Media: 3.12% | | | | | | | | | | | | | | | | |
Cinemark Holdings Incorporated | | | | | | | | | | | 240,825 | | | | 10,678,181 | |
Liberty Broadband Corporation Class C † | | | | | | | | | | | 112,100 | | | | 9,685,440 | |
| |
| | | | 20,363,621 | |
| | | | | | | | | | | | | | | | |
| | | | |
| Specialty Retail: 3.91% | | | | | | | | | | | | | | | | |
Burlington Stores Incorporated † | | | | | | | | | | | 107,300 | | | | 10,439,217 | |
O’Reilly Automotive Incorporated † | | | | | | | | | | | 56,000 | | | | 15,111,040 | |
| |
| | | | 25,550,257 | |
| | | | | | | | | | | | | | | | |
| | | | |
Consumer Staples: 2.33% | | | | | | | | | | | | | | | | |
| | | | |
| Beverages: 2.33% | | | | | | | | | | | | | | | | |
Constellation Brands Incorporated Class A | | | | | | | | | | | 55,000 | | | | 8,913,850 | |
Monster Beverage Corporation † | | | | | | | | | | | 136,200 | | | | 6,288,354 | |
| |
| | | | 15,202,204 | |
| | | | | | | | | | | | | | | | |
| | | | |
Energy: 0.73% | | | | | | | | | | | | | | | | |
| | | | |
| Oil, Gas & Consumable Fuels: 0.73% | | | | | | | | | | | | | | | | |
Diamondback Energy Incorporated † | | | | | | | | | | | 45,900 | | | | 4,760,519 | |
| | | | | | | | | | | | | | | | |
| | | | |
Financials: 7.67% | | | | | | | | | | | | | | | | |
| | | | |
| Capital Markets: 6.25% | | | | | | | | | | | | | | | | |
Intercontinental Exchange Incorporated | | | | | | | | | | | 230,725 | | | | 13,813,506 | |
Raymond James Financial Incorporated | | | | | | | | | | | 108,600 | | | | 8,281,836 | |
S&P Global Incorporated | | | | | | | | | | | 67,641 | | | | 8,843,384 | |
SEI Investments Company | | | | | | | | | | | 196,000 | | | | 9,886,240 | |
| |
| | | | 40,824,966 | |
| | | | | | | | | | | | | | | | |
The accompanying notes are an integral part of these financial statements.
| | | | |
| 8 | | Wells Fargo Enterprise Fund | | Portfolio of investments—March 31, 2017 (unaudited) |
| | | | | | | | | | | | | | | | |
| Security name | | | | | | | | Shares | | | Value | |
| | | | |
| Consumer Finance: 1.42% | | | | | | | | | | | | | | | | |
SLM Corporation † | | | | | | | | | | | 771,000 | | | $ | 9,329,100 | |
| | | | | | | | | | | | | | | | |
| | | | |
Health Care: 9.20% | | | | | | | | | | | | | | | | |
| | | | |
| Biotechnology: 2.97% | | | | | | | | | | | | | | | | |
BioMarin Pharmaceutical Incorporated † | | | | | | | | | | | 70,193 | | | | 6,161,542 | |
Bioverativ Incorporated † | | | | | | | | | | | 126,000 | | | | 6,861,960 | |
Incyte Corporation † | | | | | | | | | | | 37,300 | | | | 4,985,891 | |
Seattle Genetics Incorporated † | | | | | | | | | | | 21,800 | | | | 1,370,348 | |
| |
| | | | 19,379,741 | |
| | | | | | | | | | | | | | | | |
| | | | |
| Health Care Equipment & Supplies: 5.61% | | | | | | | | | | | | | | | | |
Boston Scientific Corporation † | | | | | | | | | | | 383,500 | | | | 9,537,645 | |
DexCom Incorporated † | | | | | | | | | | | 82,800 | | | | 7,015,644 | |
Integra LifeSciences Holdings Corporation † | | | | | | | | | | | 150,200 | | | | 6,327,926 | |
Intuitive Surgical Incorporated † | | | | | | | | | | | 18,000 | | | | 13,796,460 | |
| |
| | | | 36,677,675 | |
| | | | | | | | | | | | | | | | |
| | | | |
| Pharmaceuticals: 0.62% | | | | | | | | | | | | | | | | |
Perrigo Company plc « | | | | | | | | | | | 61,300 | | | | 4,069,707 | |
| | | | | | | | | | | | | | | | |
| | | | |
Industrials: 19.06% | | | | | | | | | | | | | | | | |
| | | | |
| Airlines: 1.63% | | | | | | | | | | | | | | | | |
Spirit Airlines Incorporated † | | | | | | | | | | | 200,500 | | | | 10,640,535 | |
| | | | | | | | | | | | | | | | |
| | | | |
| Building Products: 5.04% | | | | | | | | | | | | | | | | |
Allegion plc | | | | | | | | | | | 152,700 | | | | 11,559,390 | |
Johnson Controls International plc | | | | | | | | | | | 259,541 | | | | 10,931,867 | |
Masonite International Corporation † | | | | | | | | | | | 131,803 | | | | 10,445,388 | |
| |
| | | | 32,936,645 | |
| | | | | | | | | | | | | | | | |
| | | | |
| Commercial Services & Supplies: 2.85% | | | | | | | | | | | | | | | | |
Waste Connections Incorporated | | | | | | | | | | | 211,093 | | | | 18,622,624 | |
| | | | | | | | | | | | | | | | |
| | | | |
| Electrical Equipment: 2.25% | | | | | | | | | | | | | | | | |
Acuity Brands Incorporated | | | | | | | | | | | 37,834 | | | | 7,718,136 | |
Rockwell Automation Incorporated | | | | | | | | | | | 44,900 | | | | 6,991,379 | |
| |
| | | | 14,709,515 | |
| | | | | | | | | | | | | | | | |
| | | | |
| Industrial Conglomerates: 0.96% | | | | | | | | | | | | | | | | |
Carlisle Companies Incorporated | | | | | | | | | | | 59,233 | | | | 6,302,984 | |
| | | | | | | | | | | | | | | | |
| | | | |
| Machinery: 1.50% | | | | | | | | | | | | | | | | |
John Bean Technologies Corporation | | | | | | | | | | | 111,459 | | | | 9,802,819 | |
| | | | | | | | | | | | | | | | |
| | | | |
| Professional Services: 1.74% | | | | | | | | | | | | | | | | |
TransUnion † | | | | | | | | | | | 296,177 | | | | 11,358,388 | |
| | | | | | | | | | | | | | | | |
The accompanying notes are an integral part of these financial statements.
| | | | | | |
| Portfolio of investments—March 31, 2017 (unaudited) | | Wells Fargo Enterprise Fund | | | 9 | |
| | | | | | | | | | | | | | | | |
| Security name | | | | | | | | Shares | | | Value | |
| | | | |
| Trading Companies & Distributors: 3.09% | | | | | | | | | | | | | | | | |
HD Supply Holdings Incorporated † | | | | | | | | | | | 249,400 | | | $ | 10,256,575 | |
Univar Incorporated † | | | | | | | | | | | 323,300 | | | | 9,912,378 | |
| |
| | | | 20,168,953 | |
| | | | | | | | | | | | | | | | |
| | | | |
Information Technology: 34.98% | | | | | | | | | | | | | | | | |
| | | | |
| Communications Equipment: 2.35% | | | | | | | | | | | | | | | | |
Finisar Corporation † | | | | | | | | | | | 257,300 | | | | 7,034,582 | |
Harris Corporation | | | | | | | | | | | 74,700 | | | | 8,311,869 | |
| |
| | | | 15,346,451 | |
| | | | | | | | | | | | | | | | |
| | | | |
| Electronic Equipment, Instruments & Components: 2.46% | | | | | | | | | | | | | | | | |
FLIR Systems Incorporated | | | | | | | | | | | 209,700 | | | | 7,607,916 | |
Universal Display Corporation « | | | | | | | | | | | 98,400 | | | | 8,472,240 | |
| |
| | | | 16,080,156 | |
| | | | | | | | | | | | | | | | |
| | | | |
| Internet Software & Services: 3.16% | | | | | | | | | | | | | | | | |
CoStar Group Incorporated † | | | | | | | | | | | 47,643 | | | | 9,872,582 | |
MercadoLibre Incorporated | | | | | | | | | | | 51,200 | | | | 10,827,264 | |
| |
| | | | 20,699,846 | |
| | | | | | | | | | | | | | | | |
| | | | |
| IT Services: 10.54% | | | | | | | | | | | | | | | | |
Acxiom Corporation † | | | | | | | | | | | 318,700 | | | | 9,073,389 | |
EPAM Systems Incorporated † | | | | | | | | | | | 123,119 | | | | 9,297,947 | |
Euronet Worldwide Incorporated † | | | | | | | | | | | 115,600 | | | | 9,886,112 | |
Fidelity National Information Services Incorporated | | | | | | | | | | | 177,200 | | | | 14,108,664 | |
Square Incorporated Class A † | | | | | | | | | | | 206,200 | | | | 3,563,136 | |
Total System Services Incorporated | | | | | | | | | | | 229,900 | | | | 12,290,454 | |
WEX Incorporated † | | | | | | | | | | | 102,800 | | | | 10,639,800 | |
| |
| | | | 68,859,502 | |
| | | | | | | | | | | | | | | | |
| | | | |
| Semiconductors & Semiconductor Equipment: 4.65% | | | | | | | | | | | | | | | | |
Broadcom Limited | | | | | | | | | | | 27,400 | | | | 5,999,504 | |
Micron Technology Incorporated † | | | | | | | | | | | 254,600 | | | | 7,357,940 | |
NVIDIA Corporation | | | | | | | | | | | 61,100 | | | | 6,655,623 | |
NXP Semiconductors NV † | | | | | | | | | | | 48,400 | | | | 5,009,400 | |
Teradyne Incorporated | | | | | | | | | | | 172,100 | | | | 5,352,310 | |
| |
| | | | 30,374,777 | |
| | | | | | | | | | | | | | | | |
| | | | |
| Software: 10.58% | | | | | | | | | | | | | | | | |
Activision Blizzard Incorporated | | | | | | | | | | | 192,000 | | | | 9,573,120 | |
Electronic Arts Incorporated † | | | | | | | | | | | 162,200 | | | | 14,520,144 | |
Guidewire Software Incorporated † | | | | | | | | | | | 163,900 | | | | 9,232,487 | |
Nintendo Company Limited | | | | | | | | | | | 265,500 | | | | 7,694,509 | |
PTC Incorporated † | | | | | | | | | | | 130,400 | | | | 6,852,520 | |
ServiceNow Incorporated † | | | | | | | | | | | 115,850 | | | | 10,133,400 | |
Ultimate Software Group Incorporated † | | | | | | | | | | | 57,000 | | | | 11,126,970 | |
| |
| | | | 69,133,150 | |
| | | | | | | | | | | | | | | | |
| | | | |
| Technology Hardware, Storage & Peripherals: 1.24% | | | | | | | | | | | | | | | | |
NCR Corporation † | | | | | | | | | | | 177,200 | | | | 8,094,496 | |
| | | | | | | | | | | | | | | | |
The accompanying notes are an integral part of these financial statements.
| | | | |
| 10 | | Wells Fargo Enterprise Fund | | Portfolio of investments—March 31, 2017 (unaudited) |
| | | | | | | | | | | | | | | | |
| Security name | | | | | | | | Shares | | | Value | |
| | | | |
Materials: 5.66% | | | | | | | | | | | | | | | | |
| | | | |
| Chemicals: 2.13% | | | | | | | | | | | | | | | | |
Albemarle Corporation | | | | | | | | | | | 50,300 | | | $ | 5,313,692 | |
The Sherwin-Williams Company | | | | | | | | | | | 27,800 | | | | 8,623,282 | |
| |
| | | | 13,936,974 | |
| | | | | | | | | | | | | | | | |
| | | | |
| Construction Materials: 1.73% | | | | | | | | | | | | | | | | |
Vulcan Materials Company | | | | | | | | | | | 93,600 | | | | 11,276,928 | |
| | | | | | | | | | | | | | | | |
| | | | |
| Containers & Packaging: 1.80% | | | | | | | | | | | | | | | | |
Berry Plastics Group Incorporated † | | | | | | | | | | | 241,900 | | | | 11,749,083 | |
| | | | | | | | | | | | | | | | |
| | | | |
Real Estate: 1.34% | | | | | | | | | | | | | | | | |
| | | | |
| Equity REITs: 1.34% | | | | | | | | | | | | | | | | |
SBA Communications Corporation † | | | | 73,000 | | | | 8,787,010 | |
| | | | | | | | | | | | | | | | |
| | | | |
Telecommunication Services: 1.49% | | | | | | | | | | | | | | | | |
| | | | |
| Diversified Telecommunication Services: 1.49% | | | | | | | | | | | | | | | | |
Zayo Group Holdings Incorporated † | | | | 295,699 | | | | 9,728,495 | |
| | | | | | | | | | | | | | | | |
| |
Total Common Stocks (Cost $521,670,885) | | | | 647,428,074 | |
| | | | | | | | | | | | | | | | |
| | | | |
| | | Yield | | | | | | | | | | |
| Short-Term Investments: 1.50% | | | | | | | | | | | | | | | | |
| | | | |
| Investment Companies: 1.50% | | | | | | | | | | | | | | | | |
Securities Lending Cash Investment LLC (l)(r)(u) | | | 0.98 | % | | | | | | | 4,004,650 | | | | 4,005,050 | |
Wells Fargo Government Money Market Fund Select Class (l)(u) | | | 0.63 | | | | | | | | 5,809,204 | | | | 5,809,204 | |
| |
Total Short-Term Investments (Cost $9,814,254) | | | | 9,814,254 | |
| | | | | | | | | | | | | | | | |
| | | | | | | | |
| Total investments in securities (Cost $531,485,139) * | | | 100.58 | % | | | 657,242,328 | |
Other assets and liabilities, net | | | (0.58 | ) | | | (3,810,096 | ) |
| | | | | | | | |
| Total net assets | | | 100.00 | % | | $ | 653,432,232 | |
| | | | | | | | |
| † | Non-income-earning security |
| « | All or a portion of this security is on loan. |
| (l) | The issuer of the security is an affiliated person of the Fund as defined in the Investment Company Act of 1940. |
| (r) | The investment is a non-registered investment vehicle purchased with cash collateral received from securities on loan. |
| (u) | The rate represents the 7-day annualized yield at period end. |
| * | Cost for federal income tax purposes is $531,429,420 and unrealized gains (losses) consists of: |
| | | | |
Gross unrealized gains | | $ | 129,459,826 | |
Gross unrealized losses | | | (3,646,918 | ) |
| | | | |
Net unrealized gains | | $ | 125,812,908 | |
The accompanying notes are an integral part of these financial statements.
| | | | | | |
| Statement of assets and liabilities—March 31, 2017 (unaudited) | | Wells Fargo Enterprise Fund | | | 11 | |
| | | | |
| |
Assets | | | | |
Investments | | | | |
In unaffiliated securities, at value (including $3,917,298 of securities loaned), at value (cost $521,670,885) | | $ | 647,428,074 | |
In affiliated securities, at value (cost $9,814,254) | | | 9,814,254 | |
| | | | |
Total investments, at value (cost $531,485,139) | | | 657,242,328 | |
Cash | | | 39,189 | |
Receivable for investments sold | | | 1,114,021 | |
Receivable for Fund shares sold | | | 103,614 | |
Receivable for dividends | | | 325,590 | |
Receivable for securities lending income | | | 3,339 | |
Prepaid expenses and other assets | | | 92,566 | |
| | | | |
Total assets | | | 658,920,647 | |
| | | | |
| |
Liabilities | | | | |
Payable for investments purchased | | | 350,601 | |
Payable for Fund shares redeemed | | | 376,283 | |
Payable upon receipt of securities loaned | | | 4,005,023 | |
Management fee payable | | | 395,369 | |
Distribution fees payable | | | 5,976 | |
Administration fees payable | | | 114,494 | |
Accrued expenses and other liabilities | | | 240,669 | |
| | | | |
Total liabilities | | | 5,488,415 | |
| | | | |
Total net assets | | $ | 653,432,232 | |
| | | | |
| |
NET ASSETS CONSIST OF | | | | |
Paid-in capital | | $ | 513,382,633 | |
Accumulated net investment loss | | | (3,481,610 | ) |
Accumulated net realized gains on investments | | | 17,774,020 | |
Net unrealized gains on investments | | | 125,757,189 | |
| | | | |
Total net assets | | $ | 653,432,232 | |
| | | | |
| |
COMPUTATION OF NET ASSET VALUE AND OFFERING PRICE PER SHARE | | | | |
Net assets – Class A | | $ | 554,120,943 | |
Shares outstanding – Class A1 | | | 12,604,429 | |
Net asset value per share – Class A | | | $43.96 | |
Maximum offering price per share – Class A2 | | | $46.64 | |
Net assets – Class C | | $ | 8,854,708 | |
Shares outstanding – Class C1 | | | 222,802 | |
Net asset value per share – Class C | | | $39.74 | |
Net assets – Class R6 | | $ | 32,376,926 | |
Shares outstanding – Class R61 | | | 677,182 | |
Net asset value per share – Class R6 | | | $47.81 | |
Net assets – Administrator Class | | $ | 5,280,751 | |
Shares outstanding – Administrator Class1 | | | 114,712 | |
Net asset value per share – Administrator Class | | | $46.03 | |
Net assets – Institutional Class | | $ | 52,798,904 | |
Shares outstanding – Institutional Class1 | | | 1,105,948 | |
Net asset value per share – Institutional Class | | | $47.74 | |
| 1 | The Fund has an unlimited number of authorized shares. |
| 2 | Maximum offering price is computed as 100/94.25 of net asset value. On investments of $50,000 or more, the offering price is reduced. |
The accompanying notes are an integral part of these financial statements.
| | | | |
| 12 | | Wells Fargo Enterprise Fund | | Statement of operations—six months ended March 31, 2017 (unaudited) |
| | | | |
| | | | |
| |
Investment income | | | | |
Dividends (net of foreign withholding taxes of $11,114) | | $ | 2,320,583 | |
Income from affiliated securities | | | 13,570 | |
Securities lending income, net | | | 8,961 | |
| | | | |
Total investment income | | | 2,343,114 | |
| | | | |
| |
Expenses | | | | |
Management fee | | | 2,360,725 | |
Administration fees | | | | |
Class A | | | 561,560 | |
Class B | | | 104 | 1 |
Class C | | | 9,322 | |
Class R6 | | | 4,576 | |
Administrator Class | | | 3,132 | |
Institutional Class | | | 35,699 | |
Shareholder servicing fees | | | | |
Class A | | | 668,524 | |
Class B | | | 123 | 1 |
Class C | | | 11,098 | |
Administrator Class | | | 6,023 | |
Distribution fees | | | | |
Class B | | | 370 | 1 |
Class C | | | 33,294 | |
Custody and accounting fees | | | 30,938 | |
Professional fees | | | 21,077 | |
Registration fees | | | 53,492 | |
Shareholder report expenses | | | 48,101 | |
Trustees’ fees and expenses | | | 7,495 | |
Other fees and expenses | | | 9,763 | |
| | | | |
Total expenses | | | 3,865,416 | |
Less: Fee waivers and/or expense reimbursements | | | (241,420 | ) |
| | | | |
Net expenses | | | 3,623,996 | |
| | | | |
Net investment loss | | | (1,280,882 | ) |
| | | | |
| |
REALIZED AND UNREALIZED GAINS (LOSSES) ON INVESTMENTS | | | | |
| |
Net realized gains on: | | | | |
Unaffiliated securities | | | 28,362,092 | |
Affiliated securities | | | 27 | |
| | | | |
Net realized gains on investments | | | 28,362,119 | |
Net change in unrealized gains (losses) on investments | | | 30,903,498 | |
| | | | |
Net realized and unrealized gains (losses) on investments | | | 59,265,617 | |
| | | | |
Net increase in net assets resulting from operations | | $ | 57,984,735 | |
| | | | |
| 1 | For the period from October 1, 2016 to December 5, 2016. Effective at the close of business on December 5, 2016, Class B shares were converted to Class A shares and are no longer offered by the Fund. |
The accompanying notes are an integral part of these financial statements.
| | | | | | |
| Statement of changes in net assets | | Wells Fargo Enterprise Fund | | | 13 | |
| | | | | | | | | | | | | | | | |
| | | Six months ended March 31, 2017 (unaudited) | | | Year ended September 30, 2016 | |
| | | |
Operations | | | | | | | | | | | | |
Net investment loss | | | | | | $ | (1,280,882 | ) | | | | | | $ | (3,186,682 | ) |
Net realized gains on investments | | | | | | | 28,362,119 | | | | | | | | 17,584,427 | |
Net change in unrealized gains (losses) on investments | | | | | | | 30,903,498 | | | | | | | | 38,732,302 | |
| | | | |
Net increase in net assets resulting from operations | | | | | | | 57,984,735 | | | | | | | | 53,130,047 | |
| | | | |
| | | |
Distributions to shareholders from | | | | | | | | | | | | |
Net realized gains | | | | | | | | | | | | | | | | |
Class A | | | | | | | (23,114,697 | ) | | | | | | | (43,636,386 | ) |
Class B | | | | | | | 0 | 1 | | | | | | | (61,455 | ) |
Class C | | | | | | | (425,970 | ) | | | | | | | (809,467 | ) |
Class R6 | | | | | | | (1,209,334 | ) | | | | | | | (148,611 | ) |
Administrator Class | | | | | | | (197,246 | ) | | | | | | | (262,668 | ) |
Institutional Class | | | | | | | (2,319,994 | ) | | | | | | | (5,679,281 | ) |
| | | | |
Total distributions to shareholders | | | | | | | (27,267,241 | ) | | | | | | | (50,597,868 | ) |
| | | | |
| | | | |
Capital share transactions | | | Shares | | | | | | | | Shares | | | | | |
Proceeds from shares sold | | | | | | | | | | | | | | | | |
Class A | | | 114,966 | | | | 4,803,472 | | | | 4,522,822 | | | | 197,186,460 | |
Class B | | | 0 | 1 | | | 0 | 1 | | | 1 | | | | 16 | |
Class C | | | 8,371 | | | | 317,602 | | | | 23,985 | | | | 869,811 | |
Class R6 | | | 27,261 | | | | 1,234,486 | | | | 691,533 | | | | 29,003,966 | |
Administrator Class | | | 14,376 | | | | 635,752 | | | | 47,307 | | | | 1,846,716 | |
Institutional Class | | | 122,496 | | | | 5,602,277 | | | | 292,382 | | | | 12,703,511 | |
Investor Class | | | N/A | | | | N/A | | | | 4,864 | 2 | | | 207,062 | 2 |
| | | | |
| | | | | | | 12,593,589 | | | | | | | | 241,817,542 | |
| | | | |
Reinvestment of distributions | | | | | | | | | | | | | | | | |
Class A | | | 533,814 | | | | 21,805,828 | | | | 1,043,906 | | | | 41,244,748 | |
Class B | | | 0 | 1 | | | 0 | 1 | | | 1,651 | | | | 59,782 | |
Class C | | | 10,964 | | | | 405,900 | | | | 21,345 | | | | 773,309 | |
Class R6 | | | 27,249 | | | | 1,209,334 | | | | 3,488 | | | | 148,611 | |
Administrator Class | | | 4,559 | | | | 195,026 | | | | 6,238 | | | | 257,327 | |
Institutional Class | | | 51,089 | | | | 2,264,283 | | | | 120,020 | | | | 5,110,433 | |
| | | | |
| | | | | | | 25,880,371 | | | | | | | | 47,594,210 | |
| | | | |
Payment for shares redeemed | | | | | | | | | | | | | | | | |
Class A | | | (969,556 | ) | | | (40,474,387 | ) | | | (1,489,094 | ) | | | (59,409,799 | ) |
Class B | | | (9,343 | )1 | | | (353,582 | )1 | | | (15,187 | ) | | | (564,158 | ) |
Class C | | | (36,708 | ) | | | (1,404,599 | ) | | | (47,670 | ) | | | (1,691,275 | ) |
Class R6 | | | (35,516 | ) | | | (1,622,642 | ) | | | (37,369 | ) | | | (1,612,164 | ) |
Administrator Class | | | (11,329 | ) | | | (493,700 | ) | | | (27,720 | ) | | | (1,163,795 | ) |
Institutional Class | | | (426,145 | ) | | | (19,142,172 | ) | | | (998,881 | ) | | | (43,244,941 | ) |
Investor Class | | | N/A | | | | N/A | | | | (4,428,901 | )2 | | | (190,508,618 | )2 |
| | | | |
| | | | | | | (63,491,082 | ) | | | | | | | (298,194,750 | ) |
| | | | |
Net decrease in net assets resulting from capital share transactions | | | | | | | (25,017,122 | ) | | | | | | | (8,782,998 | ) |
| | | | |
Total increase (decrease) in net assets | | | | | | | 5,700,372 | | | | | | | | (6,250,819 | ) |
| | | | |
| | |
Net assets | | | | | | | | |
Beginning of period | | | | | | | 647,731,860 | | | | | | | | 653,982,679 | |
| | | | |
End of period | | | | | | $ | 653,432,232 | | | | | | | $ | 647,731,860 | |
| | | | |
Accumulated net investment loss | | | | | | $ | (3,481,610 | ) | | | | | | $ | (2,200,728 | ) |
| | | | |
| 1 | For the period from October 1, 2016 to December 5, 2016. Effective at the close of business on December 5, 2016, Class B shares were converted to Class A shares and are no longer offered by the Fund. |
| 2 | For the period from October 1, 2015 to October 23, 2015. Effective at the close of business on October 23, 2015, Investor Class shares were converted to Class A shares and are no longer offered by the Fund. |
The accompanying notes are an integral part of these financial statements.
| | | | |
| 14 | | Wells Fargo Enterprise Fund | | Financial highlights |
(For a share outstanding throughout each period)
| | | | | | | | | | | | | | | | | | | | | | | | |
| | | Six months ended
March 31, 2017 (unaudited) | | | Year ended September 30 | |
| CLASS A | | | 2016 | | | 2015 | | | 2014 | | | 2013 | | | 2012 | |
Net asset value, beginning of period | | | $41.94 | | | | $41.90 | | | | $47.93 | | | | $49.54 | | | | $37.67 | | | | $29.10 | |
Net investment income (loss) | | | (0.09 | ) | | | (0.21 | )1 | | | (0.29 | ) | | | (0.43 | )1 | | | 0.01 | 1 | | | (0.18 | ) |
Net realized and unrealized gains (losses) on investments | | | 3.94 | | | | 3.61 | | | | 0.18 | | | | 3.00 | | | | 11.86 | | | | 8.75 | |
| | | | | | | | | | | | | | | | | | | | | | | | |
Total from investment operations | | | 3.85 | | | | 3.40 | | | | (0.11 | ) | | | 2.57 | | | | 11.87 | | | | 8.57 | |
Distributions to shareholders from | | | | | | | | | | | | | | | | | | | | | | | | |
Net realized gains | | | (1.83 | ) | | | (3.36 | ) | | | (5.92 | ) | | | (4.18 | ) | | | 0.00 | | | | 0.00 | |
Net asset value, end of period | | | $43.96 | | | | $41.94 | | | | $41.90 | | | | $47.93 | | | | $49.54 | | | | $37.67 | |
Total return2 | | | 9.50 | % | | | 8.63 | % | | | (0.67 | )% | | | 5.27 | % | | | 31.55 | % | | | 29.46 | % |
Ratios to average net assets (annualized) | | | | | | | | | | | | | | | | | | | | | | | | |
Gross expenses | | | 1.26 | % | | | 1.26 | % | | | 1.29 | % | | | 1.29 | % | | | 1.30 | % | | | 1.29 | % |
Net expenses | | | 1.18 | % | | | 1.18 | % | | | 1.18 | % | | | 1.18 | % | | | 1.18 | % | | | 1.18 | % |
Net investment income (loss) | | | (0.44 | )% | | | (0.52 | )% | | | (0.60 | )% | | | (0.87 | )% | | | 0.01 | % | | | (0.49 | )% |
Supplemental data | | | | | | | | | | | | | | | | | | | | | | | | |
Portfolio turnover rate | | | 48 | % | | | 99 | % | | | 101 | % | | | 98 | % | | | 91 | % | | | 102 | % |
Net assets, end of period (000s omitted) | | | $554,121 | | | | $542,077 | | | | $370,743 | | | | $417,971 | | | | $427,860 | | | | $359,068 | |
| 1 | Calculated based upon average shares outstanding |
| 2 | Total return calculations do not include any sales charges. Returns for periods of less than one year are not annualized. |
The accompanying notes are an integral part of these financial statements.
| | | | | | |
| Financial highlights | | Wells Fargo Enterprise Fund | | | 15 | |
(For a share outstanding throughout each period)
| | | | | | | | | | | | | | | | | | | | | | | | |
| | | Six months ended
March 31, 2017 (unaudited) | | | Year ended September 30 | |
| CLASS C | | | 2016 | | | 2015 | | | 2014 | | | 2013 | | | 2012 | |
Net asset value, beginning of period | | | $38.23 | | | | $38.75 | | | | $45.07 | | | | $47.14 | | | | $36.11 | | | | $28.10 | |
Net investment loss | | | (0.23 | )1 | | | (0.47 | )1 | | | (0.59 | )1 | | | (0.75 | )1 | | | (0.29 | )1 | | | (0.42 | )1 |
Net realized and unrealized gains (losses) on investments | | | 3.57 | | | | 3.31 | | | | 0.19 | | | | 2.86 | | | | 11.32 | | | | 8.43 | |
| | | | | | | | | | | | | | | | | | | | | | | | |
Total from investment operations | | | 3.34 | | | | 2.84 | | | | (0.40 | ) | | | 2.11 | | | | 11.03 | | | | 8.01 | |
Distributions to shareholders from | | | | | | | | | | | | | | | | | | | | | | | | |
Net realized gains | | | (1.83 | ) | | | (3.36 | ) | | | (5.92 | ) | | | (4.18 | ) | | | 0.00 | | | | 0.00 | |
Net asset value, end of period | | | $39.74 | | | | $38.23 | | | | $38.75 | | | | $45.07 | | | | $47.14 | | | | $36.11 | |
Total return2 | | | 9.10 | % | | | 7.80 | % | | | (1.41 | )% | | | 4.49 | % | | | 30.55 | % | | | 28.51 | % |
Ratios to average net assets (annualized) | | | | | | | | | | | | | | | | | | | | | | | | |
Gross expenses | | | 2.01 | % | | | 2.01 | % | | | 2.04 | % | | | 2.04 | % | | | 2.05 | % | | | 2.04 | % |
Net expenses | | | 1.93 | % | | | 1.93 | % | | | 1.93 | % | | | 1.93 | % | | | 1.93 | % | | | 1.93 | % |
Net investment loss | | | (1.19 | )% | | | (1.28 | )% | | | (1.36 | )% | | | (1.62 | )% | | | (0.72 | )% | | | (1.24 | )% |
Supplemental data | | | | | | | | | | | | | | | | | | | | | | | | |
Portfolio turnover rate | | | 48 | % | | | 99 | % | | | 101 | % | | | 98 | % | | | 91 | % | | | 102 | % |
Net assets, end of period (000s omitted) | | | $8,855 | | | | $9,181 | | | | $9,399 | | | | $9,658 | | | | $8,483 | | | | $7,508 | |
| 1 | Calculated based upon average shares outstanding |
| 2 | Total return calculations do not include any sales charges. Returns for periods of less than one year are not annualized. |
The accompanying notes are an integral part of these financial statements.
| | | | |
| 16 | | Wells Fargo Enterprise Fund | | Financial highlights |
(For a share outstanding throughout each period)
| | | | | | | | | | | | |
| | | Six months ended
March 31, 2017 (unaudited) | | | Year ended September 30 | |
| CLASS R6 | | | 2016 | | | 20151 | |
Net asset value, beginning of period | | | $45.37 | | | | $44.89 | | | | $52.65 | |
Net investment loss | | | (0.01 | ) | | | (0.06 | )2 | | | (0.08 | ) |
Net realized and unrealized gains (losses) on investments | | | 4.28 | | | | 3.90 | | | | (1.76 | ) |
| | | | | | | | | | | | |
Total from investment operations | | | 4.27 | | | | 3.84 | | | | (1.84 | ) |
Distributions to shareholders from | | | | | | | | | | | | |
Net realized gains | | | (1.83 | ) | | | (3.36 | ) | | | (5.92 | ) |
Net asset value, end of period | | | $47.81 | | | | $45.37 | | | | $44.89 | |
Total return3 | | | 9.71 | % | | | 9.06 | % | | | (3.84 | )% |
Ratios to average net assets (annualized) | | | | | | | | | | | | |
Gross expenses | | | 0.83 | % | | | 0.83 | % | | | 0.81 | % |
Net expenses | | | 0.80 | % | | | 0.80 | % | | | 0.80 | % |
Net investment loss | | | (0.07 | )% | | | (0.14 | )% | | | (0.19 | )% |
Supplemental data | | | | | | | | | | | | |
Portfolio turnover rate | | | 48 | % | | | 99 | % | | | 101 | % |
Net assets, end of period (000s omitted) | | | $32,377 | | | | $29,861 | | | | $24 | |
| 1 | For the period from October 31, 2014 (commencement of class operations) to September 30, 2015 |
| 2 | Calculated based upon average shares outstanding |
| 3 | Returns for periods of less than one year are not annualized. |
The accompanying notes are an integral part of these financial statements.
| | | | | | |
| Financial highlights | | Wells Fargo Enterprise Fund | | | 17 | |
(For a share outstanding throughout each period)
| | | | | | | | | | | | | | | | | | | | | | | | |
| | | Six months ended
March 31, 2017 (unaudited) | | | Year ended September 30 | |
| ADMINISTRATOR CLASS | | | 2016 | | | 2015 | | | 2014 | | | 2013 | | | 2012 | |
Net asset value, beginning of period | | | $43.81 | | | | $43.58 | | | | $49.54 | | | | $51.03 | | | | $38.77 | | | | $29.93 | |
Net investment income (loss) | | | (0.08 | )1 | | | (0.18 | )1 | | | (0.23 | )1 | | | (0.37 | )1 | | | 0.02 | 1 | | | (0.16 | )1 |
Net realized and unrealized gains (losses) on investments | | | 4.13 | | | | 3.77 | | | | 0.19 | | | | 3.06 | | | | 12.24 | | | | 9.00 | |
| | | | | | | | | | | | | | | | | | | | | | | | |
Total from investment operations | | | 4.05 | | | | 3.59 | | | | (0.04 | ) | | | 2.69 | | | | 12.26 | | | | 8.84 | |
Distributions to shareholders from | | | | | | | | | | | | | | | | | | | | | | | | |
Net realized gains | | | (1.83 | ) | | | (3.36 | ) | | | (5.92 | ) | | | (4.18 | ) | | | 0.00 | | | | 0.00 | |
Net asset value, end of period | | | $46.03 | | | | $43.81 | | | | $43.58 | | | | $49.54 | | | | $51.03 | | | | $38.77 | |
Total return2 | | | 9.55 | % | | | 8.74 | % | | | (0.46 | )% | | | 5.33 | % | | | 31.62 | % | | | 29.54 | % |
Ratios to average net assets (annualized) | | | | | | | | | | | | | | | | | | | | | | | | |
Gross expenses | | | 1.18 | % | | | 1.15 | % | | | 1.09 | % | | | 1.12 | % | | | 1.13 | % | | | 1.12 | % |
Net expenses | | | 1.10 | % | | | 1.07 | % | | | 1.07 | % | | | 1.09 | % | | | 1.11 | % | | | 1.12 | % |
Net investment income (loss) | | | (0.36 | )% | | | (0.41 | )% | | | (0.47 | )% | | | (0.74 | )% | | | 0.05 | % | | | (0.46 | )% |
Supplemental data | | | | | | | | | | | | | | | | | | | | | | | | |
Portfolio turnover rate | | | 48 | % | | | 99 | % | | | 101 | % | | | 98 | % | | | 91 | % | | | 102 | % |
Net assets, end of period (000s omitted) | | | $5,281 | | | | $4,693 | | | | $3,542 | | | | $44,760 | | | | $10,046 | | | | $6,757 | |
| 1 | Calculated based upon average shares outstanding |
| 2 | Returns for periods of less than one year are not annualized. |
The accompanying notes are an integral part of these financial statements.
| | | | |
| 18 | | Wells Fargo Enterprise Fund | | Financial highlights |
(For a share outstanding throughout each period)
| | | | | | | | | | | | | | | | | | | | | | | | |
| | | Six months ended
March 31, 2017 (unaudited) | | | Year ended September 30 | |
| INSTITUTIONAL CLASS | | | 2016 | | | 2015 | | | 2014 | | | 2013 | | | 2012 | |
Net asset value, beginning of period | | | $45.32 | | | | $44.87 | | | | $50.77 | | | | $52.07 | | | | $39.46 | | | | $30.38 | |
Net investment income (loss) | | | (0.02 | )1 | | | (0.09 | )1 | | | (0.13 | )1 | | | (0.28 | )1 | | | 0.18 | 1 | | | (0.06 | )1 |
Net realized and unrealized gains (losses) on investments | | | 4.27 | | | | 3.90 | | | | 0.15 | | | | 3.16 | | | | 12.43 | | | | 9.14 | |
| | | | | | | | | | | | | | | | | | | | | | | | |
Total from investment operations | | | 4.25 | | | | 3.81 | | | | 0.02 | | | | 2.88 | | | | 12.61 | | | | 9.08 | |
Distributions to shareholders from | | | | | | | | | | | | | | | | | | | | | | | | |
Net realized gains | | | (1.83 | ) | | | (3.36 | ) | | | (5.92 | ) | | | (4.18 | ) | | | 0.00 | | | | 0.00 | |
Net asset value, end of period | | | $47.74 | | | | $45.32 | | | | $44.87 | | | | $50.77 | | | | $52.07 | | | | $39.46 | |
Total return2 | | | 9.70 | % | | | 8.97 | % | | | (0.32 | )% | | | 5.61 | % | | | 31.96 | % | | | 29.89 | % |
Ratios to average net assets (annualized) | | | | | | | | | | | | | | | | | | | | | | | | |
Gross expenses | | | 0.93 | % | | | 0.93 | % | | | 0.88 | % | | | 0.86 | % | | | 0.87 | % | | | 0.86 | % |
Net expenses | | | 0.85 | % | | | 0.85 | % | | | 0.85 | % | | | 0.85 | % | | | 0.85 | % | | | 0.85 | % |
Net investment income (loss) | | | (0.09 | )% | | | (0.21 | )% | | | (0.27 | )% | | | (0.54 | )% | | | 0.41 | % | | | (0.17 | )% |
Supplemental data | | | | | | | | | | | | | | | | | | | | | | | | |
Portfolio turnover rate | | | 48 | % | | | 99 | % | | | 101 | % | | | 98 | % | | | 91 | % | | | 102 | % |
Net assets, end of period (000s omitted) | | | $52,799 | | | | $61,563 | | | | $87,279 | | | | $76,790 | | | | $81,021 | | | | $93,367 | |
| 1 | Calculated based upon average shares outstanding |
| 2 | Returns for periods of less than one year are not annualized. |
The accompanying notes are an integral part of these financial statements.
| | | | | | |
| Notes to financial statements (unaudited) | | Wells Fargo Enterprise Fund | | | 19 | |
1. ORGANIZATION
Wells Fargo Funds Trust (the “Trust”), a Delaware statutory trust organized on March 10, 1999, is an open-end management investment company registered under the Investment Company Act of 1940, as amended (the “1940 Act”). As an investment company, the Trust follows the accounting and reporting guidance in Financial Accounting Standards Board (“FASB”) Accounting Standards Codification (“ASC”) Topic 946, Financial Services – Investment Companies. These financial statements report on the Wells Fargo Enterprise Fund (the “Fund”) which is a diversified series of the Trust.
Effective at the close of business on October 23, 2015, Investor Class shares became Class A shares in a tax-free conversion. Shareholders of Investor Class received Class A shares at a value equal to the value of their Investor Class shares immediately prior to the conversion. Investor Class shares are no longer offered by the Fund.
Effective at the close of business on December 5, 2016, Class B shares were converted to Class A shares and are no longer offered by the Fund. Information for Class B shares reflected in the financial statements represents activity through December 5, 2016.
2. SIGNIFICANT ACCOUNTING POLICIES
The following significant accounting policies, which are consistently followed in the preparation of the financial statements of the Fund, are in conformity with U.S. generally accepted accounting principles which require management to make estimates and assumptions that affect the reported amounts of assets and liabilities, disclosure of contingent assets and liabilities at the date of the financial statements, and the reported amounts of revenues and expenses during the reporting period. Actual results could differ from those estimates.
Securities valuation
All investments are valued each business day as of the close of regular trading on the New York Stock Exchange (generally 4 p.m. Eastern Time), although the Fund may deviate from this calculation time under unusual or unexpected circumstances.
Equity securities that are listed on a foreign or domestic exchange or market are valued at the official closing price or, if none, the last sales price. If no sale occurs on the principal exchange or market that day, the prior day’s price will be deemed “stale” and a fair value price will be determined in accordance with the Fund’s Valuation Procedures.
Investments in registered open-end investment companies are valued at net asset value. Interests in non-registered investment companies that are redeemable at net asset value are fair valued normally at net asset value.
Investments which are not valued using any of the methods discussed above are valued at their fair value, as determined in good faith by the Board of Trustees of the Fund. The Board of Trustees has established a Valuation Committee comprised of the Trustees and has delegated to it the authority to take any actions regarding the valuation of portfolio securities that the Valuation Committee deems necessary or appropriate, including determining the fair value of portfolio securities, unless the determination has been delegated to the Management Valuation Team of Wells Fargo Funds Management, LLC (“Funds Management”). The Board of Trustees retains the authority to make or ratify any valuation decisions or approve any changes to the Valuation Procedures as it deems appropriate. On a quarterly basis, the Board of Trustees receives reports on any valuation actions taken by the Valuation Committee or the Management Valuation Team which may include items for ratification.
Valuations of fair valued securities are compared to the next actual sales price when available, or other appropriate market values, to assess the continued appropriateness of the fair valuation methodologies used. These securities are fair valued on a day-to-day basis, taking into consideration changes to appropriate market information and any significant changes to the inputs considered in the valuation process until there is a readily available price provided on an exchange or by an independent pricing service. Valuations received from an independent pricing service or independent broker-dealer quotes are periodically validated by comparisons to most recent trades and valuations provided by other independent pricing services in addition to the review of prices by the manager and/or subadviser. Unobservable inputs used in determining fair valuations are identified based on the type of security, taking into consideration factors utilized by market participants in valuing the investment, knowledge about the issuer and the current market environment.
Security loans
The Fund may lend its securities from time to time in order to earn additional income in the form of fees or interest on securities received as collateral or the investment of any cash received as collateral. The Fund continues to receive interest or dividends on the securities loaned. The Fund receives collateral in the form of cash or securities with a value at least equal to the value of the securities on loan. The value of the loaned securities is determined at the close of each
| | | | |
| 20 | | Wells Fargo Enterprise Fund | | Notes to financial statements (unaudited) |
business day and any additional required collateral is delivered to the Fund on the next business day. In a securities lending transaction, the net asset value of the Fund will be affected by an increase or decrease in the value of the securities loaned and by an increase or decrease in the value of the instrument in which collateral is invested. The amount of securities lending activity undertaken by the Fund fluctuates from time to time. In the event of default or bankruptcy by the borrower, the Fund may be prevented from recovering the loaned securities or gaining access to the collateral or may experience delays or costs in doing so. In addition, the investment of any cash collateral received may lose all or part of its value. The Fund has the right under the lending agreement to recover the securities from the borrower on demand.
The Fund lends its securities through an unaffiliated securities lending agent. Cash collateral received in connection with its securities lending transactions is invested in Securities Lending Cash Investments, LLC (the “Securities Lending Fund”). The Securities Lending Fund is exempt from registration under Section 3(c)(7) of the 1940 Act and is managed by Funds Management and is subadvised by Wells Capital Management Incorporated (“WellsCap”), an affiliate of Funds Management and an indirect wholly owned subsidiary of Wells Fargo & Company (“Wells Fargo”). Funds Management receives an advisory fee starting at 0.05% and declining to 0.01% as the average daily net assets of the Securities Lending Fund increase. All of the fees received by Funds Management are paid to WellsCap for its services as subadviser. The Securities Lending Fund seeks to provide a positive return compared to the daily Fed Funds Open Rate by investing in high-quality, U.S. dollar-denominated short-term money market instruments. Securities Lending Fund investments are valued at the evaluated bid price provided by an independent pricing service. Income earned from investment in the Securities Lending Fund is included in securities lending income on the Statement of Operations.
Security transactions and income recognition
Securities transactions are recorded on a trade date basis. Realized gains or losses are recorded on the basis of identified cost.
Dividend income is recognized on the ex-dividend date. Dividend income is recorded net of foreign taxes withheld where recovery of such taxes is not assured.
Distributions to shareholders
Distributions to shareholders from net investment income and net realized gains, if any, are recorded on the ex-dividend date. Such distributions are determined in accordance with income tax regulations and may differ from U.S. generally accepted accounting principles. Dividend sources are estimated at the time of declaration. The tax character of distributions is determined as of the Fund’s fiscal year end. Therefore, a portion of the Fund’s distributions made prior the Fund’s fiscal year end may be categorized as a tax return of capital.
Federal and other taxes
The Fund intends to continue to qualify as a regulated investment company by distributing substantially all of its investment company taxable income and any net realized capital gains (after reduction for capital loss carryforwards) sufficient to relieve it from all, or substantially all, federal income taxes. Accordingly, no provision for federal income taxes was required.
The Fund’s income and federal excise tax returns and all financial records supporting those returns for the prior three fiscal years are subject to examination by the federal and Delaware revenue authorities. Management has analyzed the Fund’s tax positions taken on federal, state, and foreign tax returns for all open tax years and does not believe that there are any uncertain tax positions that require recognition of a tax liability.
As of September 30, 2016, the Fund had a qualified late-year ordinary loss of $2,178,411 which was recognized on the first day of the current fiscal year.
Class allocations
The separate classes of shares offered by the Fund differ principally in applicable sales charges, distribution, shareholder servicing, and administration fees. Class specific expenses are charged directly to that share class. Investment income, common expenses, and realized and unrealized gains (losses) on investments are allocated daily to each class of shares based on the relative proportion of net assets of each class.
3. FAIR VALUATION MEASUREMENTS
Fair value measurements of investments are determined within a framework that has established a fair value hierarchy based upon the various data inputs utilized in determining the value of the Fund’s investments. The three-level hierarchy gives the highest priority to unadjusted quoted prices in active markets for identical assets or liabilities (Level 1) and the lowest priority to unobservable inputs (Level 3). The Fund’s investments are classified within the fair value hierarchy
| | | | | | |
| Notes to financial statements (unaudited) | | Wells Fargo Enterprise Fund | | | 21 | |
based on the lowest level of input that is significant to the fair value measurement. The inputs are summarized into three broad levels as follows:
| ∎ | | Level 1 – quoted prices in active markets for identical securities |
| ∎ | | Level 2 – other significant observable inputs (including quoted prices for similar securities, interest rates, prepayment speeds, credit risk, etc.) |
| ∎ | | Level 3 – significant unobservable inputs (including the Fund’s own assumptions in determining the fair value of investments) |
The inputs or methodologies used for valuing investments in securities are not necessarily an indication of the risk associated with investing in those securities.
The following is a summary of the inputs used in valuing the Fund’s assets and liabilities as of March 31, 2017:
| | | | | | | | | | | | | | | | |
| | | Quoted prices
(Level 1) | | | Other significant
observable inputs
(Level 2) | | | Significant
unobservable inputs (Level 3) | | | Total | |
Assets | | | | | | | | | | | | | | | | |
Investments in: | | | | | | | | | | | | | | | | |
| | | | |
Common stocks | | | | | | | | | | | | | | | | |
Consumer discretionary | | $ | 108,574,831 | | | $ | 0 | | | $ | 0 | | | $ | 108,574,831 | |
Consumer staples | | | 15,202,204 | | | | 0 | | | | 0 | | | | 15,202,204 | |
Energy | | | 4,760,519 | | | | 0 | | | | 0 | | | | 4,760,519 | |
Financials | | | 50,154,066 | | | | 0 | | | | 0 | | | | 50,154,066 | |
Health care | | | 60,127,123 | | | | 0 | | | | 0 | | | | 60,127,123 | |
Industrials | | | 124,542,463 | | | | 0 | | | | 0 | | | | 124,542,463 | |
Information technology | | | 220,893,869 | | | | 7,694,509 | | | | 0 | | | | 228,588,378 | |
Materials | | | 36,962,985 | | | | 0 | | | | 0 | | | | 36,962,985 | |
Real estate | | | 8,787,010 | | | | 0 | | | | 0 | | | | 8,787,010 | |
Telecommunication services | | | 9,728,495 | | | | 0 | | | | 0 | | | | 9,728,495 | |
| | | | |
Short-term investments | | | | | | | | | | | | | | | | |
Investment companies | | | 5,809,204 | | | | 0 | | | | 0 | | | | 5,809,204 | |
Investments measured at net asset value* | | | | | | | | | | | | | | | 4,005,050 | |
Total assets | | $ | 645,542,769 | | | $ | 7,694,509 | | | $ | 0 | | | $ | 657,242,328 | |
| * | Investments that are measured at fair value using the net asset value per share (or its equivalent) as a practical expedient have not been categorized in the fair value hierarchy. The fair value amount presented in the table is intended to permit reconciliation of the fair value hierarchy to the amounts presented in the Statement of Assets and Liabilities. The Fund’s investment in Securities Lending Cash Investments, LLC valued at $4,005,050 does not have a redemption period notice, can be redeemed daily and does not have any unfunded commitments. |
The Fund recognizes transfers between levels within the fair value hierarchy at the end of the reporting period. At March 31, 2017, Common stocks with a market value of $7,694,509 were transferred from Level 1 to Level 2 because of a decrease in the market activity of this security. The Fund did not have any transfers into/out of Level 3.
4. TRANSACTIONS WITH AFFILIATES AND OTHER EXPENSES
Management fee
Funds Management, an indirect wholly owned subsidiary of Wells Fargo, is the manager of the Fund and provides advisory and fund-level administrative services under an investment management agreement. Under the investment management agreement, Funds Management is responsible for, among other services, implementing the investment objectives and strategies of the Fund, supervising the subadviser, providing fund-level administrative services in connection with the Fund’s operations, and providing any other fund-level administrative services reasonably necessary for the operation of the Fund. As compensation for its services under the investment management agreement, Funds Management is entitled to receive an annual management fee starting at 0.75% and declining to 0.63% as the average daily net assets of the Fund increase. For the six months ended March 31, 2017, the management fee was equivalent to an annual rate of 0.74% of the Fund’s average daily net assets.
| | | | |
| 22 | | Wells Fargo Enterprise Fund | | Notes to financial statements (unaudited) |
Funds Management has retained the services of a subadviser to provide daily portfolio management to the Fund. The fee for subadvisory services is borne by Funds Management. WellsCap is the subadviser to the Fund and is entitled to receive a fee from Funds Management at an annual rate starting at 0.45% and declining to 0.30% as the average daily net assets of the Fund increase.
Administration fees
Under a class-level administration agreement, Funds Management provides class-level administrative services to the Fund, which includes paying fees and expenses for services provided by the transfer agent, sub-transfer agents, omnibus account servicers and record-keepers. As compensation for its services under the class-level administration agreement, Funds Management receives an annual fee which is calculated based on the average daily net assets of each class as follows:
| | | | |
| | | Class-level
administration fee | |
Class A, Class B, Class C | | | 0.21 | % |
Class R6 | | | 0.03 | |
Administrator Class, Institutional Class | | | 0.13 | |
Funds Management has contractually waived and/or reimbursed management and administration fees to the extent necessary to maintain certain net operating expense ratios for the Fund. Waiver of fees and/or reimbursement of expenses by Funds Management were made first from fund level expenses on a proportionate basis and then from class specific expenses. Funds Management has committed through January 31, 2018 to waive fees and/or reimburse expenses to the extent necessary to cap the Fund’s expenses at 1.18% for Class A shares, 1.93% for Class C shares, 0.80% for Class R6 shares, 1.10% for Administrator Class shares, and 0.85% for Institutional Class shares. After this time, the cap may be increased or the commitment to maintain the cap may be terminated only with the approval of the Board of Trustees.
During the six months ended March 31, 2017, State Street Bank and Trust Company, the Fund’s custodian, reimbursed the Fund $5,080 for certain out-of-pocket expenses that were billed to the Fund in error from 1998-2015. This amount is included in dividend income on the Statement of Operations. In addition, Funds Management was also reimbursed $6,888 for waivers/reimbursements it made to the Fund during the period the Fund was erroneously billed.
Distribution fees
The Trust has adopted a distribution plan for Class B and Class C shares of the Fund pursuant to Rule 12b-1 under the 1940 Act. Distribution fees are charged to Class B and Class C shares and paid to Wells Fargo Funds Distributor, LLC (“Funds Distributor”), the principal underwriter, at an annual rate of 0.75% of the average daily net assets of Class B and Class C shares.
In addition, Funds Distributor is entitled to receive the front-end sales charge from the purchase of Class A shares and a contingent deferred sales charge on the redemption of certain Class A shares. Funds Distributor is also entitled to receive the contingent deferred sales charges from redemptions of Class B and Class C shares. For the six months ended March 31, 2017, Funds Distributor received $1,564 from the sale of Class A shares and $67 in contingent deferred sales charges from redemptions of Class C shares.
Shareholder servicing fees
The Trust has entered into contracts with one or more shareholder servicing agents, whereby Class A, Class B, Class C, and Administrator Class of the Fund are charged a fee at an annual rate of 0.25% of the average daily net assets of each respective class.
A portion of these total shareholder servicing fees were paid to affiliates of Wells Fargo.
5. INVESTMENT PORTFOLIO TRANSACTIONS
Purchases and sales of investments, excluding U.S. government obligations (if any) and short-term securities, for the six months ended March 31, 2017 were $300,723,940 and $355,865,363, respectively.
The Fund may purchase or sell investment securities to other Wells Fargo affiliates pursuant to Rule 17a-7 of the 1940 Act and under procedures adopted by the Board of Trustees. The procedures have been designed to ensure that these interfund transactions, which generally do not incur broker commissions, are effected at current market prices. Interfund trades are included within the respective purchases and sales amounts shown.
| | | | | | |
| Notes to financial statements (unaudited) | | Wells Fargo Enterprise Fund | | | 23 | |
6. BANK BORROWINGS
The Trust (excluding the money market funds and certain other funds) and Wells Fargo Variable Trust are parties to a $250,000,000 revolving credit agreement whereby the Fund is permitted to use bank borrowings for temporary or emergency purposes, such as to fund shareholder redemption requests. Interest under the credit agreement is charged to the Fund based on a borrowing rate equal to the higher of the Federal Funds rate in effect on that day plus 1.25% or the overnight LIBOR rate in effect on that day plus 1.25%. In addition, an annual commitment fee equal to 0.25% of the unused balance is allocated to each participating fund.
For the six months ended March 31, 2017, there were no borrowings by the Fund under the agreement.
7. CONCENTRATION RISK
Concentration risks result from exposure to a limited number of sectors. A fund that invests a substantial portion of its assets in any sector may be more affected by changes in that sector than would be a fund whose investments are not heavily weighted in any sector.
8. INDEMNIFICATION
Under the Trust’s organizational documents, the officers and Trustees have been granted certain indemnification rights against certain liabilities that may arise out of performance of their duties to the Trust. Additionally, in the normal course of business, the Trust may enter into contracts with service providers that contain a variety of indemnification clauses. The Trust’s maximum exposure under these arrangements is dependent on future claims that may be made against the Fund and, therefore, cannot be estimated.
9. NEW ACCOUNTING PRONOUNCEMENT
In December 2016, FASB issued Accounting Standards Update (“ASU”) No. 2016-19, Technical Corrections and Improvements. ASU 2016-19 includes an amendment to FASB ASC Topic 820, Fair Value Measurement which clarifies the difference between a valuation approach and a valuation technique. The amendment also requires an entity to disclose when there has been a change in either or both a valuation approach and/or a valuation technique. The disclosure requirements are effective for fiscal years and interim periods within those fiscal years beginning after December 15, 2016. Management is currently evaluating the potential impact of this new guidance to the financial statements.
10. REGULATORY CHANGES
In October 2016, the Securities and Exchange Commission (“SEC”) adopted new rules and forms and amended existing rules and forms (together, “final rules”) intended to modernize and enhance the reporting and disclosure of information by registered investment companies and to enhance liquidity risk management by open-end mutual funds and exchange-traded funds. The final rules will enhance the quality of information available to investors and will allow the SEC to more effectively collect and use data reported by funds. In part, the final rules amend Regulation S-X and require standardized, enhanced disclosure about derivatives in the Fund’s financial statements, as well as other amendments. The compliance date for the amendments to Regulation S-X is August 1, 2017 while the compliance date for the new form types is June 1, 2018 and the compliance date for the liquidity risk management program requirements is December 1, 2018. Management is currently assessing the potential impact of these enhancements and their impact on the financial statement disclosures and reporting requirements.
| | | | |
| 24 | | Wells Fargo Enterprise Fund | | Other information (unaudited) |
PROXY VOTING INFORMATION
A description of the policies and procedures that the Fund uses to determine how to vote proxies relating to portfolio securities is available, upon request, by calling 1-800-222-8222, visiting our website at wellsfargofunds.com, or visiting the SEC website at sec.gov. Information regarding how the Fund voted proxies relating to portfolio securities during the most recent 12-month period ended June 30 is available on the Fund’s website at wellsfargofunds.com or by visiting the SEC website at sec.gov.
PORTFOLIO HOLDINGS INFORMATION
The complete portfolio holdings for the Fund are publicly available monthly on the Fund’s website (wellsfargofunds.com), on a one-month delayed basis. In addition, top ten holdings information (excluding derivative positions) for the Fund is publicly available on the Fund’s website on a monthly, seven-day or more delayed basis. The Fund files its complete schedule of portfolio holdings with the SEC for the first and third quarters of each fiscal year on Form N-Q, which is available by visiting the SEC website at sec.gov. In addition, the Fund’s Form N-Q may be reviewed and copied at the SEC’s Public Reference Room in Washington, DC, and at regional offices in New York City, at 233 Broadway, and in Chicago, at 175 West Jackson Boulevard, Suite 900. Information about the Public Reference Room may be obtained by calling 1-800-SEC-0330.
| | | | | | |
| Other information (unaudited) | | Wells Fargo Enterprise Fund | | | 25 | |
BOARD OF TRUSTEES AND OFFICERS
Each of the Trustees and Officers1 listed in the table below acts in identical capacities for each fund in the Wells Fargo family of funds, which consists of 138 mutual funds comprising the Wells Fargo Funds Trust, Wells Fargo Variable Trust, Wells Fargo Master Trust and four closed-end funds (collectively the “Fund Complex”). This table should be read in conjunction with the Prospectus and the Statement of Additional Information2. The mailing address of each Trustee and Officer is 525 Market Street, 12th Floor, San Francisco, CA 94105. Each Trustee and Officer serves an indefinite term, however, each Trustee serves such term until reaching the mandatory retirement age established by the Trustees.
Independent Trustees
| | | | | | |
Name and
year of birth | | Position held and
length of service* | | Principal occupations during past five years or longer | | Current other
public company or
investment company
directorships |
William R. Ebsworth (Born 1957) | | Trustee, since 2015 | | Retired. From 1984 to 2013, equities analyst, portfolio manager, research director and chief financial officer at Fidelity Management and Research Company in Boston, Tokyo, and Hong Kong and retired in 2013 as Chief Investment Officer of Fidelity Strategic Advisers, Inc. where he lead a team of investment professionals managing client assets. Prior thereto, Board member of Hong Kong Securities Clearing Co., Hong Kong Options Clearing Corp., the Thailand International Fund, Ltd., Fidelity Investments Life Insurance Company, and Empire Fidelity Investments Life Insurance Company. Board member of the Fonté Foundation (non-profit organization) and the Vincent Memorial Hospital Endowment (non-profit organization), where he serves on the Investment Committee and as a Chair of the Audit Committee. Mr. Ebsworth is a CFA® charterholder and an Adjunct Lecturer, Finance, at Babson College. | | Asset Allocation Trust |
Jane A. Freeman (Born 1953) | | Trustee, since 2015 | | Retired. From 2012 to 2014 and 1999 to 2008, Chief Financial Officer of Scientific Learning Corporation. From 2008 to 2012, Ms. Freeman provided consulting services related to strategic business projects. Prior to 1999, Portfolio Manager at Rockefeller & Co. and Scudder, Stevens & Clark. Board member of the Harding Loevner Funds from 1996 to 2014, serving as both Lead Independent Director and chair of the Audit Committee. Board member of the Russell Exchange Traded Funds Trust from 2011 to 2012 and the chair of the Audit Committee. Ms. Freeman is a Board Member of Ruth Bancroft Garden (non-profit organization) and an inactive chartered financial analyst. | | Asset Allocation Trust |
Peter G. Gordon** (Born 1942) | | Trustee, since 1998; Chairman, since 2005 | | Co-Founder, Retired Chairman, President and CEO of Crystal Geyser Water Company. Trustee Emeritus, Colby College. | | Asset Allocation Trust |
Isaiah Harris, Jr. (Born 1952) | | Trustee, since 2009 | | Retired. Chairman of the Board of CIGNA Corporation since 2009, and Director since 2005. From 2003 to 2011, Director of Deluxe Corporation. Prior thereto, President and CEO of BellSouth Advertising and Publishing Corp. from 2005 to 2007, President and CEO of BellSouth Enterprises from 2004 to 2005 and President of BellSouth Consumer Services from 2000 to 2003. Emeritus member of the Iowa State University Foundation Board of Governors. Emeritus Member of the Advisory Board of Iowa State University School of Business. Advisory Board Member, Palm Harbor Academy (charter school). Advisory Board Member, Child Evangelism Fellowship (non-profit). Mr. Harris is a certified public accountant (inactive status). | | CIGNA Corporation; Asset Allocation Trust |
Judith M. Johnson (Born 1949) | | Trustee, since 2008;
Audit Committee Chairman, since 2008 | | Retired. Prior thereto, Chief Executive Officer and Chief Investment Officer of Minneapolis Employees Retirement Fund from 1996 to 2008. Ms. Johnson is an attorney, certified public accountant and a certified managerial accountant. | | Asset Allocation Trust |
David F. Larcker (Born 1950) | | Trustee, since 2009 | | James Irvin Miller Professor of Accounting at the Graduate School of Business, Stanford University, Director of the Corporate Governance Research Initiative and Senior Faculty of The Rock Center for Corporate Governance since 2006. From 2005 to 2008, Professor of Accounting at the Graduate School of Business, Stanford University. Prior thereto, Ernst & Young Professor of Accounting at The Wharton School, University of Pennsylvania from 1985 to 2005. | | Asset Allocation Trust |
| | | | |
| 26 | | Wells Fargo Enterprise Fund | | Other information (unaudited) |
| | | | | | |
Name and
year of birth | | Position held and
length of service* | | Principal occupations during past five years or longer | | Current other
public company or
investment company
directorships |
Olivia S. Mitchell (Born 1953) | | Trustee, since 2006 | | International Foundation of Employee Benefit Plans Professor, Wharton School of the University of Pennsylvania since 1993. Director of Wharton’s Pension Research Council and Boettner Center on Pensions & Retirement Research, and Research Associate at the National Bureau of Economic Research. Previously, Cornell University Professor from 1978 to 1993. | | Asset Allocation Trust |
Timothy J. Penny (Born 1951) | | Trustee, since 1996 | | President and Chief Executive Officer of Southern Minnesota Initiative Foundation, a non-profit organization, since 2007 and Senior Fellow at the Humphrey Institute Policy Forum at the University of Minnesota since 1995. Member of the Board of Trustees of NorthStar Education Finance, Inc., a non-profit organization, since 2007. | | Asset Allocation Trust |
Michael S. Scofield (Born 1943) | | Trustee, since 2010 | | Served on the Investment Company Institute’s Board of Governors and Executive Committee from 2008-2011 as well the Governing Council of the Independent Directors Council from 2006-2011 and the Independent Directors Council Executive Committee from 2008-2011. Chairman of the IDC from 2008-2010. Institutional Investor (Fund Directions) Trustee of Year in 2007. Trustee of the Evergreen Funds complex (and its predecessors) from 1984 to 2010. Chairman of the Evergreen Funds from 2000-2010. Former Trustee of the Mentor Funds. Retired Attorney, Law Offices of Michael S. Scofield. | | Asset Allocation Trust |
| * | Length of service dates reflect the Trustee’s commencement of service with the Trust’s predecessor entities, where applicable. |
| ** | Peter Gordon is expected to retire on December 31, 2017. |
Officers
| | | | | | |
Name and
year of birth | | Position held and
length of service | | Principal occupations during past five years or longer | | |
Andrew Owen (Born 1960) | | President, since 2017 | | Executive Vice President of Wells Fargo Bank, N.A. and President of Wells Fargo & Company and Head of Affiliated Managers, Wells Fargo Asset Management, since 2014. Executive Vice President responsible for marketing, investments and product development for Wells Fargo Funds Management, LLC, from 2009 to 2014. | | |
Nancy Wiser1 (Born 1967) | | Treasurer, since 2012 | | Executive Vice President of Wells Fargo Funds Management, LLC since 2011. Chief Operating Officer and Chief Compliance Officer at LightBox Capital Management LLC, from 2008 to 2011. | | |
C. David Messman (Born 1960) | | Secretary, since 2000; Chief Legal Officer, since 2003 | | Senior Vice President and Secretary of Wells Fargo Funds Management, LLC since 2001. Assistant General Counsel of Wells Fargo Bank, N.A. since 2013 and Vice President and Managing Counsel of Wells Fargo Bank, N.A. from 1996 to 2013. | | |
Michael Whitaker (Born 1967) | | Chief Compliance Officer, since 2016 | | Executive Vice President of Wells Fargo Funds Management, LLC since 2016. Chief Compliance Officer of Fidelity’s Fixed Income Funds and Asset Allocation Funds from 2008 to 2016, Compliance Officer of FMR Co., Inc. from 2014 to 2016, Fidelity Investments Money Management, Inc. from 2014 to 2016, Fidelity Investments from 2007 to 2016. | | |
David Berardi (Born 1975) | | Assistant Treasurer, since 2009 | | Vice President of Wells Fargo Funds Management, LLC since 2009. Vice President of Evergreen Investment Management Company, LLC from 2008 to 2010. Manager of Fund Reporting and Control for Evergreen Investment Management Company, LLC from 2004 to 2010. | | |
Jeremy DePalma1 (Born 1974) | | Assistant Treasurer, since 2009 | | Senior Vice President of Wells Fargo Funds Management, LLC since 2009. Senior Vice President of Evergreen Investment Management Company, LLC from 2008 to 2010 and head of the Fund Reporting and Control Team within Fund Administration from 2005 to 2010. | | |
| 1 | Nancy Wiser acts as Treasurer of 69 funds in the Fund Complex. Jeremy DePalma acts as Treasurer of 69 funds and Assistant Treasurer of 69 funds in the Fund Complex. |
| 2 | The Statement of Additional Information includes additional information about the Trustees and is available, without charge, upon request, by calling 1-800-222-8222 or by visiting the website at wellsfargofunds.com. |
| | | | | | |
| List of abbreviations | | Wells Fargo Enterprise Fund | | | 27 | |
The following is a list of common abbreviations for terms and entities that may have appeared in this report.
| ACA | — ACA Financial Guaranty Corporation |
| ADR | — American depositary receipt |
| ADS | — American depositary shares |
| AGC | — Assured Guaranty Corporation |
| AGM | — Assured Guaranty Municipal |
| Ambac | — Ambac Financial Group Incorporated |
| AMT | — Alternative minimum tax |
| BAN | — Bond anticipation notes |
| BHAC | — Berkshire Hathaway Assurance Corporation |
| CAB | — Capital appreciation bond |
| CCAB | — Convertible capital appreciation bond |
| CDA | — Community Development Authority |
| CDO | — Collateralized debt obligation |
| DRIVER | — Derivative inverse tax-exempt receipts |
| DW&P | — Department of Water & Power |
| DWR | — Department of Water Resources |
| ECFA | — Educational & Cultural Facilities Authority |
| EDA | — Economic Development Authority |
| EDFA | — Economic Development Finance Authority |
| ETF | — Exchange-traded fund |
| FDIC | — Federal Deposit Insurance Corporation |
| FFCB | — Federal Farm Credit Banks |
| FGIC | — Financial Guaranty Insurance Corporation |
| FHA | — Federal Housing Administration |
| FHLB | — Federal Home Loan Bank |
| FHLMC | — Federal Home Loan Mortgage Corporation |
| FICO | — The Financing Corporation |
| FNMA | — Federal National Mortgage Association |
| GDR | — Global depositary receipt |
| GNMA | — Government National Mortgage Association |
| HCFR | — Healthcare facilities revenue |
| HEFA | — Health & Educational Facilities Authority |
| HEFAR | — Higher education facilities authority revenue |
| HFA | — Housing Finance Authority |
| HFFA | — Health Facilities Financing Authority |
| HUD | — Department of Housing and Urban Development |
| IDA | — Industrial Development Authority |
| IDAG | — Industrial Development Agency |
| KRW | — Republic of Korea won |
| LIBOR | — London Interbank Offered Rate |
| LIFER | — Long Inverse Floating Exempt Receipts |
| LLC | — Limited liability company |
| LLLP | — Limited liability limited partnership |
| LLP | — Limited liability partnership |
| MBIA | — Municipal Bond Insurance Association |
| MFHR | — Multifamily housing revenue |
| MSTR | —�� Municipal securities trust receipts |
| MUD | — Municipal Utility District |
| National | — National Public Finance Guarantee Corporation |
| PCFA | — Pollution Control Financing Authority |
| PCL | — Public Company Limited |
| PCR | — Pollution control revenue |
| PFA | — Public Finance Authority |
| PFFA | — Public Facilities Financing Authority |
| PFOTER | — Puttable floating option tax-exempt receipts |
| plc | — Public limited company |
| PUTTER | — Puttable tax-exempt receipts |
| R&D | — Research & development |
| Radian | — Radian Asset Assurance |
| RAN | — Revenue anticipation notes |
| RDA | — Redevelopment Authority |
| RDFA | — Redevelopment Finance Authority |
| REIT | — Real estate investment trust |
| ROC | — Reset option certificates |
| SAVRS | — Select auction variable rate securities |
| SBA | — Small Business Authority |
| SDR | — Swedish depositary receipt |
| SFHR | — Single-family housing revenue |
| SFMR | — Single-family mortgage revenue |
| SPA | — Standby purchase agreement |
| SPDR | — Standard & Poor’s Depositary Receipts |
| SPEAR | — Short Puttable Exempt Adjustable Receipts |
| STRIPS | — Separate trading of registered interest and |
| TAN | — Tax anticipation notes |
| TIPS | — Treasury inflation-protected securities |
| TRAN | — Tax revenue anticipation notes |
| TTFA | — Transportation Trust Fund Authority |
| TVA | — Tennessee Valley Authority |
This page is intentionally left blank.

For more information
More information about Wells Fargo Funds is available free upon request. To obtain literature, please write, email, visit the Fund’s website, or call:
Wells Fargo Funds
P.O. Box 8266
Boston, MA 02266-8266
Email: fundservice@wellsfargo.com
Website: wellsfargofunds.com
Individual investors: 1-800-222-8222
Retail investment professionals: 1-888-877-9275
Institutional investment professionals: 1-866-765-0778
This report and the financial statements contained herein are submitted for the general information of the shareholders of the Fund. If this report is used for promotional purposes, distribution of the report must be accompanied or preceded by a current prospectus. Before investing, please consider the investment objectives, risks, charges, and expenses of the investment. For a current prospectus and, if available, a summary prospectus, containing this information, call 1-800-222-8222 or visit the Fund’s website at wellsfargofunds.com. Read the prospectus carefully before you invest or send money.
Wells Fargo Asset Management (WFAM) is a trade name used by the asset management businesses of Wells Fargo & Company. Wells Fargo Funds Management, LLC, a wholly owned subsidiary of Wells Fargo & Company, provides investment advisory and administrative services for Wells Fargo Funds. Other affiliates of Wells Fargo & Company provide subadvisory and other services for the funds. The funds are distributed by Wells Fargo Funds Distributor, LLC, Member FINRA, an affiliate of Wells Fargo & Company. Neither Wells Fargo Funds Management nor Wells Fargo Funds Distributor has Fund customer accounts/assets, and neither provides investment advice/recommendations or acts as an investment advice fiduciary to any investor.
NOT FDIC INSURED ◾ NO BANK GUARANTEE ◾ MAY LOSE VALUE
© 2017 Wells Fargo Funds Management, LLC. All rights reserved.
| | |
 | | 302889 05-17 SA231/SAR231 03-17 |
Semi-Annual Report
March 31, 2017

Wells Fargo Opportunity Fund


Reduce clutter. Save trees.
Sign up for electronic delivery of prospectuses and shareholder reports at wellsfargo.com/advantagedelivery
Contents
The views expressed and any forward-looking statements are as of March 31, 2017, unless otherwise noted, and are those of the Fund managers and/or Wells Fargo Funds Management, LLC. Discussions of individual securities, or the markets generally, or any Wells Fargo Fund are not intended as individual recommendations. Future events or results may vary significantly from those expressed in any forward-looking statements. The views expressed are subject to change at any time in response to changing circumstances in the market. Wells Fargo Funds Management, LLC and the Fund disclaim any obligation to publicly update or revise any views expressed or forward-looking statements.
NOT FDIC INSURED ◾ NO BANK GUARANTEE ◾ MAY LOSE VALUE
| | | | |
| 2 | | Wells Fargo Opportunity Fund | | Letter to shareholders (unaudited) |

Andrew Owen
President
Wells Fargo Funds
U.S. and international stocks returned 10.12% and 8.18% for the six-month period; within fixed income, the Bloomberg Barclays U.S. Aggregate Bond Index3 returned -2.18%.
Dear Shareholder:
As the new president of Wells Fargo Funds now that Karla Rabusch is retiring from that position after nearly 14 years, I am pleased to offer you this semi-annual report for the Wells Fargo Opportunity Fund for the six-month period that ended March 31, 2017. During this period, global stocks delivered favorable results overall. U.S. and international stocks returned 10.12% and 8.18% for the six-month period, respectively, as measured by the S&P 500 Index1 and the MSCI ACWI ex USA Index (Net)2; within fixed income, the Bloomberg Barclays U.S. Aggregate Bond Index3 returned -2.18%.
During the fourth quarter of 2016, prospects for faster growth and higher interest rates in the U.S. influenced markets.
Early in the fourth quarter of 2016, U.S. stocks tended to trade lower amid concerns such as a likely interest-rate increase and uncertainty over the approaching general election. However, following Donald Trump’s election as president in early November, U.S. stocks began to rally. Investors appeared optimistic that the new administration would usher in a series of progrowth policies, and supportive economic news helped the rally carry through the quarter. The buoyant environment sent interest rates higher as well. At its mid-December meeting, Fed officials raised their short-term target interest rate for the first time in a year by a quarter percentage point to between 0.50% and 0.75%. The fourth quarter also saw the implementation of the U.S. Securities and Exchange Commission’s new rules for money market funds, which included floating net asset values (NAVs) for institutional prime and municipal money market funds as well as liquidity fees and redemption gates. In the year leading up to money market fund reform implementation, nearly $1 trillion in assets moved from these types of money market funds into government money market funds, which continued to transact at a stable $1 NAV. Outside of the U.S., the prospects for faster U.S. growth appeared to trigger some acceleration in Europe. The improvement may be partly attributable to expectations for further strengthening of the U.S. dollar, which in turn could improve demand for European goods in the U.S. due to weakening of the euro relative to the dollar. Meanwhile, rising inflation across the eurozone and Japan caused an upward shift in yield curves in those areas although developed-country bond yields remained significantly lower than U.S. Treasury yields.
Globally, stocks delivered positive results and economies showed some improvement in the first quarter of 2017.
Stocks rallied globally through the first quarter of 2017, supported by signs of improvement in the U.S. and global economies. U.S. economic data released during the quarter reflected a healthy economy. Hiring remained strong, and business and consumer sentiment improved. Meanwhile, inflation inched up during the quarter. Along with the pickup in inflation, investors appeared to shift
| 1 | The S&P 500 Index consists of 500 stocks chosen for market size, liquidity, and industry group representation. It is a market-value-weighted index with each stock’s weight in the index proportionate to its market value. You cannot invest directly in an index. |
| 2 | The Morgan Stanley Capital International (MSCI) All Country World Index (ACWI) ex USA Index (Net) is a free-float-adjusted market-capitalization-weighted index that is designed to measure the equity market performance of developed markets, excluding the United States and Canada. Source: MSCI. MSCI makes no express or implied warranties or representations and shall have no liability whatsoever with respect to any MSCI data contained herein. The MSCI data may not be further redistributed or used as a basis for other indexes or any securities or financial products. This report is not approved, reviewed, or produced by MSCI. You cannot invest directly in an index. |
| 3 | The Bloomberg Barclays U.S. Aggregate Bond Index (formerly known as Barclays U.S. Aggregate Bond Index) is a broad-based benchmark that measures the investment-grade, U.S. dollar–denominated, fixed-rate taxable bond market, including Treasuries, government-related and corporate securities, mortgage-backed securities (agency fixed-rate and hybrid adjustable-rate mortgage pass-throughs), asset-backed securities, and commercial mortgage-backed securities. You cannot invest directly in an index. |
| | | | | | |
| Letter to shareholders (unaudited) | | Wells Fargo Opportunity Fund | | | 3 | |
from a mindset of very gradual interest-rate increases by the Fed to an anticipation of three or four increases in 2017. The first of these occurred in March; Fed officials raised their short-term target rate by a quarter percentage point to between 0.75% and 1.00%. With the Fed’s target-rate increase, short-term bond yields rose during the quarter. Meanwhile, longer-term Treasury yields were little changed, leading to positive performance. Investment-grade and high-yield bonds benefited from strong demand. Municipal bond returns were positive in the quarter, helped by strong demand and constrained new-issue supply. Outside of the U.S., credit spreads narrowed, helping lower-quality credit outperform amid a strong demand for yield. Also, stocks in emerging markets generally outperformed stocks in the U.S. and international developed markets. Thus far in 2017, emerging markets overall have benefited from both global economic growth and recent weakening in the U.S. dollar. European stocks also outperformed the U.S. market, despite investors’ concern over uncertainties such as the potential impact of an upcoming election in France; a contender for president of France, Marine Le Pen, favored exiting the European Union, which could potentially destabilize or topple the organization.
Don’t let short-term uncertainty derail long-term investment goals.
Periods of uncertainty can present challenges, but experience has taught us that maintaining long-term investment goals can be an effective way to plan for the future. To help you create a sound strategy based on your personal goals and risk tolerance, Wells Fargo Funds offers more than 100 mutual funds spanning a wide range of asset classes and investment styles. Although diversification cannot guarantee an investment profit or prevent losses, we believe it can be an effective way to manage investment risk and potentially smooth out overall portfolio performance. We encourage investors to know their investments and to understand that appropriate levels of risk-taking may unlock opportunities.
Thank you for choosing to invest in Wells Fargo Funds. We appreciate your confidence in us and remain committed to helping you meet your financial needs.
Sincerely,

Andrew Owen
President
Wells Fargo Funds
Although diversification cannot guarantee an investment profit or prevent losses, we believe it can be an effective way to manage investment risk and potentially smooth out overall portfolio performance.
For further information about your Fund, contact your investment professional, visit our website at wellsfargofunds.com, or call us directly at 1-800-222-8222. We are available 24 hours a day, 7 days a week.
| | | | |
| 4 | | Wells Fargo Opportunity Fund | | Performance highlights (unaudited) |
Investment objective
The Fund seeks long-term capital appreciation.
Manager
Wells Fargo Funds Management, LLC
Subadviser
Wells Capital Management Incorporated
Portfolio managers
Christopher G. Miller, CFA®‡
Ann M. Miletti
Average annual total returns (%) as of March 31, 20171
| | | | | | | | | | | | | | | | | | | | | | | | | | | | | | | | | | |
| | | | | Including sales charge | | | Excluding sales charge | | | Expense ratios2 (%) | |
| | | Inception date | | 1 year | | | 5 year | | | 10 year | | | 1 year | | | 5 year | | | 10 year | | | Gross | | | Net3 | |
| Class A (SOPVX) | | 2-24-2000 | | | 9.41 | | | | 9.16 | | | | 5.87 | | | | 16.07 | | | | 10.46 | | | | 6.50 | | | | 1.21 | | | | 1.21 | |
| Class B (SOPBX)* | | 8-26-2011 | | | 10.20 | | | | 9.35 | | | | 5.78 | | | | 15.20 | | | | 9.63 | | | | 5.78 | | | | 1.96 | | | | 1.96 | |
| Class C (WFOPX) | | 3-31-2008 | | | 14.20 | | | | 9.63 | | | | 5.70 | | | | 15.20 | | | | 9.63 | | | | 5.70 | | | | 1.96 | | | | 1.96 | |
| Administrator Class (WOFDX) | | 8-30-2002 | | | – | | | | – | | | | – | | | | 16.34 | | | | 10.71 | | | | 6.74 | | | | 1.13 | | | | 1.00 | |
| Institutional Class (WOFNX) | | 7-30-2010 | | | – | | | | – | | | | – | | | | 16.64 | | | | 10.98 | | | | 6.91 | | | | 0.88 | | | | 0.75 | |
| Russell 3000® Index4 | | – | | | – | | | | – | | | | – | | | | 18.07 | | | | 13.18 | | | | 7.54 | | | | – | | | | – | |
| * | | At the close of business on May 5, 2017, existing Class B shareholders were converted to Class A shareholders. Effective May 6, 2017, Class B shares are no longer offered by the Fund. |
Figures quoted represent past performance, which is no guarantee of future results, and do not reflect taxes that a shareholder may pay on fund distributions or the redemption of fund shares. Investment return and principal value of an investment will fluctuate so that an investor’s shares, when redeemed, may be worth more or less than their original cost. Performance shown without sales charges would be lower if sales charges were reflected. Current performance may be lower or higher than the performance data quoted, which assumes the reinvestment of dividends and capital gains. Current month-end performance is available on the Fund’s website, wellsfargofunds.com.
Index returns do not include transaction costs associated with buying and selling securities, any mutual fund fees or expenses, or any taxes. It is not possible to invest directly in an index.
For Class A shares, the maximum front-end sales charge is 5.75%. For Class B shares, the maximum contingent deferred sales charge is 5.00%. For Class C shares, the maximum contingent deferred sales charge is 1.00%. Performance including a contingent deferred sales charge assumes the sales charge for the corresponding time period. Administrator Class and Institutional Class shares are sold without a front-end sales charge or contingent deferred sales charge.
Stock values fluctuate in response to the activities of individual companies and general market and economic conditions. Smaller-company stocks tend to be more volatile and less liquid than those of larger companies. Certain investment strategies tend to increase the total risk of an investment (relative to the broader market). The Fund is exposed to foreign investment risk. Consult the Fund’s prospectus for additional information on these and other risks.
Please see footnotes on page 5.
| | | | | | |
| Performance highlights (unaudited) | | Wells Fargo Opportunity Fund | | | 5 | |
| | | | |
| Ten largest holdings (%) as of March 31, 20175 | |
Apple Incorporated | | | 3.44 | |
Alphabet Incorporated Class C | | | 2.86 | |
Johnson Controls International plc | | | 2.54 | |
PNC Financial Services Group Incorporated | | | 2.19 | |
Twenty-First Century Fox Incorporated Class B | | | 2.06 | |
Medtronic plc | | | 1.90 | |
Starbucks Corporation | | | 1.89 | |
Bio-Rad Laboratories Incorporated Class A | | | 1.80 | |
Chubb Limited | | | 1.79 | |
Comcast Corporation Class A | | | 1.78 | |
|
| Sector distribution as of March 31, 20176 |
|
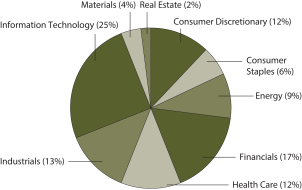
|
| ‡ | Mr. Miller became the portfolio manager of the Fund on March 1, 2017. |
| 1 | Effective June 20, 2008, Advisor Class was renamed Class A and modified to assume the features and attributes of Class A. Historical performance shown for the Class A shares through June 19, 2008, includes the expenses of Advisor Class shares. Historical performance shown for Class B shares prior to their inception reflects the performance of Class C shares. Historical performance shown for Class C shares prior to their inception reflects the performance of Class A shares and has been adjusted to reflect the higher expenses applicable to Class C shares. Historical performance shown for Institutional Class shares prior to their inception reflects the performance of Administrator Class shares, and includes the higher expenses applicable to Administrator Class shares. If these expenses had not been included, returns for Institutional Class shares would be higher. |
| 2 | Reflects the expense ratios as stated in the most recent prospectuses. The expense ratios shown are subject to change and may differ from the annualized expense ratios shown in the financial highlights of this report. |
| 3 | The manager has contractually committed through January 31, 2018, to waive fees and/or reimburse expenses to the extent necessary to cap the Fund’s Total Annual Fund Operating Expenses After Fee Waivers at the amounts shown. After this time, the cap may be increased or the commitment to maintain the cap may be terminated only with the approval of the Board of Trustees. Brokerage commissions, stamp duty fees, interest, taxes, acquired fund fees and expenses, and extraordinary expenses are excluded from the expense cap. Without this cap, the Fund’s returns would have been lower. The expense ratio paid by an investor is the net expense ratio or the Fund’s Total Annual Fund Operating Expenses After Fee Waivers, as stated in the prospectuses. |
| 4 | The Russell 3000® Index measures the performance of the 3,000 largest U.S. companies based on total market capitalization, which represents approximately 98% of the investable U.S. equity market. You cannot invest directly in an index. |
| 5 | The ten largest holdings, excluding cash and cash equivalents, are calculated based on the value of the investments divided by total net assets of the Fund. Holdings are subject to change and may have changed since the date specified. |
| 6 | Amounts are calculated based on the total long-term investments of the Fund. These amounts are subject to change and may have changed since the date specified. |
| | | | |
| 6 | | Wells Fargo Opportunity Fund | | Fund expenses (unaudited) |
As a shareholder of the Fund, you incur two types of costs: (1) transaction costs, including sales charges (loads) on purchase payments and contingent deferred sales charges (if any) on redemptions and (2) ongoing costs, including management fees, distribution (12b-1) and/or shareholder servicing fees, and other Fund expenses. This example is intended to help you understand your ongoing costs (in dollars) of investing in the Fund and to compare these costs with the ongoing costs of investing in other mutual funds.
The example is based on an investment of $1,000 invested at the beginning of the six-month period and held for the entire period from October 1, 2016 to March 31, 2017.
Actual expenses
The “Actual” line of the table below provides information about actual account values and actual expenses. You may use the information in this line, together with the amount you invested, to estimate the expenses that you paid over the period. Simply divide your account value by $1,000 (for example, an $8,600 account value divided by $1,000 = 8.6), then multiply the result by the number in the “Actual” line under the heading entitled “Expenses paid during period” for your applicable class of shares to estimate the expenses you paid on your account during this period.
Hypothetical example for comparison purposes
The “Hypothetical” line of the table below provides information about hypothetical account values and hypothetical expenses based on the Fund’s actual expense ratio and an assumed rate of return of 5% per year before expenses, which is not the Fund’s actual return. The hypothetical account values and expenses may not be used to estimate the actual ending account balance or expenses you paid for the period. You may use this information to compare the ongoing costs of investing in the Fund and other funds. To do so, compare this 5% hypothetical example with the 5% hypothetical examples that appear in the shareholder reports of the other funds.
Please note that the expenses shown in the table are meant to highlight your ongoing costs only and do not reflect any transactional costs, such as sales charges (loads) and contingent deferred sales charges. Therefore, the “Hypothetical” line of the table is useful in comparing ongoing costs only and will not help you determine the relative total costs of owning different funds. In addition, if these transactional costs were included, your costs would have been higher.
| | | | | | | | | | | | | | | | |
| | | Beginning
account value
10-1-2016 | | | Ending
account value
3-31-2017 | | | Expenses
paid during
the period¹ | | | Annualized net
expense ratio | |
Class A | | | | | | | | | | | | | | | | |
Actual | | $ | 1,000.00 | | | $ | 1,092.75 | | | $ | 6.31 | | | | 1.21 | % |
Hypothetical (5% return before expenses) | | $ | 1,000.00 | | | $ | 1,018.90 | | | $ | 6.09 | | | | 1.21 | % |
Class B | | | | | | | | | | | | | | | | |
Actual | | $ | 1,000.00 | | | $ | 1,088.64 | | | $ | 10.21 | | | | 1.96 | % |
Hypothetical (5% return before expenses) | | $ | 1,000.00 | | | $ | 1,015.16 | | | $ | 9.85 | | | | 1.96 | % |
Class C | | | | | | | | | | | | | | | | |
Actual | | $ | 1,000.00 | | | $ | 1,088.58 | | | $ | 10.21 | | | | 1.96 | % |
Hypothetical (5% return before expenses) | | $ | 1,000.00 | | | $ | 1,015.16 | | | $ | 9.85 | | | | 1.96 | % |
Administrator Class | | | | | | | | | | | | | | | | |
Actual | | $ | 1,000.00 | | | $ | 1,093.99 | | | $ | 5.22 | | | | 1.00 | % |
Hypothetical (5% return before expenses) | | $ | 1,000.00 | | | $ | 1,019.95 | | | $ | 5.04 | | | | 1.00 | % |
Institutional Class | | | | | | | | | | | | | | | | |
Actual | | $ | 1,000.00 | | | $ | 1,095.29 | | | $ | 3.92 | | | | 0.75 | % |
Hypothetical (5% return before expenses) | | $ | 1,000.00 | | | $ | 1,021.19 | | | $ | 3.78 | | | | 0.75 | % |
| 1 | Expenses paid is equal to the annualized net expense ratio of each class multiplied by the average account value over the period, multiplied by the number of days in the most recent fiscal half-year divided by the number of days in the fiscal year (to reflect the one-half-year period). |
| | | | | | |
| Portfolio of investments—March 31, 2017 (unaudited) | | Wells Fargo Opportunity Fund | | | 7 | |
| | | | | | | | | | | | | | | | |
| Security name | | | | | | | | Shares | | | Value | |
| | | | |
Common Stocks: 99.28% | | | | | | | | | | | | | | | | |
| | | | |
Consumer Discretionary: 11.72% | | | | | | | | | | | | | | | | |
| | | | |
| Hotels, Restaurants & Leisure: 2.96% | | | | | | | | | | | | | | | | |
Royal Caribbean Cruises Limited | | | | | | | | | | | 190,605 | | | $ | 18,700,256 | |
Starbucks Corporation | | | | | | | | | | | 565,826 | | | | 33,038,580 | |
| | | | |
| | | | | | | | | | | | | | | 51,738,836 | |
| | | | | | | | | | | | | | | | |
| | | | |
| Media: 3.85% | | | | | | | | | | | | | | | | |
Comcast Corporation Class A | | | | | | | | | | | 828,906 | | | | 31,158,577 | |
Twenty-First Century Fox Incorporated Class B | | | | | | | | | | | 1,135,615 | | | | 36,089,845 | |
| | | | |
| | | | | | | | | | | | | | | 67,248,422 | |
| | | | | | | | | | | | | | | | |
| | | | |
| Multiline Retail: 2.64% | | | | | | | | | | | | | | | | |
Dollar General Corporation | | | | | | | | | | | 362,565 | | | | 25,281,657 | |
Target Corporation | | | | | | | | | | | 378,113 | | | | 20,868,056 | |
| | | | |
| | | | | | | | | | | | | | | 46,149,713 | |
| | | | | | | | | | | | | | | | |
| | | | |
| Specialty Retail: 2.27% | | | | | | | | | | | | | | | | |
L Brands Incorporated | | | | | | | | | | | 295,274 | | | | 13,907,405 | |
Lowe’s Companies Incorporated | | | | | | | | | | | 313,832 | | | | 25,800,129 | |
| | | | |
| | | | | | | | | | | | | | | 39,707,534 | |
| | | | | | | | | | | | | | | | |
| | | | |
Consumer Staples: 6.36% | | | | | | | | | | | | | | | | |
| | | | |
| Food & Staples Retailing: 1.43% | | | | | | | | | | | | | | | | |
The Kroger Company | | | | | | | | | | | 851,608 | | | | 25,113,920 | |
| | | | | | | | | | | | | | | | |
| | | | |
| Food Products: 2.39% | | | | | | | | | | | | | | | | |
Mead Johnson Nutrition Company | | | | | | | | | | | 229,987 | | | | 20,487,242 | |
The Hershey Company | | | | | | | | | | | 194,383 | | | | 21,236,343 | |
| | | | |
| | | | | | | | | | | | | | | 41,723,585 | |
| | | | | | | | | | | | | | | | |
| | | | |
| Household Products: 1.11% | | | | | | | | | | | | | | | | |
Church & Dwight Company Incorporated | | | | | | | | | | | 389,295 | | | | 19,414,142 | |
| | | | | | | | | | | | | | | | |
| | | | |
| Personal Products: 1.43% | | | | | | | | | | | | | | | | |
The Estee Lauder Companies Incorporated Class A | | | | | | | | | | | 294,473 | | | | 24,968,366 | |
| | | | | | | | | | | | | | | | |
| | | | |
Energy: 8.37% | | | | | | | | | | | | | | | | |
| | | | |
| Energy Equipment & Services: 1.95% | | | | | | | | | | | | | | | | |
Halliburton Company | | | | | | | | | | | 380,673 | | | | 18,732,918 | |
Weatherford International plc Ǡ | | | | | | | | | | | 2,309,351 | | | | 15,357,184 | |
| | | | |
| | | | | | | | | | | | | | | 34,090,102 | |
| | | | | | | | | | | | | | | | |
| | | | |
| Oil, Gas & Consumable Fuels: 6.42% | | | | | | | | | | | | | | | | |
Concho Resources Incorporated † | | | | | | | | | | | 118,112 | | | | 15,158,494 | |
EOG Resources Incorporated | | | | | | | | | | | 284,897 | | | | 27,791,702 | |
Newfield Exploration Company † | | | | | | | | | | | 415,419 | | | | 15,333,115 | |
Pioneer Natural Resources Company | | | | | | | | | | | 113,372 | | | | 21,113,268 | |
Range Resources Corporation | | | | | | | | | | | 384,149 | | | | 11,178,736 | |
RSP Permian Incorporated † | | | | | | | | | | | 523,216 | | | | 21,676,839 | |
| | | | |
| | | | | | | | | | | | | | | 112,252,154 | |
| | | | | | | | | | | | | | | | |
The accompanying notes are an integral part of these financial statements.
| | | | |
| 8 | | Wells Fargo Opportunity Fund | | Portfolio of investments—March 31, 2017 (unaudited) |
| | | | | | | | | | | | | | | | |
| Security name | | | | | | | | Shares | | | Value | |
| | | | |
Financials: 16.55% | | | | | | | | | | | | | | | | |
| | | | |
| Banks: 6.82% | | | | | | | | | | | | | | | | |
Bank of the Ozarks Incorporated | | | | | | | | | | | 488,660 | | | $ | 25,415,207 | |
KeyCorp | | | | | | | | | | | 1,409,445 | | | | 25,059,932 | |
PNC Financial Services Group Incorporated | | | | | | | | | | | 318,312 | | | | 38,273,835 | |
Webster Financial Corporation | | | | | | | | | | | 609,616 | | | | 30,505,185 | |
| | | | |
| | | | | | | | | | | | | | | 119,254,159 | |
| | | | | | | | | | | | | | | | |
| | | | |
| Capital Markets: 2.28% | | | | | | | | | | | | | | | | |
E*TRADE Financial Corporation † | | | | | | | | | | | 636,341 | | | | 22,201,937 | |
TD Ameritrade Holding Corporation | | | | | | | | | | | 456,075 | | | | 17,723,075 | |
| | | | |
| | | | | | | | | | | | | | | 39,925,012 | |
| | | | | | | | | | | | | | | | |
| | | | |
| Insurance: 7.45% | | | | | | | | | | | | | | | | |
American International Group Incorporated | | | | | | | | | | | 419,901 | | | | 26,214,419 | |
Aon plc | | | | | | | | | | | 235,762 | | | | 27,982,592 | |
Chubb Limited | | | | | | | | | | | 229,332 | | | | 31,246,485 | |
The Progressive Corporation | | | | | | | | | | | 583,202 | | | | 22,849,854 | |
Willis Towers Watson plc | | | | | | | | | | | 167,581 | | | | 21,934,677 | |
| | | | |
| | | | | | | | | | | | | | | 130,228,027 | |
| | | | | | | | | | | | | | | | |
| | | | |
Health Care: 12.00% | | | | | | | | | | | | | | | | |
| | | | |
| Biotechnology: 0.54% | | | | | | | | | | | | | | | | |
Alexion Pharmaceuticals Incorporated † | | | | | | | | | | | 77,241 | | | | 9,364,699 | |
| | | | | | | | | | | | | | | | |
| | | | |
| Health Care Equipment & Supplies: 2.72% | | | | | | | | | | | | | | | | |
Medtronic plc | | | | | | | | | | | 413,060 | | | | 33,276,114 | |
Zimmer Biomet Holdings Incorporated | | | | | | | | | | | 116,914 | | | | 14,276,369 | |
| | | | |
| | | | | | | | | | | | | | | 47,552,483 | |
| | | | | | | | | | | | | | | | |
| | | | |
| Health Care Providers & Services: 1.29% | | | | | | | | | | | | | | | | |
Cigna Corporation | | | | | | | | | | | 153,532 | | | | 22,490,903 | |
| | | | | | | | | | | | | | | | |
| | | | |
| Life Sciences Tools & Services: 4.52% | | | | | | | | | | | | | | | | |
Agilent Technologies Incorporated | | | | | | | | | | | 431,429 | | | | 22,809,651 | |
Bio-Rad Laboratories Incorporated Class A † | | | | | | | | | | | 158,287 | | | | 31,552,931 | |
Thermo Fisher Scientific Incorporated | | | | | | | | | | | 160,522 | | | | 24,656,179 | |
| | | | |
| | | | | | | | | | | | | | | 79,018,761 | |
| | | | | | | | | | | | | | | | |
| | | | |
| Pharmaceuticals: 2.93% | | | | | | | | | | | | | | | | |
Merck & Company Incorporated | | | | | | | | | | | 397,540 | | | | 25,259,692 | |
Novartis AG ADR | | | | | | | | | | | 350,227 | | | | 26,011,359 | |
| | | | |
| | | | | | | | | | | | | | | 51,271,051 | |
| | | | | | | | | | | | | | | | |
| | | | |
Industrials: 13.35% | | | | | | | | | | | | | | | | |
| | | | |
| Aerospace & Defense: 2.63% | | | | | | | | | | | | | | | | |
Lockheed Martin Corporation | | | | | | | | | | | 88,698 | | | | 23,735,585 | |
Rockwell Collins Incorporated | | | | | | | | | | | 229,276 | | | | 22,276,456 | |
| | | | |
| | | | | | | | | | | | | | | 46,012,041 | |
| | | | | | | | | | | | | | | | |
The accompanying notes are an integral part of these financial statements.
| | | | | | |
| Portfolio of investments—March 31, 2017 (unaudited) | | Wells Fargo Opportunity Fund | | | 9 | |
| | | | | | | | | | | | | | | | |
| Security name | | | | | | | | Shares | | | Value | |
| | | | |
| Airlines: 1.18% | | | | | | | | | | | | | | | | |
United Continental Holdings Incorporated † | | | | | | | | | | | 292,508 | | | $ | 20,662,765 | |
| | | | | | | | | | | | | | | | |
| | | | |
| Building Products: 2.54% | | | | | | | | | | | | | | | | |
Johnson Controls International plc | | | | | | | | | | | 1,052,279 | | | | 44,321,991 | |
| | | | | | | | | | | | | | | | |
| | | | |
| Commercial Services & Supplies: 1.34% | | | | | | | | | | | | | | | | |
Republic Services Incorporated | | | | | | | | | | | 372,494 | | | | 23,396,348 | |
| | | | | | | | | | | | | | | | |
| | | | |
| Electrical Equipment: 2.06% | | | | | | | | | | | | | | | | |
Babcock & Wilcox Enterprises Incorporated † | | | | | | | | | | | 522,602 | | | | 4,881,103 | |
Eaton Corporation plc | | | | | | | | | | | 419,321 | | | | 31,092,652 | |
| | | | |
| | | | | | | | | | | | | | | 35,973,755 | |
| | | | | | | | | | | | | | | | |
| | | | |
| Machinery: 1.34% | | | | | | | | | | | | | | | | |
Colfax Corporation † | | | | | | | | | | | 596,381 | | | | 23,413,918 | |
| | | | | | | | | | | | | | | | |
| | | | |
| Road & Rail: 2.26% | | | | | | | | | | | | | | | | |
Canadian Pacific Railway Limited | | | | | | | | | | | 67,457 | | | | 9,910,782 | |
Hertz Global Holdings Incorporated « | | | | | | | | | | | 553,069 | | | | 9,700,830 | |
J.B. Hunt Transport Services Incorporated | | | | | | | | | | | 217,065 | | | | 19,913,543 | |
| | | | |
| | | | | | | | | | | | | | | 39,525,155 | |
| | | | | | | | | | | | | | | | |
| | | | |
Information Technology: 25.16% | | | | | | | | | | | | | | | | |
| | | | |
| Electronic Equipment, Instruments & Components: 3.05% | | | | | | | | | | | | | | | | |
Amphenol Corporation Class A | | | | | | | | | | | 329,834 | | | | 23,474,286 | |
TE Connectivity Limited | | | | | | | | | | | 400,997 | | | | 29,894,326 | |
| | | | |
| | | | | | | | | | | | | | | 53,368,612 | |
| | | | | | | | | | | | | | | | |
| | | | |
| Internet Software & Services: 4.36% | | | | | | | | | | | | | | | | |
Alphabet Incorporated Class C † | | | | | | | | | | | 60,339 | | | | 50,054,821 | |
Facebook Incorporated Class A † | | | | | | | | | | | 184,705 | | | | 26,237,345 | |
| | | | |
| | | | | | | | | | | | | | | 76,292,166 | |
| | | | | | | | | | | | | | | | |
| | | | |
| IT Services: 4.77% | | | | | | | | | | | | | | | | |
Alliance Data Systems Corporation | | | | | | | | | | | 100,516 | | | | 25,028,484 | |
Fidelity National Information Services Incorporated | | | | | | | | | | | 342,274 | | | | 27,251,856 | |
MasterCard Incorporated Class A | | | | | | | | | | | 276,236 | | | | 31,068,263 | |
| | | | |
| | | | | | | | | | | | | | | 83,348,603 | |
| | | | | | | | | | | | | | | | |
| | | | |
| Semiconductors & Semiconductor Equipment: 3.16% | | | | | | | | | | | | | | | | |
Broadcom Limited | | | | | | | | | | | 134,383 | | | | 29,424,502 | |
Texas Instruments Incorporated | | | | | | | | | | | 320,425 | | | | 25,813,438 | |
| | | | |
| | | | | | | | | | | | | | | 55,237,940 | |
| | | | | | | | | | | | | | | | |
| | | | |
| Software: 6.38% | | | | | | | | | | | | | | | | |
Check Point Software Technologies Limited † | | | | | | | | | | | 236,212 | | | | 24,249,524 | |
Oracle Corporation | | | | | | | | | | | 589,126 | | | | 26,280,911 | |
Red Hat Incorporated † | | | | | | | | | | | 356,962 | | | | 30,877,213 | |
Salesforce.com Incorporated † | | | | | | | | | | | 365,323 | | | | 30,135,494 | |
| | | | |
| | | | | | | | | | | | | | | 111,543,142 | |
| | | | | | | | | | | | | | | | |
The accompanying notes are an integral part of these financial statements.
| | | | |
| 10 | | Wells Fargo Opportunity Fund | | Portfolio of investments—March 31, 2017 (unaudited) |
| | | | | | | | | | | | | | | | |
| Security name | | | | | | | | Shares | | | Value | |
| | | | |
| Technology Hardware, Storage & Peripherals: 3.44% | | | | | | | | | | | | | | | | |
Apple Incorporated | | | | | | | | | | | 418,097 | | | $ | 60,063,815 | |
| | | | | | | | | | | | | | | | |
| | | | |
Materials: 4.12% | | | | | | | | | | | | | | | | |
| | | | |
| Chemicals: 1.71% | | | | | | | | | | | | | | | | |
The Sherwin-Williams Company | | | | | | | | | | | 96,204 | | | | 29,841,519 | |
| | | | | | | | | | | | | | | | |
| | | | |
| Containers & Packaging: 1.20% | | | | | | | | | | | | | | | | |
Crown Holdings Incorporated † | | | | | | | | | | | 395,052 | | | | 20,918,003 | |
| | | | | | | | | | | | | | | | |
| | | | |
| Metals & Mining: 1.21% | | | | | | | | | | | | | | | | |
Steel Dynamics Incorporated | | | | | | | | | | | 609,715 | | | | 21,193,693 | |
| | | | | | | | | | | | | | | | |
| | | | |
Real Estate: 1.65% | | | | | | | | | | | | | | | | |
| | | | |
| Equity REITs: 1.65% | | | | | | | | | | | | | | | | |
American Tower Corporation | | | | | | | | | | | 237,931 | | | | 28,918,134 | |
| | | | | | | | | | | | | | | | |
| | | | |
Total Common Stocks (Cost $1,270,872,583) | | | | | | | | | | | | | | | 1,735,543,469 | |
| | | | | | | | | | | | | | | | |
| | | | |
| | | Yield | | | | | | | | | | |
| Short-Term Investments: 2.04% | | | | | | | | | | | | | | | | |
| | | | |
| Investment Companies: 2.04% | | | | | | | | | | | | | | | | |
Securities Lending Cash Investment LLC (l)(r)(u) | | | 0.98 | % | | | | | | | 21,373,763 | | | | 21,375,900 | |
Wells Fargo Government Money Market Fund Select Class (l)(u) | | | 0.63 | | | | | | | | 14,193,391 | | | | 14,193,391 | |
| | | | |
Total Short-Term Investments (Cost $35,569,291) | | | | | | | | | | | | | | | 35,569,291 | |
| | | | | | | | | | | | | | | | |
| | | | | | | | |
| Total investments in securities (Cost $1,306,441,874) * | | | 101.32 | % | | | 1,771,112,760 | |
Other assets and liabilities, net | | | (1.32 | ) | | | (23,011,107 | ) |
| | | | | | | | |
| Total net assets | | | 100.00 | % | | $ | 1,748,101,653 | |
| | | | | | | | |
| « | All or a portion of this security is on loan. |
| † | Non-income-earning security |
| (l) | The issuer of the security is an affiliated person of the Fund as defined in the Investment Company Act of 1940. |
| (r) | The investment is a non-registered investment vehicle purchased with cash collateral received from securities on loan. |
| (u) | The rate represents the 7-day annualized yield at period end. |
| * | Cost for federal income tax purposes is $1,304,266,198 and unrealized gains (losses) consists of: |
| | | | |
Gross unrealized gains | | $ | 494,054,480 | |
Gross unrealized losses | | | (27,207,918 | ) |
| | | | |
Net unrealized gains | | $ | 466,846,562 | |
The accompanying notes are an integral part of these financial statements.
| | | | | | |
| Statement of assets and liabilities—March 31, 2017 (unaudited) | | Wells Fargo Opportunity Fund | | | 11 | |
| | | | |
| | | | |
| |
Assets | | | | |
Investments | | | | |
In unaffiliated securities (including $20,878,740 of securities loaned), at value (cost $1,270,872,583) | | $ | 1,735,543,469 | |
In affiliated securities, at value (cost $35,569,291) | | | 35,569,291 | |
| | | | |
Total investments, at value (cost $1,306,441,874) | | | 1,771,112,760 | |
Receivable for investments sold | | | 4,437,162 | |
Receivable for Fund shares sold | | | 249,883 | |
Receivable for dividends | | | 2,778,395 | |
Receivable for securities lending income | | | 3,631 | |
Prepaid expenses and other assets | | | 54,482 | |
| | | | |
Total assets | | | 1,778,636,313 | |
| | | | |
| |
Liabilities | | | | |
Payable for investments purchased | | | 5,799,676 | |
Payable for Fund shares redeemed | | | 1,262,983 | |
Payable upon receipt of securities loaned | | | 21,375,900 | |
Management fee payable | | | 1,115,217 | |
Distribution fees payable | | | 24,216 | |
Administration fees payable | | | 314,553 | |
Accrued expenses and other liabilities | | | 642,115 | |
| | | | |
Total liabilities | | | 30,534,660 | |
| | | | |
Total net assets | | $ | 1,748,101,653 | |
| | | | |
| |
NET ASSETS CONSIST OF | | | | |
Paid-in capital | | $ | 1,174,440,443 | |
Undistributed net investment income | | | 7,059,149 | |
Accumulated net realized gains on investments | | | 101,931,055 | |
Net unrealized gains on investments | | | 464,671,006 | |
| | | | |
Total net assets | | $ | 1,748,101,653 | |
| | | | |
| |
COMPUTATION OF NET ASSET VALUE AND OFFERING PRICE PER SHARE | | | | |
Net assets - Class A | | $ | 1,453,561,023 | |
Shares outstanding - Class A1 | | | 33,809,265 | |
Net asset value per share - Class A | | | $42.99 | |
Maximum offering price per share - Class A2 | | | $45.61 | |
Net assets - Class B | | $ | 521,369 | |
Shares outstanding - Class B1 | | | 12,673 | |
Net asset value per share - Class B | | | $41.14 | |
Net assets - Class C | | $ | 34,921,350 | |
Shares outstanding - Class C1 | | | 853,341 | |
Net asset value per share - Class C | | | $40.92 | |
Net assets - Administrator Class | | $ | 230,286,518 | |
Shares outstanding - Administrator Class1 | | | 4,969,969 | |
Net asset value per share - Administrator Class | | | $46.34 | |
Net assets - Institutional Class | | $ | 28,811,393 | |
Shares outstanding - Institutional Class1 | | | 611,998 | |
Net asset value per share - Institutional Class | | | $47.08 | |
| 1 | The Fund has an unlimited number of authorized shares. |
| 2 | Maximum offering price is computed as 100/94.25 of net asset value. On investments of $50,000 or more, the offering price is reduced. |
The accompanying notes are an integral part of these financial statements.
| | | | |
| 12 | | Wells Fargo Opportunity Fund | | Statement of operations—six months ended March 31, 2017 (unaudited) |
| | | | |
| | | | |
| |
Investment income | | | | |
Dividends (net of foreign withholding taxes of $141,500) | | $ | 17,294,482 | |
Securities lending income, net | | | 54,881 | |
Income from affiliated securities | | | 42,635 | |
| | | | |
Total investment income | | | 17,391,998 | |
| | | | |
| |
Expenses | | | | |
Management fee | | | 6,205,115 | |
Administration fees | | | | |
Class A | | | 1,506,635 | |
Class B | | | 1,120 | |
Class C | | | 36,367 | |
Administrator Class | | | 147,848 | |
Institutional Class | | | 13,920 | |
Shareholder servicing fees | | | | |
Class A | | | 1,793,613 | |
Class B | | | 1,333 | |
Class C | | | 43,294 | |
Administrator Class | | | 284,324 | |
Distribution fees | | | | |
Class B | | | 3,999 | |
Class C | | | 129,881 | |
Custody and accounting fees | | | 46,991 | |
Professional fees | | | 25,839 | |
Registration fees | | | 44,727 | |
Shareholder report expenses | | | 78,424 | |
Trustees’ fees and expenses | | | 8,141 | |
Other fees and expenses | | | 17,061 | |
| | | | |
Total expenses | | | 10,388,632 | |
Less: Fee waivers and/or expense reimbursements | | | (158,742 | ) |
| | | | |
Net expenses | | | 10,229,890 | |
| | | | |
Net investment income | | | 7,162,108 | |
| | | | |
| |
REALIZED AND UNREALIZED GAINS (LOSSES) ON INVESTMENTS | | | | |
| |
Net realized gains on: | | | | |
Unaffiliated securities | | | 105,904,390 | |
Affiliated securities | | | 1,643 | |
| | | | |
Net realized gains on investments | | | 105,906,033 | |
Net change in unrealized gains (losses) on investments | | | 39,736,472 | |
| | | | |
Net realized and unrealized gains (losses) on investments | | | 145,642,505 | |
| | | | |
Net increase in net assets resulting from operations | | $ | 152,804,613 | |
| | | | |
The accompanying notes are an integral part of these financial statements.
| | | | | | |
| Statement of changes in net assets | | Wells Fargo Opportunity Fund | | | 13 | |
| | | | | | | | | | | | | | | | |
| | | Six months ended
March 31, 2017 (unaudited) | | | Year ended
September 30, 2016 | |
| | | | |
Operations | | | | | | | | | | | | | | | | |
Net investment income | | | | | | $ | 7,162,108 | | | | | | | $ | 6,138,111 | |
Net realized gains on investments | | | | | | | 105,906,033 | | | | | | | | 105,020,650 | |
Net change in unrealized gains (losses) on investments | | | | | | | 39,736,472 | | | | | | | | 87,822,225 | |
| | | | |
Net increase in net assets resulting from operations | | | | | | | 152,804,613 | | | | | | | | 198,980,986 | |
| | | | |
| | | | |
Distributions to shareholders from | | | | | | | | | | | | | | | | |
Net investment income | | | | | | | | | | | | | | | | |
Class A | | | | | | | (4,495,053 | ) | | | | | | | (20,934,141 | ) |
Class C | | | | | | | 0 | | | | | | | | (189,287 | ) |
Administrator Class | | | | | | | (942,123 | ) | | | | | | | (3,656,721 | ) |
Institutional Class | | | | | | | (123,346 | ) | | | | | | | (234,706 | ) |
Net realized gains | | | | | | | | | | | | | | | | |
Class A | | | | | | | (83,846,276 | ) | | | | | | | (185,395,064 | ) |
Class B | | | | | | | (69,785 | ) | | | | | | | (425,984 | ) |
Class C | | | | | | | (2,126,589 | ) | | | | | | | (4,995,377 | ) |
Administrator Class | | | | | | | (12,365,471 | ) | | | | | | | (27,497,135 | ) |
Institutional Class | | | | | | | (1,124,308 | ) | | | | | | | (1,456,485 | ) |
| | | | |
Total distributions to shareholders | | | | | | | (105,092,951 | ) | | | | | | | (244,784,900 | ) |
| | | | |
| | | | |
Capital share transactions | | | Shares | | | | | | | | Shares | | | | | |
Proceeds from shares sold | | | | | | | | | | | | | | | | |
Class A | | | 242,606 | | | | 10,251,117 | | | | 24,061,660 | | | | 1,119,678,940 | |
Class B | | | 104 | | | | 4,292 | | | | 2 | | | | 80 | |
Class C | | | 12,961 | | | | 530,582 | | | | 13,720 | | | | 517,107 | |
Administrator Class | | | 52,522 | | | | 2,407,708 | | | | 129,304 | | | | 5,492,475 | |
Institutional Class | | | 308,651 | | | | 14,476,197 | | | | 198,222 | | | | 8,697,552 | |
Investor Class | | | N/A | | | | N/A | | | | 14,679 | 1 | | | 683,049 | 1 |
| | | | |
| | | | | | | 27,669,896 | | | | | | | | 1,135,069,203 | |
| | | | |
Reinvestment of distributions | | | | | | | | | | | | | | | | |
Class A | | | 2,058,839 | | | | 86,052,018 | | | | 5,133,573 | | | | 200,595,023 | |
Class B | | | 1,720 | | | | 68,785 | | | | 11,360 | | | | 422,382 | |
Class C | | | 49,931 | | | | 1,986,269 | | | | 129,505 | | | | 4,817,319 | |
Administrator Class | | | 278,197 | | | | 12,532,938 | | | | 701,312 | | | | 29,406,409 | |
Institutional Class | | | 24,783 | | | | 1,134,964 | | | | 33,469 | | | | 1,426,272 | |
| | | | |
| | | | | | | 101,774,974 | | | | | | | | 236,667,405 | |
| | | | |
Payment for shares redeemed | | | | | | | | | | | | | | | | |
Class A | | | (2,379,925 | ) | | | (100,531,858 | ) | | | (4,306,621 | ) | | | (173,325,216 | ) |
Class B | | | (31,827 | ) | | | (1,288,819 | ) | | | (54,234 | ) | | | (2,123,946 | ) |
Class C | | | (77,816 | ) | | | (3,125,974 | ) | | | (169,002 | ) | | | (6,566,702 | ) |
Administrator Class | | | (394,028 | ) | | | (17,957,740 | ) | | | (640,144 | ) | | | (27,663,783 | ) |
Institutional Class | | | (98,873 | ) | | | (4,562,987 | ) | | | (108,868 | ) | | | (4,765,522 | ) |
Investor Class | | | N/A | | | | N/A | | | | (23,333,080 | )1 | | | (1,113,901,150 | )1 |
| | | | |
| | | | | | | (127,467,378 | ) | | | | | | | (1,328,346,319 | ) |
| | | | |
Net increase in net assets resulting from capital share transactions | | | | | | | 1,977,492 | | | | | | | | 43,390,289 | |
| | | | |
Total increase (decrease) in net assets | | | | | | | 49,689,154 | | | | | | | | (2,413,625 | ) |
| | | | |
| | | | |
Net assets | | | | | | | | | | | | | | | | |
Beginning of period | | | | | | | 1,698,412,499 | | | | | | | | 1,700,826,124 | |
| | | | |
End of period | | | | | | $ | 1,748,101,653 | | | | | | | $ | 1,698,412,499 | |
| | | | |
Undistributed net investment income | | | | | | $ | 7,059,149 | | | | | | | $ | 5,457,563 | |
| | | | |
| 1 | For the period from October 1, 2015 to October 23, 2015. Effective at the close of business on October 23, 2015, Investor Class shares were converted to Class A shares and are no longer offered by the Fund. |
The accompanying notes are an integral part of these financial statements.
| | | | |
| 14 | | Wells Fargo Opportunity Fund | | Financial highlights |
(For a share outstanding throughout each period)
| | | | | | | | | | | | | | | | | | | | | | | | |
| | | Six months ended
March 31, 2017 (unaudited) | | | Year ended September 30 | |
| CLASS A | | | 2016 | | | 2015 | | | 2014 | | | 2013 | | | 2012 | |
Net asset value, beginning of period | | | $41.86 | | | | $43.35 | | | | $49.56 | | | | $46.23 | | | | $38.99 | | | | $32.08 | |
Net investment income (loss) | | | 0.17 | | | | 0.13 | 1 | | | 0.64 | | | | (0.07 | ) | | | (0.04 | ) | | | (0.03 | ) |
Net realized and unrealized gains (losses) on investments | | | 3.63 | | | | 4.72 | | | | (1.52 | ) | | | 6.46 | | | | 8.80 | | | | 6.94 | |
| | | | | | | | | | | | | | | | | | | | | | | | |
Total from investment operations | | | 3.80 | | | | 4.85 | | | | (0.88 | ) | | | 6.39 | | | | 8.76 | | | | 6.91 | |
Distributions to shareholders from | | | | | | | | | | | | | | | | | | | | | | | | |
Net investment income | | | (0.13 | ) | | | (0.57 | ) | | | 0.00 | | | | 0.00 | | | | 0.00 | | | | 0.00 | |
Net realized gains | | | (2.54 | ) | | | (5.77 | ) | | | (5.33 | ) | | | (3.06 | ) | | | (1.52 | ) | | | 0.00 | |
| | | | | | | | | | | | | | | | | | | | | | | | |
Total distributions to shareholders | | | (2.67 | ) | | | (6.34 | ) | | | (5.33 | ) | | | (3.06 | ) | | | (1.52 | ) | | | 0.00 | |
Net asset value, end of period | | | $42.99 | | | | $41.86 | | | | $43.35 | | | | $49.56 | | | | $46.23 | | | | $38.99 | |
Total return2 | | | 9.28 | % | | | 12.46 | % | | | (2.27 | )% | | | 14.35 | % | | | 23.31 | % | | | 21.54 | % |
Ratios to average net assets (annualized) | | | | | | | | | | | | | | | | | | | | | | | | |
Gross expenses | | | 1.21 | % | | | 1.21 | % | | | 1.24 | % | | | 1.26 | % | | | 1.26 | % | | | 1.25 | % |
Net expenses | | | 1.21 | % | | | 1.21 | % | | | 1.22 | % | | | 1.22 | % | | | 1.23 | % | | | 1.25 | % |
Net investment income (loss) | | | 0.82 | % | | | 0.33 | % | | | 1.30 | % | | | (0.13 | )% | | | (0.08 | )% | | | (0.08 | )% |
Supplemental data | | | | | | | | | | | | | | | | | | | | | | | | |
Portfolio turnover rate | | | 33 | % | | | 34 | % | | | 42 | % | | | 32 | % | | | 26 | % | | | 41 | % |
Net assets, end of period (000s omitted) | | | $1,453,561 | | | | $1,418,614 | | | | $390,154 | | | | $442,840 | | | | $431,201 | | | | $399,828 | |
| 1 | Calculated based upon average shares outstanding |
| 2 | Total return calculations do not include any sales charges. Returns for periods of less than one year are not annualized. |
The accompanying notes are an integral part of these financial statements.
| | | | | | |
| Financial highlights | | Wells Fargo Opportunity Fund | | | 15 | |
(For a share outstanding throughout each period)
| | | | | | | | | | | | | | | | | | | | | | | | |
| | | Six months ended
March 31, 2017 (unaudited) | | | Year ended September 30 | |
| CLASS B | | | 2016 | | | 2015 | | | 2014 | | | 2013 | | | 2012 | |
Net asset value, beginning of period | | | $40.19 | | | | $41.60 | | | | $48.09 | | | | $45.27 | | | | $38.49 | | | | $31.91 | |
Net investment income (loss) | | | 0.06 | 1 | | | (0.14 | )1 | | | 0.30 | 1 | | | (0.43 | )1 | | | (0.35 | )1 | | | (0.31 | )1 |
Net realized and unrealized gains (losses) on investments | | | 3.43 | | | | 4.50 | | | | (1.46 | ) | | | 6.31 | | | | 8.65 | | | | 6.89 | |
| | | | | | | | | | | | | | | | | | | | | | | | |
Total from investment operations | | | 3.49 | | | | 4.36 | | | | (1.16 | ) | | | 5.88 | | | | 8.30 | | | | 6.58 | |
Distributions to shareholders from | | | | | | | | | | | | | | | | | | | | | | | | |
Net realized gains | | | (2.54 | ) | | | (5.77 | ) | | | (5.33 | ) | | | (3.06 | ) | | | (1.52 | ) | | | 0.00 | |
Net asset value, end of period | | | $41.14 | | | | $40.19 | | | | $41.60 | | | | $48.09 | | | | $45.27 | | | | $38.49 | |
Total return2 | | | 8.86 | % | | | 11.61 | % | | | (2.98 | )% | | | 13.48 | % | | | 22.39 | % | | | 20.62 | % |
Ratios to average net assets (annualized) | | | | | | | | | | | | | | | | | | | | | | | | |
Gross expenses | | | 1.96 | % | | | 1.95 | % | | | 1.99 | % | | | 2.01 | % | | | 2.01 | % | | | 2.00 | % |
Net expenses | | | 1.96 | % | | | 1.95 | % | | | 1.97 | % | | | 1.97 | % | | | 1.98 | % | | | 2.00 | % |
Net investment income (loss) | | | 0.28 | % | | | (0.36 | )% | | | 0.64 | % | | | (0.90 | )% | | | (0.83 | )% | | | (0.83 | )% |
Supplemental data | | | | | | | | | | | | | | | | | | | | | | | | |
Portfolio turnover rate | | | 33 | % | | | 34 | % | | | 42 | % | | | 32 | % | | | 26 | % | | | 41 | % |
Net assets, end of period (000s omitted) | | | $521 | | | | $1,715 | | | | $3,559 | | | | $6,316 | | | | $9,020 | | | | $11,743 | |
| 1 | Calculated based upon average shares outstanding |
| 2 | Total return calculations do not include any sales charges. Returns for periods of less than one year are not annualized. |
The accompanying notes are an integral part of these financial statements.
| | | | |
| 16 | | Wells Fargo Opportunity Fund | | Financial highlights |
(For a share outstanding throughout each period)
| | | | | | | | | | | | | | | | | | | | | | | | |
| | | Six months ended
March 31, 2017 (unaudited) | | | Year ended September 30 | |
| CLASS C | | | 2016 | | | 2015 | | | 2014 | | | 2013 | | | 2012 | |
Net asset value, beginning of period | | | $39.99 | | | | $41.60 | | | | $48.10 | | | | $45.27 | | | | $38.49 | | | | $31.91 | |
Net investment income (loss) | | | 0.01 | 1 | | | (0.16 | )1 | | | 0.26 | | | | (0.42 | )1 | | | (0.35 | )1 | | | (0.31 | )1 |
Net realized and unrealized gains (losses) on investments | | | 3.46 | | | | 4.51 | | | | (1.43 | ) | | | 6.31 | | | | 8.65 | | | | 6.89 | |
| | | | | | | | | | | | | | | | | | | | | | | | |
Total from investment operations | | | 3.47 | | | | 4.35 | | | | (1.17 | ) | | | 5.89 | | | | 8.30 | | | | 6.58 | |
Distributions to shareholders from | | | | | | | | | | | | | | | | | | | | | | | | |
Net investment income | | | 0.00 | | | | (0.19 | ) | | | 0.00 | | | | 0.00 | | | | 0.00 | | | | 0.00 | |
Net realized gains | | | (2.54 | ) | | | (5.77 | ) | | | (5.33 | ) | | | (3.06 | ) | | | (1.52 | ) | | | 0.00 | |
| | | | | | | | | | | | | | | | | | | | | | | | |
Total distributions to shareholders | | | (2.54 | ) | | | (5.96 | ) | | | (5.33 | ) | | | (3.06 | ) | | | (1.52 | ) | | | 0.00 | |
Net asset value, end of period | | | $40.92 | | | | $39.99 | | | | $41.60 | | | | $48.10 | | | | $45.27 | | | | $38.49 | |
Total return2 | | | 8.86 | % | | | 11.62 | % | | | (3.01 | )% | | | 13.48 | % | | | 22.41 | % | | | 20.62 | % |
Ratios to average net assets (annualized) | | | | | | | | | | | | | | | | | | | | | | | | |
Gross expenses | | | 1.96 | % | | | 1.96 | % | | | 1.99 | % | | | 2.01 | % | | | 2.01 | % | | | 2.00 | % |
Net expenses | | | 1.96 | % | | | 1.96 | % | | | 1.97 | % | | | 1.97 | % | | | 1.98 | % | | | 2.00 | % |
Net investment income (loss) | | | 0.07 | % | | | (0.40 | )% | | | 0.55 | % | | | (0.88 | )% | | | (0.83 | )% | | | (0.83 | )% |
Supplemental data | | | | | | | | | | | | | | | | | | | | | | | | |
Portfolio turnover rate | | | 33 | % | | | 34 | % | | | 42 | % | | | 32 | % | | | 26 | % | | | 41 | % |
Net assets, end of period (000s omitted) | | | $34,921 | | | | $34,721 | | | | $37,196 | | | | $42,940 | | | | $43,209 | | | | $42,720 | |
| 1 | Calculated based upon average shares outstanding |
| 2 | Total return calculations do not include any sales charges. Returns for periods of less than one year are not annualized. |
The accompanying notes are an integral part of these financial statements.
| | | | | | |
| Financial highlights | | Wells Fargo Opportunity Fund | | | 17 | |
(For a share outstanding throughout each period)
| | | | | | | | | | | | | | | | | | | | | | | | |
| | | Six months ended
March 31, 2017 (unaudited) | | | Year ended September 30 | |
| ADMINISTRATOR CLASS | | | 2016 | | | 2015 | | | 2014 | | | 2013 | | | 2012 | |
Net asset value, beginning of period | | | $44.93 | | | | $46.11 | | | | $52.27 | | | | $48.50 | | | | $40.74 | | | | $33.44 | |
Net investment income | | | 0.24 | | | | 0.24 | 1 | | | 0.79 | | | | 0.08 | | | | 0.06 | 1 | | | 0.09 | |
Net realized and unrealized gains (losses) on investments | | | 3.89 | | | | 5.04 | | | | (1.62 | ) | | | 6.75 | | | | 9.22 | | | | 7.21 | |
| | | | | | | | | | | | | | | | | | | | | | | | |
Total from investment operations | | | 4.13 | | | | 5.28 | | | | (0.83 | ) | | | 6.83 | | | | 9.28 | | | | 7.30 | |
Distributions to shareholders from | | | | | | | | | | | | | | | | | | | | | | | | |
Net investment income | | | (0.18 | ) | | | (0.69 | ) | | | 0.00 | | | | 0.00 | | | | 0.00 | | | | 0.00 | |
Net realized gains | | | (2.54 | ) | | | (5.77 | ) | | | (5.33 | ) | | | (3.06 | ) | | | (1.52 | ) | | | 0.00 | |
| | | | | | | | | | | | | | | | | | | | | | | | |
Total distributions to shareholders | | | (2.72 | ) | | | (6.46 | ) | | | (5.33 | ) | | | (3.06 | ) | | | (1.52 | ) | | | 0.00 | |
Net asset value, end of period | | | $46.34 | | | | $44.93 | | | | $46.11 | | | | $52.27 | | | | $48.50 | | | | $40.74 | |
Total return2 | | | 9.40 | % | | | 12.68 | % | | | (2.04 | )% | | | 14.60 | % | | | 23.59 | % | | | 21.83 | % |
Ratios to average net assets (annualized) | | | | | | | | | | | | | | | | | | | | | | | | |
Gross expenses | | | 1.13 | % | | | 1.13 | % | | | 1.10 | % | | | 1.10 | % | | | 1.10 | % | | | 1.09 | % |
Net expenses | | | 1.00 | % | | | 1.00 | % | | | 1.00 | % | | | 1.00 | % | | | 1.00 | % | | | 1.00 | % |
Net investment income | | | 1.03 | % | | | 0.56 | % | | | 1.52 | % | | | 0.09 | % | | | 0.13 | % | | | 0.17 | % |
Supplemental data | | | | | | | | | | | | | | | | | | | | | | | | |
Portfolio turnover rate | | | 33 | % | | | 34 | % | | | 42 | % | | | 32 | % | | | 26 | % | | | 41 | % |
Net assets, end of period (000s omitted) | | | $230,287 | | | | $226,140 | | | | $223,281 | | | | $253,121 | | | | $247,230 | | | | $395,493 | |
| 1 | Calculated based upon average shares outstanding |
| 2 | Returns for periods of less than one year are not annualized. |
The accompanying notes are an integral part of these financial statements.
| | | | |
| 18 | | Wells Fargo Opportunity Fund | | Financial highlights |
(For a share outstanding throughout each period)
| | | | | | | | | | | | | | | | | | | | | | | | |
| | | Six months ended
March 31, 2017 (unaudited) | | | Year ended September 30 | |
| INSTITUTIONAL CLASS | | | 2016 | | | 2015 | | | 2014 | | | 2013 | | | 2012 | |
Net asset value, beginning of period | | | $45.63 | | | | $46.76 | | | | $52.82 | | | | $48.86 | | | | $40.93 | | | | $33.52 | |
Net investment income | | | 0.28 | 1 | | | 0.35 | 1 | | | 0.92 | 1 | | | 0.19 | 1 | | | 0.17 | | | | 0.21 | |
Net realized and unrealized gains (losses) on investments | | | 3.97 | | | | 5.12 | | | | (1.65 | ) | | | 6.83 | | | | 9.28 | | | | 7.20 | |
| | | | | | | | | | | | | | | | | | | | | | | | |
Total from investment operations | | | 4.25 | | | | 5.47 | | | | (0.73 | ) | | | 7.02 | | | | 9.45 | | | | 7.41 | |
Distributions to shareholders from | | | | | | | | | | | | | | | | | | | | | | | | |
Net investment income | | | (0.26 | ) | | | (0.83 | ) | | | 0.00 | | | | 0.00 | | | | 0.00 | | | | 0.00 | |
Net realized gains | | | (2.54 | ) | | | (5.77 | ) | | | (5.33 | ) | | | (3.06 | ) | | | (1.52 | ) | | | 0.00 | |
| | | | | | | | | | | | | | | | | | | | | | | | |
Total distributions to shareholders | | | (2.80 | ) | | | (6.60 | ) | | | (5.33 | ) | | | (3.06 | ) | | | (1.52 | ) | | | 0.00 | |
Net asset value, end of period | | | $47.08 | | | | $45.63 | | | | $46.76 | | | | $52.82 | | | | $48.86 | | | | $40.93 | |
Total return2 | | | 9.53 | % | | | 12.97 | % | | | (1.81 | )% | | | 14.89 | % | | | 23.91 | % | | | 22.11 | % |
Ratios to average net assets (annualized) | | | | | | | | | | | | | | | | | | | | | | | | |
Gross expenses | | | 0.88 | % | | | 0.88 | % | | | 0.83 | % | | | 0.83 | % | | | 0.83 | % | | | 0.82 | % |
Net expenses | | | 0.75 | % | | | 0.75 | % | | | 0.75 | % | | | 0.75 | % | | | 0.75 | % | | | 0.75 | % |
Net investment income | | | 1.19 | % | | | 0.79 | % | | | 1.79 | % | | | 0.36 | % | | | 0.41 | % | | | 0.39 | % |
Supplemental data | | | | | | | | | | | | | | | | | | | | | | | | |
Portfolio turnover rate | | | 33 | % | | | 34 | % | | | 42 | % | | | 32 | % | | | 26 | % | | | 41 | % |
Net assets, end of period (000s omitted) | | | $28,811 | | | | $17,222 | | | | $11,906 | | | | $29,335 | | | | $14,030 | | | | $10,804 | |
| 1 | Calculated based upon average shares outstanding |
| 2 | Returns for periods of less than one year are not annualized. |
The accompanying notes are an integral part of these financial statements.
| | | | | | |
| Notes to financial statements (unaudited) | | Wells Fargo Opportunity Fund | | | 19 | |
1. ORGANIZATION
Wells Fargo Funds Trust (the “Trust”), a Delaware statutory trust organized on March 10, 1999, is an open-end management investment company registered under the Investment Company Act of 1940, as amended (the “1940 Act”). As an investment company, the Trust follows the accounting and reporting guidance in Financial Accounting Standards Board (“FASB”) Accounting Standards Codification (“ASC”) Topic 946, Financial Services – Investment Companies. These financial statements report on the Wells Fargo Opportunity Fund (the “Fund”) which is a diversified series of the Trust.
Effective at the close of business on October 23, 2015, Investor Class shares became Class A shares in a tax-free conversion. Shareholders of Investor Class received Class A shares at a value equal to the value of their Investor Class shares immediately prior to the conversion. Investor Class shares are no longer offered by the Fund.
2. SIGNIFICANT ACCOUNTING POLICIES
The following significant accounting policies, which are consistently followed in the preparation of the financial statements of the Fund, are in conformity with U.S. generally accepted accounting principles which require management to make estimates and assumptions that affect the reported amounts of assets and liabilities, disclosure of contingent assets and liabilities at the date of the financial statements, and the reported amounts of revenues and expenses during the reporting period. Actual results could differ from those estimates.
Securities valuation
All investments are valued each business day as of the close of regular trading on the New York Stock Exchange (generally 4 p.m. Eastern Time), although the Fund may deviate from this calculation time under unusual or unexpected circumstances.
Equity securities that are listed on a foreign or domestic exchange or market are valued at the official closing price or, if none, the last sales price. If no sale occurs on the principal exchange or market that day, the prior day’s price will be deemed “stale” and a fair value price will be determined in accordance with the Fund’s Valuation Procedures.
The values of securities denominated in foreign currencies are translated into U.S. dollars at rates provided by an independent foreign currency pricing source at a time each business day specified by the Management Valuation Team of Wells Fargo Funds Management, LLC (“Funds Management”).
Many securities markets and exchanges outside the U.S. close prior to the close of the New York Stock Exchange and therefore may not fully reflect trading or events that occur after the close of the principal exchange in which the foreign securities are traded, but before the close of the New York Stock Exchange. If such trading or events are expected to materially affect the value of such securities, then fair value pricing procedures approved by the Board of Trustees of the Fund are applied. These procedures take into account multiple factors including movements in U.S. securities markets after foreign exchanges close. Foreign securities that are fair valued under these procedures are categorized as Level 2 and the application of these procedures may result in transfers between Level 1 and Level 2. Depending on market activity, such fair valuations may be frequent. Such fair value pricing may result in net asset values that are higher or lower than net asset values based on the last reported sales price or latest quoted bid price. On March 31, 2017, such fair value pricing was not used in pricing foreign securities.
Investments in registered open-end investment companies are valued at net asset value. Interests in non-registered investment companies that are redeemable at net asset value are fair valued normally at net asset value.
Investments which are not valued using any of the methods discussed above are valued at their fair value, as determined in good faith by the Board of Trustees. The Board of Trustees has established a Valuation Committee comprised of the Trustees and has delegated to it the authority to take any actions regarding the valuation of portfolio securities that the Valuation Committee deems necessary or appropriate, including determining the fair value of portfolio securities, unless the determination has been delegated to the Management Valuation Team. The Board of Trustees retains the authority to make or ratify any valuation decisions or approve any changes to the Valuation Procedures as it deems appropriate. On a quarterly basis, the Board of Trustees receives reports on any valuation actions taken by the Valuation Committee or the Management Valuation Team which may include items for ratification.
Valuations of fair valued securities are compared to the next actual sales price when available, or other appropriate market values, to assess the continued appropriateness of the fair valuation methodologies used. These securities are fair valued on a day-to-day basis, taking into consideration changes to appropriate market information and any significant changes to the inputs considered in the valuation process until there is a readily available price provided on an exchange or by an independent pricing service. Valuations received from an independent pricing service or independent broker-dealer quotes are periodically
| | | | |
| 20 | | Wells Fargo Opportunity Fund | | Notes to financial statements (unaudited) |
validated by comparisons to most recent trades and valuations provided by other independent pricing services in addition to the review of prices by the manager and/or subadviser. Unobservable inputs used in determining fair valuations are identified based on the type of security, taking into consideration factors utilized by market participants in valuing the investment, knowledge about the issuer and the current market environment.
Foreign currency translation
The accounting records of the Fund are maintained in U.S. dollars. The values of other assets and liabilities denominated in foreign currencies are translated into U.S. dollars at rates provided by an independent foreign currency pricing source at a time each business day specified by the Management Valuation Team. Purchases and sales of securities, and income and expenses are converted at the rate of exchange on the respective dates of such transactions. Net realized foreign exchange gains or losses arise from sales of foreign currencies, currency gains or losses realized between the trade and settlement dates on securities transactions, and the difference between the amounts of dividends, interest and foreign withholding taxes recorded and the U.S. dollar equivalent of the amounts actually paid or received. Net unrealized foreign exchange gains and losses arise from changes in the fair value of assets and liabilities other than investments in securities resulting from changes in exchange rates. The changes in net assets arising from changes in exchange rates of securities and the changes in net assets resulting from changes in market prices of securities are not separately presented. Such changes are included in net realized and unrealized gains or losses from investments
Security loans
The Fund may lend its securities from time to time in order to earn additional income in the form of fees or interest on securities received as collateral or the investment of any cash received as collateral. The Fund continues to receive interest or dividends on the securities loaned. The Fund receives collateral in the form of cash or securities with a value at least equal to the value of the securities on loan. The value of the loaned securities is determined at the close of each business day and any additional required collateral is delivered to the Fund on the next business day. In a securities lending transaction, the net asset value of the Fund will be affected by an increase or decrease in the value of the securities loaned and by an increase or decrease in the value of the instrument in which collateral is invested. The amount of securities lending activity undertaken by the Fund fluctuates from time to time. In the event of default or bankruptcy by the borrower, the Fund may be prevented from recovering the loaned securities or gaining access to the collateral or may experience delays or costs in doing so. In addition, the investment of any cash collateral received may lose all or part of its value. The Fund has the right under the lending agreement to recover the securities from the borrower on demand.
The Fund lends its securities through an unaffiliated securities lending agent. Cash collateral received in connection with its securities lending transactions is invested in Securities Lending Cash Investments, LLC (the “Securities Lending Fund”). The Securities Lending Fund is exempt from registration under Section 3(c)(7) of the 1940 Act and is managed by Funds Management and is subadvised by Wells Capital Management Incorporated (“WellsCap”), an affiliate of Funds Management and an indirect wholly owned subsidiary of Wells Fargo & Company (“Wells Fargo”). Funds Management receives an advisory fee starting at 0.05% and declining to 0.01% as the average daily net assets of the Securities Lending Fund increase. All of the fees received by Funds Management are paid to WellsCap for its services as subadviser. The Securities Lending Fund seeks to provide a positive return compared to the daily Fed Funds Open rate by investing in high-quality, U.S. dollar-denominated short-term money market instruments. Securities Lending Fund investments are valued at the evaluated bid price provided by an independent pricing service. Income earned from investment in the Securities Lending Fund is included in securities lending income on the Statement of Operations.
Security transactions and income recognition
Securities transactions are recorded on a trade date basis. Realized gains or losses are recorded on the basis of identified cost.
Dividend income is recognized on the ex-dividend date, except for certain dividends from foreign securities, which are recorded as soon as the custodian verifies the ex-dividend date. Dividend income from foreign securities is recorded net of foreign taxes withheld where recovery of such taxes is not assured.
Distributions to shareholders
Distributions to shareholders from net investment income and net realized gains, if any, are recorded on the ex-dividend date. Such distributions are determined in accordance with income tax regulations and may differ from U.S. generally accepted accounting principles. Dividend sources are estimated at the time of declaration. The tax character of distributions is determined as of the Fund’s fiscal year end. Therefore, a portion of the Fund’s distributions made prior the Fund’s fiscal year end may be categorized as a tax return of capital.
| | | | | | |
| Notes to financial statements (unaudited) | | Wells Fargo Opportunity Fund | | | 21 | |
Federal and other taxes
The Fund intends to continue to qualify as a regulated investment company by distributing substantially all of its investment company taxable income and any net realized capital gains (after reduction for capital loss carryforwards) sufficient to relieve it from all, or substantially all, federal income taxes. Accordingly, no provision for federal income taxes was required.
The Fund’s income and federal excise tax returns and all financial records supporting those returns for the prior three fiscal years are subject to examination by the federal and Delaware revenue authorities. Management has analyzed the Fund’s tax positions taken on federal, state, and foreign tax returns for all open tax years and does not believe that there are any uncertain tax positions that require recognition of a tax liability.
Class allocations
The separate classes of shares offered by the Fund differ principally in applicable sales charges, distribution, shareholder servicing, and administration fees. Class specific expenses are charged directly to that share class. Investment income, common expenses, and realized and unrealized gains (losses) on investments are allocated daily to each class of shares based on the relative proportion of net assets of each class.
3. FAIR VALUATION MEASUREMENTS
Fair value measurements of investments are determined within a framework that has established a fair value hierarchy based upon the various data inputs utilized in determining the value of the Fund’s investments. The three-level hierarchy gives the highest priority to unadjusted quoted prices in active markets for identical assets or liabilities (Level 1) and the lowest priority to unobservable inputs (Level 3). The Fund’s investments are classified within the fair value hierarchy based on the lowest level of input that is significant to the fair value measurement. The inputs are summarized into three broad levels as follows:
| ∎ | | Level 1 – quoted prices in active markets for identical securities |
| ∎ | | Level 2 – other significant observable inputs (including quoted prices for similar securities, interest rates, prepayment speeds, credit risk, etc.) |
| ∎ | | Level 3 – significant unobservable inputs (including the Fund’s own assumptions in determining the fair value of investments) |
The inputs or methodologies used for valuing investments in securities are not necessarily an indication of the risk associated with investing in those securities.
The following is a summary of the inputs used in valuing the Fund’s assets and liabilities as of March 31, 2017:
| | | | | | | | | | | | | | | | |
| | | Quoted prices
(Level 1) | | | Other significant
observable inputs (Level 2) | | | Significant
unobservable inputs (Level 3) | | | Total | |
Assets | | | | | | | | | | | | | | | | |
Investments in: | | | | | | | | | | | | | | | | |
| | | | |
Common stocks | | | | | | | | | | | | | | | | |
Consumer discretionary | | $ | 204,844,505 | | | $ | 0 | | | $ | 0 | | | $ | 204,844,505 | |
Consumer staples | | | 111,220,013 | | | | 0 | | | | 0 | | | | 111,220,013 | |
Energy | | | 146,342,256 | | | | 0 | | | | 0 | | | | 146,342,256 | |
Financials | | | 289,407,198 | | | | 0 | | | | 0 | | | | 289,407,198 | |
Health care | | | 209,697,897 | | | | 0 | | | | 0 | | | | 209,697,897 | |
Industrials | | | 233,305,973 | | | | 0 | | | | 0 | | | | 233,305,973 | |
Information technology | | | 439,854,278 | | | | 0 | | | | 0 | | | | 439,854,278 | |
Materials | | | 71,953,215 | | | | 0 | | | | 0 | | | | 71,953,215 | |
Real estate | | | 28,918,134 | | | | 0 | | | | 0 | | | | 28,918,134 | |
| | | | |
Short-term investments | | | | | | | | | | | | | | | | |
Investment companies | | | 14,193,391 | | | | 0 | | | | 0 | | | | 14,193,391 | |
Investments measured at net asset value* | | | | | | | | | | | | | | | 21,375,900 | |
Total assets | | $ | 1,749,736,860 | | | $ | 0 | | | $ | 0 | | | $ | 1,771,112,760 | |
| * | Investments that are measured at fair value using the net asset value per share (or its equivalent) as a practical expedient have not been categorized in the fair value hierarchy. The fair value amount presented in the table is intended to permit reconciliation of the fair value hierarchy to the amounts presented in the Statement of Assets and Liabilities. The Fund’s investment in Securities Lending Cash Investments, LLC valued at $21,375,900 does not have a redemption period notice, can be redeemed daily and does not have any unfunded commitments. |
| | | | |
| 22 | | Wells Fargo Opportunity Fund | | Notes to financial statements (unaudited) |
The Fund recognizes transfers between levels within the fair value hierarchy at the end of the reporting period. At March 31, 2017, the Fund did not have any transfers into/out of Level 1, Level 2, or Level 3.
4. TRANSACTIONS WITH AFFILIATES AND OTHER EXPENSES
Management fee
Funds Management, an indirect wholly owned subsidiary of Wells Fargo, is the manager of the Fund and provides advisory and fund-level administrative services under an investment management agreement. Under the investment management agreement, Funds Management is responsible for, among other services, implementing the investment objectives and strategies of the Fund, supervising the subadviser, providing fund-level administrative services in connection with the Fund’s operations, and providing any other fund-level administrative services reasonably necessary for the operation of the Fund. As compensation for its services under the investment management agreement, Funds Management is entitled to receive an annual management fee starting at 0.75% and declining to 0.63% as the average daily net assets of the Fund increase. For the six month ended March 31, 2017, the management fee was equivalent to an annual rate of 0.72% of the Fund’s average daily net assets.
Funds Management has retained the services of a subadviser to provide daily portfolio management to the Fund. The fee for subadvisory services is borne by Funds Management. WellsCap is the subadviser to the Fund and is entitled to receive a fee from Funds Management at an annual rate starting at 0.45% and declining to 0.30% as the average daily net assets of the Fund increase.
Administration fees
Under a class-level administration agreement, Funds Management provides class-level administrative services to the Fund, which includes paying fees and expenses for services provided by the transfer agent, sub-transfer agents, omnibus account servicers and record-keepers. As compensation for its services under the class-level administration agreement, Funds Management receives an annual fee which is calculated based on the average daily net assets of each class as follows:
| | | | |
| | | Class-level
administration fee | |
Class A, Class B, Class C | | | 0.21 | % |
Administrator Class, Institutional Class | | | 0.13 | |
Funds Management has contractually waived and/or reimbursed management and administration fees to the extent necessary to maintain certain net operating expense ratios for the Fund. Waiver of fees and/or reimbursement of expenses by Funds Management were made first from fund level expenses on a proportionate basis and then from class specific expenses. Funds Management has committed through January 31, 2018 to waive fees and/or reimburse expenses to the extent necessary to cap the Fund’s expenses at 1.21% for Class A shares, 1.96% for Class B shares, 1.96% for Class C shares, 1.00% for Administrator Class shares, and 0.75% for Institutional Class shares. After this time, the cap may be increased or the commitment to maintain the cap may be terminated only with the approval of the Board of Trustees.
During the six month ended March 31, 2017, State Street Bank and Trust Company, the Fund’s custodian, reimbursed the Fund $4,273 for certain out-of-pocket expenses that were billed to the Fund in error from 1998-2015. This amount is included in dividend income on the Statement of Operations. In addition, Funds Management was also reimbursed $10,171 for waivers/reimbursements it made to the Fund during the period the Fund was erroneously billed.
Distribution fees
The Trust has adopted a distribution plan for Class B and Class C shares of the Fund pursuant to Rule 12b-1 under the 1940 Act. Distribution fees are charged to Class B and Class C shares and paid to Wells Fargo Funds Distributor, LLC (“Funds Distributor”), the principal underwriter, at an annual rate of 0.75% of the average daily net assets of Class B and Class C shares.
In addition, Funds Distributor is entitled to receive the front-end sales charge from the purchase of Class A shares and a contingent deferred sales charge on the redemption of certain Class A shares. Funds Distributor is also entitled to receive the contingent deferred sales charges from redemptions of Class B and Class C shares. For the six month ended March 31, 2017, Funds Distributor received $2,995 from the sale of Class A shares and $52 in contingent deferred sales charges from redemptions of Class C shares, respectively.
| | | | | | |
| Notes to financial statements (unaudited) | | Wells Fargo Opportunity Fund | | | 23 | |
Shareholder servicing fees
The Trust has entered into contracts with one or more shareholder servicing agents, whereby Class A, Class B, Class C, and Administrator Class of the Fund are charged a fee at an annual rate of 0.25% of the average daily net assets of each respective class
A portion of these total shareholder servicing fees were paid to affiliates of Wells Fargo.
5. INVESTMENT PORTFOLIO TRANSACTIONS
Purchases and sales of investments, excluding U.S. government obligations (if any) and short-term securities, for the six months ended March 31, 2017 were $568,886,514 and $634,051,277, respectively.
The Fund may purchase or sell investment securities to other Wells Fargo affiliates pursuant to Rule 17a-7 of the 1940 Act and under procedures adopted by the Board of Trustees. The procedures have been designed to ensure that these interfund transactions, which generally do not incur broker commissions, are effected at current market prices. Interfund trades are included within the respective purchases and sales amounts shown.
6. BANK BORROWINGS
The Trust (excluding the money market funds and certain other funds) and Wells Fargo Variable Trust are parties to a $250,000,000 revolving credit agreement whereby the Fund is permitted to use bank borrowings for temporary or emergency purposes, such as to fund shareholder redemption requests. Interest under the credit agreement is charged to the Fund based on a borrowing rate equal to the higher of the Federal Funds rate in effect on that day plus 1.25% or the overnight LIBOR rate in effect on that day plus 1.25%. In addition, an annual commitment fee equal to 0.25% of the unused balance is allocated to each participating fund.
For the six month ended March 31, 2017, there were no borrowings by the Fund under the agreement.
7. CONCENTRATION RISK
Concentration risks result from exposure to a limited number of sectors. A fund that invests a substantial portion of its assets in any sector may be more affected by changes in that sector than would be a fund whose investments are not heavily weighted in any sector.
8. INDEMNIFICATION
Under the Trust’s organizational documents, the officers and Trustees have been granted certain indemnification rights against certain liabilities that may arise out of performance of their duties to the Trust. Additionally, in the normal course of business, the Trust may enter into contracts with service providers that contain a variety of indemnification clauses. The Trust’s maximum exposure under these arrangements is dependent on future claims that may be made against the Fund and, therefore, cannot be estimated.
9. NEW ACCOUNTING PRONOUNCEMENT
In December 2016, FASB issued Accounting Standards Update (“ASU”) No. 2016-19, Technical Corrections and Improvements. ASU 2016-19 includes an amendment to FASB ASC Topic 820, Fair Value Measurement which clarifies the difference between a valuation approach and a valuation technique. The amendment also requires an entity to disclose when there has been a change in either or both a valuation approach and/or a valuation technique. The disclosure requirements are effective for fiscal years and interim periods within those fiscal years beginning after December 15, 2016. Management is currently evaluating the potential impact of this new guidance to the financial statements.
10. REGULATORY CHANGES
In October 2016, the Securities and Exchange Commission (“SEC”) adopted new rules and forms and amended existing rules and forms (together, “final rules”) intended to modernize and enhance the reporting and disclosure of information by registered investment companies and to enhance liquidity risk management by open-end mutual funds and exchange-traded funds. The final rules will enhance the quality of information available to investors and will allow the SEC to more effectively collect and use data reported by funds. In part, the final rules amend Regulation S-X and require standardized, enhanced disclosure about derivatives in the Fund’s financial statements, as well as other amendments. The compliance date for the amendments to Regulation S-X is August 1, 2017 while the compliance date for the new form types is June 1, 2018 and the compliance date for the liquidity risk management program requirements is December 1, 2018. Management is currently assessing the potential impact of these enhancements and their impact on the financial statement disclosures and reporting requirements.
| | | | |
| 24 | | Wells Fargo Opportunity Fund | | Other information (unaudited) |
PORTFOLIO HOLDINGS INFORMATION
The complete portfolio holdings for the Fund are publicly available monthly on the Fund’s website (wellsfargofunds.com), on a one-month delayed basis. In addition, top ten holdings information (excluding derivative positions) for the Fund is publicly available on the Fund’s website on a monthly, seven-day or more delayed basis. The Fund files its complete schedule of portfolio holdings with the SEC for the first and third quarters of each fiscal year on Form N-Q, which is available by visiting the SEC website at sec.gov. In addition, the Fund’s Form N-Q may be reviewed and copied at the SEC’s Public Reference Room in Washington, DC, and at regional offices in New York City, at 233 Broadway, and in Chicago, at 175 West Jackson Boulevard, Suite 900. Information about the Public Reference Room may be obtained by calling 1-800-SEC-0330.
PROXY VOTING INFORMATION
A description of the policies and procedures that the Fund uses to determine how to vote proxies relating to portfolio securities is available, upon request, by calling 1-800-222-8222, visiting our website at wellsfargofunds.com, or visiting the SEC website at sec.gov. Information regarding how the Fund voted proxies relating to portfolio securities during the most recent 12-month period ended June 30 is available on the Fund’s website at wellsfargofunds.com or by visiting the SEC website at sec.gov.
| | | | | | |
| Other information (unaudited) | | Wells Fargo Opportunity Fund | | | 25 | |
BOARD OF TRUSTEES AND OFFICERS
Each of the Trustees and Officers1 listed in the table below acts in identical capacities for each fund in the Wells Fargo family of funds, which consists of 138 mutual funds comprising the Wells Fargo Funds Trust, Wells Fargo Variable Trust, Wells Fargo Master Trust and four closed-end funds (collectively the “Fund Complex”). This table should be read in conjunction with the Prospectus and the Statement of Additional Information2. The mailing address of each Trustee and Officer is 525 Market Street, 12th Floor, San Francisco, CA 94105. Each Trustee and Officer serves an indefinite term, however, each Trustee serves such term until reaching the mandatory retirement age established by the Trustees.
Independent Trustees
| | | | | | |
Name and year of birth | | Position held and length of service* | | Principal occupations during past five years or longer | | Current other public company or investment company
directorships |
William R. Ebsworth (Born 1957) | | Trustee, since 2015 | | Retired. From 1984 to 2013, equities analyst, portfolio manager, research director and chief financial officer at Fidelity Management and Research Company in Boston, Tokyo, and Hong Kong and retired in 2013 as Chief Investment Officer of Fidelity Strategic Advisers, Inc. where he lead a team of investment professionals managing client assets. Prior thereto, Board member of Hong Kong Securities Clearing Co., Hong Kong Options Clearing Corp., the Thailand International Fund, Ltd., Fidelity Investments Life Insurance Company, and Empire Fidelity Investments Life Insurance Company. Board member of the Fonté Foundation (non-profit organization) and the Vincent Memorial Hospital Endowment (non-profit organization), where he serves on the Investment Committee and as a Chair of the Audit Committee. Mr. Ebsworth is a CFA® charterholder and an Adjunct Lecturer, Finance, at Babson College. | | Asset Allocation Trust |
Jane A. Freeman (Born 1953) | | Trustee, since 2015 | | Retired. From 2012 to 2014 and 1999 to 2008, Chief Financial Officer of Scientific Learning Corporation. From 2008 to 2012, Ms. Freeman provided consulting services related to strategic business projects. Prior to 1999, Portfolio Manager at Rockefeller & Co. and Scudder, Stevens & Clark. Board member of the Harding Loevner Funds from 1996 to 2014, serving as both Lead Independent Director and chair of the Audit Committee. Board member of the Russell Exchange Traded Funds Trust from 2011 to 2012 and the chair of the Audit Committee. Ms. Freeman is a Board Member of Ruth Bancroft Garden (non-profit organization) and an inactive chartered financial analyst. | | Asset Allocation Trust |
Peter G. Gordon** (Born 1942) | | Trustee, since 1998; Chairman, since 2005 | | Co-Founder, Retired Chairman, President and CEO of Crystal Geyser Water Company. Trustee Emeritus, Colby College. | | Asset Allocation Trust |
Isaiah Harris, Jr. (Born 1952) | | Trustee, since 2009 | | Retired. Chairman of the Board of CIGNA Corporation since 2009, and Director since 2005. From 2003 to 2011, Director of Deluxe Corporation. Prior thereto, President and CEO of BellSouth Advertising and Publishing Corp. from 2005 to 2007, President and CEO of BellSouth Enterprises from 2004 to 2005 and President of BellSouth Consumer Services from 2000 to 2003. Emeritus member of the Iowa State University Foundation Board of Governors. Emeritus Member of the Advisory Board of Iowa State University School of Business. Advisory Board Member, Palm Harbor Academy (charter school). Advisory Board Member, Child Evangelism Fellowship (non-profit). Mr. Harris is a certified public accountant (inactive status). | | CIGNA Corporation; Asset Allocation Trust |
Judith M. Johnson (Born 1949) | | Trustee, since 2008; Audit Committee Chairman, since 2008 | | Retired. Prior thereto, Chief Executive Officer and Chief Investment Officer of Minneapolis Employees Retirement Fund from 1996 to 2008. Ms. Johnson is an attorney, certified public accountant and a certified managerial accountant. | | Asset Allocation Trust |
David F. Larcker (Born 1950) | | Trustee, since 2009 | | James Irvin Miller Professor of Accounting at the Graduate School of Business, Stanford University, Director of the Corporate Governance Research Initiative and Senior Faculty of The Rock Center for Corporate Governance since 2006. From 2005 to 2008, Professor of Accounting at the Graduate School of Business, Stanford University. Prior thereto, Ernst & Young Professor of Accounting at The Wharton School, University of Pennsylvania from 1985 to 2005. | | Asset Allocation Trust |
| | | | |
| 26 | | Wells Fargo Opportunity Fund | | Other information (unaudited) |
| | | | | | |
Name and year of birth | | Position held and length of service* | | Principal occupations during past five years or longer | | Current other public company or investment company
directorships |
Olivia S. Mitchell (Born 1953) | | Trustee, since 2006 | | International Foundation of Employee Benefit Plans Professor, Wharton School of the University of Pennsylvania since 1993. Director of Wharton’s Pension Research Council and Boettner Center on Pensions & Retirement Research, and Research Associate at the National Bureau of Economic Research. Previously, Cornell University Professor from 1978 to 1993. | | Asset Allocation Trust |
Timothy J. Penny (Born 1951) | | Trustee, since 1996 | | President and Chief Executive Officer of Southern Minnesota Initiative Foundation, a non-profit organization, since 2007 and Senior Fellow at the Humphrey Institute Policy Forum at the University of Minnesota since 1995. Member of the Board of Trustees of NorthStar Education Finance, Inc., a non-profit organization, since 2007. | | Asset Allocation Trust |
Michael S. Scofield (Born 1943) | | Trustee, since 2010 | | Served on the Investment Company Institute’s Board of Governors and Executive Committee from 2008-2011 as well the Governing Council of the Independent Directors Council from 2006-2011 and the Independent Directors Council Executive Committee from 2008-2011. Chairman of the IDC from 2008-2010. Institutional Investor (Fund Directions) Trustee of Year in 2007. Trustee of the Evergreen Funds complex (and its predecessors) from 1984 to 2010. Chairman of the Evergreen Funds from 2000-2010. Former Trustee of the Mentor Funds. Retired Attorney, Law Offices of Michael S. Scofield. | | Asset Allocation Trust |
| * | Length of service dates reflect the Trustee’s commencement of service with the Trust’s predecessor entities, where applicable. |
| ** | Peter Gordon is expected to retire on December 31, 2017. |
Officers
| | | | | | |
Name and year of birth | | Position held and length of service | | Principal occupations during past five years or longer | | |
Andrew Owen (Born 1960) | | President, since 2017 | | Executive Vice President of Wells Fargo Bank, N.A. and President of Wells Fargo & Company and Head of Affiliated Managers, Wells Fargo Asset Management, since 2014. Executive Vice President responsible for marketing, investments and product development for Wells Fargo Funds Management, LLC, from 2009 to 2014. | | |
Nancy Wiser1 (Born 1967) | | Treasurer, since 2012 | | Executive Vice President of Wells Fargo Funds Management, LLC since 2011. Chief Operating Officer and Chief Compliance Officer at LightBox Capital Management LLC, from 2008 to 2011. | | |
C. David Messman (Born 1960) | | Secretary, since 2000; Chief Legal Officer, since 2003 | | Senior Vice President and Secretary of Wells Fargo Funds Management, LLC since 2001. Assistant General Counsel of Wells Fargo Bank, N.A. since 2013 and Vice President and Managing Counsel of Wells Fargo Bank, N.A. from 1996 to 2013. | | |
Michael Whitaker (Born 1967) | | Chief Compliance Officer, since 2016 | | Executive Vice President of Wells Fargo Funds Management, LLC since 2016. Chief Compliance Officer of Fidelity’s Fixed Income Funds and Asset Allocation Funds from 2008 to 2016, Compliance Officer of FMR Co., Inc. from 2014 to 2016, Fidelity Investments Money Management, Inc. from 2014 to 2016, Fidelity Investments from 2007 to 2016. | | |
David Berardi (Born 1975) | | Assistant Treasurer, since 2009 | | Vice President of Wells Fargo Funds Management, LLC since 2009. Vice President of Evergreen Investment Management Company, LLC from 2008 to 2010. Manager of Fund Reporting and Control for Evergreen Investment Management Company, LLC from 2004 to 2010. | | |
Jeremy DePalma1 (Born 1974) | | Assistant Treasurer, since 2009 | | Senior Vice President of Wells Fargo Funds Management, LLC since 2009. Senior Vice President of Evergreen Investment Management Company, LLC from 2008 to 2010 and head of the Fund Reporting and Control Team within Fund Administration from 2005 to 2010. | | |
| 1 | Nancy Wiser acts as Treasurer of 69 funds in the Fund Complex. Jeremy DePalma acts as Treasurer of 69 funds and Assistant Treasurer of 69 funds in the Fund Complex. |
| 2 | The Statement of Additional Information includes additional information about the Trustees and is available, without charge, upon request, by calling 1-800-222-8222 or by visiting the website at wellsfargofunds.com. |
| | | | | | |
| List of abbreviations | | Wells Fargo Opportunity Fund | | | 27 | |
The following is a list of common abbreviations for terms and entities that may have appeared in this report.
| ACA | — ACA Financial Guaranty Corporation |
| ADR | — American depositary receipt |
| ADS | — American depositary shares |
| AGC | — Assured Guaranty Corporation |
| AGM | — Assured Guaranty Municipal |
| Ambac | — Ambac Financial Group Incorporated |
| AMT | — Alternative minimum tax |
| BAN | — Bond anticipation notes |
| BHAC | — Berkshire Hathaway Assurance Corporation |
| CAB | — Capital appreciation bond |
| CCAB | — Convertible capital appreciation bond |
| CDA | — Community Development Authority |
| CDO | — Collateralized debt obligation |
| DRIVER | — Derivative inverse tax-exempt receipts |
| DW&P | — Department of Water & Power |
| DWR | — Department of Water Resources |
| ECFA | — Educational & Cultural Facilities Authority |
| EDA | — Economic Development Authority |
| EDFA | — Economic Development Finance Authority |
| ETF | — Exchange-traded fund |
| FDIC | — Federal Deposit Insurance Corporation |
| FFCB | — Federal Farm Credit Banks |
| FGIC | — Financial Guaranty Insurance Corporation |
| FHA | — Federal Housing Administration |
| FHLB | — Federal Home Loan Bank |
| FHLMC | — Federal Home Loan Mortgage Corporation |
| FICO | — The Financing Corporation |
| FNMA | — Federal National Mortgage Association |
| GDR | — Global depositary receipt |
| GNMA | — Government National Mortgage Association |
| HCFR | — Healthcare facilities revenue |
| HEFA | — Health & Educational Facilities Authority |
| HEFAR | — Higher education facilities authority revenue |
| HFA | — Housing Finance Authority |
| HFFA | — Health Facilities Financing Authority |
| HUD | — Department of Housing and Urban Development |
| IDA | — Industrial Development Authority |
| IDAG | — Industrial Development Agency |
| KRW | — Republic of Korea won |
| LIBOR | — London Interbank Offered Rate |
| LIFER | — Long Inverse Floating Exempt Receipts |
| LLC | — Limited liability company |
| LLLP | — Limited liability limited partnership |
| LLP | — Limited liability partnership |
| MBIA | — Municipal Bond Insurance Association |
| MFHR | — Multifamily housing revenue |
| MSTR | — Municipal securities trust receipts |
| MUD | — Municipal Utility District |
| National | — National Public Finance Guarantee Corporation |
| PCFA | — Pollution Control Financing Authority |
| PCL | — Public Company Limited |
| PCR | — Pollution control revenue |
| PFA | — Public Finance Authority |
| PFFA | — Public Facilities Financing Authority |
| PFOTER | — Puttable floating option tax-exempt receipts |
| plc | — Public limited company |
| PUTTER | — Puttable tax-exempt receipts |
| R&D | — Research & development |
| Radian | — Radian Asset Assurance |
| RAN | — Revenue anticipation notes |
| RDA | — Redevelopment Authority |
| RDFA | — Redevelopment Finance Authority |
| REIT | — Real estate investment trust |
| ROC | — Reset option certificates |
| SAVRS | — Select auction variable rate securities |
| SBA | — Small Business Authority |
| SDR | — Swedish depositary receipt |
| SFHR | — Single-family housing revenue |
| SFMR | — Single-family mortgage revenue |
| SPA | — Standby purchase agreement |
| SPDR | — Standard & Poor’s Depositary Receipts |
| SPEAR | — Short Puttable Exempt Adjustable Receipts |
| STRIPS | — Separate trading of registered interest and |
| TAN | — Tax anticipation notes |
| TIPS | — Treasury inflation-protected securities |
| TRAN | — Tax revenue anticipation notes |
| TTFA | — Transportation Trust Fund Authority |
| TVA | — Tennessee Valley Authority |
This page is intentionally left blank.

For more information
More information about Wells Fargo Funds is available free upon request. To obtain literature, please write, email, visit the Fund’s website, or call:
Wells Fargo Funds
P.O. Box 8266
Boston, MA 02266-8266
Email: fundservice@wellsfargo.com
Website: wellsfargofunds.com
Individual investors: 1-800-222-8222
Retail investment professionals: 1-888-877-9275
Institutional investment professionals: 1-866-765-0778
This report and the financial statements contained herein are submitted for the general information of the shareholders of the Fund. If this report is used for promotional purposes, distribution of the report must be accompanied or preceded by a current prospectus. Before investing, please consider the investment objectives, risks, charges, and expenses of the investment. For a current prospectus and, if available, a summary prospectus, containing this information, call 1-800-222-8222 or visit the Fund’s website at wellsfargofunds.com. Read the prospectus carefully before you invest or send money.
Wells Fargo Asset Management (WFAM) is a trade name used by the asset management businesses of Wells Fargo & Company. Wells Fargo Funds Management, LLC, a wholly owned subsidiary of Wells Fargo & Company, provides investment advisory and administrative services for Wells Fargo Funds. Other affiliates of Wells Fargo & Company provide subadvisory and other services for the funds. The funds are distributed by Wells Fargo Funds Distributor, LLC, Member FINRA, an affiliate of Wells Fargo & Company. Neither Wells Fargo Funds Management nor Wells Fargo Funds Distributor has Fund customer accounts/assets, and neither provides investment advice/recommendations or acts as an investment advice fiduciary to any investor.
NOT FDIC INSURED ◾ NO BANK GUARANTEE ◾ MAY LOSE VALUE
© 2017 Wells Fargo Funds Management, LLC. All rights reserved.
| | |
 | | 302890 05-17 SA232/SAR232 03-17 |
Semi-Annual Report
March 31, 2017

Wells Fargo Special Mid Cap Value Fund


Reduce clutter. Save trees.
Sign up for electronic delivery of prospectuses and shareholder reports at wellsfargo.com/advantagedelivery
Contents
The views expressed and any forward-looking statements are as of March 31, 2017, unless otherwise noted, and are those of the Fund managers and/or Wells Fargo Funds Management, LLC. Discussions of individual securities, or the markets generally, or any Wells Fargo Fund are not intended as individual recommendations. Future events or results may vary significantly from those expressed in any forward-looking statements. The views expressed are subject to change at any time in response to changing circumstances in the market. Wells Fargo Funds Management, LLC and the Fund disclaim any obligation to publicly update or revise any views expressed or forward-looking statements.
NOT FDIC INSURED ◾ NO BANK GUARANTEE ◾ MAY LOSE VALUE
| | | | |
| 2 | | Wells Fargo Special Mid Cap Value Fund | | Letter to shareholders (unaudited) |

Andrew Owen
President
Wells Fargo Funds
U.S. and international stocks returned 10.12% and 8.18% for the six-month period; within fixed income, the Bloomberg Barclays U.S. Aggregate Bond Index3 returned -2.18%.
Dear Shareholder:
As the new president of Wells Fargo Funds now that Karla Rabusch is retiring from that position after nearly 14 years, I am pleased to offer you this semi-annual report for the Wells Fargo Special Mid Cap Value Fund for the six-month period that ended March 31, 2017. During this period, global stocks delivered favorable results overall. U.S. and international stocks returned 10.12% and 8.18% for the six-month period, respectively, as measured by the S&P 500 Index1 and the MSCI ACWI ex USA Index (Net)2; within fixed income, the Bloomberg Barclays U.S. Aggregate Bond Index3 returned -2.18%.
During the fourth quarter of 2016, prospects for faster growth and higher interest rates in the U.S. influenced markets.
Early in the fourth quarter of 2016, U.S. stocks tended to trade lower amid concerns such as a likely interest-rate increase and uncertainty over the approaching general election. However, following Donald Trump’s election as president in early November, U.S. stocks began to rally. Investors appeared optimistic that the new administration would usher in a series of progrowth policies, and supportive economic news helped the rally carry through the quarter. The buoyant environment sent interest rates higher as well. At its mid-December meeting, Fed officials raised their short-term target interest rate for the first time in a year by a quarter percentage point to between 0.50% and 0.75%. The fourth quarter also saw the implementation of the U.S. Securities and Exchange Commission’s new rules for money market funds, which included floating net asset values (NAVs) for institutional prime and municipal money market funds as well as liquidity fees and redemption gates. In the year leading up to money market fund reform implementation, nearly $1 trillion in assets moved from these types of money market funds into government money market funds, which continued to transact at a stable $1 NAV. Outside of the U.S., the prospects for faster U.S. growth appeared to trigger some acceleration in Europe. The improvement may be partly attributable to expectations for further strengthening of the U.S. dollar, which in turn could improve demand for European goods in the U.S. due to weakening of the euro relative to the dollar. Meanwhile, rising inflation across the eurozone and Japan caused an upward shift in yield curves in those areas although developed-country bond yields remained significantly lower than U.S. Treasury yields.
Globally, stocks delivered positive results and economies showed some improvement in the first quarter of 2017.
Stocks rallied globally through the first quarter of 2017, supported by signs of improvement in the U.S. and global economies. U.S. economic data released during the quarter reflected a healthy economy. Hiring remained strong, and business and consumer sentiment improved. Meanwhile, inflation inched up during the quarter. Along with the pickup in inflation, investors appeared to shift
| 1 | The S&P 500 Index consists of 500 stocks chosen for market size, liquidity, and industry group representation. It is a market-value-weighted index with each stock’s weight in the index proportionate to its market value. You cannot invest directly in an index. |
| 2 | The Morgan Stanley Capital International (MSCI) All Country World Index (ACWI) ex USA Index (Net) is a free-float-adjusted market-capitalization-weighted index that is designed to measure the equity market performance of developed markets, excluding the United States and Canada. Source: MSCI. MSCI makes no express or implied warranties or representations and shall have no liability whatsoever with respect to any MSCI data contained herein. The MSCI data may not be further redistributed or used as a basis for other indexes or any securities or financial products. This report is not approved, reviewed, or produced by MSCI. You cannot invest directly in an index. |
| 3 | The Bloomberg Barclays U.S. Aggregate Bond Index (formerly known as Barclays U.S. Aggregate Bond Index) is a broad-based benchmark that measures the investment-grade, U.S. dollar–denominated, fixed-rate taxable bond market, including Treasuries, government-related and corporate securities, mortgage-backed securities (agency fixed-rate and hybrid adjustable-rate mortgage pass-throughs), asset-backed securities, and commercial mortgage-backed securities. You cannot invest directly in an index. |
| | | | | | |
| Letter to shareholders (unaudited) | | Wells Fargo Special Mid Cap Value Fund | | | 3 | |
from a mindset of very gradual interest-rate increases by the Fed to an anticipation of three or four increases in 2017. The first of these occurred in March; Fed officials raised their short-term target rate by a quarter percentage point to between 0.75% and 1.00%. With the Fed’s target-rate increase, short-term bond yields rose during the quarter. Meanwhile, longer-term Treasury yields were little changed, leading to positive performance. Investment-grade and high-yield bonds benefited from strong demand. Municipal bond returns were positive in the quarter, helped by strong demand and constrained new-issue supply. Outside of the U.S., credit spreads narrowed, helping lower-quality credit outperform amid a strong demand for yield. Also, stocks in emerging markets generally outperformed stocks in the U.S. and international developed markets. Thus far in 2017, emerging markets overall have benefited from both global economic growth and recent weakening in the U.S. dollar. European stocks also outperformed the U.S. market, despite investors’ concern over uncertainties such as the potential impact of an upcoming election in France; a contender for president of France, Marine Le Pen, favored exiting the European Union, which could potentially destabilize or topple the organization.
Don’t let short-term uncertainty derail long-term investment goals.
Periods of uncertainty can present challenges, but experience has taught us that maintaining long-term investment goals can be an effective way to plan for the future. To help you create a sound strategy based on your personal goals and risk tolerance, Wells Fargo Funds offers more than 100 mutual funds spanning a wide range of asset classes and investment styles. Although diversification cannot guarantee an investment profit or prevent losses, we believe it can be an effective way to manage investment risk and potentially smooth out overall portfolio performance. We encourage investors to know their investments and to understand that appropriate levels of risk-taking may unlock opportunities.
Thank you for choosing to invest in Wells Fargo Funds. We appreciate your confidence in us and remain committed to helping you meet your financial needs.
Sincerely,

Andrew Owen
President
Wells Fargo Funds
Although diversification cannot guarantee an investment profit or prevent losses, we believe it can be an effective way to manage investment risk and potentially smooth out overall portfolio performance.
For further information about your Fund, contact your investment professional, visit our website at wellsfargofunds.com, or call us directly at 1-800-222-8222. We are available 24 hours a day, 7 days a week.
| | | | |
| 4 | | Wells Fargo Special Mid Cap Value Fund | | Performance highlights (unaudited) |
Investment objective
The Fund seeks long-term capital appreciation.
Manager
Wells Fargo Funds Management, LLC
Subadviser
Wells Capital Management Incorporated
Portfolio managers
James M. Tringas, CFA®, CPA
Bryant VanCronkhite, CFA®, CPA
Average annual total returns (%) as of March 31, 20171
| | | | | | | | | | | | | | | | | | | | | | | | | | | | | | | | | | |
| | | | | Including sales charge | | | Excluding sales charge | | | Expense ratios2 (%) | |
| | | Inception date | | 1 year | | | 5 year | | | 10 year | | | 1 year | | | 5 year | | | 10 year | | | Gross | | | Net3 | |
| Class A (WFPAX) | | 7-31-2007 | | | 12.74 | | | | 13.41 | | | | 7.77 | | | | 19.62 | | | | 14.76 | | | | 8.41 | | | | 1.20 | | | | 1.20 | |
| Class C (WFPCX) | | 7-31-2007 | | | 17.69 | | | | 13.90 | | | | 7.61 | | | | 18.69 | | | | 13.90 | | | | 7.61 | | | | 1.95 | | | | 1.95 | |
| Class R (WFHHX) | | 9-30-2015 | | | – | | | | – | | | | – | | | | 19.31 | | | | 14.50 | | | | 8.16 | | | | 1.45 | | | | 1.45 | |
| Class R6 (WFPRX) | | 6-28-2013 | | | – | | | | – | | | | – | | | | 20.11 | | | | 15.27 | | | | 8.86 | | | | 0.77 | | | | 0.77 | |
| Administrator Class (WFMDX) | | 4-8-2005 | | | – | | | | – | | | | – | | | | 19.69 | | | | 14.89 | | | | 8.54 | | | | 1.12 | | | | 1.12 | |
| Institutional Class (WFMIX) | | 4-8-2005 | | | – | | | | – | | | | – | | | | 20.02 | | | | 15.22 | | | | 8.83 | | | | 0.87 | | | | 0.87 | |
| Russell Midcap® Value Index4 | | – | | | – | | | | – | | | | – | | | | 19.82 | | | | 14.07 | | | | 7.47 | | | | – | | | | – | |
Figures quoted represent past performance, which is no guarantee of future results, and do not reflect taxes that a shareholder may pay on fund distributions or the redemption of fund shares. Investment return and principal value of an investment will fluctuate so that an investor’s shares, when redeemed, may be worth more or less than their original cost. Performance shown without sales charges would be lower if sales charges were reflected. Current performance may be lower or higher than the performance data quoted, which assumes the reinvestment of dividends and capital gains. Current month-end performance is available on the Fund’s website, wellsfargofunds.com.
Index returns do not include transaction costs associated with buying and selling securities, any mutual fund fees or expenses, or any taxes. It is not possible to invest directly in an index.
For Class A shares, the maximum front-end sales charge is 5.75%. For Class C shares, the maximum contingent deferred sales charge is 1.00%. Performance including a contingent deferred sales charge assumes the sales charge for the corresponding time period. Class R, Class R6, Administrator Class, and Institutional Class shares are sold without a front-end sales charge or contingent deferred sales charge.
Stock values fluctuate in response to the activities of individual companies and general market and economic conditions. Smaller-company stocks tend to be more volatile and less liquid than those of larger companies. Consult the Fund’s prospectus for additional information on these and other risks.
Please see footnotes on page 5.
| | | | | | |
| Performance highlights (unaudited) | | Wells Fargo Special Mid Cap Value Fund | | | 5 | |
| | | | |
| Ten largest holdings (%) as of March 31, 20175 | |
TreeHouse Foods Incorporated | | | 3.10 | |
Harris Corporation | | | 2.94 | |
Republic Services Incorporated | | | 2.91 | |
Fidelity National Information Services Incorporated | | | 2.81 | |
Ameren Corporation | | | 2.52 | |
Molson Coors Brewing Company Class B | | | 2.50 | |
Kansas City Southern | | | 2.30 | |
The Allstate Corporation | | | 2.18 | |
Loews Corporation | | | 2.16 | |
American Electric Power Company Incorporated | | | 2.12 | |
|
| Sector distribution as of March 31, 20176 |
|
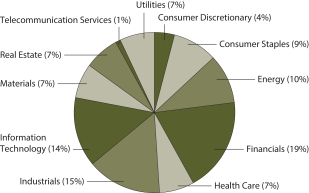 |
| 1 | Historical performance shown for Class A shares prior to their inception reflects the performance of the former Investor Class shares, and includes the higher expenses applicable to the former Investor Class shares. If these expenses had not been included, returns for Class A shares would be higher. Historical performance shown for Class C shares prior to their inception reflects the performance of the former Investor Class shares and has been adjusted to reflect the higher expenses applicable to Class C shares. Historical performance shown for the Class R shares prior to their inception reflects the performance of the Institutional Class shares, adjusted to reflect the higher expenses applicable to Class R shares. Historical performance shown for Class R6 shares prior to their inception reflects the performance of Institutional Class shares, and includes the higher expenses applicable to Institutional Class shares. If these expenses had not been included, the returns for Class R6 shares would be higher. |
| 2 | Reflects the expense ratios as stated in the most recent prospectuses, which include the impact of 0.01% in acquired fund fees and expenses. The expense ratios shown are subject to change and may differ from the annualized expense ratios shown in the financial highlights of this report, which do not include acquired fund fees and expenses. |
| 3 | The manager has contractually committed through January 31, 2018, to waive fees and/or reimburse expenses to the extent necessary to cap the Fund’s Total Annual Fund Operating Expenses After Fee Waivers at 1.22% for Class A, 1.97% for Class C, 1.47% for Class R, 0.79% for Class R6, 1.14% for Administrator Class, and 0.87% for Institutional Class. After this time, the cap may be increased or the commitment to maintain the cap may be terminated only with the approval of the Board of Trustees. Brokerage commissions, stamp duty fees, interest, taxes, acquired fund fees and expenses, and extraordinary expenses are excluded from the expense cap. Without this cap, the Fund’s returns would have been lower. The expense ratio paid by an investor is the net expense ratio or the Fund’s Total Annual Fund Operating Expenses After Fee Waivers, as stated in the prospectuses. |
| 4 | The Russell Midcap® Value Index measures the performance of those Russell Midcap companies with lower price-to-book ratios and lower forecasted growth values. The stocks are also members of the Russell 1000® Value Index. You cannot invest directly in an index. |
| 5 | The ten largest holdings, excluding cash and cash equivalents, are calculated based on the value of the investments divided by total net assets of the Fund. Holdings are subject to change and may have changed since the date specified. |
| 6 | Amounts are calculated based on the total long-term investments of the Fund. These amounts are subject to change and may have changed since the date specified. |
| | | | |
| 6 | | Wells Fargo Special Mid Cap Value Fund | | Fund expenses (unaudited) |
As a shareholder of the Fund, you incur two types of costs: (1) transaction costs, including sales charges (loads) on purchase payments and contingent deferred sales charges (if any) on redemptions and (2) ongoing costs, including management fees, distribution (12b-1) and/or shareholder servicing fees, and other Fund expenses. This example is intended to help you understand your ongoing costs (in dollars) of investing in the Fund and to compare these costs with the ongoing costs of investing in other mutual funds.
The example is based on an investment of $1,000 invested at the beginning of the six-month period and held for the entire period from October 1, 2016 to March 31, 2017.
Actual expenses
The “Actual” line of the table below provides information about actual account values and actual expenses. You may use the information in this line, together with the amount you invested, to estimate the expenses that you paid over the period. Simply divide your account value by $1,000 (for example, an $8,600 account value divided by $1,000 = 8.6), then multiply the result by the number in the “Actual” line under the heading entitled “Expenses paid during period” for your applicable class of shares to estimate the expenses you paid on your account during this period.
Hypothetical example for comparison purposes
The “Hypothetical” line of the table below provides information about hypothetical account values and hypothetical expenses based on the Fund’s actual expense ratio and an assumed rate of return of 5% per year before expenses, which is not the Fund’s actual return. The hypothetical account values and expenses may not be used to estimate the actual ending account balance or expenses you paid for the period. You may use this information to compare the ongoing costs of investing in the Fund and other funds. To do so, compare this 5% hypothetical example with the 5% hypothetical examples that appear in the shareholder reports of the other funds.
Please note that the expenses shown in the table are meant to highlight your ongoing costs only and do not reflect any transactional costs, such as sales charges (loads) and contingent deferred sales charges. Therefore, the “Hypothetical” line of the table is useful in comparing ongoing costs only and will not help you determine the relative total costs of owning different funds. In addition, if these transactional costs were included, your costs would have been higher.
| | | | | | | | | | | | | | | | |
| | | Beginning
account value
10-1-2016 | | | Ending
account value
3-31-2017 | | | Expenses
paid during
the period¹ | | | Annualized net
expense ratio | |
Class A | | | | | | | | | | | | | | | | |
Actual | | $ | 1,000.00 | | | $ | 1,094.34 | | | $ | 6.16 | | | | 1.18 | % |
Hypothetical (5% return before expenses) | | $ | 1,000.00 | | | $ | 1,019.05 | | | $ | 5.94 | | | | 1.18 | % |
Class C | | | | | | | | | | | | | | | | |
Actual | | $ | 1,000.00 | | | $ | 1,090.19 | | | $ | 10.06 | | | | 1.93 | % |
Hypothetical (5% return before expenses) | | $ | 1,000.00 | | | $ | 1,015.31 | | | $ | 9.70 | | | | 1.93 | % |
Class R | | | | | | | | | | | | | | | | |
Actual | | $ | 1,000.00 | | | $ | 1,092.76 | | | $ | 7.46 | | | | 1.43 | % |
Hypothetical (5% return before expenses) | | $ | 1,000.00 | | | $ | 1,017.80 | | | $ | 7.19 | | | | 1.43 | % |
Class R6 | | | | | | | | | | | | | | | | |
Actual | | $ | 1,000.00 | | | $ | 1,096.29 | | | $ | 3.92 | | | | 0.75 | % |
Hypothetical (5% return before expenses) | | $ | 1,000.00 | | | $ | 1,021.19 | | | $ | 3.78 | | | | 0.75 | % |
Administrator Class | | | | | | | | | | | | | | | | |
Actual | | $ | 1,000.00 | | | $ | 1,094.54 | | | $ | 5.74 | | | | 1.10 | % |
Hypothetical (5% return before expenses) | | $ | 1,000.00 | | | $ | 1,019.45 | | | $ | 5.54 | | | | 1.10 | % |
Institutional Class | | | | | | | | | | | | | | | | |
Actual | | $ | 1,000.00 | | | $ | 1,096.04 | | | $ | 4.44 | | | | 0.85 | % |
Hypothetical (5% return before expenses) | | $ | 1,000.00 | | | $ | 1,020.69 | | | $ | 4.28 | | | | 0.85 | % |
| 1 | Expenses paid is equal to the annualized net expense ratio of each class multiplied by the average account value over the period, multiplied by the number of days in the most recent fiscal half-year divided by the number of days in the fiscal year (to reflect the one-half-year period). |
| | | | | | |
| Portfolio of investments—March 31, 2017 (unaudited) | | Wells Fargo Special Mid Cap Value Fund | | | 7 | |
| | | | | | | | | | | | | | | | |
| Security name | | | | | | | | Shares | | | Value | |
| | | | |
Common Stocks: 94.98% | | | | | | | | | | | | | | | | |
| | | | |
Consumer Discretionary: 3.62% | | | | | | | | | | | | | | | | |
| | | | |
| Hotels, Restaurants & Leisure: 0.78% | | | | | | | | | | | | | | | | |
The Wendy’s Company | | | | | | | | | | | 3,721,100 | | | $ | 50,644,171 | |
| | | | | | | | | | | | | | | | |
| | | | |
| Multiline Retail: 1.78% | | | | | | | | | | | | | | | | |
Kohl’s Corporation | | | | | | | | | | | 2,896,900 | | | | 115,325,589 | |
| | | | | | | | | | | | | | | | |
| | | | |
| Specialty Retail: 1.06% | | | | | | | | | | | | | | | | |
Signet Jewelers Limited | | | | | | | | | | | 995,400 | | | | 68,951,358 | |
| | | | | | | | | | | | | | | | |
| | | | |
Consumer Staples: 8.78% | | | | | | | | | | | | | | | | |
| | | | |
| Beverages: 2.50% | | | | | | | | | | | | | | | | |
Molson Coors Brewing Company Class B | | | | | | | | | | | 1,700,110 | | | | 162,717,528 | |
| | | | | | | | | | | | | | | | |
| | | | |
| Food & Staples Retailing: 1.21% | | | | | | | | | | | | | | | | |
The Kroger Company | | | | | | | | | | | 2,661,600 | | | | 78,490,584 | |
| | | | | | | | | | | | | | | | |
| | | | |
| Food Products: 5.07% | | | | | | | | | | | | | | | | |
Pinnacle Foods Incorporated | | | | | | | | | | | 1,202,900 | | | | 69,611,823 | |
The Hain Celestial Group Incorporated † | | | | | | | | | | | 1,582,000 | | | | 58,850,400 | |
TreeHouse Foods Incorporated † | | | | | | | | | | | 2,375,609 | | | | 201,119,058 | |
| | | | |
| | | | | | | | | | | | | | | 329,581,281 | |
| | | | | | | | | | | | | | | | |
| | | | |
Energy: 9.15% | | | | | | | | | | | | | | | | |
| | | | |
| Energy Equipment & Services: 5.86% | | | | | | | | | | | | | | | | |
Baker Hughes Incorporated | | | | | | | | | | | 2,181,400 | | | | 130,491,348 | |
Frank’s International N.V. « | | | | | | | | | | | 2,796,900 | | | | 29,563,233 | |
National Oilwell Varco Incorporated | | | | | | | | | | | 2,760,600 | | | | 110,672,454 | |
Patterson-UTI Energy Incorporated | | | | | | | | | | | 4,527,500 | | | | 109,882,425 | |
| | | | |
| | | | | | | | | | | | | | | 380,609,460 | |
| | | | | | | | | | | | | | | | |
| | | | |
| Oil, Gas & Consumable Fuels: 3.29% | | | | | | | | | | | | | | | | |
Anadarko Petroleum Corporation | | | | | | | | | | | 1,477,500 | | | | 91,605,000 | |
Cimarex Energy Company | | | | | | | | | | | 186,010 | | | | 22,226,335 | |
Hess Corporation | | | | | | | | | | | 2,073,500 | | | | 99,963,435 | |
| | | | |
| | | | | | | | | | | | | | | 213,794,770 | |
| | | | | | | | | | | | | | | | |
| | | | |
Financials: 18.59% | | | | | | | | | | | | | | | | |
| | | | |
| Banks: 4.91% | | | | | | | | | | | | | | | | |
Fifth Third Bancorp | | | | | | | | | | | 2,655,700 | | | | 67,454,780 | |
PacWest Bancorp | | | | | | | | | | | 1,921,207 | | | | 102,323,485 | |
Regions Financial Corporation | | | | | | | | | | | 6,879,600 | | | | 99,960,588 | |
Zions Bancorporation | | | | | | | | | | | 1,171,800 | | | | 49,215,600 | |
| | | | |
| | | | | | | | | | | | | | | 318,954,453 | |
| | | | | | | | | | | | | | | | |
| | | | |
| Capital Markets: 1.56% | | | | | | | | | | | | | | | | |
Northern Trust Corporation | | | | | | | | | | | 1,174,600 | | | | 101,696,868 | |
| | | | | | | | | | | | | | | | |
The accompanying notes are an integral part of these financial statements.
| | | | |
| 8 | | Wells Fargo Special Mid Cap Value Fund | | Portfolio of investments—March 31, 2017 (unaudited) |
| | | | | | | | | | | | | | | | |
| Security name | | | | | | | | Shares | | | Value | |
| | | | |
| Consumer Finance: 1.34% | | | | | | | | | | | | | | | | |
Ally Financial Incorporated | | | | | | | | | | | 4,270,761 | | | $ | 86,824,571 | |
| | | | | | | | | | | | | | | | |
| | | | |
| Insurance: 10.78% | | | | | | | | | | | | | | | | |
Arch Capital Group Limited † | | | | | | | | | | | 749,460 | | | | 71,026,324 | |
Brown & Brown Incorporated | | | | | | | | | | | 2,915,500 | | | | 121,634,660 | |
FNF Group | | | | | | | | | | | 2,978,114 | | | | 115,967,759 | |
Loews Corporation | | | | | | | | | | | 3,002,500 | | | | 140,426,925 | |
The Allstate Corporation | | | | | | | | | | | 1,735,300 | | | | 141,409,597 | |
Willis Towers Watson plc | | | | | | | | | | | 839,000 | | | | 109,816,710 | |
| | | | |
| | | | | | | | | | | | | | | 700,281,975 | |
| | | | | | | | | | | | | | | | |
| | | | |
Health Care: 6.42% | | | | | | | | | | | | | | | | |
| | | | |
| Health Care Equipment & Supplies: 2.37% | | | | | | | | | | | | | | | | |
Steris plc | | | | | | | | | | | 1,017,200 | | | | 70,654,712 | |
Varian Medical Systems Incorporated | | | | | | | | | | | 912,300 | | | | 83,137,899 | |
| | | | |
| | | | | | | | | | | | | | | 153,792,611 | |
| | | | | | | | | | | | | | | | |
| | | | |
| Health Care Providers & Services: 4.05% | | | | | | | | | | | | | | | | |
AmerisourceBergen Corporation | | | | | | | | | | | 746,500 | | | | 66,065,250 | |
Humana Incorporated | | | | | | | | | | | 597,800 | | | | 123,230,492 | |
Patterson Companies Incorporated « | | | | | | | | | | | 1,634,900 | | | | 73,946,527 | |
| | | | |
| | | | | | | | | | | | | | | 263,242,269 | |
| | | | | | | | | | | | | | | | |
| | | | |
Industrials: 14.35% | | | | | | | | | | | | | | | | |
| | | | |
| Aerospace & Defense: 3.64% | | | | | | | | | | | | | | | | |
Raytheon Company | | | | | | | | | | | 831,400 | | | | 126,788,500 | |
Rockwell Collins Incorporated | | | | | | | | | | | 1,128,000 | | | | 109,596,480 | |
| | | | |
| | | | | | | | | | | | | | | 236,384,980 | |
| | | | | | | | | | | | | | | | |
| | | | |
| Commercial Services & Supplies: 4.46% | | | | | | | | | | | | | | | | |
Republic Services Incorporated | | | | | | | | | | | 3,010,675 | | | | 189,100,497 | |
Stericycle Incorporated † | | | | | | | | | | | 1,211,300 | | | | 100,404,657 | |
| | | | |
| | | | | | | | | | | | | | | 289,505,154 | |
| | | | | | | | | | | | | | | | |
| | | | |
| Machinery: 2.11% | | | | | | | | | | | | | | | | |
Deere & Company | | | | | | | | | | | 521,400 | | | | 56,759,604 | |
Flowserve Corporation | | | | | | | | | | | 1,658,200 | | | | 80,290,044 | |
| | | | |
| | | | | | | | | | | | | | | 137,049,648 | |
| | | | | | | | | | | | | | | | |
| | | | |
| Marine: 0.17% | | | | | | | | | | | | | | | | |
Kirby Corporation † | | | | | | | | | | | 158,500 | | | | 11,182,175 | |
| | | | | | | | | | | | | | | | |
| | | | |
| Road & Rail: 3.97% | | | | | | | | | | | | | | | | |
Kansas City Southern | | | | | | | | | | | 1,740,100 | | | | 149,230,976 | |
Ryder System Incorporated | | | | | | | | | | | 1,443,100 | | | | 108,867,464 | |
| | | | |
| | | | | | | | | | | | | | | 258,098,440 | |
| | | | | | | | | | | | | | | | |
The accompanying notes are an integral part of these financial statements.
| | | | | | |
| Portfolio of investments—March 31, 2017 (unaudited) | | Wells Fargo Special Mid Cap Value Fund | | | 9 | |
| | | | | | | | | | | | | | | | |
| Security name | | | | | | | | Shares | | | Value | |
| | | | |
Information Technology: 13.07% | | | | | | | | | | | | | | | | |
| | | | |
| Communications Equipment: 4.65% | | | | | | | | | | | | | | | | |
ARRIS International plc † | | | | | | | | | | | 4,197,300 | | | $ | 111,018,585 | |
Harris Corporation | | | | | | | | | | | 1,716,100 | | | | 190,950,447 | |
| | | | |
| | | | | | | | | | | | | | | 301,969,032 | |
| | | | | | | | | | | | | | | | |
| | | | |
| IT Services: 7.98% | | | | | | | | | | | | | | | | |
Amdocs Limited | | | | | | | | | | | 1,849,800 | | | | 112,819,302 | |
DST Systems Incorporated | | | | | | | | | | | 887,082 | | | | 108,667,545 | |
Fidelity National Information Services Incorporated | | | | | | | | | | | 2,295,000 | | | | 182,727,900 | |
Leidos Holdings Incorporated | | | | | | | | | | | 2,230,500 | | | | 114,067,770 | |
| | | | |
| | | | | | | | | | | | | | | 518,282,517 | |
| | | | | | | | | | | | | | | | |
| | | | |
| Technology Hardware, Storage & Peripherals: 0.44% | | | | | | | | | | | | | | | | |
Western Digital Corporation | | | | | | | | | | | 347,500 | | | | 28,679,175 | |
| | | | | | | | | | | | | | | | |
| | | | |
Materials: 6.80% | | | | | | | | | | | | | | | | |
| | | | |
| Chemicals: 2.47% | | | | | | | | | | | | | | | | |
International Flavors & Fragrances Incorporated | | | | | | | | | | | 786,500 | | | | 104,234,845 | |
PPG Industries Incorporated | | | | | | | | | | | 534,100 | | | | 56,123,228 | |
| | | | |
| | | | | | | | | | | | | | | 160,358,073 | |
| | | | | | | | | | | | | | | | |
| | | | |
| Construction Materials: 0.99% | | | | | | | | | | | | | | | | |
Eagle Materials Incorporated | | | | | | | | | | | 664,000 | | | | 64,500,960 | |
| | | | | | | | | | | | | | | | |
| | | | |
| Containers & Packaging: 3.34% | | | | | | | | | | | | | | | | |
International Paper Company | | | | | | | | | | | 1,811,000 | | | | 91,962,580 | |
Packaging Corporation of America | | | | | | | | | | | 1,361,300 | | | | 124,722,306 | |
| | | | |
| | | | | | | | | | | | | | | 216,684,886 | |
| | | | | | | | | | | | | | | | |
| | | | |
Real Estate: 6.40% | | | | | | | | | | | | | | | | |
| | | | |
| Equity REITs: 4.35% | | | | | | | | | | | | | | | | |
American Campus Communities Incorporated | | | | | | | | | | | 2,326,785 | | | | 110,731,698 | |
Corporate Office Properties Trust | | | | | | | | | | | 1,513,500 | | | | 50,096,850 | |
Invitation Homes Incorporated † | | | | | | | | | | | 2,605,828 | | | | 56,885,225 | |
Mid-America Apartment Communities Incorporated | | | | | | | | | | | 636,600 | | | | 64,767,684 | |
| | | | |
| | | | | | | | | | | | | | | 282,481,457 | |
| | | | | | | | | | | | | | | | |
| | | | |
| Real Estate Management & Development: 2.05% | | | | | | | | | | | | | | | | |
CBRE Group Incorporated Class A † | | | | | | | | | | | 3,598,800 | | | | 125,202,252 | |
Jones Lang LaSalle Incorporated | | | | | | | | | | | 75,700 | | | | 8,436,765 | |
| | | | |
| | | | | | | | | | | | | | | 133,639,017 | |
| | | | | | | | | | | | | | | | |
| | | | |
Telecommunication Services: 1.23% | | | | | | | | | | | | | | | | |
| | | | |
| Diversified Telecommunication Services: 1.23% | | | | | | | | | | | | | | | | |
CenturyLink Incorporated « | | | | | | | | | | | 3,404,100 | | | | 80,234,637 | |
| | | | | | | | | | | | | | | | |
The accompanying notes are an integral part of these financial statements.
| | | | |
| 10 | | Wells Fargo Special Mid Cap Value Fund | | Portfolio of investments—March 31, 2017 (unaudited) |
| | | | | | | | | | | | | | | | |
| Security name | | | | | | | | Shares | | | Value | |
| | | | |
Utilities: 6.57% | | | | | | | | | | | | | | | | |
| | | | |
| Electric Utilities: 2.12% | | | | | | | | | | | | | | | | |
American Electric Power Company Incorporated | | | | | | | | | | | 2,050,960 | | | $ | 137,680,945 | |
| | | | | | | | | | | | | | | | |
| | | | |
| Multi-Utilities: 2.52% | | | | | | | | | | | | | | | | |
Ameren Corporation | | | | | | | | | | | 3,002,550 | | | | 163,909,205 | |
| | | | | | | | | | | | | | | | |
| | | | |
| Water Utilities: 1.93% | | | | | | | | | | | | | | | | |
American Water Works Company Incorporated | | | | | | | | | | | 1,615,500 | | | | 125,637,435 | |
| | | | | | | | | | | | | | | | |
| | | | |
Total Common Stocks (Cost $5,352,698,216) | | | | | | | | | | | | | | | 6,171,185,224 | |
| | | | | | | | | | | | | | | | |
| | | | |
| | | Yield | | | | | | | | | | |
Short-Term Investments: 7.19% | | | | | | | | | | | | | | | | |
| | | | |
| Investment Companies: 7.19% | | | | | | | | | | | | | | | | |
Securities Lending Cash Investment LLC (l)(r)(u) | | | 0.98 | % | | | | | | | 114,295,471 | | | | 114,306,901 | |
Wells Fargo Government Money Market Fund Select Class (l)(u) | | | 0.63 | | | | | | | | 352,587,499 | | | | 352,587,499 | |
| | | | |
Total Short-Term Investments (Cost $466,894,400) | | | | | | | | | | | | | | | 466,894,400 | |
| | | | | | | | | | | | | | | | |
| | | | | | | | |
| Total investments in securities (Cost $5,819,592,616) * | | | 102.17 | % | | | 6,638,079,624 | |
Other assets and liabilities, net | | | (2.17 | ) | | | (140,793,218 | ) |
| | | | | | | | |
| Total net assets | | | 100.00 | % | | $ | 6,497,286,406 | |
| | | | | | | | |
| † | Non-income-earning security |
| « | All or a portion of this security is on loan. |
| (l) | The issuer of the security is an affiliated person of the Fund as defined in the Investment Company Act of 1940. |
| (r) | The investment is a non-registered investment vehicle purchased with cash collateral received from securities on loan. |
| (u) | The rate represents the 7-day annualized yield at period end. |
| * | Cost for federal income tax purposes is $5,819,687,276 and unrealized gains (losses) consists of: |
| | | | |
Gross unrealized gains | | $ | 870,826,255 | |
Gross unrealized losses | | | (52,433,907 | ) |
| | | | |
Net unrealized gains | | $ | 818,392,348 | |
The accompanying notes are an integral part of these financial statements.
| | | | | | |
| Statement of assets and liabilities—March 31, 2017 (unaudited) | | Wells Fargo Special Mid Cap Value Fund | | | 11 | |
| | | | |
| | | | |
| |
Assets | | | | |
Investments | | | | |
In unaffiliated securities (including $111,222,326 of securities loaned), at value (cost $5,352,698,216) | | $ | 6,171,185,224 | |
In affiliated securities, at value (cost $466,894,400) | | | 466,894,400 | |
| | | | |
Total investments, at value (cost $5,819,592,616) | | | 6,638,079,624 | |
Receivable for investments sold | | | 23,501,732 | |
Receivable for Fund shares sold | | | 68,998,281 | |
Receivable for dividends | | | 7,180,148 | |
Receivable for securities lending income | | | 112,570 | |
Prepaid expenses and other assets | | | 221,117 | |
| | | | |
Total assets | | | 6,738,093,472 | |
| | | | |
| |
Liabilities | | | | |
Payable for investments purchased | | | 83,564,781 | |
Payable for Fund shares redeemed | | | 36,923,976 | |
Payable upon receipt of securities loaned | | | 114,306,901 | |
Management fee payable | | | 3,918,994 | |
Distribution fees payable | | | 116,274 | |
Administration fees payable | | | 808,951 | |
Accrued expenses and other liabilities | | | 1,167,189 | |
| | | | |
Total liabilities | | | 240,807,066 | |
| | | | |
Total net assets | | $ | 6,497,286,406 | |
| | | | |
| |
NET ASSETS CONSIST OF | | | | |
Paid-in capital | | $ | 5,500,322,817 | |
Undistributed net investment income | | | 8,916,348 | |
Accumulated net realized gains on investments | | | 169,560,233 | |
Net unrealized gains on investments | | | 818,487,008 | |
| | | | |
Total net assets | | $ | 6,497,286,406 | |
| | | | |
| |
COMPUTATION OF NET ASSET VALUE AND OFFERING PRICE PER SHARE | | | | |
Net assets – Class A | | $ | 1,047,479,423 | |
Shares outstanding – Class A1 | | | 29,214,790 | |
Net asset value per share – Class A | | | $35.85 | |
Maximum offering price per share – Class A2 | | | $38.04 | |
Net assets – Class C | | $ | 172,438,201 | |
Shares outstanding – Class C1 | | | 4,985,274 | |
Net asset value per share – Class C | | | $34.59 | |
Net assets – Class R | | $ | 5,406,970 | |
Shares outstanding – Class R1 | | | 148,296 | |
Net asset value per share – Class R | | | $36.46 | |
Net assets – Class R6 | | $ | 601,892,414 | |
Shares outstanding – Class R61 | | | 16,372,326 | |
Net asset value per share – Class R6 | | | $36.76 | |
Net assets – Administrator Class | | $ | 1,003,549,351 | |
Shares outstanding – Administrator Class1 | | | 27,539,476 | |
Net asset value per share – Administrator Class | | | $36.44 | |
Net assets – Institutional Class | | $ | 3,666,520,047 | |
Shares outstanding – Institutional Class1 | | | 99,811,480 | |
Net asset value per share – Institutional Class | | | $36.73 | |
| 1 | The Fund has an unlimited number of authorized shares. |
| 2 | Maximum offering price is computed as 100/94.25 of net asset value. On investments of $50,000 or more, the offering price is reduced. |
The accompanying notes are an integral part of these financial statements.
| | | | |
| 12 | | Wells Fargo Special Mid Cap Value Fund | | Statement of operations—six months ended March 31, 2017 (unaudited) |
| | | | |
| | | | |
| |
Investment income | | | | |
Dividends (net of foreign withholding taxes of $26,458) | | $ | 49,842,979 | |
Income from affiliated securities | | | 675,535 | |
Securities lending income, net | | | 317,025 | |
| | | | |
Total investment income | | | 50,835,539 | |
| | | | |
| |
Expenses | | | | |
Management fee | | | 19,636,494 | |
Administration fees | | | | |
Class A | | | 1,499,918 | |
Class C | | | 150,658 | |
Class R | | | 3,618 | |
Class R6 | | | 70,385 | |
Administrator Class | | | 602,431 | |
Institutional Class | | | 1,816,684 | |
Shareholder servicing fees | | | | |
Class A | | | 1,785,616 | |
Class C | | | 179,355 | |
Class R | | | 4,307 | |
Administrator Class | | | 1,158,521 | |
Distribution fees | | | | |
Class C | | | 538,064 | |
Class R | | | 4,307 | |
Custody and accounting fees | | | 120,000 | |
Professional fees | | | 22,433 | |
Registration fees | | | 347,569 | |
Shareholder report expenses | | | 691,860 | |
Trustees’ fees and expenses | | | 10,030 | |
Other fees and expenses | | | 18,947 | |
| | | | |
Total expenses | | | 28,661,197 | |
| | | | |
Net investment income | | | 22,174,342 | |
| | | | |
| |
REALIZED AND UNREALIZED GAINS (LOSSES) ON INVESTMENTS | | | | |
Net realized gains on investments | | | 201,481,955 | |
Net change in unrealized gains (losses) on investments | | | 279,366,936 | |
| | | | |
Net realized and unrealized gains (losses) on investments | | | 480,848,891 | |
| | | | |
Net increase in net assets resulting from operations | | $ | 503,023,233 | |
| | | | |
The accompanying notes are an integral part of these financial statements.
| | | | | | |
| Statement of changes in net assets | | Wells Fargo Special Mid Cap Value Fund | | | 13 | |
| | | | | | | | | | | | | | | | |
| | | Six months ended
March 31, 2017 (unaudited) | | | Year ended
September 30, 2016 | |
| | | | |
Operations | | | | | | | | | | | | | | | | |
Net investment income | | | | | | $ | 22,174,342 | | | | | | | $ | 29,787,605 | |
Net realized gains on investments | | | | | | | 201,481,955 | | | | | | | | 1,165,809 | |
Net change in unrealized gains (losses) on investments | | | | | | | 279,366,936 | | | | | | | | 524,769,917 | |
| | | | |
Net increase in net assets resulting from operations | | | | | | | 503,023,233 | | | | | | | | 555,723,331 | |
| | | | |
| | | | |
Distributions to shareholders from | | | | | | | | | | | | | | | | |
Net investment income | | | | | | | | | | | | | | | | |
Class A | | | | | | | (7,950,644 | ) | | | | | | | (3,106,870 | ) |
Class C | | | | | | | (22,847 | ) | | | | | | | (20,450 | ) |
Class R | | | | | | | (20,893 | ) | | | | | | | (195 | ) |
Class R6 | | | | | | | (4,366,000 | ) | | | | | | | (1,171,323 | ) |
Administrator Class | | | | | | | (5,647,480 | ) | | | | | | | (2,729,427 | ) |
Institutional Class | | | | | | | (24,469,172 | ) | | | | | | | (3,574,594 | ) |
Net realized gains | | | | | | | | | | | | | | | | |
Class A | | | | | | | (8,040,188 | ) | | | | | | | (40,065,294 | ) |
Class C | | | | | | | (774,149 | ) | | | | | | | (2,776,111 | ) |
Class R | | | | | | | (15,345 | ) | | | | | | | (920 | ) |
Class R6 | | | | | | | (2,351,311 | ) | | | | | | | (5,563,069 | ) |
Administrator Class | | | | | | | (4,977,762 | ) | | | | | | | (17,677,686 | ) |
Institutional Class | | | | | | | (14,258,083 | ) | | | | | | | (17,921,301 | ) |
| | | | |
Total distributions to shareholders | | | | | | | (72,893,874 | ) | | | | | | | (94,607,240 | ) |
| | | | |
| | | | |
Capital share transactions | | | Shares | | | | | | | | Shares | | | | | |
Proceeds from shares sold | | | | | | | | | | | | | | | | |
Class A | | | 9,543,369 | | | | 334,331,311 | | | | 32,591,298 | | | | 1,012,650,670 | |
Class C | | | 1,816,412 | | | | 61,516,062 | | | | 2,098,801 | | | | 62,533,533 | |
Class R | | | 100,250 | | | | 3,575,702 | | | | 54,121 | | | | 1,738,947 | |
Class R6 | | | 6,617,572 | | | | 238,755,996 | | | | 8,542,115 | | | | 271,942,094 | |
Administrator Class | | | 5,760,379 | | | | 205,266,012 | | | | 36,577,283 | | | | 1,062,087,191 | |
Institutional Class | | | 41,656,760 | | | | 1,511,526,025 | | | | 64,727,505 | | | | 2,061,463,035 | |
Investor Class | | | N/A | | | | N/A | | | | 231,357 | 1 | | | 7,299,395 | 1 |
| | | | |
| | | | | | | 2,354,971,108 | | | | | | | | 4,479,714,865 | |
| | | | |
Reinvestment of distributions | | | | | | | | | | | | | | | | |
Class A | | | 430,399 | | | | 15,319,605 | | | | 1,432,793 | | | | 41,899,896 | |
Class C | | | 21,636 | | | | 747,041 | | | | 91,890 | | | | 2,596,151 | |
Class R | | | 1,001 | | | | 36,238 | | | | 37 | | | | 1,115 | |
Class R6 | | | 184,501 | | | | 6,716,953 | | | | 223,787 | | | | 6,734,392 | |
Administrator Class | | | 293,544 | | | | 10,613,440 | | | | 684,328 | | | | 20,395,161 | |
Institutional Class | | | 939,200 | | | | 34,186,140 | | | | 647,950 | | | | 19,486,743 | |
| | | | |
| | | | | | | 67,619,417 | | | | | | | | 91,113,458 | |
| | | | |
Payment for shares redeemed | | | | | | | | | | | | | | | | |
Class A | | | (21,918,606 | ) | | | (783,413,556 | ) | | | (9,893,268 | ) | | | (302,160,382 | ) |
Class C | | | (488,453 | ) | | | (16,426,181 | ) | | | (742,121 | ) | | | (22,059,406 | ) |
Class R | | | (5,583 | ) | | | (201,666 | ) | | | (2,344 | ) | | | (77,354 | ) |
Class R6 | | | (1,437,792 | ) | | | (51,662,158 | ) | | | (1,208,673 | ) | | | (38,504,373 | ) |
Administrator Class | | | (3,289,645 | ) | | | (117,578,563 | ) | | | (25,433,290 | ) | | | (773,879,830 | ) |
Institutional Class | | | (11,195,450 | ) | | | (401,631,960 | ) | | | (10,381,138 | ) | | | (332,586,897 | ) |
Investor Class | | | N/A | | | | N/A | | | | (17,217,665 | )1 | | | (549,439,619 | )1 |
| | | | |
| | | | | | | (1,370,914,084 | ) | | | | | | | (2,018,707,861 | ) |
| | | | |
Net increase in net assets resulting from capital share transactions | | | | | | | 1,051,676,441 | | | | | | | | 2,552,120,462 | |
| | | | |
Total increase in net assets | | | | | | | 1,481,805,800 | | | | | | | | 3,013,236,553 | |
| | | | |
| | | | |
Net assets | | | | | | | | | | | | | | | | |
Beginning of period | | | | | | | 5,015,480,606 | | | | | | | | 2,002,244,053 | |
| | | | |
End of period | | | | | | $ | 6,497,286,406 | | | | | | | $ | 5,015,480,606 | |
| | | | |
Undistributed net investment income | | | | | | $ | 8,916,348 | | | | | | | $ | 29,219,042 | |
| | | | |
| 1 | For the period from October 1, 2015 to October 23, 2015. Effective at the close of business on October 23, 2015, Investor Class shares were converted to Class A shares and are no longer offered by the Fund. |
The accompanying notes are an integral part of these financial statements.
| | | | |
| 14 | | Wells Fargo Special Mid Cap Value Fund | | Financial highlights |
(For a share outstanding throughout each period)
| | | | | | | | | | | | | | | | | | | | | | | | |
| | | Six months ended
March 31, 2017 (unaudited) | | | Year ended September 30 | |
| CLASS A | | | 2016 | | | 2015 | | | 2014 | | | 2013 | | | 2012 | |
Net asset value, beginning of period | | | $33.12 | | | | $29.91 | | | | $32.68 | | | | $30.36 | | | | $22.83 | | | | $17.84 | |
Net investment income | | | 0.10 | 1 | | | 0.19 | | | | 0.25 | | | | 0.12 | 1 | | | 0.15 | 1 | | | 0.08 | 1 |
Net realized and unrealized gains (losses) on investments | | | 3.01 | | | | 4.23 | | | | 0.07 | | | | 4.47 | | | | 7.60 | | | | 4.94 | |
| | | | | | | | | | | | | | | | | | | | | | | | |
Total from investment operations | | | 3.11 | | | | 4.42 | | | | 0.32 | | | | 4.59 | | | | 7.75 | | | | 5.02 | |
Distributions to shareholders from | | | | | | | | | | | | | | | | | | | | | | | | |
Net investment income | | | (0.19 | ) | | | (0.08 | ) | | | (0.18 | ) | | | (0.09 | ) | | | (0.22 | ) | | | (0.03 | ) |
Net realized gains | | | (0.19 | ) | | | (1.13 | ) | | | (2.91 | ) | | | (2.18 | ) | | | 0.00 | | | | 0.00 | |
| | | | | | | | | | | | | | | | | | | | | | | | |
Total distributions to shareholders | | | (0.38 | ) | | | (1.21 | ) | | | (3.09 | ) | | | (2.27 | ) | | | (0.22 | ) | | | (0.03 | ) |
Net asset value, end of period | | | $35.85 | | | | $33.12 | | | | $29.91 | | | | $32.68 | | | | $30.36 | | | | $22.83 | |
Total return2 | | | 9.43 | % | | | 15.34 | % | | | 0.69 | % | | | 15.70 | % | | | 34.23 | % | | | 28.18 | % |
Ratios to average net assets (annualized) | | | | | | | | | | | | | | | | | | | | | | | | |
Gross expenses | | | 1.18 | % | | | 1.19 | % | | | 1.25 | % | | | 1.28 | % | | | 1.29 | % | | | 1.30 | % |
Net expenses | | | 1.18 | % | | | 1.19 | % | | | 1.24 | % | | | 1.25 | % | | | 1.25 | % | | | 1.25 | % |
Net investment income | | | 0.56 | % | | | 0.82 | % | | | 0.85 | % | | | 0.38 | % | | | 0.54 | % | | | 0.38 | % |
Supplemental data | | | | | | | | | | | | | | | | | | | | | | | | |
Portfolio turnover rate | | | 37 | % | | | 30 | % | | | 58 | % | | | 58 | % | | | 87 | % | | | 87 | % |
Net assets, end of period (000s omitted) | | | $1,047,479 | | | | $1,363,213 | | | | $509,386 | | | | $110,219 | | | | $38,119 | | | | $9,545 | |
| 1 | Calculated based upon average shares outstanding |
| 2 | Total return calculations do not include any sales charges. Returns for periods of less than one year are not annualized. |
The accompanying notes are an integral part of these financial statements.
| | | | | | |
| Financial highlights | | Wells Fargo Special Mid Cap Value Fund | | | 15 | |
(For a share outstanding throughout each period)
| | | | | | | | | | | | | | | | | | | | | | | | |
| | | Six months ended
March 31, 2017 (unaudited) | | | Year ended September 30 | |
| CLASS C | | | 2016 | | | 2015 | | | 2014 | | | 2013 | | | 2012 | |
Net asset value, beginning of period | | | $31.91 | | | | $29.00 | | | | $31.82 | | | | $29.73 | | | | $22.38 | | | | $17.60 | |
Net investment income (loss) | | | (0.01 | ) | | | 0.03 | | | | 0.02 | 1 | | | (0.04 | ) | | | (0.07 | )1 | | | (0.03 | ) |
Net realized and unrealized gains (losses) on investments | | | 2.89 | | | | 4.02 | | | | 0.07 | | | | 4.31 | | | | 7.49 | | | | 4.81 | |
| | | | | | | | | | | | | | | | | | | | | | | | |
Total from investment operations | | | 2.88 | | | | 4.05 | | | | 0.09 | | | | 4.27 | | | | 7.42 | | | | 4.78 | |
Distributions to shareholders from | | | | | | | | | | | | | | | | | | | | | | | | |
Net investment income | | | (0.01 | ) | | | (0.01 | ) | | | 0.00 | | | | 0.00 | | | | (0.07 | ) | | | 0.00 | |
Net realized gains | | | (0.19 | ) | | | (1.13 | ) | | | (2.91 | ) | | | (2.18 | ) | | | 0.00 | | | | 0.00 | |
| | | | | | | | | | | | | | | | | | | | | | | | |
Total distributions to shareholders | | | (0.20 | ) | | | (1.14 | ) | | | (2.91 | ) | | | (2.18 | ) | | | (0.07 | ) | | | 0.00 | |
Net asset value, end of period | | | $34.59 | | | | $31.91 | | | | $29.00 | | | | $31.82 | | | | $29.73 | | | | $22.38 | |
Total return2 | | | 9.02 | % | | | 14.47 | % | | | (0.05 | )% | | | 14.86 | % | | | 33.23 | % | | | 27.16 | % |
Ratios to average net assets (annualized) | | | | | | | | | | | | | | | | | | | | | | | | |
Gross expenses | | | 1.93 | % | | | 1.94 | % | | | 2.00 | % | | | 2.03 | % | | | 2.04 | % | | | 2.06 | % |
Net expenses | | | 1.93 | % | | | 1.94 | % | | | 1.99 | % | | | 2.00 | % | | | 2.00 | % | | | 2.00 | % |
Net investment income (loss) | | | (0.16 | )% | | | 0.03 | % | | | 0.08 | % | | | (0.38 | )% | | | (0.25 | )% | | | (0.35 | )% |
Supplemental data | | | | | | | | | | | | | | | | | | | | | | | | |
Portfolio turnover rate | | | 37 | % | | | 30 | % | | | 58 | % | | | 58 | % | | | 87 | % | | | 87 | % |
Net assets, end of period (000s omitted) | | | $172,438 | | | | $116,022 | | | | $63,431 | | | | $29,217 | | | | $14,913 | | | | $2,770 | |
| 1 | Calculated based upon average shares outstanding |
| 2 | Total return calculations do not include any sales charges. Returns for periods of less than one year are not annualized. |
The accompanying notes are an integral part of these financial statements.
| | | | |
| 16 | | Wells Fargo Special Mid Cap Value Fund | | Financial highlights |
(For a share outstanding throughout each period)
| | | | | | | | | | | | |
| | | Six months ended
March 31, 2017 (unaudited) | | | Year ended September 30 | |
| CLASS R | | | 2016 | | | 20151 | |
Net asset value, beginning of period | | | $33.78 | | | | $30.70 | | | | $30.70 | |
Net investment income | | | 0.07 | 2 | | | 0.12 | 2 | | | 0.00 | |
Net realized and unrealized gains (losses) on investments | | | 3.06 | | | | 4.32 | | | | 0.00 | |
| | | | | | | | | | | | |
Total from investment operations | | | 3.13 | | | | 4.44 | | | | 0.00 | |
Distributions to shareholders from | | | | | | | | | | | | |
Net investment income | | | (0.26 | ) | | | (0.23 | ) | | | 0.00 | |
Net realized gains | | | (0.19 | ) | | | (1.13 | ) | | | 0.00 | |
| | | | | | | | | | | | |
Total distributions to shareholders | | | (0.45 | ) | | | (1.36 | ) | | | 0.00 | |
Net asset value, end of period | | | $36.46 | | | | $33.78 | | | | $30.70 | |
Total return3 | | | 9.28 | % | | | 15.05 | % | | | 0.00 | % |
Ratios to average net assets (annualized) | | | | | | | | | | | | |
Gross expenses | | | 1.43 | % | | | 1.44 | % | | | 0.00 | % |
Net expenses | | | 1.43 | % | | | 1.44 | % | | | 0.00 | % |
Net investment income | | | 0.36 | % | | | 0.37 | % | | | 0.00 | % |
Supplemental data | | | | | | | | | | | | |
Portfolio turnover rate | | | 37 | % | | | 30 | % | | | 58 | % |
Net assets, end of period (000s omitted) | | | $5,407 | | | | $1,778 | | | | $25 | |
| 1 | The class commenced operations on September 30, 2015. Information represents activity for the one day of operation. |
| 2 | Calculated based upon average shares outstanding |
| 3 | Returns for periods of less than one year are not annualized. |
The accompanying notes are an integral part of these financial statements.
| | | | | | |
| Financial highlights | | Wells Fargo Special Mid Cap Value Fund | | | 17 | |
(For a share outstanding throughout each period)
| | | | | | | | | | | | | | | | | | | | |
| | | Six months ended
March 31, 2017 (unaudited) | | | Year ended September 30 | |
| CLASS R6 | | | 2016 | | | 2015 | | | 2014 | | | 20131 | |
Net asset value, beginning of period | | | $34.03 | | | | $30.71 | | | | $33.39 | | | | $30.90 | | | | $28.69 | |
Net investment income | | | 0.17 | | | | 0.38 | 2 | | | 0.41 | 2 | | | 0.41 | 2 | | | 0.06 | 2 |
Net realized and unrealized gains (losses) on investments | | | 3.10 | | | | 4.30 | | | | 0.05 | | | | 4.43 | | | | 2.15 | |
| | | | | | | | | | | | | | | | | | | | |
Total from investment operations | | | 3.27 | | | | 4.68 | | | | 0.46 | | | | 4.84 | | | | 2.21 | |
Distributions to shareholders from | | | | | | | | | | | | | | | | | | | | |
Net investment income | | | (0.35 | ) | | | (0.23 | ) | | | (0.23 | ) | | | (0.17 | ) | | | 0.00 | |
Net realized gains | | | (0.19 | ) | | | (1.13 | ) | | | (2.91 | ) | | | (2.18 | ) | | | 0.00 | |
| | | | | | | | | | | | | | | | | | | | |
Total distributions to shareholders | | | (0.54 | ) | | | (1.36 | ) | | | (3.14 | ) | | | (2.35 | ) | | | 0.00 | |
Net asset value, end of period | | | $36.76 | | | | $34.03 | | | | $30.71 | | | | $33.39 | | | | $30.90 | |
Total return3 | | | 9.63 | % | | | 15.84 | % | | | 1.14 | % | | | 16.29 | % | | | 7.70 | % |
Ratios to average net assets (annualized) | | | | | | | | | | | | | | | | | | | | |
Gross expenses | | | 0.75 | % | | | 0.76 | % | | | 0.79 | % | | | 0.80 | % | | | 0.81 | % |
Net expenses | | | 0.75 | % | | | 0.76 | % | | | 0.79 | % | | | 0.80 | % | | | 0.81 | % |
Net investment income | | | 1.02 | % | | | 1.21 | % | | | 1.26 | % | | | 1.22 | % | | | 0.73 | % |
Supplemental data | | | | | | | | | | | | | | | | | | | | |
Portfolio turnover rate | | | 37 | % | | | 30 | % | | | 58 | % | | | 58 | % | | | 87 | % |
Net assets, end of period (000s omitted) | | | $601,892 | | | | $374,557 | | | | $105,973 | | | | $4,013 | | | | $27 | |
| 1 | For the period from June 28, 2013 (commencement of class operations) to September 30, 2013 |
| 2 | Calculated based upon average shares outstanding |
| 3 | Returns for periods of less than one year are not annualized. |
The accompanying notes are an integral part of these financial statements.
| | | | |
| 18 | | Wells Fargo Special Mid Cap Value Fund | | Financial highlights |
(For a share outstanding throughout each period)
| | | | | | | | | | | | | | | | | | | | | | | | |
| | | Six months ended
March 31, 2017 (unaudited) | | | Year ended September 30 | |
| ADMINISTRATOR CLASS | | | 2016 | | | 2015 | | | 2014 | | | 2013 | | | 2012 | |
Net asset value, beginning of period | | | $33.67 | | | | $30.45 | | | | $33.14 | | | | $30.71 | | | | $23.09 | | | | $18.04 | |
Net investment income | | | 0.12 | 1 | | | 0.26 | | | | 0.31 | 1 | | | 0.15 | | | | 0.20 | 1 | | | 0.11 | 1 |
Net realized and unrealized gains (losses) on investments | | | 3.06 | | | | 4.26 | | | | 0.05 | | | | 4.55 | | | | 7.67 | | | | 4.99 | |
| | | | | | | | | | | | | | | | | | | | | | | | |
Total from investment operations | | | 3.18 | | | | 4.52 | | | | 0.36 | | | | 4.70 | | | | 7.87 | | | | 5.10 | |
Distributions to shareholders from | | | | | | | | | | | | | | | | | | | | | | | | |
Net investment income | | | (0.22 | ) | | | (0.17 | ) | | | (0.14 | ) | | | (0.09 | ) | | | (0.25 | ) | | | (0.05 | ) |
Net realized gains | | | (0.19 | ) | | | (1.13 | ) | | | (2.91 | ) | | | (2.18 | ) | | | 0.00 | | | | 0.00 | |
| | | | | | | | | | | | | | | | | | | | | | | | |
Total distributions to shareholders | | | (0.41 | ) | | | (1.30 | ) | | | (3.05 | ) | | | (2.27 | ) | | | (0.25 | ) | | | (0.05 | ) |
Net asset value, end of period | | | $36.44 | | | | $33.67 | | | | $30.45 | | | | $33.14 | | | | $30.71 | | | | $23.09 | |
Total return2 | | | 9.45 | % | | | 15.42 | % | | | 0.84 | % | | | 15.89 | % | | | 34.41 | % | | | 28.30 | % |
Ratios to average net assets (annualized) | | | | | | | | | | | | | | | | | | | | | | | | |
Gross expenses | | | 1.10 | % | | | 1.10 | % | | | 1.12 | % | | | 1.12 | % | | | 1.13 | % | | | 1.14 | % |
Net expenses | | | 1.10 | % | | | 1.10 | % | | | 1.11 | % | | | 1.12 | % | | | 1.13 | % | | | 1.13 | % |
Net investment income | | | 0.66 | % | | | 0.88 | % | | | 0.95 | % | | | 0.48 | % | | | 0.71 | % | | | 0.50 | % |
Supplemental data | | | | | | | | | | | | | | | | | | | | | | | | |
Portfolio turnover rate | | | 37 | % | | | 30 | % | | | 58 | % | | | 58 | % | | | 87 | % | | | 87 | % |
Net assets, end of period (000s omitted) | | | $1,003,549 | | | | $834,134 | | | | $394,188 | | | | $187,968 | | | | $117,087 | | | | $61,596 | |
| 1 | Calculated based upon average shares outstanding |
| 2 | Returns for periods of less than one year are not annualized. |
The accompanying notes are an integral part of these financial statements.
| | | | | | |
| Financial highlights | | Wells Fargo Special Mid Cap Value Fund | | | 19 | |
(For a share outstanding throughout each period)
| | | | | | | | | | | | | | | | | | | | | | | | |
| | | Six months ended
March 31, 2017 (unaudited) | | | Year ended September 30 | |
| INSTITUTIONAL CLASS | | | 2016 | | | 2015 | | | 2014 | | | 2013 | | | 2012 | |
Net asset value, beginning of period | | | $34.00 | | | | $30.70 | | | | $33.38 | | | | $30.91 | | | | $23.15 | | | | $18.10 | |
Net investment income | | | 0.16 | | | | 0.35 | 1 | | | 0.41 | 1 | | | 0.24 | | | | 0.20 | 1 | | | 0.16 | |
Net realized and unrealized gains (losses) on investments | | | 3.09 | | | | 4.29 | | | | 0.04 | | | | 4.57 | | | | 7.81 | | | | 5.01 | |
| | | | | | | | | | | | | | | | | | | | | | | | |
Total from investment operations | | | 3.25 | | | | 4.64 | | | | 0.45 | | | | 4.81 | | | | 8.01 | | | | 5.17 | |
Distributions to shareholders from | | | | | | | | | | | | | | | | | | | | | | | | |
Net investment income | | | (0.33 | ) | | | (0.21 | ) | | | (0.22 | ) | | | (0.16 | ) | | | (0.25 | ) | | | (0.12 | ) |
Net realized gains | | | (0.19 | ) | | | (1.13 | ) | | | (2.91 | ) | | | (2.18 | ) | | | 0.00 | | | | 0.00 | |
| | | | | | | | | | | | | | | | | | | | | | | | |
Total distributions to shareholders | | | (0.52 | ) | | | (1.34 | ) | | | (3.13 | ) | | | (2.34 | ) | | | (0.25 | ) | | | (0.12 | ) |
Net asset value, end of period | | | $36.73 | | | | $34.00 | | | | $30.70 | | | | $33.38 | | | | $30.91 | | | | $23.15 | |
Total return2 | | | 9.60 | % | | | 15.73 | % | | | 1.10 | % | | | 16.17 | % | | | 34.90 | % | | | 28.65 | % |
Ratios to average net assets (annualized) | | | | | | | | | | | | | | | | | | | | | | | | |
Gross expenses | | | 0.85 | % | | | 0.86 | % | | | 0.85 | % | | | 0.85 | % | | | 0.85 | % | | | 0.87 | % |
Net expenses | | | 0.85 | % | | | 0.86 | % | | | 0.85 | % | | | 0.85 | % | | | 0.85 | % | | | 0.87 | % |
Net investment income | | | 0.92 | % | | | 1.07 | % | | | 1.23 | % | | | 0.81 | % | | | 0.72 | % | | | 0.76 | % |
Supplemental data | | | | | | | | | | | | | | | | | | | | | | | | |
Portfolio turnover rate | | | 37 | % | | | 30 | % | | | 58 | % | | | 58 | % | | | 87 | % | | | 87 | % |
Net assets, end of period (000s omitted) | | | $3,666,520 | | | | $2,325,777 | | | | $411,919 | | | | $174,989 | | | | $66,056 | | | | $125,623 | |
| 1 | Calculated based upon average shares outstanding |
| 2 | Returns for periods of less than one year are not annualized. |
The accompanying notes are an integral part of these financial statements.
| | | | |
| 20 | | Wells Fargo Special Mid Cap Value Fund | | Notes to financial statements (unaudited) |
1. ORGANIZATION
Wells Fargo Funds Trust (the “Trust”), a Delaware statutory trust organized on March 10, 1999, is an open-end management investment company registered under the Investment Company Act of 1940, as amended (the “1940 Act”). As an investment company, the Trust follows the accounting and reporting guidance in Financial Accounting Standards Board (“FASB”) Accounting Standards Codification (“ASC”) Topic 946, Financial Services – Investment Companies. These financial statements report on the Wells Fargo Special Mid Cap Value Fund (the “Fund”) which is a diversified series of the Trust.
Effective at the close of business on October 23, 2015, Investor Class shares became Class A shares in a tax-free conversion. Shareholders of Investor Class received Class A shares at a value equal to the value of their Investor Class shares immediately prior to the conversion. Investor Class shares are no longer offered by the Fund.
2. SIGNIFICANT ACCOUNTING POLICIES
The following significant accounting policies, which are consistently followed in the preparation of the financial statements of the Fund, are in conformity with U.S. generally accepted accounting principles which require management to make estimates and assumptions that affect the reported amounts of assets and liabilities, disclosure of contingent assets and liabilities at the date of the financial statements, and the reported amounts of revenues and expenses during the reporting period. Actual results could differ from those estimates.
Securities valuation
All investments are valued each business day as of the close of regular trading on the New York Stock Exchange (generally 4 p.m. Eastern Time), although the Fund may deviate from this calculation time under unusual or unexpected circumstances.
Equity securities that are listed on a foreign or domestic exchange or market are valued at the official closing price or, if none, the last sales price. If no sale occurs on the principal exchange or market that day, the prior day’s price will be deemed “stale” and a fair value price will be determined in accordance with the Fund’s Valuation Procedures.
Investments in registered open-end investment companies are valued at net asset value. Interests in non-registered investment companies that are redeemable at net asset value are fair valued normally at net asset value.
Investments which are not valued using any of the methods discussed above are valued at their fair value, as determined in good faith by the Board of Trustees of the Fund. The Board of Trustees has established a Valuation Committee comprised of the Trustees and has delegated to it the authority to take any actions regarding the valuation of portfolio securities that the Valuation Committee deems necessary or appropriate, including determining the fair value of portfolio securities, unless the determination has been delegated to the Management Valuation Team of Wells Fargo Funds Management, LLC (“Funds Management”). The Board of Trustees retains the authority to make or ratify any valuation decisions or approve any changes to the Valuation Procedures as it deems appropriate. On a quarterly basis, the Board of Trustees receives reports on any valuation actions taken by the Valuation Committee or the Management Valuation Team which may include items for ratification.
Valuations of fair valued securities are compared to the next actual sales price when available, or other appropriate market values, to assess the continued appropriateness of the fair valuation methodologies used. These securities are fair valued on a day-to-day basis, taking into consideration changes to appropriate market information and any significant changes to the inputs considered in the valuation process until there is a readily available price provided on an exchange or by an independent pricing service. Valuations received from an independent pricing service or independent broker-dealer quotes are periodically validated by comparisons to most recent trades and valuations provided by other independent pricing services in addition to the review of prices by the manager and/or subadviser. Unobservable inputs used in determining fair valuations are identified based on the type of security, taking into consideration factors utilized by market participants in valuing the investment, knowledge about the issuer and the current market environment.
Security loans
The Fund may lend its securities from time to time in order to earn additional income in the form of fees or interest on securities received as collateral or the investment of any cash received as collateral. The Fund continues to receive interest or dividends on the securities loaned. The Fund receives collateral in the form of cash or securities with a value at least equal to the value of the securities on loan. The value of the loaned securities is determined at the close of each business day and any additional required collateral is delivered to the Fund on the next business day. In a securities lending transaction, the net asset value of the Fund will be affected by an increase or decrease in the value of the securities loaned and by an increase or decrease in the value of the instrument in which collateral is invested. The amount of securities lending activity undertaken by the Fund fluctuates from time to time. In the event of default or bankruptcy by the borrower, the Fund may be prevented from recovering the loaned securities or gaining access to the collateral or may experience delays or costs in doing so. In addition, the investment of any cash collateral received may lose all or part of its value. The Fund has the right under the lending agreement to recover the securities from the borrower on demand.
| | | | | | |
| Notes to financial statements (unaudited) | | Wells Fargo Special Mid Cap Value Fund | | | 21 | |
The Fund lends its securities through an unaffiliated securities lending agent. Cash collateral received in connection with its securities lending transactions is invested in Securities Lending Cash Investments, LLC (the “Securities Lending Fund”). The Securities Lending Fund is exempt from registration under Section 3(c)(7) of the 1940 Act and is managed by Funds Management and is subadvised by Wells Capital Management Incorporated (“WellsCap”), an affiliate of Funds Management and an indirect wholly owned subsidiary of Wells Fargo & Company (“Wells Fargo”). Funds Management receives an advisory fee starting at 0.05% and declining to 0.01% as the average daily net assets of the Securities Lending Fund increase. All of the fees received by Funds Management are paid to WellsCap for its services as subadviser. The Securities Lending Fund seeks to provide a positive return compared to the daily Fed Funds Open Rate by investing in high-quality, U.S. dollar-denominated short-term money market instruments. Securities Lending Fund investments are valued at the evaluated bid price provided by an independent pricing service. Income earned from investment in the Securities Lending Fund is included in securities lending income on the Statement of Operations.
Security transactions and income recognition
Securities transactions are recorded on a trade date basis. Realized gains or losses are recorded on the basis of identified cost.
Dividend income is recognized on the ex-dividend date. Dividend income is recorded net of foreign taxes withheld where recovery of such taxes is not assured.
Distributions to shareholders
Distributions to shareholders from net investment income and net realized gains, if any, are recorded on the ex-dividend date. Such distributions are determined in accordance with income tax regulations and may differ from U.S. generally accepted accounting principles. Dividend sources are estimated at the time of declaration. The tax character of distributions is determined as of the Fund’s fiscal year end. Therefore, a portion of the Fund’s distributions made prior the Fund’s fiscal year end may be categorized as a tax return of capital.
Federal and other taxes
The Fund intends to continue to qualify as a regulated investment company by distributing substantially all of its investment company taxable income and any net realized capital gains (after reduction for capital loss carryforwards) sufficient to relieve it from all, or substantially all, federal income taxes. Accordingly, no provision for federal income taxes was required.
The Fund’s income and federal excise tax returns and all financial records supporting those returns for the prior three fiscal years are subject to examination by the federal and Delaware revenue authorities. Management has analyzed the Fund’s tax positions taken on federal, state, and foreign tax returns for all open tax years and does not believe that there are any uncertain tax positions that require recognition of a tax liability.
As of September 30, 2016, the Fund had capital loss carryforwards available to offset future net realized capital gains in the amount of $49,637 expiring in 2017.
Class allocations
The separate classes of shares offered by the Fund differ principally in applicable sales charges, distribution, shareholder servicing, and administration fees. Class specific expenses are charged directly to that share class. Investment income, common expenses, and realized and unrealized gains (losses) on investments are allocated daily to each class of shares based on the relative proportion of net assets of each class.
3. FAIR VALUATION MEASUREMENTS
Fair value measurements of investments are determined within a framework that has established a fair value hierarchy based upon the various data inputs utilized in determining the value of the Fund’s investments. The three-level hierarchy gives the highest priority to unadjusted quoted prices in active markets for identical assets or liabilities (Level 1) and the lowest priority to unobservable inputs (Level 3). The Fund’s investments are classified within the fair value hierarchy based on the lowest level of input that is significant to the fair value measurement. The inputs are summarized into three broad levels as follows:
| ∎ | | Level 1 – quoted prices in active markets for identical securities |
| ∎ | | Level 2 – other significant observable inputs (including quoted prices for similar securities, interest rates, prepayment speeds, credit risk, etc.) |
| ∎ | | Level 3 – significant unobservable inputs (including the Fund’s own assumptions in determining the fair value of investments) |
The inputs or methodologies used for valuing investments in securities are not necessarily an indication of the risk associated with investing in those securities.
| | | | |
| 22 | | Wells Fargo Special Mid Cap Value Fund | | Notes to financial statements (unaudited) |
The following is a summary of the inputs used in valuing the Fund’s assets and liabilities as of March 31, 2017:
| | | | | | | | | | | | | | | | |
| | | Quoted prices (Level 1) | | | Other significant
observable inputs
(Level 2) | | | Significant
unobservable inputs (Level 3) | | | Total | |
Assets | | | | | | | | | | | | | | | | |
Investments in: | | | | | | | | | | | | | | | | |
| | | | |
Common stocks | | | | | | | | | | | | | | | | |
Consumer discretionary | | $ | 234,921,118 | | | $ | 0 | | | $ | 0 | | | $ | 234,921,118 | |
Consumer staples | | | 570,789,393 | | | | 0 | | | | 0 | | | | 570,789,393 | |
Energy | | | 594,404,230 | | | | 0 | | | | 0 | | | | 594,404,230 | |
Financials | | | 1,207,757,867 | | | | 0 | | | | 0 | | | | 1,207,757,867 | |
Health care | | | 417,034,880 | | | | 0 | | | | 0 | | | | 417,034,880 | |
Industrials | | | 932,220,397 | | | | 0 | | | | 0 | | | | 932,220,397 | |
Information technology | | | 848,930,724 | | | | 0 | | | | 0 | | | | 848,930,724 | |
Materials | | | 441,543,919 | | | | 0 | | | | 0 | | | | 441,543,919 | |
Real estate | | | 416,120,474 | | | | 0 | | | | 0 | | | | 416,120,474 | |
Telecommunication services | | | 80,234,637 | | | | 0 | | | | 0 | | | | 80,234,637 | |
Utilities | | | 427,227,585 | | | | 0 | | | | 0 | | | | 427,227,585 | |
| | | | |
Short-term investments | | | | | | | | | | | | | | | | |
Investment companies | | | 352,587,499 | | | | 0 | | | | 0 | | | | 352,587,499 | |
Investments measured at net asset value* | | | | | | | | | | | | | | | 114,306,901 | |
Total assets | | $ | 6,523,772,723 | | | $ | 0 | | | $ | 0 | | | $ | 6,638,079,624 | |
| * | Investments that are measured at fair value using the net asset value per share (or its equivalent) as a practical expedient have not been categorized in the fair value hierarchy. The fair value amount presented in the table is intended to permit reconciliation of the fair value hierarchy to the amounts presented in the Statement of Assets and Liabilities. The Fund’s investment in Securities Lending Cash Investments, LLC valued at $114,306,901 does not have a redemption period notice, can be redeemed daily and does not have any unfunded commitments. |
The Fund recognizes transfers between levels within the fair value hierarchy at the end of the reporting period. At March 31, 2017, the Fund did not have any transfers into/out of Level 1, Level 2, or Level 3.
4. TRANSACTIONS WITH AFFILIATES AND OTHER EXPENSES
Management fee
Funds Management, an indirect wholly owned subsidiary of Wells Fargo, is the manager of the Fund and provides advisory and fund-level administrative services under an investment management agreement. Under the investment management agreement, Funds Management is responsible for, among other services, implementing the investment objectives and strategies of the Fund, supervising the subadviser, providing fund-level administrative services in connection with the Fund’s operations, and providing any other fund-level administrative services reasonably necessary for the operation of the Fund. As compensation for its services under the investment management agreement, Funds Management is entitled to receive an annual management fee starting at 0.75% and declining to 0.63% as the average daily net assets of the Fund increase. For the six months ended March 31, 2017, the management fee was equivalent to an annual rate of 0.68% of the Fund’s average daily net assets.
Funds Management has retained the services of a subadviser to provide daily portfolio management to the Fund. The fee for subadvisory services is borne by Funds Management. WellsCap is the subadviser to the Fund and is entitled to receive a fee from Funds Management at an annual rate starting at 0.45% and declining to 0.30% as the average daily net assets of the Fund increase.
Administration fees
Under a class-level administration agreement, Funds Management provides class-level administrative services to the Fund, which includes paying fees and expenses for services provided by the transfer agent, sub-transfer agents, omnibus account servicers and record-keepers. As compensation for its services under the class-level administration agreement, Funds Management receives an annual fee which is calculated based on the average daily net assets of each class as follows:
| | | | |
| | | Class level
administration fee | |
Class A, Class C, Class R | | | 0.21 | % |
Class R6 | | | 0.03 | |
Administrator Class, Institutional Class | | | 0.13 | |
| | | | | | |
| Notes to financial statements (unaudited) | | Wells Fargo Special Mid Cap Value Fund | | | 23 | |
Funds Management has contractually waived and/or reimbursed management and administration fees to the extent necessary to maintain certain net operating expense ratios for the Fund. Waiver of fees and/or reimbursement of expenses by Funds Management were made first from fund level expenses on a proportionate basis and then from class specific expenses. Funds Management has committed through January 31, 2018 to waive fees and/or reimburse expenses to the extent necessary to cap the Fund’s expenses at 1.22% for Class A shares, 1.97% for Class C shares, 1.47% for Class R shares, 0.79% for Class R6 shares, 1.14% for Administration Class shares, and 0.87% for Institutional Class shares. After this time, the cap may be increased or the commitment to maintain the cap may be terminated only with the approval of the Board of Trustees.
During the six months ended March 31, 2017, State Street Bank and Trust Company, the Fund’s custodian, reimbursed the Fund $5,405 certain out-of-pocket expenses that were billed to the Fund in error from 1998-2015. This amount is included in dividend income on the Statement of Operations. In addition, Funds Management was also reimbursed $3,058 for waivers/reimbursements it made to the Fund during the period the Fund was erroneously billed.
Distribution fees
The Trust has adopted a Distribution Plan for Class C and Class R shares of the Fund pursuant to Rule 12b-1 under the 1940 Act. Distribution fees are charged to Class C and Class R shares and paid to Wells Fargo Funds Distributor, LLC (“Funds Distributor”), the principal underwriter, at an annual rate of 0.75% of the average daily net assets of Class C shares and 0.25% of the average daily net assets of Class R shares.
In addition, Funds Distributor is entitled to receive the front-end sales charge from the purchase of Class A shares and a contingent deferred sales charge on the redemption of certain shares. Funds Distributor is also entitled to receive the contingent deferred sales charges from redemptions of Class C shares. For the six months ended March 31, 2017, Funds Distributor received $120,689 from the sale of Class A shares and $816 in contingent deferred sales charges from redemptions of Class C shares.
Shareholder servicing fees
The Trust has entered into contracts with one or more shareholder servicing agents, whereby Class A, Class C, Class R, and Administrator Class of the Fund are charged a fee at an annual rate of 0.25% of the average daily net assets of each respective class.
A portion of these total shareholder servicing fees were paid to affiliates of Wells Fargo.
5. INVESTMENT PORTFOLIO TRANSACTIONS
Purchases and sales of investments, excluding U.S. government obligations (if any) and short-term securities, for the six months ended March 31, 2017 were $3,000,126,818 and $2,029,903,289, respectively.
The Fund may purchase or sell investment securities to other Wells Fargo affiliates pursuant to Rule 17a-7 of the 1940 Act and under procedures adopted by the Board of Trustees. The procedures have been designed to ensure that these interfund transactions, which generally do not incur broker commissions, are effected at current market prices. Interfund trades are included within the respective purchases and sales amounts shown.
6. BANK BORROWINGS
The Trust (excluding the money market funds and certain other funds) and Wells Fargo Variable Trust are parties to a $250,000,000 revolving credit agreement whereby the Fund is permitted to use bank borrowings for temporary or emergency purposes, such as to fund shareholder redemption requests. Interest under the credit agreement is charged to the Fund based on a borrowing rate equal to the higher of the Federal Funds rate in effect on that day plus 1.25% or the overnight LIBOR rate in effect on that day plus 1.25%. In addition, an annual commitment fee equal to 0.25% of the unused balance is allocated to each participating fund.
For the six months ended March 31, 2017, there were no borrowings by the Fund under the agreement.
7. INDEMNIFICATION
Under the Trust’s organizational documents, the officers and Trustees have been granted certain indemnification rights against certain liabilities that may arise out of performance of their duties to the Trust. Additionally, in the normal course of business, the Trust may enter into contracts with service providers that contain a variety of indemnification clauses. The Trust’s maximum exposure under these arrangements is dependent on future claims that may be made against the Fund and, therefore, cannot be estimated.
| | | | |
| 24 | | Wells Fargo Special Mid Cap Value Fund | | Notes to financial statements (unaudited) |
8. NEW ACCOUNTING PRONOUNCEMENT
In December 2016, FASB issued Accounting Standards Update (“ASU”) No. 2016-19, Technical Corrections and Improvements. ASU 2016-19 includes an amendment to FASB ASC Topic 820, Fair Value Measurement which clarifies the difference between a valuation approach and a valuation technique. The amendment also requires an entity to disclose when there has been a change in either or both a valuation approach and/or a valuation technique. The disclosure requirements are effective for fiscal years and interim periods within those fiscal years beginning after December 15, 2016. Management is currently evaluating the potential impact of this new guidance to the financial statements.
9. REGULATORY CHANGES
In October 2016, the Securities and Exchange Commission (“SEC”) adopted new rules and forms and amended existing rules and forms (together, “final rules”) intended to modernize and enhance the reporting and disclosure of information by registered investment companies and to enhance liquidity risk management by open-end mutual funds and exchange-traded funds. The final rules will enhance the quality of information available to investors and will allow the SEC to more effectively collect and use data reported by funds. In part, the final rules amend Regulation S-X and require standardized, enhanced disclosure about derivatives in the Fund’s financial statements, as well as other amendments. The compliance date for the amendments to Regulation S-X is August 1, 2017 while the compliance date for the new form types is June 1, 2018 and the compliance date for the liquidity risk management program requirements is December 1, 2018. Management is currently assessing the potential impact of these enhancements and their impact on the financial statement disclosures and reporting requirements.
| | | | | | |
| Other information (unaudited) | | Wells Fargo Special Mid Cap Value Fund | | | 25 | |
PROXY VOTING INFORMATION
A description of the policies and procedures that the Fund uses to determine how to vote proxies relating to portfolio securities is available, upon request, by calling 1-800-222-8222, visiting our website at wellsfargofunds.com, or visiting the SEC website at sec.gov. Information regarding how the Fund voted proxies relating to portfolio securities during the most recent 12-month period ended June 30 is available on the Fund’s website at wellsfargofunds.com or by visiting the SEC website at sec.gov.
PORTFOLIO HOLDINGS INFORMATION
The complete portfolio holdings for the Fund are publicly available monthly on the Fund’s website (wellsfargofunds.com), on a one-month delayed basis. In addition, top ten holdings information (excluding derivative positions) for the Fund is publicly available on the Fund’s website on a monthly, seven-day or more delayed basis. The Fund files its complete schedule of portfolio holdings with the SEC for the first and third quarters of each fiscal year on Form N-Q, which is available by visiting the SEC website at sec.gov. In addition, the Fund’s Form N-Q may be reviewed and copied at the SEC’s Public Reference Room in Washington, DC, and at regional offices in New York City, at 233 Broadway, and in Chicago, at 175 West Jackson Boulevard, Suite 900. Information about the Public Reference Room may be obtained by calling 1-800-SEC-0330.
| | | | |
| 26 | | Wells Fargo Special Mid Cap Value Fund | | Other information (unaudited) |
BOARD OF TRUSTEES AND OFFICERS
Each of the Trustees and Officers1 listed in the table below acts in identical capacities for each fund in the Wells Fargo family of funds, which consists of 138 mutual funds comprising the Wells Fargo Funds Trust, Wells Fargo Variable Trust, Wells Fargo Master Trust and four closed-end funds (collectively the “Fund Complex”). This table should be read in conjunction with the Prospectus and the Statement of Additional Information2. The mailing address of each Trustee and Officer is 525 Market Street, 12th Floor, San Francisco, CA 94105. Each Trustee and Officer serves an indefinite term, however, each Trustee serves such term until reaching the mandatory retirement age established by the Trustees.
Independent Trustees
| | | | | | |
Name and year of birth | | Position held and length of service* | | Principal occupations during past five years or longer | | Current other public company or
investment company
directorships |
William R. Ebsworth (Born 1957) | | Trustee, since 2015 | | Retired. From 1984 to 2013, equities analyst, portfolio manager, research director and chief financial officer at Fidelity Management and Research Company in Boston, Tokyo, and Hong Kong and retired in 2013 as Chief Investment Officer of Fidelity Strategic Advisers, Inc. where he lead a team of investment professionals managing client assets. Prior thereto, Board member of Hong Kong Securities Clearing Co., Hong Kong Options Clearing Corp., the Thailand International Fund, Ltd., Fidelity Investments Life Insurance Company, and Empire Fidelity Investments Life Insurance Company. Board member of the Fonté Foundation (non-profit organization) and the Vincent Memorial Hospital Endowment (non-profit organization), where he serves on the Investment Committee and as a Chair of the Audit Committee. Mr. Ebsworth is a CFA® charterholder and an Adjunct Lecturer, Finance, at Babson College. | | Asset Allocation Trust |
Jane A. Freeman (Born 1953) | | Trustee, since 2015 | | Retired. From 2012 to 2014 and 1999 to 2008, Chief Financial Officer of Scientific Learning Corporation. From 2008 to 2012, Ms. Freeman provided consulting services related to strategic business projects. Prior to 1999, Portfolio Manager at Rockefeller & Co. and Scudder, Stevens & Clark. Board member of the Harding Loevner Funds from 1996 to 2014, serving as both Lead Independent Director and chair of the Audit Committee. Board member of the Russell Exchange Traded Funds Trust from 2011 to 2012 and the chair of the Audit Committee. Ms. Freeman is a Board Member of Ruth Bancroft Garden (non-profit organization) and an inactive chartered financial analyst. | | Asset Allocation Trust |
Peter G. Gordon** (Born 1942) | | Trustee, since 1998; Chairman, since 2005 | | Co-Founder, Retired Chairman, President and CEO of Crystal Geyser Water Company. Trustee Emeritus, Colby College. | | Asset Allocation Trust |
Isaiah Harris, Jr. (Born 1952) | | Trustee, since 2009 | | Retired. Chairman of the Board of CIGNA Corporation since 2009, and Director since 2005. From 2003 to 2011, Director of Deluxe Corporation. Prior thereto, President and CEO of BellSouth Advertising and Publishing Corp. from 2005 to 2007, President and CEO of BellSouth Enterprises from 2004 to 2005 and President of BellSouth Consumer Services from 2000 to 2003. Emeritus member of the Iowa State University Foundation Board of Governors. Emeritus Member of the Advisory Board of Iowa State University School of Business. Advisory Board Member, Palm Harbor Academy (charter school). Advisory Board Member, Child Evangelism Fellowship (non-profit). Mr. Harris is a certified public accountant (inactive status). | | CIGNA Corporation; Asset Allocation Trust |
Judith M. Johnson (Born 1949) | | Trustee, since 2008; Audit Committee Chairman, since 2008 | | Retired. Prior thereto, Chief Executive Officer and Chief Investment Officer of Minneapolis Employees Retirement Fund from 1996 to 2008. Ms. Johnson is an attorney, certified public accountant and a certified managerial accountant. | | Asset Allocation Trust |
David F. Larcker (Born 1950) | | Trustee, since 2009 | | James Irvin Miller Professor of Accounting at the Graduate School of Business, Stanford University, Director of the Corporate Governance Research Initiative and Senior Faculty of The Rock Center for Corporate Governance since 2006. From 2005 to 2008, Professor of Accounting at the Graduate School of Business, Stanford University. Prior thereto, Ernst & Young Professor of Accounting at The Wharton School, University of Pennsylvania from 1985 to 2005. | | Asset Allocation Trust |
| | | | | | |
| Other information (unaudited) | | Wells Fargo Special Mid Cap Value Fund | | | 27 | |
| | | | | | |
Name and year of birth | | Position held and length of service* | | Principal occupations during past five years or longer | | Current other public company or
investment company
directorships |
Olivia S. Mitchell (Born 1953) | | Trustee, since 2006 | | International Foundation of Employee Benefit Plans Professor, Wharton School of the University of Pennsylvania since 1993. Director of Wharton’s Pension Research Council and Boettner Center on Pensions & Retirement Research, and Research Associate at the National Bureau of Economic Research. Previously, Cornell University Professor from 1978 to 1993. | | Asset Allocation Trust |
Timothy J. Penny (Born 1951) | | Trustee, since 1996 | | President and Chief Executive Officer of Southern Minnesota Initiative Foundation, a non-profit organization, since 2007 and Senior Fellow at the Humphrey Institute Policy Forum at the University of Minnesota since 1995. Member of the Board of Trustees of NorthStar Education Finance, Inc., a non-profit organization, since 2007. | | Asset Allocation Trust |
Michael S. Scofield (Born 1943) | | Trustee, since 2010 | | Served on the Investment Company Institute’s Board of Governors and Executive Committee from 2008-2011 as well the Governing Council of the Independent Directors Council from 2006-2011 and the Independent Directors Council Executive Committee from 2008-2011. Chairman of the IDC from 2008-2010. Institutional Investor (Fund Directions) Trustee of Year in 2007. Trustee of the Evergreen Funds complex (and its predecessors) from 1984 to 2010. Chairman of the Evergreen Funds from 2000-2010. Former Trustee of the Mentor Funds. Retired Attorney, Law Offices of Michael S. Scofield. | | Asset Allocation Trust |
| * | Length of service dates reflect the Trustee’s commencement of service with the Trust’s predecessor entities, where applicable. |
| ** | Peter Gordon is expected to retire on December 31, 2017. |
Officers
| | | | | | |
Name and year of birth | | Position held and
length of service | | Principal occupations during past five years or longer | | |
Andrew Owen (Born 1960) | | President, since 2017 | | Executive Vice President of Wells Fargo Bank, N.A. and President of Wells Fargo & Company and Head of Affiliated Managers, Wells Fargo Asset Management, since 2014. Executive Vice President responsible for marketing, investments and product development for Wells Fargo Funds Management, LLC, from 2009 to 2014. | | |
Nancy Wiser1 (Born 1967) | | Treasurer, since 2012 | | Executive Vice President of Wells Fargo Funds Management, LLC since 2011. Chief Operating Officer and Chief Compliance Officer at LightBox Capital Management LLC, from 2008 to 2011. | | |
C. David Messman (Born 1960) | | Secretary, since 2000; Chief Legal Officer, since 2003 | | Senior Vice President and Secretary of Wells Fargo Funds Management, LLC since 2001. Assistant General Counsel of Wells Fargo Bank, N.A. since 2013 and Vice President and Managing Counsel of Wells Fargo Bank, N.A. from 1996 to 2013. | | |
Michael Whitaker (Born 1967) | | Chief Compliance Officer, since 2016 | | Executive Vice President of Wells Fargo Funds Management, LLC since 2016. Chief Compliance Officer of Fidelity’s Fixed Income Funds and Asset Allocation Funds from 2008 to 2016, Compliance Officer of FMR Co., Inc. from 2014 to 2016, Fidelity Investments Money Management, Inc. from 2014 to 2016, Fidelity Investments from 2007 to 2016. | | |
David Berardi (Born 1975) | | Assistant Treasurer, since 2009 | | Vice President of Wells Fargo Funds Management, LLC since 2009. Vice President of Evergreen Investment Management Company, LLC from 2008 to 2010. Manager of Fund Reporting and Control for Evergreen Investment Management Company, LLC from 2004 to 2010. | | |
Jeremy DePalma1 (Born 1974) | | Assistant Treasurer, since 2009 | | Senior Vice President of Wells Fargo Funds Management, LLC since 2009. Senior Vice President of Evergreen Investment Management Company, LLC from 2008 to 2010 and head of the Fund Reporting and Control Team within Fund Administration from 2005 to 2010. | | |
| 1 | Nancy Wiser acts as Treasurer of 69 funds in the Fund Complex. Jeremy DePalma acts as Treasurer of 69 funds and Assistant Treasurer of 69 funds in the Fund Complex. |
| 2 | The Statement of Additional Information includes additional information about the Trustees and is available, without charge, upon request, by calling 1-800-222-8222 or by visiting the website at wellsfargofunds.com. |
| | | | |
| 28 | | Wells Fargo Special Mid Cap Value Fund | | List of abbreviations |
The following is a list of common abbreviations for terms and entities that may have appeared in this report.
| ACA | — ACA Financial Guaranty Corporation |
| ADR | — American depositary receipt |
| ADS | — American depositary shares |
| AGC | — Assured Guaranty Corporation |
| AGM | — Assured Guaranty Municipal |
| Ambac | — Ambac Financial Group Incorporated |
| AMT | — Alternative minimum tax |
| BAN | — Bond anticipation notes |
| BHAC | — Berkshire Hathaway Assurance Corporation |
| CAB | — Capital appreciation bond |
| CCAB | — Convertible capital appreciation bond |
| CDA | — Community Development Authority |
| CDO | — Collateralized debt obligation |
| DRIVER | — Derivative inverse tax-exempt receipts |
| DW&P | — Department of Water & Power |
| DWR | — Department of Water Resources |
| ECFA | — Educational & Cultural Facilities Authority |
| EDA | — Economic Development Authority |
| EDFA | — Economic Development Finance Authority |
| ETF | — Exchange-traded fund |
| FDIC | — Federal Deposit Insurance Corporation |
| FFCB | — Federal Farm Credit Banks |
| FGIC | — Financial Guaranty Insurance Corporation |
| FHA | — Federal Housing Administration |
| FHLB | — Federal Home Loan Bank |
| FHLMC | — Federal Home Loan Mortgage Corporation |
| FICO | — The Financing Corporation |
| FNMA | — Federal National Mortgage Association |
| GDR | — Global depositary receipt |
| GNMA | — Government National Mortgage Association |
| HCFR | — Healthcare facilities revenue |
| HEFA | — Health & Educational Facilities Authority |
| HEFAR | — Higher education facilities authority revenue |
| HFA | — Housing Finance Authority |
| HFFA | — Health Facilities Financing Authority |
| HUD | — Department of Housing and Urban Development |
| IDA | — Industrial Development Authority |
| IDAG | — Industrial Development Agency |
| KRW | — Republic of Korea won |
| LIBOR | — London Interbank Offered Rate |
| LIFER | — Long Inverse Floating Exempt Receipts |
| LLC | — Limited liability company |
| LLLP | — Limited liability limited partnership |
| LLP | — Limited liability partnership |
| MBIA | — Municipal Bond Insurance Association |
| MFHR | — Multifamily housing revenue |
| MSTR | — Municipal securities trust receipts |
| MUD | — Municipal Utility District |
| National | — National Public Finance Guarantee Corporation |
| PCFA | — Pollution Control Financing Authority |
| PCL | — Public Company Limited |
| PCR | — Pollution control revenue |
| PFA | — Public Finance Authority |
| PFFA | — Public Facilities Financing Authority |
| PFOTER | — Puttable floating option tax-exempt receipts |
| plc | — Public limited company |
| PUTTER | — Puttable tax-exempt receipts |
| R&D | — Research & development |
| Radian | — Radian Asset Assurance |
| RAN | — Revenue anticipation notes |
| RDA | — Redevelopment Authority |
| RDFA | — Redevelopment Finance Authority |
| REIT | — Real estate investment trust |
| ROC | — Reset option certificates |
| SAVRS | — Select auction variable rate securities |
| SBA | — Small Business Authority |
| SDR | — Swedish depositary receipt |
| SFHR | — Single-family housing revenue |
| SFMR | — Single-family mortgage revenue |
| SPA | — Standby purchase agreement |
| SPDR | — Standard & Poor’s Depositary Receipts |
| SPEAR | — Short Puttable Exempt Adjustable Receipts |
| STRIPS | — Separate trading of registered interest and |
| TAN | — Tax anticipation notes |
| TIPS | — Treasury inflation-protected securities |
| TRAN | — Tax revenue anticipation notes |
| TTFA | — Transportation Trust Fund Authority |
| TVA | — Tennessee Valley Authority |

For more information
More information about Wells Fargo Funds is available free upon request. To obtain literature, please write, email, visit the Fund’s website, or call:
Wells Fargo Funds
P.O. Box 8266
Boston, MA 02266-8266
Email: fundservice@wellsfargo.com
Website: wellsfargofunds.com
Individual investors: 1-800-222-8222
Retail investment professionals: 1-888-877-9275
Institutional investment professionals: 1-866-765-0778
This report and the financial statements contained herein are submitted for the general information of the shareholders of the Fund. If this report is used for promotional purposes, distribution of the report must be accompanied or preceded by a current prospectus. Before investing, please consider the investment objectives, risks, charges, and expenses of the investment. For a current prospectus and, if available, a summary prospectus, containing this information, call 1-800-222-8222 or visit the Fund’s website at wellsfargofunds.com. Read the prospectus carefully before you invest or send money.
Wells Fargo Asset Management (WFAM) is a trade name used by the asset management businesses of Wells Fargo & Company. Wells Fargo Funds Management, LLC, a wholly owned subsidiary of Wells Fargo & Company, provides investment advisory and administrative services for Wells Fargo Funds. Other affiliates of Wells Fargo & Company provide subadvisory and other services for the funds. The funds are distributed by Wells Fargo Funds Distributor, LLC, Member FINRA, an affiliate of Wells Fargo & Company. Neither Wells Fargo Funds Management nor Wells Fargo Funds Distributor has Fund customer accounts/assets, and neither provides investment advice/recommendations or acts as an investment advice fiduciary to any investor.
NOT FDIC INSURED ◾ NO BANK GUARANTEE ◾ MAY LOSE VALUE
© 2017 Wells Fargo Funds Management, LLC. All rights reserved.
| | |
 | | 302891 05-17 SA234/SAR234 03-17 |
Not applicable.
| ITEM 3. | AUDIT COMMITTEE FINANCIAL EXPERT |
Not applicable.
| ITEM 4. | PRINCIPAL ACCOUNTANT FEES AND SERVICES |
Not applicable.
| ITEM 5. | AUDIT COMMITTEE OF LISTED REGISTRANTS |
Not applicable.
A Portfolio of Investments for each series of Wells Fargo Funds Trust is included as part of the report to shareholders filed under Item 1 of this Form.
| ITEM 7. | DISCLOSURE OF PROXY VOTING POLICIES AND PROCEDURES FOR CLOSED-END MANAGEMENT INVESTMENT COMPANIES |
Not applicable.
| ITEM 8. | PORTFOLIO MANAGERS OF CLOSED-END MANAGEMENT INVESTMENT COMPANIES |
Not applicable.
| ITEM 9. | PURCHASES OF EQUITY SECURITIES BY CLOSED-END MANAGEMEENT INVESTMENT COMPANY AND AFFILIATED PURCHASERS |
Not applicable.
| ITEM 10. | SUBMISSION OF MATTERS TO A VOTE OF SECURITY HOLDERS |
There have been no material changes to the procedures by which shareholders may recommend nominees to the registrant’s Board of Trustees that have been implemented since the registrant’s last provided disclosure in response to the requirements of this Item.
| ITEM 11. | CONTROLS AND PROCEDURES |
(a) The President and Treasurer have concluded that the Wells Fargo Funds Trust (the “Trust”) disclosure controls and procedures (as defined in Rule 30a-3(c) under the Investment Company Act of 1940) provide reasonable assurances that material information relating to the Trust is made known to them by the appropriate persons, based on their evaluation of these controls and procedures as of a date within 90 days of the filing of this report.
(b) There were no significant changes in the Trust’s internal controls over financial reporting (as defined in Rule 30a-3(d) under the Investment Company Act of 1940) that occurred during the second fiscal quarter of the period covered by this report that materially affected, or is reasonably likely to materially affect, the registrant’s internal control over financial reporting.
(a)(1) Not applicable.
(a)(2) Certification pursuant to Rule 30a-2(a) under the Investment Company Act of 1940 (17 CFR 270.30a-2(a)) is filed and attached hereto as Exhibit 99.CERT.
(a)(3) Not applicable.
(b) Certification pursuant to Rule 30a-2(b) under the Investment Company Act of 1940 (17 CFR 270.30a-2(b)) is filed and attached hereto as Exhibit 99.906CERT.
SIGNATURES
Pursuant to the requirements of the Securities Exchange Act of 1934 and the Investment Company Act of 1940, the registrant has duly caused this report to be signed on its behalf by the undersigned, thereunto duly authorized.
| | |
| Wells Fargo Funds Trust |
| |
| By: | | |
| |
| | /s/ Andrew Owen |
| |
| | Andrew Owen |
| | President |
| |
| Date: | | May 24, 2017 |
Pursuant to the requirements of the Securities Exchange Act of 1934 and the Investment Company Act of 1940, this report has been signed below by the following persons on behalf of the registrant and in the capacities and on the date indicated.
| | |
| Wells Fargo Funds Trust |
| |
| By: | | |
| |
| | /s/ Andrew Owen |
| |
| | Andrew Owen |
| | President |
| |
| Date: | | May 24, 2017 |
| |
| By: | | |
| |
| | /s/ Nancy Wiser |
| |
| | Nancy Wiser |
| | Treasurer |
| |
| Date: | | May 24, 2017 |
| |
| By: | | |
| |
| | /s/ Jeremy DePalma |
| |
| | Jeremy DePalma |
| | Treasurer |
| |
| Date: | | May 24, 2017 |