
UNITED STATES
SECURITIES AND EXCHANGE COMMISSION
Washington, D.C. 20549
FORM N-CSRS
CERTIFIED SHAREHOLDER REPORT OF REGISTERED
MANAGEMENT INVESTMENT COMPANIES
Investment Company Act file number: 811-09253
Wells Fargo Funds Trust
(Exact name of registrant as specified in charter)
525 Market St., San Francisco, CA 94105
(Address of principal executive offices) (Zip code)
C. David Messman
Wells Fargo Funds Management, LLC
525 Market St., San Francisco, CA 94105
(Name and address of agent for service)
Registrant’s telephone number, including area code: 800-222-8222
Date of fiscal year end: October 31
Registrant is making a filing for 7 of its series:
Wells Fargo Asia Pacific Fund, Wells Fargo Diversified International Fund, Wells Fargo Emerging Markets Equity Fund, Wells Fargo Emerging Markets Equity Income Fund, Wells Fargo Global Small Cap Fund, Wells Fargo International Equity Fund, and Wells Fargo Intrinsic World Equity Fund.
Date of reporting period: April 30, 2017
ITEM 1. REPORT TO STOCKHOLDERS
Semi-Annual Report
April 30, 2017

Wells Fargo Asia Pacific Fund


Reduce clutter. Save trees.
Sign up for electronic delivery of prospectuses and shareholder reports at wellsfargo.com/advantagedelivery
Contents
The views expressed and any forward-looking statements are as of April 30, 2017, unless otherwise noted, and are those of the Fund managers and/or Wells Fargo Funds Management, LLC. Discussions of individual securities, or the markets generally, or any Wells Fargo Fund are not intended as individual recommendations. Future events or results may vary significantly from those expressed in any forward-looking statements. The views expressed are subject to change at any time in response to changing circumstances in the market. Wells Fargo Funds Management, LLC and the Fund disclaim any obligation to publicly update or revise any views expressed or forward-looking statements.
NOT FDIC INSURED ◾ NO BANK GUARANTEE ◾ MAY LOSE VALUE
| | | | |
| 2 | | Wells Fargo Asia Pacific Fund | | Letter to shareholders (unaudited) |

Andrew Owen
President
Wells Fargo Funds
Despite heightened market volatility at times, in general, global stocks delivered double-digit returns while bond markets were hurt by a rise in interest rates during the latter part of 2016.
Dear Shareholder:
As the new president of Wells Fargo Funds, now that Karla Rabusch is retiring from that position after nearly 14 years, I am pleased to offer you this semi-annual report for the Wells Fargo Asia Pacific Fund for the six-month period that ended April 30, 2017. Despite heightened market volatility at times, in general, global stocks delivered double-digit returns while bond markets were hurt by a rise in interest rates during the latter part of 2016. U.S. and international stocks returned 13.31% and 10.37% for the six-month period, respectively, as measured by the S&P 500 Index1 and the MSCI ACWI ex USA Index (Net)2; within fixed income, the Bloomberg Barclays U.S. Aggregate Bond Index3 returned -0.67%.
During the last two months of 2016, prospects for faster growth and higher interest rates in the U.S. influenced markets.
Following Donald Trump’s election as president in early November, U.S. stocks began to rally. Investors appeared optimistic that the new administration would usher in a series of progrowth policies, and supportive economic news helped the rally carry through the end of 2016. The buoyant environment sent interest rates higher as well. At its mid-December meeting, Fed officials raised their short-term target interest rate for the first time in a year by a quarter percentage point to between 0.50% and 0.75%. Outside of the U.S., the prospects for faster U.S. growth appeared to trigger some acceleration in Europe. The improvement may be partly attributable to expectations for further strengthening of the U.S. dollar, which in turn could improve demand for European goods in the U.S. due to weakening of the euro relative to the dollar. Rising inflation across the eurozone and Japan caused an upward shift in yield curves in those areas, although developed-country bond yields remained significantly lower than U.S. Treasury yields.
Globally, stocks delivered positive results and economies showed improvement in the first four months of 2017.
Stocks rallied globally, supported by signs of improvement in the U.S. and global economies. In the U.S., hiring remained strong and business and consumer sentiment improved. Meanwhile, inflation inched up. In March, Fed officials raised their short-term target interest rate by a quarter percentage point to between 0.75% and 1.00%. With the Fed’s target-rate increase, short-term bond yields rose. Longer-term Treasury yields were little changed, however, leading to positive performance. Investment-grade corporate bonds and high-yield bonds benefited from strong demand. Municipal bond returns were also positive during the first four months of 2017, helped by strong demand and constrained new-issue supply. Outside the U.S., stocks in emerging markets benefited from both global economic growth and recent weakening in the U.S. dollar. European stocks also advanced as political risk declined. In the first round of the French presidential elections, Emmanuel Macron, a pro-EU candidate, garnered the most votes. Non-U.S. bonds also benefited from a decline in perceived risk, with credit spreads continuing to narrow.
| 1 | The S&P 500 Index consists of 500 stocks chosen for market size, liquidity, and industry group representation. It is a market-value-weighted index with each stock’s weight in the index proportionate to its market value. You cannot invest directly in an index. |
| 2 | The Morgan Stanley Capital International (MSCI) All Country World Index (ACWI) ex USA Index (Net) is a free-float-adjusted market-capitalization-weighted index that is designed to measure the equity market performance of developed markets, excluding the United States and Canada. Source: MSCI. MSCI makes no express or implied warranties or representations and shall have no liability whatsoever with respect to any MSCI data contained herein. The MSCI data may not be further redistributed or used as a basis for other indexes or any securities or financial products. This report is not approved, reviewed, or produced by MSCI. You cannot invest directly in an index. |
| 3 | The Bloomberg Barclays U.S. Aggregate Bond Index (formerly known as Barclays U.S. Aggregate Bond Index) is a broad-based benchmark that measures the investment-grade, U.S. dollar–denominated, fixed-rate taxable bond market, including Treasuries, government-related and corporate securities, mortgage-backed securities (agency fixed-rate and hybrid adjustable-rate mortgage pass-throughs), asset-backed securities, and commercial mortgage-backed securities. You cannot invest directly in an index. |
| | | | | | |
| Letter to shareholders (unaudited) | | Wells Fargo Asia Pacific Fund | | | 3 | |
Don’t let short-term uncertainty derail long-term investment goals.
Periods of uncertainty can present challenges, but experience has taught us that maintaining long-term investment goals can be an effective way to plan for the future. To help you create a sound strategy based on your personal goals and risk tolerance, Wells Fargo Funds offers more than 100 mutual funds spanning a wide range of asset classes and investment styles. Although diversification cannot guarantee an investment profit or prevent losses, we believe it can be an effective way to manage investment risk and potentially smooth out overall portfolio performance. We encourage investors to know their investments and to understand that appropriate levels of risk-taking may unlock opportunities.
Thank you for choosing to invest in Wells Fargo Funds. We appreciate your confidence in us and remain committed to helping you meet your financial needs.
Sincerely,

Andrew Owen
President
Wells Fargo Funds
Although diversification cannot guarantee an investment profit or prevent losses, we believe it can be an effective way to manage investment risk and potentially smooth out overall portfolio performance.
For further information about your Fund, contact your investment professional, visit our website at
wellsfargofunds.com, or call us directly at 1-800-222-8222. We are available 24 hours a day, 7 days a week.
| | | | |
| 4 | | Wells Fargo Asia Pacific Fund | | Performance highlights (unaudited) |
Investment objective
The Fund seeks long-term capital appreciation.
Manager
Wells Fargo Funds Management, LLC
Subadviser
Wells Capital Management Incorporated
Portfolio managers
Anthony L.T. Cragg
Alison Shimada
Average annual total returns (%) as of April 30, 20171
| | | | | | | | | | | | | | | | | | | | | | | | | | | | | | | | | | |
| | | | | Including sales charge | | | Excluding sales charge | | | Expense ratios2 (%) | |
| | | Inception date | | 1 year | | | 5 year | | | 10 year | | | 1 year | | | 5 year | | | 10 year | | | Gross | | | Net3 | |
| Class A (WFAAX) | | 7-31-2007 | | | 6.15 | | | | 5.82 | | | | 1.87 | | | | 12.62 | | | | 7.07 | | | | 2.48 | | | | 1.69 | | | | 1.60 | |
| Class C (WFCAX) | | 7-31-2007 | | | 10.73 | | | | 6.27 | | | | 1.69 | | | | 11.73 | | | | 6.27 | | | | 1.69 | | | | 2.44 | | | | 2.35 | |
| Administrator Class (WFADX) | | 7-30-2010 | | | – | | | | – | | | | – | | | | 12.73 | | | | 7.26 | | | | 2.59 | | | | 1.61 | | | | 1.50 | |
| Institutional Class (WFPIX) | | 7-30-2010 | | | – | | | | – | | | | – | | | | 12.98 | | | | 7.44 | | | | 2.71 | | | | 1.36 | | | | 1.25 | |
| MSCI AC Asia Pacific Index (Net)4 | | – | | | – | | | | – | | | | – | | | | 16.19 | | | | 6.09 | | | | 2.61 | | | | – | | | | – | |
Figures quoted represent past performance, which is no guarantee of future results, and do not reflect taxes that a shareholder may pay on fund distributions or the redemption of fund shares. Investment return and principal value of an investment will fluctuate so that an investor’s shares, when redeemed, may be worth more or less than their original cost. Performance shown without sales charges would be lower if sales charges were reflected. Current performance may be lower or higher than the performance data quoted, which assumes the reinvestment of dividends and capital gains. Current month-end performance is available on the Fund’s website, wellsfargofunds.com.
Index returns do not include transaction costs associated with buying and selling securities, any mutual fund fees or expenses, or any taxes. It is not possible to invest directly in an index.
For Class A shares, the maximum front-end sales charge is 5.75%. For Class C shares, the maximum contingent deferred sales charge is 1.00%. Performance including a contingent deferred sales charge assumes the sales charge for the corresponding time period. Administrator Class and Institutional Class shares are sold without a front-end sales charge or contingent deferred sales charge.
Stock values fluctuate in response to the activities of individual companies and general market and economic conditions. Foreign investments are especially volatile and can rise or fall dramatically due to differences in the political and economic conditions of the host country. These risks are generally intensified in emerging markets. The use of derivatives may reduce returns and/or increase volatility. Certain investment strategies tend to increase the total risk of an investment (relative to the broader market). The Fund is exposed to geographic risk and smaller-company securities risk. Consult the Fund’s prospectus for additional information on these and other risks.
Please see footnotes on page 5.
| | | | | | |
| Performance highlights (unaudited) | | Wells Fargo Asia Pacific Fund | | | 5 | |
| | | | |
| Ten largest holdings (%) as of April 30, 20175 | |
Alibaba Group Holding Limited ADR | | | 3.34 | |
China Construction Bank H Shares | | | 2.61 | |
Samsung Electronics Company Limited | | | 2.37 | |
Tencent Holdings Limited | | | 2.28 | |
Mitsubishi UFJ Financial Group Incorporated | | | 2.10 | |
Industrial & Commercial Bank of China Limited
H Shares | | | 1.70 | |
Samsung Electronics Company Limited | | | 1.61 | |
Sony Corporation | | | 1.59 | |
Taiwan Semiconductor Manufacturing Company Limited | | | 1.58 | |
Mitsui Fudosan Company Limited | | | 1.49 | |
|
| Country allocation as of April 30, 20176 |
|
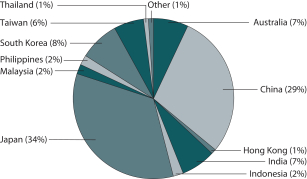
|
|
| Sector distribution as of April 30, 20176 |
|
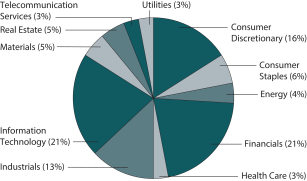
|
| 1 | Historical performance shown for the Class A shares prior to its inception reflects the performance of the former Investor Class shares, and includes the higher expenses applicable to the former Investor Class shares. If these expenses had not been included, returns for Class A shares would be higher. Historical performance shown for the Class C shares prior to its inception is based on the performance of the former Investor Class shares, and has been adjusted to reflect the higher expenses applicable to Class C shares. Historical performance shown for Administrator and Institutional Class shares prior to their inception reflects the performance of Class A shares, and includes the higher expenses applicable to Class A shares. If these expenses had not been included, returns for Administrator and Institutional Class shares would be higher. |
| 2 | Reflects the expense ratios as stated in the most recent prospectuses. The expense ratios shown are subject to change and may differ from the annualized expense ratios shown in the financial highlights of this report. |
| 3 | The manager has contractually committed through February 28, 2018, to waive fees and/or reimburse expenses to the extent necessary to cap the Fund’s Total Annual Fund Operating Expenses After Fee Waivers at the amounts shown. After this time, the cap may be increased or the commitment to maintain the cap may be terminated only with the approval of the Board of Trustees. Brokerage commissions, stamp duty fees, interest, taxes, acquired fund fees and expenses, and extraordinary expenses are excluded from the expense cap. Without this cap, the Fund’s returns would have been lower. The expense ratio paid by an investor is the net expense ratio or the Fund’s Total Annual Fund Operating Expenses After Fee Waivers, as stated in the prospectuses. |
| 4 | The Morgan Stanley Capital International (MSCI) All Country (AC) Asia Pacific Index (Net) is a free-float-adjusted market-capitalization-weighted index that is designed to measure the equity market performance of the developed and emerging markets in the Pacific region. The MSCI AC Asia Pacific Index (Net) consists of the following 12 developed and emerging markets countries: Australia, China, Hong Kong, Indonesia, Japan, Korea, Malaysia, New Zealand, the Philippines, Singapore, Taiwan, and Thailand. Source: MSCI. MSCI makes no express or implied warranties or representations and shall have no liability whatsoever with respect to any MSCI data contained herein. The MSCI data may not be further redistributed or used as a basis for other indexes or any securities or financial products. This report is not approved, reviewed, or produced by MSCI. You cannot invest directly in an index. |
| 5 | The ten largest holdings, excluding cash and cash equivalents, are calculated based on the value of the investments divided by total net assets of the Fund. Holdings are subject to change and may have changed since the date specified. |
| 6 | Amounts are calculated based on the total long-term investments of the Fund. These amounts are subject to change and may have changed since the date specified. |
| | | | |
| 6 | | Wells Fargo Asia Pacific Fund | | Fund expenses (unaudited) |
As a shareholder of the Fund, you incur two types of costs: (1) transaction costs, including sales charges (loads) on purchase payments and contingent deferred sales charges (if any) on redemptions and (2) ongoing costs, including management fees, distribution (12b-1) and/or shareholder servicing fees, and other Fund expenses. This example is intended to help you understand your ongoing costs (in dollars) of investing in the Fund and to compare these costs with the ongoing costs of investing in other mutual funds.
The example is based on an investment of $1,000 invested at the beginning of the six-month period and held for the entire period from November 1, 2016 to April 30, 2017.
Actual expenses
The “Actual” line of the table below provides information about actual account values and actual expenses. You may use the information in this line, together with the amount you invested, to estimate the expenses that you paid over the period. Simply divide your account value by $1,000 (for example, an $8,600 account value divided by $1,000 = 8.6), then multiply the result by the number in the “Actual” line under the heading entitled “Expenses paid during period” for your applicable class of shares to estimate the expenses you paid on your account during this period.
Hypothetical example for comparison purposes
The “Hypothetical” line of the table below provides information about hypothetical account values and hypothetical expenses based on the Fund’s actual expense ratio and an assumed rate of return of 5% per year before expenses, which is not the Fund’s actual return. The hypothetical account values and expenses may not be used to estimate the actual ending account balance or expenses you paid for the period. You may use this information to compare the ongoing costs of investing in the Fund and other funds. To do so, compare this 5% hypothetical example with the 5% hypothetical examples that appear in the shareholder reports of the other funds.
Please note that the expenses shown in the table are meant to highlight your ongoing costs only and do not reflect any transactional costs, such as sales charges (loads) and contingent deferred sales charges. Therefore, the “Hypothetical” line of the table is useful in comparing ongoing costs only and will not help you determine the relative total costs of owning different funds. In addition, if these transactional costs were included, your costs would have been higher.
| | | | | | | | | | | | | | | | |
| | | Beginning
account value
11-1-2016 | | | Ending
account value
4-30-2017 | | | Expenses
paid during
the period¹ | | | Annualized net
expense ratio | |
Class A | | | | | | | | | | | | | | | | |
Actual | | $ | 1,000.00 | | | $ | 1,068.51 | | | $ | 8.21 | | | | 1.60 | % |
Hypothetical (5% return before expenses) | | $ | 1,000.00 | | | $ | 1,016.86 | | | $ | 8.00 | | | | 1.60 | % |
Class C | | | | | | | | | | | | | | | | |
Actual | | $ | 1,000.00 | | | $ | 1,063.58 | | | $ | 12.02 | | | | 2.35 | % |
Hypothetical (5% return before expenses) | | $ | 1,000.00 | | | $ | 1,013.14 | | | $ | 11.73 | | | | 2.35 | % |
Administrator Class | | | | | | | | | | | | | | | | |
Actual | | $ | 1,000.00 | | | $ | 1,068.45 | | | $ | 7.69 | | | | 1.50 | % |
Hypothetical (5% return before expenses) | | $ | 1,000.00 | | | $ | 1,017.36 | | | $ | 7.50 | | | | 1.50 | % |
Institutional Class | | | | | | | | | | | | | | | | |
Actual | | $ | 1,000.00 | | | $ | 1,069.94 | | | $ | 6.42 | | | | 1.25 | % |
Hypothetical (5% return before expenses) | | $ | 1,000.00 | | | $ | 1,018.60 | | | $ | 6.26 | | | | 1.25 | % |
| 1 | Expenses paid is equal to the annualized net expense ratio of each class multiplied by the average account value over the period, multiplied by the number of days in the most recent fiscal half-year divided by the number of days in the fiscal year (to reflect the one-half-year period). |
| | | | | | |
| Portfolio of investments—April 30, 2017 (unaudited) | | Wells Fargo Asia Pacific Fund | | | 7 | |
| | | | | | | | | | | | | | | | |
| Security name | | | | | | | | Shares | | | Value | |
| | | |
Common Stocks: 90.85% | | | | | | | | | | | | | |
| | | | |
| Australia: 6.38% | | | | | | | | | | | | | | | | |
Australia & New Zealand Banking Group Limited (Financials, Banks) | | | | | | | | | | | 61,431 | | | $ | 1,506,945 | |
BHP Billiton Limited (Materials, Metals & Mining) | | | | | | | | | | | 59,774 | | | | 1,061,678 | |
Evolution Mining Limited (Materials, Metals & Mining) | | | | | | | | | | | 435,071 | | | | 746,039 | |
Healthscope Limited (Health Care, Health Care Providers & Services) | | | | | | | | | | | 385,900 | | | | 638,606 | |
Medibank Private Limited (Financials, Insurance) | | | | | | | | | | | 306,927 | | | | 668,796 | |
MYOB Group Limited (Information Technology, Internet Software & Services) | | | | | | | | | | | 256,900 | | | | 677,131 | |
Rio Tinto Limited (Materials, Metals & Mining) | | | | | | | | | | | 38,513 | | | | 1,743,001 | |
Suncorp Group Limited (Financials, Insurance) | | | | | | | | | | | 106,752 | | | | 1,103,115 | |
Woodside Petroleum Limited (Energy, Oil, Gas & Consumable Fuels) | | | | | | | | | | | 43,439 | | | | 1,046,723 | |
| |
| | | | 9,192,034 | |
| | | | | | | | | | | | | | | | |
| | | | |
| China: 23.59% | | | | | | | | | | | | | | | | |
Alibaba Group Holding Limited ADR (Information Technology, Internet Software & Services) † | | | | | | | | | | | 41,700 | | | | 4,816,350 | |
AviChina Industry & Technology Company Limited H Shares (Industrials, Aerospace & Defense) | | | | | | | | | | | 2,137,000 | | | | 1,425,885 | |
Baidu Incorporated ADR (Information Technology, Internet Software & Services) † | | | | | | | | | | | 3,941 | | | | 710,286 | |
Bank of China Limited H Shares (Financials, Banks) | | | | | | | | | | | 1,424,000 | | | | 690,182 | |
Beijing Enterprises Water Group Limited (Utilities, Water Utilities) | | | | | | | | | | | 1,608,000 | | | | 1,232,097 | |
China Communications Construction Company Limited H Shares (Industrials, Construction & Engineering) | | | | | | | | | | | 406,000 | | | | 558,499 | |
China Construction Bank H Shares (Financials, Banks) | | | | | | | | | | | 4,635,000 | | | | 3,765,992 | |
China Everbright International Limited (Industrials, Commercial Services & Supplies) | | | | | | | | | | | 579,000 | | | | 783,081 | |
China Galaxy Securities Company Limited H Shares (Financials, Capital Markets) | | | | | | | | | | | 1,071,500 | | | | 978,054 | |
China Life Insurance Company Limited H Shares (Financials, Insurance) | | | | | | | | | | | 238,000 | | | | 723,637 | |
China Merchants Bank Company Limited H Shares (Financials, Banks) | | | | | | | | | | | 344,000 | | | | 893,351 | |
China Mobile Limited (Telecommunication Services, Wireless Telecommunication Services) | | | | | | | | | | | 124,500 | | | | 1,327,695 | |
China Petroleum & Chemical Corporation H Shares (Energy, Oil, Gas & Consumable Fuels) | | | | | | | | | | | 1,140,000 | | | | 923,332 | |
China Resources Phoenix Healthcare Holdings Company Limited (Health Care, Health Care Providers & Services) « | | | | | | | | | | | 565,000 | | | | 725,647 | |
Goodbaby International Holdings Limited (Consumer Discretionary, Leisure Products) | | | | | | | | | | | 392,601 | | | | 178,172 | |
Huaneng Renewables Corporation Limited H Shares (Utilities, Independent Power & Renewable Electricity Producers) | | | | | | | | | | | 4,424,000 | | | | 1,547,022 | |
Industrial & Commercial Bank of China Limited H Shares (Financials, Banks) | | | | | | | | | | | 3,754,000 | | | | 2,451,718 | |
PetroChina Company Limited H Shares (Energy, Oil, Gas & Consumable Fuels) | | | | | | | | | | | 2,150,000 | | | | 1,514,717 | |
Ping An Insurance (Group) Company of China Limited H Shares (Financials, Insurance) | | | | | | | | | | | 187,500 | | | | 1,055,815 | |
Shanghai Electric Group Company Limited (Industrials, Electrical Equipment) † | | | | | | | | | | | 1,354,000 | | | | 638,848 | |
Shanghai Fosun Pharmaceutical Company Limited H Shares (Health Care, Pharmaceuticals) | | | | | | | | | | | 235,000 | | | | 886,724 | |
Tencent Holdings Limited (Information Technology, Internet Software & Services) | | | | | | | | | | | 104,800 | | | | 3,279,400 | |
Vipshop Holdings Limited ADR (Consumer Discretionary, Internet & Direct Marketing Retail) † | | | | | | | | | | | 54,500 | | | | 755,915 | |
Yum China Holdings Incorporated (Consumer Discretionary, Hotels, Restaurants & Leisure) † | | | | | | | | | | | 40,200 | | | | 1,371,624 | |
Zijin Mining Group Company Limited H Shares (Materials, Metals & Mining) | | | | | | | | | | | 2,104,000 | | | | 743,860 | |
| |
| | | | 33,977,903 | |
| | | | | | | | | | | | | | | | |
| | | | |
| Hong Kong: 1.32% | | | | | | | | | | | | | | | | |
China Overseas Land & Investment Limited (Real Estate, Real Estate Management & Development) | | | | | | | | | | | 426,000 | | | | 1,237,743 | |
IMAX China Holding Incorporated (Consumer Discretionary, Media) 144A† | | | | | | | | | | | 140,500 | | | | 661,104 | |
| |
| | | | 1,898,847 | |
| | | | | | | | | | | | | | | | |
| | | | |
| India: 6.62% | | | | | | | | | | | | | | | | |
Emami Limited (Consumer Staples, Personal Products) | | | | | | | | | | | 47,169 | | | | 775,946 | |
Gateway Distriparks Limited (Industrials, Transportation Infrastructure) | | | | | | | | | | | 115,448 | | | | 478,267 | |
The accompanying notes are an integral part of these financial statements.
| | | | |
| 8 | | Wells Fargo Asia Pacific Fund | | Portfolio of investments—April 30, 2017 (unaudited) |
| | | | | | | | | | | | | | | | |
| Security name | | | | | | | | Shares | | | Value | |
|
| India (continued) | |
HDFC Bank Limited (Financials, Banks) | | | | | | | | | | | 66,300 | | | $ | 1,593,859 | |
Hindalco Industries Limited (Materials, Metals & Mining) | | | | | | | | | | | 304,360 | | | | 943,171 | |
ICICI Bank Limited (Financials, Banks) | | | | | | | | | | | 169,700 | | | | 734,672 | |
Indian Hotels Company Limited (Consumer Discretionary, Hotels, Restaurants & Leisure) | | | | | | | | | | | 590,184 | | | | 1,177,524 | |
ITC Limited (Consumer Staples, Tobacco) | | | | | | | | | | | 197,800 | | | | 854,786 | |
Larsen & Toubro Limited (Industrials, Construction & Engineering) | | | | | | | | | | | 48,036 | | | | 1,306,597 | |
Maruti Suzuki India Limited (Consumer Discretionary, Automobiles) | | | | | | | | | | | 9,700 | | | | 983,850 | |
Reliance Industries Limited (Energy, Oil, Gas & Consumable Fuels) | | | | | | | | | | | 32,079 | | | | 695,735 | |
| |
| | | | 9,544,407 | |
| | | | | | | | | | | | | | | | |
| | | | |
| Indonesia: 1.99% | | | | | | | | | | | | | | | | |
PT Bank Rakyat Indonesia Tbk (Financials, Banks) | | | | | | | | | | | 809,400 | | | | 783,349 | |
PT Cikarang Listrindo Tbk (Utilities, Independent Power & Renewable Electricity Producers) | | | | | | | | | | | 6,279,300 | | | | 607,720 | |
PT Telekomunikasi Indonesia Persero Tbk (Telecommunication Services, Diversified Telecommunication Services) | | | | | | | | | | | 2,451,200 | | | | 803,642 | |
PT Wijaya Karya Persero Tbk (Industrials, Construction & Engineering) | | | | | | | | | | | 3,775,800 | | | | 671,367 | |
| |
| | | | 2,866,078 | |
| | | | | | | | | | | | | | | | |
| | | | |
| Japan: 33.35% | | | | | | | | | | | | | | | | |
FUJIFILM Holdings Corporation (Information Technology, Technology Hardware, Storage & Peripherals) | | | | | | | | | | | 19,400 | | | | 719,440 | |
Hitachi Limited (Information Technology, Electronic Equipment, Instruments & Components) | | | | | | | | | | | 316,000 | | | | 1,743,634 | |
Honda Motor Company Limited (Consumer Discretionary, Automobiles) | | | | | | | | | | | 23,000 | | | | 666,840 | |
Isuzu Motors Limited (Consumer Discretionary, Automobiles) | | | | | | | | | | | 52,300 | | | | 709,375 | |
J. Front Retailing Company Limited (Consumer Discretionary, Multiline Retail) | | | | | | | | | | | 70,100 | | | | 1,009,289 | |
Japan Airlines Company Limited (Industrials, Airlines) | | | | | | | | | | | 51,000 | | | | 1,610,406 | |
Japan Hotel REIT Investment Corporation (Real Estate, Equity REITs) | | | | | | | | | | | 1,000 | | | | 680,870 | |
Japan Rental Housing Investment Incorporated (Real Estate, Equity REITs) | | | | | | | | | | | 1,900 | | | | 1,365,239 | |
Japan Tobacco Incorporated (Consumer Staples, Tobacco) | | | | | | | | | | | 28,300 | | | | 940,837 | |
Kao Corporation (Consumer Staples, Personal Products) | | | | | | | | | | | 13,500 | | | | 744,544 | |
Kose Corporation (Consumer Staples, Personal Products) | | | | | | | | | | | 7,700 | | | | 730,110 | |
Kubota Corporation (Industrials, Machinery) | | | | | | | | | | | 71,200 | | | | 1,119,656 | |
Kyushu Railway Company (Industrials, Road & Rail) | | | | | | | | | | | 61,400 | | | | 1,925,033 | |
Macromill Incorporated (Information Technology, Internet Software & Services) | | | | | | | | | | | 58,000 | | | | 1,016,658 | |
Matsumotokiyoshi Holdings Company Limited (Consumer Staples, Food & Staples Retailing) | | | | | | | | | | | 31,600 | | | | 1,584,606 | |
Mitsubishi UFJ Financial Group Incorporated (Financials, Banks) | | | | | | | | | | | 475,800 | | | | 3,027,023 | |
Mitsui Fudosan Company Limited (Real Estate, Real Estate Management & Development) | | | | | | | | | | | 98,000 | | | | 2,153,407 | |
Nagoya Railroad Company Limited (Industrials, Road & Rail) | | | | | | | | | | | 202,000 | | | | 927,778 | |
Nintendo Company Limited (Information Technology, Software) | | | | | | | | | | | 3,300 | | | | 830,218 | |
Nippon Telegraph & Telephone Corporation (Telecommunication Services, Diversified Telecommunication Services) | | | | | | | | | | | 18,900 | | | | 808,559 | |
NTT DOCOMO Incorporated (Telecommunication Services, Wireless Telecommunication Services) | | | | | | | | | | | 62,000 | | | | 1,495,008 | |
Obayashi Corporation (Industrials, Construction & Engineering) | | | | | | | | | | | 196,200 | | | | 1,902,599 | |
ORIX Corporation (Financials, Diversified Financial Services) | | | | | | | | | | | 109,800 | | | | 1,675,441 | |
Otsuka Corporation (Information Technology, IT Services) | | | | | | | | | | | 23,200 | | | | 1,242,467 | |
Panasonic Corporation (Consumer Discretionary, Household Durables) | | | | | | | | | | | 139,700 | | | | 1,667,377 | |
Recruit Holdings Company Limited (Industrials, Professional Services) | | | | | | | | | | | 18,700 | | | | 944,436 | |
Resona Holdings Incorporated (Financials, Banks) | | | | | | | | | | | 295,600 | | | | 1,643,533 | |
Ryohin Keikaku Company Limited (Consumer Discretionary, Multiline Retail) | | | | | | | | | | | 7,400 | | | | 1,668,858 | |
Sekisui House Limited (Consumer Discretionary, Household Durables) | | | | | | | | | | | 115,400 | | | | 1,914,620 | |
Skylark Company Limited (Consumer Discretionary, Hotels, Restaurants & Leisure) | | | | | | | | | | | 127,900 | | | | 1,934,419 | |
Sony Corporation (Consumer Discretionary, Household Durables) | | | | | | | | | | | 67,800 | | | | 2,286,254 | |
Sumitomo Mitsui Trust Holdings Incorporated (Financials, Banks) | | | | | | | | | | | 55,100 | | | | 1,886,671 | |
The accompanying notes are an integral part of these financial statements.
| | | | | | |
| Portfolio of investments—April 30, 2017 (unaudited) | | Wells Fargo Asia Pacific Fund | | | 9 | |
| | | | | | | | | | | | | | | | |
| Security name | | | | | | | | Shares | | | Value | |
| | | | |
| Japan (continued) | | | | | | | | | | | | | | | | |
Suzuki Motor Corporation (Consumer Discretionary, Automobiles) | | | | | | | | | | | 25,700 | | | $ | 1,072,495 | |
Toyota Motor Corporation (Consumer Discretionary, Automobiles) | | | | | | | | | | | 12,700 | | | | 687,549 | |
Tsukui Corporation (Health Care, Health Care Providers & Services) | | | | | | | | | | | 187,300 | | | | 1,061,885 | |
Yahoo! Japan Corporation (Information Technology, Internet Software & Services) | | | | | | | | | | | 149,800 | | | | 640,992 | |
| | | | |
| | | | | | | | | | | | | | | 48,038,126 | |
| | | | | | | | | | | | | | | | |
| | | | |
| Malaysia: 2.38% | | | | | | | | | | | | | | | | |
Bursa Malaysia Bhd (Financials, Diversified Financial Services) | | | | | | | | | | | 329,300 | | | | 778,304 | |
Genting Malaysia Bhd (Consumer Discretionary, Hotels, Restaurants & Leisure) | | | | | | | | | | | 585,300 | | | | 791,456 | |
IHH Healthcare Bhd (Health Care, Health Care Providers & Services) | | | | | | | | | | | 770,000 | | | | 1,096,199 | |
Sime Darby Bhd (Industrials, Industrial Conglomerates) | | | | | | | | | | | 353,200 | | | | 759,124 | |
| | | | |
| | | | | | | | | | | | | | | 3,425,083 | |
| | | | | | | | | | | | | | | | |
| | | | |
| Philippines: 1.52% | | | | | | | | | | | | | | | | |
GT Capital Holdings Incorporated (Financials, Diversified Financial Services) | | | | | | | | | | | 42,605 | | | | 1,074,398 | |
Semirara Mining and Power Corporation (Energy, Oil, Gas & Consumable Fuels) | | | | | | | | | | | 374,860 | | | | 1,117,865 | |
| | | | |
| | | | | | | | | | | | | | | 2,192,263 | |
| | | | | | | | | | | | | | | | |
| | | | |
| Singapore: 0.46% | | | | | | | | | | | | | | | | |
CapitaLand Mall Trust (Real Estate, Equity REITs) | | | | | | | | | | | 472,700 | | | | 666,513 | |
| | | | | | | | | | | | | | | | |
| | | | |
| South Korea: 6.03% | | | | | | | | | | | | | | | | |
Hana Financial Group Incorporated (Financials, Banks) | | | | | | | | | | | 41,335 | | | | 1,423,967 | |
KB Financial Group Incorporated (Financials, Banks) | | | | | | | | | | | 31,701 | | | | 1,395,747 | |
Korea Electric Power Corporation (Utilities, Electric Utilities) | | | | | | | | | | | 26,713 | | | | 1,064,623 | |
LG Chem Limited (Materials, Chemicals) | | | | | | | | | | | 3,049 | | | | 734,182 | |
POSCO (Materials, Metals & Mining) | | | | | | | | | | | 2,748 | | | | 646,006 | |
Samsung Electronics Company Limited (Information Technology, Technology Hardware, Storage & Peripherals) | | | | | | | | | | | 1,743 | | | | 3,417,377 | |
| | | | |
| | | | | | | | | | | | | | | 8,681,902 | |
| | | | | | | | | | | | | | | | |
| | | | |
| Taiwan: 5.79% | | | | | | | | | | | | | | | | |
Advanced Semiconductor Engineering Incorporated (Information Technology, Semiconductors & Semiconductor Equipment) | | | | | | | | | | | 631,114 | | | | 793,834 | |
Chicony Electronics Company Limited (Information Technology, Technology Hardware, Storage & Peripherals) | | | | | | | | | | | 410 | | | | 1,082 | |
Hon Hai Precision Industry Company Limited (Information Technology, Electronic Equipment, Instruments & Components) | | | | | | | | | | | 472,085 | | | | 1,545,922 | |
Siliconware Precision Industries Company (Information Technology, Semiconductors & Semiconductor Equipment) | | | | | | | | | | | 493,000 | | | | 799,036 | |
Taiwan Paiho Limited (Consumer Discretionary, Textiles, Apparel & Luxury Goods) | | | | | | | | | | | 228,000 | | | | 759,471 | |
Taiwan Semiconductor Manufacturing Company Limited (Information Technology, Semiconductors & Semiconductor Equipment) | | | | | | | | | | | 354,000 | | | | 2,282,092 | |
Tung Thih Electronic Company Limited (Consumer Discretionary, Auto Components) | | | | | | | | | | | 76,000 | | | | 521,428 | |
Uni-President Enterprises Corporation (Consumer Staples, Food Products) | | | | | | | | | | | 413,000 | | | | 762,457 | |
United Microelectronics Corporation (Information Technology, Semiconductors & Semiconductor Equipment) | | | | | | | | | | | 2,180,000 | | | | 870,671 | |
| | | | |
| | | | | | | | | | | | | | | 8,335,993 | |
| | | | | | | | | | | | | | | | |
| | | | |
| Thailand: 1.04% | | | | | | | | | | | | | | | | |
Land & Houses PCL (Real Estate, Real Estate Management & Development) | | | | | | | | | | | 2,679,400 | | | | 797,855 | |
Thai Beverage PCL (Consumer Staples, Beverages) | | | | | | | | | | | 1,060,300 | | | | 701,984 | |
| | | | |
| | | | | | | | | | | | | | | 1,499,839 | |
| | | | | | | | | | | | | | | | |
The accompanying notes are an integral part of these financial statements.
| | | | |
| 10 | | Wells Fargo Asia Pacific Fund | | Portfolio of investments—April 30, 2017 (unaudited) |
| | | | | | | | | | | | | | | | |
| Security name | | | | | | | | Shares | | | Value | |
| | | | |
| Vietnam: 0.38% | | | | | | | | | | | | | | | | |
Masan Group Corporation (Consumer Staples, Food Products) | | | | | | | | | | | 281,050 | | | $ | 549,285 | |
| | | | | | | | | | | | | | | | |
| |
Total Common Stocks (Cost $116,031,850) | | | | 130,868,273 | |
| | | | | | | | | | | | | | | | |
| | | | |
| | | | | | Expiration date | | | | | | | |
| Participation Notes: 5.21% | | | | | | | | | | | | | | | | |
| | | | |
| China: 5.21% | | | | | | | | | | | | | | | | |
HSBC Bank plc (Baoshan Iron & Steel Company Limited Class A) (Industrials, Machinery) † | | | | | | | 2-19-2019 | | | | 870,995 | | | | 789,123 | |
HSBC Bank plc (China International Travel Service Corporation Limited Class A) (Consumer Discretionary, Hotels, Restaurants & Leisure) † | | | | | | | 12-23-2024 | | | | 95,500 | | | | 736,973 | |
HSBC Bank plc (Han’s Laser Technology Industry Group Company Limited Class A) (Industrials, Machinery) † | | | | | | | 3-18-2019 | | | | 229,000 | | | | 977,857 | |
HSBC Bank plc (Hangzhou Hikvision Digital Technology Company Limited Class A) (Information Technology, Electronic Equipment, Instruments & Components) † | | | | | | | 6-18-2018 | | | | 286,000 | | | | 1,518,573 | |
HSBC Bank plc (Inner Mongolia Yili Industrial Group Company Limited Class A) (Consumer Staples, Food Products) † | | | | | | | 9-25-2023 | | | | 344,600 | | | | 913,610 | |
HSBC Bank plc (Midea Group Company Limited Class A) (Consumer Discretionary, Household Durables) † | | | | | | | 5-8-2018 | | | | 175,000 | | | | 855,258 | |
UBS AG (GoerTek Incorporated Class A) (Information Technology, Electronic Equipment, Instruments & Components) † | | | | | | | 7-17-2026 | | | | 331,400 | | | | 835,790 | |
UBS AG (Han’s Laser Technology Industry Group Company Limited Class A) (Industrials, Machinery) † | | | | | | | 3-19-2018 | | | | 203,912 | | | | 870,728 | |
| |
Total Participation Notes (Cost $6,195,570) | | | | 7,497,912 | |
| | | | | | | | | | | | | | | | |
| | |
| | | Dividend yield | | | | |
| Preferred Stocks: 1.61% | | | | | | | | | | | | | | | | |
| | | | |
| South Korea: 1.61% | | | | | | | | | | | | | | | | |
Samsung Electronics Company Limited (Information Technology, Technology Hardware, Storage & Peripherals) ± | | | 1.94 | % | | | | | | | 1,509 | | | | 2,324,701 | |
| | | | | | | | | | | | | | | | |
| |
Total Preferred Stocks (Cost $1,045,900) | | | | 2,324,701 | |
| | | | | | | | | | | | | | | | |
| | |
| | | Yield | | | | |
| Short-Term Investments: 2.10% | | | | | | | | | | | | | | | | |
| | | | |
| Investment Companies: 2.10% | | | | | | | | | | | | | | | | |
Securities Lending Cash Investment LLC (l)(r)(u) | | | 1.03 | | | | | | | | 269,973 | | | | 270,000 | |
Wells Fargo Government Money Market Fund Select Class (l)(u) | | | 0.68 | | | | | | | | 2,754,710 | | | | 2,754,710 | |
| |
Total Short-Term Investments (Cost $3,024,710) | | | | 3,024,710 | |
| | | | | | | | | | | | | | | | |
| | | | | | | | |
| Total investments in securities (Cost $126,298,030) * | | | 99.77 | % | | | 143,715,596 | |
Other assets and liabilities, net | | | 0.23 | | | | 331,149 | |
| | | | | | | | |
| Total net assets | | | 100.00 | % | | $ | 144,046,745 | |
| | | | | | | | |
The accompanying notes are an integral part of these financial statements.
| | | | | | |
| Portfolio of investments—April 30, 2017 (unaudited) | | Wells Fargo Asia Pacific Fund | | | 11 | |
| † | Non-income-earning security |
| « | All or a portion of this security is on loan. |
| 144A | The security may be resold in transactions exempt from registration, normally to qualified institutional buyers, pursuant to Rule 144A under the Securities Act of 1933. |
| ± | Variable rate investment. The rate shown is the rate in effect at period end. |
| (l) | The issuer of the security is an affiliated person of the Fund as defined in the Investment Company Act of 1940. |
| (r) | The investment is a non-registered investment vehicle purchased with cash collateral received from securities on loan. |
| (u) | The rate represents the 7-day annualized yield at period end. |
| * | Cost for federal income tax purposes is $126,926,704 and unrealized gains (losses) consists of: |
| | | | |
Gross unrealized gains | | $ | 19,701,880 | |
Gross unrealized losses | | | (2,912,988 | ) |
| | | | |
Net unrealized gains | | $ | 16,788,892 | |
The accompanying notes are an integral part of these financial statements.
| | | | |
| 12 | | Wells Fargo Asia Pacific Fund | | Statement of assets and liabilities—April 30, 2017 (unaudited) |
| | | | |
| | | | |
| |
Assets | | | | |
Investments | | | | |
In unaffiliated securities (including $256,784 of securities loaned), at value (cost $123,273,320) | | $ | 140,690,886 | |
In affiliated securities, at value (cost $3,024,710) | | | 3,024,710 | |
| | | | |
Total investments, at value (cost $126,298,030) | | | 143,715,596 | |
Foreign currency, at value (cost $717,575) | | | 716,238 | |
Receivable for investments sold | | | 252,199 | |
Receivable for Fund shares sold | | | 7,919 | |
Receivable for dividends | | | 446,891 | |
Receivable for securities lending income | | | 461 | |
Prepaid expenses and other assets | | | 20,306 | |
| | | | |
Total assets | | | 145,159,610 | |
| | | | |
| |
Liabilities | | | | |
Payable for investments purchased | | | 397,379 | |
Payable for Fund shares redeemed | | | 218,720 | |
Payable upon receipt of securities loaned | | | 270,000 | |
Management fee payable | | | 110,210 | |
Distribution fee payable | | | 1,261 | |
Administration fees payable | | | 22,991 | |
Accrued expenses and other liabilities | | | 92,304 | |
| | | | |
Total liabilities | | | 1,112,865 | |
| | | | |
Total net assets | | $ | 144,046,745 | |
| | | | |
| |
NET ASSETS CONSIST OF | | | | |
Paid-in capital | | $ | 213,357,012 | |
Overdistributed net investment income | | | (472,817 | ) |
Accumulated net realized losses on investments | | | (86,251,891 | ) |
Net unrealized gains on investments | | | 17,414,441 | |
| | | | |
Total net assets | | $ | 144,046,745 | |
| | | | |
| |
COMPUTATION OF NET ASSET VALUE AND OFFERING PRICE PER SHARE | | | | |
Net assets – Class A | | $ | 115,297,913 | |
Shares outstanding – Class A1 | | | 9,031,829 | |
Net asset value per share – Class A | | | $12.77 | |
Maximum offering price per share – Class A2 | | | $13.55 | |
Net assets – Class C | | $ | 2,042,435 | |
Shares outstanding – Class C1 | | | 168,350 | |
Net asset value per share – Class C | | | $12.13 | |
Net assets – Administrator Class | | $ | 4,545,929 | |
Shares outstanding – Administrator Class1 | | | 362,291 | |
Net asset value per share – Administrator Class | | | $12.55 | |
Net assets – Institutional Class | | $ | 22,160,468 | |
Shares outstanding – Institutional Class1 | | | 1,772,485 | |
Net asset value per share – Institutional Class | | | $12.50 | |
| 1 | The Fund has an unlimited number of authorized shares. |
| 2 | Maximum offering price is computed as 100/94.25 of net asset value. On investments of $50,000 or more, the offering price is reduced. |
The accompanying notes are an integral part of these financial statements.
| | | | | | |
| Statement of operations—six months ended April 30, 2017 (unaudited) | | Wells Fargo Asia Pacific Fund | | | 13 | |
| | | | |
| | | | |
| |
Investment income | | | | |
Dividends (net of foreign withholding taxes of $146,752) | | $ | 1,133,635 | |
Securities lending income, net | | | 21,764 | |
Income from affiliated securities | | | 5,812 | |
| | | | |
Total investment income | | | 1,161,211 | |
| | | | �� |
| |
Expenses | | | | |
Management fee | | | 697,478 | |
Administration fees | | | | |
Class A | | | 119,977 | |
Class C | | | 2,153 | |
Administrator Class | | | 3,438 | |
Institutional Class | | | 11,630 | |
Shareholder servicing fees | | | | |
Class A | | | 142,830 | |
Class C | | | 2,563 | |
Administrator Class | | | 6,611 | |
Distribution fee | | | | |
Class C | | | 7,690 | |
Custody and accounting fees | | | 32,290 | |
Professional fees | | | 36,305 | |
Registration fees | | | 35,351 | |
Shareholder report expenses | | | 10,259 | |
Trustees’ fees and expenses | | | 12,569 | |
Other fees and expenses | | | 15,854 | |
| | | | |
Total expenses | | | 1,136,998 | |
Less: Fee waivers and/or expense reimbursements | | | (47,299 | ) |
| | | | |
Net expenses | | | 1,089,699 | |
| | | | |
Net investment income | | | 71,512 | |
| | | | |
| |
REALIZED AND UNREALIZED GAINS (LOSSES) ON INVESTMENTS | | | | |
| |
Net realized gains (losses) on: | | | | |
Unaffiliated securities | | | (893,649 | ) |
Affiliated securities | | | 59 | |
| | | | |
Net realized losses on investments | | | (893,590 | ) |
| | | | |
| |
Net change in unrealized gains (losses) on: | | | | |
Unaffiliated securities | | | 10,090,801 | |
Affiiliated securities | | | (59 | ) |
| | | | |
Net change in unrealized gains (losses) on investments | | | 10,090,742 | |
| | | | |
Net realized and unrealized gains (losses) on investments | | | 9,197,152 | |
| | | | |
Net increase in net assets resulting from operations | | $ | 9,268,664 | |
| | | | |
The accompanying notes are an integral part of these financial statements.
| | | | |
| 14 | | Wells Fargo Asia Pacific Fund | | Statement of changes in net assets |
| | | | | | | | | | | | | | | | |
| | | Six months ended April 30, 2017 (unaudited) | | | Year ended
October 31, 2016 | |
| | | | |
Operations | | | | | | | | | | | | | | | | |
Net investment income | | | | | | $ | 71,512 | | | | | | | $ | 1,443,500 | |
Net realized losses on investments | | | | | | | (893,590 | ) | | | | | | | (3,319,116 | ) |
Net change in unrealized gains (losses) on investments | | | | | | | 10,090,742 | | | | | | | | 5,861,420 | |
| | | | |
Net increase in net assets resulting from operations | | | | | | | 9,268,664 | | | | | | | | 3,985,804 | |
| | | | |
| | | | |
Distributions to shareholders from | | | | | | | | | | | | | | | | |
Net investment income | | | | | | | | | | | | | | | | |
Class A | | | | | | | (1,463,867 | ) | | | | | | | (2,403,259 | ) |
Class C | | | | | | | (6,107 | ) | | | | | | | (44,466 | ) |
Administrator Class | | | | | | | (50,069 | ) | | | | | | | (274,359 | ) |
Institutional Class | | | | | | | (295,073 | ) | | | | | | | (250,376 | ) |
| | | | |
Total distributions to shareholders | | | | | | | (1,815,116 | ) | | | | | | | (2,972,460 | ) |
| | | | |
| | | | |
Capital share transactions | | | Shares | | | | | | | | Shares | | | | | |
Proceeds from shares sold | | | | | | | | | | | | | | | | |
Class A | | | 449,173 | | | | 5,474,963 | | | | 1,604,531 | | | | 18,556,341 | |
Class C | | | 4,591 | | | | 54,262 | | | | 13,686 | | | | 149,151 | |
Administrator Class | | | 40,860 | | | | 481,843 | | | | 70,112 | | | | 783,199 | |
Institutional Class | | | 1,049,276 | | | | 12,210,422 | | | | 334,375 | | | | 3,796,409 | |
| | | | |
| | | | | | | 18,221,490 | | | | | | | | 23,285,100 | |
| | | | |
Reinvestment of distributions | | | | | | | | | | | | | | | | |
Class A | | | 124,042 | | | | 1,419,041 | | | | 203,382 | | | | 2,336,858 | |
Class C | | | 449 | | | | 4,899 | | | | 3,274 | | | | 35,719 | |
Administrator Class | | | 4,266 | | | | 47,951 | | | | 24,161 | | | | 272,051 | |
Institutional Class | | | 25,127 | | | | 281,166 | | | | 20,214 | | | | 227,203 | |
| | | | |
| | | | | | | 1,753,057 | | | | | | | | 2,871,831 | |
| | | | |
Payment for shares redeemed | | | | | | | | | | | | | | | | |
Class A | | | (1,457,709 | ) | | | (17,686,187 | ) | | | (3,431,646 | ) | | | (39,403,961 | ) |
Class C | | | (31,015 | ) | | | (354,378 | ) | | | (132,110 | ) | | | (1,420,868 | ) |
Administrator Class | | | (638,580 | ) | | | (7,321,928 | ) | | | (337,011 | ) | | | (3,756,219 | ) |
Institutional Class | | | (162,723 | ) | | | (1,943,367 | ) | | | (434,461 | ) | | | (4,818,709 | ) |
| | | | |
| | | | | | | (27,305,860 | ) | | | | | | | (49,399,757 | ) |
| | | | |
Net decrease in net assets resulting from capital share transactions | | | | | | | (7,331,313 | ) | | | | | | | (23,242,826 | ) |
| | | | |
Total increase (decrease) in net assets | | | | | | | 122,235 | | | | | | | | (22,229,482 | ) |
| | | | |
| | | | |
Net assets | | | | | | | | | | | | | | | | |
Beginning of period | | | | | | | 143,924,510 | | | | | | | | 166,153,992 | |
| | | | |
End of period | | | | | | $ | 144,046,745 | | | | | | | $ | 143,924,510 | |
| | | | |
Undistributed (overdistributed) net investment income | | | | | | $ | (472,817 | ) | | | | | | $ | 1,270,787 | |
| | | | |
The accompanying notes are an integral part of these financial statements.
| | | | | | |
| Financial highlights | | Wells Fargo Asia Pacific Fund | | | 15 | |
(For a share outstanding throughout each period)
| | | | | | | | | | | | | | | | | | | | | | | | |
| | | Six months ended
April 30, 2017 (unaudited) | | | Year ended October 31 | |
| CLASS A | | | 2016 | | | 2015 | | | 2014 | | | 2013 | | | 2012 | |
Net asset value, beginning of period | | | $12.11 | | | | $11.92 | | | | $12.18 | | | | $11.72 | | | | $10.19 | | | | $9.30 | |
Net investment income | | | 0.00 | 1 | | | 0.11 | 2 | | | 0.04 | 2 | | | 0.09 | 2 | | | 0.12 | 2 | | | 0.10 | 2 |
Net realized and unrealized gains (losses) on investments | | | 0.81 | | | | 0.29 | | | | (0.16 | ) | | | 0.67 | | | | 1.79 | | | | 0.79 | |
| | | | | | | | | | | | | | | | | | | | | | | | |
Total from investment operations | | | 0.81 | | | | 0.40 | | | | (0.12 | ) | | | 0.76 | | | | 1.91 | | | | 0.89 | |
Distributions to shareholders from | | | | | | | | | | | | | | | | | | | | | | | | |
Net investment income | | | (0.15 | ) | | | (0.21 | ) | | | (0.14 | ) | | | (0.30 | ) | | | (0.38 | ) | | | 0.00 | |
Net asset value, end of period | | | $12.77 | | | | $12.11 | | | | $11.92 | | | | $12.18 | | | | $11.72 | | | | $10.19 | |
Total return3 | | | 6.85 | % | | | 3.47 | % | | | (0.95 | )% | | | 6.61 | % | | | 19.24 | % | | | 9.57 | % |
Ratios to average net assets (annualized) | | | | | | | | | | | | | | | | | | | | | | | | |
Gross expenses | | | 1.66 | % | | | 1.69 | % | | | 1.72 | % | | | 1.71 | % | | | 1.79 | % | | | 1.86 | % |
Net expenses | | | 1.60 | % | | | 1.60 | % | | | 1.60 | % | | | 1.60 | % | | | 1.60 | % | | | 1.60 | % |
Net investment income | | | 0.05 | % | | | 0.97 | % | | | 0.34 | % | | | 0.80 | % | | | 1.08 | % | | | 1.04 | % |
Supplemental data | | | | | | | | | | | | | | | | | | | | | | | | |
Portfolio turnover rate | | | 56 | % | | | 52 | % | | | 113 | % | | | 113 | % | | | 187 | % | | | 163 | % |
Net assets, end of period (000s omitted) | | | $115,298 | | | | $120,108 | | | | $137,578 | | | | $6,755 | | | | $8,720 | | | | $5,699 | |
| 1 | Amount is less than $0.005. |
| 2 | Calculated based upon average shares outstanding |
| 3 | Total return calculations do not include any sales charges. Returns for periods of less than one year are not annualized. |
The accompanying notes are an integral part of these financial statements.
| | | | |
| 16 | | Wells Fargo Asia Pacific Fund | | Financial highlights |
(For a share outstanding throughout each period)
| | | | | | | | | | | | | | | | | | | | | | | | |
| | | Six months ended
April 30, 2017 (unaudited) | | | Year ended October 31 | |
| CLASS C | | | 2016 | | | 2015 | | | 2014 | | | 2013 | | | 2012 | |
Net asset value, beginning of period | | | $11.44 | | | | $11.29 | | | | $11.57 | | | | $11.15 | | | | $9.73 | | | | $8.98 | |
Net investment income (loss) | | | (0.04 | )1 | | | 0.02 | 1 | | | (0.00 | )1,2 | | | 0.01 | 1 | | | 0.05 | | | | 0.09 | 1 |
Net realized and unrealized gains (losses) on investments | | | 0.76 | | | | 0.28 | | | | (0.20 | ) | | | 0.63 | | | | 1.69 | | | | 0.69 | |
| | | | | | | | | | | | | | | | | | | | | | | | |
Total from investment operations | | | 0.72 | | | | 0.30 | | | | (0.20 | ) | | | 0.64 | | | | 1.74 | | | | 0.78 | |
Distributions to shareholders from | | | | | | | | | | | | | | | | | | | | | | | | |
Net investment income | | | (0.03 | ) | | | (0.15 | ) | | | (0.08 | ) | | | (0.22 | ) | | | (0.32 | ) | | | (0.03 | ) |
Net asset value, end of period | | | $12.13 | | | | $11.44 | | | | $11.29 | | | | $11.57 | | | | $11.15 | | | | $9.73 | |
Total return3 | | | 6.36 | % | | | 2.75 | % | | | (1.71 | )% | | | 5.76 | % | | | 18.44 | % | | | 8.78 | % |
Ratios to average net assets (annualized) | | | | | | | | | | | | | | | | | | | | | | | | |
Gross expenses | | | 2.41 | % | | | 2.44 | % | | | 2.46 | % | | | 2.46 | % | | | 2.54 | % | | | 2.62 | % |
Net expenses | | | 2.35 | % | | | 2.35 | % | | | 2.35 | % | | | 2.35 | % | | | 2.35 | % | | | 2.35 | % |
Net investment income (loss) | | | (0.71 | )% | | | 0.14 | % | | | (0.01 | )% | | | 0.12 | % | | | 0.37 | % | | | 0.92 | % |
Supplemental data | | | | | | | | | | | | | | | | | | | | | | | | |
Portfolio turnover rate | | | 56 | % | | | 52 | % | | | 113 | % | | | 113 | % | | | 187 | % | | | 163 | % |
Net assets, end of period (000s omitted) | | | $2,042 | | | | $2,223 | | | | $3,495 | | | | $2,427 | | | | $1,980 | | | | $1,673 | |
| 1 | Calculated based upon average shares outstanding |
| 2 | Amount is less than $0.005. |
| 3 | Total return calculations do not include any sales charges. Returns for periods of less than one year are not annualized. |
The accompanying notes are an integral part of these financial statements.
| | | | | | |
| Financial highlights | | Wells Fargo Asia Pacific Fund | | | 17 | |
(For a share outstanding throughout each period)
| | | | | | | | | | | | | | | | | | | | | | | | |
| | | Six months ended
April 30, 2017 (unaudited) | | | Year ended October 31 | |
| ADMINISTRATOR CLASS | | | 2016 | | | 2015 | | | 2014 | | | 2013 | | | 2012 | |
Net asset value, beginning of period | | | $11.88 | | | | $11.72 | | | | $11.99 | | | | $11.54 | | | | $10.04 | | | | $9.29 | |
Net investment income | | | 0.00 | 1,2 | | | 0.12 | | | | 0.11 | 1 | | | 0.12 | 1 | | | 0.14 | 1 | | | 0.17 | |
Net realized and unrealized gains (losses) on investments | | | 0.80 | | | | 0.29 | | | | (0.21 | ) | | | 0.65 | | | | 1.77 | | | | 0.71 | |
| | | | | | | | | | | | | | | | | | | | | | | | |
Total from investment operations | | | 0.80 | | | | 0.41 | | | | (0.10 | ) | | | 0.77 | | | | 1.91 | | | | 0.88 | |
Distributions to shareholders from | | | | | | | | | | | | | | | | | | | | | | | | |
Net investment income | | | (0.13 | ) | | | (0.25 | ) | | | (0.17 | ) | | | (0.32 | ) | | | (0.41 | ) | | | (0.13 | ) |
Net asset value, end of period | | | $12.55 | | | | $11.88 | | | | $11.72 | | | | $11.99 | | | | $11.54 | | | | $10.04 | |
Total return3 | | | 6.84 | % | | | 3.60 | % | | | (0.83 | )% | | | 6.86 | % | | | 19.57 | % | | | 9.66 | % |
Ratios to average net assets (annualized) | | | | | | | | | | | | | | | | | | | | | | | | |
Gross expenses | | | 1.58 | % | | | 1.61 | % | | | 1.56 | % | | | 1.52 | % | | | 1.61 | % | | | 1.67 | % |
Net expenses | | | 1.50 | % | | | 1.47 | % | | | 1.40 | % | | | 1.40 | % | | | 1.40 | % | | | 1.40 | % |
Net investment income | | | 0.02 | % | | | 1.07 | % | | | 0.87 | % | | | 1.04 | % | | | 1.26 | % | | | 1.74 | % |
Supplemental data | | | | | | | | | | | | | | | | | | | | | | | | |
Portfolio turnover rate | | | 56 | % | | | 52 | % | | | 113 | % | | | 113 | % | | | 187 | % | | | 163 | % |
Net assets, end of period (000s omitted) | | | $4,546 | | | | $11,357 | | | | $14,048 | | | | $13,956 | | | | $12,577 | | | | $12,860 | |
| 1 | Calculated based upon average shares outstanding |
| 2 | Amount is less than $0.005. |
| 3 | Returns for periods of less than one year are not annualized. |
The accompanying notes are an integral part of these financial statements.
| | | | |
| 18 | | Wells Fargo Asia Pacific Fund | | Financial highlights |
(For a share outstanding throughout each period)
| | | | | | | | | | | | | | | | | | | | | | | | |
| | | Six months ended
April 30, 2017 (unaudited) | | | Year ended October 31 | |
| INSTITUTIONAL CLASS | | | 2016 | | | 2015 | | | 2014 | | | 2013 | | | 2012 | |
Net asset value, beginning of period | | | $11.89 | | | | $11.73 | | | | $12.00 | | | | $11.55 | | | | $10.05 | | | | $9.30 | |
Net investment income | | | 0.08 | | | | 0.13 | | | | 0.15 | 1 | | | 0.14 | 1 | | | 0.18 | 1 | | | 0.18 | |
Net realized and unrealized gains (losses) on investments | | | 0.73 | | | | 0.30 | | | | (0.23 | ) | | | 0.65 | | | | 1.74 | | | | 0.71 | |
| | | | | | | | | | | | | | | | | | | | | | | | |
Total from investment operations | | | 0.81 | | | | 0.43 | | | | (0.08 | ) | | | 0.79 | | | | 1.92 | | | | 0.89 | |
Distributions to shareholders from | | | | | | | | | | | | | | | | | | | | | | | | |
Net investment income | | | (0.20 | ) | | | (0.27 | ) | | | (0.19 | ) | | | (0.34 | ) | | | (0.42 | ) | | | (0.14 | ) |
Net asset value, end of period | | | $12.50 | | | | $11.89 | | | | $11.73 | | | | $12.00 | | | | $11.55 | | | | $10.05 | |
Total return2 | | | 6.99 | % | | | 3.83 | % | | | (0.65 | )% | | | 6.99 | % | | | 19.70 | % | | | 9.90 | % |
Ratios to average net assets (annualized) | | | | | | | | | | | | | | | | | | | | | | | | |
Gross expenses | | | 1.34 | % | | | 1.36 | % | | | 1.36 | % | | | 1.27 | % | | | 1.33 | % | | | 1.42 | % |
Net expenses | | | 1.25 | % | | | 1.25 | % | | | 1.25 | % | | | 1.25 | % | | | 1.25 | % | | | 1.25 | % |
Net investment income | | | 0.53 | % | | | 1.28 | % | | | 1.27 | % | | | 1.15 | % | | | 1.62 | % | | | 1.86 | % |
Supplemental data | | | | | | | | | | | | | | | | | | | | | | | | |
Portfolio turnover rate | | | 56 | % | | | 52 | % | | | 113 | % | | | 113 | % | | | 187 | % | | | 163 | % |
Net assets, end of period (000s omitted) | | | $22,160 | | | | $10,237 | | | | $11,034 | | | | $502 | | | | $129 | | | | $12 | |
| 1 | Calculated based upon average shares outstanding |
| 2 | Returns for periods of less than one year are not annualized. |
The accompanying notes are an integral part of these financial statements.
| | | | | | |
| Notes to financial statements (unaudited) | | Wells Fargo Asia Pacific Fund | | | 19 | |
1. ORGANIZATION
Wells Fargo Funds Trust (the “Trust”), a Delaware statutory trust organized on March 10, 1999, is an open-end management investment company registered under the Investment Company Act of 1940, as amended (the “1940 Act”). As an investment company, the Trust follows the accounting and reporting guidance in Financial Accounting Standards Board (“FASB”) Accounting Standards Codification (“ASC”) Topic 946, Financial Services – Investment Companies. These financial statements report on the Wells Fargo Asia Pacific Fund (the “Fund”) which is a diversified series of the Trust.
2. SIGNIFICANT ACCOUNTING POLICIES
The following significant accounting policies, which are consistently followed in the preparation of the financial statements of the Fund, are in conformity with U.S. generally accepted accounting principles which require management to make estimates and assumptions that affect the reported amounts of assets and liabilities, disclosure of contingent assets and liabilities at the date of the financial statements, and the reported amounts of revenues and expenses during the reporting period. Actual results could differ from those estimates.
Securities valuation
All investments are valued each business day as of the close of regular trading on the New York Stock Exchange (generally 4 p.m. Eastern Time), although the Fund may deviate from this calculation time under unusual or unexpected circumstances.
Equity securities that are listed on a foreign or domestic exchange or market are valued at the official closing price or, if none, the last sales price. If no sale occurs on the principal exchange or market that day, the prior day’s price will be deemed “stale” and a fair value price will be determined in accordance with the Fund’s Valuation Procedures.
The values of securities denominated in foreign currencies are translated into U.S. dollars at rates provided by an independent foreign currency pricing source at a time each business day specified by the Management Valuation Team of Wells Fargo Funds Management, LLC (“Funds Management”).
Many securities markets and exchanges outside the U.S. close prior to the close of the New York Stock Exchange and therefore may not fully reflect trading or events that occur after the close of the principal exchange in which the foreign securities are traded, but before the close of the New York Stock Exchange. If such trading or events are expected to materially affect the value of such securities, then fair value pricing procedures approved by the Board of Trustees of the Fund are applied. These procedures take into account multiple factors including movements in U.S. securities markets after foreign exchanges close. Foreign securities that are fair valued under these procedures are categorized as Level 2 and the application of these procedures may result in transfers between Level 1 and Level 2. Depending on market activity, such fair valuations may be frequent. Such fair value pricing may result in net asset values that are higher or lower than net asset values based on the last reported sales price or latest quoted bid price. On April 30, 2017, such fair value pricing was not used in pricing foreign securities.
Investments in registered open-end investment companies are valued at net asset value. Interests in non-registered investment companies that are redeemable at net asset value are fair valued normally at net asset value.
Investments which are not valued using any of the method discussed above are valued at their fair value, as determined in good faith by the Board of Trustees. The Board of Trustees has established a Valuation Committee comprised of the Trustees and has delegated to it the authority to take any actions regarding the valuation of portfolio securities that the Valuation Committee deems necessary or appropriate, including determining the fair value of portfolio securities, unless the determination has been delegated to the Management Valuation Team. The Board of Trustees retains the authority to make or ratify any valuation decisions or approve any changes to the Valuation Procedures as it deems appropriate. On a quarterly basis, the Board of Trustees receives reports on any valuation actions taken by the Valuation Committee or the Management Valuation Team which may include items for ratification.
Valuations of fair valued securities are compared to the next actual sales price when available, or other appropriate market values, to assess the continued appropriateness of the fair valuation methodologies used. These securities are fair valued on a day-to-day basis, taking into consideration changes to appropriate market information and any significant changes to the inputs considered in the valuation process until there is a readily available price provided on an exchange or by an independent pricing service. Valuations received from an independent pricing service or independent broker-dealer quotes are periodically validated by comparisons to most recent trades and valuations provided by other independent pricing services in addition to the review of prices by the manager and/or subadviser. Unobservable inputs used in determining fair valuations are identified based on the type of security, taking into consideration factors utilized by market participants in valuing the investment, knowledge about the issuer and the current market environment.
| | | | |
| 20 | | Wells Fargo Asia Pacific Fund | | Notes to financial statements (unaudited) |
Foreign currency translation
The accounting records of the Fund are maintained in U.S. dollars. The values of other assets and liabilities denominated in foreign currencies are translated into U.S. dollars at rates provided by an independent foreign currency pricing source at a time each business day specified by the Management Valuation Team. Purchases and sales of securities, and income and expenses are converted at the rate of exchange on the respective dates of such transactions. Net realized foreign exchange gains or losses arise from sales of foreign currencies, currency gains or losses realized between the trade and settlement dates on securities transactions, and the difference between the amounts of dividends, interest and foreign withholding taxes recorded and the U.S. dollar equivalent of the amounts actually paid or received. Net unrealized foreign exchange gains and losses arise from changes in the fair value of assets and liabilities other than investments in securities resulting from changes in exchange rates. The changes in net assets arising from changes in exchange rates of securities and the changes in net assets resulting from changes in market prices of securities are not separately presented. Such changes are included in net realized and unrealized gains or losses from investments.
Participation notes
The Fund may invest in participation notes to gain exposure to securities in certain foreign markets. Participation notes are issued by banks or broker-dealers and are designed to offer a return linked to a particular underlying foreign security. Participation notes involve transaction costs, which may be higher than those applicable to the underlying foreign security. The holder of the participation note is entitled to receive from the bank or broker-dealer, an amount equal to the dividend paid by the issuer of the underlying foreign security; however, the holder is not entitled to the same rights (i.e. dividends, voting rights) as an owner of the underlying foreign security. Investments in participation notes involve risks beyond those normally associated with a direct investment in an underlying security. The Fund has no rights against the issuer of the underlying foreign security and participation notes expose the Fund to counterparty risk in the event the counterparty does not perform. There is also no assurance there will be a secondary trading market for the participation note or that the trading price of the participation note will equal the underlying value of the foreign security that it seeks to replicate.
Forward foreign currency contracts
The Fund is subject to foreign currency exchange rate risk in the normal course of pursuing its investment objectives. A forward foreign currency contract is an agreement between two parties to purchase or sell a specific currency for an agreed-upon price at a future date. The Fund enters into forward foreign currency contracts to facilitate transactions in foreign-denominated securities and to attempt to minimize the risk to the Fund from adverse changes in the relationship between currencies. Forward foreign currency contracts are recorded at the forward rate and marked-to-market daily. When the contracts are closed, realized gains and losses arising from such transactions are recorded as realized gains or losses on forward foreign currency contract transactions. The Fund could be exposed to risks if the counterparties to the contracts are unable to meet the terms of their contracts or if the value of the foreign currency changes unfavorably. The Fund’s maximum risk of loss from counterparty credit risk is the unrealized gains on the contracts. This risk may be mitigated if there is a master netting arrangement between the Fund and the counterparty.
Security loans
The Fund may lend its securities from time to time in order to earn additional income in the form of fees or interest on securities received as collateral or the investment of any cash received as collateral. The Fund continues to receive interest or dividends on the securities loaned. The Fund receives collateral in the form of cash or securities with a value at least equal to the value of the securities on loan. The value of the loaned securities is determined at the close of each business day and any additional required collateral is delivered to the Fund on the next business day. In a securities lending transaction, the net asset value of the Fund will be affected by an increase or decrease in the value of the securities loaned and by an increase or decrease in the value of the instrument in which collateral is invested. The amount of securities lending activity undertaken by the Fund fluctuates from time to time. In the event of default or bankruptcy by the borrower, the Fund may be prevented from recovering the loaned securities or gaining access to the collateral or may experience delays or costs in doing so. In addition, the investment of any cash collateral received may lose all or part of its value. The Fund has the right under the lending agreement to recover the securities from the borrower on demand.
The Fund lends its securities through an unaffiliated securities lending agent. Cash collateral received in connection with its securities lending transactions is invested in Securities Lending Cash Investments, LLC (the “Securities Lending Fund”). The Securities Lending Fund is exempt from registration under Section 3(c)(7) of the 1940 Act and is managed by Funds Management and is subadvised by Wells Capital Management Incorporated (“WellsCap”), an affiliate of Funds Management and an indirect wholly owned subsidiary of Wells Fargo & Company (“Wells Fargo”). Funds Management receives an advisory fee starting at 0.05% and declining to 0.01% as the average daily net assets of the Securities Lending Fund increase. All of the fees received by Funds Management are paid to WellsCap for its services as subadviser. The
| | | | | | |
| Notes to financial statements (unaudited) | | Wells Fargo Asia Pacific Fund | | | 21 | |
Securities Lending Fund seeks to provide a positive return compared to the daily Fed Funds Open Rate by investing in high-quality, U.S. dollar-denominated short-term money market instruments. Securities Lending Fund investments are valued at the evaluated bid price provided by an independent pricing service. Income earned from investment in the Securities Lending Fund is included in securities lending income on the Statement of Operations.
Security transactions and income recognition
Securities transactions are recorded on a trade date basis. Realized gains or losses are recorded on the basis of identified cost.
Dividend income is recognized on the ex-dividend date, except for certain dividends from foreign securities, which are recorded as soon as the custodian verifies the ex-dividend date. Dividend income from foreign securities is recorded net of foreign taxes withheld where recovery of such taxes is not assured.
Distributions to shareholders
Distributions to shareholders from net investment income and net realized gains, if any, are recorded on the ex-dividend date. Such distributions are determined in accordance with income tax regulations and may differ from U.S. generally accepted accounting principles. Dividend sources are estimated at the time of declaration. The tax character of distributions is determined as of the Fund’s fiscal year end. Therefore, a portion of the Fund’s distributions made prior the Fund’s fiscal year end may be categorized as a tax return of capital.
Federal and other taxes
The Fund intends to continue to qualify as a regulated investment company by distributing substantially all of its investment company taxable income and any net realized capital gains (after reduction for capital loss carryforwards) sufficient to relieve it from all, or substantially all, federal income taxes. Accordingly, no provision for federal income taxes was required.
The Fund’s income and federal excise tax returns and all financial records supporting those returns for the prior three fiscal years are subject to examination by the federal and Delaware revenue authorities. Management has analyzed the Fund’s tax positions taken on federal, state, and foreign tax returns for all open tax years and does not believe that there are any uncertain tax positions that require recognition of a tax liability.
Capital loss carryforwards that do not expire are required to be utilized prior to capital loss carryforwards that expire. As of October 31, 2016, capital loss carryforwards available to offset future net realized capital gains were as follows through the indicated expiration dates:
| | | | |
| | | No expiration |
| 2017 | | Short-term | | Long-term |
| $80,817,204 | | $463,465 | | $3,353,112 |
Class allocations
The separate classes of shares offered by the Fund differ principally in applicable sales charges, distribution, shareholder servicing, and administration fees. Class specific expenses are charged directly to that share class. Investment income, common expenses, and realized and unrealized gains (losses) on investments are allocated daily to each class of shares based on the relative proportion of net assets of each class.
3. FAIR VALUATION MEASUREMENTS
Fair value measurements of investments are determined within a framework that has established a fair value hierarchy based upon the various data inputs utilized in determining the value of the Fund’s investments. The three-level hierarchy gives the highest priority to unadjusted quoted prices in active markets for identical assets or liabilities (Level 1) and the lowest priority to unobservable inputs (Level 3). The Fund’s investments are classified within the fair value hierarchy based on the lowest level of input that is significant to the fair value measurement. The inputs are summarized into three broad levels as follows:
| ∎ | | Level 1 – quoted prices in active markets for identical securities |
| ∎ | | Level 2 – other significant observable inputs (including quoted prices for similar securities, interest rates, prepayment speeds, credit risk, etc.) |
| ∎ | | Level 3 – significant unobservable inputs (including the Fund’s own assumptions in determining the fair value of investments) |
| | | | |
| 22 | | Wells Fargo Asia Pacific Fund | | Notes to financial statements (unaudited) |
The inputs or methodologies used for valuing investments in securities are not necessarily an indication of the risk associated with investing in those securities.
The following is a summary of the inputs used in valuing the Fund’s assets and liabilities as of April 30, 2017:
| | | | | | | | | | | | | | | | |
| | | Quoted prices
(Level 1) | | | Other significant
observable inputs
(Level 2) | | | Significant
unobservable inputs (Level 3) | | | Total | |
Assets | | | | | | | | | | | | | | | | |
Investments in: | | | | | | | | | | | | | | | | |
| | | | |
Common stocks | | | | | | | | | | | | | | | | |
Australia | | $ | 9,192,034 | | | $ | 0 | | | $ | 0 | | | $ | 9,192,034 | |
China | | | 33,977,903 | | | | 0 | | | | 0 | | | | 33,977,903 | |
Hong Kong | | | 1,898,847 | | | | 0 | | | | 0 | | | | 1,898,847 | |
India | | | 9,544,407 | | | | 0 | | | | 0 | | | | 9,544,407 | |
Indonesia | | | 2,866,078 | | | | 0 | | | | 0 | | | | 2,866,078 | |
Japan | | | 48,038,126 | | | | 0 | | | | 0 | | | | 48,038,126 | |
Malaysia | | | 3,425,083 | | | | 0 | | | | 0 | | | | 3,425,083 | |
Philippines | | | 2,192,263 | | | | 0 | | | | 0 | | | | 2,192,263 | |
Singapore | | | 666,513 | | | | 0 | | | | 0 | | | | 666,513 | |
South Korea | | | 8,681,902 | | | | 0 | | | | 0 | | | | 8,681,902 | |
Taiwan | | | 8,335,993 | | | | 0 | | | | 0 | | | | 8,335,993 | |
Thailand | | | 1,499,839 | | | | 0 | | | | 0 | | | | 1,499,839 | |
Vietnam | | | 549,285 | | | | 0 | | | | 0 | | | | 549,285 | |
| | | | |
Participation notes | | | | | | | | | | | | | | | | |
China | | | 0 | | | | 7,497,912 | | | | 0 | | | | 7,497,912 | |
| | | | |
Preferred stocks | | | | | | | | | | | | | | | | |
South Korea | | | 2,324,701 | | | | 0 | | | | 0 | | | | 2,324,701 | |
| | | | |
Short-term investments | | | | | | | | | | | | | | | | |
Investment companies | | | 2,754,710 | | | | 0 | | | | 0 | | | | 2,754,710 | |
Investments measured at net asset value* | | | | | | | | | | | | | | | 270,000 | |
Total assets | | $ | 135,947,684 | | | $ | 7,497,912 | | | $ | 0 | | | $ | 143,715,596 | |
| * | Investments that are measured at fair value using the net asset value per share (or its equivalent) as a practical expedient have not been categorized in the fair value hierarchy. The fair value amount presented in the table is intended to permit reconciliation of the fair value hierarchy to the amounts presented in the Statement of Assets and Liabilities. The Fund’s investment in Securities Lending Cash Investments, LLC valued at $270,000 does not have a redemption period notice, can be redeemed daily and does not have any unfunded commitments. |
The Fund recognizes transfers between levels within the fair value hierarchy at the end of the reporting period. At April 30, 2017, the Fund did not have any transfers into/out of Level 1, Level 2, or Level 3.
4. TRANSACTIONS WITH AFFILIATES AND OTHER EXPENSES
Management fee
Funds Management, an indirect wholly owned subsidiary of Wells Fargo, is the manager of the Fund and provides advisory and fund-level administrative services under an investment management agreement. Under the investment management agreement, Funds Management is responsible for, among other services, implementing the investment objectives and strategies of the Fund, supervising the subadviser, providing fund-level administrative services in connection with the Fund’s operations, and providing any other fund-level administrative services reasonably necessary for the operation of the Fund. As compensation for its services under the investment management agreement, Funds Management is entitled to receive an annual management fee starting at 1.00% and declining to 0.83% as the average daily net assets of the Fund increase. For the six months ended April 30, 2017, the management fee was equivalent to an annual rate of 1.00% of the Fund’s average daily net assets.
Funds Management has retained the services of a subadviser to provide daily portfolio management to the Fund. The fee for subadvisory services is borne by Funds Management. WellsCap is the subadviser to the Fund and is entitled to receive a fee from Funds Management at an annual rate starting at 0.65% and declining to 0.45% as the average daily net assets of the Fund increase.
| | | | | | |
| Notes to financial statements (unaudited) | | Wells Fargo Asia Pacific Fund | | | 23 | |
Administration fees
Under a class-level administration agreement, Funds Management provides class-level administrative services to the Fund, which includes paying fees and expenses for services provided by the transfer agent, sub-transfer agents, omnibus account servicers and record-keepers. As compensation for its services under the class-level administration agreement, Funds Management receives an annual fee which is calculated based on the average daily net assets of each class as follows:
| | | | |
| | | Class-level
administration fee | |
Class A, Class C | | | 0.21 | % |
Administrator Class, Institutional Class | | | 0.13 | |
Funds Management has contractually waived and/or reimbursed management and administration fees to the extent necessary to maintain certain net operating expense ratios for the Fund. Waiver of fees and/or reimbursement of expenses by Funds Management were made first from fund level expenses on a proportionate basis and then from class specific expenses. Funds Management has committed through February 28, 2018 to waive fees and/or reimburse expenses to the extent necessary to cap the Fund’s expenses at 1.60% for Class A shares, 2.35% for Class C shares, 1.50% for Administrator Class shares, and 1.25% for Institutional Class shares. After this time, the cap may be increased or the commitment to maintain the cap may be terminated only with the approval of the Board of Trustees.
During the six months ended April 30, 2017, State Street Bank and Trust Company, the Fund’s custodian, reimbursed the Fund $162 for certain out-of-pocket expenses that were billed to the Fund in error from 1998-2015. This amount is included in dividend income on the Statement of Operations. In addition, Funds Management was also reimbursed $14,925 for waivers/reimbursements it made to the Fund during the period the Fund was erroneously billed.
Distribution fee
The Trust has adopted a distribution plan for Class C shares of the Fund pursuant to Rule 12b-1 under the 1940 Act. A distribution fee is charged to Class C shares and paid to Wells Fargo Funds Distributor, LLC (“Funds Distributor”), the principal underwriter, at an annual rate of 0.75% of the average daily net assets of Class C shares.
In addition, Funds Distributor is entitled to receive the front-end sales charge from the purchase of Class A shares and a contingent deferred sales charge on the redemption of certain Class A shares. Funds Distributor is also entitled to receive the contingent deferred sales charges from redemptions of Class C shares. For the six months ended April 30, 2017, Funds Distributor received $26 from the sale of Class A shares and $12 in contingent deferred sales charges from redemptions of Class C shares.
Shareholder servicing fees
The Trust has entered into contracts with one or more shareholder servicing agents, whereby Class A, Class C, and Administrator Class of the Fund are charged a fee at an annual rate of 0.25% of the average daily net assets of each respective class.
A portion of these total shareholder servicing fees were paid to affiliates of Wells Fargo.
5. INVESTMENT PORTFOLIO TRANSACTIONS
Purchases and sales of investments, excluding U.S. government obligations (if any) and short-term securities, for the six months ended April 30, 2017 were $78,299,405 and $87,932,660, respectively.
The Fund may purchase or sell investment securities to other Wells Fargo affiliates pursuant to Rule 17a-7 of the 1940 Act and under procedures adopted by the Board of Trustees. The procedures have been designed to ensure that these interfund transactions, which do not incur broker commissions, are effected at current market prices. Interfund trades are included within the respective purchases and sales amounts shown.
6. BANK BORROWINGS
The Trust (excluding the money market funds and certain other funds) and Wells Fargo Variable Trust are parties to a $250,000,000 revolving credit agreement whereby the Fund is permitted to use bank borrowings for temporary or emergency purposes, such as to fund shareholder redemption requests. Interest under the credit agreement is charged to the Fund based on a borrowing rate equal to the higher of the Federal Funds rate in effect on that day plus 1.25% or the overnight LIBOR rate in effect on that day plus 1.25%. In addition, an annual commitment fee equal to 0.25% of the unused balance is allocated to each participating fund.
For the six months ended April 30, 2017, there were no borrowings by the Fund under the agreement.
| | | | |
| 24 | | Wells Fargo Asia Pacific Fund | | Notes to financial statements (unaudited) |
7. CONCENTRATION RISK
Concentration risks result from exposure to a limited number of geographic regions. A fund that invest a substantial portion of their assets in any geographic region may be more affected by changes in that geographic region than would be a fund whose investments are not heavily weighted in any geographic region.
8. INDEMNIFICATION
Under the Trust’s organizational documents, the officers and Trustees have been granted certain indemnification rights against certain liabilities that may arise out of performance of their duties to the Trust. Additionally, in the normal course of business, the Trust may enter into contracts with service providers that contain a variety of indemnification clauses. The Trust’s maximum exposure under these arrangements is dependent on future claims that may be made against the Fund and, therefore, cannot be estimated.
9. NEW ACCOUNTING PRONOUNCEMENT
In December 2016, FASB issued Accounting Standards Update (“ASU”) No. 2016-19, Technical Corrections and Improvements. ASU 2016-19 includes an amendment to FASB ASC Topic 820, Fair Value Measurement which clarifies the difference between a valuation approach and a valuation technique. The amendment also requires an entity to disclose when there has been a change in either or both a valuation approach and/or a valuation technique. The disclosure requirements are effective for fiscal years and interim periods within those fiscal years beginning after December 15, 2016. Management is currently evaluating the potential impact of this new guidance to the financial statements.
10. REGULATORY CHANGES
In October 2016, the Securities and Exchange Commission (“SEC”) adopted new rules and forms and amended existing rules and forms (together, “final rules”) intended to modernize and enhance the reporting and disclosure of information by registered investment companies and to enhance liquidity risk management by open-end mutual funds and exchange-traded funds. The final rules will enhance the quality of information available to investors and will allow the SEC to more effectively collect and use data reported by funds. In part, the final rules amend Regulation S-X and require standardized, enhanced disclosure about derivatives in the Fund’s financial statements, as well as other amendments. The compliance date for the amendments to Regulation S-X is August 1, 2017 while the compliance date for the new form types is June 1, 2018 and the compliance date for the liquidity risk management program requirements is December 1, 2018. Management is currently assessing the potential impact of these enhancements and their impact on the financial statement disclosures and reporting requirements.
| | | | | | |
| Other information (unaudited) | | Wells Fargo Asia Pacific Fund | | | 25 | |
TAX INFORMATION
Pursuant to Section 853 of the Internal Revenue Code, the following amounts were designated as foreign taxes paid for the fiscal year ended October 31, 2016. These amounts may be less than the actual foreign taxes paid for financial statement purposes. Foreign taxes paid or withheld should be included in taxable income with an offsetting deduction from gross income or as a credit for taxes paid to foreign governments. None of the income was derived from ineligible foreign sources as defined under Section 901(j) of the Internal Revenue Code.
| | | | |
Creditable foreign taxes paid | | Per share amount | | Foreign
income as % of
ordinary income
distributions |
| $402,150 | | $0.0337 | | 91.17% |
PROXY VOTING INFORMATION
A description of the policies and procedures that the Fund uses to determine how to vote proxies relating to portfolio securities is available, upon request, by calling 1-800-222-8222, visiting our website at wellsfargofunds.com, or visiting the SEC website at sec.gov. Information regarding how the Fund voted proxies relating to portfolio securities during the most recent 12-month period ended June 30 is available on the Fund’s website at wellsfargofunds.com or by visiting the SEC website at sec.gov.
PORTFOLIO HOLDINGS INFORMATION
The complete portfolio holdings for the Fund are publicly available monthly on the Fund’s website (wellsfargofunds.com), on a one-month delayed basis. In addition, top ten holdings information (excluding derivative positions) for the Fund is publicly available on the Fund’s website on a monthly, seven-day or more delayed basis. The Fund files its complete schedule of portfolio holdings with the SEC for the first and third quarters of each fiscal year on Form N-Q, which is available by visiting the SEC website at sec.gov. In addition, the Fund’s Form N-Q may be reviewed and copied at the SEC’s Public Reference Room in Washington, DC, and at regional offices in New York City, at 233 Broadway, and in Chicago, at 175 West Jackson Boulevard, Suite 900. Information about the Public Reference Room may be obtained by calling 1-800-SEC-0330.
| | | | |
| 26 | | Wells Fargo Asia Pacific Fund | | Other information (unaudited) |
BOARD OF TRUSTEES AND OFFICERS
Each of the Trustees and Officers1 listed in the table below acts in identical capacities for each fund in the Wells Fargo family of funds, which consists of 138 mutual funds comprising the Wells Fargo Funds Trust, Wells Fargo Variable Trust, Wells Fargo Master Trust and four closed-end funds (collectively the “Fund Complex”). This table should be read in conjunction with the Prospectus and the Statement of Additional Information2. The mailing address of each Trustee and Officer is 525 Market Street, 12th Floor, San Francisco, CA 94105. Each Trustee and Officer serves an indefinite term, however, each Trustee serves such term until reaching the mandatory retirement age established by the Trustees.
Independent Trustees
| | | | | | |
Name and year of birth | | Position held and length of service* | | Principal occupations during past five years or longer | | Current other public company or
investment company
directorships |
William R. Ebsworth (Born 1957) | | Trustee, since 2015 | | Retired. From 1984 to 2013, equities analyst, portfolio manager, research director and chief investment officer at Fidelity Management and Research Company in Boston, Tokyo, and Hong Kong and retired in 2013 as Chief Investment Officer of Fidelity Strategic Advisers, Inc. where he led a team of investment professionals managing client assets. Prior thereto, Board member of Hong Kong Securities Clearing Co., Hong Kong Options Clearing Corp., the Thailand International Fund, Ltd., Fidelity Investments Life Insurance Company, and Empire Fidelity Investments Life Insurance Company. Board member of the Forté Foundation (non-profit organization) and the Vincent Memorial Hospital Endowment (non-profit organization), where he serves on the Investment Committee and as a Chair of the Audit Committee. Mr. Ebsworth is a CFA® charterholder. | | Asset Allocation Trust |
Jane A. Freeman (Born 1953) | | Trustee, since 2015 | | Retired. From 2012 to 2014 and 1999 to 2008, Chief Financial Officer of Scientific Learning Corporation. From 2008 to 2012, Ms. Freeman provided consulting services related to strategic business projects. Prior to 1999, Portfolio Manager at Rockefeller & Co. and Scudder, Stevens & Clark. Board member of the Harding Loevner Funds from 1996 to 2014, serving as both Lead Independent Director and chair of the Audit Committee. Board member of the Russell Exchange Traded Funds Trust from 2011 to 2012 and the chair of the Audit Committee. Ms. Freeman is a Board Member of Ruth Bancroft Garden (non-profit organization) and an inactive chartered financial analyst. | | Asset Allocation Trust |
Peter G. Gordon** (Born 1942) | | Trustee, since 1998; Chairman, since 2005 | | Co-Founder, Retired Chairman, President and CEO of Crystal Geyser Water Company. Trustee Emeritus, Colby College. | | Asset Allocation Trust |
Isaiah Harris, Jr. (Born 1952) | | Trustee, since 2009 | | Retired. Chairman of the Board of CIGNA Corporation since 2009, and Director since 2005. From 2003 to 2011, Director of Deluxe Corporation. Prior thereto, President and CEO of BellSouth Advertising and Publishing Corp. from 2005 to 2007, President and CEO of BellSouth Enterprises from 2004 to 2005 and President of BellSouth Consumer Services from 2000 to 2003. Emeritus member of the Iowa State University Foundation Board of Governors. Emeritus Member of the Advisory Board of Iowa State University School of Business. Advisory Board Member, Palm Harbor Academy (charter school). Advisory Board Member, Child Evangelism Fellowship (non-profit). Mr. Harris is a certified public accountant (inactive status). | | CIGNA Corporation; Asset Allocation Trust |
Judith M. Johnson (Born 1949) | | Trustee, since 2008; Audit Committee Chairman, since 2008 | | Retired. Prior thereto, Chief Executive Officer and Chief Investment Officer of Minneapolis Employees Retirement Fund from 1996 to 2008. Ms. Johnson is an attorney, certified public accountant and a certified managerial accountant. | | Asset Allocation Trust |
David F. Larcker (Born 1950) | | Trustee, since 2009 | | James Irvin Miller Professor of Accounting at the Graduate School of Business, Stanford University, Director of the Corporate Governance Research Initiative and Senior Faculty of The Rock Center for Corporate Governance since 2006. From 2005 to 2008, Professor of Accounting at the Graduate School of Business, Stanford University. Prior thereto, Ernst & Young Professor of Accounting at The Wharton School, University of Pennsylvania from 1985 to 2005. | | Asset Allocation Trust |
| | | | | | |
| Other information (unaudited) | | Wells Fargo Asia Pacific Fund | | | 27 | |
| | | | | | |
Name and year of birth | | Position held and length of service* | | Principal occupations during past five years or longer | | Current other public company or
investment company
directorships |
Olivia S. Mitchell (Born 1953) | | Trustee, since 2006 | | International Foundation of Employee Benefit Plans Professor, Wharton School of the University of Pennsylvania since 1993. Director of Wharton’s Pension Research Council and Boettner Center on Pensions & Retirement Research, and Research Associate at the National Bureau of Economic Research. Previously, Cornell University Professor from 1978 to 1993. | | Asset Allocation Trust |
Timothy J. Penny (Born 1951) | | Trustee, since 1996; Vice Chairman, since 2017 | | President and Chief Executive Officer of Southern Minnesota Initiative Foundation, a non-profit organization, since 2007 and Senior Fellow at the Humphrey Institute Policy Forum at the University of Minnesota since 1995. Member of the Board of Trustees of NorthStar Education Finance, Inc., a non-profit organization, since 2007. | | Asset Allocation Trust |
Michael S. Scofield (Born 1943) | | Trustee, since 2010 | | Served on the Investment Company Institute’s Board of Governors and Executive Committee from 2008-2011 as well the Governing Council of the Independent Directors Council from 2006-2011 and the Independent Directors Council Executive Committee from 2008-2011. Chairman of the IDC from 2008-2010. Institutional Investor (Fund Directions) Trustee of Year in 2007. Trustee of the Evergreen Funds complex (and its predecessors) from 1984 to 2010. Chairman of the Evergreen Funds from 2000-2010. Former Trustee of the Mentor Funds. Retired Attorney, Law Offices of Michael S. Scofield. | | Asset Allocation Trust |
| * | Length of service dates reflect the Trustee’s commencement of service with the Trust’s predecessor entities, where applicable. |
| ** | Peter Gordon is expected to retire on December 31, 2017. |
Officers
| | | | | | |
Name and year of birth | | Position held and length of service | | Principal occupations during past five years or longer | | |
Andrew Owen (Born 1960) | | President, since 2017 | | Executive Vice President of Wells Fargo & Company and Head of Affiliated Managers, Wells Fargo Asset Management, since 2014. In addition, Mr. Owen is currently President, Chief Executive Officer and Director of Wells Fargo Funds Management, LLC since 2017. Prior thereto, Executive Vice President responsible for marketing, investments and product development for Wells Fargo Funds Management, LLC, from 2009 to 2014. | | |
Jeremy DePalma1 (Born 1974) | | Treasurer, since 2012 | | Senior Vice President of Wells Fargo Funds Management, LLC since 2009. Senior Vice President of Evergreen Investment Management Company, LLC from 2008 to 2010 and head of the Fund Reporting and Control Team within Fund Administration from 2005 to 2010. | | |
C. David Messman (Born 1960) | | Secretary, since 2000; Chief Legal Officer, since 2003 | | Senior Vice President and Secretary of Wells Fargo Funds Management, LLC since 2001. Assistant General Counsel of Wells Fargo Bank, N.A. since 2013 and Vice President and Managing Counsel of Wells Fargo Bank, N.A. from 1996 to 2013. | | |
Michael Whitaker (Born 1967) | | Chief Compliance Officer, since 2016 | | Senior Vice President and Chief Compliance Officer since 2016. Senior Vice President and Chief Compliance Officer for Fidelity Investments from 2007 to 2016. | | |
David Berardi (Born 1975) | | Assistant Treasurer, since 2009 | | Vice President of Wells Fargo Funds Management, LLC since 2009. Vice President of Evergreen Investment Management Company, LLC from 2008 to 2010. Manager of Fund Reporting and Control for Evergreen Investment Management Company, LLC from 2004 to 2010. | | |
| 1 | Jeremy DePalma acts as Treasurer of 69 funds and Assistant Treasurer of 69 funds in the Fund Complex. |
| 2 | The Statement of Additional Information includes additional information about the Trustees and is available, without charge, upon request, by calling 1-800-222-8222 or by visiting the website at wellsfargofunds.com. |
| | | | |
| 28 | | Wells Fargo Asia Pacific Fund | | List of abbreviations |
The following is a list of common abbreviations for terms and entities that may have appeared in this report.
| ACA | — ACA Financial Guaranty Corporation |
| ADR | — American depositary receipt |
| ADS | — American depositary shares |
| AGC | — Assured Guaranty Corporation |
| AGM | — Assured Guaranty Municipal |
| Ambac | — Ambac Financial Group Incorporated |
| AMT | — Alternative minimum tax |
| BAN | — Bond anticipation notes |
| BHAC | — Berkshire Hathaway Assurance Corporation |
| CAB | — Capital appreciation bond |
| CCAB | — Convertible capital appreciation bond |
| CDA | — Community Development Authority |
| CDO | — Collateralized debt obligation |
| DRIVER | — Derivative inverse tax-exempt receipts |
| DW&P | — Department of Water & Power |
| DWR | — Department of Water Resources |
| ECFA | — Educational & Cultural Facilities Authority |
| EDA | — Economic Development Authority |
| EDFA | — Economic Development Finance Authority |
| ETF | — Exchange-traded fund |
| FDIC | — Federal Deposit Insurance Corporation |
| FFCB | — Federal Farm Credit Banks |
| FGIC | — Financial Guaranty Insurance Corporation |
| FHA | — Federal Housing Administration |
| FHLB | — Federal Home Loan Bank |
| FHLMC | — Federal Home Loan Mortgage Corporation |
| FICO | — The Financing Corporation |
| FNMA | — Federal National Mortgage Association |
| GDR | — Global depositary receipt |
| GNMA | — Government National Mortgage Association |
| HCFR | — Healthcare facilities revenue |
| HEFA | — Health & Educational Facilities Authority |
| HEFAR | — Higher education facilities authority revenue |
| HFA | — Housing Finance Authority |
| HFFA | — Health Facilities Financing Authority |
| HUD | — Department of Housing and Urban Development |
| IDA | — Industrial Development Authority |
| IDAG | — Industrial Development Agency |
| KRW | — Republic of Korea won |
| LIBOR | — London Interbank Offered Rate |
| LIFER | — Long Inverse Floating Exempt Receipts |
| LLC | — Limited liability company |
| LLLP | — Limited liability limited partnership |
| LLP | — Limited liability partnership |
| MBIA | — Municipal Bond Insurance Association |
| MFHR | — Multifamily housing revenue |
| MSTR | — Municipal securities trust receipts |
| MUD | — Municipal Utility District |
| National | — National Public Finance Guarantee Corporation |
| PCFA | — Pollution Control Financing Authority |
| PCL | — Public Company Limited |
| PCR | — Pollution control revenue |
| PFA | — Public Finance Authority |
| PFFA | — Public Facilities Financing Authority |
| PFOTER | — Puttable floating option tax-exempt receipts |
| plc | — Public limited company |
| PUTTER | — Puttable tax-exempt receipts |
| R&D | — Research & development |
| Radian | — Radian Asset Assurance |
| RAN | — Revenue anticipation notes |
| RDA | — Redevelopment Authority |
| RDFA | — Redevelopment Finance Authority |
| REIT | — Real estate investment trust |
| ROC | — Reset option certificates |
| SAVRS | — Select auction variable rate securities |
| SBA | — Small Business Authority |
| SDR | — Swedish depositary receipt |
| SFHR | — Single-family housing revenue |
| SFMR | — Single-family mortgage revenue |
| SPA | — Standby purchase agreement |
| SPDR | — Standard & Poor’s Depositary Receipts |
| SPEAR | — Short Puttable Exempt Adjustable Receipts |
| STRIPS | — Separate trading of registered interest and |
| TAN | — Tax anticipation notes |
| TIPS | — Treasury inflation-protected securities |
| TRAN | — Tax revenue anticipation notes |
| TTFA | — Transportation Trust Fund Authority |
| TVA | — Tennessee Valley Authority |

For more information
More information about Wells Fargo Funds is available free upon request. To obtain literature, please write, email, visit the Fund’s website, or call:
Wells Fargo Funds
P.O. Box 8266
Boston, MA 02266-8266
Email: fundservice@wellsfargo.com
Website: wellsfargofunds.com
Individual investors: 1-800-222-8222
Retail investment professionals: 1-888-877-9275
Institutional investment professionals: 1-866-765-0778
This report and the financial statements contained herein are submitted for the general information of the shareholders of the Fund. If this report is used for promotional purposes, distribution of the report must be accompanied or preceded by a current prospectus. Before investing, please consider the investment objectives, risks, charges, and expenses of the investment. For a current prospectus and, if available, a summary prospectus, containing this information, call 1-800-222-8222 or visit the Fund’s website at wellsfargofunds.com. Read the prospectus carefully before you invest or send money.
Wells Fargo Asset Management (WFAM) is a trade name used by the asset management businesses of Wells Fargo & Company. Wells Fargo Funds Management, LLC, a wholly owned subsidiary of Wells Fargo & Company, provides investment advisory and administrative services for Wells Fargo Funds. Other affiliates of Wells Fargo & Company provide subadvisory and other services for the funds. The funds are distributed by Wells Fargo Funds Distributor, LLC, Member FINRA, an affiliate of Wells Fargo & Company. Neither Wells Fargo Funds Management nor Wells Fargo Funds Distributor has Fund customer accounts/assets, and neither provides investment advice/recommendations or acts as an investment advice fiduciary to any investor.
NOT FDIC INSURED ◾ NO BANK GUARANTEE ◾ MAY LOSE VALUE
© 2017 Wells Fargo Funds Management, LLC. All rights reserved.
| | |
 | | 303212 06-17 SA236/SAR236 04-17 |
Semi-Annual Report
April 30, 2017

Wells Fargo Diversified International Fund


Reduce clutter. Save trees.
Sign up for electronic delivery of prospectuses and shareholder reports at wellsfargo.com/advantagedelivery
Contents
The views expressed and any forward-looking statements are as of April 30, 2017, unless otherwise noted, and are those of the Fund managers and/or Wells Fargo Funds Management, LLC. Discussions of individual securities, or the markets generally, or any Wells Fargo Fund are not intended as individual recommendations. Future events or results may vary significantly from those expressed in any forward-looking statements. The views expressed are subject to change at any time in response to changing circumstances in the market. Wells Fargo Funds Management, LLC and the Fund disclaim any obligation to publicly update or revise any views expressed or forward-looking statements.
NOT FDIC INSURED ◾ NO BANK GUARANTEE ◾ MAY LOSE VALUE
| | | | |
| 2 | | Wells Fargo Diversified International Fund | | Letter to shareholders (unaudited) |

Andrew Owen
President
Wells Fargo Funds
Despite heightened market volatility at times, in general, global stocks delivered double-digit returns while bond markets were hurt by a rise in interest rates during the latter part of 2016.
Dear Shareholder:
As the new president of Wells Fargo Funds, now that Karla Rabusch is retiring from that position after nearly 14 years, I am pleased to offer you this semi-annual report for the Wells Fargo Diversified International Fund for the six-month period that ended April 30, 2017. Despite heightened market volatility at times, in general, global stocks delivered double-digit returns while bond markets were hurt by a rise in interest rates during the latter part of 2016. U.S. and international stocks returned 13.31% and 10.37% for the six-month period, respectively, as measured by the S&P 500 Index1 and the MSCI ACWI ex USA Index (Net)2; within fixed income, the Bloomberg Barclays U.S. Aggregate Bond Index3 returned -0.67%.
During the last two months of 2016, prospects for faster growth and higher interest rates in the U.S. influenced markets.
Following Donald Trump’s election as president in early November, U.S. stocks began to rally. Investors appeared optimistic that the new administration would usher in a series of progrowth policies, and supportive economic news helped the rally carry through the end of 2016. The buoyant environment sent interest rates higher as well. At its mid-December meeting, Fed officials raised their short-term target interest rate for the first time in a year by a quarter percentage point to between 0.50% and 0.75%. Outside of the U.S., the prospects for faster U.S. growth appeared to trigger some acceleration in Europe. The improvement may be partly attributable to expectations for further strengthening of the U.S. dollar, which in turn could improve demand for European goods in the U.S. due to weakening of the euro relative to the dollar. Rising inflation across the eurozone and Japan caused an upward shift in yield curves in those areas, although developed-country bond yields remained significantly lower than U.S. Treasury yields.
Globally, stocks delivered positive results and economies showed improvement in the first four months of 2017.
Stocks rallied globally, supported by signs of improvement in the U.S. and global economies. In the U.S., hiring remained strong and business and consumer sentiment improved. Meanwhile, inflation inched up. In March, Fed officials raised their short-term target interest rate by a quarter percentage point to between 0.75% and 1.00%. With the Fed’s target-rate increase, short-term bond yields rose. Longer-term Treasury yields were little changed, however, leading to positive performance. Investment-grade corporate bonds and high-yield bonds benefited from strong demand. Municipal bond returns were also positive during the first four months of 2017, helped by strong demand and constrained new-issue supply. Outside the U.S., stocks in emerging markets benefited from both global economic growth and recent weakening in the U.S. dollar. European stocks also advanced as political risk declined. In the first round of the French presidential elections, Emmanuel Macron, a pro-EU candidate, garnered the most votes. Non-U.S. bonds also benefited from a decline in perceived risk, with credit spreads continuing to narrow.
| 1 | The S&P 500 Index consists of 500 stocks chosen for market size, liquidity, and industry group representation. It is a market-value-weighted index with each stock’s weight in the index proportionate to its market value. You cannot invest directly in an index. |
| 2 | The Morgan Stanley Capital International (MSCI) All Country World Index (ACWI) ex USA Index (Net) is a free-float-adjusted market-capitalization-weighted index that is designed to measure the equity market performance of developed markets, excluding the United States and Canada. Source: MSCI. MSCI makes no express or implied warranties or representations and shall have no liability whatsoever with respect to any MSCI data contained herein. The MSCI data may not be further redistributed or used as a basis for other indexes or any securities or financial products. This report is not approved, reviewed, or produced by MSCI. You cannot invest directly in an index. |
| 3 | The Bloomberg Barclays U.S. Aggregate Bond Index (formerly known as Barclays U.S. Aggregate Bond Index) is a broad-based benchmark that measures the investment-grade, U.S. dollar–denominated, fixed-rate taxable bond market, including Treasuries, government-related and corporate securities, mortgage-backed securities (agency fixed-rate and hybrid adjustable-rate mortgage pass-throughs), asset-backed securities, and commercial mortgage-backed securities. You cannot invest directly in an index. |
| | | | | | |
| Letter to shareholders (unaudited) | | Wells Fargo Diversified International Fund | | | 3 | |
Don’t let short-term uncertainty derail long-term investment goals.
Periods of uncertainty can present challenges, but experience has taught us that maintaining long-term investment goals can be an effective way to plan for the future. To help you create a sound strategy based on your personal goals and risk tolerance, Wells Fargo Funds offers more than 100 mutual funds spanning a wide range of asset classes and investment styles. Although diversification cannot guarantee an investment profit or prevent losses, we believe it can be an effective way to manage investment risk and potentially smooth out overall portfolio performance. We encourage investors to know their investments and to understand that appropriate levels of risk-taking may unlock opportunities.
Thank you for choosing to invest in Wells Fargo Funds. We appreciate your confidence in us and remain committed to helping you meet your financial needs.
Sincerely,

Andrew Owen
President
Wells Fargo Funds
Although diversification cannot guarantee an investment profit or prevent losses, we believe it can be an effective way to manage investment risk and potentially smooth out overall portfolio performance.
For further information about your Fund, contact your investment professional, visit our website at wellsfargofunds.com, or call us directly at 1-800-222-8222. We are available 24 hours a day, 7 days a week.
| | | | |
| 4 | | Wells Fargo Diversified International Fund | | Performance highlights (unaudited) |
Investment objective
The Fund seeks long-term capital appreciation.
Manager
Wells Fargo Funds Management, LLC
Subadvisers
Artisan Partners Limited Partnership
LSV Asset Management
Wells Capital Management Incorporated
Portfolio managers
Josef Lakonishok, Ph.D.
Venkateshwar Lal*
Puneet Mansharamani, CFA®
Menno Vermeulen, CFA®
Dale A. Winner, CFA®
Mark L. Yockey, CFA®
Average annual total returns (%) as of April 30, 20171
| | | | | | | | | | | | | | | | | | | | | | | | | | | | | | | | | | |
| | | | | Including sales charge | | | Excluding sales charge | | | Expense ratios2 (%) | |
| | | Inception date | | 1 year | | | 5 year | | | 10 year | | | 1 year | | | 5 year | | | 10 year | | | Gross | | | Net3 | |
| Class A (SILAX) | | 9-24-1997 | | | 4.88 | | | | 4.94 | | | | (0.17 | ) | | | 11.24 | | | | 6.19 | | | | 0.42 | | | | 1.75 | | | | 1.36 | |
| Class C (WFECX) | | 4-1-1998 | | | 9.43 | | | | 5.40 | | | | (0.31 | ) | | | 10.43 | | | | 5.40 | | | | (0.31 | ) | | | 2.50 | | | | 2.11 | |
| Class R (WDIHX) | | 9-30-2015 | | | – | | | | – | | | | – | | | | 11.06 | | | | 5.97 | | | | 0.24 | | | | 2.00 | | | | 1.61 | |
| Class R6 (WDIRX) | | 9-30-2015 | | | – | | | | – | | | | – | | | | 11.83 | | | | 6.46 | | | | 0.66 | | | | 1.32 | | | | 0.90 | |
| Administrator Class (WFIEX) | | 11-8-1999 | | | – | | | | – | | | | – | | | | 11.36 | | | | 6.34 | | | | 0.60 | | | | 1.67 | | | | 1.26 | |
| Institutional Class (WFISX) | | 8-31-2006 | | | – | | | | – | | | | – | | | | 11.60 | | | | 6.52 | | | | 0.80 | | | | 1.42 | | | | 1.00 | |
| MSCI EAFE Index (Net)4 | | – | | | – | | | | – | | | | – | | | | 11.29 | | | | 6.78 | | | | 0.87 | | | | – | | | | – | |
Figures quoted represent past performance, which is no guarantee of future results, and do not reflect taxes that a shareholder may pay on fund distributions or the redemption of fund shares. Investment return and principal value of an investment will fluctuate so that an investor’s shares, when redeemed, may be worth more or less than their original cost. Performance shown without sales charges would be lower if sales charges were reflected. Current performance may be lower or higher than the performance data quoted, which assumes the reinvestment of dividends and capital gains. Current month-end performance is available on the Fund’s website, wellsfargofunds.com.
Index returns do not include transaction costs associated with buying and selling securities, any mutual fund fees or expenses, or any taxes. It is not possible to invest directly in an index.
For Class A shares, the maximum front-end sales charge is 5.75%. For Class C shares, the maximum contingent deferred sales charge is 1.00%. Performance including a contingent deferred sales charge assumes the sales charge for the corresponding time period. Class R, Class R6, Administrator Class, and Institutional Class shares are sold without a front-end sales charge or contingent deferred sales charge.
Stock values fluctuate in response to the activities of individual companies and general market and economic conditions. Foreign investments are especially volatile and can rise or fall dramatically due to differences in the political and economic conditions of the host country. These risks are generally intensified in emerging markets. The use of derivatives may reduce returns and/or increase volatility. Certain investment strategies tend to increase the total risk of an investment (relative to the broader market). The Fund is exposed to smaller-company securities risk. Consult the Fund’s prospectus for additional information on these and other risks.
Please see footnotes on page 5.
| | | | | | |
| Performance highlights (unaudited) | | Wells Fargo Diversified International Fund | | | 5 | |
| | | | |
| Ten largest holdings (%) as of April 30, 20175 | |
Allianz AG | | | 1.60 | |
Deutsche Boerse AG | | | 1.40 | |
Nomura Holdings Incorporated | | | 1.39 | |
ING Groep NV | | | 1.39 | |
Linde AG | | | 1.37 | |
Bayer AG | | | 1.29 | |
Zurich Insurance Group AG | | | 1.26 | |
DNB ASA | | | 1.22 | |
Metro AG | | | 1.22 | |
SK Telecom Company Limited | | | 1.21 | |
|
| Sector distribution as of April 30, 20176 |
|
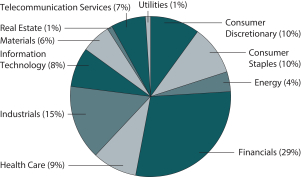 |
|
| Country allocation as of April 30, 20176 |
|
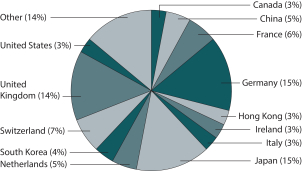
|
| * | Mr. Lal became a portfolio manager of the Fund on June 30, 2017. |
| 1 | Historical performance shown for the Class R shares prior to their inception reflects the performance of the Administrator Class shares, adjusted to reflect the higher expenses applicable to Class R shares. Historical performance shown for the Class R6 shares prior to their inception reflects the performance of the Administrator Class shares, and includes the higher expenses applicable to Administrator Class shares. If these expenses had not been included, returns for Class R6 shares would be higher. |
| 2 | Reflects the expense ratios as stated in the most recent prospectuses, which include the impact of 0.01% in acquired fund fees and expenses. The expense ratios shown are subject to change and may differ from the annualized expense ratios shown in the financial highlights of this report, which do not include acquired fund fees and expenses. |
| 3 | The manager has contractually committed through February 28, 2018, to waive fees and/or reimburse expenses to the extent necessary to cap the Fund’s Total Annual Fund Operating Expenses After Fee Waivers at 1.35% for Class A, 2.10% for Class C, 1.60% for Class R, 0.89% for Class R6, 1.25% for Administrator Class, and 0.99% for Institutional Class. After this time, the cap may be increased or the commitment to maintain the cap may be terminated only with the approval of the Board of Trustees. Brokerage commissions, stamp duty fees, interest, taxes, acquired fund fees and expenses, and extraordinary expenses are excluded from the expense cap. Without this cap, the Fund’s returns would have been lower. The expense ratio paid by an investor is the net expense ratio or the Fund’s Total Annual Fund Operating Expenses After Fee Waivers, as stated in the prospectuses. |
| 4 | The Morgan Stanley Capital International (MSCI) Europe, Australasia, and Far East (EAFE) Index (Net) is a free-float-adjusted market-capitalization-weighted index that is designed to measure the equity market performance of developed markets, excluding the United States and Canada. The MSCI EAFE Index (Net) consists of the following 21 developed markets country indexes: Australia, Austria, Belgium, Denmark, Finland, France, Germany, Hong Kong, Ireland, Israel, Italy, Japan, the Netherlands, New Zealand, Norway, Portugal, Singapore, Spain, Sweden, Switzerland, and the United Kingdom. Source: MSCI. MSCI makes no express or implied warranties or representations and shall have no liability whatsoever with respect to any MSCI data contained herein. The MSCI data may not be further redistributed or used as a basis for other indexes or any securities or financial products. This report is not approved, reviewed, or produced by MSCI. You cannot invest directly in an index. |
| 5 | The ten largest holdings, excluding cash and cash equivalents, are calculated based on the value of the investments divided by total net assets of the Fund. Holdings are subject to change and may have changed since the date specified. |
| 6 | Amounts are calculated based on the total long-term investments of the Fund. These amounts are subject to change and may have changed since the date specified. |
| | | | |
| 6 | | Wells Fargo Diversified International Fund | | Fund expenses (unaudited) |
As a shareholder of the Fund, you incur two types of costs: (1) transaction costs, including sales charges (loads) on purchase payments and contingent deferred sales charges (if any) on redemptions and (2) ongoing costs, including management fees, distribution (12b-1) and/or shareholder servicing fees, and other Fund expenses. This example is intended to help you understand your ongoing costs (in dollars) of investing in the Fund and to compare these costs with the ongoing costs of investing in other mutual funds.
The example is based on an investment of $1,000 invested at the beginning of the six-month period and held for the entire period from November 1, 2016 to April 30, 2017.
Actual expenses
The “Actual” line of the table below provides information about actual account values and actual expenses. You may use the information in this line, together with the amount you invested, to estimate the expenses that you paid over the period. Simply divide your account value by $1,000 (for example, an $8,600 account value divided by $1,000 = 8.6), then multiply the result by the number in the “Actual” line under the heading entitled “Expenses paid during period” for your applicable class of shares to estimate the expenses you paid on your account during this period.
Hypothetical example for comparison purposes
The “Hypothetical” line of the table below provides information about hypothetical account values and hypothetical expenses based on the Fund’s actual expense ratio and an assumed rate of return of 5% per year before expenses, which is not the Fund’s actual return. The hypothetical account values and expenses may not be used to estimate the actual ending account balance or expenses you paid for the period. You may use this information to compare the ongoing costs of investing in the Fund and other funds. To do so, compare this 5% hypothetical example with the 5% hypothetical examples that appear in the shareholder reports of the other funds.
Please note that the expenses shown in the table are meant to highlight your ongoing costs only and do not reflect any transactional costs, such as sales charges (loads) and contingent deferred sales charges. Therefore, the “Hypothetical” line of the table is useful in comparing ongoing costs only and will not help you determine the relative total costs of owning different funds. In addition, if these transactional costs were included, your costs would have been higher.
| | | | | | | | | | | | | | | | |
| | | Beginning
account value
11-1-2016 | | | Ending
account value
4-30-2017 | | | Expenses
paid during
the period¹ | | | Annualized net
expense ratio | |
Class A | | | | | | | | | | | | | | | | |
Actual | | $ | 1,000.00 | | | $ | 1,108.42 | | | $ | 7.06 | | | | 1.35 | % |
Hypothetical (5% return before expenses) | | $ | 1,000.00 | | | $ | 1,018.10 | | | $ | 6.76 | | | | 1.35 | % |
Class C | | | | | | | | | | | | | | | | |
Actual | | $ | 1,000.00 | | | $ | 1,105.39 | | | $ | 10.96 | | | | 2.10 | % |
Hypothetical (5% return before expenses) | | $ | 1,000.00 | | | $ | 1,014.38 | | | $ | 10.49 | | | | 2.10 | % |
Class R | | | | | | | | | | | | | | | | |
Actual | | $ | 1,000.00 | | | $ | 1,107.66 | | | $ | 8.36 | | | | 1.60 | % |
Hypothetical (5% return before expenses) | | $ | 1,000.00 | | | $ | 1,016.86 | | | $ | 8.00 | | | | 1.60 | % |
Class R6 | | | | | | | | | | | | | | | | |
Actual | | $ | 1,000.00 | | | $ | 1,112.33 | | | $ | 4.66 | | | | 0.89 | % |
Hypothetical (5% return before expenses) | | $ | 1,000.00 | | | $ | 1,020.38 | | | $ | 4.46 | | | | 0.89 | % |
Administrator Class | | | | | | | | | | | | | | | | |
Actual | | $ | 1,000.00 | | | $ | 1,109.69 | | | $ | 6.54 | | | | 1.25 | % |
Hypothetical (5% return before expenses) | | $ | 1,000.00 | | | $ | 1,018.60 | | | $ | 6.26 | | | | 1.25 | % |
Institutional Class | | | | | | | | | | | | | | | | |
Actual | | $ | 1,000.00 | | | $ | 1,110.72 | | | $ | 5.18 | | | | 0.99 | % |
Hypothetical (5% return before expenses) | | $ | 1,000.00 | | | $ | 1,019.89 | | | $ | 4.96 | | | | 0.99 | % |
| 1 | Expenses paid is equal to the annualized net expense ratio of each class multiplied by the average account value over the period, multiplied by the number of days in the most recent fiscal half-year divided by the number of days in the fiscal year (to reflect the one-half-year period). |
| | | | | | |
| Portfolio of investments—April 30, 2017 (unaudited) | | Wells Fargo Diversified International Fund | | | 7 | |
| | | | | | | | | | | | | | | | |
| Security name | | | | | | | | Shares | | | Value | |
| | | | |
Common Stocks: 93.07% | | | | | | | | | | | | | | | | |
| | | | |
| Australia: 1.76% | | | | | | | | | | | | | | | | |
Arrium Limited (Materials, Metals & Mining) †(a)(i) | | | | | | | | | | | 397,400 | | | $ | 0 | |
Asaleo Care Limited (Consumer Staples, Personal Products) | | | | | | | | | | | 114,700 | | | | 154,168 | |
Automotive Holdings Group Limited (Consumer Discretionary, Specialty Retail) | | | | | | | | | | | 29,300 | | | | 81,836 | |
Bendigo Bank Limited (Financials, Banks) | | | | | | | | | | | 26,100 | | | | 240,778 | |
CSR Limited (Materials, Construction Materials) | | | | | | | | | | | 59,900 | | | | 219,780 | |
Downer EDI Limited (Industrials, Commercial Services & Supplies) | | | | | | | | | | | 42,300 | | | | 186,245 | |
Lendlease Corporation Limited (Real Estate, Real Estate Management & Development) | | | | | | | | | | | 24,500 | | | | 294,080 | |
Metcash Limited (Consumer Staples, Food & Staples Retailing) † | | | | | | | | | | | 28,500 | | | | 45,883 | |
Mineral Resources Limited (Materials, Metals & Mining) | | | | | | | | | | | 14,900 | | | | 119,270 | |
Qantas Airways Limited (Industrials, Airlines) | | | | | | | | | | | 59,300 | | | | 188,272 | |
Seven Group Holdings Limited (Industrials, Trading Companies & Distributors) | | | | | | | | | | | 8,000 | | | | 66,434 | |
Westpac Banking Corporation (Financials, Banks) | | | | | | | | | | | 17,571 | | | | 461,290 | |
| | | | |
| | | | | | | | | | | | | | | 2,058,036 | |
| | | | | | | | | | | | | | | | |
| | | | |
| Austria: 0.36% | | | | | | | | | | | | | | | | |
OMV AG (Energy, Oil, Gas & Consumable Fuels) | | | | | | | | | | | 5,300 | | | | 244,066 | |
Voestalpine AG (Materials, Metals & Mining) | | | | | | | | | | | 4,300 | | | | 179,654 | |
| | | | |
| | | | | | | | | | | | | | | 423,720 | |
| | | | | | | | | | | | | | | | |
| | | | |
| Belgium: 0.15% | | | | | | | | | | | | | | | | |
Telenet Group Holding NV (Consumer Discretionary, Media) † | | | | | | | | | | | 2,859 | | | | 173,654 | |
| | | | | | | | | | | | | | | | |
| | | | |
| Brazil: 1.59% | | | | | | | | | | | | | | | | |
Ambev SA ADR (Consumer Staples, Beverages) | | | | | | | | | | | 25,441 | | | | 145,777 | |
Banco do Brasil SA (Financials, Banks) | | | | | | | | | | | 19,000 | | | | 196,642 | |
Companhia de Saneamento de Minas Gerais SA (Utilities, Water Utilities) | | | | | | | | | | | 5,300 | | | | 60,112 | |
Cosan Limited Class A (Energy, Oil, Gas & Consumable Fuels) | | | | | | | | | | | 105,779 | | | | 813,441 | |
JBS SA (Consumer Staples, Food Products) | | | | | | | | | | | 198,300 | | | | 641,622 | |
| | | | |
| | | | | | | | | | | | | | | 1,857,594 | |
| | | | | | | | | | | | | | | | |
| | | | |
| Canada: 2.33% | | | | | | | | | | | | | | | | |
Canadian Pacific Railway Limited (Industrials, Road & Rail) | | | | | | | | | | | 8,692 | | | | 1,332,049 | |
Lundin Mining Corporation (Materials, Metals & Mining) | | | | | | | | | | | 156,208 | | | | 833,079 | |
Magna International Incorporated (Consumer Discretionary, Auto Components) | | | | | | | | | | | 9,100 | | | | 380,119 | |
Rogers Communications Incorporated Class B (Telecommunication Services, Wireless Telecommunication Services) | | | | | | | | | | | 601 | | | | 27,557 | |
WestJet Airlines Limited (Industrials, Airlines) | | | | | | | | | | | 9,200 | | | | 152,182 | |
| | | | |
| | | | | | | | | | | | | | | 2,724,986 | |
| | | | | | | | | | | | | | | | |
| | | | |
| China: 4.23% | | | | | | | | | | | | | | | | |
Alibaba Group Holding Limited ADR (Information Technology, Internet Software & Services) † | | | | | | | | | | | 10,587 | | | | 1,222,799 | |
China Communications Services Corporation Limited H Shares (Telecommunication Services, Diversified Telecommunication Services) | | | | | | | | | | | 220,000 | | | | 125,297 | |
China Everbright Limited (Financials, Capital Markets) | | | | | | | | | | | 190,000 | | | | 434,797 | |
China Mobile Limited (Telecommunication Services, Wireless Telecommunication Services) | | | | | | | | | | | 106,500 | | | | 1,135,739 | |
China Petroleum & Chemical Corporation H Shares (Energy, Oil, Gas & Consumable Fuels) | | | | | | | | | | | 218,000 | | | | 176,567 | |
China Railway Construction Corporation Limited H Shares (Industrials, Construction & Engineering) | | | | | | | | | | | 141,500 | | | | 197,924 | |
Dongfeng Motor Group Company Limited H Shares (Consumer Discretionary, Automobiles) | | | | | | | | | | | 106,000 | | | | 111,474 | |
The accompanying notes are an integral part of these financial statements.
| | | | |
| 8 | | Wells Fargo Diversified International Fund | | Portfolio of investments—April 30, 2017 (unaudited) |
| | | | | | | | | | | | | | | | |
| Security name | | | | | | | | Shares | | | Value | |
| | | | |
| China (continued) | | | | | | | | | | | | | | | | |
Industrial & Commercial Bank of China Limited H Shares (Financials, Banks) | | | | | | | | | | | 181,000 | | | $ | 118,210 | |
PICC Property & Casualty Company Limited H Shares (Financials, Insurance) | | | | | | | | | | | 69,000 | | | | 111,062 | |
Shanghai Pharmaceuticals Holding Company Limited H Shares (Health Care, Health Care Providers & Services) | | | | | | | | | | | 272,000 | | | | 720,358 | |
Shenzhen International Holdings Limited H Shares (Industrials, Transportation Infrastructure) | | | | | | | | | | | 49,500 | | | | 83,111 | |
Tencent Holdings Limited (Information Technology, Internet Software & Services) | | | | | | | | | | | 4,300 | | | | 134,556 | |
Xinyi Solar Holdings Limited (Information Technology, Semiconductors & Semiconductor Equipment) | | | | | | | | | | | 562,000 | | | | 175,572 | |
Xtep International Holdings Limited (Consumer Discretionary, Textiles, Apparel & Luxury Goods) | | | | | | | | | | | 334,050 | | | | 133,133 | |
Yantai Changyu Pioneer Wine Company Limited Class B (Consumer Staples, Beverages) | | | | | | | | | | | 23,400 | | | | 57,520 | |
| | | | |
| | | | | | | | | | | | | | | 4,938,119 | |
| | | | | | | | | | | | | | | | |
| | | | |
| Czech Republic: 0.07% | | | | | | | | | | | | | | | | |
CEZ AS (Utilities, Electric Utilities) | | | | | | | | | | | 4,900 | | | | 85,522 | |
| | | | | | | | | | | | | | | | |
| | | | |
| Denmark: 0.85% | | | | | | | | | | | | | | | | |
Danske Bank AS (Financials, Banks) | | | | | | | | | | | 9,300 | | | | 337,773 | |
ISS AS (Industrials, Commercial Services & Supplies) | | | | | | | | | | | 3,856 | | | | 159,927 | |
Novo Nordisk AS Class B (Health Care, Pharmaceuticals) | | | | | | | | | | | 8,910 | | | | 346,705 | |
Sydbank AS (Financials, Banks) | | | | | | | | | | | 4,000 | | | | 145,513 | |
| | | | |
| | | | | | | | | | | | | | | 989,918 | |
| | | | | | | | | | | | | | | | |
| | | | |
| Finland: 0.09% | | | | | | | | | | | | | | | | |
Tieto Oyj (Information Technology, IT Services) | | | | | | | | | | | 3,500 | | | | 109,840 | |
| | | | | | | | | | | | | | | | |
| | | | |
| France: 6.12% | | | | | | | | | | | | | | | | |
Arkema SA (Materials, Chemicals) | | | | | | | | | | | 910 | | | | 96,361 | |
Atos Origin SA (Information Technology, IT Services) | | | | | | | | | | | 2,400 | | | | 314,503 | |
AXA SA (Financials, Insurance) « | | | | | | | | | | | 34,802 | | | | 929,170 | |
BNP Paribas SA (Financials, Banks) | | | | | | | | | | | 4,936 | | | | 348,308 | |
Compagnie Generale des Establissements Michelin (Consumer Discretionary, Auto Components) | | | | | | | | | | | 2,200 | | | | 287,455 | |
Compagnie de Saint-Gobain SA (Industrials, Building Products) | | | | | | | | | | | 22,254 | | | | 1,201,155 | |
Credit Agricole SA (Financials, Banks) | | | | | | | | | | | 13,900 | | | | 206,678 | |
Eiffage SA (Industrials, Construction & Engineering) | | | | | | | | | | | 2,300 | | | | 194,819 | |
Electricite de France SA (Utilities, Electric Utilities) | | | | | | | | | | | 9,000 | | | | 75,155 | |
Engie SA (Utilities, Multi-Utilities) | | | | | | | | | | | 13,300 | | | | 187,616 | |
Orange SA (Telecommunication Services, Diversified Telecommunication Services) | | | | | | | | | | | 14,100 | | | | 218,100 | |
Renault SA (Consumer Discretionary, Automobiles) | | | | | | | | | | | 3,100 | | | | 289,090 | |
Sanofi SA (Health Care, Pharmaceuticals) | | | | | | | | | | | 8,600 | | | | 811,361 | |
Schneider Electric SE (Industrials, Electrical Equipment) | | | | | | | | | | | 4,978 | | | | 393,134 | |
SCOR SE (Financials, Insurance) | | | | | | | | | | | 7,700 | | | | 304,638 | |
Societe Generale SA (Financials, Banks) | | | | | | | | | | | 3,700 | | | | 202,367 | |
Total SA (Energy, Oil, Gas & Consumable Fuels) | | | | | | | | | | | 7,000 | | | | 359,676 | |
Vallourec SA (Energy, Energy Equipment & Services) †« | | | | | | | | | | | 23,177 | | | | 148,501 | |
Zodiac Aerospace SA (Industrials, Aerospace & Defense) | | | | | | | | | | | 23,842 | | | | 578,895 | |
| | | | |
| | | | | | | | | | | | | | | 7,146,982 | |
| | | | | | | | | | | | | | | | |
| | | | |
| Germany: 14.17% | | | | | | | | | | | | | | | | |
Allianz AG (Financials, Insurance) | | | | | | | | | | | 9,835 | | | | 1,872,674 | |
Aurubis AG (Materials, Metals & Mining) | | | | | | | | | | | 2,300 | | | | 160,796 | |
BASF SE (Materials, Chemicals) | | | | | | | | | | | 2,900 | | | | 282,601 | |
Bayer AG (Health Care, Pharmaceuticals) | | | | | | | | | | | 12,177 | | | | 1,506,836 | |
The accompanying notes are an integral part of these financial statements.
| | | | | | |
| Portfolio of investments—April 30, 2017 (unaudited) | | Wells Fargo Diversified International Fund | | | 9 | |
| | | | | | | | | | | | | | | | |
| Security name | | | | | | | | Shares | | | Value | |
| | | | |
| Germany (continued) | | | | | | | | | | | | | | | | |
Bayerische Motoren Werke AG (Consumer Discretionary, Automobiles) | | | | | | | | | | | 2,200 | | | $ | 210,050 | |
Beiersdorf AG (Consumer Staples, Personal Products) | | | | | | | | | | | 7,066 | | | | 703,043 | |
Celesio AG (Health Care, Health Care Providers & Services) | | | | | | | | | | | 5,300 | | | | 149,413 | |
Daimler AG (Consumer Discretionary, Automobiles) | | | | | | | | | | | 5,300 | | | | 394,893 | |
Deutsche Bank AG (Financials, Capital Markets) | | | | | | | | | | | 13,649 | | | | 245,766 | |
Deutsche Boerse AG (Financials, Diversified Financial Services) | | | | | | | | | | | 16,703 | | | | 1,634,782 | |
Deutsche Post AG (Industrials, Air Freight & Logistics) | | | | | | | | | | | 26,101 | | | | 938,250 | |
Hannover Rueck SE (Financials, Insurance) | | | | | | | | | | | 1,200 | | | | 143,918 | |
Linde AG (Materials, Chemicals) | | | | | | | | | | | 8,922 | | | | 1,603,105 | |
Metro AG (Consumer Staples, Food & Staples Retailing) | | | | | | | | | | | 43,170 | | | | 1,420,627 | |
Muenchener Rueckversicherungs Gesellschaft AG (Financials, Insurance) | | | | | | | | | | | 5,568 | | | | 1,067,176 | |
Rheinmetall AG (Industrials, Industrial Conglomerates) | | | | | | | | | | | 7,868 | | | | 722,074 | |
SAP SE (Information Technology, Software) | | | | | | | | | | | 9,309 | | | | 933,617 | |
Siemens AG (Industrials, Industrial Conglomerates) | | | | | | | | | | | 6,080 | | | | 871,580 | |
Stada Arzneimittel AG (Health Care, Pharmaceuticals) | | | | | | | | | | | 1,500 | | | | 106,256 | |
Uniper SE (Utilities, Independent Power & Renewable Electricity Producers) | | | | | | | | | | | 810 | | | | 13,297 | |
Volkswagen AG (Consumer Discretionary, Automobiles) | | | | | | | | | | | 1,600 | | | | 257,859 | |
Vonovia SE (Real Estate, Real Estate Management & Development) | | | | | | | | | | | 12,979 | | | | 469,877 | |
Wirecard AG (Information Technology, IT Services) « | | | | | | | | | | | 14,122 | | | | 833,917 | |
| | | | |
| | | | | | | | | | | | | | | 16,542,407 | |
| | | | | | | | | | | | | | | | |
| | | | |
| Hong Kong: 2.24% | | | | | | | | | | | | | | | | |
AIA Group Limited (Financials, Insurance) | | | | | | | | | | | 144,800 | | | | 1,002,459 | |
China Resources Cement Holdings Limited (Materials, Construction Materials) | | | | | | | | | | | 168,000 | | | | 92,009 | |
Kingboard Laminates Holdings Limited (Information Technology, Electronic Equipment, Instruments & Components) | | | | | | | | | | | 109,500 | | | | 132,047 | |
Skyworth Digital Holdings Limited (Consumer Discretionary, Household Durables) | | | | | | | | | | | 320,000 | | | | 185,952 | |
Wheelock & Company Limited (Real Estate, Real Estate Management & Development) | | | | | | | | | | | 22,000 | | | | 171,540 | |
Xinyi Glass Holdings Limited (Consumer Discretionary, Auto Components) | | | | | | | | | | | 972,000 | | | | 862,239 | |
Yue Yuen Industrial Holdings Limited (Consumer Discretionary, Textiles, Apparel & Luxury Goods) | | | | | | | | | | | 42,000 | | | | 166,038 | |
| | | | |
| | | | | | | | | | | | | | | 2,612,284 | |
| | | | | | | | | | | | | | | | |
| | | | |
| Hungary: 0.07% | | | | | | | | | | | | | | | | |
Richter Gedeon (Health Care, Pharmaceuticals) | | | | | | | | | | | 3,500 | | | | 84,750 | |
| | | | | | | | | | | | | | | | |
| | | | |
| Indonesia: 0.13% | | | | | | | | | | | | | | | | |
PT Bank Rakyat Indonesia Tbk (Financials, Banks) | | | | | | | | | | | 157,400 | | | | 152,334 | |
| | | | | | | | | | | | | | | | |
| | | | |
| Ireland: 1.49% | | | | | | | | | | | | | | | | |
Allegion plc (Industrials, Building Products) | | | | | | | | | | | 2,964 | | | | 233,089 | |
C&C Group plc (Consumer Staples, Beverages) | | | | | | | | | | | 18,600 | | | | 76,728 | |
Medtronic plc (Health Care, Health Care Equipment & Supplies) | | | | | | | | | | | 14,388 | | | | 1,195,499 | |
Smurfit Kappa Group plc (Materials, Containers & Packaging) | | | | | | | | | | | 8,800 | | | | 235,716 | |
| | | | |
| | | | | | | | | | | | | | | 1,741,032 | |
| | | | | | | | | | | | | | | | |
| | | | |
| Israel: 0.30% | | | | | | | | | | | | | | | | |
Bank Hapoalim Limited (Financials, Banks) | | | | | | | | | | | 38,000 | | | | 237,225 | |
Teva Pharmaceutical Industries Limited (Health Care, Pharmaceuticals) | | | | | | | | | | | 3,400 | | | | 107,488 | |
| | | | |
| | | | | | | | | | | | | | | 344,713 | |
| | | | | | | | | | | | | | | | |
The accompanying notes are an integral part of these financial statements.
| | | | |
| 10 | | Wells Fargo Diversified International Fund | | Portfolio of investments—April 30, 2017 (unaudited) |
| | | | | | | | | | | | | | | | |
| Security name | | | | | | | | Shares | | | Value | |
| | | | |
| Italy: 3.32% | | | | | | | | | | | | | | | | |
A2A SpA (Utilities, Multi-Utilities) | | | | | | | | | | | 104,600 | | | $ | 155,529 | |
Assicurazioni Generali SpA (Financials, Insurance) | | | | | | | | | | | 37,000 | | | | 585,618 | |
Atlantia SpA (Industrials, Transportation Infrastructure) | | | | | | | | | | | 13,617 | | | | 345,312 | |
Enel SpA (Utilities, Electric Utilities) | | | | | | | | | | | 80,400 | | | | 382,198 | |
Eni SpA (Energy, Oil, Gas & Consumable Fuels) | | | | | | | | | | | 70,606 | | | | 1,097,521 | |
Intesa Sanpaolo SpA (Financials, Banks) | | | | | | | | | | | 203,532 | | | | 592,845 | |
Mediobanca SpA (Financials, Banks) | | | | | | | | | | | 23,400 | | | | 224,946 | |
Prysmian SpA (Industrials, Electrical Equipment) | | | | | | | | | | | 10,564 | | | | 305,060 | |
UniCredit SpA (Financials, Banks) | | | | | | | | | | | 11,554 | | | | 188,031 | |
| | | | |
| | | | | | | | | | | | | | | 3,877,060 | |
| | | | | | | | | | | | | | | | |
| | | | |
| Japan: 14.40% | | | | | | | | | | | | | | | | |
Adeka Corporation (Materials, Chemicals) | | | | | | | | | | | 13,000 | | | | 191,837 | |
Aisin Seiki Company Limited (Consumer Discretionary, Auto Components) | | | | | | | | | | | 3,300 | | | | 161,337 | |
Aoyama Trading Company Limited (Consumer Discretionary, Specialty Retail) | | | | | | | | | | | 1,800 | | | | 64,266 | |
Astellas Pharma Incorporated (Health Care, Pharmaceuticals) | | | | | | | | | | | 17,100 | | | | 225,188 | |
Bridgestone Corporation (Consumer Discretionary, Auto Components) | | | | | | | | | | | 6,600 | | | | 275,190 | |
CALBEE Incorporated (Consumer Staples, Food Products) | | | | | | | | | | | 9,100 | | | | 317,551 | |
Central Glass Company Limited (Industrials, Building Products) | | | | | | | | | | | 34,000 | | | | 147,011 | |
Coca-Cola Bottlers Japan Incorporated (Consumer Staples, Beverages) | | | | | | | | | | | 50 | | | | 1,487 | |
Daikyo Incorporated (Real Estate, Real Estate Management & Development) | | | | | | | | | | | 73,500 | | | | 152,967 | |
Daiwa Securities Group Incorporated (Financials, Capital Markets) | | | | | | | | | | | 171,000 | | | | 1,038,962 | |
DCM Holdings Company Limited (Consumer Discretionary, Specialty Retail) | | | | | | | | | | | 14,100 | | | | 122,818 | |
Denka Company Limited (Materials, Chemicals) | | | | | | | | | | | 50,000 | | | | 257,457 | |
DIC Incorporated (Materials, Chemicals) | | | | | | | | | | | 5,300 | | | | 188,513 | |
Eizo Corporation (Information Technology, Technology Hardware, Storage & Peripherals) | | | | | | | | | | | 7,300 | | | | 241,314 | |
Fuji Oil Company Limited (Consumer Staples, Food Products) | | | | | | | | | | | 8,800 | | | | 206,274 | |
Fujikura Limited (Industrials, Electrical Equipment) | | | | | | | | | | | 25,000 | | | | 187,710 | |
Hitachi Limited (Information Technology, Electronic Equipment, Instruments & Components) | | | | | | | | | | | 156,000 | | | | 860,781 | |
Isuzu Motors Limited (Consumer Discretionary, Automobiles) | | | | | | | | | | | 19,897 | | | | 269,874 | |
Itochu Corporation (Industrials, Trading Companies & Distributors) | | | | | | | | | | | 14,600 | | | | 206,410 | |
Japan Airlines Company Limited (Industrials, Airlines) | | | | | | | | | | | 6,300 | | | | 198,933 | |
Japan Tobacco Incorporated (Consumer Staples, Tobacco) | | | | | | | | | | | 34,420 | | | | 1,144,297 | |
Kaken Pharmaceutical Company Limited (Health Care, Pharmaceuticals) | | | | | | | | | | | 3,000 | | | | 177,887 | |
KDDI Corporation (Telecommunication Services, Wireless Telecommunication Services) | | | | | | | | | | | 18,500 | | | | 490,484 | |
Kyorin Company Limited (Health Care, Pharmaceuticals) | | | | | | | | | | | 7,900 | | | | 165,264 | |
Maeda Road Construction Company Limited (Industrials, Construction & Engineering) | | | | | | | | | | | 11,000 | | | | 202,682 | |
Marubeni Corporation (Industrials, Trading Companies & Distributors) | | | | | | | | | | | 36,300 | | | | 223,515 | |
Matsumotokiyoshi Holdings Company Limited (Consumer Staples, Food & Staples Retailing) | | | | | | | | | | | 3,000 | | | | 150,437 | |
Mitsubishi Gas Chemical Company Incorporated (Materials, Chemicals) | | | | | | | | | | | 6,100 | | | | 130,345 | |
Mitsubishi UFJ Financial Group Incorporated (Financials, Banks) | | | | | | | | | | | 184,500 | | | | 1,173,782 | |
Mitsui Fudosan Company Limited (Real Estate, Real Estate Management & Development) | | | | | | | | | | | 17,000 | | | | 373,550 | |
Mizuho Financial Group Incorporated (Financials, Banks) | | | | | | | | | | | 171,600 | | | | 313,413 | |
Nippon Telegraph & Telephone Corporation (Telecommunication Services, Diversified Telecommunication Services) | | | | | | | | | | | 22,000 | | | | 941,180 | |
Nissan Motor Company Limited (Consumer Discretionary, Automobiles) | | | | | | | | | | | 32,200 | | | | 305,752 | |
Nisshinbo Holdings Incorporated (Industrials, Industrial Conglomerates) | | | | | | | | | | | 12,400 | | | | 126,697 | |
Nomura Holdings Incorporated (Financials, Capital Markets) | | | | | | | | | | | 270,700 | | | | 1,624,565 | |
NTT DOCOMO Incorporated (Telecommunication Services, Wireless Telecommunication Services) | | | | | | | | | | | 43,103 | | | | 1,039,344 | |
ORIX Corporation (Financials, Diversified Financial Services) | | | | | | | | | | | 16,500 | | | | 251,774 | |
The accompanying notes are an integral part of these financial statements.
| | | | | | |
| Portfolio of investments—April 30, 2017 (unaudited) | | Wells Fargo Diversified International Fund | | | 11 | |
| | | | | | | | | | | | | | | | |
| Security name | | | | | | | | Shares | | | Value | |
| | | | |
| Japan (continued) | | | | | | | | | | | | | | | | |
Resona Holdings Incorporated (Financials, Banks) | | | | | | | | | | | 75,000 | | | $ | 416,999 | |
S Foods Incorporated (Consumer Staples, Food Products) « | | | | | | | | | | | 7,500 | | | | 233,797 | |
Sankyu Incorporated (Industrials, Road & Rail) | | | | | | | | | | | 28,000 | | | | 178,085 | |
Sawai Pharmaceutical Company Limited (Health Care, Pharmaceuticals) | | | | | | | | | | | 2,100 | | | | 114,725 | |
SEINO Holdings Company Limited (Industrials, Road & Rail) | | | | | | | | | | | 3,000 | | | | 34,743 | |
Sojitz Corporation (Industrials, Trading Companies & Distributors) | | | | | | | | | | | 77,400 | | | | 196,494 | |
Sumitomo Heavy Industries Limited (Industrials, Machinery) | | | | | | | | | | | 30,000 | | | | 209,105 | |
Sumitomo Mitsui Financial Group Incorporated (Financials, Banks) | | | | | | | | | | | 8,000 | | | | 295,959 | |
Sumitomo Osaka Cement Company (Materials, Construction Materials) | | | | | | | | | | | 37,600 | | | | 163,251 | |
Toho Holdings Company Limited (Health Care, Health Care Providers & Services) | | | | | | | | | | | 6,200 | | | | 134,595 | |
Toyo Ink SC Holding Company Limited (Materials, Chemicals) | | | | | | | | | | | 36,800 | | | | 180,905 | |
Toyo Tire & Rubber Company Limited (Consumer Discretionary, Auto Components) | | | | | | | | | | | 5,900 | | | | 103,525 | |
UBE Industries Limited (Materials, Chemicals) | | | | | | | | | | | 79,000 | | | | 183,548 | |
Yokohama Rubber Company Limited (Consumer Discretionary, Auto Components) | | | | | | | | | | | 10,500 | | | | 205,808 | |
| | | | |
| | | | | | | | | | | | | | | 16,802,387 | |
| | | | | | | | | | | | | | | | |
| | | | |
| Luxembourg: 0.29% | | | | | | | | | | | | | | | | |
RTL Group SA (Consumer Discretionary, Media) | | | | | | | | | | | 1,649 | | | | 127,804 | |
Tenaris SA ADR (Energy, Energy Equipment & Services) | | | | | | | | | | | 6,671 | | | | 208,335 | |
| | | | |
| | | | | | | | | | | | | | | 336,139 | |
| | | | | | | | | | | | | | | | |
| | | | |
| Malaysia: 1.06% | | | | | | | | | | | | | | | | |
Bumiputra Commerce Holdings Bhd (Financials, Banks) | | | | | | | | | | | 931,662 | | | | 1,231,914 | |
| | | | | | | | | | | | | | | | |
| | | | |
| Mexico: 0.11% | | | | | | | | | | | | | | | | |
Wal-Mart de Mexico SAB de CV (Consumer Staples, Food & Staples Retailing) | | | | | | | | | | | 56,200 | | | | 126,579 | |
| | | | | | | | | | | | | | | | |
| | | | |
| Netherlands: 4.79% | | | | | | | | | | | | | | | | |
Aegon NV (Financials, Insurance) | | | | | | | | | | | 23,200 | | | | 118,247 | |
Akzo Nobel NV (Materials, Chemicals) | | | | | | | | | | | 4,470 | | | | 390,897 | |
ASML Holding NV (Information Technology, Semiconductors & Semiconductor Equipment) | | | | | | | | | | | 3,610 | | | | 477,193 | |
Heineken NV (Consumer Staples, Beverages) | | | | | | | | | | | 1,566 | | | | 139,623 | |
ING Groep NV (Financials, Banks) | | | | | | | | | | | 99,655 | | | | 1,622,342 | |
Koninklijke Ahold NV (Consumer Staples, Food & Staples Retailing) | | | | | | | | | | | 7,700 | | | | 159,532 | |
Koninklijke Philips NV (Industrials, Industrial Conglomerates) « | | | | | | | | | | | 40,531 | | | | 1,404,964 | |
NN Group NV (Financials, Insurance) | | | | | | | | | | | 31,079 | | | | 1,030,526 | |
Unilever NV (Consumer Staples, Personal Products) | | | | | | | | | | | 3,638 | | | | 190,792 | |
X5 Retail Group NV GDR (Consumer Staples, Food & Staples Retailing) † | | | | | | | | | | | 1,700 | | | | 59,925 | |
| | | | |
| | | | | | | | | | | | | | | 5,594,041 | |
| | | | | | | | | | | | | | | | |
| | | | |
| Norway: 1.73% | | | | | | | | | | | | | | | | |
DNB Nor ASA (Financials, Banks) « | | | | | | | | | | | 90,997 | | | | 1,421,232 | |
Frontline Limited (Energy, Oil, Gas & Consumable Fuels) « | | | | | | | | | | | 17,543 | | | | 116,872 | |
Marine Harvest ASA (Consumer Staples, Food Products) | | | | | | | | | | | 22,503 | | | | 374,263 | |
Yara International ASA (Materials, Chemicals) | | | | | | | | | | | 2,900 | | | | 107,813 | |
| | | | |
| | | | | | | | | | | | | | | 2,020,180 | |
| | | | | | | | | | | | | | | | |
| | | | |
| Poland: 0.07% | | | | | | | | | | | | | | | | |
Asseco Poland SA (Information Technology, Software) | | | | | | | | | | | 5,900 | | | | 83,043 | |
| | | | | | | | | | | | | | | | |
The accompanying notes are an integral part of these financial statements.
| | | | |
| 12 | | Wells Fargo Diversified International Fund | | Portfolio of investments—April 30, 2017 (unaudited) |
| | | | | | | | | | | | | | | | |
| Security name | | | | | | | | Shares | | | Value | |
| | | | |
| Russia: 1.18% | | | | | | | | | | | | | | | | |
Gazprom Neft ADR (Energy, Oil, Gas & Consumable Fuels) | | | | | | | | | | | 10,500 | | | $ | 184,800 | |
LUKOIL OAO ADR (Energy, Oil, Gas & Consumable Fuels) | | | | | | | | | | | 4,200 | | | | 208,110 | |
MMC Norilsk Nickel PJSC ADR (Materials, Metals & Mining) | | | | | | | | | | | 14,629 | | | | 225,067 | |
Mobile TeleSystems PJSC ADR (Telecommunication Services, Wireless Telecommunication Services) | | | | | | | | | | | 73,194 | | | | 755,362 | |
| | | | |
| | | | | | | | | | | | | | | 1,373,339 | |
| | | | | | | | | | | | | | | | |
| | | | |
| Singapore: 0.35% | | | | | | | | | | | | | | | | |
DBS Group Holdings Limited (Financials, Banks) | | | | | | | | | | | 17,000 | | | | 235,444 | |
United Overseas Bank Limited (Financials, Banks) | | | | | | | | | | | 10,700 | | | | 166,954 | |
| | | | |
| | | | | | | | | | | | | | | 402,398 | |
| | | | | | | | | | | | | | | | |
| | | | |
| South Africa: 0.73% | | | | | | | | | | | | | | | | |
Barclays Africa Group Limited (Financials, Banks) | | | | | | | | | | | 12,600 | | | | 138,599 | |
Imperial Holdings Limited (Consumer Discretionary, Distributors) | | | | | | | | | | | 5,700 | | | | 72,079 | |
Omnia Holdings Limited (Materials, Chemicals) | | | | | | | | | | | 7,600 | | | | 90,555 | |
Sasol Limited (Materials, Chemicals) | | | | | | | | | | | 17,799 | | | | 546,074 | |
| | | | |
| | | | | | | | | | | | | | | 847,307 | |
| | | | | | | | | | | | | | | | |
| | | | |
| South Korea: 3.47% | | | | | | | | | | | | | | | | |
BNK Financial Group Incorporated (Financials, Banks) | | | | | | | | | | | 1,018 | | | | 8,553 | |
Hana Financial Group Incorporated (Financials, Banks) | | | | | | | | | | | 31,075 | | | | 1,070,516 | |
Industrial Bank of Korea (Financials, Banks) | | | | | | | | | | | 16,600 | | | | 182,353 | |
KT&G Corporation (Consumer Staples, Tobacco) | | | | | | | | | | | 2,300 | | | | 205,159 | |
Kwangju Bank (Financials, Banks) | | | | | | | | | | | 1,044 | | | | 10,826 | |
LG Household & Health Care Limited (Consumer Staples, Personal Products) | | | | | | | | | | | 146 | | | | 111,113 | |
Orion Corporation (Consumer Staples, Food Products) | | | | | | | | | | | 3 | | | | 1,782 | |
Samsung Electronics Company Limited (Information Technology, Technology Hardware, Storage & Peripherals) | | | | | | | | | | | 321 | | | | 629,362 | |
Samsung Electronics Company Limited GDR (Information Technology, Technology Hardware, Storage & Peripherals) 144A | | | | | | | | | | | 246 | | | | 241,326 | |
SK Telecom Company Limited (Telecommunication Services, Wireless Telecommunication Services) | | | | | | | | | | | 6,707 | | | | 1,411,659 | |
Woori Bank (Financials, Banks) | | | | | | | | | | | 13,760 | | | | 180,782 | |
| | | | |
| | | | | | | | | | | | | | | 4,053,431 | |
| | | | | | | | | | | | | | | | |
| | | | |
| Spain: 1.19% | | | | | | | | | | | | | | | | |
Banco Santander Central Hispano SA (Financials, Banks) | | | | | | | | | | | 29,500 | | | | 192,388 | |
Distribuidora Internacional SA (Consumer Staples, Food & Staples Retailing) | | | | | | | | | | | 33,900 | | | | 201,807 | |
Gas Natural SDG SA (Utilities, Gas Utilities) | | | | | | | | | | | 9,100 | | | | 205,786 | |
Grifols SA (Health Care, Biotechnology) | | | | | | | | | | | 10,307 | | | | 276,812 | |
Grifols SA ADR (Health Care, Biotechnology) | | | | | | | | | | | 17,720 | | | | 384,701 | |
International Consolidated Airlines Group SA (Industrials, Airlines) | | | | | | | | | | | 17,900 | | | | 129,831 | |
| | | | |
| | | | | | | | | | | | | | | 1,391,325 | |
| | | | | | | | | | | | | | | | |
| | | | |
| Sweden: 0.55% | | | | | | | | | | | | | | | | |
Boliden AB (Materials, Metals & Mining) « | | | | | | | | | | | 6,700 | | | | 191,530 | |
Nordea Bank AB (Financials, Banks) | | | | | | | | | | | 15,000 | | | | 184,594 | |
Swedbank AB Class A (Financials, Banks) | | | | | | | | | | | 11,286 | | | | 267,455 | |
| | | | |
| | | | | | | | | | | | | | | 643,579 | |
| | | | | | | | | | | | | | | | |
The accompanying notes are an integral part of these financial statements.
| | | | | | |
| Portfolio of investments—April 30, 2017 (unaudited) | | Wells Fargo Diversified International Fund | | | 13 | |
| | | | | | | | | | | | | | | | |
| Security name | | | | | | | | Shares | | | Value | |
| | | | |
| Switzerland: 6.52% | | | | | | | | | | | | | | | | |
Actelion Limited (Health Care, Biotechnology) † | | | | | | | | | | | 1,130 | | | $ | 319,977 | |
Aryzta AG (Consumer Staples, Food Products) | | | | | | | | | | | 3,400 | | | | 110,406 | |
Baloise Holding AG (Financials, Insurance) | | | | | | | | | | | 2,000 | | | | 293,266 | |
Credit Suisse Group AG (Financials, Capital Markets) | | | | | | | | | | | 20,800 | | | | 316,285 | |
Georg Fischer AG (Industrials, Machinery) | | | | | | | | | | | 300 | | | | 282,814 | |
LafargeHolcim Limited (Materials, Construction Materials) | | | | | | | | | | | 4,663 | | | | 264,315 | |
Nestle SA (Consumer Staples, Food Products) | | | | | | | | | | | 16,639 | | | | 1,281,788 | |
Novartis AG (Health Care, Pharmaceuticals) | | | | | | | | | | | 17,555 | | | | 1,350,588 | |
Roche Holding AG (Health Care, Pharmaceuticals) | | | | | | | | | | | 1,560 | | | | 408,109 | |
Swatch Group AG Class B (Consumer Discretionary, Textiles, Apparel & Luxury Goods) | | | | | | | | | | | 692 | | | | 277,009 | |
Swiss Life Holding AG (Financials, Insurance) | | | | | | | | | | | 1,500 | | | | 488,141 | |
Swiss Reinsurance AG (Financials, Insurance) | | | | | | | | | | | 3,900 | | | | 339,437 | |
UBS Group AG (Financials, Capital Markets) | | | | | | | | | | | 10,600 | | | | 181,106 | |
Valiant Holding AG (Financials, Banks) | | | | | | | | | | | 1,900 | | | | 218,070 | |
Zurich Insurance Group AG (Financials, Insurance) | | | | | | | | | | | 5,330 | | | | 1,475,258 | |
| | | | |
| | | | | | | | | | | | | | | 7,606,569 | |
| | | | | | | | | | | | | | | | |
| | | | |
| Taiwan: 0.99% | | | | | | | | | | | | | | | | |
Pegatron Corporation (Information Technology, Technology Hardware, Storage & Peripherals) | | | | | | | | | | | 83,000 | | | | 244,563 | |
Taiwan Semiconductor Manufacturing Company Limited (Information Technology, Semiconductors & Semiconductor Equipment) | | | | | | | | | | | 121,000 | | | | 780,037 | |
Zhen Ding Technology Holding (Information Technology, Electronic Equipment, Instruments & Components) | | | | | | | | | | | 55,000 | | | | 128,700 | |
| | | | |
| | | | | | | | | | | | | | | 1,153,300 | |
| | | | | | | | | | | | | | | | |
| | | | |
| Thailand: 0.30% | | | | | | | | | | | | | | | | |
Bangchak Corporation PCL (Energy, Oil, Gas & Consumable Fuels) | | | | | | | | | | | 135,400 | | | | 125,262 | |
Thai Beverage PCL (Consumer Staples, Beverages) | | | | | | | | | | | 80,000 | | | | 52,965 | |
Thai Oil PCL (Energy, Oil, Gas & Consumable Fuels) | | | | | | | | | | | 75,100 | | | | 169,350 | |
| | | | |
| | | | | | | | | | | | | | | 347,577 | |
| | | | | | | | | | | | | | | | |
| | | | |
| United Kingdom: 12.83% | | | | | | | | | | | | | | | | |
3i Group plc (Financials, Capital Markets) | | | | | | | | | | | 27,100 | | | | 278,518 | |
Aon plc (Financials, Insurance) | | | | | | | | | | | 9,215 | | | | 1,104,326 | |
AstraZeneca plc (Health Care, Pharmaceuticals) | | | | | | | | | | | 2,700 | | | | 162,175 | |
Aviva plc (Financials, Insurance) | | | | | | | | | | | 22,000 | | | | 149,453 | |
BAE Systems plc (Industrials, Aerospace & Defense) | | | | | | | | | | | 70,700 | | | | 574,148 | |
Barclays plc (Financials, Banks) | | | | | | | | | | | 66,900 | | | | 183,912 | |
Barratt Developments plc (Consumer Discretionary, Household Durables) | | | | | | | | | | | 23,400 | | | | 175,633 | |
Bellway plc (Consumer Discretionary, Household Durables) | | | | | | | | | | | 4,200 | | | | 154,818 | |
Berkeley Group Holdings plc (Consumer Discretionary, Household Durables) | | | | | | | | | | | 4,400 | | | | 185,669 | |
Bovis Homes Group plc (Consumer Discretionary, Household Durables) | | | | | | | | | | | 8,600 | | | | 102,532 | |
BP plc (Energy, Oil, Gas & Consumable Fuels) | | | | | | | | | | | 91,700 | | | | 525,556 | |
BT Group plc (Telecommunication Services, Diversified Telecommunication Services) | | | | | | | | | | | 18,500 | | | | 73,022 | |
Carillion plc (Industrials, Construction & Engineering) | | | | | | | | | | | 30,400 | | | | 87,607 | |
Centrica plc (Utilities, Multi-Utilities) | | | | | | | | | | | 68,900 | | | | 176,604 | |
Coca-Cola European Partners plc (Consumer Staples, Beverages) | | | | | | | | | | | 22,515 | | | | 869,529 | |
Conva Tec Limited (Health Care, Health Care Equipment & Supplies) †144A | | | | | | | | | | | 131,800 | | | | 524,242 | |
Crest Nicholson Holdings plc (Consumer Discretionary, Household Durables) | | | | | | | | | | | 20,500 | | | | 160,239 | |
Debenhams plc (Consumer Discretionary, Multiline Retail) | | | | | | | | | | | 93,500 | | | | 62,004 | |
The accompanying notes are an integral part of these financial statements.
| | | | |
| 14 | | Wells Fargo Diversified International Fund | | Portfolio of investments—April 30, 2017 (unaudited) |
| | | | | | | | | | | | | | | | |
| Security name | | | | | | | | Shares | | | Value | |
| | | | |
| United Kingdom (continued) | | | | | | | | | | | | | | | | |
easyJet plc (Industrials, Airlines) | | | | | | | | | | | 6,900 | | | $ | 104,383 | |
Experian Group Limited plc (Industrials, Professional Services) | | | | | | | | | | | 3,558 | | | | 76,452 | |
Firstgroup plc (Industrials, Road & Rail) † | | | | | | | | | | | 54,400 | | | | 96,176 | |
Galliford Try plc (Industrials, Construction & Engineering) | | | | | | | | | | | 6,500 | | | | 121,231 | |
GKN plc (Consumer Discretionary, Auto Components) | | | | | | | | | | | 42,600 | | | | 198,025 | |
GlaxoSmithKline plc (Health Care, Pharmaceuticals) | | | | | | | | | | | 19,400 | | | | 389,466 | |
Imperial Tobacco Group plc (Consumer Staples, Tobacco) | | | | | | | | | | | 3,413 | | | | 167,184 | |
Inchcape plc (Consumer Discretionary, Distributors) | | | | | | | | | | | 1,100 | | | | 12,174 | |
J Sainsbury plc (Consumer Staples, Food & Staples Retailing) | | | | | | | | | | | 90,900 | | | | 324,238 | |
Kingfisher plc (Consumer Discretionary, Specialty Retail) | | | | | | | | | | | 55,500 | | | | 245,339 | |
Liberty Global plc Class A (Consumer Discretionary, Media) | | | | | | | | | | | 15,830 | | | | 560,699 | |
Liberty Global plc Class C (Consumer Discretionary, Media) | | | | | | | | | | | 25,292 | | | | 875,356 | |
Lloyds Banking Group plc (Financials, Banks) | | | | | | | | | | | 134,900 | | | | 120,908 | |
Man Group plc (Financials, Capital Markets) | | | | | | | | | | | 633,596 | | | | 1,261,313 | |
Marks & Spencer Group plc (Consumer Discretionary, Multiline Retail) | | | | | | | | | | | 33,900 | | | | 160,964 | |
Merlin Entertainment plc (Consumer Discretionary, Hotels, Restaurants & Leisure) 144A | | | | | | | | | | | 2,787 | | | | 18,247 | |
Mitie Group plc (Industrials, Commercial Services & Supplies) « | | | | | | | | | | | 31,900 | | | | 86,600 | |
Mondi plc (Materials, Paper & Forest Products) | | | | | | | | | | | 4,200 | | | | 108,851 | |
Old Mutual plc (Financials, Insurance) | | | | | | | | | | | 59,600 | | | | 149,756 | |
Qinetiq Group plc (Industrials, Aerospace & Defense) | | | | | | | | | | | 47,700 | | | | 181,513 | |
Redrow plc (Consumer Discretionary, Household Durables) | | | | | | | | | | | 24,200 | | | | 180,697 | |
Royal Dutch Shell plc Class B (Energy, Oil, Gas & Consumable Fuels) | | | | | | | | | | | 6,800 | | | | 180,771 | |
Royal Mail plc (Industrials, Air Freight & Logistics) | | | | | | | | | | | 20,900 | | | | 108,955 | |
Smiths Group plc (Industrials, Industrial Conglomerates) | | | | | | | | | | | 47,948 | | | | 1,018,476 | |
St. James’s Place plc (Financials, Insurance) | | | | | | | | | | | 4,502 | | | | 66,940 | |
United Business Media plc (Consumer Discretionary, Media) | | | | | | | | | | | 68,872 | | | | 633,787 | |
Vodafone Group plc (Telecommunication Services, Wireless Telecommunication Services) | | | | | | | | | | | 399,658 | | | | 1,030,356 | |
Wolseley plc (Industrials, Trading Companies & Distributors) | | | | | | | | | | | 14,923 | | | | 947,858 | |
| | | | |
| | | | | | | | | | | | | | | 14,976,702 | |
| | | | | | | | | | | | | | | | |
| | | | |
| United States: 3.24% | | | | | | | | | | | | | | | | |
Amazon.com Incorporated (Consumer Discretionary, Internet & Direct Marketing Retail) † | | | | | | | | | | | 575 | | | | 531,869 | |
Apple Incorporated (Information Technology, Technology Hardware, Storage & Peripherals) | | | | | | | | | | | 6,964 | | | | 1,000,379 | |
Coach Incorporated (Consumer Discretionary, Textiles, Apparel & Luxury Goods) | | | | | | | | | | | 26,254 | | | | 1,034,145 | |
Pfizer Incorporated (Health Care, Pharmaceuticals) | | | | | | | | | | | 25,399 | | | | 861,534 | |
WABCO Holdings Incorporated (Industrials, Machinery) † | | | | | | | | | | | 2,948 | | | | 350,429 | |
| | | | |
| | | | | | | | | | | | | | | 3,778,356 | |
| | | | | | | | | | | | | | | | |
| | | | |
Total Common Stocks (Cost $97,539,785) | | | | | | | | | | | | | | | 108,631,117 | |
| | | | | | | | | | | | | | | | |
| | | | |
| | | | | | Expiration date | | | | | | | |
| Participation Notes: 1.40% | | | | | | | | | | | | | | | | |
| | | | |
| China: 0.53% | | | | | | | | | | | | | | | | |
HSBC Bank plc (Kweichow Moutai Company Limited Class A) (Consumer Staples, Beverages) † | | | | | | | 2-19-2019 | | | | 10,290 | | | | 617,753 | |
| | | | | | | | | | | | | | | | |
| | | | |
| Ireland: 0.87% | | | | | | | | | | | | | | | | |
HSBC Bank plc (Ryanair Holdings plc) (Industrials, Airlines) | | | | | | | 10-29-2018 | | | | 58,887 | | | | 1,021,025 | |
| | | | | | | | | | | | | | | | |
| | | | |
Total Participation Notes (Cost $1,056,690) | | | | | | | | | | | | | | | 1,638,778 | |
| | | | | | | | | | | | | | | | |
The accompanying notes are an integral part of these financial statements.
| | | | | | |
| Portfolio of investments—April 30, 2017 (unaudited) | | Wells Fargo Diversified International Fund | | | 15 | |
| | | | | | | | | | | | | | | | |
| Security name | | Dividend yield | | | | | | Shares | | | Value | |
| | | | |
Preferred Stocks: 0.52% | | | | | | | | | | | | | | | | |
| | | | |
| Brazil: 0.03% | | | | | | | | | | | | | | | | |
Companhia Energetica de Minas Gerais SA (Utilities, Electric Utilities) ± | | | 2.76 | % | | | | | | | 13,600 | | | $ | 38,049 | |
| | | | | | | | | | | | | | | | |
| | | | |
| Germany: 0.49% | | | | | | | | | | | | | | | | |
Henkel AG & Company KGaA (Consumer Staples, Household Products) ± | | | 1.26 | | | | | | | | 4,201 | | | | 572,019 | |
| | | | | | | | | | | | | | | | |
| | | | |
Total Preferred Stocks (Cost $474,716) | | | | | | | | | | | | | | | 610,068 | |
| | | | | | | | | | | | | | | | |
| | | | |
| | | Yield | | | | | | | | | | |
| Short-Term Investments: 7.67% | | | | | | | | | | | | | | | | |
| | | | |
| Investment Companies: 7.67% | | | | | | | | | | | | | | | | |
Securities Lending Cash Investment LLC (l)(r)(u) | | | 1.03 | | | | | | | | 3,906,178 | | | | 3,906,569 | |
Wells Fargo Government Money Market Fund Select Class (l)(u) | | | 0.68 | | | | | | | | 5,040,337 | | | | 5,040,337 | |
| | | | |
Total Short-Term Investments (Cost $8,946,884) | | | | | | | | | | | | | | | 8,946,906 | |
| | | | | | | | | | | | | | | | |
| | | | | | | | |
| Total investments in securities (Cost $108,018,075) * | | | 102.66 | % | | | 119,826,869 | |
Other assets and liabilities, net | | | (2.66 | ) | | | (3,107,259 | ) |
| | | | | | | | |
| Total net assets | | | 100.00 | % | | $ | 116,719,610 | |
| | | | | | | | |
| † | Non-income-earning security |
| (a) | The security is fair valued in accordance with procedures approved by the Board of Trustees. |
| « | All or a portion of this security is on loan. |
| 144A | The security may be resold in transactions exempt from registration, normally to qualified institutional buyers, pursuant to Rule 144A under the Securities Act of 1933. |
| ± | Variable rate investment. The rate shown is the rate in effect at period end. |
| (l) | The issuer of the security is an affiliated person of the Fund as defined in the Investment Company Act of 1940. |
| (r) | The investment is a non-registered investment vehicle purchased with cash collateral received from securities on loan. |
| (u) | The rate represents the 7-day annualized yield at period end. |
| * | Cost for federal income tax purposes is $108,168,665 and unrealized gains (losses) consists of: |
| | | | |
Gross unrealized gains | | $ | 17,120,834 | |
Gross unrealized losses | | | (5,462,630 | ) |
| | | | |
Net unrealized gains | | $ | 11,658,204 | |
The accompanying notes are an integral part of these financial statements.
| | | | |
| 16 | | Wells Fargo Diversified International Fund | | Statement of assets and liabilities—April 30, 2017 (unaudited) |
| | | | |
| | | | |
| |
Assets | | | | |
Investments | | | | |
In unaffiliated securities (including $3,704,049 of securities loaned), at value (cost $99,071,191) | | $ | 110,879,963 | |
In affiliated securities, at value (cost $8,946,884) | | | 8,946,906 | |
| | | | |
Total investments, at value (cost $108,018,075) | | | 119,826,869 | |
Foreign currency, at value (cost $829,608) | | | 816,451 | |
Receivable for investments sold | | | 492,115 | |
Receivable for Fund shares sold | | | 25,063 | |
Receivable for dividends | | | 587,960 | |
Receivable for securities lending income | | | 8,128 | |
Unrealized gains on forward foreign currency contracts | | | 82,144 | |
Prepaid expenses and other assets | | | 40,760 | |
| | | | |
Total assets | | | 121,879,490 | |
| | | | |
| |
Liabilities | | | | |
Payable for investments purchased | | | 843,917 | |
Payable for Fund shares redeemed | | | 57,487 | |
Unrealized losses on forward foreign currency contracts | | | 144,884 | |
Payable upon receipt of securities loaned | | | 3,906,502 | |
Due to custodian bank | | | 4,811 | |
Management fee payable | | | 37,709 | |
Distribution fees payable | | | 2,615 | |
Administration fees payable | | | 15,865 | |
Accrued expenses and other liabilities | | | 146,090 | |
| | | | |
Total liabilities | | | 5,159,880 | |
| | | | |
Total net assets | | $ | 116,719,610 | |
| | | | |
| |
NET ASSETS CONSIST OF | | | | |
Paid-in capital | | $ | 208,359,073 | |
Undistributed net investment income | | | 664,257 | |
Accumulated net realized losses on investments | | | (104,035,243 | ) |
Net unrealized gains on investments | | | 11,731,523 | |
| | | | |
Total net assets | | $ | 116,719,610 | |
| | | | |
| |
COMPUTATION OF NET ASSET VALUE AND OFFERING PRICE PER SHARE | | | | |
Net assets – Class A | | $ | 60,797,343 | |
Shares outstanding – Class A1 | | | 5,047,812 | |
Net asset value per share – Class A | | | $12.04 | |
Maximum offering price per share – Class A2 | | | $12.77 | |
Net assets – Class C | | $ | 4,294,385 | |
Shares outstanding – Class C1 | | | 387,538 | |
Net asset value per share – Class C | | | $11.08 | |
Net assets – Class R | | $ | 28,274 | |
Shares outstanding – Class R1 | | | 2,309 | |
Net asset value per share – Class R | | | $12.25 | |
Net assets – Class R6 | | $ | 6,301,862 | |
Shares outstanding – Class R61 | | | 512,007 | |
Net asset value per share – Class R6 | | | $12.31 | |
Net assets – Administrator Class | | $ | 11,270,495 | |
Shares outstanding – Administrator Class1 | | | 919,214 | |
Net asset value per share – Administrator Class | | | $12.26 | |
Net assets – Institutional Class | | $ | 34,027,251 | |
Shares outstanding – Institutional Class1 | | | 2,955,052 | |
Net asset value per share – Institutional Class | | | $11.51 | |
| 1 | The Fund has an unlimited number of authorized shares. |
| 2 | Maximum offering price is computed as 100/94.25 of net asset value. On investments of $50,000 or more, the offering price is reduced. |
The accompanying notes are an integral part of these financial statements.
| | | | | | |
| Statement of operations—six months ended April 30, 2017 (unaudited) | | Wells Fargo Diversified International Fund | | | 17 | |
| | | | |
| | | | |
| |
Investment income | | | | |
Dividends (net of foreign withholding taxes of $151,917) | | $ | 1,446,655 | |
Securities lending income, net | | | 24,553 | |
Income from affiliated securities | | | 10,218 | |
| | | | |
Total investment income | | | 1,481,426 | |
| | | | |
| |
Expenses | | | | |
Management fee | | | 476,289 | |
Administration fees | | | | |
Class A | | | 62,380 | |
Class B | | | 2 | 1 |
Class C | | | 4,326 | |
Class R | | | 27 | |
Class R6 | | | 870 | |
Administrator Class | | | 6,723 | |
Institutional Class | | | 18,346 | |
Shareholder servicing fees | | | | |
Class A | | | 74,262 | |
Class B | | | 2 | 1 |
Class C | | | 5,150 | |
Class R | | | 33 | |
Administrator Class | | | 12,929 | |
Distribution fees | | | | |
Class B | | | 7 | 1 |
Class C | | | 15,450 | |
Class R | | | 33 | |
Custody and accounting fees | | | 115,394 | |
Professional fees | | | 35,724 | |
Registration fees | | | 48,390 | |
Shareholder report expenses | | | 35,706 | |
Trustees’ fees and expenses | | | 10,000 | |
Other fees and expenses | | | 22,919 | |
| | | | |
Total expenses | | | 944,962 | |
Less: Fee waivers and/or expense reimbursements | | | (270,292 | ) |
| | | | |
Net expenses | | | 674,670 | |
| | | | |
Net investment income | | | 806,756 | |
| | | | |
| |
REALIZED AND UNREALIZED GAINS (LOSSES) ON INVESTMENTS | | | | |
| |
Net realized gains on: | | | | |
Unaffiliated securities | | | 378,023 | |
Affiliated securities | | | 32 | |
Forward foreign currency contract transactions | | | 211,743 | |
| | | | |
Net realized gains on investments | | | 589,798 | |
| | | | |
| |
Net change in unrealized gains (losses) on: | | | | |
Unaffiliated securities | | | 10,232,550 | |
Affiliated securities | | | (32 | ) |
Forward foreign currency contract transactions | | | (180,662 | ) |
| | | | |
Net change in unrealized gains (losses) on investments | | | 10,051,856 | |
| | | | |
Net realized and unrealized gains (losses) on investments | | | 10,641,654 | |
| | | | |
Net increase in net assets resulting from operations | | $ | 11,448,410 | |
| | | | |
| 1 | For the period from November 1, 2016 to December 5, 2016. Effective at the close of business on December 5, 2016, Class B shares were converted to Class A shares and are no longer offered by the Fund. |
The accompanying notes are an integral part of these financial statements.
| | | | |
| 18 | | Wells Fargo Diversified International Fund | | Statement of changes in net assets |
| | | | | | | | | | | | | | | | |
| | | Six months ended April 30, 2017 (unaudited) | | | Year ended
October 31, 2016 | |
| | | | |
Operations | | | | | | | | | | | | | | | | |
Net investment income | | | | | | $ | 806,756 | | | | | | | $ | 1,909,544 | |
Net realized gains (losses) on investments | | | | | | | 589,798 | | | | | | | | (2,103,113 | ) |
Net change in unrealized gains (losses) on investments | | | | | | | 10,051,856 | | | | | | | | (4,109,274 | ) |
| | | | |
Net increase (decrease) in net assets resulting from operations | | | | | | | 11,448,410 | | | | | | | | (4,302,843 | ) |
| | | | |
| | | | |
Distributions to shareholders from | | | | | | | | | | | | | | | | |
Net investment income | | | | | | | | | | | | | | | | |
Class A | | | | | | | (1,161,061 | ) | | | | | | | (692,930 | ) |
Class C | | | | | | | (54,176 | ) | | | | | | | (30,743 | ) |
Class R | | | | | | | (434 | ) | | | | | | | (268 | ) |
Class R6 | | | | | | | (131,270 | ) | | | | | | | (54,538 | ) |
Administrator Class | | | | | | | (197,876 | ) | | | | | | | (136,524 | ) |
Institutional Class | | | | | | | (625,514 | ) | | | | | | | (249,898 | ) |
| | | | |
Total distributions to shareholders | | | | | | | (2,170,331 | ) | | | | | | | (1,164,901 | ) |
| | | | |
| | | | |
Capital share transactions | | | Shares | | | | | | | | Shares | | | | | |
Proceeds from shares sold | | | | | | | | | | | | | | | | |
Class A | | | 50,723 | | | | 576,892 | | | | 322,484 | | | | 3,510,932 | |
Class C | | | 26,652 | | | | 283,941 | | | | 281,595 | | | | 2,860,258 | |
Class R6 | | | 17,257 | | | | 199,073 | | | | 517,935 | | | | 6,092,247 | |
Administrator Class | | | 189,065 | | | | 2,192,400 | | | | 459,760 | | | | 5,176,981 | |
Institutional Class | | | 711,575 | | | | 7,730,522 | | | | 1,803,946 | | | | 19,585,715 | |
| | | | |
| | | | | | | 10,982,828 | | | | | | | | 37,226,133 | |
| | | | |
Reinvestment of distributions | | | | | | | | | | | | | | | | |
Class A | | | 104,664 | | | | 1,141,882 | | | | 60,092 | | | | 682,650 | |
Class C | | | 5,009 | | | | 50,389 | | | | 2,596 | | | | 27,233 | |
Class R | | | 40 | | | | 434 | | | | 23 | | | | 268 | |
Class R6 | | | 11,794 | | | | 131,270 | | | | 4,710 | | | | 54,538 | |
Administrator Class | | | 12,354 | | | | 137,133 | | | | 11,807 | | | | 136,486 | |
Institutional Class | | | 59,475 | | | | 619,734 | | | | 21,007 | | | | 227,935 | |
| | | | |
| | | | | | | 2,080,842 | | | | | | | | 1,129,110 | |
| | | | |
Payment for shares redeemed | | | | | | | | | | | | | | | | |
Class A | | | (617,823 | ) | | | (7,003,100 | ) | | | (1,217,038 | ) | | | (13,371,782 | ) |
Class B | | | (870 | )1 | | | (9,339 | )1 | | | (3,553 | ) | | | (39,685 | ) |
Class C | | | (72,180 | ) | | | (750,323 | ) | | | (188,833 | ) | | | (1,877,720 | ) |
Class R6 | | | (4,355 | ) | | | (52,190 | ) | | | (37,580 | ) | | | (419,983 | ) |
Administrator Class | | | (375,628 | ) | | | (4,222,339 | ) | | | (266,367 | ) | | | (2,965,371 | ) |
Institutional Class | | | (108,866 | ) | | | (1,186,315 | ) | | | (169,927 | ) | | | (1,825,525 | ) |
| | | | |
| | | | | | | (13,223,606 | ) | | | | | | | (20,500,066 | ) |
| | | | |
Net increase (decrease) in net assets resulting from capital share transactions | | | | | | | (159,936 | ) | | | | | | | 17,855,177 | |
| | | | |
Total increase in net assets | | | | | | | 9,118,143 | | | | | | | | 12,387,433 | |
| | | | |
| | | | |
Net assets | | | | | | | | | | | | | | | | |
Beginning of period | | | | | | | 107,601,467 | | | | | | | | 95,214,034 | |
| | | | |
End of period | | | | | | $ | 116,719,610 | | | | | | | $ | 107,601,467 | |
| | | | |
Undistributed net investment income | | | | | | $ | 664,257 | | | | | | | $ | 2,027,832 | |
| | | | |
| 1 | For the period from November 1, 2016 to December 5, 2016. Effective at the close of business on December 5, 2016, Class B shares were converted to Class A shares and are no longer offered by the Fund. |
The accompanying notes are an integral part of these financial statements.
| | | | | | |
| Financial highlights | | Wells Fargo Diversified International Fund | | | 19 | |
(For a share outstanding throughout each period)
| | | | | | | | | | | | | | | | | | | | | | | | |
| | | Six months ended
April 30, 2017 (unaudited) | | | Year ended October 31 | |
| CLASS A | | | 2016 | | | 2015 | | | 2014 | | | 2013 | | | 2012 | |
Net asset value, beginning of period | | | $11.08 | | | | $11.65 | | | | $12.01 | | | | $12.25 | | | | $10.25 | | | | $9.69 | |
Net investment income | | | 0.08 | 1 | | | 0.17 | | | | 0.13 | 1 | | | 0.24 | 1 | | | 0.19 | 1 | | | 0.19 | 1 |
Net realized and unrealized gains (losses) on investments | | | 1.10 | | | | (0.63 | ) | | | (0.21 | ) | | | (0.29 | ) | | | 2.41 | | | | 0.51 | |
| | | | | | | | | | | | | | | | | | | | | | | | |
Total from investment operations | | | 1.18 | | | | (0.46 | ) | | | (0.08 | ) | | | (0.05 | ) | | | 2.60 | | | | 0.70 | |
Distributions to shareholders from | | | | | | | | | | | | | | | | | | | | | | | | |
Net investment income | | | (0.22 | ) | | | (0.11 | ) | | | (0.28 | ) | | | (0.19 | ) | | | (0.60 | ) | | | (0.14 | ) |
Net asset value, end of period | | | $12.04 | | | | $11.08 | | | | $11.65 | | | | $12.01 | | | | $12.25 | | | | $10.25 | |
Total return2 | | | 10.84 | % | | | (3.96 | )% | | | (0.66 | )% | | | (0.49 | )% | | | 26.59 | % | | | 7.45 | % |
Ratios to average net assets (annualized) | | | | | | | | | | | | | | | | | | | | | | | | |
Gross expenses | | | 1.84 | % | | | 1.79 | % | | | 1.85 | % | | | 1.76 | % | | | 1.92 | % | | | 1.68 | % |
Net expenses | | | 1.35 | % | | | 1.35 | % | | | 1.40 | % | | | 1.41 | % | | | 1.41 | % | | | 1.41 | % |
Net investment income | | | 1.35 | % | | | 1.67 | % | | | 1.07 | % | | | 1.93 | % | | | 1.75 | % | | | 1.96 | % |
Supplemental data | | | | | | | | | | | | | | | | | | | | | | | | |
Portfolio turnover rate | | | 44 | % | | | 50 | % | | | 31 | % | | | 33 | % | | | 40 | % | | | 57 | % |
Net assets, end of period (000s omitted) | | | $60,797 | | | | $61,031 | | | | $73,891 | | | | $24,921 | | | | $28,928 | | | | $22,434 | |
| 1 | Calculated based upon average shares outstanding |
| 2 | Total return calculations do not include any sales charges. Returns for periods of less than one year are not annualized. |
The accompanying notes are an integral part of these financial statements.
| | | | |
| 20 | | Wells Fargo Diversified International Fund | | Financial highlights |
(For a share outstanding throughout each period)
| | | | | | | | | | | | | | | | | | | | | | | | |
| | | Six months ended
April 30, 2017 (unaudited) | | | Year ended October 31 | |
| CLASS C | | | 2016 | | | 2015 | | | 2014 | | | 2013 | | | 2012 | |
Net asset value, beginning of period | | | $10.16 | | | | $10.74 | | | | $11.08 | | | | $11.35 | | | | $9.54 | | | | $9.01 | |
Net investment income | | | 0.03 | 1 | | | 0.10 | 1 | | | 0.04 | 1 | | | 0.13 | 1 | | | 0.09 | 1 | | | 0.11 | 1 |
Net realized and unrealized gains (losses) on investments | | | 1.03 | | | | (0.60 | ) | | | (0.20 | ) | | | (0.27 | ) | | | 2.25 | | | | 0.48 | |
| | | | | | | | | | | | | | | | | | | | | | | | |
Total from investment operations | | | 1.06 | | | | (0.50 | ) | | | (0.16 | ) | | | (0.14 | ) | | | 2.34 | | | | 0.59 | |
Distributions to shareholders from | | | | | | | | | | | | | | | | | | | | | | | | |
Net investment income | | | (0.14 | ) | | | (0.08 | ) | | | (0.18 | ) | | | (0.13 | ) | | | (0.53 | ) | | | (0.06 | ) |
Net asset value, end of period | | | $11.08 | | | | $10.16 | | | | $10.74 | | | | $11.08 | | | | $11.35 | | | | $9.54 | |
Total return2 | | | 10.54 | % | | | (4.72 | )% | | | (1.44 | )% | | | (1.24 | )% | | | 25.67 | % | | | 6.67 | % |
Ratios to average net assets (annualized) | | | | | | | | | | | | | | | | | | | | | | | | |
Gross expenses | | | 2.59 | % | | | 2.54 | % | | | 2.60 | % | | | 2.51 | % | | | 2.66 | % | | | 2.43 | % |
Net expenses | | | 2.10 | % | | | 2.10 | % | | | 2.15 | % | | | 2.16 | % | | | 2.16 | % | | | 2.16 | % |
Net investment income | | | 0.62 | % | | | 1.01 | % | | | 0.33 | % | | | 1.15 | % | | | 0.84 | % | | | 1.21 | % |
Supplemental data | | | | | | | | | | | | | | | | | | | | | | | | |
Portfolio turnover rate | | | 44 | % | | | 50 | % | | | 31 | % | | | 33 | % | | | 40 | % | | | 57 | % |
Net assets, end of period (000s omitted) | | | $4,294 | | | | $4,351 | | | | $3,573 | | | | $1,616 | | | | $1,746 | | | | $628 | |
| 1 | Calculated based upon average shares outstanding |
| 2 | Total return calculations do not include any sales charges. Returns for periods of less than one year are not annualized. |
The accompanying notes are an integral part of these financial statements.
| | | | | | |
| Financial highlights | | Wells Fargo Diversified International Fund | | | 21 | |
(For a share outstanding throughout each period)
| | | | | | | | | | | | |
| | | Six months ended
April 30, 2017 (unaudited) | | | Year ended October 31 | |
| CLASS R | | | 2016 | | | 20151 | |
Net asset value, beginning of period | | | $11.25 | | | | $11.86 | | | | $11.13 | |
Net investment income (loss) | | | 0.07 | | | | 0.16 | 2 | | | (0.01 | ) |
Net realized and unrealized gains (losses) on investments | | | 1.12 | | | | (0.65 | ) | | | 0.74 | |
| | | | | | | | | | | | |
Total from investment operations | | | 1.19 | | | | (0.49 | ) | | | 0.73 | |
Distributions to shareholders from | | | | | | | | | | | | |
Net investment income | | | (0.19 | ) | | | (0.12 | ) | | | 0.00 | |
Net asset value, end of period | | | $12.25 | | | | $11.25 | | | | $11.86 | |
Total return3 | | | 10.77 | % | | | (4.16 | )% | | | 6.56 | % |
Ratios to average net assets (annualized) | | | | | | | | | | | | |
Gross expenses | | | 2.09 | % | | | 2.04 | % | | | 2.15 | % |
Net expenses | | | 1.60 | % | | | 1.60 | % | | | 1.60 | % |
Net investment income (loss) | | | 1.16 | % | | | 1.42 | % | | | (0.65 | )% |
Supplemental data | | | | | | | | | | | | |
Portfolio turnover rate | | | 44 | % | | | 50 | % | | | 31 | % |
Net assets, end of period (000s omitted) | | | $28 | | | | $26 | | | | $27 | |
| 1 | For the period from September 30, 2015 (commencement of class operations) to October 31, 2015 |
| 2 | Calculated based upon average shares outstanding |
| 3 | Returns for periods of less than one year are not annualized. |
The accompanying notes are an integral part of these financial statements.
| | | | |
| 22 | | Wells Fargo Diversified International Fund | | Financial highlights |
(For a share outstanding throughout each period)
| | | | | | | | | | | | |
| | | Six months ended
April 30, 2017 (unaudited) | | | Year ended October 31 | |
| CLASS R6 | | | 2016 | | | 20151 | |
Net asset value, beginning of period | | | $11.33 | | | | $11.87 | | | | $11.13 | |
Net investment income | | | 0.11 | | | | 0.26 | 2 | | | 0.00 | 3 |
Net realized and unrealized gains (losses) on investments | | | 1.13 | | | | (0.68 | ) | | | 0.74 | |
| | | | | | | | | | | | |
Total from investment operations | | | 1.24 | | | | (0.42 | ) | | | 0.74 | |
Distributions to shareholders from | | | | | | | | | | | | |
Net investment income | | | (0.26 | ) | | | (0.12 | ) | | | 0.00 | |
Net asset value, end of period | | | $12.31 | | | | $11.33 | | | | $11.87 | |
Total return4 | | | 11.23 | % | | | (3.55 | )% | | | 6.65 | % |
Ratios to average net assets (annualized) | | | | | | | | | | | | |
Gross expenses | | | 1.41 | % | | | 1.36 | % | | | 1.46 | % |
Net expenses | | | 0.89 | % | | | 0.89 | % | | | 0.89 | % |
Net investment income | | | 1.88 | % | | | 2.30 | % | | | 0.05 | % |
Supplemental data | | | | | | | | | | | | |
Portfolio turnover rate | | | 44 | % | | | 50 | % | | | 31 | % |
Net assets, end of period (000s omitted) | | | $6,302 | | | | $5,523 | | | | $27 | |
| 1 | For the period from September 30, 2015 (commencement of class operations) to October 31, 2015 |
| 2 | Calculated based upon average shares outstanding |
| 3 | Amount is less than $0.005. |
| 4 | Returns for periods of less than one year are not annualized. |
The accompanying notes are an integral part of these financial statements.
| | | | | | |
| Financial highlights | | Wells Fargo Diversified International Fund | | | 23 | |
(For a share outstanding throughout each period)
| | | | | | | | | | | | | | | | | | | | | | | | |
| | | Six months ended
April 30, 2017 (unaudited) | | | Year ended October 31 | |
| ADMINISTRATOR CLASS | | | 2016 | | | 2015 | | | 2014 | | | 2013 | | | 2012 | |
Net asset value, beginning of period | | | $11.28 | | | | $11.87 | | | | $12.23 | | | | $12.47 | | | | $10.42 | | | | $9.68 | |
Net investment income | | | 0.09 | 1 | | | 0.20 | 1 | | | 0.16 | 1 | | | 0.26 | 1 | | | 0.19 | 1 | | | 0.21 | 1 |
Net realized and unrealized gains (losses) on investments | | | 1.12 | | | | (0.66 | ) | | | (0.22 | ) | | | (0.30 | ) | | | 2.47 | | | | 0.53 | |
| | | | | | | | | | | | | | | | | | | | | | | | |
Total from investment operations | | | 1.21 | | | | (0.46 | ) | | | (0.06 | ) | | | (0.04 | ) | | | 2.66 | | | | 0.74 | |
Distributions to shareholders from | | | | | | | | | | | | | | | | | | | | | | | | |
Net investment income | | | (0.23 | ) | | | (0.13 | ) | | | (0.30 | ) | | | (0.20 | ) | | | (0.61 | ) | | | 0.00 | |
Net asset value, end of period | | | $12.26 | | | | $11.28 | | | | $11.87 | | | | $12.23 | | | | $12.47 | | | | $10.42 | |
Total return2 | | | 10.97 | % | | | (3.90 | )% | | | (0.46 | )% | | | (0.39 | )% | | | 26.85 | % | | | 7.64 | % |
Ratios to average net assets (annualized) | | | | | | | | | | | | | | | | | | | | | | | | |
Gross expenses | | | 1.76 | % | | | 1.71 | % | | | 1.72 | % | | | 1.60 | % | | | 1.74 | % | | | 1.52 | % |
Net expenses | | | 1.25 | % | | | 1.25 | % | | | 1.25 | % | | | 1.25 | % | | | 1.25 | % | | | 1.25 | % |
Net investment income | | | 1.49 | % | | | 1.83 | % | | | 1.31 | % | | | 2.10 | % | | | 1.72 | % | | | 2.11 | % |
Supplemental data | | | | | | | | | | | | | | | | | | | | | | | | |
Portfolio turnover rate | | | 44 | % | | | 50 | % | | | 31 | % | | | 33 | % | | | 40 | % | | | 57 | % |
Net assets, end of period (000s omitted) | | | $11,270 | | | | $12,334 | | | | $10,540 | | | | $7,283 | | | | $8,195 | | | | $3,504 | |
| 1 | Calculated based upon average shares outstanding |
| 2 | Returns for periods of less than one year are not annualized. |
The accompanying notes are an integral part of these financial statements.
| | | | |
| 24 | | Wells Fargo Diversified International Fund | | Financial highlights |
(For a share outstanding throughout each period)
| | | | | | | | | | | | | | | | | | | | | | | | |
| | | Six months ended
April 30, 2017 (unaudited) | | | Year ended October 31 | |
| INSTITUTIONAL CLASS | | | 2016 | | | 2015 | | | 2014 | | | 2013 | | | 2012 | |
Net asset value, beginning of period | | | $10.61 | | | | $11.14 | | | | $11.50 | | | | $11.79 | | | | $10.20 | | | | $9.69 | |
Net investment income | | | 0.10 | 1 | | | 0.23 | 1 | | | 0.17 | 1 | | | 0.26 | 1 | | | 0.20 | 1 | | | 0.19 | 1 |
Net realized and unrealized gains (losses) on investments | | | 1.05 | | | | (0.63 | ) | | | (0.20 | ) | | | (0.27 | ) | | | 2.37 | | | | 0.51 | |
| | | | | | | | | | | | | | | | | | | | | | | | |
Total from investment operations | | | 1.15 | | | | (0.40 | ) | | | (0.03 | ) | | | (0.01 | ) | | | 2.57 | | | | 0.70 | |
Distributions to shareholders from | | | | | | | | | | | | | | | | | | | | | | | | |
Net investment income | | | (0.25 | ) | | | (0.13 | ) | | | (0.33 | ) | | | (0.28 | ) | | | (0.98 | ) | | | (0.19 | ) |
Net asset value, end of period | | | $11.51 | | | | $10.61 | | | | $11.14 | | | | $11.50 | | | | $11.79 | | | | $10.20 | |
Total return2 | | | 11.07 | % | | | (3.63 | )% | | | (0.23 | )% | | | (0.18 | )% | | | 27.28 | % | | | 7.51 | % |
Ratios to average net assets (annualized) | | | | | | | | | | | | | | | | | | | | | | | | |
Gross expenses | | | 1.51 | % | | | 1.46 | % | | | 1.47 | % | | | 1.33 | % | | | 1.50 | % | | | 1.20 | % |
Net expenses | | | 0.99 | % | | | 0.99 | % | | | 0.99 | % | | | 0.99 | % | | | 0.99 | % | | | 0.99 | % |
Net investment income | | | 1.84 | % | | | 2.16 | % | | | 1.45 | % | | | 2.23 | % | | | 1.94 | % | | | 1.96 | % |
Supplemental data | | | | | | | | | | | | | | | | | | | | | | | | |
Portfolio turnover rate | | | 44 | % | | | 50 | % | | | 31 | % | | | 33 | % | | | 40 | % | | | 57 | % |
Net assets, end of period (000s omitted) | | | $34,027 | | | | $24,328 | | | | $7,106 | | | | $2,683 | | | | $2,406 | | | | $7,367 | |
| 1 | Calculated based upon average shares outstanding |
| 2 | Returns for periods of less than one year are not annualized. |
The accompanying notes are an integral part of these financial statements.
| | | | | | |
| Notes to financial statements (unaudited) | | Wells Fargo Diversified International Fund | | | 25 | |
1. ORGANIZATION
Wells Fargo Funds Trust (the “Trust”), a Delaware statutory trust organized on March 10, 1999, is an open-end management investment company registered under the Investment Company Act of 1940, as amended (the “1940 Act”). As an investment company, the Trust follows the accounting and reporting guidance in Financial Accounting Standards Board (“FASB”) Accounting Standards Codification (“ASC”) Topic 946, Financial Services – Investment Companies. These financial statements report on the Wells Fargo Diversified International Fund (the “Fund”) which is a diversified series of the Trust.
Effective at the close of business on December 5, 2016, Class B shares were converted to Class A shares and are no longer offered by the Fund. Information for Class B shares reflected in the financial statements represents activity through December 5, 2016.
2. SIGNIFICANT ACCOUNTING POLICIES
The following significant accounting policies, which are consistently followed in the preparation of the financial statements of the Fund, are in conformity with U.S. generally accepted accounting principles which require management to make estimates and assumptions that affect the reported amounts of assets and liabilities, disclosure of contingent assets and liabilities at the date of the financial statements, and the reported amounts of revenues and expenses during the reporting period. Actual results could differ from those estimates.
Securities valuation
All investments are valued each business day as of the close of regular trading on the New York Stock Exchange (generally 4 p.m. Eastern Time), although the Fund may deviate from this calculation time under unusual or unexpected circumstances.
Equity securities that are listed on a foreign or domestic exchange or market are valued at the official closing price or, if none, the last sales price. If no sale occurs on the principal exchange or market that day, the prior day’s price will be deemed “stale” and a fair value price will be determined in accordance with the Fund’s Valuation Procedures.
The values of securities denominated in foreign currencies are translated into U.S. dollars at rates provided by an independent foreign currency pricing source at a time each business day specified by the Management Valuation Team of Wells Fargo Funds Management, LLC (“Funds Management”).
Many securities markets and exchanges outside the U.S. close prior to the close of the New York Stock Exchange and therefore may not fully reflect trading or events that occur after the close of the principal exchange in which the foreign securities are traded, but before the close of the New York Stock Exchange. If such trading or events are expected to materially affect the value of such securities, then fair value pricing procedures approved by the Board of Trustees of the Fund are applied. These procedures take into account multiple factors including movements in U.S. securities markets after foreign exchanges close. Foreign securities that are fair valued under these procedures are categorized as Level 2 and the application of these procedures may result in transfers between Level 1 and Level 2. Depending on market activity, such fair valuations may be frequent. Such fair value pricing may result in net asset values that are higher or lower than net asset values based on the last reported sales price or latest quoted bid price. On April 30, 2017, such fair value pricing was not used in pricing foreign securities.
Investments in registered open-end investment companies are valued at net asset value. Interests in non-registered investment companies that are redeemable at net asset value are fair valued normally at net asset value.
Investments which are not valued using any of the methods discussed above are valued at their fair value, as determined in good faith by the Board of Trustees. The Board of Trustees has established a Valuation Committee comprised of the Trustees and has delegated to it the authority to take any actions regarding the valuation of portfolio securities that the Valuation Committee deems necessary or appropriate, including determining the fair value of portfolio securities, unless the determination has been delegated to the Management Valuation Team. The Board of Trustees retains the authority to make or ratify any valuation decisions or approve any changes to the Valuation Procedures as it deems appropriate. On a quarterly basis, the Board of Trustees receives reports on any valuation actions taken by the Valuation Committee or the Management Valuation Team which may include items for ratification.
Valuations of fair valued securities are compared to the next actual sales price when available, or other appropriate market values, to assess the continued appropriateness of the fair valuation methodologies used. These securities are fair valued on a day-to-day basis, taking into consideration changes to appropriate market information and any significant changes to the inputs considered in the valuation process until there is a readily available price provided on an exchange or by an independent pricing service. Valuations received from an independent pricing service or independent broker-dealer quotes are periodically validated by comparisons to most recent trades and valuations provided by other independent pricing services in addition to
| | | | |
| 26 | | Wells Fargo Diversified International Fund | | Notes to financial statements (unaudited) |
the review of prices by the manager and/or subadviser. Unobservable inputs used in determining fair valuations are identified based on the type of security, taking into consideration factors utilized by market participants in valuing the investment, knowledge about the issuer and the current market environment.
Foreign currency translation
The accounting records of the Fund are maintained in U.S. dollars. The values of other assets and liabilities denominated in foreign currencies are translated into U.S. dollars at rates provided by an independent foreign currency pricing source at a time each business day specified by the Management Valuation Team. Purchases and sales of securities, and income and expenses are converted at the rate of exchange on the respective dates of such transactions. Net realized foreign exchange gains or losses arise from sales of foreign currencies, currency gains or losses realized between the trade and settlement dates on securities transactions, and the difference between the amounts of dividends, interest and foreign withholding taxes recorded and the U.S. dollar equivalent of the amounts actually paid or received. Net unrealized foreign exchange gains and losses arise from changes in the fair value of assets and liabilities other than investments in securities resulting from changes in exchange rates. The changes in net assets arising from changes in exchange rates of securities and the changes in net assets resulting from changes in market prices of securities are not separately presented. Such changes are included in net realized and unrealized gains or losses from investments.
Participation notes
The Fund may invest in participation notes to gain exposure to securities in certain foreign markets. Participation notes are issued by banks or broker-dealers and are designed to offer a return linked to a particular underlying foreign security. Participation notes involve transaction costs, which may be higher than those applicable to the underlying foreign security. The holder of the participation note is entitled to receive from the bank or broker-dealer, an amount equal to the dividend paid by the issuer of the underlying foreign security; however, the holder is not entitled to the same rights (i.e. dividends, voting rights) as an owner of the underlying foreign security. Investments in participation notes involve risks beyond those normally associated with a direct investment in an underlying security. The Fund has no rights against the issuer of the underlying foreign security and participation notes expose the Fund to counterparty risk in the event the counterparty does not perform. There is also no assurance there will be a secondary trading market for the participation note or that the trading price of the participation note will equal the underlying value of the foreign security that it seeks to replicate.
Forward foreign currency contracts
The Fund is subject to foreign currency risk in the normal course of pursuing its investment objectives. A forward foreign currency contract is an agreement between two parties to purchase or sell a specific currency for an agreed-upon price at a future date. The Fund enters into forward foreign currency contracts to facilitate transactions in foreign-denominated securities and to attempt to minimize the risk to the Fund from adverse changes in the relationship between currencies. Forward foreign currency contracts are recorded at the forward rate and marked-to-market daily. When the contracts are closed, realized gains and losses arising from such transactions are recorded as realized gains or losses on forward foreign currency contract transactions. The Fund could be exposed to risks if the counterparties to the contracts are unable to meet the terms of their contracts or if the value of the foreign currency changes unfavorably. The Fund’s maximum risk of loss from counterparty credit risk is the unrealized gains on the contracts. This risk may be mitigated if there is a master netting arrangement between the Fund and the counterparty.
Security loans
The Fund may lend its securities from time to time in order to earn additional income in the form of fees or interest on securities received as collateral or the investment of any cash received as collateral. The Fund continues to receive interest or dividends on the securities loaned. The Fund receives collateral in the form of cash or securities with a value at least equal to the value of the securities on loan. The value of the loaned securities is determined at the close of each business day and any additional required collateral is delivered to the Fund on the next business day. In a securities lending transaction, the net asset value of the Fund will be affected by an increase or decrease in the value of the securities loaned and by an increase or decrease in the value of the instrument in which collateral is invested. The amount of securities lending activity undertaken by the Fund fluctuates from time to time. In the event of default or bankruptcy by the borrower, the Fund may be prevented from recovering the loaned securities or gaining access to the collateral or may experience delays or costs in doing so. In addition, the investment of any cash collateral received may lose all or part of its value. The Fund has the right under the lending agreement to recover the securities from the borrower on demand.
The Fund lends its securities through an unaffiliated securities lending agent. Cash collateral received in connection with its securities lending transactions is invested in Securities Lending Cash Investments, LLC (the “Securities Lending Fund”). The Securities Lending Fund is exempt from registration under Section 3(c)(7) of the 1940 Act and is managed by Funds Management and is subadvised by Wells Capital Management Incorporated (“WellsCap”), an affiliate of Funds Management and an indirect wholly owned subsidiary of Wells Fargo & Company (“Wells Fargo”). Funds Management receives an advisory
| | | | | | |
| Notes to financial statements (unaudited) | | Wells Fargo Diversified International Fund | | | 27 | |
fee starting at 0.05% and declining to 0.01% as the average daily net assets of the Securities Lending Fund increase. All of the fees received by Funds Management are paid to WellsCap for its services as subadviser. The Securities Lending Fund seeks to provide a positive return compared to the daily Fed Funds Open Rate by investing in high-quality, U.S. dollar-denominated short-term money market instruments. Securities Lending Fund investments are valued at the evaluated bid price provided by an independent pricing service. Income earned from investment in the Securities Lending Fund is included in securities lending income on the Statement of Operations.
Security transactions and income recognition
Securities transactions are recorded on a trade date basis. Realized gains or losses are recorded on the basis of identified cost.
Dividend income is recognized on the ex-dividend date, except for certain dividends from foreign securities, which are recorded as soon as the custodian verifies the ex-dividend date. Dividend income from foreign securities is recorded net of foreign taxes withheld where recovery of such taxes is not assured.
Distributions to shareholders
Distributions to shareholders from net investment income and net realized gains, if any, are recorded on the ex-dividend date. Such distributions are determined in accordance with income tax regulations and may differ from U.S. generally accepted accounting principles. Dividend sources are estimated at the time of declaration. The tax character of distributions is determined as of the Fund’s fiscal year end. Therefore, a portion of the Fund’s distributions made prior the Fund’s fiscal year end may be categorized as a tax return of capital.
Federal and other taxes
The Fund intends to continue to qualify as a regulated investment company by distributing substantially all of its investment company taxable income and any net realized capital gains (after reduction for capital loss carryforwards) sufficient to relieve it from all, or substantially all, federal income taxes. Accordingly, no provision for federal income taxes was required.
The Fund’s income and federal excise tax returns and all financial records supporting those returns for the prior three fiscal years are subject to examination by the federal and Delaware revenue authorities. Management has analyzed the Fund’s tax positions taken on federal, state, and foreign tax returns for all open tax years and does not believe that there are any uncertain tax positions that require recognition of a tax liability.
Capital loss carryforwards that do not expire are required to be utilized prior to capital loss carryforwards that expire. As of October 31, 2016, capital loss carryforwards available to offset future net realized capital gains were as follows through the indicated expiration dates:
| | | | |
| | | No expiration |
| 2017 | | Short-term | | Long-term |
| $89,306,475 | | $11,620,385 | | $2,744,226 |
Class allocations
The separate classes of shares offered by the Fund differ principally in applicable sales charges, distribution, shareholder servicing, and administration fees. Class specific expenses are charged directly to that share class. Investment income, common expenses, and realized and unrealized gains (losses) on investments are allocated daily to each class of shares based on the relative proportion of net assets of each class.
3. FAIR VALUATION MEASUREMENTS
Fair value measurements of investments are determined within a framework that has established a fair value hierarchy based upon the various data inputs utilized in determining the value of the Fund’s investments. The three-level hierarchy gives the highest priority to unadjusted quoted prices in active markets for identical assets or liabilities (Level 1) and the lowest priority to unobservable inputs (Level 3). The Fund’s investments are classified within the fair value hierarchy based on the lowest level of input that is significant to the fair value measurement. The inputs are summarized into three broad levels as follows:
| ∎ | | Level 1 – quoted prices in active markets for identical securities |
| ∎ | | Level 2 – other significant observable inputs (including quoted prices for similar securities, interest rates, prepayment speeds, credit risk, etc.) |
| ∎ | | Level 3 – significant unobservable inputs (including the Fund’s own assumptions in determining the fair value of investments) |
The inputs or methodologies used for valuing investments in securities are not necessarily an indication of the risk associated with investing in those securities.
| | | | |
| 28 | | Wells Fargo Diversified International Fund | | Notes to financial statements (unaudited) |
The following is a summary of the inputs used in valuing the Fund’s assets and liabilities as of April 30, 2017:
| | | | | | | | | | | | | | | | |
| | | Quoted prices
(Level 1) | | | Other significant
observable inputs
(Level 2) | | | Significant
unobservable inputs (Level 3) | | | Total | |
Assets | | | | | | | | | | | | | | | | |
Investments in: | | | | | | | | | | | | | | | | |
| | | | |
Common stocks | | | | | | | | | | | | | | | | |
Australia | | $ | 2,058,036 | | | $ | 0 | | | $ | 0 | | | $ | 2,058,036 | |
Austria | | | 423,720 | | | | 0 | | | | 0 | | | | 423,720 | |
Belgium | | | 173,654 | | | | 0 | | | | 0 | | | | 173,654 | |
Brazil | | | 1,857,594 | | | | 0 | | | | 0 | | | | 1,857,594 | |
Canada | | | 2,724,986 | | | | 0 | | | | 0 | | | | 2,724,986 | |
China | | | 4,938,119 | | | | 0 | | | | 0 | | | | 4,938,119 | |
Czech Republic | | | 85,522 | | | | 0 | | | | 0 | | | | 85,522 | |
Denmark | | | 989,918 | | | | 0 | | | | 0 | | | | 989,918 | |
Finland | | | 109,840 | | | | 0 | | | | 0 | | | | 109,840 | |
France | | | 7,146,982 | | | | 0 | | | | 0 | | | | 7,146,982 | |
Germany | | | 16,542,407 | | | | 0 | | | | 0 | | | | 16,542,407 | |
Hong Kong | | | 2,612,284 | | | | 0 | | | | 0 | | | | 2,612,284 | |
Hungary | | | 84,750 | | | | 0 | | | | 0 | | | | 84,750 | |
Indonesia | | | 152,334 | | | | 0 | | | | 0 | | | | 152,334 | |
Ireland | | | 1,741,032 | | | | 0 | | | | 0 | | | | 1,741,032 | |
Israel | | | 344,713 | | | | 0 | | | | 0 | | | | 344,713 | |
Italy | | | 3,877,060 | | | | 0 | | | | 0 | | | | 3,877,060 | |
Japan | | | 16,802,387 | | | | 0 | | | | 0 | | | | 16,802,387 | |
Luxembourg | | | 336,139 | | | | 0 | | | | 0 | | | | 336,139 | |
Malaysia | | | 1,231,914 | | | | 0 | | | | 0 | | | | 1,231,914 | |
Mexico | | | 126,579 | | | | 0 | | | | 0 | | | | 126,579 | |
Netherlands | | | 5,594,041 | | | | 0 | | | | 0 | | | | 5,594,041 | |
Norway | | | 2,020,180 | | | | 0 | | | | 0 | | | | 2,020,180 | |
Poland | | | 83,043 | | | | 0 | | | | 0 | | | | 83,043 | |
Russia | | | 1,373,339 | | | | 0 | | | | 0 | | | | 1,373,339 | |
Singapore | | | 402,398 | | | | 0 | | | | 0 | | | | 402,398 | |
South Africa | | | 847,307 | | | | 0 | | | | 0 | | | | 847,307 | |
South Korea | | | 4,053,431 | | | | 0 | | | | 0 | | | | 4,053,431 | |
Spain | | | 1,391,325 | | | | 0 | | | | 0 | | | | 1,391,325 | |
Sweden | | | 643,579 | | | | 0 | | | | 0 | | | | 643,579 | |
Switzerland | | | 7,606,569 | | | | 0 | | | | 0 | | | | 7,606,569 | |
Taiwan | | | 1,153,300 | | | | 0 | | | | 0 | | | | 1,153,300 | |
Thailand | | | 347,577 | | | | 0 | | | | 0 | | | | 347,577 | |
United Kingdom | | | 14,976,702 | | | | 0 | | | | 0 | | | | 14,976,702 | |
United States | | | 3,778,356 | | | | 0 | | | | 0 | | | | 3,778,356 | |
| | | | |
Participation notes | | | | | | | | | | | | | | | | |
China | | | 0 | | | | 617,753 | | | | 0 | | | | 617,753 | |
Ireland | | | 0 | | | | 1,021,025 | | | | 0 | | | | 1,021,025 | |
| | | | |
Preferred stocks | | | | | | | | | | | | | | | | |
Brazil | | | 38,049 | | | | 0 | | | | 0 | | | | 38,049 | |
Germany | | | 572,019 | | | | 0 | | | | 0 | | | | 572,019 | |
| | | | |
Short-term investments | | | | | | | | | | | | | | | | |
Investment companies | | | 5,040,337 | | | | 0 | | | | 0 | | | | 5,040,337 | |
Investments measured at net asset value* | | | | | | | | | | | | | | | 3,906,569 | |
| | | 114,281,522 | | | | 1,638,778 | | | | 0 | | | | 119,826,869 | |
Forward foreign currency contracts | | | 0 | | | | 82,144 | | | | 0 | | | | 82,144 | |
Total assets | | $ | 114,281,522 | | | $ | 1,720,922 | | | $ | 0 | | | $ | 119,909,013 | |
Liabilities | | | | | | | | | | | | | | | | |
Forward foreign currency contracts | | $ | 0 | | | $ | 144,884 | | | $ | 0 | | | $ | 144,884 | |
Total liabilities | | $ | 0 | | | $ | 144,884 | | | $ | 0 | | | $ | 144,884 | |
| * | Investments that are measured at fair value using the net asset value per share (or its equivalent) as a practical expedient have not been categorized in the fair value hierarchy. The fair value amount presented in the table is intended to permit reconciliation of the fair value hierarchy to the amounts presented in the Statement of Assets and Liabilities. The Fund’s investment in Securities Lending Cash Investments, LLC valued at $3,906,569 does not have a redemption period notice, can be redeemed daily and does not have any unfunded commitments. |
| | | | | | |
| Notes to financial statements (unaudited) | | Wells Fargo Diversified International Fund | | | 29 | |
Forward foreign currency contracts are reported at their unrealized gains (losses) at measurement date, which represents the change in the contract’s value from trade date. All other assets and liabilities are reported at their market value at measurement date.
The Fund recognizes transfers between levels within the fair value hierarchy at the end of the reporting period. At April 30, 2017, the Fund did not have any transfers into/out of Level 1. The Fund had no material transfers between Level 2 and Level 3.
4. TRANSACTIONS WITH AFFILIATES AND OTHER EXPENSES
Management fee
Funds Management, an indirect wholly owned subsidiary of Wells Fargo, is the manager of the Fund and provides advisory and fund-level administrative services under an investment management agreement. Under the investment management agreement, Funds Management is responsible for, among other services, implementing the investment objectives and strategies of the Fund, supervising the applicable subadvisers, providing fund-level administrative services in connection with the Fund’s operations, and providing any other fund-level administrative services reasonably necessary for the operation of the Fund. As compensation for its services under the investment management agreement, Funds Management is entitled to receive an annual management fee starting at 0.85% and declining to 0.68% as the average daily net assets of the Fund increase. Prior to March 1, 2017, Fund Management received an annual management fee which started at 0.90% and declined to 0.73% as the average daily net assets of the Fund increased. For the six months ended April 30, 2017, the management fee was equivalent to an annual rate of 0.88% of the Fund’s average daily net assets.
Funds Management has retained the services of certain subadvisers to provide daily portfolio management to the Fund. The fee for subadvisory services is borne by Funds Management. Artisan Partners Limited Partnership, LSV Asset Management and WellsCap are the subadvisers to the Fund and are each entitled to receive a fee from Funds Management which is calculated based on the average daily net assets of the Fund as follows:
| | | | | | | | |
| | | Annual subadvisory fee | |
| | | starting at | | | declining to | |
Artisan Partners Limited Partnership | | | 0.80 | % | | | 0.50 | % |
LSV Asset Management | | | 0.35 | | | | 0.30 | |
WellsCap | | | 0.45 | | | | 0.40 | |
Administration fees
Under a class-level administration agreement, Funds Management provides class-level administrative services to the Fund, which includes paying fees and expenses for services provided by the transfer agent, sub-transfer agents, omnibus account servicers and record-keepers. As compensation for its services under the class-level administration agreement, Funds Management receives an annual fee which is calculated based on the average daily net assets of each class as follows:
| | | | |
| | | Class-level
administration fee | |
Class A, Class B, Class C, Class R | | | 0.21 | % |
Class R6 | | | 0.03 | |
Administrator Class, Institutional Class | | | 0.13 | |
Funds Management has contractually waived and/or reimbursed management and administration fees to the extent necessary to maintain certain net operating expense ratios for the Fund. Waiver of fees and/or reimbursement of expenses by Funds Management were made first from fund level expenses on a proportionate basis and then from class specific expenses. Funds Management has committed through February 28, 2018 to waive fees and/or reimburse expenses to the extent necessary to cap the Fund’s expenses at 1.35% for Class A shares, 2.10% for Class C shares, 1.60% for Class R shares, 0.89% for Class R6 shares, 1.25% for Administrator Class shares, and 0.99% for Institutional Class shares. After this time, the cap may be increased or the commitment to maintain the cap may be terminated only with the approval of the Board of Trustees.
| | | | |
| 30 | | Wells Fargo Diversified International Fund | | Notes to financial statements (unaudited) |
During the six months ended April 30, 2017, State Street Bank and Trust Company, the Fund’s custodian, reimbursed the Fund $19,158 for certain out-of-pocket expenses that were billed to the Fund in error from 1998-2015. This amount is included in dividend income on the Statement of Operations. In addition, Funds Management was also reimbursed $68,706 for waivers/reimbursements it made to the Fund during the period the Fund was erroneously billed.
Distribution fees
The Trust has adopted a distribution plan for Class B, Class C, and Class R shares of the Fund pursuant to Rule 12b-1 under the 1940 Act. Distribution fees are charged to Class B, Class C, and Class R shares and paid to Wells Fargo Funds Distributor, LLC (“Funds Distributor”), the principal underwriter, at an annual rate of 0.75% of the average daily net assets of Class B and Class C shares and 0.25% of the average daily net assets of Class R shares.
In addition, Funds Distributor is entitled to receive the front-end sales charge from the purchase of Class A shares and a contingent deferred sales charge on the redemption of certain Class A shares. Funds Distributor is also entitled to receive the contingent deferred sales charges from redemptions of Class B and Class C shares. For the six months ended April 30, 2017, Funds Distributor received $243 from the sale of Class A shares.
Shareholder servicing fees
The Trust has entered into contracts with one or more shareholder servicing agents, whereby Class A, Class B, Class C, Class R, and Administrator Class of the Fund are charged a fee at an annual rate of 0.25% of the average daily net assets of each respective class.
A portion of these total shareholder servicing fees were paid to affiliates of Wells Fargo.
5. INVESTMENT PORTFOLIO TRANSACTIONS
Purchases and sales of investments, excluding U.S. government obligations (if any) and short-term securities, for the six months ended April 30, 2017 were $48,412,772 and $46,813,215, respectively.
The Fund may purchase or sell investment securities to other Wells Fargo affiliates pursuant to Rule 17a-7 of the 1940 Act and under procedures adopted by the Board of Trustees. The procedures have been designed to ensure that these interfund transactions, which do not incur broker commissions, are effected at current market prices. Interfund trades are included within the respective purchases and sales amounts shown.
6. DERIVATIVE TRANSACTIONS
During the six months ended April 30, 2017, the Fund entered into forward foreign currency contracts for economic hedging purposes.
At April 30, 2017, the Fund had forward foreign currency contracts outstanding as follows:
Forward foreign currency contracts to buy:
| | | | | | | | | | | | | | | | | | |
| Exchange date | | Counterparty | | Contracts to
receive | | | U.S. value at April 30, 2017 | | | In exchange
for U.S. $ | | | Unrealized
gains | |
| 5-31-2017 | | Barclays | | | 1,090,000 | EUR | | $ | 1,188,928 | | | $ | 1,157,915 | | | $ | 31,013 | |
| 5-31-2017 | | Barclays | | | 32,000 | EUR | | | 34,904 | | | | 34,206 | | | | 698 | |
| 6-15-2017 | | Goldman Sachs | | | 2,343,800 | EUR | | | 2,558,545 | | | | 2,508,112 | | | | 50,433 | |
Forward foreign currency contracts to sell:
| | | | | | | | | | | | | | | | | | |
| Exchange date | | Counterparty | | Contracts to
deliver | | | U.S. value at April 30, 2017 | | | In exchange for U.S. $ | | | Unrealized
losses | |
| 5-31-2017 | | Barclays | | | 1,740,000 | EUR | | $ | 1,897,922 | | | $ | 1,853,653 | | | $ | (44,269 | ) |
| 6-15-2017 | | Goldman Sachs | | | 2,343,800 | EUR | | | 2,558,545 | | | | 2,508,862 | | | | (49,683 | ) |
| 6-22-2017 | | Morgan Stanley | | | 595,000 | GBP | | | 771,743 | | | | 737,547 | | | | (34,196 | ) |
| 7-13-2017 | | Credit Suisse | | | 600,000 | EUR | | | 655,960 | | | | 639,224 | | | | (16,736 | ) |
The Fund had average contract amounts of $1,163,069 and $5,898,642 in forward foreign currency contracts to buy and forward foreign currency contracts to sell, respectively, during the six months ended April 30, 2017.
The fair value, realized gains or losses and change in unrealized gains or losses, if any, on derivative instruments are reflected in the corresponding financial statement captions.
| | | | | | |
| Notes to financial statements (unaudited) | | Wells Fargo Diversified International Fund | | | 31 | |
For certain types of derivative transactions, the Fund has entered into International Swaps and Derivatives Association, Inc. master agreements (“ISDA Master Agreements”) or similar agreements with approved counterparties. The ISDA Master Agreements or similar agreements may have requirements to deliver/deposit securities or cash to/with an exchange or broker-dealer as collateral and allows the Fund to offset, with each counterparty, certain derivative financial instrument’s assets and/or liabilities with collateral held or pledged. Collateral requirements differ by type of derivative. Collateral or margin requirements are set by the broker or exchange clearing house for exchange traded derivatives while collateral terms are contract specific for over-the-counter traded derivatives. Cash collateral that has been pledged to cover obligations of the Fund under ISDA Master Agreements or similar agreements, if any, are reported separately in the Statement of Assets and Liabilities. Securities pledged as collateral, if any, are noted in the Portfolio of Investments. With respect to balance sheet offsetting, absent an event of default by the counterparty or a termination of the agreement, the reported amounts of financial assets and financial liabilities in the Statement of Assets and Liabilities are not offset across transactions between the Fund and the applicable counterparty. A reconciliation of the gross amounts on the Statement of Assets and Liabilities to the net amounts by derivative type, including any collateral exposure, is as follows:
| | | | | | | | | | | | | | | | | | |
| Derivative type | | Counterparty | | Gross amounts
of assets in the
Statement of
Assets and
Liabilities | | | Amounts
subject to
netting
agreements | | | Collateral
received | | | Net amount
of assets | |
Forward foreign currency contracts | | Barclays | | $ | 31,711 | * | | $ | (31,711 | ) | | $ | 0 | | | $ | 0 | |
| | Goldman Sachs | | | 50,433 | * | | | (49,683 | ) | | | 0 | | | | 750 | |
| * | Amount represents net unrealized gains. |
| | | | | | | | | | | | | | | | | | |
| Derivative type | | Counterparty | | Gross amounts
of liabilities in the
Statement of
Assets and
Liabilities | | | Amounts
subject to
netting
agreements | | | Collateral
pledged | | | Net amount
of liabilities | |
Forward foreign currency contracts | | Barclays | | $ | 44,269 | ** | | $ | (31,711 | ) | | $ | 0 | | | $ | 12,558 | |
| | Goldman Sachs | | | 49,683 | ** | | | (49,683 | ) | | | 0 | | | | 0 | |
| | Morgan Stanley | | | 34,196 | ** | | | 0 | | | | 0 | | | | 34,196 | |
| | Credit Suisse | | | 16,736 | ** | | | 0 | | | | 0 | | | | 16,736 | |
| ** | Amount represents net unrealized losses. |
7. BANK BORROWINGS
The Trust (excluding the money market funds and certain other funds) and Wells Fargo Variable Trust are parties to a $250,000,000 revolving credit agreement whereby the Fund is permitted to use bank borrowings for temporary or emergency purposes, such as to fund shareholder redemption requests. Interest under the credit agreement is charged to the Fund based on a borrowing rate equal to the higher of the Federal Funds rate in effect on that day plus 1.25% or the overnight LIBOR rate in effect on that day plus 1.25%. In addition, an annual commitment fee equal to 0.25% of the unused balance is allocated to each participating fund.
For the six months ended April 30, 2017, there were no borrowings by the Fund under the agreement.
8. CONCENTRATION RISK
Concentration risks result from exposure to a limited number of sectors. A fund that invests a substantial portion of its assets in any sector may be more affected by changes in that sector than would be a fund whose investments are not heavily weighted in any sector.
9. INDEMNIFICATION
Under the Trust’s organizational documents, the officers and Trustees have been granted certain indemnification rights against certain liabilities that may arise out of performance of their duties to the Trust. Additionally, in the normal course of business, the Trust may enter into contracts with service providers that contain a variety of indemnification clauses. The Trust’s maximum exposure under these arrangements is dependent on future claims that may be made against the Fund and, therefore, cannot be estimated.
| | | | |
| 32 | | Wells Fargo Diversified International Fund | | Notes to financial statements (unaudited) |
10. NEW ACCOUNTING PRONOUNCEMENT
In December 2016, FASB issued Accounting Standards Update (“ASU”) No. 2016-19, Technical Corrections and Improvements. ASU 2016-19 includes an amendment to FASB ASC Topic 820, Fair Value Measurement which clarifies the difference between a valuation approach and a valuation technique. The amendment also requires an entity to disclose when there has been a change in either or both a valuation approach and/or a valuation technique. The disclosure requirements are effective for fiscal years and interim periods within those fiscal years beginning after December 15, 2016. Management is currently evaluating the potential impact of this new guidance to the financial statements.
11. REGULATORY CHANGES
In October 2016, the Securities and Exchange Commission (“SEC”) adopted new rules and forms and amended existing rules and forms (together, “final rules”) intended to modernize and enhance the reporting and disclosure of information by registered investment companies and to enhance liquidity risk management by open-end mutual funds and exchange-traded funds. The final rules will enhance the quality of information available to investors and will allow the SEC to more effectively collect and use data reported by funds. In part, the final rules amend Regulation S-X and require standardized, enhanced disclosure about derivatives in the Fund’s financial statements, as well as other amendments. The compliance date for the amendments to Regulation S-X is August 1, 2017 while the compliance date for the new form types is June 1, 2018 and the compliance date for the liquidity risk management program requirements is December 1, 2018. Management is currently assessing the potential impact of these enhancements and their impact on the financial statement disclosures and reporting requirements.
| | | | | | |
| Other information (unaudited) | | Wells Fargo Diversified International Fund | | | 33 | |
TAX INFORMATION
Pursuant to Section 853 of the Internal Revenue Code, the following amounts have been designated as foreign taxes paid for the fiscal year ended October 31, 2016. These amounts may be less than the actual foreign taxes paid for financial statement purposes. Foreign taxes paid or withheld should be included in taxable income with an offsetting deduction from gross income or as a credit for taxes paid to foreign governments. None of the income was derived from ineligible foreign sources as defined under Section 901(j) of the Internal Revenue Code.
| | | | |
Creditable
foreign taxes paid | | Per share
amount | | Foreign
income as % of
ordinary income
distributions |
| $225,076 | | $0.0229 | | 89.80% |
PROXY VOTING INFORMATION
A description of the policies and procedures that the Fund uses to determine how to vote proxies relating to portfolio securities is available, upon request, by calling 1-800-222-8222, visiting our website at wellsfargofunds.com, or visiting the SEC website at sec.gov. Information regarding how the Fund voted proxies relating to portfolio securities during the most recent 12-month period ended June 30 is available on the Fund’s website at wellsfargofunds.com or by visiting the SEC website at sec.gov.
PORTFOLIO HOLDINGS INFORMATION
The complete portfolio holdings for the Fund are publicly available monthly on the Fund’s website (wellsfargofunds.com), on a one-month delayed basis. In addition, top ten holdings information (excluding derivative positions) for the Fund is publicly available on the Fund’s website on a monthly, seven-day or more delayed basis. The Fund files its complete schedule of portfolio holdings with the SEC for the first and third quarters of each fiscal year on Form N-Q, which is available by visiting the SEC website at sec.gov. In addition, the Fund’s Form N-Q may be reviewed and copied at the SEC’s Public Reference Room in Washington, DC, and at regional offices in New York City, at 233 Broadway, and in Chicago, at 175 West Jackson Boulevard, Suite 900. Information about the Public Reference Room may be obtained by calling 1-800-SEC-0330.
| | | | |
| 34 | | Wells Fargo Diversified International Fund | | Other information (unaudited) |
BOARD OF TRUSTEES AND OFFICERS
Each of the Trustees and Officers1 listed in the table below acts in identical capacities for each fund in the Wells Fargo family of funds, which consists of 138 mutual funds comprising the Wells Fargo Funds Trust, Wells Fargo Variable Trust, Wells Fargo Master Trust and four closed-end funds (collectively the “Fund Complex”). This table should be read in conjunction with the Prospectus and the Statement of Additional Information2. The mailing address of each Trustee and Officer is 525 Market Street, 12th Floor, San Francisco, CA 94105. Each Trustee and Officer serves an indefinite term, however, each Trustee serves such term until reaching the mandatory retirement age established by the Trustees.
Independent Trustees
| | | | | | |
Name and year of birth | | Position held and length of service* | | Principal occupations during past five years or longer | | Current other
public company or
investment company directorships |
William R. Ebsworth (Born 1957) | | Trustee, since 2015 | | Retired. From 1984 to 2013, equities analyst, portfolio manager, research director and chief investment officer at Fidelity Management and Research Company in Boston, Tokyo, and Hong Kong and retired in 2013 as Chief Investment Officer of Fidelity Strategic Advisers, Inc. where he led a team of investment professionals managing client assets. Prior thereto, Board member of Hong Kong Securities Clearing Co., Hong Kong Options Clearing Corp., the Thailand International Fund, Ltd., Fidelity Investments Life Insurance Company, and Empire Fidelity Investments Life Insurance Company. Board member of the Forté Foundation (non-profit organization) and the Vincent Memorial Hospital Endowment (non-profit organization), where he serves on the Investment Committee and as a Chair of the Audit Committee. Mr. Ebsworth is a CFA® charterholder. | | Asset Allocation Trust |
| Jane A. Freeman (Born 1953) | | Trustee, since 2015 | | Retired. From 2012 to 2014 and 1999 to 2008, Chief Financial Officer of Scientific Learning Corporation. From 2008 to 2012, Ms. Freeman provided consulting services related to strategic business projects. Prior to 1999, Portfolio Manager at Rockefeller & Co. and Scudder, Stevens & Clark. Board member of the Harding Loevner Funds from 1996 to 2014, serving as both Lead Independent Director and chair of the Audit Committee. Board member of the Russell Exchange Traded Funds Trust from 2011 to 2012 and the chair of the Audit Committee. Ms. Freeman is a Board Member of Ruth Bancroft Garden (non-profit organization) and an inactive chartered financial analyst. | | Asset Allocation Trust |
| Peter G. Gordon** (Born 1942) | | Trustee, since 1998; Chairman, since 2005 | | Co-Founder, Retired Chairman, President and CEO of Crystal Geyser Water Company. Trustee Emeritus, Colby College. | | Asset Allocation Trust |
| Isaiah Harris, Jr. (Born 1952) | | Trustee, since 2009 | | Retired. Chairman of the Board of CIGNA Corporation since 2009, and Director since 2005. From 2003 to 2011, Director of Deluxe Corporation. Prior thereto, President and CEO of BellSouth Advertising and Publishing Corp. from 2005 to 2007, President and CEO of BellSouth Enterprises from 2004 to 2005 and President of BellSouth Consumer Services from 2000 to 2003. Emeritus member of the Iowa State University Foundation Board of Governors. Emeritus Member of the Advisory Board of Iowa State University School of Business. Advisory Board Member, Palm Harbor Academy (charter school). Advisory Board Member, Child Evangelism Fellowship (non-profit). Mr. Harris is a certified public accountant (inactive status). | | CIGNA Corporation; Asset Allocation Trust |
| Judith M. Johnson (Born 1949) | | Trustee, since 2008; Audit Committee Chairman, since 2008 | | Retired. Prior thereto, Chief Executive Officer and Chief Investment Officer of Minneapolis Employees Retirement Fund from 1996 to 2008. Ms. Johnson is an attorney, certified public accountant and a certified managerial accountant. | | Asset Allocation Trust |
| David F. Larcker (Born 1950) | | Trustee, since 2009 | | James Irvin Miller Professor of Accounting at the Graduate School of Business, Stanford University, Director of the Corporate Governance Research Initiative and Senior Faculty of The Rock Center for Corporate Governance since 2006. From 2005 to 2008, Professor of Accounting at the Graduate School of Business, Stanford University. Prior thereto, Ernst & Young Professor of Accounting at The Wharton School, University of Pennsylvania from 1985 to 2005. | | Asset Allocation Trust |
| | | | | | |
| Other information (unaudited) | | Wells Fargo Diversified International Fund | | | 35 | |
| | | | | | |
Name and year of birth | | Position held and length of service* | | Principal occupations during past five years or longer | | Current other
public company or
investment company directorships |
| Olivia S. Mitchell (Born 1953) | | Trustee, since 2006 | | International Foundation of Employee Benefit Plans Professor, Wharton School of the University of Pennsylvania since 1993. Director of Wharton’s Pension Research Council and Boettner Center on Pensions & Retirement Research, and Research Associate at the National Bureau of Economic Research. Previously, Cornell University Professor from 1978 to 1993. | | Asset Allocation Trust |
| Timothy J. Penny (Born 1951) | | Trustee, since 1996; Vice Chairman, since 2017 | | President and Chief Executive Officer of Southern Minnesota Initiative Foundation, a non-profit organization, since 2007 and Senior Fellow at the Humphrey Institute Policy Forum at the University of Minnesota since 1995. Member of the Board of Trustees of NorthStar Education Finance, Inc., a non-profit organization, since 2007. | | Asset Allocation Trust |
| Michael S. Scofield (Born 1943) | | Trustee, since 2010 | | Served on the Investment Company Institute’s Board of Governors and Executive Committee from 2008-2011 as well the Governing Council of the Independent Directors Council from 2006-2011 and the Independent Directors Council Executive Committee from 2008-2011. Chairman of the IDC from 2008-2010. Institutional Investor (Fund Directions) Trustee of Year in 2007. Trustee of the Evergreen Funds complex (and its predecessors) from 1984 to 2010. Chairman of the Evergreen Funds from 2000-2010. Former Trustee of the Mentor Funds. Retired Attorney, Law Offices of Michael S. Scofield. | | Asset Allocation Trust |
| * | Length of service dates reflect the Trustee’s commencement of service with the Trust’s predecessor entities, where applicable. |
| ** | Peter Gordon is expected to retire on December 31, 2017. |
Officers
| | | | | | |
Name and year of birth | | Position held and length of service | | Principal occupations during past five years or longer | | |
Andrew Owen (Born 1960) | | President, since 2017 | | Executive Vice President of Wells Fargo & Company and Head of Affiliated Managers, Wells Fargo Asset Management, since 2014. In addition, Mr. Owen is currently President, Chief Executive Officer and Director of Wells Fargo Funds Management, LLC since 2017. Prior thereto, Executive Vice President responsible for marketing, investments and product development for Wells Fargo Funds Management, LLC, from 2009 to 2014. | | |
| Jeremy DePalma1 (Born 1974) | | Treasurer, since 2012 | | Senior Vice President of Wells Fargo Funds Management, LLC since 2009. Senior Vice President of Evergreen Investment Management Company, LLC from 2008 to 2010 and head of the Fund Reporting and Control Team within Fund Administration from 2005 to 2010. | | |
| C. David Messman (Born 1960) | | Secretary, since 2000; Chief Legal Officer, since 2003 | | Senior Vice President and Secretary of Wells Fargo Funds Management, LLC since 2001. Assistant General Counsel of Wells Fargo Bank, N.A. since 2013 and Vice President and Managing Counsel of Wells Fargo Bank, N.A. from 1996 to 2013. | | |
| Michael Whitaker (Born 1967) | | Chief Compliance Officer, since 2016 | | Senior Vice President and Chief Compliance Officer since 2016. Senior Vice President and Chief Compliance Officer for Fidelity Investments from 2007 to 2016. | | |
David Berardi (Born 1975) | | Assistant Treasurer, since 2009 | | Vice President of Wells Fargo Funds Management, LLC since 2009. Vice President of Evergreen Investment Management Company, LLC from 2008 to 2010. Manager of Fund Reporting and Control for Evergreen Investment Management Company, LLC from 2004 to 2010. | | |
| 1 | Jeremy DePalma acts as Treasurer of 69 funds and Assistant Treasurer of 69 funds in the Fund Complex. |
| 2 | The Statement of Additional Information includes additional information about the Trustees and is available, without charge, upon request, by calling 1-800-222-8222 or by visiting the website at wellsfargofunds.com. |
| | | | |
| 36 | | Wells Fargo Diversified International Fund | | List of abbreviations |
The following is a list of common abbreviations for terms and entities that may have appeared in this report.
| ACA | — ACA Financial Guaranty Corporation |
| ADR | — American depositary receipt |
| ADS | — American depositary shares |
| AGC | — Assured Guaranty Corporation |
| AGM | — Assured Guaranty Municipal |
| Ambac | — Ambac Financial Group Incorporated |
| AMT | — Alternative minimum tax |
| BAN | — Bond anticipation notes |
| BHAC | — Berkshire Hathaway Assurance Corporation |
| CAB | — Capital appreciation bond |
| CCAB | — Convertible capital appreciation bond |
| CDA | — Community Development Authority |
| CDO | — Collateralized debt obligation |
| DRIVER | — Derivative inverse tax-exempt receipts |
| DW&P | — Department of Water & Power |
| DWR | — Department of Water Resources |
| ECFA | — Educational & Cultural Facilities Authority |
| EDA | — Economic Development Authority |
| EDFA | — Economic Development Finance Authority |
| ETF | — Exchange-traded fund |
| FDIC | — Federal Deposit Insurance Corporation |
| FFCB | — Federal Farm Credit Banks |
| FGIC | — Financial Guaranty Insurance Corporation |
| FHA | — Federal Housing Administration |
| FHLB | — Federal Home Loan Bank |
| FHLMC | — Federal Home Loan Mortgage Corporation |
| FICO | — The Financing Corporation |
| FNMA | — Federal National Mortgage Association |
| GDR | — Global depositary receipt |
| GNMA | — Government National Mortgage Association |
| HCFR | — Healthcare facilities revenue |
| HEFA | — Health & Educational Facilities Authority |
| HEFAR | — Higher education facilities authority revenue |
| HFA | — Housing Finance Authority |
| HFFA | — Health Facilities Financing Authority |
| HUD | — Department of Housing and Urban Development |
| IDA | — Industrial Development Authority |
| IDAG | — Industrial Development Agency |
| KRW | — Republic of Korea won |
| LIBOR | — London Interbank Offered Rate |
| LIFER | — Long Inverse Floating Exempt Receipts |
| LLC | — Limited liability company |
| LLLP | — Limited liability limited partnership |
| LLP | — Limited liability partnership |
| MBIA | — Municipal Bond Insurance Association |
| MFHR | — Multifamily housing revenue |
| MSTR | — Municipal securities trust receipts |
| MUD | — Municipal Utility District |
| National | — National Public Finance Guarantee Corporation |
| PCFA | — Pollution Control Financing Authority |
| PCL | — Public Company Limited |
| PCR | — Pollution control revenue |
| PFA | — Public Finance Authority |
| PFFA | — Public Facilities Financing Authority |
| PFOTER | — Puttable floating option tax-exempt receipts |
| plc | — Public limited company |
| PUTTER | — Puttable tax-exempt receipts |
| R&D | — Research & development |
| Radian | — Radian Asset Assurance |
| RAN | — Revenue anticipation notes |
| RDA | — Redevelopment Authority |
| RDFA | — Redevelopment Finance Authority |
| REIT | — Real estate investment trust |
| ROC | — Reset option certificates |
| SAVRS | — Select auction variable rate securities |
| SBA | — Small Business Authority |
| SDR | — Swedish depositary receipt |
| SFHR | — Single-family housing revenue |
| SFMR | — Single-family mortgage revenue |
| SPA | — Standby purchase agreement |
| SPDR | — Standard & Poor’s Depositary Receipts |
| SPEAR | — Short Puttable Exempt Adjustable Receipts |
| STRIPS | — Separate trading of registered interest and |
| TAN | — Tax anticipation notes |
| TIPS | — Treasury inflation-protected securities |
| TRAN | — Tax revenue anticipation notes |
| TTFA | — Transportation Trust Fund Authority |
| TVA | — Tennessee Valley Authority |

For more information
More information about Wells Fargo Funds is available free upon request. To obtain literature, please write, email, visit the Fund’s website, or call:
Wells Fargo Funds
P.O. Box 8266
Boston, MA 02266-8266
Email: fundservice@wellsfargo.com
Website: wellsfargofunds.com
Individual investors: 1-800-222-8222
Retail investment professionals: 1-888-877-9275
Institutional investment professionals: 1-866-765-0778
This report and the financial statements contained herein are submitted for the general information of the shareholders of the Fund. If this report is used for promotional purposes, distribution of the report must be accompanied or preceded by a current prospectus. Before investing, please consider the investment objectives, risks, charges, and expenses of the investment. For a current prospectus and, if available, a summary prospectus, containing this information, call 1-800-222-8222 or visit the Fund’s website at wellsfargofunds.com. Read the prospectus carefully before you invest or send money.
Wells Fargo Asset Management (WFAM) is a trade name used by the asset management businesses of Wells Fargo & Company. Wells Fargo Funds Management, LLC, a wholly owned subsidiary of Wells Fargo & Company, provides investment advisory and administrative services for Wells Fargo Funds. Other affiliates of Wells Fargo & Company provide subadvisory and other services for the funds. The funds are distributed by Wells Fargo Funds Distributor, LLC, Member FINRA, an affiliate of Wells Fargo & Company. Neither Wells Fargo Funds Management nor Wells Fargo Funds Distributor has Fund customer accounts/assets, and neither provides investment advice/recommendations or acts as an investment advice fiduciary to any investor.
NOT FDIC INSURED ◾ NO BANK GUARANTEE ◾ MAY LOSE VALUE
© 2017 Wells Fargo Funds Management, LLC. All rights reserved.
| | |
 | | 303213 06-17 SA237/SAR237 04-17 |
Semi-Annual Report
April 30, 2017

Wells Fargo Emerging Markets Equity Fund


Reduce clutter. Save trees.
Sign up for electronic delivery of prospectuses and shareholder reports at wellsfargo.com/advantagedelivery
Contents
The views expressed and any forward-looking statements are as of April 30, 2017, unless otherwise noted, and are those of the Fund managers and/or Wells Fargo Funds Management, LLC. Discussions of individual securities, or the markets generally, or any Wells Fargo Fund are not intended as individual recommendations. Future events or results may vary significantly from those expressed in any forward-looking statements. The views expressed are subject to change at any time in response to changing circumstances in the market. Wells Fargo Funds Management, LLC and the Fund disclaim any obligation to publicly update or revise any views expressed or forward-looking statements.
NOT FDIC INSURED ◾ NO BANK GUARANTEE ◾ MAY LOSE VALUE
| | | | |
| 2 | | Wells Fargo Emerging Markets Equity Fund | | Letter to shareholders (unaudited) |

Andrew Owen
President
Wells Fargo Funds
Despite heightened market volatility at times, in general, global stocks delivered double-digit returns while bond markets were hurt by a rise in interest rates during the latter part of 2016.
Dear Shareholder:
As the new president of Wells Fargo Funds, now that Karla Rabusch is retiring from that position after nearly 14 years, I am pleased to offer you this semi-annual report for the Wells Fargo Emerging Markets Equity Fund for the six-month period that ended April 30, 2017. Despite heightened market volatility at times, in general, global stocks delivered double-digit returns while bond markets were hurt by a rise in interest rates during the latter part of 2016. U.S. and international stocks returned 13.31% and 10.37% for the six-month period, respectively, as measured by the S&P 500 Index1 and the MSCI ACWI ex USA Index (Net)2; within fixed income, the Bloomberg Barclays U.S. Aggregate Bond Index3 returned -0.67%.
During the last two months of 2016, prospects for faster growth and higher interest rates in the U.S. influenced markets.
Following Donald Trump’s election as president in early November, U.S. stocks began to rally. Investors appeared optimistic that the new administration would usher in a series of progrowth policies, and supportive economic news helped the rally carry through the end of 2016. The buoyant environment sent interest rates higher as well. At its mid-December meeting, Fed officials raised their short-term target interest rate for the first time in a year by a quarter percentage point to between 0.50% and 0.75%. Outside of the U.S., the prospects for faster U.S. growth appeared to trigger some acceleration in Europe. The improvement may be partly attributable to expectations for further strengthening of the U.S. dollar, which in turn could improve demand for European goods in the U.S. due to weakening of the euro relative to the dollar. Rising inflation across the eurozone and Japan caused an upward shift in yield curves in those areas, although developed-country bond yields remained significantly lower than U.S. Treasury yields.
Globally, stocks delivered positive results and economies showed improvement in the first four months of 2017.
Stocks rallied globally, supported by signs of improvement in the U.S. and global economies. In the U.S., hiring remained strong and business and consumer sentiment improved. Meanwhile, inflation inched up. In March, Fed officials raised their short-term target interest rate by a quarter percentage point to between 0.75% and 1.00%. With the Fed’s target-rate increase, short-term bond yields rose. Longer-term Treasury yields were little changed, however, leading to positive performance. Investment-grade corporate bonds and high-yield bonds benefited from strong demand. Municipal bond returns were also positive during the first four months of 2017, helped by strong demand and constrained new-issue supply. Outside the U.S., stocks in emerging markets benefited from both global economic growth and recent weakening in the U.S. dollar. European stocks also advanced as political risk declined. In the first round of the French presidential elections, Emmanuel Macron, a pro-EU candidate, garnered the most votes. Non-U.S. bonds also benefited from a decline in perceived risk, with credit spreads continuing to narrow.
| 1 | The S&P 500 Index consists of 500 stocks chosen for market size, liquidity, and industry group representation. It is a market-value-weighted index with each stock’s weight in the index proportionate to its market value. You cannot invest directly in an index. |
| 2 | The Morgan Stanley Capital International (MSCI) All Country World Index (ACWI) ex USA Index (Net) is a free-float-adjusted market-capitalization-weighted index that is designed to measure the equity market performance of developed markets, excluding the United States and Canada. Source: MSCI. MSCI makes no express or implied warranties or representations and shall have no liability whatsoever with respect to any MSCI data contained herein. The MSCI data may not be further redistributed or used as a basis for other indexes or any securities or financial products. This report is not approved, reviewed, or produced by MSCI. You cannot invest directly in an index. |
| 3 | The Bloomberg Barclays U.S. Aggregate Bond Index (formerly known as Barclays U.S. Aggregate Bond Index) is a broad-based benchmark that measures the investment-grade, U.S. dollar–denominated, fixed-rate taxable bond market, including Treasuries, government-related and corporate securities, mortgage-backed securities (agency fixed-rate and hybrid adjustable-rate mortgage pass-throughs), asset-backed securities, and commercial mortgage-backed securities. You cannot invest directly in an index. |
| | | | | | |
| Letter to shareholders (unaudited) | | Wells Fargo Emerging Markets Equity Fund | | | 3 | |
Don’t let short-term uncertainty derail long-term investment goals.
Periods of uncertainty can present challenges, but experience has taught us that maintaining long-term investment goals can be an effective way to plan for the future. To help you create a sound strategy based on your personal goals and risk tolerance, Wells Fargo Funds offers more than 100 mutual funds spanning a wide range of asset classes and investment styles. Although diversification cannot guarantee an investment profit or prevent losses, we believe it can be an effective way to manage investment risk and potentially smooth out overall portfolio performance. We encourage investors to know their investments and to understand that appropriate levels of risk-taking may unlock opportunities.
Thank you for choosing to invest in Wells Fargo Funds. We appreciate your confidence in us and remain committed to helping you meet your financial needs.
Sincerely,

Andrew Owen
President
Wells Fargo Funds
Although diversification cannot guarantee an investment profit or prevent losses, we believe it can be an effective way to manage investment risk and potentially smooth out overall portfolio performance.
For further information about your Fund, contact your investment professional, visit our website at wellsfargofunds.com, or call us directly at 1-800-222-8222. We are available 24 hours a day, 7 days a week.
| | | | |
| 4 | | Wells Fargo Emerging Markets Equity Fund | | Performance highlights (unaudited) |
Investment objective
The Fund seeks long-term capital appreciation.
Manager
Wells Fargo Funds Management, LLC
Subadviser
Wells Capital Management Incorporated
Portfolio managers
Derrick Irwin, CFA®
Richard Peck, CFA®
Yi (Jerry) Zhang, Ph.D., CFA®
Average annual total returns (%) as of April 30, 20171
| | | | | | | | | | | | | | | | | | | | | | | | | | | | | | | | | | |
| | | | | Including sales charge | | | Excluding sales charge | | | Expense ratios2 (%) | |
| | | Inception date | | 1 year | | | 5 year | | | 10 year | | | 1 year | | | 5 year | | | 10 year | | | Gross | | | Net3 | |
| Class A (EMGAX) | | 9-6-1994 | | | 13.53 | | | | 0.40 | | | | 2.73 | | | | 20.44 | | | | 1.60 | | | | 3.34 | | | | 1.60 | | | | 1.58 | |
| Class B (EMGBX)* | | 9-6-1994 | | | 14.45 | | | | 0.44 | | | | 2.81 | | | | 19.45 | | | | 0.83 | | | | 2.81 | | | | 2.35 | | | | 2.33 | |
| Class C (EMGCX) | | 9-6-1994 | | | 18.47 | | | | 0.83 | | | | 2.57 | | | | 19.47 | | | | 0.83 | | | | 2.57 | | | | 2.35 | | | | 2.33 | |
| Class R6 (EMGDX) | | 6-28-2013 | | | – | | | | – | | | | – | | | | 20.93 | | | | 2.06 | | | | 3.75 | | | | 1.17 | | | | 1.15 | |
| Administrator Class (EMGYX) | | 9-6-1994 | | | – | | | | – | | | | – | | | | 20.53 | | | | 1.75 | | | | 3.54 | | | | 1.52 | | | | 1.46 | |
| Institutional Class (EMGNX) | | 7-30-2010 | | | – | | | | – | | | | – | | | | 20.81 | | | | 2.01 | | | | 3.73 | | | | 1.27 | | | | 1.19 | |
| MSCI EM Index (Net)4 | | – | | | – | | | | – | | | | – | | | | 19.13 | | | | 1.49 | | | | 2.48 | | | | – | | | | – | |
| *At | | the close of business on May 5, 2017, existing Class B shareholders were converted to Class A shareholders. Effective May 6, 2017, Class B shares are no longer offered by the Fund. |
Figures quoted represent past performance, which is no guarantee of future results, and do not reflect taxes that a shareholder may pay on fund distributions or the redemption of fund shares. Investment return and principal value of an investment will fluctuate so that an investor’s shares, when redeemed, may be worth more or less than their original cost. Performance shown without sales charges would be lower if sales charges were reflected. Current performance may be lower or higher than the performance data quoted, which assumes the reinvestment of dividends and capital gains. Current month-end performance is available on the Fund’s website, wellsfargofunds.com.
Index returns do not include transaction costs associated with buying and selling securities, any mutual fund fees or expenses, or any taxes. It is not possible to invest directly in an index.
For Class A shares, the maximum front-end sales charge is 5.75%. For Class B shares, the maximum contingent deferred sales charge is 5.00%. For Class C shares, the maximum contingent deferred sales charge is 1.00%. Performance including a contingent deferred sales charge assumes the sales charge for the corresponding time period. Class R6, Administrator Class, and Institutional Class shares are sold without a front-end sales charge or contingent deferred sales charge.
Stock values fluctuate in response to the activities of individual companies and general market and economic conditions. Foreign investments are especially volatile and can rise or fall dramatically due to differences in the political and economic conditions of the host country. These risks are generally intensified in emerging markets. The use of derivatives may reduce returns and/or increase volatility. Certain investment strategies tend to increase the total risk of an investment (relative to the broader market). The Fund is exposed to smaller-company securities risk. Consult the Fund’s prospectus for additional information on these and other risks.
Please see footnotes on page 5.
| | | | | | |
| Performance highlights (unaudited) | | Wells Fargo Emerging Markets Equity Fund | | | 5 | |
| | | | |
| Ten largest holdings (%) as of April 30, 20175 | |
Samsung Electronics Company Limited | | | 5.64 | |
Taiwan Semiconductor Manufacturing Company
Limited ADR | | | 3.10 | |
China Mobile Limited | | | 2.75 | |
Fomento Economico Mexicano SAB de CV ADR | | | 2.22 | |
China Life Insurance Company Limited H Shares | | | 2.19 | |
SINA Corporation | | | 2.14 | |
New Oriental Education & Technology Group Incorporated ADR | | | 1.99 | |
Uni-President Enterprises Corporation | | | 1.93 | |
WH Group Limited | | | 1.91 | |
AIA Group Limited | | | 1.85 | |
|
| Sector distribution as of April 30, 20176 |
|
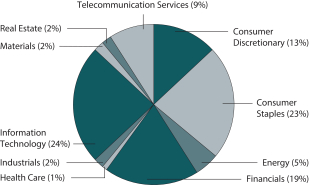
|
|
| Country allocation as of April 30, 20176 |
|
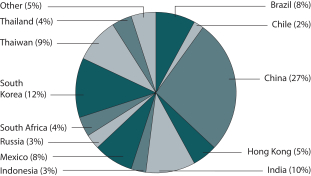 |
| 1 | Historical performance shown for Class R6 shares prior to their inception reflects the performance of Institutional Class shares and includes the higher expenses applicable to Institutional Class shares. If these expenses had not been included, returns for Class R6 shares would have been higher. Historical performance shown for Institutional Class shares prior to their inception reflects the performance of Administrator Class shares and includes the higher expenses applicable to Administrator Class shares. If these expenses had not been included, returns for Institutional Class shares would be higher. Historical performance shown for all classes of the Fund prior to July 19, 2010, is based on the performance of the Fund’s predecessor, Evergreen Emerging Markets Growth Fund. |
| 2 | Reflects the expense ratios as stated in the most recent prospectuses. The expense ratios shown are subject to change and may differ from the annualized expense ratios shown in the financial highlights of this report. |
| 3 | The manager has contractually committed through February 28, 2018 to waive fees and/or reimburse expenses to the extent necessary to cap the Fund’s Total Annual Operating Expenses After Fee Waiver at the amounts shown. After this time, the cap may be increased or the commitment to maintain the cap may be terminated only with the approval of the Board of Trustees. Brokerage commissions, stamp duty fees, interest, taxes, acquired fund fees and expenses, and extraordinary expenses are excluded from the expense cap. Without this cap, the Fund’s returns would have been lower. The expense ratio paid by an investor is the net expense ratio or the Fund’s Total Annual Fund Operating Expenses After Fee Waivers, as stated in the prospectuses. |
| 4 | The Morgan Stanley Capital International (MSCI) Emerging Markets (EM) Index (Net) is a free-float-adjusted market-capitalization-weighted index that is designed to measure the equity market performance of emerging markets. The MSCI EM Index (Net) consists of the following 23 emerging markets country indexes: Brazil, Chile, China, Colombia, Czech Republic, Egypt, Greece, Hungary, India, Indonesia, Korea, Malaysia, Mexico, Peru, the Philippines, Poland, Qatar, Russia, South Africa, Taiwan, Thailand, Turkey, and United Arab Emirates. Source: MSCI. MSCI makes no express or implied warranties or representations and shall have no liability whatsoever with respect to any MSCI data contained herein. The MSCI data may not be further redistributed or used as a basis for other indexes or any securities or financial products. This report is not approved, reviewed, or produced by MSCI. You cannot invest directly in an index. |
| 5 | The ten largest holdings, excluding cash and cash equivalents, are calculated based on the value of the investments divided by total net assets of the Fund. Holdings are subject to change and may have changed since the date specified. |
| 6 | Amounts are calculated based on the total long-term investments of the Fund. These amounts are subject to change and may have changed since the date specified. |
| | | | |
| 6 | | Wells Fargo Emerging Markets Equity Fund | | Fund expenses (unaudited) |
As a shareholder of the Fund, you incur two types of costs: (1) transaction costs, including sales charges (loads) on purchase payments and contingent deferred sales charges (if any) on redemptions and (2) ongoing costs, including management fees, distribution (12b-1) and/or shareholder servicing fees, and other Fund expenses. This example is intended to help you understand your ongoing costs (in dollars) of investing in the Fund and to compare these costs with the ongoing costs of investing in other mutual funds.
The example is based on an investment of $1,000 invested at the beginning of the six-month period and held for the entire period from November 1, 2016 to April 30, 2017.
Actual expenses
The “Actual” line of the table below provides information about actual account values and actual expenses. You may use the information in this line, together with the amount you invested, to estimate the expenses that you paid over the period. Simply divide your account value by $1,000 (for example, an $8,600 account value divided by $1,000 = 8.6), then multiply the result by the number in the “Actual” line under the heading entitled “Expenses paid during period” for your applicable class of shares to estimate the expenses you paid on your account during this period.
Hypothetical example for comparison purposes
The “Hypothetical” line of the table below provides information about hypothetical account values and hypothetical expenses based on the Fund’s actual expense ratio and an assumed rate of return of 5% per year before expenses, which is not the Fund’s actual return. The hypothetical account values and expenses may not be used to estimate the actual ending account balance or expenses you paid for the period. You may use this information to compare the ongoing costs of investing in the Fund and other funds. To do so, compare this 5% hypothetical example with the 5% hypothetical examples that appear in the shareholder reports of the other funds.
Please note that the expenses shown in the table are meant to highlight your ongoing costs only and do not reflect any transactional costs, such as sales charges (loads) and contingent deferred sales charges. Therefore, the “Hypothetical” line of the table is useful in comparing ongoing costs only and will not help you determine the relative total costs of owning different funds. In addition, if these transactional costs were included, your costs would have been higher.
| | | | | | | | | | | | | | | | |
| | | Beginning
account value
11-1-2016 | | | Ending
account value
4-30-2017 | | | Expenses
paid during
the period¹ | | | Annualized net
expense ratio | |
Class A | | | | | | | | | | | | | | | | |
Actual | | $ | 1,000.00 | | | $ | 1,080.41 | | | $ | 8.20 | | | | 1.59 | % |
Hypothetical (5% return before expenses) | | $ | 1,000.00 | | | $ | 1,016.91 | | | $ | 7.95 | | | | 1.59 | % |
Class B | | | | | | | | | | | | | | | | |
Actual | | $ | 1,000.00 | | | $ | 1,075.82 | | | $ | 12.04 | | | | 2.34 | % |
Hypothetical (5% return before expenses) | | $ | 1,000.00 | | | $ | 1,013.19 | | | $ | 11.68 | | | | 2.34 | % |
Class C | | | | | | | | | | | | | | | | |
Actual | | $ | 1,000.00 | | | $ | 1,075.81 | | | $ | 12.04 | | | | 2.34 | % |
Hypothetical (5% return before expenses) | | $ | 1,000.00 | | | $ | 1,013.19 | | | $ | 11.68 | | | | 2.34 | % |
Class R6 | | | | | | | | | | | | | | | | |
Actual | | $ | 1,000.00 | | | $ | 1,082.49 | | | $ | 5.99 | | | | 1.16 | % |
Hypothetical (5% return before expenses) | | $ | 1,000.00 | | | $ | 1,019.04 | | | $ | 5.81 | | | | 1.16 | % |
Administrator Class | | | | | | | | | | | | | | | | |
Actual | | $ | 1,000.00 | | | $ | 1,080.99 | | | $ | 7.64 | | | | 1.48 | % |
Hypothetical (5% return before expenses) | | $ | 1,000.00 | | | $ | 1,017.46 | | | $ | 7.40 | | | | 1.48 | % |
Institutional Class | | | | | | | | | | | | | | | | |
Actual | | $ | 1,000.00 | | | $ | 1,081.98 | | | $ | 6.25 | | | | 1.21 | % |
Hypothetical (5% return before expenses) | | $ | 1,000.00 | | | $ | 1,018.79 | | | $ | 6.06 | | | | 1.21 | % |
| 1 | Expenses paid is equal to the annualized net expense ratio of each class multiplied by the average account value over the period, multiplied by the number of days in the most recent fiscal half-year divided by the number of days in the fiscal year (to reflect the one-half-year period). |
| | | | | | |
| Portfolio of investments—April 30, 2017 (unaudited) | | Wells Fargo Emerging Markets Equity Fund | | | 7 | |
| | | | | | | | | | | | | | | | |
| Security name | | | | | | | | Shares | | | Value | |
| | | | |
Common Stocks: 94.97% | | | | | | | | | | | | | | | | |
| | | | |
| Argentina: 0.54% | | | | | | | | | | | | | | | | |
MercadoLibre Incorporated (Information Technology, Internet Software & Services) | | | | | | | | | | | 76,300 | | | $ | 17,465,833 | |
| | | | | | | | | | | | | | | | |
| | | | |
| Brazil: 5.99% | | | | | | | | | | | | | | | | |
Ambev SA ADR (Consumer Staples, Beverages) | | | | | | | | | | | 5,922,000 | | | | 33,933,060 | |
B2W Companhia Digital (Consumer Discretionary, Internet & Direct Marketing Retail) † | | | | | | | | | | | 3,001,424 | | | | 12,652,306 | |
B2W Companhia Digital Interim Shares (Consumer Discretionary, Internet & Direct Marketing Retail) †(a) | | | | | | | | | | | 964,063 | | | | 3,988,011 | |
Banco Bradesco SA ADR (Financials, Banks) | | | | | | | | | | | 3,111,773 | | | | 32,829,205 | |
BM&F Bovespa SA (Financials, Capital Markets) | | | | | | | | | | | 6,663,006 | | | | 39,906,030 | |
BRF Brazil Foods SA ADR (Consumer Staples, Food Products) « | | | | | | | | | | | 1,076,078 | | | | 13,386,410 | |
Lojas Renner SA (Consumer Discretionary, Multiline Retail) | | | | | | | | | | | 2,867,500 | | | | 26,723,161 | |
Multiplan Empreendimentos Imobiliarios SA (Real Estate, Real Estate Management & Development) | | | | | | | | | | | 797,302 | | | | 17,005,827 | |
Raia Drogasil SA (Consumer Staples, Food & Staples Retailing) | | | | | | | | | | | 701,600 | | | | 14,909,318 | |
| | | | |
| | | | | | | | | | | | | | | 195,333,328 | |
| | | | | | | | | | | | | | | | |
| | | | |
| Chile: 2.08% | | | | | | | | | | | | | | | | |
AES Gener SA (Utilities, Independent Power & Renewable Electricity Producers) | | | | | | | | | | | 16,613,250 | | | | 6,247,969 | |
Banco Santander Chile SA ADR (Financials, Banks) | | | | | | | | | | | 1,294,392 | | | | 30,586,483 | |
SACI Falabella (Consumer Discretionary, Multiline Retail) | | | | | | | | | | | 3,867,228 | | | | 30,814,750 | |
| | | | |
| | | | | | | | | | | | | | | 67,649,202 | |
| | | | | | | | | | | | | | | | |
| | | | |
| China: 25.99% | | | | | | | | | | | | | | | | |
51Job Incorporated ADR (Industrials, Professional Services) † | | | | | | | | | | | 833,941 | | | | 34,183,242 | |
Alibaba Group Holding Limited ADR (Information Technology, Internet Software & Services) † | | | | | | | | | | | 304,037 | | | | 35,116,274 | |
Baidu Incorporated ADR (Information Technology, Internet Software & Services) † | | | | | | | | | | | 109,540 | | | | 19,742,394 | |
Belle International Holdings Limited (Consumer Discretionary, Textiles, Apparel & Luxury Goods) (a) | | | | | | | | | | | 52,059,000 | | | | 39,981,568 | |
China Distance Education ADR (Consumer Discretionary, Diversified Consumer Services) | | | | | | | | | | | 973,710 | | | | 9,902,631 | |
China International Capital Corporation Limited H Shares (Financials, Diversified Financial Services) | | | | | | | | | | | 1,334,904 | | | | 1,973,606 | |
China Life Insurance Company Limited H Shares (Financials, Insurance) | | | | | | | | | | | 23,518,290 | | | | 71,507,140 | |
China Mobile Limited (Telecommunication Services, Wireless Telecommunication Services) | | | | | | | | | | | 8,400,165 | | | | 89,581,169 | |
China Rapid Finance Limited ADR (Financials, Consumer Finance) † | | | | | | | | | | | 838,004 | | | | 5,072,613 | |
CNOOC Limited (Energy, Oil, Gas & Consumable Fuels) | | | | | | | | | | | 24,574,000 | | | | 28,654,686 | |
Ctrip.com International Limited ADR (Consumer Discretionary, Internet & Direct Marketing Retail) † | | | | | | | | | | | 1,055,632 | | | | 53,319,972 | |
Gridsum Holding Incorporated ADR (Information Technology, Software) † | | | | | | | | | | | 391,040 | | | | 4,798,061 | |
Hengan International Group Company Limited (Consumer Staples, Personal Products) | | | | | | | | | | | 4,527,000 | | | | 33,872,402 | |
Li Ning Company Limited (Consumer Discretionary, Textiles, Apparel & Luxury Goods) † | | | | | | | | | | | 25,884,207 | | | | 17,037,950 | |
New Oriental Education & Technology Group Incorporated ADR (Consumer Discretionary, Diversified Consumer Services) † | | | | | | | | | | | 1,005,413 | | | | 64,889,355 | |
PetroChina Company Limited H Shares (Energy, Oil, Gas & Consumable Fuels) | | | | | | | | | | | 11,566,000 | | | | 8,148,474 | |
Shandong Weigao Group Medical Polymer Company Limited H Shares (Health Care, Health Care Equipment & Supplies) | | | | | | | | | | | 18,024,000 | | | | 13,138,529 | |
SINA Corporation (Information Technology, Internet Software & Services) | | | | | | | | | | | 909,907 | | | | 69,889,957 | |
Tencent Holdings Limited (Information Technology, Internet Software & Services) | | | | | | | | | | | 1,678,800 | | | | 52,532,982 | |
Tingyi Holding Corporation (Consumer Staples, Food Products) | | | | | | | | | | | 11,698,000 | | | | 15,024,140 | |
Tsingtao Brewery Company Limited H Shares (Consumer Staples, Beverages) | | | | | | | | | | | 7,690,000 | | | | 34,602,454 | |
Vipshop Holdings Limited ADR (Consumer Discretionary, Internet & Direct Marketing Retail) † | | | | | | | | | | | 4,034,738 | | | | 55,961,816 | |
Want Want China Holdings Limited (Consumer Staples, Food Products) | | | | | | | | | | | 34,604,000 | | | | 24,913,047 | |
Weibo Corporation ADR (Information Technology, Internet Software & Services) †« | | | | | | | | | | | 810,336 | | | | 45,265,369 | |
Zhou Hei Ya International Holding Company Limited (Consumer Staples, Food Products) « | | | | | | | | | | | 17,203,626 | | | | 18,224,672 | |
| | | | |
| | | | | | | | | | | | | | | 847,334,503 | |
| | | | | | | | | | | | | | | | |
The accompanying notes are an integral part of these financial statements.
| | | | |
| 8 | | Wells Fargo Emerging Markets Equity Fund | | Portfolio of investments—April 30, 2017 (unaudited) |
| | | | | | | | | | | | | | | | |
| Security name | | | | | | | | Shares | | | Value | |
| | | | |
| Colombia: 0.52% | | | | | | | | | | | | | | | | |
Bancolombia SA ADR (Financials, Banks) | | | | | | | | | | | 432,400 | | | $ | 17,075,476 | |
| | | | | | | | | | | | | | | | |
| | | | |
| Hong Kong: 4.98% | | | | | | | | | | | | | | | | |
AIA Group Limited (Financials, Insurance) | | | | | | | | | | | 8,691,400 | | | | 60,171,102 | |
Johnson Electric Holdings Limited (Industrials, Electrical Equipment) | | | | | | | | | | | 4,214,250 | | | | 12,975,925 | |
Sun Art Retail Group Limited (Consumer Staples, Food & Staples Retailing) | | | | | | | | | | | 25,490,500 | | | | 26,282,413 | |
WH Group Limited (Consumer Staples, Food Products) 144A | | | | | | | | | | | 70,405,500 | | | | 62,907,715 | |
| | | | |
| | | | | | | | | | | | | | | 162,337,155 | |
| | | | | | | | | | | | | | | | |
| | | | |
| India: 9.67% | | | | | | | | | | | | | | | | |
Bharti Airtel Limited (Telecommunication Services, Wireless Telecommunication Services) | | | | | | | | | | | 3,538,728 | | | | 19,555,694 | |
Bharti Infratel Limited (Telecommunication Services, Diversified Telecommunication Services) | | | | | | | | | | | 3,153,851 | | | | 17,389,569 | |
Dalmia Bharat Limited (Materials, Construction Materials) | | | | | | | | | | | 312,329 | | | | 10,546,505 | |
HDFC Bank Limited ADR (Financials, Banks) | | | | | | | | | | | 123,826 | | | | 9,857,788 | |
HDFC Limited (Financials, Thrifts & Mortgage Finance) | | | | | | | | | | | 1,285,700 | | | | 30,721,495 | |
ICICI Bank Limited ADR (Financials, Banks) | | | | | | | | | | | 3,281,775 | | | | 28,124,812 | |
Indusind Bank Limited (Financials, Banks) | | | | | | | | | | | 817,217 | | | | 18,355,941 | |
Infosys Limited ADR (Information Technology, IT Services) « | | | | | | | | | | | 1,907,460 | | | | 27,772,618 | |
ITC Limited (Consumer Staples, Tobacco) | | | | | | | | | | | 10,998,960 | | | | 47,531,647 | |
Laurus Labs Limited (Health Care, Pharmaceuticals) 144A† | | | | | | | | | | | 455,595 | | | | 3,682,012 | |
Max India Limited (Financials, Industrial Conglomerates) | | | | | | | | | | | 925,389 | | | | 9,435,141 | |
PNB Housing Finance Limited (Financials, Thrifts & Mortgage Finance) 144A† | | | | | | | | | | | 191,606 | | | | 4,128,777 | |
Reliance Industries Limited (Energy, Oil, Gas & Consumable Fuels) | | | | | | | | | | | 714,200 | | | | 15,489,691 | |
Reliance Industries Limited GDR (Energy, Oil, Gas & Consumable Fuels) 144A | | | | | | | | | | | 1,246,587 | | | | 53,914,888 | |
Ultra Tech Cement Limited (Materials, Construction Materials) | | | | | | | | | | | 286,000 | | | | 18,890,093 | |
| | | | |
| | | | | | | | | | | | | | | 315,396,671 | |
| | | | | | | | | | | | | | | | |
| | | | |
| Indonesia: 2.55% | | | | | | | | | | | | | | | | |
PT Astra International Tbk (Consumer Discretionary, Automobiles) | | | | | | | | | | | 14,651,000 | | | | 9,837,681 | |
PT Bank Central Asia Tbk (Financials, Banks) | | | | | | | | | | | 9,549,500 | | | | 12,716,905 | |
PT Blue Bird Tbk (Industrials, Road & Rail) | | | | | | | | | | | 13,605,309 | | | | 4,001,261 | |
PT Link Net Tbk (Telecommunication Services, Diversified Telecommunication Services) | | | | | | | | | | | 38,278,161 | | | | 15,507,695 | |
PT Matahari Department Store Tbk (Consumer Discretionary, Multiline Retail) | | | | | | | | | | | 10,474,600 | | | | 11,473,416 | |
PT Telekomunikasi Indonesia Persero ADR Tbk (Telecommunication Services, Diversified Telecommunication Services) « | | | | | | | | | | | 907,754 | | | | 29,728,944 | |
| | | | |
| | | | | | | | | | | | | | | 83,265,902 | |
| | | | | | | | | | | | | | | | |
| | | | |
| Malaysia: 1.17% | | | | | | | | | | | | | | | | |
Genting Bhd (Consumer Discretionary, Hotels, Restaurants & Leisure) | | | | | | | | | | | 8,280,900 | | | | 18,770,803 | |
Genting Malaysia Bhd (Consumer Discretionary, Hotels, Restaurants & Leisure) | | | | | | | | | | | 14,196,300 | | | | 19,196,563 | |
| | | | |
| | | | | | | | | | | | | | | 37,967,366 | |
| | | | | | | | | | | | | | | | |
| | | | |
| Mexico: 7.37% | | | | | | | | | | | | | | | | |
America Movil SAB de CV ADR (Telecommunication Services, Wireless Telecommunication Services) | | | | | | | | | | | 1,577,320 | | | | 24,274,955 | |
Becle SAB de CV ADR (Consumer Staples, Beverages) † | | | | | | | | | | | 5,564,661 | | | | 9,311,261 | |
Cemex SAB de CV ADR (Materials, Construction Materials) † | | | | | | | | | | | 1,886,393 | | | | 17,392,543 | |
Fibra Uno Administracion SAB de CV (Real Estate, Equity REITs) | | | | | | | | | | | 25,236,922 | | | | 43,984,723 | |
Fomento Economico Mexicano SAB de CV ADR (Consumer Staples, Beverages) | | | | | | | | | | | 803,120 | | | | 72,312,925 | |
Grupo Financiero Banorte SAB de CV (Financials, Banks) | | | | | | | | | | | 6,433,188 | | | | 37,125,751 | |
Grupo Financiero Santander SAB de CV ADR (Financials, Banks) | | | | | | | | | | | 1,813,441 | | | | 16,520,448 | |
The accompanying notes are an integral part of these financial statements.
| | | | | | |
| Portfolio of investments—April 30, 2017 (unaudited) | | Wells Fargo Emerging Markets Equity Fund | | | 9 | |
| | | | | | | | | | | | | | | | |
| Security name | | | | | | | | Shares | | | Value | |
| | | | |
| Mexico (continued) | | | | | | | | | | | | | | | | |
Grupo Sanborns SAB de CV (Consumer Discretionary, Multiline Retail) | | | | | | | | | | | 814,226 | | | $ | 933,374 | |
Wal-Mart de Mexico SAB de CV (Consumer Staples, Food & Staples Retailing) | | | | | | | | | | | 8,127,100 | | | | 18,304,620 | |
| | | | |
| | | | | | | | | | | | | | | 240,160,600 | |
| | | | | | | | | | | | | | | | |
| | | | |
| Peru: 0.42% | | | | | | | | | | | | | | | | |
Compania de Minas Buenaventura SA ADR (Materials, Metals & Mining) | | | | | | | | | | | 1,152,495 | | | | 13,841,465 | |
| | | | | | | | | | | | | | | | |
| | | | |
| Philippines: 0.89% | | | | | | | | | | | | | | | | |
Ayala Corporation (Financials, Diversified Financial Services) | | | | | | | | | | | 647,624 | | | | 11,231,186 | |
Metropolitan Bank & Trust Company (Financials, Banks) | | | | | | | | | | | 4,287,486 | | | | 7,250,927 | |
SM Investments Corporation (Industrials, Industrial Conglomerates) | | | | | | | | | | | 732,873 | | | | 10,678,106 | |
| | | | |
| | | | | | | | | | | | | | | 29,160,219 | |
| | | | | | | | | | | | | | | | |
| | | | |
| Russia: 2.94% | | | | | | | | | | | | | | | | |
LUKOIL PJSC ADR (Energy, Oil, Gas & Consumable Fuels) | | | | | | | | | | | 428,249 | | | | 21,268,987 | |
Magnit (Consumer Staples, Food & Staples Retailing) (a) | | | | | | | | | | | 95,300 | | | | 14,692,449 | |
Mobile TeleSystems PJSC ADR (Telecommunication Services, Wireless Telecommunication Services) | | | | | | | | | | | 1,137,800 | | | | 11,742,096 | |
Sberbank of Russia ADR (Financials, Banks) | | | | | | | | | | | 1,541,195 | | | | 18,324,809 | |
Yandex NV Class A (Information Technology, Internet Software & Services) † | | | | | | | | | | | 1,090,106 | | | | 29,716,290 | |
| | | | |
| | | | | | | | | | | | | | | 95,744,631 | |
| | | | | | | | | | | | | | | | |
| | | | |
| South Africa: 4.20% | | | | | | | | | | | | | | | | |
AngloGold Ashanti Limited ADR (Materials, Metals & Mining) « | | | | | | | | | | | 878,071 | | | | 10,036,352 | |
Clicks Group Limited (Consumer Staples, Food & Staples Retailing) | | | | | | | | | | | 690,000 | | | | 6,930,592 | |
Impala Platinum Holdings Limited (Materials, Metals & Mining) † | | | | | | | | | | | 610,758 | | | | 1,962,926 | |
MTN Group Limited (Telecommunication Services, Wireless Telecommunication Services) « | | | | | | | | | | | 2,102,643 | | | | 19,903,421 | |
Shoprite Holdings Limited (Consumer Staples, Food & Staples Retailing) | | | | | | | | | | | 2,678,100 | | | | 42,043,991 | |
Standard Bank Group Limited (Financials, Banks) | | | | | | | | | | | 1,690,190 | | | | 18,763,939 | |
Tiger Brands Limited (Consumer Staples, Food Products) | | | | | | | | | | | 1,235,333 | | | | 37,340,774 | |
| | | | |
| | | | | | | | | | | | | | | 136,981,995 | |
| | | | | | | | | | | | | | | | |
| | | | |
| South Korea: 11.88% | | | | | | | | | | | | | | | | |
Amorepacific Corporation (Consumer Staples, Personal Products) | | | | | | | | | | | 20,500 | | | | 5,260,568 | |
KT Corporation ADR (Telecommunication Services, Diversified Telecommunication Services) « | | | | | | | | | | | 3,144,813 | | | | 52,172,448 | |
KT&G Corporation (Consumer Staples, Tobacco) | | | | | | | | | | | 218,091 | | | | 19,453,587 | |
Naver Corporation (Information Technology, Internet Software & Services) | | | | | | | | | | | 59,700 | | | | 41,972,054 | |
Samsung Biologics Company Limited (Health Care, Life Sciences Tools & Services) † | | | | | | | | | | | 21,099 | | | | 3,244,859 | |
Samsung Electronics Company Limited (Information Technology, Technology Hardware, Storage & Peripherals) | | | | | | | | | | | 93,736 | | | | 183,781,541 | |
Samsung Life Insurance Company Limited (Financials, Insurance) | | | | | | | | | | | 445,337 | | | | 42,854,734 | |
SK Hynix Incorporated (Information Technology, Semiconductors & Semiconductor Equipment) | | | | | | | | | | | 813,000 | | | | 38,581,598 | |
| | | | |
| | | | | | | | | | | | | | | 387,321,389 | |
| | | | | | | | | | | | | | | | |
| | | | |
| Taiwan: 8.81% | | | | | | | | | | | | | | | | |
104 Corporation (Industrials, Professional Services) | | | | | | | | | | | 1,655,000 | | | | 7,926,403 | |
Far Eastern New Century Corporation (Industrials, Industrial Conglomerates) | | | | | | | | | | | 4,166,448 | | | | 3,507,599 | |
MediaTek Incorporated (Information Technology, Semiconductors & Semiconductor Equipment) | | | | | | | | | | | 3,039,881 | | | | 21,863,849 | |
President Chain Store Corporation (Consumer Staples, Food & Staples Retailing) | | | | | | | | | | | 4,205,000 | | | | 36,585,214 | |
Taiwan Semiconductor Manufacturing Company Limited (Information Technology, Semiconductors & Semiconductor Equipment) | | | | | | | | | | | 8,285,224 | | | | 53,411,424 | |
The accompanying notes are an integral part of these financial statements.
| | | | |
| 10 | | Wells Fargo Emerging Markets Equity Fund | | Portfolio of investments—April 30, 2017 (unaudited) |
| | | | | | | | | | | | | | | | |
| Security name | | | | | | | | Shares | | | Value | |
| | | | |
| Taiwan (continued) | | | | | | | | | | | | | | | | |
Taiwan Semiconductor Manufacturing Company Limited ADR (Information Technology, Semiconductors & Semiconductor Equipment) | | | | | | | | | | | 3,052,852 | | | $ | 100,957,816 | |
Uni-President Enterprises Corporation (Consumer Staples, Food Products) | | | | | | | | | | | 34,162,368 | | | | 63,068,639 | |
| | | | |
| | | | | | | | | | | | | | | 287,320,944 | |
| | | | | | | | | | | | | | | | |
| | | | |
| Thailand: 3.50% | | | | | | | | | | | | | | | | |
Bangkok Bank PCL (Financials, Banks) | | | | | | | | | | | 1,659,800 | | | | 8,973,189 | |
PTT Exploration & Production PCL (Energy, Oil, Gas & Consumable Fuels) | | | | | | | | | | | 4,128,139 | | | | 11,606,288 | |
PTT PCL (Energy, Oil, Gas & Consumable Fuels) | | | | | | | | | | | 1,925,900 | | | | 21,658,719 | |
Siam Commercial Bank PCL (Financials, Banks) | | | | | | | | | | | 7,405,100 | | | | 33,396,808 | |
Thai Beverage PCL (Consumer Staples, Beverages) | | | | | | | | | | | 58,227,000 | | | | 38,549,887 | |
| | | | |
| | | | | | | | | | | | | | | 114,184,891 | |
| | | | | | | | | | | | | | | | |
| | | | |
| Turkey: 0.68% | | | | | | | | | | | | | | | | |
Anadolu Efes Biracilik Ve Malt Sanayii AS (Consumer Staples, Beverages) | | | | | | | | | | | 2,690,453 | | | | 15,164,309 | |
Avivasa Emeklilik Ve Hayat AS (Financials, Insurance) « | | | | | | | | | | | 1,246,853 | | | | 6,894,296 | |
| | | | |
| | | | | | | | | | | | | | | 22,058,605 | |
| | | | | | | | | | | | | | | | |
| | | | |
| United Arab Emirates: 0.08% | | | | | | | | | | | | | | | | |
Emaar Malls Group (Real Estate, Real Estate Management & Development) | | | | | | | | | | | 3,773,147 | | | | 2,640,073 | |
| | | | | | | | | | | | | | | | |
| | | | |
| United Kingdom: 0.71% | | | | | | | | | | | | | | | | |
Standard Chartered plc (Financials, Banks) † | | | | | | | | | | | 2,475,244 | | | | 23,121,193 | |
| | | | | | | | | | | | | | | | |
| | | | |
Total Common Stocks (Cost $2,506,983,760) | | | | | | | | | | | | | | | 3,096,361,441 | |
| | | | | | | | | | | | | | | | |
| | | | |
| | | Interest rate | | | Maturity date | | | Principal | | | | |
| Convertible Debentures: 0.00% | | | | | | | | | | | | | | | | |
| | | | |
| Brazil: 0.00% | | | | | | | | | | | | | | | | |
Lupatech SA (Energy, Energy Equipment &
Services) (a)(i)(s) | | | 6.50 | % | | | 4-15-2018 | | | $ | 303,000 | | | | 0 | |
| | | | | | | | | | | | | | | | |
| | | | |
Total Convertible Debentures (Cost $160,691) | | | | | | | | | | | | | | | 0 | |
| | | | | | | | | | | | | | | | |
| | | | |
| | | Dividend yield | | | | | | Shares | | | | |
| Preferred Stocks: 1.43% | | | | | | | | | | | | | | | | |
| | | | |
| Brazil: 1.43% | | | | | | | | | | | | | | | | |
Lojas Americanas SA (Consumer Discretionary, Multiline Retail) ± | | | 0.05 | | | | | | | | 8,765,093 | | | | 46,503,416 | |
| | | | | | | | | | | | | | | | |
| | | | |
Total Preferred Stocks (Cost $35,049,790) | | | | | | | | | | | | | | | 46,503,416 | |
| | | | | | | | | | | | | | | | |
| | | | |
| | | Yield | | | | | | | | | | |
| Short-Term Investments: 6.06% | | | | | | | | | | | | | | | | |
| | | | |
| Investment Companies: 6.06% | | | | | | | | | | | | | | | | |
Securities Lending Cash Investment LLC (l)(r)(u) | | | 1.03 | | | | | | | | 106,663,673 | | | | 106,674,339 | |
Wells Fargo Government Money Market Fund Select Class (l)(u) | | | 0.68 | | | | | | | | 91,093,977 | | | | 91,093,977 | |
| | | | |
Total Short-Term Investments (Cost $197,760,129) | | | | | | | | | | | | | | | 197,768,316 | |
| | | | | | | | | | | | | | | | |
| | | | | | | | |
| Total investments in securities (Cost $2,739,954,370) * | | | 102.46 | % | | | 3,340,633,173 | |
Other assets and liabilities, net | | | (2.46 | ) | | | (80,302,696 | ) |
| | | | | | | | |
| Total net assets | | | 100.00 | % | | $ | 3,260,330,477 | |
| | | | | | | | |
The accompanying notes are an integral part of these financial statements.
| | | | | | |
| Portfolio of investments—April 30, 2017 (unaudited) | | Wells Fargo Emerging Markets Equity Fund | | | 11 | |
| † | Non-income-earning security |
| (a) | The security is fair valued in accordance with procedures approved by the Board of Trustees. |
| « | All or a portion of this security is on loan. |
| 144A | The security may be resold in transactions exempt from registration, normally to qualified institutional buyers, pursuant to Rule 144A under the Securities Act of 1933. |
| (s) | The security is currently in default with regards to scheduled interest and/or principal payments. The Fund has stopped accruing interest on the security. |
| ± | Variable rate investment. The rate shown is the rate in effect at period end. |
| (l) | The issuer of the security is an affiliated person of the Fund as defined in the Investment Company Act of 1940. |
| (r) | The investment is a non-registered investment vehicle purchased with cash collateral received from securities on loan. |
| (u) | The rate represents the 7-day annualized yield at period end. |
| * | Cost for federal income tax purposes is $2,758,644,450 and unrealized gains (losses) consists of: |
| | | | |
Gross unrealized gains | | $ | 890,091,278 | |
Gross unrealized losses | | | (308,102,555 | ) |
| | | | |
Net unrealized gains | | $ | 581,988,723 | |
The accompanying notes are an integral part of these financial statements.
| | | | |
| 12 | | Wells Fargo Emerging Markets Equity Fund | | Statement of assets and liabilities—April 30, 2017 (unaudited) |
| | | | |
| | |
| |
Assets | | | | |
Investments | | | | |
In unaffiliated securities (including $103,794,793 of securities loaned), at value (cost $2,542,194,241) | | $ | 3,142,864,857 | |
In affiliated securities, at value (cost $197,760,129) | | | 197,768,316 | |
| | | | |
Total investments, at value (cost $2,739,954,370) | | | 3,340,633,173 | |
Cash | | | 391,376 | |
Foreign currency, at value (cost $12,035,547) | | | 11,439,486 | |
Receivable for investments sold | | | 28,460,820 | |
Receivable for Fund shares sold | | | 6,363,070 | |
Receivable for dividends | | | 3,263,991 | |
Receivable for securities lending income | | | 90,787 | |
Prepaid expenses and other assets | | | 110,914 | |
| | | | |
Total assets | | | 3,390,753,617 | |
| | | | |
| |
Liabilities | | | | |
Payable for investments purchased | | | 13,268,170 | |
Payable for Fund shares redeemed | | | 5,816,735 | |
Payable upon receipt of securities loaned | | | 106,664,012 | |
Management fee payable | | | 2,630,612 | |
Distribution fees payable | | | 41,814 | |
Administration fees payable | | | 351,931 | |
Accrued expenses and other liabilities | | | 1,649,866 | |
| | | | |
Total liabilities | | | 130,423,140 | |
| | | | |
Total net assets | | $ | 3,260,330,477 | |
| | | | |
| |
NET ASSETS CONSIST OF | | | | |
Paid-in capital | | $ | 3,024,841,323 | |
Accumulated net investment loss | | | (19,825,585 | ) |
Accumulated net realized losses on investments | | | (344,537,574 | ) |
Net unrealized gains on investments | | | 599,852,313 | |
| | | | |
Total net assets | | $ | 3,260,330,477 | |
| | | | |
| |
COMPUTATION OF NET ASSET VALUE AND OFFERING PRICE PER SHARE | | | | |
Net assets – Class A | | $ | 244,922,639 | |
Shares outstanding – Class A1 | | | 11,137,665 | |
Net asset value per share – Class A | | | $21.99 | |
Maximum offering price per share – Class A2 | | | $23.33 | |
Net assets – Class B | | $ | 229,137 | |
Shares outstanding – Class B1 | | | 12,231 | |
Net asset value per share – Class B | | | $18.73 | |
Net assets – Class C | | $ | 68,158,911 | |
Shares outstanding – Class C1 | | | 3,665,900 | |
Net asset value per share – Class C | | | $18.59 | |
Net assets – Class R6 | | $ | 156,620,767 | |
Shares outstanding – Class R61 | | | 6,818,888 | |
Net asset value per share – Class R6 | | | $22.97 | |
Net assets – Administrator Class | | $ | 139,161,419 | |
Shares outstanding – Administrator Class1 | | | 6,027,926 | |
Net asset value per share – Administrator Class | | | $23.09 | |
Net assets – Institutional Class | | $ | 2,651,237,604 | |
Shares outstanding – Institutional Class1 | | | 115,410,034 | |
Net asset value per share – Institutional Class | | | $22.97 | |
| 1 | The Fund has an unlimited number of authorized shares. |
| 2 | Maximum offering price is computed as 100/94.25 of net asset value. On investments of $50,000 or more, the offering price is reduced. |
The accompanying notes are an integral part of these financial statements.
| | | | | | |
| Statement of operations—six months ended April 30, 2017 (unaudited) | | Wells Fargo Emerging Markets Equity Fund | | | 13 | |
| | | | |
| | | | |
| |
Investment income | | | | |
Dividends (net of foreign withholding taxes of $2,363,747) | | $ | 18,892,819 | |
Securities lending income, net | | | 492,470 | |
Income from affiliated securities | | | 215,150 | |
| | | | |
Total investment income | | | 19,600,439 | |
| | | | |
| |
Expenses | | | | |
Management fee | | | 15,869,117 | |
Administration fees | | | | |
Class A | | | 730,628 | |
Class B | | | 430 | |
Class C | | | 69,018 | |
Class R6 | | | 24,387 | |
Administrator Class | | | 91,580 | |
Institutional Class | | | 1,268,950 | |
Shareholder servicing fees | | | | |
Class A | | | 869,796 | |
Class B | | | 512 | |
Class C | | | 82,165 | |
Administrator Class | | | 172,529 | |
Distribution fees | | | | |
Class B | | | 1,536 | |
Class C | | | 246,494 | |
Custody and accounting fees | | | 576,452 | |
Professional fees | | | 36,627 | |
Registration fees | | | 77,700 | |
Shareholder report expenses | | | 422,546 | |
Trustees’ fees and expenses | | | 11,845 | |
Other fees and expenses | | | 23,753 | |
| | | | |
Total expenses | | | 20,576,065 | |
Less: Fee waivers and/or expense reimbursements | | | (484,961 | ) |
| | | | |
Net expenses | | | 20,091,104 | |
| | | | |
Net investment loss | | | (490,665 | ) |
| | | | |
| |
REALIZED AND UNREALIZED GAINS (LOSSES) ON INVESTMENTS | | | | |
| |
Net realized gains on: | | | | |
Unaffiliated securities | | | 1,647,976 | |
Forward foreign currency contract transactions | | | 10,937 | |
| | | | |
Net realized gains on investments | | | 1,658,913 | |
| | | | |
| |
Net change in unrealized gains (losses) on: | | | | |
Unaffiliated securities | | | 244,670,482 | |
Affiliated securities | | | 8,187 | |
| | | | |
Net change in unrealized gains (losses) on investments | | | 244,678,669 | |
| | | | |
Net realized and unrealized gains (losses) on investments | | | 246,337,582 | |
| | | | |
Net increase in net assets resulting from operations | | $ | 245,846,917 | |
| | | | |
The accompanying notes are an integral part of these financial statements.
| | | | |
| 14 | | Wells Fargo Emerging Markets Equity Fund | | Statement of changes in net assets |
| | | | | | | | | | | | | | | | |
| | | Six months ended
April 30, 2017
(unaudited) | | | Year ended
October 31, 2016 | |
| | | | |
Operations | | | | | | | | | | | | | | | | |
Net investment income (loss) | | | | | | $ | (490,665 | ) | | | | | | $ | 28,132,427 | |
Net realized gains (losses) on investments | | | | | | | 1,658,913 | | | | | | | | (78,862,801 | ) |
Net change in unrealized gains (losses) on investments | | | | | | | 244,678,669 | | | | | | | | 486,377,392 | |
| | | | |
Net increase in net assets resulting from operations | | | | | | | 245,846,917 | | | | | | | | 435,647,018 | |
| | | | |
| | | | |
Distributions to shareholders from | | | | | | | | | | | | | | | | |
Net investment income | | | | | | | | | | | | | | | | |
Class A | | | | | | | (5,313,014 | ) | | | | | | | (4,821,280 | ) |
Class R6 | | | | | | | (2,098,471 | ) | | | | | | | (1,207,067 | ) |
Administrator Class | | | | | | | (1,140,541 | ) | | | | | | | (915,237 | ) |
Institutional Class | | | | | | | (18,026,382 | ) | | | | | | | (22,745,172 | ) |
| | | | |
Total distributions to shareholders | | | | | | | (26,578,408 | ) | | | | | | | (29,688,756 | ) |
| | | | |
| | | | |
Capital share transactions | | | Shares | | | | | | | | Shares | | | | | |
Proceeds from shares sold | | | | | | | | | | | | | | | | |
Class A | | | 6,010,981 | | | | 119,101,950 | | | | 14,276,408 | | | | 257,431,388 | |
Class C | | | 196,861 | | | | 3,370,646 | | | | 284,656 | | | | 4,423,556 | |
Class R6 | | | 1,657,248 | | | | 34,687,725 | | | | 4,886,774 | | | | 94,696,839 | |
Administrator Class | | | 922,107 | | | | 19,538,122 | | | | 2,473,929 | | | | 47,026,221 | |
Institutional Class | | | 44,109,470 | | | | 961,676,422 | | | | 25,310,308 | | | | 470,045,141 | |
| | | | |
| | | | | | | 1,138,374,865 | | | | | | | | 873,623,145 | |
| | | | |
Reinvestment of distributions | | | | | | | | | | | | | | | | |
Class A | | | 274,903 | | | | 5,190,176 | | | | 275,442 | | | | 4,701,801 | |
Class R6 | | | 105,864 | | | | 2,085,516 | | | | 66,974 | | | | 1,193,482 | |
Administrator Class | | | 54,161 | | | | 1,073,463 | | | | 49,021 | | | | 878,463 | |
Institutional Class | | | 841,119 | | | | 16,578,453 | | | | 1,178,702 | | | | 21,004,467 | |
| | | | |
| | | | | | | 24,927,608 | | | | | | | | 27,778,213 | |
| | | | |
Payment for shares redeemed | | | | | | | | | | | | | | | | |
Class A | | | (37,828,389 | ) | | | (793,286,532 | ) | | | (20,179,942 | ) | | | (375,408,750 | ) |
Class B | | | (21,988 | ) | | | (384,513 | ) | | | (60,187 | ) | | | (925,067 | ) |
Class C | | | (692,148 | ) | | | (11,761,161 | ) | | | (1,621,268 | ) | | | (24,542,512 | ) |
Class R6 | | | (3,855,736 | ) | | | (79,989,683 | ) | | | (1,051,876 | ) | | | (20,911,449 | ) |
Administrator Class | | | (2,408,985 | ) | | | (50,789,333 | ) | | | (4,603,140 | ) | | | (87,710,425 | ) |
Institutional Class | | | (14,633,082 | ) | | | (311,154,935 | ) | | | (54,409,985 | ) | | | (1,055,274,030 | ) |
| | | | |
| | | | | | | (1,247,366,157 | ) | | | | | | | (1,564,772,233 | ) |
| | | | |
Net decrease in net assets resulting from capital share transactions | | | | | | | (84,063,684 | ) | | | | | | | (663,370,875 | ) |
| | | | |
Total increase (decrease) in net assets | | | | | | | 135,204,825 | | | | | | | | (257,412,613 | ) |
| | | | |
| | | | |
Net assets | | | | | | | | | | | | | | | | |
Beginning of period | | | | | | | 3,125,125,652 | | | | | | | | 3,382,538,265 | |
| | | | |
End of period | | | | | | $ | 3,260,330,477 | | | | | | | $ | 3,125,125,652 | |
| | | | |
Undistributed (accumulated) net investment income (loss) | | | | | | $ | (19,825,585 | ) | | | | | | $ | 7,243,488 | |
| | | | |
The accompanying notes are an integral part of these financial statements.
| | | | | | |
| Financial highlights | | Wells Fargo Emerging Markets Equity Fund | | | 15 | |
(For a share outstanding throughout each period)
| | | | | | | | | | | | | | | | | | | | | | | | |
| | | Six months ended
April 30, 2017 (unaudited) | | | Year ended October 31 | |
| CLASS A | | | 2016 | | | 2015 | | | 2014 | | | 2013 | | | 2012 | |
Net asset value, beginning of period | | | $20.49 | | | | $18.09 | | | | $21.44 | | | | $21.77 | | | | $20.48 | | | | $20.93 | |
Net investment income (loss) | | | (0.04 | )1 | | | 0.12 | | | | 0.08 | | | | 0.07 | | | | 0.02 | | | | 0.10 | |
Net realized and unrealized gains (losses) on investments | | | 1.67 | | | | 2.38 | | | | (3.29 | ) | | | (0.40 | ) | | | 1.33 | | | | (0.19 | ) |
| | | | | | | | | | | | | | | | | | | | | | | | |
Total from investment operations | | | 1.63 | | | | 2.50 | | | | (3.21 | ) | | | (0.33 | ) | | | 1.35 | | | | (0.09 | ) |
Distributions to shareholders from | | | | | | | | | | | | | | | | | | | | | | | | |
Net investment income | | | (0.13 | ) | | | (0.10 | ) | | | (0.14 | ) | | | 0.00 | | | | (0.06 | ) | | | (0.14 | ) |
Net realized gains | | | 0.00 | | | | 0.00 | | | | 0.00 | | | | 0.00 | | | | 0.00 | | | | (0.22 | ) |
| | | | | | | | | | | | | | | | | | | | | | | | |
Total distributions to shareholders | | | (0.13 | ) | | | (0.10 | ) | | | (0.14 | ) | | | 0.00 | | | | (0.06 | ) | | | (0.36 | ) |
Net asset value, end of period | | | $21.99 | | | | $20.49 | | | | $18.09 | | | | $21.44 | | | | $21.77 | | | | $20.48 | |
Total return2 | | | 8.04 | % | | | 13.93 | % | | | (15.02 | )% | | | (1.52 | )% | | | 6.62 | % | | | (0.31 | )% |
Ratios to average net assets (annualized) | | | | | | | | | | | | | | | | | | | | | | | | |
Gross expenses | | | 1.59 | % | | | 1.64 | % | | | 1.64 | % | | | 1.64 | % | | | 1.65 | % | | | 1.67 | % |
Net expenses | | | 1.59 | % | | | 1.60 | % | | | 1.64 | % | | | 1.64 | % | | | 1.65 | % | | | 1.67 | % |
Net investment income (loss) | | | (0.40 | )% | | | 0.64 | % | | | 0.37 | % | | | 0.36 | % | | | 0.15 | % | | | 0.51 | % |
Supplemental data | | | | | | | | | | | | | | | | | | | | | | | | |
Portfolio turnover rate | | | 17 | % | | | 8 | % | | | 8 | % | | | 7 | % | | | 13 | % | | | 7 | % |
Net assets, end of period (000s omitted) | | | $244,923 | | | | $874,625 | | | | $873,992 | | | | $1,502,597 | | | | $1,306,269 | | | | $920,709 | |
| 1 | Calculated based upon average shares outstanding |
| 2 | Total return calculations do not include any sales charges. Returns for periods of less than one year are not annualized. |
The accompanying notes are an integral part of these financial statements.
| | | | |
| 16 | | Wells Fargo Emerging Markets Equity Fund | | Financial highlights |
(For a share outstanding throughout each period)
| | | | | | | | | | | | | | | | | | | | | | | | |
| | | Six months ended
April 30, 2017 (unaudited) | | | Year ended October 31 | |
| CLASS B | | | 2016 | | | 2015 | | | 2014 | | | 2013 | | | 2012 | |
Net asset value, beginning of period | | | $17.41 | | | | $15.40 | | | | $18.25 | | | | $18.67 | | | | $17.64 | | | | $18.06 | |
Net investment loss | | | (0.09 | )1 | | | (0.03 | )1 | | | (0.08 | ) | | | (0.08 | )1 | | | (0.12 | )1 | | | (0.05 | )1 |
Net realized and unrealized gains (losses) on investments | | | 1.41 | | | | 2.04 | | | | (2.77 | ) | | | (0.34 | ) | | | 1.15 | | | | (0.15 | ) |
| | | | | | | | | | | | | | | | | | | | | | | | |
Total from investment operations | | | 1.32 | | | | 2.01 | | | | (2.85 | ) | | | (0.42 | ) | | | 1.03 | | | | (0.20 | ) |
Distributions to shareholders from | | | | | | | | | | | | | | | | | | | | | | | | |
Net realized gains | | | 0.00 | | | | 0.00 | | | | 0.00 | | | | 0.00 | | | | 0.00 | | | | (0.22 | ) |
Net asset value, end of period | | | $18.73 | | | | $17.41 | | | | $15.40 | | | | $18.25 | | | | $18.67 | | | | $17.64 | |
Total return2 | | | 7.58 | % | | | 13.05 | % | | | (15.62 | )% | | | (2.25 | )% | | | 5.84 | % | | | (1.06 | )% |
Ratios to average net assets (annualized) | | | | | | | | | | | | | | | | | | | | | | | | |
Gross expenses | | | 2.34 | % | | | 2.39 | % | | | 2.38 | % | | | 2.39 | % | | | 2.39 | % | | | 2.41 | % |
Net expenses | | | 2.34 | % | | | 2.35 | % | | | 2.38 | % | | | 2.39 | % | | | 2.39 | % | | | 2.41 | % |
Net investment loss | | | (1.08 | )% | | | (0.22 | )% | | | (0.46 | )% | | | (0.46 | )% | | | (0.64 | )% | | | (0.28 | )% |
Supplemental data | | | | | | | | | | | | | | | | | | | | | | | | |
Portfolio turnover rate | | | 17 | % | | | 8 | % | | | 8 | % | | | 7 | % | | | 13 | % | | | 7 | % |
Net assets, end of period (000s omitted) | | | $229 | | | | $596 | | | | $1,453 | | | | $5,380 | | | | $11,071 | | | | $15,408 | |
| 1 | Calculated based upon average shares outstanding |
| 2 | Total return calculations do not include any sales charges. Returns for periods of less than one year are not annualized. |
The accompanying notes are an integral part of these financial statements.
| | | | | | |
| Financial highlights | | Wells Fargo Emerging Markets Equity Fund | | | 17 | |
(For a share outstanding throughout each period)
| | | | | | | | | | | | | | | | | | | | | | | | |
| | | Six months ended
April 30, 2017 (unaudited) | | | Year ended October 31 | |
| CLASS C | | | 2016 | | | 2015 | | | 2014 | | | 2013 | | | 2012 | |
Net asset value, beginning of period | | | $17.28 | | | | $15.28 | | | | $18.11 | | | | $18.53 | | | | $17.51 | | | | $17.92 | |
Net investment loss | | | (0.09 | )1 | | | (0.02 | ) | | | (0.06 | ) | | | (0.08 | )1 | | | (0.11 | )1 | | | (0.06 | ) |
Net realized and unrealized gains (losses) on investments | | | 1.40 | | | | 2.02 | | | | (2.77 | ) | | | (0.34 | ) | | | 1.13 | | | | (0.13 | ) |
| | | | | | | | | | | | | | | | | | | | | | | | |
Total from investment operations | | | 1.31 | | | | 2.00 | | | | (2.83 | ) | | | (0.42 | ) | | | 1.02 | | | | (0.19 | ) |
Distributions to shareholders from | | | | | | | | | | | | | | | | | | | | | | | | |
Net realized gains | | | 0.00 | | | | 0.00 | | | | 0.00 | | | | 0.00 | | | | 0.00 | | | | (0.22 | ) |
Net asset value, end of period | | | $18.59 | | | | $17.28 | | | | $15.28 | | | | $18.11 | | | | $18.53 | | | | $17.51 | |
Total return2 | | | 7.58 | % | | | 13.09 | % | | | (15.63 | )% | | | (2.27 | )% | | | 5.83 | % | | | (1.01 | )% |
Ratios to average net assets (annualized) | | | | | | | | | | | | | | | | | | | | | | | | |
Gross expenses | | | 2.34 | % | | | 2.39 | % | | | 2.39 | % | | | 2.39 | % | | | 2.39 | % | | | 2.42 | % |
Net expenses | | | 2.34 | % | | | 2.35 | % | | | 2.39 | % | | | 2.39 | % | | | 2.39 | % | | | 2.42 | % |
Net investment loss | | | (1.04 | )% | | | (0.12 | )% | | | (0.39 | )% | | | (0.42 | )% | | | (0.62 | )% | | | (0.24 | )% |
Supplemental data | | | | | | | | | | | | | | | | | | | | | | | | |
Portfolio turnover rate | | | 17 | % | | | 8 | % | | | 8 | % | | | 7 | % | | | 13 | % | | | 7 | % |
Net assets, end of period (000s omitted) | | | $68,159 | | | | $71,900 | | | | $84,004 | | | | $138,169 | | | | $173,454 | | | | $183,471 | |
| 1 | Calculated based upon average shares outstanding |
| 2 | Total return calculations do not include any sales charges. Returns for periods of less than one year are not annualized. |
The accompanying notes are an integral part of these financial statements.
| | | | |
| 18 | | Wells Fargo Emerging Markets Equity Fund | | Financial highlights |
(For a share outstanding throughout each period)
| | | | | | | | | | | | | | | | | | | | |
| | | Six months ended
April 30, 2017 (unaudited) | | | Year ended October 31 | |
| CLASS R6 | | | 2016 | | | 2015 | | | 2014 | | | 20131 | |
Net asset value, beginning of period | | | $21.46 | | | | $19.00 | | | | $22.53 | | | | $22.86 | | | | $20.89 | |
Net investment income | | | 0.02 | 2 | | | 0.23 | 2 | | | 0.19 | | | | 0.21 | | | | 0.01 | 2 |
Net realized and unrealized gains (losses) on investments | | | 1.71 | | | | 2.46 | | | | (3.46 | ) | | | (0.44 | ) | | | 1.96 | |
| | | | | | | | | | | | | | | | | | | | |
Total from investment operations | | | 1.73 | | | | 2.69 | | | | (3.27 | ) | | | (0.23 | ) | | | 1.97 | |
Distributions to shareholders from | | | | | | | | | | | | | | | | | | | | |
Net investment income | | | (0.22 | ) | | | (0.23 | ) | | | (0.26 | ) | | | (0.10 | ) | | | 0.00 | |
Net asset value, end of period | | | $22.97 | | | | $21.46 | | | | $19.00 | | | | $22.53 | | | | $22.86 | |
Total return3 | | | 8.25 | % | | | 14.43 | % | | | (14.61 | )% | | | (1.01 | )% | | | 9.43 | % |
Ratios to average net assets (annualized) | | | | | | | | | | | | | | | | | | | | |
Gross expenses | | | 1.16 | % | | | 1.20 | % | | | 1.19 | % | | | 1.17 | % | | | 1.17 | % |
Net expenses | | | 1.16 | % | | | 1.17 | % | | | 1.18 | % | | | 1.17 | % | | | 1.17 | % |
Net investment income | | | 0.15 | % | | | 1.16 | % | | | 0.84 | % | | | 0.88 | % | | | 0.15 | % |
Supplemental data | | | | | | | | | | | | | | | | | | | | |
Portfolio turnover rate | | | 17 | % | | | 8 | % | | | 8 | % | | | 7 | % | | | 13 | % |
Net assets, end of period (000s omitted) | | | $156,621 | | | | $191,250 | | | | $95,190 | | | | $35,967 | | | | $4,809 | |
| 1 | For the period from June 28, 2013 (commencement of class operations) to October 31, 2013 |
| 2 | Calculated based upon average shares outstanding |
| 3 | Returns for periods of less than one year are not annualized. |
The accompanying notes are an integral part of these financial statements.
| | | | | | |
| Financial highlights | | Wells Fargo Emerging Markets Equity Fund | | | 19 | |
(For a share outstanding throughout each period)
| | | | | | | | | | | | | | | | | | | | | | | | |
| | | Six months ended
April 30, 2017 (unaudited) | | | Year ended October 31 | |
| ADMINISTRATOR CLASS | | | 2016 | | | 2015 | | | 2014 | | | 2013 | | | 2012 | |
Net asset value, beginning of period | | | $21.53 | | | | $18.99 | | | | $22.44 | | | | $22.79 | | | | $21.44 | | | | $21.90 | |
Net investment income (loss) | | | (0.02 | )1 | | | 0.15 | 1 | | | 0.12 | 1 | | | 0.13 | 1 | | | 0.05 | | | | 0.14 | |
Net realized and unrealized gains (losses) on investments | | | 1.74 | | | | 2.50 | | | | (3.46 | ) | | | (0.44 | ) | | | 1.40 | | | | (0.18 | ) |
| | | | | | | | | | | | | | | | | | | | | | | | |
Total from investment operations | | | 1.72 | | | | 2.65 | | | | (3.34 | ) | | | (0.31 | ) | | | 1.45 | | | | (0.04 | ) |
Distributions to shareholders from | | | | | | | | | | | | | | | | | | | | | | | | |
Net investment income | | | (0.16 | ) | | | (0.11 | ) | | | (0.11 | ) | | | (0.04 | ) | | | (0.10 | ) | | | (0.20 | ) |
Net realized gains | | | 0.00 | | | | 0.00 | | | | 0.00 | | | | 0.00 | | | | 0.00 | | | | (0.22 | ) |
| | | | | | | | | | | | | | | | | | | | | | | | |
Total distributions to shareholders | | | (0.16 | ) | | | (0.11 | ) | | | (0.11 | ) | | | (0.04 | ) | | | (0.10 | ) | | | (0.42 | ) |
Net asset value, end of period | | | $23.09 | | | | $21.53 | | | | $18.99 | | | | $22.44 | | | | $22.79 | | | | $21.44 | |
Total return2 | | | 8.10 | % | | | 14.07 | % | | | (14.91 | )% | | | (1.36 | )% | | | 6.83 | % | | | (0.13 | )% |
Ratios to average net assets (annualized) | | | | | | | | | | | | | | | | | | | | | | | | |
Gross expenses | | | 1.50 | % | | | 1.56 | % | | | 1.49 | % | | | 1.48 | % | | | 1.48 | % | | | 1.47 | % |
Net expenses | | | 1.48 | % | | | 1.49 | % | | | 1.48 | % | | | 1.48 | % | | | 1.48 | % | | | 1.47 | % |
Net investment income (loss) | | | (0.19 | )% | | | 0.76 | % | | | 0.58 | % | | | 0.57 | % | | | 0.35 | % | | | 0.72 | % |
Supplemental data | | | | | | | | | | | | | | | | | | | | | | | | |
Portfolio turnover rate | | | 17 | % | | | 8 | % | | | 8 | % | | | 7 | % | | | 13 | % | | | 7 | % |
Net assets, end of period (000s omitted) | | | $139,161 | | | | $160,657 | | | | $181,224 | | | | $464,135 | | | | $1,050,660 | | | | $634,428 | |
| 1 | Calculated based upon average shares outstanding |
| 2 | Returns for periods of less than one year are not annualized. |
The accompanying notes are an integral part of these financial statements.
| | | | |
| 20 | | Wells Fargo Emerging Markets Equity Fund | | Financial highlights |
(For a share outstanding throughout each period)
| | | | | | | | | | | | | | | | | | | | | | | | |
| | | Six months ended
April 30, 2017 (unaudited) | | | Year ended October 31 | |
| INSTITUTIONAL CLASS | | | 2016 | | | 2015 | | | 2014 | | | 2013 | | | 2012 | |
Net asset value, beginning of period | | | $21.46 | | | | $18.99 | | | | $22.52 | | | | $22.86 | | | | $21.50 | | | | $21.96 | |
Net investment income | | | 0.01 | 1 | | | 0.20 | 1 | | | 0.17 | | | | 0.15 | | | | 0.11 | | | | 0.22 | |
Net realized and unrealized gains (losses) on investments | | | 1.71 | | | | 2.49 | | | | (3.45 | ) | | | (0.40 | ) | | | 1.40 | | | | (0.22 | ) |
| | | | | | | | | | | | | | | | | | | | | | | | |
Total from investment operations | | | 1.72 | | | | 2.69 | | | | (3.28 | ) | | | (0.25 | ) | | | 1.51 | | | | 0.00 | |
Distributions to shareholders from | | | | | | | | | | | | | | | | | | | | | | | | |
Net investment income | | | (0.21 | ) | | | (0.22 | ) | | | (0.25 | ) | | | (0.09 | ) | | | (0.15 | ) | | | (0.24 | ) |
Net realized gains | | | 0.00 | | | | 0.00 | | | | 0.00 | | | | 0.00 | | | | 0.00 | | | | (0.22 | ) |
| | | | | | | | | | | | | | | | | | | | | | | | |
Total distributions to shareholders | | | (0.21 | ) | | | (0.22 | ) | | | (0.25 | ) | | | (0.09 | ) | | | (0.15 | ) | | | (0.46 | ) |
Net asset value, end of period | | | $22.97 | | | | $21.46 | | | | $18.99 | | | | $22.52 | | | | $22.86 | | | | $21.50 | |
Total return2 | | | 8.20 | % | | | 14.40 | % | | | (14.66 | )% | | | (1.09 | )% | | | 7.07 | % | | | 0.13 | % |
Ratios to average net assets (annualized) | | | | | | | | | | | | | | | | | | | | | | | | |
Gross expenses | | | 1.26 | % | | | 1.31 | % | | | 1.24 | % | | | 1.21 | % | | | 1.22 | % | | | 1.24 | % |
Net expenses | | | 1.21 | % | | | 1.22 | % | | | 1.22 | % | | | 1.21 | % | | | 1.22 | % | | | 1.24 | % |
Net investment income | | | 0.13 | % | | | 1.04 | % | | | 0.82 | % | | | 0.77 | % | | | 0.57 | % | | | 1.04 | % |
Supplemental data | | | | | | | | | | | | | | | | | | | | | | | | |
Portfolio turnover rate | | | 17 | % | | | 8 | % | | | 8 | % | | | 7 | % | | | 13 | % | | | 7 | % |
Net assets, end of period (000s omitted) | | | $2,651,238 | | | | $1,826,097 | | | | $2,146,675 | | | | $2,900,353 | | | | $2,183,281 | | | | $1,176,567 | |
| 1 | Calculated based upon average shares outstanding |
| 2 | Returns for periods of less than one year are not annualized. |
The accompanying notes are an integral part of these financial statements.
| | | | | | |
| Notes to financial statements (unaudited) | | Wells Fargo Emerging Markets Equity Fund | | | 21 | |
1. ORGANIZATION
Wells Fargo Funds Trust (the “Trust”), a Delaware statutory trust organized on March 10, 1999, is an open-end management investment company registered under the Investment Company Act of 1940, as amended (the “1940 Act”). As an investment company, the Trust follows the accounting and reporting guidance in Financial Accounting Standards Board (“FASB”) Accounting Standards Codification (“ASC”) Topic 946, Financial Services – Investment Companies. These financial statements report on the Wells Fargo Emerging Markets Equity Fund (the “Fund”) which is a diversified series of the Trust.
2. SIGNIFICANT ACCOUNTING POLICIES
The following significant accounting policies, which are consistently followed in the preparation of the financial statements of the Fund, are in conformity with U.S. generally accepted accounting principles which require management to make estimates and assumptions that affect the reported amounts of assets and liabilities, disclosure of contingent assets and liabilities at the date of the financial statements, and the reported amounts of revenues and expenses during the reporting period. Actual results could differ from those estimates.
Securities valuation
All investments are valued each business day as of the close of regular trading on the New York Stock Exchange (generally 4 p.m. Eastern Time), although the Fund may deviate from this calculation time under unusual or unexpected circumstances.
Equity securities that are listed on a foreign or domestic exchange or market are valued at the official closing price or, if none, the last sales price. If no sale occurs on the principal exchange or market that day, the prior day’s price will be deemed “stale” and a fair value price will be determined in accordance with the Fund’s Valuation Procedures.
The values of securities denominated in foreign currencies are translated into U.S. dollars at rates provided by an independent foreign currency pricing source at a time each business day specified by the Management Valuation Team of Wells Fargo Funds Management, LLC (“Funds Management”).
Many securities markets and exchanges outside the U.S. close prior to the close of the New York Stock Exchange and therefore may not fully reflect trading or events that occur after the close of the principal exchange in which the foreign securities are traded, but before the close of the New York Stock Exchange. If such trading or events are expected to materially affect the value of such securities, then fair value pricing procedures approved by the Board of Trustees of the Fund are applied. These procedures take into account multiple factors including movements in U.S. securities markets after foreign exchanges close. Foreign securities that are fair valued under these procedures are categorized as Level 2 and the application of these procedures may result in transfers between Level 1 and Level 2. Depending on market activity, such fair valuations may be frequent. Such fair value pricing may result in net asset values that are higher or lower than net asset values based on the last reported sales price or latest quoted bid price. On April 30, 2017, such fair value pricing was not used in pricing foreign securities.
Debt securities are valued at the evaluated bid price provided by an independent pricing service or, if a reliable price is not available, the quoted bid price from an independent broker-dealer.
Investments in registered open-end investment companies are valued at net asset value. Interests in non-registered investment companies that are redeemable at net asset value are fair valued normally at net asset value.
Investments which are not valued using any of the methods discussed above are valued at their fair value, as determined in good faith by the Board of Trustees. The Board of Trustees has established a Valuation Committee comprised of the Trustees and has delegated to it the authority to take any actions regarding the valuation of portfolio securities that the Valuation Committee deems necessary or appropriate, including determining the fair value of portfolio securities, unless the determination has been delegated to the Management Valuation Team. The Board of Trustees retains the authority to make or ratify any valuation decisions or approve any changes to the Valuation Procedures as it deems appropriate. On a quarterly basis, the Board of Trustees receives reports on any valuation actions taken by the Valuation Committee or the Management Valuation Team which may include items for ratification.
Valuations of fair valued securities are compared to the next actual sales price when available, or other appropriate market values, to assess the continued appropriateness of the fair valuation methodologies used. These securities are fair valued on a day-to-day basis, taking into consideration changes to appropriate market information and any significant changes to the inputs considered in the valuation process until there is a readily available price provided on an exchange or by an independent pricing service. Valuations received from an independent pricing service or independent broker-dealer quotes are periodically validated by comparisons to most recent trades and valuations provided by other independent pricing
| | | | |
| 22 | | Wells Fargo Emerging Markets Equity Fund | | Notes to financial statements (unaudited) |
services in addition to the review of prices by the manager and/or subadviser. Unobservable inputs used in determining fair valuations are identified based on the type of security, taking into consideration factors utilized by market participants in valuing the investment, knowledge about the issuer and the current market environment.
Foreign currency translation
The accounting records of the Fund are maintained in U.S. dollars. The values of other assets and liabilities denominated in foreign currencies are translated into U.S. dollars at rates provided by an independent foreign currency pricing source at a time each business day specified by the Management Valuation Team. Purchases and sales of securities, and income and expenses are converted at the rate of exchange on the respective dates of such transactions. Net realized foreign exchange gains or losses arise from sales of foreign currencies, currency gains or losses realized between the trade and settlement dates on securities transactions, and the difference between the amounts of dividends, interest and foreign withholding taxes recorded and the U.S. dollar equivalent of the amounts actually paid or received. Net unrealized foreign exchange gains and losses arise from changes in the fair value of assets and liabilities other than investments in securities resulting from changes in exchange rates. The changes in net assets arising from changes in exchange rates of securities and the changes in net assets resulting from changes in market prices of securities are not separately presented. Such changes are included in net realized and unrealized gains or losses from investments.
Forward foreign currency contracts
The Fund is subject to foreign currency exchange rate risk in the normal course of pursuing its investment objectives. A forward foreign currency contract is an agreement between two parties to purchase or sell a specific currency for an agreed-upon price at a future date. The Fund enters into forward foreign currency contracts to facilitate transactions in foreign-denominated securities and to attempt to minimize the risk to the Fund from adverse changes in the relationship between currencies. Forward foreign currency contracts are recorded at the forward rate and marked-to-market daily. When the contracts are closed, realized gains and losses arising from such transactions are recorded as realized gains or losses on forward foreign currency contract transactions. The Fund could be exposed to risks if the counterparties to the contracts are unable to meet the terms of their contracts or if the value of the foreign currency changes unfavorably. The Fund’s maximum risk of loss from counterparty credit risk is the unrealized gains on the contracts. This risk may be mitigated if there is a master netting arrangement between the Fund and the counterparty.
Security loans
The Fund may lend its securities from time to time in order to earn additional income in the form of fees or interest on securities received as collateral or the investment of any cash received as collateral. The Fund continues to receive interest or dividends on the securities loaned. The Fund receives collateral in the form of cash or securities with a value at least equal to the value of the securities on loan. The value of the loaned securities is determined at the close of each business day and any additional required collateral is delivered to the Fund on the next business day. In a securities lending transaction, the net asset value of the Fund will be affected by an increase or decrease in the value of the securities loaned and by an increase or decrease in the value of the instrument in which collateral is invested. The amount of securities lending activity undertaken by the Fund fluctuates from time to time. In the event of default or bankruptcy by the borrower, the Fund may be prevented from recovering the loaned securities or gaining access to the collateral or may experience delays or costs in doing so. In addition, the investment of any cash collateral received may lose all or part of its value. The Fund has the right under the lending agreement to recover the securities from the borrower on demand.
The Fund lends its securities through an unaffiliated securities lending agent. Cash collateral received in connection with its securities lending transactions is invested in Securities Lending Cash Investments, LLC (the “Securities Lending Fund”). The Securities Lending Fund is exempt from registration under Section 3(c)(7) of the 1940 Act and is managed by Funds Management and is subadvised by Wells Capital Management Incorporated (“WellsCap”), an affiliate of Funds Management and an indirect wholly owned subsidiary of Wells Fargo & Company (“Wells Fargo”). Funds Management receives an advisory fee starting at 0.05% and declining to 0.01% as the average daily net assets of the Securities Lending Fund increase. All of the fees received by Funds Management are paid to WellsCap for its services as subadviser. The Securities Lending Fund seeks to provide a positive return compared to the daily Fed Funds Open Rate by investing in high-quality, U.S. dollar-denominated short-term money market instruments. Securities Lending Fund investments are valued at the evaluated bid price provided by an independent pricing service. Income earned from investment in the Securities Lending Fund is included in securities lending income on the Statement of Operations.
Security transactions and income recognition
Securities transactions are recorded on a trade date basis. Realized gains or losses are recorded on the basis of identified cost.
| | | | | | |
| Notes to financial statements (unaudited) | | Wells Fargo Emerging Markets Equity Fund | | | 23 | |
Dividend income is recognized on the ex-dividend date, except for certain dividends from foreign securities, which are recorded as soon as the custodian verifies the ex-dividend date. Dividend income from foreign securities is recorded net of foreign taxes withheld where recovery of such taxes is not assured.
Distributions to shareholders
Distributions to shareholders from net investment income and net realized gains, if any, are recorded on the ex-dividend date. Such distributions are determined in accordance with income tax regulations and may differ from U.S. generally accepted accounting principles. Dividend sources are estimated at the time of declaration. The tax character of distributions is determined as of the Fund’s fiscal year end. Therefore, a portion of the Fund’s distributions made prior the Fund’s fiscal year end may be categorized as a tax return of capital.
Federal and other taxes
The Fund intends to continue to qualify as a regulated investment company by distributing substantially all of its investment company taxable income and any net realized capital gains (after reduction for capital loss carryforwards) sufficient to relieve it from all, or substantially all, federal income taxes. Accordingly, no provision for federal income taxes was required.
The Fund’s income and federal excise tax returns and all financial records supporting those returns for the prior three fiscal years are subject to examination by the federal and Delaware revenue authorities. Management has analyzed the Fund’s tax positions taken on federal, state, and foreign tax returns for all open tax years and does not believe that there are any uncertain tax positions that require recognition of a tax liability.
Capital loss carryforwards that do not expire are required to be utilized prior to capital loss carryforwards that expire. As of October 31, 2016, capital loss carryforwards available to offset future net realized capital gains were as follows through the indicated expiration dates:
| | | | |
| | | No expiration |
| 2017 | | Short-term | | Long-term |
| $10,889,490 | | $28,743,201 | | $302,353,927 |
Class allocations
The separate classes of shares offered by the Fund differ principally in applicable sales charges, distribution, shareholder servicing, and administration fees. Class specific expenses are charged directly to that share class. Investment income, common expenses, and realized and unrealized gains (losses) on investments are allocated daily to each class of shares based on the relative proportion of net assets of each class.
3. FAIR VALUATION MEASUREMENTS
Fair value measurements of investments are determined within a framework that has established a fair value hierarchy based upon the various data inputs utilized in determining the value of the Fund’s investments. The three-level hierarchy gives the highest priority to unadjusted quoted prices in active markets for identical assets or liabilities (Level 1) and the lowest priority to unobservable inputs (Level 3). The Fund’s investments are classified within the fair value hierarchy based on the lowest level of input that is significant to the fair value measurement. The inputs are summarized into three broad levels as follows:
| ∎ | | Level 1 – quoted prices in active markets for identical securities |
| ∎ | | Level 2 – other significant observable inputs (including quoted prices for similar securities, interest rates, prepayment speeds, credit risk, etc.) |
| ∎ | | Level 3 – significant unobservable inputs (including the Fund’s own assumptions in determining the fair value of investments) |
The inputs or methodologies used for valuing investments in securities are not necessarily an indication of the risk associated with investing in those securities.
| | | | |
| 24 | | Wells Fargo Emerging Markets Equity Fund | | Notes to financial statements (unaudited) |
The following is a summary of the inputs used in valuing the Fund’s assets and liabilities as of April 30, 2017:
| | | | | | | | | | | | | | | | |
| | | Quoted prices
(Level 1) | | | Other significant
observable inputs
(Level 2) | | | Significant
unobservable inputs (Level 3) | | | Total | |
Assets | | | | | | | | | | | | | | | | |
Investments in: | | | | | | | | | | | | | | | | |
| | | | |
Common stocks | | | | | | | | | | | | | | | | |
Argentina | | $ | 17,465,833 | | | $ | 0 | | | $ | 0 | | | $ | 17,465,833 | |
Brazil | | | 191,345,317 | | | | 3,988,011 | | | | 0 | | | | 195,333,328 | |
Chile | | | 67,649,202 | | | | 0 | | | | 0 | | | | 67,649,202 | |
China | | | 807,352,935 | | | | 39,981,568 | | | | 0 | | | | 847,334,503 | |
Colombia | | | 17,075,476 | | | | 0 | | | | 0 | | | | 17,075,476 | |
Hong Kong | | | 162,337,155 | | | | 0 | | | | 0 | | | | 162,337,155 | |
India | | | 315,396,671 | | | | 0 | | | | 0 | | | | 315,396,671 | |
Indonesia | | | 83,265,902 | | | | 0 | | | | 0 | | | | 83,265,902 | |
Malaysia | | | 37,967,366 | | | | 0 | | | | 0 | | | | 37,967,366 | |
Mexico | | | 240,160,600 | | | | 0 | | | | 0 | | | | 240,160,600 | |
Peru | | | 13,841,465 | | | | 0 | | | | 0 | | | | 13,841,465 | |
Philippines | | | 29,160,219 | | | | 0 | | | | 0 | | | | 29,160,219 | |
Russia | | | 81,052,182 | | | | 14,692,449 | | | | 0 | | | | 95,744,631 | |
South Africa | | | 136,981,995 | | | | 0 | | | | 0 | | | | 136,981,995 | |
South Korea | | | 387,321,389 | | | | 0 | | | | 0 | | | | 387,321,389 | |
Taiwan | | | 287,320,944 | | | | 0 | | | | 0 | | | | 287,320,944 | |
Thailand | | | 114,184,891 | | | | 0 | | | | 0 | | | | 114,184,891 | |
Turkey | | | 22,058,605 | | | | 0 | | | | 0 | | | | 22,058,605 | |
United Arab Emirates | | | 2,640,073 | | | | 0 | | | | 0 | | | | 2,640,073 | |
United Kingdom | | | 23,121,193 | | | | 0 | | | | 0 | | | | 23,121,193 | |
| | | | |
Convertible debentures | | | 0 | | | | 0 | | | | 0 | | | | 0 | |
| | | | |
Preferred stocks | | | | | | | | | | | | | | | | |
Brazil | | | 46,503,416 | | | | 0 | | | | 0 | | | | 46,503,416 | |
| | | | |
Short-term investments | | | | | | | | | | | | | | | | |
Investment companies | | | 91,093,977 | | | | 0 | | | | 0 | | | | 91,093,977 | |
Investments measured at net asset value* | | | | | | | | | | | | | | | 106,674,339 | |
Total assets | | $ | 3,175,296,806 | | | $ | 58,662,028 | | | $ | 0 | | | $ | 3,340,633,173 | |
| * | Investments that are measured at fair value using the net asset value per share (or its equivalent) as a practical expedient have not been categorized in the fair value hierarchy. The fair value amount presented in the table is intended to permit reconciliation of the fair value hierarchy to the amounts presented in the Statement of Assets and Liabilities. The Fund’s investment in Securities Lending Cash Investments, LLC valued at $106,674,339 does not have a redemption period notice, can be redeemed daily and does not have any unfunded commitments. |
The Fund recognizes transfers between levels within the fair value hierarchy at the end of the reporting period. At April 30, 2017, common stocks with a market value of $39,981,568 were transferred from Level 1 to Level 2 because of a decrease in the market activity of these securities. The Fund had no material transfers into/out of Level 3.
4. TRANSACTIONS WITH AFFILIATES AND OTHER EXPENSES
Management fee
Funds Management, an indirect wholly owned subsidiary of Wells Fargo, is the manager of the Fund and provides advisory and fund-level administrative services under an investment management agreement. Under the investment management agreement, Funds Management is responsible for, among other services, implementing the investment objectives and strategies of the Fund, supervising the subadviser, providing fund-level administrative services in connection with the Fund’s operations, and providing any other fund-level administrative services reasonably necessary for the operation of the Fund. As compensation for its services under the investment management agreement, Funds Management is entitled to receive an annual management fee starting at 1.05% and declining to 0.945% as the average daily net assets of the Fund increase. Prior to March 1, 2017, Funds Management received a fee at an annual rate which started at 1.15% and declined to 0.955% as the average daily net assets of the Fund increased. For the six months ended April 30, 2017, the management fee was equivalent to an annual rate of 1.05% of the Fund’s average daily net assets.
| | | | | | |
| Notes to financial statements (unaudited) | | Wells Fargo Emerging Markets Equity Fund | | | 25 | |
Funds Management has retained the services of a subadviser to provide daily portfolio management to the Fund. The fee for subadvisory services is borne by Funds Management. WellsCap is the subadviser to the Fund and is entitled to receive a fee from Funds Management at an annual rate starting at 0.65% and declining to 0.45% as the average daily net assets of the Fund increase.
Administration fees
Under a class-level administration agreement, Funds Management provides class-level administrative services to the Fund, which includes paying fees and expenses for services provided by the transfer agent, sub-transfer agents, omnibus account servicers and record-keepers. As compensation for its services under the class-level administration agreement, Funds Management receives an annual fee which is calculated based on the average daily net assets of each class as follows:
| | | | |
| | | Class-level
administration fee | |
Class A, Class B, Class C | | | 0.21 | % |
Class R6 | | | 0.03 | |
Administrator Class, Institutional Class | | | 0.13 | |
Funds Management has contractually waived and/or reimbursed management and administration fees to the extent necessary to maintain certain net operating expense ratios for the Fund. Waiver of fees and/or reimbursement of expenses by Funds Management were made first from fund level expenses on a proportionate basis and then from class specific expenses. Funds Management has committed through February 28, 2018 to waive fees and/or reimburse expenses to the extent necessary to cap the Fund’s expenses at 1.58% for Class A shares, 2.33% for Class B shares, 2.33% for Class C shares, 1.15% for Class R6 shares, 1.46% for Administrator Class shares, and 1.19% for Institutional Class shares. After this time, the cap may be increased or the commitment to maintain the cap may be terminated only with the approval of the Board of Trustees. Prior to March 1, 2017, the Fund’s expenses were capped at 1.61% for Class A shares, 2.36% for Class B shares, 2.36% for Class C shares, 1.18% for Class R6 shares, 1.49% for Administrator Class shares, and 1.22% for Institutional Class shares.
During the six months ended April 30, 2017, State Street Bank and Trust Company, the Fund’s custodian, reimbursed the Fund $21,642 for certain out-of-pocket expenses that were billed to the Fund in error from 1998-2015. This amount is included in dividend income on the Statement of Operations. In addition, Funds Management was also reimbursed $63,842 for waivers/reimbursements it made to the Fund during the period the Fund was erroneously billed.
Distribution fees
The Trust has adopted a distribution plan for Class B and Class C shares of the Fund pursuant to Rule 12b-1 under the 1940 Act. Distribution fees are charged to Class B and Class C shares and paid to Wells Fargo Funds Distributor, LLC (“Funds Distributor”), and the principal underwriter, at an annual rate of 0.75% of the average daily net assets of Class B and Class C shares.
In addition, Funds Distributor is entitled to receive the front-end sales charge from the purchase of Class A shares and a contingent deferred sales charge on the redemption of certain Class A shares. Funds Distributor is also entitled to receive the contingent deferred sales charges from redemptions of Class B and Class C shares. For the six months ended April 30, 2017, Funds Distributor received $6,872 from the sale of Class A shares and $368 in contingent deferred sales charges from redemptions of Class C shares.
Shareholder servicing fees
The Trust has entered into contracts with one or more shareholder servicing agents, whereby Class A, Class B, Class C, and Administrator Class of the Fund are charged a fee at an annual rate of 0.25% of the average daily net assets of each respective class.
A portion of these total shareholder servicing fees were paid to affiliates of Wells Fargo.
5. INVESTMENT PORTFOLIO TRANSACTIONS
Purchases and sales of investments, excluding U.S. government obligations (if any) and short-term securities, for the six months ended April 30, 2017 were $528,466,826 and $731,326,970, respectively.
The Fund may purchase or sell investment securities to other Wells Fargo affiliates pursuant to Rule 17a-7 of the 1940 Act and under procedures adopted by the Board of Trustees. The procedures have been designed to ensure that these interfund transactions, which do not incur broker commissions, are effected at current market prices.
| | | | |
| 26 | | Wells Fargo Emerging Markets Equity Fund | | Notes to financial statements (unaudited) |
6. DERIVATIVE TRANSACTIONS
During the six months ended April 30, 017, the Fund entered into forward foreign currency contracts for economic hedging purposes.
As of April 30, 2017, the Fund did not have any open forward foreign currency contracts. The Fund had average contract amounts of $329,258 in forward foreign currency contracts to buy during the six months ended April 30, 2017.
The fair value, realized gains or losses and change in unrealized gains or losses, if any, on derivative instruments are reflected in the appropriate financial statements.
7. BANK BORROWINGS
The Trust (excluding the money market funds and certain other funds) and Wells Fargo Variable Trust are parties to a $250,000,000 revolving credit agreement whereby the Fund is permitted to use bank borrowings for temporary or emergency purposes, such as to fund shareholder redemption requests. Interest under the credit agreement is charged to the Fund based on a borrowing rate equal to the higher of the Federal Funds rate in effect on that day plus 1.25% or the overnight LIBOR rate in effect on that day plus 1.25%. In addition, an annual commitment fee equal to 0.25% of the unused balance is allocated to each participating fund.
For the six months ended April 30, 2017, there were no borrowings by the Fund under the agreement.
8. CONCENTRATION RISK
Concentration risks result from exposure to a limited number of geographic regions. A fund that invest a substantial portion of their assets in any geographic region may be more affected by changes in that geographic region than would be a fund whose investments are not heavily weighted in any geographic region.
9. INDEMNIFICATION
Under the Trust’s organizational documents, the officers and Trustees have been granted certain indemnification rights against certain liabilities that may arise out of performance of their duties to the Trust. Additionally, in the normal course of business, the Trust may enter into contracts with service providers that contain a variety of indemnification clauses. The Trust’s maximum exposure under these arrangements is dependent on future claims that may be made against the Fund and, therefore, cannot be estimated.
10. NEW ACCOUNTING PRONOUNCEMENT
In December 2016, FASB issued Accounting Standards Update (“ASU”) No. 2016-19, Technical Corrections and Improvements. ASU 2016-19 includes an amendment to FASB ASC Topic 820, Fair Value Measurement which clarifies the difference between a valuation approach and a valuation technique. The amendment also requires an entity to disclose when there has been a change in either or both a valuation approach and/or a valuation technique. The disclosure requirements are effective for fiscal years and interim periods within those fiscal years beginning after December 15, 2016. Management is currently evaluating the potential impact of this new guidance to the financial statements.
11. REGULATORY CHANGES
In October 2016, the Securities and Exchange Commission (“SEC”) adopted new rules and forms and amended existing rules and forms (together, “final rules”) intended to modernize and enhance the reporting and disclosure of information by registered investment companies and to enhance liquidity risk management by open-end mutual funds and exchange-traded funds. The final rules will enhance the quality of information available to investors and will allow the SEC to more effectively collect and use data reported by funds. In part, the final rules amend Regulation S-X and require standardized, enhanced disclosure about derivatives in the Fund’s financial statements, as well as other amendments. The compliance date for the amendments to Regulation S-X is August 1, 2017 while the compliance date for the new form types is June 1, 2018 and the compliance date for the liquidity risk management program requirements is December 1, 2018. Management is currently assessing the potential impact of these enhancements and their impact on the financial statement disclosures and reporting requirements.
| | | | | | |
| Other information (unaudited) | | Wells Fargo Emerging Markets Equity Fund | | | 27 | |
TAX INFORMATION
Pursuant to Section 853 of the Internal Revenue Code, the following amounts have been designated as foreign taxes paid for the fiscal year ended October 31, 2016. These amounts may be less than the actual foreign taxes paid for financial statement purposes. Foreign taxes paid or withheld should be included in taxable income with an offsetting deduction from gross income or as a credit for taxes paid to foreign governments. None of the income was derived from ineligible foreign sources as defined under Section 901(j) of the Internal Revenue Code.
| | | | |
Creditable
foreign taxes paid | | Per share
amount | | Foreign income as % of
ordinary income
distributions |
| $5,393,476 | | $0.0364 | | 94.53% |
PROXY VOTING INFORMATION
A description of the policies and procedures that the Fund uses to determine how to vote proxies relating to portfolio securities is available, upon request, by calling 1-800-222-8222, visiting our website at wellsfargofunds.com, or visiting the SEC website at sec.gov. Information regarding how the Fund voted proxies relating to portfolio securities during the most recent 12-month period ended June 30 is available on the Fund’s website at wellsfargofunds.com or by visiting the SEC website at sec.gov.
PORTFOLIO HOLDINGS INFORMATION
The complete portfolio holdings for the Fund are publicly available monthly on the Fund’s website (wellsfargofunds.com), on a one-month delayed basis. In addition, top ten holdings information (excluding derivative positions) for the Fund is publicly available on the Fund’s website on a monthly, seven-day or more delayed basis. The Fund files its complete schedule of portfolio holdings with the SEC for the first and third quarters of each fiscal year on Form N-Q, which is available by visiting the SEC website at sec.gov. In addition, the Fund’s Form N-Q may be reviewed and copied at the SEC’s Public Reference Room in Washington, DC, and at regional offices in New York City, at 233 Broadway, and in Chicago, at 175 West Jackson Boulevard, Suite 900. Information about the Public Reference Room may be obtained by calling 1-800-SEC-0330.
| | | | |
| 28 | | Wells Fargo Emerging Markets Equity Fund | | Other information (unaudited) |
BOARD OF TRUSTEES AND OFFICERS
Each of the Trustees and Officers1 listed in the table below acts in identical capacities for each fund in the Wells Fargo family of funds, which consists of 138 mutual funds comprising the Wells Fargo Funds Trust, Wells Fargo Variable Trust, Wells Fargo Master Trust and four closed-end funds (collectively the “Fund Complex”). This table should be read in conjunction with the Prospectus and the Statement of Additional Information2. The mailing address of each Trustee and Officer is 525 Market Street, 12th Floor, San Francisco, CA 94105. Each Trustee and Officer serves an indefinite term, however, each Trustee serves such term until reaching the mandatory retirement age established by the Trustees.
Independent Trustees
| | | | | | |
Name and year of birth | | Position held and
length of service* | | Principal occupations during past five years or longer | | Current other
public company or
investment company
directorships |
William R. Ebsworth (Born 1957) | | Trustee, since 2015 | | Retired. From 1984 to 2013, equities analyst, portfolio manager, research director and chief investment officer at Fidelity Management and Research Company in Boston, Tokyo, and Hong Kong and retired in 2013 as Chief Investment Officer of Fidelity Strategic Advisers, Inc. where he led a team of investment professionals managing client assets. Prior thereto, Board member of Hong Kong Securities Clearing Co., Hong Kong Options Clearing Corp., the Thailand International Fund, Ltd., Fidelity Investments Life Insurance Company, and Empire Fidelity Investments Life Insurance Company. Board member of the Forté Foundation (non-profit organization) and the Vincent Memorial Hospital Endowment (non-profit organization), where he serves on the Investment Committee and as a Chair of the Audit Committee. Mr. Ebsworth is a CFA® charterholder. | | Asset Allocation Trust |
Jane A. Freeman (Born 1953) | | Trustee, since 2015 | | Retired. From 2012 to 2014 and 1999 to 2008, Chief Financial Officer of Scientific Learning Corporation. From 2008 to 2012, Ms. Freeman provided consulting services related to strategic business projects. Prior to 1999, Portfolio Manager at Rockefeller & Co. and Scudder, Stevens & Clark. Board member of the Harding Loevner Funds from 1996 to 2014, serving as both Lead Independent Director and chair of the Audit Committee. Board member of the Russell Exchange Traded Funds Trust from 2011 to 2012 and the chair of the Audit Committee. Ms. Freeman is a Board Member of Ruth Bancroft Garden (non-profit organization) and an inactive chartered financial analyst. | | Asset Allocation Trust |
Peter G. Gordon** (Born 1942) | | Trustee, since 1998; Chairman, since 2005 | | Co-Founder, Retired Chairman, President and CEO of Crystal Geyser Water Company. Trustee Emeritus, Colby College. | | Asset Allocation Trust |
Isaiah Harris, Jr. (Born 1952) | | Trustee, since 2009 | | Retired. Chairman of the Board of CIGNA Corporation since 2009, and Director since 2005. From 2003 to 2011, Director of Deluxe Corporation. Prior thereto, President and CEO of BellSouth Advertising and Publishing Corp. from 2005 to 2007, President and CEO of BellSouth Enterprises from 2004 to 2005 and President of BellSouth Consumer Services from 2000 to 2003. Emeritus member of the Iowa State University Foundation Board of Governors. Emeritus Member of the Advisory Board of Iowa State University School of Business. Advisory Board Member, Palm Harbor Academy (charter school). Advisory Board Member, Child Evangelism Fellowship (non-profit). Mr. Harris is a certified public accountant (inactive status). | | CIGNA Corporation; Asset Allocation Trust |
Judith M. Johnson (Born 1949) | | Trustee, since 2008; Audit Committee Chairman, since 2008 | | Retired. Prior thereto, Chief Executive Officer and Chief Investment Officer of Minneapolis Employees Retirement Fund from 1996 to 2008. Ms. Johnson is an attorney, certified public accountant and a certified managerial accountant. | | Asset Allocation Trust |
David F. Larcker (Born 1950) | | Trustee, since 2009 | | James Irvin Miller Professor of Accounting at the Graduate School of Business, Stanford University, Director of the Corporate Governance Research Initiative and Senior Faculty of The Rock Center for Corporate Governance since 2006. From 2005 to 2008, Professor of Accounting at the Graduate School of Business, Stanford University. Prior thereto, Ernst & Young Professor of Accounting at The Wharton School, University of Pennsylvania from 1985 to 2005. | | Asset Allocation Trust |
| | | | | | |
| Other information (unaudited) | | Wells Fargo Emerging Markets Equity Fund | | | 29 | |
| | | | | | |
Name and year of birth | | Position held and
length of service* | | Principal occupations during past five years or longer | | Current other
public company or
investment company
directorships |
Olivia S. Mitchell (Born 1953) | | Trustee, since 2006 | | International Foundation of Employee Benefit Plans Professor, Wharton School of the University of Pennsylvania since 1993. Director of Wharton’s Pension Research Council and Boettner Center on Pensions & Retirement Research, and Research Associate at the National Bureau of Economic Research. Previously, Cornell University Professor from 1978 to 1993. | | Asset Allocation Trust |
Timothy J. Penny (Born 1951) | | Trustee, since 1996;
Vice Chairman, since 2017 | | President and Chief Executive Officer of Southern Minnesota Initiative Foundation, a non-profit organization, since 2007 and Senior Fellow at the Humphrey Institute Policy Forum at the University of Minnesota since 1995. Member of the Board of Trustees of NorthStar Education Finance, Inc., a non-profit organization, since 2007. | | Asset Allocation Trust |
Michael S. Scofield (Born 1943) | | Trustee, since 2010 | | Served on the Investment Company Institute’s Board of Governors and Executive Committee from 2008-2011 as well the Governing Council of the Independent Directors Council from 2006-2011 and the Independent Directors Council Executive Committee from 2008-2011. Chairman of the IDC from 2008-2010. Institutional Investor (Fund Directions) Trustee of Year in 2007. Trustee of the Evergreen Funds complex (and its predecessors) from 1984 to 2010. Chairman of the Evergreen Funds from 2000-2010. Former Trustee of the Mentor Funds. Retired Attorney, Law Offices of Michael S. Scofield. | | Asset Allocation Trust |
| * | Length of service dates reflect the Trustee’s commencement of service with the Trust’s predecessor entities, where applicable. |
| ** | Peter Gordon is expected to retire on December 31, 2017. |
Officers
| | | | | | |
Name and year of birth | | Position held and length of service | | Principal occupations during past five years or longer | | |
Andrew Owen (Born 1960) | | President, since 2017 | | Executive Vice President of Wells Fargo & Company and Head of Affiliated Managers, Wells Fargo Asset Management, since 2014. In addition, Mr. Owen is currently President, Chief Executive Officer and Director of Wells Fargo Funds Management, LLC since 2017. Prior thereto, Executive Vice President responsible for marketing, investments and product development for Wells Fargo Funds Management, LLC, from 2009 to 2014. | | |
Jeremy DePalma1 (Born 1974) | | Treasurer, since 2012 | | Senior Vice President of Wells Fargo Funds Management, LLC since 2009. Senior Vice President of Evergreen Investment Management Company, LLC from 2008 to 2010 and head of the Fund Reporting and Control Team within Fund Administration from 2005 to 2010. | | |
C. David Messman (Born 1960) | | Secretary, since 2000; Chief Legal Officer, since 2003 | | Senior Vice President and Secretary of Wells Fargo Funds Management, LLC since 2001. Assistant General Counsel of Wells Fargo Bank, N.A. since 2013 and Vice President and Managing Counsel of Wells Fargo Bank, N.A. from 1996 to 2013. | | |
Michael Whitaker (Born 1967) | | Chief Compliance Officer, since 2016 | | Senior Vice President and Chief Compliance Officer since 2016. Senior Vice President and Chief Compliance Officer for Fidelity Investments from 2007 to 2016. | | |
David Berardi (Born 1975) | | Assistant Treasurer, since 2009 | | Vice President of Wells Fargo Funds Management, LLC since 2009. Vice President of Evergreen Investment Management Company, LLC from 2008 to 2010. Manager of Fund Reporting and Control for Evergreen Investment Management Company, LLC from 2004 to 2010. | | |
| 1 | Jeremy DePalma acts as Treasurer of 69 funds and Assistant Treasurer of 69 funds in the Fund Complex. |
| 2 | The Statement of Additional Information includes additional information about the Trustees and is available, without charge, upon request, by calling 1-800-222-8222 or by visiting the website at wellsfargofunds.com. |
| | | | |
| 30 | | Wells Fargo Emerging Markets Equity Fund | | List of abbreviations |
The following is a list of common abbreviations for terms and entities that may have appeared in this report.
| ACA | — ACA Financial Guaranty Corporation |
| ADR | — American depositary receipt |
| ADS | — American depositary shares |
| AGC | — Assured Guaranty Corporation |
| AGM | — Assured Guaranty Municipal |
| Ambac | — Ambac Financial Group Incorporated |
| AMT | — Alternative minimum tax |
| BAN | — Bond anticipation notes |
| BHAC | — Berkshire Hathaway Assurance Corporation |
| CAB | — Capital appreciation bond |
| CCAB | — Convertible capital appreciation bond |
| CDA | — Community Development Authority |
| CDO | — Collateralized debt obligation |
| DRIVER | — Derivative inverse tax-exempt receipts |
| DW&P | — Department of Water & Power |
| DWR | — Department of Water Resources |
| ECFA | — Educational & Cultural Facilities Authority |
| EDA | — Economic Development Authority |
| EDFA | — Economic Development Finance Authority |
| ETF | — Exchange-traded fund |
| FDIC | — Federal Deposit Insurance Corporation |
| FFCB | — Federal Farm Credit Banks |
| FGIC | — Financial Guaranty Insurance Corporation |
| FHA | — Federal Housing Administration |
| FHLB | — Federal Home Loan Bank |
| FHLMC | — Federal Home Loan Mortgage Corporation |
| FICO | — The Financing Corporation |
| FNMA | — Federal National Mortgage Association |
| GDR | — Global depositary receipt |
| GNMA | — Government National Mortgage Association |
| HCFR | — Healthcare facilities revenue |
| HEFA | — Health & Educational Facilities Authority |
| HEFAR | — Higher education facilities authority revenue |
| HFA | — Housing Finance Authority |
| HFFA | — Health Facilities Financing Authority |
| HUD | — Department of Housing and Urban Development |
| IDA | — Industrial Development Authority |
| IDAG | — Industrial Development Agency |
| KRW | — Republic of Korea won |
| LIBOR | — London Interbank Offered Rate |
| LIFER | — Long Inverse Floating Exempt Receipts |
| LLC | — Limited liability company |
| LLLP | — Limited liability limited partnership |
| LLP | — Limited liability partnership |
| MBIA | — Municipal Bond Insurance Association |
| MFHR | — Multifamily housing revenue |
| MSTR | — Municipal securities trust receipts |
| MUD | — Municipal Utility District |
| National | — National Public Finance Guarantee Corporation |
| PCFA | — Pollution Control Financing Authority |
| PCL | — Public Company Limited |
| PCR | — Pollution control revenue |
| PFA | — Public Finance Authority |
| PFFA | — Public Facilities Financing Authority |
| PFOTER | — Puttable floating option tax-exempt receipts |
| plc | — Public limited company |
| PUTTER | — Puttable tax-exempt receipts |
| R&D | — Research & development |
| Radian | — Radian Asset Assurance |
| RAN | — Revenue anticipation notes |
| RDA | — Redevelopment Authority |
| RDFA | — Redevelopment Finance Authority |
| REIT | — Real estate investment trust |
| ROC | — Reset option certificates |
| SAVRS | — Select auction variable rate securities |
| SBA | — Small Business Authority |
| SDR | — Swedish depositary receipt |
| SFHR | — Single-family housing revenue |
| SFMR | — Single-family mortgage revenue |
| SPA | — Standby purchase agreement |
| SPDR | — Standard & Poor’s Depositary Receipts |
| SPEAR | — Short Puttable Exempt Adjustable Receipts |
| STRIPS | — Separate trading of registered interest and |
| TAN | — Tax anticipation notes |
| TIPS | — Treasury inflation-protected securities |
| TRAN | — Tax revenue anticipation notes |
| TTFA | — Transportation Trust Fund Authority |
| TVA | — Tennessee Valley Authority |
This page is intentionally left blank.
This page is intentionally left blank.

For more information
More information about Wells Fargo Funds is available free upon request. To obtain literature, please write, email, visit the Fund’s website, or call:
Wells Fargo Funds
P.O. Box 8266
Boston, MA 02266-8266
Email: fundservice@wellsfargo.com
Website: wellsfargofunds.com
Individual investors: 1-800-222-8222
Retail investment professionals: 1-888-877-9275
Institutional investment professionals:
1-866-765-0778
This report and the financial statements contained herein are submitted for the general information of the shareholders of the Fund. If this report is used for promotional purposes, distribution of the report must be accompanied or preceded by a current prospectus. Before investing, please consider the investment objectives, risks, charges, and expenses of the investment. For a current prospectus and, if available, a summary prospectus, containing this information, call 1-800-222-8222 or visit the Fund’s website at wellsfargofunds.com. Read the prospectus carefully before you invest or send money.
Wells Fargo Asset Management (WFAM) is a trade name used by the asset management businesses of Wells Fargo & Company. Wells Fargo Funds Management, LLC, a wholly owned subsidiary of Wells Fargo & Company, provides investment advisory and administrative services for Wells Fargo Funds. Other affiliates of Wells Fargo & Company provide subadvisory and other services for the funds. The funds are distributed by Wells Fargo Funds Distributor, LLC, Member FINRA, an affiliate of Wells Fargo & Company. Neither Wells Fargo Funds Management nor Wells Fargo Funds Distributor has Fund customer accounts/assets, and neither provides investment advice/recommendations or acts as an investment advice fiduciary to any investor.
NOT FDIC INSURED ◾ NO BANK GUARANTEE ◾ MAY LOSE VALUE
© 2017 Wells Fargo Funds Management, LLC. All rights reserved.
| | |
 | | 303214 06-17 SA238/SAR238 04-17 |
Semi-Annual Report
April 30, 2017

Wells Fargo
Emerging Markets Equity Income Fund


Reduce clutter. Save trees.
Sign up for electronic delivery of prospectuses and shareholder reports at wellsfargo.com/advantagedelivery
Contents
The views expressed and any forward-looking statements are as of April 30, 2017, unless otherwise noted, and are those of the Fund managers and/or Wells Fargo Funds Management, LLC. Discussions of individual securities, or the markets generally, or any Wells Fargo Fund are not intended as individual recommendations. Future events or results may vary significantly from those expressed in any forward-looking statements. The views expressed are subject to change at any time in response to changing circumstances in the market. Wells Fargo Funds Management, LLC and the Fund disclaim any obligation to publicly update or revise any views expressed or forward-looking statements.
NOT FDIC INSURED ◾ NO BANK GUARANTEE ◾ MAY LOSE VALUE
| | | | |
| 2 | | Wells Fargo Emerging Markets Equity Income Fund | | Letter to shareholders (unaudited) |

Andrew Owen
President
Wells Fargo Funds
Despite heightened market volatility at times, in general, global stocks delivered double-digit returns while bond markets were hurt by a rise in interest rates during the latter part of 2016.
Dear Shareholder:
As the new president of Wells Fargo Funds, now that Karla Rabusch is retiring from that position after nearly 14 years, I am pleased to offer you this semi-annual report for the Wells Fargo Emerging Markets Equity Income Fund for the six-month period that ended April 30, 2017. Despite heightened market volatility at times, in general, global stocks delivered double-digit returns while bond markets were hurt by a rise in interest rates during the latter part of 2016. U.S. and international stocks returned 13.31% and 10.37% for the six-month period, respectively, as measured by the S&P 500 Index1 and the MSCI ACWI ex USA Index (Net)2; within fixed income, the Bloomberg Barclays U.S. Aggregate Bond Index3 returned -0.67%.
During the last two months of 2016, prospects for faster growth and higher interest rates in the U.S. influenced markets.
Following Donald Trump’s election as president in early November, U.S. stocks began to rally. Investors appeared optimistic that the new administration would usher in a series of progrowth policies, and supportive economic news helped the rally carry through the end of 2016. The buoyant environment sent interest rates higher as well. At its mid-December meeting, Fed officials raised their short-term target interest rate for the first time in a year by a quarter percentage point to between 0.50% and 0.75%. Outside of the U.S., the prospects for faster U.S. growth appeared to trigger some acceleration in Europe. The improvement may be partly attributable to expectations for further strengthening of the U.S. dollar, which in turn could improve demand for European goods in the U.S. due to weakening of the euro relative to the dollar. Rising inflation across the eurozone and Japan caused an upward shift in yield curves in those areas, although developed-country bond yields remained significantly lower than U.S. Treasury yields.
Globally, stocks delivered positive results and economies showed improvement in the first four months of 2017.
Stocks rallied globally, supported by signs of improvement in the U.S. and global economies. In the U.S., hiring remained strong and business and consumer sentiment improved. Meanwhile, inflation inched up. In March, Fed officials raised their short-term target interest rate by a quarter percentage point to between 0.75% and 1.00%. With the Fed’s target-rate increase, short-term bond yields rose. Longer-term Treasury yields were little changed, however, leading to positive performance. Investment-grade corporate bonds and high-yield bonds benefited from strong demand. Municipal bond returns were also positive during the first four months of 2017, helped by strong demand and constrained new-issue supply. Outside the U.S., stocks in emerging markets benefited from both global economic growth and recent weakening in the U.S. dollar. European stocks also advanced as political risk declined. In the first round of the French presidential elections, Emmanuel Macron, a pro-EU candidate, garnered the most votes. Non-U.S. bonds also benefited from a decline in perceived risk, with credit spreads continuing to narrow.
| 1 | The S&P 500 Index consists of 500 stocks chosen for market size, liquidity, and industry group representation. It is a market-value-weighted index with each stock’s weight in the index proportionate to its market value. You cannot invest directly in an index. |
| 2 | The Morgan Stanley Capital International (MSCI) All Country World Index (ACWI) ex USA Index (Net) is a free-float-adjusted market-capitalization-weighted index that is designed to measure the equity market performance of developed markets, excluding the United States and Canada. Source: MSCI. MSCI makes no express or implied warranties or representations and shall have no liability whatsoever with respect to any MSCI data contained herein. The MSCI data may not be further redistributed or used as a basis for other indexes or any securities or financial products. This report is not approved, reviewed, or produced by MSCI. You cannot invest directly in an index. |
| 3 | The Bloomberg Barclays U.S. Aggregate Bond Index (formerly known as Barclays U.S. Aggregate Bond Index) is a broad-based benchmark that measures the investment-grade, U.S. dollar–denominated, fixed-rate taxable bond market, including Treasuries, government-related and corporate securities, mortgage-backed securities (agency fixed-rate and hybrid adjustable-rate mortgage pass-throughs), asset-backed securities, and commercial mortgage-backed securities. You cannot invest directly in an index. |
| | | | | | |
| Letter to shareholders (unaudited) | | Wells Fargo Emerging Markets Equity Income Fund | | | 3 | |
Don’t let short-term uncertainty derail long-term investment goals.
Periods of uncertainty can present challenges, but experience has taught us that maintaining long-term investment goals can be an effective way to plan for the future. To help you create a sound strategy based on your personal goals and risk tolerance, Wells Fargo Funds offers more than 100 mutual funds spanning a wide range of asset classes and investment styles. Although diversification cannot guarantee an investment profit or prevent losses, we believe it can be an effective way to manage investment risk and potentially smooth out overall portfolio performance. We encourage investors to know their investments and to understand that appropriate levels of risk-taking may unlock opportunities.
Thank you for choosing to invest in Wells Fargo Funds. We appreciate your confidence in us and remain committed to helping you meet your financial needs.
Sincerely,

Andrew Owen
President
Wells Fargo Funds
Although diversification cannot guarantee an investment profit or prevent losses, we believe it can be an effective way to manage investment risk and potentially smooth out overall portfolio performance.
For further information about your Fund, contact your investment professional, visit our website at wellsfargofunds.com, or call us directly at 1-800-222-8222. We are available 24 hours a day, 7 days a week.
| | | | |
| 4 | | Wells Fargo Emerging Markets Equity Income Fund | | Performance highlights (unaudited) |
Investment objective
The Fund seeks to achieve long-term capital appreciation and current income.
Manager
Wells Fargo Funds Management, LLC
Subadviser
Wells Capital Management Incorporated
Portfolio managers
Anthony L.T. Cragg
Alison Shimada
Average annual total returns (%) as of April 30, 20171
| | | | | | | | | | | | | | | | | | | | | | | | | | |
| | | | | Including sales charge | | | Excluding sales charge | | | Expense ratios2 (%) | |
| | | Inception date | | 1 year | | | Since inception | | | 1 year | | | Since inception | | | Gross | | | Net3 | |
| Class A (EQIAX) | | 5-31-2012 | | | 5.45 | | | | 3.89 | | | | 11.83 | | | | 5.15 | | | | 1.72 | | | | 1.65 | |
| Class C (EQICX) | | 5-31-2012 | | | 10.06 | | | | 4.38 | | | | 11.06 | | | | 4.38 | | | | 2.47 | | | | 2.40 | |
| Class R (EQIHX) | | 9-30-2015 | | | – | | | | – | | | | 11.58 | | | | 4.89 | | | | 1.97 | | | | 1.90 | |
| Class R6 (EQIRX) | | 9-30-2015 | | | – | | | | – | | | | 12.36 | | | | 5.60 | | | | 1.29 | | | | 1.20 | |
| Administrator Class (EQIDX) | | 5-31-2012 | | | – | | | | – | | | | 12.18 | | | | 5.39 | | | | 1.64 | | | | 1.48 | |
| Institutional Class (EQIIX) | | 5-31-2012 | | | – | | | | – | | | | 12.25 | | | | 5.57 | | | | 1.39 | | | | 1.25 | |
| MSCI EM Index (Net)4 | | – | | | – | | | | – | | | | 19.13 | | | | 4.00 | | | | – | | | | – | |
Figures quoted represent past performance, which is no guarantee of future results, and do not reflect taxes that a shareholder may pay on fund distributions or the redemption of fund shares. Investment return and principal value of an investment will fluctuate so that an investor’s shares, when redeemed, may be worth more or less than their original cost. Performance shown without sales charges would be lower if sales charges were reflected. Current performance may be lower or higher than the performance data quoted, which assumes the reinvestment of dividends and capital gains. Current month-end performance is available on the Fund’s website, wellsfargofunds.com.
Index returns do not include transaction costs associated with buying and selling securities, any mutual fund fees or expenses, or any taxes. It is not possible to invest directly in an index.
For Class A shares, the maximum front-end sales charge is 5.75%. For Class C shares, the maximum contingent deferred sales charge is 1.00%. Performance including a contingent deferred sales charge assumes the sales charge for the corresponding time period. Class R, Class R6, Administrator Class, and Institutional Class shares are sold without a front-end sales charge or contingent deferred sales charge.
Stock values fluctuate in response to the activities of individual companies and general market and economic conditions. Foreign investments are especially volatile and can rise or fall dramatically due to differences in the political and economic conditions of the host country. These risks are generally intensified in emerging markets. The use of derivatives may reduce returns and/or increase volatility. Certain investment strategies tend to increase the total risk of investment (relative to the broader market). The Fund is exposed to smaller-company securities risk. Consult the Fund’s prospectus for additional information on these and other risks.
Please see footnotes on page 5.
| | | | | | |
| Performance highlights (unaudited) | | Wells Fargo Emerging Markets Equity Income Fund | | | 5 | |
| | | | |
| Ten largest holdings (%) as of April 30, 20175 | |
Samsung Electronics Company Limited | | | 3.26 | |
China Construction Bank H Shares | | | 3.00 | |
Industrial & Commercial Bank of China Limited H Shares | | | 2.80 | |
China Petroleum & Chemical Corporation H Shares | | | 2.07 | |
Taiwan Semiconductor Manufacturing Company Limited | | | 1.95 | |
China Mobile Limited | | | 1.93 | |
Itausa Investimentos Itau SA | | | 1.88 | |
Banco Bradesco SA | | | 1.85 | |
SK Telecom Company Limited ADR | | | 1.73 | |
Hon Hai Precision Industry Company Limited | | | 1.58 | |
|
| Country allocation as of April 30, 20176 |
|

|
|
| Sector distribution as of April 30, 20176 |
|
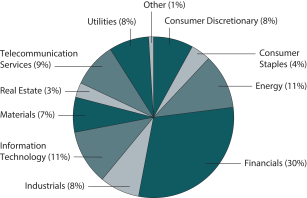
|
| 1 | Historical performance shown for the Class R shares prior to their inception reflects the performance of the Administrator Class shares, adjusted to reflect the higher expenses applicable to Class R shares. Historical performance shown for the Class R6 shares prior to their inception reflects the performance of the Institutional Class shares, and includes the higher expenses applicable to Institutional Class shares. If these expenses had not been included, returns for Class R6 shares would be higher. |
| 2 | Reflects the expense ratios as stated in the most recent prospectuses, which include the impact of 0.03% in acquired fund fees and expenses. The expense ratios shown are subject to change and may differ from the annualized expense ratios shown in the financial highlights of this report, which do not include acquired fund fees and expenses. |
| 3 | The manager has contractually committed through February 28, 2018 to waive fees and/or reimburse expenses to the extent necessary to cap the Fund’s Total Annual Operating Expenses After Fee Waiver at 1.62% for Class A, 2.37% for Class C, 1.87% for Class R, 1.17% for Class R6, 1.45% for Administrator Class, and 1.22% for Institutional Class. After this time, the cap may be increased or the commitment to maintain the cap may be terminated only with the approval of the Board of Trustees. Brokerage commissions, stamp duty fees, interest, taxes, acquired fund fees and expenses, and extraordinary expenses are excluded from the expense cap. Without this cap, the Fund’s returns would have been lower. The expense ratio paid by an investor is the net expense ratio or the Fund’s Total Annual Fund Operating Expenses After Fee Waivers, as stated in the prospectuses. |
| 4 | The Morgan Stanley Capital International (MSCI) Emerging Markets (EM) Index (Net) is a free-float-adjusted market-capitalization-weighted index that is designed to measure the equity market performance of emerging markets. The MSCI EM Index (Net) consists of the following 23 emerging markets country indexes: Brazil, Chile, China, Colombia, Czech Republic, Egypt, Greece, Hungary, India, Indonesia, Korea, Malaysia, Mexico, Peru, the Philippines, Poland, Qatar, Russia, South Africa, Taiwan, Thailand, Turkey, and United Arab Emirates. Source: MSCI. MSCI makes no express or implied warranties or representations and shall have no liability whatsoever with respect to any MSCI data contained herein. The MSCI data may not be further redistributed or used as a basis for other indexes or any securities or financial products. This report is not approved, reviewed, or produced by MSCI. You cannot invest directly in an index. |
| 5 | The ten largest holdings, excluding cash and cash equivalents, are calculated based on the value of the investments divided by total net assets of the Fund. Holdings are subject to change and may have changed since the date specified. |
| 6 | Amounts are calculated based on the total long-term investments of the Fund. These amounts are subject to change and may have changed since the date specified. |
| | | | |
| 6 | | Wells Fargo Emerging Markets Equity Income Fund | | Fund expenses (unaudited) |
As a shareholder of the Fund, you incur two types of costs: (1) transaction costs, including sales charges (loads) on purchase payments and contingent deferred sales charges (if any) on redemptions and (2) ongoing costs, including management fees, distribution (12b-1) and/or shareholder servicing fees, and other Fund expenses. This example is intended to help you understand your ongoing costs (in dollars) of investing in the Fund and to compare these costs with the ongoing costs of investing in other mutual funds.
The example is based on an investment of $1,000 invested at the beginning of the six-month period and held for the entire period from November 1, 2016 to April 30, 2017.
Actual expenses
The “Actual” line of the table below provides information about actual account values and actual expenses. You may use the information in this line, together with the amount you invested, to estimate the expenses that you paid over the period. Simply divide your account value by $1,000 (for example, an $8,600 account value divided by $1,000 = 8.6), then multiply the result by the number in the “Actual” line under the heading entitled “Expenses paid during period” for your applicable class of shares to estimate the expenses you paid on your account during this period.
Hypothetical example for comparison purposes
The “Hypothetical” line of the table below provides information about hypothetical account values and hypothetical expenses based on the Fund’s actual expense ratio and an assumed rate of return of 5% per year before expenses, which is not the Fund’s actual return. The hypothetical account values and expenses may not be used to estimate the actual ending account balance or expenses you paid for the period. You may use this information to compare the ongoing costs of investing in the Fund and other funds. To do so, compare this 5% hypothetical example with the 5% hypothetical examples that appear in the shareholder reports of the other funds.
Please note that the expenses shown in the table are meant to highlight your ongoing costs only and do not reflect any transactional costs, such as sales charges (loads) and contingent deferred sales charges. Therefore, the “Hypothetical” line of the table is useful in comparing ongoing costs only and will not help you determine the relative total costs of owning different funds. In addition, if these transactional costs were included, your costs would have been higher.
| | | | | | | | | | | | | | | | |
| | | Beginning
account value
11-1-2016 | | | Ending
account value
4-30-2017 | | | Expenses
paid during
the period¹ | | | Annualized net
expense ratio | |
Class A | | | | | | | | | | | | | | | | |
Actual | | $ | 1,000.00 | | | $ | 1,061.69 | | | $ | 8.38 | | | | 1.64 | % |
Hypothetical (5% return before expenses) | | $ | 1,000.00 | | | $ | 1,016.66 | | | $ | 8.20 | | | | 1.64 | % |
Class C | | | | | | | | | | | | | | | | |
Actual | | $ | 1,000.00 | | | $ | 1,057.41 | | | $ | 12.19 | | | | 2.39 | % |
Hypothetical (5% return before expenses) | | $ | 1,000.00 | | | $ | 1,012.94 | | | $ | 11.93 | | | | 2.39 | % |
Class R | | | | | | | | | | | | | | | | |
Actual | | $ | 1,000.00 | | | $ | 1,059.51 | | | $ | 9.65 | | | | 1.89 | % |
Hypothetical (5% return before expenses) | | $ | 1,000.00 | | | $ | 1,015.42 | | | $ | 9.44 | | | | 1.89 | % |
Class R6 | | | | | | | | | | | | | | | | |
Actual | | $ | 1,000.00 | | | $ | 1,063.76 | | | $ | 6.04 | | | | 1.18 | % |
Hypothetical (5% return before expenses) | | $ | 1,000.00 | | | $ | 1,018.94 | | | $ | 5.91 | | | | 1.18 | % |
Administrator Class | | | | | | | | | | | | | | | | |
Actual | | $ | 1,000.00 | | | $ | 1,062.68 | | | $ | 7.42 | | | | 1.45 | % |
Hypothetical (5% return before expenses) | | $ | 1,000.00 | | | $ | 1,017.60 | | | $ | 7.25 | | | | 1.45 | % |
Institutional Class | | | | | | | | | | | | | | | | |
Actual | | $ | 1,000.00 | | | $ | 1,062.13 | | | $ | 6.34 | | | | 1.24 | % |
Hypothetical (5% return before expenses) | | $ | 1,000.00 | | | $ | 1,018.65 | | | $ | 6.21 | | | | 1.24 | % |
| 1 | Expenses paid is equal to the annualized net expense ratio of each class multiplied by the average account value over the period, multiplied by the number of days in the most recent fiscal half-year divided by the number of days in the fiscal year (to reflect the one-half-year period). |
| | | | | | |
| Portfolio of investments—April 30, 2017 (unaudited) | | Wells Fargo Emerging Markets Equity Income Fund | | | 7 | |
| | | | | | | | | | | | | | | | |
| Security name | | | | | | | | Shares | | | Value | |
| | | | |
Common Stocks: 84.64% | | | | | | | | | | | | | | | | |
| | | | |
| Argentina: 0.49% | | | | | | | | | | | | | | | | |
Banco Macro SA (Financials, Banks) | | | | | | | | | | | 28,625 | | | $ | 2,453,735 | |
| | | | | | | | | | | | | | | | |
| | | | |
| Brazil: 5.58% | | | | | | | | | | | | | | | | |
Ambev SA (Consumer Staples, Beverages) | | | | | | | | | | | 409,900 | | | | 2,358,115 | |
Banco do Brasil SA (Financials, Banks) | | | | | | | | | | | 599,700 | | | | 6,206,627 | |
BB Seguridade Participacoes SA (Financials, Insurance) | | | | | | | | | | | 663,096 | | | | 6,244,369 | |
CCR SA (Industrials, Transportation Infrastructure) | | | | | | | | | | | 628,100 | | | | 3,502,582 | |
Energisa SA (Utilities, Electric Utilities) | | | | | | | | | | | 391,400 | | | | 2,805,359 | |
Itausa Investimentos Itau SA Interim Shares (Financials, Banks) †(a) | | | | | | | | | | | 1,589 | | | | 4,621 | |
Petroleo Brasileiro SA ADR Class A (Energy, Oil, Gas & Consumable Fuels) † | | | | | | | | | | | 519,970 | | | | 4,539,338 | |
WEG SA (Industrials, Machinery) | | | | | | | | | | | 450,800 | | | | 2,513,873 | |
| | | | |
| | | | | | | | | | | | | | | 28,174,884 | |
| | | | | | | | | | | | | | | | |
| | | | |
| Cayman Islands: 1.03% | | | | | | | | | | | | | | | | |
ANTA Sports Products Limited (Consumer Discretionary, Textiles, Apparel & Luxury Goods) | | | | | | | | | | | 377,000 | | | | 1,059,023 | |
Wynn Macau Limited (Consumer Discretionary, Hotels, Restaurants & Leisure) | | | | | | | | | | | 1,871,600 | | | | 4,114,544 | |
| | | | |
| | | | | | | | | | | | | | | 5,173,567 | |
| | | | | | | | | | | | | | | | |
| | | | |
| Chile: 0.96% | | | | | | | | | | | | | | | | |
Enersis SA ADR (Utilities, Electric Utilities) | | | | | | | | | | | 489,949 | | | | 4,855,395 | |
| | | | | | | | | | | | | | | | |
| | | | |
| China: 23.17% | | | | | | | | | | | | | | | | |
Anhui Conch Cement Company Limited H Shares (Materials, Construction Materials) | | | | | | | | | | | 716,000 | | | | 2,508,373 | |
Bank of China Limited H Shares (Financials, Banks) | | | | | | | | | | | 13,752,000 | | | | 6,665,300 | |
Beijing Capital International Airport Company Limited H Shares (Industrials, Transportation Infrastructure) | | | | | | | | | | | 3,400,000 | | | | 4,799,475 | |
China Communications Construction Company Limited H Shares (Industrials, Construction & Engineering) | | | | | | | | | | | 1,720,000 | | | | 2,366,055 | |
China Construction Bank H Shares (Financials, Banks) | | | | | | | | | | | 18,641,000 | | | | 15,146,030 | |
China Galaxy Securities Company Limited H Shares (Financials, Capital Markets) | | | | | | | | | | | 6,722,500 | | | | 6,136,231 | |
China Mobile Limited (Telecommunication Services, Wireless Telecommunication Services) | | | | | | | | | | | 915,000 | | | | 9,757,757 | |
China Petroleum & Chemical Corporation H Shares (Energy, Oil, Gas & Consumable Fuels) | | | | | | | | | | | 12,873,600 | | | | 10,426,849 | |
China Power International Development Limited (Utilities, Independent Power & Renewable Electricity Producers) | | | | | | | | | | | 17,678,000 | | | | 6,590,884 | |
China Resources Land Limited (Real Estate, Real Estate Management & Development) | | | | | | | | | | | 2,112,000 | | | | 5,864,894 | |
China State Construction International Holdings Limited (Industrials, Construction & Engineering) | | | | | | | | | | | 2,048,000 | | | | 3,717,724 | |
CNOOC Limited (Energy, Oil, Gas & Consumable Fuels) | | | | | | | | | | | 3,327,000 | | | | 3,879,472 | |
Huaneng Power International Incorporated H Shares (Utilities, Independent Power & Renewable Electricity Producers) | | | | | | | | | | | 3,878,000 | | | | 2,677,285 | |
Industrial & Commercial Bank of China Limited H Shares (Financials, Banks) | | | | | | | | | | | 21,620,000 | | | | 14,119,910 | |
Nine Dragons Paper Holdings Limited (Materials, Paper & Forest Products) | | | | | | | | | | | 1,524,000 | | | | 1,645,799 | |
PetroChina Company Limited H Shares (Energy, Oil, Gas & Consumable Fuels) | | | | | | | | | | | 8,272,000 | | | | 5,827,786 | |
PICC Property & Casualty Company Limited H Shares (Financials, Insurance) | | | | | | | | | | | 2,752,000 | | | | 4,429,608 | |
Sinotrans Limited H Shares (Industrials, Air Freight & Logistics) | | | | | | | | | | | 10,330,000 | | | | 4,648,158 | |
Zhejiang Expressway Company Limited (Industrials, Transportation Infrastructure) | | | | | | | | | | | 1,928,000 | | | | 2,399,357 | |
Zijin Mining Group Company Limited H Shares (Materials, Metals & Mining) | | | | | | | | | | | 9,484,000 | | | | 3,353,025 | |
| | | | |
| | | | | | | | | | | | | | | 116,959,972 | |
| | | | | | | | | | | | | | | | |
| | | | |
| India: 6.16% | | | | | | | | | | | | | | | | |
Bharat Petroleum Corporation Limited (Energy, Oil, Gas & Consumable Fuels) | | | | | | | | | | | 372,616 | | | | 4,166,082 | |
Bharti Infratel Limited (Telecommunication Services, Diversified Telecommunication Services) | | | | | | | | | | | 710,997 | | | | 3,920,265 | |
The accompanying notes are an integral part of these financial statements.
| | | | |
| 8 | | Wells Fargo Emerging Markets Equity Income Fund | | Portfolio of investments—April 30, 2017 (unaudited) |
| | | | | | | | | | | | | | | | |
| Security name | | | | | | | | Shares | | | Value | |
| | | | |
| India (continued) | | | | | | | | | | | | | | | | |
Coal India Limited (Energy, Oil, Gas & Consumable Fuels) | | | | | | | | | | | 550,279 | | | $ | 2,366,465 | |
Credit Analysis & Research Limited (Financials, Capital Markets) | | | | | | | | | | | 22,420 | | | | 550,289 | |
HCL Technologies Limited (Information Technology, IT Services) | | | | | | | | | | | 187,147 | | | | 2,368,356 | |
Hero Honda Motors Limited (Consumer Discretionary, Automobiles) | | | | | | | | | | | 94,491 | | | | 4,874,519 | |
Infosys Technologies Limited (Information Technology, IT Services) | | | | | | | | | | | 235,238 | | | | 3,360,360 | |
NTPC Limited (Utilities, Independent Power & Renewable Electricity Producers) | | | | | | | | | | | 1,547,503 | | | | 3,957,162 | |
Oil & Natural Gas Corporation Limited (Energy, Oil, Gas & Consumable Fuels) | | | | | | | | | | | 1,147,476 | | | | 3,327,556 | |
Vedanta Limited (Materials, Metals & Mining) | | | | | | | | | | | 587,067 | | | | 2,222,605 | |
| | | | |
| | | | | | | | | | | | | | | 31,113,659 | |
| | | | | | | | | | | | | | | | |
| | | | |
| Indonesia: 3.35% | | | | | | | | | | | | | | | | |
PT Bank Rakyat Indonesia Tbk (Financials, Banks) | | | | | | | | | | | 5,167,600 | | | | 5,001,278 | |
PT Cikarang Listrindo Tbk (Utilities, Independent Power & Renewable Electricity Producers) | | | | | | | | | | | 19,197,400 | | | | 1,857,952 | |
PT Matahari Department Store Tbk (Consumer Discretionary, Multiline Retail) | | | | | | | | | | | 2,474,100 | | | | 2,710,020 | |
PT Telekomunikasi Indonesia Persero Tbk (Telecommunication Services, Diversified Telecommunication Services) | | | | | | | | | | | 22,374,500 | | | | 7,335,626 | |
| | | | |
| | | | | | | | | | | | | | | 16,904,876 | |
| | | | | | | | | | | | | | | | |
| | | | |
| Luxembourg: 0.91% | | | | | | | | | | | | | | | | |
Ternium SA (Materials, Metals & Mining) | | | | | | | | | | | 181,060 | | | | 4,584,439 | |
| | | | | | | | | | | | | | | | |
| | | | |
| Malaysia: 3.20% | | | | | | | | | | | | | | | | |
Bursa Malaysia Bhd (Financials, Diversified Financial Services) | | | | | | | | | | | 1,867,300 | | | | 4,413,384 | |
Malayan Banking Bhd (Financials, Banks) | | | | | | | | | | | 1,162,400 | | | | 2,565,260 | |
Sime Darby Bhd (Industrials, Industrial Conglomerates) | | | | | | | | | | | 1,678,100 | | | | 3,606,697 | |
Telecom Malaysia Bhd (Telecommunication Services, Diversified Telecommunication Services) | | | | | | | | | | | 2,164,981 | | | | 3,221,787 | |
Tenaga Nasional Bhd (Utilities, Electric Utilities) | | | | | | | | | | | 722,000 | | | | 2,318,516 | |
| | | | |
| | | | | | | | | | | | | | | 16,125,644 | |
| | | | | | | | | | | | | | | | |
| | | | |
| Mexico: 2.34% | | | | | | | | | | | | | | | | |
Grupo Aeroportuario del Centro Norte SAB de CV (Industrials, Transportation Infrastructure) | | | | | | | | | | | 539,526 | | | | 2,996,658 | |
Grupo Financiero Banorte SAB de CV (Financials, Banks) | | | | | | | | | | | 459,600 | | | | 2,652,339 | |
Grupo Financiero Santander SAB de CV Class B (Financials, Banks) | | | | | | | | | | | 1,289,310 | | | | 2,344,356 | |
Wal-Mart de Mexico SAB de CV (Consumer Staples, Food & Staples Retailing) | | | | | | | | | | | 1,705,428 | | | | 3,841,125 | |
| | | | |
| | | | | | | | | | | | | | | 11,834,478 | |
| | | | | | | | | | | | | | | | |
| | | | |
| Philippines: 1.59% | | | | | | | | | | | | | | | | |
Globe Telecom Incorporated (Telecommunication Services, Wireless Telecommunication Services) | | | | | | | | | | | 56,805 | | | | 2,362,470 | |
Semirara Mining and Power Corporation (Energy, Oil, Gas & Consumable Fuels) | | | | | | | | | | | 1,895,580 | | | | 5,652,785 | |
| | | | |
| | | | | | | | | | | | | | | 8,015,255 | |
| | | | | | | | | | | | | | | | |
| | | | |
| Poland: 0.54% | | | | | | | | | | | | | | | | |
Bank Pekao SA (Financials, Banks) | | | | | | | | | | | 74,613 | | | | 2,703,356 | |
| | | | | | | | | | | | | | | | |
| | | | |
| Russia: 2.18% | | | | | | | | | | | | | | | | |
LUKOIL PJSC ADR (Energy, Oil, Gas & Consumable Fuels) | | | | | | | | | | | 67,380 | | | | 3,346,425 | |
MegaFon OAO (Telecommunication Services, Wireless Telecommunication Services) | | | | | | | | | | | 212,174 | | | | 2,268,140 | |
Moscow Exchange MICEX-RTS OAO (Financials, Diversified Financial Services) (a) | | | | | | | | | | | 1,254,688 | | | | 2,535,870 | |
Severstal PAO GDR (Materials, Metals & Mining) | | | | | | | | | | | 210,119 | | | | 2,874,428 | |
| | | | |
| | | | | | | | | | | | | | | 11,024,863 | |
| | | | | | | | | | | | | | | | |
The accompanying notes are an integral part of these financial statements.
| | | | | | |
| Portfolio of investments—April 30, 2017 (unaudited) | | Wells Fargo Emerging Markets Equity Income Fund | | | 9 | |
| | | | | | | | | | | | | | | | |
| Security name | | | | | | | | Shares | | | Value | |
| | | | |
| Singapore: 3.08% | | | | | | | | | | | | | | | | |
Asian Pay Television Trust (Consumer Discretionary, Media) | | | | | | | | | | | 4,457,600 | | | $ | 1,643,105 | |
CapitaRetail China Trust (Real Estate, Equity REITs) | | | | | | | | | | | 3,499,657 | | | | 3,982,718 | |
Jardine Cycle & Carriage Limited (Consumer Discretionary, Distributors) | | | | | | | | | | | 113,900 | | | | 3,850,336 | |
Singapore Telecommunications Limited (Telecommunication Services, Diversified Telecommunication Services) | | | | | | | | | | | 2,268,900 | | | | 6,073,568 | |
| | | | |
| | | | | | | | | | | | | | | 15,549,727 | |
| | | | | | | | | | | | | | | | |
| | | | |
| South Africa: 3.70% | | | | | | | | | | | | | | | | |
African Rainbow Minerals Limited (Materials, Metals & Mining) | | | | | | | | | | | 275,891 | | | | 1,744,480 | |
Barclays Africa Group Limited (Financials, Banks) | | | | | | | | | | | 270,604 | | | | 2,976,619 | |
FirstRand Limited (Financials, Diversified Financial Services) | | | | | | | | | | | 1,458,030 | | | | 5,438,802 | |
Foschini Limited (Consumer Discretionary, Specialty Retail) | | | | | | | | | | | 402,691 | | | | 4,809,843 | |
Sanlam Limited (Financials, Insurance) | | | | | | | | | | | 701,323 | | | | 3,720,272 | |
| | | | |
| | | | | | | | | | | | | | | 18,690,016 | |
| | | | | | | | | | | | | | | | |
| | | | |
| South Korea: 12.24% | | | | | | | | | | | | | | | | |
Hana Financial Group Incorporated (Financials, Banks) | | | | | | | | | | | 75,260 | | | | 2,592,664 | |
Hyundai Motor Company (Consumer Discretionary, Automobiles) | | | | | | | | | | | 28,893 | | | | 3,656,378 | |
KB Financial Group Incorporated (Financials, Banks) | | | | | | | | | | | 111,923 | | | | 4,927,799 | |
Korea Electric Power Corporation (Utilities, Electric Utilities) | | | | | | | | | | | 159,504 | | | | 6,356,891 | |
Korea Reinsurance Company (Financials, Insurance) | | | | | | | | | | | 399,604 | | | | 3,968,297 | |
POSCO (Materials, Metals & Mining) | | | | | | | | | | | 22,967 | | | | 5,399,132 | |
S-Oil Corporation (Energy, Oil, Gas & Consumable Fuels) | | | | | | | | | | | 55,237 | | | | 4,839,730 | |
Samsung Electronics Company Limited (Information Technology, Technology Hardware, Storage & Peripherals) | | | | | | | | | | | 8,404 | | | | 16,477,128 | |
Shinhan Financial Group Company Limited (Financials, Banks) | | | | | | | | | | | 115,129 | | | | 4,810,953 | |
SK Telecom Company Limited ADR (Telecommunication Services, Wireless Telecommunication Services) | | | | | | | | | | | 371,180 | | | | 8,756,136 | |
| | | | |
| | | | | | | | | | | | | | | 61,785,108 | |
| | | | | | | | | | | | | | | | |
| | | | |
| Taiwan: 9.60% | | | | | | | | | | | | | | | | |
Advanced Semiconductor Engineering Incorporated (Information Technology, Semiconductors & Semiconductor Equipment) | | | | | | | | | | | 62,937 | | | | 79,164 | |
Cathay Financial Holding Company Limited (Financials, Insurance) | | | | | | | | | | | 2,084,000 | | | | 3,343,131 | |
Chicony Electronics Company Limited (Information Technology, Technology Hardware, Storage & Peripherals) | | | | | | | | | | | 716,000 | | | | 1,889,019 | |
CTBC Financial Holding Company Limited (Financials, Banks) | | | | | | | | | | | 4,320,130 | | | | 2,699,097 | |
CTCI Corporation (Industrials, Construction & Engineering) | | | | | | | | | | | 1,402,000 | | | | 2,453,535 | |
Delta Electronics Incorporated (Information Technology, Electronic Equipment, Instruments & Components) | | | | | | | | | | | 451,283 | | �� | | 2,542,777 | |
Hon Hai Precision Industry Company Limited (Information Technology, Electronic Equipment, Instruments & Components) | | | | | | | | | | | 2,442,630 | | | | 7,998,802 | |
Novatek Microelectronics Corporation Limited (Information Technology, Semiconductors & Semiconductor Equipment) | | | | | | | | | | | 945,000 | | | | 3,633,290 | |
Siliconware Precision Industries Company (Information Technology, Semiconductors & Semiconductor Equipment) | | | | | | | | | | | 1,415,000 | | | | 2,293,378 | |
Taiwan Semiconductor Manufacturing Company Limited (Information Technology, Semiconductors & Semiconductor Equipment) | | | | | | | | | | | 1,529,000 | | | | 9,856,833 | |
Teco Electric & Machinery Company Limited (Industrials, Electrical Equipment) | | | | | | | | | | | 3,660,000 | | | | 3,627,125 | |
Uni-President Enterprises Corporation (Consumer Staples, Food Products) | | | | | | | | | | | 1,975,000 | | | | 3,646,134 | |
United Microelectronics Corporation ADR (Information Technology, Semiconductors & Semiconductor Equipment) | | | | | | | | | | | 1,206,024 | | | | 2,339,687 | |
WPG Holdings Company Limited (Information Technology, Electronic Equipment, Instruments & Components) | | | | | | | | | | | 1,617,000 | | | | 2,049,990 | |
| | | | |
| | | | | | | | | | | | | | | 48,451,962 | |
| | | | | | | | | | | | | | | | |
The accompanying notes are an integral part of these financial statements.
| | | | |
| 10 | | Wells Fargo Emerging Markets Equity Income Fund | | Portfolio of investments—April 30, 2017 (unaudited) |
| | | | | | | | | | | | | | | | |
| Security name | | | | | | | | Shares | | | Value | |
| | | | |
| Thailand: 2.54% | | | | | | | | | | | | | | | | |
Charoen Pokphand Food PCL (Consumer Staples, Food Products) | | | | | | | | | | | 2,891,200 | | | $ | 2,235,895 | |
Land & Houses PCL (Real Estate, Real Estate Management & Development) | | | | | | | | | | | 2,002,900 | | | | 602,202 | |
Land & Houses PCL (Real Estate, Real Estate Management & Development) | | | | | | | | | | | 12,826,000 | | | | 3,819,248 | |
Major Cineplex Group PCL (Consumer Discretionary, Media) | | | | | | | | | | | 2,467,000 | | | | 2,496,242 | |
Thai Beverage PCL (Consumer Staples, Beverages) | | | | | | | | | | | 5,561,300 | | | | 3,681,926 | |
| | | | |
| | | | | | | | | | | | | | | 12,835,513 | |
| | | | | | | | | | | | | | | | |
| | | | |
| Turkey: 0.55% | | | | | | | | | | | | | | | | |
Tupras Turkiye Petrol Rafinerileri AS (Energy, Oil, Gas & Consumable Fuels) | | | | | | | | | | | 110,937 | | | | 2,795,327 | |
| | | | | | | | | | | | | | | | |
| | | | |
| United Arab Emirates: 0.66% | | | | | | | | | | | | | | | | |
Abu Dhabi Commercial Bank PJSC (Financials, Banks) | | | | | | | | | | | 1,769,645 | | | | 3,334,044 | |
| | | | | | | | | | | | | | | | |
| | | | |
| United Kingdom: 0.77% | | | | | | | | | | | | | | | | |
Polymetal International plc (Materials, Metals & Mining) | | | | | | | | | | | 293,671 | | | | 3,860,679 | |
| | | | | | | | | | | | | | | | |
| | | | |
Total Common Stocks (Cost $390,695,322) | | | | | | | | | | | | | | | 427,226,499 | |
| | | | | | | | | | | | | | | | |
| | | | |
Exchange-Traded Funds: 0.49% | | | | | | | | | | | | | | | | |
| | | | |
| United States: 0.49% | | | | | | | | | | | | | | | | |
VanEck Vectors Russia ETF | | | | | | | | | | | 119,775 | | | | 2,500,902 | |
| | | | | | | | | | | | | | | | |
| | | | |
Total Exchange-Traded Funds (Cost $1,932,576) | | | | | | | | | | | | | | | 2,500,902 | |
| | | | | | | | | | | | | | | | |
| | | | |
| | | | | | Expiration date | | | | | | | |
Participation Notes: 5.21% | | | | | | | | | | | | | | | | |
| | | | |
| China: 5.21% | | | | | | | | | | | | | | | | |
HSBC Bank plc (Huayu Automotive Systems Company Limited) (Consumer Discretionary, Auto Components) † | | | | | | | 8-24-2017 | | | | 1,333,100 | | | | 3,634,989 | |
HSBC Bank plc (Inner Mongolia Yili Industrial Group Company Limited Class A) (Consumer Staples, Food Products) † | | | | | | | 8-28-2017 | | | | 666,000 | | | | 1,765,712 | |
HSBC Bank plc (Inner Mongolia Yili Industrial Group Company Limited) (Consumer Staples, Food Products) † | | | | | | | 8-28-2017 | | | | 258,577 | | | | 685,544 | |
HSBC Bank plc (Midea Group Company Limited Class A) (Consumer Discretionary, Household Durables) † | | | | | | | 8-29-2017 | | | | 512,000 | | | | 2,502,239 | |
HSBC Bank plc (Ningbo Green Electric Appliance Company Limited) (Consumer Discretionary, Household Durables) † | | | | | | | 2-12-2019 | | | | 600,499 | | | | 2,877,206 | |
UBS AG (Agricultural Bank of China Limited) (Financials, Banks) † | | | | | | | 8-14-2017 | | | | 5,083,200 | | | | 2,494,585 | |
UBS AG (Baoshan Iron & Steel Company Limited) (Materials, Metals & Mining) † | | | | | | | 8-29-2017 | | | | 5,326,961 | | | | 4,826,238 | |
UBS AG (Midea Group Company Limited Class A) (Consumer Discretionary, Household Durables) † | | | | | | | 8-29-2017 | | | | 857,133 | | | | 4,188,968 | |
UBS AG (Poly Real Estate Group Company Limited) (Real Estate, Real Estate Management & Development) † | | | | | | | 8-29-2017 | | | | 2,442,368 | | | | 3,340,463 | |
| | | | |
Total Participation Notes (Cost $24,082,208) | | | | | | | | | | | | | | | 26,315,944 | |
| | | | | | | | | | | | | | | | |
The accompanying notes are an integral part of these financial statements.
| | | | | | |
| Portfolio of investments—April 30, 2017 (unaudited) | | Wells Fargo Emerging Markets Equity Income Fund | | | 11 | |
| | | | | | | | | | | | | | | | |
| Security name | | Dividend yield | | | | | | Shares | | | Value | |
| | | | |
Preferred Stocks: 4.73% | | | | | | | | | | | | | | | | |
| | | | |
| Brazil: 4.73% | | | | | | | | | | | | | | | | |
Banco Bradesco SA (Financials, Banks) | | | 14.17 | % | | | | | | | 885,300 | | | $ | 9,318,654 | |
Companhia de Saneamento do Parana (Utilities, Water Utilities) | | | 8.06 | | | | | | | | 1,509,920 | | | | 4,890,275 | |
Itausa Investimentos Itau SA (Financials, Banks) | | | 9.75 | | | | | | | | 3,051,450 | | | | 9,507,992 | |
Itausa Investimentos Itau SA Preferred Interim Shares (Financials, Banks) †(a) | | | 9.75 | | | | | | | | 48,738 | | | | 151,248 | |
| | | | |
Total Preferred Stocks (Cost $18,040,435) | | | | | | | | | | | | | | | 23,868,169 | |
| | | | | | | | | | | | | | | | |
| | | | |
| | | Yield | | | | | | | | | | |
Short-Term Investments: 4.48% | | | | | | | | | | | | | | | | |
| | | | |
| Investment Companies: 4.48% | | | | | | | | | | | | | | | | |
Wells Fargo Government Money Market Fund Select Class (l)(u) | | | 0.68 | | | | | | | | 22,591,288 | | | | 22,591,288 | |
| | | | | | | | | | | | | | | | |
| | | | |
Total Short-Term Investments (Cost $22,591,288) | | | | | | | | | | | | | | | 22,591,288 | |
| | | | | | | | | | | | | | | | |
| | | | | | | | |
| Total investments in securities (Cost $457,341,829) * | | | 99.55 | % | | | 502,502,802 | |
Other assets and liabilities, net | | | 0.45 | | | | 2,258,740 | |
| | | | | | | | |
| Total net assets | | | 100.00 | % | | $ | 504,761,542 | |
| | | | | | | | |
| † | Non-income-earning security |
| (a) | The security is fair valued in accordance with procedures approved by the Board of Trustees. |
| (l) | The issuer of the security is an affiliated person of the Fund as defined in the Investment Company Act of 1940. |
| (u) | The rate represents the 7-day annualized yield at period end. |
| * | Cost for federal income tax purposes is $459,198,787 and unrealized gains (losses) consists of: |
| | | | |
Gross unrealized gains | | $ | 52,222,444 | |
Gross unrealized losses | | | (8,918,429 | ) |
| | | | |
Net unrealized gains | | $ | 43,304,015 | |
The accompanying notes are an integral part of these financial statements.
| | | | |
| 12 | | Wells Fargo Emerging Markets Equity Income Fund | | Statement of assets and liabilities—April 30, 2017 (unaudited) |
| | | | |
| | | | |
| |
Assets | | | | |
Investments | | | | |
In unaffiliated securities, at value (cost $434,750,541) | | $ | 479,911,514 | |
In affiliated securities, at value (cost $22,591,288) | | | 22,591,288 | |
| | | | |
Total investments, at value (cost $457,341,829) | | | 502,502,802 | |
Foreign currency, at value (cost $4,364,161) | | | 4,374,902 | |
Receivable for investments sold | | | 1,145,544 | |
Receivable for Fund shares sold | | | 2,353,185 | |
Receivable for dividends | | | 365,683 | |
Prepaid expenses and other assets | | | 22,516 | |
| | | | |
Total assets | | | 510,764,632 | |
| | | | |
| |
Liabilities | | | | |
Payable for investments purchased | | | 4,543,962 | |
Payable for Fund shares redeemed | | | 908,670 | |
Management fee payable | | | 396,657 | |
Distribution fees payable | | | 8,935 | |
Administration fees payable | | | 52,848 | |
Accrued expenses and other liabilities | | | 92,018 | |
| | | | |
Total liabilities | | | 6,003,090 | |
| | | | |
Total net assets | | $ | 504,761,542 | |
| | | | |
| |
NET ASSETS CONSIST OF | | | | |
Paid-in capital | | $ | 490,573,350 | |
Undistributed net investment income | | | 42,177 | |
Accumulated net realized losses on investments | | | (31,027,954 | ) |
Net unrealized gains on investments | | | 45,173,969 | |
| | | | |
Total net assets | | $ | 504,761,542 | |
| | | | |
| |
COMPUTATION OF NET ASSET VALUE AND OFFERING PRICE PER SHARE | | | | |
Net assets – Class A | | $ | 17,614,448 | |
Shares outstanding – Class A1 | | | 1,625,579 | |
Net asset value per share – Class A | | | $10.84 | |
Maximum offering price per share – Class A2 | | | $11.50 | |
Net assets – Class C | | $ | 14,494,021 | |
Shares outstanding – Class C1 | | | 1,343,776 | |
Net asset value per share – Class C | | | $10.79 | |
Net assets – Class R | | $ | 29,475 | |
Shares outstanding – Class R1 | | | 2,714 | |
Net asset value per share – Class R | | | $10.86 | |
Net assets – Class R6 | | $ | 37,722,696 | |
Shares outstanding – Class R61 | | | 3,477,270 | |
Net asset value per share – Class R6 | | | $10.85 | |
Net assets – Administrator Class | | $ | 12,092,890 | |
Shares outstanding – Administrator Class1 | | | 1,108,671 | |
Net asset value per share – Administrator Class | | | $10.91 | |
Net assets – Institutional Class | | $ | 422,808,012 | |
Shares outstanding – Institutional Class1 | | | 38,956,871 | |
Net asset value per share – Institutional Class | | | $10.85 | |
| 1 | The Fund has an unlimited number of authorized shares. |
| 2 | Maximum offering price is computed as 100/94.25 of net asset value. On investments of $50,000 or more, the offering price is reduced. |
The accompanying notes are an integral part of these financial statements.
| | | | | | |
| Statement of operations—six months ended April 30, 2017 (unaudited) | | Wells Fargo Emerging Markets Equity Income Fund | | | 13 | |
| | | | |
| | | | |
| |
Investment income | | | | |
Dividends (net of foreign withholding taxes of $634,698) | | $ | 5,915,301 | |
Income from affiliated securities | | | 44,810 | |
| | | | |
Total investment income | | | 5,960,111 | |
| | | | |
| |
Expenses | | | | |
Management fee | | | 2,489,892 | |
Administration fees | | | | |
Class A | | | 24,440 | |
Class C | | | 13,967 | |
Class R | | | 29 | |
Class R6 | | | 1,244 | |
Administrator Class | | | 10,331 | |
Institutional Class | | | 251,012 | |
Shareholder servicing fees | | | | |
Class A | | | 29,096 | |
Class C | | | 16,628 | |
Class R | | | 35 | |
Administrator Class | | | 18,916 | |
Distribution fees | | | | |
Class C | | | 49,883 | |
Class R | | | 35 | |
Custody and accounting fees | | | 139,233 | |
Professional fees | | | 24,813 | |
Registration fees | | | 80,996 | |
Shareholder report expenses | | | 48,937 | |
Trustees’ fees and expenses | | | 11,776 | |
Other fees and expenses | | | 10,002 | |
| | | | |
Total expenses | | | 3,221,265 | |
Less: Fee waivers and/or expense reimbursements | | | (314,175 | ) |
| | | | |
Net expenses | | | 2,907,090 | |
| | | | |
Net investment income | | | 3,053,021 | |
| | | | |
| |
REALIZED AND UNREALIZED GAINS (LOSSES) ON INVESTMENTS | | | | |
| |
Net realized gains (losses) on: | | | | |
Unaffiliated securities | | | (10,556,758 | ) |
Forward foreign currency contract transactions | | | 58,200 | |
| | | | |
Net realized losses on investments | | | (10,498,558 | ) |
Net change in unrealized gains (losses) on investments | | | 28,585,281 | |
| | | | |
Net realized and unrealized gains (losses) on investments | | | 18,086,723 | |
| | | | |
Net increase in net assets resulting from operations | | $ | 21,139,744 | |
| | | | |
The accompanying notes are an integral part of these financial statements.
| | | | |
| 14 | | Wells Fargo Emerging Markets Equity Income Fund | | Statement of changes in net assets |
| | | | | | | | | | | | | | | | |
| | | Six months ended
April 30, 2017 (unaudited) | | | Year ended
October 31, 2016 | |
| | | |
Operations | | | | | | | | | | | | |
Net investment income | | | | | | $ | 3,053,021 | | | | | | | $ | 8,427,369 | |
Net realized losses on investments | | | | | | | (10,498,558 | ) | | | | | | | (12,750,447 | ) |
Net change in unrealized gains (losses) on investments | | | | | | | 28,585,281 | | | | | | | | 27,078,980 | |
| | | | |
Net increase in net assets resulting from operations | | | | | | | 21,139,744 | | | | | | | | 22,755,902 | |
| | | | |
| | | |
Distributions to shareholders from | | | | | | | | | | | | |
Net investment income | | | | | | | | | | | | | | | | |
Class A | | | | | | | (139,637 | ) | | | | | | | (520,415 | ) |
Class C | | | | | | | (31,839 | ) | | | | | | | (196,473 | ) |
Class R | | | | | | | (132 | ) | | | | | | | (512 | ) |
Class R6 | | | | | | | (63,048 | ) | | | | | | | (62,106 | ) |
Administrator Class | | | | | | | (59,467 | ) | | | | | | | (1,092,920 | ) |
Institutional Class | | | | | | | (3,124,516 | ) | | | | | | | (6,378,435 | ) |
| | | | |
Total distributions to shareholders | | | | | | | (3,418,639 | ) | | | | | | | (8,250,861 | ) |
| | | | |
| | | | |
Capital share transactions | | | Shares | | | | | | | | Shares | | | | | |
Proceeds from shares sold | | | | | | | | | | | | | | | | |
Class A | | | 718,514 | | | | 7,378,675 | | | | 1,710,525 | | | | 16,669,000 | |
Class C | | | 247,194 | | | | 2,582,206 | | | | 735,242 | | | | 7,145,583 | |
Class R6 | | | 3,223,448 | | | | 35,153,977 | | | | 280,056 | | | | 2,733,901 | |
Administrator Class | | | 227,824 | | | | 2,311,884 | | | | 3,295,035 | | | | 31,905,381 | |
Institutional Class | | | 15,833,124 | | | | 162,027,120 | | | | 42,218,845 | | | | 417,403,734 | |
| | | | |
| | | | | | | 209,453,862 | | | | | | | | 475,857,599 | |
| | | | |
Reinvestment of distributions | | | | | | | | | | | | | | | | |
Class A | | | 13,190 | | | | 130,639 | | | | 50,509 | | | | 495,441 | |
Class C | | | 2,720 | | | | 26,495 | | | | 16,592 | | | | 161,956 | |
Class R | | | 13 | | | | 132 | | | | 52 | | | | 512 | |
Class R6 | | | 5,988 | | | | 63,048 | | | | 6,334 | | | | 62,106 | |
Administrator Class | | | 5,672 | | | | 58,110 | | | | 110,594 | | | | 1,087,476 | |
Institutional Class | | | 274,083 | | | | 2,781,059 | | | | 526,646 | | | | 5,191,655 | |
| | | | |
| | | | | | | 3,059,483 | | | | | | | | 6,999,146 | |
| | | | |
Payment for shares redeemed | | | | | | | | | | | | | | | | |
Class A | | | (1,681,299 | ) | | | (17,597,864 | ) | | | (1,479,305 | ) | | | (14,314,963 | ) |
Class C | | | (208,631 | ) | | | (2,147,746 | ) | | | (474,574 | ) | | | (4,639,504 | ) |
Class R6 | | | (4,081 | ) | | | (43,929 | ) | | | (37,131 | ) | | | (356,931 | ) |
Administrator Class | | | (4,064,979 | ) | | | (39,519,658 | ) | | | (2,859,314 | ) | | | (27,376,015 | ) |
Institutional Class | | | (18,605,773 | ) | | | (186,340,530 | ) | | | (14,607,459 | ) | | | (140,452,239 | ) |
| | | | |
| | | | | | | (245,649,727 | ) | | | | | | | (187,139,652 | ) |
| | | | |
Net increase (decrease) in net assets resulting from capital share transactions | | | | | | | (33,136,382 | ) | | | | | | | 295,717,093 | |
| | | | |
Total increase (decrease) in net assets | | | | | | | (15,415,277 | ) | | | | | | | 310,222,134 | |
| | | | |
| | |
Net assets | | | | | | | | |
Beginning of period | | | | | | | 520,176,819 | | | | | | | | 209,954,685 | |
| | | | |
End of period | | | | | | $ | 504,761,542 | | | | | | | $ | 520,176,819 | |
| | | | |
Undistributed net investment income | | | | | | $ | 42,177 | | | | | | | $ | 407,795 | |
| | | | |
The accompanying notes are an integral part of these financial statements.
| | | | | | |
| Financial highlights | | Wells Fargo Emerging Markets Equity Income Fund | | | 15 | |
(For a share outstanding throughout each period)
| | | | | | | | | | | | | | | | | | | | | | | | |
| | | Six months ended
April 30, 2017 (unaudited) | | | Year ended October 31 | |
| CLASS A | | | 2016 | | | 2015 | | | 2014 | | | 2013 | | | 20121 | |
Net asset value, beginning of period | | | $10.27 | | | | $9.97 | | | | $11.33 | | | | $11.79 | | | | $11.17 | | | | $10.00 | |
Net investment income | | | 0.06 | | | | 0.23 | 2 | | | 0.20 | | | | 0.33 | | | | 0.31 | | | | 0.13 | |
Net realized and unrealized gains (losses) on investments | | | 0.57 | | | | 0.29 | | | | (1.36 | ) | | | (0.11 | ) | | | 0.88 | | | | 1.15 | |
| | | | | | | | | | | | | | | | | | | | | | | | |
Total from investment operations | | | 0.63 | | | | 0.52 | | | | (1.16 | ) | | | 0.22 | | | | 1.19 | | | | 1.28 | |
Distributions to shareholders from | | | | | | | | | | | | | | | | | | | | | | | | |
Net investment income | | | (0.06 | ) | | | (0.22 | ) | | | (0.20 | ) | | | (0.31 | ) | | | (0.34 | ) | | | (0.11 | ) |
Net realized gains | | | 0.00 | | | | 0.00 | | | | 0.00 | | | | (0.37 | ) | | | (0.23 | ) | | | 0.00 | |
| | | | | | | | | | | | | | | | | | | | | | | | |
Total distributions to shareholders | | | (0.06 | ) | | | (0.22 | ) | | | (0.20 | ) | | | (0.68 | ) | | | (0.57 | ) | | | (0.11 | ) |
Net asset value, end of period | | | $10.84 | | | | $10.27 | | | | $9.97 | | | | $11.33 | | | | $11.79 | | | | $11.17 | |
Total return3 | | | 6.17 | % | | | 5.29 | % | | | (10.34 | )% | | | 2.05 | % | | | 10.94 | % | | | 12.80 | % |
Ratios to average net assets (annualized) | | | | | | | | | | | | | | | | | | | | | | | | |
Gross expenses | | | 1.73 | % | | | 1.79 | % | | | 1.89 | % | | | 2.09 | % | | | 2.88 | % | | | 4.29 | % |
Net expenses | | | 1.64 | % | | | 1.65 | % | | | 1.65 | % | | | 1.65 | % | | | 1.65 | % | | | 1.65 | % |
Net investment income | | | 0.90 | % | | | 2.34 | % | | | 2.22 | % | | | 3.12 | % | | | 2.64 | % | | | 2.94 | % |
Supplemental data | | | | | | | | | | | | | | | | | | | | | | | | |
Portfolio turnover rate | | | 43 | % | | | 64 | % | | | 84 | % | | | 91 | % | | | 85 | % | | | 39 | % |
Net assets, end of period (000s omitted) | | | $17,614 | | | | $26,459 | | | | $22,866 | | | | $14,010 | | | | $8,658 | | | | $628 | |
| 1 | For the period from May 31, 2012 (commencement of class operations) to October 31, 2012 |
| 2 | Calculated based upon average shares outstanding |
| 3 | Total return calculations do not include any sales charges. Returns for periods of less than one year are not annualized. |
The accompanying notes are an integral part of these financial statements.
| | | | |
| 16 | | Wells Fargo Emerging Markets Equity Income Fund | | Financial highlights |
(For a share outstanding throughout each period)
| | | | | | | | | | | | | | | | | | | | | | | | |
| | | Six months ended
April 30, 2017 (unaudited) | | | Year ended October 31 | |
| CLASS C | | | 2016 | | | 2015 | | | 2014 | | | 2013 | | | 20121 | |
Net asset value, beginning of period | | | $10.23 | | | | $9.94 | | | | $11.32 | | | | $11.79 | | | | $11.16 | | | | $10.00 | |
Net investment income | | | 0.02 | | | | 0.16 | 2 | | | 0.14 | | | | 0.23 | | | | 0.22 | | | | 0.10 | |
Net realized and unrealized gains (losses) on investments | | | 0.56 | | | | 0.28 | | | | (1.38 | ) | | | (0.08 | ) | | | 0.89 | | | | 1.13 | |
| | | | | | | | | | | | | | | | | | | | | | | | |
Total from investment operations | | | 0.58 | | | | 0.44 | | | | (1.24 | ) | | | 0.15 | | | | 1.11 | | | | 1.23 | |
Distributions to shareholders from | | | | | | | | | | | | | | | | | | | | | | | | |
Net investment income | | | (0.02 | ) | | | (0.15 | ) | | | (0.14 | ) | | | (0.25 | ) | | | (0.25 | ) | | | (0.07 | ) |
Net realized gains | | | 0.00 | | | | 0.00 | | | | 0.00 | | | | (0.37 | ) | | | (0.23 | ) | | | 0.00 | |
| | | | | | | | | | | | | | | | | | | | | | | | |
Total distributions to shareholders | | | (0.02 | ) | | | (0.15 | ) | | | (0.14 | ) | | | (0.62 | ) | | | (0.48 | ) | | | (0.07 | ) |
Net asset value, end of period | | | $10.79 | | | | $10.23 | | | | $9.94 | | | | $11.32 | | | | $11.79 | | | | $11.16 | |
Total return3 | | | 5.74 | % | | | 4.53 | % | | | (10.95 | )% | | | 1.27 | % | | | 10.11 | % | | | 12.49 | % |
Ratios to average net assets (annualized) | | | | | | | | | | | | | | | | | | | | | | | | |
Gross expenses | | | 2.47 | % | | | 2.54 | % | | | 2.64 | % | | | 2.83 | % | | | 3.81 | % | | | 5.03 | % |
Net expenses | | | 2.39 | % | | | 2.40 | % | | | 2.40 | % | | | 2.40 | % | | | 2.40 | % | | | 2.41 | % |
Net investment income | | | 0.32 | % | | | 1.62 | % | | | 1.45 | % | | | 2.17 | % | | | 1.80 | % | | | 2.24 | % |
Supplemental data | | | | | | | | | | | | | | | | | | | | | | | | |
Portfolio turnover rate | | | 43 | % | | | 64 | % | | | 84 | % | | | 91 | % | | | 85 | % | | | 39 | % |
Net assets, end of period (000s omitted) | | | $14,494 | | | | $13,327 | | | | $10,190 | | | | $6,390 | | | | $2,028 | | | | $562 | |
| 1 | For the period from May 31, 2012 (commencement of class operations) to October 31, 2012 |
| 2 | Calculated based upon average shares outstanding |
| 3 | Total return calculations do not include any sales charges. Returns for periods of less than one year are not annualized. |
The accompanying notes are an integral part of these financial statements.
| | | | | | |
| Financial highlights | | Wells Fargo Emerging Markets Equity Income Fund | | | 17 | |
(For a share outstanding throughout each period)
| | | | | | | | | | | | |
| | | Six months ended
April 30, 2017 (unaudited) | | | Year ended October 31 | |
| CLASS R | | | 2016 | | | 20151 | |
Net asset value, beginning of period | | | $10.30 | | | | $9.99 | | | | $9.44 | |
Net investment income (loss) | | | 0.04 | | | | 0.20 | 2 | | | (0.01 | )2 |
Net realized and unrealized gains (losses) on investments | | | 0.57 | | | | 0.30 | | | | 0.56 | |
| | | | | | | | | | | | |
Total from investment operations | | | 0.61 | | | | 0.50 | | | | 0.55 | |
Distributions to shareholders from | | | | | | | | | | | | |
Net investment income | | | (0.05 | ) | | | (0.19 | ) | | | (0.00 | )3 |
Net asset value, end of period | | | $10.86 | | | | $10.30 | | | | $9.99 | |
Total return4 | | | 5.95 | % | | | 5.13 | % | | | 5.87 | % |
Ratios to average net assets (annualized) | | | | | | | | | | | | |
Gross expenses | | | 1.97 | % | | | 2.04 | % | | | 2.10 | % |
Net expenses | | | 1.89 | % | | | 1.90 | % | | | 1.90 | % |
Net investment income (loss) | | | 0.82 | % | | | 2.09 | % | | | (0.90 | )% |
Supplemental data | | | | | | | | | | | | |
Portfolio turnover rate | | | 43 | % | | | 64 | % | | | 84 | % |
Net assets, end of period (000s omitted) | | | $29 | | | | $28 | | | | $26 | |
| 1 | For the period from September 30, 2015 (commencement of class operations) to October 31, 2015 |
| 2 | Calculated based upon average shares outstanding |
| 3 | Amount is less than $0.005. |
| 4 | Returns for periods of less than one year are not annualized. |
The accompanying notes are an integral part of these financial statements.
| | | | |
| 18 | | Wells Fargo Emerging Markets Equity Income Fund | | Financial highlights |
(For a share outstanding throughout each period)
| | | | | | | | | | | | |
| | | Six months ended
April 30, 2017 (unaudited) | | | Year ended October 31 | |
| CLASS R6 | | | 2016 | | | 20151 | |
Net asset value, beginning of period | | | $10.29 | | | | $9.97 | | | | $9.42 | |
Net investment income (loss) | | | 0.10 | 2 | | | 0.30 | 2 | | | (0.00 | )2,3 |
Net realized and unrealized gains (losses) on investments | | | 0.55 | | | | 0.27 | | | | 0.56 | |
| | | | | | | | | | | | |
Total from investment operations | | | 0.65 | | | | 0.57 | | | | 0.56 | |
Distributions to shareholders from | | | | | | | | | | | | |
Net investment income | | | (0.09 | ) | | | (0.25 | ) | | | (0.01 | ) |
Net asset value, end of period | | | $10.85 | | | | $10.29 | | | | $9.97 | |
Total return4 | | | 6.38 | % | | | 5.90 | % | | | 5.91 | % |
Ratios to average net assets (annualized) | | | | | | | | | | | | |
Gross expenses | | | 1.23 | % | | | 1.36 | % | | | 1.40 | % |
Net expenses | | | 1.18 | % | | | 1.20 | % | | | 1.20 | % |
Net investment income (loss) | | | 1.84 | % | | | 3.05 | % | | | (0.19 | )% |
Supplemental data | | | | | | | | | | | | |
Portfolio turnover rate | | | 43 | % | | | 64 | % | | | 84 | % |
Net assets, end of period (000s omitted) | | | $37,723 | | | | $2,592 | | | | $26 | |
| 1 | For the period from September 30, 2015 (commencement of class operations) to October 31, 2015 |
| 2 | Calculated based upon average shares outstanding |
| 3 | Amount is less than $0.005. |
| 4 | Returns for periods of less than one year are not annualized. |
The accompanying notes are an integral part of these financial statements.
| | | | | | |
| Financial highlights | | Wells Fargo Emerging Markets Equity Income Fund | | | 19 | |
(For a share outstanding throughout each period)
| | | | | | | | | | | | | | | | | | | | | | | | |
| | | Six months ended
April 30, 2017 (unaudited) | | | Year ended October 31 | |
| ADMINISTRATOR CLASS | | | 2016 | | | 2015 | | | 2014 | | | 2013 | | | 20121 | |
Net asset value, beginning of period | | | $10.32 | | | | $10.00 | | | | $11.35 | | | | $11.80 | | | | $11.17 | | | | $10.00 | |
Net investment income | | | 0.04 | 2 | | | 0.25 | 2 | | | 0.23 | | | | 0.33 | 2 | | | 0.32 | | | | 0.14 | |
Net realized and unrealized gains (losses) on investments | | | 0.60 | | | | 0.29 | | | | (1.37 | ) | | | (0.08 | ) | | | 0.89 | | | | 1.14 | |
| | | | | | | | | | | | | | | | | | | | | | | | |
Total from investment operations | | | 0.64 | | | | 0.54 | | | | (1.14 | ) | | | 0.25 | | | | 1.21 | | | | 1.28 | |
Distributions to shareholders from | | | | | | | | | | | | | | | | | | | | | | | | |
Net investment income | | | (0.05 | ) | | | (0.22 | ) | | | (0.21 | ) | | | (0.33 | ) | | | (0.35 | ) | | | (0.11 | ) |
Net realized gains | | | 0.00 | | | | 0.00 | | | | 0.00 | | | | (0.37 | ) | | | (0.23 | ) | | | 0.00 | |
| | | | | | | | | | | | | | | | | | | | | | | | |
Total distributions to shareholders | | | (0.05 | ) | | | (0.22 | ) | | | (0.21 | ) | | | (0.70 | ) | | | (0.58 | ) | | | (0.11 | ) |
Net asset value, end of period | | | $10.91 | | | | $10.32 | | | | $10.00 | | | | $11.35 | | | | $11.80 | | | | $11.17 | |
Total return3 | | | 6.27 | % | | | 5.56 | % | | | (10.12 | )% | | | 2.30 | % | | | 11.13 | % | | | 12.89 | % |
Ratios to average net assets (annualized) | | | | | | | | | | | | | | | | | | | | | | | | |
Gross expenses | | | 1.63 | % | | | 1.71 | % | | | 1.76 | % | | | 1.91 | % | | | 2.94 | % | | | 4.14 | % |
Net expenses | | | 1.45 | % | | | 1.45 | % | | | 1.45 | % | | | 1.45 | % | | | 1.45 | % | | | 1.45 | % |
Net investment income | | | 0.81 | % | | | 2.54 | % | | | 2.38 | % | | | 2.89 | % | | | 2.70 | % | | | 3.17 | % |
Supplemental data | | | | | | | | | | | | | | | | | | | | | | | | |
Portfolio turnover rate | | | 43 | % | | | 64 | % | | | 84 | % | | | 91 | % | | | 85 | % | | | 39 | % |
Net assets, end of period (000s omitted) | | | $12,093 | | | | $50,970 | | | | $43,928 | | | | $52,896 | | | | $13,527 | | | | $5,285 | |
| 1 | For the period from May 31, 2012 (commencement of class operations) to October 31, 2012 |
| 2 | Calculated based upon average shares outstanding |
| 3 | Returns for periods of less than one year are not annualized. |
The accompanying notes are an integral part of these financial statements.
| | | | |
| 20 | | Wells Fargo Emerging Markets Equity Income Fund | | Financial highlights |
(For a share outstanding throughout each period)
| | | | | | | | | | | | | | | | | | | | | | | | |
| | | Six months ended
April 30, 2017 (unaudited) | | | Year ended October 31 | |
| INSTITUTIONAL CLASS | | | 2016 | | | 2015 | | | 2014 | | | 2013 | | | 20121 | |
Net asset value, beginning of period | | | $10.30 | | | | $9.98 | | | | $11.34 | | | | $11.79 | | | | $11.17 | | | | $10.00 | |
Net investment income | | | 0.08 | | | | 0.27 | 2 | | | 0.25 | 2 | | | 0.35 | | | | 0.34 | | | | 0.15 | |
Net realized and unrealized gains (losses) on investments | | | 0.55 | | | | 0.30 | | | | (1.36 | ) | | | (0.07 | ) | | | 0.89 | | | | 1.14 | |
| | | | | | | | | | | | | | | | | | | | | | | | |
Total from investment operations | | | 0.63 | | | | 0.57 | | | | (1.11 | ) | | | 0.28 | | | | 1.23 | | | | 1.29 | |
Distributions to shareholders from | | | | | | | | | | | | | | | | | | | | | | | | |
Net investment income | | | (0.08 | ) | | | (0.25 | ) | | | (0.25 | ) | | | (0.36 | ) | | | (0.38 | ) | | | (0.12 | ) |
Net realized gains | | | 0.00 | | | | 0.00 | | | | 0.00 | | | | (0.37 | ) | | | (0.23 | ) | | | 0.00 | |
| | | | | | | | | | | | | | | | | | | | | | | | |
Total distributions to shareholders | | | (0.08 | ) | | | (0.25 | ) | | | (0.25 | ) | | | (0.73 | ) | | | (0.61 | ) | | | (0.12 | ) |
Net asset value, end of period | | | $10.85 | | | | $10.30 | | | | $9.98 | | | | $11.34 | | | | $11.79 | | | | $11.17 | |
Total return3 | | | 6.21 | % | | | 5.84 | % | | | (9.95 | )% | | | 2.52 | % | | | 11.32 | % | | | 12.98 | % |
Ratios to average net assets (annualized) | | | | | | | | | | | | | | | | | | | | | | | | |
Gross expenses | | | 1.39 | % | | | 1.45 | % | | | 1.51 | % | | | 1.62 | % | | | 2.74 | % | | | 3.92 | % |
Net expenses | | | 1.24 | % | | | 1.25 | % | | | 1.25 | % | | | 1.25 | % | | | 1.25 | % | | | 1.25 | % |
Net investment income | | | 1.44 | % | | | 2.75 | % | | | 2.41 | % | | | 3.69 | % | | | 2.88 | % | | | 3.39 | % |
Supplemental data | | | | | | | | | | | | | | | | | | | | | | | | |
Portfolio turnover rate | | | 43 | % | | | 64 | % | | | 84 | % | | | 91 | % | | | 85 | % | | | 39 | % |
Net assets, end of period (000s omitted) | | | $422,808 | | | | $426,801 | | | | $132,918 | | | | $35,114 | | | | $6,077 | | | | $5,082 | |
| 1 | For the period from May 31, 2012 (commencement of class operations) to October 31, 2012 |
| 2 | Calculated based upon average shares outstanding |
| 3 | Returns for periods of less than one year are not annualized. |
The accompanying notes are an integral part of these financial statements.
| | | | | | |
| Notes to financial statements (unaudited) | | Wells Fargo Emerging Markets Equity Income Fund | | | 21 | |
1. ORGANIZATION
Wells Fargo Funds Trust (the “Trust”), a Delaware statutory trust organized on March 10, 1999, is an open-end management investment company registered under the Investment Company Act of 1940, as amended (the “1940 Act”). As an investment company, the Trust follows the accounting and reporting guidance in Financial Accounting Standards Board (“FASB”) Accounting Standards Codification (“ASC”) Topic 946, Financial Services – Investment Companies. These financial statements report on the Wells Fargo Emerging Markets Equity Income Fund (the “Fund”) which is a diversified series of the Trust.
2. SIGNIFICANT ACCOUNTING POLICIES
The following significant accounting policies, which are consistently followed in the preparation of the financial statements of the Fund, are in conformity with U.S. generally accepted accounting principles which require management to make estimates and assumptions that affect the reported amounts of assets and liabilities, disclosure of contingent assets and liabilities at the date of the financial statements, and the reported amounts of revenues and expenses during the reporting period. Actual results could differ from those estimates.
Securities valuation
All investments are valued each business day as of the close of regular trading on the New York Stock Exchange (generally 4 p.m. Eastern Time), although the Fund may deviate from this calculation time under unusual or unexpected circumstances.
Equity securities that are listed on a foreign or domestic exchange or market are valued at the official closing price or, if none, the last sales price. If no sale occurs on the principal exchange or market that day, the prior day’s price will be deemed “stale” and a fair value price will be determined in accordance with the Fund’s Valuation Procedures.
The values of securities denominated in foreign currencies are translated into U.S. dollars at rates provided by an independent foreign currency pricing source at a time each business day specified by the Management Valuation Team of Wells Fargo Funds Management, LLC (“Funds Management”).
Many securities markets and exchanges outside the U.S. close prior to the close of the New York Stock Exchange and therefore may not fully reflect trading or events that occur after the close of the principal exchange in which the foreign securities are traded, but before the close of the New York Stock Exchange. If such trading or events are expected to materially affect the value of such securities, then fair value pricing procedures approved by the Board of Trustees of the Fund are applied. These procedures take into account multiple factors including movements in U.S. securities markets after foreign exchanges close. Foreign securities that are fair valued under these procedures are categorized as Level 2 and the application of these procedures may result in transfers between Level 1 and Level 2. Depending on market activity, such fair valuations may be frequent. Such fair value pricing may result in net asset values that are higher or lower than net asset values based on the last reported sales price or latest quoted bid price. On April 30, 2017, such fair value pricing was not used in pricing foreign securities.
Investments in registered open-end investment companies are valued at net asset value.
Investments which are not valued using any of the methods discussed above are valued at their fair value, as determined in good faith by the Board of Trustees. The Board of Trustees has established a Valuation Committee comprised of the Trustees and has delegated to it the authority to take any actions regarding the valuation of portfolio securities that the Valuation Committee deems necessary or appropriate, including determining the fair value of portfolio securities, unless the determination has been delegated to the Management Valuation Team. The Board of Trustees retains the authority to make or ratify any valuation decisions or approve any changes to the Valuation Procedures as it deems appropriate. On a quarterly basis, the Board of Trustees receives reports on any valuation actions taken by the Valuation Committee or the Management Valuation Team which may include items for ratification.
Valuations of fair valued securities are compared to the next actual sales price when available, or other appropriate market values, to assess the continued appropriateness of the fair valuation methodologies used. These securities are fair valued on a day-to-day basis, taking into consideration changes to appropriate market information and any significant changes to the inputs considered in the valuation process until there is a readily available price provided on an exchange or by an independent pricing service. Valuations received from an independent pricing service or independent broker-dealer quotes are periodically validated by comparisons to most recent trades and valuations provided by other independent pricing services in addition to the review of prices by the manager and/or subadviser. Unobservable inputs used in determining fair valuations are identified based on the type of security, taking into consideration factors utilized by market participants in valuing the investment, knowledge about the issuer and the current market environment.
| | | | |
| 22 | | Wells Fargo Emerging Markets Equity Income Fund | | Notes to financial statements (unaudited) |
Foreign currency translation
The accounting records of the Fund are maintained in U.S. dollars. The values of other assets and liabilities denominated in foreign currencies are translated into U.S. dollars at rates provided by an independent foreign currency pricing source at a time each business day specified by the Management Valuation Team. Purchases and sales of securities, and income and expenses are converted at the rate of exchange on the respective dates of such transactions. Net realized foreign exchange gains or losses arise from sales of foreign currencies, currency gains or losses realized between the trade and settlement dates on securities transactions, and the difference between the amounts of dividends, interest and foreign withholding taxes recorded and the U.S. dollar equivalent of the amounts actually paid or received. Net unrealized foreign exchange gains and losses arise from changes in the fair value of assets and liabilities other than investments in securities resulting from changes in exchange rates. The changes in net assets arising from changes in exchange rates of securities and the changes in net assets resulting from changes in market prices of securities are not separately presented. Such changes are included in net realized and unrealized gains or losses from investments.
Participation notes
The Fund may invest in participation notes to gain exposure to securities in certain foreign markets. Participation notes are issued by banks or broker-dealers and are designed to offer a return linked to a particular underlying foreign security. Participation notes involve transaction costs, which may be higher than those applicable to the underlying foreign security. The holder of the participation note is entitled to receive from the bank or broker-dealer, an amount equal to the dividend paid by the issuer of the underlying foreign security; however, the holder is not entitled to the same rights (i.e. dividends, voting rights) as an owner of the underlying foreign security. Investments in participation notes involve risks beyond those normally associated with a direct investment in an underlying security. The Fund has no rights against the issuer of the underlying foreign security and participation notes expose the Fund to counterparty risk in the event the counterparty does not perform. There is also no assurance there will be a secondary trading market for the participation note or that the trading price of the participation note will equal the underlying value of the foreign security that it seeks to replicate.
Forward foreign currency contracts
The Fund is subject to foreign currency exchange rate risk in the normal course of pursuing its investment objectives. A forward foreign currency contract is an agreement between two parties to purchase or sell a specific currency for an agreed-upon price at a future date. The Fund enters into forward foreign currency contracts to facilitate transactions in foreign-denominated securities and to attempt to minimize the risk to the Fund from adverse changes in the relationship between currencies. Forward foreign currency contracts are recorded at the forward rate and marked-to-market daily. When the contracts are closed, realized gains and losses arising from such transactions are recorded as realized gains or losses on forward foreign currency contract transactions. The Fund could be exposed to risks if the counterparties to the contracts are unable to meet the terms of their contracts or if the value of the foreign currency changes unfavorably. The Fund’s maximum risk of loss from counterparty credit risk is the unrealized gains on the contracts. This risk may be mitigated if there is a master netting arrangement between the Fund and the counterparty.
Security transactions and income recognition
Securities transactions are recorded on a trade date basis. Realized gains or losses are recorded on the basis of identified cost.
Dividend income is recognized on the ex-dividend date, except for certain dividends from foreign securities, which are recorded as soon as the custodian verifies the ex-dividend date. Dividend income from foreign securities is recorded net of foreign taxes withheld where recovery of such taxes is not assured.
Distributions to shareholders
Distributions to shareholders from net investment income and net realized gains, if any, are recorded on the ex-dividend date. Such distributions are determined in accordance with income tax regulations and may differ from U.S. generally accepted accounting principles. Dividend sources are estimated at the time of declaration. The tax character of distributions is determined as of the Fund’s fiscal year end. Therefore, a portion of the Fund’s distributions made prior the Fund’s fiscal year end may be categorized as a tax return of capital.
Federal and other taxes
The Fund intends to continue to qualify as a regulated investment company by distributing substantially all of its investment company taxable income and any net realized capital gains (after reduction for capital loss carryforwards) sufficient to relieve it from all, or substantially all, federal income taxes. Accordingly, no provision for federal income taxes was required.
| | | | | | |
| Notes to financial statements (unaudited) | | Wells Fargo Emerging Markets Equity Income Fund | | | 23 | |
The Fund’s income and federal excise tax returns and all financial records supporting those returns for the prior three fiscal years are subject to examination by the federal and Delaware revenue authorities. Management has analyzed the Fund’s tax positions taken on federal, state, and foreign tax returns for all open tax years and does not believe that there are any uncertain tax positions that require recognition of a tax liability.
As of October 31, 2016, the Fund had capital loss carryforwards which consist of $14,095,175 in short-term capital losses and $5,166,871 in long-term capital losses.
Class allocations
The separate classes of shares offered by the Fund differ principally in applicable sales charges, distribution, shareholder servicing, and administration fees. Class specific expenses are charged directly to that share class. Investment income, common expenses, and realized and unrealized gains (losses) on investments are allocated daily to each class of shares based on the relative proportion of net assets of each class.
3. FAIR VALUATION MEASUREMENTS
Fair value measurements of investments are determined within a framework that has established a fair value hierarchy based upon the various data inputs utilized in determining the value of the Fund’s investments. The three-level hierarchy gives the highest priority to unadjusted quoted prices in active markets for identical assets or liabilities (Level 1) and the lowest priority to unobservable inputs (Level 3). The Fund’s investments are classified within the fair value hierarchy based on the lowest level of input that is significant to the fair value measurement. The inputs are summarized into three broad levels as follows:
| ∎ | | Level 1 – quoted prices in active markets for identical securities |
| ∎ | | Level 2 – other significant observable inputs (including quoted prices for similar securities, interest rates, prepayment speeds, credit risk, etc.) |
| ∎ | | Level 3 – significant unobservable inputs (including the Fund’s own assumptions in determining the fair value of investments) |
The inputs or methodologies used for valuing investments in securities are not necessarily an indication of the risk associated with investing in those securities.
| | | | |
| 24 | | Wells Fargo Emerging Markets Equity Income Fund | | Notes to financial statements (unaudited) |
The following is a summary of the inputs used in valuing the Fund’s assets and liabilities as of April 30, 2017:
| | | | | | | | | | | | | | | | |
| | | Quoted prices
(Level 1) | | | Other significant
observable inputs
(Level 2) | | | Significant
unobservable inputs (Level 3) | | | Total | |
Assets | | | | | | | | | | | | | | | | |
Investments in: | | | | | | | | | | | | | | | | |
| | | | |
Common stocks | | | | | | | | | | | | | | | | |
Argentina | | $ | 2,453,735 | | | $ | 0 | | | $ | 0 | | | $ | 2,453,735 | |
Brazil | | | 28,170,263 | | | | 4,621 | | | | 0 | | | | 28,174,884 | |
Cayman Islands | | | 5,173,567 | | | | 0 | | | | 0 | | | | 5,173,567 | |
Chile | | | 4,855,395 | | | | 0 | | | | 0 | | | | 4,855,395 | |
China | | | 116,959,972 | | | | 0 | | | | 0 | | | | 116,959,972 | |
India | | | 31,113,659 | | | | 0 | | | | 0 | | | | 31,113,659 | |
Indonesia | | | 16,904,876 | | | | 0 | | | | 0 | | | | 16,904,876 | |
Luxembourg | | | 4,584,439 | | | | 0 | | | | 0 | | | | 4,584,439 | |
Malaysia | | | 16,125,644 | | | | 0 | | | | 0 | | | | 16,125,644 | |
Mexico | | | 11,834,478 | | | | 0 | | | | 0 | | | | 11,834,478 | |
Philippines | | | 8,015,255 | | | | 0 | | | | 0 | | | | 8,015,255 | |
Poland | | | 2,703,356 | | | | 0 | | | | 0 | | | | 2,703,356 | |
Russia | | | 8,488,993 | | | | 2,535,870 | | | | 0 | | | | 11,024,863 | |
Singapore | | | 15,549,727 | | | | 0 | | | | 0 | | | | 15,549,727 | |
South Africa | | | 18,690,016 | | | | 0 | | | | 0 | | | | 18,690,016 | |
South Korea | | | 61,785,108 | | | | 0 | | | | 0 | | | | 61,785,108 | |
Taiwan | | | 48,451,962 | | | | 0 | | | | 0 | | | | 48,451,962 | |
Thailand | | | 12,835,513 | | | | 0 | | | | 0 | | | | 12,835,513 | |
Turkey | | | 2,795,327 | | | | 0 | | | | 0 | | | | 2,795,327 | |
United Arab Emirates | | | 3,334,044 | | | | 0 | | | | 0 | | | | 3,334,044 | |
United Kingdom | | | 3,860,679 | | | | 0 | | | | 0 | | | | 3,860,679 | |
| | | | |
Exchange-traded funds | | | | | | | | | | | | | | | | |
United States | | | 2,500,902 | | | | 0 | | | | 0 | | | | 2,500,902 | |
| | | | |
Participation notes | | | | | | | | | | | | | | | | |
China | | | 0 | | | | 26,315,944 | | | | 0 | | | | 26,315,944 | |
| | | | |
Preferred stocks | | | | | | | | | | | | | | | | |
Brazil | | | 23,716,921 | | | | 151,248 | | | | 0 | | | | 23,868,169 | |
| | | | |
Short-term investments | | | | | | | | | | | | | | | | |
Investment companies | | | 22,591,288 | | | | 0 | | | | 0 | | | | 22,591,288 | |
Total assets | | $ | 473,495,119 | | | $ | 29,007,683 | | | $ | 0 | | | $ | 502,502,802 | |
The Fund recognizes transfers between levels within the fair value hierarchy at the end of the reporting period. At April 30, 2017, the Fund did not have any transfers into/out of level 1, level 2, or level 3.
4. TRANSACTIONS WITH AFFILIATES AND OTHER EXPENSES
Management fee
Funds Management, an indirect wholly owned subsidiary of Wells Fargo & Company (“Wells Fargo”), is the manager of the Fund and provides advisory and fund-level administrative services under an investment management agreement. Under the investment management agreement, Funds Management is responsible for, among other services, implementing the investment objectives and strategies of the Fund, supervising the subadviser, providing fund-level administrative services in connection with the Fund’s operations, and providing any other fund-level administrative services reasonably necessary for the operation of the Fund. As compensation for its services under the investment management agreement, Funds Management is entitled to receive an annual management fee starting at 1.05% and declining to 0.945% as the average daily net assets of the Fund increase. Prior to March 1, 2017, Funds Management received a fee at an annual rate which started at 1.15% and declined to 0.955% as the average daily assets of the Fund increased. For the six months ended April 30, 2017, the management fee was equivalent to an annual rate of 1.11% of the Fund’s average daily net assets.
| | | | | | |
| Notes to financial statements (unaudited) | | Wells Fargo Emerging Markets Equity Income Fund | | | 25 | |
Funds Management has retained the services of a subadviser to provide daily portfolio management to the Fund. The fee for subadvisory services is borne by Funds Management. Wells Capital Management Incorporated, an affiliate of Funds Management and an indirect wholly owned subsidiary of Wells Fargo, is the subadviser to the Fund and is entitled to receive a fee from Funds Management at an annual rate starting at 0.65% and declining to 0.45% as the average daily net assets of the Fund increase.
Administration fees
Under a class-level administration agreement, Funds Management provides class-level administrative services to the Fund, which includes paying fees and expenses for services provided by the transfer agent, sub-transfer agents, omnibus account servicers and record-keepers. As compensation for its services under the class-level administration agreement, Funds Management receives an annual fee which is calculated based on the average daily net assets of each class as follows:
| | | | |
| | | Class-level
administration fee | |
Class A, Class C, Class R | | | 0.21 | % |
Class R6 | | | 0.03 | |
Administrator Class, Institutional Class | | | 0.13 | |
Funds Management has contractually waived and/or reimbursed management and administration fees to the extent necessary to maintain certain net operating expense ratios for the Fund. Waiver of fees and/or reimbursement of expenses by Funds Management were made first from fund level expenses on a proportionate basis and then from class specific expenses. Funds Management has committed through February 28, 2018 to waive fees and/or reimburse expenses to the extent necessary to cap the Fund’s expenses at 1.62% for Class A shares, 2.37% for Class C shares, 1.87% for Class R shares, 1.17% for Class R6 shares, 1.45% for Administrator Class shares, and 1.22% for Institutional Class shares. After this time, the cap may be increased or the commitment to maintain the cap may be terminated only with the approval of the Board of Trustees. Prior to March 1, 2017, the Fund’s expenses were capped at 1.65% for Class A shares, 2.40% for Class C shares, 1.90% for Class R shares, 1.20% for Class R6 shares, 1.45% for Administrator Class shares, and 1.25% for Institutional Class shares.
During the six months ended April 30, 2017, State Street Bank and Trust Company, the Fund’s custodian, reimbursed the Fund $373 for certain out-of-pocket expenses that were billed to the Fund in error from 1998-2015. This amount is included in dividend income on the Statement of Operations. In addition, Funds Management was also reimbursed $2,063 for waivers/reimbursements it made to the Fund during the period the Fund was erroneously billed.
Distribution fees
The Trust has adopted a distribution plan for Class C and Class R shares of the Fund pursuant to Rule 12b-1 under the 1940 Act. Distribution fees are charged to Class C and Class R shares and paid to Wells Fargo Funds Distributor, LLC (“Funds Distributor”), the principal underwriter, at an annual rate of 0.75% of the average daily net assets of Class C shares and 0.25% of the average daily net assets of Class R shares.
In addition, Funds Distributor is entitled to receive the front-end sales charge from the purchase of Class A shares and a contingent deferred sales charge on the redemption of certain Class A shares. Funds Distributor is also entitled to receive the contingent deferred sales charges from redemptions of Class B and Class C shares. For the six months ended April 30, 2017, Funds Distributor received $6,506 from the sale of Class A shares and $939 in contingent deferred sales charges from redemptions of Class C shares.
Shareholder servicing fees
The Trust has entered into contracts with one or more shareholder servicing agents, whereby Class A, Class C, Class R, and Administrator Class of the Fund are charged a fee at an annual rate of 0.25% of the average daily net assets of each respective class.
A portion of these total shareholder servicing fees were paid to affiliates of Wells Fargo.
5. INVESTMENT PORTFOLIO TRANSACTIONS
Purchases and sales of investments, excluding U.S. government obligations (if any) and short-term securities, for the six months ended April 30, 2017 were $190,235,116 and $231,502,504, respectively.
The Fund may purchase or sell investment securities to other Wells Fargo affiliates pursuant to Rule 17a-7 of the 1940 Act and under procedures adopted by the Board of Trustees. The procedures have been designed to ensure that these interfund transactions, which do not incur broker commissions, are effected at current market prices. Interfund trades are included within the respective purchases and sales amounts shown.
| | | | |
| 26 | | Wells Fargo Emerging Markets Equity Income Fund | | Notes to financial statements (unaudited) |
6. DERIVATIVE TRANSACTIONS
During the six months ended April 30, 2017, the Fund entered into forward foreign currency contracts for economic hedging purposes.
As of April 30, 2017, the Fund did not have any open forward foreign currency contracts. The Fund had average contract amounts of $126,912 in forward foreign currency contracts to buy during the six months ended April 30, 2017.
The fair value, realized gains or losses and change in unrealized gains or losses, if any, on derivative instruments are reflected in the appropriate financial statements.
7. BANK BORROWINGS
The Trust (excluding the money market funds and certain other funds) and Wells Fargo Variable Trust are parties to a $250,000,000 revolving credit agreement whereby the Fund is permitted to use bank borrowings for temporary or emergency purposes, such as to fund shareholder redemption requests. Interest under the credit agreement is charged to the Fund based on a borrowing rate equal to the higher of the Federal Funds rate in effect on that day plus 1.25% or the overnight LIBOR rate in effect on that day plus 1.25%. In addition, an annual commitment fee equal to 0.25% of the unused balance is allocated to each participating fund.
For the six months ended April 30, 2017, there were no borrowings by the Fund under the agreement.
8. CONCENTRATION RISKS
Concentration risks result from exposure to a limited number of sectors or geographic regions. A fund that invests a substantial portion of its assets in any sector or geographic region may be more affected by changes in that sector or geographic region than would be a fund whose investments are not heavily weighted in any sector.
9. INDEMNIFICATION
Under the Trust’s organizational documents, the officers and Trustees have been granted certain indemnification rights against certain liabilities that may arise out of performance of their duties to the Trust. Additionally, in the normal course of business, the Trust may enter into contracts with service providers that contain a variety of indemnification clauses. The Trust’s maximum exposure under these arrangements is dependent on future claims that may be made against the Fund and, therefore, cannot be estimated.
10. NEW ACCOUNTING PRONOUNCEMENT
In December 2016, FASB issued Accounting Standards Update (“ASU”) No. 2016-19, Technical Corrections and Improvements. ASU 2016-19 includes an amendment to FASB ASC Topic 820, Fair Value Measurement which clarifies the difference between a valuation approach and a valuation technique. The amendment also requires an entity to disclose when there has been a change in either or both a valuation approach and/or a valuation technique. The disclosure requirements are effective for fiscal years and interim periods within those fiscal years beginning after December 15, 2016. Management is currently evaluating the potential impact of this new guidance to the financial statements.
11. REGULATORY CHANGES
In October 2016, the Securities and Exchange Commission (“SEC”) adopted new rules and forms and amended existing rules and forms (together, “final rules”) intended to modernize and enhance the reporting and disclosure of information by registered investment companies and to enhance liquidity risk management by open-end mutual funds and exchange-traded funds. The final rules will enhance the quality of information available to investors and will allow the SEC to more effectively collect and use data reported by funds. In part, the final rules amend Regulation S-X and require standardized, enhanced disclosure about derivatives in the Fund’s financial statements, as well as other amendments. The compliance date for the amendments to Regulation S-X is August 1, 2017 while the compliance date for the new form types is June 1, 2018 and the compliance date for the liquidity risk management program requirements is December 1, 2018. Management is currently assessing the potential impact of these enhancements and their impact on the financial statement disclosures and reporting requirements.
| | | | | | |
| Other information (unaudited) | | Wells Fargo Emerging Markets Equity Income Fund | | | 27 | |
TAX INFORMATION
Pursuant to Section 853 of the Internal Revenue Code, the following amounts have been designated as foreign taxes paid for the fiscal year ended October 31, 2016. These amounts may be less than the actual foreign taxes paid for financial statement purposes. Foreign taxes paid or withheld should be included in taxable income with an offsetting deduction from gross income or as a credit for taxes paid to foreign governments. None of the income was derived from ineligible foreign sources as defined under Section 901(j) of the Internal Revenue Code.
| | | | |
Creditable
foreign taxes paid | | Per share
amount | | Foreign income as % of ordinary income distributions |
| $1,331,086 | | $0.0263 | | 93.37% |
PROXY VOTING INFORMATION
A description of the policies and procedures that the Fund uses to determine how to vote proxies relating to portfolio securities is available, upon request, by calling 1-800-222-8222, visiting our website at wellsfargofunds.com, or visiting the SEC website at sec.gov. Information regarding how the Fund voted proxies relating to portfolio securities during the most recent 12-month period ended June 30 is available on the Fund’s website at wellsfargofunds.com or by visiting the SEC website at sec.gov.
PORTFOLIO HOLDINGS INFORMATION
The complete portfolio holdings for the Fund are publicly available monthly on the Fund’s website (wellsfargofunds.com), on a one-month delayed basis. In addition, top ten holdings information (excluding derivative positions) for the Fund is publicly available on the Fund’s website on a monthly, seven-day or more delayed basis. The Fund files its complete schedule of portfolio holdings with the SEC for the first and third quarters of each fiscal year on Form N-Q, which is available by visiting the SEC website at sec.gov. In addition, the Fund’s Form N-Q may be reviewed and copied at the SEC’s Public Reference Room in Washington, DC, and at regional offices in New York City, at 233 Broadway, and in Chicago, at 175 West Jackson Boulevard, Suite 900. Information about the Public Reference Room may be obtained by calling 1-800-SEC-0330.
| | | | |
| 28 | | Wells Fargo Emerging Markets Equity Income Fund | | Other information (unaudited) |
BOARD OF TRUSTEES AND OFFICERS
Each of the Trustees and Officers1 listed in the table below acts in identical capacities for each fund in the Wells Fargo family of funds, which consists of 138 mutual funds comprising the Wells Fargo Funds Trust, Wells Fargo Variable Trust, Wells Fargo Master Trust and four closed-end funds (collectively the “Fund Complex”). This table should be read in conjunction with the Prospectus and the Statement of Additional Information2. The mailing address of each Trustee and Officer is 525 Market Street, 12th Floor, San Francisco, CA 94105. Each Trustee and Officer serves an indefinite term, however, each Trustee serves such term until reaching the mandatory retirement age established by the Trustees.
Independent Trustees
| | | | | | |
Name and
year of birth | | Position held and
length of service* | | Principal occupations during past five years or longer | | Current other
public company or
investment company
directorships |
| William R. Ebsworth (Born 1957) | | Trustee, since 2015 | | Retired. From 1984 to 2013, equities analyst, portfolio manager, research director and chief investment officer at Fidelity Management and Research Company in Boston, Tokyo, and Hong Kong and retired in 2013 as Chief Investment Officer of Fidelity Strategic Advisers, Inc. where he led a team of investment professionals managing client assets. Prior thereto, Board member of Hong Kong Securities Clearing Co., Hong Kong Options Clearing Corp., the Thailand International Fund, Ltd., Fidelity Investments Life Insurance Company, and Empire Fidelity Investments Life Insurance Company. Board member of the Forté Foundation (non-profit organization) and the Vincent Memorial Hospital Endowment (non-profit organization), where he serves on the Investment Committee and as a Chair of the Audit Committee. Mr. Ebsworth is a CFA® charterholder. | | Asset Allocation Trust |
| Jane A. Freeman (Born 1953) | | Trustee, since 2015 | | Retired. From 2012 to 2014 and 1999 to 2008, Chief Financial Officer of Scientific Learning Corporation. From 2008 to 2012, Ms. Freeman provided consulting services related to strategic business projects. Prior to 1999, Portfolio Manager at Rockefeller & Co. and Scudder, Stevens & Clark. Board member of the Harding Loevner Funds from 1996 to 2014, serving as both Lead Independent Director and chair of the Audit Committee. Board member of the Russell Exchange Traded Funds Trust from 2011 to 2012 and the chair of the Audit Committee. Ms. Freeman is a Board Member of Ruth Bancroft Garden (non-profit organization) and an inactive chartered financial analyst. | | Asset Allocation Trust |
| Peter G. Gordon** (Born 1942) | | Trustee, since 1998; Chairman, since 2005 | | Co-Founder, Retired Chairman, President and CEO of Crystal Geyser Water Company. Trustee Emeritus, Colby College. | | Asset Allocation Trust |
| Isaiah Harris, Jr. (Born 1952) | | Trustee, since 2009 | | Retired. Chairman of the Board of CIGNA Corporation since 2009, and Director since 2005. From 2003 to 2011, Director of Deluxe Corporation. Prior thereto, President and CEO of BellSouth Advertising and Publishing Corp. from 2005 to 2007, President and CEO of BellSouth Enterprises from 2004 to 2005 and President of BellSouth Consumer Services from 2000 to 2003. Emeritus member of the Iowa State University Foundation Board of Governors. Emeritus Member of the Advisory Board of Iowa State University School of Business. Advisory Board Member, Palm Harbor Academy (charter school). Advisory Board Member, Child Evangelism Fellowship (non-profit). Mr. Harris is a certified public accountant (inactive status). | | CIGNA Corporation; Asset Allocation Trust |
| Judith M. Johnson (Born 1949) | | Trustee, since 2008; Audit Committee Chairman, since 2008 | | Retired. Prior thereto, Chief Executive Officer and Chief Investment Officer of Minneapolis Employees Retirement Fund from 1996 to 2008. Ms. Johnson is an attorney, certified public accountant and a certified managerial accountant. | | Asset Allocation Trust |
| David F. Larcker (Born 1950) | | Trustee, since 2009 | | James Irvin Miller Professor of Accounting at the Graduate School of Business, Stanford University, Director of the Corporate Governance Research Initiative and Senior Faculty of The Rock Center for Corporate Governance since 2006. From 2005 to 2008, Professor of Accounting at the Graduate School of Business, Stanford University. Prior thereto, Ernst & Young Professor of Accounting at The Wharton School, University of Pennsylvania from 1985 to 2005. | | Asset Allocation Trust |
| | | | | | |
| Other information (unaudited) | | Wells Fargo Emerging Markets Equity Income Fund | | | 29 | |
| | | | | | |
Name and
year of birth | | Position held and
length of service* | | Principal occupations during past five years or longer | | Current other
public company or
investment company
directorships |
| Olivia S. Mitchell (Born 1953) | | Trustee, since 2006 | | International Foundation of Employee Benefit Plans Professor, Wharton School of the University of Pennsylvania since 1993. Director of Wharton’s Pension Research Council and Boettner Center on Pensions & Retirement Research, and Research Associate at the National Bureau of Economic Research. Previously, Cornell University Professor from 1978 to 1993. | | Asset Allocation Trust |
| Timothy J. Penny (Born 1951) | | Trustee, since 1996;
Vice Chairman, since 2017 | | President and Chief Executive Officer of Southern Minnesota Initiative Foundation, a non-profit organization, since 2007 and Senior Fellow at the Humphrey Institute Policy Forum at the University of Minnesota since 1995. Member of the Board of Trustees of NorthStar Education Finance, Inc., a non-profit organization, since 2007. | | Asset Allocation Trust |
| Michael S. Scofield (Born 1943) | | Trustee, since 2010 | | Served on the Investment Company Institute’s Board of Governors and Executive Committee from 2008-2011 as well the Governing Council of the Independent Directors Council from 2006-2011 and the Independent Directors Council Executive Committee from 2008-2011. Chairman of the IDC from 2008-2010. Institutional Investor (Fund Directions) Trustee of Year in 2007. Trustee of the Evergreen Funds complex (and its predecessors) from 1984 to 2010. Chairman of the Evergreen Funds from 2000-2010. Former Trustee of the Mentor Funds. Retired Attorney, Law Offices of Michael S. Scofield. | | Asset Allocation Trust |
| * | Length of service dates reflect the Trustee’s commencement of service with the Trust’s predecessor entities, where applicable. |
| ** | Peter Gordon is expected to retire on December 31, 2017. |
Officers
| | | | | | |
Name and
year of birth | | Position held and
length of service | | Principal occupations during past five years or longer | | |
Andrew Owen
(Born 1960) | | President, since 2017 | | Executive Vice President of Wells Fargo & Company and Head of Affiliated Managers, Wells Fargo Asset Management, since 2014. In addition, Mr. Owen is currently President, Chief Executive Officer and Director of Wells Fargo Funds Management, LLC since 2017. Prior thereto, Executive Vice President responsible for marketing, investments and product development for Wells Fargo Funds Management, LLC, from 2009 to 2014. | | |
| Jeremy DePalma1 (Born 1974) | | Treasurer, since 2012 | | Senior Vice President of Wells Fargo Funds Management, LLC since 2009. Senior Vice President of Evergreen Investment Management Company, LLC from 2008 to 2010 and head of the Fund Reporting and Control Team within Fund Administration from 2005 to 2010. | | |
| C. David Messman (Born 1960) | | Secretary, since 2000; Chief Legal Officer, since 2003 | | Senior Vice President and Secretary of Wells Fargo Funds Management, LLC since 2001. Assistant General Counsel of Wells Fargo Bank, N.A. since 2013 and Vice President and Managing Counsel of Wells Fargo Bank, N.A. from 1996 to 2013. | | |
| Michael Whitaker (Born 1967) | | Chief Compliance Officer, since 2016 | | Senior Vice President and Chief Compliance Officer since 2016. Senior Vice President and Chief Compliance Officer for Fidelity Investments from 2007 to 2016. | | |
David Berardi
(Born 1975) | | Assistant Treasurer, since 2009 | | Vice President of Wells Fargo Funds Management, LLC since 2009. Vice President of Evergreen Investment Management Company, LLC from 2008 to 2010. Manager of Fund Reporting and Control for Evergreen Investment Management Company, LLC from 2004 to 2010. | | |
| 1 | Jeremy DePalma acts as Treasurer of 69 funds and Assistant Treasurer of 69 funds in the Fund Complex. |
| 2 | The Statement of Additional Information includes additional information about the Trustees and is available, without charge, upon request, by calling 1-800-222-8222 or by visiting the website at wellsfargofunds.com. |
| | | | |
| 30 | | Wells Fargo Emerging Markets Equity Income Fund | | List of abbreviations |
The following is a list of common abbreviations for terms and entities that may have appeared in this report.
| ACA | — ACA Financial Guaranty Corporation |
| ADR | — American depositary receipt |
| ADS | — American depositary shares |
| AGC | — Assured Guaranty Corporation |
| AGM | — Assured Guaranty Municipal |
| Ambac | — Ambac Financial Group Incorporated |
| AMT | — Alternative minimum tax |
| BAN | — Bond anticipation notes |
| BHAC | — Berkshire Hathaway Assurance Corporation |
| CAB | — Capital appreciation bond |
| CCAB | — Convertible capital appreciation bond |
| CDA | — Community Development Authority |
| CDO | — Collateralized debt obligation |
| DRIVER | — Derivative inverse tax-exempt receipts |
| DW&P | — Department of Water & Power |
| DWR | — Department of Water Resources |
| ECFA | — Educational & Cultural Facilities Authority |
| EDA | — Economic Development Authority |
| EDFA | — Economic Development Finance Authority |
| ETF | — Exchange-traded fund |
| FDIC | — Federal Deposit Insurance Corporation |
| FFCB | — Federal Farm Credit Banks |
| FGIC | — Financial Guaranty Insurance Corporation |
| FHA | — Federal Housing Administration |
| FHLB | — Federal Home Loan Bank |
| FHLMC | — Federal Home Loan Mortgage Corporation |
| FICO | — The Financing Corporation |
| FNMA | — Federal National Mortgage Association |
| GDR | — Global depositary receipt |
| GNMA | — Government National Mortgage Association |
| HCFR | — Healthcare facilities revenue |
| HEFA | — Health & Educational Facilities Authority |
| HEFAR | — Higher education facilities authority revenue |
| HFA | — Housing Finance Authority |
| HFFA | — Health Facilities Financing Authority |
| HUD | — Department of Housing and Urban Development |
| IDA | — Industrial Development Authority |
| IDAG | — Industrial Development Agency |
| KRW | — Republic of Korea won |
| LIBOR | — London Interbank Offered Rate |
| LIFER | — Long Inverse Floating Exempt Receipts |
| LLC | — Limited liability company |
| LLLP | — Limited liability limited partnership |
| LLP | — Limited liability partnership |
| MBIA | — Municipal Bond Insurance Association |
| MFHR | — Multifamily housing revenue |
| MSTR | — Municipal securities trust receipts |
| MUD | — Municipal Utility District |
| National | — National Public Finance Guarantee Corporation |
| PCFA | — Pollution Control Financing Authority |
| PCL | — Public Company Limited |
| PCR | — Pollution control revenue |
| PFA | — Public Finance Authority |
| PFFA | — Public Facilities Financing Authority |
| PFOTER | — Puttable floating option tax-exempt receipts |
| plc | — Public limited company |
| PUTTER | — Puttable tax-exempt receipts |
| R&D | — Research & development |
| Radian | — Radian Asset Assurance |
| RAN | — Revenue anticipation notes |
| RDA | — Redevelopment Authority |
| RDFA | — Redevelopment Finance Authority |
| REIT | — Real estate investment trust |
| ROC | — Reset option certificates |
| SAVRS | — Select auction variable rate securities |
| SBA | — Small Business Authority |
| SDR | — Swedish depositary receipt |
| SFHR | — Single-family housing revenue |
| SFMR | — Single-family mortgage revenue |
| SPA | — Standby purchase agreement |
| SPDR | — Standard & Poor’s Depositary Receipts |
| SPEAR | — Short Puttable Exempt Adjustable Receipts |
| STRIPS | — Separate trading of registered interest and |
| TAN | — Tax anticipation notes |
| TIPS | — Treasury inflation-protected securities |
| TRAN | — Tax revenue anticipation notes |
| TTFA | — Transportation Trust Fund Authority |
| TVA | — Tennessee Valley Authority |
This page is intentionally left blank.
This page is intentionally left blank.

For more information
More information about Wells Fargo Funds is available free upon request. To obtain literature, please write, email, visit the Fund’s website, or call:
Wells Fargo Funds
P.O. Box 8266
Boston, MA 02266-8266
Email: fundservice@wellsfargo.com
Website: wellsfargofunds.com
Individual investors: 1-800-222-8222
Retail investment professionals: 1-888-877-9275
Institutional investment professionals:
1-866-765-0778
This report and the financial statements contained herein are submitted for the general information of the shareholders of the Fund. If this report is used for promotional purposes, distribution of the report must be accompanied or preceded by a current prospectus. Before investing, please consider the investment objectives, risks, charges, and expenses of the investment. For a current prospectus and, if available, a summary prospectus, containing this information, call 1-800-222-8222 or visit the Fund’s website at wellsfargofunds.com. Read the prospectus carefully before you invest or send money.
Wells Fargo Asset Management (WFAM) is a trade name used by the asset management businesses of Wells Fargo & Company. Wells Fargo Funds Management, LLC, a wholly owned subsidiary of Wells Fargo & Company, provides investment advisory and administrative services for Wells Fargo Funds. Other affiliates of Wells Fargo & Company provide subadvisory and other services for the funds. The funds are distributed by Wells Fargo Funds Distributor, LLC, Member FINRA, an affiliate of Wells Fargo & Company. Neither Wells Fargo Funds Management nor Wells Fargo Funds Distributor has Fund customer accounts/assets, and neither provides investment advice/recommendations or acts as an investment advice fiduciary to any investor.
NOT FDIC INSURED ◾ NO BANK GUARANTEE ◾ MAY LOSE VALUE
© 2017 Wells Fargo Funds Management, LLC. All rights reserved.
| | |
 | | 303215 06-17 SA262/SAR262 04-17 |
Semi-Annual Report
April 30, 2017

Wells Fargo Global Small Cap Fund
(formerly known as Wells Fargo Global Opportunities Fund)


Reduce clutter. Save trees.
Sign up for electronic delivery of prospectuses and shareholder reports at wellsfargo.com/advantagedelivery
Contents
The views expressed and any forward-looking statements are as of April 30, 2017, unless otherwise noted, and are those of the Fund managers and/or Wells Fargo Funds Management, LLC. Discussions of individual securities, or the markets generally, or any Wells Fargo Fund are not intended as individual recommendations. Future events or results may vary significantly from those expressed in any forward-looking statements. The views expressed are subject to change at any time in response to changing circumstances in the market. Wells Fargo Funds Management, LLC and the Fund disclaim any obligation to publicly update or revise any views expressed or forward-looking statements.
NOT FDIC INSURED ◾ NO BANK GUARANTEE ◾ MAY LOSE VALUE
| | | | |
| 2 | | Wells Fargo Global Small Cap Fund | | Letter to shareholders (unaudited) |

Andrew Owen
President
Wells Fargo Funds
Despite heightened market volatility at times, in general, global stocks delivered double-digit returns while bond markets were hurt by a rise in interest rates during the latter part of 2016.
Dear Shareholder:
As the new president of Wells Fargo Funds, now that Karla Rabusch is retiring from that position after nearly 14 years, I am pleased to offer you this semi-annual report for the Wells Fargo Global Small Cap Fund for the six-month period that ended April 30, 2017. Effective April 1, 2017, the Fund changed its name from Wells Fargo Global Opportunities Fund to Wells Fargo Global Small Cap Fund. Despite heightened market volatility at times, in general, global stocks delivered double-digit returns while bond markets were hurt by a rise in interest rates during the latter part of 2016. U.S. and international stocks returned 13.31% and 10.37% for the six-month period, respectively, as measured by the S&P 500 Index1 and the MSCI ACWI ex USA Index (Net)2; within fixed income, the Bloomberg Barclays U.S. Aggregate Bond Index3 returned -0.67%.
During the last two months of 2016, prospects for faster growth and higher interest rates in the U.S. influenced markets.
Following Donald Trump’s election as president in early November, U.S. stocks began to rally. Investors appeared optimistic that the new administration would usher in a series of progrowth policies, and supportive economic news helped the rally carry through the end of 2016. The buoyant environment sent interest rates higher as well. At its mid-December meeting, Fed officials raised their short-term target interest rate for the first time in a year by a quarter percentage point to between 0.50% and 0.75%. Outside of the U.S., the prospects for faster U.S. growth appeared to trigger some acceleration in Europe. The improvement may be partly attributable to expectations for further strengthening of the U.S. dollar, which in turn could improve demand for European goods in the U.S. due to weakening of the euro relative to the dollar. Rising inflation across the eurozone and Japan caused an upward shift in yield curves in those areas, although developed-country bond yields remained significantly lower than U.S. Treasury yields.
Globally, stocks delivered positive results and economies showed improvement in the first four months of 2017.
Stocks rallied globally, supported by signs of improvement in the U.S. and global economies. In the U.S., hiring remained strong and business and consumer sentiment improved. Meanwhile, inflation inched up. In March, Fed officials raised their short-term target interest rate by a quarter percentage point to between 0.75% and 1.00%. With the Fed’s target-rate increase, short-term bond yields rose. Longer-term Treasury yields were little changed, however, leading to positive performance. Investment-grade corporate bonds and high-yield bonds benefited from strong demand. Municipal bond returns were also positive during the first four months of 2017, helped by strong demand and constrained new-issue supply. Outside the U.S., stocks in emerging markets benefited from both global economic growth and recent weakening in the U.S. dollar. European stocks also advanced as political risk declined. In the first round of the French presidential
| 1 | The S&P 500 Index consists of 500 stocks chosen for market size, liquidity, and industry group representation. It is a market-value-weighted index with each stock’s weight in the index proportionate to its market value. You cannot invest directly in an index. |
| 2 | The Morgan Stanley Capital International (MSCI) All Country World Index (ACWI) ex USA Index (Net) is a free-float-adjusted market-capitalization-weighted index that is designed to measure the equity market performance of developed markets, excluding the United States and Canada. Source: MSCI. MSCI makes no express or implied warranties or representations and shall have no liability whatsoever with respect to any MSCI data contained herein. The MSCI data may not be further redistributed or used as a basis for other indexes or any securities or financial products. This report is not approved, reviewed, or produced by MSCI. You cannot invest directly in an index. |
| 3 | The Bloomberg Barclays U.S. Aggregate Bond Index (formerly known as Barclays U.S. Aggregate Bond Index) is a broad-based benchmark that measures the investment-grade, U.S. dollar–denominated, fixed-rate taxable bond market, including Treasuries, government-related and corporate securities, mortgage-backed securities (agency fixed-rate and hybrid adjustable-rate mortgage pass-throughs), asset-backed securities, and commercial mortgage-backed securities. You cannot invest directly in an index. |
| | | | | | |
| Letter to shareholders (unaudited) | | Wells Fargo Global Small Cap Fund | | | 3 | |
elections, Emmanuel Macron, a pro-EU candidate, garnered the most votes. Non-U.S. bonds also benefited from a decline in perceived risk, with credit spreads continuing to narrow.
Don’t let short-term uncertainty derail long-term investment goals.
Periods of uncertainty can present challenges, but experience has taught us that maintaining long-term investment goals can be an effective way to plan for the future. To help you create a sound strategy based on your personal goals and risk tolerance, Wells Fargo Funds offers more than 100 mutual funds spanning a wide range of asset classes and investment styles. Although diversification cannot guarantee an investment profit or prevent losses, we believe it can be an effective way to manage investment risk and potentially smooth out overall portfolio performance. We encourage investors to know their investments and to understand that appropriate levels of risk-taking may unlock opportunities.
Thank you for choosing to invest in Wells Fargo Funds. We appreciate your confidence in us and remain committed to helping you meet your financial needs.
Sincerely,

Andrew Owen
President
Wells Fargo Funds
Although diversification cannot guarantee an investment profit or prevent losses, we believe it can be an effective way to manage investment risk and potentially smooth out overall portfolio performance.
For further information about your Fund, contact your investment professional, visit our website at wellsfargofunds.com, or call us directly at 1-800-222-8222. We are available 24 hours a day, 7 days a week.
| | | | |
| 4 | | Wells Fargo Global Small Cap Fund | | Performance highlights (unaudited) |
Investment objective
The Fund seeks long-term capital appreciation.
Manager
Wells Fargo Funds Management, LLC
Subadviser
Wells Capital Management Incorporated
Portfolio managers
Oleg Makhorine
Robert Rifkin, CFA®
James M. Tringas, CFA®, CPA
Bryant VanCronkhite, CFA®, CPA
Average annual total returns (%) as of April 30, 20171
| | | | | | | | | | | | | | | | | | | | | | | | | | | | | | | | | | |
| | | | | Including sales charge | | | Excluding sales charge | | | Expense ratios2 (%) | |
| | | Inception date | | 1 year | | | 5 year | | | 10 year | | | 1 year | | | 5 year | | | 10 year | | | Gross | | | Net3 | |
| Class A (EKGAX) | | 3-16-1988 | | | 13.82 | | | | 9.91 | | | | 4.69 | | | | 20.76 | | | | 11.22 | | | | 5.31 | | | | 1.56 | | | | 1.56 | |
| Class B (EKGBX)* | | 2-1-1993 | | | 14.88 | | | | 10.11 | | | | 4.76 | | | | 19.88 | | | | 10.38 | | | | 4.76 | | | | 2.31 | | | | 2.31 | |
| Class C (EKGCX) | | 2-1-1993 | | | 18.88 | | | | 10.39 | | | | 4.53 | | | | 19.88 | | | | 10.39 | | | | 4.53 | | | | 2.31 | | | | 2.31 | |
| Administrator Class (EKGYX) | | 1-13-1997 | | | – | | | | – | | | | – | | | | 20.94 | | | | 11.39 | | | | 5.52 | | | | 1.48 | | | | 1.41 | |
| Institutional Class (EKGIX) | | 7-30-2010 | | | – | | | | – | | | | – | | | | 21.24 | | | | 11.67 | | | | 5.70 | | | | 1.23 | | | | 1.16 | |
| S&P Developed SmallCap Index4 | | – | | | – | | | | – | | | | – | | | | 16.89 | | | | 11.45 | | | | 5.24 | | | | – | | | | – | |
| * | | At the close of business on May 5, 2017, existing Class B shareholders were converted to Class A shareholders. Effective May 6, 2017, Class B shares are no longer offered by the Fund. |
Figures quoted represent past performance, which is no guarantee of future results, and do not reflect taxes that a shareholder may pay on fund distributions or the redemption of fund shares. Investment return and principal value of an investment will fluctuate so that an investor’s shares, when redeemed, may be worth more or less than their original cost. Performance shown without sales charges would be lower if sales charges were reflected. Current performance may be lower or higher than the performance data quoted, which assumes the reinvestment of dividends and capital gains. Current month-end performance is available on the Fund’s website, wellsfargofunds.com.
Index returns do not include transaction costs associated with buying and selling securities, any mutual fund fees or expenses, or any taxes. It is not possible to invest directly in an index.
For Class A shares, the maximum front-end sales charge is 5.75%. For Class B shares, the maximum contingent deferred sales charge is 5.00%. For Class C shares, the maximum contingent deferred sales charge is 1.00%. Performance including a contingent deferred sales charge assumes the sales charge for the corresponding time period. Administrator Class and Institutional Class shares are sold without a front-end sales charge or contingent deferred sales charge.
Stock values fluctuate in response to the activities of individual companies and general market and economic conditions. Foreign investments are especially volatile and can rise or fall dramatically due to differences in the political and economic conditions of the host country. These risks are generally intensified in emerging markets. The use of derivatives may reduce returns and/or increase volatility. Certain investment strategies tend to increase the total risk of an investment (relative to the broader market). The Fund is exposed to geographic risk and smaller-company securities risk. Consult the Fund’s prospectus for additional information on these and other risks.
Please see footnotes on page 5.
| | | | | | |
| Performance highlights (unaudited) | | Wells Fargo Global Small Cap Fund | | | 5 | |
| | | | |
| Ten largest holdings (%) as of April 30, 20175 | |
Denny’s Corporation | | | 1.74 | |
ICU Medical Incorporated | | | 1.73 | |
Nomad Foods Limited | | | 1.61 | |
Douglas Dynamics Incorporated | | | 1.57 | |
Forward Air Corporation | | | 1.52 | |
ALLETE Incorporated | | | 1.51 | |
Haemonetics Corporation | | | 1.51 | |
Korn/Ferry International | | | 1.50 | |
Analogic Corporation | | | 1.48 | |
Gerresheimer AG | | | 1.47 | |
|
| Country allocation as of April 30, 20176 |
|
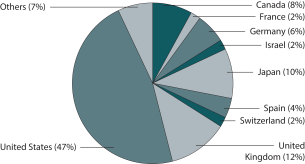 |
|
| Sector distribution as of April 30, 20176 |
|

|
| 1 | Historical performance shown for Institutional Class shares prior to their inception reflects the performance of Administrator Class shares, and includes the higher expenses applicable to Administrator Class shares. If these expenses had not been included, returns for Institutional Class shares would be higher. Historical performance shown for all classes of the Fund prior to July 19, 2010, is based on the performance of the Fund’s predecessor, Evergreen Global Opportunities Fund. |
| 2 | Reflects the expense ratios as stated in the most recent prospectuses, which include the impact of 0.01% in acquired fund fees and expenses. The expense ratios shown are subject to change and may differ from the annualized expense ratios shown in the financial highlights of this report, which do not include acquired fund fees and expenses. |
| 3 | The manager has contractually committed through February 28, 2018 to waive fees and/or reimburse expenses to the extent necessary to cap the Fund’s Total Annual Operating Expenses After Fee Waiver at 1.55% for Class A, 2.30% for Class B, 2.30% for Class C, 1.40% for Administrator Class, and 1.15% for Institutional Class. After this time, the cap may be increased or the commitment to maintain the cap may be terminated only with the approval of the Board of Trustees. Brokerage commissions, stamp duty fees, interest, taxes, acquired fees and expenses, and extraordinary expenses are excluded from the expense cap. Without this cap, the Fund’s returns would have been lower. The expense ratio paid by an investor is the net expense ratio or the Fund’s Total Annual Fund Operating Expenses After Fee Waivers, as stated in the prospectuses. |
| 4 | The S&P Developed SmallCap Index is a free-float-adjusted market-capitalization-weighted index designed to measure the equity market performance of small-capitalization companies located in developed markets. The index is composed of companies within the bottom 15% of the cumulative market capitalization in developed markets. The index covers all publicly listed equities with float-adjusted market values of U.S. $100 million or more and annual dollar value traded of at least U.S. $50 million in all included countries. You cannot invest directly in an index. |
| 5 | The ten largest holdings, excluding cash and cash equivalents, are calculated based on the value of the investments divided by total net assets of the Fund. Holdings are subject to change and may have changed since the date specified. |
| 6 | Amounts are calculated based on the total long-term investments of the Fund. These amounts are subject to change and may have changed since the date specified. |
| | | | |
| 6 | | Wells Fargo Global Small Cap Fund | | Fund expenses (unaudited) |
As a shareholder of the Fund, you incur two types of costs: (1) transaction costs, including sales charges (loads) on purchase payments and contingent deferred sales charges (if any) on redemptions and (2) ongoing costs, including management fees, distribution (12b-1) and/or shareholder servicing fees, and other Fund expenses. This example is intended to help you understand your ongoing costs (in dollars) of investing in the Fund and to compare these costs with the ongoing costs of investing in other mutual funds.
The example is based on an investment of $1,000 invested at the beginning of the six-month period and held for the entire period from November 1, 2016 to April 30, 2017.
Actual expenses
The “Actual” line of the table below provides information about actual account values and actual expenses. You may use the information in this line, together with the amount you invested, to estimate the expenses that you paid over the period. Simply divide your account value by $1,000 (for example, an $8,600 account value divided by $1,000 = 8.6), then multiply the result by the number in the “Actual” line under the heading entitled “Expenses paid during period” for your applicable class of shares to estimate the expenses you paid on your account during this period.
Hypothetical example for comparison purposes
The “Hypothetical” line of the table below provides information about hypothetical account values and hypothetical expenses based on the Fund’s actual expense ratio and an assumed rate of return of 5% per year before expenses, which is not the Fund’s actual return. The hypothetical account values and expenses may not be used to estimate the actual ending account balance or expenses you paid for the period. You may use this information to compare the ongoing costs of investing in the Fund and other funds. To do so, compare this 5% hypothetical example with the 5% hypothetical examples that appear in the shareholder reports of the other funds.
Please note that the expenses shown in the table are meant to highlight your ongoing costs only and do not reflect any transactional costs, such as sales charges (loads) and contingent deferred sales charges. Therefore, the “Hypothetical” line of the table is useful in comparing ongoing costs only and will not help you determine the relative total costs of owning different funds. In addition, if these transactional costs were included, your costs would have been higher.
| | | | | | | | | | | | | | | | |
| | | Beginning
account value
11-1-2016 | | | Ending
account value
4-30-2017 | | | Expenses
paid during
the period¹ | | | Annualized net
expense ratio | |
Class A | | | | | | | | | | | | | | | | |
Actual | | $ | 1,000.00 | | | $ | 1,141.27 | | | $ | 8.18 | | | | 1.54 | % |
Hypothetical (5% return before expenses) | | $ | 1,000.00 | | | $ | 1,017.16 | | | $ | 7.70 | | | | 1.54 | % |
Class B | | | | | | | | | | | | | | | | |
Actual | | $ | 1,000.00 | | | $ | 1,137.17 | | | $ | 12.13 | | | | 2.29 | % |
Hypothetical (5% return before expenses) | | $ | 1,000.00 | | | $ | 1,013.44 | | | $ | 11.43 | | | | 2.29 | % |
Class C | | | | | | | | | | | | | | | | |
Actual | | $ | 1,000.00 | | | $ | 1,137.12 | | | $ | 12.13 | | | | 2.29 | % |
Hypothetical (5% return before expenses) | | $ | 1,000.00 | | | $ | 1,013.44 | | | $ | 11.43 | | | | 2.29 | % |
Administrator Class | | | | | | | | | | | | | | | | |
Actual | | $ | 1,000.00 | | | $ | 1,141.94 | | | $ | 7.44 | | | | 1.40 | % |
Hypothetical (5% return before expenses) | | $ | 1,000.00 | | | $ | 1,017.85 | | | $ | 7.00 | | | | 1.40 | % |
Institutional Class | | | | | | | | | | | | | | | | |
Actual | | $ | 1,000.00 | | | $ | 1,143.46 | | | $ | 6.11 | | | | 1.15 | % |
Hypothetical (5% return before expenses) | | $ | 1,000.00 | | | $ | 1,019.09 | | | $ | 5.76 | | | | 1.15 | % |
| 1 | Expenses paid is equal to the annualized net expense ratio of each class multiplied by the average account value over the period, multiplied by the number of days in the most recent fiscal half-year divided by the number of days in the fiscal year (to reflect the one-half-year period). |
| | | | | | |
| Portfolio of investments—April 30, 2017 (unaudited) | | Wells Fargo Global Small Cap Fund | | | 7 | |
| | | | | | | | | | | | | | | | |
| Security name | | | | | | | | Shares | | | Value | |
| | | |
Common Stocks: 90.54% | | | | | | | | | | | | | |
| | | |
| Australia: 1.23% | | | | | | | | | | | | | |
Ansell Limited (Health Care, Health Care Equipment & Supplies) | | | | | | | | | | | 135,976 | | | $ | 2,423,288 | |
Inghams Group Limited (Consumer Staples, Food Products) | | | | | | | | | | | 247,416 | | | | 579,880 | |
| | | | |
| | | | | | | | | | | | | | | 3,003,168 | |
| | | | | | | | | | | | | | | | |
| | | |
| Austria: 0.72% | | | | | | | | | | | | | |
Mayr-Melnhof Karton AG (Materials, Containers & Packaging) | | | | | | | | | | | 10,231 | | | | 1,237,053 | |
Zumtobel Group AG (Industrials, Electrical Equipment) | | | | | | | | | | | 25,315 | | | | 528,073 | |
| | | | |
| | | | | | | | | | | | | | | 1,765,126 | |
| | | | | | | | | | | | | | | | |
| | | |
| Canada: 7.19% | | | | | | | | | | | | | |
Colliers International Group (Real Estate, Real Estate Management & Development) | | | | | | | | | | | 39,753 | | | | 1,946,515 | |
Cott Corporation (Consumer Staples, Beverages) | | | | | | | | | | | 156,635 | | | | 2,060,851 | |
Great Canadian Gaming Corporation (Consumer Discretionary, Hotels, Restaurants & Leisure) † | | | | | | | | | | | 77,622 | | | | 1,385,772 | |
Maple Leaf Foods Incorporated (Consumer Staples, Food Products) | | | | | | | | | | | 61,025 | | | | 1,527,581 | |
MTY Food Group Incorporated (Consumer Discretionary, Hotels, Restaurants & Leisure) | | | | | | | | | | | 50,294 | | | | 1,727,250 | |
Mullen Group Limited (Energy, Energy Equipment & Services) | | | | | | | | | | | 107,591 | | | | 1,179,911 | |
Novanta Incorporated (Information Technology, Electronic Equipment, Instruments & Components) † | | | | | | | | | | | 116,105 | | | | 3,256,745 | |
Parex Resources Incorporated (Energy, Oil, Gas & Consumable Fuels) † | | | | | | | | | | | 96,236 | | | | 1,194,975 | |
Source Energy Services Limited (Energy, Energy Equipment & Services) † | | | | | | | | | | | 125,000 | | | | 902,897 | |
Tesco Corporation (Energy, Energy Equipment & Services) † | | | | | | | | | | | 158,800 | | | | 1,040,140 | |
Western Forest Products Incorporated (Materials, Paper & Forest Products) | | | | | | | | | | | 850,117 | | | | 1,338,963 | |
| | | | |
| | | | | | | | | | | | | | | 17,561,600 | |
| | | | | | | | | | | | | | | | |
| | | |
| Finland: 0.50% | | | | | | | | | | | | | |
Metsa Board OYJ (Materials, Paper & Forest Products) | | | | | | | | | | | 171,648 | | | | 1,219,084 | |
| | | | | | | | | | | | | | | | |
| | | |
| France: 1.87% | | | | | | | | | | | | | |
ALTEN SA (Information Technology, IT Services) | | | | | | | | | | | 28,939 | | | | 2,452,508 | |
M6 Metropole Television SA (Consumer Discretionary, Media) | | | | | | | | | | | 93,186 | | | | 2,123,029 | |
| | | | |
| | | | | | | | | | | | | | | 4,575,537 | |
| | | | | | | | | | | | | | | | |
| | | |
| Germany: 5.21% | | | | | | | | | | | | | |
Cancom SE (Information Technology, IT Services) « | | | | | | | | | | | 42,061 | | | | 2,488,781 | |
Gerresheimer AG (Health Care, Life Sciences Tools & Services) | | | | | | | | | | | 45,830 | | | | 3,595,426 | |
Krones AG (Industrials, Machinery) « | | | | | | | | | | | 12,891 | | | | 1,530,596 | |
SMA Solar Technology AG (Information Technology, Semiconductors & Semiconductor Equipment) « | | | | | | | | | | | 58,058 | | | | 1,502,327 | |
TAG Immobilien AG (Real Estate, Real Estate Management & Development) | | | | | | | | | | | 137,371 | | | | 1,955,771 | |
TLG Immobilien AG (Real Estate, Real Estate Management & Development) | | | | | | | | | | | 81,158 | | | | 1,642,130 | |
| | | | |
| | | | | | | | | | | | | | | 12,715,031 | |
| | | | | | | | | | | | | | | | |
| | | |
| Hong Kong: 0.96% | | | | | | | | | | | | | |
Sunlight REIT (Real Estate, Equity REITs) | | | | | | | | | | | 3,763,000 | | | | 2,336,651 | |
| | | | | | | | | | | | | | | | |
| | | |
| Ireland: 1.09% | | | | | | | | | | | | | |
Endo International plc (Health Care, Pharmaceuticals) † | | | | | | | | | | | 59,000 | | | | 670,830 | |
Horizon Pharma plc (Health Care, Pharmaceuticals) † | | | | | | | | | | | 129,700 | | | | 1,994,786 | |
| | | | |
| | | | | | | | | �� | | | | | | 2,665,616 | |
| | | | | | | | | | | | | | | | |
The accompanying notes are an integral part of these financial statements.
| | | | |
| 8 | | Wells Fargo Global Small Cap Fund | | Portfolio of investments—April 30, 2017 (unaudited) |
| | | | | | | | | | | | | | | | |
| Security name | | | | | | | | Shares | | | Value | |
| | | |
| Israel: 1.44% | | | | | | | | | | | | | |
Orbotech Limited (Information Technology, Electronic Equipment, Instruments & Components) † | | | | | | | | | | | 106,827 | | | $ | 3,517,813 | |
| | | | | | | | | | | | | | | | |
| | | |
| Italy: 1.20% | | | | | | | | | | | | | |
Azimut Holding SpA (Financials, Capital Markets) | | | | | | | | | | | 64,206 | | | | 1,253,317 | |
Davide Campari-Milano SpA (Consumer Staples, Beverages) | | | | | | | | | | | 141,029 | | | | 1,668,344 | |
| | | | |
| | | | | | | | | | | | | | | 2,921,661 | |
| | | | | | | | | | | | | | | | |
| | | | |
| Japan: 9.18% | | | | | | | | | | | | | | | | |
Aeon Delight Company Limited (Industrials, Commercial Services & Supplies) | | | | | | | | | | | 108,400 | | | | 3,306,212 | |
DTS Corporation (Information Technology, IT Services) | | | | | | | | | | | 87,400 | | | | 2,290,942 | |
Ezaki Glico Company Limited (Consumer Staples, Food Products) | | | | | | | | | | | 30,900 | | | | 1,627,118 | |
FamilyMart Company Limited (Consumer Staples, Food & Staples Retailing) | | | | | | | | | | | 18,400 | | | | 1,039,874 | |
Fuji Seal International Incorporated (Materials, Containers & Packaging) | | | | | | | | | | | 67,000 | | | | 1,595,138 | |
Meitec Corporation (Industrials, Professional Services) | | | | | | | | | | | 59,400 | | | | 2,565,696 | |
Musashi Seimitsu Industry Company Limited (Consumer Discretionary, Auto Components) | | | | | | | | | | | 39,400 | | | | 967,019 | |
Nihon Parkerizing Company Limited (Materials, Chemicals) | | | | | | | | | | | 170,100 | | | | 2,183,567 | |
ORIX JREIT Incorporated (Real Estate, Equity REITs) | | | | | | | | | | | 1,088 | | | | 1,725,574 | |
OSG Corporation (Industrials, Machinery) « | | | | | | | | | | | 62,500 | | | | 1,286,723 | |
Ship Healthcare Holdings Incorporated (Health Care, Health Care Providers & Services) | | | | | | | | | | | 52,100 | | | | 1,400,706 | |
Sumitomo Warehouse Company Limited (Industrials, Transportation Infrastructure) | | | | | | | | | | | 202,000 | | | | 1,224,956 | |
Taikisha Limited (Industrials, Construction & Engineering) | | | | | | | | | | | 48,500 | | | | 1,207,769 | |
| | | | |
| | | | | | | | | | | | | | | 22,421,294 | |
| | | | | | | | | | | | | | | | |
| | | | |
| Netherlands: 0.87% | | | | | | | | | | | | | | | | |
Frank’s International NV (Energy, Energy Equipment & Services) « | | | | | | | | | | | 130,800 | | | | 1,190,280 | |
TKH Group NV (Industrials, Electrical Equipment) | | | | | | | | | | | 19,992 | | | | 919,001 | |
| | | | |
| | | | | | | | | | | | | | | 2,109,281 | |
| | | | | | | | | | | | | | | | |
| | | | |
| Spain: 3.20% | | | | | | | | | | | | | | | | |
Almirall SA (Health Care, Pharmaceuticals) | | | | | | | | | | | 139,327 | | | | 2,516,328 | |
Merlin Properties Socimi SA (Real Estate, Equity REITs) « | | | | | | | | | | | 160,285 | | | | 1,897,012 | |
Prosegur Compania de Seguridad SA (Industrials, Commercial Services & Supplies) | | | | | | | | | | | 173,358 | | | | 1,131,145 | |
Viscofan SA (Consumer Staples, Food Products) | | | | | | | | | | | 37,829 | | | | 2,263,919 | |
| | | | |
| | | | | | | | | | | | | | | 7,808,404 | |
| | | | | | | | | | | | | | | | |
| | | | |
| Sweden: 0.40% | | | | | | | | | | | | | | | | |
Rezidor Hotel Group AB (Consumer Discretionary, Hotels, Restaurants & Leisure) « | | | | | | | | | | | 263,630 | | | | 982,217 | |
| | | | | | | | | | | | | | | | |
| | | | |
| Switzerland: 1.84% | | | | | | | | | | | | | | | | |
Aryzta AG (Consumer Staples, Food Products) | | | | | | | | | | | 29,419 | | | | 955,304 | |
Bucher Industries AG (Industrials, Machinery) | | | | | | | | | | | 2,703 | | | | 871,344 | |
OC Oerlikon Corporation AG (Information Technology, Electronic Equipment, Instruments & Components) | | | | | | | | | | | 222,432 | | | | 2,671,420 | |
| | | | |
| | | | | | | | | | | | | | | 4,498,068 | |
| | | | | | | | | | | | | | | | |
| | | | |
| United Kingdom: 10.85% | | | | | | | | | | | | | | | | |
Berendsen plc (Industrials, Commercial Services & Supplies) | | | | | | | | | | | 90,107 | | | | 979,168 | |
Bovis Homes Group plc (Consumer Discretionary, Household Durables) | | | | | | | | | | | 62,815 | | | | 748,900 | |
Britvic plc (Consumer Staples, Beverages) | | | | | | | | | | | 222,231 | | | | 1,914,092 | |
Consort Medical plc (Health Care, Health Care Equipment & Supplies) | | | | | | | | | | | 45,055 | | | | 606,894 | |
The accompanying notes are an integral part of these financial statements.
| | | | | | |
| Portfolio of investments—April 30, 2017 (unaudited) | | Wells Fargo Global Small Cap Fund | | | 9 | |
| | | | | | | | | | | | | | | | |
| Security name | | | | | | | | Shares | | | Value | |
| | | |
| United Kingdom (continued) | | | | | | | | | | | | | |
Domino’s Pizza Group plc (Consumer Discretionary, Hotels, Restaurants & Leisure) | | | | | | | | | | | 329,461 | | | $ | 1,410,302 | |
Elementis plc (Materials, Chemicals) | | | | | | | | | | | 459,799 | | | | 1,811,606 | |
Hunting plc (Energy, Energy Equipment & Services) | | | | | | | | | | | 199,757 | | | | 1,455,329 | |
Jupiter Fund Management plc (Financials, Capital Markets) | | | | | | | | | | | 262,284 | | | | 1,612,264 | |
Keller Group plc (Industrials, Construction & Engineering) | | | | | | | | | | | 90,011 | | | | 1,079,551 | |
Lancashire Holdings Limited (Financials, Insurance) | | | | | | | | | | | 156,710 | | | | 1,385,275 | |
Mears Group plc (Industrials, Commercial Services & Supplies) | | | | | | | | | | | 233,426 | | | | 1,575,156 | |
Micro Focus International plc (Information Technology, Software) | | | | | | | | | | | 68,206 | | | | 2,286,249 | |
NCC Group plc (Information Technology, IT Services) | | | | | | | | | | | 895,060 | | | | 1,651,975 | |
Nomad Foods Limited (Consumer Staples, Food Products) † | | | | | | | | | | | 332,653 | | | | 3,925,305 | |
Savills plc (Real Estate, Real Estate Management & Development) | | | | | | | | | | | 163,390 | | | | 1,965,974 | |
Steris plc (Health Care, Health Care Equipment & Supplies) | | | | | | | | | | | 24,985 | | | | 1,843,893 | |
Stock Spirits Group plc (Consumer Staples, Beverages) | | | | | | | | | | | 109,708 | | | | 248,664 | |
| | | | |
| | | | | | | | | | | | | | | 26,500,597 | |
| | | | | | | | | | | | | | | | |
| | | |
| United States: 42.79% | | | | | | | | | | | | | |
ACI Worldwide Incorporated (Information Technology, Software) † | | | | | | | | | | | 154,200 | | | | 3,313,758 | |
ALLETE Incorporated (Utilities, Electric Utilities) | | | | | | | | | | | 52,900 | | | | 3,698,239 | |
Analogic Corporation (Health Care, Health Care Equipment & Supplies) | | | | | | | | | | | 50,324 | | | | 3,615,779 | |
AptarGroup Incorporated (Materials, Containers & Packaging) | | | | | | | | | | | 42,700 | | | | 3,428,810 | |
Aspen Insurance Holdings Limited (Financials, Insurance) | | | | | | | | | | | 58,200 | | | | 3,046,770 | |
Belden Incorporated (Information Technology, Electronic Equipment, Instruments & Components) | | | | | | | | | | | 39,700 | | | | 2,767,090 | |
Berkshire Hills Bancorp Incorporated (Financials, Banks) | | | | | | | | | | | 56,800 | | | | 2,130,000 | |
Casey’s General Stores Incorporated (Consumer Staples, Food & Staples Retailing) « | | | | | | | | | | | 23,100 | | | | 2,588,817 | |
Compass Minerals International Incorporated (Materials, Metals & Mining) « | | | | | | | | | | | 46,100 | | | | 3,042,600 | |
Denny’s Corporation (Consumer Discretionary, Hotels, Restaurants & Leisure) † | | | | | | | | | | | 334,300 | | | | 4,245,610 | |
Douglas Dynamics Incorporated (Industrials, Machinery) | | | | | | | | | | | 120,142 | | | | 3,832,530 | |
Forward Air Corporation (Industrials, Air Freight & Logistics) | | | | | | | | | | | 69,600 | | | | 3,700,632 | |
GCP Applied Technologies Incorporated (Materials, Chemicals) † | | | | | | | | | | | 46,975 | | | | 1,545,478 | |
Gibraltar Industries Incorporated (Industrials, Building Products) † | | | | | | | | | | | 16,200 | | | | 635,850 | |
Global Brass & Copper Holdings Incorporated (Industrials, Machinery) | | | | | | | | | | | 46,300 | | | | 1,650,595 | |
Guess? Incorporated (Consumer Discretionary, Specialty Retail) | | | | | | | | | | | 148,000 | | | | 1,651,680 | |
Haemonetics Corporation (Health Care, Health Care Equipment & Supplies) † | | | | | | | | | | | 88,076 | | | | 3,688,623 | |
HB Fuller Company (Materials, Chemicals) | | | | | | | | | | | 47,900 | | | | 2,530,557 | |
Helen of Troy Limited (Consumer Discretionary, Household Durables) † | | | | | | | | | | | 37,600 | | | | 3,534,400 | |
ICU Medical Incorporated (Health Care, Health Care Equipment & Supplies) † | | | | | | | | | | | 27,400 | | | | 4,214,120 | |
Innoviva Incorporated (Health Care, Pharmaceuticals) † | | | | | | | | | | | 273,508 | | | | 3,223,292 | |
Keane Group Incorporated (Energy, Energy Equipment & Services) Ǡ | | | | | | | | | | | 85,974 | | | | 1,188,161 | |
Korn/Ferry International (Industrials, Professional Services) | | | | | | | | | | | 113,400 | | | | 3,674,160 | |
Mueller Industries Incorporated (Industrials, Machinery) | | | | | | | | | | | 82,800 | | | | 2,652,912 | |
NetScout Systems Incorporated (Information Technology, Communications Equipment) † | | | | | | | | | | | 72,400 | | | | 2,725,860 | |
PAREXEL International Corporation (Health Care, Life Sciences Tools & Services) † | | | | | | | | | | | 42,600 | | | | 2,719,158 | |
Parkway Incorporated (Real Estate, Equity REITs) | | | | | | | | | | | 139,500 | | | | 2,810,925 | |
PharMerica Corporation (Health Care, Health Care Providers & Services) † | | | | | | | | | | | 37,200 | | | | 877,920 | |
Progress Software Corporation (Information Technology, Software) | | | | | | | | | | | 101,300 | | | | 3,010,636 | |
Quanex Building Products Corporation (Industrials, Building Products) | | | | | | | | | | | 156,508 | | | | 3,192,763 | |
Ryder System Incorporated (Industrials, Road & Rail) | | | | | | | | | | | 38,800 | | | | 2,634,908 | |
Schweitzer-Mauduit International Incorporated (Materials, Paper & Forest Products) | | | | | | | | | | | 46,857 | | | | 2,017,194 | |
Simpson Manufacturing Company Incorporated (Industrials, Building Products) | | | | | | | | | | | 52,770 | | | | 2,201,037 | |
The accompanying notes are an integral part of these financial statements.
| | | | |
| 10 | | Wells Fargo Global Small Cap Fund | | Portfolio of investments—April 30, 2017 (unaudited) |
| | | | | | | | | | | | | | | | | | | | |
| Security name | | | | | | | | | | | Shares | | | Value | |
| | | | |
| United States (continued) | | | | | | | | | | | | | | | | | |
Smart Sand Incorporated (Energy, Energy Equipment & Services) Ǡ | | | | | | | | | | | | | | | 81,900 | | | $ | 997,542 | |
Thermon Group Holdings Incorporated (Industrials, Electrical Equipment) † | | | | | | | | | | | | | | | 106,400 | | | | 2,181,200 | |
Vishay Intertechnology Incorporated (Information Technology, Electronic Equipment, Instruments & Components) | | | | | | | | | | | | | | | 100,233 | | | | 1,638,810 | |
WD-40 Company (Consumer Staples, Household Products) | | | | | | | | | | | | | | | 26,200 | | | | 2,747,070 | |
Weingarten Realty Investors (Real Estate, Equity REITs) | | | | | | | | | | | | | | | 57,800 | | | | 1,894,106 | |
Westwood Holdings Group Incorporated (Financials, Capital Markets) | | | | | | | | | | | | | | | 58,050 | | | | 3,239,190 | |
| | | | | |
| | | | | | | | | | | | | | | | | | | 104,488,782 | |
| | | | | | | | | | | | | | | | | | | | |
| | | | |
Total Common Stocks (Cost $183,866,656) | | | | | | | | | | | | | | | | 221,089,930 | |
| | | | | | | | | | | | | | | | | | | | |
| | | | | |
| | | Yield | | | | | | | | | | | | | |
| Short-Term Investments: 14.72% | | | | | | | | | | | | | | | | | |
| | | | |
| Investment Companies: 14.72% | | | | | | | | | | | | | | | | | |
Securities Lending Cash Investment LLC (l)(r)(u) | | | 1.03 | % | | | | | | | | | | | 14,491,930 | | | | 14,493,379 | |
Wells Fargo Government Money Market Fund Select Class (l)(u) | | | 0.68 | | | | | | | | | | | | 21,455,075 | | | | 21,455,075 | |
| | | | |
Total Short-Term Investments (Cost $35,947,664) | | | | | | | | | | | | | | | | 35,948,454 | |
| | | | | | | | | | | | | | | | | | | | |
| | | | | | | | |
| Total investments in securities (Cost $219,814,320) * | | | 105.26 | % | | | 257,038,384 | |
Other assets and liabilities, net | | | (5.26 | ) | | | (12,839,880 | ) |
| | | | | | | | |
| Total net assets | | | 100.00 | % | | $ | 244,198,504 | |
| | | | | | | | |
| † | Non-income-earning security |
| « | All or a portion of this security is on loan. |
| (l) | The issuer of the security is an affiliated person of the Fund as defined in the Investment Company Act of 1940. |
| (r) | The investment is a non-registered investment vehicle purchased with cash collateral received from securities on loan. |
| (u) | The rate represents the 7-day annualized yield at period end. |
| * | Cost for federal income tax purposes is $222,023,612 and unrealized gains (losses) consists of: |
| | | | |
Gross unrealized gains | | $ | 40,366,181 | |
Gross unrealized losses | | | (5,351,409 | ) |
| | | | |
Net unrealized gains | | $ | 35,014,772 | |
The accompanying notes are an integral part of these financial statements.
| | | | | | |
| Statement of assets and liabilities—April 30, 2017 (unaudited) | | Wells Fargo Global Small Cap Fund | | | 11 | |
| | | | |
| | |
| |
Assets | | | | |
Investments | | | | |
In unaffiliated securities (including $13,944,609 of securities loaned), at value (cost $183,866,656) | | $ | 221,089,930 | |
In affiliated securities, at value (cost $35,947,664) | | | 35,948,454 | |
| | | | |
Total investments, at value (cost $219,814,320) | | | 257,038,384 | |
Foreign currency, at value (cost $2,006,523) | | | 2,055,663 | |
Receivable for investments sold | | | 3,065,376 | |
Receivable for Fund shares sold | | | 225,663 | |
Receivable for dividends | | | 514,915 | |
Receivable for securities lending income | | | 26,171 | |
Prepaid expenses and other assets | | | 62,246 | |
| | | | |
Total assets | | | 262,988,418 | |
| | | | |
| |
Liabilities | | | | |
Payable for investments purchased | | | 3,435,661 | |
Payable for Fund shares redeemed | | | 465,550 | |
Payable upon receipt of securities loaned | | | 14,492,302 | |
Management fee payable | | | 184,869 | |
Distribution fees payable | | | 21,420 | |
Administration fees payable | | | 37,263 | |
Accrued expenses and other liabilities | | | 152,849 | |
| | | | |
Total liabilities | | | 18,789,914 | |
| | | | |
Total net assets | | $ | 244,198,504 | |
| | | | |
| |
NET ASSETS CONSIST OF | | | | |
Paid-in capital | | $ | 194,862,150 | |
Undistributed net investment income | | | 829,116 | |
Accumulated net realized gains on investments | | | 11,232,717 | |
Net unrealized gains on investments | | | 37,274,521 | |
| | | | |
Total net assets | | $ | 244,198,504 | |
| | | | |
| |
COMPUTATION OF NET ASSET VALUE AND OFFERING PRICE PER SHARE | | | | |
Net assets – Class A | | $ | 143,085,001 | |
Shares outstanding – Class A1 | | | 3,472,669 | |
Net asset value per share – Class A | | | $41.20 | |
Maximum offering price per share – Class A2 | | | $43.71 | |
Net assets – Class B | | $ | 444,614 | |
Shares outstanding – Class B1 | | | 14,703 | |
Net asset value per share – Class B | | | $30.24 | |
Net assets – Class C | | $ | 34,279,765 | |
Shares outstanding – Class C1 | | | 1,128,321 | |
Net asset value per share – Class C | | | $30.38 | |
Net assets – Administrator Class | | $ | 27,664,378 | |
Shares outstanding – Administrator Class1 | | | 644,095 | |
Net asset value per share – Administrator Class | | | $42.95 | |
Net assets – Institutional Class | | $ | 38,724,746 | |
Shares outstanding – Institutional Class1 | | | 904,691 | |
Net asset value per share – Institutional Class | | | $42.80 | |
| 1 | The Fund has an unlimited number of authorized shares. |
| 2 | Maximum offering price is computed as 100/94.25 of net asset value. On investments of $50,000 or more, the offering price is reduced. |
The accompanying notes are an integral part of these financial statements.
| | | | |
| 12 | | Wells Fargo Global Small Cap Fund | | Statement of operations—six months ended April 30, 2017 (unaudited) |
| | | | |
| | | | |
| |
Investment income | | | | |
Dividends (net of foreign withholding taxes of $88,240) | | $ | 2,492,985 | |
Securities lending income, net | | | 142,422 | |
Income from affiliated securities | | | 34,413 | |
| | | | |
Total investment income | | | 2,669,820 | |
| | | | |
| |
Expenses | | | | |
Management fee | | | 1,091,860 | |
Administration fees | | | | |
Class A | | | 150,147 | |
Class B | | | 778 | |
Class C | | | 35,516 | |
Administrator Class | | | 17,577 | |
Institutional Class | | | 16,420 | |
Shareholder servicing fees | | | | |
Class A | | | 178,747 | |
Class B | | | 926 | |
Class C | | | 42,282 | |
Administrator Class | | | 33,588 | |
Distribution fees | | | | |
Class B | | | 2,777 | |
Class C | | | 126,845 | |
Custody and accounting fees | | | 45,034 | |
Professional fees | | | 35,422 | |
Registration fees | | | 31,590 | |
Shareholder report expenses | | | 22,781 | |
Trustees’ fees and expenses | | | 9,830 | |
Other fees and expenses | | | 7,283 | |
| | | | |
Total expenses | | | 1,849,403 | |
Less: Fee waivers and/or expense reimbursements | | | (16,358 | ) |
| | | | |
Net expenses | | | 1,833,045 | |
| | | | |
Net investment income | | | 836,775 | |
| | | | |
| |
REALIZED AND UNREALIZED GAINS (LOSSES) ON INVESTMENTS | | | | |
| |
Net realized gains on investments | | | 13,127,840 | |
Net change in unrealized gains (losses) on investments | | | 16,268,349 | |
| | | | |
Net realized and unrealized gains (losses) on investments | | | 29,396,189 | |
| | | | |
Net increase in net assets resulting from operations | | $ | 30,232,964 | |
| | | | |
The accompanying notes are an integral part of these financial statements.
| | | | | | |
| Statement of changes in net assets | | Wells Fargo Global Small Cap Fund | | | 13 | |
| | | | | | | | | | | | | | | | |
| | | Six months ended April 30, 2017 (unaudited) | | | Year ended October 31, 2016 | |
| | | |
Operations | | | | | | | | | | | | |
Net investment income | | | | | | $ | 836,775 | | | | | | | $ | 1,424,127 | |
Net realized gains on investments | | | | | | | 13,127,840 | | | | | | | | 14,082,086 | |
Net change in unrealized gains (losses) on investments | | | | | | | 16,268,349 | | | | | | | | 2,225,625 | |
| | | | |
Net increase in net assets resulting from operations | | | | | | | 30,232,964 | | | | | | | | 17,731,838 | |
| | | | |
| | | |
Distributions to shareholders from | | | | | | | | | | | | |
Net investment income | | | | | | | | | | | | | | | | |
Class A | | | | | | | (1,253,803 | ) | | | | | | | (886,928 | ) |
Class C | | | | | | | (83,983 | ) | | | | | | | 0 | |
Administrator Class | | | | | | | (242,326 | ) | | | | | | | (231,280 | ) |
Institutional Class | | | | | | | (251,541 | ) | | | | | | | (115,938 | ) |
Net realized gains | | | | | | | | | | | | | | | | |
Class A | | | | | | | (8,370,890 | ) | | | | | | | (6,414,005 | ) |
Class B | | | | | | | (64,415 | ) | | | | | | | (179,734 | ) |
Class C | | | | | | | (2,630,739 | ) | | | | | | | (1,977,317 | ) |
Administrator Class | | | | | | | (1,441,791 | ) | | | | | | | (1,289,238 | ) |
Institutional Class | | | | | | | (1,098,674 | ) | | | | | | | (426,341 | ) |
| | | | |
Total distributions to shareholders | | | | | | | (15,438,162 | ) | | | | | | | (11,520,781 | ) |
| | | | |
| | | | |
Capital share transactions | | | Shares | | | | | | | | Shares | | | | | |
Proceeds from shares sold | | | | | | | | | | | | | | | | |
Class A | | | 270,713 | | | | 10,667,540 | | | | 287,344 | | | | 10,463,647 | |
Class B | | | 0 | | | | 0 | | | | 67 | | | | 1,865 | |
Class C | | | 60,707 | | | | 1,763,008 | | | | 44,683 | | | | 1,201,168 | |
Administrator Class | | | 98,434 | | | | 4,047,712 | | | | 164,556 | | | | 6,297,087 | |
Institutional Class | | | 737,350 | | | | 30,436,237 | | | | 146,823 | | | | 5,639,061 | |
| | | | |
| | | | | | | 46,914,497 | | | | | | | | 23,602,828 | |
| | | | |
Reinvestment of distributions | | | | | | | | | | | | | | | | |
Class A | | | 229,395 | | | | 8,959,764 | | | | 196,310 | | | | 6,790,837 | |
Class B | | | 2,242 | | | | 64,035 | | | | 6,892 | | | | 177,539 | |
Class C | | | 79,166 | | | | 2,276,848 | | | | 63,376 | | | | 1,643,340 | |
Administrator Class | | | 39,319 | | | | 1,601,354 | | | | 41,455 | | | | 1,492,072 | |
Institutional Class | | | 30,428 | | | | 1,235,167 | | | | 11,643 | | | | 418,957 | |
| | | | |
| | | | | | | 14,137,168 | | | | | | | | 10,522,745 | |
| | | | |
Payment for shares redeemed | | | | | | | | | | | | | | | | |
Class A | | | (622,832 | ) | | | (24,695,995 | ) | | | (963,819 | ) | | | (34,320,655 | ) |
Class B | | | (18,399 | ) | | | (538,162 | ) | | | (125,178 | ) | | | (3,309,009 | ) |
Class C | | | (145,707 | ) | | | (4,267,716 | ) | | | (249,405 | ) | | | (6,823,638 | ) |
Administrator Class | | | (261,603 | ) | | | (10,855,646 | ) | | | (259,890 | ) | | | (9,801,894 | ) |
Institutional Class | | | (175,779 | ) | | | (7,210,258 | ) | | | (114,180 | ) | | | (4,457,864 | ) |
| | | | |
| | | | | | | (47,567,777 | ) | | | | | | | (58,713,060 | ) |
| | | | |
Net increase (decrease) in net assets resulting from capital share transactions | | | | | | | 13,483,888 | | | | | | | | (24,587,487 | ) |
| | | | |
Total increase (decrease) in net assets | | | | | | | 28,278,690 | | | | | | | | (18,376,430 | ) |
| | | | |
| | |
Net assets | | | | | | | | |
Beginning of period | | | | | | | 215,919,814 | | | | | | | | 234,296,244 | |
| | | | |
End of period | | | | | | $ | 244,198,504 | | | | | | | $ | 215,919,814 | |
| | | | |
Undistributed net investment income | | | | | | $ | 829,116 | | | | | | | $ | 1,823,994 | |
| | | | |
The accompanying notes are an integral part of these financial statements.
| | | | |
| 14 | | Wells Fargo Global Small Cap Fund | | Financial highlights |
(For a share outstanding throughout each period)
| | | | | | | | | | | | | | | | | | | | | | | | |
| | | Six months ended
April 30, 2017 (unaudited) | | | Year ended October 31 | |
| CLASS A | | | 2016 | | | 2015 | | | 2014 | | | 2013 | | | 2012 | |
Net asset value, beginning of period | | | $38.61 | | | | $37.23 | | | | $43.26 | | | | $42.68 | | | | $33.17 | | | | $30.14 | |
Net investment income | | | 0.14 | 1 | | | 0.26 | 1 | | | 0.10 | 1 | | | 0.03 | 1 | | | 0.16 | 1 | | | 0.20 | 1 |
Net realized and unrealized gains (losses) on investments | | | 5.14 | | | | 2.92 | | | | 0.64 | | | | 0.86 | | | | 9.58 | | | | 2.87 | |
| | | | | | | | | | | | | | | | | | | | | | | | |
Total from investment operations | | | 5.28 | | | | 3.18 | | | | 0.74 | | | | 0.89 | | | | 9.74 | | | | 3.07 | |
Distributions to shareholders from | | | | | | | | | | | | | | | | | | | | | | | | |
Net investment income | | | (0.34 | ) | | | (0.21 | ) | | | (0.03 | ) | | | (0.31 | ) | | | (0.23 | ) | | | (0.04 | ) |
Net realized gains | | | (2.35 | ) | | | (1.59 | ) | | | (6.74 | ) | | | 0.00 | | | | 0.00 | | | | 0.00 | |
| | | | | | | | | | | | | | | | | | | | | | | | |
Total distributions to shareholders | | | (2.69 | ) | | | (1.80 | ) | | | (6.77 | ) | | | (0.31 | ) | | | (0.23 | ) | | | (0.04 | ) |
Net asset value, end of period | | | $41.20 | | | | $38.61 | | | | $37.23 | | | | $43.26 | | | | $42.68 | | | | $33.17 | |
Total return2 | | | 14.13 | % | | | 9.12 | % | | | 2.12 | % | | | 2.07 | % | | | 29.50 | % | | | 10.24 | % |
Ratios to average net assets (annualized) | | | | | | | | | | | | | | | | | | | | | | | | |
Gross expenses | | | 1.54 | % | | | 1.55 | % | | | 1.57 | % | | | 1.57 | % | | | 1.59 | % | | | 1.55 | % |
Net expenses | | | 1.54 | % | | | 1.55 | % | | | 1.55 | % | | | 1.55 | % | | | 1.55 | % | | | 1.54 | % |
Net investment income | | | 0.73 | % | | | 0.73 | % | | | 0.27 | % | | | 0.06 | % | | | 0.43 | % | | | 0.65 | % |
Supplemental data | | | | | | | | | | | | | | | | | | | | | | | | |
Portfolio turnover rate | | | 63 | % | | | 70 | % | | | 42 | % | | | 66 | % | | | 59 | % | | | 85 | % |
Net assets, end of period (000s omitted) | | | $143,085 | | | | $138,805 | | | | $151,740 | | | | $167,166 | | | | $181,764 | | | | $156,433 | |
| 1 | Calculated based upon average shares outstanding |
| 2 | Total return calculations do not include any sales charges. Returns for periods of less than one year are not annualized. |
The accompanying notes are an integral part of these financial statements.
| | | | | | |
| Financial highlights | | Wells Fargo Global Small Cap Fund | | | 15 | |
(For a share outstanding throughout each period)
| | | | | | | | | | | | | | | | | | | | | | | | |
| | | Six months ended
April 30, 2017 (unaudited) | | | Year ended October 31 | |
| CLASS B | | | 2016 | | | 2015 | | | 2014 | | | 2013 | | | 2012 | |
Net asset value, beginning of period | | | $28.79 | | | | $28.21 | | | | $34.62 | | | | $34.18 | | | | $26.58 | | | | $24.30 | |
Net investment loss | | | (0.02 | )1 | | | (0.09 | )1 | | | (0.14 | )1 | | | (0.25 | )1 | | | (0.09 | )1 | | | (0.03 | )1 |
Net realized and unrealized gains (losses) on investments | | | 3.82 | | | | 2.26 | | | | 0.47 | | | | 0.69 | | | | 7.69 | | | | 2.31 | |
| | | | | | | | | | | | | | | | | | | | | | | | |
Total from investment operations | | | 3.80 | | | | 2.17 | | | | 0.33 | | | | 0.44 | | | | 7.60 | | | | 2.28 | |
Distributions to shareholders from | | | | | | | | | | | | | | | | | | | | | | | | |
Net realized gains | | | (2.35 | ) | | | (1.59 | ) | | | (6.74 | ) | | | 0.00 | | | | 0.00 | | | | 0.00 | |
Net asset value, end of period | | | $30.24 | | | | $28.79 | | | | $28.21 | | | | $34.62 | | | | $34.18 | | | | $26.58 | |
Total return2 | | | 13.72 | % | | | 8.32 | % | | | 1.34 | % | | | 1.29 | % | | | 28.54 | % | | | 9.42 | % |
Ratios to average net assets (annualized) | | | | | | | | | | | | | | | | | | | | | | | | |
Gross expenses | | | 2.29 | % | | | 2.31 | % | | | 2.32 | % | | | 2.32 | % | | | 2.34 | % | | | 2.30 | % |
Net expenses | | | 2.29 | % | | | 2.30 | % | | | 2.30 | % | | | 2.30 | % | | | 2.30 | % | | | 2.29 | % |
Net investment loss | | | (0.11 | )% | | | (0.32 | )% | | | (0.49 | )% | | | (0.71 | )% | | | (0.32 | )% | | | (0.10 | )% |
Supplemental data | | | | | | | | | | | | | | | | | | | | | | | | |
Portfolio turnover rate | | | 63 | % | | | 70 | % | | | 42 | % | | | 66 | % | | | 59 | % | | | 85 | % |
Net assets, end of period (000s omitted) | | | $445 | | | | $888 | | | | $4,206 | | | | $11,799 | | | | $19,446 | | | | $21,181 | |
| 1 | Calculated based upon average shares outstanding |
| 2 | Total return calculations do not include any sales charges. Returns for periods of less than one year are not annualized. |
The accompanying notes are an integral part of these financial statements.
| | | | |
| 16 | | Wells Fargo Global Small Cap Fund | | Financial highlights |
(For a share outstanding throughout each period)
| | | | | | | | | | | | | | | | | | | | | | | | |
| | | Six months ended
April 30, 2017 (unaudited) | | | Year ended October 31 | |
| CLASS C | | | 2016 | | | 2015 | | | 2014 | | | 2013 | | | 2012 | |
Net asset value, beginning of period | | | $28.98 | | | | $28.39 | | | | $34.80 | | | | $34.36 | | | | $26.73 | | | | $24.43 | |
Net investment income (loss) | | | 0.00 | 1,2 | | | (0.01 | )1 | | | (0.14 | )1 | | | (0.24 | )1 | | | (0.09 | )1 | | | (0.03 | )1 |
Net realized and unrealized gains (losses) on investments | | | 3.82 | | | | 2.19 | | | | 0.47 | | | | 0.69 | | | | 7.72 | | | | 2.33 | |
| | | | | | | | | | | | | | | | | | | | | | | | |
Total from investment operations | | | 3.82 | | | | 2.18 | | | | 0.33 | | | | 0.45 | | | | 7.63 | | | | 2.30 | |
Distributions to shareholders from | | | | | | | | | | | | | | | | | | | | | | | | |
Net investment income | | | (0.07 | ) | | | 0.00 | | | | 0.00 | | | | (0.01 | ) | | | 0.00 | | | | 0.00 | |
Net realized gains | | | (2.35 | ) | | | (1.59 | ) | | | (6.74 | ) | | | 0.00 | | | | 0.00 | | | | 0.00 | |
| | | | | | | | | | | | | | | | | | | | | | | | |
Total distributions to shareholders | | | (2.42 | ) | | | (1.59 | ) | | | (6.74 | ) | | | (0.01 | ) | | | 0.00 | | | | 0.00 | |
Net asset value, end of period | | | $30.38 | | | | $28.98 | | | | $28.39 | | | | $34.80 | | | | $34.36 | | | | $26.73 | |
Total return3 | | | 13.71 | % | | | 8.31 | % | | | 1.34 | % | | | 1.32 | % | | | 28.54 | % | | | 9.41 | % |
Ratios to average net assets (annualized) | | | | | | | | | | | | | | | | | | | | | | | | |
Gross expenses | | | 2.29 | % | | | 2.30 | % | | | 2.32 | % | | | 2.32 | % | | | 2.34 | % | | | 2.30 | % |
Net expenses | | | 2.29 | % | | | 2.30 | % | | | 2.30 | % | | | 2.30 | % | | | 2.30 | % | | | 2.29 | % |
Net investment income (loss) | | | 0.01 | % | | | (0.02 | )% | | | (0.48 | )% | | | (0.69 | )% | | | (0.31 | )% | | | (0.11 | )% |
Supplemental data | | | | | | | | | | | | | | | | | | | | | | | | |
Portfolio turnover rate | | | 63 | % | | | 70 | % | | | 42 | % | | | 66 | % | | | 59 | % | | | 85 | % |
Net assets, end of period (000s omitted) | | | $34,280 | | | | $32,863 | | | | $36,215 | | | | $41,792 | | | | $44,618 | | | | $37,753 | |
| 1 | Calculated based upon average shares outstanding |
| 2 | Amount is less than $0.005. |
| 3 | Total return calculations do not include any sales charges. Returns for periods of less than one year are not annualized. |
The accompanying notes are an integral part of these financial statements.
| | | | | | |
| Financial highlights | | Wells Fargo Global Small Cap Fund | | | 17 | |
(For a share outstanding throughout each period)
| | | | | | | | | | | | | | | | | | | | | | | | |
| | | Six months ended
April 30, 2017 (unaudited) | | | Year ended October 31 | |
| ADMINISTRATOR CLASS | | | 2016 | | | 2015 | | | 2014 | | | 2013 | | | 2012 | |
Net asset value, beginning of period | | | $40.15 | | | | $38.65 | | | | $44.60 | | | | $44.00 | | | | $34.21 | | | | $31.10 | |
Net investment income | | | 0.19 | 1 | | | 0.41 | | | | 0.16 | 1 | | | 0.09 | | | | 0.22 | 1 | | | 0.26 | 1 |
Net realized and unrealized gains (losses) on investments | | | 5.34 | | | | 2.95 | | | | 0.66 | | | | 0.90 | | | | 9.86 | | | | 2.96 | |
| | | | | | | | | | | | | | | | | | | | | | | | |
Total from investment operations | | | 5.53 | | | | 3.36 | | | | 0.82 | | | | 0.99 | | | | 10.08 | | | | 3.22 | |
Distributions to shareholders from | | | | | | | | | | | | | | | | | | | | | | | | |
Net investment income | | | (0.38 | ) | | | (0.27 | ) | | | (0.03 | ) | | | (0.39 | ) | | | (0.29 | ) | | | (0.11 | ) |
Net realized gains | | | (2.35 | ) | | | (1.59 | ) | | | (6.74 | ) | | | 0.00 | | | | 0.00 | | | | 0.00 | |
| | | | | | | | | | | | | | | | | | | | | | | | |
Total distributions to shareholders | | | (2.73 | ) | | | (1.86 | ) | | | (6.77 | ) | | | (0.39 | ) | | | (0.29 | ) | | | (0.11 | ) |
Net asset value, end of period | | | $42.95 | | | | $40.15 | | | | $38.65 | | | | $44.60 | | | | $44.00 | | | | $34.21 | |
Total return2 | | | 14.19 | % | | | 9.30 | % | | | 2.27 | % | | | 2.22 | % | | | 29.73 | % | | | 10.44 | % |
Ratios to average net assets (annualized) | | | | | | | | | | | | | | | | | | | | | | | | |
Gross expenses | | | 1.46 | % | | | 1.47 | % | | | 1.43 | % | | | 1.41 | % | | | 1.42 | % | | | 1.38 | % |
Net expenses | | | 1.40 | % | | | 1.40 | % | | | 1.40 | % | | | 1.40 | % | | | 1.40 | % | | | 1.38 | % |
Net investment income | | | 0.93 | % | | | 0.90 | % | | | 0.41 | % | | | 0.22 | % | | | 0.58 | % | | | 0.81 | % |
Supplemental data | | | | | | | | | | | | | | | | | | | | | | | | |
Portfolio turnover rate | | | 63 | % | | | 70 | % | | | 42 | % | | | 66 | % | | | 59 | % | | | 85 | % |
Net assets, end of period (000s omitted) | | | $27,664 | | | | $30,832 | | | | $31,765 | | | | $53,966 | | | | $52,461 | | | | $44,360 | |
| 1 | Calculated based upon average shares outstanding |
| 2 | Returns for periods of less than one year are not annualized. |
The accompanying notes are an integral part of these financial statements.
| | | | |
| 18 | | Wells Fargo Global Small Cap Fund | | Financial highlights |
(For a share outstanding throughout each period)
| | | | | | | | | | | | | | | | | | | | | | | | |
| | | Six months ended
April 30, 2017 (unaudited) | | | Year ended October 31 | |
| INSTITUTIONAL CLASS | | | 2016 | | | 2015 | | | 2014 | | | 2013 | | | 2012 | |
Net asset value, beginning of period | | | $40.08 | | | | $38.63 | | | | $44.67 | | | | $44.05 | | | | $34.25 | | | | $31.18 | |
Net investment income | | | 0.30 | 1 | | | 0.45 | | | | 0.20 | | | | 0.15 | | | | 0.32 | 1 | | | 0.36 | 1 |
Net realized and unrealized gains (losses) on investments | | | 5.26 | | | | 3.00 | | | | 0.72 | | | | 0.96 | | | | 9.86 | | | | 2.93 | |
| | | | | | | | | | | | | | | | | | | | | | | | |
Total from investment operations | | | 5.56 | | | | 3.45 | | | | 0.92 | | | | 1.11 | | | | 10.18 | | | | 3.29 | |
Distributions to shareholders from | | | | | | | | | | | | | | | | | | | | | | | | |
Net investment income | | | (0.49 | ) | | | (0.41 | ) | | | (0.22 | ) | | | (0.49 | ) | | | (0.38 | ) | | | (0.22 | ) |
Net realized gains | | | (2.35 | ) | | | (1.59 | ) | | | (6.74 | ) | | | 0.00 | | | | 0.00 | | | | 0.00 | |
| | | | | | | | | | | | | | | | | | | | | | | | |
Total distributions to shareholders | | | (2.84 | ) | | | (2.00 | ) | | | (6.96 | ) | | | (0.49 | ) | | | (0.38 | ) | | | (0.22 | ) |
Net asset value, end of period | | | $42.80 | | | | $40.08 | | | | $38.63 | | | | $44.67 | | | | $44.05 | | | | $34.25 | |
Total return2 | | | 14.35 | % | | | 9.56 | % | | | 2.53 | % | | | 2.48 | % | | | 30.06 | % | | | 10.70 | % |
Ratios to average net assets (annualized) | | | | | | | | | | | | | | | | | | | | | | | | |
Gross expenses | | | 1.21 | % | | | 1.22 | % | | | 1.18 | % | | | 1.14 | % | | | 1.16 | % | | | 1.12 | % |
Net expenses | | | 1.15 | % | | | 1.15 | % | | | 1.15 | % | | | 1.14 | % | | | 1.15 | % | | | 1.12 | % |
Net investment income | | | 1.49 | % | | | 1.20 | % | | | 0.66 | % | | | 0.47 | % | | | 0.83 | % | | | 1.13 | % |
Supplemental data | | | | | | | | | | | | | | | | | | | | | | | | |
Portfolio turnover rate | | | 63 | % | | | 70 | % | | | 42 | % | | | 66 | % | | | 59 | % | | | 85 | % |
Net assets, end of period (000s omitted) | | | $38,725 | | | | $12,531 | | | | $10,369 | | | | $5,284 | | | | $2,151 | | | | $1,263 | |
| 1 | Calculated based upon average shares outstanding |
| 2 | Returns for periods of less than one year are not annualized. |
The accompanying notes are an integral part of these financial statements.
| | | | | | |
| Notes to financial statements (unaudited) | | Wells Fargo Global Small Cap Fund | | | 19 | |
1. ORGANIZATION
Wells Fargo Funds Trust (the “Trust”), a Delaware statutory trust organized on March 10, 1999, is an open-end management investment company registered under the Investment Company Act of 1940, as amended (the “1940 Act”). As an investment company, the Trust follows the accounting and reporting guidance in Financial Accounting Standards Board (“FASB”) Accounting Standards Codification (“ASC”) Topic 946, Financial Services – Investment Companies. These financial statements report on the Wells Fargo Global Small Cap Fund (formerly, Wells Fargo Global Opportunities Fund) (the “Fund”) which is a diversified series of the Trust.
2. SIGNIFICANT ACCOUNTING POLICIES
The following significant accounting policies, which are consistently followed in the preparation of the financial statements of the Fund, are in conformity with U.S. generally accepted accounting principles which require management to make estimates and assumptions that affect the reported amounts of assets and liabilities, disclosure of contingent assets and liabilities at the date of the financial statements, and the reported amounts of revenues and expenses during the reporting period. Actual results could differ from those estimates.
Securities valuation
All investments are valued each business day as of the close of regular trading on the New York Stock Exchange (generally 4 p.m. Eastern Time), although the Fund may deviate from this calculation time under unusual or unexpected circumstances.
Equity securities that are listed on a foreign or domestic exchange or market are valued at the official closing price or, if none, the last sales price. If no sale occurs on the principal exchange or market that day, the prior day’s price will be deemed “stale” and a fair value price will be determined in accordance with the Fund’s Valuation Procedures.
The values of securities denominated in foreign currencies are translated into U.S. dollars at rates provided by an independent foreign currency pricing source at a time each business day specified by the Management Valuation Team of Wells Fargo Funds Management, LLC (“Funds Management”).
Many securities markets and exchanges outside the U.S. close prior to the close of the New York Stock Exchange and therefore may not fully reflect trading or events that occur after the close of the principal exchange in which the foreign securities are traded, but before the close of the New York Stock Exchange. If such trading or events are expected to materially affect the value of such securities, then fair value pricing procedures approved by the Board of Trustees of the Fund are applied. These procedures take into account multiple factors including movements in U.S. securities markets after foreign exchanges close. Foreign securities that are fair valued under these procedures are categorized as Level 2 and the application of these procedures may result in transfers between Level 1 and Level 2. Depending on market activity, such fair valuations may be frequent. Such fair value pricing may result in net asset values that are higher or lower than net asset values based on the last reported sales price or latest quoted bid price. On April 30, 2017, such fair value pricing was not used in pricing foreign securities.
Investments in registered open-end investment companies are valued at net asset value. Interests in non-registered investment companies that are redeemable at net asset value are fair valued normally at net asset value.
Investments which are not valued using any of the methods discussed above are valued at their fair value, as determined in good faith by the Board of Trustees. The Board of Trustees has established a Valuation Committee comprised of the Trustees and has delegated to it the authority to take any actions regarding the valuation of portfolio securities that the Valuation Committee deems necessary or appropriate, including determining the fair value of portfolio securities, unless the determination has been delegated to the Management Valuation Team. The Board of Trustees retains the authority to make or ratify any valuation decisions or approve any changes to the Valuation Procedures as it deems appropriate. On a quarterly basis, the Board of Trustees receives reports on any valuation actions taken by the Valuation Committee or the Management Valuation Team which may include items for ratification.
Valuations of fair valued securities are compared to the next actual sales price when available, or other appropriate market values, to assess the continued appropriateness of the fair valuation methodologies used. These securities are fair valued on a day-to-day basis, taking into consideration changes to appropriate market information and any significant changes to the inputs considered in the valuation process until there is a readily available price provided on an exchange or by an independent pricing service. Valuations received from an independent pricing service or independent broker-dealer quotes are periodically validated by comparisons to most recent trades and valuations provided by other independent pricing services in addition to the review of prices by the manager and/or subadviser. Unobservable inputs used in determining fair valuations are identified based on the type of security, taking into consideration factors utilized by market participants in valuing the investment, knowledge about the issuer and the current market environment.
| | | | |
| 20 | | Wells Fargo Global Small Cap Fund | | Notes to financial statements (unaudited) |
Foreign currency translation
The accounting records of the Fund are maintained in U.S. dollars. The values of other assets and liabilities denominated in foreign currencies are translated into U.S. dollars at rates provided by an independent foreign currency pricing source at a time each business day specified by the Management Valuation Team. Purchases and sales of securities, and income and expenses are converted at the rate of exchange on the respective dates of such transactions. Net realized foreign exchange gains or losses arise from sales of foreign currencies, currency gains or losses realized between the trade and settlement dates on securities transactions, and the difference between the amounts of dividends, interest and foreign withholding taxes recorded and the U.S. dollar equivalent of the amounts actually paid or received. Net unrealized foreign exchange gains and losses arise from changes in the fair value of assets and liabilities other than investments in securities resulting from changes in exchange rates. The changes in net assets arising from changes in exchange rates of securities and the changes in net assets resulting from changes in market prices of securities are not separately presented. Such changes are included in net realized and unrealized gains or losses from investments.
Security loans
The Fund may lend its securities from time to time in order to earn additional income in the form of fees or interest on securities received as collateral or the investment of any cash received as collateral. The Fund continues to receive interest or dividends on the securities loaned. The Fund receives collateral in the form of cash or securities with a value at least equal to the value of the securities on loan. The value of the loaned securities is determined at the close of each business day and any additional required collateral is delivered to the Fund on the next business day. In a securities lending transaction, the net asset value of the Fund will be affected by an increase or decrease in the value of the securities loaned and by an increase or decrease in the value of the instrument in which collateral is invested. The amount of securities lending activity undertaken by the Fund fluctuates from time to time. In the event of default or bankruptcy by the borrower, the Fund may be prevented from recovering the loaned securities or gaining access to the collateral or may experience delays or costs in doing so. In addition, the investment of any cash collateral received may lose all or part of its value. The Fund has the right under the lending agreement to recover the securities from the borrower on demand.
The Fund lends its securities through an unaffiliated securities lending agent. Cash collateral received in connection with its securities lending transactions is invested in Securities Lending Cash Investments, LLC (the “Securities Lending Fund”). The Securities Lending Fund is exempt from registration under Section 3(c)(7) of the 1940 Act and is managed by Funds Management and is subadvised by Wells Capital Management Incorporated (“WellsCap”), an affiliate of Funds Management and an indirect wholly owned subsidiary of Wells Fargo & Company (“Wells Fargo”). Funds Management receives an advisory fee starting at 0.05% and declining to 0.01% as the average daily net assets of the Securities Lending Fund increase. All of the fees received by Funds Management are paid to WellsCap for its services as subadviser. The Securities Lending Fund seeks to provide a positive return compared to the daily Fed Funds Open Rate by investing in high-quality, U.S. dollar-denominated short-term money market instruments. Securities Lending Fund investments are valued at the evaluated bid price provided by an independent pricing service. Income earned from investment in the Securities Lending Fund is included in securities lending income on the Statement of Operations.
Security transactions and income recognition
Securities transactions are recorded on a trade date basis. Realized gains or losses are recorded on the basis of identified cost.
Dividend income is recognized on the ex-dividend date, except for certain dividends from foreign securities, which are recorded as soon as the custodian verifies the ex-dividend date. Dividend income from foreign securities is recorded net of foreign taxes withheld where recovery of such taxes is not assured.
Distributions to shareholders
Distributions to shareholders from net investment income and net realized gains, if any, are recorded on the ex-dividend date. Such distributions are determined in accordance with income tax regulations and may differ from U.S. generally accepted accounting principles. Dividend sources are estimated at the time of declaration. The tax character of distributions is determined as of the Fund’s fiscal year end. Therefore, a portion of the Fund’s distributions made prior the Fund’s fiscal year end may be categorized as a tax return of capital.
Federal and other taxes
The Fund intends to continue to qualify as a regulated investment company by distributing substantially all of its investment company taxable income and any net realized capital gains (after reduction for capital loss carryforwards) sufficient to relieve it from all, or substantially all, federal income taxes. Accordingly, no provision for federal income taxes was required.
The Fund’s income and federal excise tax returns and all financial records supporting those returns for the prior three fiscal years are subject to examination by the federal and Delaware revenue authorities. Management has analyzed the Fund’s tax positions taken on federal, state, and foreign tax returns for all open tax years and does not believe that there are any uncertain tax positions that require recognition of a tax liability.
| | | | | | |
| Notes to financial statements (unaudited) | | Wells Fargo Global Small Cap Fund | | | 21 | |
Class allocations
The separate classes of shares offered by the Fund differ principally in applicable sales charges, distribution, shareholder servicing, and administration fees. Class specific expenses are charged directly to that share class. Investment income, common expenses, and realized and unrealized gains (losses) on investments are allocated daily to each class of shares based on the relative proportion of net assets of each class.
3. FAIR VALUATION MEASUREMENTS
Fair value measurements of investments are determined within a framework that has established a fair value hierarchy based upon the various data inputs utilized in determining the value of the Fund’s investments. The three-level hierarchy gives the highest priority to unadjusted quoted prices in active markets for identical assets or liabilities (Level 1) and the lowest priority to unobservable inputs (Level 3). The Fund’s investments are classified within the fair value hierarchy based on the lowest level of input that is significant to the fair value measurement. The inputs are summarized into three broad levels as follows:
| ∎ | | Level 1 – quoted prices in active markets for identical securities |
| ∎ | | Level 2 – other significant observable inputs (including quoted prices for similar securities, interest rates, prepayment speeds, credit risk, etc.) |
| ∎ | | Level 3 – significant unobservable inputs (including the Fund’s own assumptions in determining the fair value of investments) |
The inputs or methodologies used for valuing investments in securities are not necessarily an indication of the risk associated with investing in those securities.
The following is a summary of the inputs used in valuing the Fund’s assets and liabilities as of April 30, 2017:
| | | | | | | | | | | | | | | | |
| | | Quoted prices
(Level 1) | | | Other significant
observable inputs
(Level 2) | | | Significant
unobservable inputs (Level 3) | | | Total | |
Assets | | | | | | | | | | | | | | | | |
Investments in: | | | | | | | | | | | | | | | | |
| | | | |
Common stocks | | | | | | | | | | | | | | | | |
Australia | | $ | 3,003,168 | | | $ | 0 | | | $ | 0 | | | $ | 3,003,168 | |
Austria | | | 1,765,126 | | | | 0 | | | | 0 | | | | 1,765,126 | |
Canada | | | 17,561,600 | | | | 0 | | | | 0 | | | | 17,561,600 | |
Finland | | | 1,219,084 | | | | 0 | | | | 0 | | | | 1,219,084 | |
France | | | 4,575,537 | | | | 0 | | | | 0 | | | | 4,575,537 | |
Germany | | | 12,715,031 | | | | 0 | | | | 0 | | | | 12,715,031 | |
Hong Kong | | | 2,336,651 | | | | 0 | | | | 0 | | | | 2,336,651 | |
Ireland | | | 2,665,616 | | | | 0 | | | | 0 | | | | 2,665,616 | |
Israel | | | 3,517,813 | | | | 0 | | | | 0 | | | | 3,517,813 | |
Italy | | | 2,921,661 | | | | 0 | | | | 0 | | | | 2,921,661 | |
Japan | | | 22,421,294 | | | | 0 | | | | 0 | | | | 22,421,294 | |
Netherlands | | | 2,109,281 | | | | 0 | | | | 0 | | | | 2,109,281 | |
Spain | | | 7,808,404 | | | | 0 | | | | 0 | | | | 7,808,404 | |
Sweden | | | 982,217 | | | | 0 | | | | 0 | | | | 982,217 | |
Switzerland | | | 4,498,068 | | | | 0 | | | | 0 | | | | 4,498,068 | |
United Kingdom | | | 26,500,597 | | | | 0 | | | | 0 | | | | 26,500,597 | |
United States | | | 104,488,782 | | | | 0 | | | | 0 | | | | 104,488,782 | |
| | | | |
Short-term investments | | | | | | | | | | | | | | | | |
Investment companies | | | 21,455,075 | | | | | | | | | | | | 21,455,075 | |
Investments measured at net asset value* | | | | | | | | | | | | | | | 14,493,379 | |
Total assets | | $ | 242,545,005 | | | $ | 0 | | | $ | 0 | | | $ | 257,038,384 | |
| * | Investments that are measured at fair value using the net asset value per share (or its equivalent) as a practical expedient have not been categorized in the fair value hierarchy. The fair value amount presented in the table is intended to permit reconciliation of the fair value hierarchy to the amounts presented in the Statement of Assets and Liabilities. The Fund’s investment in Securities Lending Cash Investments, LLC valued at $14,493,379 does not have a redemption period notice, can be redeemed daily and does not have any unfunded commitments. |
| | | | |
| 22 | | Wells Fargo Global Small Cap Fund | | Notes to financial statements (unaudited) |
The Fund recognizes transfers between levels within the fair value hierarchy at the end of the reporting period. At April 30, 2017, the Fund did not have any transfers into/out of Level 1, Level 2, or Level 3.
4. TRANSACTIONS WITH AFFILIATES AND OTHER EXPENSES
Management fee
Funds Management, an indirect wholly owned subsidiary of Wells Fargo, is the manager of the Fund and provides advisory and fund-level administrative services under an investment management agreement. Under the investment management agreement, Funds Management is responsible for, among other services, implementing the investment objectives and strategies of the Fund, supervising the subadviser, providing fund-level administrative services in connection with the Fund’s operations, and providing any other fund-level administrative services reasonably necessary for the operation of the Fund. As compensation for its services under the investment management agreement, Funds Management is entitled to receive an annual management fee starting at 0.95% and declining to 0.83% as the average daily net assets of the Fund increase. For the six months ended April 30, 2017, the management fee was equivalent to an annual rate of 0.95% of the Fund’s average daily net assets.
Funds Management has retained the services of a subadviser to provide daily portfolio management to the Fund. The fee for subadvisory services is borne by Funds Management. WellsCap is the subadviser to the Fund and is entitled to receive a fee from Funds Management at an annual rate starting at 0.55% and declining to 0.40% as the average daily net assets of the Fund increase.
Administration fees
Under a class-level administration agreement, Funds Management provides class-level administrative services to the Fund, which includes paying fees and expenses for services provided by the transfer agent, sub-transfer agents, omnibus account servicers and record-keepers. As compensation for its services under the class-level administration agreement, Funds Management receives an annual fee which is calculated based on the average daily net assets of each class as follows:
| | | | |
| | | Class-level
administration fee | |
Class A, Class B, Class C | | | 0.21 | % |
Administrator Class, Institutional Class | | | 0.13 | |
Funds Management has contractually waived and/or reimbursed management and administration fees to the extent necessary to maintain certain net operating expense ratios for the Fund. Waiver of fees and/or reimbursement of expenses by Funds Management were made first from fund level expenses on a proportionate basis and then from class specific expenses. Funds Management has committed through February 28, 2018 to waive fees and/or reimburse expenses to the extent necessary to cap the Fund’s expenses at 1.55% for Class A shares, 2.30% for Class B shares, 2.30% for Class C shares, 1.40% for Administrator Class shares, and 1.15% for Institutional Class shares. After this time, the cap may be increased or the commitment to maintain the cap may be terminated only with the approval of the Board of Trustees.
During the six months ended April 30, 2017, State Street Bank and Trust Company, the Fund’s custodian, reimbursed the Fund $24,532 for certain out-of-pocket expenses that were billed to the Fund in error from 1998-2015. This amount is included in dividend income on the Statement of Operations. In addition, Funds Management was also reimbursed $14,545 for waivers/reimbursements it made to the Fund during the period the Fund was erroneously billed.
Distribution fees
The Trust has adopted a distribution plan for Class B and Class C shares of the Fund pursuant to Rule 12b-1 under the 1940 Act. Distribution fees are charged to Class B and Class C shares and paid to Wells Fargo Funds Distributor, LLC (“Funds Distributor”), the principal underwriter, at an annual rate of 0.75% of the average daily net assets of Class B and Class C shares.
In addition, Funds Distributor is entitled to receive the front-end sales charge from the purchase of Class A shares and a contingent deferred sales charge on the redemption of certain Class A shares. Funds Distributor is also entitled to receive the contingent deferred sales charges from redemptions of Class B and Class C shares. For the six months ended April 30, 2017, Funds Distributor received $5,156 from the sale of Class A shares and $148 in contingent deferred sales charges from redemptions of Class C shares.
| | | | | | |
| Notes to financial statements (unaudited) | | Wells Fargo Global Small Cap Fund | | | 23 | |
Shareholder servicing fees
The Trust has entered into contracts with one or more shareholder servicing agents, whereby Class A, Class B, Class C, and Administrator Class of the Fund are charged a fee at an annual rate of 0.25% of the average daily net assets of each respective class.
A portion of these total shareholder servicing fees were paid to affiliates of Wells Fargo.
5. INVESTMENT PORTFOLIO TRANSACTIONS
Purchases and sales of investments, excluding U.S. government obligations (if any) and short-term securities, for the six months ended April 30, 2017 were $143,077,409 and $146,846,977, respectively.
The Fund may purchase or sell investment securities to other Wells Fargo affiliates pursuant to Rule 17a-7 of the 1940 Act and under procedures adopted by the Board of Trustees. The procedures have been designed to ensure that these interfund transactions, which do not incur broker commissions, are effected at current market prices. Interfund trades are included within the respective purchases and sales amounts shown.
6. BANK BORROWINGS
The Trust (excluding the money market funds and certain other funds) and Wells Fargo Variable Trust are parties to a $250,000,000 revolving credit agreement whereby the Fund is permitted to use bank borrowings for temporary or emergency purposes, such as to fund shareholder redemption requests. Interest under the credit agreement is charged to the Fund based on a borrowing rate equal to the higher of the Federal Funds rate in effect on that day plus 1.25% or the overnight LIBOR rate in effect on that day plus 1.25%. In addition, an annual commitment fee equal to 0.25% of the unused balance is allocated to each participating fund.
For the six months ended April 30, 2017, there were no borrowings by the Fund under the agreement.
7. INDEMNIFICATION
Under the Trust’s organizational documents, the officers and Trustees have been granted certain indemnification rights against certain liabilities that may arise out of performance of their duties to the Trust. Additionally, in the normal course of business, the Trust may enter into contracts with service providers that contain a variety of indemnification clauses. The Trust’s maximum exposure under these arrangements is dependent on future claims that may be made against the Fund and, therefore, cannot be estimated.
8. NEW ACCOUNTING PRONOUNCEMENT
In December 2016, FASB issued Accounting Standards Update (“ASU”) No. 2016-19, Technical Corrections and Improvements. ASU 2016-19 includes an amendment to FASB ASC Topic 820, Fair Value Measurement which clarifies the difference between a valuation approach and a valuation technique. The amendment also requires an entity to disclose when there has been a change in either or both a valuation approach and/or a valuation technique. The disclosure requirements are effective for fiscal years and interim periods within those fiscal years beginning after December 15, 2016. Management is currently evaluating the potential impact of this new guidance to the financial statements.
9. REGULATORY CHANGES
In October 2016, the Securities and Exchange Commission (“SEC”) adopted new rules and forms and amended existing rules and forms (together, “final rules”) intended to modernize and enhance the reporting and disclosure of information by registered investment companies and to enhance liquidity risk management by open-end mutual funds and exchange-traded funds. The final rules will enhance the quality of information available to investors and will allow the SEC to more effectively collect and use data reported by funds. In part, the final rules amend Regulation S-X and require standardized, enhanced disclosure about derivatives in the Fund’s financial statements, as well as other amendments. The compliance date for the amendments to Regulation S-X is August 1, 2017 while the compliance date for the new form types is June 1, 2018 and the compliance date for the liquidity risk management program requirements is December 1, 2018. Management is currently assessing the potential impact of these enhancements and their impact on the financial statement disclosures and reporting requirements.
| | | | |
| 24 | | Wells Fargo Global Small Cap Fund | | Other information (unaudited) |
PROXY VOTING INFORMATION
A description of the policies and procedures that the Fund uses to determine how to vote proxies relating to portfolio securities is available, upon request, by calling 1-800-222-8222, visiting our website at wellsfargofunds.com, or visiting the SEC website at sec.gov. Information regarding how the Fund voted proxies relating to portfolio securities during the most recent 12-month period ended June 30 is available on the Fund’s website at wellsfargofunds.com or by visiting the SEC website at sec.gov.
PORTFOLIO HOLDINGS INFORMATION
The complete portfolio holdings for the Fund are publicly available monthly on the Fund’s website (wellsfargofunds.com), on a one-month delayed basis. In addition, top ten holdings information (excluding derivative positions) for the Fund is publicly available on the Fund’s website on a monthly, seven-day or more delayed basis. The Fund files its complete schedule of portfolio holdings with the SEC for the first and third quarters of each fiscal year on Form N-Q, which is available by visiting the SEC website at sec.gov. In addition, the Fund’s Form N-Q may be reviewed and copied at the SEC’s Public Reference Room in Washington, DC, and at regional offices in New York City, at 233 Broadway, and in Chicago, at 175 West Jackson Boulevard, Suite 900. Information about the Public Reference Room may be obtained by calling 1-800-SEC-0330.
| | | | | | |
| Other information (unaudited) | | Wells Fargo Global Small Cap Fund | | | 25 | |
BOARD OF TRUSTEES AND OFFICERS
Each of the Trustees and Officers1 listed in the table below acts in identical capacities for each fund in the Wells Fargo family of funds, which consists of 138 mutual funds comprising the Wells Fargo Funds Trust, Wells Fargo Variable Trust, Wells Fargo Master Trust and four closed-end funds (collectively the “Fund Complex”). This table should be read in conjunction with the Prospectus and the Statement of Additional Information2. The mailing address of each Trustee and Officer is 525 Market Street, 12th Floor, San Francisco, CA 94105. Each Trustee and Officer serves an indefinite term, however, each Trustee serves such term until reaching the mandatory retirement age established by the Trustees.
Independent Trustees
| | | | | | |
Name and
year of birth | | Position held and
length of service* | | Principal occupations during past five years or longer | | Current other
public company or
investment company
directorships |
William R. Ebsworth
(Born 1957) | | Trustee, since 2015 | | Retired. From 1984 to 2013, equities analyst, portfolio manager, research director and chief investment officer at Fidelity Management and Research Company in Boston, Tokyo, and Hong Kong and retired in 2013 as Chief Investment Officer of Fidelity Strategic Advisers, Inc. where he led a team of investment professionals managing client assets. Prior thereto, Board member of Hong Kong Securities Clearing Co., Hong Kong Options Clearing Corp., the Thailand International Fund, Ltd., Fidelity Investments Life Insurance Company, and Empire Fidelity Investments Life Insurance Company. Board member of the Forté Foundation (non-profit organization) and the Vincent Memorial Hospital Endowment (non-profit organization), where he serves on the Investment Committee and as a Chair of the Audit Committee. Mr. Ebsworth is a CFA® charterholder. | | Asset Allocation Trust |
Jane A. Freeman
(Born 1953) | | Trustee, since 2015 | | Retired. From 2012 to 2014 and 1999 to 2008, Chief Financial Officer of Scientific Learning Corporation. From 2008 to 2012, Ms. Freeman provided consulting services related to strategic business projects. Prior to 1999, Portfolio Manager at Rockefeller & Co. and Scudder, Stevens & Clark. Board member of the Harding Loevner Funds from 1996 to 2014, serving as both Lead Independent Director and chair of the Audit Committee. Board member of the Russell Exchange Traded Funds Trust from 2011 to 2012 and the chair of the Audit Committee. Ms. Freeman is a Board Member of Ruth Bancroft Garden (non-profit organization) and an inactive chartered financial analyst. | | Asset Allocation Trust |
Peter G. Gordon**
(Born 1942) | | Trustee, since 1998; Chairman, since 2005 | | Co-Founder, Retired Chairman, President and CEO of Crystal Geyser Water Company. Trustee Emeritus, Colby College. | | Asset Allocation Trust |
Isaiah Harris, Jr.
(Born 1952) | | Trustee, since 2009 | | Retired. Chairman of the Board of CIGNA Corporation since 2009, and Director since 2005. From 2003 to 2011, Director of Deluxe Corporation. Prior thereto, President and CEO of BellSouth Advertising and Publishing Corp. from 2005 to 2007, President and CEO of BellSouth Enterprises from 2004 to 2005 and President of BellSouth Consumer Services from 2000 to 2003. Emeritus member of the Iowa State University Foundation Board of Governors. Emeritus Member of the Advisory Board of Iowa State University School of Business. Advisory Board Member, Palm Harbor Academy (charter school). Advisory Board Member, Child Evangelism Fellowship (non-profit). Mr. Harris is a certified public accountant (inactive status). | | CIGNA Corporation; Asset Allocation Trust |
Judith M. Johnson
(Born 1949) | | Trustee, since 2008;
Audit Committee Chairman, since 2008 | | Retired. Prior thereto, Chief Executive Officer and Chief Investment Officer of Minneapolis Employees Retirement Fund from 1996 to 2008. Ms. Johnson is an attorney, certified public accountant and a certified managerial accountant. | | Asset Allocation Trust |
David F. Larcker
(Born 1950) | | Trustee, since 2009 | | James Irvin Miller Professor of Accounting at the Graduate School of Business, Stanford University, Director of the Corporate Governance Research Initiative and Senior Faculty of The Rock Center for Corporate Governance since 2006. From 2005 to 2008, Professor of Accounting at the Graduate School of Business, Stanford University. Prior thereto, Ernst & Young Professor of Accounting at The Wharton School, University of Pennsylvania from 1985 to 2005. | | Asset Allocation Trust |
| | | | |
| 26 | | Wells Fargo Global Small Cap Fund | | Other information (unaudited) |
| | | | | | |
Name and
year of birth | | Position held and
length of service* | | Principal occupations during past five years or longer | | Current other
public company or
investment company
directorships |
Olivia S. Mitchell
(Born 1953) | | Trustee, since 2006 | | International Foundation of Employee Benefit Plans Professor, Wharton School of the University of Pennsylvania since 1993. Director of Wharton’s Pension Research Council and Boettner Center on Pensions & Retirement Research, and Research Associate at the National Bureau of Economic Research. Previously, Cornell University Professor from 1978 to 1993. | | Asset Allocation Trust |
Timothy J. Penny
(Born 1951) | | Trustee, since 1996;
Vice Chairman, since 2017 | | President and Chief Executive Officer of Southern Minnesota Initiative Foundation, a non-profit organization, since 2007 and Senior Fellow at the Humphrey Institute Policy Forum at the University of Minnesota since 1995. Member of the Board of Trustees of NorthStar Education Finance, Inc., a non-profit organization, since 2007. | | Asset Allocation Trust |
Michael S. Scofield
(Born 1943) | | Trustee, since 2010 | | Served on the Investment Company Institute’s Board of Governors and Executive Committee from 2008-2011 as well the Governing Council of the Independent Directors Council from 2006-2011 and the Independent Directors Council Executive Committee from 2008-2011. Chairman of the IDC from 2008-2010. Institutional Investor (Fund Directions) Trustee of Year in 2007. Trustee of the Evergreen Funds complex (and its predecessors) from 1984 to 2010. Chairman of the Evergreen Funds from 2000-2010. Former Trustee of the Mentor Funds. Retired Attorney, Law Offices of Michael S. Scofield. | | Asset Allocation Trust |
| * | Length of service dates reflect the Trustee’s commencement of service with the Trust’s predecessor entities, where applicable. |
| ** | Peter Gordon is expected to retire on December 31, 2017. |
Officers
| | | | | | |
Name and
year of birth | | Position held and
length of service | | Principal occupations during past five years or longer | | |
Andrew Owen (Born 1960) | | President, since 2017 | | Executive Vice President of Wells Fargo & Company and Head of Affiliated Managers, Wells Fargo Asset Management, since 2014. In addition, Mr. Owen is currently President, Chief Executive Officer and Director of Wells Fargo Funds Management, LLC since 2017. Prior thereto, Executive Vice President responsible for marketing, investments and product development for Wells Fargo Funds Management, LLC, from 2009 to 2014. | | |
| Jeremy DePalma1 (Born 1974) | | Treasurer, since 2012 | | Senior Vice President of Wells Fargo Funds Management, LLC since 2009. Senior Vice President of Evergreen Investment Management Company, LLC from 2008 to 2010 and head of the Fund Reporting and Control Team within Fund Administration from 2005 to 2010. | | |
| C. David Messman (Born 1960) | | Secretary, since 2000; Chief Legal Officer, since 2003 | | Senior Vice President and Secretary of Wells Fargo Funds Management, LLC since 2001. Assistant General Counsel of Wells Fargo Bank, N.A. since 2013 and Vice President and Managing Counsel of Wells Fargo Bank, N.A. from 1996 to 2013. | | |
| Michael Whitaker (Born 1967) | | Chief Compliance Officer, since 2016 | | Senior Vice President and Chief Compliance Officer since 2016. Senior Vice President and Chief Compliance Officer for Fidelity Investments from 2007 to 2016. | | |
David Berardi (Born 1975) | | Assistant Treasurer, since 2009 | | Vice President of Wells Fargo Funds Management, LLC since 2009. Vice President of Evergreen Investment Management Company, LLC from 2008 to 2010. Manager of Fund Reporting and Control for Evergreen Investment Management Company, LLC from 2004 to 2010. | | |
| 1 | Jeremy DePalma acts as Treasurer of 69 funds and Assistant Treasurer of 69 funds in the Fund Complex. |
| 2 | The Statement of Additional Information includes additional information about the Trustees and is available, without charge, upon request, by calling 1-800-222-8222 or by visiting the website at wellsfargofunds.com. |
| | | | | | |
| List of abbreviations | | Wells Fargo Global Small Cap Fund | | | 27 | |
The following is a list of common abbreviations for terms and entities that may have appeared in this report.
| ACA | — ACA Financial Guaranty Corporation |
| ADR | — American depositary receipt |
| ADS | — American depositary shares |
| AGC | — Assured Guaranty Corporation |
| AGM | — Assured Guaranty Municipal |
| Ambac | — Ambac Financial Group Incorporated |
| AMT | — Alternative minimum tax |
| BAN | — Bond anticipation notes |
| BHAC | — Berkshire Hathaway Assurance Corporation |
| CAB | — Capital appreciation bond |
| CCAB | — Convertible capital appreciation bond |
| CDA | — Community Development Authority |
| CDO | — Collateralized debt obligation |
| DRIVER | — Derivative inverse tax-exempt receipts |
| DW&P | — Department of Water & Power |
| DWR | — Department of Water Resources |
| ECFA | — Educational & Cultural Facilities Authority |
| EDA | — Economic Development Authority |
| EDFA | — Economic Development Finance Authority |
| ETF | — Exchange-traded fund |
| FDIC | — Federal Deposit Insurance Corporation |
| FFCB | — Federal Farm Credit Banks |
| FGIC | — Financial Guaranty Insurance Corporation |
| FHA | — Federal Housing Administration |
| FHLB | — Federal Home Loan Bank |
| FHLMC | — Federal Home Loan Mortgage Corporation |
| FICO | — The Financing Corporation |
| FNMA | — Federal National Mortgage Association |
| GDR | — Global depositary receipt |
| GNMA | — Government National Mortgage Association |
| HCFR | — Healthcare facilities revenue |
| HEFA | — Health & Educational Facilities Authority |
| HEFAR | — Higher education facilities authority revenue |
| HFA | — Housing Finance Authority |
| HFFA | — Health Facilities Financing Authority |
| HUD | — Department of Housing and Urban Development |
| IDA | — Industrial Development Authority |
| IDAG | — Industrial Development Agency |
| KRW | — Republic of Korea won |
| LIBOR | — London Interbank Offered Rate |
| LIFER | — Long Inverse Floating Exempt Receipts |
| LLC | — Limited liability company |
| LLLP | — Limited liability limited partnership |
| LLP | — Limited liability partnership |
| MBIA | — Municipal Bond Insurance Association |
| MFHR | — Multifamily housing revenue |
| MSTR | — Municipal securities trust receipts |
| MUD | — Municipal Utility District |
| National | — National Public Finance Guarantee Corporation |
| PCFA | — Pollution Control Financing Authority |
| PCL | — Public Company Limited |
| PCR | — Pollution control revenue |
| PFA | — Public Finance Authority |
| PFFA | — Public Facilities Financing Authority |
| PFOTER | — Puttable floating option tax-exempt receipts |
| plc | — Public limited company |
| PUTTER | — Puttable tax-exempt receipts |
| R&D | — Research & development |
| Radian | — Radian Asset Assurance |
| RAN | — Revenue anticipation notes |
| RDA | — Redevelopment Authority |
| RDFA | — Redevelopment Finance Authority |
| REIT | — Real estate investment trust |
| ROC | — Reset option certificates |
| SAVRS | — Select auction variable rate securities |
| SBA | — Small Business Authority |
| SDR | — Swedish depositary receipt |
| SFHR | — Single-family housing revenue |
| SFMR | — Single-family mortgage revenue |
| SPA | — Standby purchase agreement |
| SPDR | — Standard & Poor’s Depositary Receipts |
| SPEAR | — Short Puttable Exempt Adjustable Receipts |
| STRIPS | — Separate trading of registered interest and |
| TAN | — Tax anticipation notes |
| TIPS | — Treasury inflation-protected securities |
| TRAN | — Tax revenue anticipation notes |
| TTFA | — Transportation Trust Fund Authority |
| TVA | — Tennessee Valley Authority |
This page is intentionally left blank.

For more information
More information about Wells Fargo Funds is available free upon request. To obtain literature, please write, email, visit the Fund’s website, or call:
Wells Fargo Funds
P.O. Box 8266
Boston, MA 02266-8266
Email: fundservice@wellsfargo.com
Website: wellsfargofunds.com
Individual investors: 1-800-222-8222
Retail investment professionals: 1-888-877-9275
Institutional investment professionals: 1-866-765-0778
This report and the financial statements contained herein are submitted for the general information of the shareholders of the Fund. If this report is used for promotional purposes, distribution of the report must be accompanied or preceded by a current prospectus. Before investing, please consider the investment objectives, risks, charges, and expenses of the investment. For a current prospectus and, if available, a summary prospectus, containing this information, call 1-800-222-8222 or visit the Fund’s website at wellsfargofunds.com. Read the prospectus carefully before you invest or send money.
Wells Fargo Asset Management (WFAM) is a trade name used by the asset management businesses of Wells Fargo & Company. Wells Fargo Funds Management, LLC, a wholly owned subsidiary of Wells Fargo & Company, provides investment advisory and administrative services for Wells Fargo Funds. Other affiliates of Wells Fargo & Company provide subadvisory and other services for the funds. The funds are distributed by Wells Fargo Funds Distributor, LLC, Member FINRA, an affiliate of Wells Fargo & Company. Neither Wells Fargo Funds Management nor Wells Fargo Funds Distributor has Fund customer accounts/assets, and neither provides investment advice/recommendations or acts as an investment advice fiduciary to any investor.
NOT FDIC INSURED ◾ NO BANK GUARANTEE ◾ MAY LOSE VALUE
© 2017 Wells Fargo Funds Management, LLC. All rights reserved.
| | |
 | | 303216 06-17 SA239/SAR239 04-17 |
Semi-Annual Report
April 30, 2017

Wells Fargo International Equity Fund


Reduce clutter. Save trees.
Sign up for electronic delivery of prospectuses and shareholder reports at wellsfargo.com/advantagedelivery
Contents
The views expressed and any forward-looking statements are as of April 30, 2017, unless otherwise noted, and are those of the Fund managers and/or Wells Fargo Funds Management, LLC. Discussions of individual securities, or the markets generally, or any Wells Fargo Fund are not intended as individual recommendations. Future events or results may vary significantly from those expressed in any forward-looking statements. The views expressed are subject to change at any time in response to changing circumstances in the market. Wells Fargo Funds Management, LLC and the Fund disclaim any obligation to publicly update or revise any views expressed or forward-looking statements.
NOT FDIC INSURED ◾ NO BANK GUARANTEE ◾ MAY LOSE VALUE
| | | | |
| 2 | | Wells Fargo International Equity Fund | | Letter to shareholders (unaudited) |

Andrew Owen
President
Wells Fargo Funds
Despite heightened market volatility at times, in general, global stocks delivered double-digit returns while bond markets were hurt by a rise in interest rates during the latter part of 2016.
Dear Shareholder:
As the new president of Wells Fargo Funds, now that Karla Rabusch is retiring from that position after nearly 14 years, I am pleased to offer you this semi-annual report for the Wells Fargo International Equity Fund for the six-month period that ended April 30, 2017. Despite heightened market volatility at times, in general, global stocks delivered double-digit returns while bond markets were hurt by a rise in interest rates during the latter part of 2016. U.S. and international stocks returned 13.31% and 10.37% for the six-month period, respectively, as measured by the S&P 500 Index1 and the MSCI ACWI ex USA Index (Net)2; within fixed income, the Bloomberg Barclays U.S. Aggregate Bond Index3 returned -0.67%.
During the last two months of 2016, prospects for faster growth and higher interest rates in the U.S. influenced markets.
Following Donald Trump’s election as president in early November, U.S. stocks began to rally. Investors appeared optimistic that the new administration would usher in a series of progrowth policies, and supportive economic news helped the rally carry through the end of 2016. The buoyant environment sent interest rates higher as well. At its mid-December meeting, Fed officials raised their short-term target interest rate for the first time in a year by a quarter percentage point to between 0.50% and 0.75%. Outside of the U.S., the prospects for faster U.S. growth appeared to trigger some acceleration in Europe. The improvement may be partly attributable to expectations for further strengthening of the U.S. dollar, which in turn could improve demand for European goods in the U.S. due to weakening of the euro relative to the dollar. Rising inflation across the eurozone and Japan caused an upward shift in yield curves in those areas, although developed-country bond yields remained significantly lower than U.S. Treasury yields.
Globally, stocks delivered positive results and economies showed improvement in the first four months of 2017.
Stocks rallied globally, supported by signs of improvement in the U.S. and global economies. In the U.S., hiring remained strong and business and consumer sentiment improved. Meanwhile, inflation inched up. In March, Fed officials raised their short-term target interest rate by a quarter percentage point to between 0.75% and 1.00%. With the Fed’s target-rate increase, short-term bond yields rose. Longer-term Treasury yields were little changed, however, leading to positive performance. Investment-grade corporate bonds and high-yield bonds benefited from strong demand. Municipal bond returns were also positive during the first four months of 2017, helped by strong demand and constrained new-issue supply. Outside the U.S., stocks in emerging markets benefited from both global economic growth and recent weakening in the U.S. dollar. European stocks also advanced as political risk declined. In the first round of the French presidential elections, Emmanuel Macron, a pro-EU candidate, garnered the most votes. Non-U.S. bonds also benefited from a decline in perceived risk, with credit spreads continuing to narrow.
| 1 | The S&P 500 Index consists of 500 stocks chosen for market size, liquidity, and industry group representation. It is a market-value-weighted index with each stock’s weight in the index proportionate to its market value. You cannot invest directly in an index. |
| 2 | The Morgan Stanley Capital International (MSCI) All Country World Index (ACWI) ex USA Index (Net) is a free-float-adjusted market-capitalization-weighted index that is designed to measure the equity market performance of developed markets, excluding the United States and Canada. Source: MSCI. MSCI makes no express or implied warranties or representations and shall have no liability whatsoever with respect to any MSCI data contained herein. The MSCI data may not be further redistributed or used as a basis for other indexes or any securities or financial products. This report is not approved, reviewed, or produced by MSCI. You cannot invest directly in an index. |
| 3 | The Bloomberg Barclays U.S. Aggregate Bond Index (formerly known as Barclays U.S. Aggregate Bond Index) is a broad-based benchmark that measures the investment-grade, U.S. dollar–denominated, fixed-rate taxable bond market, including Treasuries, government-related and corporate securities, mortgage-backed securities (agency fixed-rate and hybrid adjustable-rate mortgage pass-throughs), asset-backed securities, and commercial mortgage-backed securities. You cannot invest directly in an index. |
| | | | | | |
| Letter to shareholders (unaudited) | | Wells Fargo International Equity Fund | | | 3 | |
Don’t let short-term uncertainty derail long-term investment goals.
Periods of uncertainty can present challenges, but experience has taught us that maintaining long-term investment goals can be an effective way to plan for the future. To help you create a sound strategy based on your personal goals and risk tolerance, Wells Fargo Funds offers more than 100 mutual funds spanning a wide range of asset classes and investment styles. Although diversification cannot guarantee an investment profit or prevent losses, we believe it can be an effective way to manage investment risk and potentially smooth out overall portfolio performance. We encourage investors to know their investments and to understand that appropriate levels of risk-taking may unlock opportunities.
Thank you for choosing to invest in Wells Fargo Funds. We appreciate your confidence in us and remain committed to helping you meet your financial needs.
Sincerely,

Andrew Owen
President
Wells Fargo Funds
Although diversification cannot guarantee an investment profit or prevent losses, we believe it can be an effective way to manage investment risk and potentially smooth out overall portfolio performance.
For further information about your Fund, contact your investment professional, visit our website at wellsfargofunds.com, or call us directly at 1-800-222-8222. We are available 24 hours a day, 7 days a week.
| | | | |
| 4 | | Wells Fargo International Equity Fund | | Performance highlights (unaudited) |
Investment objective
The Fund seeks long-term capital appreciation.
Manager
Wells Fargo Funds Management, LLC
Subadviser
Wells Capital Management Incorporated
Portfolio managers
Dale A. Winner, CFA®
Venkateshwar Lal‡
Average annual total returns (%) as of April 30, 20171
| | | | | | | | | | | | | | | | | | | | | | | | | | | | | | | | | | |
| | | | | Including sales charge | | | Excluding sales charge | | | Expense ratios2 (%) | |
| | | Inception date | | 1 year | | | 5 year | | | 10 year | | | 1 year | | | 5 year | | | 10 year | | | Gross | | | Net3 | |
| Class A (WFEAX) | | 1-20-1998 | | | 8.82 | | | | 5.72 | | | | 0.19 | | | | 15.49 | | | | 6.98 | | | | 0.78 | | | | 1.43 | | | | 1.15 | |
| Class B (WFEBX)* | | 9-06-1979 | | | 9.59 | | | | 5.87 | | | | 0.25 | | | | 14.59 | | | | 6.18 | | | | 0.25 | | | | 2.18 | | | | 1.90 | |
| Class C (WFEFX) | | 3-6-1998 | | | 13.57 | | | | 6.19 | | | | 0.03 | | | | 14.57 | | | | 6.19 | | | | 0.03 | | | | 2.18 | | | | 1.90 | |
| Class R (WFERX) | | 10-10-2003 | | | – | | | | – | | | | – | | | | 15.08 | | | | 6.70 | | | | 0.52 | | | | 1.68 | | | | 1.40 | |
| Class R6 (WFEHX) | | 9-30-2015 | | | – | | | | – | | | | – | | | | 15.77 | | | | 7.22 | | | | 0.96 | | | | 1.00 | | | | 0.85 | |
| Administrator Class (WFEDX) | | 7-16-2010 | | | – | | | | – | | | | – | | | | 15.44 | | | | 6.99 | | | | 0.86 | | | | 1.35 | | | | 1.15 | |
| Institutional Class (WFENX) | | 3-9-1998 | | | – | | | | – | | | | – | | | | 15.75 | | | | 7.24 | | | | 1.03 | | | | 1.10 | | | | 0.90 | |
| MSCI ACWI ex USA (Net)4 | | – | | | – | | | | – | | | | – | | | | 12.59 | | | | 5.13 | | | | 1.12 | | | | – | | | | – | |
| * | | At the close of business on May 5, 2017, existing Class B shareholders were converted to Class A shareholders. Effective May 6, 2017, Class B shares are no longer offered by the Fund. |
Figures quoted represent past performance, which is no guarantee of future results, and do not reflect taxes that a shareholder may pay on fund distributions or the redemption of fund shares. Investment return and principal value of an investment will fluctuate so that an investor’s shares, when redeemed, may be worth more or less than their original cost. Performance shown without sales charges would be lower if sales charges were reflected. Current performance may be lower or higher than the performance data quoted, which assumes the reinvestment of dividends and capital gains. Current month-end performance is available on the Fund’s website, wellsfargofunds.com.
Index returns do not include transaction costs associated with buying and selling securities, any mutual fund fees or expenses, or any taxes. It is not possible to invest directly in an index.
For Class A shares, the maximum front-end sales charge is 5.75%. For Class B shares, the maximum contingent deferred sales charge is 5.00%. For Class C shares, the maximum contingent deferred sales charge is 1.00%. Performance including a contingent deferred sales charge assumes the sales charge for the corresponding time period. Class R, Class R6, Administrator Class, and Institutional Class shares are sold without a front-end sales charge or contingent deferred sales charge.
Stock values fluctuate in response to the activities of individual companies and general market and economic conditions. Foreign investments are especially volatile and can rise or fall dramatically due to differences in the political and economic conditions of the host country. These risks are generally intensified in emerging markets. The use of derivatives may reduce returns and/or increase volatility. Certain investment strategies tend to increase the total risk of an investment (relative to the broader market). The Fund is exposed to smaller-company securities risk. Consult the Fund’s prospectus for additional information on these and other risks.
Please see footnotes on page 5.
| | | | | | |
| Performance highlights (unaudited) | | Wells Fargo International Equity Fund | | | 5 | |
| | | | |
| Ten largest holdings (%) as of April 30, 20175 | |
Novartis AG | | | 3.39 | |
Man Group plc | | | 3.23 | |
Bayer AG | | | 3.18 | |
CIMB Group Holdings Berhad | | | 3.14 | |
Den Norske Bank ASA | | | 3.13 | |
Koninklijke Philips NV | | | 3.08 | |
Compagnie de Saint-Gobain SA | | | 3.07 | |
Zurich Insurance Group AG | | | 2.94 | |
Metro AG | | | 2.91 | |
China Mobile Limited | | | 2.84 | |
|
| Sector distribution as of April 30, 20176 |
|
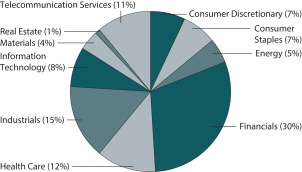
|
|
| Country allocation as of April 30, 20176 |
|
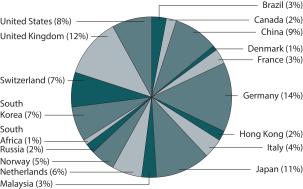
|
| ‡ | Mr. Lal became a portfolio manager of the Fund on June 30, 2017. |
| 1 | Historical performance shown for Class R6 shares prior to their inception reflects the performance of Institutional Class shares and includes the higher expenses applicable to Institutional Class shares. If these expenses had not been included, returns for Class R6 shares would be higher. Historical performance shown for Administrator Class shares prior to their inception reflects the performance of Institutional Class shares and has been adjusted to reflect the higher expenses applicable to Administrator Class shares. Historical performance shown for all classes of the Fund prior to July 12, 2010, is based on the performance of the Fund’s predecessor, Evergreen International Equity Fund. |
| 2 | Reflects the expense ratios as stated in the most recent prospectuses, which include the impact of 0.01% in acquired fund fees and expenses. The expense ratios shown are subject to change and may differ from the annualized expense ratios shown in the financial highlights of this report, which do not include acquired fund fees and expenses. |
| 3 | The manager has contractually committed through February 28, 2018 to waive fees and/or reimburse expenses to the extent necessary to cap the Fund’s Total Annual Operating Expenses After Fee Waiver at 1.14% for Class A, 1.89% for Class B, 1.89% for Class C, 1.39% for Class R, 0.84% for Class R6, 1.14% for Administrator Class, and 0.89% for Institutional Class. After this time, the cap may be increased or the commitment to maintain the cap may be terminated only with the approval of the Board of Trustees. Brokerage commissions, stamp duty fees, interest, taxes, acquired fees and expenses, and extraordinary expenses are excluded from the expense cap. Without this cap, the Fund’s returns would have been lower. The expense ratio paid by an investor is the net expense ratio or the Fund’s Total Annual Fund Operating Expenses After Fee Waivers, as stated in the prospectuses. |
| 4 | The Morgan Stanley Capital International (MSCI) All Country World Index (ACWI) ex USA Index (Net) is a free-float-adjusted market-capitalization-weighted index that is designed to measure the equity market performance of developed markets, excluding the United States and Canada. Source: MSCI. MSCI makes no express or implied warranties or representations and shall have no liability whatsoever with respect to any MSCI data contained herein. The MSCI data may not be further redistributed or used as a basis for other indexes or any securities or financial products. This report is not approved, reviewed, or produced by MSCI. You cannot invest directly in an index. |
| 5 | The ten largest holdings, excluding cash and cash equivalents, are calculated based on the value of the investments divided by total net assets of the Fund. Holdings are subject to change and may have changed since the date specified. |
| 6 | Amounts are calculated based on the total long-term investments of the Fund. These amounts are subject to change and may have changed since the date specified. |
| | | | |
| 6 | | Wells Fargo International Equity Fund | | Fund expenses (unaudited) |
As a shareholder of the Fund, you incur two types of costs: (1) transaction costs, including sales charges (loads) on purchase payments and contingent deferred sales charges (if any) on redemptions and (2) ongoing costs, including management fees, distribution (12b-1) and/or shareholder servicing fees, and other Fund expenses. This example is intended to help you understand your ongoing costs (in dollars) of investing in the Fund and to compare these costs with the ongoing costs of investing in other mutual funds.
The example is based on an investment of $1,000 invested at the beginning of the six-month period and held for the entire period from November 1, 2016 to April 30, 2017.
Actual expenses
The “Actual” line of the table below provides information about actual account values and actual expenses. You may use the information in this line, together with the amount you invested, to estimate the expenses that you paid over the period. Simply divide your account value by $1,000 (for example, an $8,600 account value divided by $1,000 = 8.6), then multiply the result by the number in the “Actual�� line under the heading entitled “Expenses paid during period” for your applicable class of shares to estimate the expenses you paid on your account during this period.
Hypothetical example for comparison purposes
The “Hypothetical” line of the table below provides information about hypothetical account values and hypothetical expenses based on the Fund’s actual expense ratio and an assumed rate of return of 5% per year before expenses, which is not the Fund’s actual return. The hypothetical account values and expenses may not be used to estimate the actual ending account balance or expenses you paid for the period. You may use this information to compare the ongoing costs of investing in the Fund and other funds. To do so, compare this 5% hypothetical example with the 5% hypothetical examples that appear in the shareholder reports of the other funds.
Please note that the expenses shown in the table are meant to highlight your ongoing costs only and do not reflect any transactional costs, such as sales charges (loads) and contingent deferred sales charges. Therefore, the “Hypothetical” line of the table is useful in comparing ongoing costs only and will not help you determine the relative total costs of owning different funds. In addition, if these transactional costs were included, your costs would have been higher.
| | | | | | | | | | | | | | | | |
| | | Beginning
account value
11-1-2016 | | | Ending
account value
4-30-2017 | | | Expenses
paid during
the period¹ | | | Annualized net
expense ratio | |
Class A | | | | | | | | | | | | | | | | |
Actual | | $ | 1,000.00 | | | $ | 1,123.57 | | | $ | 6.00 | | | | 1.14 | % |
Hypothetical (5% return before expenses) | | $ | 1,000.00 | | | $ | 1,019.14 | | | $ | 5.71 | | | | 1.14 | % |
Class B | | | | | | | | | | | | | | | | |
Actual | | $ | 1,000.00 | | | $ | 1,119.39 | | | $ | 9.93 | | | | 1.89 | % |
Hypothetical (5% return before expenses) | | $ | 1,000.00 | | | $ | 1,015.42 | | | $ | 9.44 | | | | 1.89 | % |
Class C | | | | | | | | | | | | | | | | |
Actual | | $ | 1,000.00 | | | $ | 1,119.25 | | | $ | 9.93 | | | | 1.89 | % |
Hypothetical (5% return before expenses) | | $ | 1,000.00 | | | $ | 1,015.42 | | | $ | 9.44 | | | | 1.89 | % |
Class R | | | | | | | | | | | | | | | | |
Actual | | $ | 1,000.00 | | | $ | 1,121.00 | | | $ | 7.31 | | | | 1.39 | % |
Hypothetical (5% return before expenses) | | $ | 1,000.00 | | | $ | 1,017.90 | | | $ | 6.95 | | | | 1.39 | % |
Class R6 | | | | | | | | | | | | | | | | |
Actual | | $ | 1,000.00 | | | $ | 1,125.24 | | | $ | 4.43 | | | | 0.84 | % |
Hypothetical (5% return before expenses) | | $ | 1,000.00 | | | $ | 1,020.63 | | | $ | 4.21 | | | | 0.84 | % |
Administrator Class | | | | | | | | | | | | | | | | |
Actual | | $ | 1,000.00 | | | $ | 1,122.61 | | | $ | 6.00 | | | | 1.14 | % |
Hypothetical (5% return before expenses) | | $ | 1,000.00 | | | $ | 1,019.14 | | | $ | 5.71 | | | | 1.14 | % |
Institutional Class | | | | | | | | | | | | | | | | |
Actual | | $ | 1,000.00 | | | $ | 1,125.05 | | | $ | 4.69 | | | | 0.89 | % |
Hypothetical (5% return before expenses) | | $ | 1,000.00 | | | $ | 1,020.38 | | | $ | 4.46 | | | | 0.89 | % |
| 1 | Expenses paid is equal to the annualized net expense ratio of each class multiplied by the average account value over the period, multiplied by the number of days in the most recent fiscal half-year divided by the number of days in the fiscal year (to reflect the one-half-year period). |
| | | | | | |
| Portfolio of investments—April 30, 2017 (unaudited) | | Wells Fargo International Equity Fund | | | 7 | |
| | | | | | | | | | | | | | | | |
| Security name | | | | | | | | Shares | | | Value | |
| | | | |
Common Stocks: 92.88% | | | | | | | | | | | | | | | | |
| | | | |
| Brazil: 3.09% | | | | | | | | | | | | | | | | |
Cosan Limited Class A (Energy, Oil, Gas & Consumable Fuels) | | | | | | | | | | | 1,073,269 | | | $ | 8,253,439 | |
JBS SA (Consumer Staples, Food Products) | | | | | | | | | | | 1,325,800 | | | | 4,289,777 | |
| | | | |
| | | | | | | | | | | | | | | 12,543,216 | |
| | | | | | | | | | | | | | | | |
| | | | |
| Canada: 2.12% | | | | | | | | | | | | | | | | |
Lundin Mining Corporation (Materials, Metals & Mining) | | | | | | | | | | | 1,615,145 | | | | 8,613,791 | |
| | | | | | | | | | | | | | | | |
| | | | |
| China: 6.48% | | | | | | | | | | | | | | | | |
China Everbright Limited (Financials, Capital Markets) | | | | | | | | | | | 2,054,000 | | | | 4,700,380 | |
China Mobile Limited (Telecommunication Services, Wireless Telecommunication Services) | | | | | | | | | | | 1,080,000 | | | | 11,517,349 | |
Industrial & Commercial Bank of China Limited H Shares (Financials, Banks) | | | | | | | | | | | 1,935,000 | | | | 1,263,738 | |
Shanghai Pharmaceuticals Holding Company Limited H Shares (Health Care, Health Care Providers & Services) | | | | | | | | | | | 1,946,100 | | | | 5,154,006 | |
Xinyi Solar Holdings Limited (Information Technology, Semiconductors & Semiconductor Equipment) « | | | | | | | | | | | 7,280,000 | | | | 2,274,313 | |
Xtep International Holdings Limited (Consumer Discretionary, Textiles, Apparel & Luxury Goods) | | | | | | | | | | | 3,498,680 | | | | 1,394,371 | |
| | | | |
| | | | | | | | | | | | | | | 26,304,157 | |
| | | | | | | | | | | | | | | | |
| | | | |
| Denmark: 0.92% | | | | | | | | | | | | | | | | |
Novo Nordisk AS Class B (Health Care, Pharmaceuticals) | | | | | | | | | | | 95,686 | | | | 3,723,322 | |
| | | | | | | | | | | | | | | | |
| | | | |
| France: 3.07% | | | | | | | | | | | | | | | | |
Compagnie de Saint-Gobain SA (Industrials, Building Products) | | | | | | | | | | | 230,369 | | | | 12,434,121 | |
| | | | | | | | | | | | | | | | |
| | | | |
| Germany: 13.35% | | | | | | | | | | | | | | | | |
Bayer AG (Health Care, Pharmaceuticals) | | | | | | | | | | | 104,197 | | | | 12,893,800 | |
Metro AG (Consumer Staples, Food & Staples Retailing) | | | | | | | | | | | 358,829 | | | | 11,808,253 | |
Muenchener Rueckversicherungs Gesellschaft AG (Financials, Insurance) | | | | | | | | | | | 39,482 | | | | 7,567,210 | |
Rheinmetall AG (Industrials, Industrial Conglomerates) | | | | | | | | | | | 84,722 | | | | 7,775,234 | |
SAP SE (Information Technology, Software) | | | | | | | | | | | 69,014 | | | | 6,921,540 | |
Siemens AG (Industrials, Industrial Conglomerates) | | | | | | | | | | | 50,071 | | | | 7,177,770 | |
| | | | |
| | | | | | | | | | | | | | | 54,143,807 | |
| | | | | | | | | | | | | | | | |
| | | | |
| Hong Kong: 2.19% | | | | | | | | | | | | | | | | |
Xinyi Glass Holdings Limited (Consumer Discretionary, Auto Components) | | | | | | | | | | | 10,034,000 | | | | 8,900,937 | |
| | | | | | | | | | | | | | | | |
| | | | |
| Italy: 3.61% | | | | | | | | | | | | | | | | |
Eni SpA (Energy, Oil, Gas & Consumable Fuels) | | | | | | | | | | | 733,994 | | | | 11,409,428 | |
Prysmian SpA (Industrials, Electrical Equipment) | | | | | | | | | | | 112,578 | | | | 3,250,953 | |
| | | | |
| | | | | | | | | | | | | | | 14,660,381 | |
| | | | | | | | | | | | | | | | |
| | | | |
| Japan: 10.75% | | | | | | | | | | | | | | | | |
Coca-Cola Bottlers Japan Incorporated (Consumer Staples, Beverages) | | | | | | | | | | | 75 | | | | 2,230 | |
Daiwa Securities Group Incorporated (Financials, Capital Markets) | | | | | | | | | | | 1,829,000 | | | | 11,112,641 | |
Hitachi Limited (Information Technology, Electronic Equipment, Instruments & Components) | | | | | | | | | | | 1,613,000 | | | | 8,900,258 | |
Mitsubishi UFJ Financial Group Incorporated (Financials, Banks) | | | | | | | | | | | 1,383,600 | | | | 8,802,414 | |
Mitsui Fudosan Company Limited (Real Estate, Real Estate Management & Development) | | | | | | | | | | | 167,000 | | | | 3,669,581 | |
Nomura Holdings Incorporated (Financials, Capital Markets) | | | | | | | | | | | 1,854,800 | | | | 11,131,296 | |
| | | | |
| | | | | | | | | | | | | | | 43,618,420 | |
| | | | | | | | | | | | | | | | |
The accompanying notes are an integral part of these financial statements.
| | | | |
| 8 | | Wells Fargo International Equity Fund | | Portfolio of investments—April 30, 2017 (unaudited) |
| | | | | | | | | | | | | | | | |
| Security name | | | | | | | | Shares | | | Value | |
| | | | |
| Malaysia: 3.14% | | | | | | | | | | | | | | | | |
CIMB Group Holdings Bhd (Financials, Banks) | | | | | | | | | | | 9,619,463 | | | $ | 12,719,585 | |
| | | | | | | | | | | | | | | | |
| | | | |
| Netherlands: 5.65% | | | | | | | | | | | | | | | | |
Koninklijke Philips NV (Industrials, Industrial Conglomerates) « | | | | | | | | | | | 360,012 | | | | 12,478,562 | |
NN Group NV (Financials, Insurance) | | | | | | | | | | | 315,272 | | | | 10,453,878 | |
| | | | |
| | | | | | | | | | | | | | | 22,932,440 | |
| | | | | | | | | | | | | | | | |
| | | | |
| Norway: 4.24% | | | | | | | | | | | | | | | | |
Den Norske Bank ASA (Financials, Banks) « | | | | | | | | | | | 813,903 | | | | 12,711,902 | |
Frontline Limited (Energy, Oil, Gas & Consumable Fuels) « | | | | | | | | | | | 195,800 | | | | 1,304,421 | |
Marine Harvest ASA (Consumer Staples, Food Products) | | | | | | | | | | | 192,194 | | | | 3,196,518 | |
| | | | |
| | | | | | | | | | | | | | | 17,212,841 | |
| | | | | | | | | | | | | | | | |
| | | | |
| Russia: 1.94% | | | | | | | | | | | | | | | | |
Mobile TeleSystems PJSC ADR (Telecommunication Services, Wireless Telecommunication Services) | | | | | | | | | | | 760,386 | | | | 7,847,184 | |
| | | | | | | | | | | | | | | | |
| | | | |
| South Africa: 1.37% | | | | | | | | | | | | | | | | |
Sasol Limited (Materials, Chemicals) | | | | | | | | | | | 180,673 | | | | 5,543,050 | |
| | | | | | | | | | | | | | | | |
| | | | |
| South Korea: 6.10% | | | | | | | | | | | | | | | | |
Hana Financial Group Incorporated (Financials, Banks) | | | | | | | | | | | 320,865 | | | | 11,053,615 | |
Samsung Electronics Company Limited GDR (Information Technology, Technology Hardware, Storage & Peripherals) 144A | | | | | | | | | | | 2,644 | | | | 2,593,764 | |
SK Telecom Company Limited (Telecommunication Services, Wireless Telecommunication Services) | | | | | | | | | | | 52,736 | | | | 11,099,633 | |
| | | | |
| | | | | | | | | | | | | | | 24,747,012 | |
| | | | | | | | | | | | | | | | |
| | | | |
| Switzerland: 6.34% | | | | | | | | | | | | | | | | |
Novartis AG (Health Care, Pharmaceuticals) | | | | | | | | | | | 178,818 | | | | 13,757,304 | |
Zurich Insurance Group AG (Financials, Insurance) | | | | | | | | | | | 43,133 | | | | 11,938,521 | |
| | | | |
| | | | | | | | | | | | | | | 25,695,825 | |
| | | | | | | | | | | | | | | | |
| | | | |
| United Kingdom: 11.13% | | | | | | | | | | | | | | | | |
Man Group plc (Financials, Capital Markets) | | | | | | | | | | | 6,580,047 | | | | 13,099,039 | |
Smiths Group plc (Industrials, Industrial Conglomerates) | | | | | | | | | | | 512,201 | | | | 10,879,798 | |
United Business Media plc (Consumer Discretionary, Media) | | | | | | | | | | | 723,413 | | | | 6,657,129 | |
Vodafone Group plc (Telecommunication Services, Wireless Telecommunication Services) | | | | | | | | | | | 4,048,076 | | | | 10,436,321 | |
Wolseley plc (Industrials, Trading Companies & Distributors) | | | | | | | | | | | 64,090 | | | | 4,070,777 | |
| | | | |
| | | | | | | | | | | | | | | 45,143,064 | |
| | | | | | | | | | | | | | | | |
| | | | |
| United States: 7.39% | | | | | | | | | | | | | | | | |
Apple Incorporated (Information Technology, Technology Hardware, Storage & Peripherals) | | | | | | | | | | | 72,207 | | | | 10,372,536 | |
Coach Incorporated (Consumer Discretionary, Textiles, Apparel & Luxury Goods) | | | | | | | | | | | 264,200 | | | | 10,406,838 | |
Pfizer Incorporated (Health Care, Pharmaceuticals) | | | | | | | | | | | 270,914 | | | | 9,189,403 | |
| | | | |
| | | | | | | | | | | | | | | 29,968,777 | |
| | | | | | | | | | | | | | | | |
| | | | |
Total Common Stocks (Cost $325,157,457) | | | | | | | | | | | | | | | 376,751,930 | |
| | | | | | | | | | | | | | | | |
The accompanying notes are an integral part of these financial statements.
| | | | | | |
| Portfolio of investments—April 30, 2017 (unaudited) | | Wells Fargo International Equity Fund | | | 9 | |
| | | | | | | | | | | | | | | | |
| Security name | | | | | Expiration date | | | Shares | | | Value | |
| | | | |
Participation Notes: 1.54% | | | | | | | | | | | | | | | | |
| | | | |
| China: 1.54% | | | | | | | | | | | | | | | | |
HSBC Bank plc (Kweichow Moutai Company Limited Class A) (Consumer Staples, Beverages) † | | | | | | | 2-19-2019 | | | | 61,306 | | | $ | 3,680,462 | |
HSBC Bank plc (Kweichow Moutai Company Limited Class A) (Consumer Staples, Beverages) † | | | | | | | 12-4-2024 | | | | 43,031 | | | | 2,583,335 | |
| | | | |
Total Participation Notes (Cost $3,124,077) | | | | | | | | | | | | | | | 6,263,797 | |
| | | | | | | | | | | | | | | | |
| | | | |
| | | Yield | | | | | | | | | | |
| Short-Term Investments: 8.98% | | | | | | | | | | | | | | | | |
| | | | |
| Investment Companies: 8.98% | | | | | | | | | | | | | | | | |
Securities Lending Cash Investment LLC (l)(r)(u) | | | 1.03 | % | | | | | | | 15,605,057 | | | | 15,606,618 | |
Wells Fargo Government Money Market Fund Select Class (l)(u) | | | 0.68 | | | | | | | | 20,835,637 | | | | 20,835,637 | |
| | | | |
Total Short-Term Investments (Cost $36,442,212) | | | | | | | | | | | | | | | 36,442,255 | |
| | | | | | | | | | | | | | | | |
| | | | | | | | |
| Total investments in securities (Cost $364,723,746) * | | | 103.40 | % | | | 419,457,982 | |
Other assets and liabilities, net | | | (3.40 | ) | | | (13,799,694 | ) |
| | | | | | | | |
| Total net assets | | | 100.00 | % | | $ | 405,658,288 | |
| | | | | | | | |
| « | All or a portion of this security is on loan. |
| 144A | The security may be resold in transactions exempt from registration, normally to qualified institutional buyers, pursuant to Rule 144A under the Securities Act of 1933. |
| † | Non-income-earning security |
| (l) | The issuer of the security is an affiliated person of the Fund as defined in the Investment Company Act of 1940. |
| (r) | The investment is a non-registered investment vehicle purchased with cash collateral received from securities on loan. |
| (u) | The rate represents the 7-day annualized yield at period end. |
| * | Cost for federal income tax purposes is $364,559,352 and unrealized gains (losses) consists of: |
| | | | |
Gross unrealized gains | | $ | 62,336,877 | |
Gross unrealized losses | | | (7,438,247 | ) |
| | | | |
Net unrealized gains | | $ | 54,898,630 | |
The accompanying notes are an integral part of these financial statements.
| | | | |
| 10 | | Wells Fargo International Equity Fund | | Statement of assets and liabilities—April 30, 2017 (unaudited) |
| | | | |
| | | | |
| |
Assets | | | | |
Investments | | | | |
In unaffiliated securities (including $14,778,207 of securities loaned), at value (cost $328,281,534) | | $ | 383,015,727 | |
In affiliated securities, at value (cost $36,442,212) | | | 36,442,255 | |
| | | | |
Total investments, at value (cost $364,723,746) | | | 419,457,982 | |
Segregated cash | | | 270,000 | |
Foreign currency, at value (cost $537,113) | | | 536,428 | |
Receivable for investments sold | | | 1,786,134 | |
Receivable for Fund shares sold | | | 865,471 | |
Receivable for dividends | | | 2,533,793 | |
Receivable for securities lending income | | | 34,156 | |
Unrealized gains on forward foreign currency contracts | | | 882,110 | |
Prepaid expenses and other assets | | | 33,855 | |
| | | | |
Total assets | | | 426,399,929 | |
| | | | |
| |
Liabilities | | | | |
Payable for investments purchased | | | 2,551,701 | |
Payable for Fund shares redeemed | | | 635,159 | |
Unrealized losses on forward foreign currency contracts | | | 1,503,857 | |
Payable upon receipt of securities loaned | | | 15,606,311 | |
Management fee payable | | | 192,821 | |
Distribution fees payable | | | 16,702 | |
Administration fees payable | | | 48,610 | |
Accrued expenses and other liabilities | | | 186,480 | |
| | | | |
Total liabilities | | | 20,741,641 | |
| | | | |
Total net assets | | $ | 405,658,288 | |
| | | | |
| |
NET ASSETS CONSIST OF | | | | |
Paid-in capital | | $ | 367,933,037 | |
Undistributed net investment income | | | 2,697,266 | |
Accumulated net realized losses on investments | | | (19,092,269 | ) |
Net unrealized gains on investments | | | 54,120,254 | |
| | | | |
Total net assets | | $ | 405,658,288 | |
| | | | |
| |
COMPUTATION OF NET ASSET VALUE AND OFFERING PRICE PER SHARE | | | | |
Net assets – Class A | | $ | 96,757,280 | |
Shares outstanding – Class A1 | | | 8,010,199 | |
Net asset value per share – Class A | | | $12.08 | |
Maximum offering price per share – Class A2 | | | $12.82 | |
Net assets – Class B | | $ | 165,078 | |
Shares outstanding – Class B1 | | | 13,815 | |
Net asset value per share – Class B | | | $11.95 | |
Net assets – Class C | | $ | 26,718,315 | |
Shares outstanding – Class C1 | | | 2,253,537 | |
Net asset value per share – Class C | | | $11.86 | |
Net assets – Class R | | $ | 1,862,230 | |
Shares outstanding – Class R1 | | | 152,202 | |
Net asset value per share – Class R | | | $12.24 | |
Net assets – Class R6 | | $ | 24,657,268 | |
Shares outstanding – Class R61 | | | 2,042,957 | |
Net asset value per share – Class R6 | | | $12.07 | |
Net assets – Administrator Class | | $ | 19,876,618 | |
Shares outstanding – Administrator Class1 | | | 1,674,025 | |
Net asset value per share – Administrator Class | | | $11.87 | |
Net assets – Institutional Class | | $ | 235,621,499 | |
Shares outstanding – Institutional Class1 | | | 19,571,718 | |
Net asset value per share – Institutional Class | | | $12.04 | |
| 1 | The Fund has an unlimited number of authorized shares. |
| 2 | Maximum offering price is computed as 100/94.25 of net asset value. On investments of $50,000 or more, the offering price is reduced. |
The accompanying notes are an integral part of these financial statements.
| | | | | | |
| Statement of operations—six months ended April 30, 2017 (unaudited) | | Wells Fargo International Equity Fund | | | 11 | |
| | | | |
| | | | |
| |
Investment income | | | | |
Dividends (net of foreign withholding taxes of $675,982) | | $ | 5,786,458 | |
Securities lending income, net | | | 119,155 | |
Income from affiliated securities | | | 74,674 | |
| | | | |
Total investment income | | | 5,980,287 | |
| | | | |
| |
Expenses | | | | |
Management fee | | | 1,696,530 | |
Administration fees | | | | |
Class A | | | 117,144 | |
Class B | | | 611 | |
Class C | | | 27,561 | |
Class R | | | 2,011 | |
Class R6 | | | 2,906 | |
Administrator Class | | | 14,248 | |
Institutional Class | | | 131,793 | |
Shareholder servicing fees | | | | |
Class A | | | 139,457 | |
Class B | | | 727 | |
Class C | | | 32,811 | |
Class R | | | 2,394 | |
Administrator Class | | | 27,077 | |
Distribution fees | | | | |
Class B | | | 2,181 | |
Class C | | | 98,432 | |
Class R | | | 2,394 | |
Custody and accounting fees | | | 85,909 | |
Professional fees | | | 34,261 | |
Registration fees | | | 95,291 | |
Shareholder report expenses | | | 47,451 | |
Trustees’ fees and expenses | | | 22,551 | |
Other fees and expenses | | | 5,707 | |
| | | | |
Total expenses | | | 2,589,447 | |
Less: Fee waivers and/or expense reimbursements | | | (578,071 | ) |
| | | | |
Net expenses | | | 2,011,376 | |
| | | | |
Net investment income | | | 3,968,911 | |
| | | | |
| |
REALIZED AND UNREALIZED GAINS (LOSSES) ON INVESTMENTS | | | | |
| |
Net realized gains on: | | | | |
Unaffiliated securities | | | 8,303,685 | |
Affiliated securities | | | 13 | |
Forward foreign currency contract transactions | | | 2,202,233 | |
| | | | |
Net realized gains on investments | | | 10,505,931 | |
| | | | |
| |
Net change in unrealized gains (losses) on: | | | | |
Unaffiliated securities | | | 32,764,449 | |
Affiliated securities | | | (264 | ) |
Forward foreign currency contract transactions | | | (1,842,781 | ) |
| | | | |
Net change in unrealized gains (losses) on investments | | | 30,921,404 | |
| | | | |
Net realized and unrealized gains (losses) on investments | | | 41,427,335 | |
| | | | |
Net increase in net assets resulting from operations | | $ | 45,396,246 | |
| | | | |
The accompanying notes are an integral part of these financial statements.
| | | | |
| 12 | | Wells Fargo International Equity Fund | | Statement of changes in net assets |
| | | | | | | | | | | | | | | | |
| | | Six months ended
April 30, 2017 (unaudited) | | | Year ended
October 31, 2016 | |
| | | | |
Operations | | | | | | | | | | | | | | | | |
Net investment income | | | | | | $ | 3,968,911 | | | | | | | $ | 8,536,868 | |
Net realized gains (losses) on investments | | | | | | | 10,505,931 | | | | | | | | (24,356,272 | ) |
Net change in unrealized gains (losses) on investments | | | | | | | 30,921,404 | | | | | | | | (1,641,199 | ) |
| | | | |
Net increase (decrease) in net assets resulting from operations | | | | | | | 45,396,246 | | | | | | | | (17,460,603 | ) |
| | | | |
| | | | |
Distributions to shareholders from | | | | | | | | | | | | | | | | |
Net investment income | | | | | | | | | | | | | | | | |
Class A | | | | | | | (3,419,346 | ) | | | | | | | (1,980,548 | ) |
Class B | | | | | | | (8,853 | ) | | | | | | | (4,737 | ) |
Class C | | | | | | | (543,400 | ) | | | | | | | (292,082 | ) |
Class R | | | | | | | (49,858 | ) | | | | | | | (24,021 | ) |
Class R6 | | | | | | | (681,611 | ) | | | | | | | (338 | ) |
Administrator Class | | | | | | | (583,495 | ) | | | | | | | (731,926 | ) |
Institutional Class | | | | | | | (6,175,331 | ) | | | | | | | (3,153,699 | ) |
| | | | |
Total distributions to shareholders | | | | | | | (11,461,894 | ) | | | | | | | (6,187,351 | ) |
| | | | |
| | | | |
Capital share transactions | | | Shares | | | | | | | | Shares | | | | | |
Proceeds from shares sold | | | | | | | | | | | | | | | | |
Class A | | | 717,148 | | | | 8,335,457 | | | | 3,672,410 | | | | 40,169,639 | |
Class B | | | 0 | | | | 0 | | | | 815 | | | | 8,671 | |
Class C | | | 130,508 | | | | 1,487,086 | | | | 998,881 | | | | 10,835,255 | |
Class R | | | 19,662 | | | | 230,097 | | | | 72,262 | | | | 801,881 | |
Class R6 | | | 1,979,061 | | | | 22,007,197 | | | | 51 | | | | 541 | |
Administrator Class | | | 492,571 | | | | 5,528,200 | | | | 2,805,944 | | | | 30,263,453 | |
Institutional Class | | | 6,458,770 | | | | 74,415,190 | | | | 9,957,611 | | | | 108,139,415 | |
| | | | |
| | | | | | | 112,003,227 | | | | | | | | 190,218,855 | |
| | | | |
Reinvestment of distributions | | | | | | | | | | | | | | | | |
Class A | | | 289,214 | | | | 3,207,383 | | | | 167,795 | | | | 1,860,967 | |
Class B | | | 801 | | | | 8,812 | | | | 431 | | | | 4,689 | |
Class C | | | 43,293 | | | | 472,331 | | | | 23,355 | | | | 254,804 | |
Class R | | | 1,205 | | | | 13,541 | | | | 822 | | | | 9,244 | |
Class R6 | | | 61,573 | | | | 681,611 | | | | 30 | | | | 338 | |
Administrator Class | | | 53,401 | | | | 582,070 | | | | 67,082 | | | | 731,191 | |
Institutional Class | | | 436,449 | | | | 4,818,398 | | | | 230,119 | | | | 2,542,811 | |
| | | | |
| | | | | | | 9,784,146 | | | | | | | | 5,404,044 | |
| | | | |
Payment for shares redeemed | | | | | | | | | | | | | | | | |
Class A | | | (4,035,268 | ) | | | (46,854,848 | ) | | | (5,436,299 | ) | | | (57,973,044 | ) |
Class B | | | (74,928 | ) | | | (853,037 | ) | | | (148,673 | ) | | | (1,557,542 | ) |
Class C | | | (462,779 | ) | | | (5,177,464 | ) | | | (1,053,145 | ) | | | (11,165,445 | ) |
Class R | | | (49,869 | ) | | | (579,539 | ) | | | (76,036 | ) | | | (818,347 | ) |
Class R6 | | | (54 | ) | | | (628 | ) | | | 0 | | | | 0 | |
Administrator Class | | | (2,184,031 | ) | | | (23,971,201 | ) | | | (4,192,576 | ) | | | (44,163,215 | ) |
Institutional Class | | | (3,845,398 | ) | | | (44,059,550 | ) | | | (10,441,636 | ) | | | (109,679,342 | ) |
| | | | |
| | | | | | | (121,496,267 | ) | | | | | | | (225,356,935 | ) |
| | | | |
Net increase (decrease) in net assets resulting from capital share transactions | | | | | | | 291,106 | | | | | | | | (29,734,036 | ) |
| | | | |
Total increase (decrease) in net assets | | | | | | | 34,225,458 | | | | | | | | (53,381,990 | ) |
| | | | |
| | | | |
Net assets | | | | | | | | | | | | | | | | |
Beginning of period | | | | | | | 371,432,830 | | | | | | | | 424,814,820 | |
| | | | |
End of period | | | | | | $ | 405,658,288 | | | | | | | $ | 371,432,830 | |
| | | | |
Undistributed net investment income | | | | | | $ | 2,697,266 | | | | | | | $ | 10,190,249 | |
| | | | |
The accompanying notes are an integral part of these financial statements.
| | | | | | |
| Financial highlights | | Wells Fargo International Equity Fund | | | 13 | |
(For a share outstanding throughout each period)
| | | | | | | | | | | | | | | | | | | | | | | | |
| | | Six months ended
April 30, 2017 (unaudited) | | | Year ended October 31 | |
| CLASS A | | | 2016 | | | 2015 | | | 2014 | | | 2013 | | | 2012 | |
Net asset value, beginning of period | | | $11.07 | | | | $11.53 | | | | $11.28 | | | | $11.98 | | | | $9.77 | | | | $9.82 | |
Net investment income | | | 0.10 | | | | 0.22 | | | | 0.18 | 1 | | | 0.37 | 1 | | | 0.21 | | | | 0.25 | |
Net realized and unrealized gains (losses) on investments | | | 1.24 | | | | (0.54 | ) | | | 0.57 | | | | (0.81 | ) | | | 2.27 | | | | (0.09 | ) |
| | | | | | | | | | | | | | | | | | | | | | | | |
Total from investment operations | | | 1.34 | | | | (0.32 | ) | | | 0.75 | | | | (0.44 | ) | | | 2.48 | | | | 0.16 | |
Distributions to shareholders from | | | | | | | | | | | | | | | | | | | | | | | | |
Net investment income | | | (0.33 | ) | | | (0.14 | ) | | | (0.50 | ) | | | (0.26 | ) | | | (0.27 | ) | | | (0.21 | ) |
Net asset value, end of period | | | $12.08 | | | | $11.07 | | | | $11.53 | | | | $11.28 | | | | $11.98 | | | | $9.77 | |
Total return2 | | | 12.36 | % | | | (2.76 | )% | | | 6.85 | % | | | (3.77 | )% | | | 25.99 | % | | | 1.83 | % |
Ratios to average net assets (annualized) | | | | | | | | | | | | | | | | | | | | | | | | |
Gross expenses | | | 1.50 | % | | | 1.47 | % | | | 1.53 | % | | | 1.53 | % | | | 1.56 | % | | | 1.53 | % |
Net expenses | | | 1.14 | % | | | 1.12 | % | | | 1.09 | % | | | 1.09 | % | | | 1.09 | % | | | 1.09 | % |
Net investment income | | | 1.77 | % | | | 2.04 | % | | | 1.50 | % | | | 3.14 | % | | | 2.03 | % | | | 2.49 | % |
Supplemental data | | | | | | | | | | | | | | | | | | | | | | | | |
Portfolio turnover rate | | | 48 | % | | | 65 | % | | | 27 | % | | | 32 | % | | | 38 | % | | | 115 | % |
Net assets, end of period (000s omitted) | | | $96,757 | | | | $122,248 | | | | $145,654 | | | | $97,640 | | | | $115,821 | | | | $114,219 | |
| 1 | Calculated based upon average shares outstanding |
| 2 | Total return calculations do not include any sales charges. Returns for periods of less than one year are not annualized. |
The accompanying notes are an integral part of these financial statements.
| | | | |
| 14 | | Wells Fargo International Equity Fund | | Financial highlights |
(For a share outstanding throughout each period)
| | | | | | | | | | | | | | | | | | | | | | | | |
| | | Six months ended
April 30, 2017 (unaudited) | | | Year ended October 31 | |
| CLASS B | | | 2016 | | | 2015 | | | 2014 | | | 2013 | | | 2012 | |
Net asset value, beginning of period | | | $10.81 | | | | $11.21 | | | | $10.95 | | | | $11.62 | | | | $9.47 | | | | $9.48 | |
Net investment income | | | 0.02 | 1 | | | 0.12 | 1 | | | 0.08 | 1 | | | 0.28 | 1 | | | 0.13 | 1 | | | 0.16 | 1 |
Net realized and unrealized gains (losses) on investments | | | 1.25 | | | | (0.50 | ) | | | 0.56 | | | | (0.79 | ) | | | 2.21 | | | | (0.07 | ) |
| | | | | | | | | | | | | | | | | | | | | | | | |
Total from investment operations | | | 1.27 | | | | (0.38 | ) | | | 0.64 | | | | (0.51 | ) | | | 2.34 | | | | 0.09 | |
Distributions to shareholders from | | | | | | | | | | | | | | | | | | | | | | | | |
Net investment income | | | (0.13 | ) | | | (0.02 | ) | | | (0.38 | ) | | | (0.16 | ) | | | (0.19 | ) | | | (0.10 | ) |
Net asset value, end of period | | | $11.95 | | | | $10.81 | | | | $11.21 | | | | $10.95 | | | | $11.62 | | | | $9.47 | |
Total return2 | | | 11.94 | % | | | (3.46 | )% | | | 6.00 | % | | | (4.48 | )% | | | 25.07 | % | | | 0.99 | % |
Ratios to average net assets (annualized) | | | | | | | | | | | | | | | | | | | | | | | | |
Gross expenses | | | 2.25 | % | | | 2.21 | % | | | 2.29 | % | | | 2.28 | % | | | 2.31 | % | | | 2.28 | % |
Net expenses | | | 1.89 | % | | | 1.87 | % | | | 1.84 | % | | | 1.84 | % | | | 1.84 | % | | | 1.84 | % |
Net investment income | | | 0.43 | % | | | 1.17 | % | | | 0.68 | % | | | 2.40 | % | | | 1.27 | % | | | 1.67 | % |
Supplemental data | | | | | | | | | | | | | | | | | | | | | | | | |
Portfolio turnover rate | | | 48 | % | | | 65 | % | | | 27 | % | | | 32 | % | | | 38 | % | | | 115 | % |
Net assets, end of period (000s omitted) | | | $165 | | | | $950 | | | | $2,639 | | | | $4,127 | | | | $6,810 | | | | $8,303 | |
| 1 | Calculated based upon average shares outstanding |
| 2 | Total return calculations do not include any sales charges. Returns for periods of less than one year are not annualized. |
The accompanying notes are an integral part of these financial statements.
| | | | | | |
| Financial highlights | | Wells Fargo International Equity Fund | | | 15 | |
(For a share outstanding throughout each period)
| | | | | | | | | | | | | | | | | | | | | | | | |
| | | Six months ended
April 30, 2017 (unaudited) | | | Year ended October 31 | |
| CLASS C | | | 2016 | | | 2015 | | | 2014 | | | 2013 | | | 2012 | |
Net asset value, beginning of period | | | $10.82 | | | | $11.30 | | | | $11.06 | | | | $11.75 | | | | $9.58 | | | | $9.59 | |
Net investment income | | | 0.06 | | | | 0.14 | | | | 0.08 | 1 | | | 0.27 | 1 | | | 0.14 | 1 | | | 0.16 | 1 |
Net realized and unrealized gains (losses) on investments | | | 1.21 | | | | (0.53 | ) | | | 0.57 | | | | (0.79 | ) | | | 2.22 | | | | (0.07 | ) |
| | | | | | | | | | | | | | | | | | | | | | | | |
Total from investment operations | | | 1.27 | | | | (0.39 | ) | | | 0.65 | | | | (0.52 | ) | | | 2.36 | | | | 0.09 | |
Distributions to shareholders from | | | | | | | | | | | | | | | | | | | | | | | | |
Net investment income | | | (0.23 | ) | | | (0.09 | ) | | | (0.41 | ) | | | (0.17 | ) | | | (0.19 | ) | | | (0.10 | ) |
Net asset value, end of period | | | $11.86 | | | | $10.82 | | | | $11.30 | | | | $11.06 | | | | $11.75 | | | | $9.58 | |
Total return2 | | | 11.92 | % | | | (3.43 | )% | | | 6.03 | % | | | (4.49 | )% | | | 25.05 | % | | | 1.08 | % |
Ratios to average net assets (annualized) | | | | | | | | | | | | | | | | | | | | | | | | |
Gross expenses | | | 2.24 | % | | | 2.22 | % | | | 2.28 | % | | | 2.28 | % | | | 2.31 | % | | | 2.28 | % |
Net expenses | | | 1.89 | % | | | 1.87 | % | | | 1.84 | % | | | 1.84 | % | | | 1.84 | % | | | 1.84 | % |
Net investment income | | | 1.17 | % | | | 1.33 | % | | | 0.72 | % | | | 2.37 | % | | | 1.30 | % | | | 1.72 | % |
Supplemental data | | | | | | | | | | | | | | | | | | | | | | | | |
Portfolio turnover rate | | | 48 | % | | | 65 | % | | | 27 | % | | | 32 | % | | | 38 | % | | | 115 | % |
Net assets, end of period (000s omitted) | | | $26,718 | | | | $27,508 | | | | $29,080 | | | | $16,346 | | | | $16,997 | | | | $16,760 | |
| 1 | Calculated based upon average shares outstanding |
| 2 | Total return calculations do not include any sales charges. Returns for periods of less than one year are not annualized. |
The accompanying notes are an integral part of these financial statements.
| | | | |
| 16 | | Wells Fargo International Equity Fund | | Financial highlights |
(For a share outstanding throughout each period)
| | | | | | | | | | | | | | | | | | | | | | | | |
| | | Six months ended
April 30, 2017 (unaudited) | | | Year ended October 31 | |
| CLASS R | | | 2016 | | | 2015 | | | 2014 | | | 2013 | | | 2012 | |
Net asset value, beginning of period | | | $11.20 | | | | $11.66 | | | | $11.40 | | | | $11.96 | | | | $9.75 | | | | $9.79 | |
Net investment income | | | 0.09 | 1 | | | 0.19 | 1 | | | 0.15 | 1 | | | 0.32 | 1 | | | 0.18 | 1 | | | 0.20 | 1 |
Net realized and unrealized gains (losses) on investments | | | 1.25 | | | | (0.53 | ) | | | 0.57 | | | | (0.79 | ) | | | 2.27 | | | | (0.06 | ) |
| | | | | | | | | | | | | | | | | | | | | | | | |
Total from investment operations | | | 1.34 | | | | (0.34 | ) | | | 0.72 | | | | (0.47 | ) | | | 2.45 | | | | 0.14 | |
Distributions to shareholders from | | | | | | | | | | | | | | | | | | | | | | | | |
Net investment income | | | (0.30 | ) | | | (0.12 | ) | | | (0.46 | ) | | | (0.09 | ) | | | (0.24 | ) | | | (0.18 | ) |
Net asset value, end of period | | | $12.24 | | | | $11.20 | | | | $11.66 | | | | $11.40 | | | | $11.96 | | | | $9.75 | |
Total return2 | | | 12.10 | % | | | (2.94 | )% | | | 6.53 | % | | | (4.00 | )% | | | 25.68 | % | | | 1.58 | % |
Ratios to average net assets (annualized) | | | | | | | | | | | | | | | | | | | | | | | | |
Gross expenses | | | 1.74 | % | | | 1.72 | % | | | 1.78 | % | | | 1.78 | % | | | 1.81 | % | | | 1.78 | % |
Net expenses | | | 1.39 | % | | | 1.37 | % | | | 1.34 | % | | | 1.34 | % | | | 1.34 | % | | | 1.34 | % |
Net investment income | | | 1.63 | % | | | 1.77 | % | | | 1.23 | % | | | 2.71 | % | | | 1.72 | % | | | 2.11 | % |
Supplemental data | | | | | | | | | | | | | | | | | | | | | | | | |
Portfolio turnover rate | | | 48 | % | | | 65 | % | | | 27 | % | | | 32 | % | | | 38 | % | | | 115 | % |
Net assets, end of period (000s omitted) | | | $1,862 | | | | $2,029 | | | | $2,147 | | | | $1,576 | | | | $2,234 | | | | $2,196 | |
| 1 | Calculated based upon average shares outstanding |
| 2 | Returns for periods of less than one year are not annualized. |
The accompanying notes are an integral part of these financial statements.
| | | | | | |
| Financial highlights | | Wells Fargo International Equity Fund | | | 17 | |
(For a share outstanding throughout each period)
| | | | | | | | | | | | |
| | | Six months ended
April 30, 2017 (unaudited) | | | Year ended October 31 | |
| CLASS R6 | | | 2016 | | | 20151 | |
Net asset value, beginning of period | | | $11.06 | | | | $11.49 | | | | $10.89 | |
Net investment income | | | 0.15 | 2 | | | 0.24 | | | | 0.00 | 3 |
Net realized and unrealized gains (losses) on investments | | | 1.20 | | | | (0.52 | ) | | | 0.60 | |
| | | | | | | | | | | | |
Total from investment operations | | | 1.35 | | | | (0.28 | ) | | | 0.60 | |
Distributions to shareholders from | | | | | | | | | | | | |
Net investment income | | | (0.34 | ) | | | (0.15 | ) | | | 0.00 | |
Net asset value, end of period | | | $12.07 | | | | $11.06 | | | | $11.49 | |
Total return4 | | | 12.52 | % | | | (2.46 | )% | | | 5.51 | % |
Ratios to average net assets (annualized) | | | | | | | | | | | | |
Gross expenses | | | 1.06 | % | | | 1.04 | % | | | 1.05 | % |
Net expenses | | | 0.84 | % | | | 0.85 | % | | | 0.88 | % |
Net investment income | | | 2.65 | % | | | 2.31 | % | | | 0.23 | % |
Supplemental data | | | | | | | | | | | | |
Portfolio turnover rate | | | 48 | % | | | 65 | % | | | 27 | % |
Net assets, end of period (000s omitted) | | | $24,657 | | | | $26 | | | | $26 | |
| 1 | For the period from September 30, 2015 (commencement of class operations) to October 31, 2015 |
| 2 | Calculated based upon average shares outstanding |
| 3 | Amount is less than $0.005 per share. |
| 4 | Returns for periods of less than one year are not annualized. |
The accompanying notes are an integral part of these financial statements.
| | | | |
| 18 | | Wells Fargo International Equity Fund | | Financial highlights |
(For a share outstanding throughout each period)
| | | | | | | | | | | | | | | | | | | | | | | | |
| | | Six months ended
April 30, 2017 (unaudited) | | | Year ended October 31 | |
| ADMINISTRATOR CLASS | | | 2016 | | | 2015 | | | 2014 | | | 2013 | | | 2012 | |
Net asset value, beginning of period | | | $10.88 | | | | $11.33 | | | | $11.09 | | | | $11.79 | | | | $9.62 | | | | $9.67 | |
Net investment income | | | 0.10 | 1 | | | 0.22 | | | | 0.17 | 1 | | | 0.37 | 1 | | | 0.22 | | | | 0.25 | |
Net realized and unrealized gains (losses) on investments | | | 1.21 | | | | (0.53 | ) | | | 0.57 | | | | (0.80 | ) | | | 2.22 | | | | (0.09 | ) |
| | | | | | | | | | | | | | | | | | | | | | | | |
Total from investment operations | | | 1.31 | | | | (0.31 | ) | | | 0.74 | | | | (0.43 | ) | | | 2.44 | | | | 0.16 | |
Distributions to shareholders from | | | | | | | | | | | | | | | | | | | | | | | | |
Net investment income | | | (0.32 | ) | | | (0.14 | ) | | | (0.50 | ) | | | (0.27 | ) | | | (0.27 | ) | | | (0.21 | ) |
Net asset value, end of period | | | $11.87 | | | | $10.88 | | | | $11.33 | | | | $11.09 | | | | $11.79 | | | | $9.62 | |
Total return2 | | | 12.26 | % | | | (2.71 | )% | | | 6.89 | % | | | (3.82 | )% | | | 26.00 | % | | | 1.88 | % |
Ratios to average net assets (annualized) | | | | | | | | | | | | | | | | | | | | | | | | |
Gross expenses | | | 1.41 | % | | | 1.38 | % | | | 1.40 | % | | | 1.37 | % | | | 1.37 | % | | | 1.36 | % |
Net expenses | | | 1.14 | % | | | 1.12 | % | | | 1.09 | % | | | 1.09 | % | | | 1.09 | % | | | 1.09 | % |
Net investment income | | | 1.74 | % | | | 1.93 | % | | | 1.44 | % | | | 3.21 | % | | | 2.08 | % | | | 2.52 | % |
Supplemental data | | | | | | | | | | | | | | | | | | | | | | | | |
Portfolio turnover rate | | | 48 | % | | | 65 | % | | | 27 | % | | | 32 | % | | | 38 | % | | | 115 | % |
Net assets, end of period (000s omitted) | | | $19,877 | | | | $36,032 | | | | $52,469 | | | | $12,962 | | | | $3,955 | | | | $3,505 | |
| 1 | Calculated based upon average shares outstanding |
| 2 | Returns for periods of less than one year are not annualized. |
The accompanying notes are an integral part of these financial statements.
| | | | | | |
| Financial highlights | | Wells Fargo International Equity Fund | | | 19 | |
(For a share outstanding throughout each period)
| | | | | | | | | | | | | | | | | | | | | | | | |
| | | Six months ended
April 30, 2017 (unaudited) | | | Year ended October 31 | |
| INSTITUTIONAL CLASS | | | 2016 | | | 2015 | | | 2014 | | | 2013 | | | 2012 | |
Net asset value, beginning of period | | | $11.05 | | | | $11.49 | | | | $11.25 | | | | $11.96 | | | | $9.76 | | | | $9.83 | |
Net investment income | | | 0.13 | 1 | | | 0.23 | | | | 0.19 | 1 | | | 0.37 | 1 | | | 0.24 | 1 | | | 0.37 | |
Net realized and unrealized gains (losses) on investments | | | 1.22 | | | | (0.52 | ) | | | 0.58 | | | | (0.77 | ) | | | 2.26 | | | | (0.19 | ) |
| | | | | | | | | | | | | | | | | | | | | | | | |
Total from investment operations | | | 1.35 | | | | (0.29 | ) | | | 0.77 | | | | (0.40 | ) | | | 2.50 | | | | 0.18 | |
Distributions to shareholders from | | | | | | | | | | | | | | | | | | | | | | | | |
Net investment income | | | (0.36 | ) | | | (0.15 | ) | | | (0.53 | ) | | | (0.31 | ) | | | (0.30 | ) | | | (0.25 | ) |
Net asset value, end of period | | | $12.04 | | | | $11.05 | | | | $11.49 | | | | $11.25 | | | | $11.96 | | | | $9.76 | |
Total return2 | | | 12.50 | % | | | (2.48 | )% | | | 7.07 | % | | | (3.53 | )% | | | 26.31 | % | | | 2.05 | % |
Ratios to average net assets (annualized) | | | | | | | | | | | | | | | | | | | | | | | | |
Gross expenses | | | 1.16 | % | | | 1.14 | % | | | 1.15 | % | | | 1.10 | % | | | 1.13 | % | | | 1.10 | % |
Net expenses | | | 0.89 | % | | | 0.87 | % | | | 0.84 | % | | | 0.84 | % | | | 0.84 | % | | | 0.84 | % |
Net investment income | | | 2.33 | % | | | 2.27 | % | | | 1.67 | % | | | 3.18 | % | | | 2.29 | % | | | 2.67 | % |
Supplemental data | | | | | | | | | | | | | | | | | | | | | | | | |
Portfolio turnover rate | | | 48 | % | | | 65 | % | | | 27 | % | | | 32 | % | | | 38 | % | | | 115 | % |
Net assets, end of period (000s omitted) | | | $235,621 | | | | $182,639 | | | | $192,799 | | | | $63,766 | | | | $82,982 | | | | $138,245 | |
| 1 | Calculated based upon average shares outstanding |
| 2 | Returns for periods of less than one year are not annualized. |
The accompanying notes are an integral part of these financial statements.
| | | | |
| 20 | | Wells Fargo International Equity Fund | | Notes to financial statements (unaudited) |
1. ORGANIZATION
Wells Fargo Funds Trust (the “Trust”), a Delaware statutory trust organized on March 10, 1999, is an open-end management investment company registered under the Investment Company Act of 1940, as amended (the “1940 Act”). As an investment company, the Trust follows the accounting and reporting guidance in Financial Accounting Standards Board (“FASB”) Accounting Standards Codification (“ASC”) Topic 946, Financial Services – Investment Companies. These financial statements report on the Wells Fargo International Equity Fund (the “Fund”) which is a diversified series of the Trust.
2. SIGNIFICANT ACCOUNTING POLICIES
The following significant accounting policies, which are consistently followed in the preparation of the financial statements of the Fund, are in conformity with U.S. generally accepted accounting principles which require management to make estimates and assumptions that affect the reported amounts of assets and liabilities, disclosure of contingent assets and liabilities at the date of the financial statements, and the reported amounts of revenues and expenses during the reporting period. Actual results could differ from those estimates.
Securities valuation
All investments are valued each business day as of the close of regular trading on the New York Stock Exchange (generally 4 p.m. Eastern Time), although the Fund may deviate from this calculation time under unusual or unexpected circumstances.
Equity securities that are listed on a foreign or domestic exchange or market are valued at the official closing price or, if none, the last sales price. If no sale occurs on the principal exchange or market that day, the prior day’s price will be deemed “stale” and a fair value price will be determined in accordance with the Fund’s Valuation Procedures.
The values of securities denominated in foreign currencies are translated into U.S. dollars at rates provided by an independent foreign currency pricing source at a time each business day specified by the Management Valuation Team of Wells Fargo Funds Management, LLC (“Funds Management”).
Many securities markets and exchanges outside the U.S. close prior to the close of the New York Stock Exchange and therefore may not fully reflect trading or events that occur after the close of the principal exchange in which the foreign securities are traded, but before the close of the New York Stock Exchange. If such trading or events are expected to materially affect the value of such securities, then fair value pricing procedures approved by the Board of Trustees of the Fund are applied. These procedures take into account multiple factors including movements in U.S. securities markets after foreign exchanges close. Foreign securities that are fair valued under these procedures are categorized as Level 2 and the application of these procedures may result in transfers between Level 1 and Level 2. Depending on market activity, such fair valuations may be frequent. Such fair value pricing may result in net asset values that are higher or lower than net asset values based on the last reported sales price or latest quoted bid price. On April 30, 2017, such fair value pricing was not used in pricing foreign securities.
Investments in registered open-end investment companies are valued at net asset value. Interests in non-registered investment companies that are redeemable at net asset value are fair valued normally at net asset value.
Investments which are not valued using any of the methods discussed above are valued at their fair value, as determined in good faith by the Board of Trustees. The Board of Trustees has established a Valuation Committee comprised of the Trustees and has delegated to it the authority to take any actions regarding the valuation of portfolio securities that the Valuation Committee deems necessary or appropriate, including determining the fair value of portfolio securities, unless the determination has been delegated to the Management Valuation Team. The Board of Trustees retains the authority to make or ratify any valuation decisions or approve any changes to the Valuation Procedures as it deems appropriate. On a quarterly basis, the Board of Trustees receives reports on any valuation actions taken by the Valuation Committee or the Management Valuation Team which may include items for ratification.
Valuations of fair valued securities are compared to the next actual sales price when available, or other appropriate market values, to assess the continued appropriateness of the fair valuation methodologies used. These securities are fair valued on a day-to-day basis, taking into consideration changes to appropriate market information and any significant changes to the inputs considered in the valuation process until there is a readily available price provided on an exchange or by an independent pricing service. Valuations received from an independent pricing service or independent broker-dealer quotes are periodically validated by comparisons to most recent trades and valuations provided by other independent pricing services in addition to the review of prices by the manager and/or subadviser. Unobservable inputs used in determining fair valuations are identified based on the type of security, taking into consideration factors utilized by market participants in valuing the investment, knowledge about the issuer and the current market environment.
| | | | | | |
| Notes to financial statements (unaudited) | | Wells Fargo International Equity Fund | | | 21 | |
Foreign currency translation
The accounting records of the Fund are maintained in U.S. dollars. The values of other assets and liabilities denominated in foreign currencies are translated into U.S. dollars at rates provided by an independent foreign currency pricing source at a time each business day specified by the Management Valuation Team. Purchases and sales of securities, and income and expenses are converted at the rate of exchange on the respective dates of such transactions. Net realized foreign exchange gains or losses arise from sales of foreign currencies, currency gains or losses realized between the trade and settlement dates on securities transactions, and the difference between the amounts of dividends, interest and foreign withholding taxes recorded and the U.S. dollar equivalent of the amounts actually paid or received. Net unrealized foreign exchange gains and losses arise from changes in the fair value of assets and liabilities other than investments in securities resulting from changes in exchange rates. The changes in net assets arising from changes in exchange rates of securities and the changes in net assets resulting from changes in market prices of securities are not separately presented. Such changes are included in net realized and unrealized gains or losses from investments.
Participation notes
The Fund may invest in participation notes to gain exposure to securities in certain foreign markets. Participation notes are issued by banks or broker-dealers and are designed to offer a return linked to a particular underlying foreign security. Participation notes involve transaction costs, which may be higher than those applicable to the underlying foreign security. The holder of the participation note is entitled to receive from the bank or broker-dealer, an amount equal to the dividend paid by the issuer of the underlying foreign security; however, the holder is not entitled to the same rights (i.e. dividends, voting rights) as an owner of the underlying foreign security. Investments in participation notes involve risks beyond those normally associated with a direct investment in an underlying security. The Fund has no rights against the issuer of the underlying foreign security and participation notes expose the Fund to counterparty risk in the event the counterparty does not perform. There is also no assurance there will be a secondary trading market for the participation note or that the trading price of the participation note will equal the underlying value of the foreign security that it seeks to replicate.
Forward foreign currency contracts
The Fund is subject to foreign currency exchange rate risk in the normal course of pursuing its investment objectives. A forward foreign currency contract is an agreement between two parties to purchase or sell a specific currency for an agreed-upon price at a future date. The Fund enters into forward foreign currency contracts to facilitate transactions in foreign-denominated securities and to attempt to minimize the risk to the Fund from adverse changes in the relationship between currencies. Forward foreign currency contracts are recorded at the forward rate and marked-to-market daily. When the contracts are closed, realized gains and losses arising from such transactions are recorded as realized gains or losses on forward foreign currency contract transactions. The Fund could be exposed to risks if the counterparties to the contracts are unable to meet the terms of their contracts or if the value of the foreign currency changes unfavorably. The Fund’s maximum risk of loss from counterparty credit risk is the unrealized gains on the contracts. This risk may be mitigated if there is a master netting arrangement between the Fund and the counterparty.
Security loans
The Fund may lend its securities from time to time in order to earn additional income in the form of fees or interest on securities received as collateral or the investment of any cash received as collateral. The Fund continues to receive interest or dividends on the securities loaned. The Fund receives collateral in the form of cash or securities with a value at least equal to the value of the securities on loan. The value of the loaned securities is determined at the close of each business day and any additional required collateral is delivered to the Fund on the next business day. In a securities lending transaction, the net asset value of the Fund will be affected by an increase or decrease in the value of the securities loaned and by an increase or decrease in the value of the instrument in which collateral is invested. The amount of securities lending activity undertaken by the Fund fluctuates from time to time. In the event of default or bankruptcy by the borrower, the Fund may be prevented from recovering the loaned securities or gaining access to the collateral or may experience delays or costs in doing so. In addition, the investment of any cash collateral received may lose all or part of its value. The Fund has the right under the lending agreement to recover the securities from the borrower on demand.
The Fund lends its securities through an unaffiliated securities lending agent. Cash collateral received in connection with its securities lending transactions is invested in Securities Lending Cash Investments, LLC (the “Securities Lending Fund”). The Securities Lending Fund is exempt from registration under Section 3(c)(7) of the 1940 Act and is managed by Funds Management and is subadvised by Wells Capital Management Incorporated (“WellsCap”), an affiliate of Funds Management and an indirect wholly owned subsidiary of Wells Fargo & Company (“Wells Fargo”). Funds Management receives an advisory fee starting at 0.05% and declining to 0.01% as the average daily net assets of the Securities Lending
| | | | |
| 22 | | Wells Fargo International Equity Fund | | Notes to financial statements (unaudited) |
Fund increase. All of the fees received by Funds Management are paid to WellsCap for its services as subadviser. The Securities Lending Fund seeks to provide a positive return compared to the daily Fed Funds Open Rate by investing in high-quality, U.S. dollar-denominated short-term money market instruments. Securities Lending Fund investments are valued at the evaluated bid price provided by an independent pricing service. Income earned from investment in the Securities Lending Fund is included in securities lending income on the Statement of Operations.
Security transactions and income recognition
Securities transactions are recorded on a trade date basis. Realized gains or losses are recorded on the basis of identified cost.
Dividend income is recognized on the ex-dividend date, except for certain dividends from foreign securities, which are recorded as soon as the custodian verifies the ex-dividend date. Dividend income from foreign securities is recorded net of foreign taxes withheld where recovery of such taxes is not assured.
Distributions to shareholders
Distributions to shareholders from net investment income and net realized gains, if any, are recorded on the ex-dividend date. Such distributions are determined in accordance with income tax regulations and may differ from U.S. generally accepted accounting principles. Dividend sources are estimated at the time of declaration. The tax character of distributions is determined as of the Fund’s fiscal year end. Therefore, a portion of the Fund’s distributions made prior the Fund’s fiscal year end may be categorized as a tax return of capital.
Federal and other taxes
The Fund intends to continue to qualify as a regulated investment company by distributing substantially all of its investment company taxable income and any net realized capital gains (after reduction for capital loss carryforwards) sufficient to relieve it from all, or substantially all, federal income taxes. Accordingly, no provision for federal income taxes was required.
The Fund’s income and federal excise tax returns and all financial records supporting those returns for the prior three fiscal years are subject to examination by the federal and Delaware revenue authorities. Management has analyzed the Fund’s tax positions taken on federal, state, and foreign tax returns for all open tax years and does not believe that there are any uncertain tax positions that require recognition of a tax liability.
As of October 31, 2016, the Fund had capital loss carryforwards which consist of $22,277,977 in short-term capital losses and $5,430,684 in long-term capital losses.
Class allocations
The separate classes of shares offered by the Fund differ principally in applicable sales charges, distribution, shareholder servicing, and administration fees. Class specific expenses are charged directly to that share class. Investment income, common expenses, and realized and unrealized gains (losses) on investments are allocated daily to each class of shares based on the relative proportion of net assets of each class.
3. FAIR VALUATION MEASUREMENTS
Fair value measurements of investments are determined within a framework that has established a fair value hierarchy based upon the various data inputs utilized in determining the value of the Fund’s investments. The three-level hierarchy gives the highest priority to unadjusted quoted prices in active markets for identical assets or liabilities (Level 1) and the lowest priority to unobservable inputs (Level 3). The Fund’s investments are classified within the fair value hierarchy based on the lowest level of input that is significant to the fair value measurement. The inputs are summarized into three broad levels as follows:
| ∎ | | Level 1 – quoted prices in active markets for identical securities |
| ∎ | | Level 2 – other significant observable inputs (including quoted prices for similar securities, interest rates, prepayment speeds, credit risk, etc.) |
| ∎ | | Level 3 – significant unobservable inputs (including the Fund’s own assumptions in determining the fair value of investments) |
The inputs or methodologies used for valuing investments in securities are not necessarily an indication of the risk associated with investing in those securities.
| | | | | | |
| Notes to financial statements (unaudited) | | Wells Fargo International Equity Fund | | | 23 | |
The following is a summary of the inputs used in valuing the Fund’s assets and liabilities as of April 30, 2017:
| | | | | | | | | | | | | | | | |
| | | Quoted prices
(Level 1) | | | Other significant
observable inputs
(Level 2) | | | Significant
unobservable inputs
(Level 3) | | | Total | |
Assets | | | | | | | | | | | | | | | | |
Investments in: | | | | | | | | | | | | | | | | |
| | | | |
Common stocks | | | | | | | | | | | | | | | | |
Brazil | | $ | 12,543,216 | | | $ | 0 | | | $ | 0 | | | $ | 12,543,216 | |
Canada | | | 8,613,791 | | | | 0 | | | | 0 | | | | 8,613,791 | |
China | | | 26,304,157 | | | | 0 | | | | 0 | | | | 26,304,157 | |
Demark | | | 3,723,322 | | | | 0 | | | | 0 | | | | 3,723,322 | |
France | | | 12,434,121 | | | | 0 | | | | 0 | | | | 12,434,121 | |
Germany | | | 54,143,807 | | | | 0 | | | | 0 | | | | 54,143,807 | |
Hong Kong | | | 8,900,937 | | | | 0 | | | | 0 | | | | 8,900,937 | |
Italy | | | 14,660,381 | | | | 0 | | | | 0 | | | | 14,660,381 | |
Japan | | | 43,618,420 | | | | 0 | | | | 0 | | | | 43,618,420 | |
Malaysia | | | 12,719,585 | | | | 0 | | | | 0 | | | | 12,719,585 | |
Netherlands | | | 22,932,440 | | | | 0 | | | | 0 | | | | 22,932,440 | |
Norway | | | 17,212,841 | | | | 0 | | | | 0 | | | | 17,212,841 | |
Russia | | | 7,847,184 | | | | 0 | | | | 0 | | | | 7,847,184 | |
South Africa | | | 5,543,050 | | | | 0 | | | | 0 | | | | 5,543,050 | |
South Korea | | | 24,747,012 | | | | 0 | | | | 0 | | | | 24,747,012 | |
Switzerland | | | 25,695,825 | | | | 0 | | | | 0 | | | | 25,695,825 | |
United Kingdom | | | 45,143,064 | | | | 0 | | | | 0 | | | | 45,143,064 | |
United States | | | 29,968,777 | | | | 0 | | | | 0 | | | | 29,968,777 | |
| | | | |
Participation notes | | | | | | | | | | | | | | | | |
China | | | 0 | | | | 6,263,797 | | | | 0 | | | | 6,263,797 | |
| | | | |
Short-term investments | | | | | | | | | | | | | | | | |
Investment companies | | | 20,835,637 | | | | 0 | | | | 0 | | | | 20,835,637 | |
Investments measured at net asset value* | | | | | | | | | | | | | | | 15,606,618 | |
| | | 397,587,567 | | | | 6,263,797 | | | | 0 | | | | 419,457,982 | |
Forward foreign currency contracts | | | 0 | | | | 882,110 | | | | 0 | | | | 882,110 | |
Total assets | | $ | 397,587,567 | | | $ | 7,145,907 | | | $ | 0 | | | $ | 420,340,092 | |
Liabilities | | | | | | | | | | | | | | | | |
| | | | |
Forward foreign currency contracts | | | 0 | | | | 1,503,857 | | | | 0 | | | | 1,503,857 | |
Total liabilities | | $ | 0 | | | $ | 1,503,857 | | | $ | 0 | | | $ | 1,503,857 | |
| * | Investments that are measured at fair value using the net asset value per share (or its equivalent) as a practical expedient have not been categorized in the fair value hierarchy. The fair value amount presented in the table is intended to permit reconciliation of the fair value hierarchy to the amounts presented in the Statement of Assets and Liabilities. The Fund’s investment in Securities Lending Cash Investments, LLC valued at $15,606,618 does not have a redemption period notice, can be redeemed daily and does not have any unfunded commitments. |
Forward foreign currency contracts are reported at their unrealized gains (losses) at measurement date, which represents the change in the contract’s value from trade date. All other assets and liabilities are reported at their market value at measurement date.
The Fund recognizes transfers between levels within the fair value hierarchy at the end of the reporting period. At April 30, 2017, the Fund did not have any transfers into/out of Level 1, Level 2, or Level 3.
4. TRANSACTIONS WITH AFFILIATES AND OTHER EXPENSES
Management fee
Funds Management, an indirect wholly owned subsidiary of Wells Fargo, is the manager of the Fund and provides advisory and fund-level administrative services under an investment management agreement. Under the investment management agreement, Funds Management is responsible for, among other services, implementing the investment
| | | | |
| 24 | | Wells Fargo International Equity Fund | | Notes to financial statements (unaudited) |
objectives and strategies of the Fund, supervising the subadviser, providing fund-level administrative services in connection with the Fund’s operations, and providing any other fund-level administrative services reasonably necessary for the operation of the Fund. As compensation for its services under the investment management agreement, Funds Management is entitled to receive an annual management fee starting at 0.85% and declining to 0.68% as the average daily net assets of the Fund increase. Prior to March 1, 2017, Funds Management received a fee at an annual rate which started at 0.90% and declined to 0.73% as the average daily net assets of the Fund increased. For the six months ended April 30, 2017, the management fee was equivalent to an annual rate of 0.88% of the Fund’s average daily net assets.
Funds Management has retained the services of a subadviser to provide daily portfolio management to the Fund. The fee for subadvisory services is borne by Funds Management. WellsCap is the subadviser to the Fund and is entitled to receive a fee from Funds Management at an annual rate starting at 0.45% and declining to 0.40% as the average daily net assets of the Fund increase.
Administration fees
Under a class-level administration agreement, Funds Management provides class-level administrative services to the Fund, which includes paying fees and expenses for services provided by the transfer agent, sub-transfer agents, omnibus account servicers and record-keepers. As compensation for its services under the class-level administration agreement, Funds Management receives an annual fee which is calculated based on the average daily net assets of each class as follows:
| | | | |
| | | Class-level
administration fee | |
Class A, Class B, Class C, Class R | | | 0.21 | % |
Class R6 | | | 0.03 | |
Administrator Class, Institutional Class | | | 0.13 | |
Funds Management has contractually waived and/or reimbursed management and administration fees to the extent necessary to maintain certain net operating expense ratios for the Fund. Waiver of fees and/or reimbursement of expenses by Funds Management were made first from fund level expenses on a proportionate basis and then from class specific expenses. Funds Management has committed through February 28, 2018 to waive fees and/or reimburse expenses to the extent necessary to cap the Fund’s expenses at 1.14% for Class A shares, 1.89% for Class B shares, 1.89% for Class C shares, 1.39% for Class R shares, 0.84% for Class R6 shares, 1.14% for Administrator Class shares, and 0.89% for Institutional Class shares. After this time, the cap may be increased or the commitment to maintain the cap may be terminated only with the approval of the Board of Trustees.
During the six months ended April 30, 2017, State Street Bank and Trust Company, the Fund’s custodian, reimbursed the Fund $222,895 for certain out-of-pocket expenses that were billed to the Fund in error from 1998-2015. This amount is included in dividend income on the Statement of Operations. In addition, Funds Management was also reimbursed $50,184 for waivers/reimbursements it made to the Fund during the period the Fund was erroneously billed.
Distribution fees
The Trust has adopted a distribution plan for Class B, Class C, and Class R shares of the Fund pursuant to Rule 12b-1 under the 1940 Act. Distribution fees are charged to Class B, Class C, and Class R shares and paid to Wells Fargo Funds Distributor, LLC (“Funds Distributor”), the principal underwriter, at an annual rate of 0.75% of the average daily net assets of Class B and Class C shares and 0.25% of the average daily net assets of Class R shares.
In addition, Funds Distributor is entitled to receive the front-end sales charge from the purchase of Class A shares and a contingent deferred sales charge on the redemption of certain Class A shares. Funds Distributor is also entitled to receive the contingent deferred sales charges from redemptions of Class B and Class C shares. For the six months ended April 30, 2017, Funds Distributor received $4,745 from the sale of Class A shares and $89 in contingent deferred sales charges from redemptions of Class C shares.
Shareholder servicing fees
The Trust has entered into contracts with one or more shareholder servicing agents, whereby Class A, Class B, Class C, Class R, and Administrator Class of the Fund are charged a fee at an annual rate of 0.25% of the average daily net assets of each respective class.
A portion of these total shareholder servicing fees were paid to affiliates of Wells Fargo.
| | | | | | |
| Notes to financial statements (unaudited) | | Wells Fargo International Equity Fund | | | 25 | |
5. INVESTMENT PORTFOLIO TRANSACTIONS
Purchases and sales of investments, excluding U.S. government obligations (if any) and short-term securities, for the six months ended April 30, 2017 were $198,726,450 and $173,421,879, respectively.
The Fund may purchase or sell investment securities to other Wells Fargo affiliates pursuant to Rule 17a-7 of the 1940 Act and under procedures adopted by the Board of Trustees. The procedures have been designed to ensure that these interfund transactions, which do not incur broker commissions, are effected at current market prices. Interfund trades are included within the respective purchases and sales amounts shown.
6. DERIVATIVE TRANSACTIONS
During the six months ended April 30, 2017, the Fund entered into forward foreign currency contracts for economic hedging purposes.
At April 30, 2017, the Fund had forward foreign currency contracts outstanding as follows:
Forward foreign currency contracts to buy:
| | | | | | | | | | | | | | | | | | |
| Exchange date | | Counterparty | | Contracts to
receive | | | U.S. value at
April 30, 2017 | | | In exchange
for U.S. $ | | | Unrealized
gains | |
| 5-31-2017 | | Barclays | | | 12,900,000 EUR | | | $ | 14,070,802 | | | $ | 13,703,760 | | | $ | 367,042 | |
| 6-15-2017 | | Goldman Sachs | | | 23,937,000 EUR | | | | 26,130,171 | | | | 25,615,103 | | | | 515,068 | |
Forward foreign currency contracts to sell:
| | | | | | | | | | | | | | | | | | |
| Exchange date | | Counterparty | | Contracts to
deliver | | | U.S. value at
April 30, 2017 | | | In exchange
for U.S. $ | | | Unrealized
losses | |
| 5-31-2017 | | Barclays | | | 20,043,800 EUR | | | $ | 21,862,972 | | | $ | 21,353,021 | | | $ | (509,951 | ) |
| 6-15-2017 | | Goldman Sachs | | | 25,600,000 EUR | | | | 27,945,540 | | | | 27,402,880 | | | | (542,660 | ) |
| 6-22-2017 | | Morgan Stanley | | | 5,716,000 GBP | | | | 7,413,922 | | | | 7,085,411 | | | | (328,511 | ) |
| 7-13-2017 | | Credit Suisse | | | 4,400,000 EUR | | | | 4,810,376 | | | | 4,687,641 | | | | (122,735 | ) |
The Fund had average contract amounts of $12,486,593 and $61,734,383 in forward foreign currency contracts to buy and forward foreign currency contracts to sell, respectively, during the six months ended April 30, 2017. As of April 30, 2017, the Fund had segregated $270,000 as cash collateral for open forward foreign currency contracts.
The fair value, realized gains or losses and change in unrealized gains or losses, if any, on derivative instruments are reflected in the corresponding financial statement captions.
For certain types of derivative transactions, the Fund has entered into International Swaps and Derivatives Association, Inc. master agreements (“ISDA Master Agreements”) or similar agreements with approved counterparties. The ISDA Master Agreements or similar agreements may have requirements to deliver/deposit securities or cash to/with an exchange or broker-dealer as collateral and allows the Fund to offset, with each counterparty, certain derivative financial instrument’s assets and/or liabilities with collateral held or pledged. Collateral requirements differ by type of derivative. Collateral or margin requirements are set by the broker or exchange clearing house for exchange traded derivatives while collateral terms are contract specific for over-the-counter traded derivatives. Cash collateral that has been pledged to cover obligations of the Fund under ISDA Master Agreements or similar agreements, if any, are reported separately in the Statement of Assets and Liabilities. Securities pledged as collateral, if any, are noted in the Portfolio of Investments. With respect to balance sheet offsetting, absent an event of default by the counterparty or a termination of the agreement, the reported amounts of financial assets and financial liabilities in the Statement of Assets and Liabilities are not offset across transactions between the Fund and the applicable counterparty. A reconciliation of the gross amounts on the Statement of Assets and Liabilities to the net amounts by derivative type, including any collateral exposure, is as follows:
| | | | | | | | | | | | | | | | |
| Derivative type | | Counterparty | | Gross amounts of assets in the Statement of
Assets and
Liabilities | | Amounts
subject to
netting
agreements | | | Collateral
received | | | Net amount
of assets | |
Forward foreign currency contracts | | Barclays | | $367,042* | | $ | (367,042 | ) | | $ | 0 | | | $ | 0 | |
| | Goldman Sachs | | 515,068* | | | (515,068 | ) | | | 0 | | | | 0 | |
| * | Amount represents net unrealized gains. |
| | | | |
| 26 | | Wells Fargo International Equity Fund | | Notes to financial statements (unaudited) |
| | | | | | | | | | | | | | | | | | |
| Derivative type | | Counterparty | | Gross amounts of liabilities in the Statement of
Assets and
Liabilities | | | Amounts
subject to
netting
agreements | | | Collateral
pledged1 | | | Net amount
of liabilities | |
Forward foreign currency contracts | | Barclays | | $ | 509,951 | ** | | $ | (367,042 | ) | | $ | 0 | | | $ | 142,909 | |
| | Credit Suisse | | | 122,735 | ** | | | 0 | | | | 0 | | | | 122,735 | |
| | Goldman Sachs | | | 542,660 | ** | | | (515,068 | ) | | | 0 | | | | 27,592 | |
| | Morgan Stanley | | | 328,511 | ** | | | 0 | | | | (270,000 | ) | | | 58,511 | |
| 1 | Collateral pledged within this table is limited to the collateral for the net transaction with the counterparty. |
| ** | Amount represents net unrealized loss. |
7. BANK BORROWINGS
The Trust (excluding the money market funds and certain other funds) and Wells Fargo Variable Trust are parties to a $250,000,000 revolving credit agreement whereby the Fund is permitted to use bank borrowings for temporary or emergency purposes, such as to fund shareholder redemption requests. Interest under the credit agreement is charged to the Fund based on a borrowing rate equal to the higher of the Federal Funds rate in effect on that day plus 1.25% or the overnight LIBOR rate in effect on that day plus 1.25%. In addition, an annual commitment fee equal to 0.25% of the unused balance is allocated to each participating fund.
For the six months ended April 30, 2017, there were no borrowings by the Fund under the agreement.
8. CONCENTRATION RISK
Concentration risks result from exposure to a limited number of sectors. A fund that invests a substantial portion of its assets in any sector may be more affected by changes in that sector than would be a fund whose investments are not heavily weighted in any sector.
9. INDEMNIFICATION
Under the Trust’s organizational documents, the officers and Trustees have been granted certain indemnification rights against certain liabilities that may arise out of performance of their duties to the Trust. Additionally, in the normal course of business, the Trust may enter into contracts with service providers that contain a variety of indemnification clauses. The Trust’s maximum exposure under these arrangements is dependent on future claims that may be made against the Fund and, therefore, cannot be estimated.
10. NEW ACCOUNTING PRONOUNCEMENT
In December 2016, FASB issued Accounting Standards Update (“ASU”) No. 2016-19, Technical Corrections and Improvements. ASU 2016-19 includes an amendment to FASB ASC Topic 820, Fair Value Measurement which clarifies the difference between a valuation approach and a valuation technique. The amendment also requires an entity to disclose when there has been a change in either or both a valuation approach and/or a valuation technique. The disclosure requirements are effective for fiscal years and interim periods within those fiscal years beginning after December 15, 2016. Management is currently evaluating the potential impact of this new guidance to the financial statements.
11. REGULATORY CHANGES
In October 2016, the Securities and Exchange Commission (“SEC”) adopted new rules and forms and amended existing rules and forms (together, “final rules”) intended to modernize and enhance the reporting and disclosure of information by registered investment companies and to enhance liquidity risk management by open-end mutual funds and exchange-traded funds. The final rules will enhance the quality of information available to investors and will allow the SEC to more effectively collect and use data reported by funds. In part, the final rules amend Regulation S-X and require standardized, enhanced disclosure about derivatives in the Fund’s financial statements, as well as other amendments. The compliance date for the amendments to Regulation S-X is August 1, 2017 while the compliance date for the new form types is June 1, 2018 and the compliance date for the liquidity risk management program requirements is December 1, 2018. Management is currently assessing the potential impact of these enhancements and their impact on the financial statement disclosures and reporting requirements.
| | | | | | |
| Other information (unaudited) | | Wells Fargo International Equity Fund | | | 27 | |
TAX INFORMATION
Pursuant to Section 853 of the Internal Revenue Code, the following amounts have been designated as foreign taxes paid for the fiscal year ended October 31, 2016. These amounts may be less than the actual foreign taxes paid for financial statement purposes. Foreign taxes paid or withheld should be included in taxable income with an offsetting deduction from gross income or as a credit for taxes paid to foreign governments. None of the income was derived from ineligible foreign sources as defined under Section 901(j) of the Internal Revenue Code.
| | | | |
Creditable foreign taxes paid | | Per share amount | | Foreign income as % of
ordinary income
distributions |
| $783,215 | | $0.0232 | | 79.72% |
PROXY VOTING INFORMATION
A description of the policies and procedures that the Fund uses to determine how to vote proxies relating to portfolio securities is available, upon request, by calling 1-800-222-8222, visiting our website at wellsfargofunds.com, or visiting the SEC website at sec.gov. Information regarding how the Fund voted proxies relating to portfolio securities during the most recent 12-month period ended June 30 is available on the Fund’s website at wellsfargofunds.com or by visiting the SEC website at sec.gov.
PORTFOLIO HOLDINGS INFORMATION
The complete portfolio holdings for the Fund are publicly available monthly on the Fund’s website (wellsfargofunds.com), on a one-month delayed basis. In addition, top ten holdings information (excluding derivative positions) for the Fund is publicly available on the Fund’s website on a monthly, seven-day or more delayed basis. The Fund files its complete schedule of portfolio holdings with the SEC for the first and third quarters of each fiscal year on Form N-Q, which is available by visiting the SEC website at sec.gov. In addition, the Fund’s Form N-Q may be reviewed and copied at the SEC’s Public Reference Room in Washington, DC, and at regional offices in New York City, at 233 Broadway, and in Chicago, at 175 West Jackson Boulevard, Suite 900. Information about the Public Reference Room may be obtained by calling 1-800-SEC-0330.
| | | | |
| 28 | | Wells Fargo International Equity Fund | | Other information (unaudited) |
BOARD OF TRUSTEES AND OFFICERS
Each of the Trustees and Officers1 listed in the table below acts in identical capacities for each fund in the Wells Fargo family of funds, which consists of 138 mutual funds comprising the Wells Fargo Funds Trust, Wells Fargo Variable Trust, Wells Fargo Master Trust and four closed-end funds (collectively the “Fund Complex”). This table should be read in conjunction with the Prospectus and the Statement of Additional Information2. The mailing address of each Trustee and Officer is 525 Market Street, 12th Floor, San Francisco, CA 94105. Each Trustee and Officer serves an indefinite term, however, each Trustee serves such term until reaching the mandatory retirement age established by the Trustees.
Independent Trustees
| | | | | | |
Name and
year of birth | | Position held and
length of service* | | Principal occupations during past five years or longer | | Current other
public company or
investment company
directorships |
| William R. Ebsworth (Born 1957) | | Trustee, since 2015 | | Retired. From 1984 to 2013, equities analyst, portfolio manager, research director and chief investment officer at Fidelity Management and Research Company in Boston, Tokyo, and Hong Kong and retired in 2013 as Chief Investment Officer of Fidelity Strategic Advisers, Inc. where he led a team of investment professionals managing client assets. Prior thereto, Board member of Hong Kong Securities Clearing Co., Hong Kong Options Clearing Corp., the Thailand International Fund, Ltd., Fidelity Investments Life Insurance Company, and Empire Fidelity Investments Life Insurance Company. Board member of the Forté Foundation (non-profit organization) and the Vincent Memorial Hospital Endowment (non-profit organization), where he serves on the Investment Committee and as a Chair of the Audit Committee. Mr. Ebsworth is a CFA® charterholder. | | Asset Allocation Trust |
| Jane A. Freeman (Born 1953) | | Trustee, since 2015 | | Retired. From 2012 to 2014 and 1999 to 2008, Chief Financial Officer of Scientific Learning Corporation. From 2008 to 2012, Ms. Freeman provided consulting services related to strategic business projects. Prior to 1999, Portfolio Manager at Rockefeller & Co. and Scudder, Stevens & Clark. Board member of the Harding Loevner Funds from 1996 to 2014, serving as both Lead Independent Director and chair of the Audit Committee. Board member of the Russell Exchange Traded Funds Trust from 2011 to 2012 and the chair of the Audit Committee. Ms. Freeman is a Board Member of Ruth Bancroft Garden (non-profit organization) and an inactive chartered financial analyst. | | Asset Allocation Trust |
| Peter G. Gordon** (Born 1942) | | Trustee, since 1998; Chairman, since 2005 | | Co-Founder, Retired Chairman, President and CEO of Crystal Geyser Water Company. Trustee Emeritus, Colby College. | | Asset Allocation Trust |
| Isaiah Harris, Jr. (Born 1952) | | Trustee, since 2009 | | Retired. Chairman of the Board of CIGNA Corporation since 2009, and Director since 2005. From 2003 to 2011, Director of Deluxe Corporation. Prior thereto, President and CEO of BellSouth Advertising and Publishing Corp. from 2005 to 2007, President and CEO of BellSouth Enterprises from 2004 to 2005 and President of BellSouth Consumer Services from 2000 to 2003. Emeritus member of the Iowa State University Foundation Board of Governors. Emeritus Member of the Advisory Board of Iowa State University School of Business. Advisory Board Member, Palm Harbor Academy (charter school). Advisory Board Member, Child Evangelism Fellowship (non-profit). Mr. Harris is a certified public accountant (inactive status). | | CIGNA Corporation; Asset Allocation Trust |
| Judith M. Johnson (Born 1949) | | Trustee, since 2008; Audit Committee Chairman, since 2008 | | Retired. Prior thereto, Chief Executive Officer and Chief Investment Officer of Minneapolis Employees Retirement Fund from 1996 to 2008. Ms. Johnson is an attorney, certified public accountant and a certified managerial accountant. | | Asset Allocation Trust |
| David F. Larcker (Born 1950) | | Trustee, since 2009 | | James Irvin Miller Professor of Accounting at the Graduate School of Business, Stanford University, Director of the Corporate Governance Research Initiative and Senior Faculty of The Rock Center for Corporate Governance since 2006. From 2005 to 2008, Professor of Accounting at the Graduate School of Business, Stanford University. Prior thereto, Ernst & Young Professor of Accounting at The Wharton School, University of Pennsylvania from 1985 to 2005. | | Asset Allocation Trust |
| | | | | | |
| Other information (unaudited) | | Wells Fargo International Equity Fund | | | 29 | |
| | | | | | |
Name and
year of birth | | Position held and
length of service* | | Principal occupations during past five years or longer | | Current other
public company or
investment company
directorships |
| Olivia S. Mitchell (Born 1953) | | Trustee, since 2006 | | International Foundation of Employee Benefit Plans Professor, Wharton School of the University of Pennsylvania since 1993. Director of Wharton’s Pension Research Council and Boettner Center on Pensions & Retirement Research, and Research Associate at the National Bureau of Economic Research. Previously, Cornell University Professor from 1978 to 1993. | | Asset Allocation Trust |
| Timothy J. Penny (Born 1951) | | Trustee, since 1996; Vice Chairman, since 2017 | | President and Chief Executive Officer of Southern Minnesota Initiative Foundation, a non-profit organization, since 2007 and Senior Fellow at the Humphrey Institute Policy Forum at the University of Minnesota since 1995. Member of the Board of Trustees of NorthStar Education Finance, Inc., a non-profit organization, since 2007. | | Asset Allocation Trust |
| Michael S. Scofield (Born 1943) | | Trustee, since 2010 | | Served on the Investment Company Institute’s Board of Governors and Executive Committee from 2008-2011 as well the Governing Council of the Independent Directors Council from 2006-2011 and the Independent Directors Council Executive Committee from 2008-2011. Chairman of the IDC from 2008-2010. Institutional Investor (Fund Directions) Trustee of Year in 2007. Trustee of the Evergreen Funds complex (and its predecessors) from 1984 to 2010. Chairman of the Evergreen Funds from 2000-2010. Former Trustee of the Mentor Funds. Retired Attorney, Law Offices of Michael S. Scofield. | | Asset Allocation Trust |
| * | Length of service dates reflect the Trustee’s commencement of service with the Trust’s predecessor entities, where applicable. |
| ** | Peter Gordon is expected to retire on December 31, 2017. |
Officers
| | | | | | |
Name and
year of birth | | Position held and length of service | | Principal occupations during past five years or longer | | |
Andrew Owen
(Born 1960) | | President, since 2017 | | Executive Vice President of Wells Fargo & Company and Head of Affiliated Managers, Wells Fargo Asset Management, since 2014. In addition, Mr. Owen is currently President, Chief Executive Officer and Director of Wells Fargo Funds Management, LLC since 2017. Prior thereto, Executive Vice President responsible for marketing, investments and product development for Wells Fargo Funds Management, LLC, from 2009 to 2014. | | |
| Jeremy DePalma1 (Born 1974) | | Treasurer, since 2012 | | Senior Vice President of Wells Fargo Funds Management, LLC since 2009. Senior Vice President of Evergreen Investment Management Company, LLC from 2008 to 2010 and head of the Fund Reporting and Control Team within Fund Administration from 2005 to 2010. | | |
| C. David Messman (Born 1960) | | Secretary, since 2000; Chief Legal Officer, since 2003 | | Senior Vice President and Secretary of Wells Fargo Funds Management, LLC since 2001. Assistant General Counsel of Wells Fargo Bank, N.A. since 2013 and Vice President and Managing Counsel of Wells Fargo Bank, N.A. from 1996 to 2013. | | |
| Michael Whitaker (Born 1967) | | Chief Compliance Officer, since 2016 | | Senior Vice President and Chief Compliance Officer since 2016. Senior Vice President and Chief Compliance Officer for Fidelity Investments from 2007 to 2016. | | |
| David Berardi (Born 1975) | | Assistant Treasurer, since 2009 | | Vice President of Wells Fargo Funds Management, LLC since 2009. Vice President of Evergreen Investment Management Company, LLC from 2008 to 2010. Manager of Fund Reporting and Control for Evergreen Investment Management Company, LLC from 2004 to 2010. | | |
| 1 | Jeremy DePalma acts as Treasurer of 69 funds and Assistant Treasurer of 69 funds in the Fund Complex. |
| 2 | The Statement of Additional Information includes additional information about the Trustees and is available, without charge, upon request, by calling 1-800-222-8222 or by visiting the website at wellsfargofunds.com. |
| | | | |
| 30 | | Wells Fargo International Equity Fund | | List of abbreviations |
The following is a list of common abbreviations for terms and entities that may have appeared in this report.
| ACA | — ACA Financial Guaranty Corporation |
| ADR | — American depositary receipt |
| ADS | — American depositary shares |
| AGC | — Assured Guaranty Corporation |
| AGM | — Assured Guaranty Municipal |
| Ambac | — Ambac Financial Group Incorporated |
| AMT | — Alternative minimum tax |
| BAN | — Bond anticipation notes |
| BHAC | — Berkshire Hathaway Assurance Corporation |
| CAB | — Capital appreciation bond |
| CCAB | — Convertible capital appreciation bond |
| CDA | — Community Development Authority |
| CDO | — Collateralized debt obligation |
| DRIVER | — Derivative inverse tax-exempt receipts |
| DW&P | — Department of Water & Power |
| DWR | — Department of Water Resources |
| ECFA | — Educational & Cultural Facilities Authority |
| EDA | — Economic Development Authority |
| EDFA | — Economic Development Finance Authority |
| ETF | — Exchange-traded fund |
| FDIC | — Federal Deposit Insurance Corporation |
| FFCB | — Federal Farm Credit Banks |
| FGIC | — Financial Guaranty Insurance Corporation |
| FHA | — Federal Housing Administration |
| FHLB | — Federal Home Loan Bank |
| FHLMC | — Federal Home Loan Mortgage Corporation |
| FICO | — The Financing Corporation |
| FNMA | — Federal National Mortgage Association |
| GDR | — Global depositary receipt |
| GNMA | — Government National Mortgage Association |
| HCFR | — Healthcare facilities revenue |
| HEFA | — Health & Educational Facilities Authority |
| HEFAR | — Higher education facilities authority revenue |
| HFA | — Housing Finance Authority |
| HFFA | — Health Facilities Financing Authority |
| HUD | — Department of Housing and Urban Development |
| IDA | — Industrial Development Authority |
| IDAG | — Industrial Development Agency |
| KRW | — Republic of Korea won |
| LIBOR | — London Interbank Offered Rate |
| LIFER | — Long Inverse Floating Exempt Receipts |
| LLC | — Limited liability company |
| LLLP | — Limited liability limited partnership |
| LLP | — Limited liability partnership |
| MBIA | — Municipal Bond Insurance Association |
| MFHR | — Multifamily housing revenue |
| MSTR | — Municipal securities trust receipts |
| MUD | — Municipal Utility District |
| National | — National Public Finance Guarantee Corporation |
| PCFA | — Pollution Control Financing Authority |
| PCL | — Public Company Limited |
| PCR | — Pollution control revenue |
| PFA | — Public Finance Authority |
| PFFA | — Public Facilities Financing Authority |
| PFOTER | — Puttable floating option tax-exempt receipts |
| plc | — Public limited company |
| PUTTER | — Puttable tax-exempt receipts |
| R&D | — Research & development |
| Radian | — Radian Asset Assurance |
| RAN | — Revenue anticipation notes |
| RDA | — Redevelopment Authority |
| RDFA | — Redevelopment Finance Authority |
| REIT | — Real estate investment trust |
| ROC | — Reset option certificates |
| SAVRS | — Select auction variable rate securities |
| SBA | — Small Business Authority |
| SDR | — Swedish depositary receipt |
| SFHR | — Single-family housing revenue |
| SFMR | — Single-family mortgage revenue |
| SPA | — Standby purchase agreement |
| SPDR | — Standard & Poor’s Depositary Receipts |
| SPEAR | — Short Puttable Exempt Adjustable Receipts |
| STRIPS | — Separate trading of registered interest and |
| TAN | — Tax anticipation notes |
| TIPS | — Treasury inflation-protected securities |
| TRAN | — Tax revenue anticipation notes |
| TTFA | — Transportation Trust Fund Authority |
| TVA | — Tennessee Valley Authority |
This page is intentionally left blank.
This page is intentionally left blank.

For more information
More information about Wells Fargo Funds is available free upon request. To obtain literature, please write, email, visit the Fund’s website, or call:
Wells Fargo Funds
P.O. Box 8266
Boston, MA 02266-8266
Email: fundservice@wellsfargo.com
Website: wellsfargofunds.com
Individual investors: 1-800-222-8222
Retail investment professionals: 1-888-877-9275
Institutional investment professionals:
1-866-765-0778
This report and the financial statements contained herein are submitted for the general information of the shareholders of the Fund. If this report is used for promotional purposes, distribution of the report must be accompanied or preceded by a current prospectus. Before investing, please consider the investment objectives, risks, charges, and expenses of the investment. For a current prospectus and, if available, a summary prospectus, containing this information, call 1-800-222-8222 or visit the Fund’s website at wellsfargofunds.com. Read the prospectus carefully before you invest or send money.
Wells Fargo Asset Management (WFAM) is a trade name used by the asset management businesses of Wells Fargo & Company. Wells Fargo Funds Management, LLC, a wholly owned subsidiary of Wells Fargo & Company, provides investment advisory and administrative services for Wells Fargo Funds. Other affiliates of Wells Fargo & Company provide subadvisory and other services for the funds. The funds are distributed by Wells Fargo Funds Distributor, LLC, Member FINRA, an affiliate of Wells Fargo & Company. Neither Wells Fargo Funds Management nor Wells Fargo Funds Distributor has Fund customer accounts/assets, and neither provides investment advice/recommendations or acts as an investment advice fiduciary to any investor.
NOT FDIC INSURED ◾ NO BANK GUARANTEE ◾ MAY LOSE VALUE
© 2017 Wells Fargo Funds Management, LLC. All rights reserved.
| | |
 | | 303217 06-17 SA240/SAR240 04-17 |
Semi-Annual Report
April 30, 2017

Wells Fargo Intrinsic World Equity Fund


Reduce clutter. Save trees.
Sign up for electronic delivery of prospectuses and shareholder reports at wellsfargo.com/advantagedelivery
Contents
The views expressed and any forward-looking statements are as of April 30, 2017, unless otherwise noted, and are those of the Fund managers and/or Wells Fargo Funds Management, LLC. Discussions of individual securities, or the markets generally, or any Wells Fargo Fund are not intended as individual recommendations. Future events or results may vary significantly from those expressed in any forward-looking statements. The views expressed are subject to change at any time in response to changing circumstances in the market. Wells Fargo Funds Management, LLC and the Fund disclaim any obligation to publicly update or revise any views expressed or forward-looking statements.
NOT FDIC INSURED ◾ NO BANK GUARANTEE ◾ MAY LOSE VALUE
| | | | |
| 2 | | Wells Fargo Intrinsic World Equity Fund | | Letter to shareholders (unaudited) |

Andrew Owen
President
Wells Fargo Funds
Despite heightened market volatility at times, in general, global stocks delivered double-digit returns while bond markets were hurt by a rise in interest rates during the latter part of 2016.
Dear Shareholder:
As the new president of Wells Fargo Funds, now that Karla Rabusch is retiring from that position after nearly 14 years, I am pleased to offer you this semi-annual report for the Wells Fargo Intrinsic World Equity Fund for the six-month period that ended April 30, 2017. Despite heightened market volatility at times, in general, global stocks delivered double-digit returns while bond markets were hurt by a rise in interest rates during the latter part of 2016. U.S. and international stocks returned 13.31% and 10.37% for the six-month period, respectively, as measured by the S&P 500 Index1 and the MSCI ACWI ex USA Index (Net)2; within fixed income, the Bloomberg Barclays U.S. Aggregate Bond Index3 returned -0.67%.
During the last two months of 2016, prospects for faster growth and higher interest rates in the U.S. influenced markets.
Following Donald Trump’s election as president in early November, U.S. stocks began to rally. Investors appeared optimistic that the new administration would usher in a series of progrowth policies, and supportive economic news helped the rally carry through the end of 2016. The buoyant environment sent interest rates higher as well. At its mid-December meeting, Fed officials raised their short-term target interest rate for the first time in a year by a quarter percentage point to between 0.50% and 0.75%. Outside of the U.S., the prospects for faster U.S. growth appeared to trigger some acceleration in Europe. The improvement may be partly attributable to expectations for further strengthening of the U.S. dollar, which in turn could improve demand for European goods in the U.S. due to weakening of the euro relative to the dollar. Rising inflation across the eurozone and Japan caused an upward shift in yield curves in those areas, although developed-country bond yields remained significantly lower than U.S. Treasury yields.
Globally, stocks delivered positive results and economies showed improvement in the first four months of 2017.
Stocks rallied globally, supported by signs of improvement in the U.S. and global economies. In the U.S., hiring remained strong and business and consumer sentiment improved. Meanwhile, inflation inched up. In March, Fed officials raised their short-term target interest rate by a quarter percentage point to between 0.75% and 1.00%. With the Fed’s target-rate increase, short-term bond yields rose. Longer-term Treasury yields were little changed, however, leading to positive performance. Investment-grade corporate bonds and high-yield bonds benefited from strong demand. Municipal bond returns were also positive during the first four months of 2017, helped by strong demand and constrained new-issue supply. Outside the U.S., stocks in emerging markets benefited from both global economic growth and recent weakening in the U.S. dollar. European stocks also advanced as political risk declined. In the first round of the French presidential elections, Emmanuel Macron, a pro-EU candidate, garnered the most votes. Non-U.S. bonds also benefited from a decline in perceived risk, with credit spreads continuing to narrow.
| 1 | The S&P 500 Index consists of 500 stocks chosen for market size, liquidity, and industry group representation. It is a market-value-weighted index with each stock’s weight in the index proportionate to its market value. You cannot invest directly in an index. |
| 2 | The Morgan Stanley Capital International (MSCI) All Country World Index (ACWI) ex USA Index (Net) is a free-float-adjusted market-capitalization-weighted index that is designed to measure the equity market performance of developed markets, excluding the United States and Canada. Source: MSCI. MSCI makes no express or implied warranties or representations and shall have no liability whatsoever with respect to any MSCI data contained herein. The MSCI data may not be further redistributed or used as a basis for other indexes or any securities or financial products. This report is not approved, reviewed, or produced by MSCI. You cannot invest directly in an index. |
| 3 | The Bloomberg Barclays U.S. Aggregate Bond Index (formerly known as Barclays U.S. Aggregate Bond Index) is a broad-based benchmark that measures the investment-grade, U.S. dollar–denominated, fixed-rate taxable bond market, including Treasuries, government-related and corporate securities, mortgage-backed securities (agency fixed-rate and hybrid adjustable-rate mortgage pass-throughs), asset-backed securities, and commercial mortgage-backed securities. You cannot invest directly in an index. |
| | | | | | |
| Letter to shareholders (unaudited) | | Wells Fargo Intrinsic World Equity Fund | | | 3 | |
Don’t let short-term uncertainty derail long-term investment goals.
Periods of uncertainty can present challenges, but experience has taught us that maintaining long-term investment goals can be an effective way to plan for the future. To help you create a sound strategy based on your personal goals and risk tolerance, Wells Fargo Funds offers more than 100 mutual funds spanning a wide range of asset classes and investment styles. Although diversification cannot guarantee an investment profit or prevent losses, we believe it can be an effective way to manage investment risk and potentially smooth out overall portfolio performance. We encourage investors to know their investments and to understand that appropriate levels of risk-taking may unlock opportunities.
Thank you for choosing to invest in Wells Fargo Funds. We appreciate your confidence in us and remain committed to helping you meet your financial needs.
Sincerely,

Andrew Owen
President
Wells Fargo Funds
Although diversification cannot guarantee an investment profit or prevent losses, we believe it can be an effective way to manage investment risk and potentially smooth out overall portfolio performance.
For further information about your Fund, contact your investment professional, visit our website at wellsfargofunds.com, or call us directly at 1-800-222-8222. We are available 24 hours a day, 7 days a week.
| | | | |
| 4 | | Wells Fargo Intrinsic World Equity Fund | | Performance highlights (unaudited) |
Investment objective
The Fund seeks long-term capital appreciation.
Manager
Wells Fargo Funds Management, LLC
Subadviser
Wells Capital Management Incorporated
Portfolio managers
Amit Kumar*
Jean-Baptiste Nadal, CFA®
Jeffrey Peck
Jen Robertson, CFA®*
Average annual total returns (%) as of April 30, 20171
| | | | | | | | | | | | | | | | | | | | | | | | | | | | | | | | | | |
| | | | | Including sales charge | | | Excluding sales charge | | | Expense ratios2 (%) | |
| | | Inception date | | 1 year | | | 5 year | | | 10 year | | | 1 year | | | 5 year | | | 10 year | | | Gross | | | Net3 | |
| Class A (EWEAX) | | 4-30-1996 | | | 9.68 | | | | 7.18 | | | | 3.87 | | | | 16.36 | | | | 8.46 | | | | 4.49 | | | | 1.46 | | | | 1.35 | |
| Class C (EWECX) | | 5-18-2007 | | | 14.44 | | | | 7.64 | | | | 3.71 | | | | 15.44 | | | | 7.64 | | | | 3.71 | | | | 2.21 | | | | 2.10 | |
| Administrator Class (EWEIX) | | 5-18-2007 | | | – | | | | – | | | | – | | | | 16.43 | | | | 8.69 | | | | 4.72 | | | | 1.38 | | | | 1.25 | |
| Institutional Class (EWENX) | | 7-30-2010 | | | – | | | | – | | | | – | | | | 16.82 | | | | 8.93 | | | | 4.87 | | | | 1.13 | | | | 0.95 | |
| MSCI World Index (Net)4 | | – | | | – | | | | – | | | | – | | | | 14.65 | | | | 9.94 | | | | 3.92 | | | | – | | | | – | |
Figures quoted represent past performance, which is no guarantee of future results, and do not reflect taxes that a shareholder may pay on fund distributions or the redemption of fund shares. Investment return and principal value of an investment will fluctuate so that an investor’s shares, when redeemed, may be worth more or less than their original cost. Performance shown without sales charges would be lower if sales charges were reflected. Current performance may be lower or higher than the performance data quoted, which assumes the reinvestment of dividends and capital gains. Current month-end performance is available on the Fund’s website, wellsfargofunds.com.
Index returns do not include transaction costs associated with buying and selling securities, any mutual fund fees or expenses, or any taxes. It is not possible to invest directly in an index.
For Class A shares, the maximum front-end sales charge is 5.75%. For Class C shares, the maximum contingent deferred sales charge is 1.00%. Performance including a contingent deferred sales charge assumes the sales charge for the corresponding time period. Administrator Class and Institutional Class shares are sold without a front-end sales charge or contingent deferred sales charge.
Stock values fluctuate in response to the activities of individual companies and general market and economic conditions. Foreign investments are especially volatile and can rise or fall dramatically due to differences in the political and economic conditions of the host country. These risks are generally intensified in emerging markets. The use of derivatives may reduce returns and/or increase volatility. Certain investment strategies tend to increase the total risk of an investment (relative to the broader market). The Fund is exposed to focused portfolio risk, geographic risk, and smaller-company securities risk. Consult the Fund’s prospectus for additional information on these and other risks.
Please see footnotes on page 5.
| | | | | | |
| Performance highlights (unaudited) | | Wells Fargo Intrinsic World Equity Fund | | | 5 | |
| | | | |
| Ten largest holdings (%) as of April 30, 20175 | |
Societe Generale SA | | | 2.69 | |
Capgemini SA | | | 2.61 | |
AIA Group Limited | | | 2.59 | |
Cigna Corporation | | | 2.55 | |
Microsoft Corporation | | | 2.46 | |
Alphabet Incorporated Class C | | | 2.43 | |
UBS Group AG | | | 2.39 | |
EOG Resources Incorporated | | | 2.38 | |
Air Liquide SA | | | 2.38 | |
Visa Incorporated Class A | | | 2.37 | |
|
| Sector distribution as of April 30, 20176 |
|
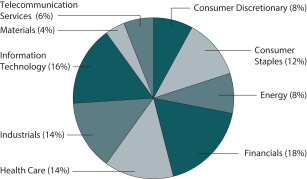
|
|
| Country allocation as of April 30, 20176 |
|
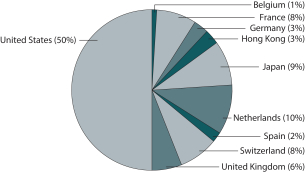 |
| * | Mr. Kumar and Ms. Robertson became portfolio managers of the Fund on June 6, 2017. |
| 1 | Historical performance shown for Class C shares prior to their inception reflects the performance of Class A shares, and has been adjusted to reflect the higher expenses applicable to Class C shares. Historical performance shown for Administrator Class shares prior to their inception reflects the performance of Class A shares, and includes the higher expenses applicable to Class A shares. If these expenses had not been included, returns for Administrator Class shares would be higher. Historical performance shown for Institutional Class shares prior to their inception reflects the performance of Administrator Class shares, and includes the higher expenses applicable to Administrator Class shares. If these expenses had not been included, returns for Institutional Class shares would be higher. Historical performance shown for all classes of the Fund prior to July 19, 2010, is based on the performance of the Fund’s predecessor, Evergreen Intrinsic World Equity Fund. |
| 2 | Reflects the expense ratios as stated in the most recent prospectuses. The expense ratios shown are subject to change and may differ from the annualized expense ratios shown in the financial highlights of this report. |
| 3 | The manager has contractually committed through February 28, 2018 to waive fees and/or reimburse expenses to the extent necessary to cap the Fund’s Total Annual Operating Expenses After Fee Waiver at the amounts shown. After this time, the cap may be increased or the commitment to maintain the cap may be terminated only with the approval of the Board of Trustees. Brokerage commissions, stamp duty fees, interest, taxes, acquired fees and expenses, and extraordinary expenses are excluded from the expense cap. Without this cap, the Fund’s returns would have been lower. The expense ratio paid by an investor is the net expense ratio or the Fund’s Total Annual Fund Operating Expenses After Fee Waivers, as stated in the prospectuses. |
| 4 | The Morgan Stanley Capital International (MSCI) World Index (Net) is a free-float-adjusted market-capitalization-weighted index that is designed to measure the equity market performance of developed markets. The MSCI World Index (Net) consists of the following 23 developed markets country indexes: Australia, Austria, Belgium, Canada, Denmark, Finland, France, Germany, Hong Kong, Ireland, Israel, Italy, Japan, the Netherlands, New Zealand, Norway, Portugal, Singapore, Spain, Sweden, Switzerland, the United Kingdom, and the United States. Source: MSCI. MSCI makes no express or implied warranties or representations and shall have no liability whatsoever with respect to any MSCI data contained herein. The MSCI data may not be further redistributed or used as a basis for other indexes or any securities or financial products. This report is not approved, reviewed, or produced by MSCI. You cannot invest directly in an index. |
| 5 | The ten largest holdings, excluding cash and cash equivalents, are calculated based on the value of the investments divided by total net assets of the Fund. Holdings are subject to change and may have changed since the date specified. |
| 6 | Amounts are calculated based on the total long-term investments of the Fund. These amounts are subject to change and may have changed since the date specified. |
| | | | |
| 6 | | Wells Fargo Intrinsic World Equity Fund | | Fund expenses (unaudited) |
As a shareholder of the Fund, you incur two types of costs: (1) transaction costs, including sales charges (loads) on purchase payments and contingent deferred sales charges (if any) on redemptions and (2) ongoing costs, including management fees, distribution (12b-1) and/or shareholder servicing fees, and other Fund expenses. This example is intended to help you understand your ongoing costs (in dollars) of investing in the Fund and to compare these costs with the ongoing costs of investing in other mutual funds.
The example is based on an investment of $1,000 invested at the beginning of the six-month period and held for the entire period from November 1, 2016 to April 30, 2017.
Actual expenses
The “Actual” line of the table below provides information about actual account values and actual expenses. You may use the information in this line, together with the amount you invested, to estimate the expenses that you paid over the period. Simply divide your account value by $1,000 (for example, an $8,600 account value divided by $1,000 = 8.6), then multiply the result by the number in the “Actual” line under the heading entitled “Expenses paid during period” for your applicable class of shares to estimate the expenses you paid on your account during this period.
Hypothetical example for comparison purposes
The “Hypothetical” line of the table below provides information about hypothetical account values and hypothetical expenses based on the Fund’s actual expense ratio and an assumed rate of return of 5% per year before expenses, which is not the Fund’s actual return. The hypothetical account values and expenses may not be used to estimate the actual ending account balance or expenses you paid for the period. You may use this information to compare the ongoing costs of investing in the Fund and other funds. To do so, compare this 5% hypothetical example with the 5% hypothetical examples that appear in the shareholder reports of the other funds.
Please note that the expenses shown in the table are meant to highlight your ongoing costs only and do not reflect any transactional costs, such as sales charges (loads) and contingent deferred sales charges. Therefore, the “Hypothetical” line of the table is useful in comparing ongoing costs only and will not help you determine the relative total costs of owning different funds. In addition, if these transactional costs were included, your costs would have been higher.
| | | | | | | | | | | | | | | | |
| | | Beginning
account value
11-1-2016 | | | Ending
account value
4-30-2017 | | | Expenses
paid during
the period¹ | | | Annualized net
expense ratio | |
Class A | | | | | | | | | | | | | | | | |
Actual | | $ | 1,000.00 | | | $ | 1,144.57 | | | $ | 7.18 | | | | 1.35 | % |
Hypothetical (5% return before expenses) | | $ | 1,000.00 | | | $ | 1,018.10 | | | $ | 6.76 | | | | 1.35 | % |
Class C | | | | | | | | | | | | | | | | |
Actual | | $ | 1,000.00 | | | $ | 1,140.28 | | | $ | 11.14 | | | | 2.10 | % |
Hypothetical (5% return before expenses) | | $ | 1,000.00 | | | $ | 1,014.38 | | | $ | 10.49 | | | | 2.10 | % |
Administrator Class | | | | | | | | | | | | | | | | |
Actual | | $ | 1,000.00 | | | $ | 1,145.08 | | | $ | 6.65 | | | | 1.25 | % |
Hypothetical (5% return before expenses) | | $ | 1,000.00 | | | $ | 1,018.60 | | | $ | 6.26 | | | | 1.25 | % |
Institutional Class | | | | | | | | | | | | | | | | |
Actual | | $ | 1,000.00 | | | $ | 1,146.65 | | | $ | 5.06 | | | | 0.95 | % |
Hypothetical (5% return before expenses) | | $ | 1,000.00 | | | $ | 1,020.08 | | | $ | 4.76 | | | | 0.95 | % |
| 1 | Expenses paid is equal to the annualized net expense ratio of each class multiplied by the average account value over the period, multiplied by the number of days in the most recent fiscal half-year divided by the number of days in the fiscal year (to reflect the one-half-year period). |
| | | | | | |
| Portfolio of investments—April 30, 2017 (unaudited) | | Wells Fargo Intrinsic World Equity Fund | | | 7 | |
| | | | | | | | | | | | | | | | |
| Security name | | | | | | | | Shares | | | Value | |
|
Common Stocks: 99.63% | |
| | | | |
| Belgium: 1.01% | | | | | | | | | | | | | | | | |
Anheuser-Busch InBev NV ADR (Consumer Staples, Beverages) « | | | | | | | | | | | 13,700 | | | $ | 1,551,388 | |
| | | | | | | | | | | | | | | | |
| | | | |
| France: 7.68% | | | | | | | | | | | | | | | | |
Air Liquide SA (Materials, Chemicals) | | | | | | | | | | | 30,220 | | | | 3,640,801 | |
Capgemini SA (Information Technology, IT Services) | | | | | | | | | | | 39,900 | | | | 3,994,255 | |
Societe Generale SA (Financials, Banks) | | | | | | | | | | | 75,200 | | | | 4,112,969 | |
| |
| | | | 11,748,025 | |
| | | | | | | | | | | | | | | | |
| | | | |
| Germany: 3.27% | | | | | | | | | | | | | | | | |
Bayer AG (Health Care, Pharmaceuticals) | | | | | | | | | | | 15,500 | | | | 1,918,039 | |
Deutsche Telekom AG (Telecommunication Services, Diversified Telecommunication Services) | | | | | | | | | | | 175,800 | | | | 3,083,132 | |
| |
| | | | 5,001,171 | |
| | | | | | | | | | | | | | | | |
| | | | |
| Hong Kong: 2.59% | | | | | | | | | | | | | | | | |
AIA Group Limited (Financials, Insurance) | | | | | | | | | | | 571,800 | | | | 3,958,607 | |
| | | | | | | | | | | | | | | | |
| | | | |
| Japan: 9.28% | | | | | | | | | | | | | | | | |
Honda Motor Company Limited (Consumer Discretionary, Automobiles) | | | | | | | | | | | 92,200 | | | | 2,673,159 | |
Kao Corporation (Consumer Staples, Personal Products) | | | | | | | | | | | 46,600 | | | | 2,570,054 | |
Nidec Corporation (Industrials, Electrical Equipment) | | | | | | | | | | | 31,600 | | | | 2,897,080 | |
ORIX Corporation (Financials, Diversified Financial Services) | | | | | | | | | | | 176,000 | | | | 2,685,589 | |
Sony Corporation (Consumer Discretionary, Household Durables) | | | | | | | | | | | 100,040 | | | | 3,373,405 | |
| |
| | | | 14,199,287 | |
| | | | | | | | | | | | | | | | |
| | | | |
| Netherlands: 9.45% | | | | | | | | | | | | | | | | |
AerCap Holdings NV (Industrials, Trading Companies & Distributors) † | | | | | | | | | | | 73,700 | | | | 3,390,937 | |
Airbus Group NV (Industrials, Aerospace & Defense) | | | | | | | | | | | 20,800 | | | | 1,681,861 | |
Heineken NV (Consumer Staples, Beverages) | | | | | | | | | | | 33,000 | | | | 2,942,253 | |
Sensata Technologies Holding NV (Industrials, Electrical Equipment) † | | | | | | | | | | | 80,700 | | | | 3,323,226 | |
Unilever NV (Consumer Staples, Personal Products) « | | | | | | | | | | | 59,700 | | | | 3,118,728 | |
| |
| | | | 14,457,005 | |
| | | | | | | | | | | | | | | | |
| | | | |
| Spain: 2.05% | | | | | | | | | | | | | | | | |
CaixaBank SA (Financials, Banks) | | | | | | | | | | | 690,000 | | | | 3,133,490 | |
| | | | | | | | | | | | | | | | |
| | | | |
| Switzerland: 8.33% | | | | | | | | | | | | | | | | |
Nestle SA (Consumer Staples, Food Products) | | | | | | | | | | | 39,000 | | | | 3,004,372 | |
Novartis AG ADR (Health Care, Pharmaceuticals) | | | | | | | | | | | 41,500 | | | | 3,196,745 | |
Roche Holding AG (Health Care, Pharmaceuticals) | | | | | | | | | | | 11,000 | | | | 2,877,688 | |
UBS Group AG (Financials, Capital Markets) | | | | | | | | | | | 214,300 | | | | 3,661,407 | |
| |
| | | | 12,740,212 | |
| | | | | | | | | | | | | | | | |
| | | | |
| United Kingdom: 5.78% | | | | | | | | | | | | | | | | |
Diageo plc (Consumer Staples, Beverages) | | | | | | | | | | | 84,400 | | | | 2,455,757 | |
Royal Dutch Shell plc Class A (Energy, Oil, Gas & Consumable Fuels) | | | | | | | | | | | 120,300 | | | | 3,129,301 | |
Vodafone Group plc (Telecommunication Services, Wireless Telecommunication Services) | | | | | | | | | | | 1,265,000 | | | | 3,261,289 | |
| |
| | | | 8,846,347 | |
| | | | | | | | | | | | | | | | |
| | | | |
| United States: 50.19% | | | | | | | | | | | | | | | | |
Abbott Laboratories (Health Care, Health Care Equipment & Supplies) | | | | | | | | | | | 61,700 | | | | 2,692,588 | |
Affiliated Managers Group Incorporated (Financials, Capital Markets) | | | | | | | | | | | 11,760 | | | | 1,947,338 | |
The accompanying notes are an integral part of these financial statements.
| | | | |
| 8 | | Wells Fargo Intrinsic World Equity Fund | | Portfolio of investments—April 30, 2017 (unaudited) |
| | | | | | | | | | | | | | | | |
| Security name | | | | | | | | Shares | | | Value | |
| | | | |
| United States (continued) | | | | | | | | | | | | | | | | |
Alphabet Incorporated Class C (Information Technology, Internet Software & Services) † | | | | | | | | | | | 4,100 | | | $ | 3,714,436 | |
Apple Incorporated (Information Technology, Technology Hardware, Storage & Peripherals) | | | | | | | | | | | 23,000 | | | | 3,303,950 | |
BB&T Corporation (Financials, Banks) | | | | | | | | | | | 70,000 | | | | 3,022,600 | |
Charles Schwab Corporation (Financials, Capital Markets) | | | | | | | | | | | 17,700 | | | | 687,645 | |
Chevron Corporation (Energy, Oil, Gas & Consumable Fuels) | | | | | | | | | | | 18,500 | | | | 1,973,950 | |
Cigna Corporation (Health Care, Health Care Providers & Services) | | | | | | | | | | | 24,900 | | | | 3,893,613 | |
CIT Group Incorporated (Financials, Banks) | | | | | | | | | | | 76,600 | | | | 3,547,346 | |
Eli Lilly & Company (Health Care, Pharmaceuticals) | | | | | | | | | | | 20,200 | | | | 1,657,612 | |
EOG Resources Incorporated (Energy, Oil, Gas & Consumable Fuels) | | | | | | | | | | | 39,400 | | | | 3,644,500 | |
General Dynamics Corporation (Industrials, Aerospace & Defense) | | | | | | | | | | | 14,000 | | | | 2,713,060 | |
Gilead Sciences Incorporated (Health Care, Biotechnology) | | | | | | | | | | | 36,800 | | | | 2,522,640 | |
Honeywell International Incorporated (Industrials, Industrial Conglomerates) | | | | | | | | | | | 22,600 | | | | 2,963,764 | |
Lockheed Martin Corporation (Industrials, Aerospace & Defense) | | | | | | | | | | | 8,400 | | | | 2,263,380 | |
Merck & Company Incorporated (Health Care, Pharmaceuticals) | | | | | | | | | | | 52,300 | | | | 3,259,859 | |
Microsoft Corporation (Information Technology, Software) | | | | | | | | | | | 54,900 | | | | 3,758,454 | |
Motorola Solutions Incorporated (Information Technology, Communications Equipment) | | | | | | | | | | | 40,600 | | | | 3,490,382 | |
Oracle Corporation (Information Technology, Software) | | | | | | | | | | | 62,800 | | | | 2,823,488 | |
PepsiCo Incorporated (Consumer Staples, Beverages) | | | | | | | | | | | 20,900 | | | | 2,367,552 | |
Samsonite International SA (Consumer Discretionary, Textiles, Apparel & Luxury Goods) | | | | | | | | | | | 927,515 | | | | 3,583,257 | |
Schlumberger Limited (Energy, Energy Equipment & Services) | | | | | | | | | | | 36,700 | | | | 2,664,053 | |
The Goldman Sachs Group Incorporated (Financials, Capital Markets) | | | | | | | | | | | 5,500 | | | | 1,230,900 | |
The Walt Disney Company (Consumer Discretionary, Media) | | | | | | | | | | | 24,700 | | | | 2,855,320 | |
United Parcel Service Incorporated Class B (Industrials, Air Freight & Logistics) | | | | | | | | | | | 20,700 | | | | 2,224,422 | |
Verizon Communications Incorporated (Telecommunication Services, Diversified Telecommunication Services) | | | | 59,600 | | | | 2,736,236 | |
Visa Incorporated Class A (Information Technology, IT Services) | | | | | | | | | | | 39,800 | | | | 3,630,556 | |
Vulcan Materials Company (Materials, Construction Materials) | | | | | | | | | | | 13,400 | | | | 1,619,794 | |
| | | | |
| | | | | | | | | | | | | | | 76,792,695 | |
| | | | | | | | | | | | | | | | |
| | | | |
Total Common Stocks (Cost $121,301,109) | | | | | | | | | | | | | | | 152,428,227 | |
| | | | | | | | | | | | | | | | |
| | | | |
| | | Yield | | | | | | | | | | |
| Short-Term Investments: 2.99% | | | | | | | | | | | | | | | | |
| | | | |
| Investment Companies: 2.99% | | | | | | | | | | | | | | | | |
Securities Lending Cash Investment LLC (l)(r)(u) | | | 1.03 | % | | | | | | | 4,198,505 | | | | 4,198,925 | |
Wells Fargo Government Money Market Fund Select Class (l)(u) | | | 0.68 | | | | | | | | 370,186 | | | | 370,186 | |
| | | | |
Total Short-Term Investments (Cost $4,569,111) | | | | | | | | | | | | | | | 4,569,111 | |
| | | | | | | | | | | | | | | | |
| | | | | | | | |
| Total investments in securities (Cost $125,870,220) * | | | 102.62 | % | | | 156,997,338 | |
Other assets and liabilities, net | | | (2.62 | ) | | | (4,007,842 | ) |
| | | | | | | | |
| Total net assets | | | 100.00 | % | | $ | 152,989,496 | |
| | | | | | | | |
| « | All or a portion of this security is on loan. |
| † | Non-income-earning security |
| (l) | The issuer of the security is an affiliated person of the Fund as defined in the Investment Company Act of 1940. |
| (r) | The investment is a non-registered investment vehicle purchased with cash collateral received from securities on loan. |
| (u) | The rate represents the 7-day annualized yield at period end. |
| * | Cost for federal income tax purposes is $126,417,145 and unrealized gains (losses) consists of: |
| | | | |
Gross unrealized gains | | $ | 33,840,921 | |
Gross unrealized losses | | | (3,260,728 | ) |
| | | | |
Net unrealized gains | | $ | 30,580,193 | |
The accompanying notes are an integral part of these financial statements.
| | | | | | |
| Statement of assets and liabilities—April 30, 2017 (unaudited) | | Wells Fargo Intrinsic World Equity Fund | | | 9 | |
| | | | |
| | | | |
| |
Assets | | | | |
Investments | | | | |
In unaffiliated securities (including $4,107,826 of securities loaned), at value (cost $121,301,109) | | $ | 152,428,227 | |
In affiliated securities, at value (cost $4,569,111) | | | 4,569,111 | |
| | | | |
Total investments, at value (cost $125,870,220) | | | 156,997,338 | |
Foreign currency, at value (cost $82,894) | | | 84,040 | |
Receivable for investments sold | | | 397,216 | |
Receivable for Fund shares sold | | | 47,994 | |
Receivable for dividends | | | 351,120 | |
Receivable for securities lending income | | | 2,062 | |
Prepaid expenses and other assets | | | 25,801 | |
| | | | |
Total assets | | | 157,905,571 | |
| | | | |
| |
Liabilities | | | | |
Payable for Fund shares redeemed | | | 499,810 | |
Payable upon receipt of securities loaned | | | 4,198,925 | |
Management fee payable | | | 89,977 | |
Distribution fee payable | | | 4,427 | |
Administration fees payable | | | 25,388 | |
Accrued expenses and other liabilities | | | 97,548 | |
| | | | |
Total liabilities | | | 4,916,075 | |
| | | | |
Total net assets | | $ | 152,989,496 | |
| | | | |
| |
NET ASSETS CONSIST OF | | | | |
Paid-in capital | | $ | 117,349,962 | |
Overdistributed net investment income | | | (110,082 | ) |
Accumulated net realized gains on investments | | | 4,622,982 | |
Net unrealized gains on investments | | | 31,126,634 | |
| | | | |
Total net assets | | $ | 152,989,496 | |
| | | | |
| |
COMPUTATION OF NET ASSET VALUE AND OFFERING PRICE PER SHARE | | | | |
Net assets – Class A | | $ | 136,199,890 | |
Shares outstanding – Class A1 | | | 6,468,688 | |
Net asset value per share – Class A | | | $21.06 | |
Maximum offering price per share – Class A2 | | | $22.34 | |
Net assets – Class C | | $ | 7,201,154 | |
Shares outstanding – Class C1 | | | 355,052 | |
Net asset value per share – Class C | | | $20.28 | |
Net assets – Administrator Class | | $ | 3,672,271 | |
Shares outstanding – Administrator Class1 | | | 175,252 | |
Net asset value per share – Administrator Class | | | $20.95 | |
Net assets – Institutional Class | | $ | 5,916,181 | |
Shares outstanding – Institutional Class1 | | | 281,865 | |
Net asset value per share – Institutional Class | | | $20.99 | |
| 1 | The Fund has an unlimited number of authorized shares. |
| 2 | Maximum offering price is computed as 100/94.25 of net asset value. On investments of $50,000 or more, the offering price is reduced. |
The accompanying notes are an integral part of these financial statements.
| | | | |
| 10 | | Wells Fargo Intrinsic World Equity Fund | | Statement of operations—six months ended April 30, 2017 (unaudited) |
| | | | |
| | | | |
| |
Investment income | | | | |
Dividends (net of foreign withholding taxes of $79,392) | | $ | 1,463,433 | |
Securities lending income, net | | | 3,437 | |
Income from affiliated securities | | | 1,049 | |
| | | | |
Total investment income | | | 1,467,919 | |
| | | | |
| |
Expenses | | | | |
Management fee | | | 624,249 | |
Administration fees | | | | |
Class A | | | 137,165 | |
Class C | | | 7,623 | |
Administrator Class | | | 2,445 | |
Institutional Class | | | 3,398 | |
Shareholder servicing fees | | | | |
Class A | | | 163,291 | |
Class C | | | 9,075 | |
Administrator Class | | | 4,702 | |
Distribution fee | | | | |
Class C | | | 27,224 | |
Custody and accounting fees | | | 15,125 | |
Professional fees | | | 30,310 | |
Registration fees | | | 32,408 | |
Shareholder report expenses | | | 24,866 | |
Trustees’ fees and expenses | | | 11,130 | |
Other fees and expenses | | | 5,692 | |
| | | | |
Total expenses | | | 1,098,703 | |
Less: Fee waivers and/or expense reimbursements | | | (92,362 | ) |
| | | | |
Net expenses | | | 1,006,341 | |
| | | | |
Net investment income | | | 461,578 | |
| | | | |
| |
REALIZED AND UNREALIZED GAINS (LOSSES) ON INVESTMENTS | | | | |
Net realized gains on investments | | | 4,744,521 | |
Net change in unrealized gains (losses) on investments | | | 14,780,665 | |
| | | | |
Net realized and unrealized gains (losses) on investments | | | 19,525,186 | |
| | | | |
Net increase in net assets resulting from operations | | $ | 19,986,764 | |
| | | | |
The accompanying notes are an integral part of these financial statements.
| | | | | | |
| Statement of changes in net assets | | Wells Fargo Intrinsic World Equity Fund | | | 11 | |
| | | | | | | | | | | | | | | | |
| | | Six months ended
April 30, 2017
(unaudited) | | | Year ended
October 31, 2016 | |
| | | |
Operations | | | | | | | | | | | | |
Net investment income | | | | | | $ | 461,578 | | | | | | | $ | 1,612,182 | |
Net realized gains on investments | | | | | | | 4,744,521 | | | | | | | | 7,022,443 | |
Net change in unrealized gains (losses) on investments | | | | | | | 14,780,665 | | | | | | | | (13,434,282 | ) |
| | | | |
Net increase (decrease) in net assets resulting from operations | | | | | | | 19,986,764 | | | | | | | | (4,799,657 | ) |
| | | | |
| | | |
Distributions to shareholders from | | | | | | | | | | | | |
Net investment income | | | | | | | | | | | | | | | | |
Class A | | | | | | | (1,555,767 | ) | | | | | | | (1,480,000 | ) |
Class C | | | | | | | (31,841 | ) | | | | | | | (5,766 | ) |
Administrator Class | | | | | | | (46,398 | ) | | | | | | | (77,002 | ) |
Institutional Class | | | | | | | (82,395 | ) | | | | | | | (77,098 | ) |
Net realized gains | | | | | | | | | | | | | | | | |
Class A | | | | | | | (6,105,260 | ) | | | | | | | (15,944,560 | ) |
Class C | | | | | | | (361,793 | ) | | | | | | | (992,532 | ) |
Administrator Class | | | | | | | (186,415 | ) | | | | | | | (637,316 | ) |
Institutional Class | | | | | | | (246,870 | ) | | | | | | | (554,534 | ) |
| | | | |
Total distributions to shareholders | | | | | | | (8,616,739 | ) | | | | | | | (19,768,808 | ) |
| | | | |
| | | | |
Capital share transactions | | | Shares | | | | | | | | Shares | | | | | |
Proceeds from shares sold | | | | | | | | | | | | | | | | |
Class A | | | 40,988 | | | | 821,559 | | | | 77,894 | | | | 1,519,486 | |
Class C | | | 3,459 | | | | 65,178 | | | | 48,859 | | | | 912,817 | |
Administrator Class | | | 23,852 | | | | 480,201 | | | | 99,764 | | | | 1,871,151 | |
Institutional Class | | | 112,009 | | | | 2,249,365 | | | | 87,333 | | | | 1,706,229 | |
| | | | |
| | | | | | | 3,616,303 | | | | | | | | 6,009,683 | |
| | | | |
Reinvestment of distributions | | | | | | | | | | | | | | | | |
Class A | | | 382,201 | | | | 7,440,005 | | | | 871,879 | | | | 16,927,692 | |
Class C | | | 19,293 | | | | 360,925 | | | | 51,392 | | | | 955,480 | |
Administrator Class | | | 11,664 | | | | 225,913 | | | | 36,033 | | | | 697,376 | |
Institutional Class | | | 14,333 | | | | 278,253 | | | | 24,158 | | | | 469,358 | |
| | | | |
| | | | | | | 8,305,096 | | | | | | | | 19,049,906 | |
| | | | |
Payment for shares redeemed | | | | | | | | | | | | | | | | |
Class A | | | (480,618 | ) | | | (9,615,421 | ) | | | (975,567 | ) | | | (18,924,820 | ) |
Class C | | | (54,053 | ) | | | (1,044,545 | ) | | | (121,189 | ) | | | (2,191,011 | ) |
Administrator Class | | | (103,933 | ) | | | (2,061,070 | ) | | | (166,281 | ) | | | (3,242,731 | ) |
Institutional Class | | | (67,840 | ) | | | (1,353,678 | ) | | | (109,687 | ) | | | (2,106,188 | ) |
| | | | |
| | | | | | | (14,074,714 | ) | | | | | | | (26,464,750 | ) |
| | | | |
Net decrease in net assets resulting from capital share transactions | | | | | | | (2,153,315 | ) | | | | | | | (1,405,161 | ) |
| | | | |
Total increase (decrease) in net assets | | | | | | | 9,216,710 | | | | | | | | (25,973,626 | ) |
| | | | |
| | |
Net assets | | | | | | | | |
Beginning of period | | | | | | | 143,772,786 | | | | | | | | 169,746,412 | |
| | | | |
End of period | | | | | | $ | 152,989,496 | | | | | | | $ | 143,772,786 | |
| | | | |
Undistributed (overdistributed) net investment income | | | | | | $ | (110,082 | ) | | | | | | $ | 1,144,741 | |
| | | | |
The accompanying notes are an integral part of these financial statements.
| | | | |
| 12 | | Wells Fargo Intrinsic World Equity Fund | | Financial highlights |
(For a share outstanding throughout each period)
| | | | | | | | | | | | | | | | | | | | | | | | |
| | | Six months ended
April 30, 2017 (unaudited) | | | Year ended October 31 | |
| CLASS A | | | 2016 | | | 2015 | | | 2014 | | | 2013 | | | 2012 | |
Net asset value, beginning of period | | | $19.53 | | | | $22.82 | | | | $22.39 | | | | $21.88 | | | | $17.94 | | | | $15.55 | |
Net investment income | | | 0.06 | | | | 0.20 | | | | 0.19 | | | | 0.17 | | | | 0.20 | | | | 0.16 | |
Net realized and unrealized gains (losses) on investments | | | 2.65 | | | | (0.83 | ) | | | 0.73 | | | | 0.59 | | | | 4.00 | | | | 1.87 | |
| | | | | | | | | | | | | | | | | | | | | | | | |
Total from investment operations | | | 2.71 | | | | (0.63 | ) | | | 0.92 | | | | 0.76 | | | | 4.20 | | | | 2.03 | |
Distributions to shareholders from | | | | | | | | | | | | | | | | | | | | | | | | |
Net investment income | | | (0.23 | ) | | | (0.20 | ) | | | (0.12 | ) | | | (0.25 | ) | | | (0.26 | ) | | | (0.11 | ) |
Net realized gains | | | (0.95 | ) | | | (2.46 | ) | | | (0.37 | ) | | | 0.00 | | | | 0.00 | | | | 0.00 | |
| | | | | | | | | | | | | | | | | | | | | | | | |
Total distributions to shareholders | | | (1.18 | ) | | | (2.66 | ) | | | (0.49 | ) | | | (0.25 | ) | | | (0.26 | ) | | | (0.11 | ) |
Regulatory settlement proceeds | | | 0.00 | | | | 0.00 | | | | 0.00 | | | | 0.00 | | | | 0.00 | | | | 0.47 | |
Net asset value, end of period | | | $21.06 | | | | $19.53 | | | | $22.82 | | | | $22.39 | | | | $21.88 | | | | $17.94 | |
Total return1 | | | 14.46 | % | | | (2.54 | )% | | | 4.23 | % | | | 3.45 | % | | | 23.74 | % | | | 16.25 | %2 |
Ratios to average net assets (annualized) | | | | | | | | | | | | | | | | | | | | | | | | |
Gross expenses | | | 1.47 | % | | | 1.46 | % | | | 1.48 | % | | | 1.47 | % | | | 1.49 | % | | | 1.51 | % |
Net expenses | | | 1.35 | % | | | 1.37 | % | | | 1.40 | % | | | 1.40 | % | | | 1.40 | % | | | 1.40 | % |
Net investment income | | | 0.65 | % | | | 1.09 | % | | | 0.79 | % | | | 0.70 | % | | | 0.95 | % | | | 0.91 | % |
Supplemental data | | | | | | | | | | | | | | | | | | | | | | | | |
Portfolio turnover rate | | | 33 | % | | | 23 | % | | | 32 | % | | | 23 | % | | | 22 | % | | | 27 | % |
Net assets, end of period (000s omitted) | | | $136,200 | | | | $127,428 | | | | $149,492 | | | | $157,061 | | | | $168,621 | | | | $146,930 | |
| 1 | Total return calculations do not include any sales charges. Returns for periods of less than one year are not annualized. |
| 2 | During the year ended October 31, 2012, the Fund received a regulatory settlement from an unaffiliated third party which had an impact of 2.92% on the total return. |
The accompanying notes are an integral part of these financial statements.
| | | | | | |
| Financial highlights | | Wells Fargo Intrinsic World Equity Fund | | | 13 | |
(For a share outstanding throughout each period)
| | | | | | | | | | | | | | | | | | | | | | | | |
| | | Six months ended
April 30, 2017 (unaudited) | | | Year ended October 31 | |
| CLASS C | | | 2016 | | | 2015 | | | 2014 | | | 2013 | | | 2012 | |
Net asset value, beginning of period | | | $18.77 | | | | $21.99 | | | | $21.64 | | | | $21.19 | | | | $17.37 | | | | $15.15 | |
Net investment income (loss) | | | (0.03 | ) | | | 0.05 | | | | 0.01 | 1 | | | (0.02 | ) | | | 0.05 | | | | 0.02 | |
Net realized and unrealized gains (losses) on investments | | | 2.57 | | | | (0.80 | ) | | | 0.71 | | | | 0.58 | | | | 3.89 | | | | 1.82 | |
| | | | | | | | | | | | | | | | | | | | | | | | |
Total from investment operations | | | 2.54 | | | | (0.75 | ) | | | 0.72 | | | | 0.56 | | | | 3.94 | | | | 1.84 | |
Distributions to shareholders from | | | | | | | | | | | | | | | | | | | | | | | | |
Net investment income | | | (0.08 | ) | | | (0.01 | ) | | | 0.00 | | | | (0.11 | ) | | | (0.12 | ) | | | (0.09 | ) |
Net realized gains | | | (0.95 | ) | | | (2.46 | ) | | | (0.37 | ) | | | 0.00 | | | | 0.00 | | | | 0.00 | |
| | | | | | | | | | | | | | | | | | | | | | | | |
Total distributions to shareholders | | | (1.03 | ) | | | (2.47 | ) | | | (0.37 | ) | | | (0.11 | ) | | | (0.12 | ) | | | (0.09 | ) |
Regulatory settlement proceeds | | | 0.00 | | | | 0.00 | | | | 0.00 | | | | 0.00 | | | | 0.00 | | | | 0.47 | |
Net asset value, end of period | | | $20.28 | | | | $18.77 | | | | $21.99 | | | | $21.64 | | | | $21.19 | | | | $17.37 | |
Total return2 | | | 14.03 | % | | | (3.26 | )% | | | 3.41 | % | | | 2.65 | % | | | 22.82 | % | | | 15.39 | %3 |
Ratios to average net assets (annualized) | | | | | | | | | | | | | | | | | | | | | | | | |
Gross expenses | | | 2.22 | % | | | 2.21 | % | | | 2.23 | % | | | 2.22 | % | | | 2.24 | % | | | 2.26 | % |
Net expenses | | | 2.10 | % | | | 2.12 | % | | | 2.15 | % | | | 2.15 | % | | | 2.15 | % | | | 2.15 | % |
Net investment income (loss) | | | (0.10 | )% | | | 0.32 | % | | | 0.05 | % | | | (0.06 | )% | | | 0.20 | % | | | 0.16 | % |
Supplemental data | | | | | | | | | | | | | | | | | | | | | | | | |
Portfolio turnover rate | | | 33 | % | | | 23 | % | | | 32 | % | | | 23 | % | | | 22 | % | | | 27 | % |
Net assets, end of period (000s omitted) | | | $7,201 | | | | $7,252 | | | | $8,958 | | | | $9,788 | | | | $9,949 | | | | $7,341 | |
| 1 | Calculated based upon average shares outstanding |
| 2 | Total return calculations do not include any sales charges. Returns for periods of less than one year are not annualized. |
| 3 | During the year ended October 31, 2012, the Fund received a regulatory settlement from an unaffiliated third party which had an impact of 2.92% on the total return. |
The accompanying notes are an integral part of these financial statements.
| | | | |
| 14 | | Wells Fargo Intrinsic World Equity Fund | | Financial highlights |
(For a share outstanding throughout each period)
| | | | | | | | | | | | | | | | | | | | | | | | |
| | | Six months ended
April 30, 2017 (unaudited) | | | Year ended October 31 | |
| ADMINISTRATOR CLASS | | | 2016 | | | 2015 | | | 2014 | | | 2013 | | | 2012 | |
Net asset value, beginning of period | | | $19.43 | | | | $22.76 | | | | $22.33 | | | | $21.81 | | | | $17.89 | | | | $15.52 | |
Net investment income | | | 0.07 | 1 | | | 0.24 | 1 | | | 0.23 | 1 | | | 0.22 | 1 | | | 0.24 | 1 | | | 0.19 | 1 |
Net realized and unrealized gains (losses) on investments | | | 2.64 | | | | (0.84 | ) | | | 0.75 | | | | 0.59 | | | | 3.99 | | | | 1.87 | |
| | | | | | | | | | | | | | | | | | | | | | | | |
Total from investment operations | | | 2.71 | | | | (0.60 | ) | | | 0.98 | | | | 0.81 | | | | 4.23 | | | | 2.06 | |
Distributions to shareholders from | | | | | | | | | | | | | | | | | | | | | | | | |
Net investment income | | | (0.24 | ) | | | (0.27 | ) | | | (0.18 | ) | | | (0.29 | ) | | | (0.31 | ) | | | (0.16 | ) |
Net realized gains | | | (0.95 | ) | | | (2.46 | ) | | | (0.37 | ) | | | 0.00 | | | | 0.00 | | | | 0.00 | |
| | | | | | | | | | | | | | | | | | | | | | | | |
Total distributions to shareholders | | | (1.19 | ) | | | (2.73 | ) | | | (0.55 | ) | | | (0.29 | ) | | | (0.31 | ) | | | (0.16 | ) |
Regulatory settlement proceeds | | | 0.00 | | | | 0.00 | | | | 0.00 | | | | 0.00 | | | | 0.00 | | | | 0.47 | |
Net asset value, end of period | | | $20.95 | | | | $19.43 | | | | $22.76 | | | | $22.33 | | | | $21.81 | | | | $17.89 | |
Total return2 | | | 14.51 | % | | | (2.43 | )% | | | 4.51 | % | | | 3.70 | % | | | 24.03 | % | | | 16.52 | %3 |
Ratios to average net assets (annualized) | | | | | | | | | | | | | | | | | | | | | | | | |
Gross expenses | | | 1.39 | % | | | 1.37 | % | | | 1.34 | % | | | 1.29 | % | | | 1.31 | % | | | 1.34 | % |
Net expenses | | | 1.25 | % | | | 1.22 | % | | | 1.15 | % | | | 1.15 | % | | | 1.15 | % | | | 1.15 | % |
Net investment income | | | 0.75 | % | | | 1.27 | % | | | 1.01 | % | | | 0.96 | % | | | 1.18 | % | | | 1.14 | % |
Supplemental data | | | | | | | | | | | | | | | | | | | | | | | | |
Portfolio turnover rate | | | 33 | % | | | 23 | % | | | 32 | % | | | 23 | % | | | 22 | % | | | 27 | % |
Net assets, end of period (000s omitted) | | | $3,672 | | | | $4,735 | | | | $6,239 | | | | $7,327 | | | | $5,306 | | | | $2,001 | |
| 1 | Calculated based upon average shares outstanding |
| 2 | Returns for periods of less than one year are not annualized. |
| 3 | During the year ended October 31, 2012, the Fund received a regulatory settlement from an unaffiliated third party which had an impact of 2.93% on the total return. |
The accompanying notes are an integral part of these financial statements.
| | | | | | |
| Financial highlights | | Wells Fargo Intrinsic World Equity Fund | | | 15 | |
(For a share outstanding throughout each period)
| | | | | | | | | | | | | | | | | | | | | | | | |
| | | Six months ended April 30, 2017 (unaudited) | | | Year ended October 31 | |
| INSTITUTIONAL CLASS | | | 2016 | | | 2015 | | | 2014 | | | 2013 | | | 2012 | |
Net asset value, beginning of period | | | $19.51 | | | | $22.83 | | | | $22.40 | | | | $21.87 | | | | $17.93 | | | | $15.54 | |
Net investment income | �� | | 0.12 | | | | 0.26 | | | | 0.28 | | | | 0.25 | 1 | | | 0.26 | 1 | | | 0.17 | 1 |
Net realized and unrealized gains (losses) on investments | | | 2.62 | | | | (0.80 | ) | | | 0.75 | | | | 0.60 | | | | 4.02 | | | | 1.92 | |
| | | | | | | | | | | | | | | | | | | | | | | | |
Total from investment operations | | | 2.74 | | | | (0.54 | ) | | | 1.03 | | | | 0.85 | | | | 4.28 | | | | 2.09 | |
Distributions to shareholders from | | | | | | | | | | | | | | | | | | | | | | | | |
Net investment income | | | (0.31 | ) | | | (0.32 | ) | | | (0.23 | ) | | | (0.32 | ) | | | (0.34 | ) | | | (0.17 | ) |
Net realized gains | | | (0.95 | ) | | | (2.46 | ) | | | (0.37 | ) | | | 0.00 | | | | 0.00 | | | | 0.00 | |
| | | | | | | | | | | | | | | | | | | | | | | | |
Total distributions to shareholders | | | (1.26 | ) | | | (2.78 | ) | | | (0.60 | ) | | | (0.32 | ) | | | (0.34 | ) | | | (0.17 | ) |
Regulatory settlement proceeds | | | 0.00 | | | | 0.00 | | | | 0.00 | | | | 0.00 | | | | 0.00 | | | | 0.47 | |
Net asset value, end of period | | | $20.99 | | | | $19.51 | | | | $22.83 | | | | $22.40 | | | | $21.87 | | | | $17.93 | |
Total return2 | | | 14.66 | % | | | (2.13 | )% | | | 4.72 | % | | | 3.90 | % | | | 24.28 | % | | | 16.74 | %3 |
Ratios to average net assets (annualized) | | | | | | | | | | | | | | | | | | | | | | | | |
Gross expenses | | | 1.14 | % | | | 1.13 | % | | | 1.09 | % | | | 1.04 | % | | | 1.06 | % | | | 1.10 | % |
Net expenses | | | 0.95 | % | | | 0.95 | % | | | 0.95 | % | | | 0.95 | % | | | 0.95 | % | | | 0.95 | % |
Net investment income | | | 1.05 | % | | | 1.47 | % | | | 1.23 | % | | | 1.11 | % | | | 1.32 | % | | | 1.03 | % |
Supplemental data | | | | | | | | | | | | | | | | | | | | | | | | |
Portfolio turnover rate | | | 33 | % | | | 23 | % | | | 32 | % | | | 23 | % | | | 22 | % | | | 27 | % |
Net assets, end of period (000s omitted) | | | $5,916 | | | | $4,357 | | | | $5,058 | | | | $3,179 | | | | $2,352 | | | | $561 | |
| 1 | Calculated based upon average shares outstanding |
| 2 | Returns for periods of less than one year are not annualized. |
| 3 | During the year ended October 31, 2012, the Fund received a regulatory settlement from an unaffiliated third party which had an impact of 2.93% on the total return. |
The accompanying notes are an integral part of these financial statements.
| | | | |
| 16 | | Wells Fargo Intrinsic World Equity Fund | | Notes to financial statements (unaudited) |
1. ORGANIZATION
Wells Fargo Funds Trust (the “Trust”), a Delaware statutory trust organized on March 10, 1999, is an open-end management investment company registered under the Investment Company Act of 1940, as amended (the “1940 Act”). As an investment company, the Trust follows the accounting and reporting guidance in Financial Accounting Standards Board (“FASB”) Accounting Standards Codification (“ASC”) Topic 946, Financial Services – Investment Companies. These financial statements report on the Wells Fargo Intrinsic World Equity Fund (the “Fund”) which is a diversified series of the Trust.
2. SIGNIFICANT ACCOUNTING POLICIES
The following significant accounting policies, which are consistently followed in the preparation of the financial statements of the Fund, are in conformity with U.S. generally accepted accounting principles which require management to make estimates and assumptions that affect the reported amounts of assets and liabilities, disclosure of contingent assets and liabilities at the date of the financial statements, and the reported amounts of revenues and expenses during the reporting period. Actual results could differ from those estimates.
Securities valuation
All investments are valued each business day as of the close of regular trading on the New York Stock Exchange (generally 4 p.m. Eastern Time), although the Fund may deviate from this calculation time under unusual or unexpected circumstances.
Equity securities that are listed on a foreign or domestic exchange or market are valued at the official closing price or, if none, the last sales price. If no sale occurs on the principal exchange or market that day, the prior day’s price will be deemed “stale” and a fair value price will be determined in accordance with the Fund’s Valuation Procedures.
The values of securities denominated in foreign currencies are translated into U.S. dollars at rates provided by an independent foreign currency pricing source at a time each business day specified by the Management Valuation Team of Wells Fargo Funds Management, LLC (“Funds Management”).
Many securities markets and exchanges outside the U.S. close prior to the close of the New York Stock Exchange and therefore may not fully reflect trading or events that occur after the close of the principal exchange in which the foreign securities are traded, but before the close of the New York Stock Exchange. If such trading or events are expected to materially affect the value of such securities, then fair value pricing procedures approved by the Board of Trustees of the Fund are applied. These procedures take into account multiple factors including movements in U.S. securities markets after foreign exchanges close. Foreign securities that are fair valued under these procedures are categorized as Level 2 and the application of these procedures may result in transfers between Level 1 and Level 2. Depending on market activity, such fair valuations may be frequent. Such fair value pricing may result in net asset values that are higher or lower than net asset values based on the last reported sales price or latest quoted bid price. On April 30, 2017, such fair value pricing was not used in pricing foreign securities.
Investments in registered open-end investment companies are valued at net asset value. Interests in non-registered investment companies that are redeemable at net asset value are fair valued normally at net asset value.
Investments which are not valued using any of the methods discussed above are valued at their fair value, as determined in good faith by the Board of Trustees. The Board of Trustees has established a Valuation Committee comprised of the Trustees and has delegated to it the authority to take any actions regarding the valuation of portfolio securities that the Valuation Committee deems necessary or appropriate, including determining the fair value of portfolio securities, unless the determination has been delegated to the Management Valuation Team. The Board of Trustees retains the authority to make or ratify any valuation decisions or approve any changes to the Valuation Procedures as it deems appropriate. On a quarterly basis, the Board of Trustees receives reports on any valuation actions taken by the Valuation Committee or the Management Valuation Team which may include items for ratification.
Valuations of fair valued securities are compared to the next actual sales price when available, or other appropriate market values, to assess the continued appropriateness of the fair valuation methodologies used. These securities are fair valued on a day-to-day basis, taking into consideration changes to appropriate market information and any significant changes to the inputs considered in the valuation process until there is a readily available price provided on an exchange or by an independent pricing service. Valuations received from an independent pricing service or independent broker-dealer quotes are periodically validated by comparisons to most recent trades and valuations provided by other independent pricing services in addition to the review of prices by the manager and/or subadviser. Unobservable inputs used in determining fair valuations are identified based on the type of security, taking into consideration factors utilized by market participants in valuing the investment, knowledge about the issuer and the current market environment.
| | | | | | |
| Notes to financial statements (unaudited) | | Wells Fargo Intrinsic World Equity Fund | | | 17 | |
Foreign currency translation
The accounting records of the Fund are maintained in U.S. dollars. The values of other assets and liabilities denominated in foreign currencies are translated into U.S. dollars at rates provided by an independent foreign currency pricing source at a time each business day specified by the Management Valuation Team. Purchases and sales of securities, and income and expenses are converted at the rate of exchange on the respective dates of such transactions. Net realized foreign exchange gains or losses arise from sales of foreign currencies, currency gains or losses realized between the trade and settlement dates on securities transactions, and the difference between the amounts of dividends, interest and foreign withholding taxes recorded and the U.S. dollar equivalent of the amounts actually paid or received. Net unrealized foreign exchange gains and losses arise from changes in the fair value of assets and liabilities other than investments in securities resulting from changes in exchange rates. The changes in net assets arising from changes in exchange rates of securities and the changes in net assets resulting from changes in market prices of securities are not separately presented. Such changes are included in net realized and unrealized gains or losses from investments.
Security loans
The Fund may lend its securities from time to time in order to earn additional income in the form of fees or interest on securities received as collateral or the investment of any cash received as collateral. The Fund continues to receive interest or dividends on the securities loaned. The Fund receives collateral in the form of cash or securities with a value at least equal to the value of the securities on loan. The value of the loaned securities is determined at the close of each business day and any additional required collateral is delivered to the Fund on the next business day. In a securities lending transaction, the net asset value of the Fund will be affected by an increase or decrease in the value of the securities loaned and by an increase or decrease in the value of the instrument in which collateral is invested. The amount of securities lending activity undertaken by the Fund fluctuates from time to time. In the event of default or bankruptcy by the borrower, the Fund may be prevented from recovering the loaned securities or gaining access to the collateral or may experience delays or costs in doing so. In addition, the investment of any cash collateral received may lose all or part of its value. The Fund has the right under the lending agreement to recover the securities from the borrower on demand.
The Fund lends its securities through an unaffiliated securities lending agent. Cash collateral received in connection with its securities lending transactions is invested in Securities Lending Cash Investments, LLC (the “Securities Lending Fund”). The Securities Lending Fund is exempt from registration under Section 3(c)(7) of the 1940 Act and is managed by Funds Management and is subadvised by Wells Capital Management Incorporated (“WellsCap”), an affiliate of Funds Management and an indirect wholly owned subsidiary of Wells Fargo & Company (“Wells Fargo”). Funds Management receives an advisory fee starting at 0.05% and declining to 0.01% as the average daily net assets of the Securities Lending Fund increase. All of the fees received by Funds Management are paid to WellsCap for its services as subadviser. The Securities Lending Fund seeks to provide a positive return compared to the daily Fed Funds Open Rate by investing in high-quality, U.S. dollar-denominated short-term money market instruments. Securities Lending Fund investments are valued at the evaluated bid price provided by an independent pricing service. Income earned from investment in the Securities Lending Fund is included in securities lending income on the Statement of Operations.
Security transactions and income recognition
Securities transactions are recorded on a trade date basis. Realized gains or losses are recorded on the basis of identified cost.
Dividend income is recognized on the ex-dividend date, except for certain dividends from foreign securities, which are recorded as soon as the custodian verifies the ex-dividend date. Dividend income from foreign securities is recorded net of foreign taxes withheld where recovery of such taxes is not assured.
Distributions to shareholders
Distributions to shareholders from net investment income and net realized gains, if any, are recorded on the ex-dividend date. Such distributions are determined in accordance with income tax regulations and may differ from U.S. generally accepted accounting principles. Dividend sources are estimated at the time of declaration. The tax character of distributions is determined as of the Fund’s fiscal year end. Therefore, a portion of the Fund’s distributions made prior the Fund’s fiscal year end may be categorized as a tax return of capital.
Federal and other taxes
The Fund intends to continue to qualify as a regulated investment company by distributing substantially all of its investment company taxable income and any net realized capital gains (after reduction for capital loss carryforwards) sufficient to relieve it from all, or substantially all, federal income taxes. Accordingly, no provision for federal income taxes was required.
| | | | |
| 18 | | Wells Fargo Intrinsic World Equity Fund | | Notes to financial statements (unaudited) |
The Fund’s income and federal excise tax returns and all financial records supporting those returns for the prior three fiscal years are subject to examination by the federal and Delaware revenue authorities. Management has analyzed the Fund’s tax positions taken on federal, state, and foreign tax returns for all open tax years and does not believe that there are any uncertain tax positions that require recognition of a tax liability.
Class allocations
The separate classes of shares offered by the Fund differ principally in applicable sales charges, distribution, shareholder servicing, and administration fees. Class specific expenses are charged directly to that share class. Investment income, common expenses, and realized and unrealized gains (losses) on investments are allocated daily to each class of shares based on the relative proportion of net assets of each class.
3. FAIR VALUATION MEASUREMENTS
Fair value measurements of investments are determined within a framework that has established a fair value hierarchy based upon the various data inputs utilized in determining the value of the Fund’s investments. The three-level hierarchy gives the highest priority to unadjusted quoted prices in active markets for identical assets or liabilities (Level 1) and the lowest priority to unobservable inputs (Level 3). The Fund’s investments are classified within the fair value hierarchy based on the lowest level of input that is significant to the fair value measurement. The inputs are summarized into three broad levels as follows:
| ∎ | | Level 1 – quoted prices in active markets for identical securities |
| ∎ | | Level 2 – other significant observable inputs (including quoted prices for similar securities, interest rates, prepayment speeds, credit risk, etc.) |
| ∎ | | Level 3 – significant unobservable inputs (including the Fund’s own assumptions in determining the fair value of investments) |
The inputs or methodologies used for valuing investments in securities are not necessarily an indication of the risk associated with investing in those securities.
The following is a summary of the inputs used in valuing the Fund’s assets and liabilities as of April 30, 2017:
| | | | | | | | | | | | | | | | |
| | | Quoted prices
(Level 1) | | | Other significant observable inputs (Level 2) | | | Significant unobservable inputs (Level 3) | | | Total | |
Assets | | | | | | | | | | | | | | | | |
Investments in: | | | | | | | | | | | | | | | | |
| | | | |
Common stocks | | | | | | | | | | | | | | | | |
Belgium | | $ | 1,551,388 | | | $ | 0 | | | $ | 0 | | | $ | 1,551,388 | |
France | | | 11,748,025 | | | | 0 | | | | 0 | | | | 11,748,025 | |
Germany | | | 5,001,171 | | | | 0 | | | | 0 | | | | 5,001,171 | |
Hong Kong | | | 3,958,607 | | | | 0 | | | | 0 | | | | 3,958,607 | |
Japan | | | 14,199,287 | | | | 0 | | | | 0 | | | | 14,199,287 | |
Netherlands | | | 14,457,005 | | | | 0 | | | | 0 | | | | 14,457,005 | |
Spain | | | 3,133,490 | | | | 0 | | | | 0 | | | | 3,133,490 | |
Switzerland | | | 12,740,212 | | | | 0 | | | | 0 | | | | 12,740,212 | |
United Kingdom | | | 8,846,347 | | | | 0 | | | | 0 | | | | 8,846,347 | |
United States | | | 76,792,695 | | | | 0 | | | | 0 | | | | 76,792,695 | |
| | | | |
Short-term investments | | | | | | | | | | | | | | | | |
Investment companies | | | 370,186 | | | | 0 | | | | 0 | | | | 370,186 | |
Investments measured at net asset value* | | | | | | | | | | | | | | | 4,198,925 | |
Total assets | | $ | 152,798,413 | | | $ | 0 | | | $ | 0 | | | $ | 156,997,338 | |
| * | Investments that are measured at fair value using the net asset value per share (or its equivalent) as a practical expedient have not been categorized in the fair value hierarchy. The fair value amount presented in the table is intended to permit reconciliation of the fair value hierarchy to the amounts presented in the Statement of Assets and Liabilities. The Fund’s investment in Securities Lending Cash Investments, LLC valued at $4,198,925 does not have a redemption period notice, can be redeemed daily and does not have any unfunded commitments. |
The Fund recognizes transfers between levels within the fair value hierarchy at the end of the reporting period. At April 30, 2017, the Fund did not have any transfers into/out of Level 1, Level 2, or Level 3.
| | | | | | |
| Notes to financial statements (unaudited) | | Wells Fargo Intrinsic World Equity Fund | | | 19 | |
4. TRANSACTIONS WITH AFFILIATES AND OTHER EXPENSES
Management fee
Funds Management, an indirect wholly owned subsidiary of Wells Fargo, is the manager of the Fund and provides advisory and fund-level administrative services under an investment management agreement. Under the investment management agreement, Funds Management is responsible for, among other services, implementing the investment objectives and strategies of the Fund, supervising the subadviser, providing fund-level administrative services in connection with the Fund’s operations, and providing any other fund-level administrative services reasonably necessary for the operation of the Fund. As compensation for its services under the investment management agreement, Funds Management is entitled to receive an annual management fee starting at 0.85% and declining to 0.68% as the average daily net assets of the Fund increase. For the six months ended April 30, 2017, the management fee was equivalent to an annual rate of 0.85% of the Fund’s average daily net assets.
Funds Management has retained the services of a subadviser to provide daily portfolio management to the Fund. The fee for subadvisory services is borne by Funds Management. WellsCap is the subadviser to the Fund and is entitled to receive a fee from Funds Management at an annual rate starting at 0.35% and declining to 0.20% as the average daily net assets of the Fund increase.
Administration fees
Under a class-level administration agreement, Funds Management provides class-level administrative services to the Fund, which includes paying fees and expenses for services provided by the transfer agent, sub-transfer agents, omnibus account servicers and record-keepers. As compensation for its services under the class-level administration agreement, Funds Management receives an annual fee which is calculated based on the average daily net assets of each class as follows:
| | | | |
| | | Class-level
administration fee | |
Class A, Class C | | | 0.21 | % |
Administrator Class, Institutional Class | | | 0.13 | |
Funds Management has contractually waived and/or reimbursed management and administration fees to the extent necessary to maintain certain net operating expense ratios for the Fund. Waiver of fees and/or reimbursement of expenses by Funds Management were made first from fund level expenses on a proportionate basis and then from class specific expenses. Funds Management has committed through February 28, 2018 to waive fees and/or reimburse expenses to the extent necessary to cap the Fund’s expenses at 1.35% for Class A shares, 2.10% for Class C shares, 1.25% for Administrator Class shares, and 0.95% for Institutional Class shares. After this time, the cap may be increased or the commitment to maintain the cap may be terminated only with the approval of the Board of Trustees.
During the six months ended April 30, 2017, State Street Bank and Trust Company, the Fund’s custodian, reimbursed the Fund $29,258 for certain out-of-pocket expenses that were billed to the Fund in error from 1998-2015. This amount is included in dividend income on the Statement of Operations. In addition, Funds Management was also reimbursed $49,603 for waivers/reimbursements it made to the Fund during the period the Fund was erroneously billed.
Distribution fee
The Trust has adopted a distribution plan for Class C shares of the Fund pursuant to Rule 12b-1 under the 1940 Act. A distribution fee is charged to Class C and paid to Wells Fargo Funds Distributor, LLC (“Funds Distributor”), the principal underwriter, at an annual rate of 0.75% of the average daily net assets of Class C shares.
In addition, Funds Distributor is entitled to receive the front-end sales charge from the purchase of Class A shares and a contingent deferred sales charge on the redemption of certain Class A shares. Funds Distributor is also entitled to receive the contingent deferred sales charges from redemptions of Class B and Class C shares. For the six months ended April 30, 2017, Funds Distributor received $373 from the sale of Class A shares.
Shareholder servicing fees
The Trust has entered into contracts with one or more shareholder servicing agents, whereby Class A, Class C, and Administrator Class of the Fund are charged a fee at an annual rate of 0.25% of the average daily net assets of each respective class.
A portion of these total shareholder servicing fees were paid to affiliates of Wells Fargo.
| | | | |
| 20 | | Wells Fargo Intrinsic World Equity Fund | | Notes to financial statements (unaudited) |
5. INVESTMENT PORTFOLIO TRANSACTIONS
Purchases and sales of investments, excluding U.S. government obligations (if any) and short-term securities, for the six months ended April 30, 2017 were $49,155,922 and $55,112,297, respectively.
The Fund may purchase or sell investment securities to other Wells Fargo affiliates pursuant to Rule 17a-7 of the 1940 Act and under procedures adopted by the Board of Trustees. The procedures have been designed to ensure that these interfund transactions, which do not incur broker commissions, are effected at current market prices. Interfund trades are included within the respective purchases and sales amounts shown.
6. BANK BORROWINGS
The Trust (excluding the money market funds and certain other funds) and Wells Fargo Variable Trust are parties to a $250,000,000 revolving credit agreement whereby the Fund is permitted to use bank borrowings for temporary or emergency purposes, such as to fund shareholder redemption requests. Interest under the credit agreement is charged to the Fund based on a borrowing rate equal to the higher of the Federal Funds rate in effect on that day plus 1.25% or the overnight LIBOR rate in effect on that day plus 1.25%. In addition, an annual commitment fee equal to 0.25% of the unused balance is allocated to each participating fund.
For the six months ended April 30, 2017, there were no borrowings by the Fund under the agreement.
7. INDEMNIFICATION
Under the Trust’s organizational documents, the officers and Trustees have been granted certain indemnification rights against certain liabilities that may arise out of performance of their duties to the Trust. Additionally, in the normal course of business, the Trust may enter into contracts with service providers that contain a variety of indemnification clauses. The Trust’s maximum exposure under these arrangements is dependent on future claims that may be made against the Fund and, therefore, cannot be estimated.
8. NEW ACCOUNTING PRONOUNCEMENT
In December 2016, FASB issued Accounting Standards Update (“ASU”) No. 2016-19, Technical Corrections and Improvements. ASU 2016-19 includes an amendment to FASB ASC Topic 820, Fair Value Measurement which clarifies the difference between a valuation approach and a valuation technique. The amendment also requires an entity to disclose when there has been a change in either or both a valuation approach and/or a valuation technique. The disclosure requirements are effective for fiscal years and interim periods within those fiscal years beginning after December 15, 2016. Management is currently evaluating the potential impact of this new guidance to the financial statements.
9. REGULATORY CHANGES
In October 2016, the Securities and Exchange Commission (“SEC”) adopted new rules and forms and amended existing rules and forms (together, “final rules”) intended to modernize and enhance the reporting and disclosure of information by registered investment companies and to enhance liquidity risk management by open-end mutual funds and exchange-traded funds. The final rules will enhance the quality of information available to investors and will allow the SEC to more effectively collect and use data reported by funds. In part, the final rules amend Regulation S-X and require standardized, enhanced disclosure about derivatives in the Fund’s financial statements, as well as other amendments. The compliance date for the amendments to Regulation S-X is August 1, 2017 while the compliance date for the new form types is June 1, 2018 and the compliance date for the liquidity risk management program requirements is December 1, 2018. Management is currently assessing the potential impact of these enhancements and their impact on the financial statement disclosures and reporting requirements.
| | | | | | |
| Other information (unaudited) | | Wells Fargo Intrinsic World Equity Fund | | | 21 | |
TAX INFORMATION
Pursuant to Section 853 of the Internal Revenue Code, the following amounts have been designated as foreign taxes paid for the fiscal year ended October 31, 2016. These amounts may be less than the actual foreign taxes paid for financial statement purposes. Foreign taxes paid or withheld should be included in taxable income with an offsetting deduction from gross income or as a credit for taxes paid to foreign governments. None of the income was derived from ineligible foreign sources as defined under Section 901(j) of the Internal Revenue Code.
| | | | |
Creditable
foreign taxes paid | | Per share
amount | | Foreign income as % of
ordinary income
distributions |
| $201,663 | | $0.0273 | | 55.49% |
PROXY VOTING INFORMATION
A description of the policies and procedures that the Fund uses to determine how to vote proxies relating to portfolio securities is available, upon request, by calling 1-800-222-8222, visiting our website at wellsfargofunds.com, or visiting the SEC website at sec.gov. Information regarding how the Fund voted proxies relating to portfolio securities during the most recent 12-month period ended June 30 is available on the Fund’s website at wellsfargofunds.com or by visiting the SEC website at sec.gov.
PORTFOLIO HOLDINGS INFORMATION
The complete portfolio holdings for the Fund are publicly available monthly on the Fund’s website (wellsfargofunds.com), on a one-month delayed basis. In addition, top ten holdings information (excluding derivative positions) for the Fund is publicly available on the Fund’s website on a monthly, seven-day or more delayed basis. The Fund files its complete schedule of portfolio holdings with the SEC for the first and third quarters of each fiscal year on Form N-Q, which is available by visiting the SEC website at sec.gov. In addition, the Fund’s Form N-Q may be reviewed and copied at the SEC’s Public Reference Room in Washington, DC, and at regional offices in New York City, at 233 Broadway, and in Chicago, at 175 West Jackson Boulevard, Suite 900. Information about the Public Reference Room may be obtained by calling 1-800-SEC-0330.
| | | | |
| 22 | | Wells Fargo Intrinsic World Equity Fund | | Other information (unaudited) |
BOARD OF TRUSTEES AND OFFICERS
Each of the Trustees and Officers1 listed in the table below acts in identical capacities for each fund in the Wells Fargo family of funds, which consists of 138 mutual funds comprising the Wells Fargo Funds Trust, Wells Fargo Variable Trust, Wells Fargo Master Trust and four closed-end funds (collectively the “Fund Complex”). This table should be read in conjunction with the Prospectus and the Statement of Additional Information2. The mailing address of each Trustee and Officer is 525 Market Street, 12th Floor, San Francisco, CA 94105. Each Trustee and Officer serves an indefinite term, however, each Trustee serves such term until reaching the mandatory retirement age established by the Trustees.
Independent Trustees
| | | | | | |
Name and
year of birth | | Position held and
length of service* | | Principal occupations during past five years or longer | | Current other public company or investment company directorships |
William R. Ebsworth
(Born 1957) | | Trustee, since 2015 | | Retired. From 1984 to 2013, equities analyst, portfolio manager, research director and chief investment officer at Fidelity Management and Research Company in Boston, Tokyo, and Hong Kong and retired in 2013 as Chief Investment Officer of Fidelity Strategic Advisers, Inc. where he led a team of investment professionals managing client assets. Prior thereto, Board member of Hong Kong Securities Clearing Co., Hong Kong Options Clearing Corp., the Thailand International Fund, Ltd., Fidelity Investments Life Insurance Company, and Empire Fidelity Investments Life Insurance Company. Board member of the Forté Foundation (non-profit organization) and the Vincent Memorial Hospital Endowment (non-profit organization), where he serves on the Investment Committee and as a Chair of the Audit Committee. Mr. Ebsworth is a CFA® charterholder. | | Asset Allocation Trust |
Jane A. Freeman
(Born 1953) | | Trustee, since 2015 | | Retired. From 2012 to 2014 and 1999 to 2008, Chief Financial Officer of Scientific Learning Corporation. From 2008 to 2012, Ms. Freeman provided consulting services related to strategic business projects. Prior to 1999, Portfolio Manager at Rockefeller & Co. and Scudder, Stevens & Clark. Board member of the Harding Loevner Funds from 1996 to 2014, serving as both Lead Independent Director and chair of the Audit Committee. Board member of the Russell Exchange Traded Funds Trust from 2011 to 2012 and the chair of the Audit Committee. Ms. Freeman is a Board Member of Ruth Bancroft Garden (non-profit organization) and an inactive chartered financial analyst. | | Asset Allocation Trust |
Peter G. Gordon**
(Born 1942) | | Trustee, since 1998; Chairman, since 2005 | | Co-Founder, Retired Chairman, President and CEO of Crystal Geyser Water Company. Trustee Emeritus, Colby College. | | Asset Allocation Trust |
Isaiah Harris, Jr.
(Born 1952) | | Trustee, since 2009 | | Retired. Chairman of the Board of CIGNA Corporation since 2009, and Director since 2005. From 2003 to 2011, Director of Deluxe Corporation. Prior thereto, President and CEO of BellSouth Advertising and Publishing Corp. from 2005 to 2007, President and CEO of BellSouth Enterprises from 2004 to 2005 and President of BellSouth Consumer Services from 2000 to 2003. Emeritus member of the Iowa State University Foundation Board of Governors. Emeritus Member of the Advisory Board of Iowa State University School of Business. Advisory Board Member, Palm Harbor Academy (charter school). Advisory Board Member, Child Evangelism Fellowship (non-profit). Mr. Harris is a certified public accountant (inactive status). | | CIGNA Corporation; Asset Allocation Trust |
Judith M. Johnson
(Born 1949) | | Trustee, since 2008; Audit Committee Chairman, since 2008 | | Retired. Prior thereto, Chief Executive Officer and Chief Investment Officer of Minneapolis Employees Retirement Fund from 1996 to 2008. Ms. Johnson is an attorney, certified public accountant and a certified managerial accountant. | | Asset Allocation Trust |
David F. Larcker
(Born 1950) | | Trustee, since 2009 | | James Irvin Miller Professor of Accounting at the Graduate School of Business, Stanford University, Director of the Corporate Governance Research Initiative and Senior Faculty of The Rock Center for Corporate Governance since 2006. From 2005 to 2008, Professor of Accounting at the Graduate School of Business, Stanford University. Prior thereto, Ernst & Young Professor of Accounting at The Wharton School, University of Pennsylvania from 1985 to 2005. | | Asset Allocation Trust |
| | | | | | |
| Other information (unaudited) | | Wells Fargo Intrinsic World Equity Fund | | | 23 | |
| | | | | | |
Name and
year of birth | | Position held and
length of service* | | Principal occupations during past five years or longer | | Current other public company or investment company directorships |
Olivia S. Mitchell
(Born 1953) | | Trustee, since 2006 | | International Foundation of Employee Benefit Plans Professor, Wharton School of the University of Pennsylvania since 1993. Director of Wharton’s Pension Research Council and Boettner Center on Pensions & Retirement Research, and Research Associate at the National Bureau of Economic Research. Previously, Cornell University Professor from 1978 to 1993. | | Asset Allocation Trust |
Timothy J. Penny
(Born 1951) | | Trustee, since 1996; Vice Chairman, since 2017 | | President and Chief Executive Officer of Southern Minnesota Initiative Foundation, a non-profit organization, since 2007 and Senior Fellow at the Humphrey Institute Policy Forum at the University of Minnesota since 1995. Member of the Board of Trustees of NorthStar Education Finance, Inc., a non-profit organization, since 2007. | | Asset Allocation Trust |
Michael S. Scofield
(Born 1943) | | Trustee, since 2010 | | Served on the Investment Company Institute’s Board of Governors and Executive Committee from 2008-2011 as well the Governing Council of the Independent Directors Council from 2006-2011 and the Independent Directors Council Executive Committee from 2008-2011. Chairman of the IDC from 2008-2010. Institutional Investor (Fund Directions) Trustee of Year in 2007. Trustee of the Evergreen Funds complex (and its predecessors) from 1984 to 2010. Chairman of the Evergreen Funds from 2000-2010. Former Trustee of the Mentor Funds. Retired Attorney, Law Offices of Michael S. Scofield. | | Asset Allocation Trust |
| * | Length of service dates reflect the Trustee’s commencement of service with the Trust’s predecessor entities, where applicable. |
| ** | Peter Gordon is expected to retire on December 31, 2017. |
Officers
| | | | | | |
Name and
year of birth | | Position held and
length of service | | Principal occupations during past five years or longer | | |
Andrew Owen
(Born 1960) | | President, since 2017 | | Executive Vice President of Wells Fargo & Company and Head of Affiliated Managers, Wells Fargo Asset Management, since 2014. In addition, Mr. Owen is currently President, Chief Executive Officer and Director of Wells Fargo Funds Management, LLC since 2017. Prior thereto, Executive Vice President responsible for marketing, investments and product development for Wells Fargo Funds Management, LLC, from 2009 to 2014. | | |
Jeremy DePalma1
(Born 1974) | | Treasurer, since 2012 | | Senior Vice President of Wells Fargo Funds Management, LLC since 2009. Senior Vice President of Evergreen Investment Management Company, LLC from 2008 to 2010 and head of the Fund Reporting and Control Team within Fund Administration from 2005 to 2010. | | |
C. David Messman
(Born 1960) | | Secretary, since 2000; Chief Legal Officer, since 2003 | | Senior Vice President and Secretary of Wells Fargo Funds Management, LLC since 2001. Assistant General Counsel of Wells Fargo Bank, N.A. since 2013 and Vice President and Managing Counsel of Wells Fargo Bank, N.A. from 1996 to 2013. | | |
Michael Whitaker
(Born 1967) | | Chief Compliance Officer, since 2016 | | Senior Vice President and Chief Compliance Officer since 2016. Senior Vice President and Chief Compliance Officer for Fidelity Investments from 2007 to 2016. | | |
David Berardi
(Born 1975) | | Assistant Treasurer, since 2009 | | Vice President of Wells Fargo Funds Management, LLC since 2009. Vice President of Evergreen Investment Management Company, LLC from 2008 to 2010. Manager of Fund Reporting and Control for Evergreen Investment Management Company, LLC from 2004 to 2010. | | |
| 1 | Jeremy DePalma acts as Treasurer of 69 funds and Assistant Treasurer of 69 funds in the Fund Complex. |
| 2 | The Statement of Additional Information includes additional information about the Trustees and is available, without charge, upon request, by calling
1-800-222-8222 or by visiting the website at wellsfargofunds.com. |
| | | | |
| 24 | | Wells Fargo Intrinsic World Equity Fund | | List of abbreviations |
The following is a list of common abbreviations for terms and entities that may have appeared in this report.
| ACA | — ACA Financial Guaranty Corporation |
| ADR | — American depositary receipt |
| ADS | — American depositary shares |
| AGC | — Assured Guaranty Corporation |
| AGM | — Assured Guaranty Municipal |
| Ambac | — Ambac Financial Group Incorporated |
| AMT | — Alternative minimum tax |
| BAN | — Bond anticipation notes |
| BHAC | — Berkshire Hathaway Assurance Corporation |
| CAB | — Capital appreciation bond |
| CCAB | — Convertible capital appreciation bond |
| CDA | — Community Development Authority |
| CDO | — Collateralized debt obligation |
| DRIVER | — Derivative inverse tax-exempt receipts |
| DW&P | — Department of Water & Power |
| DWR | — Department of Water Resources |
| ECFA | — Educational & Cultural Facilities Authority |
| EDA | — Economic Development Authority |
| EDFA | — Economic Development Finance Authority |
| ETF | — Exchange-traded fund |
| FDIC | — Federal Deposit Insurance Corporation |
| FFCB | — Federal Farm Credit Banks |
| FGIC | — Financial Guaranty Insurance Corporation |
| FHA | — Federal Housing Administration |
| FHLB | — Federal Home Loan Bank |
| FHLMC | — Federal Home Loan Mortgage Corporation |
| FICO | — The Financing Corporation |
| FNMA | — Federal National Mortgage Association |
| GDR | — Global depositary receipt |
| GNMA | — Government National Mortgage Association |
| HCFR | — Healthcare facilities revenue |
| HEFA | — Health & Educational Facilities Authority |
| HEFAR | — Higher education facilities authority revenue |
| HFA | — Housing Finance Authority |
| HFFA | — Health Facilities Financing Authority |
| HUD | — Department of Housing and Urban Development |
| IDA | — Industrial Development Authority |
| IDAG | — Industrial Development Agency |
| KRW | — Republic of Korea won |
| LIBOR | — London Interbank Offered Rate |
| LIFER | — Long Inverse Floating Exempt Receipts |
| LLC | — Limited liability company |
| LLLP | — Limited liability limited partnership |
| LLP | — Limited liability partnership |
| MBIA | — Municipal Bond Insurance Association |
| MFHR | — Multifamily housing revenue |
| MSTR | — Municipal securities trust receipts |
| MUD | — Municipal Utility District |
| National | — National Public Finance Guarantee Corporation |
| PCFA | — Pollution Control Financing Authority |
| PCL | — Public Company Limited |
| PCR | — Pollution control revenue |
| PFA | — Public Finance Authority |
| PFFA | — Public Facilities Financing Authority |
| PFOTER | — Puttable floating option tax-exempt receipts |
| plc | — Public limited company |
| PUTTER | — Puttable tax-exempt receipts |
| R&D | — Research & development |
| Radian | — Radian Asset Assurance |
| RAN | — Revenue anticipation notes |
| RDA | — Redevelopment Authority |
| RDFA | — Redevelopment Finance Authority |
| REIT | — Real estate investment trust |
| ROC | — Reset option certificates |
| SAVRS | — Select auction variable rate securities |
| SBA | — Small Business Authority |
| SDR | — Swedish depositary receipt |
| SFHR | — Single-family housing revenue |
| SFMR | — Single-family mortgage revenue |
| SPA | — Standby purchase agreement |
| SPDR | — Standard & Poor’s Depositary Receipts |
| SPEAR | — Short Puttable Exempt Adjustable Receipts |
| STRIPS | — Separate trading of registered interest and |
| TAN | — Tax anticipation notes |
| TIPS | — Treasury inflation-protected securities |
| TRAN | — Tax revenue anticipation notes |
| TTFA | — Transportation Trust Fund Authority |
| TVA | — Tennessee Valley Authority |

For more information
More information about Wells Fargo Funds is available free upon request. To obtain literature, please write, email, visit the Fund’s website, or call:
Wells Fargo Funds
P.O. Box 8266
Boston, MA 02266-8266
Email: fundservice@wellsfargo.com
Website: wellsfargofunds.com
Individual investors: 1-800-222-8222
Retail investment professionals: 1-888-877-9275
Institutional investment professionals: 1-866-765-0778
This report and the financial statements contained herein are submitted for the general information of the shareholders of the Fund. If this report is used for promotional purposes, distribution of the report must be accompanied or preceded by a current prospectus. Before investing, please consider the investment objectives, risks, charges, and expenses of the investment. For a current prospectus and, if available, a summary prospectus, containing this information, call 1-800-222-8222 or visit the Fund’s website at wellsfargofunds.com. Read the prospectus carefully before you invest or send money.
Wells Fargo Asset Management (WFAM) is a trade name used by the asset management businesses of Wells Fargo & Company. Wells Fargo Funds Management, LLC, a wholly owned subsidiary of Wells Fargo & Company, provides investment advisory and administrative services for Wells Fargo Funds. Other affiliates of Wells Fargo & Company provide subadvisory and other services for the funds. The funds are distributed by Wells Fargo Funds Distributor, LLC, Member FINRA, an affiliate of Wells Fargo & Company. Neither Wells Fargo Funds Management nor Wells Fargo Funds Distributor has Fund customer accounts/assets, and neither provides investment advice/recommendations or acts as an investment advice fiduciary to any investor.
NOT FDIC INSURED ◾ NO BANK GUARANTEE ◾ MAY LOSE VALUE
© 2017 Wells Fargo Funds Management, LLC. All rights reserved.
| | |
 | | 303218 06-17 SA241/SAR241 04-17 |
ITEM 2. CODE OF ETHICS
Not applicable.
ITEM 3. AUDIT COMMITTEE FINANCIAL EXPERT
Not applicable.
ITEM 4. PRINCIPAL ACCOUNTANT FEES AND SERVICES
Not applicable.
ITEM 5. AUDIT COMMITTEE OF LISTED REGISTRANTS
Not applicable.
ITEM 6. INVESTMENTS
A Portfolio of Investments for each series of Wells Fargo Funds Trust is included as part of the report to shareholders filed under Item 1 of this Form.
ITEM 7. DISCLOSURE OF PROXY VOTING POLICIES AND PROCEDURES FOR CLOSED-END MANAGEMENT INVESTMENT COMPANIES
Not applicable.
ITEM 8. PORTFOLIO MANAGERS OF CLOSED-END MANAGEMENT INVESTMENT COMPANIES
Not applicable.
ITEM 9. PURCHASES OF EQUITY SECURITIES BY CLOSED-END MANAGEMENT INVESTMENT COMPANY AND AFFILIATED PURCHASERS
Not applicable.
ITEM 10. SUBMISSION OF MATTERS TO A VOTE OF SECURITY HOLDERS
There have been no material changes to the procedures by which shareholders may recommend nominees to the registrant’s Board of Trustees that have been implemented since the registrant’s last provided disclosure in response to the requirements of this Item.
ITEM 11. CONTROLS AND PROCEDURES
(a) The President and Treasurer have concluded that the Wells Fargo Funds Trust (the “Trust”) disclosure controls and procedures (as defined in Rule 30a-3(c) under the Investment Company Act of 1940) provide reasonable assurances that material information relating to the Trust is made known to them by the appropriate persons, based on their evaluation of these controls and procedures as of a date within 90 days of the filing of this report.
(b) There were no significant changes in the Trust’s internal controls over financial reporting (as defined in Rule 30a-3(d) under the Investment Company Act of 1940) that occurred during the second fiscal quarter of the period covered by this report that materially affected, or is reasonably likely to materially affect, the registrant’s internal control over financial reporting.
ITEM 12. EXHIBITS
(a)(1) Not applicable.
(a)(2) Certification pursuant to Rule 30a-2(a) under the Investment Company Act of 1940 (17 CFR 270.30a-2(a)) is filed and attached hereto as Exhibit 99.CERT.
(a)(3) Not applicable.
(b) Certification pursuant to Rule 30a-2(b) under the Investment Company Act of 1940 (17 CFR 270.30a-2(b)) is filed and attached hereto as Exhibit 99.906CERT.
SIGNATURES
Pursuant to the requirements of the Securities Exchange Act of 1934 and the Investment Company Act of 1940, the registrant has duly caused this report to be signed on its behalf by the undersigned, thereunto duly authorized.
| | |
| Wells Fargo Funds Trust |
| |
| By: | | |
| |
| | /s/ Andrew Owen |
| |
| | Andrew Owen |
| | President |
| |
| Date: | | June 23, 2017 |
Pursuant to the requirements of the Securities Exchange Act of 1934 and the Investment Company Act of 1940, this report has been signed below by the following persons on behalf of the registrant and in the capacities and on the date indicated.
| | |
| Wells Fargo Funds Trust |
|
| By: |
| |
| | /s/ Andrew Owen |
| |
| | Andrew Owen |
| | President |
| |
| Date: | | June 23, 2017 |
|
| By: |
| |
| | /s/ Jeremy DePalma |
| |
| | Jeremy DePalma |
| | Treasurer |
| |
| Date: | | June 23, 2017 |