
UNITED STATES
SECURITIES AND EXCHANGE COMMISSION
Washington, D.C. 20549
FORM N-CSR
CERTIFIED SHAREHOLDER REPORT OF REGISTERED
MANAGEMENT INVESTMENT COMPANIES
Investment Company Act file number: 811-09253
Wells Fargo Funds Trust
(Exact name of registrant as specified in charter)
525 Market St., San Francisco, CA 94105
(Address of principal executive offices) (Zip code)
C. David Messman
Wells Fargo Funds Management, LLC
525 Market St., San Francisco, CA 94105
(Name and address of agent for service)
Registrant’s telephone number, including area code: 800-222-8222
Date of fiscal year end: February 28
Registrant is making a filing for 12 of its series:
Wells Fargo Dow Jones Target Today Fund, Wells Fargo Dow Jones Target 2010 Fund, Wells Fargo Dow Jones Target 2015 Fund, Wells Fargo Dow Jones Target 2020 Fund, Wells Fargo Dow Jones Target 2025 Fund, Wells Fargo Dow Jones Target 2030 Fund, Wells Fargo Dow Jones Target 2035 Fund, Wells Fargo Dow Jones Target 2040 Fund, Wells Fargo Dow Jones Target 2045 Fund, Wells Fargo Dow Jones Target 2050 Fund, Wells Fargo Dow Jones Target 2055 Fund, and Wells Fargo Dow Jones Target 2060 Fund.
Date of reporting period: February 28, 2017
| ITEM 1. | REPORT TO STOCKHOLDERS |
Annual Report
February 28, 2017

Dow Jones Target Date Funds

| ∎ | | Wells Fargo Dow Jones Target Today Fund |
| ∎ | | Wells Fargo Dow Jones Target 2010 Fund |
| ∎ | | Wells Fargo Dow Jones Target 2015 Fund |
| ∎ | | Wells Fargo Dow Jones Target 2020 Fund |
| ∎ | | Wells Fargo Dow Jones Target 2025 Fund |
| ∎ | | Wells Fargo Dow Jones Target 2030 Fund |
| ∎ | | Wells Fargo Dow Jones Target 2035 Fund |
| ∎ | | Wells Fargo Dow Jones Target 2040 Fund |
| ∎ | | Wells Fargo Dow Jones Target 2045 Fund |
| ∎ | | Wells Fargo Dow Jones Target 2050 Fund |
| ∎ | | Wells Fargo Dow Jones Target 2055 Fund |
| ∎ | | Wells Fargo Dow Jones Target 2060 Fund |

Reduce clutter. Save trees.
Sign up for electronic delivery of prospectuses and shareholder reports at wellsfargo.com/advantagedelivery
Contents
| * | A complete schedule of portfolio holdings as of the report date may be obtained, free of charge, by accessing the following website: https://www.wellsfargofunds.com/assets/edocs/regulatory/holdings/diversified-fixed-income-ann.pdf or by calling Wells Fargo Funds at 1-800-222-8222. This complete schedule, filed on Form N-CSR, is also available on the SEC’s website at sec.gov. |
| ** | A complete schedule of portfolio holdings as of the report date may be obtained, free of charge, by accessing the following website: https://www.wellsfargofunds.com/assets/edocs/regulatory/holdings/diversified-stock-ann.pdf or by calling Wells Fargo Funds at 1-800-222-8222. This complete schedule, filed on Form N-CSR, is also available on the SEC’s website at sec.gov. |
Dow Jones® and Dow Jones Global Target Date IndexesSM are service marks of Dow Jones Trademark Holdings LLC (Dow Jones); have been licensed to CME Group Index Services LLC (CME Indexes); and have been sublicensed for use for certain purposes by Global Index Advisors, Inc., and Wells Fargo Funds Management, LLC. The Wells Fargo Dow Jones Target Date Funds, based on the Dow Jones Global Target Date IndexesSM, are not sponsored, endorsed, sold, or promoted by Dow Jones, CME Indexes, or their respective affiliates, and none of them makes any representation regarding the advisability of investing in such product(s).
The views expressed and any forward-looking statements are as of February 28, 2017, unless otherwise noted, and are those of the Fund managers and/or Wells Fargo Funds Management, LLC. Discussions of individual securities, or the markets generally, or any Wells Fargo Fund are not intended as individual recommendations. Future events or results may vary significantly from those expressed in any forward-looking statements. The views expressed are subject to change at any time in response to changing circumstances in the market. Wells Fargo Funds Management, LLC and the Fund disclaim any obligation to publicly update or revise any views expressed or forward-looking statements.
NOT FDIC INSURED ◾ NO BANK GUARANTEE ◾ MAY LOSE VALUE
| | | | |
| 2 | | Wells Fargo Dow Jones Target Date Funds | | Letter to shareholders (unaudited) |

Andrew Owen
President
Wells Fargo Funds
U.S. and international stocks returned 24.98% and 19.31% for the 12-month period, respectively; within fixed income, the Bloomberg Barclays U.S. Aggregate Bond Index3 returned 1.42%.
Dear Shareholder:
As the new president of Wells Fargo Funds now that Karla Rabusch is retiring from that position after nearly 14 years, I am pleased to offer you this annual report for the Wells Fargo Dow Jones Target Date Funds for the 12-month period that ended February 28, 2017. Despite heightened market volatility at times, global stocks delivered strong results overall. U.S. and international stocks returned 24.98% and 19.31% for the 12-month period, respectively, as measured by the S&P 500 Index1 and the MSCI ACWI ex USA Index (Net)2; within fixed income, the Bloomberg Barclays U.S. Aggregate Bond Index3 returned 1.42%.
Interest rates and the U.K.’s Brexit vote largely drove markets from March 2016 through the end of June 2016.
U.S. stocks overall were in positive territory in March and April, plunged briefly in May on worries of a possible June interest-rate increase, and then rallied until early June. The first three weeks of June brought heightened volatility, spurred largely by a disappointing jobs report and uncertainty over whether the U.K. would remain in the European Union (E.U.). The U.K.’s Brexit vote on June 23 shocked countries worldwide. Stock markets fell as investors worried that the U.K.’s departure from the E.U. would slow global growth and prolong the low-interest-rate environment. Following the initial rout, however, U.S. stocks rose as investors seemed to decide that any negative effects would be more localized and not create a serious risk for global growth. In March, China’s government set an anticipated growth rate of 6.5% to 7.0% for 2016, an acknowledgment of weakening growth. In emerging markets, although central-bank stimulus and improved prices for oil and other commodities led to stock rallies in March, many of these countries’ economies faced the potential of credit downgrades due to challenges such as the likelihood of a stronger U.S. dollar, which would make dollar-denominated debt more expensive. Within fixed income, government bonds rallied immediately post-Brexit, and non-Treasury sectors rallied soon after as investors regained their appetite for risk. As a result, most bond markets remained in a situation of ultralow yields and tight credit spreads. Interestingly, U.S. bonds continued to be supported by demand from both domestic and foreign buyers looking for positive yield since U.S. interest rates were the highest among developed-country bonds. Also notable was the rebound in oil prices to nearly $50 per barrel in June, driven by a lower rig count, unplanned supply outages, anticipated demand ahead of the summer driving season, and a weaker dollar.
Globally, stocks delivered positive results in the third quarter of 2016; bonds’ interest rates remained low.
Stocks’ upward trend continued into August and then lost some steam. Ever since the Great Recession, markets worldwide have been supported to varying degrees by accommodative policies from leading central banks, including the Federal
| 1 | The S&P 500 Index consists of 500 stocks chosen for market size, liquidity, and industry group representation. It is a market-value-weighted index with each stock’s weight in the index proportionate to its market value. You cannot invest directly in an index. |
| 2 | The Morgan Stanley Capital International (MSCI) All Country World Index (ACWI) ex USA Index (Net) is a free-float-adjusted market-capitalization-weighted index that is designed to measure the equity market performance of developed markets, excluding the United States and Canada. Source: MSCI. MSCI makes no express or implied warranties or representations and shall have no liability whatsoever with respect to any MSCI data contained herein. The MSCI data may not be further redistributed or used as a basis for other indexes or any securities or financial products. This report is not approved, reviewed, or produced by MSCI. You cannot invest directly in an index. |
| 3 | The Bloomberg Barclays U.S. Aggregate Bond Index (formerly known as Barclays U.S. Aggregate Bond Index) is a broad-based benchmark that measures the investment-grade, U.S. dollar–denominated, fixed-rate taxable bond market, including Treasuries, government-related and corporate securities, mortgage-backed securities (agency fixed-rate and hybrid adjustable-rate mortgage pass-throughs), asset-backed securities, and commercial mortgage-backed securities. You cannot invest directly in an index. |
| | | | | | |
| Letter to shareholders (unaudited) | | Wells Fargo Dow Jones Target Date Funds | | | 3 | |
Reserve (Fed), European Central Bank, Bank of England, and Bank of Japan. As a result, investors have watched closely for any signs that global central banks might tighten their measures. In the U.S., early-September comments by several Fed officials appeared to suggest a September interest-rate increase, which sent stock and bond prices down. However, stocks surged following the Fed’s September 20 meeting on news that the Fed had decided to delay a rate increase to later in 2016. In bond markets, interest rates rose during the quarter but remained at historically low levels as a result of easy monetary policies, subdued global growth, and modest inflation expectations. After bottoming in early July, yields began to rise again as market participants felt that yields had overshot the real risks of the U.K.’s Brexit vote and as economic activity strengthened. At the front end of the yield curve, implementation of new money market fund rules resulted in significantly higher yields on many short-term securities.
During the fourth quarter of 2016, prospects for faster growth and higher interest rates in the U.S. influenced markets.
Early in the fourth quarter of 2016, U.S. stocks tended to trade lower amid concerns such as a likely interest-rate increase and uncertainty over the approaching general election. However, following Donald Trump’s election as president in early November, U.S. stocks began to rally. Investors appeared optimistic that the new administration would usher in a series of pro-growth policies, and supportive economic news helped the rally carry through the quarter. The buoyant environment sent interest rates higher as well. At its mid-December meeting, Fed officials raised their short-term target interest rate for the first time in a year, by a quarter percentage point, to between 0.50% and 0.75%. The fourth quarter also saw the implementation of the Securities and Exchange Commission’s new rules for money market funds, which included floating net asset values (NAVs) for institutional prime and municipal money market funds as well as liquidity fees and redemption gates. In the year leading up to money fund reform implementation, nearly $1 trillion in assets moved from these types of money market funds into government money market funds, which continued to transact at a stable $1 NAV. Outside of the U.S., the prospects for faster U.S. growth appeared to trigger some acceleration in Europe. The improvement may be partly attributable to expectations for further strengthening of the U.S. dollar, which in turn could improve demand for European goods in the U.S. due to weakening of the euro relative to the dollar.
Investor optimism continued into February 2017.
January and February brought continued strength in global stock markets. Markets were lifted by factors such as strong trade data from Japan, robust earnings reports by businesses, and investors’ hopes that the U.S. government will approve a large fiscal stimulus package. Within fixed income, short-term interest rates rose modestly during these two months in anticipation of Fed interest-rate hikes. Meanwhile, 10-year Treasury yields ranged between 2.30% and 2.55%, appearing to plateau after the fourth quarter’s sell-off. Spreads of both investment-grade and high-yield bonds compressed slightly, and both taxable and municipal bond mutual fund flows were positive.
| | | | |
| 4 | | Wells Fargo Dow Jones Target Date Funds | | Letter to shareholders (unaudited) |
Don’t let short-term uncertainty derail long-term investment goals.
Periods of uncertainty can present challenges, but experience has taught us that maintaining long-term investment goals can be an effective way to plan for the future. To help you create a sound strategy based on your personal goals and risk tolerance, Wells Fargo Funds offers more than 100 mutual funds spanning a wide range of asset classes and investment styles. Although diversification cannot guarantee an investment profit or prevent losses, we believe it can be an effective way to manage investment risk and potentially smooth out overall portfolio performance. We encourage investors to know their investments and to understand that appropriate levels of risk-taking may unlock opportunities.
Thank you for choosing to invest in Wells Fargo Funds. We appreciate your confidence in us and remain committed to helping you meet your financial needs.
Sincerely,

Andrew Owen
President
Wells Fargo Funds
Although diversification cannot guarantee an investment profit or prevent losses, we believe it can be an effective way to manage investment risk and potentially smooth out overall portfolio performance.
For further information about your Fund, contact your investment professional, visit our website at wellsfargofunds.com, or call us directly at 1-800-222-8222. We are available 24 hours a day, 7 days a week.
This page is intentionally left blank.
| | | | |
| 6 | | Wells Fargo Dow Jones Target Date Funds | | Performance highlights (unaudited) |
Wells Fargo Dow Jones Target Date Funds1
Investment objective
Each Fund’s objective is to approximate, before fees and expenses, the total return of the appropriate Dow Jones Global Target Date Index as specified in the following table:
| | |
Wells Fargo Dow Jones
Target Date Funds | | Corresponding Dow Jones
Global Target Date Index |
| Target Today Fund | | Dow Jones Global Target Today Index |
| Target 2010 Fund | | Dow Jones Global Target 2010 Index |
| Target 2015 Fund | | Dow Jones Global Target 2015 Index |
| Target 2020 Fund | | Dow Jones Global Target 2020 Index |
| Target 2025 Fund | | Dow Jones Global Target 2025 Index |
| Target 2030 Fund | | Dow Jones Global Target 2030 Index |
| Target 2035 Fund | | Dow Jones Global Target 2035 Index |
| Target 2040 Fund | | Dow Jones Global Target 2040 Index |
| Target 2045 Fund | | Dow Jones Global Target 2045 Index |
| Target 2050 Fund | | Dow Jones Global Target 2050 Index |
| Target 2055 Fund | | Dow Jones Global Target 2055 Index |
| Target 2060 Fund | | Dow Jones Global Target 2060 Index |
Manager
Wells Fargo Funds Management, LLC
Subadviser
Global Index Advisors, Inc.
Portfolio managers
Rodney H. Alldredge
James P. Lauder
Paul T. Torregrosa, Ph.D.
The target date represents the year in which investors may likely begin withdrawing assets. The Funds gradually seek to reduce market risk as the target date approaches and after it arrives by decreasing equity exposure and increasing fixed income exposure. The principal value is not guaranteed at any time, including at the target date.
Stock values fluctuate in response to the activities of individual companies and general market and economic conditions. Bond values fluctuate in response to the financial condition of individual issuers, general market and economic conditions, and changes in interest rates. Changes in market conditions and government policies may lead to periods of heightened volatility in the bond market and reduced liquidity for certain bonds held by the Funds. In general, when interest rates rise, bond values fall and investors may lose principal value. Interest-rate changes and their impact on each Fund and its share price can be sudden and unpredictable. The use of derivatives may reduce returns and/or increase volatility. Securities issued by U.S. government agencies or government-sponsored entities may not be guaranteed by the U.S. Treasury. Certain investment strategies tend to increase the total risk of an investment (relative to the broader market). The Funds are exposed to foreign investment risk, mortgage- and asset-backed securities risk, smaller-company investment risk, and allocation methodology risk (risk that the allocation methodology of the Dow Jones Global Target Date Index, whose total returns the Fund seeks to approximate, before fees and expenses, will not meet an investor’s goals). Consult the Funds’ prospectus for additional information on these and other risks.
Please see footnotes on pages 22-23.
| | | | | | |
| Performance highlights (unaudited) | | Wells Fargo Dow Jones Target Date Funds | | | 7 | |
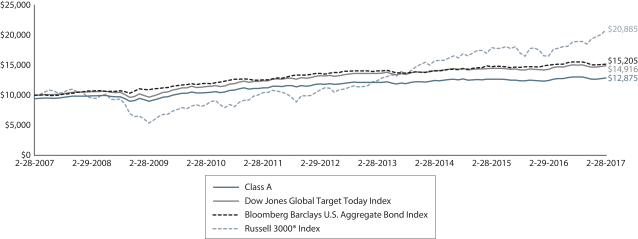
Target Today Fund
Average annual total returns (%) as of February 28, 20172
| | | | | | | | | | | | | | | | | | | | | | | | | | | | | | | | | | |
| | | | | Including sales charge | | | Excluding sales charge | | | Expense ratios3 (%) | |
| | | Inception date | | 1 year | | | 5 year | | | 10 year | | | 1 year | | | 5 year | | | 10 year | | | Gross | | | Net4 | |
| Class A (STWRX) | | 3-1-1994 | | | (2.60 | ) | | | 0.45 | | | | 2.56 | | | | 3.39 | | | | 1.64 | | | | 3.16 | | | | 0.84 | | | | 0.76 | |
| Class C (WFODX) | | 12-1-1998 | | | 1.57 | | | | 0.88 | | | | 2.39 | | | | 2.57 | | | | 0.88 | | | | 2.39 | | | | 1.59 | | | | 1.51 | |
| Class R (WFRRX) | | 6-28-2013 | | | – | | | | – | | | | – | | | | 3.13 | | | | 1.44 | | | | 3.04 | | | | 1.09 | | | | 1.01 | |
| Class R4 (WOTRX) | | 11-30-2012 | | | – | | | | – | | | | – | | | | 3.71 | | | | 2.03 | | | | 3.62 | | | | 0.56 | | | | 0.45 | |
| Class R6 (WOTDX) | | 6-30-2004 | | | – | | | | – | | | | – | | | | 3.81 | | | | 2.15 | | | | 3.68 | | | | 0.41 | | | | 0.30 | |
| Administrator Class (WFLOX) | | 11-8-1999 | | | – | | | | – | | | | – | | | | 3.41 | | | | 1.77 | | | | 3.35 | | | | 0.76 | | | | 0.65 | |
| Dow Jones Global Target Today Index5 | | – | | | – | | | | – | | | | – | | | | 4.05 | | | | 2.41 | | | | 4.08 | | | | – | | | | – | |
| Bloomberg Barclays U.S. Aggregate Bond Index6 | | – | | | – | | | | – | | | | – | | | | 1.42 | | | | 2.24 | | | | 4.28 | | | | – | | | | – | |
| Russell 3000® Index7 | | – | | | – | | | | – | | | | – | | | | 26.29 | | | | 13.85 | | | | 7.64 | | | | – | | | | – | |
Figures quoted represent past performance, which is no guarantee of future results, and do not reflect taxes that a shareholder may pay on fund distributions or the redemption of fund shares. Investment return and principal value of an investment will fluctuate so that an investor’s shares, when redeemed, may be worth more or less than their original cost. Performance shown without sales charges would be lower if sales charges were reflected. Current performance may be lower or higher than the performance data quoted and assumes the reinvestment of dividends and capital gains. Current month-end performance is available on the Fund’s website, wellsfargofunds.com.
Index returns do not include transaction costs associated with buying and selling securities, any mutual fund fees or expenses, or any taxes. It is not possible to invest directly in an index.
For Class A shares, the maximum front-end sales charge is 5.75%. For Class C shares, the maximum contingent deferred sales charge is 1.00%. Performance including a contingent deferred sales charge assumes the sales charge for the corresponding time period. Class R, Class R4, Class R6, and Administrator Class shares are sold without a front-end sales charge or contingent deferred sales charge.
| | |
| Growth of $10,000 investment as of February 28, 20178 |
| |
| | |
Please see footnotes on pages 22-23.
| | | | |
| 8 | | Wells Fargo Dow Jones Target Date Funds | | Performance highlights (unaudited) |
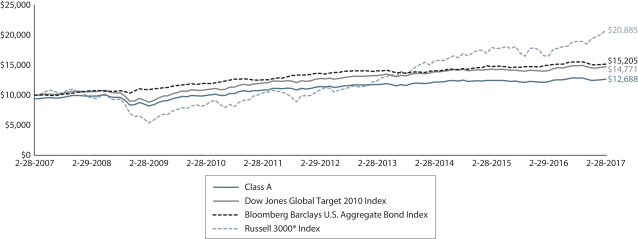
Target 2010 Fund
Average annual total returns (%) as of February 28, 20179
| | | | | | | | | | | | | | | | | | | | | | | | | | | | | | | | | | |
| | | | | Including sales charge | | | Excluding sales charge | | | Expense ratios3 (%) | |
| | | Inception date | | 1 year | | | 5 year | | | 10 year | | | 1 year | | | 5 year | | | 10 year | | | Gross | | | Net4 | |
| Class A (STNRX) | | 3-1-1994 | | | (2.27 | ) | | | 0.90 | | | | 2.41 | | | | 3.71 | | | | 2.10 | | | | 3.01 | | | | 0.85 | | | | 0.78 | |
| Class C (WFOCX) | | 12-1-1998 | | | 1.96 | | | | 1.34 | | | | 2.25 | | | | 2.96 | | | | 1.34 | | | | 2.25 | | | | 1.60 | | | | 1.53 | |
| Class R (WFARX) | | 6-28-2013 | | | – | | | | – | | | | – | | | | 3.45 | | | | 1.88 | | | | 2.88 | | | | 1.10 | | | | 1.03 | |
| Class R4 (WFORX) | | 11-30-2012 | | | – | | | | – | | | | – | | | | 4.11 | | | | 2.49 | | | | 3.49 | | | | 0.57 | | | | 0.47 | |
| Class R6 (WFOAX) | | 6-30-2004 | | | – | | | | – | | | | – | | | | 4.27 | | | | 2.61 | | | | 3.55 | | | | 0.42 | | | | 0.32 | |
| Administrator Class (WFLGX) | | 11-8-1999 | | | – | | | | – | | | | – | | | | 3.84 | | | | 2.26 | | | | 3.21 | | | | 0.77 | | | | 0.67 | |
| Dow Jones Global Target 2010 Index5 | | – | | | – | | | | – | | | | – | | | | 4.49 | | | | 2.92 | | | | 3.98 | | | | – | | | | – | |
| Bloomberg Barclays U.S. Aggregate Bond Index6 | | – | | | – | | | | – | | | | – | | | | 1.42 | | | | 2.24 | | | | 4.28 | | | | – | | | | – | |
| Russell 3000® Index7 | | – | | | – | | | | – | | | | – | | | | 26.29 | | | | 13.85 | | | | 7.64 | | | | – | | | | – | |
Figures quoted represent past performance, which is no guarantee of future results, and do not reflect taxes that a shareholder may pay on fund distributions or the redemption of fund shares. Investment return and principal value of an investment will fluctuate so that an investor’s shares, when redeemed, may be worth more or less than their original cost. Performance shown without sales charges would be lower if sales charges were reflected. Current performance may be lower or higher than the performance data quoted and assumes the reinvestment of dividends and capital gains. Current month-end performance is available on the Fund’s website, wellsfargofunds.com.
Index returns do not include transaction costs associated with buying and selling securities, any mutual fund fees or expenses, or any taxes. It is not possible to invest directly in an index.
For Class A shares, the maximum front-end sales charge is 5.75%. For Class C shares, the maximum contingent deferred sales charge is 1.00%. Performance including a contingent deferred sales charge assumes the sales charge for the corresponding time period. Class R, Class R4, Class R6, and Administrator Class shares are sold without a front-end sales charge or contingent deferred sales charge.
|
| Growth of $10,000 investment as of February 28, 20178 |
|
|
Please see footnotes on pages 22-23.
| | | | | | |
| Performance highlights (unaudited) | | Wells Fargo Dow Jones Target Date Funds | | | 9 | |
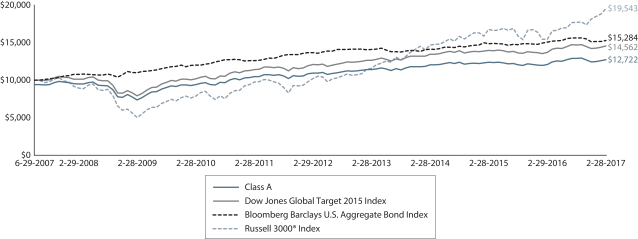
Target 2015 Fund
Average annual total returns (%) as of February 28, 201710
| | | | | | | | | | | | | | | | | | | | | | | | | | | | | | | | | | |
| | | | | Including sales charge | | | Excluding sales charge | | | Expense ratios11 (%) | |
| | | Inception date | | 1 year | | | 5 year | | | Since
inception | | | 1 year | | | 5 year | | | Since
inception | | | Gross | | | Net4 | |
| Class A (WFACX) | | 11-30-2012 | | | (0.73 | ) | | | 1.80 | | | | 2.52 | | | | 5.30 | | | | 3.02 | | | | 3.15 | | | | 0.84 | | | | 0.79 | |
| Class R (WFBRX) | | 6-28-2013 | | | – | | | | – | | | | – | | | | 4.99 | | | | 2.73 | | | | 2.91 | | | | 1.09 | | | | 1.04 | |
| Class R4 (WFSRX) | | 11-30-2012 | | | – | | | | – | | | | – | | | | 5.57 | | | | 3.36 | | | | 3.46 | | | | 0.56 | | | | 0.48 | |
| Class R6 (WFSCX) | | 6-29-2007 | | | – | | | | – | | | | – | | | | 5.74 | | | | 3.46 | | | | 3.51 | | | | 0.41 | | | | 0.33 | |
| Administrator Class (WFFFX) | | 6-29-2007 | | | – | | | | – | | | | – | | | | 5.52 | | | | 3.12 | | | | 3.21 | | | | 0.76 | | | | 0.68 | |
| Dow Jones Global Target 2015 Index5 | | – | | | – | | | | – | | | | – | | | | 6.12 | | | | 3.81 | | | | 3.96 | * | | | – | | | | – | |
| Bloomberg Barclays U.S. Aggregate Bond Index6 | | – | | | – | | | | – | | | | – | | | | 1.42 | | | | 2.24 | | | | 4.49 | * | | | – | | | | – | |
| Russell 3000® Index7 | | – | | | – | | | | – | | | | – | | | | 26.29 | | | | 13.85 | | | | 7.18 | * | | | – | | | | – | |
| * | | Based on the inception date of the oldest class. |
Figures quoted represent past performance, which is no guarantee of future results, and do not reflect taxes that a shareholder may pay on fund distributions or the redemption of fund shares. Investment return and principal value of an investment will fluctuate so that an investor’s shares, when redeemed, may be worth more or less than their original cost. Performance shown without sales charges would be lower if sales charges were reflected. Current performance may be lower or higher than the performance data quoted and assumes the reinvestment of dividends and capital gains. Current month-end performance is available on the Fund’s website, wellsfargofunds.com.
Index returns do not include transaction costs associated with buying and selling securities, any mutual fund fees or expenses, or any taxes. It is not possible to invest directly in an index.
For Class A shares, the maximum front-end sales charge is 5.75%. Class R, Class R4, Class R6, and Administrator Class shares are sold without a front-end sales charge or contingent deferred sales charge.
|
| Growth of $10,000 investment as of February 28, 20178 |
|
|
Please see footnotes on pages 22-23.
| | | | |
| 10 | | Wells Fargo Dow Jones Target Date Funds | | Performance highlights (unaudited) |
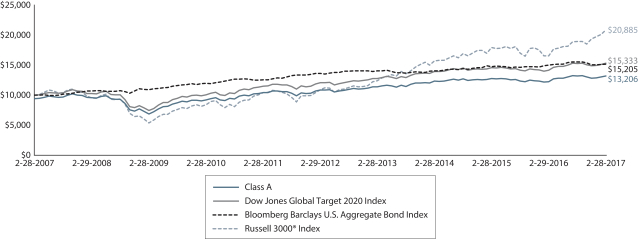
Target 2020 Fund
Average annual total returns (%) as of February 28, 20172
| | | | | | | | | | | | | | | | | | | | | | | | | | | | | | | | | | |
| | | | | Including sales charge | | | Excluding sales charge | | | Expense ratios11 (%) | |
| | | Inception date | | 1 year | | | 5 year | | | 10 year | | | 1 year | | | 5 year | | | 10 year | | | Gross | | | Net4 | |
| Class A (STTRX) | | 3-1-1994 | | | 1.32 | | | | 2.76 | | | | 2.82 | | | | 7.53 | | | | 3.99 | | | | 3.43 | | | | 0.83 | | | | 0.81 | |
| Class C (WFLAX) | | 12-1-1998 | | | 5.71 | | | | 3.22 | | | | 2.66 | | | | 6.71 | | | | 3.22 | | | | 2.66 | | | | 1.58 | | | | 1.56 | |
| Class R (WFURX) | | 6-28-2013 | | | – | | | | – | | | | – | | | | 7.27 | | | | 3.78 | | | | 3.31 | | | | 1.08 | | | | 1.06 | |
| Class R4 (WFLRX) | | 11-30-2012 | | | – | | | | – | | | | – | | | | 7.89 | | | | 4.39 | | | | 3.90 | | | | 0.55 | | | | 0.50 | |
| Class R6 (WFOBX) | | 6-30-2004 | | | – | | | | – | | | | – | | | | 8.04 | | | | 4.50 | | | | 3.96 | | | | 0.40 | | | | 0.35 | |
| Administrator Class (WFLPX) | | 11-8-1999 | | | – | | | | – | | | | – | | | | 7.58 | | | | 4.13 | | | | 3.63 | | | | 0.75 | | | | 0.70 | |
| Dow Jones Global Target 2020 Index5 | | – | | | – | | | | – | | | | – | | | | 8.40 | | | | 4.86 | | | | 4.37 | | | | – | | | | – | |
| Bloomberg Barclays U.S. Aggregate Bond Index6 | | – | | | – | | | | – | | | | – | | | | 1.42 | | | | 2.24 | | | | 4.28 | | | | – | | | | – | |
| Russell 3000® Index7 | | – | | | – | | | | – | | | | – | | | | 26.29 | | | | 13.85 | | | | 7.64 | | | | – | | | | – | |
Figures quoted represent past performance, which is no guarantee of future results, and do not reflect taxes that a shareholder may pay on fund distributions or the redemption of fund shares. Investment return and principal value of an investment will fluctuate so that an investor’s shares, when redeemed, may be worth more or less than their original cost. Performance shown without sales charges would be lower if sales charges were reflected. Current performance may be lower or higher than the performance data quoted and assumes the reinvestment of dividends and capital gains. Current month-end performance is available on the Fund’s website, wellsfargofunds.com.
Index returns do not include transaction costs associated with buying and selling securities, any mutual fund fees or expenses, or any taxes. It is not possible to invest directly in an index.
For Class A shares, the maximum front-end sales charge is 5.75%. For Class C shares, the maximum contingent deferred sales charge is 1.00%. Performance including a contingent deferred sales charge assumes the sales charge for the corresponding time period. Class R, Class R4, Class R6, and Administrator Class shares are sold without a front-end sales charge or contingent deferred sales charge.
|
| Growth of $10,000 investment as of February 28, 20178 |
|
|
Please see footnotes on pages 22-23.
| | | | | | |
| Performance highlights (unaudited) | | Wells Fargo Dow Jones Target Date Funds | | | 11 | |
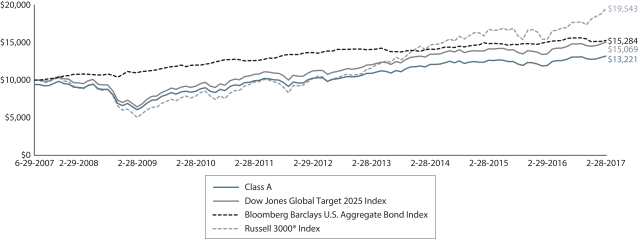
Target 2025 Fund
Average annual total returns (%) as of February 28, 201710
| | | | | | | | | | | | | | | | | | | | | | | | | | | | | | | | | | |
| | | | | Including sales charge | | | Excluding sales charge | | | Expense ratios11 (%) | |
| | | Inception date | | 1 year | | | 5 year | | | Since
inception | | | 1 year | | | 5 year | | | Since
inception | | | Gross | | | Net4 | |
| Class A (WFAYX) | | 11-30-2012 | | | 4.21 | | | | 3.95 | | | | 2.93 | | | | 10.61 | | | | 5.19 | | | | 3.56 | | | | 0.83 | | | | 0.81 | |
| Class R (WFHRX) | | 6-28-2013 | | | – | | | | – | | | | – | | | | 10.22 | | | | 4.92 | | | | 3.33 | | | | 1.08 | | | | 1.06 | |
| Class R4 (WFGRX) | | 11-30-2012 | | | – | | | | – | | | | – | | | | 10.98 | | | | 5.56 | | | | 3.89 | | | | 0.55 | | | | 0.50 | |
| Class R6 (WFTYX) | | 6-29-2007 | | | – | | | | – | | | | – | | | | 11.04 | | | | 5.67 | | | | 3.95 | | | | 0.40 | | | | 0.35 | |
| Administrator Class (WFTRX) | | 6-29-2007 | | | – | | | | – | | | | – | | | | 10.87 | | | | 5.31 | | | | 3.65 | | | | 0.75 | | | | 0.70 | |
| Dow Jones Global Target 2025 Index5 | | – | | | – | | | | – | | | | – | | | | 11.48 | | | | 6.03 | | | | 4.33 | * | | | – | | | | – | |
| Bloomberg Barclays U.S. Aggregate Bond Index6 | | – | | | – | | | | – | | | | – | | | | 1.42 | | | | 2.24 | | | | 4.49 | * | | | – | | | | – | |
| Russell 3000® Index7 | | – | | | – | | | | – | | | | – | | | | 26.29 | | | | 13.85 | | | | 7.18 | * | | | – | | | | – | |
| * | | Based on the inception date of the oldest class. |
Figures quoted represent past performance, which is no guarantee of future results, and do not reflect taxes that a shareholder may pay on fund distributions or the redemption of fund shares. Investment return and principal value of an investment will fluctuate so that an investor’s shares, when redeemed, may be worth more or less than their original cost. Performance shown without sales charges would be lower if sales charges were reflected. Current performance may be lower or higher than the performance data quoted and assumes the reinvestment of dividends and capital gains. Current month-end performance is available on the Fund’s website, wellsfargofunds.com.
Index returns do not include transaction costs associated with buying and selling securities, any mutual fund fees or expenses, or any taxes. It is not possible to invest directly in an index.
For Class A shares, the maximum front-end sales charge is 5.75%. Class R, Class R4, Class R6, and Administrator Class shares are sold without a front-end sales charge or contingent deferred sales charge.
|
| Growth of $10,000 investment as of February 28, 20178 |
|
|
Please see footnotes on pages 22-23.
| | | | |
| 12 | | Wells Fargo Dow Jones Target Date Funds | | Performance highlights (unaudited) |
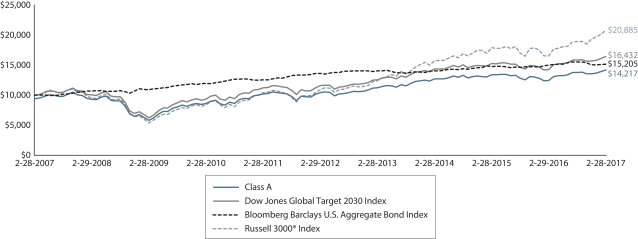
Target 2030 Fund
Average annual total returns (%) as of February 28, 20172
| | | | | | | | | | | | | | | | | | | | | | | | | | | | | | | | | | |
| | | | | Including sales charge | | | Excluding sales charge | | | Expense ratios11 (%) | |
| | | Inception date | | 1 year | | | 5 year | | | 10 year | | | 1 year | | | 5 year | | | 10 year | | | Gross | | | Net4 | |
| Class A (STHRX) | | 3-1-1994 | | | 7.56 | | | | 5.06 | | | | 3.58 | | | | 14.15 | | | | 6.31 | | | | 4.19 | | | | 0.83 | | | | 0.82 | |
| Class C (WFDMX) | | 12-1-1998 | | | 12.28 | | | | 5.52 | | | | 3.42 | | | | 13.28 | | | | 5.52 | | | | 3.42 | | | | 1.58 | | | | 1.57 | |
| Class R (WFJRX) | | 6-28-2013 | | | – | | | | – | | | | – | | | | 13.88 | | | | 6.10 | | | | 4.07 | | | | 1.08 | | | | 1.07 | |
| Class R4 (WTHRX) | | 11-30-2012 | | | – | | | | – | | | | – | | | | 14.52 | | | | 6.73 | | | | 4.67 | | | | 0.55 | | | | 0.51 | |
| Class R6 (WFOOX) | | 6-30-2004 | | | – | | | | – | | | | – | | | | 14.63 | | | | 6.83 | | | | 4.72 | | | | 0.40 | | | | 0.36 | |
| Administrator Class (WFLIX) | | 11-8-1999 | | | – | | | | – | | | | – | | | | 14.32 | | | | 6.47 | | | | 4.39 | | | | 0.75 | | | | 0.71 | |
| Dow Jones Global Target 2030 Index5 | | – | | | – | | | | – | | | | – | | | | 15.02 | | | | 7.19 | | | | 5.09 | | | | – | | | | – | |
| Bloomberg Barclays U.S. Aggregate Bond Index6 | | – | | | – | | | | – | | | | – | | | | 1.42 | | | | 2.24 | | | | 4.28 | | | | – | | | | – | |
| Russell 3000® Index7 | | – | | | – | | | | – | | | | – | | | | 26.29 | | | | 13.85 | | | | 7.64 | | | | – | | | | – | |
Figures quoted represent past performance, which is no guarantee of future results, and do not reflect taxes that a shareholder may pay on fund distributions or the redemption of fund shares. Investment return and principal value of an investment will fluctuate so that an investor’s shares, when redeemed, may be worth more or less than their original cost. Performance shown without sales charges would be lower if sales charges were reflected. Current performance may be lower or higher than the performance data quoted and assumes the reinvestment of dividends and capital gains. Current month-end performance is available on the Fund’s website, wellsfargofunds.com.
Index returns do not include transaction costs associated with buying and selling securities, any mutual fund fees or expenses, or any taxes. It is not possible to invest directly in an index.
For Class A shares, the maximum front-end sales charge is 5.75%. For Class C shares, the maximum contingent deferred sales charge is 1.00%. Performance including a contingent deferred sales charge assumes the sales charge for the corresponding time period. Class R, Class R4, Class R6, and Administrator Class shares are sold without a front-end sales charge or contingent deferred sales charge.
|
| Growth of $10,000 investment as of February 28, 20178 |
|
|
Please see footnotes on pages 22-23.
| | | | | | |
| Performance highlights (unaudited) | | Wells Fargo Dow Jones Target Date Funds | | | 13 | |
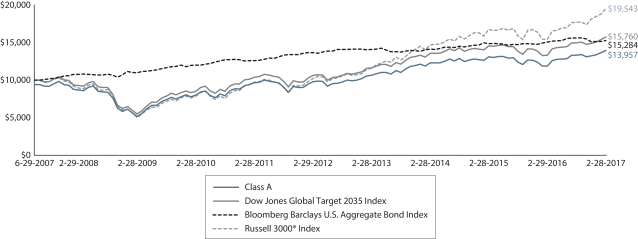
Target 2035 Fund
Average annual total returns (%) as of February 28, 201710
| | | | | | | | | | | | | | | | | | | | | | | | | | | | | | | | | | |
| | | | | Including sales charge | | | Excluding sales charge | | | Expense ratios11 (%) | |
| | | Inception date | | 1 year | | | 5 year | | | Since
inception | | | 1 year | | | 5 year | | | Since
inception | | | Gross | | | Net4 | |
| Class A (WFQBX) | | 11-30-2012 | | | 10.62 | | | | 6.04 | | | | 3.51 | | | | 17.33 | | | | 7.30 | | | | 4.14 | | | | 0.84 | | | | 0.83 | |
| Class R (WFKRX) | | 6-28-2013 | | | – | | | | – | | | | – | | | | 17.09 | | | | 7.02 | | | | 3.87 | | | | 1.09 | | | | 1.08 | |
| Class R4 (WTTRX) | | 11-30-2012 | | | – | | | | – | | | | – | | | | 17.68 | | | | 7.66 | | | | 4.46 | | | | 0.56 | | | | 0.52 | |
| Class R6 (WFQRX) | | 6-29-2007 | | | – | | | | – | | | | – | | | | 17.86 | | | | 7.79 | | | | 4.53 | | | | 0.41 | | | | 0.37 | |
| Administrator Class (WFQWX) | | 6-29-2007 | | | – | | | | – | | | | – | | | | 17.38 | | | | 7.39 | | | | 4.16 | | | | 0.76 | | | | 0.72 | |
| Dow Jones Global Target 2035 Index5 | | – | | | – | | | | – | | | | – | | | | 18.22 | | | | 8.13 | | | | 4.82 | * | | | – | | | | – | |
| Bloomberg Barclays U.S. Aggregate Bond Index6 | | – | | | – | | | | – | | | | – | | | | 1.42 | | | | 2.24 | | | | 4.49 | * | | | – | | | | – | |
| Russell 3000® Index7 | | – | | | – | | | | – | | | | – | | | | 26.29 | | | | 13.85 | | | | 7.18 | * | | | – | | | | – | |
| * | | Based on the inception date of the oldest class. |
Figures quoted represent past performance, which is no guarantee of future results, and do not reflect taxes that a shareholder may pay on fund distributions or the redemption of fund shares. Investment return and principal value of an investment will fluctuate so that an investor’s shares, when redeemed, may be worth more or less than their original cost. Performance shown without sales charges would be lower if sales charges were reflected. Current performance may be lower or higher than the performance data quoted and assumes the reinvestment of dividends and capital gains. Current month-end performance is available on the Fund’s website, wellsfargofunds.com.
Index returns do not include transaction costs associated with buying and selling securities, any mutual fund fees or expenses, or any taxes. It is not possible to invest directly in an index.
For Class A shares, the maximum front-end sales charge is 5.75%. Class R, Class R4, Class R6, and Administrator Class shares are sold without a front-end sales charge or contingent deferred sales charge.
|
| Growth of $10,000 investment as of February 28, 20178 |
|
|
Please see footnotes on pages 22-23.
| | | | |
| 14 | | Wells Fargo Dow Jones Target Date Funds | | Performance highlights (unaudited) |
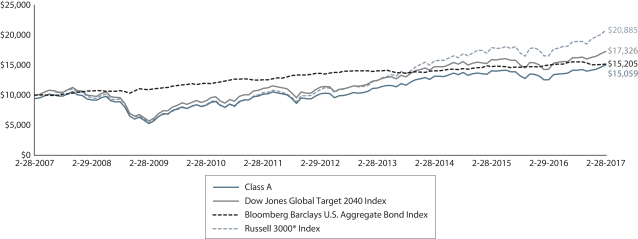
Target 2040 Fund
Average annual total returns (%) as of February 28, 20172
| | | | | | | | | | | | | | | | | | | | | | | | | | | | | | | | | | |
| | | | | Including sales charge | | | Excluding sales charge | | | Expense ratios11 (%) | |
| | | Inception date | | 1 year | | | 5 year | | | 10 year | | | 1 year | | | 5 year | | | 10 year | | | Gross | | | Net4 | |
| Class A (STFRX) | | 3-1-1994 | | | 13.12 | | | | 6.72 | | | | 4.18 | | | | 20.01 | | | | 7.99 | | | | 4.80 | | | | 0.84 | | | | 0.83 | |
| Class C (WFOFX) | | 7-1-1998 | | | 18.11 | | | | 7.18 | | | | 4.01 | | | | 19.11 | | | | 7.18 | | | | 4.01 | | | | 1.59 | | | | 1.58 | |
| Class R (WFMRX) | | 6-28-2013 | | | – | | | | – | | | | – | | | | 19.68 | | | | 7.77 | | | | 4.66 | | | | 1.09 | | | | 1.08 | |
| Class R4 (WTFRX) | | 11-30-2012 | | | – | | | | – | | | | – | | | | 20.43 | | | | 8.39 | | | | 5.26 | | | | 0.56 | | | | 0.52 | |
| Class R6 (WFOSX) | | 6-30-2004 | | | – | | | | – | | | | – | | | | 20.56 | | | | 8.51 | | | | 5.32 | | | | 0.41 | | | | 0.37 | |
| Administrator Class (WFLWX) | | 11-8-1999 | | | – | | | | – | | | | – | | | | 20.09 | | | | 8.14 | | | | 4.99 | | | | 0.76 | | | | 0.72 | |
| Dow Jones Global Target 2040 Index5 | | – | | | – | | | | – | | | | – | | | | 20.85 | | | | 8.85 | | | | 5.65 | | | | – | | | | – | |
| Bloomberg Barclays U.S. Aggregate Bond Index6 | | – | | | – | | | | – | | | | – | | | | 1.42 | | | | 2.24 | | | | 4.28 | | | | – | | | | – | |
| Russell 3000® Index7 | | – | | | – | | | | – | | | | – | | | | 26.29 | | | | 13.85 | | | | 7.64 | | | | – | | | | – | |
Figures quoted represent past performance, which is no guarantee of future results, and do not reflect taxes that a shareholder may pay on fund distributions or the redemption of fund shares. Investment return and principal value of an investment will fluctuate so that an investor’s shares, when redeemed, may be worth more or less than their original cost. Performance shown without sales charges would be lower if sales charges were reflected. Current performance may be lower or higher than the performance data quoted and assumes the reinvestment of dividends and capital gains. Current month-end performance is available on the Fund’s website, wellsfargofunds.com.
Index returns do not include transaction costs associated with buying and selling securities, any mutual fund fees or expenses, or any taxes. It is not possible to invest directly in an index.
For Class A shares, the maximum front-end sales charge is 5.75%. For Class C shares, the maximum contingent deferred sales charge is 1.00%. Performance including a contingent deferred sales charge assumes the sales charge for the corresponding time period. Class R, Class R4, Class R6, and Administrator Class shares are sold without a front-end sales charge or contingent deferred sales charge.
|
| Growth of $10,000 investment as of February 28, 20178 |
|
|
Please see footnotes on pages 22-23.
| | | | | | |
| Performance highlights (unaudited) | | Wells Fargo Dow Jones Target Date Funds | | | 15 | |
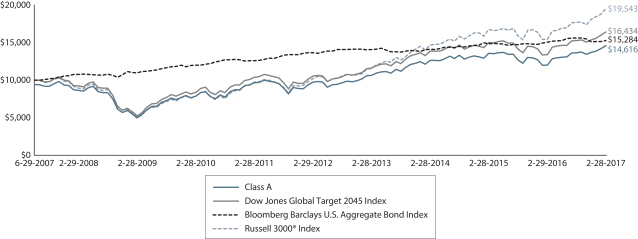
Target 2045 Fund
Average annual total returns (%) as of February 28, 201710
| | | | | | | | | | | | | | | | | | | | | | | | | | | | | | | | | | |
| | | | | Including sales charge | | | Excluding sales charge | | | Expense ratios11 (%) | |
| | | Inception date | | 1 year | | | 5 year | | | Since
inception | | | 1 year | | | 5 year | | | Since
inception | | | Gross | | | Net4 | |
| Class A (WFQVX) | | 11-30-2012 | | | 14.89 | | | | 7.18 | | | | 4.00 | | | | 21.85 | | | | 8.45 | | | | 4.64 | | | | 0.85 | | | | 0.83 | |
| Class R (WFNRX) | | 6-28-2013 | | | – | | | | – | | | | – | | | | 21.41 | | | | 8.16 | | | | 4.38 | | | | 1.10 | | | | 1.08 | |
| Class R4 (WFFRX) | | 11-30-2012 | | | – | | | | – | | | | – | | | | 22.25 | | | | 8.83 | | | | 4.98 | | | | 0.57 | | | | 0.52 | |
| Class R6 (WFQPX) | | 6-29-2007 | | | – | | | | – | | | | – | | | | 22.26 | | | | 8.92 | | | | 5.02 | | | | 0.42 | | | | 0.37 | |
| Administrator Class (WFQYX) | | 6-29-2007 | | | – | | | | – | | | | – | | | | 21.89 | | | | 8.54 | | | | 4.70 | | | | 0.77 | | | | 0.72 | |
| Dow Jones Global Target 2045 Index5 | | – | | | – | | | | – | | | | – | | | | 22.63 | | | | 9.26 | | | | 5.27 | * | | | – | | | | – | |
| Bloomberg Barclays U.S. Aggregate Bond Index6 | | – | | | – | | | | – | | | | – | | | | 1.42 | | | | 2.24 | | | | 4.49 | * | | | – | | | | – | |
| Russell 3000® Index7 | | – | | | – | | | | – | | | | – | | | | 26.29 | | | | 13.85 | | | | 7.18 | * | | | – | | | | – | |
| * | | Based on the inception date of the oldest class. |
Figures quoted represent past performance, which is no guarantee of future results, and do not reflect taxes that a shareholder may pay on fund distributions or the redemption of fund shares. Investment return and principal value of an investment will fluctuate so that an investor’s shares, when redeemed, may be worth more or less than their original cost. Performance shown without sales charges would be lower if sales charges were reflected. Current performance may be lower or higher than the performance data quoted and assumes the reinvestment of dividends and capital gains. Current month-end performance is available on the Fund’s website, wellsfargofunds.com.
Index returns do not include transaction costs associated with buying and selling securities, any mutual fund fees or expenses, or any taxes. It is not possible to invest directly in an index.
For Class A shares, the maximum front-end sales charge is 5.75%. Class R, Class R4, Class R6, and Administrator Class shares are sold without a front-end sales charge or contingent deferred sales charge.
|
| Growth of $10,000 investment as of February 28, 20178 |
|
|
Please see footnotes on pages 22-23.
| | | | |
| 16 | | Wells Fargo Dow Jones Target Date Funds | | Performance highlights (unaudited) |
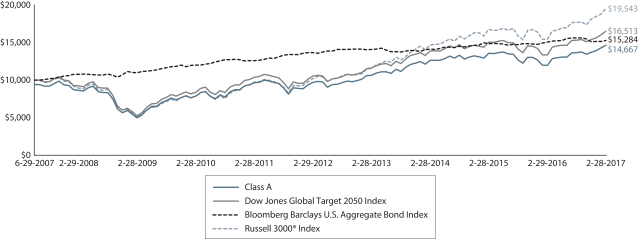
Target 2050 Fund
Average annual total returns (%) as of February 28, 201712
| | | | | | | | | | | | | | | | | | | | | | | | | | | | | | | | | | |
| | | | | Including sales charge | | | Excluding sales charge | | | Expense ratios11 (%) | |
| | | Inception date | | 1 year | | | 5 year | | | Since
inception | | | 1 year | | | 5 year | | | Since
inception | | | Gross | | | Net4 | |
| Class A (WFQAX) | | 11-30-2012 | | | 15.40 | | | | 7.28 | | | | 4.04 | | | | 22.48 | | | | 8.55 | | | | 4.68 | | | | 0.84 | | | | 0.83 | |
| Class C (WFQCX) | | 11-30-2012 | | | 20.58 | | | | 7.75 | | | | 3.90 | | | | 21.58 | | | | 7.75 | | | | 3.90 | | | | 1.59 | | | | 1.58 | |
| Class R (WFWRX) | | 6-28-2013 | | | – | | | | – | | | | – | | | | 22.29 | | | | 8.29 | | | | 4.42 | | | | 1.09 | | | | 1.08 | |
| Class R4 (WQFRX) | | 11-30-2012 | | | – | | | | – | | | | – | | | | 23.00 | | | | 8.93 | | | | 5.01 | | | | 0.56 | | | | 0.52 | |
| Class R6 (WFQFX) | | 6-29-2007 | | | – | | | | – | | | | – | | | | 23.09 | | | | 9.05 | | | | 5.07 | | | | 0.41 | | | | 0.37 | |
| Administrator Class (WFQDX) | | 6-29-2007 | | | – | | | | – | | | | – | | | | 22.72 | | | | 8.67 | | | | 4.73 | | | | 0.76 | | | | 0.72 | |
| Dow Jones Global Target 2050 Index5 | | – | | | – | | | | – | | | | – | | | | 23.36 | | | | 9.36 | | | | 5.32 | * | | | – | | | | – | |
| Bloomberg Barclays U.S. Aggregate Bond Index6 | | – | | | – | | | | – | | | | – | | | | 1.42 | | | | 2.24 | | | | 4.49 | * | | | – | | | | – | |
| Russell 3000® Index7 | | – | | | – | | | | – | | | | – | | | | 26.29 | | | | 13.85 | | | | 7.18 | * | | | – | | | | – | |
| * | | Based on the inception date of the oldest class. |
Figures quoted represent past performance, which is no guarantee of future results, and do not reflect taxes that a shareholder may pay on fund distributions or the redemption of fund shares. Investment return and principal value of an investment will fluctuate so that an investor’s shares, when redeemed, may be worth more or less than their original cost. Performance shown without sales charges would be lower if sales charges were reflected. Current performance may be lower or higher than the performance data quoted and assumes the reinvestment of dividends and capital gains. Current month-end performance is available on the Fund’s website, wellsfargofunds.com.
Index returns do not include transaction costs associated with buying and selling securities, any mutual fund fees or expenses, or any taxes. It is not possible to invest directly in an index.
For Class A shares, the maximum front-end sales charge is 5.75%. For Class C shares, the maximum contingent deferred sales charge is 1.00%. Performance including a contingent deferred sales charge assumes the sales charge for the corresponding time period. Class R, Class R4, Class R6, and Administrator Class shares are sold without a front-end sales charge or contingent deferred sales charge.
|
| Growth of $10,000 investment as of February 28, 20178 |
|
|
Please see footnotes on pages 22-23.
| | | | | | |
| Performance highlights (unaudited) | | Wells Fargo Dow Jones Target Date Funds | | | 17 | |
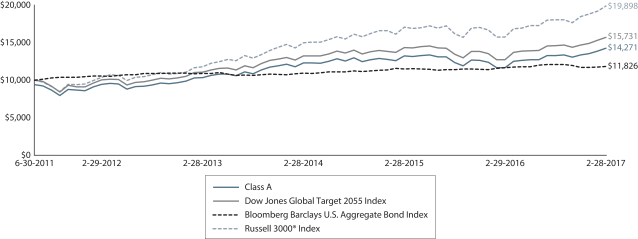
Target 2055 Fund
Average annual total returns (%) as of February 28, 201710
| | | | | | | | | | | | | | | | | | | | | | | | | | | | | | | | | | |
| | | | | Including sales charge | | | Excluding sales charge | | | Expense ratios11 (%) | |
| | | Inception date | | 1 year | | | 5 year | | | Since
inception | | | 1 year | | | 5 year | | | Since
inception | | | Gross | | | Net4 | |
| Class A (WFQZX) | | 11-30-2012 | | | 15.37 | | | | 7.26 | | | | 6.48 | | | | 22.45 | | | | 8.53 | | | | 7.60 | | | | 0.90 | | | | 0.83 | |
| Class R (WFYRX) | | 6-28-2013 | | | – | | | | – | | | | – | | | | 22.04 | | | | 8.26 | | | | 7.21 | | | | 1.15 | | | | 1.08 | |
| Class R4 (WFVRX) | | 11-30-2012 | | | – | | | | – | | | | – | | | | 22.78 | | | | 8.89 | | | | 7.96 | | | | 0.62 | | | | 0.52 | |
| Class R6 (WFQUX) | | 6-30-2011 | | | – | | | | – | | | | – | | | | 22.97 | | | | 9.01 | | | | 8.06 | | | | 0.47 | | | | 0.37 | |
| Administrator Class (WFLHX) | | 6-30-2011 | | | – | | | | – | | | | – | | | | 22.50 | | | | 8.64 | | | | 7.70 | | | | 0.82 | | | | 0.72 | |
| Dow Jones Global Target 2055 Index5 | | – | | | – | | | | – | | | | – | | | | 23.38 | | | | 9.37 | | | | 8.32 | * | | | – | | | | – | |
| Bloomberg Barclays U.S. Aggregate Bond Index6 | | – | | | – | | | | – | | | | – | | | | 1.42 | | | | 2.24 | | | | 3.00 | * | | | – | | | | – | |
| Russell 3000® Index7 | | – | | | – | | | | – | | | | – | | | | 26.29 | | | | 13.85 | | | | 12.91 | * | | | – | | | | – | |
| * | | Based on the inception date of the oldest class. |
Figures quoted represent past performance, which is no guarantee of future results, and do not reflect taxes that a shareholder may pay on fund distributions or the redemption of fund shares. Investment return and principal value of an investment will fluctuate so that an investor’s shares, when redeemed, may be worth more or less than their original cost. Performance shown without sales charges would be lower if sales charges were reflected. Current performance may be lower or higher than the performance data quoted, which assumes the reinvestment of dividends and capital gains. Current month-end performance is available on the Fund’s website, wellsfargofunds.com.
Index returns do not include transaction costs associated with buying and selling securities, any mutual fund fees or expenses, or any taxes. It is not possible to invest directly in an index.
For Class A shares, the maximum front-end sales charge is 5.75%. Class R, Class R4, Class R6, and Administrator Class shares are sold without a front-end sales charge or contingent deferred sales charge.
|
| Growth of $10,000 investment as of February 28, 20178 |
|
|
Please see footnotes on pages 22-23.
| | | | |
| 18 | | Wells Fargo Dow Jones Target Date Funds | | Performance highlights (unaudited) |
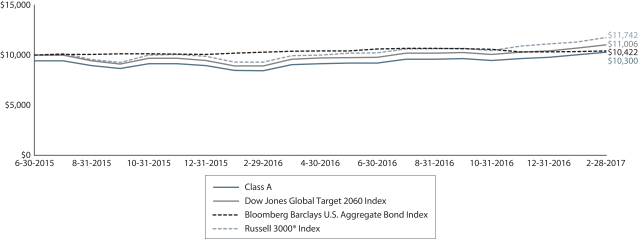
Target 2060 Fund
Average annual total returns (%) as of February 28, 201712
| | | | | | | | | | | | | | | | | | | | | | | | | | |
| | | Including sales charge | | | Excluding sales charge | | | Expense ratios11 (%) | |
| | | Inception date | | 1 year | | | Since inception | | | 1 year | | | Since inception | | | Gross | | | Net4 | |
| Class A (WFAFX) | | 6-30-2015 | | | 15.19 | | | | 1.79 | | | | 22.23 | | | | 5.47 | | | | 14.46 | | | | 0.83 | |
| Class C (WFCFX) | | 6-30-2015 | | | 20.22 | | | | 4.66 | | | | 21.22 | | | | 4.66 | | | | 15.21 | | | | 1.58 | |
| Class R (WFRFX) | | 6-30-2015 | | | – | | | | – | | | | 21.73 | | | | 5.17 | | | | 14.71 | | | | 1.08 | |
| Class R4 (WFSFX) | | 6-30-2015 | | | – | | | | – | | | | 22.45 | | | | 5.79 | | | | 14.18 | | | | 0.52 | |
| Class R6 (WFUFX) | | 6-30-2015 | | | – | | | | – | | | | 22.75 | | | | 5.95 | | | | 14.03 | | | | 0.37 | |
| Administrator Class (WFDFX) | | 6-30-2015 | | | – | | | | – | | | | 22.38 | | | | 5.62 | | | | 14.38 | | | | 0.72 | |
| Dow Jones Global Target 2060 Index5 | | – | | | – | | | | – | | | | 23.38 | | | | 5.92 | | | | – | | | | – | |
| Bloomberg Barclays U.S. Aggregate Bond Index6 | | – | | | – | | | | – | | | | 1.42 | | | | 2.51 | | | | – | | | | – | |
| Russell 3000® Index7 | | – | | | – | | | | – | | | | 26.29 | | | | 10.12 | | | | – | | | | – | |
Figures quoted represent past performance, which is no guarantee of future results, and do not reflect taxes that a shareholder may pay on fund distributions or the redemption of fund shares. Investment return and principal value of an investment will fluctuate so that an investor’s shares, when redeemed, may be worth more or less than their original cost. Performance shown without sales charges would be lower if sales charges were reflected. Current performance may be lower or higher than the performance data quoted, which assumes the reinvestment of dividends and capital gains. Current month-end performance is available on the Fund’s website, wellsfargofunds.com.
Index returns do not include transaction costs associated with buying and selling securities, any mutual fund fees or expenses, or any taxes. It is not possible to invest directly in an index.
For Class A shares, the maximum front-end sales charge is 5.75%. For Class C shares, the maximum contingent deferred sales charge is 1.00%. Performance including a contingent deferred sales charge assumes the sales charge for the corresponding time period. Class R, Class R4, Class R6, and Administrator Class shares are sold without a front-end sales charge or contingent deferred sales charge.
| | |
| Growth of $10,000 investment as of February 28, 20178 |
|
|
Please see footnotes on pages 22-23.
| | | | | | |
| Performance highlights (unaudited) | | Wells Fargo Dow Jones Target Date Funds | | | 19 | |
MANAGER’S DISCUSSION
Highlights
The Wells Fargo Dow Jones Target Date Funds seek to replicate the asset allocations and returns of their respective Dow Jones Global Target Date Indexes before fees and expenses. The strategic asset allocations are designed to provide high levels of diversification across equity, fixed-income, and short-term investments. Our disciplined approach to portfolio construction seeks to help investors benefit from bull markets while providing risk management in bear markets.
The Funds address investment risk through diversification and disciplined asset allocation.
All Funds invest in the same three underlying portfolios: the Wells Fargo Diversified Stock Portfolio, the Wells Fargo Diversified Fixed-Income Portfolio, and the Wells Fargo Short-Term Investment Portfolio, differing only in the amount invested in each underlying portfolio. The breadth and depth of diversification and disciplined asset allocation help manage, but do not eliminate, risk. The Diversified Stock Portfolio contains a broad mix of large-cap, mid-cap, small-cap, growth, value, and international stocks, including emerging markets. The Diversified Fixed-Income Portfolio invests in several types of fixed-income securities, including U.S. and non-U.S. government bonds, corporate bonds, and mortgage-backed securities. The Short-Term Investment Portfolio typically holds high-quality, short-term U.S. dollar–denominated money market instruments of domestic and foreign issuers, including U.S. government obligations, obligations of foreign and domestic banks, short-term corporate debt securities, and repurchase agreements.
Global equity markets recorded gains while bond markets trailed.
For the 12-month period that ended February 28, 2017, each Dow Jones Target Date Fund posted positive returns before expenses, with longer-dated funds generating higher returns due to their higher equity allocations. After adjusting for expenses, the Dow Jones Target Date Funds trailed their respective indexes. For Class R6 shares, underperformance ranged from 22 basis points (bps; 100 bps is 1.00%) to 63 bps. For the period, the performance of the Target 2060 Fund varied from its index’s performance to a higher degree relative to other Funds in the series due to its small asset base and comparatively large cash flows.
Global equity markets posted double-digit returns during the period. Domestically, the S&P 500 Index13 rose 24.98% while the Russell 2000® Index14 jumped 36.11%. Foreign markets also rose sharply, with the MSCI EAFE Index15 gaining 15.75% and the MSCI EM Index (Net)16 rising 29.46%. Global bond markets trailed, with the Bloomberg Barclays U.S. Aggregate Bond Index rising 1.42% while the Bloomberg Barclays Global Treasury: Majors ex U.S. Index17fell 1.27%, helping to explain why funds with higher equity allocations during the period outperformed funds with lower equity exposure.
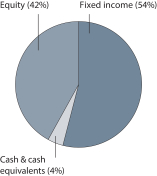
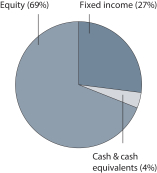
The Dow Jones Target Date Funds are designed to become more conservative as a fund moves down the glide path and its target date approaches. Our goal is to manage the relative equity risk of each fund as dictated by the glide path—a fund’s targeted equity risk is not the same as a fund’s equity allocation percentage, as both fixed income and cash equivalents carry risks. On a monthly basis, we adjust each Dow Jones Target Date Fund’s strategic allocations to equities, fixed income, and cash equivalents in response to changing market conditions and a fund’s movement down the glide path.
An increase in correlation between bonds and equities and an increase in relative bond risk affected allocation decisions during the period. The Target 2055 Fund and the Target 2060 Fund, which have not begun to move down the glide path, decreased their equity exposure over the past 12 months as fixed-income holdings became less effective diversifiers. The funds further down the equity glide path, the Target 2050 Fund through Target 2025 Fund, reduced their equity holdings by slightly more than the amount they decreased their relative equity risk due to the decreased diversification benefits of holding bonds. The shorter-dated funds, the Target 2020 Fund through Target 2010 Fund, remained invested at their minimum allowable equity allocations during the period and decreased their equity holdings at the same rate as their targeted equity risk.
The Target Today Fund, which is the most conservative fund, maintained its targeted equity exposure at 15% during the period. The cash allocation of the Target Today Fund, the Target 2010 Fund, and the Target 2015 Fund remained elevated during the period due to the increased volatility of bonds. The higher cash allocations are consistent with the capital preservation intentions of the Funds. All other Funds maintained their cash allocation at 4%.
Please see footnotes on pages 22-23.
| | | | |
| 20 | | Wells Fargo Dow Jones Target Date Funds | | Performance highlights (unaudited) |
It is our belief that equities and bonds are likely to experience meaningful volatility into the foreseeable future. The Dow Jones Target Date Funds are designed to address the asset accumulation needs of investors as they advance toward their long-term retirement goals. Diversification at the individual-security and asset-class levels is intended to allow investors to capture capital appreciation in a variety of markets at risk levels that are appropriate to achieve capital preservation objectives. However, although the Funds are designed to provide varying degrees of downside risk management based on their index dates, they cannot prevent losses or eliminate risk. We believe our Funds are well positioned to give investors an opportunity to build and maintain their retirement nest eggs in the coming years.
Please see footnotes on pages 22-23.
| | | | | | |
| Performance highlights (unaudited) | | Wells Fargo Dow Jones Target Date Funds | | | 21 | |
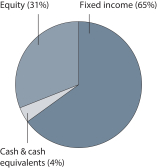
Portfolio allocation as of February 28, 201718
| | | | |
| Target Today Fund | | Target 2010 Fund | | Target 2015 Fund |
| | | |
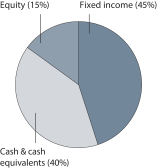 | | 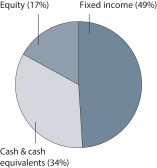 | | 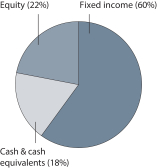 |
| | | | |
| Target 2020 Fund | | Target 2025 Fund | | Target 2030 Fund |
| | | |
| |  | | 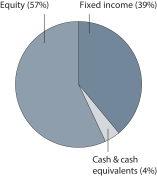 |
| | | | |
| Target 2035 Fund | | Target 2040 Fund | | Target 2045 Fund |
| | | |
 | | 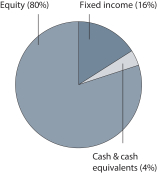 | |  |
Please see footnotes on pages 22-23.
| | | | |
| 22 | | Wells Fargo Dow Jones Target Date Funds | | Performance highlights (unaudited) |
| | | | |
| Target 2050 Fund | | Target 2055 Fund | | Target 2060 Fund |
| | | |
 | |  | |  |
| 1 | The Funds are gateway funds that invest in various affiliated master portfolios which in turn invest in a combination of equity, fixed income, and money market securities using an asset allocation strategy designed to replicate, before fees and expenses, the total return of the Dow Jones Global Target Date Indexes that have the same target year as the Funds. References to the investment activities of the Funds are intended to refer to the investment activities of the underlying affiliated master portfolios in which the Funds invest. |
| 2 | Historical performance shown for Class R shares prior to their inception reflects the performance of the Class A shares and has been adjusted to reflect the higher expenses applicable to Class R shares. Historical performance shown for Class R4 shares prior to their inception reflects the performance of Class R6 shares and includes the expenses applicable to Class R6. Effective June 1, 2013, Institutional Class was renamed Class R6 and modified to assume the features and attributes of Class R6. Historical performance shown for Class R6 shares from inception through May 31, 2013, reflects Institutional Class performance and expenses. |
| 3 | Reflects the expense ratios as stated in the most recent prospectuses, which include the impact of 0.15% of acquired fund fees and expenses which represent the net expenses from the underlying affiliated master portfolios. The expense ratios shown are subject to change and may differ from the annualized expense ratios shown in the financial highlights of this report. |
| 4 | The manager has contractually committed through June 30, 2017, to waive fees and/or reimburse expenses to the extent necessary to cap the Fund’s Total Annual Fund Operating Expenses After Fee Waivers at the amounts shown. Brokerage commissions, stamp duty fees, interest, taxes, acquired fund fees and expenses, and extraordinary expenses are excluded from the expense cap. After this time, the cap may be increased or the commitment to maintain the cap may be terminated only with the approval of the Board of Trustees. Net expenses from the underlying affiliated master portfolios are included in the expense cap. Without this cap, the Fund’s returns would have been lower. The expense ratio paid by an investor is the net expense ratio or the Fund’s Total Annual Fund Operating Expenses After Fee Waivers, as stated in the prospectus. |
| 5 | The Dow Jones Global Target Date Indexes (each an “index” or collectively the “indexes”) are a series of indexes designed as benchmarks for multi-asset class portfolios with risk profiles that became more conservative over time. The index weightings among the major asset classes are adjusted monthly based on a published set of index rules. The indexes with longer time horizons have higher allocations to equity securities, while the indexes with shorter time horizons replace some of their stock allocations with allocations to fixed income securities and money market instruments. You cannot invest directly in an index. |
| 6 | The Bloomberg Barclays U.S. Aggregate Bond Index (formerly known as Barclays U.S. Aggregate Bond Index) is a broad-based benchmark that measures the investment-grade, U.S. dollar-denominated, fixed-rate taxable bond market, including Treasuries, government-related and corporate securities, mortgage-backed securities (agency fixed-rate and hybrid adjustable-rate mortgage pass-throughs), asset-backed securities, and commercial mortgage-backed securities. You cannot invest directly in an index. |
| 7 | The Russell 3000® Index measures the performance of the 3,000 largest U.S. companies based on total market capitalization, which represents approximately 98% of the investable U.S. equity market. You cannot invest directly in an index. |
| 8 | The chart compares the performance of the Class A shares for the last 10 years or since inception with the respective Dow Jones Global Target Date Index, the Bloomberg Barclays U.S. Aggregate Bond Index, and the Russell 3000® Index. The chart assumes a hypothetical investment of $10,000 in Class A shares and reflects all operating expenses and assumes the maximum initial sales charge of 5.75%. |
| 9 | Historical performance shown for Class R shares prior to their inception reflects the performance of Class A shares and has been adjusted to reflect the higher expenses applicable to Class R shares. Historical performance shown for Class R4 shares prior to their inception reflects the performance of Class R6 shares, and includes the higher expenses applicable to Class R6. If these expenses had not been included, returns would be higher. Effective June 1, 2013, Institutional Class was renamed Class R6 and modified to assume the features and attributes of Class R6. Historical performance shown for Class R6 shares from inception through May 31, 2013, reflects Institutional Class performance and expenses. |
| 10 | Historical performance shown for Class A shares prior to their inception reflects the performance of Class R6 shares and has been adjusted to reflect the higher expenses applicable to Class A shares. Historical performance shown for Class R shares prior to their inception reflects the performance of the former Investor Class shares and has been adjusted to reflect the higher expenses applicable to Class R shares. Historical performance shown for Class R4 shares prior to their inception reflects the performance of Class R6 shares and includes the expenses applicable to Class R4. Effective June 1, 2013, Institutional Class was renamed Class R6 and modified to assume the features and attributes of Class R6. Historical performance shown for Class R6 shares from inception through May 31, 2013, reflects Institutional Class performance and expenses. |
| | | | | | |
| Performance highlights (unaudited) | | Wells Fargo Dow Jones Target Date Funds | | | 23 | |
| 11 | Reflects the expense ratios as stated in the most recent prospectuses, which include the impact of 0.16% of acquired fund fees and expenses which represent the net expenses from the underlying affiliated master portfolios. The expense ratios shown are subject to change and may differ from the annualized expense ratios shown in the financial highlights of this report. |
| 12 | Historical performance shown for Class A and Class C shares prior to their inception reflects the performance of Class R6 shares and has been adjusted to reflect the higher expenses applicable to Class A and Class C shares. Historical performance shown for Class R shares prior to their inception reflects the performance of the former Investor Class shares and has been adjusted to reflect the higher expenses applicable to Class R shares. Historical performance shown for Class R4 shares prior to their inception reflects the performance of Class R6 shares and includes the expenses applicable to Class R6. If these expenses had not been included, returns would be higher. Effective June 1, 2013, Institutional Class was renamed Class R6 and modified to assume the features and attributes of Class R6. Historical performance shown for Class R6 shares from inception through May 31, 2013, reflects Institutional Class performance and expenses. |
| 13 | The S&P 500 Index consists of 500 stocks chosen for market size, liquidity, and industry group representation. It is a market-value-weighted index with each stock’s weight in the index proportionate to its market value. You cannot invest directly in an index. |
| 14 | The Russell 2000® Index measures the performance of the 2,000 smallest companies in the Russell 3000® Index, which represents approximately 8% of the total market capitalization of the Russell 3000® Index. You cannot invest directly in an index. |
| 15 | The Morgan Stanley Capital International (MSCI) Europe, Australasia, Far East (EAFE) Index is a free-float-adjusted market-capitalization-weighted index that is designed to measure the equity market performance of developed markets, excluding the United States and Canada. The MSCI EAFE Index consists of the following 21 developed markets country indexes: Australia, Austria, Belgium, Denmark, Finland, France, Germany, Hong Kong, Ireland, Israel, Italy, Japan, the Netherlands, New Zealand, Norway, Portugal, Singapore, Spain, Sweden, Switzerland, and the United Kingdom. Source: MSCI. MSCI makes no express or implied warranties or representations and shall have no liability whatsoever with respect to any MSCI data contained herein. The MSCI data may not be further redistributed or used as a basis for other indexes or any securities or financial products. This report is not approved, reviewed, or produced by MSCI. You cannot invest directly in an index. |
| 16 | The MSCI Emerging Markets (EM) Index (Net) is a free-float-adjusted market-capitalization-weighted index that is designed to measure the equity market performance of emerging markets. The MSCI EM Index (Net) consists of the following 23 emerging markets country indexes: Brazil, Chile, China, Colombia, Czech Republic, Egypt, Greece, Hungary, India, Indonesia, Korea, Malaysia, Mexico, Peru, the Philippines, Poland, Qatar, Russia, South Africa, Taiwan, Thailand, Turkey, and United Arab Emirates. You cannot invest directly in an index. |
| 17 | The Bloomberg Barclays Global Treasury: Majors ex U.S. Index (formerly known as Barclays Global Treasury: Majors ex U.S. Index) consists of securities in the following Global Treasury indexes: Australia, Belgium, Canada, Denmark, France, Germany, Italy, Japan, the Netherlands, Spain, Sweden and the United Kingdom. To be included in the index, securities must have at least one year to maturity and must meet specified liquidity requirements that vary by country and that are recalculated annually. You cannot invest directly in an index. |
| 18 | Each chart represents the composite of the portfolio allocations of the underlying affiliated master portfolios in which the Fund invests and is calculated based on the total investments of the underlying affiliated master portfolios. Portfolio holdings are subject to change and may have changed since the date specified. See the Portfolio of investments or Summary portfolio of investments of each underlying affiliated master portfolio which is also included in this report. |
| | | | |
| 24 | | Wells Fargo Dow Jones Target Date Funds | | Fund expenses (unaudited) |
As a shareholder of the Fund, you incur two types of costs: (1) transaction costs, including sales charges (loads) on purchase payments and contingent deferred sales charges (if any) on redemptions and (2) ongoing costs, including management fees, distribution (12b-1) and/or shareholder servicing fees, and other Fund expenses. This example is intended to help you understand your ongoing costs (in dollars) of investing in the Fund and to compare these costs with the ongoing costs of investing in other mutual funds.
The example is based on an investment of $1,000 invested at the beginning of the six-month period and held for the entire period from September 1, 2016 to February 28, 2017.
Actual expenses
The “Actual” line of the table below provides information about actual account values and actual expenses. You may use the information in this line, together with the amount you invested, to estimate the expenses that you paid over the period. Simply divide your account value by $1,000 (for example, an $8,600 account value divided by $1,000 = 8.6), then multiply the result by the number in the “Actual” line under the heading entitled “Expenses paid during period” for your applicable class of shares to estimate the expenses you paid on your account during this period.
Hypothetical example for comparison purposes
The “Hypothetical” line of the table below provides information about hypothetical account values and hypothetical expenses based on the Fund’s actual expense ratio and an assumed rate of return of 5% per year before expenses, which is not the Fund’s actual return. The hypothetical account values and expenses may not be used to estimate the actual ending account balance or expenses you paid for the period. You may use this information to compare the ongoing costs of investing in the Fund and other funds. To do so, compare this 5% hypothetical example with the 5% hypothetical examples that appear in the shareholder reports of the other funds.
Please note that the expenses shown in the table are meant to highlight your ongoing costs only and do not reflect any transactional costs, such as sales charges (loads) and contingent deferred sales charges. Therefore, the “Hypothetical” line of the table is useful in comparing ongoing costs only and will not help you determine the relative total costs of owning different funds. In addition, if these transactional costs were included, your costs would have been higher.
| | | | | | | | | | | | | | | | |
| Target Today Fund | | Beginning
account value
9-1-2016 | | | Ending
account value
2-28-2017 | | | Expenses
paid during
the period¹ | | | Annualized net
expense ratio | |
Class A | | | | | | | | | | | | | | | | |
Actual | | $ | 1,000.00 | | | $ | 988.31 | | | $ | 3.81 | | | | 0.76 | % |
Hypothetical (5% return before expenses) | | $ | 1,000.00 | | | $ | 1,021.37 | | | $ | 3.87 | | | | 0.76 | % |
Class C | | | | | | | | | | | | | | | | |
Actual | | $ | 1,000.00 | | | $ | 984.95 | | | $ | 7.55 | | | | 1.51 | % |
Hypothetical (5% return before expenses) | | $ | 1,000.00 | | | $ | 1,017.59 | | | $ | 7.68 | | | | 1.51 | % |
Class R | | | | | | | | | | | | | | | | |
Actual | | $ | 1,000.00 | | | $ | 987.59 | | | $ | 5.06 | | | | 1.01 | % |
Hypothetical (5% return before expenses) | | $ | 1,000.00 | | | $ | 1,020.11 | | | $ | 5.14 | | | | 1.01 | % |
Class R4 | | | | | | | | | | | | | | | | |
Actual | | $ | 1,000.00 | | | $ | 989.66 | | | $ | 2.26 | | | | 0.45 | % |
Hypothetical (5% return before expenses) | | $ | 1,000.00 | | | $ | 1,022.94 | | | $ | 2.29 | | | | 0.45 | % |
Class R6 | | | | | | | | | | | | | | | | |
Actual | | $ | 1,000.00 | | | $ | 990.59 | | | $ | 1.51 | | | | 0.30 | % |
Hypothetical (5% return before expenses) | | $ | 1,000.00 | | | $ | 1,023.69 | | | $ | 1.53 | | | | 0.30 | % |
Administrator Class | | | | | | | | | | | | | | | | |
Actual | | $ | 1,000.00 | | | $ | 988.52 | | | $ | 3.26 | | | | 0.65 | % |
Hypothetical (5% return before expenses) | | $ | 1,000.00 | | | $ | 1,021.93 | | | $ | 3.31 | | | | 0.65 | % |
Please see footnote on page 30.
| | | | | | |
| Fund expenses (unaudited) | | Wells Fargo Dow Jones Target Date Funds | | | 25 | |
| | | | | | | | | | | | | | | | |
| Target 2010 Fund | | Beginning
account value
9-1-2016 | | | Ending
account value
2-28-2017 | | | Expenses
paid during
the period¹ | | | Annualized net
expense ratio | |
Class A | | | | | | | | | | | | | | | | |
Actual | | $ | 1,000.00 | | | $ | 987.15 | | | $ | 3.91 | | | | 0.78 | % |
Hypothetical (5% return before expenses) | | $ | 1,000.00 | | | $ | 1,021.27 | | | $ | 3.97 | | | | 0.78 | % |
Class C | | | | | | | | | | | | | | | | |
Actual | | $ | 1,000.00 | | | $ | 983.51 | | | $ | 7.65 | | | | 1.53 | % |
Hypothetical (5% return before expenses) | | $ | 1,000.00 | | | $ | 1,017.49 | | | $ | 7.78 | | | | 1.53 | % |
Class R | | | | | | | | | | | | | | | | |
Actual | | $ | 1,000.00 | | | $ | 985.85 | | | $ | 5.15 | | | | 1.03 | % |
Hypothetical (5% return before expenses) | | $ | 1,000.00 | | | $ | 1,020.01 | | | $ | 5.24 | | | | 1.03 | % |
Class R4 | | | | | | | | | | | | | | | | |
Actual | | $ | 1,000.00 | | | $ | 988.95 | | | $ | 2.36 | | | | 0.47 | % |
Hypothetical (5% return before expenses) | | $ | 1,000.00 | | | $ | 1,022.84 | | | $ | 2.40 | | | | 0.47 | % |
Class R6 | | | | | | | | | | | | | | | | |
Actual | | $ | 1,000.00 | | | $ | 989.96 | | | $ | 1.61 | | | | 0.32 | % |
Hypothetical (5% return before expenses) | | $ | 1,000.00 | | | $ | 1,023.59 | | | $ | 1.63 | | | | 0.32 | % |
Administrator Class | | | | | | | | | | | | | | | | |
Actual | | $ | 1,000.00 | | | $ | 987.82 | | | $ | 3.36 | | | | 0.67 | % |
Hypothetical (5% return before expenses) | | $ | 1,000.00 | | | $ | 1,021.83 | | | $ | 3.41 | | | | 0.67 | % |
| Target 2015 Fund | | | | | | | | | | | | |
Class A | | | | | | | | | | | | | | | | |
Actual | | $ | 1,000.00 | | | $ | 986.80 | | | $ | 3.96 | | | | 0.79 | % |
Hypothetical (5% return before expenses) | | $ | 1,000.00 | | | $ | 1,021.22 | | | $ | 4.02 | | | | 0.79 | % |
Class R | | | | | | | | | | | | | | | | |
Actual | | $ | 1,000.00 | | | $ | 985.42 | | | $ | 5.21 | | | | 1.04 | % |
Hypothetical (5% return before expenses) | | $ | 1,000.00 | | | $ | 1,019.96 | | | $ | 5.30 | | | | 1.04 | % |
Class R4 | | | | | | | | | | | | | | | | |
Actual | | $ | 1,000.00 | | | $ | 988.54 | | | $ | 2.41 | | | | 0.48 | % |
Hypothetical (5% return before expenses) | | $ | 1,000.00 | | | $ | 1,022.79 | | | $ | 2.45 | | | | 0.48 | % |
Class R6 | | | | | | | | | | | | | | | | |
Actual | | $ | 1,000.00 | | | $ | 988.68 | | | $ | 1.65 | | | | 0.33 | % |
Hypothetical (5% return before expenses) | | $ | 1,000.00 | | | $ | 1,023.54 | | | $ | 1.68 | | | | 0.33 | % |
Administrator Class | | | | | | | | | | | | | | | | |
Actual | | $ | 1,000.00 | | | $ | 988.49 | | | $ | 3.41 | | | | 0.68 | % |
Hypothetical (5% return before expenses) | | $ | 1,000.00 | | | $ | 1,021.78 | | | $ | 3.47 | | | | 0.68 | % |
Please see footnote on page 30.
| | | | |
| 26 | | Wells Fargo Dow Jones Target Date Funds | | Fund expenses (unaudited) |
| | | | | | | | | | | | | | | | |
| Target 2020 Fund | | Beginning
account value
9-1-2016 | | | Ending
account value
2-28-2017 | | | Expenses
paid during
the period¹ | | | Annualized net
expense ratio | |
Class A | | | | | | | | | | | | | | | | |
Actual | | $ | 1,000.00 | | | $ | 997.74 | | | $ | 4.08 | | | | 0.81 | % |
Hypothetical (5% return before expenses) | | $ | 1,000.00 | | | $ | 1,021.12 | | | $ | 4.13 | | | | 0.81 | % |
Class C | | | | | | | | | | | | | | | | |
Actual | | $ | 1,000.00 | | | $ | 993.79 | | | $ | 7.84 | | | | 1.56 | % |
Hypothetical (5% return before expenses) | | $ | 1,000.00 | | | $ | 1,017.34 | | | $ | 7.93 | | | | 1.56 | % |
Class R | | | | | | | | | | | | | | | | |
Actual | | $ | 1,000.00 | | | $ | 996.42 | | | $ | 5.34 | | | | 1.06 | % |
Hypothetical (5% return before expenses) | | $ | 1,000.00 | | | $ | 1,019.86 | | | $ | 5.40 | | | | 1.06 | % |
Class R4 | | | | | | | | | | | | | | | | |
Actual | | $ | 1,000.00 | | | $ | 999.43 | | | $ | 2.52 | | | | 0.50 | % |
Hypothetical (5% return before expenses) | | $ | 1,000.00 | | | $ | 1,022.68 | | | $ | 2.55 | | | | 0.50 | % |
Class R6 | | | | | | | | | | | | | | | | |
Actual | | $ | 1,000.00 | | | $ | 999.70 | | | $ | 1.76 | | | | 0.35 | % |
Hypothetical (5% return before expenses) | | $ | 1,000.00 | | | $ | 1,023.44 | | | $ | 1.79 | | | | 0.35 | % |
Administrator Class | | | | | | | | | | | | | | | | |
Actual | | $ | 1,000.00 | | | $ | 997.64 | | | $ | 3.52 | | | | 0.70 | % |
Hypothetical (5% return before expenses) | | $ | 1,000.00 | | | $ | 1,021.68 | | | $ | 3.57 | | | | 0.70 | % |
| Target 2025 Fund | | | | | | | | | | | | |
Class A | | | | | | | | | | | | | | | | |
Actual | | $ | 1,000.00 | | | $ | 1,011.94 | | | $ | 4.11 | | | | 0.81 | % |
Hypothetical (5% return before expenses) | | $ | 1,000.00 | | | $ | 1,021.12 | | | $ | 4.13 | | | | 0.81 | % |
Class R | | | | | | | | | | | | | | | | |
Actual | | $ | 1,000.00 | | | $ | 1,010.60 | | | $ | 5.37 | | | | 1.06 | % |
Hypothetical (5% return before expenses) | | $ | 1,000.00 | | | $ | 1,019.86 | | | $ | 5.40 | | | | 1.06 | % |
Class R4 | | | | | | | | | | | | | | | | |
Actual | | $ | 1,000.00 | | | $ | 1,013.63 | | | $ | 2.54 | | | | 0.50 | % |
Hypothetical (5% return before expenses) | | $ | 1,000.00 | | | $ | 1,022.68 | | | $ | 2.55 | | | | 0.50 | % |
Class R6 | | | | | | | | | | | | | | | | |
Actual | | $ | 1,000.00 | | | $ | 1,014.68 | | | $ | 1.78 | | | | 0.35 | % |
Hypothetical (5% return before expenses) | | $ | 1,000.00 | | | $ | 1,023.44 | | | $ | 1.79 | | | | 0.35 | % |
Administrator Class | | | | | | | | | | | | | | | | |
Actual | | $ | 1,000.00 | | | $ | 1,014.36 | | | $ | 3.55 | | | | 0.70 | % |
Hypothetical (5% return before expenses) | | $ | 1,000.00 | | | $ | 1,021.68 | | | $ | 3.57 | | | | 0.70 | % |
Please see footnote on page 30.
| | | | | | |
| Fund expenses (unaudited) | | Wells Fargo Dow Jones Target Date Funds | | | 27 | |
| | | | | | | | | | | | | | | | |
| Target 2030 Fund | | Beginning
account value
9-1-2016 | | | Ending
account value
2-28-2017 | | | Expenses
paid during
the period¹ | | | Annualized net
expense ratio | |
Class A | | | | | | | | | | | | | | | | |
Actual | | $ | 1,000.00 | | | $ | 1,030.79 | | | $ | 4.20 | | | | 0.82 | % |
Hypothetical (5% return before expenses) | | $ | 1,000.00 | | | $ | 1,021.07 | | | $ | 4.18 | | | | 0.82 | % |
Class C | | | | | | | | | | | | | | | | |
Actual | | $ | 1,000.00 | | | $ | 1,026.58 | | | $ | 8.02 | | | | 1.57 | % |
Hypothetical (5% return before expenses) | | $ | 1,000.00 | | | $ | 1,017.29 | | | $ | 7.98 | | | | 1.57 | % |
Class R | | | | | | | | | | | | | | | | |
Actual | | $ | 1,000.00 | | | $ | 1,029.93 | | | $ | 5.47 | | | | 1.07 | % |
Hypothetical (5% return before expenses) | | $ | 1,000.00 | | | $ | 1,019.81 | | | $ | 5.45 | | | | 1.07 | % |
Class R4 | | | | | | | | | | | | | | | | |
Actual | | $ | 1,000.00 | | | $ | 1,032.44 | | | $ | 2.61 | | | | 0.51 | % |
Hypothetical (5% return before expenses) | | $ | 1,000.00 | | | $ | 1,022.63 | | | $ | 2.60 | | | | 0.51 | % |
Class R6 | | | | | | | | | | | | | | | | |
Actual | | $ | 1,000.00 | | | $ | 1,032.78 | | | $ | 1.84 | | | | 0.36 | % |
Hypothetical (5% return before expenses) | | $ | 1,000.00 | | | $ | 1,023.39 | | | $ | 1.84 | | | | 0.36 | % |
Administrator Class | | | | | | | | | | | | | | | | |
Actual | | $ | 1,000.00 | | | $ | 1,031.76 | | | $ | 3.64 | | | | 0.71 | % |
Hypothetical (5% return before expenses) | | $ | 1,000.00 | | | $ | 1,021.63 | | | $ | 3.62 | | | | 0.71 | % |
| Target 2035 Fund | | | | �� | | | | | | | | |
Class A | | | | | | | | | | | | | | | | |
Actual | | $ | 1,000.00 | | | $ | 1,046.96 | | | $ | 4.28 | | | | 0.83 | % |
Hypothetical (5% return before expenses) | | $ | 1,000.00 | | | $ | 1,021.02 | | | $ | 4.23 | | | | 0.83 | % |
Class R | | | | | | | | | | | | | | | | |
Actual | | $ | 1,000.00 | | | $ | 1,046.30 | | | $ | 5.57 | | | | 1.08 | % |
Hypothetical (5% return before expenses) | | $ | 1,000.00 | | | $ | 1,019.76 | | | $ | 5.50 | | | | 1.08 | % |
Class R4 | | | | | | | | | | | | | | | | |
Actual | | $ | 1,000.00 | | | $ | 1,048.67 | | | $ | 2.69 | | | | 0.52 | % |
Hypothetical (5% return before expenses) | | $ | 1,000.00 | | | $ | 1,022.58 | | | $ | 2.65 | | | | 0.52 | % |
Class R6 | | | | | | | | | | | | | | | | |
Actual | | $ | 1,000.00 | | | $ | 1,049.58 | | | $ | 1.91 | | | | 0.37 | % |
Hypothetical (5% return before expenses) | | $ | 1,000.00 | | | $ | 1,023.34 | | | $ | 1.89 | | | | 0.37 | % |
Administrator Class | | | | | | | | | | | | | | | | |
Actual | | $ | 1,000.00 | | | $ | 1,047.31 | | | $ | 3.72 | | | | 0.72 | % |
Hypothetical (5% return before expenses) | | $ | 1,000.00 | | | $ | 1,021.58 | | | $ | 3.67 | | | | 0.72 | % |
Please see footnote on page 30.
| | | | |
| 28 | | Wells Fargo Dow Jones Target Date Funds | | Fund expenses (unaudited) |
| | | | | | | | | | | | | | | | |
| Target 2040 Fund | | Beginning
account value
9-1-2016 | | | Ending
account value
2-28-2017 | | | Expenses
paid during
the period¹ | | | Annualized net
expense ratio | |
Class A | | | | | | | | | | | | | | | | |
Actual | | $ | 1,000.00 | | | $ | 1,060.99 | | | $ | 4.31 | | | | 0.83 | % |
Hypothetical (5% return before expenses) | | $ | 1,000.00 | | | $ | 1,021.02 | | | $ | 4.23 | | | | 0.83 | % |
Class C | | | | | | | | | | | | | | | | |
Actual | | $ | 1,000.00 | | | $ | 1,056.88 | | | $ | 8.19 | | | | 1.58 | % |
Hypothetical (5% return before expenses) | | $ | 1,000.00 | | | $ | 1,017.24 | | | $ | 8.03 | | | | 1.58 | % |
Class R | | | | | | | | | | | | | | | | |
Actual | | $ | 1,000.00 | | | $ | 1,059.24 | | | $ | 5.61 | | | | 1.08 | % |
Hypothetical (5% return before expenses) | | $ | 1,000.00 | | | $ | 1,019.76 | | | $ | 5.50 | | | | 1.08 | % |
Class R4 | | | | | | | | | | | | | | | | |
Actual | | $ | 1,000.00 | | | $ | 1,062.43 | | | $ | 2.70 | | | | 0.52 | % |
Hypothetical (5% return before expenses) | | $ | 1,000.00 | | | $ | 1,022.58 | | | $ | 2.65 | | | | 0.52 | % |
Class R6 | | | | | | | | | | | | | | | | |
Actual | | $ | 1,000.00 | | | $ | 1,062.82 | | | $ | 1.92 | | | | 0.37 | % |
Hypothetical (5% return before expenses) | | $ | 1,000.00 | | | $ | 1,023.34 | | | $ | 1.89 | | | | 0.37 | % |
Administrator Class | | | | | | | | | | | | | | | | |
Actual | | $ | 1,000.00 | | | $ | 1,061.37 | | | $ | 3.74 | | | | 0.72 | % |
Hypothetical (5% return before expenses) | | $ | 1,000.00 | | | $ | 1,021.58 | | | $ | 3.67 | | | | 0.72 | % |
| Target 2045 Fund | | | | | | | | | | | | |
Class A | | | | | | | | | | | | | | | | |
Actual | | $ | 1,000.00 | | | $ | 1,070.13 | | | $ | 4.33 | | | | 0.83 | % |
Hypothetical (5% return before expenses) | | $ | 1,000.00 | | | $ | 1,021.02 | | | $ | 4.23 | | | | 0.83 | % |
Class R | | | | | | | | | | | | | | | | |
Actual | | $ | 1,000.00 | | | $ | 1,067.94 | | | $ | 5.62 | | | | 1.08 | % |
Hypothetical (5% return before expenses) | | $ | 1,000.00 | | | $ | 1,019.77 | | | $ | 5.49 | | | | 1.08 | % |
Class R4 | | | | | | | | | | | | | | | | |
Actual | | $ | 1,000.00 | | | $ | 1,071.60 | | | $ | 2.72 | | | | 0.52 | % |
Hypothetical (5% return before expenses) | | $ | 1,000.00 | | | $ | 1,022.58 | | | $ | 2.65 | | | | 0.52 | % |
Class R6 | | | | | | | | | | | | | | | | |
Actual | | $ | 1,000.00 | | | $ | 1,071.78 | | | $ | 1.93 | | | | 0.37 | % |
Hypothetical (5% return before expenses) | | $ | 1,000.00 | | | $ | 1,023.34 | | | $ | 1.89 | | | | 0.37 | % |
Administrator Class | | | | | | | | | | | | | | | | |
Actual | | $ | 1,000.00 | | | $ | 1,070.05 | | | $ | 3.76 | | | | 0.72 | % |
Hypothetical (5% return before expenses) | | $ | 1,000.00 | | | $ | 1,021.58 | | | $ | 3.67 | | | | 0.72 | % |
Please see footnote on page 30.
| | | | | | |
| Fund expenses (unaudited) | | Wells Fargo Dow Jones Target Date Funds | | | 29 | |
| | | | | | | | | | | | | | | | |
| Target 2050 Fund | | Beginning
account value
9-1-2016 | | | Ending
account value
2-28-2017 | | | Expenses
paid during
the period¹ | | | Annualized net
expense ratio | |
Class A | | | | | | | | | | | | | | | | |
Actual | | $ | 1,000.00 | | | $ | 1,073.42 | | | $ | 4.34 | | | | 0.83 | % |
Hypothetical (5% return before expenses) | | $ | 1,000.00 | | | $ | 1,021.02 | | | $ | 4.23 | | | | 0.83 | % |
Class C | | | | | | | | | | | | | | | | |
Actual | | $ | 1,000.00 | | | $ | 1,069.63 | | | $ | 8.24 | | | | 1.58 | % |
Hypothetical (5% return before expenses) | | $ | 1,000.00 | | | $ | 1,017.24 | | | $ | 8.03 | | | | 1.58 | % |
Class R | | | | | | | | | | | | | | | | |
Actual | | $ | 1,000.00 | | | $ | 1,072.88 | | | $ | 5.65 | | | | 1.08 | % |
Hypothetical (5% return before expenses) | | $ | 1,000.00 | | | $ | 1,019.75 | | | $ | 5.51 | | | | 1.08 | % |
Class R4 | | | | | | | | | | | | | | | | |
Actual | | $ | 1,000.00 | | | $ | 1,075.84 | | | $ | 2.72 | | | | 0.52 | % |
Hypothetical (5% return before expenses) | | $ | 1,000.00 | | | $ | 1,022.58 | | | $ | 2.65 | | | | 0.52 | % |
Class R6 | | | | | | | | | | | | | | | | |
Actual | | $ | 1,000.00 | | | $ | 1,075.90 | | | $ | 1.94 | | | | 0.37 | % |
Hypothetical (5% return before expenses) | | $ | 1,000.00 | | | $ | 1,023.34 | | | $ | 1.89 | | | | 0.37 | % |
Administrator Class | | | | | | | | | | | | | | | | |
Actual | | $ | 1,000.00 | | | $ | 1,073.93 | | | $ | 3.76 | | | | 0.72 | % |
Hypothetical (5% return before expenses) | | $ | 1,000.00 | | | $ | 1,021.58 | | | $ | 3.67 | | | | 0.72 | % |
| Target 2055 Fund | | | | | | | | | | | | |
Class A | | | | | | | | | | | | | | | | |
Actual | | $ | 1,000.00 | | | $ | 1,073.16 | | | $ | 4.34 | | | | 0.83 | % |
Hypothetical (5% return before expenses) | | $ | 1,000.00 | | | $ | 1,021.02 | | | $ | 4.23 | | | | 0.83 | % |
Class R | | | | | | | | | | | | | | | | |
Actual | | $ | 1,000.00 | | | $ | 1,070.65 | | | $ | 5.64 | | | | 1.08 | % |
Hypothetical (5% return before expenses) | | $ | 1,000.00 | | | $ | 1,019.76 | | | $ | 5.50 | | | | 1.08 | % |
Class R4 | | | | | | | | | | | | | | | | |
Actual | | $ | 1,000.00 | | | $ | 1,073.98 | | | $ | 2.72 | | | | 0.52 | % |
Hypothetical (5% return before expenses) | | $ | 1,000.00 | | | $ | 1,022.58 | | | $ | 2.65 | | | | 0.52 | % |
Class R6 | | | | | | | | | | | | | | | | |
Actual | | $ | 1,000.00 | | | $ | 1,074.63 | | | $ | 1.93 | | | | 0.37 | % |
Hypothetical (5% return before expenses) | | $ | 1,000.00 | | | $ | 1,023.34 | | | $ | 1.89 | | | | 0.37 | % |
Administrator Class | | | | | | | | | | | | | | | | |
Actual | | $ | 1,000.00 | | | $ | 1,073.76 | | | $ | 3.76 | | | | 0.72 | % |
Hypothetical (5% return before expenses) | | $ | 1,000.00 | | | $ | 1,021.58 | | | $ | 3.67 | | | | 0.72 | % |
Please see footnote on page 30.
| | | | |
| 30 | | Wells Fargo Dow Jones Target Date Funds | | Fund expenses (unaudited) |
| | | | | | | | | | | | | | | | |
| Target 2060 Fund | | Beginning
account value
9-1-2016 | | | Ending
account value
2-28-2017 | | | Expenses
paid during
the period¹ | | | Annualized net
expense ratio | |
Class A | | | | | | | | | | | | | | | | |
Actual | | $ | 1,000.00 | | | $ | 1,074.04 | | | $ | 4.34 | | | | 0.83 | % |
Hypothetical (5% return before expenses) | | $ | 1,000.00 | | | $ | 1,021.02 | | | $ | 4.23 | | | | 0.83 | % |
Class C | | | | | | | | | | | | | | | | |
Actual | | $ | 1,000.00 | | | $ | 1,070.20 | | | $ | 8.24 | | | | 1.58 | % |
Hypothetical (5% return before expenses) | | $ | 1,000.00 | | | $ | 1,017.24 | | | $ | 8.03 | | | | 1.58 | % |
Class R | | | | | | | | | | | | | | | | |
Actual | | $ | 1,000.00 | | | $ | 1,072.43 | | | $ | 5.64 | | | | 1.08 | % |
Hypothetical (5% return before expenses) | | $ | 1,000.00 | | | $ | 1,019.76 | | | $ | 5.50 | | | | 1.08 | % |
Class R4 | | | | | | | | | | | | | | | | |
Actual | | $ | 1,000.00 | | | $ | 1,074.97 | | | $ | 2.72 | | | | 0.52 | % |
Hypothetical (5% return before expenses) | | $ | 1,000.00 | | | $ | 1,022.58 | | | $ | 2.65 | | | | 0.52 | % |
Class R6 | | | | | | | | | | | | | | | | |
Actual | | $ | 1,000.00 | | | $ | 1,076.85 | | | $ | 1.94 | | | | 0.37 | % |
Hypothetical (5% return before expenses) | | $ | 1,000.00 | | | $ | 1,023.34 | | | $ | 1.89 | | | | 0.37 | % |
Administrator Class | | | | | | | | | | | | | | | | |
Actual | | $ | 1,000.00 | | | $ | 1,075.08 | | | $ | 3.77 | | | | 0.72 | % |
Hypothetical (5% return before expenses) | | $ | 1,000.00 | | | $ | 1,021.58 | | | $ | 3.67 | | | | 0.72 | % |
| 1 | Expenses paid is equal to the annualized net expense ratio of each class multiplied by the average account value over the period, multiplied by the number of days in the most recent fiscal half-year divided by the number of days in the fiscal year (to reflect the one-half-year period). |
| | | | | | |
| Portfolios of investments—February 28, 2017 | | Wells Fargo Dow Jones Target Date Funds | | | 31 | |
TARGET TODAY FUND
| | | | | | | | | | |
| Security name | | | | | | | | Value | |
| | | | |
Investment Companies: 100.30% | | | | | | | | | | |
| | | | |
| Affiliated Master Portfolios: 100.30% | | | | | | | | | | |
Wells Fargo Diversified Fixed Income Portfolio | | | | | | | | $ | 188,907,168 | |
Wells Fargo Diversified Stock Portfolio | | | | | | | | | 64,482,994 | |
Wells Fargo Short-Term Investment Portfolio | | | | | | | | | 167,306,648 | |
| | | | |
Total Investment Companies (Cost $399,171,043) | | | | | | | | | 420,696,810 | |
| | | | | | | | | | |
| | | | | | | | |
| Total investments in securities (Cost $399,171,043) * | | | 100.30 | % | | | 420,696,810 | |
Other assets and liabilities, net | | | (0.30 | ) | | | (1,267,023 | ) |
| | | | | | | | |
| Total net assets | | | 100.00 | % | | $ | 419,429,787 | |
| | | | | | | | |
| | | | | | | | |
* | | Cost for federal income tax purposes is $400,203,750 and unrealized gains (losses) consists of: |
| | Gross unrealized gains | | $ | 20,493,060 | | | |
| | Gross unrealized losses | | | 0 | | | |
| | | | | | | | |
| | Net unrealized gains | | $ | 20,493,060 | | | |
TARGET 2010 FUND
| | | | | | | | | | | | | | | | |
| Security name | | | | | | | | | | | Value | |
| | | | |
Investment Companies: 100.35% | | | | | | | | | | | | | | | | |
| | | | |
| Affiliated Master Portfolios: 100.35% | | | | | | | | | | | | | | | | |
Wells Fargo Diversified Fixed Income Portfolio | | | | | | | | | | | | | | $ | 119,860,365 | |
Wells Fargo Diversified Stock Portfolio | | | | | | | | | | | | | | | 40,452,933 | |
Wells Fargo Short-Term Investment Portfolio | | | | | | | | | | | | | | | 83,504,088 | |
| | | | |
Total Investment Companies (Cost $207,541,227) | | | | | | | | | | | | | | | 243,817,386 | |
| | | | | | | | | | | | | | | | |
| | | | | | | | |
| Total investments in securities (Cost $207,541,227) * | | | 100.35 | % | | | 243,817,386 | |
Other assets and liabilities, net | | | (0.35 | ) | | | (843,235 | ) |
| | | | | | | | |
| Total net assets | | | 100.00 | % | | $ | 242,974,151 | |
| | | | | | | | |
| | | | | | | | |
* | | Cost for federal income tax purposes is $216,268,249 and unrealized gains (losses) consists of: |
| | Gross unrealized gains | | $ | 27,549,137 | | | |
| | Gross unrealized losses | | | 0 | | | |
| | | | | | | | |
| | Net unrealized gains | | $ | 27,549,137 | | | |
The accompanying notes are an integral part of these financial statements.
| | | | |
| 32 | | Wells Fargo Dow Jones Target Date Funds | | Portfolios of investments—February 28, 2017 |
TARGET 2015 FUND
| | | | | | | | | | | | | | | | |
| Security name | | | | | | | | | | | Value | |
| | | | |
Investment Companies: 100.32% | | | | | | | | | | | | | | | | |
| | | | |
| Affiliated Master Portfolios: 100.32% | | | | | | | | | | | | | | | | |
Wells Fargo Diversified Fixed Income Portfolio | | | | | | | | | | | | | | $ | 185,911,703 | |
Wells Fargo Diversified Stock Portfolio | | | | | | | | | | | | | | | 67,527,682 | |
Wells Fargo Short-Term Investment Portfolio | | | | | | | | | | | | | | | 55,478,791 | |
| | | | |
Total Investment Companies (Cost $261,964,223) | | | | | | | | | | | | | | | 308,918,176 | |
| | | | | | | | | | | | | | | | |
| | | | | | | | |
| Total investments in securities (Cost $261,964,223) * | | | 100.32 | % | | | 308,918,176 | |
Other assets and liabilities, net | | | (0.32 | ) | | | (991,344 | ) |
| | | | | | | | |
| Total net assets | | | 100.00 | % | | $ | 307,926,832 | |
| | | | | | | | |
| | | | | | | | |
* | | Cost for federal income tax purposes is $262,484,019 and unrealized gains (losses) consists of: |
| | Gross unrealized gains | | $ | 46,434,157 | | | |
| | Gross unrealized losses | | | 0 | | | |
| | | | | | | | |
| | Net unrealized gains | | $ | 46,434,157 | | | |
TARGET 2020 FUND
| | | | | | | | | | | | | | | | |
| Security name | | | | | | | | | | | Value | |
| | | | |
Investment Companies: 100.62% | | | | | | | | | | | | | | | | |
| | | | |
| Affiliated Master Portfolios: 100.62% | | | | | | | | | | | | | | | | |
Wells Fargo Diversified Fixed Income Portfolio | | | | | | | | | | | | | | $ | 939,619,926 | |
Wells Fargo Diversified Stock Portfolio | | | | | | | | | | | | | | | 439,077,058 | |
Wells Fargo Short-Term Investment Portfolio | | | | | | | | | | | | | | | 56,751,574 | |
| | | | |
Total Investment Companies (Cost $1,268,638,833) | | | | | | | | | | | | | | | 1,435,448,558 | |
| | | | | | | | | | | | | | | | |
| | | | | | | | |
| Total investments in securities (Cost $1,268,638,833) * | | | 100.62 | % | | | 1,435,448,558 | |
Other assets and liabilities, net | | | (0.62 | ) | | | (8,866,878 | ) |
| | | | | | | | |
| Total net assets | | | 100.00 | % | | $ | 1,426,581,680 | |
| | | | | | | | |
| | | | | | | | |
* | | Cost for federal income tax purposes is $1,283,576,306 and unrealized gains (losses) consists of: |
| | Gross unrealized gains | | $ | 151,872,252 | | | |
| | Gross unrealized losses | | | 0 | | | |
| | | | | | | | |
| | Net unrealized gains | | $ | 151,872,252 | | | |
The accompanying notes are an integral part of these financial statements.
| | | | | | |
| Portfolios of investments—February 28, 2017 | | Wells Fargo Dow Jones Target Date Funds | | | 33 | |
TARGET 2025 FUND
| | | | | | | | | | | | | | | | |
| Security name | | | | | | | | | | | Value | |
| | | | |
Investment Companies: 100.37% | | | | | | | | | | | | | | | | |
| | | | |
| Affiliated Master Portfolios: 100.37% | | | | | | | | | | | | | | | | |
Wells Fargo Diversified Fixed Income Portfolio | | | | | | | | | | | | | | $ | 464,928,354 | |
Wells Fargo Diversified Stock Portfolio | | | | | | | | | | | | | | | 357,839,929 | |
Wells Fargo Short-Term Investment Portfolio | | | | | | | | | | | | | | | 33,776,655 | |
| | | | |
Total Investment Companies (Cost $651,324,135) | | | | | | | | | | | | | | | 856,544,938 | |
| | | | | | | | | | | | | | | | |
| | | | | | | | |
| Total investments in securities (Cost $651,324,135) * | | | 100.37 | % | | | 856,544,938 | |
Other assets and liabilities, net | | | (0.37 | ) | | | (3,146,927 | ) |
| | | | | | | | |
| Total net assets | | | 100.00 | % | | $ | 853,398,011 | |
| | | | | | | | |
| | | | | | | | |
* | | Cost for federal income tax purposes is $651,894,058 and unrealized gains (losses) consists of: |
| | Gross unrealized gains | | $ | 204,650,880 | | | |
| | Gross unrealized losses | | | 0 | | | |
| | | | | | | | |
| | Net unrealized gains | | $ | 204,650,880 | | | |
TARGET 2030 FUND
| | | | | | | | | | | | | | | | |
| Security name | | | | | | | | | | | Value | |
| | | | |
Investment Companies: 100.46% | | | | | | | | | | | | | | | | |
| | | | |
| Affiliated Master Portfolios: 100.46% | | | | | | | | | | | | | | | | |
Wells Fargo Diversified Fixed Income Portfolio | | | | | | | | | | | | | | $ | 644,323,921 | |
Wells Fargo Diversified Stock Portfolio | | | | | | | | | | | | | | | 923,061,006 | |
Wells Fargo Short-Term Investment Portfolio | | | | | | | | | | | | | | | 64,115,446 | |
| | | | |
Total Investment Companies (Cost $1,392,885,357) | | | | | | | | | | | | | | | 1,631,500,373 | |
| | | | | | | | | | | | | | | | |
| | | | | | | | |
| Total investments in securities (Cost $1,392,885,357) * | | | 100.46 | % | | | 1,631,500,373 | |
Other assets and liabilities, net | | | (0.46 | ) | | | (7,447,280 | ) |
| | | | | | | | |
| Total net assets | | | 100.00 | % | | $ | 1,624,053,093 | |
| | | | | | | | |
| | | | | | | | |
* | | Cost for federal income tax purposes is $1,401,360,676 and unrealized gains (losses) consists of: |
| | Gross unrealized gains | | $ | 230,139,697 | | | |
| | Gross unrealized losses | | | 0 | | | |
| | | | | | | | |
| | Net unrealized gains | | $ | 230,139,697 | | | |
The accompanying notes are an integral part of these financial statements.
| | | | |
| 34 | | Wells Fargo Dow Jones Target Date Funds | | Portfolios of investments—February 28, 2017 |
TARGET 2035 FUND
| | | | | | | | | | | | | | | | |
| Security name | | | | | | | | | | | Value | |
| | | | |
Investment Companies: 100.52% | | | | | | | | | | | | | | | | |
| | | | |
| Affiliated Master Portfolios: 100.52% | | | | | | | | | | | | | | | | |
Wells Fargo Diversified Fixed Income Portfolio | | | | | | | | | | | | | | $ | 197,630,899 | |
Wells Fargo Diversified Stock Portfolio | | | | | | | | | | | | | | | 513,200,543 | |
Wells Fargo Short-Term Investment Portfolio | | | | | | | | | | | | | | | 28,987,324 | |
| | | | |
Total Investment Companies (Cost $611,072,993) | | | | | | | | | | | | | | | 739,818,766 | |
| | | | | | | | | | | | | | | | |
| | | | | | | | |
| Total investments in securities (Cost $611,072,993) * | | | 100.52 | % | | | 739,818,766 | |
Other assets and liabilities, net | | | (0.52 | ) | | | (3,836,149 | ) |
| | | | | | | | |
| Total net assets | | | 100.00 | % | | $ | 735,982,617 | |
| | | | | | | | |
| | | | | | | | |
* | | Cost for federal income tax purposes is $610,402,925 and unrealized gains (losses) consists of: |
| | Gross unrealized gains | | $ | 129,415,841 | | | |
| | Gross unrealized losses | | | 0 | | | |
| | | | | | | | |
| | Net unrealized gains | | $ | 129,415,841 | | | |
TARGET 2040 FUND
| | | | | | | | | | | | | | | | |
| Security name | | | | | | | | | | | Value | |
| | | | |
Investment Companies: 100.48% | | | | | | | | | | | | | | | | |
| | | | |
| Affiliated Master Portfolios: 100.48% | | | | | | | | | | | | | | | | |
Wells Fargo Diversified Fixed Income Portfolio | | | | | | | | | | | | | | $ | 212,922,169 | |
Wells Fargo Diversified Stock Portfolio | | | | | | | | | | | | | | | 1,041,707,891 | |
Wells Fargo Short-Term Investment Portfolio | | | | | | | | | | | | | | | 51,033,897 | |
| | | | |
Total Investment Companies (Cost $1,108,101,958) | | | | | | | | | | | | | | | 1,305,663,957 | |
| | | | | | | | | | | | | | | | |
| | | | | | | | |
| Total investments in securities (Cost $1,108,101,958) * | | | 100.48 | % | | | 1,305,663,957 | |
Other assets and liabilities, net | | | (0.48 | ) | | | (6,211,865 | ) |
| | | | | | | | |
| Total net assets | | | 100.00 | % | | $ | 1,299,452,092 | |
| | | | | | | | |
| | | | | | | | |
* | | Cost for federal income tax purposes is $1,112,086,521 and unrealized gains (losses) consists of: |
| | Gross unrealized gains | | $ | 193,577,436 | | | |
| | Gross unrealized losses | | | 0 | | | |
| | | | | | | | |
| | Net unrealized gains | | $ | 193,577,436 | | | |
The accompanying notes are an integral part of these financial statements.
| | | | | | |
| Portfolios of investments—February 28, 2017 | | Wells Fargo Dow Jones Target Date Funds | | | 35 | |
TARGET 2045 FUND
| | | | | | | | | | | | | | | | |
| Security name | | | | | | | | | | | Value | |
| | | | |
Investment Companies: 100.56% | | | | | | | | | | | | | | | | |
| | | | |
| Affiliated Master Portfolios: 100.56% | | | | | | | | | | | | | | | | |
Wells Fargo Diversified Fixed Income Portfolio | | | | | | | | | | | | | | $ | 44,950,467 | |
Wells Fargo Diversified Stock Portfolio | | | | | | | | | | | | | | | 422,816,085 | |
Wells Fargo Short-Term Investment Portfolio | | | | | | | | | | | | | | | 18,994,336 | |
| | | | |
Total Investment Companies (Cost $416,397,795) | | | | | | | | | | | | | | | 486,760,888 | |
| | | | | | | | | | | | | | | | |
| | | | | | | | |
| Total investments in securities (Cost $416,397,795) * | | | 100.56 | % | | | 486,760,888 | |
Other assets and liabilities, net | | | (0.56 | ) | | | (2,723,943 | ) |
| | | | | | | | |
| Total net assets | | | 100.00 | % | | $ | 484,036,945 | |
| | | | | | | | |
| | | | | | | | |
* | | Cost for federal income tax purposes is $415,175,954 and unrealized gains (losses) consists of: |
| | Gross unrealized gains | | $ | 71,584,934 | | | |
| | Gross unrealized losses | | | 0 | | | |
| | | | | | | | |
| | Net unrealized gains | | $ | 71,584,934 | | | |
TARGET 2050 FUND
| | | | | | | | | | | | | | | | |
| Security name | | | | | | | | | | | Value | |
| | | | |
Investment Companies: 100.43% | | | | | | | | | | | | | | | | |
| | | | |
| Affiliated Master Portfolios: 100.43% | | | | | | | | | | | | | | | | |
Wells Fargo Diversified Fixed Income Portfolio | | | | | | | | | | | | | | $ | 44,128,706 | |
Wells Fargo Diversified Stock Portfolio | | | | | | | | | | | | | | | 648,250,757 | |
Wells Fargo Short-Term Investment Portfolio | | | | | | | | | | | | | | | 28,093,758 | |
| | | | |
Total Investment Companies (Cost $568,782,909) | | | | | | | | | | | | | | | 720,473,221 | |
| | | | | | | | | | | | | | | | |
| | | | | | | | |
| Total investments in securities (Cost $568,782,909) * | | | 100.43 | % | | | 720,473,221 | |
Other assets and liabilities, net | | | (0.43 | ) | | | (3,075,159 | ) |
| | | | | | | | |
| Total net assets | | | 100.00 | % | | $ | 717,398,062 | |
| | | | | | | | |
| | | | | | | | |
* | | Cost for federal income tax purposes is $568,316,198 and unrealized gains (losses) consists of: |
| | Gross unrealized gains | | $ | 152,157,023 | | | |
| | Gross unrealized losses | | | 0 | | | |
| | | | | | | | |
| | Net unrealized gains | | $ | 152,157,023 | | | |
The accompanying notes are an integral part of these financial statements.
| | | | |
| 36 | | Wells Fargo Dow Jones Target Date Funds | | Portfolios of investments—February 28, 2017 |
TARGET 2055 FUND
| | | | | | | | | | | | | | | | |
| Security name | | | | | | | | | | | Value | |
| | | | |
Investment Companies: 100.60% | | | | | | | | | | | | | | | | |
| | | | |
| Affiliated Master Portfolios: 100.60% | | | | | | | | | | | | | | | | |
Wells Fargo Diversified Fixed Income Portfolio | | | | | | | | | | | | | | $ | 7,717,105 | |
Wells Fargo Diversified Stock Portfolio | | | | | | | | | | | | | | | 115,718,641 | |
Wells Fargo Short-Term Investment Portfolio | | | | | | | | | | | | | | | 5,008,345 | |
| | | | |
Total Investment Companies (Cost $115,084,581) | | | | | | | | | | | | | | | 128,444,091 | |
| | | | | | | | | | | | | | | | |
| | | | | | | | |
| Total investments in securities (Cost $115,084,581) * | | | 100.60 | % | | | 128,444,091 | |
Other assets and liabilities, net | | | (0.60 | ) | | | (770,611 | ) |
| | | | | | | | |
| Total net assets | | | 100.00 | % | | $ | 127,673,480 | |
| | | | | | | | |
| | | | | | | | |
* | | Cost for federal income tax purposes is $113,688,579 and unrealized gains (losses) consists of: |
| | Gross unrealized gains | | $ | 14,755,512 | | | |
| | Gross unrealized losses | | | 0 | | | |
| | | | | | | | |
| | Net unrealized gains | | $ | 14,755,512 | | | |
TARGET 2060 FUND
| | | | | | | | | | | | | | | | |
| Security name | | | | | | | | | | | Value | |
| | | | |
Investment Companies: 100.10% | | | | | | | | | | | | | | | | |
| | | | |
| Affiliated Master Portfolios: 100.10% | | | | | | | | | | | | | | | | |
Wells Fargo Diversified Fixed Income Portfolio | | | | | | | | | | | | | | $ | 1,469,805 | |
Wells Fargo Diversified Stock Portfolio | | | | | | | | | | | | | | | 22,039,855 | |
Wells Fargo Short-Term Investment Portfolio | | | | | | | | | | | | | | | 953,893 | |
| | | | |
Total Investment Companies (Cost $25,831,222) | | | | | | | | | | | | | | | 24,463,553 | |
| | | | | | | | | | | | | | | | |
| | | | | | | | |
| Total investments in securities (Cost $25,831,222) * | | | 100.10 | % | | | 24,463,553 | |
Other assets and liabilities, net | | | (0.10 | ) | | | (25,231 | ) |
| | | | | | | | |
| Total net assets | | | 100.00 | % | | $ | 24,438,322 | |
| | | | | | | | |
| | | | | | | | |
* | | Cost for federal income tax purposes is $25,754,893 and unrealized gains (losses) consists of: |
| | Gross unrealized gains | | $ | 0 | | | |
| | Gross unrealized losses | | | (1,291,340 | ) | | |
| | | | | | | | |
| | Net unrealized losses | | $ | (1,291,340 | ) | | |
The accompanying notes are an integral part of these financial statements.
This page is intentionally left blank.
| | | | |
| 38 | | Wells Fargo Dow Jones Target Date Funds | | Statements of assets and liabilities—February 28, 2017 |
| | | | | | | | | | | | | | | | |
| | | Target Today Fund | | | Target 2010 Fund | | | Target 2015 Fund | | | Target 2020 Fund | |
| | | | |
Assets | | | | | | | | | | | | | | | | |
Investments in affiliated Master Portfolios, at value (see cost below) | | $ | 420,696,810 | | | $ | 243,817,386 | | | $ | 308,918,176 | | | $ | 1,435,448,558 | |
Receivable for Fund shares sold | | | 3,379,095 | | | | 152,859 | | | | 1,257,007 | | | | 2,520,699 | |
Receivable from manager | | | 0 | | | | 0 | | | | 0 | | | | 0 | |
Prepaid expenses and other assets | | | 46,048 | | | | 38,529 | | | | 31,583 | | | | 53,547 | |
| | | | |
Total assets | | | 424,121,953 | | | | 244,008,774 | | | | 310,206,766 | | | | 1,438,022,804 | |
| | | | |
| | | | |
Liabilities | | | | | | | | | | | | | | | | |
Payable for Fund shares redeemed | | | 4,549,976 | | | | 940,258 | | | | 2,170,650 | | | | 11,012,095 | |
Management fee payable | | | 17,663 | | | | 8,787 | | | | 11,375 | | | | 123,494 | |
Distribution fees payable | | | 1,625 | | | | 1,027 | | | | 7 | | | | 3,972 | |
Administration fees payable | | | 30,855 | | | | 19,884 | | | | 20,569 | | | | 93,398 | |
Accrued expenses and other liabilities | | | 92,047 | | | | 64,667 | | | | 77,333 | | | | 208,165 | |
| | | | |
Total liabilities | | | 4,692,166 | | | | 1,034,623 | | | | 2,279,934 | | | | 11,441,124 | |
| | | | |
Total net assets | | $ | 419,429,787 | | | $ | 242,974,151 | | | $ | 307,926,832 | | | $ | 1,426,581,680 | |
| | | | |
| | | | |
NET ASSETS CONSIST OF | | | | | | | | | | | | | | | | |
Paid-in capital | | $ | 395,263,573 | | | $ | 211,015,136 | | | $ | 254,392,682 | | | $ | 1,245,977,663 | |
Undistributed (overdistributed) net investment income | | | (930,686 | ) | | | (694,475 | ) | | | (1,147,289 | ) | | | (5,252,741 | ) |
Accumulated net realized gains (losses) on investments | | | 3,571,133 | | | | (3,622,669 | ) | | | 7,727,486 | | | | 19,047,033 | |
Net unrealized gains (losses) on investments | | | 21,525,767 | | | | 36,276,159 | | | | 46,953,953 | | | | 166,809,725 | |
| | | | |
Total net assets | | $ | 419,429,787 | | | $ | 242,974,151 | | | $ | 307,926,832 | | | $ | 1,426,581,680 | |
| | | | |
| | | | |
COMPUTATION OF NET ASSET VALUE AND OFFERING PRICE PER SHARE | | | | | | | | | | | | | | | | |
Net assets – Class A | | $ | 55,964,630 | | | $ | 60,236,561 | | | $ | 54,769,595 | | | $ | 218,652,025 | |
Shares outstanding – Class A1 | | | 5,299,732 | | | | 4,852,742 | | | | 5,414,073 | | | | 14,706,086 | |
Net asset value per share – Class A | | | $10.56 | | | | $12.41 | | | | $10.12 | | | | $14.87 | |
Maximum offering price per share – Class A2 | | | $11.20 | | | | $13.17 | | | | $10.74 | | | | $15.78 | |
Net assets – Class C | | $ | 2,821,971 | | | $ | 1,760,803 | | | | N/A | | | $ | 6,712,779 | |
Shares outstanding – Class C1 | | | 262,123 | | | | 140,221 | | | | N/A | | | | 455,241 | |
Net asset value per share – Class C | | | $10.77 | | | | $12.56 | | | | N/A | | | | $14.75 | |
Net assets – Class R | | $ | 32,197 | | | $ | 53,046 | | | $ | 36,568 | | | $ | 321,276 | |
Shares outstanding – Class R1 | | | 3,059 | | | �� | 4,301 | | | | 3,565 | | | | 21,694 | |
Net asset value per share – Class R | | | $10.53 | | | | $12.33 | | | | $10.26 | | | | $14.81 | |
Net assets – Class R4 | | $ | 248,734,306 | | | $ | 48,884,666 | | | $ | 105,773,101 | | | $ | 357,823,336 | |
Share outstanding – Class R41 | | | 23,019,143 | | | | 3,896,723 | | | | 10,410,276 | | | | 23,622,067 | |
Net asset value per share – Class R4 | | | $10.81 | | | | $12.55 | | | | $10.16 | | | | $15.15 | |
Net assets – Class R6 | | $ | 72,643,052 | | | $ | 82,473,667 | | | $ | 125,437,544 | | | $ | 645,236,948 | |
Shares outstanding – Class R61 | | | 6,740,310 | | | | 6,579,031 | | | | 12,357,066 | | | | 42,620,127 | |
Net asset value per share – Class R6 | | | $10.78 | | | | $12.54 | | | | $10.15 | | | | $15.14 | |
Net assets – Administrator Class | | $ | 39,233,631 | | | $ | 49,565,408 | | | $ | 21,910,024 | | | $ | 197,835,316 | |
Shares outstanding – Administrator Class1 | | | 3,638,110 | | | | 3,950,247 | | | | 2,128,907 | | | | 13,107,783 | |
Net asset value per share – Administrator Class | | | $10.78 | | | | $12.55 | | | | $10.29 | | | | $15.09 | |
| | | | |
Investments in affiliated Master Portfolios, at cost | | $ | 399,171,043 | | | $ | 207,541,227 | | | $ | 261,964,223 | | | $ | 1,268,638,833 | |
| | | | |
| 1 | Each Fund has an unlimited number of authorized shares. |
| 2 | Maximum offering price is computed as 100/94.25 of net asset value. On investments of $50,000 or more, the offering price is reduced. |
The accompanying notes are an integral part of these financial statements.
| | | | | | |
| Statements of assets and liabilities—February 28, 2017 | | Wells Fargo Dow Jones Target Date Funds | | | 39 | |
| | | | | | | | | | | | | | | | | | | | | | | | | | | | | | |
Target 2025 Fund | | | Target 2030 Fund | | | Target 2035 Fund | | | Target 2040 Fund | | | Target 2045 Fund | | | Target 2050 Fund | | | Target 2055 Fund | | | Target 2060 Fund | |
| | | | | | | |
| | | | | | | | | | | | | | | | | | | | | | | | | | | | | | |
| $ | 856,544,938 | | | $ | 1,631,500,373 | | | $ | 739,818,766 | | | $ | 1,305,663,957 | | | $ | 486,760,888 | | | $ | 720,473,221 | | | $ | 128,444,091 | | | $ | 24,463,553 | |
| | 2,746,875 | | | | 4,287,270 | | | | 2,938,293 | | | | 2,680,912 | | | | 2,224,819 | | | | 3,172,027 | | | | 2,385,961 | | | | 444,161 | |
| | 0 | | | | 0 | | | | 0 | | | | 0 | | | | 0 | | | | 0 | | | | 0 | | | | 9,572 | |
| | 83,994 | | | | 53,347 | | | | 39,691 | | | | 51,779 | | | | 35,494 | | | | 39,090 | | | | 38,790 | | | | 21,533 | |
| | |
| | 859,375,807 | | | | 1,635,840,990 | | | | 742,796,750 | | | | 1,308,396,648 | | | | 489,021,201 | | | | 723,684,338 | | | | 130,868,842 | | | | 24,938,819 | |
| | |
| | | | | | | |
| | | | | | | | | | | | | | | | | | | | | | | | | | | | | | |
| | 5,716,169 | | | | 11,288,975 | | | | 6,579,683 | | | | 8,527,567 | | | | 4,831,248 | | | | 6,065,216 | | | | 3,153,461 | | | | 471,389 | |
| | 67,407 | | | | 150,961 | | | | 64,022 | | | | 126,305 | | | | 36,094 | | | | 59,899 | | | | 233 | | | | 0 | |
| | 116 | | | | 2,841 | | | | 32 | | | | 2,815 | | | | 8 | | | | 701 | | | | 8 | | | | 168 | |
| | 54,751 | | | | 109,289 | | | | 47,605 | | | | 90,287 | | | | 29,812 | | | | 43,878 | | | | 6,697 | | | | 1,267 | |
| | 139,353 | | | | 235,831 | | | | 122,791 | | | | 197,582 | | | | 87,094 | | | | 116,582 | | | | 34,963 | | | | 27,673 | |
| | |
| | 5,977,796 | | | | 11,787,897 | | | | 6,814,133 | | | | 8,944,556 | | | | 4,984,256 | | | | 6,286,276 | | | | 3,195,362 | | | | 500,497 | |
| | |
| $ | 853,398,011 | | | $ | 1,624,053,093 | | | $ | 735,982,617 | | | $ | 1,299,452,092 | | | $ | 484,036,945 | | | $ | 717,398,062 | | | $ | 127,673,480 | | | $ | 24,438,322 | |
| | |
| | | | | | | |
| | | | | | | | | | | | | | | | | | | | | | | | | | | | | | |
| $ | 615,994,662 | | | $ | 1,349,274,065 | | | $ | 582,431,441 | | | $ | 1,066,777,692 | | | $ | 397,837,914 | | | $ | 538,074,468 | | | $ | 114,688,225 | | | $ | 25,935,904 | |
| | (3,499,335 | ) | | | (2,736,262 | ) | | | (789,308 | ) | | | (1,456,786 | ) | | | (261,090 | ) | | | (1,048,939 | ) | | | 79,043 | | | | 23,529 | |
| | 35,681,881 | | | | 38,900,274 | | | | 25,594,711 | | | | 36,569,187 | | | | 16,097,028 | | | | 28,682,221 | | | | (453,298 | ) | | | (153,442 | ) |
| | 205,220,803 | | | | 238,615,016 | | | | 128,745,773 | | | | 197,561,999 | | | | 70,363,093 | | | | 151,690,312 | | | | 13,359,510 | | | | (1,367,669 | ) |
| | |
| $ | 853,398,011 | | | $ | 1,624,053,093 | | | $ | 735,982,617 | | | $ | 1,299,452,092 | | | $ | 484,036,945 | | | $ | 717,398,062 | | | $ | 127,673,480 | | | $ | 24,438,322 | |
| | |
| | | | | | | |
| | | | | | | | | | | | | | | | | | | | | | | | | | | | | | |
| $ | 140,427,695 | | | $ | 230,043,730 | | | $ | 127,293,995 | | | $ | 218,688,574 | | | $ | 70,569,744 | | | $ | 64,356,270 | | | $ | 9,270,290 | | | $ | 671,204 | |
| | 13,395,272 | | | | 13,772,338 | | | | 11,312,890 | | | | 11,257,464 | | | | 5,926,190 | | | | 5,645,179 | | | | 666,617 | | | | 62,791 | |
| | $10.48 | | | | $16.70 | | | | $11.25 | | | | $19.43 | | | | $11.91 | | | | $11.40 | | | | $13.91 | | | | $10.69 | |
| | $11.12 | | | | $17.72 | | | | $11.94 | | | | $20.62 | | | | $12.64 | | | | $12.10 | | | | $14.76 | | | | $11.34 | |
| | N/A | | | $ | 4,630,444 | | | | N/A | | | $ | 4,782,085 | | | | N/A | | | $ | 1,217,874 | | | | N/A | | | $ | 252,002 | |
| | N/A | | | | 285,059 | | | | N/A | | | | 262,889 | | | | N/A | | | | 107,230 | | | | N/A | | | | 23,529 | |
| | N/A | | | | $16.24 | | | | N/A | | | | $18.19 | | | | N/A | | | | $11.36 | | | | N/A | | | | $10.71 | |
| $ | 610,351 | | | $ | 904,062 | | | $ | 171,138 | | | $ | 394,319 | | | $ | 41,892 | | | $ | 34,288 | | | $ | 40,300 | | | $ | 126,935 | |
| | 58,158 | | | | 54,269 | | | | 15,124 | | | | 20,364 | | | | 3,478 | | | | 3,001 | | | | 2,928 | | | | 12,049 | |
| | $10.49 | | | | $16.66 | | | | $11.32 | | | | $19.36 | | | | $12.04 | | | | $11.43 | | | | $13.76 | | | | $10.53 | |
| $ | 274,638,821 | | | $ | 507,587,474 | | | $ | 240,024,788 | | | $ | 388,621,613 | | | $ | 151,999,383 | | | $ | 243,338,511 | | | $ | 43,146,985 | | | $ | 6,443,151 | |
| | 26,102,810 | | | | 29,942,523 | | | | 21,299,509 | | | | 19,571,128 | | | | 12,711,465 | | | | 21,258,656 | | | | 3,094,452 | | | | 591,935 | |
| | $10.52 | | | | $16.95 | | | | $11.27 | | | | $19.86 | | | | $11.96 | | | | $11.45 | | | | $13.94 | | | | $10.88 | |
| $ | 372,100,909 | | | $ | 618,551,003 | | | $ | 317,594,207 | | | $ | 489,693,031 | | | $ | 219,921,834 | | | $ | 287,422,776 | | | $ | 65,515,678 | | | $ | 12,518,173 | |
| | 35,393,296 | | | | 36,526,805 | | | | 28,186,044 | | | | 24,668,088 | | | | 18,428,160 | | | | 25,126,168 | | | | 4,708,306 | | | | 1,153,076 | |
| | $10.51 | | | | $16.93 | | | | $11.27 | | | | $19.85 | | | | $11.93 | | | | $11.44 | | | | $13.91 | | | | $10.86 | |
| $ | 65,620,235 | | | $ | 262,336,380 | | | $ | 50,898,489 | | | $ | 197,272,470 | | | $ | 41,504,092 | | | $ | 121,028,343 | | | $ | 9,700,227 | | | $ | 4,426,857 | |
| | 6,221,682 | | | | 15,483,974 | | | | 4,503,544 | | | | 9,952,110 | | | | 3,456,356 | | | | 10,606,569 | | | | 697,401 | | | | 412,245 | |
| | $10.55 | | | | $16.94 | | | | $11.30 | | | | $19.82 | | | | $12.01 | | | | $11.41 | | | | $13.91 | | | | $10.74 | |
| | | | | | | |
| $ | 651,324,135 | | | $ | 1,392,885,357 | | | $ | 611,072,993 | | | $ | 1,108,101,958 | | | $ | 416,397,795 | | | $ | 568,782,909 | | | $ | 115,084,581 | | | $ | 25,831,222 | |
| | |
The accompanying notes are an integral part of these financial statements.
| | | | |
| 40 | | Wells Fargo Dow Jones Target Date Funds | | Statements of operations—year ended February 28, 2017 |
| | | | | | | | | | | | | | | | |
| | | Target Today Fund | | | Target 2010 Fund | | | Target 2015 Fund | | | Target 2020 Fund | |
| | | | |
Investment income | | | | | | | | | | | | | | | | |
Interest allocated from affiliated Master Portfolios* | | $ | 8,801,890 | | | $ | 5,772,673 | | | $ | 10,424,033 | | | $ | 35,505,985 | |
Dividends allocated from affiliated Master Portfolios** | | | 1,875,557 | | | | 1,327,261 | | | | 2,859,294 | | | | 14,660,331 | |
Affiliated income allocated from affiliated Master Portfolios | | | 84,138 | | | | 53,278 | | | | 83,747 | | | | 445,947 | |
Securities lending income allocated from affiliated Master Portfolios | | | 53,095 | | | | 37,741 | | | | 80,538 | | | | 404,367 | |
Other income and other income allocated from affiliated Master Portfolios | | | 2,786 | | | | 1,703 | | | | 2,439 | | | | 11,513 | |
Expenses allocated from affiliated Master Portfolios | | | (910,058 | ) | | | (580,540 | ) | | | (980,207 | ) | | | (3,721,713 | ) |
| | | | |
Total investment income | | | 9,907,408 | | | | 6,612,116 | | | | 12,469,844 | | | | 47,306,430 | |
| | | | |
| | | | |
Expenses | | | | | | | | | | | | | | | | |
Management fee | | | 1,188,770 | | | | 746,149 | | | | 1,198,201 | | | | 4,491,254 | |
Administration fees | | | | | | | | | | | | | | | | |
Class A | | | 132,914 | | | | 136,765 | | | | 140,984 | | | | 482,519 | |
Class B | | | 4 | 1 | | | 48 | 1 | | | N/A | | | | 54 | 1 |
Class C | | | 6,114 | | | | 4,138 | | | | N/A | | | | 14,353 | |
Class R | | | 63 | | | | 112 | | | | 88 | | | | 896 | |
Class R4 | | | 214,346 | | | | 50,348 | | | | 95,480 | | | | 325,170 | |
Class R6 | | | 61,131 | | | | 48,873 | | | | 93,120 | | | | 340,385 | |
Administrator Class | | | 73,381 | | | | 104,075 | | | | 132,825 | | | | 607,735 | |
Shareholder servicing fees | | | | | | | | | | | | | | | | |
Class A | | | 158,231 | | | | 162,815 | | | | 167,838 | | | | 574,427 | |
Class B | | | 4 | 1 | | | 57 | 1 | | | N/A | | | | 65 | 1 |
Class C | | | 7,278 | | | | 4,926 | | | | N/A | | | | 17,087 | |
Class R | | | 75 | | | | 133 | | | | 105 | | | | 1,066 | |
Class R4 | | | 267,933 | | | | 62,723 | | | | 119,350 | | | | 405,937 | |
Administrator Class | | | 141,118 | | | | 199,908 | | | | 255,086 | | | | 1,166,796 | |
Distribution fees | | | | | | | | | | | | | | | | |
Class B | | | 14 | 1 | | | 172 | 1 | | | N/A | | | | 194 | 1 |
Class C | | | 21,835 | | | | 14,778 | | | | N/A | | | | 51,261 | |
Class R | | | 75 | | | | 133 | | | | 105 | | | | 1,066 | |
Custody and accounting fees | | | 24,082 | | | | 14,238 | | | | 24,255 | | | | 86,000 | |
Professional fees | | | 36,920 | | | | 35,277 | | | | 38,011 | | | | 38,610 | |
Registration fees | | | 93,601 | | | | 83,892 | | | | 99,010 | | | | 107,788 | |
Shareholder report expenses | | | 45,596 | | | | 39,573 | | | | 53,739 | | | | 89,746 | |
Trustees’ fees and expenses | | | 23,050 | | | | 23,046 | | | | 23,050 | | | | 23,148 | |
Other fees and expenses | | | 16,154 | | | | 12,289 | | | | 17,254 | | | | 41,775 | |
| | | | |
Total expenses | | | 2,512,689 | | | | 1,744,468 | | | | 2,458,501 | | | | 8,867,332 | |
Less: Fee waivers and/or expense reimbursements | | | (713,519 | ) | | | (432,487 | ) | | | (615,925 | ) | | | (1,340,460 | ) |
| | | | |
Net expenses | | | 1,799,170 | | | | 1,311,981 | | | | 1,842,576 | | | | 7,526,872 | |
| | | | |
Net investment income | | | 8,108,238 | | | | 5,300,135 | | | | 10,627,268 | | | | 39,779,558 | |
| | | | |
| | | | |
REALIZED AND UNREALIZED GAINS (LOSSES) ON INVESTMENTS | | | | | | | | | | | | | | | | |
Net realized gains on securities transactions allocated from affiliated Master Portfolios | | | 19,448,165 | | | | 17,262,849 | | | | 31,119,358 | | | | 156,680,560 | |
Net change in unrealized gains (losses) on securities transactions allocated from affiliated Master Portfolios | | | (6,228,835 | ) | | | (6,339,716 | ) | | | (8,924,342 | ) | | | (34,503,411 | ) |
| | | | |
Net realized and unrealized gains (losses) on investments | | | 13,219,330 | | | | 10,923,133 | | | | 22,195,016 | | | | 122,177,149 | |
| | | | |
Net increase in net assets resulting from operations | | $ | 21,327,568 | | | $ | 16,223,268 | | | $ | 32,822,284 | | | $ | 161,956,707 | |
| | | | |
| | | | |
* Net of foreign interest withholding taxes allocated from affiliated Master Portfolios in the amount of | | | $56,323 | | | | $38,172 | | | | $76,540 | | | | $255,353 | |
** Net of foreign dividend withholding taxes allocated from affiliated Master Portfolios in the amount of | | | $101,961 | | | | $73,378 | | | | $158,792 | | | | $802,122 | |
| 1 | For the period from March 1, 2016 to December 5, 2016. Effective at the close of business on December 5, 2016, Class B shares were converted to Class A shares and are no longer offered by the Fund. |
The accompanying notes are an integral part of these financial statements.
| | | | | | |
| Statements of operations—year ended February 28, 2017 | | Wells Fargo Dow Jones Target Date Funds | | | 41 | |
| | | | | | | | | | | | | | | | | | | | | | | | | | | | | | |
Target 2025 Fund | | | Target 2030 Fund | | | Target 2035 Fund | | | Target 2040 Fund | | | Target 2045 Fund | | | Target 2050 Fund | | | Target 2055 Fund | | | Target 2060 Fund | |
| | | | | | | |
| | | | | | | | | | | | | | | | | | | | | | | | | | | | | | |
| $ | 25,235,094 | | | $ | 23,115,951 | | | $ | 7,861,383 | | | $ | 7,332,848 | | | $ | 1,753,105 | | | $ | 2,182,005 | | | $ | 403,054 | | | $ | 20,451 | |
| | 18,739,288 | | | | 29,864,804 | | | | 18,197,335 | | | | 30,733,708 | | | | 13,334,910 | | | | 23,772,761 | | | | 4,383,977 | | | | 165,633 | |
| | 253,263 | | | | 450,038 | | | | 191,394 | | | | 319,559 | | | | 114,516 | | | | 166,495 | | | | 29,662 | | | | 5,649 | |
| | 511,251 | | | | 806,007 | | | | 487,758 | | | | 821,285 | | | | 354,692 | | | | 634,413 | | | | 116,079 | | | | 3,898 | |
| | 8,409 | | | | 16,769 | | | | 8,679 | | | | 15,471 | | | | 6,275 | | | | 9,168 | | | | 1,519 | | | | 242 | |
| | (3,275,470 | ) | | | (4,086,538 | ) | | | (2,037,920 | ) | | | (3,055,371 | ) | | | (1,222,003 | ) | | | (2,086,583 | ) | | | (387,618 | ) | | | (20,041 | ) |
| | |
| | 41,471,835 | | | | 50,167,031 | | | | 24,708,629 | | | | 36,167,500 | | | | 14,341,495 | | | | 24,678,259 | | | | 4,546,673 | | | | 175,832 | |
| | |
| | | | | | | |
| | | | | | | | | | | | | | | | | | | | | | | | | | | | | | |
| | 3,979,043 | | | | 4,934,827 | | | | 2,465,902 | | | | 3,687,989 | | | | 1,476,796 | | | | 2,531,919 | | | | 470,420 | | | | 23,180 | |
| | | | | | | | | | | | | | | | | | | | | | | | | | | | | | |
| | 342,533 | | | | 490,146 | | | | 292,721 | | | | 448,612 | | | | 161,160 | | | | 131,146 | | | | 19,959 | | | | 660 | |
| | N/A | | | | 58 | 1 | | | N/A | | | | 109 | 1 | | | N/A | | | | N/A | | | | N/A | | | | N/A | |
| | N/A | | | | 10,122 | | | | N/A | | | | 10,034 | | | | N/A | | | | 2,204 | | | | N/A | | | | 466 | |
| | 1,325 | | | | 1,919 | | | | 265 | | | | 687 | | | | 73 | | | | 80 | | | | 108 | | | | 232 | |
| | 220,439 | | | | 423,061 | | | | 185,736 | | | | 320,661 | | | | 112,663 | | | | 192,277 | | | | 27,770 | | | | 2,276 | |
| | 381,645 | | | | 368,409 | | | | 205,581 | | | | 274,775 | | | | 123,736 | | | | 232,763 | | | | 51,523 | | | | 1,693 | |
| | 361,505 | | | | 612,811 | | | | 228,794 | | | | 401,009 | | | | 140,839 | | | | 242,059 | | | | 24,960 | | | | 3,189 | |
| | | | | | | | | | | | | | | | | | | | | | | | | | | | | | |
| | 407,778 | | | | 583,508 | | | | 348,477 | | | | 534,062 | | | | 191,857 | | | | 156,126 | | | | 23,761 | | | | 786 | |
| | N/A | | | | 69 | 1 | | | N/A | | | | 129 | 1 | | | N/A | | | | N/A | | | | N/A | | | | N/A | |
| | N/A | | | | 12,050 | | | | N/A | | | | 11,945 | | | | N/A | | | | 2,624 | | | | N/A | | | | 554 | |
| | 1,577 | | | | 2,285 | | | | 316 | | | | 818 | | | | 87 | | | | 96 | | | | 129 | | | | 277 | |
| | 275,343 | | | | 527,896 | | | | 231,951 | | | | 399,769 | | | | 140,829 | | | | 239,851 | | | | 34,713 | | | | 2,845 | |
| | 694,764 | | | | 1,177,462 | | | | 439,723 | | | | 770,447 | | | | 270,843 | | | | 465,136 | | | | 48,001 | | | | 6,134 | |
| | | | | | | | | | | | | | | | | | | | | | | | | | | | | | |
| | N/A | | | | 206 | 1 | | | N/A | | | | 388 | 1 | | | N/A | | | | N/A | | | | N/A | | | | N/A | |
| | N/A | | | | 36,151 | | | | N/A | | | | 35,835 | | | | N/A | | | | 7,872 | | | | N/A | | | | 1,663 | |
| | 1,577 | | | | 2,285 | | | | 316 | | | | 818 | | | | 87 | | | | 96 | | | | 129 | | | | 277 | |
| | 76,242 | | | | 94,317 | | | | 46,520 | | | | 70,939 | | | | 29,460 | | | | 48,113 | | | | 10,518 | | | | 2,365 | |
| | 34,847 | | | | 38,679 | | | | 37,617 | | | | 37,390 | | | | 37,752 | | | | 37,686 | | | | 34,912 | | | | 32,552 | |
| | 78,679 | | | | 95,951 | | | | 103,419 | | | | 92,925 | | | | 100,302 | | | | 106,919 | | | | 88,290 | | | | 101,543 | |
| | 84,713 | | | | 106,241 | | | | 81,632 | | | | 93,393 | | | | 58,177 | | | | 75,340 | | | | 29,598 | | | | 11,486 | |
| | 23,440 | | | | 23,046 | | | | 23,050 | | | | 24,685 | | | | 25,638 | | | | 15,596 | | | | 16,217 | | | | 17,328 | |
| | 27,601 | | | | 47,819 | | | | 25,481 | | | | 37,779 | | | | 18,940 | | | | 24,353 | | | | 8,882 | | | | 10,706 | |
| | |
| | 6,993,051 | | | | 9,589,318 | | | | 4,717,501 | | | | 7,255,198 | | | | 2,889,239 | | | | 4,512,256 | | | | 889,890 | | | | 220,212 | |
| | (1,163,801 | ) | | | (1,211,251 | ) | | | (587,168 | ) | | | (763,470 | ) | | | (435,484 | ) | | | (602,330 | ) | | | (243,875 | ) | | | (179,601 | ) |
| | |
| | 5,829,250 | | | | 8,378,067 | | | | 4,130,333 | | | | 6,491,728 | | | | 2,453,755 | | | | 3,909,926 | | | | 646,015 | | | | 40,611 | |
| | |
| | 35,642,585 | | | | 41,788,964 | | | | 20,578,296 | | | | 29,675,772 | | | | 11,887,740 | | | | 20,768,333 | | | | 3,900,658 | | | | 135,221 | |
| | |
| | | | | | | |
| | | | | | | | | | | | | | | | | | | | | | | | | | | | | | |
| 155,982,862 | | | | 285,192,645 | | | | 159,628,599 | | | | 281,561,882 | | | | 114,510,017 | | | | 178,311,295 | | | | 30,594,432 | | | | 3,164,642 | |
| 8,889,925 | | | | 3,651,745 | | | | 19,222,082 | | | | 28,899,272 | | | | 20,363,337 | | | | 61,120,568 | | | | 13,165,216 | | | | (1,311,506 | ) |
| | |
| | 164,872,787 | | | | 288,844,390 | | | | 178,850,681 | | | | 310,461,154 | | | | 134,873,354 | | | | 239,431,863 | | | | 43,759,648 | | | | 1,853,136 | |
| | |
| $ | 200,515,372 | | | $ | 330,633,354 | | | $ | 199,428,977 | | | $ | 340,136,926 | | | $ | 146,761,094 | | | $ | 260,200,196 | | | $ | 47,660,306 | | | $ | 1,988,357 | |
| | |
| | | | | | | |
| $189,902 | | | | $165,229 | | | | $56,079 | | | | $50,140 | | | | $11,474 | | | | $14,045 | | | | $2,596 | | | | $98 | |
| $1,052,714 | | | | $1,639,742 | | | | $1,003,232 | | | | $1,681,702 | | | | $729,596 | | | | $1,320,571 | | | | $242,320 | | | | $6,209 | |
The accompanying notes are an integral part of these financial statements.
| | | | |
| 42 | | Wells Fargo Dow Jones Target Date Funds | | Statements of changes in net assets |
| | | | | | | | | | | | | | | | |
| | | Target Today Fund | |
| | | Year ended
February 28, 2017 | | | Year ended
February 29, 2016 | |
| | | | |
Operations | | | | | | | | | | | | | | | | |
Net investment income | | | | | | $ | 8,108,238 | | | | | | | $ | 8,827,099 | |
Net realized gains on investments | | | | | | | 19,448,165 | | | | | | | | 3,450,074 | |
Net change in unrealized gains (losses) on investments | | | | | | | (6,228,835 | ) | | | | | | | (23,144,376 | ) |
| | | | |
Net increase (decrease) in net assets resulting from operations | | | | | | | 21,327,568 | | | | | | | | (10,867,203 | ) |
| | | | |
| | | | |
Distributions to shareholders from | | | | | | | | | | | | | | | | |
Net investment income | | | | | | | | | | | | | | | | |
Class A | | | | | | | (583,927 | ) | | | | | | | (212,385 | ) |
Class C | | | | | | | (10,272 | ) | | | | | | | 0 | |
Class R | | | | | | | (250 | ) | | | | | | | (39 | ) |
Class R4 | | | | | | | (3,309,292 | ) | | | | | | | (1,986,228 | ) |
Class R6 | | | | | | | (1,204,070 | ) | | | | | | | (2,057,136 | ) |
Administrator Class | | | | | | | (546,519 | ) | | | | | | | (295,420 | ) |
Net realized gains | | | | | | | | | | | | | | | | |
Class A | | | | | | | (509,224 | ) | | | | | | | (1,208,132 | ) |
Class B | | | | | | | 0 | 1 | | | | | | | (60 | ) |
Class C | | | | | | | (24,645 | ) | | | | | | | (50,563 | ) |
Class R | | | | | | | (258 | ) | | | | | | | (482 | ) |
Class R4 | | | | | | | (2,228,868 | ) | | | | | | | (4,742,418 | ) |
Class R6 | | | | | | | (1,878,874 | ) | | | | | | | (4,034,298 | ) |
Administrator Class | | | | | | | (438,853 | ) | | | | | | | (1,109,624 | ) |
| | | | |
Total distributions to shareholders | | | | | | | (10,735,052 | ) | | | | | | | (15,696,785 | ) |
| | | | |
| | | | |
Capital share transactions | | | Shares | | | | | | | | Shares | | | | | |
Proceeds from shares sold | | | | | | | | | | | | | | | | |
Class A | | | 246,349 | | | | 2,631,608 | | | | 5,647,163 | | | | 60,339,126 | |
Class C | | | 28,357 | | | | 310,720 | | | | 10,570 | | | | 115,474 | |
Class R | | | 397 | | | | 4,180 | | | | 120 | | | | 1,272 | |
Class R4 | | | 3,300,035 | | | | 36,219,983 | | | | 3,730,527 | | | | 40,609,285 | |
Class R6 | | | 6,202,776 | | | | 68,036,987 | | | | 10,259,626 | | | | 111,458,455 | |
Administrator Class | | | 792,164 | | | | 8,623,265 | | | | 1,204,150 | | | | 13,090,822 | |
Investor Class | | | N/A | | | | N/A | | | | 414,797 | 2 | | | 4,533,435 | 2 |
| | | | |
| | | | | | | 115,826,743 | | | | | | | | 230,147,869 | |
| | | | |
Reinvestment of distributions | | | | | | | | | | | | | | | | |
Class A | | | 103,641 | | | | 1,083,760 | | | | 135,261 | | | | 1,409,363 | |
Class B | | | 0 | 1 | | | 0 | 1 | | | 5 | | | | 60 | |
Class C | | | 3,217 | | | | 34,356 | | | | 4,686 | | | | 49,810 | |
Class R | | | 49 | | | | 508 | | | | 50 | | | | 521 | |
Class R4 | | | 517,812 | | | | 5,538,160 | | | | 630,358 | | | | 6,728,633 | |
Class R6 | | | 282,767 | | | | 3,032,839 | | | | 563,932 | | | | 6,009,114 | |
Administrator Class | | | 92,160 | | | | 983,978 | | | | 131,713 | | | | 1,401,554 | |
| | | | |
| | | | | | | 10,673,601 | | | | | | | | 15,599,055 | |
| | | | |
Please see footnotes on page 43.
The accompanying notes are an integral part of these financial statements.
| | | | | | |
| Statements of changes in net assets | | Wells Fargo Dow Jones Target Date Funds | | | 43 | |
| | | | | | | | | | | | | | | | |
| | | Target Today Fund | |
| | | Year ended
February 28, 2017 | | | Year ended
February 29, 2016 | |
| | | | |
| | | Shares | | | | | | Shares | | | | |
| | | | |
Capital share transactions (continued) | | | | | | | | | | | | | | | | |
Payment for shares redeemed | | | | | | | | | | | | | | | | |
Class A | | | (1,450,631 | ) | | $ | (15,543,355 | ) | | | (818,764 | ) | | $ | (8,571,490 | ) |
Class B | | | (310 | )1 | | | (3,437 | )1 | | | (654 | ) | | | (7,312 | ) |
Class C | | | (29,507 | ) | | | (322,360 | ) | | | (68,466 | ) | | | (738,149 | ) |
Class R | | | (157 | ) | | | (1,691 | ) | | | (1 | ) | | | (10 | ) |
Class R4 | | | (6,307,526 | ) | | | (68,848,062 | ) | | | (9,414,225 | ) | | | (102,232,762 | ) |
Class R6 | | | (22,670,955 | ) | | | (246,443,613 | ) | | | (9,625,506 | ) | | | (104,577,784 | ) |
Administrator Class | | | (3,068,548 | ) | | | (33,333,515 | ) | | | (4,542,886 | ) | | | (49,322,402 | ) |
Investor Class | | | N/A | | | | N/A | | | | (6,369,254 | )2 | | | (69,335,370 | )2 |
| | | | |
| | | | | | | (364,496,033 | ) | | | | | | | (334,785,279 | ) |
| | | | |
Net decrease in net assets resulting from capital share transactions | | | | | | | (237,995,689 | ) | | | | | | | (89,038,355 | ) |
| | | | |
Total decrease in net assets | | | | | | | (227,403,173 | ) | | | | | | | (115,602,343 | ) |
| | | | |
| | | | |
Net assets | | | | | | | | | | | | | | | | |
Beginning of period | | | | | | | 646,832,960 | | | | | | | | 762,435,303 | |
| | | | |
End of period | | | | | | $ | 419,429,787 | | | | | | | $ | 646,832,960 | |
| | | | |
Overdistributed net investment income | | | | | | $ | (930,686 | ) | | | | | | $ | (954,532 | ) |
| | | | |
| 1 | For the period from March 1, 2016 to December 5, 2016. Effective at the close of business on December 5, 2016, Class B shares were converted to Class A shares and are no longer offered by the Fund. |
| 2 | For the period from March 1, 2015 to October 23, 2015. Effective at the close of business on October 23, 2015, Investor Class shares were converted to Class A shares and are no longer offered by the Fund. |
The accompanying notes are an integral part of these financial statements.
| | | | |
| 44 | | Wells Fargo Dow Jones Target Date Funds | | Statements of changes in net assets |
| | | | | | | | | | | | | | | | |
| | | Target 2010 Fund | |
| | | Year ended
February 28, 2017 | | | Year ended
February 29, 2016 | |
| | | | |
Operations | | | | | | | | | | | | | | | | |
Net investment income | | | | | | $ | 5,300,135 | | | | | | | $ | 7,103,709 | |
Net realized gains on investments | | | | | | | 17,262,849 | | | | | | | | 9,701,380 | |
Net change in unrealized gains (losses) on investments | | | | | | | (6,339,716 | ) | | | | | | | (26,828,269 | ) |
| | | | |
Net increase (decrease) in net assets resulting from operations | | | | | | | 16,223,268 | | | | | | | | (10,023,180 | ) |
| | | | |
| | | | |
Distributions to shareholders from | | | | | | | | | | | | | | | | |
Net investment income | | | | | | | | | | | | | | | | |
Class A | | | | | | | (482,645 | ) | | | | | | | (335,875 | ) |
Class B | | | | | | | (34 | )1 | | | | | | | (51 | ) |
Class C | | | | | | | (2,721 | ) | | | | | | | 0 | |
Class R | | | | | | | (297 | ) | | | | | | | (172 | ) |
Class R4 | | | | | | | (630,636 | ) | | | | | | | (788,009 | ) |
Class R6 | | | | | | | (1,832,870 | ) | | | | | | | (2,051,024 | ) |
Administrator Class | | | | | | | (678,380 | ) | | | | | | | (586,950 | ) |
Net realized gains | | | | | | | | | | | | | | | | |
Class A | | | | | | | (1,034,288 | ) | | | | | | | (3,286,691 | ) |
Class B | | | | | | | 0 | 1 | | | | | | | (1,389 | ) |
Class C | | | | | | | (29,911 | ) | | | | | | | (92,831 | ) |
Class R | | | | | | | (882 | ) | | | | | | | (2,344 | ) |
Class R4 | | | | | | | (927,722 | ) | | | | | | | (4,072,646 | ) |
Class R6 | | | | | | | (2,563,659 | ) | | | | | | | (9,055,541 | ) |
Administrator Class | | | | | | | (1,215,342 | ) | | | | | | | (4,393,823 | ) |
| | | | |
Total distributions to shareholders | | | | | | | (9,399,387 | ) | | | | | | | (24,667,346 | ) |
| | | | |
| | | | |
Capital share transactions | | | Shares | | | | | | | | Shares | | | | | |
Proceeds from shares sold | | | | | | | | | | | | | | | | |
Class A | | | 320,041 | | | | 4,005,083 | | | | 4,221,546 | | | | 54,786,333 | |
Class B | | | 0 | 1 | | | 0 | 1 | | | 2,193 | | | | 29,082 | |
Class C | | | 22,779 | | | | 286,839 | | | | 7,041 | | | | 90,916 | |
Class R | | | 9 | | | | 113 | | | | 16 | | | | 212 | |
Class R4 | | | 1,041,548 | | | | 13,249,443 | | | | 1,712,102 | | | | 22,327,468 | |
Class R6 | | | 4,547,953 | | | | 57,992,817 | | | | 8,059,088 | | | | 104,895,708 | |
Administrator Class | | | 722,092 | | | | 9,180,641 | | | | 1,374,739 | | | | 17,794,276 | |
Investor Class | | | N/A | | | | N/A | | | | 308,626 | 2 | | | 4,041,703 | 2 |
| | | | |
| | | | | | | 84,714,936 | | | | | | | | 203,965,698 | |
| | | | |
Reinvestment of distributions | | | | | | | | | | | | | | | | |
Class A | | | 120,746 | | | | 1,496,895 | | | | 291,606 | | | | 3,586,673 | |
Class B | | | 3 | 1 | | | 34 | 1 | | | 116 | | | | 1,440 | |
Class C | | | 2,527 | | | | 31,542 | | | | 7,012 | | | | 87,152 | |
Class R | | | 96 | | | | 1,179 | | | | 206 | | | | 2,516 | |
Class R4 | | | 124,200 | | | | 1,558,358 | | | | 390,609 | | | | 4,860,655 | |
Class R6 | | | 340,421 | | | | 4,277,373 | | | | 878,628 | | | | 10,935,710 | |
Administrator Class | | | 148,875 | | | | 1,866,250 | | | | 400,560 | | | | 4,980,773 | |
| | | | |
| | | | | | | 9,231,631 | | | | | | | | 24,454,919 | |
| | | | |
Please see footnotes on page 45.
The accompanying notes are an integral part of these financial statements.
| | | | | | |
| Statements of changes in net assets | | Wells Fargo Dow Jones Target Date Funds | | | 45 | |
| | | | | | | | | | | | | | | | |
| | | Target 2010 Fund | |
| | | Year ended
February 28, 2017 | | | Year ended
February 29, 2016 | |
| | | | |
| | | Shares | | | | | | Shares | | | | |
| | | | |
Capital share transactions (continued) | | | | | | | | | | | | | | | | |
Payment for shares redeemed | | | | | | | | | | | | | | | | |
Class A | | | (1,120,538 | ) | | $ | (14,076,865 | ) | | | (1,013,261 | ) | | $ | (12,776,658 | ) |
Class B | | | (2,486 | )1 | | | (31,397 | )1 | | | (682 | ) | | | (9,045 | ) |
Class C | | | (44,856 | ) | | | (570,911 | ) | | | (62,410 | ) | | | (820,797 | ) |
Class R | | | (48 | ) | | | (608 | ) | | | (1 | ) | | | (17 | ) |
Class R4 | | | (2,965,131 | ) | | | (37,697,012 | ) | | | (7,588,790 | ) | | | (97,975,580 | ) |
Class R6 | | | (14,486,651 | ) | | | (183,122,305 | ) | | | (6,669,142 | ) | | | (86,398,389 | ) |
Administrator Class | | | (4,298,183 | ) | | | (54,267,295 | ) | | | (7,050,419 | ) | | | (91,816,190 | ) |
Investor Class | | | N/A | | | | N/A | | | | (4,828,884 | )2 | | | (63,153,213 | )2 |
| | | | |
| | | | | | | (289,766,393 | ) | | | | | | | (352,949,889 | ) |
| | | | |
Net decrease in net assets resulting from capital share transactions | | | | | | | (195,819,826 | ) | | | | | | | (124,529,272 | ) |
| | | | |
Total decrease in net assets | | | | | | | (188,995,945 | ) | | | | | | | (159,219,798 | ) |
| | | | |
| | | | |
Net assets | | | | | | | | | | | | | | | | |
Beginning of period | | | | | | | 431,970,096 | | | | | | | | 591,189,894 | |
| | | | |
End of period | | | | | | $ | 242,974,151 | | | | | | | $ | 431,970,096 | |
| | | | |
Overdistributed net investment income | | | | | | $ | (694,475 | ) | | | | | | $ | (974,071 | ) |
| | | | |
| 1 | For the period from March 1, 2016 to December 5, 2016. Effective at the close of business on December 5, 2016, Class B shares were converted to Class A shares and are no longer offered by the Fund. |
| 2 | For the period from March 1, 2015 to October 23, 2015. Effective at the close of business on October 23, 2015, Investor Class shares were converted to Class A shares and are no longer offered by the Fund. |
The accompanying notes are an integral part of these financial statements.
| | | | |
| 46 | | Wells Fargo Dow Jones Target Date Funds | | Statements of changes in net assets |
| | | | | | | | | | | | | | | | |
| | | Target 2015 Fund | |
| | | Year ended
February 28, 2017 | | | Year ended
February 29, 2016 | |
| | | | |
Operations | | | | | | | | | | | | | | | | |
Net investment income | | | | | | $ | 10,627,268 | | | | | | | $ | 14,276,725 | |
Net realized gains on investments | | | | | | | 31,119,358 | | | | | | | | 4,048,645 | |
Net change in unrealized gains (losses) on investments | | | | | | | (8,924,342 | ) | | | | | | | (37,431,296 | ) |
| | | | |
Net increase (decrease) in net assets resulting from operations | | | | | | | 32,822,284 | | | | | | | | (19,105,926 | ) |
| | | | |
| | | | |
Distributions to shareholders from | | | | | | | | | | | | | | | | |
Net investment income | | | | | | | | | | | | | | | | |
Class A | | | | | | | (664,158 | ) | | | | | | | (20,228 | ) |
Class R | | | | | | | (317 | ) | | | | | | | (329 | ) |
Class R4 | | | | | | | (1,501,134 | ) | | | | | | | (1,703,828 | ) |
Class R6 | | | | | | | (4,179,131 | ) | | | | | | | (4,784,541 | ) |
Administrator Class | | | | | | | (1,183,112 | ) | | | | | | | (1,475,155 | ) |
Investor Class | | | | | | | N/A | | | | | | | | (758,997 | )1 |
Net realized gains | | | | | | | | | | | | | | | | |
Class A | | | | | | | (979,508 | ) | | | | | | | (1,573,386 | ) |
Class R | | | | | | | (591 | ) | | | | | | | (859 | ) |
Class R4 | | | | | | | (1,921,730 | ) | | | | | | | (2,323,259 | ) |
Class R6 | | | | | | | (5,490,488 | ) | | | | | | | (6,760,642 | ) |
Administrator Class | | | | | | | (1,670,852 | ) | | | | | | | (2,256,193 | ) |
| | | | |
Total distributions to shareholders | | | | | | | (17,591,021 | ) | | | | | | | (21,657,417 | ) |
| | | | |
| | | | |
Capital share transactions | | | Shares | | | | | | | | Shares | | | | | |
Proceeds from shares sold | | | | | | | | | | | | | | | | |
Class A | | | 472,706 | | | | 4,872,068 | | | | 9,344,836 | | | | 94,779,977 | |
Class R | | | 66 | | | | 681 | | | | 67 | | | | 686 | |
Class R4 | | | 3,281,066 | | | | 33,966,649 | | | | 2,312,239 | | | | 23,537,215 | |
Class R6 | | | 8,730,425 | | | | 90,017,825 | | | | 12,758,792 | | | | 129,474,281 | |
Administrator Class | | | 1,191,525 | | | | 12,386,745 | | | | 1,888,382 | | | | 19,442,817 | |
Investor Class | | | N/A | | | | N/A | | | | 908,576 | 1 | | | 9,440,796 | 1 |
| | | | |
| | | | | | | 141,243,968 | | | | | | | | 276,675,772 | |
| | | | |
Reinvestment of distributions | | | | | | | | | | | | | | | | |
Class A | | | 162,003 | | | | 1,635,999 | | | | 160,134 | | | | 1,584,498 | |
Class R | | | 89 | | | | 908 | | | | 117 | | | | 1,188 | |
Class R4 | | | 337,377 | | | | 3,422,864 | | | | 401,199 | | | | 4,027,087 | |
Class R6 | | | 921,605 | | | | 9,365,745 | | | | 1,109,939 | | | | 11,115,010 | |
Administrator Class | | | 277,370 | | | | 2,844,581 | | | | 366,890 | | | | 3,726,803 | |
Investor Class | | | N/A | | | | N/A | | | | 73,227 | 1 | | | 758,463 | 1 |
| | | | |
| | | | | | | 17,270,097 | | | | | | | | 21,213,049 | |
| | | | |
Payment for shares redeemed | | | | | | | | | | | | | | | | |
Class A | | | (2,799,861 | ) | | | (28,769,893 | ) | | | (2,112,945 | ) | | | (20,902,388 | ) |
Class R | | | (792 | ) | | | (8,129 | ) | | | (708 | ) | | | (6,979 | ) |
Class R4 | | | (6,077,465 | ) | | | (62,298,002 | ) | | | (7,113,750 | ) | | | (72,406,836 | ) |
Class R6 | | | (34,369,025 | ) | | | (348,220,043 | ) | | | (17,178,318 | ) | | | (174,145,663 | ) |
Administrator Class | | | (11,547,122 | ) | | | (118,243,491 | ) | | | (7,909,252 | ) | | | (81,427,388 | ) |
Investor Class | | | N/A | | | | N/A | | | | (11,199,953 | )1 | | | (115,605,930 | )1 |
| | | | |
| | | | | | | (557,539,558 | ) | | | | | | | (464,495,184 | ) |
| | | | |
Net decrease in net assets resulting from capital share transactions | | | | | | | (399,025,493 | ) | | | | | | | (166,606,363 | ) |
| | | | |
Total decrease in net assets | | | | | | | (383,794,230 | ) | | | | | | | (207,369,706 | ) |
| | | | |
| | | | |
Net assets | | | | | | | | | | | | | | | | |
Beginning of period | | | | | | | 691,721,062 | | | | | | | | 899,090,768 | |
| | | | |
End of period | | | | | | $ | 307,926,832 | | | | | | | $ | 691,721,062 | |
| | | | |
Overdistributed net investment income | | | | | | $ | (1,147,289 | ) | | | | | | $ | (1,607,902 | ) |
| | | | |
| 1 | For the period from March 1, 2015 to October 23, 2015. Effective at the close of business on October 23, 2015, Investor Class shares were converted to Class A shares and are no longer offered by the Fund. |
The accompanying notes are an integral part of these financial statements.
| | | | | | |
| Statements of changes in net assets | | Wells Fargo Dow Jones Target Date Funds | | | 47 | |
| | | | | | | | | | | | | | | | |
| | | Target 2020 Fund | |
| | | Year ended
February 28, 2017 | | | Year ended
February 29, 2016 | |
| | | | |
Operations | | | | | | | | | | | | | | | | |
Net investment income | | | | | | $ | 39,779,558 | | | | | | | $ | 47,559,500 | |
Net realized gains on investments | | | | | | | 156,680,560 | | | | | | | | 25,796,388 | |
Net change in unrealized gains (losses) on investments | | | | | | | (34,503,411 | ) | | | | | | | (170,875,058 | ) |
| | | | |
Net increase (decrease) in net assets resulting from operations | | | | | | | 161,956,707 | | | | | | | | (97,519,170 | ) |
| | | | |
| | | | |
Distributions to shareholders from | | | | | | | | | | | | | | | | |
Net investment income | | | | | | | | | | | | | | | | |
Class A | | | | | | | (2,619,472 | ) | | | | | | | (1,204,855 | ) |
Class B | | | | | | | (87 | )1 | | | | | | | (108 | ) |
Class C | | | | | | | (38,178 | ) | | | | | | | (6,481 | ) |
Class R | | | | | | | (4,251 | ) | | | | | | | (2,560 | ) |
Class R4 | | | | | | | (5,634,274 | ) | | | | | | | (6,107,482 | ) |
Class R6 | | | | | | | (16,606,485 | ) | | | | | | | (13,668,753 | ) |
Administrator Class | | | | | | | (6,009,682 | ) | | | | | | | (5,002,528 | ) |
Investor Class | | | | | | | N/A | | | | | | | | (494,020 | )2 |
Net realized gains | | | | | | | | | | | | | | | | |
Class A | | | | | | | (3,151,261 | ) | | | | | | | (6,049,652 | ) |
Class B | | | | | | | 0 | 1 | | | | | | | (1,139 | ) |
Class C | | | | | | | (99,187 | ) | | | | | | | (138,075 | ) |
Class R | | | | | | | (6,324 | ) | | | | | | | (10,129 | ) |
Class R4 | | | | | | | (5,485,709 | ) | | | | | | | (12,325,852 | ) |
Class R6 | | | | | | | (17,730,052 | ) | | | | | | | (27,705,228 | ) |
Administrator Class | | | | | | | (6,409,366 | ) | | | | | | | (13,559,585 | ) |
| | | | |
Total distributions to shareholders | | | | | | | (63,794,328 | ) | | | | | | | (86,276,447 | ) |
| | | | |
| | | | |
Capital share transactions | | | Shares | | | | | | | | Shares | | | | | |
Proceeds from shares sold | | | | | | | | | | | | | | | | |
Class A | | | 1,077,052 | | | | 15,995,960 | | | | 13,749,128 | | | | 204,800,204 | |
Class C | | | 145,106 | | | | 2,155,858 | | | | 186,108 | | | | 2,690,829 | |
Class R | | | 3,506 | | | | 52,543 | | | | 1,560 | | | | 22,804 | |
Class R4 | | | 7,912,329 | | | | 120,262,004 | | | | 8,587,505 | | | | 129,528,210 | |
Class R6 | | | 29,579,390 | | | | 448,662,128 | | | | 25,570,337 | | | | 385,301,666 | |
Administrator Class | | | 4,539,800 | | | | 68,331,350 | | | | 6,631,029 | | | | 99,603,642 | |
Investor Class | | | N/A | | | | N/A | | | | 1,084,475 | 2 | | | 16,500,298 | 2 |
| | | | |
| | | | | | | 655,459,843 | | | | | | | | 838,447,653 | |
| | | | |
Reinvestment of distributions | | | | | | | | | | | | | | | | |
Class A | | | 385,483 | | | | 5,674,858 | | | | 498,070 | | | | 7,153,660 | |
Class B | | | 6 | 1 | | | 87 | 1 | | | 87 | | | | 1,247 | |
Class C | | | 8,796 | | | | 128,190 | | | | 9,259 | | | | 132,096 | |
Class R | | | 722 | | | | 10,575 | | | | 881 | | | | 12,689 | |
Class R4 | | | 741,202 | | | | 11,119,983 | | | | 1,252,971 | | | | 18,433,334 | |
Class R6 | | | 2,223,824 | | | | 33,407,112 | | | | 2,737,761 | | | | 40,176,324 | |
Administrator Class | | | 824,099 | | | | 12,315,923 | | | | 1,267,785 | | | | 18,559,644 | |
Investor Class | | | N/A | | | | N/A | | | | 32,029 | 2 | | | 494,020 | 2 |
| | | | |
| | | | | | | 62,656,728 | | | | | | | | 84,963,014 | |
| | | | |
Please see footnotes on page 48.
The accompanying notes are an integral part of these financial statements.
| | | | |
| 48 | | Wells Fargo Dow Jones Target Date Funds | | Statements of changes in net assets |
| | | | | | | | | | | | | | | | |
| | | Target 2020 Fund | |
| | | Year ended
February 28, 2017 | | | Year ended
February 29, 2016 | |
| | | | |
| | | Shares | | | | | | Shares | | | | |
| | | | |
Capital share transactions (continued) | | | | | | | | | | | | | | | | |
Payment for shares redeemed | | | | | | | | | | | | | | | | |
Class A | | | (3,011,707 | ) | | $ | (44,676,552 | ) | | | (2,245,750 | ) | | $ | (32,588,487 | ) |
Class B | | | (2,821 | )1 | | | (41,676 | )1 | | | (4,357 | ) | | | (63,797 | ) |
Class C | | | (149,522 | ) | | | (2,211,488 | ) | | | (107,814 | ) | | | (1,567,416 | ) |
Class R | | | (11,485 | ) | | | (168,905 | ) | | | (22,506 | ) | | | (336,340 | ) |
Class R4 | | | (13,315,739 | ) | | | (201,266,768 | ) | | | (31,392,856 | ) | | | (469,564,323 | ) |
Class R6 | | | (66,534,662 | ) | | | (998,627,589 | ) | | | (22,890,031 | ) | | | (342,653,004 | ) |
Administrator Class | | | (28,809,682 | ) | | | (431,422,845 | ) | | | (14,750,039 | ) | | | (220,778,164 | ) |
Investor Class | | | N/A | | | | N/A | | | | (14,268,341 | )2 | | | (215,721,640 | )2 |
| | | | |
| | | | | | | (1,678,415,823 | ) | | | | | | | (1,283,273,171 | ) |
| | | | |
Net decrease in net assets resulting from capital share transactions | | | | | | | (960,299,252 | ) | | | | | | | (359,862,504 | ) |
| | | | |
Total decrease in net assets | | | | | | | (862,136,873 | ) | | | | | | | (543,658,121 | ) |
| | | | |
| | | | |
Net assets | | | | | | | | | | | | | | | | |
Beginning of period | | | | | | | 2,288,718,553 | | | | | | | | 2,832,376,674 | |
| | | | |
End of period | | | | | | $ | 1,426,581,680 | | | | | | | $ | 2,288,718,553 | |
| | | | |
Overdistributed net investment income | | | | | | $ | (5,252,741 | ) | | | | | | $ | (3,754,490 | ) |
| | | | |
| 1 | For the period from March 1, 2016 to December 5, 2016. Effective at the close of business on December 5, 2016, Class B shares were converted to Class A shares and are no longer offered by the Fund. |
| 2 | For the period from March 1, 2015 to October 23, 2015. Effective at the close of business on October 23, 2015, Investor Class shares were converted to Class A shares and are no longer offered by the Fund. |
The accompanying notes are an integral part of these financial statements.
| | | | | | |
| Statements of changes in net assets | | Wells Fargo Dow Jones Target Date Funds | | | 49 | |
| | | | | | | | | | | | | | | | |
| | | Target 2025 Fund | |
| | | Year ended
February 28, 2017 | | | Year ended
February 29, 2016 | |
| | | | |
Operations | | | | | | | | | | | | | | | | |
Net investment income | | | | | | $ | 35,642,585 | | | | | | | $ | 42,396,222 | |
Net realized gains on investments | | | | | | | 155,982,862 | | | | | | | | 31,965,590 | |
Net change in unrealized gains (losses) on investments | | | | | | | 8,889,925 | | | | | | | | (199,079,376 | ) |
| | | | |
Net increase (decrease) in net assets resulting from operations | | | | | | | 200,515,372 | | | | | | | | (124,717,564 | ) |
| | | | |
| | | | |
Distributions to shareholders from | | | | | | | | | | | | | | | | |
Net investment income | | | | | | | | | | | | | | | | |
Class A | | | | | | | (2,306,156 | ) | | | | | | | (42,829 | ) |
Class R | | | | | | | (7,276 | ) | | | | | | | (5,968 | ) |
Class R4 | | | | | | | (4,717,186 | ) | | | | | | | (3,638,272 | ) |
Class R6 | | | | | | | (18,967,324 | ) | | | | | | | (18,652,274 | ) |
Administrator Class | | | | | | | (4,708,394 | ) | | | | | | | (3,011,839 | ) |
Investor Class | | | | | | | N/A | | | | | | | | (1,645,710 | )1 |
Net realized gains | | | | | | | | | | | | | | | | |
Class A | | | | | | | (2,361,873 | ) | | | | | | | (5,365,512 | ) |
Class R | | | | | | | (9,422 | ) | | | | | | | (22,403 | ) |
Class R4 | | | | | | | (4,472,260 | ) | | | | | | | (7,078,806 | ) |
Class R6 | | | | | | | (24,192,306 | ) | | | | | | | (35,607,376 | ) |
Administrator Class | | | | | | | (4,706,783 | ) | | | | | | | (7,606,102 | ) |
| | | | |
Total distributions to shareholders | | | | | | | (66,448,980 | ) | | | | | | | (82,677,091 | ) |
| | | | |
| | | | |
Capital share transactions | | | Shares | | | | | | | | Shares | | | | | |
Proceeds from shares sold | | | | | | | | | | | | | | | | |
Class A | | | 1,513,892 | | | | 15,681,305 | | | | 22,964,538 | | | | 237,832,127 | |
Class R | | | 2,822 | | | | 29,361 | | | | 7,103 | | | | 73,345 | |
Class R4 | | | 8,631,979 | | | | 90,459,627 | | | | 7,138,606 | | | | 74,121,001 | |
Class R6 | | | 27,490,150 | | | | 286,244,401 | | | | 32,385,111 | | | | 335,503,479 | |
Administrator Class | | | 4,209,931 | | | | 43,679,906 | | | | 5,348,130 | | | | 55,738,366 | |
Investor Class | | | N/A | | | | N/A | | | | 3,079,689 | 1 | | | 32,431,424 | 1 |
| | | | |
| | | | | | | 436,094,600 | | | | | | | | 735,699,742 | |
| | | | |
Reinvestment of distributions | | | | | | | | | | | | | | | | |
Class A | | | 446,066 | | | | 4,593,108 | | | | 537,272 | | | | 5,363,185 | |
Class R | | | 1,620 | | | | 16,698 | | | | 2,814 | | | | 28,371 | |
Class R4 | | | 889,379 | | | | 9,189,446 | | | | 1,057,076 | | | | 10,717,065 | |
Class R6 | | | 4,035,204 | | | | 41,802,977 | | | | 5,206,467 | | | | 52,679,324 | |
Administrator Class | | | 909,253 | | | | 9,408,063 | | | | 1,041,420 | | | | 10,562,155 | |
Investor Class | | | N/A | | | | N/A | | | | 157,908 | 1 | | | 1,643,604 | 1 |
| | | | |
| | | | | | | 65,010,292 | | | | | | | | 80,993,704 | |
| | | | |
Payment for shares redeemed | | | | | | | | | | | | | | | | |
Class A | | | (6,507,824 | ) | | | (67,704,631 | ) | | | (5,857,457 | ) | | | (57,909,133 | ) |
Class R | | | (31,107 | ) | | | (319,792 | ) | | | (21,481 | ) | | | (219,125 | ) |
Class R4 | | | (11,942,981 | ) | | | (124,035,573 | ) | | | (15,075,663 | ) | | | (156,694,774 | ) |
Class R6 | | | (140,764,802 | ) | | | (1,457,629,379 | ) | | | (31,284,459 | ) | | | (321,990,675 | ) |
Administrator Class | | | (29,281,475 | ) | | | (303,427,237 | ) | | | (8,684,086 | ) | | | (89,814,734 | ) |
Investor Class | | | N/A | | | | N/A | | | | (26,018,686 | )1 | | | (271,321,720 | )1 |
| | | | |
| | | | | | | (1,953,116,612 | ) | | | | | | | (897,950,161 | ) |
| | | | |
Net decrease in net assets resulting from capital share transactions | | | | | | | (1,452,011,720 | ) | | | | | | | (81,256,715 | ) |
| | | | |
Total decrease in net assets | | | | | | | (1,317,945,328 | ) | | | | | | | (288,651,370 | ) |
| | | | |
| | | | |
Net assets | | | | | | | | | | | | | | | | |
Beginning of period | | | | | | | 2,171,343,339 | | | | | | | | 2,459,994,709 | |
| | | | |
End of period | | | | | | $ | 853,398,011 | | | | | | | $ | 2,171,343,339 | |
| | | | |
Overdistributed net investment income | | | | | | $ | (3,499,335 | ) | | | | | | $ | (3,353,031 | ) |
| | | | |
| 1 | For the period from March 1, 2015 to October 23, 2015. Effective at the close of business on October 23, 2015, Investor Class shares were converted to Class A shares and are no longer offered by the Fund. |
The accompanying notes are an integral part of these financial statements.
| | | | |
| 50 | | Wells Fargo Dow Jones Target Date Funds | | Statements of changes in net assets |
| | | | | | | | | | | | | | | | |
| | | Target 2030 Fund | |
| | | Year ended
February 28, 2017 | | | Year ended
February 29, 2016 | |
| | | | |
Operations | | | | | | | | | | | | | | | | |
Net investment income | | | | | | $ | 41,788,964 | | | | | | | $ | 49,126,829 | |
Net realized gains on investments | | | | | | | 285,192,645 | | | | | | | | 47,166,634 | |
Net change in unrealized gains (losses) on investments | | | | | | | 3,651,745 | | | | | | | | (304,156,369 | ) |
| | | | |
Net increase (decrease) in net assets resulting from operations | | | | | | | 330,633,354 | | | | | | | | (207,862,906 | ) |
| | | | |
| | | | |
Distributions to shareholders from | | | | | | | | | | | | | | | | |
Net investment income | | | | | | | | | | | | | | | | |
Class A | | | | | | | (4,250,699 | ) | | | | | | | (672,323 | ) |
Class B | | | | | | | 0 | 1 | | | | | | | (317 | ) |
Class C | | | | | | | (63,295 | ) | | | | | | | (14,221 | ) |
Class R | | | | | | | (14,867 | ) | | | | | | | (5,538 | ) |
Class R4 | | | | | | | (10,858,017 | ) | | | | | | | (9,749,314 | ) |
Class R6 | | | | | | | (14,022,915 | ) | | | | | | | (17,248,094 | ) |
Administrator Class | | | | | | | (8,992,896 | ) | | | | | | | (5,868,441 | ) |
Investor Class | | | | | | | N/A | | | | | | | | (1,506,020 | )2 |
Net realized gains | | | | | | | | | | | | | | | | |
Class A | | | | | | | (3,932,043 | ) | | | | | | | (6,570,826 | ) |
Class B | | | | | | | 0 | 1 | | | | | | | (1,944 | ) |
Class C | | | | | | | (87,929 | ) | | | | | | | (130,780 | ) |
Class R | | | | | | | (15,488 | ) | | | | | | | (23,231 | ) |
Class R4 | | | | | | | (8,913,930 | ) | | | | | | | (17,160,046 | ) |
Class R6 | | | | | | | (23,598,415 | ) | | | | | | | (33,810,493 | ) |
Administrator Class | | | | | | | (7,999,829 | ) | | | | | | | (14,132,103 | ) |
| | | | |
Total distributions to shareholders | | | | | | | (82,750,323 | ) | | | | | | | (106,893,691 | ) |
| | | | |
| | | | |
Capital share transactions | | | Shares | | | | | | | | Shares | | | | | |
Proceeds from shares sold | | | | | | | | | | | | | | | | |
Class A | | | 1,063,697 | | | | 17,423,388 | | | | 13,314,397 | | | | 218,134,426 | |
Class B | | | 1,321 | 1 | | | 21,894 | 1 | | | 2,962 | | | | 47,267 | |
Class C | | | 16,824 | | | | 268,578 | | | | 61,971 | | | | 996,816 | |
Class R | | | 2,851 | | | | 46,868 | | | | 24,510 | | | | 411,423 | |
Class R4 | | | 9,056,613 | | | | 151,196,897 | | | | 11,129,367 | | | | 184,411,020 | |
Class R6 | | | 22,368,225 | | | | 371,281,603 | | | | 30,536,859 | | | | 503,514,864 | |
Administrator Class | | | 5,648,833 | | | | 93,336,961 | | | | 7,079,870 | | | | 117,060,125 | |
Investor Class | | | N/A | | | | N/A | | | | 1,082,861 | 2 | | | 18,302,900 | 2 |
| | | | |
| | | | | | | 633,576,189 | | | | | | | | 1,042,878,841 | |
| | | | |
Reinvestment of distributions | | | | | | | | | | | | | | | | |
Class A | | | 493,003 | | | | 8,029,944 | | | | 451,373 | | | | 7,108,240 | |
Class B | | | 0 | 1 | | | 0 | 1 | | | 141 | | | | 2,195 | |
Class C | | | 8,931 | | | | 141,623 | | | | 8,955 | | | | 137,782 | |
Class R | | | 1,868 | | | | 30,355 | | | | 1,822 | | | | 28,769 | |
Class R4 | | | 1,196,727 | | | | 19,771,947 | | | | 1,666,294 | | | | 26,908,961 | |
Class R6 | | | 2,210,976 | | | | 36,707,115 | | | | 3,085,435 | | | | 49,653,407 | |
Administrator Class | | | 1,029,012 | | | | 16,991,572 | | | | 1,242,049 | | | | 19,998,935 | |
Investor Class | | | N/A | | | | N/A | | | | 90,457 | 2 | | | 1,500,603 | 2 |
| | | | |
| | | | | | | 81,672,556 | | | | | | | | 105,338,892 | |
| | | | |
Please see footnotes on page 51.
The accompanying notes are an integral part of these financial statements.
| | | | | | |
| Statements of changes in net assets | | Wells Fargo Dow Jones Target Date Funds | | | 51 | |
| | | | | | | | | | | | | | | | |
| | | Target 2030 Fund | |
| | | Year ended
February 28, 2017 | | | Year ended
February 29, 2016 | |
| | | | |
| | | Shares | | | | | | Shares | | | | |
| | | | |
Capital share transactions (continued) | | | | | | | | | | | | | | | | |
Payment for shares redeemed | | | | | | | | | | | | | | | | |
Class A | | | (2,806,490 | ) | | $ | (45,994,982 | ) | | | (2,322,835 | ) | | $ | (36,890,791 | ) |
Class B | | | (6,730 | )1 | | | (107,466 | )1 | | | (4,678 | ) | | | (75,655 | ) |
Class C | | | (55,899 | ) | | | (883,151 | ) | | | (58,470 | ) | | | (938,684 | ) |
Class R | | | (6,765 | ) | | | (111,328 | ) | | | (5,557 | ) | | | (93,587 | ) |
Class R4 | | | (13,713,378 | ) | | | (228,391,107 | ) | | | (31,558,785 | ) | | | (514,470,177 | ) |
Class R6 | | | (71,624,029 | ) | | | (1,201,710,967 | ) | | | (19,005,059 | ) | | | (311,167,043 | ) |
Administrator Class | | | (23,620,555 | ) | | | (392,144,183 | ) | | | (13,317,134 | ) | | | (219,101,625 | ) |
Investor Class | | | N/A | | | | N/A | | | | (13,797,898 | )2 | | | (229,181,050 | )2 |
| | | | |
| | | | | | | (1,869,343,184 | ) | | | | | | | (1,311,918,612 | ) |
| | | | |
Net decrease in net assets resulting from capital share transactions | | | | | | | (1,154,094,439 | ) | | | | | | | (163,700,879 | ) |
| | | | |
Total decrease in net assets | | | | | | | (906,211,408 | ) | | | | | | | (478,457,476 | ) |
| | | | |
| | | | |
Net assets | | | | | | | | | | | | | | | | |
Beginning of period | | | | | | | 2,530,264,501 | | | | | | | | 3,008,721,977 | |
| | | | |
End of period | | | | | | $ | 1,624,053,093 | | | | | | | $ | 2,530,264,501 | |
| | | | |
Overdistributed net investment income | | | | | | $ | (2,736,262 | ) | | | | | | $ | (2,742,787 | ) |
| | | | |
| 1 | For the period from March 1, 2016 to December 5, 2016. Effective at the close of business on December 5, 2016, Class B shares were converted to Class A shares and are no longer offered by the Fund. |
| 2 | For the period from March 1, 2015 to October 23, 2015. Effective at the close of business on October 23, 2015, Investor Class shares were converted to Class A shares and are no longer offered by the Fund. |
The accompanying notes are an integral part of these financial statements.
| | | | |
| 52 | | Wells Fargo Dow Jones Target Date Funds | | Statements of changes in net assets |
| | | | | | | | | | | | | | | | |
| | | Target 2035 Fund | |
| | | Year ended
February 28, 2017 | | | Year ended
February 29, 2016 | |
| | | | |
Operations | | | | | | | | | | | | | | | | |
Net investment income | | | | | | $ | 20,578,296 | | | | | | | $ | 23,055,848 | |
Net realized gains on investments | | | | | | | 159,628,599 | | | | | | | | 26,916,539 | |
Net change in unrealized gains (losses) on investments | | | | | | | 19,222,082 | | | | | | | | (179,695,293 | ) |
| | | | |
Net increase (decrease) in net assets resulting from operations | | | | | | | 199,428,977 | | | | | | | | (129,722,906 | ) |
| | | | |
| | | | |
Distributions to shareholders from | | | | | | | | | | | | | | | | |
Net investment income | | | | | | | | | | | | | | | | |
Class A | | | | | | | (1,962,259 | ) | | | | | | | (301,136 | ) |
Class R | | | | | | | (1,558 | ) | | | | | | | (372 | ) |
Class R4 | | | | | | | (4,088,239 | ) | | | | | | | (3,545,457 | ) |
Class R6 | | | | | | | (11,397,239 | ) | | | | | | | (10,573,204 | ) |
Administrator Class | | | | | | | (2,957,409 | ) | | | | | | | (2,304,817 | ) |
Investor Class | | | | | | | N/A | | | | | | | | (1,435,192 | )1 |
Net realized gains | | | | | | | | | | | | | | | | |
Class A | | | | | | | (2,126,418 | ) | | | | | | | (4,979,880 | ) |
Class R | | | | | | | (2,161 | ) | | | | | | | (1,055 | ) |
Class R4 | | | | | | | (3,964,240 | ) | | | | | | | (6,509,836 | ) |
Class R6 | | | | | | | (13,329,527 | ) | | | | | | | (19,919,240 | ) |
Administrator Class | | | | | | | (3,129,387 | ) | | | | | | | (5,313,366 | ) |
| | | | |
Total distributions to shareholders | | | | | | | (42,958,437 | ) | | | | | | | (54,883,555 | ) |
| | | | |
| | | | |
Capital share transactions | | | Shares | | | | | | | | Shares | | | | | |
Proceeds from shares sold | | | | | | | | | | | | | | | | |
Class A | | | 1,253,704 | | | | 13,492,027 | | | | 18,552,591 | | | | 201,310,133 | |
Class R | | | 9,064 | | | | 98,311 | | | | 4,089 | | | | 42,241 | |
Class R4 | | | 6,809,847 | | | | 74,141,264 | | | | 6,285,864 | | | | 68,420,704 | |
Class R6 | | | 19,872,642 | | | | 214,299,770 | | | | 27,717,560 | | | | 300,793,731 | |
Administrator Class | | | 3,078,500 | | | | 33,060,548 | | | | 4,092,376 | | | | 44,621,351 | |
Investor Class | | | N/A | | | | N/A | | | | 2,114,487 | 1 | | | 23,609,674 | 1 |
| | | | |
| | | | | | | 335,091,920 | | | | | | | | 638,797,834 | |
| | | | |
Reinvestment of distributions | | | | | | | | | | | | | | | | |
Class A | | | 374,031 | | | | 4,045,225 | | | | 505,796 | | | | 5,237,691 | |
Class R | | | 341 | | | | 3,719 | | | | 136 | | | | 1,427 | |
Class R4 | | | 744,052 | | | | 8,052,479 | | | | 954,353 | | | | 10,055,293 | |
Class R6 | | | 2,212,469 | | | | 23,935,961 | | | | 2,798,657 | | | | 29,409,827 | |
Administrator Class | | | 560,180 | | | | 6,086,796 | | | | 722,417 | | | | 7,618,183 | |
Investor Class | | | N/A | | | | N/A | | | | 129,844 | 1 | | | 1,431,195 | 1 |
| | | | |
| | | | | | | 42,124,180 | | | | | | | | 53,753,616 | |
| | | | |
Payment for shares redeemed | | | | | | | | | | | | | | | | |
Class A | | | (4,754,278 | ) | | | (51,553,434 | ) | | | (4,767,137 | ) | | | (48,289,542 | ) |
Class R | | | (1,649 | ) | | | (18,193 | ) | | | (47 | ) | | | (487 | ) |
Class R4 | | | (9,351,383 | ) | | | (100,761,245 | ) | | | (13,188,251 | ) | | | (143,959,697 | ) |
Class R6 | | | (66,063,881 | ) | | | (722,366,426 | ) | | | (17,913,876 | ) | | | (192,666,848 | ) |
Administrator Class | | | (17,507,773 | ) | | | (192,188,450 | ) | | | (6,437,073 | ) | | | (69,772,390 | ) |
Investor Class | | | N/A | | | | N/A | | | | (20,176,529 | )1 | | | (221,695,444 | )1 |
| | | | |
| | | | | | | (1,066,887,748 | ) | | | | | | | (676,384,408 | ) |
| | | | |
Net increase (decrease) in net assets resulting from capital share transactions | | | | | | | (689,671,648 | ) | | | | | | | 16,167,042 | |
| | | | |
Total decrease in net assets | | | | | | | (533,201,108 | ) | | | | | | | (168,439,419 | ) |
| | | | |
| | | | |
Net assets | | | | | | | | | | | | | | | | |
Beginning of period | | | | | | | 1,269,183,725 | | | | | | | | 1,437,623,144 | |
| | | | |
End of period | | | | | | $ | 735,982,617 | | | | | | | $ | 1,269,183,725 | |
| | | | |
Overdistributed net investment income | | | | | | $ | (789,308 | ) | | | | | | $ | (669,842 | ) |
| | | | |
| 1 | For the period from March 1, 2015 to October 23, 2015. Effective at the close of business on October 23, 2015, Investor Class shares were converted to Class A shares and are no longer offered by the Fund. |
The accompanying notes are an integral part of these financial statements.
| | | | | | |
| Statements of changes in net assets | | Wells Fargo Dow Jones Target Date Funds | | | 53 | |
| | | | | | | | | | | | | | | | |
| | | Target 2040 Fund | |
| | | Year ended
February 28, 2017 | | | Year ended
February 29, 2016 | |
| | | | |
Operations | | | | | | | | | | | | | | | | |
Net investment income | | | | | | $ | 29,675,772 | | | | | | | $ | 34,325,202 | |
Net realized gains on investments | | | | | | | 281,561,882 | | | | | | | | 46,674,645 | |
Net change in unrealized gains (losses) on investments | | | | | | | 28,899,272 | | | | | | | | (309,570,864 | ) |
| | | | |
Net increase (decrease) in net assets resulting from operations | | | | | | | 340,136,926 | | | | | | | | (228,571,017 | ) |
| | | | |
| | | | |
Distributions to shareholders from | | | | | | | | | | | | | | | | |
Net investment income | | | | | | | | | | | | | | | | |
Class A | | | | | | | (3,118,747 | ) | | | | | | | (1,363,872 | ) |
Class B | | | | | | | (240 | )1 | | | | | | | (427 | ) |
Class C | | | | | | | (39,836 | ) | | | | | | | (21,203 | ) |
Class R | | | | | | | (4,094 | ) | | | | | | | (2,485 | ) |
Class R4 | | | | | | | (6,907,862 | ) | | | | | | | (8,186,005 | ) |
Class R6 | | | | | | | (15,908,768 | ) | | | | | | | (14,332,859 | ) |
Administrator Class | | | | | | | (4,922,079 | ) | | | | | | | (4,465,866 | ) |
Investor Class | | | | | | | N/A | | | | | | | | (1,006,626 | )2 |
Net realized gains | | | | | | | | | | | | | | | | |
Class A | | | | | | | (3,955,515 | ) | | | | | | | (6,639,292 | ) |
Class B | | | | | | | 0 | 1 | | | | | | | (3,025 | ) |
Class C | | | | | | | (92,338 | ) | | | | | | | (155,995 | ) |
Class R | | | | | | | (5,844 | ) | | | | | | | (8,919 | ) |
Class R4 | | | | | | | (7,095,650 | ) | | | | | | | (15,183,244 | ) |
Class R6 | | | | | | | (19,057,353 | ) | | | | | | | (27,150,983 | ) |
Administrator Class | | | | | | | (5,594,910 | ) | | | | | | | (10,413,294 | ) |
| | | | |
Total distributions to shareholders | | | | | | | (66,703,236 | ) | | | | | | | (88,934,095 | ) |
| | | | |
| | | | |
Capital share transactions | | | Shares | | | | | | | | Shares | | | | | |
Proceeds from shares sold | | | | | | | | | | | | | | | | |
Class A | | | 750,385 | | | | 13,850,987 | | | | 7,832,531 | | | | 145,840,814 | |
Class B | | | 0 | 1 | | | 0 | 1 | | | 3,929 | | | | 71,579 | |
Class C | | | 22,185 | | | | 384,662 | | | | 37,287 | | | | 657,846 | |
Class R | | | 5,024 | | | | 95,186 | | | | 10,378 | | | | 197,802 | |
Class R4 | | | 5,991,638 | | | | 113,545,876 | | | | 8,084,530 | | | | 153,528,934 | |
Class R6 | | | 16,718,285 | | | | 314,049,695 | | | | 22,577,979 | | | | 425,406,090 | |
Administrator Class | | | 3,806,064 | | | | 71,124,538 | | | | 4,962,945 | | | | 93,999,139 | |
Investor Class | | | N/A | | | | N/A | | | | 818,800 | 2 | | | 16,002,580 | 2 |
| | | | |
| | | | | | | 513,050,944 | | | | | | | | 835,704,784 | |
| | | | |
Reinvestment of distributions | | | | | | | | | | | | | | | | |
Class A | | | 373,738 | | | | 6,933,608 | | | | 441,267 | | | | 7,850,956 | |
Class B | | | 14 | 1 | | | 240 | 1 | | | 203 | | | | 3,449 | |
Class C | | | 7,220 | | | | 126,095 | | | | 10,060 | | | | 168,164 | |
Class R | | | 537 | | | | 9,938 | | | | 640 | | | | 11,404 | |
Class R4 | | | 740,553 | | | | 14,003,512 | | | | 1,271,924 | | | | 23,369,182 | |
Class R6 | | | 1,820,117 | | | | 34,392,916 | | | | 2,211,178 | | | | 40,536,041 | |
Administrator Class | | | 550,579 | | | | 10,409,892 | | | | 813,092 | | | | 14,878,081 | |
Investor Class | | | N/A | | | | N/A | | | | 52,301 | 2 | | | 1,003,724 | 2 |
| | | | |
| | | | | | | 65,876,201 | | | | | | | | 87,821,001 | |
| | | | |
Please see footnotes on page 54.
The accompanying notes are an integral part of these financial statements.
| | | | |
| 54 | | Wells Fargo Dow Jones Target Date Funds | | Statements of changes in net assets |
| | | | | | | | | | | | | | | | |
| | | Target 2040 Fund | |
| | | Year ended
February 28, 2017 | | | Year ended
February 29, 2016 | |
| | | | |
| | | Shares | | | | | | Shares | | | | |
| | | | |
Capital share transactions (continued) | | | | | | | | | | | | | | | | |
Payment for shares redeemed | | | | | | | | | | | | | | | | |
Class A | | | (1,937,707 | ) | | $ | (35,723,021 | ) | | | (1,932,220 | ) | | $ | (34,985,826 | ) |
Class B | | | (5,548 | )1 | | | (97,562 | )1 | | | (3,253 | ) | | | (58,388 | ) |
Class C | | | (60,643 | ) | | | (1,048,846 | ) | | | (65,920 | ) | | | (1,132,401 | ) |
Class R | | | (2,536 | ) | | | (47,441 | ) | | | (720 | ) | | | (13,176 | ) |
Class R4 | | | (9,697,443 | ) | | | (183,790,455 | ) | | | (20,889,265 | ) | | | (387,340,331 | ) |
Class R6 | | | (48,266,026 | ) | | | (923,947,920 | ) | | | (14,202,963 | ) | | | (266,513,595 | ) |
Administrator Class | | | (13,179,578 | ) | | | (250,636,949 | ) | | | (8,504,025 | ) | | | (159,988,208 | ) |
Investor Class | | | N/A | | | | N/A | | | | (7,811,715 | )2 | | | (148,868,103 | )2 |
| | | | |
| | | | | | | (1,395,292,194 | ) | | | | | | | (998,900,028 | ) |
| | | | |
Net decrease in net assets resulting from capital share transactions | | | | | | | (816,365,049 | ) | | | | | | | (75,374,243 | ) |
| | | | |
Total decrease in net assets | | | | | | | (542,931,359 | ) | | | | | | | (392,879,355 | ) |
| | | | |
| | | | |
Net assets | | | | | | | | | | | | | | | | |
Beginning of period | | | | | | | 1,842,383,451 | | | | | | | | 2,235,262,806 | |
| | | | |
End of period | | | | | | $ | 1,299,452,092 | | | | | | | $ | 1,842,383,451 | |
| | | | |
Overdistributed net investment income | | | | | | $ | (1,456,786 | ) | | | | | | $ | (1,075,105 | ) |
| | | | |
| 1 | For the period from March 1, 2016 to December 5, 2016. Effective at the close of business on December 5, 2016, Class B shares were converted to Class A shares and are no longer offered by the Fund. |
| 2 | For the period from March 1, 2015 to October 23, 2015. Effective at the close of business on October 23, 2015, Investor Class shares were converted to Class A shares and are no longer offered by the Fund. |
The accompanying notes are an integral part of these financial statements.
| | | | | | |
| Statements of changes in net assets | | Wells Fargo Dow Jones Target Date Funds | | | 55 | |
| | | | | | | | | | | | | | | | |
| | | Target 2045 Fund | |
| | | Year ended
February 28, 2017 | | | Year ended
February 29, 2016 | |
| | | | |
Operations | | | | | | | | | | | | | | | | |
Net investment income | | | | | | $ | 11,887,740 | | | | | | | $ | 12,722,827 | |
Net realized gains on investments | | | | | | | 114,510,017 | | | | | | | | 16,623,481 | |
Net change in unrealized gains (losses) on investments | | | | | | | 20,363,337 | | | | | | | | (125,041,631 | ) |
| | | | |
Net increase (decrease) in net assets resulting from operations | | | | | | | 146,761,094 | | | | | | | | (95,695,323 | ) |
| | | | |
| | | | |
Distributions to shareholders from | | | | | | | | | | | | | | | | |
Net investment income | | | | | | | | | | | | | | | | |
Class A | | | | | | | (1,166,088 | ) | | | | | | | (268,832 | ) |
Class R | | | | | | | (440 | ) | | | | | | | (252 | ) |
Class R4 | | | | | | | (2,597,632 | ) | | | | | | | (2,188,948 | ) |
Class R6 | | | | | | | (7,314,597 | ) | | | | | | | (6,523,660 | ) |
Administrator Class | | | | | | | (1,885,277 | ) | | | | | | | (1,492,836 | ) |
Investor Class | | | | | | | N/A | | | | | | | | (837,020 | )1 |
Net realized gains | | | | | | | | | | | | | | | | |
Class A | | | | | | | (1,033,575 | ) | | | | | | | (2,771,190 | ) |
Class R | | | | | | | (492 | ) | | | | | | | (817 | ) |
Class R4 | | | | | | | (2,165,894 | ) | | | | | | | (3,688,268 | ) |
Class R6 | | | | | | | (7,211,828 | ) | | | | | | | (11,238,044 | ) |
Administrator Class | | | | | | | (1,659,277 | ) | | | | | | | (3,155,252 | ) |
| | | | |
Total distributions to shareholders | | | | | | | (25,035,100 | ) | | | | | | | (32,165,119 | ) |
| | | | |
| | | | |
Capital share transactions | | | Shares | | | | | | | | Shares | | | | | |
Proceeds from shares sold | | | | | | | | | | | | | | | | |
Class A | | | 1,201,048 | | | | 13,439,925 | | | | 10,643,641 | | | | 119,886,949 | |
Class R | | | 1,044 | | | | 11,983 | | | | 251 | | | | 2,795 | |
Class R4 | | | 4,442,172 | | | | 50,226,606 | | | | 4,571,380 | | | | 52,006,760 | |
Class R6 | | | 15,704,610 | | | | 175,212,278 | | | | 20,456,922 | | | | 230,687,584 | |
Administrator Class | | | 2,322,405 | | | | 25,910,378 | | | | 3,086,451 | | | | 35,108,254 | |
Investor Class | | | N/A | | | | N/A | | | | 1,568,639 | 1 | | | 18,347,423 | 1 |
| | | | |
| | | | | | | 264,801,170 | | | | | | | | 456,039,765 | |
| | | | |
Reinvestment of distributions | | | | | | | | | | | | | | | | |
Class A | | | 194,607 | | | | 2,190,289 | | | | 282,891 | | | | 3,027,399 | |
Class R | | | 82 | | | | 932 | | | | 98 | | | | 1,069 | |
Class R4 | | | 421,613 | | | | 4,763,526 | | | | 536,817 | | | | 5,877,216 | |
Class R6 | | | 1,260,571 | | | | 14,181,842 | | | | 1,585,167 | | | | 17,267,672 | |
Administrator Class | | | 312,184 | | | | 3,542,901 | | | | 423,857 | | | | 4,648,064 | |
Investor Class | | | N/A | | | | N/A | | | | 72,282 | 1 | | | 836,392 | 1 |
| | | | |
| | | | | | | 24,679,490 | | | | | | | | 31,657,812 | |
| | | | |
Payment for shares redeemed | | | | | | | | | | | | | | | | |
Class A | | | (3,119,406 | ) | | | (34,969,496 | ) | | | (3,343,560 | ) | | | (35,251,201 | ) |
Class R | | | (579 | ) | | | (6,579 | ) | | | (2 | ) | | | (18 | ) |
Class R4 | | | (5,181,915 | ) | | | (58,020,514 | ) | | | (8,821,123 | ) | | | (101,240,476 | ) |
Class R6 | | | (38,859,114 | ) | | | (444,874,202 | ) | | | (12,660,032 | ) | | | (140,410,371 | ) |
Administrator Class | | | (9,816,729 | ) | | | (113,364,507 | ) | | | (3,775,671 | ) | | | (42,382,911 | ) |
Investor Class | | | N/A | | | | N/A | | | | (11,149,642 | )1 | | | (127,553,030 | )1 |
| | | | |
| | | | | | | (651,235,298 | ) | | | | | | | (446,838,007 | ) |
| | | | |
Net increase (decrease) in net assets resulting from capital share transactions | | | | | | | (361,754,638 | ) | | | | | | | 40,859,570 | |
| | | | |
Total decrease in net assets | | | | | | | (240,028,644 | ) | | | | | | | (87,000,872 | ) |
| | | | |
| | | | |
Net assets | | | | | | | | | | | | | | | | |
Beginning of period | | | | | | | 724,065,589 | | | | | | | | 811,066,461 | |
| | | | |
End of period | | | | | | $ | 484,036,945 | | | | | | | $ | 724,065,589 | |
| | | | |
Undistributed (overdistributed) net investment income | | | | | | $ | (261,090 | ) | | | | | | $ | 142,148 | |
| | | | |
| 1 | For the period from March 1, 2015 to October 23, 2015. Effective at the close of business on October 23, 2015, Investor Class shares were converted to Class A shares and are no longer offered by the Fund. |
The accompanying notes are an integral part of these financial statements.
| | | | |
| 56 | | Wells Fargo Dow Jones Target Date Funds | | Statements of changes in net assets |
| | | | | | | | | | | | | | | | |
| | | Target 2050 Fund | |
| | | Year ended
February 28, 2017 | | | Year ended
February 29, 2016 | |
| | | | |
Operations | | | | | | | | | | | | | | | | |
Net investment income | | | | | | $ | 20,768,333 | | | | | | | $ | 23,349,252 | |
Net realized gains on investments | | | | | | | 178,311,295 | | | | | | | | 29,896,358 | |
Net change in unrealized gains (losses) on investments | | | | | | | 61,120,568 | | | | | | | | (225,672,734 | ) |
| | | | |
Net increase (decrease) in net assets resulting from operations | | | | | | | 260,200,196 | | | | | | | | (172,427,124 | ) |
| | | | |
| | | | |
Distributions to shareholders from | | | | | | | | | | | | | | | | |
Net investment income | | | | | | | | | | | | | | | | |
Class A | | | | | | | (1,052,438 | ) | | | | | | | (186,145 | ) |
Class C | | | | | | | (10,753 | ) | | | | | | | (3,126 | ) |
Class R | | | | | | | (570 | ) | | | | | | | (272 | ) |
Class R4 | | | | | | | (4,811,396 | ) | | | | | | | (4,725,511 | ) |
Class R6 | | | | | | | (13,860,592 | ) | | | | | | | (13,225,354 | ) |
Administrator Class | | | | | | | (3,479,790 | ) | | | | | | | (2,626,389 | ) |
Investor Class | | | | | | | N/A | | | | | | | | (513,873 | )1 |
Net realized gains | | | | | | | | | | | | | | | | |
Class A | | | | | | | (931,850 | ) | | | | | | | (1,825,085 | ) |
Class C | | | | | | | (17,124 | ) | | | | | | | (22,958 | ) |
Class R | | | | | | | (486 | ) | | | | | | | (847 | ) |
Class R4 | | | | | | | (3,687,375 | ) | | | | | | | (7,749,938 | ) |
Class R6 | | | | | | | (14,124,221 | ) | | | | | | | (21,991,674 | ) |
Administrator Class | | | | | | | (2,769,054 | ) | | | | | | | (5,482,713 | ) |
| | | | |
Total distributions to shareholders | | | | | | | (44,745,649 | ) | | | | | | | (58,353,885 | ) |
| | | | |
| | | | |
Capital share transactions | | | Shares | | | | | | | | Shares | | | | | |
Proceeds from shares sold | | | | | | | | | | | | | | | | |
Class A | | | 1,073,967 | | | | 11,452,648 | | | | 6,951,910 | | | | 74,657,726 | |
Class C | | | 34,167 | | | | 367,397 | | | | 50,243 | | | | 530,074 | |
Class R | | | 1,294 | | | | 13,688 | | | | 521 | | | | 5,371 | |
Class R4 | | | 8,595,718 | | | | 92,702,362 | | | | 11,348,069 | | | | 122,406,849 | |
Class R6 | | | 25,211,448 | | | | 268,725,737 | | | | 33,537,208 | | | | 360,894,394 | |
Administrator Class | | | 5,754,148 | | | | 61,093,379 | | | | 7,641,132 | | | | 82,336,166 | |
Investor Class | | | N/A | | | | N/A | | | | 895,669 | 1 | | | 9,981,111 | 1 |
| | | | |
| | | | | | | 434,355,211 | | | | | | | | 650,811,691 | |
| | | | |
Reinvestment of distributions | | | | | | | | | | | | | | | | |
Class A | | | 183,141 | | | | 1,974,063 | | | | 196,059 | | | | 2,006,262 | |
Class C | | | 2,542 | | | | 27,550 | | | | 2,416 | | | | 24,807 | |
Class R | | | 98 | | | | 1,056 | | | | 108 | | | | 1,119 | |
Class R4 | | | 786,828 | | | | 8,498,771 | | | | 1,191,982 | | | | 12,475,449 | |
Class R6 | | | 2,556,328 | | | | 27,519,772 | | | | 3,298,611 | | | | 34,453,143 | |
Administrator Class | | | 576,210 | | | | 6,206,033 | | | | 779,371 | | | | 8,109,102 | |
Investor Class | | | N/A | | | | N/A | | | | 46,705 | 1 | | | 513,287 | 1 |
| | | | |
| | | | | | | 44,227,245 | | | | | | | | 57,583,169 | |
| | | | |
Please see footnote on page 57.
The accompanying notes are an integral part of these financial statements.
| | | | | | |
| Statements of changes in net assets | | Wells Fargo Dow Jones Target Date Funds | | | 57 | |
| | | | | | | | | | | | | | | | |
| | | Target 2050 Fund | |
| | | Year ended
February 28, 2017 | | | Year ended
February 29, 2016 | |
| | | | |
| | | Shares | | | | | | Shares | | | | |
| | | | |
Capital share transactions (continued) | | | | | | | | | | | | | | | | |
Payment for shares redeemed | | | | | | | | | | | | | | | | |
Class A | | | (1,727,222 | ) | | $ | (18,384,264 | ) | | | (1,176,375 | ) | | $ | (11,926,737 | ) |
Class C | | | (22,857 | ) | | | (244,462 | ) | | | (24,531 | ) | | | (253,785 | ) |
Class R | | | (1,744 | ) | | | (18,969 | ) | | | (2 | ) | | | (29 | ) |
Class R4 | | | (10,848,862 | ) | | | (117,265,781 | ) | | | (21,529,377 | ) | | | (225,930,036 | ) |
Class R6 | | | (86,275,614 | ) | | | (948,116,955 | ) | | | (25,162,016 | ) | | | (272,468,982 | ) |
Administrator Class | | | (14,966,837 | ) | | | (162,602,080 | ) | | | (9,136,641 | ) | | | (97,702,104 | ) |
Investor Class | | | N/A | | | | N/A | | | | (6,875,405 | )1 | | | (74,811,494 | )1 |
| | | | |
| | | | | | | (1,246,632,511 | ) | | | | | | | (683,093,167 | ) |
| | | | |
Net increase (decrease) in net assets resulting from capital share transactions | | | | | | | (768,050,055 | ) | | | | | | | 25,301,693 | |
| | | | |
Total decrease in net assets | | | | | | | (552,595,508 | ) | | | | | | | (205,479,316 | ) |
| | | | |
| | | | |
Net assets | | | | | | | | | | | | | | | | |
Beginning of period | | | | | | | 1,269,993,570 | | | | | | | | 1,475,472,886 | |
| | | | |
End of period | | | | | | $ | 717,398,062 | | | | | | | $ | 1,269,993,570 | |
| | | | |
Overdistributed net investment income | | | | | | $ | (1,048,939 | ) | | | | | | $ | (11,347 | ) |
| | | | |
| 1 | For the period from March 1, 2015 to October 23, 2015. Effective at the close of business on October 23, 2015, Investor Class shares were converted to Class A shares and are no longer offered by the Fund. |
The accompanying notes are an integral part of these financial statements.
| | | | |
| 58 | | Wells Fargo Dow Jones Target Date Funds | | Statements of changes in net assets |
| | | | | | | | | | | | | | | | |
| | | Target 2055 Fund | |
| | | Year ended
February 28, 2017 | | | Year ended
February 29, 2016 | |
| | | | |
Operations | | | | | | | | | | | | | | | | |
Net investment income | | | | | | $ | 3,900,658 | | | | | | | $ | 3,348,997 | |
Net realized gains (losses) on investments | | | | | | | 30,594,432 | | | | | | | | (6,950,552 | ) |
Net change in unrealized gains (losses) on investments | | | | | | | 13,165,216 | | | | | | | | (21,701,511 | ) |
| | | | |
Net increase (decrease) in net assets resulting from operations | | | | | | | 47,660,306 | | | | | | | | (25,303,066 | ) |
| | | | |
| | | | |
Distributions to shareholders from | | | | | | | | | | | | | | | | |
Net investment income | | | | | | | | | | | | | | | | |
Class A | | | | | | | (165,923 | ) | | | | | | | (29,658 | ) |
Class R | | | | | | | (775 | ) | | | | | | | (252 | ) |
Class R4 | | | | | | | (719,343 | ) | | | | | | | (378,682 | ) |
Class R6 | | | | | | | (3,141,825 | ) | | | | | | | (2,072,829 | ) |
Administrator Class | | | | | | | (380,788 | ) | | | | | | | (152,082 | ) |
Investor Class | | | | | | | N/A | | | | | | | | (72,053 | )1 |
Net realized gains | | | | | | | | | | | | | | | | |
Class A | | | | | | | 0 | | | | | | | | (24,092 | ) |
Class R | | | | | | | 0 | | | | | | | | (86 | ) |
Class R4 | | | | | | | 0 | | | | | | | | (55,238 | ) |
Class R6 | | | | | | | 0 | | | | | | | | (319,151 | ) |
Administrator Class | | | | | | | 0 | | | | | | | | (31,756 | ) |
| | | | |
Total distributions to shareholders | | | | | | | (4,408,654 | ) | | | | | | | (3,135,879 | ) |
| | | | |
| | | | |
Capital share transactions | | | Shares | | | | | | | | Shares | | | | | |
Proceeds from shares sold | | | | | | | | | | | | | | | | |
Class A | | | 295,984 | | | | 3,791,625 | | | | 1,100,577 | | | | 13,865,874 | |
Class R | | | 2,272 | | | | 28,459 | | | | 1,468 | | | | 17,944 | |
Class R4 | | | 1,821,833 | | | | 23,608,827 | | | | 1,763,543 | | | | 22,488,266 | |
Class R6 | | | 10,227,920 | | | | 130,922,660 | | | | 9,869,147 | | | | 124,299,082 | |
Administrator Class | | | 1,273,847 | | | | 16,263,083 | | | | 1,127,506 | | | | 14,089,884 | |
Investor Class | | | N/A | | | | N/A | | | | 320,954 | 1 | | | 4,145,234 | 1 |
| | | | |
| | | | | | | 174,614,654 | | | | | | | | 178,906,284 | |
| | | | |
Reinvestment of distributions | | | | | | | | | | | | | | | | |
Class A | | | 12,712 | | | | 162,444 | | | | 4,195 | | | | 51,885 | |
Class R | | | 61 | | | | 775 | | | | 27 | | | | 338 | |
Class R4 | | | 56,009 | | | | 719,343 | | | | 34,201 | | | | 433,920 | |
Class R6 | | | 230,120 | | | | 2,903,253 | | | | 171,963 | | | | 2,165,166 | |
Administrator Class | | | 29,767 | | | | 380,770 | | | | 14,584 | | | | 183,838 | |
Investor Class | | | N/A | | | | N/A | | | | 5,667 | 1 | | | 71,987 | 1 |
| | | | |
| | | | | | | 4,166,585 | | | | | | | | 2,907,134 | |
| | | | |
Payment for shares redeemed | | | | | | | | | | | | | | | | |
Class A | | | (415,288 | ) | | | (5,349,209 | ) | | | (374,104 | ) | | | (4,453,123 | ) |
Class R | | | (3,065 | ) | | | (39,597 | ) | | | (191 | ) | | | (2,112 | ) |
Class R4 | | | (1,128,838 | ) | | | (14,561,489 | ) | | | (1,979,482 | ) | | | (25,237,910 | ) |
Class R6 | | | (19,725,771 | ) | | | (262,098,148 | ) | | | (5,605,399 | ) | | | (70,687,587 | ) |
Administrator Class | | | (1,881,274 | ) | | | (24,996,411 | ) | | | (807,536 | ) | | | (10,091,281 | ) |
Investor Class | | | N/A | | | | N/A | | | | (938,655 | )1 | | | (11,838,163 | )1 |
| | | | |
| | | | | | | (307,044,854 | ) | | | | | | | (122,310,176 | ) |
| | | | |
Net increase (decrease) in net assets resulting from capital share transactions | | | | | | | (128,263,615 | ) | | | | | | | 59,503,242 | |
| | | | |
Total increase (decrease) in net assets | | | | | | | (85,011,963 | ) | | | | | | | 31,064,297 | |
| | | | |
| | | | |
Net assets | | | | | | | | | | | | | | | | |
Beginning of period | | | | | | | 212,685,443 | | | | | | | | 181,621,146 | |
| | | | |
End of period | | | | | | $ | 127,673,480 | | | | | | | $ | 212,685,443 | |
| | | | |
Undistributed net investment income | | | | | | $ | 79,043 | | | | | | | $ | 506,259 | |
| | | | |
| 1 | For the period from March 1, 2015 to October 23, 2015. Effective at the close of business on October 23, 2015, Investor Class shares were converted to Class A shares and are no longer offered by the Fund. |
The accompanying notes are an integral part of these financial statements.
| | | | | | |
| Statements of changes in net assets | | Wells Fargo Dow Jones Target Date Funds | | | 59 | |
| | | | | | | | | | | | | | | | |
| | | Target 2060 Fund | |
| | | Year ended
February 28, 2017 | | | Year ended
February 29, 20161 | |
| | | | |
Operations | | | | | | | | | | | | | | | | |
Net investment income | | | | | | $ | 135,221 | | | | | | | $ | 9,249 | |
Net realized gains (losses) on investments | | | | | | | 3,164,642 | | | | | | | | (83,369 | ) |
Net change in unrealized gains (losses) on investments | | | | | | | (1,311,506 | ) | | | | | | | (56,163 | ) |
| | | | |
Net increase (decrease) in net assets resulting from operations | | | | | | | 1,988,357 | | | | | | | | (130,283 | ) |
| | | | |
| | | | |
Distributions to shareholders from | | | | | | | | | | | | | | | | |
Net investment income | | | | | | | | | | | | | | | | |
Class A | | | | | | | (3,486 | ) | | | | | | | (1,105 | ) |
Class C | | | | | | | (1,567 | ) | | | | | | | 0 | |
Class R | | | | | | | (2,177 | ) | | | | | | | (981 | ) |
Class R4 | | | | | | | (31,389 | ) | | | | | | | 0 | |
Class R6 | | | | | | | (68,995 | ) | | | | | | | (1,057 | ) |
Administrator Class | | | | | | | (26,508 | ) | | | | | | | (2,524 | ) |
| | | | |
Total distributions to shareholders | | | | | | | (134,122 | ) | | | | | | | (5,667 | ) |
| | | | |
| | | | |
Capital share transactions | | | Shares | | | | | | | | Shares | | | | | |
Proceeds from shares sold | | | | | | | | | | | | | | | | |
Class A | | | 67,988 | | | | 679,344 | | | | 11,519 | | | | 113,979 | |
Class C | | | 3,964 | | | | 38,209 | | | | 19,544 | | | | 190,494 | |
Class R | | | 2,739 | | | | 27,102 | | | | 10,000 | | | | 100,000 | |
Class R4 | | | 680,949 | | | | 6,938,855 | | | | 39,373 | | | | 372,597 | |
Class R6 | | | 1,251,361 | | | | 12,719,457 | | | | 64,296 | | | | 622,396 | |
Administrator Class | | | 556,655 | | | | 5,584,665 | | | | 58,746 | | | | 570,470 | |
| | | | |
| | | | | | | 25,987,632 | | | | | | | | 1,969,936 | |
| | | | |
Reinvestment of distributions | | | | | | | | | | | | | | | | |
Class A | | | 351 | | | | 3,486 | | | | 120 | | | | 1,105 | |
Class C | | | 164 | | | | 1,567 | | | | 0 | | | | 0 | |
Class R | | | 232 | | | | 2,177 | | | | 106 | | | | 981 | |
Class R4 | | | 3,060 | | | | 31,389 | | | | 0 | | | | 0 | |
Class R6 | | | 6,704 | | | | 68,438 | | | | 113 | | | | 1,057 | |
Administrator Class | | | 2,643 | | | | 26,508 | | | | 272 | | | | 2,524 | |
| | | | |
| | | | | | | 133,565 | | | | | | | | 5,667 | |
| | | | |
Payment for shares redeemed | | | | | | | | | | | | | | | | |
Class A | | | (16,887 | ) | | | (170,284 | ) | | | (300 | ) | | | (2,643 | ) |
Class C | | | (42 | ) | | | (404 | ) | | | (101 | ) | | | (947 | ) |
Class R | | | (1,028 | ) | | | (10,133 | ) | | | 0 | | | | 0 | |
Class R4 | | | (113,793 | ) | | | (1,178,005 | ) | | | (17,654 | ) | | | (166,114 | ) |
Class R6 | | | (169,020 | ) | | | (1,736,930 | ) | | | (378 | ) | | | (3,576 | ) |
Administrator Class | | | (187,439 | ) | | | (1,931,014 | ) | | | (18,632 | ) | | | (176,713 | ) |
| | | | |
| | | | | | | (5,026,770 | ) | | | | | | | (349,993 | ) |
| | | | |
Net increase in net assets resulting from capital share transactions | | | | | | | 21,094,427 | | | | | | | | 1,625,610 | |
| | | | |
Total increase in net assets | | | | | | | 22,948,662 | | | | | | | | 1,489,660 | |
| | | | |
| | | | |
Net assets | | | | | | | | | | | | | | | | |
Beginning of period | | | | | | | 1,489,660 | | | | | | | | 0 | |
| | | | |
End of period | | | | | | $ | 24,438,322 | | | | | | | $ | 1,489,660 | |
| | | | |
Undistributed net investment income | | | | | | $ | 23,529 | | | | | | | $ | 2,283 | |
| | | | |
| 1 | For the period from June 30, 2015 (commencement of Fund operations) to February 29, 2016 |
The accompanying notes are an integral part of these financial statements.
| | | | |
| 60 | | Wells Fargo Dow Jones Target Date Funds | | Financial highlights |
| | | | | | | | | | | | | | | | | | | | | | | | |
| Target Today Fund | | Beginning net asset value per share | | | Net investment income | | | Net realized and unrealized gains (losses) on investments | | | Distributions from net investment income | | | Distributions from net realized gains | | | Ending net asset value per share | |
Class A | | | | | | | | | | | | | | | | | | | | | | | | |
Year ended February 28, 2017 | | $ | 10.41 | | | | 0.12 | | | | 0.23 | | | | (0.11 | ) | | | (0.09 | ) | | $ | 10.56 | |
Year ended February 29, 2016 | | $ | 10.81 | | | | 0.10 | 4 | | | (0.29 | ) | | | (0.03 | ) | | | (0.18 | ) | | $ | 10.41 | |
Year ended February 28, 2015 | | $ | 10.85 | | | | 0.15 | | | | 0.05 | | | | (0.13 | ) | | | (0.11 | ) | | $ | 10.81 | |
Year ended February 28, 2014 | | $ | 10.84 | | | | 0.15 | | | | 0.13 | | | | (0.13 | ) | | | (0.14 | ) | | $ | 10.85 | |
Year ended February 28, 2013 | | $ | 10.86 | | | | 0.15 | 4 | | | 0.08 | | | | (0.17 | ) | | | (0.08 | ) | | $ | 10.84 | |
Class C | | | | | | | | | | | | | | | | | | | | | | | | |
Year ended February 28, 2017 | | $ | 10.63 | | | | 0.03 | | | | 0.24 | | | | (0.04 | ) | | | (0.09 | ) | | $ | 10.77 | |
Year ended February 29, 2016 | | $ | 11.08 | | | | 0.02 | 4 | | | (0.29 | ) | | | 0.00 | | | | (0.18 | ) | | $ | 10.63 | |
Year ended February 28, 2015 | | $ | 11.11 | | | | 0.06 | 4 | | | 0.06 | | | | (0.04 | ) | | | (0.11 | ) | | $ | 11.08 | |
Year ended February 28, 2014 | | $ | 11.09 | | | | 0.06 | 4 | | | 0.14 | | | | (0.04 | ) | | | (0.14 | ) | | $ | 11.11 | |
Year ended February 28, 2013 | | $ | 11.11 | | | | 0.07 | | | | 0.08 | | | | (0.09 | ) | | | (0.08 | ) | | $ | 11.09 | |
Class R | | | | | | | | | | | | | | | | | | | | | | | | |
Year ended February 28, 2017 | | $ | 10.39 | | | | 0.09 | | | | 0.23 | | | | (0.09 | ) | | | (0.09 | ) | | $ | 10.53 | |
Year ended February 29, 2016 | | $ | 10.80 | | | | 0.07 | | | | (0.29 | ) | | | (0.01 | ) | | | (0.18 | ) | | $ | 10.39 | |
Year ended February 28, 2015 | | $ | 10.85 | | | | 0.11 | | | | 0.06 | | | | (0.11 | ) | | | (0.11 | ) | | $ | 10.80 | |
Year ended February 28, 20145 | | $ | 10.57 | | | | 0.07 | | | | 0.41 | | | | (0.06 | ) | | | (0.14 | ) | | $ | 10.85 | |
Class R4 | | | | | | | | | | | | | | | | | | | | | | | | |
Year ended February 28, 2017 | | $ | 10.65 | | | | 0.14 | | | | 0.25 | | | | (0.14 | ) | | | (0.09 | ) | | $ | 10.81 | |
Year ended February 29, 2016 | | $ | 11.06 | | | | 0.14 | | | | (0.30 | ) | | | (0.07 | ) | | | (0.18 | ) | | $ | 10.65 | |
Year ended February 28, 2015 | | $ | 11.10 | | | | 0.18 | | | | 0.06 | | | | (0.17 | ) | | | (0.11 | ) | | $ | 11.06 | |
Year ended February 28, 2014 | | $ | 11.08 | | | | 0.18 | 4 | | | 0.15 | | | | (0.17 | ) | | | (0.14 | ) | | $ | 11.10 | |
Year ended February 28, 20136 | | $ | 11.24 | | | | 0.05 | 4 | | | (0.06 | ) | | | (0.07 | ) | | | (0.08 | ) | | $ | 11.08 | |
Class R67 | | | | | | | | | | | | | | | | | | | | | | | | |
Year ended February 28, 2017 | | $ | 10.64 | | | | 0.17 | 4 | | | 0.23 | | | | (0.17 | ) | | | (0.09 | ) | | $ | 10.78 | |
Year ended February 29, 2016 | | $ | 11.05 | | | | 0.15 | | | | (0.29 | ) | | | (0.09 | ) | | | (0.18 | ) | | $ | 10.64 | |
Year ended February 28, 2015 | | $ | 11.08 | | | | 0.19 | | | | 0.08 | | | | (0.19 | ) | | | (0.11 | ) | | $ | 11.05 | |
Year ended February 28, 2014 | | $ | 11.07 | | | | 0.20 | 4 | | | 0.14 | | | | (0.19 | ) | | | (0.14 | ) | | $ | 11.08 | |
Year ended February 28, 2013 | | $ | 11.09 | | | | 0.21 | | | | 0.08 | | | | (0.23 | ) | | | (0.08 | ) | | $ | 11.07 | |
Administrator Class | | | | | | | | | | | | | | | | | | | | | | | | |
Year ended February 28, 2017 | | $ | 10.63 | | | | 0.13 | 4 | | | 0.23 | | | | (0.12 | ) | | | (0.09 | ) | | $ | 10.78 | |
Year ended February 29, 2016 | | $ | 11.03 | | | | 0.12 | 4 | | | (0.29 | ) | | | (0.05 | ) | | | (0.18 | ) | | $ | 10.63 | |
Year ended February 28, 2015 | | $ | 11.07 | | | | 0.16 | | | | 0.06 | | | | (0.15 | ) | | | (0.11 | ) | | $ | 11.03 | |
Year ended February 28, 2014 | | $ | 11.05 | | | | 0.16 | | | | 0.14 | | | | (0.14 | ) | | | (0.14 | ) | | $ | 11.07 | |
Year ended February 28, 2013 | | $ | 11.07 | | | | 0.17 | | | | 0.08 | | | | (0.19 | ) | | | (0.08 | ) | | $ | 11.05 | |
| 1 | Ratios include net expenses allocated from the affiliated Master Portfolios which were as follows: |
| | | | | | | | | | | | | | | | | | | | |
| | | Year ended February 28, 2017 | | | Year ended February 29, 2016 | | | Year ended February 28 | |
| | | | | 2015 | | | 2014 | | | 2013 | |
| | | | |
Class A | | | 0.15 | % | | | 0.15 | % | | | 0.16 | % | | | 0.18 | % | | | 0.25 | % |
Class C | | | 0.15 | | | | 0.15 | | | | 0.16 | | | | 0.18 | | | | 0.25 | |
Class R | | | 0.16 | | | | 0.14 | | | | 0.16 | | | | 0.18 | 5 | | | N/A | |
Class R4 | | | 0.15 | | | | 0.15 | | | | 0.16 | | | | 0.18 | | | | 0.25 | 6 |
Class R67 | | | 0.15 | | | | 0.15 | | | | 0.16 | | | | 0.18 | | | | 0.25 | |
Administrator Class | | | 0.15 | | | | 0.15 | | | | 0.16 | | | | 0.18 | | | | 0.25 | |
| 2 | Total return calculations do not include any sales charges. Returns for periods of less than one year are not annualized. |
| 3 | Portfolio turnover rate is calculated by aggregating the results of multiplying the Fund’s investment percentage in the respective affiliated Master Portfolios by the corresponding affiliated Master Portfolio’s portfolio turnover rate. |
| 4 | Calculated based upon average shares outstanding |
| 5 | For the period from June 28, 2013 (commencement of class operations) to February 28, 2014 |
| 6 | For the period from November 30, 2012 (commencement of class operations) to February 28, 2013 |
| 7 | On June 1, 2013, Institutional Class was renamed Class R6. |
The accompanying notes are an integral part of these financial statements.
| | | | | | |
| Financial highlights | | Wells Fargo Dow Jones Target Date Funds | | | 61 | |
| | | | | | | | | | | | | | | | | | | | | | |
| Ratio to average net assets (annualized) | | | Total return2 | | | Portfolio turnover rate3 | | | Net assets at end of period (000s omitted) | |
Net investment income | | | Gross expenses1 | | | Net expenses1 | | | | |
| | | | | | | | | | | | | | | | | | | | | | |
| | 1.06 | % | | | 0.85 | % | | | 0.76 | % | | | 3.39 | % | | | 41 | % | | $ | 55,965 | |
| | 0.98 | % | | | 0.86 | % | | | 0.77 | % | | | (1.74 | )% | | | 36 | % | | $ | 66,656 | |
| | 1.26 | % | | | 0.98 | % | | | 0.81 | % | | | 1.83 | % | | | 42 | % | | $ | 15,537 | |
| | 1.29 | % | | | 1.01 | % | | | 0.85 | % | | | 2.67 | % | | | 40 | % | | $ | 17,467 | |
| | 1.39 | % | | | 1.08 | % | | | 0.96 | % | | | 2.15 | % | | | 39 | % | | $ | 19,815 | |
| | | | | | | | | | | | | | | | | | | | | | |
| | 0.31 | % | | | 1.61 | % | | | 1.51 | % | | | 2.57 | % | | | 41 | % | | $ | 2,822 | |
| | 0.19 | % | | | 1.63 | % | | | 1.53 | % | | | (2.44 | )% | | | 36 | % | | $ | 2,763 | |
| | 0.51 | % | | | 1.73 | % | | | 1.56 | % | | | 1.09 | % | | | 42 | % | | $ | 3,471 | |
| | 0.54 | % | | | 1.76 | % | | | 1.60 | % | | | 1.89 | % | | | 40 | % | | $ | 4,287 | |
| | 0.64 | % | | | 1.83 | % | | | 1.71 | % | | | 1.36 | % | | | 39 | % | | $ | 4,945 | |
| | | | | | | | | | | | | | | | | | | | | | |
| | 0.79 | % | | | 1.12 | % | | | 1.01 | % | | | 3.13 | % | | | 41 | % | | $ | 32 | |
| | 0.69 | % | | | 1.12 | % | | | 1.02 | % | | | (2.00 | )% | | | 36 | % | | $ | 29 | |
| | 1.01 | % | | | 1.27 | % | | | 1.06 | % | | | 1.53 | % | | | 42 | % | | $ | 28 | |
| | 1.02 | % | �� | | 1.27 | % | | | 1.06 | % | | | 4.61 | % | | | 40 | % | | $ | 26 | |
| | | | | | | | | | | | | | | | | | | | | | |
| | 1.37 | % | | | 0.58 | % | | | 0.45 | % | | | 3.71 | % | | | 41 | % | | $ | 248,734 | |
| | 1.27 | % | | | 0.59 | % | | | 0.45 | % | | | (1.40 | )% | | | 36 | % | | $ | 271,674 | |
| | 1.62 | % | | | 0.65 | % | | | 0.45 | % | | | 2.16 | % | | | 42 | % | | $ | 338,108 | |
| | 1.66 | % | | | 0.66 | % | | | 0.45 | % | | | 3.09 | % | | | 40 | % | | $ | 367,184 | |
| | 2.06 | % | | | 0.75 | % | | | 0.45 | % | | | (0.09 | )% | | | 39 | % | | $ | 3,073 | |
| | | | | | | | | | | | | | | | | | | | | | |
| | 1.53 | % | | | 0.42 | % | | | 0.30 | % | | | 3.81 | % | | | 41 | % | | $ | 72,643 | |
| | 1.42 | % | | | 0.43 | % | | | 0.30 | % | | | (1.25 | )% | | | 36 | % | | $ | 243,820 | |
| | 1.77 | % | | | 0.51 | % | | | 0.30 | % | | | 2.41 | % | | | 42 | % | | $ | 240,044 | |
| | 1.79 | % | | | 0.57 | % | | | 0.37 | % | | | 3.23 | % | | | 40 | % | | $ | 233,894 | |
| | 1.90 | % | | | 0.65 | % | | | 0.45 | % | | | 2.63 | % | | | 39 | % | | $ | 671,576 | |
| | | | | | | | | | | | | | | | | | | | | | |
| | 1.17 | % | | | 0.77 | % | | | 0.65 | % | | | 3.41 | % | | | 41 | % | | $ | 39,234 | |
| | 1.07 | % | | | 0.78 | % | | | 0.65 | % | | | (1.56 | )% | | | 36 | % | | $ | 61,887 | |
| | 1.42 | % | | | 0.82 | % | | | 0.65 | % | | | 1.95 | % | | | 42 | % | | $ | 99,638 | |
| | 1.45 | % | | | 0.85 | % | | | 0.69 | % | | | 2.87 | % | | | 40 | % | | $ | 116,854 | |
| | 1.54 | % | | | 0.92 | % | | | 0.80 | % | | | 2.29 | % | | | 39 | % | | $ | 139,771 | |
The accompanying notes are an integral part of these financial statements.
| | | | |
| 62 | | Wells Fargo Dow Jones Target Date Funds | | Financial highlights |
| | | | | | | | | | | | | | | | | | | | | | | | |
| Target 2010 Fund | | Beginning net asset value per share | | | Net investment income | | | Net realized and unrealized gains (losses) on investments | | | Distributions from net investment income | | | Distributions from net realized gains | | | Ending net asset value per share | |
Class A | | | | | | | | | | | | | | | | | | | | | | | | |
Year ended February 28, 2017 | | $ | 12.26 | | | | 0.15 | | | | 0.30 | | | | (0.09 | ) | | | (0.21 | ) | | $ | 12.41 | |
Year ended February 29, 2016 | | $ | 13.16 | | | | 0.14 | 4 | | | (0.40 | ) | | | (0.06 | ) | | | (0.58 | ) | | $ | 12.26 | |
Year ended February 28, 2015 | | $ | 13.33 | | | | 0.18 | 4 | | | 0.09 | | | | (0.17 | ) | | | (0.27 | ) | | $ | 13.16 | |
Year ended February 28, 2014 | | $ | 13.30 | | | | 0.19 | 4 | | | 0.31 | | | | (0.17 | ) | | | (0.30 | ) | | $ | 13.33 | |
Year ended February 28, 2013 | | $ | 13.26 | | | | 0.19 | 4 | | | 0.19 | | | | (0.21 | ) | | | (0.13 | ) | | $ | 13.30 | |
Class C | | | | | | | | | | | | | | | | | | | | | | | | |
Year ended February 28, 2017 | | $ | 12.42 | | | | 0.07 | | | | 0.30 | | | | (0.02 | ) | | | (0.21 | ) | | $ | 12.56 | |
Year ended February 29, 2016 | | $ | 13.36 | | | | 0.04 | 4 | | | (0.40 | ) | | | 0.00 | | | | (0.58 | ) | | $ | 12.42 | |
Year ended February 28, 2015 | | $ | 13.52 | | | | 0.09 | | | | 0.09 | | | | (0.07 | ) | | | (0.27 | ) | | $ | 13.36 | |
Year ended February 28, 2014 | | $ | 13.48 | | | | 0.09 | 4 | | | 0.31 | | | | (0.06 | ) | | | (0.30 | ) | | $ | 13.52 | |
Year ended February 28, 2013 | | $ | 13.44 | | | | 0.09 | | | | 0.19 | | | | (0.11 | ) | | | (0.13 | ) | | $ | 13.48 | |
Class R | | | | | | | | | | | | | | | | | | | | | | | | |
Year ended February 28, 2017 | | $ | 12.19 | | | | 0.11 | | | | 0.31 | | | | (0.07 | ) | | | (0.21 | ) | | $ | 12.33 | |
Year ended February 29, 2016 | | $ | 13.11 | | | | 0.11 | 4 | | | (0.41 | ) | | | (0.04 | ) | | | (0.58 | ) | | $ | 12.19 | |
Year ended February 28, 2015 | | $ | 13.28 | | | | 0.15 | 4 | | | 0.10 | | | | (0.15 | ) | | | (0.27 | ) | | $ | 13.11 | |
Year ended February 28, 20145 | | $ | 13.08 | | | | 0.10 | 4 | | | 0.58 | | | | (0.18 | ) | | | (0.30 | ) | | $ | 13.28 | |
Class R4 | | | | | | | | | | | | | | | | | | | | | | | | |
Year ended February 28, 2017 | | $ | 12.38 | | | | 0.19 | 4 | | | 0.32 | | | | (0.13 | ) | | | (0.21 | ) | | $ | 12.55 | |
Year ended February 29, 2016 | | $ | 13.30 | | | | 0.18 | 4 | | | (0.41 | ) | | | (0.11 | ) | | | (0.58 | ) | | $ | 12.38 | |
Year ended February 28, 2015 | | $ | 13.46 | | | | 0.23 | 4 | | | 0.10 | | | | (0.22 | ) | | | (0.27 | ) | | $ | 13.30 | |
Year ended February 28, 2014 | | $ | 13.43 | | | | 0.24 | 4 | | | 0.31 | | | | (0.22 | ) | | | (0.30 | ) | | $ | 13.46 | |
Year ended February 28, 20136 | | $ | 13.56 | | | | 0.08 | | | | 0.00 | 7 | | | (0.08 | ) | | | (0.13 | ) | | $ | 13.43 | |
Class R68 | | | | | | | | | | | | | | | | | | | | | | | | |
Year ended February 28, 2017 | | $ | 12.37 | | | | 0.21 | 4 | | | 0.32 | | | | (0.15 | ) | | | (0.21 | ) | | $ | 12.54 | |
Year ended February 29, 2016 | | $ | 13.29 | | | | 0.19 | | | | (0.40 | ) | | | (0.13 | ) | | | (0.58 | ) | | $ | 12.37 | |
Year ended February 28, 2015 | | $ | 13.45 | | | | 0.27 | | | | 0.08 | | | | (0.24 | ) | | | (0.27 | ) | | $ | 13.29 | |
Year ended February 28, 2014 | | $ | 13.43 | | | | 0.25 | 4 | | | 0.32 | | | | (0.25 | ) | | | (0.30 | ) | | $ | 13.45 | |
Year ended February 28, 2013 | | $ | 13.39 | | | | 0.26 | | | | 0.19 | | | | (0.28 | ) | | | (0.13 | ) | | $ | 13.43 | |
Administrator Class | | | | | | | | | | | | | | | | | | | | | | | | |
Year ended February 28, 2017 | | $ | 12.39 | | | | 0.16 | | | | 0.31 | | | | (0.10 | ) | | | (0.21 | ) | | $ | 12.55 | |
Year ended February 29, 2016 | | $ | 13.29 | | | | 0.16 | 4 | | | (0.41 | ) | | | (0.07 | ) | | | (0.58 | ) | | $ | 12.39 | |
Year ended February 28, 2015 | | $ | 13.46 | | | | 0.21 | | | | 0.08 | | | | (0.19 | ) | | | (0.27 | ) | | $ | 13.29 | |
Year ended February 28, 2014 | | $ | 13.42 | | | | 0.21 | 4 | | | 0.32 | | | | (0.19 | ) | | | (0.30 | ) | | $ | 13.46 | |
Year ended February 28, 2013 | | $ | 13.38 | | | | 0.21 | 4 | | | 0.19 | | | | (0.23 | ) | | | (0.13 | ) | | $ | 13.42 | |
| 1 | Ratios include net expenses allocated from the affiliated Master Portfolios which were as follows: |
| | | | | | | | | | | | | | | | | | | | |
| | | Year ended February 28, 2017 | | | Year ended February 29, 2016 | | | Year ended February 28 | |
| | | | | 2015 | | | 2014 | | | 2013 | |
| | | | |
Class A | | | 0.16 | % | | | 0.15 | % | | | 0.16 | % | | | 0.19 | % | | | 0.26 | % |
Class C | | | 0.16 | | | | 0.15 | | | | 0.16 | | | | 0.19 | | | | 0.26 | |
Class R | | | 0.16 | | | | 0.15 | | | | 0.16 | | | | 0.19 | 5 | | | N/A | |
Class R4 | | | 0.16 | | | | 0.15 | | | | 0.16 | | | | 0.19 | | | | 0.26 | 6 |
Class R68 | | | 0.16 | | | | 0.15 | | | | 0.16 | | | | 0.19 | | | | 0.26 | |
Administrator Class | | | 0.16 | | | | 0.15 | | | | 0.16 | | | | 0.19 | | | | 0.26 | |
| 2 | Total return calculations do not include any sales charges. Returns for periods of less than one year are not annualized. |
| 3 | Portfolio turnover rate is calculated by aggregating the results of multiplying the Fund’s investment percentage in the respective affiliated Master Portfolios by the corresponding affiliated Master Portfolio’s portfolio turnover rate. |
| 4 | Calculated based upon average shares outstanding |
| 5 | For the period from June 28, 2013 (commencement of class operations) to February 28, 2014 |
| 6 | For the period from November 30, 2012 (commencement of class operations) to February 28, 2013 |
| 7 | Amount is less than $0.005. |
| 8 | On June 1, 2013, Institutional Class was renamed Class R6. |
The accompanying notes are an integral part of these financial statements.
| | | | | | |
| Financial highlights | | Wells Fargo Dow Jones Target Date Funds | | | 63 | |
| | | | | | | | | | | | | | | | | | | | | | |
| Ratio to average net assets (annualized) | | | Total return2 | | | Portfolio turnover rate3 | | | Net assets at end of period (000s omitted) | |
Net investment income | | | Gross expenses1 | | | Net expenses1 | | | | |
| | | | | | | | | | | | | | | | | | | | | | |
| | 1.14 | % | | | 0.87 | % | | | 0.78 | % | | | 3.71 | % | | | 41 | % | | $ | 60,237 | |
| | 1.11 | % | | | 0.88 | % | | | 0.79 | % | | | (1.99 | )% | | | 36 | % | | $ | 67,826 | |
| | 1.36 | % | | | 0.99 | % | | | 0.83 | % | | | 2.11 | % | | | 41 | % | | $ | 26,753 | |
| | 1.39 | % | | | 1.02 | % | | | 0.87 | % | | | 3.87 | % | | | 40 | % | | $ | 32,012 | |
| | 1.39 | % | | | 1.08 | % | | | 0.99 | % | | | 2.92 | % | | | 37 | % | | $ | 36,462 | |
| | | | | | | | | | | | | | | | | | | | | | |
| | 0.39 | % | | | 1.62 | % | | | 1.53 | % | | | 2.96 | % | | | 41 | % | | $ | 1,761 | |
| | 0.34 | % | | | 1.65 | % | | | 1.55 | % | | | (2.69 | )% | | | 36 | % | | $ | 1,984 | |
| | 0.61 | % | | | 1.75 | % | | | 1.58 | % | | | 1.39 | % | | | 41 | % | | $ | 2,781 | |
| | 0.64 | % | | | 1.77 | % | | | 1.62 | % | | | 3.07 | % | | | 40 | % | | $ | 2,952 | |
| | 0.64 | % | | | 1.83 | % | | | 1.74 | % | | | 2.10 | % | | | 37 | % | | $ | 3,269 | |
| | | | | | | | | | | | | | | | | | | | | | |
| | 0.88 | % | | | 1.14 | % | | | 1.03 | % | | | 3.45 | % | | | 41 | % | | $ | 53 | |
| | 0.84 | % | | | 1.16 | % | | | 1.05 | % | | | (2.27 | )% | | | 36 | % | | $ | 52 | |
| | 1.09 | % | | | 1.26 | % | | | 1.08 | % | | | 1.92 | % | | | 41 | % | | $ | 53 | |
| | 1.18 | % | | | 1.29 | % | | | 1.08 | % | | | 5.36 | % | | | 40 | % | | $ | 26 | |
| | | | | | | | | | | | | | | | | | | | | | |
| | 1.45 | % | | | 0.59 | % | | | 0.47 | % | | | 4.11 | % | | | 41 | % | | $ | 48,885 | |
| | 1.42 | % | | | 0.61 | % | | | 0.47 | % | | | (1.73 | )% | | | 36 | % | | $ | 70,528 | |
| | 1.73 | % | | | 0.66 | % | | | 0.47 | % | | | 2.55 | % | | | 41 | % | | $ | 148,668 | |
| | 1.79 | % | | | 0.67 | % | | | 0.47 | % | | | 4.24 | % | | | 40 | % | | $ | 199,432 | |
| | 2.03 | % | | | 0.75 | % | | | 0.47 | % | | | 0.63 | % | | | 37 | % | | $ | 5,555 | |
| | | | | | | | | | | | | | | | | | | | | | |
| | 1.61 | % | | | 0.44 | % | | | 0.32 | % | | | 4.27 | % | | | 41 | % | | $ | 82,474 | |
| | 1.57 | % | | | 0.45 | % | | | 0.32 | % | | | (1.59 | )% | | | 36 | % | | $ | 200,168 | |
| | 1.88 | % | | | 0.51 | % | | | 0.38 | % | | | 2.71 | % | | | 41 | % | | $ | 184,812 | |
| | 1.89 | % | | | 0.57 | % | | | 0.48 | % | | | 4.35 | % | | | 40 | % | | $ | 242,218 | |
| | 1.91 | % | | | 0.65 | % | | | 0.48 | % | | | 3.43 | % | | | 37 | % | | $ | 486,113 | |
| | | | | | | | | | | | | | | | | | | | | | |
| | 1.26 | % | | | 0.79 | % | | | 0.67 | % | | | 3.84 | % | | | 41 | % | | $ | 49,565 | |
| | 1.22 | % | | | 0.80 | % | | | 0.67 | % | | | (1.83 | )% | | | 36 | % | | $ | 91,381 | |
| | 1.53 | % | | | 0.86 | % | | | 0.67 | % | | | 2.26 | % | | | 41 | % | | $ | 168,185 | |
| | 1.55 | % | | | 0.92 | % | | | 0.71 | % | | | 4.08 | % | | | 40 | % | | $ | 201,159 | |
| | 1.54 | % | | | 0.92 | % | | | 0.83 | % | | | 3.08 | % | | | 37 | % | | $ | 241,045 | |
The accompanying notes are an integral part of these financial statements.
| | | | |
| 64 | | Wells Fargo Dow Jones Target Date Funds | | Financial highlights |
| | | | | | | | | | | | | | | | | | | | | | | | |
| Target 2015 Fund | | Beginning net asset value per share | | | Net investment income | | | Net realized and unrealized gains (losses) on investments | | | Distributions from net
investment
income | | | Distributions from net realized gains | | | Ending net asset value per share | |
Class A | | | | | | | | | | | | | | | | | | | | | | | | |
Year ended February 28, 2017 | | $ | 9.87 | | | | 0.15 | 4 | | | 0.37 | | | | (0.10 | ) | | | (0.17 | ) | | $ | 10.12 | |
Year ended February 29, 2016 | | $ | 10.40 | | | | 0.15 | | | | (0.41 | ) | | | (0.09 | ) | | | (0.18 | ) | | $ | 9.87 | |
Year ended February 28, 2015 | | $ | 10.38 | | | | 0.15 | | | | 0.13 | | | | (0.14 | ) | | | (0.12 | ) | | $ | 10.40 | |
Year ended February 28, 2014 | | $ | 10.13 | | | | 0.15 | 4 | | | 0.40 | | | | (0.14 | ) | | | (0.16 | ) | | $ | 10.38 | |
Year ended February 28, 20135 | | $ | 10.11 | | | | 0.03 | 4 | | | 0.13 | | | | (0.04 | ) | | | (0.10 | ) | | $ | 10.13 | |
Class R | | | | | | | | | | | | | | | | | | | | | | | | |
Year ended February 28, 2017 | | $ | 10.01 | | | | 0.13 | | | | 0.37 | | | | (0.08 | ) | | | (0.17 | ) | | $ | 10.26 | |
Year ended February 29, 2016 | | $ | 10.55 | | | | 0.13 | | | | (0.42 | ) | | | (0.07 | ) | | | (0.18 | ) | | $ | 10.01 | |
Year ended February 28, 2015 | | $ | 10.52 | | | | 0.12 | | | | 0.14 | | | | (0.11 | ) | | | (0.12 | ) | | $ | 10.55 | |
Year ended February 28, 20146 | | $ | 10.08 | | | | 0.08 | 4 | | | 0.57 | | | | (0.05 | ) | | | (0.16 | ) | | $ | 10.52 | |
Class R4 | | | | | | | | | | | | | | | | | | | | | | | | |
Year ended February 28, 2017 | | $ | 9.91 | | | | 0.18 | 4 | | | 0.37 | | | | (0.13 | ) | | | (0.17 | ) | | $ | 10.16 | |
Year ended February 29, 2016 | | $ | 10.43 | | | | 0.18 | | | | (0.41 | ) | | | (0.11 | ) | | | (0.18 | ) | | $ | 9.91 | |
Year ended February 28, 2015 | | $ | 10.40 | | | | 0.18 | | | | 0.14 | | | | (0.17 | ) | | | (0.12 | ) | | $ | 10.43 | |
Year ended February 28, 2014 | | $ | 10.14 | | | | 0.20 | | | | 0.38 | | | | (0.16 | ) | | | (0.16 | ) | | $ | 10.40 | |
Year ended February 28, 20135 | | $ | 10.11 | | | | 0.05 | 4 | | | 0.13 | | | | (0.05 | ) | | | (0.10 | ) | | $ | 10.14 | |
Class R67 | | | | | | | | | | | | | | | | | | | | | | | | |
Year ended February 28, 2017 | | $ | 9.90 | | | | 0.20 | 4 | | | 0.37 | | | | (0.15 | ) | | | (0.17 | ) | | $ | 10.15 | |
Year ended February 29, 2016 | | $ | 10.42 | | | | 0.20 | | | | (0.42 | ) | | | (0.12 | ) | | | (0.18 | ) | | $ | 9.90 | |
Year ended February 28, 2015 | | $ | 10.39 | | | | 0.20 | | | | 0.14 | | | | (0.19 | ) | | | (0.12 | ) | | $ | 10.42 | |
Year ended February 28, 2014 | | $ | 10.13 | | | | 0.21 | | | | 0.39 | | | | (0.18 | ) | | | (0.16 | ) | | $ | 10.39 | |
Year ended February 28, 2013 | | $ | 9.98 | | | | 0.18 | 4 | | | 0.27 | | | | (0.20 | ) | | | (0.10 | ) | | $ | 10.13 | |
Administrator Class | | | | | | | | | | | | | | | | | | | | | | | | |
Year ended February 28, 2017 | | $ | 10.02 | | | | 0.17 | 4 | | | 0.38 | | | | (0.11 | ) | | | (0.17 | ) | | $ | 10.29 | |
Year ended February 29, 2016 | | $ | 10.55 | | | | 0.17 | | | | (0.43 | ) | | | (0.09 | ) | | | (0.18 | ) | | $ | 10.02 | |
Year ended February 28, 2015 | | $ | 10.52 | | | | 0.17 | | | | 0.13 | | | | (0.15 | ) | | | (0.12 | ) | | $ | 10.55 | |
Year ended February 28, 2014 | | $ | 10.24 | | | | 0.16 | | | | 0.42 | | | | (0.14 | ) | | | (0.16 | ) | | $ | 10.52 | |
Year ended February 28, 2013 | | $ | 10.10 | | | | 0.15 | 4 | | | 0.26 | | | | (0.17 | ) | | | (0.10 | ) | | $ | 10.24 | |
| 1 | Ratios include net expenses allocated from the affiliated Master Portfolios which were as follows: |
| | | | | | | | | | | | | | | | | | | | |
| | | Year ended February 28, 2017 | | | Year ended February 29, 2016 | | | Year ended February 28 | |
| | | | | 2015 | | | 2014 | | | 2013 | |
| | | | |
Class A | | | 0.16 | % | | | 0.16 | % | | | 0.16 | % | | | 0.19 | % | | | 0.26 | %5 |
Class R | | | 0.16 | | | | 0.16 | | | | 0.16 | | | | 0.19 | 6 | | | N/A | |
Class R4 | | | 0.16 | | | | 0.16 | | | | 0.16 | | | | 0.19 | | | | 0.26 | 5 |
Class R67 | | | 0.16 | | | | 0.16 | | | | 0.16 | | | | 0.19 | | | | 0.26 | |
Administrator Class | | | 0.16 | | | | 0.16 | | | | 0.16 | | | | 0.19 | | | | 0.26 | |
| 2 | Total return calculations do not include any sales charges. Returns for periods of less than one year are not annualized. |
| 3 | Portfolio turnover rate is calculated by aggregating the results of multiplying the Fund’s investment percentage in the respective affiliated Master Portfolios by the corresponding affiliated Master Portfolio’s portfolio turnover rate. |
| 4 | Calculated based upon average shares outstanding |
| 5 | For the period from November 30, 2012 (commencement of class operations) to February 28, 2013 |
| 6 | For the period from June 28, 2013 (commencement of class operations) to February 28, 2014 |
| 7 | On June 1, 2013, Institutional Class was renamed Class R6. |
The accompanying notes are an integral part of these financial statements.
| | | | | | |
| Financial highlights | | Wells Fargo Dow Jones Target Date Funds | | | 65 | |
| | | | | | | | | | | | | | | | | | | | | | |
| Ratio to average net assets (annualized) | | | Total return2 | | | Portfolio turnover rate3 | | | Net assets at end of period (000s omitted) | |
Net investment income | | | Gross expenses1 | | | Net expenses1 | | | | |
| | | | | | | | | | | | | | | | | | | | | | |
| | 1.43 | % | | | 0.87 | % | | | 0.79 | % | | | 5.30 | % | | | 41 | % | | $ | 54,770 | |
| | 1.55 | % | | | 0.85 | % | | | 0.79 | % | | | (2.54 | )% | | | 36 | % | | $ | 74,807 | |
| | 1.39 | % | | | 0.99 | % | | | 0.84 | % | | | 2.75 | % | | | 39 | % | | $ | 1,947 | |
| | 1.45 | % | | | 0.99 | % | | | 0.84 | % | | | 5.56 | % | | | 38 | % | | $ | 332 | |
| | 1.28 | % | | | 1.05 | % | | | 0.84 | % | | | 1.60 | % | | | 35 | % | | $ | 10 | |
| | | | | | | | | | | | | | | | | | | | | | |
| | 1.18 | % | | | 1.12 | % | | | 1.04 | % | | | 4.99 | % | | | 41 | % | | $ | 37 | |
| | 1.25 | % | | | 1.14 | % | | | 1.06 | % | | | (2.78 | )% | | | 36 | % | | $ | 42 | |
| | 1.16 | % | | | 1.25 | % | | | 1.09 | % | | | 2.51 | % | | | 39 | % | | $ | 50 | |
| | 1.14 | % | | | 1.26 | % | | | 1.09 | % | | | 6.51 | % | | | 38 | % | | $ | 27 | |
| | | | | | | | | | | | | | | | | | | | | | |
| | 1.73 | % | | | 0.59 | % | | | 0.48 | % | | | 5.57 | % | | | 41 | % | | $ | 105,773 | |
| | 1.83 | % | | | 0.59 | % | | | 0.48 | % | | | (2.22 | )% | | | 36 | % | | $ | 127,503 | |
| | 1.78 | % | | | 0.66 | % | | | 0.48 | % | | | 3.15 | % | | | 39 | % | | $ | 180,101 | |
| | 1.76 | % | | | 0.66 | % | | | 0.48 | % | | | 5.90 | % | | | 38 | % | | $ | 189,078 | |
| | 1.90 | % | | | 0.75 | % | | | 0.48 | % | | | 1.72 | % | | | 35 | % | | $ | 2,614 | |
| | | | | | | | | | | | | | | | | | | | | | |
| | 1.92 | % | | | 0.43 | % | | | 0.33 | % | | | 5.74 | % | | | 41 | % | | $ | 125,438 | |
| | 1.97 | % | | | 0.44 | % | | | 0.33 | % | | | (2.12 | )% | | | 36 | % | | $ | 367,041 | |
| | 1.92 | % | | | 0.51 | % | | | 0.33 | % | | | 3.31 | % | | | 39 | % | | $ | 420,676 | |
| | 1.88 | % | | | 0.55 | % | | | 0.38 | % | | | 6.04 | % | | | 38 | % | | $ | 437,620 | |
| | 1.87 | % | | | 0.65 | % | | | 0.49 | % | | | 4.56 | % | | | 35 | % | | $ | 613,945 | |
| | | | | | | | | | | | | | | | | | | | | | |
| | 1.59 | % | | | 0.78 | % | | | 0.68 | % | | | 5.52 | % | | | 41 | % | | $ | 21,910 | |
| | 1.62 | % | | | 0.78 | % | | | 0.68 | % | | | (2.45 | )% | | | 36 | % | | $ | 122,329 | |
| | 1.57 | % | | | 0.83 | % | | | 0.68 | % | | | 2.91 | % | | | 39 | % | | $ | 188,412 | |
| | 1.54 | % | | | 0.85 | % | | | 0.72 | % | | | 5.79 | % | | | 38 | % | | $ | 211,930 | |
| | 1.47 | % | | | 0.92 | % | | | 0.84 | % | | | 4.06 | % | | | 35 | % | | $ | 194,125 | |
The accompanying notes are an integral part of these financial statements.
| | | | |
| 66 | | Wells Fargo Dow Jones Target Date Funds | | Financial highlights |
| | | | | | | | | | | | | | | | | | | | | | | | |
| Target 2020 Fund | | Beginning net asset value per share | | | Net investment income | | | Net realized and unrealized gains (losses) on investments | | | Distributions from net investment income | | | Distributions from net realized gains | | | Ending net asset value per share | |
Class A | | | | | | | | | | | | | | | | | | | | | | | | |
Year ended February 28, 2017 | | $ | 14.19 | | | | 0.21 | | | | 0.85 | | | | (0.17 | ) | | | (0.21 | ) | | $ | 14.87 | |
Year ended February 29, 2016 | | $ | 15.24 | | | | 0.22 | 4 | | | (0.81 | ) | | | (0.10 | ) | | | (0.36 | ) | | $ | 14.19 | |
Year ended February 28, 2015 | | $ | 15.14 | | | | 0.20 | 4 | | | 0.33 | | | | (0.18 | ) | | | (0.25 | ) | | $ | 15.24 | |
Year ended February 28, 2014 | | $ | 14.53 | | | | 0.20 | | | | 0.97 | | | | (0.17 | ) | | | (0.39 | ) | | $ | 15.14 | |
Year ended February 28, 2013 | | $ | 14.25 | | | | 0.20 | | | | 0.50 | | | | (0.21 | ) | | | (0.21 | ) | | $ | 14.53 | |
Class C | | | | | | | | | | | | | | | | | | | | | | | | |
Year ended February 28, 2017 | | $ | 14.10 | | | | 0.10 | | | | 0.84 | | | | (0.08 | ) | | | (0.21 | ) | | $ | 14.75 | |
Year ended February 29, 2016 | | $ | 15.16 | | | | 0.11 | 4 | | | (0.79 | ) | | | (0.02 | ) | | | (0.36 | ) | | $ | 14.10 | |
Year ended February 28, 2015 | | $ | 15.08 | | | | 0.09 | | | | 0.32 | | | | (0.08 | ) | | | (0.25 | ) | | $ | 15.16 | |
Year ended February 28, 2014 | | $ | 14.49 | | | | 0.08 | | | | 0.97 | | | | (0.07 | ) | | | (0.39 | ) | | $ | 15.08 | |
Year ended February 28, 2013 | | $ | 14.20 | | | | 0.09 | | | | 0.51 | | | | (0.10 | ) | | | (0.21 | ) | | $ | 14.49 | |
Class R | | | | | | | | | | | | | | | | | | | | | | | | |
Year ended February 28, 2017 | | $ | 14.14 | | | | 0.18 | | | | 0.84 | | | | (0.14 | ) | | | (0.21 | ) | | $ | 14.81 | |
Year ended February 29, 2016 | | $ | 15.18 | | | | 0.17 | 4 | | | (0.79 | ) | | | (0.06 | ) | | | (0.36 | ) | | $ | 14.14 | |
Year ended February 28, 2015 | | $ | 15.10 | | | | 0.15 | 4 | | | 0.34 | | | | (0.16 | ) | | | (0.25 | ) | | $ | 15.18 | |
Year ended February 28, 20145 | | $ | 14.48 | | | | 0.10 | 4 | | | 1.10 | | | | (0.19 | ) | | | (0.39 | ) | | $ | 15.10 | |
Class R4 | | | | | | | | | | | | | | | | | | | | | | | | |
Year ended February 28, 2017 | | $ | 14.44 | | | | 0.27 | 4 | | | 0.86 | | | | (0.21 | ) | | | (0.21 | ) | | $ | 15.15 | |
Year ended February 29, 2016 | | $ | 15.50 | | | | 0.26 | | | | (0.81 | ) | | | (0.15 | ) | | | (0.36 | ) | | $ | 14.44 | |
Year ended February 28, 2015 | | $ | 15.40 | | | | 0.26 | | | | 0.33 | | | | (0.24 | ) | | | (0.25 | ) | | $ | 15.50 | |
Year ended February 28, 2014 | | $ | 14.77 | | | | 0.19 | | | | 1.06 | | | | (0.23 | ) | | | (0.39 | ) | | $ | 15.40 | |
Year ended February 28, 20136 | | $ | 14.66 | | | | 0.09 | | | | 0.31 | | | | (0.08 | ) | | | (0.21 | ) | | $ | 14.77 | |
Class R67 | | | | | | | | | | | | | | | | | | | | | | | | |
Year ended February 28, 2017 | | $ | 14.43 | | | | 0.29 | 4 | | | 0.86 | | | | (0.23 | ) | | | (0.21 | ) | | $ | 15.14 | |
Year ended February 29, 2016 | | $ | 15.50 | | | | 0.27 | | | | (0.80 | ) | | | (0.18 | ) | | | (0.36 | ) | | $ | 14.43 | |
Year ended February 28, 2015 | | $ | 15.40 | | | | 0.28 | | | | 0.33 | | | | (0.26 | ) | | | (0.25 | ) | | $ | 15.50 | |
Year ended February 28, 2014 | | $ | 14.77 | | | | 0.27 | 4 | | | 1.00 | | | | (0.25 | ) | | | (0.39 | ) | | $ | 15.40 | |
Year ended February 28, 2013 | | $ | 14.47 | | | | 0.27 | | | | 0.52 | | | | (0.28 | ) | | | (0.21 | ) | | $ | 14.77 | |
Administrator Class | | | | | | | | | | | | | | | | | | | | | | | | |
Year ended February 28, 2017 | | $ | 14.40 | | | | 0.24 | 4 | | | 0.84 | | | | (0.18 | ) | | | (0.21 | ) | | $ | 15.09 | |
Year ended February 29, 2016 | | $ | 15.46 | | | | 0.23 | | | | (0.81 | ) | | | (0.12 | ) | | | (0.36 | ) | | $ | 14.40 | |
Year ended February 28, 2015 | | $ | 15.36 | | | | 0.23 | | | | 0.33 | | | | (0.21 | ) | | | (0.25 | ) | | $ | 15.46 | |
Year ended February 28, 2014 | | $ | 14.73 | | | | 0.22 | | | | 0.99 | | | | (0.19 | ) | | | (0.39 | ) | | $ | 15.36 | |
Year ended February 28, 2013 | | $ | 14.44 | | | | 0.21 | | | | 0.52 | | | | (0.23 | ) | | | (0.21 | ) | | $ | 14.73 | |
| 1 | Ratios include net expenses allocated from the affiliated Master Portfolios which were as follows: |
| | | | | | | | | | | | | | | | | | | | |
| | | Year ended February 28, 2017 | | | Year ended February 29, 2016 | | | Year ended February 28 | |
| | | | | 2015 | | | 2014 | | | 2013 | |
| | | | |
Class A | | | 0.17 | % | | | 0.16 | % | | | 0.16 | % | | | 0.19 | % | | | 0.26 | % |
Class C | | | 0.17 | | | | 0.16 | | | | 0.16 | | | | 0.19 | | | | 0.26 | |
Class R | | | 0.17 | | | | 0.16 | | | | 0.16 | | | | 0.19 | 5 | | | N/A | |
Class R4 | | | 0.17 | | | | 0.16 | | | | 0.16 | | | | 0.19 | | | | 0.26 | 6 |
Class R67 | | | 0.17 | | | | 0.16 | | | | 0.16 | | | | 0.19 | | | | 0.26 | |
Administrator Class | | | 0.17 | | | | 0.16 | | | | 0.16 | | | | 0.19 | | | | 0.26 | |
| 2 | Total return calculations do not include any sales charges. Returns for periods of less than one year are not annualized. |
| 3 | Portfolio turnover rate is calculated by aggregating the results of multiplying the Fund’s investment percentage in the respective affiliated Master Portfolio by the corresponding affiliated Master Portfolio’s portfolio turnover rate. |
| 4 | Calculated based upon average shares outstanding |
| 5 | For the period from June 28, 2013 (commencement of class operations) to February 28, 2014 |
| 6 | For the period from November 30, 2012 (commencement of class operations) to February 28, 2013 |
| 7 | On June 1, 2013, Institutional Class was renamed Class R6. |
The accompanying notes are an integral part of these financial statements.
| | | | | | |
| Financial highlights | | Wells Fargo Dow Jones Target Date Funds | | | 67 | |
| | | | | | | | | | | | | | | | | | | | | | |
| Ratio to average net assets (annualized) | | | Total return2 | | | Portfolio turnover rate3 | | | Net assets at end of period (000s omitted) | |
Net investment income | | | Gross expenses1 | | | Net expenses1 | | | | |
| | | | | | | | | | | | | | | | | | | | | | |
| | 1.44 | % | | | 0.85 | % | | | 0.81 | % | | | 7.53 | % | | | 39 | % | | $ | 218,652 | |
| | 1.49 | % | | | 0.86 | % | | | 0.82 | % | | | (3.86 | )% | | | 34 | % | | $ | 230,667 | |
| | 1.34 | % | | | 0.95 | % | | | 0.86 | % | | | 3.57 | % | | | 36 | % | | $ | 64,808 | |
| | 1.32 | % | | | 0.98 | % | | | 0.90 | % | | | 8.16 | % | | | 35 | % | | $ | 75,871 | |
| | 1.36 | % | | | 1.06 | % | | | 1.01 | % | | | 5.00 | % | | | 32 | % | | $ | 74,720 | |
| | | | | | | | | | | | | | | | | | | | | | |
| | 0.69 | % | | | 1.60 | % | | | 1.56 | % | | | 6.71 | % | | | 39 | % | | $ | 6,713 | |
| | 0.74 | % | | | 1.62 | % | | | 1.58 | % | | | (4.50 | )% | | | 34 | % | | $ | 6,355 | |
| | 0.59 | % | | | 1.70 | % | | | 1.61 | % | | | 2.71 | % | | | 36 | % | | $ | 5,509 | |
| | 0.57 | % | | | 1.73 | % | | | 1.65 | % | | | 7.36 | % | | | 35 | % | | $ | 5,208 | |
| | 0.61 | % | | | 1.81 | % | | | 1.76 | % | | | 4.28 | % | | | 32 | % | | $ | 4,514 | |
| | | | | | | | | | | | | | | | | | | | | | |
| | 1.21 | % | | | 1.10 | % | | | 1.06 | % | | | 7.27 | % | | | 39 | % | | $ | 321 | |
| | 1.25 | % | | | 1.14 | % | | | 1.08 | % | | | (4.08 | )% | | | 34 | % | | $ | 409 | |
| | 1.00 | % | | | 1.21 | % | | | 1.11 | % | | | 3.30 | % | | | 36 | % | | $ | 744 | |
| | 1.07 | % | | | 1.24 | % | | | 1.11 | % | | | 8.37 | % | | | 35 | % | | $ | 27 | |
| | | | | | | | | | | | | | | | | | | | | | |
| | 1.76 | % | | | 0.56 | % | | | 0.50 | % | | | 7.89 | % | | | 39 | % | | $ | 357,823 | |
| | 1.82 | % | | | 0.58 | % | | | 0.50 | % | | | (3.52 | )% | | | 34 | % | | $ | 408,501 | |
| | 1.72 | % | | | 0.62 | % | | | 0.50 | % | | | 3.89 | % | | | 36 | % | | $ | 772,604 | |
| | 1.70 | % | | | 0.63 | % | | | 0.50 | % | | | 8.58 | % | | | 35 | % | | $ | 803,141 | |
| | 1.72 | % | | | 0.73 | % | | | 0.50 | % | | | 2.79 | % | | | 32 | % | | $ | 23,050 | |
| | | | | | | | | | | | | | | | | | | | | | |
| | 1.92 | % | | | 0.41 | % | | | 0.35 | % | | | 8.04 | % | | | 39 | % | | $ | 645,237 | |
| | 1.97 | % | | | 0.43 | % | | | 0.35 | % | | | (3.42 | )% | | | 34 | % | | $ | 1,116,419 | |
| | 1.85 | % | | | 0.47 | % | | | 0.35 | % | | | 4.04 | % | | | 36 | % | | $ | 1,114,670 | |
| | 1.88 | % | | | 0.53 | % | | | 0.40 | % | | | 8.72 | % | | | 35 | % | | $ | 1,065,417 | |
| | 1.85 | % | | | 0.63 | % | | | 0.50 | % | | | 5.60 | % | | | 32 | % | | $ | 1,605,032 | |
| | | | | | | | | | | | | | | | | | | | | | |
| | 1.60 | % | | | 0.76 | % | | | 0.70 | % | | | 7.58 | % | | | 39 | % | | $ | 197,835 | |
| | 1.62 | % | | | 0.77 | % | | | 0.70 | % | | | (3.72 | )% | | | 34 | % | | $ | 526,327 | |
| | 1.50 | % | | | 0.79 | % | | | 0.70 | % | | | 3.69 | % | | | 36 | % | | $ | 670,893 | |
| | 1.52 | % | | | 0.82 | % | | | 0.74 | % | | | 8.35 | % | | | 35 | % | | $ | 746,910 | |
| | 1.47 | % | | | 0.90 | % | | | 0.85 | % | | | 5.19 | % | | | 32 | % | | $ | 688,261 | |
The accompanying notes are an integral part of these financial statements.
| | | | |
| 68 | | Wells Fargo Dow Jones Target Date Funds | | Financial highlights |
| | | | | | | | | | | | | | | | | | | | | | | | |
| Target 2025 Fund | | Beginning net asset value per share | | | Net investment income | | | Net realized and unrealized gains (losses) on investments | | | Distributions from net investment income | | | Distributions from net realized gains | | | Ending net asset value per share | |
Class A | | | | | | | | | | | | | | | | | | | | | | | | |
Year ended February 28, 2017 | | $ | 9.77 | | | | 0.13 | | | | 0.90 | | | | (0.15 | ) | | | (0.17 | ) | | $ | 10.48 | |
Year ended February 29, 2016 | | $ | 10.69 | | | | 0.14 | 4 | | | (0.73 | ) | | | (0.08 | ) | | | (0.25 | ) | | $ | 9.77 | |
Year ended February 28, 2015 | | $ | 10.56 | | | | 0.13 | | | | 0.33 | | | | (0.13 | ) | | | (0.20 | ) | | $ | 10.69 | |
Year ended February 28, 2014 | | $ | 9.95 | | | | 0.15 | | | | 0.92 | | | | (0.13 | ) | | | (0.33 | ) | | $ | 10.56 | |
Year ended February 28, 20135 | | $ | 9.83 | | | | 0.04 | | | | 0.33 | | | | (0.05 | ) | | | (0.20 | ) | | $ | 9.95 | |
Class R | | | | | | | | | | | | | | | | | | | | | | | | |
Year ended February 28, 2017 | | $ | 9.79 | | | | 0.12 | | | | 0.88 | | | | (0.13 | ) | | | (0.17 | ) | | $ | 10.49 | |
Year ended February 29, 2016 | | $ | 10.71 | | | | 0.13 | | | | (0.73 | ) | | | (0.07 | ) | | | (0.25 | ) | | $ | 9.79 | |
Year ended February 28, 2015 | | $ | 10.57 | | | | 0.11 | | | | 0.33 | | | | (0.10 | ) | | | (0.20 | ) | | $ | 10.71 | |
Year ended February 28, 20146 | | $ | 9.95 | | | | 0.07 | | | | 0.94 | | | | (0.06 | ) | | | (0.33 | ) | | $ | 10.57 | |
Class R4 | | | | | | | | | | | | | | | | | | | | | | | | |
Year ended February 28, 2017 | | $ | 9.80 | | | | 0.17 | | | | 0.90 | | | | (0.18 | ) | | | (0.17 | ) | | $ | 10.52 | |
Year ended February 29, 2016 | | $ | 10.72 | | | | 0.18 | | | | (0.73 | ) | | | (0.12 | ) | | | (0.25 | ) | | $ | 9.80 | |
Year ended February 28, 2015 | | $ | 10.58 | | | | 0.17 | | | | 0.33 | | | | (0.16 | ) | | | (0.20 | ) | | $ | 10.72 | |
Year ended February 28, 2014 | | $ | 9.97 | | | | 0.15 | | | | 0.95 | | | | (0.16 | ) | | | (0.33 | ) | | $ | 10.58 | |
Year ended February 28, 20135 | | $ | 9.83 | | | | 0.06 | | | | 0.33 | | | | (0.05 | ) | | | (0.20 | ) | | $ | 9.97 | |
Class R67 | | | | | | | | | | | | | | | | | | | | | | | | |
Year ended February 28, 2017 | | $ | 9.80 | | | | 0.20 | 4 | | | 0.87 | | | | (0.19 | ) | | | (0.17 | ) | | $ | 10.51 | |
Year ended February 29, 2016 | | $ | 10.71 | | | | 0.20 | | | | (0.73 | ) | | | (0.13 | ) | | | (0.25 | ) | | $ | 9.80 | |
Year ended February 28, 2015 | | $ | 10.57 | | | | 0.19 | | | | 0.33 | | | | (0.18 | ) | | | (0.20 | ) | | $ | 10.71 | |
Year ended February 28, 2014 | | $ | 9.96 | | | | 0.19 | | | | 0.92 | | | | (0.17 | ) | | | (0.33 | ) | | $ | 10.57 | |
Year ended February 28, 2013 | | $ | 9.71 | | | | 0.18 | | | | 0.45 | | | | (0.18 | ) | | | (0.20 | ) | | $ | 9.96 | |
Administrator Class | | | | | | | | | | | | | | | | | | | | | | | | |
Year ended February 28, 2017 | | $ | 9.82 | | | | 0.17 | 4 | | | 0.89 | | | | (0.16 | ) | | | (0.17 | ) | | $ | 10.55 | |
Year ended February 29, 2016 | | $ | 10.74 | | | | 0.16 | | | | (0.74 | ) | | | (0.09 | ) | | | (0.25 | ) | | $ | 9.82 | |
Year ended February 28, 2015 | | $ | 10.60 | | | | 0.15 | | | | 0.33 | | | | (0.14 | ) | | | (0.20 | ) | | $ | 10.74 | |
Year ended February 28, 2014 | | $ | 9.98 | | | | 0.15 | | | | 0.94 | | | | (0.14 | ) | | | (0.33 | ) | | $ | 10.60 | |
Year ended February 28, 2013 | | $ | 9.74 | | | | 0.14 | 4 | | | 0.45 | | | | (0.15 | ) | | | (0.20 | ) | | $ | 9.98 | |
| 1 | Ratios include net expenses allocated from the affiliated Master Portfolios which were as follows: |
| | | | | | | | | | | | | | | | | | | | |
| | | Year ended February 28, 2017 | | | Year ended February 29, 2016 | | | Year ended February 28 | |
| | | | | 2015 | | | 2014 | | | 2013 | |
| | | | |
Class A | | | 0.17 | % | | | 0.16 | % | | | 0.16 | % | | | 0.19 | % | | | 0.26 | %5 |
Class R | | | 0.17 | | | | 0.16 | | | | 0.16 | | | | 0.19 | 6 | | | N/A | |
Class R4 | | | 0.17 | | | | 0.16 | | | | 0.16 | | | | 0.19 | | | | 0.26 | 5 |
Class R67 | | | 0.16 | | | | 0.16 | | | | 0.16 | | | | 0.19 | | | | 0.26 | |
Administrator Class | | | 0.16 | | | | 0.16 | | | | 0.16 | | | | 0.19 | | | | 0.26 | |
| 2 | Total return calculations do not include any sales charges. Returns for periods of less than one year are not annualized. |
| 3 | Portfolio turnover rate is calculated by aggregating the results of multiplying the Fund’s investment percentage in the respective affiliated Master Portfolios by the corresponding affiliated Master Portfolio’s portfolio turnover rate. |
| 4 | Calculated based upon average shares outstanding |
| 5 | For the period from November 30, 2012 (commencement of class operations) to February 28, 2013 |
| 6 | For the period from June 28, 2013 (commencement of class operations) to February 28, 2014 |
| 7 | On June 1, 2013, Institutional Class was renamed Class R6. |
The accompanying notes are an integral part of these financial statements.
| | | | | | |
| Financial highlights | | Wells Fargo Dow Jones Target Date Funds | | | 69 | |
| | | | | | | | | | | | | | | | | | | | | | |
| Ratio to average net assets (annualized) | | | Total return2 | | | Portfolio turnover rate3 | | | Net assets at end of period (000s omitted) | |
Net investment income | | | Gross expenses1 | | | Net expenses1 | | | | |
| | | | | | | | | | | | | | | | | | | | | | |
| | 1.37 | % | | | 0.84 | % | | | 0.81 | % | | | 10.61 | % | | | 36 | % | | $ | 140,428 | |
| | 1.40 | % | | | 0.84 | % | | | 0.81 | % | | | (5.56 | )% | | | 32 | % | | $ | 175,373 | |
| | 1.25 | % | | | 0.96 | % | | | 0.86 | % | | | 4.46 | % | | | 31 | % | | $ | 3,193 | |
| | 1.28 | % | | | 0.97 | % | | | 0.86 | % | | | 10.99 | % | | | 32 | % | | $ | 1,379 | |
| | 1.01 | % | | | 1.06 | % | | | 0.86 | % | | | 3.92 | % | | | 28 | % | | $ | 159 | |
| | | | | | | | | | | | | | | | | | | | | | |
| | 1.12 | % | | | 1.10 | % | | | 1.06 | % | | | 10.22 | % | | | 36 | % | | $ | 610 | |
| | 1.20 | % | | | 1.13 | % | | | 1.08 | % | | | (5.72 | )% | | | 32 | % | | $ | 830 | |
| | 0.85 | % | | | 1.21 | % | | | 1.11 | % | | | 4.24 | % | | | 31 | % | | $ | 1,032 | |
| | 0.96 | % | | | 1.22 | % | | | 1.11 | % | | | 10.27 | % | | | 32 | % | | $ | 28 | |
| | | | | | | | | | | | | | | | | | | | | | |
| | 1.65 | % | | | 0.57 | % | | | 0.50 | % | | | 10.98 | % | | | 36 | % | | $ | 274,639 | |
| | 1.78 | % | | | 0.58 | % | | | 0.50 | % | | | (5.26 | )% | | | 32 | % | | $ | 279,663 | |
| | 1.65 | % | | | 0.63 | % | | | 0.50 | % | | | 4.87 | % | | | 31 | % | | $ | 379,384 | |
| | 1.60 | % | | | 0.63 | % | | | 0.50 | % | | | 11.29 | % | | | 32 | % | | $ | 354,137 | |
| | 1.51 | % | | | 0.73 | % | | | 0.50 | % | | | 4.13 | % | | | 28 | % | | $ | 4,210 | |
| | | | | | | | | | | | | | | | | | | | | | |
| | 1.92 | % | | | 0.41 | % | | | 0.35 | % | | | 11.04 | % | | | 36 | % | | $ | 372,101 | |
| | 1.92 | % | | | 0.43 | % | | | 0.35 | % | | | (5.02 | )% | | | 32 | % | | $ | 1,416,984 | |
| | 1.79 | % | | | 0.48 | % | | | 0.35 | % | | | 5.03 | % | | | 31 | % | | $ | 1,481,264 | |
| | 1.78 | % | | | 0.52 | % | | | 0.39 | % | | | 11.42 | % | | | 32 | % | | $ | 1,409,281 | |
| | 1.83 | % | | | 0.63 | % | | | 0.50 | % | | | 6.74 | % | | | 28 | % | | $ | 1,577,058 | |
| | | | | | | | | | | | | | | | | | | | | | |
| | 1.59 | % | | | 0.76 | % | | | 0.70 | % | | | 10.87 | % | | | 36 | % | | $ | 65,620 | |
| | 1.58 | % | | | 0.77 | % | | | 0.70 | % | | | (5.45 | )% | | | 32 | % | | $ | 298,492 | |
| | 1.45 | % | | | 0.80 | % | | | 0.70 | % | | | 4.65 | % | | | 31 | % | | $ | 350,823 | |
| | 1.43 | % | | | 0.82 | % | | | 0.74 | % | | | 11.11 | % | | | 32 | % | | $ | 354,050 | |
| | 1.42 | % | | | 0.90 | % | | | 0.85 | % | | | 6.27 | % | | | 28 | % | | $ | 271,593 | |
The accompanying notes are an integral part of these financial statements.
| | | | |
| 70 | | Wells Fargo Dow Jones Target Date Funds | | Financial highlights |
| | | | | | | | | | | | | | | | | | | | | | | | |
| Target 2030 Fund | | Beginning net asset value per share | | | Net investment income | | | Net realized and unrealized gains (losses) on investments | | | Distributions from net investment income | | | Distributions from net realized gains | | | Ending net asset value per share | |
Class A | | | | | | | | | | | | | | | | | | | | | | | | |
Year ended February 28, 2017 | | $ | 15.17 | | | | 0.23 | | | | 1.90 | | | | (0.31 | ) | | | (0.29 | ) | | $ | 16.70 | |
Year ended February 29, 2016 | | $ | 16.97 | | | | 0.21 | 4 | | | (1.44 | ) | | | (0.14 | ) | | | (0.43 | ) | | $ | 15.17 | |
Year ended February 28, 2015 | | $ | 16.61 | | | | 0.22 | | | | 0.67 | | | | (0.19 | ) | | | (0.34 | ) | | $ | 16.97 | |
Year ended February 28, 2014 | | $ | 15.31 | | | | 0.20 | | | | 1.83 | | | | (0.19 | ) | | | (0.54 | ) | | $ | 16.61 | |
Year ended February 28, 2013 | | $ | 14.74 | | | | 0.20 | | | | 0.85 | | | | (0.20 | ) | | | (0.28 | ) | | $ | 15.31 | |
Class C | | | | | | | | | | | | | | | | | | | | | | | | |
Year ended February 28, 2017 | | $ | 14.79 | | | | 0.07 | | | | 1.88 | | | | (0.21 | ) | | | (0.29 | ) | | $ | 16.24 | |
Year ended February 29, 2016 | | $ | 16.58 | | | | 0.10 | | | | (1.41 | ) | | | (0.05 | ) | | | (0.43 | ) | | $ | 14.79 | |
Year ended February 28, 2015 | | $ | 16.25 | | | | 0.08 | | | | 0.67 | | | | (0.08 | ) | | | (0.34 | ) | | $ | 16.58 | |
Year ended February 28, 2014 | | $ | 15.00 | | | | 0.08 | | | | 1.79 | | | | (0.08 | ) | | | (0.54 | ) | | $ | 16.25 | |
Year ended February 28, 2013 | | $ | 14.45 | | | | 0.08 | | | | 0.85 | | | | (0.10 | ) | | | (0.28 | ) | | $ | 15.00 | |
Class R | | | | | | | | | | | | | | | | | | | | | | | | |
Year ended February 28, 2017 | | $ | 15.14 | | | | 0.18 | | | | 1.90 | | | | (0.27 | ) | | | (0.29 | ) | | $ | 16.66 | |
Year ended February 29, 2016 | | $ | 16.95 | | | | 0.18 | | | | (1.44 | ) | | | (0.12 | ) | | | (0.43 | ) | | $ | 15.14 | |
Year ended February 28, 2015 | | $ | 16.61 | | | | 0.13 | 4 | | | 0.71 | | | | (0.16 | ) | | | (0.34 | ) | | $ | 16.95 | |
Year ended February 28, 20145 | | $ | 15.39 | | | | 0.10 | | | | 1.75 | | | | (0.09 | ) | | | (0.54 | ) | | $ | 16.61 | |
Class R4 | | | | | | | | | | | | | | | | | | | | | | | | |
Year ended February 28, 2017 | | $ | 15.38 | | | | 0.27 | | | | 1.94 | | | | (0.35 | ) | | | (0.29 | ) | | $ | 16.95 | |
Year ended February 29, 2016 | | $ | 17.20 | | | | 0.28 | | | | (1.47 | ) | | | (0.20 | ) | | | (0.43 | ) | | $ | 15.38 | |
Year ended February 28, 2015 | | $ | 16.83 | | | | 0.26 | | | | 0.70 | | | | (0.25 | ) | | | (0.34 | ) | | $ | 17.20 | |
Year ended February 28, 2014 | | $ | 15.50 | | | | 0.23 | | | | 1.89 | | | | (0.25 | ) | | | (0.54 | ) | | $ | 16.83 | |
Year ended February 28, 20136 | | $ | 15.07 | | | | 0.08 | | | | 0.71 | | | | (0.08 | ) | | | (0.28 | ) | | $ | 15.50 | |
Class R67 | | | | | | | | | | | | | | | | | | | | | | | | |
Year ended February 28, 2017 | | $ | 15.37 | | | | 0.31 | 4 | | | 1.92 | | | | (0.38 | ) | | | (0.29 | ) | | $ | 16.93 | |
Year ended February 29, 2016 | | $ | 17.19 | | | | 0.30 | | | | (1.46 | ) | | | (0.23 | ) | | | (0.43 | ) | | $ | 15.37 | |
Year ended February 28, 2015 | | $ | 16.81 | | | | 0.28 | | | | 0.72 | | | | (0.28 | ) | | | (0.34 | ) | | $ | 17.19 | |
Year ended February 28, 2014 | | $ | 15.49 | | | | 0.29 | 4 | | | 1.84 | | | | (0.27 | ) | | | (0.54 | ) | | $ | 16.81 | |
Year ended February 28, 2013 | | $ | 14.91 | | | | 0.27 | | | | 0.86 | | | | (0.27 | ) | | | (0.28 | ) | | $ | 15.49 | |
Administrator Class | | | | | | | | | | | | | | | | | | | | | | | | |
Year ended February 28, 2017 | | $ | 15.37 | | | | 0.25 | 4 | | | 1.93 | | | | (0.32 | ) | | | (0.29 | ) | | $ | 16.94 | |
Year ended February 29, 2016 | | $ | 17.19 | | | | 0.25 | | | | (1.47 | ) | | | (0.17 | ) | | | (0.43 | ) | | $ | 15.37 | |
Year ended February 28, 2015 | | $ | 16.82 | | | | 0.23 | | | | 0.70 | | | | (0.22 | ) | | | (0.34 | ) | | $ | 17.19 | |
Year ended February 28, 2014 | | $ | 15.49 | | | | 0.23 | | | | 1.86 | | | | (0.22 | ) | | | (0.54 | ) | | $ | 16.82 | |
Year ended February 28, 2013 | | $ | 14.91 | | | | 0.21 | | | | 0.88 | | | | (0.23 | ) | | | (0.28 | ) | | $ | 15.49 | |
| 1 | Ratios include net expenses allocated from the affiliated Master Portfolios which were as follows: |
| | | | | | | | | | | | | | | | | | | | |
| | | Year ended February 28, 2017 | | | Year ended February 29, 2016 | | | Year ended February 28 | |
| | | | | 2015 | | | 2014 | | | 2013 | |
| | | | |
Class A | | | 0.17 | % | | | 0.16 | % | | | 0.16 | % | | | 0.19 | % | | | 0.27 | % |
Class C | | | 0.17 | | | | 0.16 | | | | 0.16 | | | | 0.19 | | | | 0.27 | |
Class R | | | 0.17 | | | | 0.16 | | | | 0.16 | | | | 0.19 | 5 | | | N/A | |
Class R4 | | | 0.17 | | | | 0.16 | | | | 0.16 | | | | 0.19 | | | | 0.27 | 6 |
Class R67 | | | 0.16 | | | | 0.16 | | | | 0.16 | | | | 0.19 | | | | 0.27 | |
Administrator Class | | | 0.17 | | | | 0.16 | | | | 0.16 | | | | 0.19 | | | | 0.27 | |
| 2 | Total return calculations do not include any sales charges. Returns for periods of less than one year are not annualized. |
| 3 | Portfolio turnover rate is calculated by aggregating the results of multiplying the Fund’s investment percentage in the respective affiliated Master Portfolios by the corresponding affiliated Master Portfolio’s portfolio turnover rate. |
| 4 | Calculated based upon average shares outstanding |
| 5 | For the period from June 28, 2013 (commencement of class operations) to February 28, 2014 |
| 6 | For the period from November 30, 2012 (commencement of class operations) to February 28, 2013 |
| 7 | On June 1, 2013, Institutional Class was renamed Class R6. |
The accompanying notes are an integral part of these financial statements.
| | | | | | |
| Financial highlights | | Wells Fargo Dow Jones Target Date Funds | | | 71 | |
| | | | | | | | | | | | | | | | | | | | | | |
| Ratio to average net assets (annualized) | | | Total
return2 | | | Portfolio
turnover
rate3 | | | Net assets at end of period (000s omitted) | |
Net investment income | | | Gross expenses1 | | | Net expenses1 | | | | |
| | | | | | | | | | | | | | | | | | | | | | |
| | 1.32 | % | | | 0.84 | % | | | 0.82 | % | | | 14.15 | % | | | 31 | % | | $ | 230,044 | |
| | 1.32 | % | | | 0.86 | % | | | 0.83 | % | | | (7.37 | )% | | | 30 | % | | $ | 227,928 | |
| | 1.22 | % | | | 0.95 | % | | | 0.87 | % | | | 5.44 | % | | | 26 | % | | $ | 60,747 | |
| | 1.22 | % | | | 0.98 | % | | | 0.91 | % | | | 13.52 | % | | | 29 | % | | $ | 65,634 | |
| | 1.29 | % | | | 1.06 | % | | | 1.02 | % | | | 7.28 | % | | | 25 | % | | $ | 60,857 | |
| | | | | | | | | | | | | | | | | | | | | | |
| | 0.57 | % | | | 1.59 | % | | | 1.57 | % | | | 13.28 | % | | | 31 | % | | $ | 4,630 | |
| | 0.63 | % | | | 1.63 | % | | | 1.59 | % | | | (8.05 | )% | | | 30 | % | | $ | 4,662 | |
| | 0.45 | % | | | 1.70 | % | | | 1.62 | % | | | 4.67 | % | | | 26 | % | | $ | 5,020 | |
| | 0.47 | % | | | 1.73 | % | | | 1.66 | % | | | 12.64 | % | | | 29 | % | | $ | 4,097 | |
| | 0.53 | % | | | 1.82 | % | | | 1.77 | % | | | 6.52 | % | | | 25 | % | | $ | 3,465 | |
| | | | | | | | | | | | | | | | | | | | | | |
| | 1.06 | % | | | 1.10 | % | | | 1.07 | % | | | 13.88 | % | | | 31 | % | | $ | 904 | |
| | 1.11 | % | | | 1.12 | % | | | 1.08 | % | | | (7.57 | )% | | | 30 | % | | $ | 853 | |
| | 0.72 | % | | | 1.22 | % | | | 1.12 | % | | | 5.15 | % | | | 26 | % | | $ | 603 | |
| | 0.87 | % | | | 1.22 | % | | | 1.12 | % | | | 12.19 | % | | | 29 | % | | $ | 28 | |
| | | | | | | | | | | | | | | | | | | | | | |
| | 1.64 | % | | | 0.56 | % | | | 0.51 | % | | | 14.52 | % | | | 31 | % | | $ | 507,587 | |
| | 1.73 | % | | | 0.58 | % | | | 0.51 | % | | | (7.07 | )% | | | 30 | % | | $ | 513,864 | |
| | 1.57 | % | | | 0.62 | % | | | 0.51 | % | | | 5.82 | % | | | 26 | % | | $ | 897,425 | |
| | 1.53 | % | | | 0.63 | % | | | 0.51 | % | | | 13.99 | % | | | 29 | % | | $ | 850,913 | |
| | 1.35 | % | | | 0.73 | % | | | 0.51 | % | | | 5.34 | % | | | 25 | % | | $ | 19,568 | |
| | | | | | | | | | | | | | | | | | | | | | |
| | 1.87 | % | | | 0.41 | % | | | 0.36 | % | | | 14.63 | % | | | 31 | % | | $ | 618,551 | |
| | 1.85 | % | | | 0.43 | % | | | 0.36 | % | | | (6.93 | )% | | | 30 | % | | $ | 1,284,324 | |
| | 1.72 | % | | | 0.47 | % | | | 0.36 | % | | | 6.04 | % | | | 26 | % | | $ | 1,185,077 | |
| | 1.76 | % | | | 0.53 | % | | | 0.41 | % | | | 14.08 | % | | | 29 | % | | $ | 1,049,122 | |
| | 1.80 | % | | | 0.64 | % | | | 0.51 | % | | | 7.82 | % | | | 25 | % | | $ | 1,478,163 | |
| | | | | | | | | | | | | | | | | | | | | | |
| | 1.51 | % | | | 0.76 | % | | | 0.71 | % | | | 14.32 | % | | | 31 | % | | $ | 262,336 | |
| | 1.52 | % | | | 0.77 | % | | | 0.71 | % | | | (7.27 | )% | | | 30 | % | | $ | 498,554 | |
| | 1.38 | % | | | 0.79 | % | | | 0.71 | % | | | 5.61 | % | | | 26 | % | | $ | 643,336 | |
| | 1.38 | % | | | 0.82 | % | | | 0.75 | % | | | 13.74 | % | | | 29 | % | | $ | 685,421 | |
| | 1.43 | % | | | 0.91 | % | | | 0.86 | % | | | 7.46 | % | | | 25 | % | | $ | 572,735 | |
The accompanying notes are an integral part of these financial statements.
| | | | |
| 72 | | Wells Fargo Dow Jones Target Date Funds | | Financial highlights |
| | | | | | | | | | | | | | | | | | | | | | | | |
| Target 2035 Fund | | Beginning net asset value per share | | | Net investment income | | | Net realized and unrealized gains (losses) on investments | | | Distributions from net investment income | | | Distributions from net realized gains | | | Ending net asset value per share | |
Class A | | | | | | | | | | | | | | | | | | | | | | | | |
Year ended February 28, 2017 | | $ | 9.89 | | | | 0.13 | | | | 1.56 | | | | (0.15 | ) | | | (0.18 | ) | | $ | 11.25 | |
Year ended February 29, 2016 | | $ | 11.32 | | | | 0.15 | | | | (1.18 | ) | | | (0.11 | ) | | | (0.29 | ) | | $ | 9.89 | |
Year ended February 28, 2015 | | $ | 11.02 | | | | 0.12 | | | | 0.56 | | | | (0.13 | ) | | | (0.25 | ) | | $ | 11.32 | |
Year ended February 28, 2014 | | $ | 9.99 | | | | 0.14 | | | | 1.41 | | | | (0.13 | ) | | | (0.39 | ) | | $ | 11.02 | |
Year ended February 28, 20134 | | $ | 9.60 | | | | 0.02 | 5 | | | 0.58 | | | | (0.05 | ) | | | (0.16 | ) | | $ | 9.99 | |
Class R | | | | | | | | | | | | | | | | | | | | | | | | |
Year ended February 28, 2017 | | $ | 9.95 | | | | 0.11 | | | | 1.57 | | | | (0.13 | ) | | | (0.18 | ) | | $ | 11.32 | |
Year ended February 29, 2016 | | $ | 11.39 | | | | 0.11 | | | | (1.17 | ) | | | (0.09 | ) | | | (0.29 | ) | | $ | 9.95 | |
Year ended February 28, 2015 | | $ | 11.09 | | | | 0.10 | | | | 0.55 | | | | (0.10 | ) | | | (0.25 | ) | | $ | 11.39 | |
Year ended February 28, 20146 | | $ | 10.16 | | | | 0.06 | 5 | | | 1.32 | | | | (0.06 | ) | | | (0.39 | ) | | $ | 11.09 | |
Class R4 | | | | | | | | | | | | | | | | | | | | | | | | |
Year ended February 28, 2017 | | $ | 9.91 | | | | 0.17 | 5 | | | 1.56 | | | | (0.19 | ) | | | (0.18 | ) | | $ | 11.27 | |
Year ended February 29, 2016 | | $ | 11.33 | | | | 0.18 | | | | (1.17 | ) | | | (0.14 | ) | | | (0.29 | ) | | $ | 9.91 | |
Year ended February 28, 2015 | | $ | 11.03 | | | | 0.17 | | | | 0.54 | | | | (0.16 | ) | | | (0.25 | ) | | $ | 11.33 | |
Year ended February 28, 2014 | | $ | 9.99 | | | | 0.15 | | | | 1.44 | | | | (0.16 | ) | | | (0.39 | ) | | $ | 11.03 | |
Year ended February 28, 20134 | | $ | 9.60 | | | | 0.03 | 5 | | | 0.57 | | | | (0.05 | ) | | | (0.16 | ) | | $ | 9.99 | |
Class R67 | | | | | | | | | | | | | | | | | | | | | | | | |
Year ended February 28, 2017 | | $ | 9.91 | | | | 0.20 | 5 | | | 1.55 | | | | (0.21 | ) | | | (0.18 | ) | | $ | 11.27 | |
Year ended February 29, 2016 | | $ | 11.33 | | | | 0.19 | | | | (1.16 | ) | | | (0.16 | ) | | | (0.29 | ) | | $ | 9.91 | |
Year ended February 28, 2015 | | $ | 11.03 | | | | 0.18 | | | | 0.55 | | | | (0.18 | ) | | | (0.25 | ) | | $ | 11.33 | |
Year ended February 28, 2014 | | $ | 9.99 | | | | 0.19 | | | | 1.41 | | | | (0.17 | ) | | | (0.39 | ) | | $ | 11.03 | |
Year ended February 28, 2013 | | $ | 9.50 | | | | 0.17 | | | | 0.65 | | | | (0.17 | ) | | | (0.16 | ) | | $ | 9.99 | |
Administrator Class | | | | | | | | | | | | | | | | | | | | | | | | |
Year ended February 28, 2017 | | $ | 9.94 | | | | 0.16 | 5 | | | 1.55 | | | | (0.17 | ) | | | (0.18 | ) | | $ | 11.30 | |
Year ended February 29, 2016 | | $ | 11.37 | | | | 0.16 | | | | (1.18 | ) | | | (0.12 | ) | | | (0.29 | ) | | $ | 9.94 | |
Year ended February 28, 2015 | | $ | 11.06 | | | | 0.15 | | | | 0.55 | | | | (0.14 | ) | | | (0.25 | ) | | $ | 11.37 | |
Year ended February 28, 2014 | | $ | 10.02 | | | | 0.14 | | | | 1.43 | | | | (0.14 | ) | | | (0.39 | ) | | $ | 11.06 | |
Year ended February 28, 2013 | | $ | 9.53 | | | | 0.13 | | | | 0.66 | | | | (0.14 | ) | | | (0.16 | ) | | $ | 10.02 | |
| 1 | Ratios include net expenses allocated from the affiliated Master Portfolios which were as follows: |
| | | | | | | | | | | | | | | | | | | | |
| | | Year ended February 28, 2017 | | | Year ended February 29, 2016 | | | Year ended February 28 | |
| | | | | 2015 | | | 2014 | | | 2013 | |
| | | | |
Class A | | | 0.17 | % | | | 0.17 | % | | | 0.16 | % | | | 0.19 | % | | | 0.27 | %4 |
Class R | | | 0.17 | | | | 0.17 | | | | 0.16 | | | | 0.19 | 6 | | | N/A | |
Class R4 | | | 0.17 | | | | 0.16 | | | | 0.16 | | | | 0.19 | | | | 0.27 | 4 |
Class R67 | | | 0.16 | | | | 0.16 | | | | 0.16 | | | | 0.19 | | | | 0.27 | |
Administrator Class | | | 0.16 | | | | 0.16 | | | | 0.16 | | | | 0.19 | | | | 0.27 | |
| 2 | Total return calculations do not include any sales charges. Returns for periods of less than one year are not annualized. |
| 3 | Portfolio turnover rate is calculated by aggregating the results of multiplying the Fund’s investment percentage in the respective affiliated Master Portfolios by the corresponding affiliated Master Portfolio’s portfolio turnover rate. |
| 4 | For the period from November 30, 2012 (commencement of class operations) to February 28, 2013 |
| 5 | Calculated based upon average shares outstanding |
| 6 | For the period from June 28, 2013 (commencement of class operations) to February 28, 2014 |
| 7 | On June 1, 2013, Institutional Class was renamed Class R6. |
The accompanying notes are an integral part of these financial statements.
| | | | | | |
| Financial highlights | | Wells Fargo Dow Jones Target Date Funds | | | 73 | |
| | | | | | | | | | | | | | | | | | | | | | |
| Ratio to average net assets (annualized) | | | Total return2 | | | Portfolio turnover
rate3 | | | Net assets at end of period (000s omitted) | |
Net investment income | | | Gross expenses1 | | | Net expenses1 | | | | |
| | | | | | | | | | | | | | | | | | | | | | |
| | 1.28 | % | | | 0.85 | % | | | 0.83 | % | | | 17.33 | % | | | 27 | % | | $ | 127,294 | |
| | 1.19 | % | | | 0.84 | % | | | 0.83 | % | | | (9.28 | )% | | | 28 | % | | $ | 142,817 | |
| | 1.05 | % | | | 0.97 | % | | | 0.88 | % | | | 6.33 | % | | | 22 | % | | $ | 1,677 | |
| | 1.11 | % | | | 0.98 | % | | | 0.88 | % | | | 15.82 | % | | | 26 | % | | $ | 532 | |
| | 1.04 | % | | | 1.07 | % | | | 0.88 | % | | | 6.36 | % | | | 22 | % | | $ | 41 | |
| | | | | | | | | | | | | | | | | | | | | | |
| | 0.89 | % | | | 1.11 | % | | | 1.08 | % | | | 17.09 | % | | | 27 | % | | $ | 171 | |
| | 1.02 | % | | | 1.13 | % | | | 1.09 | % | | | (9.48 | )% | | | 28 | % | | $ | 73 | |
| | 0.90 | % | | | 1.23 | % | | | 1.13 | % | | | 5.97 | % | | | 22 | % | | $ | 36 | |
| | 0.79 | % | | | 1.26 | % | | | 1.13 | % | | | 13.76 | % | | | 26 | % | | $ | 28 | |
| | | | | | | | | | | | | | | | | | | | | | |
| | 1.54 | % | | | 0.57 | % | | | 0.52 | % | | | 17.68 | % | | | 27 | % | | $ | 240,025 | |
| | 1.66 | % | | | 0.59 | % | | | 0.52 | % | | | (8.92 | )% | | | 28 | % | | $ | 228,810 | |
| | 1.51 | % | | | 0.64 | % | | | 0.52 | % | | | 6.63 | % | | | 22 | % | | $ | 329,135 | |
| | 1.45 | % | | | 0.65 | % | | | 0.52 | % | | | 16.28 | % | | | 26 | % | | $ | 297,612 | |
| | 1.30 | % | | | 0.75 | % | | | 0.52 | % | | | 6.38 | % | | | 22 | % | | $ | 1,940 | |
| | | | | | | | | | | | | | | | | | | | | | |
| | 1.83 | % | | | 0.42 | % | | | 0.37 | % | | | 17.86 | % | | | 27 | % | | $ | 317,594 | |
| | 1.80 | % | | | 0.44 | % | | | 0.37 | % | | | (8.78 | )% | | | 28 | % | | $ | 714,884 | |
| | 1.65 | % | | | 0.49 | % | | | 0.37 | % | | | 6.79 | % | | | 22 | % | | $ | 674,926 | |
| | 1.71 | % | | | 0.55 | % | | | 0.41 | % | | | 16.41 | % | | | 26 | % | | $ | 570,482 | |
| | 1.76 | % | | | 0.66 | % | | | 0.52 | % | | | 8.86 | % | | | 22 | % | | $ | 648,345 | |
| | | | | | | | | | | | | | | | | | | | | | |
| | 1.52 | % | | | 0.77 | % | | | 0.72 | % | | | 17.38 | % | | | 27 | % | | $ | 50,898 | |
| | 1.46 | % | | | 0.78 | % | | | 0.72 | % | | | (9.17 | )% | | | 28 | % | | $ | 182,599 | |
| | 1.31 | % | | | 0.81 | % | | | 0.72 | % | | | 6.50 | % | | | 22 | % | | $ | 227,265 | |
| | 1.33 | % | | | 0.85 | % | | | 0.75 | % | | | 15.96 | % | | | 26 | % | | $ | 236,217 | |
| | 1.36 | % | | | 0.93 | % | | | 0.87 | % | | | 8.48 | % | | | 22 | % | | $ | 172,860 | |
The accompanying notes are an integral part of these financial statements.
| | | | |
| 74 | | Wells Fargo Dow Jones Target Date Funds | | Financial highlights |
| | | | | | | | | | | | | | | | | | | | | | | | |
| Target 2040 Fund | | Beginning net asset value per share | | | Net investment income | | | Net realized and unrealized gains (losses) on investments | | | Distributions from net investment income | | | Distributions from net realized gains | | | Ending net asset value per share | |
Class A | | | | | | | | | | | | | | | | | | | | | | | | |
Year ended February 28, 2017 | | $ | 16.74 | | | | 0.23 | | | | 3.08 | | | | (0.27 | ) | | | (0.35 | ) | | $ | 19.43 | |
Year ended February 29, 2016 | | $ | 19.53 | | | | 0.22 | 4 | | | (2.27 | ) | | | (0.20 | ) | | | (0.54 | ) | | $ | 16.74 | |
Year ended February 28, 2015 | | $ | 18.90 | | | | 0.22 | | | | 1.08 | | | | (0.21 | ) | | | (0.46 | ) | | $ | 19.53 | |
Year ended February 28, 2014 | | $ | 16.92 | | | | 0.21 | | | | 2.71 | | | | (0.21 | ) | | | (0.73 | ) | | $ | 18.90 | |
Year ended February 28, 2013 | | $ | 16.07 | | | | 0.21 | | | | 1.19 | | | | (0.21 | ) | | | (0.34 | ) | | $ | 16.92 | |
Class C | | | | | | | | | | | | | | | | | | | | | | | | |
Year ended February 28, 2017 | | $ | 15.71 | | | | 0.04 | | | | 2.94 | | | | (0.15 | ) | | | (0.35 | ) | | $ | 18.19 | |
Year ended February 29, 2016 | | $ | 18.38 | | | | 0.09 | 4 | | | (2.15 | ) | | | (0.07 | ) | | | (0.54 | ) | | $ | 15.71 | |
Year ended February 28, 2015 | | $ | 17.85 | | | | 0.06 | 4 | | | 1.02 | | | | (0.09 | ) | | | (0.46 | ) | | $ | 18.38 | |
Year ended February 28, 2014 | | $ | 16.03 | | | | 0.07 | 4 | | | 2.57 | | | | (0.09 | ) | | | (0.73 | ) | | $ | 17.85 | |
Year ended February 28, 2013 | | $ | 15.26 | | | | 0.09 | 4 | | | 1.12 | | | | (0.10 | ) | | | (0.34 | ) | | $ | 16.03 | |
Class R | | | | | | | | | | | | | | | | | | | | | | | | |
Year ended February 28, 2017 | | $ | 16.69 | | | | 0.18 | | | | 3.07 | | | | (0.23 | ) | | | (0.35 | ) | | $ | 19.36 | |
Year ended February 29, 2016 | | $ | 19.51 | | | | 0.18 | | | | (2.28 | ) | | | (0.18 | ) | | | (0.54 | ) | | $ | 16.69 | |
Year ended February 28, 2015 | | $ | 18.90 | | | | 0.14 | 4 | | | 1.11 | | | | (0.18 | ) | | | (0.46 | ) | | $ | 19.51 | |
Year ended February 28, 20145 | | $ | 17.19 | | | | 0.09 | 4 | | | 2.45 | | | | (0.10 | ) | | | (0.73 | ) | | $ | 18.90 | |
Class R4 | | | | | | | | | | | | | | | | | | | | | | | | |
Year ended February 28, 2017 | | $ | 17.09 | | | | 0.27 | | | | 3.18 | | | | (0.33 | ) | | | (0.35 | ) | | $ | 19.86 | |
Year ended February 29, 2016 | | $ | 19.93 | | | | 0.28 | | | | (2.32 | ) | | | (0.26 | ) | | | (0.54 | ) | | $ | 17.09 | |
Year ended February 28, 2015 | | $ | 19.28 | | | | 0.29 | | | | 1.10 | | | | (0.28 | ) | | | (0.46 | ) | | $ | 19.93 | |
Year ended February 28, 2014 | | $ | 17.24 | | | | 0.27 | 4 | | | 2.78 | | | | (0.28 | ) | | | (0.73 | ) | | $ | 19.28 | |
Year ended February 28, 20136 | | $ | 16.52 | | | | 0.09 | | | | 1.06 | | | | (0.09 | ) | | | (0.34 | ) | | $ | 17.24 | |
Class R67 | | | | | | | | | | | | | | | | | | | | | | | | |
Year ended February 28, 2017 | | $ | 17.09 | | | | 0.41 | | | | 3.06 | | | | (0.36 | ) | | | (0.35 | ) | | $ | 19.85 | |
Year ended February 29, 2016 | | $ | 19.93 | | | | 0.32 | | | | (2.33 | ) | | | (0.29 | ) | | | (0.54 | ) | | $ | 17.09 | |
Year ended February 28, 2015 | | $ | 19.27 | | | | 0.30 | | | | 1.13 | | | | (0.31 | ) | | | (0.46 | ) | | $ | 19.93 | |
Year ended February 28, 2014 | | $ | 17.24 | | | | 0.31 | 4 | | | 2.75 | | | | (0.30 | ) | | | (0.73 | ) | | $ | 19.27 | |
Year ended February 28, 2013 | | $ | 16.37 | | | | 0.29 | | | | 1.21 | | | | (0.29 | ) | | | (0.34 | ) | | $ | 17.24 | |
Administrator Class | | | | | | | | | | | | | | | | | | | | | | | | |
Year ended February 28, 2017 | | $ | 17.07 | | | | 0.25 | | | | 3.14 | | | | (0.29 | ) | | | (0.35 | ) | | $ | 19.82 | |
Year ended February 29, 2016 | | $ | 19.89 | | | | 0.27 | | | | (2.33 | ) | | | (0.22 | ) | | | (0.54 | ) | | $ | 17.07 | |
Year ended February 28, 2015 | | $ | 19.25 | | | | 0.25 | | | | 1.09 | | | | (0.24 | ) | | | (0.46 | ) | | $ | 19.89 | |
Year ended February 28, 2014 | | $ | 17.21 | | | | 0.24 | | | | 2.77 | | | | (0.24 | ) | | | (0.73 | ) | | $ | 19.25 | |
Year ended February 28, 2013 | | $ | 16.34 | | | | 0.22 | | | | 1.22 | | | | (0.23 | ) | | | (0.34 | ) | | $ | 17.21 | |
| 1 | Ratios include net expenses allocated from the affiliated Master Portfolios which were as follows: |
| | | | | | | | | | | | | | | | | | | | |
| | | Year ended February 28, 2017 | | | Year ended February 29, 2016 | | | Year ended February 28 | |
| | | | | 2015 | | | 2014 | | | 2013 | |
| | | | |
Class A | | | 0.17 | % | | | 0.16 | % | | | 0.16 | % | | | 0.19 | % | | | 0.27 | % |
Class C | | | 0.17 | | | | 0.16 | | | | 0.16 | | | | 0.19 | | | | 0.27 | |
Class R | | | 0.17 | | | | 0.17 | | | | 0.16 | | | | 0.19 | 6 | | | N/A | |
Class R4 | | | 0.17 | | | | 0.16 | | | | 0.16 | | | | 0.19 | | | | 0.27 | 6 |
Class R67 | | | 0.16 | | | | 0.16 | | | | 0.16 | | | | 0.19 | | | | 0.27 | |
Administrator Class | | | 0.17 | | | | 0.16 | | | | 0.16 | | | | 0.19 | | | | 0.27 | |
| 2 | Total return calculations do not include any sales charges. Returns for periods of less than one year are not annualized. |
| 3 | Portfolio turnover rate is calculated by aggregating the results of multiplying the Fund’s investment percentage in the respective affiliated Master Portfolios by the corresponding affiliated Master Portfolio’s portfolio turnover rate. |
| 4 | Calculated based upon average shares outstanding |
| 5 | For the period from June 28, 2013 (commencement of class operations) to February 28, 2014 |
| 6 | For the period from November 30, 2012 (commencement of class operations) to February 28, 2013 |
| 7 | On June 1, 2013, Institutional Class was renamed Class R6. |
The accompanying notes are an integral part of these financial statements.
| | | | | | |
| Financial highlights | | Wells Fargo Dow Jones Target Date Funds | | | 75 | |
| | | | | | | | | | | | | | | | | | | | | | |
| Ratio to average net assets (annualized) | | | Total return2 | | | Portfolio turnover rate3 | | | Net assets at end of period (000s omitted) | |
Net investment income | | | Gross expenses1 | | | Net expenses1 | | | | |
| | | | | | | | | | | | | | | | | | | | | | |
| | 1.21 | % | | | 0.85 | % | | | 0.83 | % | | | 20.01 | % | | | 24 | % | | $ | 218,689 | |
| | 1.23 | % | | | 0.87 | % | | | 0.84 | % | | | (10.72 | )% | | | 27 | % | | $ | 202,038 | |
| | 1.11 | % | | | 0.96 | % | | | 0.88 | % | | | 7.01 | % | | | 18 | % | | $ | 111,874 | |
| | 1.15 | % | | | 0.99 | % | | | 0.92 | % | | | 17.54 | % | | | 25 | % | | $ | 114,233 | |
| | 1.25 | % | | | 1.08 | % | | | 1.03 | % | | | 8.99 | % | | | 20 | % | | $ | 104,836 | |
| | | | | | | | | | | | | | | | | | | | | | |
| | 0.47 | % | | | 1.60 | % | | | 1.58 | % | | | 19.11 | % | | | 24 | % | | $ | 4,782 | |
| | 0.54 | % | | | 1.63 | % | | | 1.60 | % | | | (11.39 | )% | | | 27 | % | | $ | 4,621 | |
| | 0.35 | % | | | 1.71 | % | | | 1.63 | % | | | 6.15 | % | | | 18 | % | | $ | 5,747 | |
| | 0.40 | % | | | 1.74 | % | | | 1.67 | % | | | 16.68 | % | | | 25 | % | | $ | 4,813 | |
| | 0.50 | % | | | 1.83 | % | | | 1.78 | % | | | 8.18 | % | | | 20 | % | | $ | 4,040 | |
| | | | | | | | | | | | | | | | | | | | | | |
| | 0.94 | % | | | 1.10 | % | | | 1.08 | % | | | 19.68 | % | | | 24 | % | | $ | 394 | |
| | 0.97 | % | | | 1.12 | % | | | 1.09 | % | | | (10.96 | )% | | | 27 | % | | $ | 289 | |
| | 0.72 | % | | | 1.23 | % | | | 1.13 | % | | | 6.71 | % | | | 18 | % | | $ | 137 | |
| | 0.75 | % | | | 1.24 | % | | | 1.13 | % | | | 14.96 | % | | | 25 | % | | $ | 29 | |
| | | | | | | | | | | | | | | | | | | | | | |
| | 1.54 | % | | | 0.57 | % | | | 0.52 | % | | | 20.43 | % | | | 24 | % | | $ | 388,622 | |
| | 1.64 | % | | | 0.59 | % | | | 0.52 | % | | | (10.45 | )% | | | 27 | % | | $ | 385,259 | |
| | 1.47 | % | | | 0.63 | % | | | 0.52 | % | | | 7.35 | % | | | 18 | % | | $ | 678,944 | |
| | 1.42 | % | | | 0.64 | % | | | 0.52 | % | | | 18.02 | % | | | 25 | % | | $ | 635,241 | |
| | 1.12 | % | | | 0.75 | % | | | 0.52 | % | | | 7.13 | % | | | 20 | % | | $ | 13,651 | |
| | | | | | | | | | | | | | | | | | | | | | |
| | 1.80 | % | | | 0.41 | % | | | 0.37 | % | | | 20.56 | % | | | 24 | % | | $ | 489,693 | |
| | 1.75 | % | | | 0.43 | % | | | 0.37 | % | | | (10.32 | )% | | | 27 | % | | $ | 929,672 | |
| | 1.61 | % | | | 0.48 | % | | | 0.37 | % | | | 7.57 | % | | | 18 | % | | $ | 872,914 | |
| | 1.70 | % | | | 0.54 | % | | | 0.42 | % | | | 18.14 | % | | | 25 | % | | $ | 724,856 | |
| | 1.76 | % | | | 0.65 | % | | | 0.52 | % | | | 9.50 | % | | | 20 | % | | $ | 993,528 | |
| | | | | | | | | | | | | | | | | | | | | | |
| | 1.43 | % | | | 0.76 | % | | | 0.72 | % | | | 20.09 | % | | | 24 | % | | $ | 197,272 | |
| | 1.42 | % | | | 0.78 | % | | | 0.72 | % | | | (10.56 | )% | | | 27 | % | | $ | 320,415 | |
| | 1.27 | % | | | 0.80 | % | | | 0.72 | % | | | 7.10 | % | | | 18 | % | | $ | 427,789 | |
| | 1.30 | % | | | 0.83 | % | | | 0.76 | % | | | 17.79 | % | | | 25 | % | | $ | 452,487 | |
| | 1.39 | % | | | 0.92 | % | | | 0.87 | % | | | 9.14 | % | | | 20 | % | | $ | 360,567 | |
The accompanying notes are an integral part of these financial statements.
| | | | |
| 76 | | Wells Fargo Dow Jones Target Date Funds | | Financial highlights |
| | | | | | | | | | | | | | | | | | | | | | | | |
| Target 2045 Fund | | Beginning net asset value per share | | | Net investment income | | | Net realized and unrealized gains (losses) on investments | | | Distributions from net investment income | | | Distributions from net realized gains | | | Ending net asset value per share | |
Class A | | | | | | | | | | | | | | | | | | | | | | | | |
Year ended February 28, 2017 | | $ | 10.07 | | | | 0.13 | | | | 2.05 | | | | (0.17 | ) | | | (0.17 | ) | | $ | 11.91 | |
Year ended February 29, 2016 | | $ | 11.85 | | | | 0.16 | | | | (1.52 | ) | | | (0.13 | ) | | | (0.29 | ) | | $ | 10.07 | |
Year ended February 28, 2015 | | $ | 11.43 | | | | 0.11 | 4 | | | 0.72 | | | | (0.13 | ) | | | (0.28 | ) | | $ | 11.85 | |
Year ended February 28, 2014 | | $ | 10.17 | | | | 0.12 | 4 | | | 1.73 | | | | (0.14 | ) | | | (0.45 | ) | | $ | 11.43 | |
Year ended February 28, 20135 | | $ | 9.64 | | | | 0.03 | | | | 0.68 | | | | (0.05 | ) | | | (0.13 | ) | | $ | 10.17 | |
Class R | | | | | | | | | | | | | | | | | | | | | | | | |
Year ended February 28, 2017 | | $ | 10.19 | | | | 0.11 | | | | 2.05 | | | | (0.14 | ) | | | (0.17 | ) | | $ | 12.04 | |
Year ended February 29, 2016 | | $ | 11.97 | | | | 0.11 | | | | (1.51 | ) | | | (0.09 | ) | | | (0.29 | ) | | $ | 10.19 | |
Year ended February 28, 2015 | | $ | 11.54 | | | | 0.10 | | | | 0.71 | | | | (0.10 | ) | | | (0.28 | ) | | $ | 11.97 | |
Year ended February 28, 20146 | | $ | 10.45 | | | | 0.05 | | | | 1.55 | | | | (0.06 | ) | | | (0.45 | ) | | $ | 11.54 | |
Class R4 | | | | | | | | | | | | | | | | | | | | | | | | |
Year ended February 28, 2017 | | $ | 10.11 | | | | 0.16 | | | | 2.06 | | | | (0.20 | ) | | | (0.17 | ) | | $ | 11.96 | |
Year ended February 29, 2016 | | $ | 11.89 | | | | 0.18 | | | | (1.51 | ) | | | (0.16 | ) | | | (0.29 | ) | | $ | 10.11 | |
Year ended February 28, 2015 | | $ | 11.46 | | | | 0.17 | | | | 0.71 | | | | (0.17 | ) | | | (0.28 | ) | | $ | 11.89 | |
Year ended February 28, 2014 | | $ | 10.18 | | | | 0.14 | | | | 1.76 | | | | (0.17 | ) | | | (0.45 | ) | | $ | 11.46 | |
Year ended February 28, 20135 | | $ | 9.64 | | | | 0.06 | | | | 0.66 | | | | (0.05 | ) | | | (0.13 | ) | | $ | 10.18 | |
Class R67 | | | | | | | | | | | | | | | | | | | | | | | | |
Year ended February 28, 2017 | | $ | 10.10 | | | | 0.23 | | | | 1.99 | | | | (0.22 | ) | | | (0.17 | ) | | $ | 11.93 | |
Year ended February 29, 2016 | | $ | 11.87 | | | | 0.19 | | | | (1.49 | ) | | | (0.18 | ) | | | (0.29 | ) | | $ | 10.10 | |
Year ended February 28, 2015 | | $ | 11.44 | | | | 0.18 | | | | 0.71 | | | | (0.18 | ) | | | (0.28 | ) | | $ | 11.87 | |
Year ended February 28, 2014 | | $ | 10.17 | | | | 0.19 | | | | 1.71 | | | | (0.18 | ) | | | (0.45 | ) | | $ | 11.44 | |
Year ended February 28, 2013 | | $ | 9.55 | | | | 0.16 | | | | 0.76 | | | | (0.17 | ) | | | (0.13 | ) | | $ | 10.17 | |
Administrator Class | | | | | | | | | | | | | | | | | | | | | | | | |
Year ended February 28, 2017 | | $ | 10.16 | | | | 0.16 | 4 | | | 2.04 | | | | (0.18 | ) | | | (0.17 | ) | | $ | 12.01 | |
Year ended February 29, 2016 | | $ | 11.94 | | | | 0.16 | | | | (1.51 | ) | | | (0.14 | ) | | | (0.29 | ) | | $ | 10.16 | |
Year ended February 28, 2015 | | $ | 11.51 | | | | 0.14 | | | | 0.71 | | | | (0.14 | ) | | | (0.28 | ) | | $ | 11.94 | |
Year ended February 28, 2014 | | $ | 10.23 | | | | 0.14 | | | | 1.73 | | | | (0.14 | ) | | | (0.45 | ) | | $ | 11.51 | |
Year ended February 28, 2013 | | $ | 9.59 | | | | 0.12 | | | | 0.77 | | | | (0.12 | ) | | | (0.13 | ) | | $ | 10.23 | |
| 1 | Ratios include net expenses allocated from the affiliated Master Portfolios which were as follows: |
| | | | | | | | | | | | | | | | | | | | |
| | | Year ended February 28, 2017 | | | Year ended February 29, 2016 | | | Year ended February 28 | |
| | | | | 2015 | | | 2014 | | | 2013 | |
| | | | |
Class A | | | 0.17 | % | | | 0.17 | % | | | 0.16 | % | | | 0.19 | % | | | 0.27 | %5 |
Class R | | | 0.16 | | | | 0.16 | | | | 0.16 | | | | 0.19 | 6 | | | N/A | |
Class R4 | | | 0.17 | | | | 0.16 | | | | 0.16 | | | | 0.19 | | | | 0.27 | 5 |
Class R67 | | | 0.16 | | | | 0.16 | | | | 0.16 | | | | 0.19 | | | | 0.27 | |
Administrator Class | | | 0.17 | | | | 0.16 | | | | 0.16 | | | | 0.19 | | | | 0.27 | |
| 2 | Total return calculations do not include any sales charges. Returns for periods of less than one year are not annualized. |
| 3 | Portfolio turnover rate is calculated by aggregating the results of multiplying the Fund’s investment percentage in the respective affiliated Master Portfolios by the corresponding affiliated Master Portfolio’s portfolio turnover rate. |
| 4 | Calculated based upon average shares outstanding |
| 5 | For the period from November 30, 2012 (commencement of class operations) to February 28, 2013 |
| 6 | For the period from June 28, 2013 (commencement of class operations) to February 28, 2014 |
| 7 | On June 1, 2013, Institutional Class was renamed Class R6. |
The accompanying notes are an integral part of these financial statements.
| | | | | | |
| Financial highlights | | Wells Fargo Dow Jones Target Date Funds | | | 77 | |
| | | | | | | | | | | | | | | | | | | | | | |
| Ratio to average net assets (annualized) | | | Total return2 | | | Portfolio turnover rate3 | | | Net assets at end of period (000s omitted) | |
Net investment income | | | Gross expenses1 | | | Net expenses1 | | | | |
| | | | | | | | | | | | | | | | | | | | | | |
| | 1.22 | % | | | 0.86 | % | | | 0.83 | % | | | 21.85 | % | | | 22 | % | | $ | 70,570 | |
| | 1.09 | % | | | 0.86 | % | | | 0.83 | % | | | (11.70 | )% | | | 26 | % | | $ | 77,062 | |
| | 0.96 | % | | | 0.99 | % | | | 0.88 | % | | | 7.41 | % | | | 16 | % | | $ | 793 | |
| | 1.09 | % | | | 1.01 | % | | | 0.88 | % | | | 18.54 | % | | | 24 | % | | $ | 167 | |
| | 1.08 | % | | | 1.10 | % | | | 0.88 | % | | | 7.41 | % | | | 19 | % | | $ | 13 | |
| | | | | | | | | | | | | | | | | | | | | | |
| | 0.88 | % | | | 1.11 | % | | | 1.08 | % | | | 21.41 | % | | | 22 | % | | $ | 42 | |
| | 1.01 | % | | | 1.14 | % | | | 1.09 | % | | | (11.84 | )% | | | 26 | % | | $ | 30 | |
| | 0.83 | % | | | 1.25 | % | | | 1.13 | % | | | 7.11 | % | | | 16 | % | | $ | 31 | |
| | 0.68 | % | | | 1.30 | % | | | 1.13 | % | | | 15.52 | % | | | 24 | % | | $ | 29 | |
| | | | | | | | | | | | | | | | | | | | | | |
| | 1.46 | % | | | 0.59 | % | | | 0.52 | % | | | 22.25 | % | | | 22 | % | | $ | 151,999 | |
| | 1.61 | % | | | 0.60 | % | | | 0.52 | % | | | (11.41 | )% | | | 26 | % | | $ | 131,789 | |
| | 1.44 | % | | | 0.66 | % | | | 0.52 | % | | | 7.79 | % | | | 16 | % | | $ | 199,015 | |
| | 1.39 | % | | | 0.68 | % | | | 0.52 | % | | | 18.99 | % | | | 24 | % | | $ | 174,582 | |
| | 1.29 | % | | | 0.78 | % | | | 0.52 | % | | | 7.55 | % | | | 19 | % | | $ | 1,246 | |
| | | | | | | | | | | | | | | | | | | | | | |
| | 1.77 | % | | | 0.43 | % | | | 0.37 | % | | | 22.26 | % | | | 22 | % | | $ | 219,922 | |
| | 1.73 | % | | | 0.45 | % | | | 0.37 | % | | | (11.21 | )% | | | 26 | % | | $ | 407,094 | |
| | 1.58 | % | | | 0.51 | % | | | 0.37 | % | | | 7.96 | % | | | 16 | % | | $ | 367,164 | |
| | 1.67 | % | | | 0.57 | % | | | 0.42 | % | | | 19.07 | % | | | 24 | % | | $ | 291,293 | |
| | 1.74 | % | | | 0.69 | % | | | 0.52 | % | | | 9.85 | % | | | 19 | % | | $ | 324,476 | |
| | | | | | | | | | | | | | | | | | | | | | |
| | 1.46 | % | | | 0.78 | % | | | 0.72 | % | | | 21.89 | % | | | 22 | % | | $ | 41,504 | |
| | 1.39 | % | | | 0.79 | % | | | 0.72 | % | | | (11.55 | )% | | | 26 | % | | $ | 108,091 | |
| | 1.24 | % | | | 0.83 | % | | | 0.72 | % | | | 7.54 | % | | | 16 | % | | $ | 130,175 | |
| | 1.28 | % | | | 0.87 | % | | | 0.75 | % | | | 18.65 | % | | | 24 | % | | $ | 126,533 | |
| | 1.35 | % | | | 0.96 | % | | | 0.87 | % | | | 9.49 | % | | | 19 | % | | $ | 85,590 | |
The accompanying notes are an integral part of these financial statements.
| | | | |
| 78 | | Wells Fargo Dow Jones Target Date Funds | | Financial highlights |
| | | | | | | | | | | | | | | | | | | | | | | | |
| Target 2050 Fund | | Beginning net asset value per share | | | Net investment income | | | Net realized and unrealized gains (losses) on investments | | | Distributions from net investment income | | | Distributions from net realized gains | | | Ending net asset value per share | |
Class A | | | | | | | | | | | | | | | | | | | | | | | | |
Year ended February 28, 2017 | | $ | 9.61 | | | | 0.12 | | | | 2.02 | | | | (0.18 | ) | | | (0.17 | ) | | $ | 11.40 | |
Year ended February 29, 2016 | | $ | 11.34 | | | | 0.11 | 4 | | | (1.44 | ) | | | (0.12 | ) | | | (0.28 | ) | | $ | 9.61 | |
Year ended February 28, 2015 | | $ | 10.93 | | | | 0.11 | | | | 0.69 | | | | (0.13 | ) | | | (0.26 | ) | | $ | 11.34 | |
Year ended February 28, 2014 | | $ | 9.72 | | | | 0.15 | | | | 1.62 | | | | (0.13 | ) | | | (0.43 | ) | | $ | 10.93 | |
Year ended February 28, 20135 | | $ | 9.29 | | �� | | 0.03 | | | | 0.65 | | | | (0.05 | ) | | | (0.20 | ) | | $ | 9.72 | |
Class C | | | | | | | | | | | | | | | | | | | | | | | | |
Year ended February 28, 2017 | | $ | 9.58 | | | | 0.04 | | | | 2.02 | | | | (0.11 | ) | | | (0.17 | ) | | $ | 11.36 | |
Year ended February 29, 2016 | | $ | 11.30 | | | | 0.06 | | | | (1.46 | ) | | | (0.04 | ) | | | (0.28 | ) | | $ | 9.58 | |
Year ended February 28, 2015 | | $ | 10.91 | | | | 0.04 | | | | 0.68 | | | | (0.07 | ) | | | (0.26 | ) | | $ | 11.30 | |
Year ended February 28, 2014 | | $ | 9.71 | | | | 0.08 | | | | 1.61 | | | | (0.06 | ) | | | (0.43 | ) | | $ | 10.91 | |
Year ended February 28, 20135 | | $ | 9.29 | | | | 0.02 | | | | 0.64 | | | | (0.04 | ) | | | (0.20 | ) | | $ | 9.71 | |
Class R | | | | | | | | | | | | | | | | | | | | | | | | |
Year ended February 28, 2017 | | $ | 9.63 | | | | 0.09 | | | | 2.04 | | | | (0.16 | ) | | | (0.17 | ) | | $ | 11.43 | |
Year ended February 29, 2016 | | $ | 11.37 | | | | 0.11 | | | | (1.47 | ) | | | (0.10 | ) | | | (0.28 | ) | | $ | 9.63 | |
Year ended February 28, 2015 | | $ | 10.95 | | | | 0.09 | | | | 0.68 | | | | (0.09 | ) | | | (0.26 | ) | | $ | 11.37 | |
Year ended February 28, 20146 | | $ | 9.91 | | | | 0.05 | | | | 1.48 | | | | (0.06 | ) | | | (0.43 | ) | | $ | 10.95 | |
Class R4 | | | | | | | | | | | | | | | | | | | | | | | | |
Year ended February 28, 2017 | | $ | 9.64 | | | | 0.16 | 4 | | | 2.03 | | | | (0.21 | ) | | | (0.17 | ) | | $ | 11.45 | |
Year ended February 29, 2016 | | $ | 11.38 | | | | 0.17 | | | | (1.48 | ) | | | (0.15 | ) | | | (0.28 | ) | | $ | 9.64 | |
Year ended February 28, 2015 | | $ | 10.96 | | | | 0.16 | | | | 0.68 | | | | (0.16 | ) | | | (0.26 | ) | | $ | 11.38 | |
Year ended February 28, 2014 | | $ | 9.73 | | | | 0.15 | 4 | | | 1.67 | | | | (0.16 | ) | | | (0.43 | ) | | $ | 10.96 | |
Year ended February 28, 20135 | | $ | 9.29 | | | | 0.05 | | | | 0.64 | | | | (0.05 | ) | | | (0.20 | ) | | $ | 9.73 | |
Class R67 | | | | | | | | | | | | | | | | | | | | | | | | |
Year ended February 28, 2017 | | $ | 9.64 | | | | 0.19 | 4 | | | 2.01 | | | | (0.23 | ) | | | (0.17 | ) | | $ | 11.44 | |
Year ended February 29, 2016 | | $ | 11.37 | | | | 0.18 | | | | (1.46 | ) | | | (0.17 | ) | | | (0.28 | ) | | $ | 9.64 | |
Year ended February 28, 2015 | | $ | 10.95 | | | | 0.17 | | | | 0.68 | | | | (0.17 | ) | | | (0.26 | ) | | $ | 11.37 | |
Year ended February 28, 2014 | | $ | 9.72 | | | | 0.17 | 4 | | | 1.66 | | | | (0.17 | ) | | | (0.43 | ) | | $ | 10.95 | |
Year ended February 28, 2013 | | $ | 9.20 | | | | 0.16 | | | | 0.72 | | | | (0.16 | ) | | | (0.20 | ) | | $ | 9.72 | |
Administrator Class | | | | | | | | | | | | | | | | | | | | | | | | |
Year ended February 28, 2017 | | $ | 9.61 | | | | 0.15 | 4 | | | 2.01 | | | | (0.19 | ) | | | (0.17 | ) | | $ | 11.41 | |
Year ended February 29, 2016 | | $ | 11.34 | | | | 0.15 | | | | (1.47 | ) | | | (0.13 | ) | | | (0.28 | ) | | $ | 9.61 | |
Year ended February 28, 2015 | | $ | 10.92 | | | | 0.13 | | | | 0.69 | | | | (0.14 | ) | | | (0.26 | ) | | $ | 11.34 | |
Year ended February 28, 2014 | | $ | 9.70 | | | | 0.13 | 4 | | | 1.65 | | | | (0.13 | ) | | | (0.43 | ) | | $ | 10.92 | |
Year ended February 28, 2013 | | $ | 9.18 | | | | 0.12 | 4 | | | 0.73 | | | | (0.13 | ) | | | (0.20 | ) | | $ | 9.70 | |
| 1 | Ratios include net expenses allocated from the affiliated Master Portfolios which were as follows: |
| | | | | | | | | | | | | | | | | | | | |
| | | Year ended February 28, 2017 | | | Year ended February 29, 2016 | | | Year ended February 28 | |
| | | | | 2015 | | | 2014 | | | 2013 | |
| | | | |
Class A | | | 0.17 | % | | | 0.17 | % | | | 0.16 | % | | | 0.21 | % | | | 0.27 | %5 |
Class C | | | 0.17 | | | | 0.16 | | | | 0.16 | | | | 0.21 | | | | 0.27 | 5 |
Class R | | | 0.19 | | | | 0.19 | | | | 0.16 | | | | 0.21 | 6 | | | N/A | |
Class R4 | | | 0.17 | | | | 0.16 | | | | 0.16 | | | | 0.21 | | | | 0.27 | 5 |
Class R67 | | | 0.16 | | | | 0.16 | | | | 0.16 | | | | 0.21 | | | | 0.27 | |
Administrator Class | | | 0.17 | | | | 0.16 | | | | 0.16 | | | | 0.21 | | | | 0.27 | |
| 2 | Total return calculations do not include any sales charges. Returns for periods of less than one year are not annualized. |
| 3 | Portfolio turnover rate is calculated by aggregating the results of multiplying the Fund’s investment percentage in the respective affiliated Master Portfolios by the corresponding affiliated Master Portfolio’s portfolio turnover rate. |
| 4 | Calculated based upon average shares outstanding |
| 5 | For the period from November 30, 2012 (commencement of class operations) to February 28, 2013 |
| 6 | For the period from June 28, 2013 (commencement of class operations) to February 28, 2014 |
| 7 | On June 1, 2013, Institutional Class was renamed Class R6. |
The accompanying notes are an integral part of these financial statements.
| | | | | | |
| Financial highlights | | Wells Fargo Dow Jones Target Date Funds | | | 79 | |
| | | | | | | | | | | | | | | | | | | | | | |
| Ratio to average net assets (annualized) | | | Total return2 | | | Portfolio turnover rate3 | | | Net assets at end of period (000s omitted) | |
Net investment income | | | Gross expenses1 | | | Net expenses1 | | | | |
| | | | | | | | | | | | | | | | | | | | | | |
| | 1.13 | % | | | 0.85 | % | | | 0.83 | % | | | 22.48 | % | | | 21 | % | | $ | 64,356 | |
| | 1.05 | % | | | 0.86 | % | | | 0.83 | % | | | (11.93 | )% | | | 26 | % | | $ | 58,749 | |
| | 0.94 | % | | | 0.97 | % | | | 0.88 | % | | | 7.52 | % | | | 16 | % | | $ | 1,629 | |
| | 1.00 | % | | | 0.98 | % | | | 0.88 | % | | | 18.62 | % | | | 23 | % | | $ | 210 | |
| | 1.07 | % | | | 1.05 | % | | | 0.88 | % | | | 7.49 | % | | | 19 | % | | $ | 11 | |
| | | | | | | | | | | | | | | | | | | | | | |
| | 0.33 | % | | | 1.61 | % | | | 1.58 | % | | | 21.58 | % | | | 21 | % | | $ | 1,218 | |
| | 0.49 | % | | | 1.64 | % | | | 1.60 | % | | | (12.56 | )% | | | 26 | % | | $ | 894 | |
| | 0.20 | % | | | 1.72 | % | | | 1.63 | % | | | 6.70 | % | | | 16 | % | | $ | 737 | |
| | 0.39 | % | | | 1.73 | % | | | 1.63 | % | | | 17.68 | % | | | 23 | % | | $ | 163 | |
| | 0.16 | % | | | 1.81 | % | | | 1.63 | % | | | 7.31 | % | | | 19 | % | | $ | 17 | |
| | | | | | | | | | | | | | | | | | | | | | |
| | 0.94 | % | | | 1.13 | % | | | 1.08 | % | | | 22.29 | % | | | 21 | % | | $ | 34 | |
| | 1.00 | % | | | 1.17 | % | | | 1.10 | % | | | (12.21 | )% | | | 26 | % | | $ | 32 | |
| | 0.82 | % | | | 1.25 | % | | | 1.13 | % | | | 7.20 | % | | | 16 | % | | $ | 31 | |
| | 0.69 | % | | | 1.27 | % | | | 1.13 | % | | | 15.67 | % | | | 23 | % | | $ | 29 | |
| | | | | | | | | | | | | | | | | | | | | | |
| | 1.45 | % | | | 0.57 | % | | | 0.52 | % | | | 23.00 | % | | | 21 | % | | $ | 243,339 | |
| | 1.61 | % | | | 0.59 | % | | | 0.52 | % | | | (11.72 | )% | | | 26 | % | | $ | 219,157 | |
| | 1.43 | % | | | 0.64 | % | | | 0.52 | % | | | 7.82 | % | | | 16 | % | | $ | 360,833 | |
| | 1.39 | % | | | 0.65 | % | | | 0.52 | % | | | 19.10 | % | | | 23 | % | | $ | 307,320 | |
| | 1.03 | % | | | 0.76 | % | | | 0.52 | % | | | 7.63 | % | | | 19 | % | | $ | 6,538 | |
| | | | | | | | | | | | | | | | | | | | | | |
| | 1.81 | % | | | 0.42 | % | | | 0.37 | % | | | 23.09 | % | | | 21 | % | | $ | 287,423 | |
| | 1.72 | % | | | 0.44 | % | | | 0.37 | % | | | (11.51 | )% | | | 26 | % | | $ | 806,152 | |
| | 1.58 | % | | | 0.49 | % | | | 0.37 | % | | | 7.98 | % | | | 16 | % | | $ | 818,335 | |
| | 1.66 | % | | | 0.55 | % | | | 0.41 | % | | | 19.28 | % | | | 23 | % | | $ | 693,648 | |
| | 1.75 | % | | | 0.67 | % | | | 0.52 | % | | | 9.94 | % | | | 19 | % | | $ | 754,088 | |
| | | | | | | | | | | | | | | | | | | | | | |
| | 1.37 | % | | | 0.76 | % | | | 0.72 | % | | | 22.72 | % | | | 21 | % | | $ | 121,028 | |
| | 1.39 | % | | | 0.78 | % | | | 0.72 | % | | | (11.86 | )% | | | 26 | % | | $ | 185,008 | |
| | 1.23 | % | | | 0.81 | % | | | 0.72 | % | | | 7.64 | % | | | 16 | % | | $ | 226,405 | |
| | 1.28 | % | | | 0.85 | % | | | 0.75 | % | | | 18.79 | % | | | 23 | % | | $ | 202,276 | |
| | 1.38 | % | | | 0.94 | % | | | 0.87 | % | | | 9.59 | % | | | 19 | % | | $ | 141,212 | |
The accompanying notes are an integral part of these financial statements.
| | | | |
| 80 | | Wells Fargo Dow Jones Target Date Funds | | Financial highlights |
| | | | | | | | | | | | | | | | | | | | | | | | |
| Target 2055 Fund | | Beginning net asset value per share | | | Net investment income | | | Net realized and unrealized gains (losses) on investments | | | Distributions from net investment income | | | Distributions from net realized gains | | | Ending net asset value per share | |
Class A | | | | | | | | | | | | | | | | | | | | | | | | |
Year ended February 28, 2017 | | $ | 11.56 | | | | 0.14 | | | | 2.44 | | | | (0.23 | ) | | | 0.00 | | | $ | 13.91 | |
Year ended February 29, 2016 | | $ | 13.28 | | | | 0.14 | 4 | | | (1.71 | ) | | | (0.12 | ) | | | (0.03 | ) | | $ | 11.56 | |
Year ended February 28, 2015 | | $ | 12.63 | | | | 0.13 | | | | 0.80 | | | | (0.14 | ) | | | (0.14 | ) | | $ | 13.28 | |
Year ended February 28, 2014 | | $ | 10.90 | | | | 0.14 | | | | 1.87 | | | | (0.13 | ) | | | (0.15 | ) | | $ | 12.63 | |
Year ended February 28, 20135 | | $ | 10.19 | | | | 0.03 | 4 | | | 0.72 | | | | (0.04 | ) | | | 0.00 | | | $ | 10.90 | |
Class R | | | | | | | | | | | | | | | | | | | | | | | | |
Year ended February 28, 2017 | | $ | 11.45 | | | | 0.10 | | | | 2.41 | | | | (0.20 | ) | | | 0.00 | | | $ | 13.76 | |
Year ended February 29, 2016 | | $ | 13.16 | | | | 0.12 | | | | (1.71 | ) | | | (0.09 | ) | | | (0.03 | ) | | $ | 11.45 | |
Year ended February 28, 2015 | | $ | 12.51 | | | | 0.11 | | | | 0.79 | | | | (0.11 | ) | | | (0.14 | ) | | $ | 13.16 | |
Year ended February 28, 20146 | | $ | 11.01 | | | | 0.06 | | | | 1.65 | | | | (0.06 | ) | | | (0.15 | ) | | $ | 12.51 | |
Class R4 | | | | | | | | | | | | | | | | | | | | | | | | |
Year ended February 28, 2017 | | $ | 11.59 | | | | 0.18 | | | | 2.44 | | | | (0.27 | ) | | | 0.00 | | | $ | 13.94 | |
Year ended February 29, 2016 | | $ | 13.32 | | | | 0.20 | | | | (1.74 | ) | | | (0.16 | ) | | | (0.03 | ) | | $ | 11.59 | |
Year ended February 28, 2015 | | $ | 12.65 | | | | 0.18 | | | | 0.81 | | | | (0.18 | ) | | | (0.14 | ) | | $ | 13.32 | |
Year ended February 28, 2014 | | $ | 10.91 | | | | 0.15 | | | | 1.90 | | | | (0.16 | ) | | | (0.15 | ) | | $ | 12.65 | |
Year ended February 28, 20135 | | $ | 10.19 | | | | 0.04 | 4 | | | 0.72 | | | | (0.04 | ) | | | 0.00 | | | $ | 10.91 | |
Class R67 | | | | | | | | | | | | | | | | | | | | | | | | |
Year ended February 28, 2017 | | $ | 11.57 | | | | 0.23 | 4 | | | 2.40 | | | | (0.29 | ) | | | 0.00 | | | $ | 13.91 | |
Year ended February 29, 2016 | | $ | 13.29 | | | | 0.21 | | | | (1.72 | ) | | | (0.18 | ) | | | (0.03 | ) | | $ | 11.57 | |
Year ended February 28, 2015 | | $ | 12.63 | | | | 0.19 | | | | 0.80 | | | | (0.19 | ) | | | (0.14 | ) | | $ | 13.29 | |
Year ended February 28, 2014 | | $ | 10.90 | | | | 0.19 | | | | 1.87 | | | | (0.18 | ) | | | (0.15 | ) | | $ | 12.63 | |
Year ended February 28, 2013 | | $ | 10.08 | | | | 0.15 | | | | 0.83 | | | | (0.16 | ) | | | 0.00 | | | $ | 10.90 | |
Administrator Class | | | | | | | | | | | | | | | | | | | | | | | | |
Year ended February 28, 2017 | | $ | 11.57 | | | | 0.17 | 4 | | | 2.41 | | | | (0.24 | ) | | | 0.00 | | | $ | 13.91 | |
Year ended February 29, 2016 | | $ | 13.28 | | | | 0.17 | | | | (1.71 | ) | | | (0.14 | ) | | | (0.03 | ) | | $ | 11.57 | |
Year ended February 28, 2015 | | $ | 12.62 | | | | 0.14 | | | | 0.81 | | | | (0.15 | ) | | | (0.14 | ) | | $ | 13.28 | |
Year ended February 28, 2014 | | $ | 10.90 | | | | 0.14 | | | | 1.87 | | | | (0.14 | ) | | | (0.15 | ) | | $ | 12.62 | |
Year ended February 28, 2013 | | $ | 10.06 | | | | 0.14 | 4 | | | 0.81 | | | | (0.11 | ) | | | 0.00 | | | $ | 10.90 | |
| 1 | Ratios include net expenses allocated from the affiliated Master Portfolios which were as follows: |
| | | | | | | | | | | | | | | | | | | | |
| | | Year ended February 28, 2017 | | | Year ended February 29, 2016 | | | Year ended February 28 | |
| | | | | 2015 | | | 2014 | | | 2013 | |
| | | | |
Class A | | | 0.17 | % | | | 0.17 | % | | | 0.16 | % | | | 0.18 | % | | | 0.27 | %5 |
Class R | | | 0.17 | | | | 0.20 | | | | 0.16 | | | | 0.18 | 6 | | | N/A | |
Class R4 | | | 0.17 | | | | 0.16 | | | | 0.16 | | | | 0.18 | | | | 0.27 | 5 |
Class R67 | | | 0.16 | | | | 0.16 | | | | 0.16 | | | | 0.18 | | | | 0.27 | |
Administrator Class | | | 0.17 | | | | 0.16 | | | | 0.16 | | | | 0.18 | | | | 0.27 | |
| 2 | Total return calculations do not include any sales charges. Returns for periods of less than one year are not annualized. |
| 3 | Portfolio turnover rate is calculated by aggregating the results of multiplying the Fund’s investment percentage in the respective affiliated Master Portfolios by the corresponding affiliated Master Portfolio’s portfolio turnover rate. |
| 4 | Calculated based upon average shares outstanding |
| 5 | For the period from November 30, 2012 (commencement of class operations) to February 28, 2013 |
| 6 | For the period from June 28, 2013 (commencement of class operations) to February 28, 2014 |
| 7 | On June 1, 2013, Institutional Class was renamed Class R6. |
The accompanying notes are an integral part of these financial statements.
| | | | | | |
| Financial highlights | | Wells Fargo Dow Jones Target Date Funds | | | 81 | |
| | | | | | | | | | | | | | | | | | | | | | |
| Ratio to average net assets (annualized) | | | Total return2 | | | Portfolio turnover rate3 | | | Net assets at end of period (000s omitted) | |
Net investment income | | | Gross expenses1 | | | Net expenses1 | | | | |
| | | | | | | | | | | | | | | | | | | | | | |
| | 1.13 | % | | | 0.91 | % | | | 0.83 | % | | | 22.45 | % | | | 21 | % | | $ | 9,270 | |
| | 1.15 | % | | | 0.94 | % | | | 0.84 | % | | | (11.93 | )% | | | 26 | % | | $ | 8,940 | |
| | 0.97 | % | | | 1.07 | % | | | 0.88 | % | | | 7.46 | % | | | 16 | % | | $ | 565 | |
| | 1.10 | % | | | 1.19 | % | | | 0.88 | % | | | 18.69 | % | | | 23 | % | | $ | 66 | |
| | 1.05 | % | | | 1.44 | % | | | 0.88 | % | | | 7.39 | % | | | 19 | % | | $ | 14 | |
| | | | | | | | | | | | | | | | | | | | | | |
| | 0.98 | % | | | 1.16 | % | | | 1.08 | % | | | 22.04 | % | | | 21 | % | | $ | 40 | |
| | 0.98 | % | | | 1.24 | % | | | 1.09 | % | | | (12.16 | )% | | | 26 | % | | $ | 42 | |
| | 0.83 | % | | | 1.36 | % | | | 1.13 | % | | | 7.24 | % | | | 16 | % | | $ | 31 | |
| | 0.73 | % | | | 1.48 | % | | | 1.13 | % | | | 15.66 | % | | | 23 | % | | $ | 29 | |
| | | | | | | | | | | | | | | | | | | | | | |
| | 1.32 | % | | | 0.64 | % | | | 0.52 | % | | | 22.78 | % | | | 21 | % | | $ | 43,147 | |
| | 1.61 | % | | | 0.66 | % | | | 0.52 | % | | | (11.70 | )% | | | 26 | % | | $ | 27,193 | |
| | 1.41 | % | | | 0.74 | % | | | 0.52 | % | | | 7.92 | % | | | 16 | % | | $ | 33,651 | |
| | 1.40 | % | | | 0.86 | % | | | 0.52 | % | | | 19.06 | % | | | 23 | % | | $ | 20,591 | |
| | 1.51 | % | | | 1.09 | % | | | 0.52 | % | | | 7.51 | % | | | 19 | % | | $ | 33 | |
| | | | | | | | | | | | | | | | | | | | | | |
| | 1.79 | % | | | 0.47 | % | | | 0.37 | % | | | 22.97 | % | | | 21 | % | | $ | 65,516 | |
| | 1.72 | % | | | 0.51 | % | | | 0.37 | % | | | (11.52 | )% | | | 26 | % | | $ | 161,764 | |
| | 1.55 | % | | | 0.59 | % | | | 0.37 | % | | | 8.01 | % | | | 16 | % | | $ | 126,822 | |
| | 1.63 | % | | | 0.75 | % | | | 0.40 | % | | | 19.18 | % | | | 23 | % | | $ | 74,427 | |
| | 1.69 | % | | | 1.17 | % | | | 0.52 | % | | | 9.90 | % | | | 19 | % | | $ | 36,345 | |
| | | | | | | | | | | | | | | | | | | | | | |
| | 1.34 | % | | | 0.83 | % | | | 0.72 | % | | | 22.50 | % | | | 21 | % | | $ | 9,700 | |
| | 1.37 | % | | | 0.85 | % | | | 0.72 | % | | | (11.75 | )% | | | 26 | % | | $ | 14,747 | |
| | 1.16 | % | | | 0.91 | % | | | 0.72 | % | | | 7.66 | % | | | 16 | % | | $ | 12,493 | |
| | 1.28 | % | | | 1.05 | % | | | 0.75 | % | | | 18.70 | % | | | 23 | % | | $ | 8,462 | |
| | 1.36 | % | | | 1.45 | % | | | 0.87 | % | | | 9.52 | % | | | 19 | % | | $ | 4,739 | |
The accompanying notes are an integral part of these financial statements.
| | | | |
| 82 | | Wells Fargo Dow Jones Target Date Funds | | Financial highlights |
| | | | | | | | | | | | | | | | | | | | |
| Target 2060 Fund | | Beginning net asset value per share | | | Net investment income | | | Net realized and unrealized gains (losses) on investments | | | Distributions from net investment income | | | Ending net asset value per share | |
Class A | | | | | | | | | | | | | | | | | | | | |
Year ended February 28, 2017 | | $ | 8.84 | | | | 0.09 | 4 | | | 1.86 | | | | (0.10 | ) | | $ | 10.69 | |
Year ended February 29, 20165 | | $ | 10.00 | | | | 0.06 | | | | (1.11 | ) | | | (0.11 | ) | | $ | 8.84 | |
Class C | | | | | | | | | | | | | | | | | | | | |
Year ended February 28, 2017 | | $ | 8.90 | | | | 0.04 | | | | 1.84 | | | | (0.07 | ) | | $ | 10.71 | |
Year ended February 29, 20165 | | $ | 10.00 | | | | 0.01 | | | | (1.11 | ) | | | 0.00 | | | $ | 8.90 | |
Class R | | | | | | | | | | | | | | | | | | | | |
Year ended February 28, 2017 | | $ | 8.84 | | | | 0.09 | 4 | | | 1.80 | | | | (0.20 | ) | | $ | 10.53 | |
Year ended February 29, 20165 | | $ | 10.00 | | | | 0.05 | | | | (1.11 | ) | | | (0.10 | ) | | $ | 8.84 | |
Class R4 | | | | | | | | | | | | | | | | | | | | |
Year ended February 28, 2017 | | $ | 8.97 | | | | 0.12 | 4 | | | 1.89 | | | | (0.10 | ) | | $ | 10.88 | |
Year ended February 29, 20165 | | $ | 10.00 | | | | 0.08 | 4 | | | (1.11 | ) | | | 0.00 | | | $ | 8.97 | |
Class R6 | | | | | | | | | | | | | | | | | | | | |
Year ended February 28, 2017 | | $ | 8.95 | | | | 0.13 | 4 | | | 1.90 | | | | (0.12 | ) | | $ | 10.86 | |
Year ended February 29, 20165 | | $ | 10.00 | | | | 0.09 | 4 | | | (1.12 | ) | | | (0.02 | ) | | $ | 8.95 | |
Administrator Class | | | | | | | | | | | | | | | | | | | | |
Year ended February 28, 2017 | | $ | 8.89 | | | | 0.10 | 4 | | | 1.88 | | | | (0.13 | ) | | $ | 10.74 | |
Year ended February 29, 20165 | | $ | 10.00 | | | | 0.07 | | | | (1.12 | ) | | | (0.06 | ) | | $ | 8.89 | |
| 1 | Ratios include net expenses allocated from the affiliated Master Portfolios which were as follows: |
| | | | | | | | |
| | | Year ended February 29, 2017 | | | Year ended February 29, 20165 | |
| | | |
| | | | |
Class A | | | 0.17 | % | | | 0.15 | % |
Class C | | | 0.16 | | | | 0.16 | |
Class R | | | 0.19 | | | | 0.17 | |
Class R4 | | | 0.17 | | | | 0.16 | |
Class R6 | | | 0.17 | | | | 0.16 | |
Administrator Class | | | 0.17 | | | | 0.16 | |
| 2 | Total return calculations do not include any sales charges. Returns for periods of less than one year are not annualized. |
| 3 | Portfolio turnover rate is calculated by aggregating the results of multiplying the Fund’s investment percentage in the respective affiliated Master Portfolios by the corresponding affiliated Master Portfolio’s portfolio turnover rate. |
| 4 | Calculated based upon average shares outstanding |
| 5 | For the period from June 30, 2015 (commencement of Fund operations) to February 29, 2016 |
The accompanying notes are an integral part of these financial statements.
| | | | | | |
| Financial highlights | | Wells Fargo Dow Jones Target Date Funds | | | 83 | |
| | | | | | | | | | | | | | | | | | | | | | |
| Ratio to average net assets (annualized) | | | Total return2 | | | Portfolio turnover rate3 | | | Net assets at end of period (000s omitted) | |
Net investment income | | | Gross expenses1 | | | Net expenses1 | | | | |
| | | | | | | | | | | | | | | | | | | | | | |
| | 0.90 | % | | | 3.21 | % | | | 0.83 | % | | | 22.23 | % | | | 21 | % | | $ | 671 | |
| | 0.97 | % | | | 14.47 | % | | | 0.83 | % | | | (10.59 | )% | | | 26 | % | | $ | 100 | |
| | | | | | | | | | | | | | | | | | | | | | |
| | 0.39 | % | | | 5.30 | % | | | 1.58 | % | | | 21.22 | % | | | 21 | % | | $ | 252 | |
| | 0.21 | % | | | 15.14 | % | | | 1.58 | % | | | (11.00 | )% | | | 26 | % | | $ | 173 | |
| | | | | | | | | | | | | | | | | | | | | | |
| | 0.89 | % | | | 4.69 | % | | | 1.08 | % | | | 21.73 | % | | | 21 | % | | $ | 127 | |
| | 0.72 | % | | | 14.73 | % | | | 1.08 | % | | | (10.66 | )% | | | 26 | % | | $ | 89 | |
| | | | | | | | | | | | | | | | | | | | | | |
| | 1.14 | % | | | 1.88 | % | | | 0.52 | % | | | 22.45 | % | | | 21 | % | | $ | 6,443 | |
| | 1.29 | % | | | 14.19 | % | | | 0.52 | % | | | (10.30 | )% | | | 26 | % | | $ | 195 | |
| | | | | | | | | | | | | | | | | | | | | | |
| | 1.31 | % | | | 1.82 | % | | | 0.37 | % | | | 22.75 | % | | | 21 | % | | $ | 12,518 | |
| | 1.41 | % | | | 14.05 | % | | | 0.37 | % | | | (10.30 | )% | | | 26 | % | | $ | 573 | |
| | | | | | | | | | | | | | | | | | | | | | |
| | 0.98 | % | | | 2.31 | % | | | 0.72 | % | | | 22.38 | % | | | 21 | % | | $ | 4,427 | |
| | 1.10 | % | | | 14.35 | % | | | 0.72 | % | | | (10.50 | )% | | | 26 | % | | $ | 359 | |
The accompanying notes are an integral part of these financial statements.
| | | | |
| 84 | | Wells Fargo Dow Jones Target Date Funds | | Notes to financial statements |
1. ORGANIZATION
Wells Fargo Funds Trust (the “Trust”), a Delaware statutory trust organized on March 10, 1999, is an open-end management investment company registered under the Investment Company Act of 1940, as amended (the “1940 Act”). As an investment company, the Trust follows the accounting and reporting guidance in Financial Accounting Standards Board (“FASB”) Accounting Standards Codification Topic 946, Financial Services – Investment Companies. These financial statements report on the following funds: Wells Fargo Dow Jones Target Today Fund (“Target Today Fund”), Wells Fargo Dow Jones Target 2010 Fund (“Target 2010 Fund”), Wells Fargo Dow Jones Target 2015 Fund (“Target 2015 Fund” ), Wells Fargo Dow Jones Target 2020 Fund (“Target 2020 Fund” ), Wells Fargo Dow Jones Target 2025 Fund (“Target 2025 Fund”), Wells Fargo Dow Jones Target 2030 Fund (“Target 2030 Fund”), Wells Fargo Dow Jones Target 2035 Fund (“Target 2035 Fund”), Wells Fargo Dow Jones Target 2040 Fund (“Target 2040 Fund”), Wells Fargo Dow Jones Target 2045 Fund (“Target 2045 Fund”), Wells Fargo Dow Jones Target 2050 Fund (“Target 2050 Fund”), Wells Fargo Dow Jones Target 2055 Fund (“Target 2055 Fund”), and Wells Fargo Dow Jones Target 2060 Fund (“Target 2060 Fund”) (each, a “Fund”, collectively, the “Funds”). Each Fund is a diversified series of the Trust.
After the close of business on October 23, 2015, Investor Class shares became Class A shares in a tax-free conversion. Shareholders of Investor Class in the applicable Funds received Class A shares at a value equal to the value of their Investor Class shares immediately prior to the conversion. Investor Class shares are no longer offered by the applicable Funds.
After the close of business on December 5, 2016, Class B shares of Target Today Fund, Target 2010 Fund, Target 2020 Fund, Target 2030 Fund, and Target 2040 Fund were converted to Class A shares and are no longer offered by each Fund. Information for Class B shares reflected in the financial statements represents activity through December 5, 2016.
Each Fund seeks to achieve its investment objective by investing all investable assets in separate diversified portfolios of Wells Fargo Master Trust, a registered open-end management investment company. Each Fund invests in Wells Fargo Diversified Fixed Income Portfolio (“Diversified Fixed Income Portfolio”), Wells Fargo Diversified Stock Portfolio (“Diversified Stock Portfolio”) and Wells Fargo Short-Term Investment Portfolio (“Short-Term Investment Portfolio”) (each, an “affiliated Master Portfolio”, collectively, the “affiliated Master Portfolios”). Each affiliated Master Portfolio directly acquires portfolio securities, and a Fund investing in an affiliated Master Portfolio acquires an indirect interest in those securities. Each Fund accounts for its investment in the affiliated Master Portfolios as partnership investments and records on a daily basis its share of the affiliated Master Portfolio’s income, expense and realized and unrealized gains and losses. The financial statements of the affiliated Master Portfolios for the year ended February 28, 2017 are included in this report and should be read in conjunction with each Fund’s financial statements. As of February 28, 2017, the Funds own the following percentages of the affiliated Master Portfolios:
| | | | | | | | | | | | | | | | | | | | | | | | | | | | | | | | | | | | | | | | | | | | | | | | |
| | | Target
Today
Fund | | | Target
2010
Fund | | | Target
2015
Fund | | | Target
2020
Fund | | | Target
2025
Fund | | | Target
2030
Fund | | | Target
2035
Fund | | | Target
2040
Fund | | | Target
2045
Fund | | | Target
2050
Fund | | | Target
2055
Fund | | | Target
2060
Fund | |
Diversified Fixed Income Portfolio | | | 6 | % | | | 4 | % | | | 6 | % | | | 31 | % | | | 15 | % | | | 21 | % | | | 7 | % | | | 7 | % | | | 2 | % | | | 1 | % | | | 0 | %* | | | 0 | %* |
Diversified Stock Portfolio | | | 1 | | | | 1 | | | | 2 | | | | 10 | | | | 8 | | | | 20 | | | | 11 | | | | 22 | | | | 9 | | | | 14 | | | | 2 | | | | 0 | * |
Short-Term Investment Portfolio | | | 28 | | | | 14 | | | | 9 | | | | 10 | | | | 6 | | | | 11 | | | | 5 | | | | 8 | | | | 3 | | | | 5 | | | | 1 | | | | 0 | * |
| * | The amount invested is less than 1%. |
2. SIGNIFICANT ACCOUNTING POLICIES
The following significant accounting policies, which are consistently followed in the preparation of the financial statements of each Fund, are in conformity with U.S. generally accepted accounting principles which require management to make estimates and assumptions that affect the reported amounts of assets and liabilities, disclosure of contingent assets and liabilities at the date of the financial statements, and the reported amounts of revenues and expenses during the reporting period. Actual results could differ from those estimates.
Securities valuation
All investments are valued each business day as of the close of regular trading on the New York Stock Exchange (generally 4 p.m. Eastern Time), although the Funds may deviate from this calculation time under unusual or unexpected circumstances.
Investments in the affiliated Master Portfolios are valued daily based on each Fund’s proportionate share of each affiliated Master Portfolio’s net assets, which are also valued daily. Securities held in the affiliated Master Portfolios are valued as discussed in the Notes to Financial Statements of the affiliated Master Portfolios, which are included elsewhere in this report.
| | | | | | |
| Notes to financial statements | | Wells Fargo Dow Jones Target Date Funds | | | 85 | |
Security transactions and income recognition
Securities transactions are recorded on a trade date basis in each affiliated Master Portfolio. Realized gains or losses in each affiliated Master Portfolio are recorded on the basis of identified cost.
Interest income is accrued daily and bond discounts are accreted and premiums are amortized daily based on the effective interest method by each affiliated Master Portfolio. To the extent debt obligations are placed on non-accrual status, any related interest income may be reduced by writing off interest receivables when the collection of all or a portion of interest has become doubtful based on consistently applied procedures. If the issuer subsequently resumes interest payments or when the collectability of interest is reasonably assured, the debt obligation is removed from non-accrual status.
Dividend income in each affiliated Master Portfolio is recognized on the ex-dividend date, except for certain dividends from foreign securities which are recorded as soon as the custodian verifies the ex-dividend date.
Income from foreign securities in each affiliated Master Portfolio is recorded net of foreign taxes withheld where recovery of such taxes is not assured.
Each Fund records daily its proportionate share of each affiliated Master Portfolio’s interest and dividend income and realized and unrealized gains or losses.
Distributions to shareholders
Distributions to shareholders from net investment income and net realized gains, if any, are recorded on the ex-dividend date. Such distributions are determined in conformity with federal income tax regulations, which may differ in amount or character from net investment income and realized gains recognized for purposes of U.S. generally accepted accounting principles.
Federal and other taxes
Each Fund is treated as a separate entity for federal income tax purposes. Each Fund intends to continue to qualify as a regulated investment company by distributing substantially all of its investment company taxable income and any net realized capital gains (after reduction for capital loss carryforwards) sufficient to relieve it from all, or substantially all, federal income taxes. Accordingly, no provision for federal income taxes was required.
Each Fund’s income and federal excise tax returns and all financial records supporting those returns for the prior three fiscal years are subject to examination by the federal and Delaware revenue authorities. Management has analyzed each Fund’s tax positions taken on federal, state, and foreign tax returns for all open tax years and does not believe that there are any uncertain tax positions that require recognition of a tax liability.
Reclassifications are made to each Fund’s capital accounts for permanent tax differences to reflect income and gains available for distribution (or available capital loss carryforwards) under federal income tax regulations. U.S. generally accepted accounting principles requires that certain components of net assets be adjusted to reflect permanent differences between financial and tax reporting. These reclassifications have no effect on net assets or net asset values per share. At February 28, 2017, as a result of permanent book-to-tax differences, the following reclassification adjustments were made on the Statements of Assets and Liabilities:
| | | | | | | | | | | | |
| | | Paid-in
capital | | | Undistributed
(overdistributed)
net investment
income | | | Accumulated
net realized
gains (losses) on
investments | |
Target Today Fund | | $ | 13,195,202 | | | $ | (2,430,062 | ) | | $ | (10,765,140 | ) |
Target 2010 Fund | | | 8,919,624 | | | | (1,392,956 | ) | | | (7,526,668 | ) |
Target 2015 Fund | | | 17,705,512 | | | | (2,638,803 | ) | | | (15,066,709 | ) |
Target 2020 Fund | | | 103,084,283 | | | | (10,365,380 | ) | | | (92,718,903 | ) |
Target 2025 Fund | | | 92,935,983 | | | | (5,082,553 | ) | | | (87,853,430 | ) |
Target 2030 Fund | | | 199,064,438 | | | | (3,579,750 | ) | | | (195,484,688 | ) |
Target 2035 Fund | | | 112,941,636 | | | | (291,058 | ) | | | (112,650,578 | ) |
Target 2040 Fund | | | 205,023,623 | | | | 844,173 | | | | (205,867,796 | ) |
Target 2045 Fund | | | 86,161,240 | | | | 673,056 | | | | (86,834,296 | ) |
Target 2050 Fund | | | 126,318,691 | | | | 1,409,614 | | | | (127,728,305 | ) |
Target 2055 Fund | | | 24,503,369 | | | | 80,780 | | | | (24,584,149 | ) |
Target 2060 Fund | | | 3,215,952 | | | | 20,147 | | | | (3,236,099 | ) |
| | | | |
| 86 | | Wells Fargo Dow Jones Target Date Funds | | Notes to financial statements |
As of February 28, 2017, capital loss carryforwards available to offset future net realized capital gains were as follows:
| | | | | | | | |
| | | No expiration | |
| | | Short-term | | | Long-term | |
Target 2055 Fund | | $ | 1,822,061 | | | $ | 0 | |
Target 2060 Fund | | | 41,819 | | | | 53,116 | |
At February 28, 2017, current year deferred post-October capital losses and qualified late-year ordinary losses which will be recognized on the first day of the following fiscal year were as follows:
| | | | | | | | | | | | |
| | | Deferred post-October
capital losses | | | Late-year
ordinary losses
deferred | |
| | | Short-term | | | Long-term | | |
Target Today Fund | | $ | 0 | | | $ | 0 | | | $ | 763,398 | |
Target 2010 Fund | | | 0 | | | | 0 | | | | 362,770 | |
Target 2015 Fund | | | 0 | | | | 0 | | | | 777,441 | |
Target 2020 Fund | | | 0 | | | | 0 | | | | 3,692,583 | |
Target 2025 Fund | | | 0 | | | | 0 | | | | 1,451,620 | |
Target 2030 Fund | | | 0 | | | | 0 | | | | 822,110 | |
Target 2060 Fund | | | 43,798 | | | | 64,147 | | | | 3,362 | |
Class allocations
The separate classes of shares offered by each Fund differ principally in applicable sales charges, distribution, shareholder servicing, and administration fees. Class specific expenses are charged directly to that share class. Investment income, common expenses, and realized and unrealized gains (losses) on investments are allocated daily to each class of shares based on the relative proportion of net assets of each class.
3. FAIR VALUATION MEASUREMENTS
As of February 28, 2017, each Fund’s investment in the affiliated Master Portfolios was measured at fair value using the net asset value per share (or its equivalent) as a practical expedient. The Diversified Stock Portfolio and the Diversified Fixed Income Portfolio seek to approximate, before fees and expenses, the total return of the respective equity and fixed income portions of its corresponding Dow Jones Global Target Date Index by investing in the securities that comprise the sub-indexes representing the equity and fixed income asset classes, respectively. The Diversified Stock Portfolio and the Diversified Fixed Income Portfolio use an optimization process, which seeks to balance the replication of index performance and security transaction costs. The Short-Term Investment Portfolio seeks to represent the cash component of the Dow Jones Global Target Date Indexes. At February 28, 2017, the affiliated Master Portfolios do not have a redemption period notice, can be redeemed daily and do not have any unfunded commitments.
| | | | | | |
| Notes to financial statements | | Wells Fargo Dow Jones Target Date Funds | | | 87 | |
At February 28, 2017, aggregate fair value of the affiliated Master Portfolios held in each Fund was as follows:
| | | | |
| | | Fair value of affiliated
Master Portfolios | |
Target Today Fund | | $ | 420,696,810 | |
Target 2010 Fund | | | 243,817,386 | |
Target 2015 Fund | | | 308,918,176 | |
Target 2020 Fund | | | 1,435,448,558 | |
Target 2025 Fund | | | 856,544,938 | |
Target 2030 Fund | | | 1,631,500,373 | |
Target 2035 Fund | | | 739,818,766 | |
Target 2040 Fund | | | 1,305,663,957 | |
Target 2045 Fund | | | 486,760,888 | |
Target 2050 Fund | | | 720,473,221 | |
Target 2055 Fund | | | 128,444,091 | |
Target 2060 Fund | | | 24,463,553 | |
4. TRANSACTIONS WITH AFFILIATES AND OTHER EXPENSES
Management fee
Wells Fargo Funds Management, LLC (“Funds Management”), an indirect wholly owned subsidiary of Wells Fargo & Company (“Wells Fargo”), is the manager of each Fund and provides advisory and fund-level administrative services under an investment management agreement. Under the investment management agreement, Funds Management is responsible for, among other services, implementing the investment objectives and strategies of each Fund, supervising the subadviser, providing fund-level administrative services in connection with each Fund’s operations, and providing any other fund-level administrative services reasonably necessary for the operation of each Fund. As compensation for its services under the investment management agreement, Funds Management is entitled to receive an annual management fee starting at 0.20% and declining to 0.18% as the average daily net assets of each Fund increase. For the year ended February 28, 2017, the management fee for each Fund was equivalent to an annual rate of 0.20% of each Fund’s average daily net assets.
Funds Management also serves as the adviser to each affiliated Master Portfolio and is entitled to receive a fee from each affiliated Master Portfolio for those services.
Funds Management has retained the services of a subadviser to provide daily portfolio management to the Funds. The fees for subadvisory services are borne by Funds Management. Global Index Advisors, Inc. is the subadviser to each Fund and is entitled to receive a fee from Funds Management at an annual rate starting at 0.06% and declining to 0.04% as the average daily net assets of each Fund increase.
Administration fees
Under a class-level administration agreement, Funds Management provides class-level administrative services to each Fund, which includes paying fees and expenses for services provided by the transfer agent, sub-transfer agents, omnibus account servicers and record-keepers. As compensation for its services under the class-level administration agreement, Funds Management receives an annual fee which is calculated based on the average daily net assets of each class as follows:
| | | | |
| | | Class-level
administration fee | |
Class A, Class B, Class C, Class R | | | 0.21 | % |
Class R4 | | | 0.08 | |
Class R6 | | | 0.03 | |
Administrator Class | | | 0.13 | |
| | | | |
| 88 | | Wells Fargo Dow Jones Target Date Funds | | Notes to financial statements |
Funds Management has contractually waived and/or reimbursed management and administration fees to the extent necessary to maintain certain net operating expense ratios for the Funds. Waiver of fees and/or reimbursement of expenses by Funds Management were made first from fund level expenses on a proportionate basis and then from class specific expenses. Funds Management has committed through June 30, 2017 to waive fees and/or reimburse expenses to the extent necessary to cap each Fund’s expenses as follows:
| | | | | | | | | | | | | | | | | | | | | | | | |
| | | Class A | | | Class C | | | Class R | | | Class R4 | | | Class R6 | | | Administrator
Class | |
Target Today Fund | | | 0.76 | % | | | 1.51 | % | | | 1.01 | % | | | 0.45 | % | | | 0.30 | % | | | 0.65 | % |
Target 2010 Fund | | | 0.78 | | | | 1.53 | | | | 1.03 | | | | 0.47 | | | | 0.32 | | | | 0.67 | |
Target 2015 Fund | | | 0.79 | | | | N/A | | | | 1.04 | | | | 0.48 | | | | 0.33 | | | | 0.68 | |
Target 2020 Fund | | | 0.81 | | | | 1.56 | | | | 1.06 | | | | 0.50 | | | | 0.35 | | | | 0.70 | |
Target 2025 Fund | | | 0.81 | | | | N/A | | | | 1.06 | | | | 0.50 | | | | 0.35 | | | | 0.70 | |
Target 2030 Fund | | | 0.82 | | | | 1.57 | | | | 1.07 | | | | 0.51 | | | | 0.36 | | | | 0.71 | |
Target 2035 Fund | | | 0.83 | | | | N/A | | | | 1.08 | | | | 0.52 | | | | 0.37 | | | | 0.72 | |
Target 2040 Fund | | | 0.83 | | | | 1.58 | | | | 1.08 | | | | 0.52 | | | | 0.37 | | | | 0.72 | |
Target 2045 Fund | | | 0.83 | | | | N/A | | | | 1.08 | | | | 0.52 | | | | 0.37 | | | | 0.72 | |
Target 2050 Fund | | | 0.83 | | | | 1.58 | | | | 1.08 | | | | 0.52 | | | | 0.37 | | | | 0.72 | |
Target 2055 Fund | | | 0.83 | | | | N/A | | | | 1.08 | | | | 0.52 | | | | 0.37 | | | | 0.72 | |
Target 2060 Fund | | | 0.83 | | | | 1.58 | | | | 1.08 | | | | 0.52 | | | | 0.37 | | | | 0.72 | |
After the expiration date, each expense cap may be increased or the commitment to maintain the cap may be terminated only with the approval of the Board of Trustees.
During the year ended February 28, 2017, State Street Bank and Trust Company, the Funds’ custodian, reimbursed each Fund for certain out-of-pocket expenses that were billed to each Fund in error from 1998-2015. These amounts are included in other income and other income allocated from affiliated Master Portfolios on the Statements of Operations. In addition, Funds Management was also reimbursed for waivers/reimbursements it made to the Funds during the period the Funds were erroneously billed. The amount were as follows:
| | | | | | | | |
| | | Amount reimbursed to
the Fund | | | Amount reimbursed to
Funds Management | |
Target Today Fund | | $ | 416 | | | $ | 2,957 | |
Target 2010 Fund | | | 261 | | | | 2,956 | |
Target 2015 Fund | | | 375 | | | | 2,955 | |
Target 2020 Fund | | | 1,590 | | | | 2,957 | |
Target 2025 Fund | | | 1,003 | | | | 2,957 | |
Target 2030 Fund | | | 1,701 | | | | 2,957 | |
Target 2035 Fund | | | 792 | | | | 2,955 | |
Target 2040 Fund | | | 1,285 | | | | 2,956 | |
Target 2045 Fund | | | 499 | | | | 2,957 | |
Target 2050 Fund | | | 709 | | | | 2,955 | |
Target 2055 Fund | | | 122 | | | | 2,077 | |
Target 2060 Fund | | | 19 | | | | 139 | |
Distribution fees
The Trust has adopted a Distribution Plan for Class B, Class C, and Class R shares of the applicable Funds pursuant to Rule 12b-1 under the 1940 Act. Distribution fees are charged to the Class B, Class C, and Class R shares and paid to Wells Fargo Funds Distributor, LLC (“Funds Distributor”), the principal underwriter of each Fund, at an annual rate of 0.75% of the average daily net assets of Class B and Class C shares and 0.25% of the average daily net assets of Class R shares.
| | | | | | |
| Notes to financial statements | | Wells Fargo Dow Jones Target Date Funds | | | 89 | |
In addition, Funds Distributor is entitled to receive the front-end sales charge from the purchase of Class A shares and a contingent deferred sales charge on the redemption of certain Class A shares. Funds Distributor is also entitled to receive the contingent deferred sales charges from redemptions of Class B and Class C shares. For the year ended February 28, 2017, Funds Distributor received the following amounts in front-end sales charges and contingent deferred sales charges:
| | | | | | | | |
| | | Front-end sales charges
Class A | | | Contingent deferred
sales charges Class C | |
Target Today Fund | | $ | 398 | | | $ | 0 | |
Target 2010 Fund | | | 148 | | | | 0 | |
Target 2015 Fund | | | 394 | | | | N/A | |
Target 2020 Fund | �� | | 1,033 | | | | 0 | |
Target 2025 Fund | | | 553 | | | | N/A | |
Target 2030 Fund | | | 3,676 | | | | 0 | |
Target 2035 Fund | | | 1,333 | | | | N/A | |
Target 2040 Fund | | | 3,763 | | | | 0 | |
Target 2045 Fund | | | 461 | | | | N/A | |
Target 2050 Fund | | | 2,922 | | | | 15 | |
Target 2055 Fund | | | 690 | | | | N/A | |
Target 2060 Fund | | | 5 | | | | 0 | |
Shareholder servicing fees
The Trust has entered into contracts with one or more shareholder servicing agents, whereby Class A, Class B, Class C, Class R, and Administrator Class of each applicable Fund are charged a fee at an annual rate of 0.25% of the average daily net assets of each respective class. Class R4 is charged a fee at an annual rate of 0.10% of its average daily net assets.
A portion of these total shareholder servicing fees were paid to affiliates of Wells Fargo.
5. INVESTMENT PORTFOLIO TRANSACTIONS
Purchases and sales of investments, excluding short-term securities, for the year ended February 28, 2017 were as follows:
| | | | | | | | | | | | | | | | |
| | | Purchases at cost* | | | Sales proceeds* | |
| | | U.S. government | | | Non-U.S. government | | | U.S. government | | | Non-U.S. government | |
Target Today Fund | | $ | 116,774,805 | | | $ | 53,807,644 | | | $ | 163,162,328 | | | $ | 47,906,745 | |
Target 2010 Fund | | | 74,092,852 | | | | 33,998,780 | | | | 103,525,433 | | | | 30,054,354 | |
Target 2015 Fund | | | 114,923,130 | | | | 54,205,343 | | | | 160,575,096 | | | | 50,165,143 | |
Target 2020 Fund | | | 580,835,205 | | | | 304,035,084 | | | | 811,565,684 | | | | 326,101,188 | |
Target 2025 Fund | | | 287,399,987 | | | | 193,676,038 | | | | 401,566,514 | | | | 265,675,490 | |
Target 2030 Fund | | | 398,295,105 | | | | 399,781,750 | | | | 556,513,510 | | | | 685,151,403 | |
Target 2035 Fund | | | 122,167,464 | | | | 193,385,728 | | | | 170,697,163 | | | | 380,879,665 | |
Target 2040 Fund | | | 131,619,912 | | | | 358,685,414 | | | | 183,904,493 | | | | 773,062,494 | |
Target 2045 Fund | | | 27,786,569 | | | | 138,127,134 | | | | 38,824,481 | | | | 313,763,747 | |
Target 2050 Fund | | | 27,278,589 | | | | 207,314,806 | | | | 38,114,712 | | | | 481,047,005 | |
Target 2055 Fund | | | 4,770,404 | | | | 36,978,749 | | | | 6,665,395 | | | | 85,871,206 | |
Target 2060 Fund | | | 908,575 | | | | 7,042,999 | | | | 1,269,496 | | | | 16,355,091 | |
| * | The Funds seek to achieve their investment objective by investing all of their investable assets in affiliated Master Portfolios. Purchases and sales related to these investments have been calculated by aggregating the results of multiplying each Fund’s ownership percentage of the respective affiliated Master Portfolio by the corresponding affiliated Master Portfolio’s purchases and sales. |
| | | | |
| 90 | | Wells Fargo Dow Jones Target Date Funds | | Notes to financial statements |
6. BANK BORROWINGS
The Trust is party to a $30,000,000 revolving credit agreement whereby each Fund is permitted to use bank borrowings for temporary or emergency purposes, such as to fund shareholder redemption requests. Interest under the credit agreement is charged to each Fund based on a borrowing rate equal to the higher of the Federal Funds rate in effect on that day plus 1.25% or the overnight LIBOR rate in effect on that day plus 1.25%. In addition, an annual commitment fee equal to 0.20% of the unused balance is allocated to each participating fund. Prior to August 30, 2016, the annual commitment fee was equal to 0.175% of the unused balance which was allocated to each participating fund.
For the year ended February 28, 2017, there were no borrowings by the Funds under the agreement.
7. DISTRIBUTIONS TO SHAREHOLDERS
The tax character of distributions paid during the years ended February 28, 2017 and February 29, 2016 were as follows:
| | | | | | | | | | | | | | | | |
| | | Ordinary income | | | Long-term capital gain | |
| | | 2017 | | | 2016 | | | 2017 | | | 2016 | |
Target Today Fund | | $ | 6,205,883 | | | $ | 5,627,893 | | | $ | 4,529,169 | | | $ | 10,068,892 | |
Target 2010 Fund | | | 4,319,691 | | | | 6,584,589 | | | | 5,079,696 | | | | 18,082,757 | |
Target 2015 Fund | | | 8,310,622 | | | | 9,737,982 | | | | 9,280,399 | | | | 11,919,435 | |
Target 2020 Fund | | | 33,835,576 | | | | 30,256,877 | | | | 29,958,752 | | | | 56,019,570 | |
Target 2025 Fund | | | 33,707,054 | | | | 29,655,061 | | | | 32,741,926 | | | | 53,022,030 | |
Target 2030 Fund | | | 41,923,591 | | | | 38,149,521 | | | | 40,826,732 | | | | 68,744,170 | |
Target 2035 Fund | | | 22,388,314 | | | | 19,585,081 | | | | 20,570,123 | | | | 35,298,474 | |
Target 2040 Fund | | | 34,183,584 | | | | 31,558,443 | | | | 32,519,652 | | | | 57,375,652 | |
Target 2045 Fund | | | 14,022,723 | | | | 12,062,951 | | | | 11,012,377 | | | | 20,102,168 | |
Target 2050 Fund | | | 25,094,635 | | | | 22,588,997 | | | | 19,651,014 | | | | 35,764,888 | |
Target 2055 Fund | | | 4,408,654 | | | | 2,738,996 | | | | 0 | | | | 396,883 | |
Target 2060 Fund | | | 134,122 | | | | 5,667 | * | | | 0 | | | | 0 | * |
| * | For the period from June 30, 2015 (commencement of operations) to February 29, 2016. |
As of February 28, 2017, the components of distributable earnings on a tax basis were as follows:
| | | | | | | | | | | | | | | | | | | | | | | | |
| | | Undistributed
ordinary
income | | | Undistributed
long-term
gain | | | Unrealized
gains (losses) | | | Late-year
ordinary losses
deferred | | | Post-October
capital losses
deferred | | | Capital loss
carryforward | |
Target Today Fund | | $ | 0 | | | $ | 4,436,552 | | | $ | 20,493,060 | | | $ | (763,398 | ) | | $ | 0 | | | $ | 0 | |
Target 2010 Fund | | | 0 | | | | 4,772,648 | | | | 27,549,137 | | | | (362,770 | ) | | | 0 | | | | 0 | |
Target 2015 Fund | | | 0 | | | | 7,877,434 | | | | 46,434,157 | | | | (777,441 | ) | | | 0 | | | | 0 | |
Target 2020 Fund | | | 0 | | | | 32,424,348 | | | | 151,872,252 | | | | (3,692,583 | ) | | | 0 | | | | 0 | |
Target 2025 Fund | | | 0 | | | | 34,204,089 | | | | 204,650,880 | | | | (1,451,620 | ) | | | 0 | | | | 0 | |
Target 2030 Fund | | | 0 | | | | 45,461,441 | | | | 230,139,697 | | | | (822,110 | ) | | | 0 | | | | 0 | |
Target 2035 Fund | | | 323,412 | | | | 23,811,923 | | | | 129,415,841 | | | | 0 | | | | 0 | | | | 0 | |
Target 2040 Fund | | | 1,457,509 | | | | 37,639,455 | | | | 193,577,436 | | | | 0 | | | | 0 | | | | 0 | |
Target 2045 Fund | | | 711,595 | | | | 13,902,502 | | | | 71,584,934 | | | | 0 | | | | 0 | | | | 0 | |
Target 2050 Fund | | | 1,359,080 | | | | 25,807,491 | | | | 152,157,023 | | | | 0 | | | | 0 | | | | 0 | |
Target 2055 Fund | | | 51,804 | | | | 0 | | | | 14,755,512 | | | | 0 | | | | 0 | | | | (1,822,061 | ) |
Target 2060 Fund | | | 0 | | | | 0 | | | | (1,291,340 | ) | | | (3,362 | ) | | | (107,945 | ) | | | (94,935 | ) |
| | | | | | |
| Notes to financial statements | | Wells Fargo Dow Jones Target Date Funds | | | 91 | |
8. INDEMNIFICATION
Under the Trust’s organizational documents, the officers and Trustees have been granted certain indemnification rights against certain liabilities that may arise out of performance of their duties to the Trust. Additionally, in the normal course of business, the Trust may enter into contracts with service providers that contain a variety of indemnification clauses. The Trust’s maximum exposure under these arrangements is dependent on future claims that may be made against the Funds and, therefore, cannot be estimated.
9. REDEMPTIONS IN-KIND
After the close of business on December 9, 2016, the following Funds each redeemed assets through a redemption in-kind from a shareholder in Class R6. Each Fund invests all of its assets in the affiliated Master Portfolios to achieve its investment objective. In each redemption transaction, each applicable Fund issued securities which it received from the affiliated Master Portfolios on a pro-rata basis. The value of securities from the Portfolios along with any cash issued in the redemption, the percentage of the Fund and Class R6 at the time of the transaction and the gains or losses realized by each Fund are reflected in the table below. The gains or losses realized by each Fund are reflected in the amounts on the Statements of Operations. The redemption in-kind is reflected on the Statements of Changes in Net Assets.
| | | | | | | | | | | | | | | | | | | | |
| | | Value of securities | | | Cash | | | % of Fund | | | % of Class R6 | | | Realized
gains | |
Target Today Fund | | $ | 105,982,689 | | | $ | 15,411,197 | | | | 21 | % | | | 56 | % | | $ | 13,693,939 | |
Target 2010 Fund | | | 44,481,032 | | | | 6,468,094 | | | | 15 | | | | 33 | | | | 9,446,049 | |
Target 2015 Fund | | | 141,203,562 | | | | 20,532,749 | | | | 27 | | | | 49 | | | | 18,589,051 | |
Target 2020 Fund | | | 446,374,230 | | | | 64,908,349 | | | | 22 | | | | 40 | | | | 107,022,336 | |
Target 2025 Fund | | | 922,814,403 | | | | 134,188,661 | | | | 47 | | | | 69 | | | | 97,311,715 | |
Target 2030 Fund | | | 620,359,094 | | | | 90,207,907 | | | | 27 | | | | 51 | | | | 205,832,959 | |
Target 2035 Fund | | | 410,931,047 | | | | 59,754,471 | | | | 34 | | | | 58 | | | | 116,877,858 | |
Target 2040 Fund | | | 485,327,423 | | | | 70,572,627 | | | | 28 | | | | 52 | | | | 211,673,564 | |
Target 2045 Fund | | | 249,349,193 | | | | 36,258,465 | | | | 34 | | | | 57 | | | | 88,998,866 | |
Target 2050 Fund | | | 584,732,726 | | | | 85,027,391 | | | | 46 | | | | 70 | | | | 131,256,617 | |
Target 2055 Fund | | | 136,882,005 | | | | 19,904,341 | | | | 50 | | | | 66 | | | | 25,419,397 | |
10. NEW ACCOUNTING PRONOUNCEMENT
In December 2016, FASB issued Accounting Standards Update (“ASU”) No. 2016-19, Technical Corrections and Improvements. ASU 2016-19 includes an amendment to FASB ASC Topic 820, Fair Value Measurement which clarifies the difference between a valuation approach and a valuation technique. The amendment also requires an entity to disclose when there has been a change in either or both a valuation approach and/or a valuation technique. The disclosure requirements are effective for fiscal years and interim periods within those fiscal years beginning after December 15, 2016. Management is currently evaluating the potential impact of this new guidance to the financial statements.
11. REGULATORY CHANGES
In October 2016, the Securities and Exchange Commission (“SEC”) adopted new rules and forms and amended existing rules and forms (together, “final rules”) intended to modernize and enhance the reporting and disclosure of information by registered investment companies and to enhance liquidity risk management by open-end mutual funds and exchange-traded funds. The final rules will enhance the quality of information available to investors and will allow the SEC to more effectively collect and use data reported by funds. In part, the final rules amend Regulation S-X and require standardized, enhanced disclosure about derivatives in the Funds’ financial statements, as well as other amendments. The compliance date for the amendments to Regulation S-X is August 1, 2017 while the compliance date for the new form types is June 1, 2018 and the compliance date for the liquidity risk management program requirements is December 1, 2018. Management is currently assessing the potential impact of these enhancements and their impact on the financial statement disclosures and reporting requirements.
| | | | |
| 92 | | Wells Fargo Dow Jones Target Date Funds | | Report of independent registered public accounting firm |
BOARD OF TRUSTEES AND SHAREHOLDERS OF WELLS FARGO FUNDS TRUST:
We have audited the accompanying statements of assets and liabilities, including the portfolios of investments, of the Wells Fargo Dow Jones Target Today Fund, Wells Fargo Dow Jones Target 2010 Fund, Wells Fargo Dow Jones Target 2015 Fund, Wells Fargo Dow Jones Target 2020 Fund, Wells Fargo Dow Jones Target 2025 Fund, Wells Fargo Dow Jones Target 2030 Fund, Wells Fargo Dow Jones Target 2035 Fund, Wells Fargo Dow Jones Target 2040 Fund, Wells Fargo Dow Jones Target 2045 Fund, Wells Fargo Dow Jones Target 2050 Fund, Wells Fargo Dow Jones Target 2055 Fund, and Wells Fargo Dow Jones Target 2060 Fund (collectively, the “Funds”), twelve of the funds constituting the Wells Fargo Funds Trust as of February 28, 2017, and the related statements of operations for the year then ended, the statements of changes in net assets for each of the years or periods in the two-year period then ended, and the financial highlights for each of the years or periods in the five-year period then ended. These financial statements and financial highlights are the responsibility of the Funds’ management. Our responsibility is to express an opinion on these financial statements and financial highlights based on our audits.
We conducted our audits in accordance with the standards of the Public Company Accounting Oversight Board (United States). Those standards require that we plan and perform the audit to obtain reasonable assurance about whether the financial statements and financial highlights are free of material misstatement. An audit includes examining, on a test basis, evidence supporting the amounts and disclosures in the financial statements. Our procedures included confirmation of investments owned as of February 28, 2017, by correspondence with the transfer agent or by other appropriate auditing procedures. An audit also includes assessing the accounting principles used and significant estimates made by management, as well as evaluating the overall financial statement presentation. We believe that our audits provide a reasonable basis for our opinion.
In our opinion, the financial statements and financial highlights referred to above present fairly, in all material respects, the financial position of the Funds as of February 28, 2017, the results of their operations for the year then ended, the changes in their net assets for each of the years or periods in the two-year period then ended, and the financial highlights for each of the years or periods in the five-year period then ended, in conformity with U.S. generally accepted accounting principles.

Boston, MA
April 26, 2017
| | | | | | |
| Summary portfolio of investments—February 28, 2017 | | Wells Fargo Dow Jones Target Date Funds | | | 93 | |
DIVERSIFIED FIXED INCOME PORTFOLIO
The Summary portfolio of investments shows the 50 largest portfolio holdings in unaffiliated issuers and any holdings exceeding 1% of the total net assets as of the report date. The remaining securities held are grouped as “Other securities” in each category.
| | | | | | | | | | | | | | | | | | | | |
| Security name | | Interest rate | | | Maturity date | | | Principal | | | Value | | | Percent of
net assets | |
| | | | | |
Agency Securities: 26.42% | | | | | | | | | | | | | | | | | | | | |
FHLB | | | 0.88-6.00 | % | | | 3-19-2018 to 11-1-2043 | | | $ | 61,985,302 | | | $ | 63,604,734 | | | | 2.08 | % |
FHLMC | | | 0.75-6.75 | | | | 8-1-2017 to 3-13-2047 | | | | 142,938,295 | | | | 148,236,891 | | | | 4.85 | |
FHLMC | | | 2.50 | | | | 5-1-2031 | | | | 8,274,048 | | | | 8,302,724 | | | | 0.27 | |
FHLMC | | | 3.00 | | | | 8-1-2045 | | | | 7,615,576 | | | | 7,564,943 | | | | 0.25 | |
FNMA | | | 0.00-7.25 | | | | 4-1-2017 to 3-13-2047 | | | | 303,466,527 | | | | 314,717,783 | | | | 10.31 | |
FNMA | | | 3.00 | | | | 5-1-2046 | | | | 8,823,149 | | | | 8,773,533 | | | | 0.29 | |
FNMA | | | 3.00 | | | | 8-1-2046 | | | | 9,465,615 | | | | 9,412,386 | | | | 0.31 | |
FNMA | | | 3.50 | | | | 1-1-2045 | | | | 8,443,155 | | | | 8,662,645 | | | | 0.28 | |
FNMA | | | 3.50 | | | | 8-1-2045 | | | | 6,767,926 | | | | 6,953,327 | | | | 0.23 | |
FNMA %% | | | 3.50 | | | | 3-13-2047 | | | | 11,000,000 | | | | 11,273,282 | | | | 0.37 | |
GNMA | | | 3.00-7.00 | | | | 11-15-2023 to 3-21-2047 | | | | 159,629,899 | | | | 167,237,159 | | | | 5.48 | |
GNMA | | | 3.00 | | | | 11-20-2046 | | | | 9,270,048 | | | | 9,393,063 | | | | 0.31 | |
GNMA %% | | | 3.00 | | | | 3-21-2047 | | | | 8,000,000 | | | | 8,094,687 | | | | 0.27 | |
GNMA | | | 3.50 | | | | 4-20-2045 | | | | 9,048,129 | | | | 9,429,422 | | | | 0.31 | |
GNMA | | | 3.50 | | | | 4-20-2046 | | | | 9,598,941 | | | | 9,991,524 | | | | 0.33 | |
GNMA | | | 3.50 | | | | 7-20-2046 | | | | 8,849,135 | | | | 9,211,051 | | | | 0.30 | |
Other securities | | | | 5,615,645 | | | | 0.18 | |
| | |
Total Agency Securities (Cost $801,271,277) | | | | 806,474,799 | | | | 26.42 | |
| | | | | | | | | | | | | | | | | | | | |
| | | | | |
Corporate Bonds and Notes: 20.77% | | | | | | | | | | | | | | | | | | | | |
| | | | | |
Consumer Discretionary: 1.89% | | | | | | | | | | | | | | | | | | | | |
| | | | | |
| Auto Components: 0.04% | | | | | | | | | | | | | | | | | | | | |
Other securities | | | | 1,122,349 | | | | 0.04 | |
| | | | | | | | | | | | | | | | | | | | |
| | | | | |
| Automobiles: 0.08% | | | | | | | | | | | | | | | | | | | | |
Other securities | | | | 2,380,990 | | | | 0.08 | |
| | | | | | | | | | | | | | | | | | | | |
| | | | | |
| Diversified Consumer Services: 0.05% | | | | | | | | | | | | | | | | | | | | |
Other securities | | | | 1,445,332 | | | | 0.05 | |
| | | | | | | | | | | | | | | | | | | | |
| | | | | |
| Hotels, Restaurants & Leisure: 0.16% | | | | | | | | | | | | | | | | | | | | |
Other securities | | | | 4,948,668 | | | | 0.16 | |
| | | | | | | | | | | | | | | | | | | | |
| | | | | |
| Household Durables: 0.09% | | | | | | | | | | | | | | | | | | | | |
Other securities | | | | 2,762,750 | | | | 0.09 | |
| | | | | | | | | | | | | | | | | | | | |
| | | | |
| Internet & Direct Marketing Retail: 0.09% | | | | | | | | | | | | | | | | | |
Other securities | | | | 2,746,024 | | | | 0.09 | |
| | | | | | | | | | | | | | | | | | | | |
| | | | | |
| Leisure Products: 0.01% | | | | | | | | | | | | | | | | | | | | |
Other securities | | | | 433,470 | | | | 0.01 | |
| | | | | | | | | | | | | | | | | | | | |
| | | | | |
| Media: 0.96% | | | | | | | | | | | | | | | | | | | | |
Other securities | | | | 29,314,776 | | | | 0.96 | |
| | | | | | | | | | | | | | | | | | | | |
| | | | | |
| Multiline Retail: 0.14% | | | | | | | | | | | | | | | | | | | | |
Other securities | | | | 4,281,815 | | | | 0.14 | |
| | | | | | | | | | | | | | | | | | | | |
The accompanying notes are an integral part of these financial statements.
| | | | |
| 94 | | Wells Fargo Dow Jones Target Date Funds | | Summary portfolio of investments—February 28, 2017 |
DIVERSIFIED FIXED INCOME PORTFOLIO
| | | | | | | | | | | | | | | | | | | | |
| Security name | | | | | | | | | | | Value | | | Percent of
net assets | |
| | | | | |
| Specialty Retail: 0.24% | | | | | | | | | | | | | | | | | | | | |
Other securities | | | $ | 7,241,131 | | | | 0.24 | % |
| | | | | | | | | | | | | | | | | | | | |
| | | | | |
| Textiles, Apparel & Luxury Goods: 0.03% | | | | | | | | | | | | | | | | | | | | |
Other securities | | | | 834,405 | | | | 0.03 | |
| | | | | | | | | | | | | | | | | | | | |
| | | | | |
Consumer Staples: 1.80% | | | | | | | | | | | | | | | | | | | | |
| | | | | |
| Beverages: 0.67% | | | | | | | | | | | | | | | | | | | | |
Other securities | | | | 20,406,558 | | | | 0.67 | |
| | | | | | | | | | | | | | | | | | | | |
| | | | | |
| Food & Staples Retailing: 0.47% | | | | | | | | | | | | | | | | | | | | |
Other securities | | | | 14,276,946 | | | | 0.47 | |
| | | | | | | | | | | | | | | | | | | | |
| | | | | |
| Food Products: 0.30% | | | | | | | | | | | | | | | | | | | | |
Other securities | | | | 9,302,724 | | | | 0.30 | |
| | | | | | | | | | | | | | | | | | | | |
| | | | | |
| Household Products: 0.10% | | | | | | | | | | | | | | | | | | | | |
Other securities | | | | 3,029,608 | | | | 0.10 | |
| | | | | | | | | | | | | | | | | | | | |
| | | | | |
| Personal Products: 0.01% | | | | | | | | | | | | | | | | | | | | |
Other securities | | | | 172,983 | | | | 0.01 | |
| | | | | | | | | | | | | | | | | | | | |
| | | | | |
| Tobacco: 0.25% | | | | | | | | | | | | | | | | | | | | |
Other securities | | | | 7,784,001 | | | | 0.25 | |
| | | | | | | | | | | | | | | | | | | | |
| | | | | |
Energy: 1.79% | | | | | | | | | | | | | | | | | | | | |
| | | | | |
| Energy Equipment & Services: 0.10% | | | | | | | | | | | | | | | | | | | | |
Other securities | | | | 3,023,377 | | | | 0.10 | |
| | | | | | | | | | | | | | | | | | | | |
| | | | | |
| Oil, Gas & Consumable Fuels: 1.69% | | | | | | | | | | | | | | | | | | | | |
Other securities | | | | 51,718,804 | | | | 1.69 | |
| | | | | | | | | | | | | | | | | | | | |
| | | | | |
| | | Interest rate | | | Maturity date | | | Principal | | | | | | | |
| | | | | |
Financials: 5.60% | | | | | | | | | | | | | | | | | | | | |
| | | | | |
| Banks: 2.41% | | | | | | | | | | | | | | | | | | | | |
Wachovia Bank NA (l) | | | 6.60 | % | | | 1-15-2038 | | | $ | 350,000 | | | | 460,354 | | | | 0.02 | |
Wells Fargo & Company (l) | | | 2.15 | | | | 1-30-2020 | | | | 1,250,000 | | | | 1,251,794 | | | | 0.04 | |
Wells Fargo & Company (l) | | | 3.00 | | | | 2-19-2025 | | | | 875,000 | | | | 856,412 | | | | 0.03 | |
Wells Fargo & Company (l) | | | 3.00 | | | | 4-22-2026 | | | | 875,000 | | | | 845,054 | | | | 0.03 | |
Wells Fargo & Company (l) | | | 3.00 | | | | 10-23-2026 | | | | 1,000,000 | | | | 960,700 | | | | 0.03 | |
Wells Fargo & Company (l) | | | 3.30 | | | | 9-9-2024 | | | | 450,000 | | | | 451,935 | | | | 0.02 | |
Wells Fargo & Company (l) | | | 3.45 | | | | 2-13-2023 | | | | 525,000 | | | | 531,912 | | | | 0.02 | |
Wells Fargo & Company (l) | | | 3.50 | | | | 3-8-2022 | | | | 700,000 | | | | 725,676 | | | | 0.02 | |
Wells Fargo & Company (l) | | | 3.90 | | | | 5-1-2045 | | | | 925,000 | | | | 894,198 | | | | 0.03 | |
Wells Fargo & Company (l) | | | 4.10 | | | | 6-3-2026 | | | | 700,000 | | | | 716,145 | | | | 0.02 | |
Wells Fargo & Company (l) | | | 4.13 | | | | 8-15-2023 | | | | 700,000 | | | | 733,415 | | | | 0.02 | |
Wells Fargo & Company (l) | | | 4.60 | | | | 4-1-2021 | | | | 875,000 | | | | 943,804 | | | | 0.03 | |
Wells Fargo & Company (l) | | | 5.38 | | | | 11-2-2043 | | | | 700,000 | | | | 793,630 | | | | 0.03 | |
Wells Fargo & Company (l) | | | 5.61 | | | | 1-15-2044 | | | | 700,000 | | | | 820,366 | | | | 0.03 | |
The accompanying notes are an integral part of these financial statements.
| | | | | | |
| Summary portfolio of investments—February 28, 2017 | | Wells Fargo Dow Jones Target Date Funds | | | 95 | |
DIVERSIFIED FIXED INCOME PORTFOLIO
| | | | | | | | | | | | | | | | | | | | |
| Security name | | Interest rate | | | Maturity date | | | Principal | | | Value | | | Percent of
net assets | |
| | | | | |
| Banks (continued) | | | | | | | | | | | | | | | | | | | | |
Wells Fargo Bank NA (l) | | | 5.95 | % | | | 8-26-2036 | | | $ | 100,000 | | | $ | 122,066 | | | | 0.00 | % |
Wells Fargo Capital X (l) | | | 5.95 | | | | 12-1-2086 | | | | 350,000 | | | | 373,625 | | | | 0.01 | |
Other securities | | | | 62,044,113 | | | | 2.03 | |
| | |
| | | | 73,525,199 | | | | 2.41 | |
| | | | | | | | | | | | | | | | | | | | |
| | | | | |
| Capital Markets: 1.19% | | | | | | | | | | | | | | | | | | | | |
Other securities | | | | 36,284,804 | | | | 1.19 | |
| | | | | | | | | | | | | | | | | | | | |
| | | | | |
| Consumer Finance: 0.98% | | | | | | | | | | | | | | | | | | | | |
Other securities | | | | 29,754,349 | | | | 0.98 | |
| | | | | | | | | | | | | | | | | | | | |
| | | | | |
| Diversified Financial Services: 0.27% | | | | | | | | | | | | | | | | | | | | |
Other securities | | | | 8,099,808 | | | | 0.27 | |
| | | | | | | | | | | | | | | | | | | | |
| | | | | |
| Insurance: 0.75% | | | | | | | | | | | | | | | | | | | | |
Other securities | | | | | | | | | | | | | | | 23,029,301 | | | | 0.75 | |
| | | | | | | | | | | | | | | | | | | | |
| | | | | |
| Thrifts & Mortgage Finance: 0.00% | | | | | | | | | | | | | | | | | | | | |
Other securities | | | | | | | | | | | | | | | 106,745 | | | | 0.00 | |
| | | | | | | | | | | | | | | | | | | | |
| | | | | |
Health Care: 2.21% | | | | | | | | | | | | | | | | | | | | |
| | | | | |
| Biotechnology: 0.55% | | | | | | | | | | | | | | | | | | | | |
Other securities | | | | | | | | | | | | | | | 16,874,955 | | | | 0.55 | |
| | | | | | | | | | | | | | | | | | | | |
| | | | | |
| Health Care Equipment & Supplies: 0.32% | | | | | | | | | | | | | | | | | | | | |
Other securities | | | | | | | | | | | | | | | 9,712,337 | | | | 0.32 | |
| | | | | | | | | | | | | | | | | | | | |
| | | | | |
| Health Care Providers & Services: 0.58% | | | | | | | | | | | | | | | | | | | | |
Other securities | | | | | | | | | | | | | | | 17,799,467 | | | | 0.58 | |
| | | | | | | | | | | | | | | | | | | | |
| | | | | |
| Life Sciences Tools & Services: 0.06% | | | | | | | | | | | | | | | | | | | | |
Other securities | | | | | | | | | | | | | | | 1,896,644 | | | | 0.06 | |
| | | | | | | | | | | | | | | | | | | | |
| | | | | |
| Pharmaceuticals: 0.70% | | | | | | | | | | | | | | | | | | | | |
Other securities | | | | | | | | | | | | | | | 21,279,003 | | | | 0.70 | |
| | | | | | | | | | | | | | | | | | | | |
| | | | | |
Industrials: 1.54% | | | | | | | | | | | | | | | | | | | | |
| | | | | |
| Aerospace & Defense: 0.44% | | | | | | | | | | | | | | | | | | | | |
Other securities | | | | | | | | | | | | | | | 13,332,126 | | | | 0.44 | |
| | | | | | | | | | | | | | | | | | | | |
| | | | | |
| Air Freight & Logistics: 0.10% | | | | | | | | | | | | | | | | | | | | |
Other securities | | | | | | | | | | | | | | | 2,977,150 | | | | 0.10 | |
| | | | | | | | | | | | | | | | | | | | |
| | | | | |
| Airlines: 0.06% | | | | | | | | | | | | | | | | | | | | |
Other securities | | | | | | | | | | | | | | | 1,930,751 | | | | 0.06 | |
| | | | | | | | | | | | | | | | | | | | |
| | | | | |
| Building Products: 0.06% | | | | | | | | | | | | | | | | | | | | |
Other securities | | | | | | | | | | | | | | | 1,798,930 | | | | 0.06 | |
| | | | | | | | | | | | | | | | | | | | |
The accompanying notes are an integral part of these financial statements.
| | | | |
| 96 | | Wells Fargo Dow Jones Target Date Funds | | Summary portfolio of investments—February 28, 2017 |
DIVERSIFIED FIXED INCOME PORTFOLIO
| | | | | | | | | | | | | | | | | | | | |
| Security name | | | | | | | | | | | Value | | | Percent of
net assets | |
| | | | | |
| Commercial Services & Supplies: 0.12% | | | | | | | | | | | | | | | | | | | | |
Other securities | | | | | | | | | | | | | | $ | 3,708,039 | | | | 0.12 | % |
| | | | | | | | | | | | | | | | | | | | |
| | | | | |
| Electrical Equipment: 0.08% | | | | | | | | | | | | | | | | | | | | |
Other securities | | | | | | | | | | | | | | | 2,470,310 | | | | 0.08 | |
| | | | | | | | | | | | | | | | | | | | |
| | | | | |
| Industrial Conglomerates: 0.08% | | | | | | | | | | | | | | | | | | | | |
Other securities | | | | | | | | | | | | | | | 2,450,349 | | | | 0.08 | |
| | | | | | | | | | | | | | | | | | | | |
| | | | | |
| Machinery: 0.26% | | | | | | | | | | | | | | | | | | | | |
Other securities | | | | | | | | | | | | | | | 7,995,046 | | | | 0.26 | |
| | | | | | | | | | | | | | | | | | | | |
| | | | | |
| Professional Services: 0.03% | | | | | | | | | | | | | | | | | | | | |
Other securities | | | | | | | | | | | | | | | 796,296 | | | | 0.03 | |
| | | | | | | | | | | | | | | | | | | | |
| | | | | |
| Road & Rail: 0.29% | | | | | | | | | | | | | | | | | | | | |
Other securities | | | | | | | | | | | | | | | 8,975,799 | | | | 0.29 | |
| | | | | | | | | | | | | | | | | | | | |
| | | | | |
| Trading Companies & Distributors: 0.02% | | | | | | | | | | | | | | | | | | | | |
Other securities | | | | | | | | | | | | | | | 689,755 | | | | 0.02 | |
| | | | | | | | | | | | | | | | | | | | |
| | | | | |
Information Technology: 1.94% | | | | | | | | | | | | | | | | | | | | |
| | | | | |
| Communications Equipment: 0.22% | | | | | | | | | | | | | | | | | | | | |
Other securities | | | | | | | | | | | | | | | 6,652,104 | | | | 0.22 | |
| | | | | | | | | | | | | | | | | | | | |
| | | | | |
| Electronic Equipment, Instruments & Components: 0.06% | | | | | | | | | | | | | | | | | | | | |
Other securities | | | | | | | | | | | | | | | 1,951,364 | | | | 0.06 | |
| | | | | | | | | | | | | | | | | | | | |
| | | | | |
| Internet Software & Services: 0.05% | | | | | | | | | | | | | | | | | | | | |
Other securities | | | | | | | | | | | | | | | 1,596,362 | | | | 0.05 | |
| | | | | | | | | | | | | | | | | | | | |
| | | | | |
| IT Services: 0.34% | | | | | | | | | | | | | | | | | | | | |
Other securities | | | | | | | | | | | | | | | 10,424,406 | | | | 0.34 | |
| | | | | | | | | | | | | | | | | | | | |
| | | | | |
| Semiconductors & Semiconductor Equipment: 0.24% | | | | | | | | | | | | | | | | | | | | |
Other securities | | | | | | | | | | | | | | | 7,300,317 | | | | 0.24 | |
| | | | | | | | | | | | | | | | | | | | |
| | | | | |
| Software: 0.60% | | | | | | | | | | | | | | | | | | | | |
Other securities | | | | | | | | | | | | | | | 18,214,133 | | | | 0.60 | |
| | | | | | | | | | | | | | | | | | | | |
| | | | | |
| Technology Hardware, Storage & Peripherals: 0.43% | | | | | | | | | | | | | | | | | | | | |
Other securities | | | | | | | | | | | | | | | 13,127,438 | | | | 0.43 | |
| | | | | | | | | | | | | | | | | | | | |
| | | | | |
Materials: 0.55% | | | | | | | | | | | | | | | | | | | | |
| | | | | |
| Chemicals: 0.35% | | | | | | | | | | | | | | | | | | | | |
Other securities | | | | | | | | | | | | | | | 10,516,879 | | | | 0.35 | |
| | | | | | | | | | | | | | | | | | | | |
| | | | | |
| Construction Materials: 0.00% | | | | | | | | | | | | | | | | | | | | |
Other securities | | | | | | | | | | | | | | | 91,167 | | | | 0.00 | |
| | | | | | | | | | | | | | | | | | | | |
| | | | | |
| Containers & Packaging: 0.01% | | | | | | | | | | | | | | | | | | | | |
Other securities | | | | | | | | | | | | | | | 405,595 | | | | 0.01 | |
| | | | | | | | | | | | | | | | | | | | |
The accompanying notes are an integral part of these financial statements.
| | | | | | |
| Summary portfolio of investments—February 28, 2017 | | Wells Fargo Dow Jones Target Date Funds | | | 97 | |
DIVERSIFIED FIXED INCOME PORTFOLIO
| | | | | | | | | | | | | | | | | | | | |
| Security name | | | | | | | | | | | Value | | | Percent of
net assets | |
| | | | | |
| Metals & Mining: 0.10% | | | | | | | | | | | | | | | | | | | | |
Other securities | | | | | | | | | | | | | | $ | 3,161,763 | | | | 0.10 | % |
| | | | | | | | | | | | | | | | | | | | |
| | | | | |
| Paper & Forest Products: 0.09% | | | | | | | | | | | | | | | | | | | | |
Other securities | | | | | | | | | | | | | | | 2,717,560 | | | | 0.09 | |
| | | | | | | | | | | | | | | | | | | | |
| | | | | |
Real Estate: 0.74% | | | | | | | | | | | | | | | | | | | | |
| | | | | |
| Equity REITs: 0.72% | | | | | | | | | | | | | | | | | | | | |
Other securities | | | | | | | | | | | | | | | 22,072,195 | | | | 0.72 | |
| | | | | | | | | | | | | | | | | | | | |
| | | | |
| Real Estate Management & Development: 0.02% | | | | | | | | | | | | | | | | | |
Other securities | | | | | | | | | | | | | | | 406,441 | | | | 0.02 | |
| | | | | | | | | | | | | | | | | | | | |
| | | | | |
Telecommunication Services: 0.84% | | | | | | | | | | | | | | | | | | | | |
| | | | |
| Diversified Telecommunication Services: 0.83% | | | | | | | | | | | | | | | | | |
Other securities | | | | | | | | | | | | | | | 25,257,384 | | | | 0.83 | |
| | | | | | | | | | | | | | | | | | | | |
| | | | |
| Wireless Telecommunication Services: 0.01% | | | | | | | | | | | | | | | | | |
Other securities | | | | | | | | | | | | | | | 359,014 | | | | 0.01 | |
| | | | | | | | | | | | | | | | | | | | |
| | | | | |
Utilities: 1.87% | | | | | | | | | | | | | | | | | | | | |
| | | | | |
| Electric Utilities: 1.42% | | | | | | | | | | | | | | | | | | | | |
Other securities | | | | 43,427,320 | | | | 1.42 | |
| | | | | | | | | | | | | | | | | | | | |
| | | | | |
| Gas Utilities: 0.10% | | | | | | | | | | | | | | | | | | | | |
Other securities | | | | 2,980,449 | | | | 0.10 | |
| | | | | | | | | | | | | | | | | | | | |
| | | |
| Independent Power & Renewable Electricity Producers: 0.01% | | | | | | | | | | | | | |
Other securities | | | | 308,241 | | | | 0.01 | |
| | | | | | | | | | | | | | | | | | | | |
| | | | | |
| Multi-Utilities: 0.33% | | | | | | | | | | | | | | | | | | | | |
Other securities | | | | 10,048,310 | | | | 0.33 | |
| | | | | | | | | | | | | | | | | | | | |
| | | | | |
| Water Utilities: 0.01% | | | | | | | | | | | | | | | | | | | | |
Other securities | | | | 216,055 | | | | 0.01 | |
| | | | | | | | | | | | | | | | | | | | |
| | |
Total Corporate Bonds and Notes (Cost $609,715,679) | | | | 633,948,371 | | | | 20.77 | |
| | | | | | | | | | | | | | | | | | | | |
| | | | | |
| | | Interest rate | | | Maturity date | | | Principal | | | | | | | |
| | | | | |
Foreign Government Bonds @: 24.84% | | | | | | | | | | | | | | | | | | | | |
France Government Bond (EUR) | | | 0.00-8.50 | % | | | 4-25-2018 to 5-25-2066 | | | | 58,882,000 | | | | 73,127,338 | | | | 2.40 | |
Italy Buoni Poliennali del Tesoro (EUR) | | | 0.05-9.00 | | | | 5- 15-2018 to 3-1-2067 | | | | 58,047,000 | | | | 69,996,968 | | | | 2.29 | |
Japan Government Ten Year Bond (JPY) | | | 0.10-1.80 | | | | 3-20-2018 to 12-20-2026 | | | | 14,803,950,000 | | | | 136,793,437 | | | | 4.48 | |
Japan Government Thirty Year Bond (JPY) | | | 0.30-2.90 | | | | 5- 20-2030 to 9-20-2046 | | | | 3,862,850,000 | | | | 43,535,175 | | | | 1.43 | |
Japan Government Twenty Year Bond (JPY) | | | 0.20-2.50 | | | | 9-20-2018 to 12-20-2036 | | | | 12,297,600,000 | | | | 127,105,717 | | | | 4.16 | |
United Kingdom Gilt (GBP) | | | 0.50-8.00 | | | | 3- 7-2018 to 7-22-2068 | | | | 51,806,000 | | | | 82,893,099 | | | | 2.72 | |
Other securities | | | | | | | | | | | 224,765,747 | | | | 7.36 | |
| | |
Total Foreign Government Bonds (Cost $813,427,309) | | | | 758,217,481 | | | | 24.84 | |
| | | | | | | | | | | | | | | | | | | | |
The accompanying notes are an integral part of these financial statements.
| | | | |
| 98 | | Wells Fargo Dow Jones Target Date Funds | | Summary portfolio of investments—February 28, 2017 |
DIVERSIFIED FIXED INCOME PORTFOLIO
| | | | | | | | | | | | | | | | | | | | |
| Security name | | Interest rate | | | Maturity date | | | Principal | | | Value | | | Percent of
net assets | |
| | | | | |
U.S. Treasury Securities: 23.20% | | | | | | | | | | | | | | | | | | | | |
U.S. Treasury Bond | | | 2.25-6.25 | % | | | 2-15-2026 to 2-15-2047 | | | $ | 86,116,000 | | | $ | 91,155,596 | | | | 2.99 | % |
U.S. Treasury Bond | | | 2.50 | | | | 2-15-2045 | | | | 9,922,000 | | | | 9,004,602 | | | | 0.29 | |
U.S. Treasury Bond | | | 3.63 | | | | 2-15-2044 | | | | 6,824,000 | | | | 7,675,137 | | | | 0.25 | |
U.S. Treasury Note | | | 0.63 | | | | 6-30-2018 | | | | 10,000,000 | | | | 9,943,750 | | | | 0.33 | |
U.S. Treasury Note | | | 0.75 | | | | 4-30-2018 | | | | 10,000,000 | | | | 9,969,530 | | | | 0.33 | |
U.S. Treasury Note | | | 0.75-9.13 | | | | 3-15-2018 to 2-15-2027 | | | | 279,320,000 | | | | 284,468,738 | | | | 9.32 | |
U.S. Treasury Note | | | 1.00 | | | | 6-30-2019 | | | | 7,496,000 | | | | 7,439,195 | | | | 0.24 | |
U.S. Treasury Note | | | 1.00 | | | | 11-30-2019 | | | | 6,999,000 | | | | 6,917,525 | | | | 0.23 | |
U.S. Treasury Note | | | 1.13 | | | | 4-30-2020 | | | | 10,498,000 | | | | 10,360,214 | | | | 0.34 | |
U.S. Treasury Note | | | 1.25 | | | | 10-31-2018 | | | | 6,999,000 | | | | 7,009,387 | | | | 0.23 | |
U.S. Treasury Note | | | 1.25 | | | | 2-29-2020 | | | | 6,999,000 | | | | 6,947,053 | | | | 0.23 | |
U.S. Treasury Note | | | 1.25 | | | | 10-31-2021 | | | | 10,100,000 | | | | 9,815,150 | | | | 0.32 | |
U.S. Treasury Note | | | 1.38 | | | | 9-30-2018 | | | | 7,698,000 | | | | 7,727,768 | | | | 0.25 | |
U.S. Treasury Note | | | 1.38 | | | | 4-30-2020 | | | | 10,848,000 | | | | 10,786,557 | | | | 0.35 | |
U.S. Treasury Note | | | 1.38 | | | | 5-31-2020 | | | | 6,999,000 | | | | 6,952,793 | | | | 0.23 | |
U.S. Treasury Note | | | 1.38 | | | | 4-30-2021 | | | | 6,999,000 | | | | 6,880,619 | | | | 0.23 | |
U.S. Treasury Note | | | 1.38 | | | | 5-31-2021 | | | | 6,999,000 | | | | 6,873,235 | | | | 0.23 | |
U.S. Treasury Note | | | 1.50 | | | | 8-31-2018 | | | | 8,398,000 | | | | 8,447,204 | | | | 0.28 | |
U.S. Treasury Note | | | 1.63 | | | | 3-31-2019 | | | | 6,999,000 | | | | 7,049,855 | | | | 0.23 | |
U.S. Treasury Note | | | 1.63 | | | | 2-15-2026 | | | | 9,798,000 | | | | 9,215,480 | | | | 0.30 | |
U.S. Treasury Note | | | 1.63 | | | | 5-15-2026 | | | | 7,698,000 | | | | 7,224,696 | | | | 0.24 | |
U.S. Treasury Note | | | 1.75 | | | | 5-15-2023 | | | | 8,748,000 | | | | 8,562,787 | | | | 0.28 | |
U.S. Treasury Note | | | 2.00 | | | | 11-30-2020 | | | | 6,999,000 | | | | 7,073,910 | | | | 0.23 | |
U.S. Treasury Note | | | 2.00 | | | | 2-15-2025 | | | | 11,548,000 | | | | 11,299,903 | | | | 0.37 | |
U.S. Treasury Note | | | 2.00 | | | | 8-15-2025 | | | | 9,448,000 | | | | 9,205,895 | | | | 0.30 | |
U.S. Treasury Note | | | 2.00 | | | | 11-15-2026 | | | | 7,249,000 | | | | 7,012,277 | | | | 0.23 | |
U.S. Treasury Note | | | 2.13 | | | | 8-31-2020 | | | | 9,098,000 | | | | 9,247,971 | | | | 0.30 | |
U.S. Treasury Note | | | 2.13 | | | | 1-31-2021 | | | | 6,999,000 | | | | 7,100,157 | | | | 0.23 | |
U.S. Treasury Note | | | 2.13 | | | | 8-15-2021 | | | | 6,999,000 | | | | 7,079,104 | | | | 0.23 | |
U.S. Treasury Note | | | 2.13 | | | | 5-15-2025 | | | | 6,999,000 | | | | 6,900,027 | | | | 0.23 | |
U.S. Treasury Note | | | 2.25 | | | | 11-15-2024 | | | | 7,947,000 | | | | 7,934,587 | | | | 0.26 | |
U.S. Treasury Note | | | 2.25 | | | | 11-15-2025 | | | | 8,048,000 | | | | 7,985,757 | | | | 0.26 | |
U.S. Treasury Note | | | 2.38 | | | | 8-15-2024 | | | | 10,498,000 | | | | 10,592,723 | | | | 0.35 | |
U.S. Treasury Note | | | 2.50 | | | | 8-15-2023 | | | | 9,973,000 | | | | 10,191,937 | | | | 0.33 | |
U.S. Treasury Note | | | 2.50 | | | | 5-15-2024 | | | | 10,848,000 | | | | 11,053,092 | | | | 0.36 | |
U.S. Treasury Note | | | 2.63 | | | | 8-15-2020 | | | | 8,398,000 | | | | 8,678,149 | | | | 0.28 | |
U.S. Treasury Note | | | 2.63 | | | | 11-15-2020 | | | | 10,498,000 | | | | 10,850,260 | | | | 0.36 | |
U.S. Treasury Note | | | 2.75 | | | | 2-15-2024 | | | | 12,772,000 | | | | 13,233,491 | | | | 0.43 | |
U.S. Treasury Note | | | 3.63 | | | | 8-15-2019 | | | | 6,649,000 | | | | 7,011,577 | | | | 0.23 | |
U.S. Treasury Note | | | 3.63 | | | | 2-15-2020 | | | | 14,347,000 | | | | 15,232,998 | | | | 0.50 | |
| | |
Total U.S. Treasury Securities (Cost $702,256,252) | | | | 708,110,686 | | | | 23.20 | |
| | | | | | | | | | | | | | | | | | | | |
| | | | | |
Yankee Corporate Bonds and Notes: 4.08% | | | | | | | | | | | | | | | | | | | | |
| | | | | |
Consumer Discretionary: 0.06% | | | | | | | | | | | | | | | | | | | | |
| | | | | |
| Auto Components: 0.01% | | | | | | | | | | | | | | | | | | | | |
Other securities | | | | 184,965 | | | | 0.01 | |
| | | | | | | | | | | | | | | | | | | | |
The accompanying notes are an integral part of these financial statements.
| | | | | | |
| Summary portfolio of investments—February 28, 2017 | | Wells Fargo Dow Jones Target Date Funds | | | 99 | |
DIVERSIFIED FIXED INCOME PORTFOLIO
| | | | | | | | | | | | | | | | | | | | |
| Security name | | | | | | | | | | | Value | | | Percent of
net assets | |
| | | | | |
| Media: 0.05% | | | | | | | | | | | | | | | | | | | | |
Other securities | | | $ | 1,702,546 | | | | 0.05 | % |
| | | | | | | | | | | | | | | | | | | | |
| | | | | |
Consumer Staples: 0.07% | | | | | | | | | | | | | | | | | | | | |
| | | | | |
| Beverages: 0.07% | | | | | | | | | | | | | | | | | | | | |
Other securities | | | | 2,043,857 | | | | 0.07 | |
| | | | | | | | | | | | | | | | | | | | |
| | | | | |
Energy: 0.42% | | | | | | | | | | | | | | | | | | | | |
| | | | | |
| Oil, Gas & Consumable Fuels: 0.42% | | | | | | | | | | | | | | | | | | | | |
Other securities | | | | 12,696,960 | | | | 0.42 | |
| | | | | | | | | | | | | | | | | | | | |
| | | | | |
Financials: 2.32% | | | | | | | | | | | | | | | | | | | | |
| | | | | |
| Banks: 1.66% | | | | | | | | | | | | | | | | | | | | |
Other securities | | | | 50,506,852 | | | | 1.66 | |
| | | | | | | | | | | | | | | | | | | | |
| | | | | |
| Capital Markets: 0.09% | | | | | | | | | | | | | | | | | | | | |
Other securities | | | | 2,891,033 | | | | 0.09 | |
| | | | | | | | | | | | | | | | | | | | |
| | | | | |
| Diversified Financial Services: 0.49% | | | | | | | | | | | | | | | | | | | | |
Other securities | | | | 15,069,969 | | | | 0.49 | |
| | | | | | | | | | | | | | | | | | | | |
| | | | | |
| Insurance: 0.08% | | | | | | | | | | | | | | | | | | | | |
Other securities | | | | 2,367,103 | | | | 0.08 | |
| | | | | | | | | | | | | | | | | | | | |
| | | | | |
Health Care: 0.37% | | | | | | | | | | | | | | | | | | | | |
| | | | | |
| Health Care Equipment & Supplies: 0.01% | | | | | | | | | | | | | | | | | | | | |
Other securities | | | | 362,415 | | | | 0.01 | |
| | | | | | | | | | | | | | | | | | | | |
| | | | | |
| Pharmaceuticals: 0.36% | | | | | | | | | | | | | | | | | | | | |
Other securities | | | | 11,080,371 | | | | 0.36 | |
| | | | | | | | | | | | | | | | | | | | |
| | | | | |
Industrials: 0.20% | | | | | | | | | | | | | | | | | | | | |
| | | | | |
| Industrial Conglomerates: 0.04% | | | | | | | | | | | | | | | | | | | | |
Other securities | | | | 1,052,122 | | | | 0.04 | |
| | | | | | | | | | | | | | | | | | | | |
| | | | | |
| Machinery: 0.01% | | | | | | | | | | | | | | | | | | | | |
Other securities | | | | | | | | | | | | | | | 398,789 | | | | 0.01 | |
| | | | | | | | | | | | | | | | | | | | |
| | | | | |
| Road & Rail: 0.07% | | | | | | | | | | | | | | | | | | | | |
Other securities | | | | | | | | | | | | | | | 2,235,144 | | | | 0.07 | |
| | | | | | | | | | | | | | | | | | | | |
| | | | | |
| Trading Companies & Distributors: 0.08% | | | | | | | | | | | | | | | | | | | | |
Other securities | | | | | | | | | | | | | | | 2,470,732 | | | | 0.08 | |
| | | | | | | | | | | | | | | | | | | | |
| | | | | |
Information Technology: 0.09% | | | | | | | | | | | | | | | | | | | | |
| | | | | |
| Communications Equipment: 0.01% | | | | | | | | | | | | | | | | | | | | |
Other securities | | | | | | | | | | | | | | | 285,798 | | | | 0.01 | |
| | | | | | | | | | | | | | | | | | | | |
| | | | | |
| Internet Software & Services: 0.05% | | | | | | | | | | | | | | | | | | | | |
Other securities | | | | | | | | | | | | | | | 1,438,392 | | | | 0.05 | |
| | | | | | | | | | | | | | | | | | | | |
The accompanying notes are an integral part of these financial statements.
| | | | |
| 100 | | Wells Fargo Dow Jones Target Date Funds | | Summary portfolio of investments—February 28, 2017 |
DIVERSIFIED FIXED INCOME PORTFOLIO
| | | | | | | | | | | | | | | | | | | | |
| Security name | | | | | | | | | | | Value | | | Percent of
net assets | |
| | | | | |
| Technology Hardware, Storage & Peripherals: 0.03% | | | | | | | | | | | | | | | | | | | | |
Other securities | | | | | | | | | | | | | | $ | 1,038,616 | | | | 0.03 | % |
| | | | | | | | | | | | | | | | | | | | |
| | | | | |
Materials: 0.23% | | | | | | | | | | | | | | | | | | | | |
| | | | | |
| Chemicals: 0.08% | | | | | | | | | | | | | | | | | | | | |
Other securities | | | | | | | | | | | | | | | 2,408,767 | | | | 0.08 | |
| | | | | | | | | | | | | | | | | | | | |
| | | | | |
| Metals & Mining: 0.13% | | | | | | | | | | | | | | | | | | | | |
Other securities | | | | | | | | | | | | | | | 4,131,790 | | | | 0.13 | |
| | | | | | | | | | | | | | | | | | | | |
| | | | | |
| Paper & Forest Products: 0.02% | | | | | | | | | | | | | | | | | | | | |
Other securities | | | | | | | | | | | | | | | 636,548 | | | | 0.02 | |
| | | | | | | | | | | | | | | | | | | | |
| | | | | |
Telecommunication Services: 0.30% | | | | | | | | | | | | | | | | | | | | |
| | | | | |
| Diversified Telecommunication Services: 0.16% | | | | | | | | | | | | | | | | | | | | |
Other securities | | | | | | | | | | | | | | | 4,934,784 | | | | 0.16 | |
| | | | | | | | | | | | | | | | | | | | |
| | | | | |
| Wireless Telecommunication Services: 0.14% | | | | | | | | | | | | | | | | | | | | |
Other securities | | | | | | | | | | | | | | | 4,226,882 | | | | 0.14 | |
| | | | | | | | | | | | | | | | | | | | |
| | | | | |
Utilities: 0.02% | | | | | | | | | | | | | | | | | | | | |
| | | | | |
| Electric Utilities: 0.00% | | | | | | | | | | | | | | | | | | | | |
Other securities | | | | | | | | | | | | | | | 116,271 | | | | 0.00 | |
| | | | | | | | | | | | | | | | | | | | |
| | | | | |
| Independent Power & Renewable Electricity Producers: 0.01% | | | | | | | | | | | | | | | | | | | | |
Other securities | | | | | | | | | | | | | | | 204,762 | | | | 0.01 | |
| | | | | | | | | | | | | | | | | | | | |
| | | | | |
| Water Utilities: 0.01% | | | | | | | | | | | | | | | | | | | | |
Other securities | | | | | | | | | | | | | | | 182,988 | | | | 0.01 | |
| | | | | | | | | | | | | | | | | | | | |
| | | | | |
Total Yankee Corporate Bonds and Notes (Cost $121,684,308) | | | | | | | | | | | | | | | 124,668,456 | | | | 4.08 | |
| | | | | | | | | | | | | | | | | | | | |
| | | | | |
Yankee Government Bonds: 0.05% | | | | | | | | | | | | | | | | | | | | |
Other securities | | | | | | | | | | | | | | | 1,415,805 | | | | 0.05 | |
| | | | | | | | | | | | | | | | | | | | |
| | | | | |
Total Yankee Government Bonds (Cost $1,400,418) | | | | | | | | | | | | | | | 1,415,805 | | | | 0.05 | |
| | | | | | | | | | | | | | | | | | | | |
| | | | | |
| | | Yield | | | | | | Shares | | | | | | | |
| Short-Term Investments: 2.52% | | | | | | | | | | | | | | | | | | | | |
| | | | | |
| Investment Companies: 2.52% | | | | | | | | | | | | | | | | | | | | |
Securities Lending Cash Investment LLC (l)(r)(u) | | | 0.84 | % | | | | | | | 11,559,329 | | | | 11,560,485 | | | | 0.38 | |
Wells Fargo Government Money Market Fund Select Class (l)(u)## | | | 0.48 | | | | | | | | 65,307,347 | | | | 65,307,347 | | | | 2.14 | |
| | |
Total Short-Term Investments (Cost $76,867,579) | | | | 76,867,832 | | | | 2.52 | |
| | | | | | | | | | | | | | | | | | | | |
| | | | |
| Total investments in securities (Cost $3,126,622,822) * | | | | | | | | | | | | 3,109,703,430 | | | | 101.88 | |
Other assets and liabilities, net | | | | (57,332,840 | ) | | | (1.88 | ) |
| | | | | | | | | | | | | | | | | | | | |
| Total net assets | | | $ | 3,052,370,590 | | | | 100.00 | % |
| | | | | | | | | | | | | | | | | | | | |
The accompanying notes are an integral part of these financial statements.
| | | | | | |
| Summary portfolio of investments—February 28, 2017 | | Wells Fargo Dow Jones Target Date Funds | | | 101 | |
DIVERSIFIED FIXED INCOME PORTFOLIO
| %% | Security issued on a when-issued basis |
| (l) | The issuer of the security is an affiliated person of the Portfolio as defined in the Investment Company Act of 1940. |
| @ | Foreign bond principal is denominated in the local currency of the issuer. |
| (r) | The investment is a non-registered investment vehicle purchased with cash collateral received from securities on loan. |
| (u) | The rate represents the 7-day annualized yield at period end. |
| ## | All or a portion of this security has been segregated for when-issued securities. |
| * | Cost for federal income tax purposes is $3,127,989,725 and unrealized gains (losses) consists of: |
| | | | |
Gross unrealized gains | | $ | 71,734,494 | |
Gross unrealized losses | | | (90,020,789 | ) |
| | | | |
Net unrealized losses | | $ | (18,286,295 | ) |
The following table shows the percent of total long-term investments by geographic location as of February 28, 2017:
| | | | |
United States | | | 70.66 | % |
Japan | | | 12.07 | |
United Kingdom | | | 3.61 | |
France | | | 2.68 | |
Italy | | | 2.35 | |
Germany | | | 1.84 | |
Spain | | | 1.38 | |
Canada | | | 1.28 | |
Netherlands | | | 1.08 | |
Other | | | 3.05 | |
| | | | |
| | | 100.00 | % |
| | | | |
The accompanying notes are an integral part of these financial statements.
| | | | |
| 102 | | Wells Fargo Dow Jones Target Date Funds | | Summary portfolio of investments—February 28, 2017 |
DIVERSIFIED STOCK PORTFOLIO
The Summary portfolio of investments shows the 50 largest portfolio holdings in unaffiliated issuers and any holdings exceeding 1% of the total net assets as of the report date. The remaining securities held are grouped as “Other securities” in each category.
| | | | | | | | | | | | | | | | | | | | |
| Security name | | | | | | | | Shares | | | Value | | | Percent of net assets | |
| | | | | |
Common Stocks: 96.63% | | | | | | | | | | | | | | | | | | | | |
| | | | | |
Consumer Discretionary: 13.29% | | | | | | | | | | | | | | | | | | | | |
| | | | | |
| Auto Components: 0.90% | | | | | | | | | | | | | | | | | | | | |
Other securities | | | | | | | | | | | | | | $ | 41,715,889 | | | | 0.90 | % |
| | | | | | | | | | | | | | | | | | | | |
| | | | | |
| Automobiles: 1.19% | | | | | | | | | | | | | | | | | | | | |
Toyota Motor Corporation | | | | | | | | | | | 212,500 | | | | 12,039,365 | | | | 0.26 | |
Other securities | | | | | | | | | | | | | | | 43,293,070 | | | | 0.93 | |
| | | | | |
| | | | | | | | | | | | | | | 55,332,435 | | | | 1.19 | |
| | | | | | | | | | | | | | | | | | | | |
| | | | | |
| Distributors: 0.22% | | | | | | | | | | | | | | | | | | | | |
Other securities | | | | | | | | | | | | | | | 10,214,765 | | | | 0.22 | |
| | | | | | | | | | | | | | | | | | | | |
| | | | | |
| Diversified Consumer Services: 0.19% | | | | | | | | | | | | | | | | | | | | |
Other securities | | | | | | | | | | | | | | | 8,807,963 | | | | 0.19 | |
| | | | | | | | | | | | | | | | | | | | |
| | | | | |
| Hotels, Restaurants & Leisure: 2.09% | | | | | | | | | | | | | | | | | | | | |
Marriott International Incorporated Class A | | | | | | | | | | | 92,300 | | | | 8,029,177 | | | | 0.17 | |
Other securities | | | | | | | | | | | | | | | 89,280,365 | | | | 1.92 | |
| | | | | |
| | | | | | | | | | | | | | | 97,309,542 | | | | 2.09 | |
| | | | | | | | | | | | | | | | | | | | |
| | | | | |
| Household Durables: 1.03% | | | | | | | | | | | | | | | | | | | | |
Other securities | | | | | | | | | | | | | | | 48,144,802 | | | | 1.03 | |
| | | | | | | | | | | | | | | | | | | | |
| | | | | |
| Internet & Direct Marketing Retail: 1.41% | | | | | | | | | | | | | | | | | | | | |
Amazon.com Incorporated † | | | | | | | | | | | 36,227 | | | | 30,613,264 | | | | 0.66 | |
The Priceline Group Incorporated † | | | | | | | | | | | 4,596 | | | | 7,924,101 | | | | 0.17 | |
Other securities | | | | | | | | | | | | | | | 27,107,849 | | | | 0.58 | |
| | | | | |
| | | | | | | | | | | | | | | 65,645,214 | | | | 1.41 | |
| | | | | | | | | | | | | | | | | | | | |
| | | | | |
| Leisure Products: 0.22% | | | | | | | | | | | | | | | | | | | | |
Other securities | | | | | | | | | | | | | | | 10,394,670 | | | | 0.22 | |
| | | | | | | | | | | | | | | | | | | | |
| | | | | |
| Media: 2.31% | | | | | | | | | | | | | | | | | | | | |
Naspers Limited | | | | | | | | | | | 59,393 | | | | 9,497,764 | | | | 0.21 | |
The Walt Disney Company | | | | | | | | | | | 134,400 | | | | 14,796,096 | | | | 0.32 | |
Other securities | | | | | | | | | | | | | | | 83,126,529 | | | | 1.78 | |
| | | | | |
| | | | | | | | | | | | | | | 107,420,389 | | | | 2.31 | |
| | | | | | | | | | | | | | | | | | | | |
| | | | | |
| Multiline Retail: 0.52% | | | | | | | | | | | | | | | | | | | | |
Other securities | | | | | | | | | | | | | | | 24,194,087 | | | | 0.52 | |
| | | | | | | | | | | | | | | | | | | | |
| | | | | |
| Specialty Retail: 2.23% | | | | | | | | | | | | | | | | | | | | |
Ross Stores Incorporated | | | | | | | | | | | 114,388 | | | | 7,844,729 | | | | 0.17 | |
The Home Depot Incorporated | | | | | | | | | | | 112,520 | | | | 16,305,273 | | | | 0.35 | |
Other securities | | | | | | | | | | | | | | | 79,712,380 | | | | 1.71 | |
| | | | | |
| | | | | | | | | | | | | | | 103,862,382 | | | | 2.23 | |
| | | | | | | | | | | | | | | | | | | | |
The accompanying notes are an integral part of these financial statements.
| | | | | | |
| Summary portfolio of investments—February 28, 2017 | | Wells Fargo Dow Jones Target Date Funds | | | 103 | |
DIVERSIFIED STOCK PORTFOLIO
| | | | | | | | | | | | | | | | | | | | |
| Security name | | | | | | | | Shares | | | Value | | | Percent of net assets | |
| | | | | |
| Textiles, Apparel & Luxury Goods: 0.98% | | | | | | | | | | | | | | | | | | | | |
Other securities | | | | | | | | | | | | | | $ | 45,705,543 | | | | 0.98 | % |
| | | | | | | | | | | | | | | | | | | | |
| | | | | |
Consumer Staples: 6.34% | | | | | | | | | | | | | | | | | | | | |
| | | | | |
| Beverages: 1.25% | | | | | | | | | | | | | | | | | | | | |
PepsiCo Incorporated | | | | | | | | | | | 71,619 | | | | 7,905,305 | | | | 0.17 | |
The Coca-Cola Company | | | | | | | | | | | 193,874 | | | | 8,134,953 | | | | 0.18 | |
Other securities | | | | | | | | | | | | | | | 42,012,691 | | | | 0.90 | |
| | | | | |
| | | | | | | | | | | | | | | 58,052,949 | | | | 1.25 | |
| | | | | | | | | | | | | | | | | | | | |
| | | | | |
| Food & Staples Retailing: 1.21% | | | | | | | | | | | | | | | | | | | | |
Other securities | | | | | | | | | | | | | | | 56,337,764 | | | | 1.21 | |
| | | | | | | | | | | | | | | | | | | | |
| | | | | |
| Food Products: 2.10% | | | | | | | | | | | | | | | | | | | | |
Nestle SA | | | | | | | | | | | 145,582 | | | | 10,762,646 | | | | 0.23 | |
Other securities | | | | | | | | | | | | | | | 87,329,061 | | | | 1.87 | |
| | | | | |
| | | | | | | | | | | | | | | 98,091,707 | | | | 2.10 | |
| | | | | | | | | | | | | | | | | | | | |
| | | | | |
| Household Products: 0.64% | | | | | | | | | | | | | | | | | | | | |
The Procter & Gamble Company | | | | | | | | | | | 133,668 | | | | 12,173,145 | | | | 0.26 | |
Other securities | | | | | | | | | | | | | | | 17,624,601 | | | | 0.38 | |
| | | | | |
| | | | | | | | | | | | | | | 29,797,746 | | | | 0.64 | |
| | | | | | | | | | | | | | | | | | | | |
| | | | | |
| Personal Products: 0.51% | | | | | | | | | | | | | | | | | | | | |
Other securities | | | | | | | | | | | | | | | 23,611,410 | | | | 0.51 | |
| | | | | | | | | | | | | | | | | | | | |
| | | | | |
| Tobacco: 0.63% | | | | | | | | | | | | | | | | | | | | |
Philip Morris International Incorporated | | | | | | | | | | | 77,443 | | | | 8,468,392 | | | | 0.18 | |
Other securities | | | | | | | | | | | | | | | 21,094,112 | | | | 0.45 | |
| | | | | |
| | | | | | | | | | | | | | | 29,562,504 | | | | 0.63 | |
| | | | | | | | | | | | | | | | | | | | |
| | | | | |
Energy: 5.68% | | | | | | | | | | | | | | | | | | | | |
| | | | | |
| Energy Equipment & Services: 0.96% | | | | | | | | | | | | | | | | | | | | |
Schlumberger Limited | | | | | | | | | | | 127,755 | | | | 10,266,392 | | | | 0.22 | |
Other securities | | | | | | | | | | | | | | | 34,208,180 | | | | 0.74 | |
| | | | | |
| | | | | | | | | | | | | | | 44,474,572 | | | | 0.96 | |
| | | | | | | | | | | | | | | | | | | | |
| | | | | |
| Oil, Gas & Consumable Fuels: 4.72% | | | | | | | | | | | | | | | | | | | | |
Chevron Corporation | | | | | | | | | | | 94,316 | | | | 10,610,550 | | | | 0.23 | |
Exxon Mobil Corporation | | | | | | | | | | | 208,252 | | | | 16,935,053 | | | | 0.36 | |
Other securities | | | | | | | | | | | | | | | 192,466,215 | | | | 4.13 | |
| | | | | |
| | | | | | | | | | | | | | | 220,011,818 | | | | 4.72 | |
| | | | | | | | | | | | | | | | | | | | |
| | | | | |
Financials: 16.52% | | | | | | | | | | | | | | | | | | | | |
| | | | | |
| Banks: 8.34% | | | | | | | | | | | | | | | | | | | | |
Bank of America Corporation | | | | | | | | | | | 504,745 | | | | 12,457,107 | | | | 0.27 | |
China Construction Bank H Shares | | | | | | | | | | | 12,717,990 | | | | 10,468,762 | | | | 0.23 | |
The accompanying notes are an integral part of these financial statements.
| | | | |
| 104 | | Wells Fargo Dow Jones Target Date Funds | | Summary portfolio of investments—February 28, 2017 |
DIVERSIFIED STOCK PORTFOLIO
| | | | | | | | | | | | | | | | | | | | |
| Security name | | | | | | | | Shares | | | Value | | | Percent of net assets | |
| | | | | |
| Banks (continued) | | | | | | | | | | | | | | | | | | | | |
Citigroup Incorporated | | | | | | | | | | | 142,330 | | | $ | 8,512,757 | | | | 0.18 | % |
Commonwealth Bank of Australia | | | | | | | | | | | 128,582 | | | | 8,115,421 | | | | 0.17 | |
JPMorgan Chase & Company | | | | | | | | | | | 179,693 | | | | 16,283,780 | | | | 0.35 | |
Wells Fargo & Company (l) | | | | | | | | | | | 225,784 | | | | 13,068,378 | | | | 0.28 | |
Other securities | | | | | | | | | | | | | | | 319,624,873 | | | | 6.86 | |
| | | | | |
| | | | | | | | | | | | | | | 388,531,078 | | | | 8.34 | |
| | | | | | | | | | | | | | | | | | | | |
| | | | | |
| Capital Markets: 2.33% | | | | | | | | | | | | | | | | | | | | |
Other securities | | | | | | | | | | | | | | | 108,756,504 | | | | 2.33 | |
| | | | | | | | | | | | | | | | | | | | |
| | | | | |
| Consumer Finance: 0.45% | | | | | | | | | | | | | | | | | | | | |
Other securities | | | | | | | | | | | | | | | 20,789,863 | | | | 0.45 | |
| | | | | | | | | | | | | | | | | | | | |
| | | | | |
| Diversified Financial Services: 0.76% | | | | | | | | | | | | | | | | | | | | |
Berkshire Hathaway Incorporated Class B † | | | | | | | | | | | 95,400 | | | | 16,353,468 | | | | 0.35 | |
Other securities | | | | | | | | | | | | | | | 18,985,554 | | | | 0.41 | |
| | | | | |
| | | | | | | | | | | | | | | 35,339,022 | | | | 0.76 | |
| | | | | | | | | | | | | | | | | | | | |
| | | | | |
| Insurance: 4.02% | | | | | | | | | | | | | | | | | | | | |
Other securities | | | | | | | | | | | | | | | 187,053,241 | | | | 4.02 | |
| | | | | | | | | | | | | | | | | | | | |
| | | | | |
| Mortgage REITs: 0.35% | | | | | | | | | | | | | | | | | | | | |
Other securities | | | | | | | | | | | | | | | 16,259,086 | | | | 0.35 | |
| | | | | | | | | | | | | | | | | | | | |
| | | | | |
| Thrifts & Mortgage Finance: 0.27% | | | | | | | | | | | | | | | | | | | | |
Other securities | | | | | | | | | | | | | | | 12,398,370 | | | | 0.27 | |
| | | | | | | | | | | | | | | | | | | | |
| | | | | |
Health Care: 9.44% | | | | | | | | | | | | | | | | | | | | |
| | | | | |
| Biotechnology: 2.05% | | | | | | | | | | | | | | | | | | | | |
Celgene Corporation † | | | | | | | | | | | 71,124 | | | | 8,784,525 | | | | 0.19 | |
Other securities | | | | | | | | | | | | | | | 86,468,411 | | | | 1.86 | |
| | | | | |
| | | | | | | | | | | | | | | 95,252,936 | | | | 2.05 | |
| | | | | | | | | | | | | | | | | | | | |
| | | | | |
| Health Care Equipment & Supplies: 1.58% | | | | | | | | | | | | | | | | | | | | |
Other securities | | | | | | | | | | | | | | | 73,578,002 | | | | 1.58 | |
| | | | | | | | | | | | | | | | | | | | |
| | | | | |
| Health Care Providers & Services: 2.04% | | | | | | | | | | | | | | | | | | | | |
UnitedHealth Group Incorporated | | | | | | | | | | | 87,363 | | | | 14,448,093 | | | | 0.31 | |
Other securities | | | | | | | | | | | | | | | 80,647,791 | | | | 1.73 | |
| | | | | |
| | | | | | | | | | | | | | | 95,095,884 | | | | 2.04 | |
| | | | | | | | | | | | | | | | | | | | |
| | | | | |
| Health Care Technology: 0.21% | | | | | | | | | | | | | | | | | | | | |
Other securities | | | | | | | | | | | | | | | 9,986,122 | | | | 0.21 | |
| | | | | | | | | | | | | | | | | | | | |
| | | | | |
| Life Sciences Tools & Services: 0.63% | | | | | | | | | | | | | | | | | | | | |
Other securities | | | | | | | | | | | | | | | 29,107,897 | | | | 0.63 | |
| | | | | | | | | | | | | | | | | | | | |
The accompanying notes are an integral part of these financial statements.
| | | | | | |
| Summary portfolio of investments—February 28, 2017 | | Wells Fargo Dow Jones Target Date Funds | | | 105 | |
DIVERSIFIED STOCK PORTFOLIO
| | | | | | | | | | | | | | | | | | | | |
| Security name | | | | | | | | Shares | | | Value | | | Percent of net assets | |
| | | | | |
| Pharmaceuticals: 2.93% | | | | | | | | | | | | | | | | | | | | |
Allergan plc | | | | | | | | | | | 34,434 | | | $ | 8,430,132 | | | | 0.18 | % |
Johnson & Johnson | | | | | | | | | | | 136,696 | | | | 16,705,618 | | | | 0.36 | |
Merck & Company Incorporated | | | | | | | | | | | 137,685 | | | | 9,069,311 | | | | 0.20 | |
Novartis AG | | | | | | | | | | | 122,893 | | | | 9,593,081 | | | | 0.21 | |
Pfizer Incorporated | | | | | | | | | | | 303,071 | | | | 10,340,783 | | | | 0.22 | |
Roche Holding AG Genusschein | | | | | | | | | | | 32,865 | | | | 8,007,234 | | | | 0.17 | |
Other securities | | | | | | | | | | | | | | | 74,419,695 | | | | 1.59 | |
| | | | | |
| | | | | | | | | | | | | | | 136,565,854 | | | | 2.93 | |
| | | | | | | | | | | | | | | | | | | | |
| | | | | |
Industrials: 11.09% | | | | | | | | | | | | | | | | | | | | |
| | | | | |
| Aerospace & Defense: 1.21% | | | | | | | | | | | | | | | | | | | | |
Other securities | | | | | | | | | | | | | | | 56,459,920 | | | | 1.21 | |
| | | | | | | | | | | | | | | | | | | | |
| | | | | |
| Air Freight & Logistics: 0.30% | | | | | | | | | | | | | | | | | | | | |
Other securities | | | | | | | | | | | | | | | 14,154,358 | | | | 0.30 | |
| | | | | | | | | | | | | | | | | | | | |
| | | | | |
| Airlines: 0.48% | | | | | | | | | | | | | | | | | | | | |
Other securities | | | | | | | | | | | | | | | 22,395,443 | | | | 0.48 | |
| | | | | | | | | | | | | | | | | | | | |
| | | | | |
| Building Products: 0.67% | | | | | | | | | | | | | | | | | | | | |
Johnson Controls International plc | | | | | | | | | | | 225,167 | | | | 9,443,504 | | | | 0.20 | |
Other securities | | | | | | | | | | | | | | | 21,635,464 | | | | 0.47 | |
| | | | | |
| | | | | | | | | | | | | | | 31,078,968 | | | | 0.67 | |
| | | | | | | | | | | | | | | | | | | | |
| | | | | |
| Commercial Services & Supplies: 0.73% | | | | | | | | | | | | | | | | | | | | |
Other securities | | | | | | | | | | | | | | | 33,971,428 | | | | 0.73 | |
| | | | | | | | | | | | | | | | | | | | |
| | | | | |
| Construction & Engineering: 0.71% | | | | | | | | | | | | | | | | | | | | |
Other securities | | | | | | | | | | | | | | | 33,133,261 | | | | 0.71 | |
| | | | | | | | | | | | | | | | | | | | |
| | | | | |
| Electrical Equipment: 0.75% | | | | | | | | | | | | | | | | | | | | |
Other securities | | | | | | | | | | | | | | | 35,137,712 | | | | 0.75 | |
| | | | | | | | | | | | | | | | | | | | |
| | | | | |
| Industrial Conglomerates: 0.99% | | | | | | | | | | | | | | | | | | | | |
General Electric Company | | | | | | | | | | | 441,838 | | | | 13,171,191 | | | | 0.28 | |
Other securities | | | | | | | | | | | | | | | 32,968,103 | | | | 0.71 | |
| | | | | |
| | | | | | | | | | | | | | | 46,139,294 | | | | 0.99 | |
| | | | | | | | | | | | | | | | | | | | |
| | | | | |
| Machinery: 2.39% | | | | | | | | | | | | | | | | | | | | |
Other securities | | | | | | | | | | | | | | | 111,211,413 | | | | 2.39 | |
| | | | | | | | | | | | | | | | | | | | |
| | | | | |
| Marine: 0.11% | | | | | | | | | | | | | | | | | | | | |
Other securities | | | | | | | | | | | | | | | 5,013,710 | | | | 0.11 | |
| | | | | | | | | | | | | | | | | | | | |
| | | | | |
| Professional Services: 0.64% | | | | | | | | | | | | | | | | | | | | |
Other securities | | | | | | | | | | | | | | | 29,845,476 | | | | 0.64 | |
| | | | | | | | | | | | | | | | | | | | |
The accompanying notes are an integral part of these financial statements.
| | | | |
| 106 | | Wells Fargo Dow Jones Target Date Funds | | Summary portfolio of investments—February 28, 2017 |
DIVERSIFIED STOCK PORTFOLIO
| | | | | | | | | | | | | | | | | | | | |
| Security name | | | | | | | | Shares | | | Value | | | Percent of net assets | |
| | | | | |
| Road & Rail: 0.94% | | | | | | | | | | | | | | | | | | | | |
Union Pacific Corporation | | | | | | | | | | | 75,700 | | | $ | 8,171,058 | | | | 0.18 | % |
Other securities | | | | | | | | | | | | | | | 35,506,613 | | | | 0.76 | |
| | | | | |
| | | | | | | | | | | | | | | 43,677,671 | | | | 0.94 | |
| | | | | | | | | | | | | | | | | | | | |
| | | | | |
| Trading Companies & Distributors: 0.92% | | | | | | | | | | | | | | | | | | | | |
Other securities | | | | | | | | | | | | | | | 42,614,110 | | | | 0.92 | |
| | | | | | | | | | | | | | | | | | | | |
| | | | | |
| Transportation Infrastructure: 0.25% | | | | | | | | | | | | | | | | | | | | |
Other securities | | | | | | | | | | | | | | | 11,448,845 | | | | 0.25 | |
| | | | | | | | | | | | | | | | | | | | |
| | | | | |
Information Technology: 17.08% | | | | | | | | | | | | | | | | | | | | |
| | | | | |
| Communications Equipment: 0.92% | | | | | | | | | | | | | | | | | | | | |
Cisco Systems Incorporated | | | | | | | | | | | 250,750 | | | | 8,570,635 | | | | 0.18 | |
Other securities | | | | | | | | | | | | | | | 34,029,995 | | | | 0.74 | |
| | | | | |
| | | | | | | | | | | | | | | 42,600,630 | | | | 0.92 | |
| | | | | | | | | | | | | | | | | | | | |
| | | | | |
| Electronic Equipment, Instruments & Components: 1.50% | | | | | | | | | | | | | | | | | | | | |
Other securities | | | | | | | | | | | | | | | 69,995,070 | | | | 1.50 | |
| | | | | | | | | | | | | | | | | | | | |
| | | | | |
| Internet Software & Services: 3.19% | | | | | | | | | | | | | | | | | | | | |
Alibaba Group Holding Limited ADR † | | | | | | | | | | | 146,318 | | | | 15,056,122 | | | | 0.32 | |
Alphabet Incorporated Class A † | | | | | | | | | | | 27,182 | | | | 22,966,887 | | | | 0.49 | |
Alphabet Incorporated Class C † | | | | | | | | | | | 27,245 | | | | 22,428,356 | | | | 0.48 | |
Facebook Incorporated Class A † | | | | | | | | | | | 214,895 | | | | 29,126,868 | | | | 0.63 | |
Tencent Holdings Limited | | | | | | | | | | | 732,700 | | | | 19,537,660 | | | | 0.42 | |
Other securities | | | | | | | | | | | | | | | 39,302,973 | | | | 0.85 | |
| | | | | |
| | | | | | | | | | | | | | | 148,418,866 | | | | 3.19 | |
| | | | | | | | | | | | | | | | | | | | |
| | | | | |
| IT Services: 3.02% | | | | | | | | | | | | | | | | | | | | |
MasterCard Incorporated Class A | | | | | | | | | | | 87,400 | | | | 9,654,204 | | | | 0.21 | |
Visa Incorporated Class A | | | | | | | | | | | 171,494 | | | | 15,081,182 | | | | 0.32 | |
Other securities | | | | | | | | | | | | | | | 115,947,782 | | | | 2.49 | |
| | | | | |
| | | | | | | | | | | | | | | 140,683,168 | | | | 3.02 | |
| | | | | | | | | | | | | | | | | | | | |
| | | | | |
| Semiconductors & Semiconductor Equipment: 3.04% | | | | | | | | | | | | | | | | | | | | |
Intel Corporation | | | | | | | | | | | 236,702 | | | | 8,568,612 | | | | 0.18 | |
Taiwan Semiconductor Manufacturing Company Limited | | | | | | | | | | | 2,532,863 | | | | 15,581,269 | | | | 0.34 | |
Other securities | | | | | | | | | | | | | | | 117,497,260 | | | | 2.52 | |
| | | | | |
| | | | | | | | | | | | | | | 141,647,141 | | | | 3.04 | |
| | | | | | | | | | | | | | | | | | | | |
| | | | | |
| Software: 2.86% | | | | | | | | | | | | | | | | | | | | |
Microsoft Corporation | | | | | | | | | | | 388,373 | | | | 24,848,105 | | | | 0.53 | |
Other securities | | | | | | | | | | | | | | | 108,391,051 | | | | 2.33 | |
| | | | | |
| | | | | | | | | | | | | | | 133,239,156 | | | | 2.86 | |
| | | | | | | | | | | | | | | | | | | | |
The accompanying notes are an integral part of these financial statements.
| | | | | | |
| Summary portfolio of investments—February 28, 2017 | | Wells Fargo Dow Jones Target Date Funds | | | 107 | |
DIVERSIFIED STOCK PORTFOLIO
| | | | | | | | | | | | | | | | | | | | |
| Security name | | | | | | | | Shares | | | Value | | | Percent of net assets | |
| | | | | |
| Technology Hardware, Storage & Peripherals: 2.55% | | | | | | | | | | | | | | | | | | | | |
Apple Incorporated | | | | | | | | | | | 489,543 | | | $ | 67,062,496 | | | | 1.44 | % |
Samsung Electronics Company Limited | | | | | | | | | | | 8,038 | | | | 13,662,645 | | | | 0.29 | |
Other securities | | | | | | | | | | | | | | | 37,974,654 | | | | 0.82 | |
| | | | | |
| | | | | | | | | | | | | | | 118,699,795 | | | | 2.55 | |
| | | | | | | | | | | | | | | | | | | | |
| | | | | |
Materials: 5.50% | | | | | | | | | | | | | | | | | | | | |
| | | | | |
| Chemicals: 2.50% | | | | | | | | | | | | | | | | | | | | |
Other securities | | | | | | | | | | | | | | | 116,493,412 | | | | 2.50 | |
| | | | | | | | | | | | | | | | | | | | |
| | | | | |
| Construction Materials: 0.52% | | | | | | | | | | | | | | | | | | | | |
Other securities | | | | | | | | | | | | | | | 23,986,709 | | | | 0.52 | |
| | | | | | | | | | | | | | | | | | | | |
| | | | | |
| Containers & Packaging: 0.59% | | | | | | | | | | | | | | | | | | | | |
Other securities | | | | | | | | | | | | | | | 27,492,419 | | | | 0.59 | |
| | | | | | | | | | | | | | | | | | | | |
| | | | | |
| Metals & Mining: 1.78% | | | | | | | | | | | | | | | | | | | | |
Other securities | | | | | | | | | | | | | | | 82,860,853 | | | | 1.78 | |
| | | | | | | | | | | | | | | | | | | | |
| | | | | |
| Paper & Forest Products: 0.11% | | | | | | | | | | | | | | | | | | | | |
Other securities | | | | | | | | | | | | | | | 5,207,818 | | | | 0.11 | |
| | | | | | | | | | | | | | | | | | | | |
| | | | | |
Real Estate: 5.96% | | | | | | | | | | | | | | | | | | | | |
| | | | | |
| Equity REITs: 5.05% | | | | | | | | | | | | | | | | | | | | |
Other securities | | | | | | | | | | | | | | | 235,175,279 | | | | 5.05 | |
| | | | | | | | | | | | | | | | | | | | |
| | | | | |
| Real Estate Management & Development: 0.91% | | | | | | | | | | | | | | | | | | | | |
Other securities | | | | | | | | | | | | | | | 42,346,205 | | | | 0.91 | |
| | | | | | | | | | | | | | | | | | | | |
| | | | | |
Telecommunication Services: 2.24% | | | | | | | | | | | | | | | | | | | | |
| | | | | |
| Diversified Telecommunication Services: 1.34% | | | | | | | | | | | | | | | | | | | | |
AT&T Incorporated | | | | | | | | | | | 306,677 | | | | 12,816,032 | | | | 0.28 | |
Verizon Communications Incorporated | | | | | | | | | | | 203,597 | | | | 10,104,519 | | | | 0.22 | |
Other securities | | | | | | | | | | | | | | | 39,658,027 | | | | 0.84 | |
| | | | | |
| | | | | | | | | | | | | | | 62,578,578 | | | | 1.34 | |
| | | | | | | | | | | | | | | | | | | | |
| | | | | |
| Wireless Telecommunication Services: 0.90% | | | | | | | | | | | | | | | | | | | | |
China Mobile Limited | | | | | | | | | | | 750,000 | | | | 8,270,105 | | | | 0.18 | |
Other securities | | | | | | | | | | | | | | | 33,523,340 | | | | 0.72 | |
| | | | | |
| | | | | | | | | | | | | | | 41,793,445 | | | | 0.90 | |
| | | | | | | | | | | | | | | | | | | | |
| | | | | |
Utilities: 3.49% | | | | | | | | | | | | | | | | | | | | |
| | | | | |
| Electric Utilities: 1.52% | | | | | | | | | | | | | | | | | | | | |
Other securities | | | | | | | | | | | | | | | 70,895,576 | | | | 1.52 | |
| | | | | | | | | | | | | | | | | | | | |
| | | | | |
| Gas Utilities: 0.53% | | | | | | | | | | | | | | | | | | | | |
Other securities | | | | | | | | | | | | | | | 24,798,978 | | | | 0.53 | |
| | | | | | | | | | | | | | | | | | | | |
The accompanying notes are an integral part of these financial statements.
| | | | |
| 108 | | Wells Fargo Dow Jones Target Date Funds | | Summary portfolio of investments—February 28, 2017 |
DIVERSIFIED STOCK PORTFOLIO
| | | | | | | | | | | | | | | | | | | | |
| Security name | | | | | | | | | | | Value | | | Percent of net assets | |
| | | | | |
| Independent Power & Renewable Electricity Producers: 0.26% | | | | | | | | | | | | | | | | | | | | |
Other securities | | | | | | | | | | | | | | $ | 11,986,909 | | | | 0.26 | % |
| | | | | | | | | | | | | | | | | | | | |
| | | | | |
| Multi-Utilities: 0.99% | | | | | | | | | | | | | | | | | | | | |
Other securities | | | | | | | | | | | | | | | 45,760,635 | | | | 0.99 | |
| | | | | | | | | | | | | | | | | | | | |
| | | | | |
| Water Utilities: 0.19% | | | | | | | | | | | | | | | | | | | | |
Other securities | | | | | | | | | | | | | | | 8,891,439 | | | | 0.19 | |
| | | | | | | | | | | | | | | | | | | | |
| | | | | |
Total Common Stocks (Cost $3,212,145,714) | | | | | | | | | | | | | | | 4,499,235,700 | | | | 96.63 | |
| | | | | | | | | | | | | | | | | | | | |
| | | | | |
Preferred Stocks: 0.53% | | | | | | | | | | | | | | | | | | | | |
| | | | | |
Consumer Discretionary: 0.06% | | | | | | | | | | | | | | | | | | | | |
| | | | | |
| Automobiles: 0.05% | | | | | | | | | | | | | | | | | | | | |
Other securities | | | | | | | | | | | | | | | 2,305,038 | | | | 0.05 | |
| | | | | | | | | | | | | | | | | | | | |
| | | | | |
| Multiline Retail: 0.01% | | | | | | | | | | | | | | | | | | | | |
Other securities | | | | | | | | | | | | | | | 600,453 | | | | 0.01 | |
| | | | | | | | | | | | | | | | | | | | |
| | | | | |
Consumer Staples: 0.03% | | | | | | | | | | | | | | | | | | | | |
| | | | | |
| Beverages: 0.00% | | | | | | | | | | | | | | | | | | | | |
Other securities | | | | | | | | | | | | | | | 53,407 | | | | 0.00 | |
| | | | | | | | | | | | | | | | | | | | |
| | | | | |
| Household Products: 0.03% | | | | | | | | | | | | | | | | | | | | |
Other securities | | | | | | | | | | | | | | | 1,040,943 | | | | 0.03 | |
| | | | | | | | | | | | | | | | | | | | |
| | | | | |
| Personal Products: 0.00% | | | | | | | | | | | | | | | | | | | | |
Other securities | | | | | | | | | | | | | | | 72,334 | | | | 0.00 | |
| | | | | | | | | | | | | | | | | | | | |
| | | | | |
Energy: 0.07% | | | | | | | | | | | | | | | | | | | | |
| | | | | |
| Oil, Gas & Consumable Fuels: 0.07% | | | | | | | | | | | | | | | | | | | | |
Other securities | | | | | | | | | | | | | | | 3,392,799 | | | | 0.07 | |
| | | | | | | | | | | | | | | | | | | | |
| | | | | |
Financials: 0.24% | | | | | | | | | | | | | | | | | | | | |
| | | | | |
| Banks: 0.24% | | | | | | | | | | | | | | | | | | | | |
Other securities | | | | | | | | | | | | | | | 11,184,627 | | | | 0.24 | |
| | | | | | | | | | | | | | | | | | | | |
| | | | | |
Health Care: 0.01% | | | | | | | | | | | | | | | | | | | | |
| | | | | |
| Biotechnology: 0.01% | | | | | | | | | | | | | | | | | | | | |
Other securities | | | | | | | | | | | | | | | 257,416 | | | | 0.01 | |
| | | | | | | | | | | | | | | | | | | | |
| | | | | |
| Health Care Equipment & Supplies: 0.00% | | | | | | | | | | | | | | | | | | | | |
Other securities | | | | | | | | | | | | | | | 156,775 | | | | 0.00 | |
| | | | | | | | | | | | | | | | | | | | |
| | | | | |
| Life Sciences Tools & Services: 0.00% | | | | | | | | | | | | | | | | | | | | |
Other securities | | | | | | | | | | | | | | | 13 | | | | 0.00 | |
| | | | | | | | | | | | | | | | | | | | |
| | | | | |
Information Technology: 0.04% | | | | | | | | | | | | | | | | | | | | |
| | | | | |
| Technology Hardware, Storage & Peripherals: 0.04% | | | | | | | | | | | | | | | | | | | | |
Other securities | | | | | | | | | | | | | | | 1,704,044 | | | | 0.04 | |
| | | | | | | | | | | | | | | | | | | | |
The accompanying notes are an integral part of these financial statements.
| | | | | | |
| Summary portfolio of investments—February 28, 2017 | | Wells Fargo Dow Jones Target Date Funds | | | 109 | |
DIVERSIFIED STOCK PORTFOLIO
| | | | | | | | | | | | | | | | | | | | |
| Security name | | | | | | | | | | | Value | | | Percent of net assets | |
| | | | | |
Materials: 0.07% | | | | | | | | | | | | | | | | | | | | |
| | | | | |
| Chemicals: 0.01% | | | | | | | | | | | | | | | | | | | | |
Other securities | | | | | | | | | | | | | | $ | 536,359 | | | | 0.01 | % |
| | | | | | | | | | | | | | | | | | | | |
| | | | | |
| Metals & Mining: 0.06% | | | | | | | | | | | | | | | | | | | | |
Other securities | | | | | | | | | | | | | | | 2,784,335 | | | | 0.06 | |
| | | | | | | | | | | | | | | | | | | | |
| | | | | |
Real Estate: 0.00% | | | | | | | | | | | | | | | | | | | | |
| | | | | |
| Real Estate Management & Development: 0.00% | | | | | | | | | | | | | | | | | | | | |
Other securities | | | | | | | | | | | | | | | 26,672 | | | | 0.00 | |
| | | | | | | | | | | | | | | | | | | | |
| | | | | |
Telecommunication Services: 0.01% | | | | | | | | | | | | | | | | | | | | |
| | | | | |
| Diversified Telecommunication Services: 0.01% | | | | | | | | | | | | | | | | | | | | |
Other securities | | | | | | | | | | | | | | | 524,165 | | | | 0.01 | |
| | | | | | | | | | | | | | | | | | | | |
| | | | | |
Utilities: 0.00% | | | | | | | | | | | | | | | | | | | | |
| | | | | |
| Multi-Utilities: 0.00% | | | | | | | | | | | | | | | | | | | | |
Other securities | | | | | | | | | | | | | | | 26,686 | | | | 0.00 | |
| | | | | | | | | | | | | | | | | | | | |
| | | | | |
Total Preferred Stocks (Cost $20,379,836) | | | | | | | | | | | | | | | 24,666,066 | | | | 0.53 | |
| | | | | | | | | | | | | | | | | | | | |
| | | | | |
Rights: 0.00% | | | | | | | | | | | | | | | | | | | | |
| | | | | |
Financials: 0.00% | | | | | | | | | | | | | | | | | | | | |
| | | | | |
| Banks: 0.00% | | | | | | | | | | | | | | | | | | | | |
Other securities | | | | | | | | | | | | | | | 10,959 | | | | 0.00 | |
| | | | | | | | | | | | | | | | | | | | |
| | | | | |
| Capital Markets: 0.00% | | | | | | | | | | | | | �� | | | | | | | |
Other securities | | | | | | | | | | | | | | | 7,083 | | | | 0.00 | |
| | | | | | | | | | | | | | | | | | | | |
| | | | | |
Health Care: 0.00% | | | | | | | | | | | | | | | | | | | | |
| | | | | |
| Biotechnology: 0.00% | | | | | | | | | | | | | | | | | | | | |
Other securities | | | | | | | | | | | | | | | 0 | | | | 0.00 | |
| | | | | | | | | | | | | | | | | | | | |
| | | | | |
Industrials: 0.00% | | | | | | | | | | | | | | | | | | | | |
| | | | | |
| Airlines: 0.00% | | | | | | | | | | | | | | | | | | | | |
Other securities | | | | | | | | | | | | | | | 8,557 | | | | 0.00 | |
| | | | | | | | | | | | | | | | | | | | |
| | | | | |
Total Rights (Cost $0) | | | | | | | | | | | | | | | 26,599 | | | | 0.00 | |
| | | | | | | | | | | | | | | | | | | | |
| | | | | |
Warrants: 0.00% | | | | | | | | | | | | | | | | | | | | |
| | | | | |
Consumer Discretionary: 0.00% | | | | | | | | | | | | | | | | | | | | |
| | | | | |
| Automobiles: 0.00% | | | | | | | | | | | | | | | | | | | | |
Other securities | | | | | | | | | | | | | | | 25,018 | | | | 0.00 | |
| | | | | | | | | | | | | | | | | | | | |
| | | | | |
| Media: 0.00% | | | | | | | | | | | | | | | | | | | | |
Other securities | | | | | | | | | | | | | | | 96 | | | | 0.00 | |
| | | | | | | | | | | | | | | | | | | | |
The accompanying notes are an integral part of these financial statements.
| | | | |
| 110 | | Wells Fargo Dow Jones Target Date Funds | | Summary portfolio of investments—February 28, 2017 |
DIVERSIFIED STOCK PORTFOLIO
| | | | | | | | | | | | | | | | | | | | |
| Security name | | | | | | | | | | | Value | | | Percent of net assets | |
| | | | | |
Energy: 0.00% | | | | | | | | | | | | | | | | | | | | |
| | | | | |
| Energy Equipment & Services: 0.00% | | | | | | | | | | | | | | | | | | | | |
Other securities | | | | | | | | | | | | | | $ | 160 | | | | 0.00 | % |
| | | | | | | | | | | | | | | | | | | | |
| | | | | |
Industrials: 0.00% | | | | | | | | | | | | | | | | | | | | |
| | | | | |
| Industrial Conglomerates: 0.00% | | | | | | | | | | | | | | | | | | | | |
Other securities | | | | | | | | | | | | | | | 1,204 | | | | 0.00 | |
| | | | | | | | | | | | | | | | | | | | |
| | | | | |
Total Warrants (Cost $39,410) | | | | | | | | | | | | | | | 26,478 | | | | 0.00 | |
| | | | | | | | | | | | | | | | | | | | |
| | | | | |
| | | Yield | | | | | | Shares | | | | | | | |
| Short-Term Investments: 4.62% | | | | | | | | | | | | | | | | | | | | |
| | | | | |
| Investment Companies: 4.62% | | | | | | | | | | | | | | | | | | | | |
Securities Lending Cash Investment LLC (l)(r)(u) | | | 0.84 | % | | | | | | | 129,965,153 | | | | 129,978,150 | | | | 2.79 | |
Wells Fargo Government Money Market Fund Select Class (l)(u) | | | 0.48 | | | | | | | | 85,261,994 | | | | 85,261,994 | | | | 1.83 | |
| | | | | |
Total Short-Term Investments (Cost $215,231,010) | | | | | | | | | | | | | | | 215,240,144 | | | | 4.62 | |
| | | | | | | | | | | | | | | | | | | | |
| | | | | |
| Total investments in securities (Cost $3,447,795,970) * | | | | | | | | | | | | | | | 4,739,194,987 | | | | 101.78 | |
Other assets and liabilities, net | | | | | | | | | | | | | | | (83,019,615 | ) | | | (1.78 | ) |
| | | | | | | | | | | | | | | | | | | | |
| Total net assets | | | | | | | | | | | | | | $ | 4,656,175,372 | | | | 100.00 | % |
| | | | | | | | | | | | | | | | | | | | |
| † | Non-income-earning security |
| (l) | The issuer of the security is an affiliated person of the Portfolio as defined in the Investment Company Act of 1940. |
| (r) | The investment is a non-registered investment vehicle purchased with cash collateral received from securities on loan. |
| (u) | The rate represents the 7-day annualized yield at period end. |
| * | Cost for federal income tax purposes is $3,480,809,811 and unrealized gains (losses) consists of: |
| | | | |
Gross unrealized gains | | $ | 1,574,711,752 | |
Gross unrealized losses | | | (316,326,576 | ) |
| | | | |
Net unrealized gains | | $ | 1,258,385,176 | |
The following table shows percent of total long-term investments by geographic locations as of February 28, 2017:
| | | | |
United States | | | 63.64 | % |
Japan | | | 6.71 | |
China | | | 3.28 | |
United Kingdom | | | 3.18 | |
Taiwan | | | 1.79 | |
Australia | | | 1.75 | |
Canada | | | 1.59 | |
Switzerland | | | 1.53 | |
India | | | 1.47 | |
Ireland | | | 1.42 | |
South Korea | | | 1.33 | |
Germany | | | 1.31 | |
France | | | 1.31 | |
Other | | | 9.69 | |
| | | | |
| | | 100.00 | % |
| | | | |
The accompanying notes are an integral part of these financial statements.
| | | | | | |
| Portfolio of investments—February 28, 2017 | | Wells Fargo Dow Jones Target Date Funds | | | 111 | |
SHORT-TERM INVESTMENT PORTFOLIO
| | | | | | | | | | | | | | | | |
| Security name | | Interest rate | | | Maturity date | | | Principal | | | Value | |
| | | | |
Certificates of Deposit: 16.88% | | | | | | | | | | | | | | | | |
Banco del Estado de Chile | | | 1.10 | % | | | 4-18-2017 | | | $ | 2,000,000 | | | $ | 2,000,900 | |
Bank of Montreal | | | 1.17 | | | | 6-7-2017 | | | | 3,000,000 | | | | 3,001,860 | |
Bank of Nova Scotia ± | | | 1.32 | | | | 5-11-2017 | | | | 4,000,000 | | | | 4,003,760 | |
Chiba Bank Limited | | | 1.10 | | | | 3-13-2017 | | | | 5,000,000 | | | | 5,000,600 | |
Chiba Bank Limited | | | 1.10 | | | | 3-23-2017 | | | | 5,000,000 | | | | 5,000,900 | |
Cooperatieve Centrale ± | | | 1.14 | | | | 7-10-2017 | | | | 5,000,000 | | | | 5,002,250 | |
Credit Suisse (New York) ± | | | 1.47 | | | | 5-12-2017 | | | | 4,000,000 | | | | 4,005,000 | |
HSBC Bank plc 144A± | | | 1.20 | | | | 6-7-2017 | | | | 4,000,000 | | | | 4,002,800 | |
KBC Bank | | | 0.58 | | | | 3-1-2017 | | | | 15,000,000 | | | | 15,000,000 | |
Mizuho Bank Limited | | | 1.10 | | | | 5-5-2017 | | | | 3,000,000 | | | | 3,001,410 | |
Mizuho Bank Limited ± | | | 1.53 | | | | 3-7-2017 | | | | 4,000,000 | | | | 4,000,680 | |
National Bank of Kuwait | | | 0.58 | | | | 3-1-2017 | | | | 14,250,000 | | | | 14,250,000 | |
NBAD Americas NV | | | 0.58 | | | | 3-1-2017 | | | | 13,000,000 | | | | 13,000,000 | |
Norinchukin Bank | | | 1.03 | | | | 5-16-2017 | | | | 8,000,000 | | | | 8,001,360 | |
Norinchukin Bank | | | 1.11 | | | | 6-8-2017 | | | | 5,000,000 | | | | 5,000,650 | |
Sumitomo Mitsui Banking Corporation ± | | | 1.43 | | | | 4-18-2017 | | | | 3,000,000 | | | | 3,002,430 | |
Swedbank ± | | | 1.12 | | | | 5-22-2017 | | | | 3,000,000 | | | | 3,001,530 | |
| |
Total Certificates of Deposit (Cost $100,254,002) | | | | 100,276,130 | |
| | | | | | | | | | | | | | | | |
| | | | |
Commercial Paper: 39.08% | | | | | | | | | | | | | | | | |
Albion Capital Corporation (z) | | | 0.90 | | | | 4-18-2017 | | | | 2,000,000 | | | | 1,998,040 | |
Alpine Securitization Limited 144A±(p) | | | 1.02 | | | | 8-14-2017 | | | | 7,000,000 | | | | 6,999,720 | |
Alpine Securitization Limited 144A(p)(z) | | | 1.11 | | | | 5-31-2017 | | | | 3,000,000 | | | | 2,991,900 | |
Alpine Securitization Limited 144A(p)(z) | | | 1.18 | | | | 3-21-2017 | | | | 2,000,000 | | | | 1,999,100 | |
Anglesea Funding LLC 144A± | | | 1.01 | | | | 6-30-2017 | | | | 3,000,000 | | | | 2,999,940 | |
Banco de Credito e Inversiones 144A(z) | | | 1.00 | | | | 3-2-2017 | | | | 6,000,000 | | | | 5,999,640 | |
Banco de Credito e Inversiones 144A(z) | | | 1.00 | | | | 3-10-2017 | | | | 3,000,000 | | | | 2,999,160 | |
Banco de Credito e Inversiones 144A(z) | | | 1.00 | | | | 3-15-2017 | | | | 4,000,000 | | | | 3,998,280 | |
Barton Capital Corporation 144A(z) | | | 0.97 | | | | 3-9-2017 | | | | 3,000,000 | | | | 2,999,400 | |
Berkshire Hathaway Incorporated 144A(z) | | | 0.92 | | | | 3-17-2017 | | | | 2,000,000 | | | | 1,999,080 | |
BPCE 144A(z) | | | 1.15 | | | | 5-31-2017 | | | | 3,000,000 | | | | 2,992,890 | |
BPCE 144A(z) | | | 1.16 | | | | 5-1-2017 | | | | 4,000,000 | | | | 3,994,400 | |
Caisse Centrale Desjardins du Quebec 144A(z) | | | 0.89 | | | | 3-8-2017 | | | | 2,000,000 | | | | 1,999,620 | |
Cedar Spring Capital Company 144A(p)(z) | | | 1.18 | | | | 5-9-2017 | | | | 4,000,000 | | | | 3,991,040 | |
CenterPoint Energy 144A(z) | | | 1.10 | | | | 3-15-2017 | | | | 2,000,000 | | | | 1,999,200 | |
Charles Schwab Corporation 144A(z) | | | 0.75 | | | | 3-3-2017 | | | | 3,000,000 | | | | 2,999,820 | |
Chesham Finance Limited 144A(p)(z) | | | 0.73 | | | | 3-1-2017 | | | | 14,000,000 | | | | 13,999,825 | |
Commonwealth Bank of Australia 144A± | | | 1.41 | | | | 4-19-2017 | | | | 6,000,000 | | | | 6,005,160 | |
Concord Minutemen Capital Company 144A(p)(z) | | | 0.95 | | | | 4-12-2017 | | | | 4,000,000 | | | | 3,995,960 | |
Concord Minutemen Capital Company 144A(p)(z) | | | 0.95 | | | | 5-2-2017 | | | | 2,000,000 | | | | 1,996,800 | |
DBS Bank Limited 144A(z) | | | 1.04 | | | | 4-4-2017 | | | | 3,000,000 | | | | 2,997,960 | |
DBS Bank Limited 144A(z) | | | 1.04 | | | | 5-17-2017 | | | | 5,000,000 | | | | 4,990,800 | |
Erste Abwicklungsanstalt 144A(z) | | | 1.04 | | | | 4-25-2017 | | | | 2,000,000 | | | | 1,997,820 | |
Erste Bank der Oesterreichischen Sparkassen AG 144A± | | | 1.12 | | | | 3-14-2017 | | | | 3,000,000 | | | | 3,000,510 | |
Federation Des Caisses 144A(z) | | | 1.00 | | | | 4-12-2017 | | | | 2,000,000 | | | | 1,998,300 | |
ING Funding LLC ± | | | 1.22 | | | | 5-30-2017 | | | | 4,000,000 | | | | 4,003,040 | |
Institutional Secured Funding LLC 144A(p)(z) | | | 1.10 | | | | 4-3-2017 | | | | 4,000,000 | | | | 3,996,920 | |
Kells Funding LLC 144A(p)(z) | | | 1.00 | | | | 5-26-2017 | | | | 3,000,000 | | | | 2,992,710 | |
Kells Funding LLC 144A(p)± | | | 1.13 | | | | 5-2-2017 | | | | 4,000,000 | | | | 4,002,080 | |
The accompanying notes are an integral part of these financial statements.
| | | | |
| 112 | | Wells Fargo Dow Jones Target Date Funds | | Portfolio of investments—February 28, 2017 |
SHORT-TERM INVESTMENT PORTFOLIO
| | | | | | | | | | | | | | | | |
| Security name | | Interest rate | | | Maturity date | | | Principal | | | Value | |
| | | | |
Commercial Paper (continued) | | | | | | | | | | | | | | | | |
Korea Development Bank (z) | | | 0.93 | % | | | 4-21-2017 | | | $ | 2,000,000 | | | $ | 1,997,900 | |
Lexington Parker Capital Company LLC 144A(p)(z) | | | 0.95 | | | | 4-10-2017 | | | | 4,000,000 | | | | 3,996,200 | |
Lexington Parker Capital Company LLC 144A(p)(z) | | | 1.15 | | | | 4-20-2017 | | | | 5,000,000 | | | | 4,993,850 | |
LMA Americas LLC 144A(z) | | | 1.05 | | | | 3-7-2017 | | | | 3,000,000 | | | | 2,999,580 | |
LMA Americas LLC 144A(z) | | | 1.24 | | | | 7-3-2017 | | | | 2,000,000 | | | | 1,991,840 | |
Macquarie Bank Limited 144A(z) | | | 0.90 | | | | 3-7-2017 | | | | 2,000,000 | | | | 1,999,700 | |
Manhattan Asset Funding Company LLC 144A(p)(z) | | | 0.84 | | | | 3-9-2017 | | | | 3,000,000 | | | | 2,999,460 | |
Mitsubishi UFJ Trust & Banking Corporation (z) | | | 1.07 | | | | 4-21-2017 | | | | 6,000,000 | | | | 5,992,980 | |
Mont Blanc Capital Corporation 144A(p)(z) | | | 0.90 | | | | 3-27-2017 | | | | 4,000,000 | | | | 3,997,640 | |
Mountcliff Funding LLC 144A(p)(z) | | | 1.15 | | | | 5-1-2017 | | | | 3,000,000 | | | | 2,994,780 | |
Nationwide Building Society 144A(z) | | | 1.10 | | | | 4-3-2017 | | | | 5,000,000 | | | | 4,995,750 | |
Nationwide Building Society 144A(z) | | | 1.11 | | | | 5-24-2017 | | | | 2,000,000 | | | | 1,994,860 | |
Nederlandse Waterschapsbank 144A(z) | | | 0.90 | | | | 4-24-2017 | | | | 2,000,000 | | | | 1,997,860 | |
Oversea-Chinese Banking Corporation 144A(z) | | | 1.05 | | | | 4-10-2017 | | | | 5,000,000 | | | | 4,995,800 | |
Oversea-Chinese Banking Corporation 144A± | | | 1.17 | | | | 7-19-2017 | | | | 5,000,000 | | | | 5,002,650 | |
Regency Markets No.1 LLC 144A(p)(z) | | | 0.82 | | | | 3-8-2017 | | | | 10,000,000 | | | | 9,998,400 | |
Ridgefield Funding Company 144A(p)(z) | | | 1.05 | | | | 4-3-2017 | | | | 10,000,000 | | | | 9,992,300 | |
Salt River Project Agricultural Improvement and Power District (z) | | | 0.82 | | | | 3-20-2017 | | | | 4,000,000 | | | | 3,998,160 | |
Sumitomo Trust & Banking Company 144A(z) | | | 1.09 | | | | 6-14-2017 | | | | 8,000,000 | | | | 7,975,680 | |
Suncorp Group Limited 144A(z) | | | 1.17 | | | | 6-27-2017 | | | | 2,000,000 | | | | 1,991,432 | |
Swedish Export Credit (z) | | | 0.87 | | | | 4-28-2017 | | | | 10,000,000 | | | | 9,988,400 | |
United Overseas Bank Limited 144A(z) | | | 0.84 | | | | 3-23-2017 | | | | 10,000,000 | | | | 9,995,600 | |
United Overseas Bank Limited 144A(z) | | | 1.05 | | | | 4-24-2017 | | | | 2,000,000 | | | | 1,997,760 | |
Versailles Commercial Paper LLC 144A± | | | 1.03 | | | | 6-1-2017 | | | | 8,000,000 | | | | 8,000,000 | |
Victory Receivables 144A(p)(z) | | | 0.94 | | | | 3-3-2017 | | | | 3,000,000 | | | | 2,999,760 | |
Victory Receivables 144A(p)(z) | | | 0.95 | | | | 3-10-2017 | | | | 3,309,000 | | | | 3,308,140 | |
| |
Total Commercial Paper (Cost $232,100,159) | | | | 232,135,597 | |
| | | | | | | | | | | | | | | | |
| | | | |
Corporate Bonds and Notes: 5.14% | | | | | | | | | | | | | | | | |
| | | | |
Financials: 0.67% | | | | | | | | | | | | | | | | |
| | | | |
| Banks: 0.67% | | | | | | | | | | | | | | | | |
ANZ New Zealand International Limited of London 144A | | | 1.40 | | | | 4-27-2017 | | | | 1,000,000 | | | | 1,000,555 | |
Suncorp Metway Limited 144A± | | | 1.70 | | | | 3-28-2017 | | | | 3,000,000 | | | | 3,001,623 | |
| |
| | | | 4,002,178 | |
| | | | | | | | | | | | | | | | |
| | | | |
Health Care: 4.38% | | | | | | | | | | | | | | | | |
| | | | |
| Health Care Providers & Services: 4.38% | | | | | | | | | | | | | | | | |
Keep Memory Alive ±§ | | | 0.73 | | | | 5-1-2037 | | | | 920,000 | | | | 920,000 | |
Providence Health & Services ±§ | | | 0.73 | | | | 10-1-2042 | | | | 7,960,000 | | | | 7,960,000 | |
Providence St. Joseph Health ±§ | | | 0.72 | | | | 10-1-2047 | | | | 9,000,000 | | | | 9,000,000 | |
Steadfast Crestvilla LLC Series A ±§ | | | 0.75 | | | | 2-1-2056 | | | | 5,000,000 | | | | 5,000,000 | |
Steadfast Crestvilla LLC Series B ±§ | | | 0.75 | | | | 2-1-2056 | | | | 3,160,000 | | | | 3,160,000 | |
| |
| | | | 26,040,000 | |
| | | | | | | | | | | | | | | | |
| | | | |
Materials: 0.09% | | | | | | | | | | | | | | | | |
| | | | |
| Metals & Mining: 0.09% | | | | | | | | | | | | | | | | |
SSAB AB Series A ±§ | | | 0.75 | | | | 6-1-2035 | | | | 500,000 | | | | 500,000 | |
| | | | | | | | | | | | | | | | |
| |
Total Corporate Bonds and Notes (Cost $30,541,361) | | | | 30,542,178 | |
| | | | | | | | | | | | | | | | |
The accompanying notes are an integral part of these financial statements.
| | | | | | |
| Portfolio of investments—February 28, 2017 | | Wells Fargo Dow Jones Target Date Funds | | | 113 | |
SHORT-TERM INVESTMENT PORTFOLIO
| | | | | | | | | | | | | | | | |
| Security name | | Interest rate | | | Maturity date | | | Principal | | | Value | |
| | | | |
Municipal Obligations: 33.07% | | | | | | | | | | | | | | | | |
| | | | |
| California: 1.85% | | | | | | | | | | | | | | | | |
California Tender Option Bond Trust Receipts/Certificates Palomar Pomerado Health Series XG0017 (GO Revenue, Bank of America NA LIQ) 144Aø | | | 0.94 | % | | | 8-1-2037 | | | $ | 2,000,000 | | | $ | 2,000,000 | |
RBC Municipal Products Incorporated Trust Water District Series E (Water & Sewer Revenue, Royal Bank of Canada LOC) 144Aø | | | 0.80 | | | | 4-5-2019 | | | | 7,000,000 | | | | 7,000,000 | |
San Francisco City & County CA Certificate of Participation Series B001 (Miscellaneous Revenue, Morgan Stanley Bank LIQ) 144Aø | | | 1.10 | | | | 11-1-2041 | | | | 2,000,000 | | | | 2,000,000 | |
| |
| | | | 11,000,000 | |
| | | | | | | | | | | | | | | | |
| | | | |
| Colorado: 2.55% | | | | | | | | | | | | | | | | |
Colorado HFA MFHR Class I Series A-1 (Housing Revenue, FHLB SPA) ø | | | 0.69 | | | | 10-1-2034 | | | | 805,000 | | | | 805,000 | |
Colorado HFA MFHR Class II Series A-2 (Housing Revenue, FHLB SPA) ø | | | 0.85 | | | | 10-1-2033 | | | | 3,100,000 | | | | 3,100,000 | |
Colorado HFA MFHR Class II Series B (Housing Revenue, FHLB SPA) ø | | | 0.80 | | | | 5-1-2052 | | | | 10,240,000 | | | | 10,240,000 | |
Colorado Southern Ute Indian Tribe Reservation (Miscellaneous Revenue) ø | | | 0.73 | | | | 1-1-2027 | | | | 1,000,000 | | | | 1,000,000 | |
| | | | |
| | | | | | | | | | | | | | | 15,145,000 | |
| | | | | | | | | | | | | | | | |
| | | | |
| Connecticut: 0.85% | | | | | | | | | | | | | | | | |
Puttable Floating Option Taxable Series TNP-1013 (Miscellaneous Revenue, Bank of America NA LIQ) 144Aø | | | 1.30 | | | | 4-15-2046 | | | | 5,065,000 | | | | 5,065,000 | |
| | | | | | | | | | | | | | | | |
| | | | |
| District of Columbia: 2.02% | | | | | | | | | | | | | | | | |
Howard University (Education Revenue) ø | | | 0.80 | | | | 8-1-2031 | | | | 12,000,000 | | | | 12,000,000 | |
| | | | | | | | | | | | | | | | |
| | | | |
| Florida: 1.63% | | | | | | | | | | | | | | | | |
Florida Tender Option Bond Trust Receipts/Certificates Series 2016 XL0027 (Airport Revenue, AGC Insured, JPMorgan Chase & Company LIQ) 144Aø | | | 0.84 | | | | 10-1-2030 | | | | 2,000,000 | | | | 2,000,000 | |
Orlando & Orange County FL Expressway Authority Series 2007 (Transportation Revenue, BHAC/AGM Insured, Citibank NA LIQ) ø | | | 0.68 | | | | 7-1-2042 | | | | 3,000,000 | | | | 3,000,000 | |
West Palm Beach FL Utilities Systems Series C (Water & Sewer Revenue, AGC Insured, JPMorgan Chase & Company SPA) ø | | | 0.69 | | | | 10-1-2038 | | | | 4,705,000 | | | | 4,705,000 | |
| | | | |
| | | | | | | | | | | | | | | 9,705,000 | |
| | | | | | | | | | | | | | | | |
| | | | |
| Georgia: 0.84% | | | | | | | | | | | | | | | | |
Macon-Bibb County GA Industrial Authority Development Kumho Tire Georgia Incorporated Series A (Industrial Development Revenue, Korea Development Bank LOC) ø | | | 1.05 | | | | 12-1-2022 | | | | 5,000,000 | | | | 5,000,000 | |
| | | | | | | | | | | | | | | | |
| | | | |
| Idaho: 0.66% | | | | | | | | | | | | | | | | |
Idaho HFA Series A3 Class II (Housing Revenue, Barclays Bank plc SPA) ø | | | 0.85 | | | | 7-1-2034 | | | | 1,965,000 | | | | 1,965,000 | |
Idaho HFA Series A4 Class II (Housing Revenue, Barclays Bank plc LIQ) ø | | | 0.85 | | | | 1-1-2036 | | | | 1,960,000 | | | | 1,960,000 | |
| | | | |
| | | | | | | | | | | | | | | 3,925,000 | |
| | | | | | | | | | | | | | | | |
| | | | |
| Illinois: 0.90% | | | | | | | | | | | | | | | | |
Illinois Tender Option Bond Trust Receipts/Certificates Northwestern University Series 2017-TPG004 (Education Revenue, Bank of America NA LIQ) 144Aø | | | 0.75 | | | | 12-1-2038 | | | | 5,350,000 | | | | 5,350,000 | |
| | | | | | | | | | | | | | | | |
| | | | |
| Iowa: 1.01% | | | | | | | | | | | | | | | | |
Iowa Finance Authority Midwestern Disaster Area Project (Industrial Development Revenue, Korea Development Bank LOC) ø | | | 0.85 | | | | 4-1-2022 | | | | 6,000,000 | | | | 6,000,000 | |
| | | | | | | | | | | | | | | | |
The accompanying notes are an integral part of these financial statements.
| | | | |
| 114 | | Wells Fargo Dow Jones Target Date Funds | | Portfolio of investments—February 28, 2017 |
SHORT-TERM INVESTMENT PORTFOLIO
| | | | | | | | | | | | | | | | |
| Security name | | Interest rate | | | Maturity date | | | Principal | | | Value | |
| | | | |
| Louisiana: 1.35% | | | | | | | | | | | | | | | | |
East Baton Rouge Parish LA Sewerage Commission Revenue Series B005 (Water & Sewer Revenue, Morgan Stanley Bank LIQ) 144Aø | | | 1.00 | % | | | 2-1-2045 | | | $ | 8,000,000 | | | $ | 8,000,000 | |
| | | | | | | | | | | | | | | | |
| | | | |
| Maryland: 1.18% | | | | | | | | | | | | | | | | |
Maryland CDA Housing & Community Residential Series B (Housing Revenue, TD Bank NA SPA) ø | | | 0.68 | | | | 9-1-2033 | | | | 7,000,000 | | | | 7,000,000 | |
| | | | | | | | | | | | | | | | |
| | | | |
| Minnesota: 0.02% | | | | | | | | | | | | | | | | |
RBC Municipal Products Incorporated Trust Series E-69 (Housing Revenue, Royal Bank of Canada LOC) 144Aø | | | 0.80 | | | | 5-31-2018 | | | | 115,000 | | | | 115,000 | |
| | | | | | | | | | | | | | | | |
| | | | |
| Nebraska: 0.65% | | | | | | | | | | | | | | | | |
Nebraska Tender Option Bond Trust Receipts/Certificates Omaha Packaging Facilities Corporation Series SGT13 (Miscellaneous Revenue, Societe Generale LIQ) 144Aø | | | 0.90 | | | | 3-1-2033 | | | | 3,850,000 | | | | 3,850,000 | |
| | | | | | | | | | | | | | | | |
| | | | |
| New York: 6.24% | | | | | | | | | | | | | | | | |
New York HFA 222 East 44th Street Series B (Housing Revenue, Bank of China LOC) ø | | | 1.12 | | | | 5-1-2050 | | | | 1,000,000 | | | | 1,000,000 | |
New York HFA 605 West 42nd Street Series B (Housing Revenue, Bank of China LOC) ø | | | 1.10 | | | | 5-1-2048 | | | | 16,000,000 | | | | 16,000,000 | |
New York HFA Manhattan West Residential Housing Project Series B-2 (Housing Revenue, Bank of China LOC) ø | | | 1.11 | | | | 11-1-2049 | | | | 1,000,000 | | | | 1,000,000 | |
New York HFA Manhattan West Residential Housing Project Series B-2 (Housing Revenue, Bank of China LOC) ø | | | 1.25 | | | | 11-1-2049 | | | | 11,100,000 | | | | 11,100,000 | |
New York NY Municipal Water Finance Series F1B-RMKT (Water & Sewer Revenue, U.S. Bank NA SPA) ø | | | 0.63 | | | | 6-15-2035 | | | | 4,000,000 | | | | 4,000,000 | |
RBC Municipal Products Incorporated Trust Series E-51 for Invesco Van Kampen New York Value Income Trust (Miscellaneous Revenue, Royal Bank of Canada LOC) 144Aø(i) | | | 1.23 | | | | 7-1-2017 | | | | 4,000,000 | | | | 4,000,000 | |
| | | | |
| | | | | | | | | | | | | | | 37,100,000 | |
| | | | | | | | | | | | | | | | |
| | | | |
| North Carolina: 0.83% | | | | | | | | | | | | | | | | |
Charlotte NC NASCAR Project Series D (Miscellaneous Revenue, Bank of America NA LOC) ø | | | 0.73 | | | | 6-1-2035 | | | | 2,000,000 | | | | 2,000,000 | |
North Carolina Medical Care Commission FirstHealth Carolina Project Series 2008A (Health Revenue, Branch Banking & Trust SPA) ø | | | 0.68 | | | | 10-1-2028 | | | | 2,915,000 | | | | 2,915,000 | |
| | | | |
| | | | | | | | | | | | | | | 4,915,000 | |
| | | | | | | | | | | | | | | | |
| | | | |
| North Dakota: 0.34% | | | | | | | | | | | | | | | | |
North Dakota HFA Mortgage Finance Program Series F (Housing Revenue, FHLB SPA) ø | | | 0.75 | | | | 1-1-2047 | | | | 2,000,000 | | | | 2,000,000 | |
| | | | | | | | | | | | | | | | |
| | | | |
| Ohio: 0.31% | | | | | | | | | | | | | | | | |
Ohio HFA Residential Management Series J (Housing Revenue, JPMorgan Chase & Company SPA) ø | | | 0.72 | | | | 9-1-2035 | | | | 1,830,000 | | | | 1,830,000 | |
| | | | | | | | | | | | | | | | |
| | | | |
| Oklahoma: 1.28% | | | | | | | | | | | | | | | | |
RBC Municipal Products Incorporated Trust Series E-77 (Transportation Revenue, Royal Bank of Canada LOC) 144Aø | | | 0.80 | | | | 7-13-2017 | | | | 7,635,000 | | | | 7,635,000 | |
| | | | | | | | | | | | | | | | |
| | | | |
| Oregon: 0.17% | | | | | | | | | | | | | | | | |
Oregon Tender Option Bond Trust Receipts/Certificates Series 2016-XF2340 (Miscellaneous Revenue, Bank of America NA LIQ) 144Aø | | | 1.03 | | | | 5-1-2035 | | | | 1,000,000 | | | | 1,000,000 | |
| | | | | | | | | | | | | | | | |
The accompanying notes are an integral part of these financial statements.
| | | | | | |
| Portfolio of investments—February 28, 2017 | | Wells Fargo Dow Jones Target Date Funds | | | 115 | |
SHORT-TERM INVESTMENT PORTFOLIO
| | | | | | | | | | | | | | | | |
| Security name | | Interest rate | | | Maturity date | | | Principal | | | Value | |
| | | | |
| Other: 1.03% | | | | | | | | | | | | | | | | |
Clipper Tax-Exempt Certificate Trust Series 2009-54 (Miscellaneous Revenue, State Street Bank & Trust Company LIQ) ø | | | 0.70 | % | | | 2-15-2028 | | | $ | 6,106,000 | | | $ | 6,106,000 | |
| | | | | | | | | | | | | | | | |
| | | | |
| Pennsylvania: 0.34% | | | | | | | | | | | | | | | | |
RBC Municipal Products Incorporated Trust Series E-52 Invesco Van Kampen Trust (Miscellaneous Revenue, Royal Bank of Canada LOC) 144Aø(i) | | | 1.23 | | | | 7-1-2017 | | | | 2,000,000 | | | | 2,000,000 | |
| | | | | | | | | | | | | | | | |
| | | | |
| South Carolina: 2.93% | | | | | | | | | | | | | | | | |
South Carolina Public Service Authority (Utilities Revenue) (z) | | | 0.82 | | | | 3-8-2017 | | | | 10,000,000 | | | | 10,000,200 | |
South Carolina Public Service Authority (Utilities Revenue) (z) | | | 0.82 | | | | 3-9-2017 | | | | 7,402,000 | | | | 7,402,148 | |
| | | | |
| | | | | | | | | | | | | | | 17,402,348 | |
| | | | | | | | | | | | | | | | |
| | | | |
| Tennessee: 0.84% | | | | | | | | | | | | | | | | |
Montgomery County TN Industrial Development Bonds Hankook Tire Manufacturing Project Series A (Industrial Development Revenue, Kookmin Bank LOC) ø | | | 1.10 | | | | 12-1-2024 | | | | 5,000,000 | | | | 5,000,000 | |
| | | | | | | | | | | | | | | | |
| | | | |
| Texas: 2.07% | | | | | | | | | | | | | | | | |
Brazos Harbor TX Industrial Development Corporation (Industrial Development Revenue) ø | | | 0.76 | | | | 10-1-2036 | | | | 5,000,000 | | | | 5,000,000 | |
Port Arthur TX Navigation District Daily Fina Oil and Chemical Company Project (Industrial Development Revenue) ø | | | 0.73 | | | | 5-1-2033 | | | | 1,000,000 | | | | 1,000,000 | |
Port Arthur TX Navigation District Industrial Development Corporation Total Petrochemicals USA Incorporated Project Series 2012 (Industrial Development Revenue) ø | | | 0.69 | | | | 3-1-2042 | | | | 3,000,000 | | | | 3,000,000 | |
Port Corpus Christi TX Flint Hills Resources Project Series A (Resource Recovery Revenue) ø | | | 0.73 | | | | 4-1-2028 | | | | 2,500,000 | | | | 2,500,000 | |
Texas Department of Housing & Community Affairs Series A (Housing Revenue, GNMA/FNMA/FHLMC Insured, Texas State Treasurer SPA) ø | | | 0.69 | | | | 9-1-2038 | | | | 790,000 | | | | 790,000 | |
| | | | |
| | | | | | | | | | | | | | | 12,290,000 | |
| | | | | | | | | | | | | | | | |
| | | | |
| Utah: 0.84% | | | | | | | | | | | | | | | | |
Utah Water Finance Agency Series B-1 (Water & Sewer Revenue, JPMorgan Chase & Company SPA) ø | | | 0.68 | | | | 10-1-2037 | | | | 5,000,000 | | | | 5,000,000 | |
| | | | | | | | | | | | | | | | |
| | | | |
| Wisconsin: 0.34% | | | | | | | | | | | | | | | | |
Wisconsin Housing & EDA Series F (Housing Revenue, JPMorgan Chase & Company SPA) ø | | | 0.72 | | | | 5-1-2030 | | | | 2,000,000 | | | | 2,000,000 | |
| | | | | | | | | | | | | | | | |
| | | | |
Total Municipal Obligations (Cost $196,433,000) | | | | | | | | | | | | | | | 196,433,348 | |
| | | | | | | | | | | | | | | | |
| | | | |
Other: 3.37% | | | | | | | | | | | | | | | | |
Nuveen California Dividend Advantage Municipal Fund Variable Rate Demand Preferred Shares Series 5 (Citibank NA LIQ) 144A±§ | | | 0.77 | | | | 8-1-2040 | | | | 3,000,000 | | | | 3,000,000 | |
Nuveen California Dividend Advantage Municipal Fund Variable Rate Demand Preferred Shares Series 6 (Citibank NA LIQ) 144A±§ | | | 0.77 | | | | 8-1-2040 | | | | 1,000,000 | | | | 1,000,000 | |
Nuveen Enhanced Municipal Credit Opportunities Fund Series 1 (Citibank NA LIQ) 144A±§ | | | 0.79 | | | | 3-1-2040 | | | | 3,000,000 | | | | 3,000,000 | |
Western Asset Intermediate Municipal Fund Incorporated Variable Rate Demand Preferred Shares Series 1 (Citibank NA LIQ) 144A±§ | | | 0.77 | | | | 2-25-2045 | | | | 4,000,000 | | | | 4,000,000 | |
Western Asset Managed Municipal Fund Incorporated Variable Rate Demand Preferred Shares Series 1 (Citibank NA LIQ) 144A±§ | | | 0.77 | | | | 3-4-2045 | | | | 9,000,000 | | | | 9,000,000 | |
| | | | |
Total Other (Cost $20,000,000) | | | | | | | | | | | | | | | 20,000,000 | |
| | | | | | | | | | | | | | | | |
The accompanying notes are an integral part of these financial statements.
| | | | |
| 116 | | Wells Fargo Dow Jones Target Date Funds | | Portfolio of investments—February 28, 2017 |
SHORT-TERM INVESTMENT PORTFOLIO
| | | | | | | | | | | | | | | | |
| Security name | | Interest rate | | | Maturity date | | | Principal | | | Value | |
| | | | |
Repurchase Agreements: 2.36% | | | | | | | | | | | | | | | | |
GX Clarke & Company, dated 2-28-2017, maturity value $14,000,272 ^^ | | | 0.70 | % | | | 3-1-2017 | | | $ | 14,000,000 | | | $ | 14,000,000 | |
| | | | | | | | | | | | | | | | |
| | | | |
Total Repurchase Agreements (Cost $14,000,000) | | | | | | | | | | | | | | | 14,000,000 | |
| | | | | | | | | | | | | | | | |
| | | | | | | | |
| Total investments in securities (Cost $593,328,522) * | | | 99.90 | % | | | 593,387,253 | |
Other assets and liabilities, net | | | 0.10 | | | | 617,502 | |
| | | | | | | | |
| Total net assets | | | 100.00 | % | | $ | 594,004,755 | |
| | | | | | | | |
| ± | Variable rate investment. The rate shown is the rate in effect at period end. |
| (z) | Zero coupon security. The rate represents the current yield to maturity. |
| 144A | The security may be resold in transactions exempt from registration, normally to qualified institutional buyers, pursuant to Rule 144A under the Securities Act of 1933. |
| (p) | Asset-backed commercial paper |
| § | The security is subject to a demand feature which reduces the effective maturity. |
| ø | Variable rate demand notes are subject to a demand feature which reduces the effective maturity. The maturity date shown represents the final maturity date of the security. The interest rate is determined and reset by the issuer daily, weekly, or monthly depending upon the terms of the security. The rate shown is the rate in effect at period end. |
| (i) | Illiquid security for which the designation of illiquid is unaudited. |
| ^^ | Collateralized by: U.S. government securities, 2.50% to 6.00%, 4-1-2024 to 5-1-2045, fair value including accrued interest is $14,420,296. |
| * | Cost for federal income tax purposes is $593,328,522 and unrealized gains (losses) consists of: |
| | | | |
Gross unrealized gains | | $ | 61,178 | |
Gross unrealized losses | | | (2,447 | ) |
| | | | |
Net unrealized gains | | $ | 58,731 | |
The accompanying notes are an integral part of these financial statements.
| | | | | | |
| Statements of assets and liabilities—February 28, 2017 | | Wells Fargo Dow Jones Target Date Funds | | | 117 | |
| | | | | | | | | | | | |
| | | Diversified
Fixed Income Portfolio | | | Diversified Stock Portfolio | | | Short-Term Investment Portfolio | |
| | | |
Assets | | | | | | | | | | | | |
Investments | | | | | | | | | | | | |
In unaffiliated securities (including securities on loan), at value (see cost below) | | $ | 3,021,354,512 | | | $ | 4,510,886,465 | | | $ | 593,387,253 | |
In affiliated securities, at value (see cost below) | | | 88,348,918 | | | | 228,308,522 | | | | 0 | |
| | | | |
Total investments, at value (see cost below) | | | 3,109,703,430 | | | | 4,739,194,987 | | | | 593,387,253 | |
Cash | | | 0 | | | | 2,956,022 | | | | 37,297 | |
Segregated cash | | | 0 | | | | 4,251,478 | | | | 0 | |
Foreign currency, at value (see cost below) | | | 2,439,968 | | | | 17,860,369 | | | | 0 | |
Receivable for investments sold | | | 9,287,792 | | | | 14,500,942 | | | | 345,000 | |
Receivable for dividends and interest | | | 18,883,574 | | | | 9,266,654 | | | | 344,303 | |
Receivable for securities lending income | | | 4,341 | | | | 84,097 | | | | 0 | |
Prepaid expenses and other assets | | | 72,228 | | | | 51,831 | | | | 4,920 | |
| | | | |
Total assets | | | 3,140,391,333 | | | | 4,788,166,380 | | | | 594,118,773 | |
| | | | |
| | | |
Liabilities | | | | | | | | | | | | |
Payable for investments purchased | | | 75,802,937 | | | | 0 | | | | 0 | |
Payable upon receipt of securities loaned | | | 11,559,478 | | | | 129,954,513 | | | | 0 | |
Payable for daily variation margin on open futures contracts | | | 0 | | | | 968,961 | | | | 0 | |
Due to custodian bank | | | 155 | | | | 0 | | | | 0 | |
Advisory fee payable | | | 410,913 | | | | 584,905 | | | | 47,277 | |
Custodian and accounting fees payable | | | 167,967 | | | | 392,012 | | | | 28,890 | |
Professional fees payable | | | 78,467 | | | | 74,301 | | | | 35,541 | |
Accrued expenses and other liabilities | | | 826 | | | | 16,316 | | | | 2,310 | |
| | | | |
Total liabilities | | | 88,020,743 | | | | 131,991,008 | | | | 114,018 | |
| | | | |
Total net assets | | $ | 3,052,370,590 | | | $ | 4,656,175,372 | | | $ | 594,004,755 | |
| | | | |
| | | |
Investments in unaffiliated securities, at cost | | $ | 3,038,572,964 | | | $ | 3,226,213,927 | | | $ | 593,328,522 | |
| | | | |
Investments in affiliated securities, at cost | | $ | 88,049,858 | | | $ | 221,582,043 | | | $ | 0 | |
| | | | |
Total investments, at cost | | $ | 3,126,622,822 | | | $ | 3,447,795,970 | | | $ | 593,328,522 | |
| | | | |
Securities on loan, at value | | $ | 11,330,967 | | | $ | 124,577,446 | | | $ | 0 | |
| | | | |
Foreign currency, at cost | | $ | 2,446,209 | | | $ | 17,624,169 | | | $ | 0 | |
| | | | |
The accompanying notes are an integral part of these financial statements.
| | | | |
| 118 | | Wells Fargo Dow Jones Target Date Funds | | Statements of operations—year ended February 28, 2017 |
| | | | | | | | | | | | |
| | | Diversified Fixed Income
Portfolio | | | Diversified Stock Portfolio | | | Short-Term Investment Portfolio | |
| | | |
Investment income | | | | | | | | | | | | |
Interest* | | $ | 123,138,965 | | | $ | 37,696 | | | $ | 5,231,811 | |
Income from affiliated securities | | | 1,117,886 | | | | 1,079,800 | | | | 0 | |
Securities lending income, net | | | 55,322 | | | | 4,255,802 | | | | 0 | |
Other income | | | 10,476 | | | | 62,282 | | | | 3,443 | |
Dividends** | | | 0 | | | | 159,914,859 | | | | 0 | |
| | | | |
Total investment income | | | 124,322,649 | | | | 165,350,439 | | | | 5,235,254 | |
| | | | |
| | | |
Expenses | | | | | | | | | | | | |
Advisory fee | | | 7,967,017 | | | | 11,062,171 | | | | 807,381 | |
Custody and accounting fees | | | 440,122 | | | | 1,454,741 | | | | 93,761 | |
Professional fees | | | 108,869 | | | | 116,278 | | | | 44,395 | |
Shareholder report expenses | | | 12,819 | | | | 20,904 | | | | 1,927 | |
Trustees’ fees and expenses | | | 24,371 | | | | 23,455 | | | | 23,050 | |
Other fees and expenses | | | 25,777 | | | | 122,048 | | | | 14,976 | |
| | | | |
Total expenses | | | 8,578,975 | | | | 12,799,597 | | | | 985,490 | |
| | | | |
Net investment income | | | 115,743,674 | | | | 152,550,842 | | | | 4,249,764 | |
| | | | |
| | | |
REALIZED AND UNREALIZED GAINS (LOSSES) ON INVESTMENTS | | | | | | | | | | | | |
| | | |
Net realized gains (losses) on: | | | | | | | | | | | | |
Unaffiliated securities | | | (17,953,352 | ) | | | 1,405,513,626 | | | | 33,198 | |
Affiliated securities | | | 408,676 | | | | 7,869,839 | | | | 0 | |
Futures transactions | | | 0 | | | | 37,584,794 | | | | 0 | |
| | | | |
Net realized gain (losses) on investments | | | (17,544,676 | ) | | | 1,450,968,259 | | | | 33,198 | |
| | | | |
| | | |
Net change in unrealized gains (losses) on: | | | | | | | | | | | | |
Unaffiliated securities | | | (80,818,410 | ) | | | 180,806,377 | | | | 44,769 | |
Affiliated securities | | | (747,502 | ) | | | (3,256,681 | ) | | | 0 | |
Futures transactions | | | 0 | | | | 1,975,788 | | | | 0 | |
| | | | |
Net change in unrealized gains (losses) on investments | | | (81,565,912 | ) | | | 179,525,484 | | | | 44,769 | |
| | | | |
Net realized and unrealized gains (losses) on investments | | | (99,110,588 | ) | | | 1,630,493,743 | | | | 77,967 | |
| | | | |
Net increase in net assets resulting from operations | | $ | 16,633,086 | | | $ | 1,783,044,585 | | | $ | 4,327,731 | |
| | | | |
| | | |
* Net of foreign interest withholding taxes in the amount of | | | $915,943 | | | | $0 | | | | $8 | |
** Net of foreign dividend withholding taxes in the amount of | | | $0 | | | | $8,812,339 | | | | $0 | |
The accompanying notes are an integral part of these financial statements.
| | | | | | |
| Statements of changes in net assets | | Wells Fargo Dow Jones Target Date Funds | | | 119 | |
| | | | | | | | |
| | | Diversified Fixed Income Portfolio | |
| | | Year ended
February 28, 2017 | | | Year ended
February 29, 2016 | |
| | |
Operations | | | | | | | | |
Net investment income | | $ | 115,743,674 | | | $ | 141,080,187 | |
Net realized losses on investments | | | (17,544,676 | ) | | | (72,730,886 | ) |
Net change in unrealized gains (losses) on investments | | | (81,565,912 | ) | | | 5,299,221 | |
| | | | |
Net increase in net assets resulting from operations | | | 16,633,086 | | | | 73,648,522 | |
| | | | |
| |
Capital share transactions | | | | |
Transactions in investors’ beneficial interests | | | | | | | | |
Contributions | | | 1,103,615,608 | | | | 1,180,576,977 | |
Withdrawals | | | (3,412,423,378 | ) | | | (1,994,426,845 | ) |
| | | | |
Net decrease in net assets resulting from capital share transactions | | | (2,308,807,770 | ) | | | (813,849,868 | ) |
| | | | |
Total decrease in net assets | | | (2,292,174,684 | ) | | | (740,201,346 | ) |
| | | | |
| |
Net assets | | | | |
Beginning of period | | | 5,344,545,274 | | | | 6,084,746,620 | |
| | | | |
End of period | | $ | 3,052,370,590 | | | $ | 5,344,545,274 | |
| | | | |
The accompanying notes are an integral part of these financial statements.
| | | | |
| 120 | | Wells Fargo Dow Jones Target Date Funds | | Statements of changes in net assets |
| | | | | | | | |
| | | Diversified Stock Portfolio | |
| | | Year ended
February 28, 2017 | | | Year ended
February 29, 2016 | |
| | |
Operations | | | | | | | | |
Net investment income | | $ | 152,550,842 | | | $ | 177,947,840 | |
Net realized gains on investments | | | 1,450,968,259 | | | | 307,932,833 | |
Net change in unrealized gains (losses) on investments | | | 179,525,484 | | | | (1,628,567,751 | ) |
| | | | |
Net increase (decrease) in net assets resulting from operations | | | 1,783,044,585 | | | | (1,142,687,078 | ) |
| | | | |
| | |
Capital share transactions | | | | | | | | |
Transactions in investors’ beneficial interests | | | | | | | | |
Contributions | | | 877,788,722 | | | | 1,596,369,458 | |
Withdrawals | | | (5,950,397,014 | ) | | | (2,186,652,936 | ) |
| | | | |
Net decrease in net assets resulting from capital share transactions | | | (5,072,608,292 | ) | | | (590,283,478 | ) |
| | | | |
Total decrease in net assets | | | (3,289,563,707 | ) | | | (1,732,970,556 | ) |
| | | | |
| | |
Net assets | | | | | | | | |
Beginning of period | | | 7,945,739,079 | | | | 9,678,709,635 | |
| | | | |
End of period | | $ | 4,656,175,372 | | | $ | 7,945,739,079 | |
| | | | |
The accompanying notes are an integral part of these financial statements.
| | | | | | |
| Statements of changes in net assets | | Wells Fargo Dow Jones Target Date Funds | | | 121 | |
| | | | | | | | |
| | | Short-Term Investment Portfolio | |
| | | Year ended
February 28, 2017 | | | Year ended
February 29, 2016 | |
| | |
Operations | | | | | | | | |
Net investment income | | $ | 4,249,764 | | | $ | 1,789,194 | |
Net realized gains on investments | | | 33,198 | | | | 862 | |
Net change in unrealized gains (losses) on investments | | | 44,769 | | | | 12,131 | |
| | | | |
Net increase in net assets resulting from operations | | | 4,327,731 | | | | 1,802,187 | |
| | | | |
| | |
Capital share transactions | | | | | | | | |
Transactions in investors’ beneficial interests | | | | | | | | |
Contributions | | | 385,434,116 | | | | 410,642,819 | |
Withdrawals | | | (639,192,927 | ) | | | (460,272,218 | ) |
| | | | |
Net decrease in net assets resulting from capital share transactions | | | (253,758,811 | ) | | | (49,629,399 | ) |
| | | | |
Total decrease in net assets | | | (249,431,080 | ) | | | (47,827,212 | ) |
| | | | |
| | |
Net assets | | | | | | | | |
Beginning of period | | | 843,435,835 | | | | 891,263,047 | |
| | | | |
End of period | | $ | 594,004,755 | | | $ | 843,435,835 | |
| | | | |
The accompanying notes are an integral part of these financial statements.
| | | | |
| 122 | | Wells Fargo Dow Jones Target Date Funds | | Financial highlights |
| | | | | | | | | | | | | | | | | | | | |
| | | Ratio to average net assets (annualized) | | | | | | Portfolio turnover
rate | |
| | | Net investment
income | | | Gross
expenses | | | Net
expenses | | | Total
return | | |
| | | | | |
Diversified Fixed Income Portfolio | | | | | | | | | | | | | | | | | | | | |
Year ended February 28, 2017 | | | 2.26 | % | | | 0.17 | % | | | 0.17 | % | | | 0.84 | % | | | 48 | % |
Year ended February 29, 2016 | | | 2.37 | % | | | 0.16 | % | | | 0.16 | % | | | 1.58 | % | | | 39 | % |
Year ended February 28, 2015 | | | 2.28 | % | | | 0.16 | % | | | 0.16 | % | | | 1.54 | % | | | 49 | % |
Year ended February 28, 2014 | | | 2.25 | % | | | 0.19 | % | | | 0.19 | % | | | 0.47 | % | | | 44 | % |
Year ended February 28, 2013 | | | 2.24 | % | | | 0.27 | % | | | 0.26 | % | | | 1.50 | % | | | 43 | % |
| | | | | |
Diversified Stock Portfolio | | | | | | | | | | | | | | | | | | | | |
Year ended February 28, 2017 | | | 1.99 | % | | | 0.17 | % | | | 0.17 | % | | | 26.09 | % | | | 19 | % |
Year ended February 29, 2016 | | | 1.99 | % | | | 0.17 | % | | | 0.17 | % | | | (12.77 | )% | | | 25 | % |
Year ended February 28, 2015 | | | 1.85 | % | | | 0.16 | % | | | 0.16 | % | | | 9.01 | % | | | 14 | % |
Year ended February 28, 2014 | | | 1.92 | % | | | 0.20 | % | | | 0.19 | % | | | 21.82 | % | | | 22 | % |
Year ended February 28, 2013 | | | 2.06 | % | | | 0.33 | % | | | 0.28 | % | | | 11.12 | % | | | 18 | % |
| | | | | |
Short-Term Investment Portfolio | | | | | | | | | | | | | | | | | | | | |
Year ended February 28, 2017 | | | 0.53 | % | | | 0.12 | % | | | 0.12 | % | | | 0.55 | % | | | N/A | |
Year ended February 29, 2016 | | | 0.18 | % | | | 0.12 | % | | | 0.12 | % | | | 0.15 | % | | | N/A | |
Year ended February 28, 2015 | | | 0.07 | % | | | 0.12 | % | | | 0.12 | % | | | (0.03 | )% | | | N/A | |
Year ended February 28, 2014 | | | 0.09 | % | | | 0.12 | % | | | 0.12 | % | | | 0.03 | % | | | N/A | |
Year ended February 28, 2013 | | | 0.14 | % | | | 0.12 | % | | | 0.12 | % | | | 0.11 | % | | | N/A | |
The accompanying notes are an integral part of these financial statements.
| | | | | | |
| Notes to financial statements | | Wells Fargo Dow Jones Target Date Funds | | | 123 | |
1. ORGANIZATION
Wells Fargo Master Trust (the “Trust”), a Delaware statutory trust organized on March 10, 1999, is an open-end management investment company registered under the Investment Company Act of 1940, as amended (the “1940 Act”). As an investment company, the Trust follows the accounting and reporting guidance in Financial Accounting Standards Board (“FASB”) Accounting Standards Codification Topic 946, Financial Services – Investment Companies. These financial statements report on the following portfolios: Wells Fargo Diversified Fixed Income Portfolio (“Diversified Fixed Income Portfolio”), Wells Fargo Diversified Stock Portfolio (“Diversified Stock Portfolio”), and Wells Fargo Short-Term Investment Portfolio (“Short-Term Investment Portfolio”) (each, a “Portfolio”, collectively, the “Portfolios”).
The Portfolios, which are master portfolios in a master/feeder structure, offer their shares to multiple feeder funds and other affiliated master portfolios rather than directly to the public.
2. SIGNIFICANT ACCOUNTING POLICIES
The following significant accounting policies, which are consistently followed in the preparation of the financial statements of each Portfolio, are in conformity with U.S. generally accepted accounting principles which require management to make estimates and assumptions that affect the reported amounts of assets and liabilities, disclosure of contingent assets and liabilities at the date of the financial statements, and the reported amounts of revenues and expenses during the reporting period. Actual results could differ from those estimates.
Securities valuation
All investments are valued each business day as of the close of regular trading on the New York Stock Exchange (generally 4 p.m. Eastern Time), although the Portfolios may deviate from this calculation time under unusual or unexpected circumstances.
Equity securities and futures that are listed on a foreign or domestic exchange or market are valued at the official closing price or, if none, the last sales price. If no sale occurs on the principal exchange or market that day, the prior day’s price will be deemed “stale” and a fair value price will be determined in accordance with the Portfolio’s Valuation Procedures.
The values of securities denominated in foreign currencies are translated into U.S. dollars at rates provided by an independent foreign currency pricing source at a time each business day specified by the Management Valuation Team of Wells Fargo Funds Management, LLC (“Funds Management��).
Many securities markets and exchanges outside the U.S. close prior to the close of the New York Stock Exchange and therefore may not fully reflect trading or events that occur after the close of the principal exchange in which the foreign securities are traded, but before the close of the New York Stock Exchange. If such trading or events are expected to materially affect the value of such securities, then fair value pricing procedures approved by the Board of Trustees of the Portfolios are applied. These procedures take into account multiple factors including movements in U.S. securities markets after foreign exchanges close. Foreign securities that are fair valued under these procedures are categorized as Level 2 and the application of these procedures may result in transfers between Level 1 and Level 2. Depending on market activity, such fair valuations may be frequent. Such fair value pricing may result in net asset values that are higher or lower than net asset values based on the last reported sales price or latest quoted bid price. On February 28, 2017, such fair value pricing was not used in pricing foreign securities.
Debt securities are valued at the evaluated bid price provided by an independent pricing service or, if a reliable price is not available, the quoted bid price from an independent broker-dealer.
Investments in registered open-end investment companies are valued at net asset value. Interests in non-registered investment vehicles that are redeemable at net asset value are fair valued normally at net asset value.
Investments which are not valued using any of the methods discussed above are valued at their fair value, as determined in good faith by the Board of Trustees. The Board of Trustees has established a Valuation Committee comprised of the Trustees and has delegated to it the authority to take any actions regarding the valuation of portfolio securities that the Valuation Committee deems necessary or appropriate, including determining the fair value of portfolio securities, unless the determination has been delegated to the Management Valuation Team. The Board of Trustees retains the authority to make or ratify any valuation decisions or approve any changes to the Valuation Procedures as it deems appropriate. On a quarterly basis, the Board of Trustees receives reports on any valuation actions taken by the Valuation Committee or the Management Valuation Team which may include items for ratification.
Valuations of fair valued securities are compared to the next actual sales price when available, or other appropriate market values, to assess the continued appropriateness of the fair valuation methodologies used. These securities are fair
| | | | |
| 124 | | Wells Fargo Dow Jones Target Date Funds | | Notes to financial statements |
valued on a day-to-day basis, taking into consideration changes to appropriate market information and any significant changes to the inputs considered in the valuation process until there is a readily available price provided on an exchange or by an independent pricing service. Valuations received from an independent pricing service or independent broker-dealer quotes are periodically validated by comparisons to most recent trades and valuations provided by other independent pricing services in addition to the review of prices by the adviser and/or subadviser. Unobservable inputs used in determining fair valuations are identified based on the type of security, taking into consideration factors utilized by market participants in valuing the investment, knowledge about the issuer and the current market environment.
Foreign currency translation
The accounting records of the Portfolios are maintained in U.S. dollars. The value of other assets and liabilities denominated in foreign currencies are translated into U.S. dollars at rates provided by an independent foreign currency pricing source at a time each business day specified by the Management Valuation Team. Purchases and sales of securities, and income and expenses are converted at the rate of exchange on the respective dates of such transactions. Net realized foreign exchange gains or losses arise from sales of foreign currencies, currency gains or losses realized between the trade and settlement dates on securities transactions, and the difference between the amounts of dividends, interest and foreign withholding taxes recorded and the U.S. dollar equivalent of the amounts actually paid or received. Net unrealized foreign exchange gains and losses arise from changes in the fair value of assets and liabilities other than investments in securities resulting from changes in exchange rates. The changes in net assets arising from changes in exchange rates and the changes in net assets resulting from changes in market prices of securities are not separately presented. Such changes are included in net realized and unrealized gains or losses from investments.
Repurchase agreements
The Portfolios may invest in repurchase agreements and may participate in pooled repurchase agreement transactions with other portfolios advised by Funds Management. The repurchase agreements must be fully collateralized based on values that are marked-to-market daily. The collateral may be held by an agent bank under a tri-party agreement. It is the custodian’s responsibility to value collateral daily and to take action to obtain additional collateral as necessary to maintain market value equal to or greater than the resale price. The repurchase agreements are collateralized by instruments such as U.S. Treasury, federal agency, or high-grade corporate obligations. There could be potential loss to a Portfolio in the event that such Portfolio is delayed or prevented from exercising its rights to dispose of the collateral, including the risk of a possible decline in the value of the underlying obligations during the period in which a Portfolio seeks to assert its rights.
Security loans
The Portfolios may lend their securities from time to time in order to earn additional income in the form of fees or interest on securities received as collateral or the investment of any cash received as collateral. The Portfolios continue to receive interest or dividends on the securities loaned. The Portfolios receive collateral in the form of cash or securities with a value at least equal to the value of the securities on loan. The value of the loaned securities is determined at the close of each business day and any additional required collateral is delivered to the Portfolios on the next business day. In a securities lending transaction, the net asset value of the Portfolios will be affected by an increase or decrease in the value of the securities loaned and by an increase or decrease in the value of the instrument in which collateral is invested. The amount of securities lending activity undertaken by the Portfolios fluctuate from time to time. In the event of default or bankruptcy by the borrower, the Portfolios may be prevented from recovering the loaned securities or gaining access to the collateral or may experience delays or costs in doing so. In addition, the investment of any cash collateral received may lose all or part of its value. The Portfolios have the right under the lending agreement to recover the securities from the borrower on demand.
The Portfolios lend their securities through an unaffiliated securities lending agent. Cash collateral received in connection with its securities lending transactions is invested in Securities Lending Cash Investments, LLC (the “Securities Lending Fund”). The Securities Lending Fund is exempt from registration under Section 3(c)(7) of the 1940 Act and is managed by Funds Management and is subadvised by Wells Capital Management Incorporated (“WellsCap”), an affiliate of Funds Management and an indirect wholly owned subsidiary of Wells Fargo & Company (“Wells Fargo”). Funds Management receives an advisory fee starting at 0.05% and declining to 0.01% as the average daily net assets of the Securities Lending Fund increase. All of the fees received by Funds Management are paid to WellsCap for its services as subadviser. The Securities Lending Fund seeks to provide a positive return compared to the daily Fed Funds Open Rate by investing in high-quality, U.S. dollar-denominated short-term money market instruments. Securities Lending Fund investments are valued at the evaluated bid price provided by an independent pricing service. Income earned from investment in the Securities Lending Fund is included in securities lending income on the Statements of Operations.
| | | | | | |
| Notes to financial statements | | Wells Fargo Dow Jones Target Date Funds | | | 125 | |
When-issued transactions
Each Portfolio may purchase securities on a forward commitment or when-issued basis. A Portfolio records a when-issued transaction on the trade date and will segregate assets in an amount at least equal in value to the Portfolio’s commitment to purchase when-issued securities. Securities purchased on a when-issued basis are marked-to-market daily and the Portfolio begins earning interest on the settlement date. Losses may arise due to changes in the market value of the underlying securities or if the counterparty does not perform under the contract.
Futures contracts
Diversified Stock Portfolio is subject to equity price risk in the normal course of pursuing its investment objectives. The Portfolio may buy and sell futures contracts in order to gain exposure to, or protect against, changes in security values. The primary risks associated with the use of futures contracts are the imperfect correlation between changes in market values of securities held by the Portfolio and the prices of futures contracts, and the possibility of an illiquid market.
The aggregate principal amounts of the contracts are not recorded in the financial statements. Fluctuations in the value of the contracts are recorded in the Statements of Assets and Liabilities as an asset or liability and in the Statements of Operations as unrealized gains or losses until the contracts are closed, at which point they are recorded as net realized gains or losses on futures contracts. With futures contracts, there is minimal counterparty risk to the Portfolio since futures are exchange traded and the exchange’s clearinghouse, as counterparty to all exchange traded futures, guarantees the futures against default.
Mortgage dollar roll transactions
Each Portfolio may engage in mortgage dollar roll transactions through TBA mortgage-backed securities issued by Government National Mortgage Association (GNMA), Federal National Mortgage Association (FNMA) and Federal Home Loan Mortgage Corporation (FHLMC). In a mortgage dollar roll transaction, a Portfolio sells a mortgage-backed security to a financial institution, such as a bank or broker-dealer and simultaneously agrees to repurchase a substantially similar security from the institution at a later date at an agreed upon price. The mortgage-backed securities that are repurchased will bear the same interest rate as those sold, but generally will be collateralized by different pools of mortgages with different pre-payment histories. During the roll period, a Portfolio foregoes principal and interest paid on the securities. A Portfolio is compensated by the difference between the current sales price and the forward price for the future purchase as well as by the earnings on the cash proceeds of the initial sale. Mortgage dollar rolls may be renewed without physical delivery of the securities subject to the contract. A Portfolio accounts for TBA dollar roll transactions as purchases and sales which, as a result, may increase its portfolio turnover rate.
Security transactions and income recognition
Securities transactions are recorded on a trade date basis. Realized gains or losses are recorded on the basis of identified cost.
Dividend income is recognized on the ex-dividend date, except for certain dividends from foreign securities which are recorded as soon as the custodian verifies the ex-dividend date.
Interest income is accrued daily and bond discounts are accreted and premiums are amortized daily based on the effective interest method. To the extent debt obligations are placed on non-accrual status, any related interest income may be reduced by writing off interest receivables when the collection of all or a portion of interest has become doubtful based on consistently applied procedures. If the issuer subsequently resumes interest payments or when the collectability of interest is reasonably assured, the debt obligation is removed from non-accrual status.
Income from foreign securities is recorded net of foreign taxes withheld where recovery of such taxes is not assured.
Federal and other taxes
Each Portfolio is treated as a separate entity for federal income tax purposes. The Portfolios are not required to pay federal income taxes on their net investment income and net capital gain as they are treated as partnerships for federal income tax purposes. All interest, dividends, gains and losses of a Portfolio are deemed to have been “passed through” to the interestholders in proportion to their holdings of the Portfolio regardless of whether such interest, dividends and gains have been distributed by the Portfolio.
Each Portfolio’s income tax returns and all financial records supporting those returns for the prior three fiscal years are subject to examination by the federal revenue authority. Management has analyzed each Portfolio’s tax positions taken on federal, state, and foreign tax returns for all open tax years and does not believe that there are any uncertain tax positions that require recognition of a tax liability.
| | | | |
| 126 | | Wells Fargo Dow Jones Target Date Funds | | Notes to financial statements |
3. FAIR VALUATION MEASUREMENTS
Fair value measurements of investments are determined within a framework that has established a fair value hierarchy based upon the various data inputs utilized in determining the value of each Portfolio’s investments. The three-level hierarchy gives the highest priority to unadjusted quoted prices in active markets for identical assets or liabilities (Level 1) and the lowest priority to significant unobservable inputs (Level 3). Each Portfolio’s investments are classified within the fair value hierarchy based on the lowest level of input that is significant to the fair value measurement. The inputs are summarized into three broad levels as follows:
| ∎ | | Level 1 – quoted prices in active markets for identical securities |
| ∎ | | Level 2 – other significant observable inputs (including quoted prices for similar securities, interest rates, prepayment speeds, credit risk, etc.) |
| ∎ | | Level 3 – significant unobservable inputs (including each Portfolio’s own assumptions in determining the fair value of investments) |
The inputs or methodologies used for valuing investments in securities are not necessarily an indication of the risk associated with investing in those securities.
The following is a summary of the inputs used in valuing each Portfolio’s assets and liabilities as of February 28, 2017:
| | | | | | | | | | | | | | | | |
| Diversified Fixed Income Portfolio | | Quoted prices
(Level 1) | | | Other significant
observable inputs
(Level 2) | | | Significant
unobservable inputs
(Level 3) | | | Total | |
Assets | | | | | | | | | | | | | | | | |
Investments in: | | | | | | | | | | | | | | | | |
| | | | |
Agency securities | | $ | 0 | | | $ | 806,474,799 | | | $ | 0 | | | $ | 806,474,799 | |
| | | | |
Corporate bonds and notes | | | 0 | | | | 633,948,371 | | | | 0 | | | | 633,948,371 | |
| | | | |
Foreign government bonds | | | 0 | | | | 758,217,481 | | | | 0 | | | | 758,217,481 | |
| | | | |
U.S. Treasury securities | | | 708,110,686 | | | | 0 | | | | 0 | | | | 708,110,686 | |
| | | | |
Yankee corporate bonds and notes | | | 0 | | | | 124,668,456 | | | | 0 | | | | 124,668,456 | |
| | | | |
Yankee government bonds | | | 0 | | | | 1,415,805 | | | | 0 | | | | 1,415,805 | |
| | | | |
Short-term investments | | | | | | | | | | | | | | | | |
Investment companies | | | 65,307,347 | | | | 0 | | | | 0 | | | | 65,307,347 | |
Investments measured at net asset value* | | | | | | | | | | | | | | | 11,560,485 | |
Total assets | | $ | 773,418,033 | | | $ | 2,324,724,912 | | | $ | 0 | | | $ | 3,109,703,430 | |
| * | Investments that are measured at fair value using the net asset value per share (or its equivalent) as a practical expedient have not been categorized in the fair value hierarchy. The fair value amount presented in the table is intended to permit reconciliation of the fair value hierarchy to the amounts presented in the Statements of Assets and Liabilities. The Portfolio’s investment in Securities Lending Cash Investments, LLC valued at $11,560,485 does not have a redemption period notice, can be redeemed daily and does not have any unfunded commitments. |
| | | | | | |
| Notes to financial statements | | Wells Fargo Dow Jones Target Date Funds | | | 127 | |
| | | | | | | | | | | | | | | | |
| Diversified Stock Portfolio | | Quoted prices
(Level 1) | | | Other significant
observable inputs
(Level 2) | | | Significant
unobservable inputs
(Level 3) | | | Total | |
Assets | | | | | | | | | | | | | | | | |
Investments in: | | | | | | | | | | | | | | | | |
| | | | |
Common stocks | | | | | | | | | | | | | | | | |
Consumer discretionary | | $ | 618,739,639 | | | $ | 8,042 | | | $ | 0 | | | $ | 618,747,681 | |
Consumer staples | | | 295,454,080 | | | | 0 | | | | 0 | | | | 295,454,080 | |
Energy | | | 263,556,753 | | | | 929,634 | | | | 3 | | | | 264,486,390 | |
Financials | | | 769,035,871 | | | | 55,338 | | | | 35,955 | | | | 769,127,164 | |
Health care | | | 439,586,355 | | | | 0 | | | | 340 | | | | 439,586,695 | |
Industrials | | | 516,074,871 | | | | 139,503 | | | | 67,235 | | | | 516,281,609 | |
Information technology | | | 795,283,825 | | | | 1 | | | | 0 | | | | 795,283,826 | |
Materials | | | 255,663,101 | | | | 378,110 | | | | 0 | | | | 256,041,211 | |
Real estate | | | 277,521,484 | | | | 0 | | | | 0 | | | | 277,521,484 | |
Telecommunication services | | | 104,044,429 | | | | 327,594 | | | | 0 | | | | 104,372,023 | |
Utilities | | | 162,333,537 | | | | 0 | | | | 0 | | | | 162,333,537 | |
| | | | |
Preferred stocks | | | | | | | | | | | | | | | | |
Consumer discretionary | | | 2,905,491 | | | | 0 | | | | 0 | | | | 2,905,491 | |
Consumer staples | | | 1,166,684 | | | | 0 | | | | 0 | | | | 1,166,684 | |
Energy | | | 3,392,799 | | | | 0 | | | | 0 | | | | 3,392,799 | |
Financials | | | 11,184,627 | | | | 0 | | | | 0 | | | | 11,184,627 | |
Health care | | | 414,204 | | | | 0 | | | | 0 | | | | 414,204 | |
Information technology | | | 1,704,044 | | | | 0 | | | | 0 | | | | 1,704,044 | |
Materials | | | 3,320,694 | | | | 0 | | | | 0 | | | | 3,320,694 | |
Real estate | | | 26,672 | | | | 0 | | | | 0 | | | | 26,672 | |
Telecommunication services | | | 524,165 | | | | 0 | | | | 0 | | | | 524,165 | |
Utilities | | | 26,686 | | | | 0 | | | | 0 | | | | 26,686 | |
| | | | |
Rights | | | | | | | | | | | | | | | | |
Financials | | | 0 | | | | 18,042 | | | | 0 | | | | 18,042 | |
Industrials | | | 0 | | | | 8,557 | | | | 0 | | | | 8,557 | |
| | | | |
Warrants | | | | | | | | | | | | | | | | |
Consumer discretionary | | | 0 | | | | 25,114 | | | | 0 | | | | 25,114 | |
Energy | | | 0 | | | | 160 | | | | 0 | | | | 160 | |
Industrials | | | 0 | | | | 1,204 | | | | 0 | | | | 1,204 | |
| | | | |
Short-term investments | | | | | | | | | | | | | | | | |
Investment companies | | | 85,261,994 | | | | 0 | | | | 0 | | | | 85,261,994 | |
Investments measured at net asset value* | | | | | | | | | | | | | | | 129,978,150 | |
Total assets | | $ | 4,607,222,005 | | | $ | 1,891,299 | | | $ | 103,533 | | | $ | 4,739,194,987 | |
Liabilities | | | | | | | | | | | | | | | | |
Futures contracts | | $ | 968,961 | | | $ | 0 | | | $ | 0 | | | $ | 968,961 | |
Total liabilities | | $ | 968,961 | | | $ | 0 | | | $ | 0 | | | $ | 968,961 | |
| * | Investments that are measured at fair value using the net asset value per share (or its equivalent) as a practical expedient have not been categorized in the fair value hierarchy. The fair value amount presented in the table is intended to permit reconciliation of the fair value hierarchy to the amounts presented in the Statements of Assets and Liabilities. The Portfolio’s investment in Securities Lending Cash Investments, LLC valued at $129,978,150 does not have a redemption period notice, can be redeemed daily and does not have any unfunded commitments. |
| | | | |
| 128 | | Wells Fargo Dow Jones Target Date Funds | | Notes to financial statements |
| | | | | | | | | | | | | | | | |
| Short-Term Investment Portfolio | | Quoted prices
(Level 1) | | | Other significant
observable inputs
(Level 2) | | | Significant
unobservable inputs
(Level 3) | | | Total | |
Assets | | | | | | | | | | | | | | | | |
Investments in: | | | | | | | | | | | | | | | | |
| | | | |
Certificates of deposit | | $ | 0 | | | $ | 100,276,130 | | | $ | 0 | | | $ | 100,276,130 | |
| | | | |
Commercial paper | | | 0 | | | | 232,135,597 | | | | 0 | | | | 232,135,597 | |
| | | | |
Corporate bonds and notes | | | 0 | | | | 30,542,178 | | | | 0 | | | | 30,542,178 | |
| | | | |
Municipal obligations | | | 0 | | | | 196,433,348 | | | | 0 | | | | 196,433,348 | |
| | | | |
Other | | | 0 | | | | 20,000,000 | | | | 0 | | | | 20,000,000 | |
Repurchase agreements | | | 0 | | | | 14,000,000 | | | | 0 | | | | 14,000,000 | |
Total assets | | $ | 0 | | | $ | 593,387,253 | | | $ | 0 | | | $ | 593,387,253 | |
Futures contracts are reported at their variation margin at measurement date, which represents the amount due from the Portfolio at that date. All other assets and liabilities are reported at their market value at measurement date.
The Portfolios recognize transfers between levels within the fair value hierarchy at the end of the reporting period. Fair value pricing that was used in pricing certain foreign securities at the previous period end was not used at February 28, 2017. As a result, Diversified Stock Portfolio common stocks valued at $1,264,579,301 and preferred stocks valued at $6,080,681 were transferred from Level 2 to Level 1 within the fair value hierarchy. The Diversified Stock Portfolio had no material transfers into/out of Level 3. At February 28, 2017, the Diversified Fixed Income Portfolio and Short-Term Investment Portfolio did not have any transfers into/out of Level 1, Level 2, or Level 3.
4. TRANSACTIONS WITH AFFILIATES AND OTHER EXPENSES
Advisory fee
The Trust has entered into an advisory contract with Funds Management. The adviser is responsible for implementing investment policies and guidelines and for supervising the subadvisers, who are responsible for day-to-day portfolio management of the Portfolios.
Pursuant to the contract, Funds Management is entitled to receive an annual advisory fee from Diversified Fixed Income Portfolio and Diversified Stock Portfolio starting at 0.20% and declining to 0.10% as the average daily net assets of each respective Portfolio increase. Funds Management is entitled to receive an annual advisory fee of 0.10% of the average daily net assets of Short-Term Investment Portfolio. For the year ended February 28, 2017, the advisory fee was equivalent to an annual rate for each Portfolio as follows:
| | | | |
| | | Advisory fee | |
Diversified Fixed Income Portfolio | | | 0.16 | % |
Diversified Stock Portfolio | | | 0.14 | |
Short-Term Investment Portfolio | | | 0.10 | |
Funds Management has retained the services of certain subadvisers to provide daily portfolio management to the Portfolios. The fees for subadvisory services are borne by Funds Management. WellsCap is the subadviser to Short-Term Investment Portfolio and is entitled to receive a fee from Funds Management at an annual rate starting at 0.05% and declining to 0.01% as the average daily net assets of Short-Term Investment Portfolio increase. SSgA Funds Management Incorporated is the subadviser to both Diversified Fixed Income Portfolio and Diversified Stock Portfolio and is entitled to receive an annual subadvisory fee starting at 0.07% and declining to 0.025% as the average daily net assets of each Portfolio increase.
During the year ended February 28, 2017, State Street Bank and Trust Company, the Portfolios’ custodian, reimbursed each Portfolio for certain out-of-pocket expenses that were billed to each Portfolio in error from 1998-2015. These amounts are included in other income on the Statements of Operations. In addition, Funds Management was also reimbursed for waivers/reimbursements it made to the Portfolios during the period the Portfolios were erroneously billed. The amount were as follows:
| | | | | | |
| Notes to financial statements | | Wells Fargo Dow Jones Target Date Funds | | | 129 | |
| | | | | | | | |
| | | Amount reimbursed to
the Portfolio | | | Amount reimbursed to
Funds Management | |
Diversified Fixed Income Portfolio | | $ | 10,476 | | | $ | 6,928 | |
Diversified Stock Portfolio | | | 62,282 | | | | 198,799 | |
Short-Term Investment Portfolio | | | 3,443 | | | | 104 | |
5. INVESTMENT PORTFOLIO TRANSACTIONS
Purchases and sales of investments, excluding short-term securities, for the year ended February 28, 2017 were as follows:
| | | | | | | | | | | | | | | | |
| | | Purchases at cost | | | Sales proceeds | |
| | | U.S.
government | | | Non-U.S.
government | | | U.S.
government | | | Non-U.S.
government | |
Diversified Fixed Income Portfolio | | $ | 1,886,852,597 | | | $ | 548,970,101 | | | $ | 2,636,384,305 | | | $ | 924,606 | |
Diversified Stock Portfolio | | | 0 | | | | 1,432,069,368 | | | | 0 | | | | 3,455,108,925 | |
The Portfolios may purchase or sell investment securities to other Wells Fargo funds under procedures adopted by the Board of Trustees. The procedures have been designed to ensure that these interfund transactions, which generally do not incur broker commissions, are effected at current market prices. Interfund trades are included within the respective purchases and sales amounts shown.
6. INVESTMENTS IN AFFILIATES
An affiliated investment is a company which is under common ownership or control of a Portfolio or which a Portfolio has ownership of at least 5% of the outstanding voting shares. The following is a summary of transactions for the long-term holdings of issuers that were either affiliates of a Portfolio at the beginning of the period or the end of the period.
| | | | | | | | | | | | | | | | | | | | | | | | | | | | |
| | | | | Shares, beginning
of period | | Shares
purchased | | | Shares
sold | | | Shares, end
of period | | | Value, end
of period | | | Income from
affiliated
securities | | | Realized
gains | |
Diversified Stock Portfolio | | Wells Fargo & Company | | 563,684 | | | 14,700 | | | | 352,600 | | | | 225,784 | | | $ | 13,068,378 | | | $ | 784,061 | | | $ | 7,855,337 | |
7. DERIVATIVE TRANSACTIONS
During the year ended February 28, 2017, Diversified Stock Portfolio used uninvested cash to enter into future contracts to gain market exposure.
At February 28, 2017, Diversified Stock Portfolio had long futures contracts outstanding as follows:
| | | | | | | | | | | | | | |
| Expiration date | | Counterparty | | Contracts | | Type | | Contract
value at
February 28, 2017 | | | Unrealized
gains | |
| 3/17/2017 | | UBS | | 2 Long | | MSCI EAFE Index | | $ | 174,550 | | | $ | 6,580 | |
| 3/17/2017 | | UBS | | 2 Long | | MSCI EM Index | | | 93,080 | | | | 4,728 | |
| 3/17/2017 | | UBS | | 369 Long | | Russell 2000 Index | | | 25,553,250 | | | | 239,165 | |
| 3/17/2017 | | UBS | | 156 Long | | S&P 500 E-Mini Index | | | 18,429,840 | | | | 523,040 | |
| 3/17/2017 | | UBS | | 111 Long | | S&P Midcap 400 Index | | | 19,177,470 | | | | 327,110 | |
Diversified Stock Portfolio had an average notional amount of $ $122,728,163 in long futures contracts during the year ended February 28, 2017. As of February, Diversified Stock Portfolio had segregated $4,251,478 as cash collateral for open futures contracts.
The payable for daily variation margin on open futures contracts reflected in the Statements of Assets and Liabilities only represents the current day’s variation margin. The realized gains and change in unrealized gains (losses) on futures contracts are reflected in the Statements of Operations.
For certain types of derivative transactions, Diversified Stock Portfolio has entered into International Swaps and Derivatives Association, Inc. master agreements (“ISDA Master Agreements”) or similar agreements with approved counterparties. The ISDA Master Agreements or similar agreements may have requirements to deliver/deposit securities or cash to/with an exchange or broker-dealer as collateral and allows Diversified Stock Portfolio to offset, with each counterparty, certain derivative financial instrument’s assets and/or liabilities with collateral held or pledged. Collateral requirements differ by type of derivative. Collateral or margin requirements are set by the broker or exchange clearing
| | | | |
| 130 | | Wells Fargo Dow Jones Target Date Funds | | Notes to financial statements |
house for exchange traded derivatives while collateral terms are contract specific for over-the-counter traded derivatives. Cash collateral that has been pledged to cover obligations of Diversified Stock Portfolio under ISDA Master Agreements or similar agreements, if any, are reported separately in the Statements of Assets and Liabilities. Securities pledged as collateral, if any, are noted in the Summary Portfolio of Investments. With respect to balance sheet offsetting, absent an event of default by the counterparty or a termination of the agreement, the reported amounts of financial assets and financial liabilities in the Statements of Assets and Liabilities are not offset across transactions between Diversified Stock Portfolio and the applicable counterparty. A reconciliation of the gross amounts on the Statements of Assets and Liabilities to the net amounts by derivative type, including any collateral exposure, is as follows:
| | | | | | | | | | | | | | | | | | | | |
| | | Derivative type | | Counterparty | | Gross amounts
of liabilities in the
Statements of
Assets and
Liabilities | | | Amounts
subject to
netting
agreements | | | Collateral
pledged1 | | | Net amount
of liabilities | |
| Diversified Stock Portfolio | | Futures – variation margin | | UBS | | $ | 968,961 | | | $ | 0 | | | $ | (968,961 | ) | | $ | 0 | |
| 1 | Collateral pledged within this table is limited to the collateral for the net transaction with the counterparty. |
8. INDEMNIFICATION
Under the Trust’s organizational documents, the officers and Trustees have been granted certain indemnification rights against certain liabilities that may arise out of performance of their duties to the Trust. Additionally, in the normal course of business, the Trust may enter into contracts with service providers that contain a variety of indemnification clauses. The Trust’s maximum exposure under these arrangements is dependent on future claims that may be made against the Portfolios and, therefore, cannot be estimated.
9. REDEMPTIONS IN-KIND
The Dow Jones Target Date Funds each invests all of their assets in the Portfolios to achieve their investment objective. After the close of business on December 9, 2016, several of the Dow Jones Target Date Funds, redeemed assets through a redemption in-kind. In the redemptions transaction, each of the Portfolios issued securities and cash to the respective Dow Jones Target Date Fund. The aggregate value of securities issued to each Dow Jones Target Date Fund along with any cash issued in the redemption, the percentage of the Portfolio and the gains or losses realized by each Portfolio are reflected in the table below. The gains or losses realized by each Portfolio are reflected in the amounts on the Statements of Operations.
| | | | | | | | | | | | |
| | | Value of securities | | Cash | | % of
Portfolio | | | Realized gains | |
| Diversified Fixed Income Portfolio | | $1,572,349,585 | | $54,487,895 | | | 30 | % | | $ | 7,760,121 | |
| Diversified Stock Portfolio | | 2,576,087,819 | | 301,625,005 | | | 34 | | | | 1,021,648,798 | |
| Short-Term Investment Portfolio | | N/A | | 247,121,352 | | | 28 | | | | 0 | |
10. NEW ACCOUNTING PRONOUNCEMENT
In December 2016, FASB issued Accounting Standards Update (“ASU”) No. 2016-19, Technical Corrections and Improvements. ASU 2016-19 includes an amendment to FASB ASC Topic 820, Fair Value Measurement which clarifies the difference between a valuation approach and a valuation technique. The amendment also requires an entity to disclose when there has been a change in either or both a valuation approach and/or a valuation technique. The disclosure requirements are effective for fiscal years and interim periods within those fiscal years beginning after December 15, 2016. Management is currently evaluating the potential impact of this new guidance to the financial statements.
11. REGULATORY CHANGES
In October 2016, the Securities and Exchange Commission (“SEC”) adopted new rules and forms and amended existing rules and forms (together, “final rules”) intended to modernize and enhance the reporting and disclosure of information by registered investment companies and to enhance liquidity risk management by open-end mutual funds and exchange-traded funds. The final rules will enhance the quality of information available to investors and will allow the SEC to more effectively collect and use data reported by funds. In part, the final rules amend Regulation S-X and require standardized, enhanced disclosure about derivatives in the Portfolios’ financial statements, as well as other amendments. The compliance date for the amendments to Regulation S-X is August 1, 2017 while the compliance date for the new form types is June 1, 2018 and the compliance date for the liquidity risk management program requirements is December 1, 2018. Management is currently assessing the potential impact of these enhancements and their impact on the financial statement disclosures and reporting requirements.
| | | | | | |
| Report of independent registered public accounting firm | | Wells Fargo Dow Jones Target Date Funds | | | 131 | |
BOARD OF TRUSTEES AND SHAREHOLDERS OF WELLS FARGO MASTER TRUST:
We have audited the accompanying statements of assets and liabilities, including the portfolios of investments or summary portfolios of investments (for the Wells Fargo Diversified Fixed Income Portfolio and Wells Fargo Diversified Stock Portfolio), of the Wells Fargo Diversified Fixed Income Portfolio, Wells Fargo Diversified Stock Portfolio, and Wells Fargo Short-Term Investment Portfolio (collectively, the “Portfolios”), three of the portfolios constituting the Wells Fargo Master Trust, as of February 28, 2017, and the related statements of operations for the year then ended, the statements of changes in net assets for each of the years in the two-year period then ended, and the financial highlights for each of the years in the five-year period then ended. These financial statements and financial highlights are the responsibility of the Portfolios’ management. Our responsibility is to express an opinion on these financial statements and financial highlights based on our audits.
We conducted our audits in accordance with the standards of the Public Company Accounting Oversight Board (United States). Those standards require that we plan and perform the audit to obtain reasonable assurance about whether the financial statements and financial highlights are free of material misstatement. An audit includes examining, on a test basis, evidence supporting the amounts and disclosures in the financial statements. Our procedures included confirmation of securities owned as of February 28, 2017, by correspondence with the custodian and brokers, or by other appropriate auditing procedures. An audit also includes assessing the accounting principles used and significant estimates made by management, as well as evaluating the overall financial statement presentation. We believe that our audits provide a reasonable basis for our opinion.
In our opinion, the financial statements and financial highlights referred to above present fairly, in all material respects, the financial position of the Portfolios as of February 28, 2017, the results of their operations for the year then ended, the changes in their net assets for each of the years in the two-year period then ended, and the financial highlights for each of the years in the five-year period then ended, in conformity with U.S. generally accepted accounting principles.
Boston, MA
April 26, 2017
| | | | |
| 132 | | Wells Fargo Dow Jones Target Date Funds | | Other information (unaudited) |
TAX INFORMATION
For corporate shareholders, pursuant to Section 854 of the Internal Revenue Code, the percentage of ordinary income dividends qualifying for the corporate dividends-received deduction was as follows for the fiscal year ended February 28, 2017:
| | | | |
| | | Dividends-received deduction | |
Target Today Fund | |
| 14.06
| %
|
Target 2010 Fund | | | 14.66 | |
Target 2015 Fund | | | 15.45 | |
Target 2020 Fund | | | 19.55 | |
Target 2025 Fund | | | 24.96 | |
Target 2030 Fund | | | 32.21 | |
Target 2035 Fund | | | 37.47 | |
Target 2040 Fund | | | 41.52 | |
Target 2045 Fund | | | 44.05 | |
Target 2050 Fund | | | 43.89 | |
Target 2055 Fund | | | 50.98 | |
Target 2060 Fund | | | 59.65 | |
Pursuant to Section 852 of the Internal Revenue Code, the following amounts were designated as 20% rate gain distributions for the fiscal year ended February 28, 2017:
| | | | |
| | | 20% rate
gain distributions | |
Target Today Fund | | $ | 4,529,169 | |
Target 2010 Fund | | | 5,079,696 | |
Target 2015 Fund | | | 9,280,399 | |
Target 2020 Fund | | | 29,958,752 | |
Target 2025 Fund | | | 32,741,926 | |
Target 2030 Fund | | | 40,826,732 | |
Target 2035 Fund | | | 20,570,123 | |
Target 2040 Fund | | | 32,519,652 | |
Target 2045 Fund | | | 11,012,377 | |
Target 2050 Fund | | | 19,651,014 | |
| | | | | | |
| Other information (unaudited) | | Wells Fargo Dow Jones Target Date Funds | | | 133 | |
Pursuant to Section 854 of the Internal Revenue Code, the following amounts of income dividends paid during the fiscal year ended February 28, 2017 have been designated as qualified dividend income (QDI):
| | | | |
| | | QDI | |
Target Today Fund | | $ | 1,625,058 | |
Target 2010 Fund | | | 1,177,304 | |
Target 2015 Fund | | | 2,398,025 | |
Target 2020 Fund | | | 12,350,272 | |
Target 2025 Fund | | | 15,713,118 | |
Target 2030 Fund | | | 25,215,149 | |
Target 2035 Fund | | | 15,620,463 | |
Target 2040 Fund | | | 26,369,934 | |
Target 2045 Fund | | | 11,452,427 | |
Target 2050 Fund | | | 20,429,435 | |
Target 2055 Fund | | | 4,147,343 | |
Target 2060 Fund | | | 134,122 | |
For the fiscal year ended February 28, 2017, the following amounts have been designated as interest-related dividends for nonresident alien shareholders pursuant to Section 871 of the Internal Revenue Code:
| | | | |
| | | Interest-related dividends | |
Target Today Fund | | $ | 4,600,702 | |
Target 2010 Fund | | | 2,990,539 | |
Target 2015 Fund | | | 5,904,542 | |
Target 2020 Fund | | | 20,307,041 | |
Target 2025 Fund | | | 15,091,313 | |
Target 2030 Fund | | | 13,603,465 | |
Target 2035 Fund | | | 4,798,253 | |
Target 2040 Fund | | | 4,562,520 | |
Target 2045 Fund | | | 1,125,650 | |
Target 2050 Fund | | | 1,444,424 | |
Target 2055 Fund | | | 277,518 | |
Target 2060 Fund | | | 11,266 | |
| | | | |
| 134 | | Wells Fargo Dow Jones Target Date Funds | | Other information (unaudited) |
For the fiscal year ended February 28, 2017, the following amounts have been designated as short-term capital gain dividends for nonresident alien shareholders pursuant to Section 871 of the Internal Revenue Code:
| | | | |
| | | Short-term capital gains dividends | |
Target Today Fund | | $ | 584,302 | |
Target 2010 Fund | | | 888,207 | |
Target 2015 Fund | | | 980,339 | |
Target 2020 Fund | | | 4,059,857 | |
Target 2025 Fund | | | 4,545,096 | |
Target 2030 Fund | | | 6,727,045 | |
Target 2035 Fund | | | 3,462,045 | |
Target 2040 Fund | | | 5,035,689 | |
Target 2045 Fund | | | 1,630,024 | |
Target 2050 Fund | | | 2,827,979 | |
For the fiscal year ended February 28, 2017 ordinary income distributed was derived from interest on U.S. government securities.
| | | | |
| | | U.S Government income | |
Target Today Fund | | | 15.91 | % |
Target 2010 Fund | | | 15.59 | |
Target 2015 Fund | | | 17.33 | |
Target 2020 Fund | | | 14.94 | |
Target 2025 Fund | | | 11.30 | |
Target 2030 Fund | | | 8.25 | |
Target 2035 Fund | | | 5.34 | |
Target 2040 Fund | | | 3.16 | |
Target 2045 Fund | | | 1.79 | |
Target 2050 Fund | | | 1.21 | |
Target 2055 Fund | | | 1.31 | |
Target 2060 Fund | | | 1.68 | |
PROXY VOTING INFORMATION
A description of the policies and procedures used to determine how to vote proxies relating to portfolio securities is available without charge, upon request, by calling 1-800-222-8222, visiting our website at wellsfargofunds.com, or visiting the SEC website at sec.gov. Information regarding how the proxies related to portfolio securities were voted during the most recent 12-month period ended June 30 is available on the website at wellsfargofunds.com or by visiting the SEC website at sec.gov.
PORTFOLIO HOLDINGS INFORMATION
The complete portfolio holdings are publicly available on the website (wellsfargofunds.com) on a one-month delayed basis. In addition, top ten holdings information (excluding derivative positions) is publicly available on the website on a monthly, seven-day or more delayed basis. Each Fund and Portfolio files its complete schedule of portfolio holdings with the SEC for the first and third quarters of each fiscal year on Form N-Q, which is available by visiting the SEC website at sec.gov. In addition, each Form N-Q may be reviewed and copied at the SEC’s Public Reference Room in Washington, DC, and at regional offices in New York City, at 233 Broadway, and in Chicago, at 175 West Jackson Boulevard, Suite 900. Information about the Public Reference Room may be obtained by calling 1-800-SEC-0330.
| | | | | | |
| Other information (unaudited) | | Wells Fargo Dow Jones Target Date Funds | | | 135 | |
BOARD OF TRUSTEES AND OFFICERS
Each of the Trustees and Officers1 listed in the table below acts in identical capacities for each fund in the Wells Fargo family of funds, which consists of 138 mutual funds comprising the Wells Fargo Funds Trust, Wells Fargo Variable Trust, Wells Fargo Master Trust and four closed-end funds (collectively the “Fund Complex”). This table should be read in conjunction with the Prospectus and the Statement of Additional Information2. The mailing address of each Trustee and Officer is 525 Market Street, 12th Floor, San Francisco, CA 94105. Each Trustee and Officer serves an indefinite term, however, each Trustee serves such term until reaching the mandatory retirement age established by the Trustees.
Independent Trustees
| | | | | | |
Name and year of birth | | Position held and length of service* | | Principal occupations during past five years or longer | | Current other
public company or
investment company
directorships |
William R. Ebsworth (Born 1957) | | Trustee, since 2015 | | Retired. From 1984 to 2013, equities analyst, portfolio manager, research director and chief financial officer at Fidelity Management and Research Company in Boston, Tokyo, and Hong Kong and retired in 2013 as Chief Investment Officer of Fidelity Strategic Advisers, Inc. where he lead a team of investment professionals managing client assets. Prior thereto, Board member of Hong Kong Securities Clearing Co., Hong Kong Options Clearing Corp., the Thailand International Fund, Ltd., Fidelity Investments Life Insurance Company, and Empire Fidelity Investments Life Insurance Company. Board member of the Fonté Foundation (non-profit organization) and the Vincent Memorial Hospital Endowment (non-profit organization), where he serves on the Investment Committee and as a Chair of the Audit Committee. Mr. Ebsworth is a CFA® charterholder and an Adjunct Lecturer, Finance, at Babson College. | | Asset Allocation Trust |
Jane A. Freeman (Born 1953) | | Trustee, since 2015 | | Retired. From 2012 to 2014 and 1999 to 2008, Chief Financial Officer of Scientific Learning Corporation. From 2008 to 2012, Ms. Freeman provided consulting services related to strategic business projects. Prior to 1999, Portfolio Manager at Rockefeller & Co. and Scudder, Stevens & Clark. Board member of the Harding Loevner Funds from 1996 to 2014, serving as both Lead Independent Director and chair of the Audit Committee. Board member of the Russell Exchange Traded Funds Trust from 2011 to 2012 and the chair of the Audit Committee. Ms. Freeman is Chair of Taproot Foundation (non-profit organization), a Board Member of Ruth Bancroft Garden (non-profit organization) and an inactive chartered financial analyst. | | Asset Allocation Trust |
Peter G. Gordon** (Born 1942) | | Trustee, since 1998; Chairman, since 2005 | | Co-Founder, Retired Chairman, President and CEO of Crystal Geyser Water Company. Trustee Emeritus, Colby College. | | Asset Allocation Trust |
Isaiah Harris, Jr. (Born 1952) | | Trustee, since 2009 | | Retired. Chairman of the Board of CIGNA Corporation since 2009, and Director since 2005. From 2003 to 2011, Director of Deluxe Corporation. Prior thereto, President and CEO of BellSouth Advertising and Publishing Corp. from 2005 to 2007, President and CEO of BellSouth Enterprises from 2004 to 2005 and President of BellSouth Consumer Services from 2000 to 2003. Emeritus member of the Iowa State University Foundation Board of Governors. Emeritus Member of the Advisory Board of Iowa State University School of Business. Advisory Board Member, Palm Harbor Academy (charter school). Advisory Board Member, Child Evangelism Fellowship (non-profit). Mr. Harris is a certified public accountant (inactive status). | | CIGNA Corporation; Asset Allocation Trust |
Judith M. Johnson (Born 1949) | | Trustee, since 2008; Audit Committee Chairman, since 2008 | | Retired. Prior thereto, Chief Executive Officer and Chief Investment Officer of Minneapolis Employees Retirement Fund from 1996 to 2008. Ms. Johnson is an attorney, certified public accountant and a certified managerial accountant. | | Asset Allocation Trust |
David F. Larcker (Born 1950) | | Trustee, since 2009 | | James Irvin Miller Professor of Accounting at the Graduate School of Business, Stanford University, Director of the Corporate Governance Research Initiative and Senior Faculty of The Rock Center for Corporate Governance since 2006. From 2005 to 2008, Professor of Accounting at the Graduate School of Business, Stanford University. Prior thereto, Ernst & Young Professor of Accounting at The Wharton School, University of Pennsylvania from 1985 to 2005. | | Asset Allocation Trust |
| | | | |
| 136 | | Wells Fargo Dow Jones Target Date Funds | | Other information (unaudited) |
| | | | | | |
Name and year of birth | | Position held and length of service* | | Principal occupations during past five years or longer | | Current other
public company or
investment company
directorships |
Olivia S. Mitchell (Born 1953) | | Trustee, since 2006 | | International Foundation of Employee Benefit Plans Professor, Wharton School of the University of Pennsylvania since 1993. Director of Wharton’s Pension Research Council and Boettner Center on Pensions & Retirement Research, and Research Associate at the National Bureau of Economic Research. Previously, Cornell University Professor from 1978 to 1993. | | Asset Allocation Trust |
Timothy J. Penny (Born 1951) | | Trustee, since 1996 | | President and Chief Executive Officer of Southern Minnesota Initiative Foundation, a non-profit organization, since 2007 and Senior Fellow at the Humphrey Institute Policy Forum at the University of Minnesota since 1995. Member of the Board of Trustees of NorthStar Education Finance, Inc., a non-profit organization, since 2007. | | Asset Allocation Trust |
Michael S. Scofield (Born 1943) | | Trustee, since 2010 | | Served on the Investment Company Institute’s Board of Governors and Executive Committee from 2008-2011 as well the Governing Council of the Independent Directors Council from 2006-2011 and the Independent Directors Council Executive Committee from 2008-2011. Chairman of the IDC from 2008-2010. Institutional Investor (Fund Directions) Trustee of Year in 2007. Trustee of the Evergreen Funds complex (and its predecessors) from 1984 to 2010. Chairman of the Evergreen Funds from 2000-2010. Former Trustee of the Mentor Funds. Retired Attorney, Law Offices of Michael S. Scofield. | | Asset Allocation Trust |
| * | Length of service dates reflect the Trustee’s commencement of service with the Trust’s predecessor entities, where applicable. |
| ** | Peter Gordon is expected to retire on December 31, 2017. |
Officers
| | | | | | |
Name and year of birth | | Position held and length of service | | Principal occupations during past five years or longer | | |
Andrew Owen (Born 1960) | | President, since 2017 | | Executive Vice President of Wells Fargo Bank, N.A. and President of Wells Fargo & Company and Head of Affiliated Managers, Wells Fargo Asset Management, since 2014. Executive Vice President responsible for marketing, investments and product development for Wells Fargo Funds Management, LLC, from 2009 to 2014. | | |
Jeremy DePalma1 (Born 1974) | | Treasurer, since 2012 | | Senior Vice President of Wells Fargo Funds Management, LLC since 2009. Senior Vice President of Evergreen Investment Management Company, LLC from 2008 to 2010 and head of the Fund Reporting and Control Team within Fund Administration from 2005 to 2010. | | |
C. David Messman (Born 1960) | | Secretary, since 2000; Chief Legal Officer, since 2003 | | Senior Vice President and Secretary of Wells Fargo Funds Management, LLC since 2001. Assistant General Counsel of Wells Fargo Bank, N.A. since 2013 and Vice President and Managing Counsel of Wells Fargo Bank, N.A. from 1996 to 2013. | | |
Michael Whitaker (Born 1967) | | Chief Compliance Officer, since 2016 | | Executive Vice President of Wells Fargo Funds Management, LLC since 2016. Chief Compliance Officer of Fidelity’s Fixed Income Funds and Asset Allocation Funds from 2008 to 2016, Compliance Officer of FMR Co., Inc. from 2014 to 2016, Fidelity Investments Money Management, Inc. from 2014 to 2016, Fidelity Investments from 2007 to 2016. | | |
David Berardi (Born 1975) | | Assistant Treasurer, since 2009 | | Vice President of Wells Fargo Funds Management, LLC since 2009. Vice President of Evergreen Investment Management Company, LLC from 2008 to 2010. Manager of Fund Reporting and Control for Evergreen Investment Management Company, LLC from 2004 to 2010. | | |
| 1 | Jeremy DePalma acts as Treasurer of 69 funds and Assistant Treasurer of 69 funds in the Fund Complex. |
| 2 | The Statement of Additional Information includes additional information about the Trustees and is available, without charge, upon request, by calling 1-800-222-8222 or by visiting the website at wellsfargofunds.com. |
| | | | | | |
| List of abbreviations | | Wells Fargo Dow Jones Target Date Funds | | | 137 | |
The following is a list of common abbreviations for terms and entities that may have appeared in this report.
| ACA | — ACA Financial Guaranty Corporation |
| ADR | — American depositary receipt |
| ADS | — American depositary shares |
| AGC | — Assured Guaranty Corporation |
| AGM | — Assured Guaranty Municipal |
| Ambac | — Ambac Financial Group Incorporated |
| AMT | — Alternative minimum tax |
| BAN | — Bond anticipation notes |
| BHAC | — Berkshire Hathaway Assurance Corporation |
| CAB | — Capital appreciation bond |
| CCAB | — Convertible capital appreciation bond |
| CDA | — Community Development Authority |
| CDO | — Collateralized debt obligation |
| DRIVER | — Derivative inverse tax-exempt receipts |
| DW&P | — Department of Water & Power |
| DWR | — Department of Water Resources |
| ECFA | — Educational & Cultural Facilities Authority |
| EDA | — Economic Development Authority |
| EDFA | — Economic Development Finance Authority |
| ETF | — Exchange-traded fund |
| FDIC | — Federal Deposit Insurance Corporation |
| FFCB | — Federal Farm Credit Banks |
| FGIC | — Financial Guaranty Insurance Corporation |
| FHA | — Federal Housing Administration |
| FHLB | — Federal Home Loan Bank |
| FHLMC | — Federal Home Loan Mortgage Corporation |
| FICO | — The Financing Corporation |
| FNMA | — Federal National Mortgage Association |
| GDR | — Global depositary receipt |
| GNMA | — Government National Mortgage Association |
| HCFR | — Healthcare facilities revenue |
| HEFA | — Health & Educational Facilities Authority |
| HEFAR | — Higher education facilities authority revenue |
| HFA | — Housing Finance Authority |
| HFFA | — Health Facilities Financing Authority |
| HUD | — Department of Housing and Urban Development |
| IDA | — Industrial Development Authority |
| IDAG | — Industrial Development Agency |
| KRW | — Republic of Korea won |
| LIBOR | — London Interbank Offered Rate |
| LIFER | — Long Inverse Floating Exempt Receipts |
| LLC | — Limited liability company |
| LLLP | — Limited liability limited partnership |
| LLP | — Limited liability partnership |
| MBIA | — Municipal Bond Insurance Association |
| MFHR | — Multifamily housing revenue |
| MSTR | — Municipal securities trust receipts |
| MUD | — Municipal Utility District |
| National | — National Public Finance Guarantee Corporation |
| PCFA | — Pollution Control Financing Authority |
| PCL | — Public Company Limited |
| PCR | — Pollution control revenue |
| PFA | — Public Finance Authority |
| PFFA | — Public Facilities Financing Authority |
| PFOTER | — Puttable floating option tax-exempt receipts |
| plc | — Public limited company |
| PUTTER | — Puttable tax-exempt receipts |
| R&D | — Research & development |
| Radian | — Radian Asset Assurance |
| RAN | — Revenue anticipation notes |
| RDA | — Redevelopment Authority |
| RDFA | — Redevelopment Finance Authority |
| REIT | — Real estate investment trust |
| ROC | — Reset option certificates |
| SAVRS | — Select auction variable rate securities |
| SBA | — Small Business Authority |
| SDR | — Swedish depositary receipt |
| SFHR | — Single-family housing revenue |
| SFMR | — Single-family mortgage revenue |
| SPA | — Standby purchase agreement |
| SPDR | — Standard & Poor’s Depositary Receipts |
| SPEAR | — Short Puttable Exempt Adjustable Receipts |
| STRIPS | — Separate trading of registered interest and |
| TAN | — Tax anticipation notes |
| TIPS | — Treasury inflation-protected securities |
| TRAN | — Tax revenue anticipation notes |
| TTFA | — Transportation Trust Fund Authority |
| TVA | — Tennessee Valley Authority |
This page is intentionally left blank.
This page is intentionally left blank.
This page is intentionally left blank.

For more information
More information about Wells Fargo Funds is available free upon request. To obtain literature, please write, email, visit the Fund’s website, or call:
Wells Fargo Funds
P.O. Box 8266
Boston, MA 02266-8266
Email: fundservice@wellsfargo.com
Website: wellsfargofunds.com
Individual investors: 1-800-222-8222
Retail investment professionals: 1-888-877-9275
Institutional investment professionals: 1-866-765-0778
This report and the financial statements contained herein are submitted for the general information of the shareholders of the Fund. If this report is used for promotional purposes, distribution of the report must be accompanied or preceded by a current prospectus. Before investing, please consider the investment objectives, risks, charges, and expenses of the investment. For a current prospectus and, if available, a summary prospectus, containing this information, call 1-800-222-8222 or visit the Fund’s website at wellsfargofunds.com. Read the prospectus carefully before you invest or send money.
Wells Fargo Asset Management (WFAM) is a trade name used by the asset management businesses of Wells Fargo & Company. Wells Fargo Funds Management, LLC, a wholly owned subsidiary of Wells Fargo & Company, provides investment advisory and administrative services for Wells Fargo Funds. Other affiliates of Wells Fargo & Company provide subadvisory and other services for the funds. The funds are distributed by Wells Fargo Funds Distributor, LLC, Member FINRA, an affiliate of Wells Fargo & Company. Neither Wells Fargo Funds Management nor Wells Fargo Funds Distributor has Fund customer accounts/assets, and neither provides investment advice/recommendations or acts as an investment advice fiduciary to any investor.
NOT FDIC INSURED ◾ NO BANK GUARANTEE ◾ MAY LOSE VALUE
© 2017 Wells Fargo Funds Management, LLC. All rights reserved.
| | |
 | | 302020 04-17 AOUTLD/AR003 02-17 |
(a) As of the end of the period covered by the report, Wells Fargo Funds Trust has adopted a code of ethics that applies to its President and Treasurer. A copy of the code of ethics is filed as an exhibit to this Form N-CSR.
(c) During the period covered by this report, there were no amendments to the provisions of the code of ethics adopted in Item 2(a) above.
(d) During the period covered by this report, there were no implicit or explicit waivers to the provisions of the code of ethics adopted in Item 2(a) above.
| ITEM 3. | AUDIT COMMITTEE FINANCIAL EXPERT |
The Board of Trustees of Wells Fargo Funds Trust has determined that Judith Johnson is an audit committee financial expert, as defined in Item 3 of Form N-CSR. Mrs. Johnson is independent for purposes of Item 3 of Form N-CSR.
| ITEM 4. | PRINCIPAL ACCOUNTANT FEES AND SERVICES |
(a), (b), (c), (d) The following table presents aggregate fees billed in each of the last two fiscal years for services rendered to the Registrant by the Registrant’s principal accountant. These fees were billed to the registrant and were approved by the Registrant’s audit committee.
| | | | | | | | |
| | | Fiscal
year ended
February 28, 2017 | | | Fiscal
year ended
February 29, 2016 | |
Audit fees | | $ | 203,232 | | | $ | 169,272 | |
Audit-related fees | | | — | | | | — | |
Tax fees (1) | | | 43,440 | | | | 42,000 | |
All other fees | | | — | | | | — | |
| | | | | | | | |
| | $ | 246,672 | | | $ | 211,272 | |
| | | | | | | | |
| (1) | Tax fees consist of fees for tax compliance, tax advice, tax planning and excise tax. |
(e) The Chairman of the Audit Committees is authorized to pre-approve: (1) audit services for the mutual funds of
Wells Fargo Funds Trust; (2) non-audit tax or compliance consulting or training services provided to the Funds by the independent auditors (“Auditors”) if the fees for any particular engagement are not anticipated to exceed $50,000; and (3) non-audit tax or compliance consulting or training services provided by the Auditors to a Fund’s investment adviser and its controlling entities (where pre-approval is required because the engagement relates directly to the operations and financial reporting of the Fund) if the fee to the Auditors for any particular engagement is not anticipated to exceed $50,000. For any such pre-approval sought from the Chairman, Management shall prepare a brief description of the proposed services. If the Chairman approves of such service, he or she shall sign the statement prepared by Management. Such written statement shall be presented to the full Committees at their next regularly scheduled meetings.
(f) Not applicable
(g) Not applicable
(h) Not applicable
| ITEM 5. | AUDIT COMMITTEE OF LISTED REGISTRANTS |
Not applicable.
A Portfolio of Investments for each series of Wells Fargo Funds Trust is included as part of the report to shareholders filed under Item 1 of this Form.
| ITEM 7. | DISCLOSURE OF PROXY VOTING POLICIES AND PROCEDURES FOR CLOSED-END MANAGEMENT INVESTMENT COMPANIES |
Not applicable.
| ITEM 8. | PORTFOLIO MANAGERS OF CLOSED-END MANAGEMENT INVESTMENT COMPANIES |
Not applicable.
| ITEM 9. | PURCHASES OF EQUITY SECURITIES BY CLOSED-END MANAGEMENT INVESTMENT COMPANY AND AFFILIATED PURCHASERS |
Not applicable.
| ITEM 10. | SUBMISSION OF MATTERS TO A VOTE OF SECURITY HOLDERS |
There have been no material changes to the procedures by which shareholders may recommend nominees to the registrant’s Board of Trustees that have been implemented since the registrant’s last provided disclosure in response to the requirements of this Item.
| ITEM 11. | CONTROLS AND PROCEDURES |
(a) The President and Treasurer have concluded that the Wells Fargo Funds Trust (the “Trust”) disclosure controls and procedures (as defined in Rule 30a-3(c) under the Investment Company Act of 1940) provide reasonable assurances that material information relating to the Trust is made known to them by the appropriate persons based on their evaluation of these controls and procedures as of a date within 90 days of the filing of this report.
(b) There were no significant changes in the Trust’s internal controls over financial reporting (as defined in Rule 30a-3(d) under the Investment Company Act of 1940) that occurred during the second fiscal quarter of the period covered by this report that materially affected, or is reasonably likely to materially affect, the registrant’s internal control over financial reporting.
(a)(1) Code of Ethics pursuant to Item 2 of Form N-CSR is filed and attached hereto as Exhibit COE.
(a)(2) Certification pursuant to Rule 30a-2(a) under the Investment Company Act of 1940 (17 CFR 270.30a-2(a)) is filed and attached hereto as Exhibit 99.CERT.
(a)(3) Not applicable.
(b) Certification pursuant to Rule 30a-2(b) under the Investment Company Act of 1940 (17 CFR 270.30a-2(b)) is filed and attached hereto as Exhibit 99.906CERT.
SIGNATURES
Pursuant to the requirements of the Securities Exchange Act of 1934 and the Investment Company Act of 1940, the registrant has duly caused this report to be signed on its behalf by the undersigned, thereunto duly authorized.
| | |
| Wells Fargo Funds Trust |
| |
| By: | | /s/ Andrew Owen |
| | Andrew Owen |
| | President |
| |
| Date: | | April 26, 2017 |
Pursuant to the requirements of the Securities Exchange Act of 1934 and the Investment Company Act of 1940, this report has been signed below by the following persons on behalf of the registrant and in the capacities and on the date indicated.
| | |
| Wells Fargo Funds Trust |
| |
| By: | | /s/ Andrew Owen |
| | Andrew Owen |
| | President |
| |
| Date: | | April 26, 2017 |
| |
| By: | | /s/ Jeremy DePalma |
| | Jeremy DePalma |
| | Treasurer |
| |
| Date: | | April 26, 2017 |