
UNITED STATES
SECURITIES AND EXCHANGE COMMISSION
Washington, D.C. 20549
FORM N-CSR
CERTIFIED SHAREHOLDER REPORT OF REGISTERED
MANAGEMENT INVESTMENT COMPANIES
Investment Company Act file number: 811-09253
Wells Fargo Funds Trust
(Exact name of registrant as specified in charter)
525 Market St., San Francisco, CA 94105
(Address of principal executive offices) (Zip code)
C. David Messman
Wells Fargo Funds Management, LLC
525 Market St., San Francisco, CA 94105
(Name and address of agent for service)
Registrant’s telephone number, including area code: 800-222-8222
Date of fiscal year end: October 31
Registrant is making a filing for 7 of its series:
Wells Fargo Asia Pacific Fund, Wells Fargo Diversified International Fund, Wells Fargo Emerging Markets Equity Fund, Wells Fargo Emerging Markets Equity Income Fund, Wells Fargo Global Opportunities Fund, Wells Fargo International Equity Fund, and Wells Fargo Intrinsic World Equity Fund.
Date of reporting period: October 31, 2016
ITEM 1. REPORT TO STOCKHOLDERS
Annual Report
October 31, 2016

Wells Fargo Asia Pacific Fund


Reduce clutter. Save trees.
Sign up for electronic delivery of prospectuses and shareholder reports at wellsfargo.com/advantagedelivery
Contents
The views expressed and any forward-looking statements are as of October 31, 2016, unless otherwise noted, and are those of the Fund managers and/or Wells Fargo Funds Management, LLC. Discussions of individual securities, or the markets generally, or any Wells Fargo Fund are not intended as individual recommendations. Future events or results may vary significantly from those expressed in any forward-looking statements. The views expressed are subject to change at any time in response to changing circumstances in the market. Wells Fargo Funds Management, LLC and the Fund disclaim any obligation to publicly update or revise any views expressed or forward-looking statements.
NOT FDIC INSURED ◾ NO BANK GUARANTEE ◾ MAY LOSE VALUE
| | | | |
| 2 | | Wells Fargo Asia Pacific Fund | | Letter to shareholders (unaudited) |

Karla M. Rabusch
President
Wells Fargo Funds
Central bank policies in major markets were accommodative of business growth and economic conditions improved in smaller markets.
Equity markets throughout the region by and large delivered favorable returns in U.S. dollar terms for investors during the period.
Dear Shareholder:
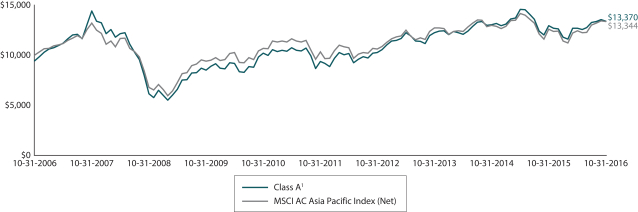
We are pleased to offer you this annual report for the Wells Fargo Asia Pacific Fund for the 12-month period that ended October 31, 2016. Early in the reporting period, concerns about slowing economic growth in the major markets of China and Japan restrained equity returns in the region. The Morgan Stanley Capital International (MSCI) All Country (AC) Asia Pacific Index (Net)1 recorded a -1.43% return for the first six months of the period. During the second half of the period, investors were more optimistic. Central bank policies in major markets were accommodative of business growth and economic conditions improved in smaller markets. The index reflected the improved investment sentiment, recording a 7.52% gain for the second six months of the period to achieve a 5.98% return for the full 12-month period.
The People’s Bank of China, Reserve Bank of India, and the Bank of Japan remained accommodative.
Central bank policies influenced investor sentiment globally throughout the reporting period, particularly in three of the region’s largest economies. The People’s Bank of China (PBOC) remained in an actively-easing mode throughout the reporting period, reducing short-term borrowing costs for banks and implementing policies to encourage lending rather than holding assets on deposit. Despite concerns that the PBOC’s accommodative policies indicated that China’s economy was slowing more quickly than anticipated, China’s growth rate remained higher than that of most other economies. Investor sentiment towards China improved during the period. While the MSCI China Index2 had a 1.54% return for the full 12-month reporting period, its return in the second half of the period was 12.07%, reflecting improved investor confidence as the period progressed.
In Japan, soft consumer spending weighed on growth. In response, the Bank of Japan (BOJ) increased its monetary easing program, imposing a negative interest rate on surplus bank reserves in early 2016. The central bank also continued to purchase shares and bonds in an attempt to support the asset markets. The BOJ’s stimulus program weakened the yen, which supported export growth. The weaker currency benefited Japan’s information technology, materials, and industrials sectors, and many Japanese companies reported strong earnings and improving fundamentals in the latter half of the period. The MSCI Japan Index3 gained 6.21% during the last six months of the reporting period after declining 2.84% during the first six months of the period.
Equity markets throughout the region by and large delivered favorable returns in U.S. dollar terms for investors during the period. Indonesia, New Zealand, and Taiwan delivered double-digit positive returns while markets in Australia, Korea, and Malaysia were also positive although less dramatically. Several countries that export commodities benefited from a mid-year rebound in the price of oil and other natural resources. In addition, as the U.S. dollar strengthened during the period, exporters benefited as their products became more attractive overseas. While stocks in the Philippines were essentially flat, Singapore’s equity market was
| 1 | The Morgan Stanley Capital International (MSCI) All Country (AC) Asia Pacific Index (Net) is a free-float-adjusted market-capitalization-weighted index that is designed to measure the equity market performance of the developed and emerging markets in the Pacific region. The MSCI AC Asia Pacific Index (Net) consists of the following 12 developed and emerging markets countries: Australia, China, Hong Kong, Indonesia, Japan, Korea, Malaysia, New Zealand, the Philippines, Singapore, Taiwan, and Thailand. Source: MSCI. MSCI makes no express or implied warranties or representations and shall have no liability whatsoever with respect to any MSCI data contained herein. The MSCI data may not be further redistributed or used as a basis for other indexes or any securities or financial products. This report is not approved, reviewed, or produced by MSCI. You cannot invest directly in an index. |
| 2 | The MSCI China Index is a free-float-adjusted market-capitalization-weighted index that is designed to measure equity market performance in China. You cannot invest directly in an index. |
| 3 | The MSCI Japan Index is a free-float-adjusted market-capitalization-weighted index that is designed to measure the equity market performance of Japan. You cannot invest directly in an index. |
| | | | | | |
| Letter to shareholders (unaudited) | | Wells Fargo Asia Pacific Fund | | | 3 | |
the notable laggard in the region, falling 7.72%. India’s economy showed growth with moderate inflation. In April 2016, the Reserve Bank of India (RBI) cut its key interest rate to the lowest level in five years, lowered the percentage of deposits that banks must keep at the central bank, and purchased bonds to help provide bank liquidity. Late in the period, the appointment of a new RBI governor, advancement of a goods and services tax provision, and a new bankruptcy law were considered positive by many investors because steps like these may allow further monetary policy accommodation and attract more foreign direct investment.
Don’t let short-term uncertainty derail long-term investment goals. Periods of uncertainty can present challenges, but experience has taught us that maintaining long-term investment goals can be an effective way to plan for the future. To help you create a sound strategy based on your personal goals and risk tolerance, Wells Fargo Funds offers more than 100 mutual funds and other investments spanning a wide range of asset classes and investment styles. Although diversification cannot guarantee an investment profit or prevent losses, we believe it can be an effective way to manage investment risk and potentially smooth out overall portfolio performance. We encourage investors to know their investments and to understand that appropriate levels of risk-taking may unlock opportunities.
Thank you for choosing to invest with Wells Fargo Funds. We appreciate your confidence in us and remain committed to helping you meet your financial needs.
Sincerely,

Karla M. Rabusch
President
Wells Fargo Funds
For further information about your Fund, contact your investment professional, visit our website at wellsfargofunds.com, or call us directly at 1-800-222-8222. We are available 24 hours a day, 7 days a week.
| | | | |
| 4 | | Wells Fargo Asia Pacific Fund | | Performance highlights (unaudited) |
Investment objective
The Fund seeks long-term capital appreciation.
Manager
Wells Fargo Funds Management, LLC
Subadviser
Wells Capital Management Incorporated
Portfolio managers
Anthony L.T. Cragg
Alison Shimada
Average annual total returns (%) as of October 31, 20161
| | | | | | | | | | | | | | | | | | | | | | | | | | | | | | | | | | |
| | | | | Including sales charge | | | Excluding sales charge | | | Expense ratios2 (%) | |
| | | Inception date | | 1 year | | | 5 year | | | 10 year | | | 1 year | | | 5 year | | | 10 year | | | Gross | | | Net3 | |
| Class A (WFAAX) | | 7-31-2007 | | | (2.50 | ) | | | 6.11 | | | | 2.95 | | | | 3.47 | | | | 7.38 | | | | 3.56 | | | | 1.68 | | | | 1.61 | |
| Class C (WFCAX) | | 7-31-2007 | | | 1.75 | | | | 6.59 | | | | 2.78 | | | | 2.75 | | | | 6.59 | | | | 2.78 | | | | 2.43 | | | | 2.36 | |
| Administrator Class (WFADX) | | 7-30-2010 | | | – | | | | – | | | | – | | | | 3.60 | | | | 7.56 | | | | 3.68 | | | | 1.60 | | | | 1.51 | |
| Institutional Class (WFPIX) | | 7-30-2010 | | | – | | | | – | | | | – | | | | 3.83 | | | | 7.74 | | | | 3.78 | | | | 1.35 | | | | 1.26 | |
| MSCI AC Asia Pacific Index (Net)4 | | – | | | – | | | | – | | | | – | | | | 5.98 | | | | 5.29 | | | | 2.93 | | | | – | | | | – | |
Figures quoted represent past performance, which is no guarantee of future results, and do not reflect taxes that a shareholder may pay on fund distributions or the redemption of fund shares. Investment return and principal value of an investment will fluctuate so that an investor’s shares, when redeemed, may be worth more or less than their original cost. Performance shown without sales charges would be lower if sales charges were reflected. Current performance may be lower or higher than the performance data quoted, which assumes the reinvestment of dividends and capital gains. Current month-end performance is available on the Fund’s website, wellsfargofunds.com.
Index returns do not include transaction costs associated with buying and selling securities, any mutual fund fees or expenses, or any taxes. It is not possible to invest directly in an index.
For Class A shares, the maximum front-end sales charge is 5.75%. For Class C shares, the maximum contingent deferred sales charge is 1.00%. Performance including a contingent deferred sales charge assumes the sales charge for the corresponding time period. Administrator Class and Institutional Class shares are sold without a front-end sales charge or contingent deferred sales charge.
Stock values fluctuate in response to the activities of individual companies and general market and economic conditions. Foreign investments are especially volatile and can rise or fall dramatically due to differences in the political and economic conditions of the host country. These risks are generally intensified in emerging markets. The use of derivatives may reduce returns and/or increase volatility. Certain investment strategies tend to increase the total risk of an investment (relative to the broader market). The Fund is exposed to geographic risk and smaller-company securities risk. Consult the Fund’s prospectus for additional information on these and other risks.
Please see footnotes on page 5.
| | | | | | |
| Performance highlights (unaudited) | | Wells Fargo Asia Pacific Fund | | | 5 | |
|
| Growth of $10,000 investment as of October 31, 20165 |
|
|
| 1 | Historical performance shown for the Class A shares prior to its inception reflects the performance of the former Investor Class shares, and includes the higher expenses applicable to the former Investor Class shares. If these expenses has not been included, returns would be higher. Historical performance shown for the Class C shares prior to its inception is based on the performance of the former Investor Class shares, and has been adjusted to reflect the higher expenses applicable to Class C shares. Historical performance shown for Administrator and Institutional Class shares prior to their inception reflects the performance of Class A shares, and includes the higher expenses applicable to Class A shares. If these expenses had not been included, returns would be higher. |
| 2 | Reflects the expense ratios as stated in the most recent prospectuses, which include the impact of 0.01% in acquired fund fees and expenses. The expense ratios shown are subject to change and may differ from the annualized expense ratios shown in the financial highlights of this report, which do not include acquired fund fees and expenses. |
| 3 | The manager has contractually committed through February 28, 2017 to waive fees and/or reimburse expenses to the extent necessary to cap the Fund’s Total Annual Operating Expenses After Fee Waiver at 1.60% for Class A, 2.35% for Class C, 1.50% for Administrator Class, and 1.25% for Institutional Class. After this time, the cap may be increased or the commitment to maintain the cap may be terminated only with the approval of the Board of Trustees. Brokerage commissions, stamp duty fees, interest, taxes, acquired fees and expenses, and extraordinary expenses are excluded from the cap. Without this cap, the Fund’s returns would have been lower. |
| 4 | The Morgan Stanley Capital International (MSCI) All Country (AC) Asia Pacific Index (Net) is a free-float-adjusted market-capitalization-weighted index that is designed to measure the equity market performance of the developed and emerging markets in the Pacific region. The MSCI AC Asia Pacific Index (Net) consists of the following 12 developed and emerging markets countries: Australia, China, Hong Kong, Indonesia, Japan, Korea, Malaysia, New Zealand, the Philippines, Singapore, Taiwan, and Thailand. Source: MSCI. MSCI makes no express or implied warranties or representations and shall have no liability whatsoever with respect to any MSCI data contained herein. The MSCI data may not be further redistributed or used as a basis for other indexes or any securities or financial products. This report is not approved, reviewed, or produced by MSCI. You cannot invest directly in an index. |
| 5 | The chart compares the performance of Class A shares for the most recent ten years with the MSCI AC Asia Pacific Index (Net). The chart assumes a hypothetical investment of $10,000 in Class A shares and reflects all operating expenses and assumes the maximum initial sales charge of 5.75%. |
| 6 | The ten largest holdings, excluding cash and cash equivalents, are calculated based on the value of the investments divided by total net assets of the Fund. Holdings are subject to change and may have changed since the date specified. |
| 7 | Amounts are calculated based on the total long-term investments of the Fund. These amounts are subject to change and may have changed since the date specified. |
| | | | |
| 6 | | Wells Fargo Asia Pacific Fund | | Performance highlights (unaudited) |
MANAGER’S DISCUSSION
Fund highlights
| n | | The Fund underperformed its benchmark, the Morgan Stanley Capital International (MSCI) All Country (AC) Asia Pacific Index (Net), for the 12-month period that ended October 31, 2016. |
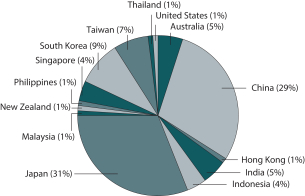
| n | | Overall country allocation contributed to relative returns for the period led by an overweight position to Indonesia and New Zealand; however, stock selection in China/Hong Kong and Japan detracted from relative returns. |
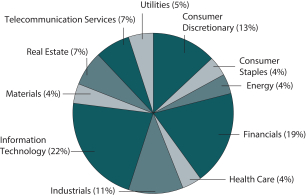
| n | | Among sectors, underweight positions in consumer discretionary and financial stocks contributed to relative returns. Unfavorable stock selection in industrials and information technology (IT) detracted from relative performance. |
The Fund underperformed its benchmark during a volatile market.
During the 12-month period, returns in Asian markets fluctuated according to factors that included the introduction of negative interest rates in Japan, a general resurgence in commodities prices, measures to reduce volatility in the Chinese stock market, and the election of new leaders in Taiwan and the Philippines.
In the financial sector, the Fund benefited from investments in Korean shares such as Hana Financial Group Incorporated, KB Financial Group Incorporated, and Macquarie Korea Infrastructure Fund. Health care equipment and services companies were key drivers within health care benefiting from investments in M3, Incorporated, Tsukui Corporation, and St. Shine Optical Company, Limited. In the industrials sector, the Fund’s investments in the capital goods industry detracted, with notable weakness in Indian wind turbine manufacturers Suzlon Energy Limited and Inox Wind Limited.
| | | | |
| Ten largest holdings (%) as of October 31, 20166 | |
Alibaba Group Holding Limited ADR | | | 2.95 | |
China Construction Bank H Shares | | | 2.36 | |
Tencent Holdings Limited | | | 1.93 | |
Samsung Electronics Company Limited | | | 1.92 | |
Baidu Incorporated ADR | | | 1.84 | |
Industrial & Commercial Bank of China Limited H Shares | | | 1.81 | |
Taiwan Semiconductor Manufacturing Company Limited | | | 1.71 | |
Mitsui Fudosan Company Limited | | | 1.55 | |
Mitsubishi UFJ Financial Group Incorporated | | | 1.54 | |
China Mobile Limited | | | 1.50 | |
Looking at individual countries, notable areas of success included Taiwan, Singapore, and India. In Taiwan, stock selection and an overweight position to IT resulted in strong performance relative to the index. The Fund also benefited from an overweight to Indonesia as it was the best performing market during the period. In Japan, an average underweight of approximately 10.5% was positive but offset by negative stock selection. China/Hong Kong underperformed the index due to the Fund’s overweight position coupled with weak stock selection.
|
| Sector distribution as of October 31, 20167 |
|
 |
|
| Country allocation as of October 31, 20167 |
|
 |
Please see footnotes on page 5.
| | | | | | |
| Performance highlights (unaudited) | | Wells Fargo Asia Pacific Fund | | | 7 | |
Our investment outlook on the Asia Pacific region remains positive.
We believe Chinese equity performance will continue to perform, driven by earnings growth. Cyclical earnings recovery has been unfolding, and industrial reflation, continued policy support, and weaker prior year earnings are expected to drive upside to earnings. Equity risk premium is narrowing as currency and financial sector risks are increasingly contained. The corporate sector is conscientiously deleveraging and banks are derisking loan exposures. With household debt at only 26% of gross domestic product, the structural shift towards consumption has momentum. We are convinced that some of the best value for growth opportunities can be found in China.
Earnings growth remains challenging for Korea, and the export sector is not getting help from the recent strengthening of the won, but the market and our value names are performing on narrowing of deep discount valuations. The IT sector has enjoyed a period of new product launches and strengthening seasonality causing us to revisit our positioning in Taiwanese IT shares.
Although we are cautious near term on valuation grounds, we remain constructive on India over the medium term. Reform momentum has accelerated over the past five months with approval of the Goods and Services Tax bill by the government’s Upper House, the Reserve Bank of India’s (RBI) new monetary policy committee, and the passage of new bankruptcy laws. A relatively good monsoon season this year has also lifted sentiments on the ground, especially in rural India where growth has been sluggish; a tangible recovery is expected by December after the harvest season. Under the new governor Urjit Patel and the newly-established monetary policy committee, the RBI appears to be more dovish than market expectations. We believe there will be more room for monetary easing over the next six to twelve months if inflation remains benign.
We are structurally bullish in Indonesia notwithstanding strong year-to-date performance. The tax amnesty program was an overwhelming success and has several positive implications including a widening of the tax base, currency stabilization, increased confidence, a boost to the president’s credibility, an increase in liquidity, and potential for easing of funding costs. Indonesia is also undergoing a rate-cut cycle and is expected to benefit from the recent recovery in coal prices.
While we see many value-added technologies originating in Japan, we are cognizant of the fact that negative interest rates along with weakening global growth weighs on the market. Therefore, we foresee remaining underweight on a country basis. In the current environment, we favor restructuring plays, unique service models, domestic-related stocks, including tourism, as well as globally competitive companies that can potentially withstand currency volatility. Valuations are supportive, and companies are in the process of adjusting expectations to the prospect of a stronger yen.
We are cautious on the Australian market. Australasia stock valuations are expensive relative to the rest of Asia Pacific, and we see deterioration in earnings momentum due to imbalances in the economy and lack of consumer affordability. New Zealand’s macroeconomic environment is supportive of a stronger market and corporate strategic execution is solid. Therefore, within Australasia, we continue to prefer New Zealand.
Please see footnotes on page 5.
| | | | |
| 8 | | Wells Fargo Asia Pacific Fund | | Fund expenses (unaudited) |
As a shareholder of the Fund, you incur two types of costs: (1) transaction costs, including sales charges (loads) on purchase payments and contingent deferred sales charges (if any) on redemptions and (2) ongoing costs, including management fees, distribution (12b-1) and/or shareholder servicing fees, and other Fund expenses. This example is intended to help you understand your ongoing costs (in dollars) of investing in the Fund and to compare these costs with the ongoing costs of investing in other mutual funds.
The example is based on an investment of $1,000 invested at the beginning of the six-month period and held for the entire period from May 1, 2016 to October 31, 2016.
Actual expenses
The “Actual” line of the table below provides information about actual account values and actual expenses. You may use the information in this line, together with the amount you invested, to estimate the expenses that you paid over the period. Simply divide your account value by $1,000 (for example, an $8,600 account value divided by $1,000 = 8.6), then multiply the result by the number in the “Actual” line under the heading entitled “Expenses paid during period” for your applicable class of shares to estimate the expenses you paid on your account during this period.
Hypothetical example for comparison purposes
The “Hypothetical” line of the table below provides information about hypothetical account values and hypothetical expenses based on the Fund’s actual expense ratio and an assumed rate of return of 5% per year before expenses, which is not the Fund’s actual return. The hypothetical account values and expenses may not be used to estimate the actual ending account balance or expenses you paid for the period. You may use this information to compare the ongoing costs of investing in the Fund and other funds. To do so, compare this 5% hypothetical example with the 5% hypothetical examples that appear in the shareholder reports of the other funds.
Please note that the expenses shown in the table are meant to highlight your ongoing costs only and do not reflect any transactional costs, such as sales charges (loads) and contingent deferred sales charges. Therefore, the “Hypothetical” line of the table is useful in comparing ongoing costs only and will not help you determine the relative total costs of owning different funds. In addition, if these transactional costs were included, your costs would have been higher.
| | | | | | | | | | | | | | | | |
| | | Beginning
account value
5-1-2016 | | | Ending
account value
10-31-2016 | | | Expenses
paid during
the period¹ | | | Annualized net
expense ratio | |
Class A | | | | | | | | | | | | | | | | |
Actual | | $ | 1,000.00 | | | $ | 1,053.96 | | | $ | 8.26 | | | | 1.60 | % |
Hypothetical (5% return before expenses) | | $ | 1,000.00 | | | $ | 1,017.09 | | | $ | 8.11 | | | | 1.60 | % |
Class C | | | | | | | | | | | | | | | | |
Actual | | $ | 1,000.00 | | | $ | 1,050.51 | | | $ | 12.11 | | | | 2.35 | % |
Hypothetical (5% return before expenses) | | $ | 1,000.00 | | | $ | 1,013.32 | | | $ | 11.89 | | | | 2.35 | % |
Administrator Class | | | | | | | | | | | | | | | | |
Actual | | $ | 1,000.00 | | | $ | 1,055.06 | | | $ | 7.75 | | | | 1.50 | % |
Hypothetical (5% return before expenses) | | $ | 1,000.00 | | | $ | 1,017.60 | | | $ | 7.61 | | | | 1.50 | % |
Institutional Class | | | | | | | | | | | | | | | | |
Actual | | $ | 1,000.00 | | | $ | 1,055.95 | | | $ | 6.46 | | | | 1.25 | % |
Hypothetical (5% return before expenses) | | $ | 1,000.00 | | | $ | 1,018.85 | | | $ | 6.34 | | | | 1.25 | % |
| 1 | Expenses paid is equal to the annualized net expense ratio of each class multiplied by the average account value over the period, multiplied by the number of days in the most recent fiscal half-year divided by the number of days in the fiscal year (to reflect the one-half-year period). |
| | | | | | |
| Portfolio of investments—October 31, 2016 | | Wells Fargo Asia Pacific Fund | | | 9 | |
| | | | | | | | | | | | | | | | |
| Security name | | | | | | | | Shares | | | Value | |
| | | | |
Common Stocks: 92.68% | | | | | | | | | | | | | | | | |
| | | | |
| Australia: 5.01% | | | | | | | | | | | | | | | | |
AMP Limited (Financials, Diversified Financial Services) | | | | | | | | | | | 198,057 | | | $ | 688,525 | |
Australia & New Zealand Banking Group Limited (Financials, Banks) | | | | | | | | | | | 61,431 | | | | 1,301,446 | |
BHP Billiton Limited (Materials, Metals & Mining) | | | | | | | | | | | 48,500 | | | | 851,143 | |
Healthscope Limited (Health Care, Health Care Providers & Services) | | | | | | | | | | | 482,300 | | | | 810,817 | |
Medibank Private Limited (Financials, Insurance) | | | | | | | | | | | 306,927 | | | | 602,373 | |
MYOB Group Limited (Information Technology, Internet Software & Services) « | | | | | | | | | | | 256,900 | | | | 723,068 | |
Rio Tinto Limited (Materials, Metals & Mining) | | | | | | | | | | | 19,800 | | | | 816,051 | |
Suncorp Group Limited (Financials, Insurance) | | | | | | | | | | | 156,300 | | | | 1,423,202 | |
| | | | |
| | | | | | | | | | | | | | | 7,216,625 | |
| | | | | | | | | | | | | | | | |
| | | | |
| China: 25.27% | | | | | | | | | | | | | | | | |
Alibaba Group Holding Limited ADR (Information Technology, Internet Software & Services) † | | | | | | | | | | | 41,700 | | | | 4,240,473 | |
AviChina Industry & Technology Company Limited H Shares (Industrials, Aerospace & Defense) | | | | | | | | | | | 2,137,000 | | | | 1,452,120 | |
Baidu Incorporated ADR (Information Technology, Internet Software & Services) † | | | | | | | | | | | 14,941 | | | | 2,642,465 | |
Bank of China Limited H Shares (Financials, Banks) | | | | | | | | | | | 2,630,000 | | | | 1,180,110 | |
Beijing Enterprises Water Group Limited (Utilities, Water Utilities) | | | | | | | | | | | 1,608,000 | | | | 1,167,298 | |
BYD Company Limited H Shares (Consumer Discretionary, Automobiles) † | | | | | | | | | | | 110,000 | | | | 723,353 | |
China Communications Construction Company Limited H Shares (Industrials, Construction & Engineering) | | | | | | | | | | | 647,000 | | | | 712,442 | |
China Construction Bank H Shares (Financials, Banks) | | | | | | | | | | | 4,635,000 | | | | 3,394,576 | |
China Everbright International Limited (Industrials, Commercial Services & Supplies) | | | | | | | | | | | 579,000 | | | | 694,303 | |
China Galaxy Securities Company Limited H Shares (Financials, Capital Markets) | | | | | | | | | | | 817,000 | | | | 777,438 | |
China Longyuan Power Group Corporation H Shares (Utilities, Independent Power & Renewable Electricity Producers) | | | | | | | | | | | 1,470,000 | | | | 1,123,982 | |
China Merchants Bank Company Limited H Shares (Financials, Banks) | | | | | | | | | | | 344,000 | | | | 839,203 | |
China Mobile Limited (Telecommunication Services, Wireless Telecommunication Services) | | | | | | | | | | | 189,000 | | | | 2,165,243 | |
China Petroleum & Chemical Corporation H Shares (Energy, Oil, Gas & Consumable Fuels) | | | | | | | | | | | 2,854,000 | | | | 2,079,169 | |
China Power International Development Limited (Utilities, Independent Power & Renewable Electricity Producers) | | | | | | | | | | | 1,238,000 | | | | 451,746 | |
China State Construction International Holdings Limited (Industrials, Construction & Engineering) | | | | | | | | | | | 798,000 | | | | 1,166,819 | |
CNOOC Limited (Energy, Oil, Gas & Consumable Fuels) | | | | | | | | | | | 609,000 | | | | 775,036 | |
Huaneng Renewables Corporation Limited H Shares (Utilities, Independent Power & Renewable Electricity Producers) | | | | | | | | | | | 4,424,000 | | | | 1,488,823 | |
Industrial & Commercial Bank of China Limited H Shares (Financials, Banks) | | | | | | | | | | | 4,315,000 | | | | 2,598,275 | |
PetroChina Company Limited H Shares (Energy, Oil, Gas & Consumable Fuels) | | | | | | | | | | | 2,298,000 | | | | 1,582,263 | |
Ping An Insurance (Group) Company of China Limited H Shares (Financials, Insurance) | | | | | | | | | | | 154,500 | | | | 815,774 | |
Shanghai Fosun Pharmaceutical Company Limited (Health Care, Pharmaceuticals) | | | | | | | | | | | 235,000 | | | | 722,676 | |
Sinotrans Limited H Shares (Industrials, Air Freight & Logistics) | | | | | | | | | | | 176,000 | | | | 83,058 | |
Tencent Holdings Limited (Information Technology, Internet Software & Services) | | | | | | | | | | | 104,800 | | | | 2,780,956 | |
Yum China Holdings Incorporated (Consumer Discretionary, Hotels, Restaurants & Leisure) † | | | | | | | | | | | 29,400 | | | | 718,533 | |
| | | | |
| | | | | | | | | | | | | | | 36,376,134 | |
| | | | | | | | | | | | | | | | |
| | | | |
| Hong Kong: 1.12% | | | | | | | | | | | | | | | | |
China Overseas Land & Investment Limited (Real Estate, Real Estate Management & Development) | | | | | | | | | | | 522,000 | | | | 1,611,994 | |
| | | | | | | | | | | | | | | | |
| | | | |
| India: 5.23% | | | | | | | | | | | | | | | | |
Bharti Infratel Limited (Telecommunication Services, Diversified Telecommunication Services) | | | | | | | | | | | 131,466 | | | | 684,037 | |
Coal India Limited (Energy, Oil, Gas & Consumable Fuels) | | | | | | | | | | | 221,249 | | | | 1,077,979 | |
Emami Limited (Consumer Staples, Personal Products) | | | | | | | | | | | 43,300 | | | | 780,465 | |
Gateway Distriparks Limited (Industrials, Transportation Infrastructure) | | | | | | | | | | | 9,500 | | | | 35,561 | |
HDFC Bank Limited (Financials, Banks) | | | | | | | | | | | 79,600 | | | | 1,493,755 | |
The accompanying notes are an integral part of these financial statements.
| | | | |
| 10 | | Wells Fargo Asia Pacific Fund | | Portfolio of investments—October 31, 2016 |
| | | | | | | | | | | | | | | | |
| Security name | | | | | | | | Shares | | | Value | |
| | | | |
| India (continued) | | | | | | | | | | | | | | | | |
Hindalco Industries Limited (Materials, Metals & Mining) | | | | | | | | | | | 489,600 | | | $ | 1,097,791 | |
Larsen & Toubro Limited (Industrials, Construction & Engineering) | | | | | | | | | | | 33,400 | | | | 737,774 | |
Maruti Suzuki India Limited (Consumer Discretionary, Automobiles) | | | | | | | | | | | 9,700 | | | | 856,351 | |
Reliance Industries Limited (Energy, Oil, Gas & Consumable Fuels) | | | | | | | | | | | 48,700 | | | | 766,524 | |
| | | | |
| | | | | | | | | | | | | | | 7,530,237 | |
| | | | | | | | | | | | | | | | |
| | | | |
| Indonesia: 4.15% | | | | | | | | | | | | | | | | |
PT Bank Rakyat Indonesia Tbk (Financials, Banks) | | | | | | | | | | | 1,694,300 | | | | 1,584,186 | |
PT Blue Bird Tbk (Industrials, Road & Rail) | | | | | | | | | | | 1,221,000 | | | | 262,017 | |
PT Bumi Serpong Damai Tbk (Real Estate, Real Estate Management & Development) | | | | | | | | | | | 6,551,800 | | | | 1,089,623 | |
PT Cikarang Listrindo Tbk (Utilities, Independent Power & Renewable Electricity Producers) † | | | | | | | | | | | 9,528,700 | | | | 1,095,421 | |
PT Telekomunikasi Indonesia Persero Tbk (Telecommunication Services, Diversified Telecommunication Services) | | | | | | | | | | | 6,008,300 | | | | 1,943,212 | |
| | | | |
| | | | | | | | | | | | | | | 5,974,459 | |
| | | | | | | | | | | | | | | | |
| | | | |
| Japan: 29.83% | | | | | | | | | | | | | | | | |
Bridgestone Corporation (Consumer Discretionary, Auto Components) | | | | | | | | | | | 48,900 | | | | 1,825,532 | |
FUJIFILM Holdings Corporation (Information Technology, Technology Hardware, Storage & Peripherals) | | | | | | | | | | | 40,700 | | | | 1,542,696 | |
Hitachi Limited (Information Technology, Electronic Equipment, Instruments & Components) | | | | | | | | | | | 249,000 | | | | 1,327,747 | |
Isuzu Motors Limited (Consumer Discretionary, Automobiles) | | | | | | | | | | | 93,500 | | | | 1,158,608 | |
Japan Airlines Company Limited (Industrials, Airlines) | | | | | | | | | | | 51,000 | | | | 1,505,636 | |
Japan Hotel REIT Investment Corporation (Real Estate, Equity REITs) | | | | | | | | | | | 2,300 | | | | 1,554,973 | |
Japan Rental Housing Investment Incorporated (Real Estate, Equity REITs) | | | | | | | | | | | 2,400 | | | | 1,856,012 | |
Japan Tobacco Incorporated (Consumer Staples, Tobacco) | | | | | | | | | | | 28,300 | | | | 1,077,813 | |
Kubota Corporation (Industrials, Machinery) | | | | | | | | | | | 51,000 | | | | 824,063 | |
Kyushu Railway Company (Industrials, Road & Rail) † | | | | | | | | | | | 14,400 | | | | 424,297 | |
LINE Corporation (Information Technology, Software) Ǡ | | | | | | | | | | | 17,900 | | | | 734,810 | |
Matsumotokiyoshi Holdings Company Limited (Consumer Staples, Food & Staples Retailing) | | | | | | | | | | | 31,600 | | | | 1,630,171 | |
Mitsubishi UFJ Financial Group Incorporated (Financials, Banks) | | | | | | | | | | | 427,800 | | | | 2,221,607 | |
Mitsui Fudosan Company Limited (Real Estate, Real Estate Management & Development) | | | | | | | | | | | 98,000 | | | | 2,233,899 | |
Nagoya Railroad Company Limited (Industrials, Road & Rail) | | | | | | | | | | | 303,000 | | | | 1,600,667 | |
Nintendo Company Limited (Information Technology, Software) | | | | | | | | | | | 3,300 | | | | 800,534 | |
Nippon Telegraph & Telephone Corporation (Telecommunication Services, Diversified Telecommunication Services) | | | | | | | | | | | 18,900 | | | | 839,840 | |
NTT DOCOMO Incorporated (Telecommunication Services, Wireless Telecommunication Services) | | | | | | | | | | | 28,900 | | | | 727,667 | |
Obayashi Corporation (Industrials, Construction & Engineering) | | | | | | | | | | | 196,200 | | | | 1,895,209 | |
ORIX Corporation (Financials, Diversified Financial Services) | | | | | | | | | | | 73,600 | | | | 1,168,883 | |
Otsuka Corporation (Information Technology, IT Services) | | | | | | | | | | | 23,200 | | | | 1,106,131 | |
Panasonic Corporation (Consumer Discretionary, Household Durables) | | | | | | | | | | | 139,700 | | | | 1,461,342 | |
Recruit Holdings Company Limited (Industrials, Professional Services) | | | | | | | | | | | 18,700 | | | | 752,494 | |
Resona Holdings Incorporated (Financials, Banks) | | | | | | | | | | | 295,600 | | | | 1,313,527 | |
Ryohin Keikaku Company Limited (Consumer Discretionary, Multiline Retail) | | | | | | | | | | | 6,400 | | | | 1,369,467 | |
Sekisui House Limited (Consumer Discretionary, Household Durables) | | | | | | | | | | | 115,400 | | | | 1,910,862 | |
Skylark Company Limited (Consumer Discretionary, Hotels, Restaurants & Leisure) | | | | | | | | | | | 113,100 | | | | 1,592,912 | |
Sony Corporation (Consumer Discretionary, Household Durables) | | | | | | | | | | | 45,500 | | | | 1,458,239 | |
Sumitomo Mitsui Trust Holdings Incorporated (Financials, Banks) | | | | | | | | | | | 48,600 | | | | 1,645,180 | |
Suzuki Motor Corporation (Consumer Discretionary, Automobiles) | | | | | | | | | | | 55,600 | | | | 1,977,572 | |
Tsukui Corporation (Health Care, Health Care Providers & Services) | | | | | | | | | | | 212,900 | | | | 1,398,761 | |
| | | | |
| | | | | | | | | | | | | | | 42,937,151 | |
| | | | | | | | | | | | | | | | |
The accompanying notes are an integral part of these financial statements.
| | | | | | |
| Portfolio of investments—October 31, 2016 | | Wells Fargo Asia Pacific Fund | | | 11 | |
| | | | | | | | | | | | | | | | |
| Security name | | | | | | | | Shares | | | Value | |
| | | | |
| Malaysia: 0.99% | | | | | | | | | | | | | | | | |
IHH Healthcare Bhd (Health Care, Health Care Providers & Services) | | | | | | | | | | | 493,400 | | | $ | 752,744 | |
Tenaga Nasional Bhd (Utilities, Electric Utilities) | | | | | | | | | | | 196,300 | | | | 671,023 | |
| | | | |
| | | | | | | | | | | | | | | 1,423,767 | |
| | | | | | | | | | | | | | | | |
| | | | |
| New Zealand: 1.15% | | | | | | | | | | | | | | | | |
Air New Zealand Limited (Industrials, Airlines) | | | | | | | | | | | 533,800 | | | | 736,720 | |
Fletcher Building Limited (Materials, Construction Materials) | | | | | | | | | | | 124,700 | | | | 924,724 | |
| | | | |
| | | | | | | | | | | | | | | 1,661,444 | |
| | | | | | | | | | | | | | | | |
| | | | |
| Philippines: 0.71% | | | | | | | | | | | | | | | | |
Globe Telecom Incorporated (Telecommunication Services, Wireless Telecommunication Services) | | | | | | | | | | | 27,675 | | | | 1,017,327 | |
| | | | | | | | | | | | | | | | |
| | | | |
| Singapore: 3.79% | | | | | | | | | | | | | | | | |
CapitaLand Commercial Trust Limited (Real Estate, Equity REITs) | | | | | | | | | | | 642,000 | | | | 726,792 | |
CapitaLand Mall Trust (Real Estate, Equity REITs) | | | | | | | | | | | 472,700 | | | | 703,316 | |
Jardine Cycle & Carriage Limited (Consumer Discretionary, Distributors) | | | | | | | | | | | 35,000 | | | | 1,062,138 | |
Singapore Post Limited (Industrials, Air Freight & Logistics) | | | | | | | | | | | 999,700 | | | | 1,149,700 | |
Singapore Technologies Engineering Limited (Industrials, Aerospace & Defense) | | | | | | | | | | | 322,000 | | | | 724,428 | |
Singapore Telecommunications Limited (Telecommunication Services, Diversified Telecommunication Services) | | | | | | | | | | | 387,700 | | | | 1,081,241 | |
| | | | |
| | | | | | | | | | | | | | | 5,447,615 | |
| | | | | | | | | | | | | | | | |
| | | | |
| South Korea: 6.58% | | | | | | | | | | | | | | | | |
Hana Financial Group Incorporated (Financials, Banks) | | | | | | | | | | | 51,790 | | | | 1,484,564 | |
Hyundai Motor Company (Consumer Discretionary, Automobiles) | | | | | | | | | | | 9,200 | | | | 1,125,628 | |
KB Financial Group Incorporated (Financials, Banks) | | | | | | | | | | | 39,500 | | | | 1,460,214 | |
Korea Electric Power Corporation (Utilities, Electric Utilities) | | | | | | | | | | | 26,890 | | | | 1,157,380 | |
LG Chem Limited (Materials, Chemicals) | | | | | | | | | | | 7,700 | | | | 1,658,772 | |
POSCO (Materials, Metals & Mining) | | | | | | | | | | | 3,400 | | | | 704,217 | |
Samsung Biologics Company Limited (Health Care, Life Sciences Tools & Services) † | | | | | | | | | | | 500 | | | | 60,022 | |
Samsung Electronics Company Limited (Information Technology, Technology Hardware, Storage & Peripherals) | | | | | | | | | | | 763 | | | | 1,092,905 | |
SK Telecom Company Limited (Telecommunication Services, Wireless Telecommunication Services) | | | | | | | | | | | 3,700 | | | | 722,700 | |
| | | | |
| | | | | | | | | | | | | | | 9,466,402 | |
| | | | | | | | | | | | | | | | |
| | | | |
| Taiwan: 7.32% | | | | | | | | | | | | | | | | |
Advanced Semiconductor Engineering Incorporated (Information Technology, Semiconductors & Semiconductor Equipment) | | | | | | | | | | | 612,000 | | | | 719,487 | |
Chicony Electronics Company Limited (Information Technology, Technology Hardware, Storage & Peripherals) | | | | | | | | | | | 265,410 | | | | 679,557 | |
Hon Hai Precision Industry Company Limited (Information Technology, Electronic Equipment, Instruments & Components) | | | | | | | | | | | 747,085 | | | | 2,019,373 | |
Largan Precision Company Limited (Information Technology, Electronic Equipment, Instruments & Components) | | | | | | | | | | | 7,000 | | | | 828,488 | |
MediaTek Incorporated (Information Technology, Semiconductors & Semiconductor Equipment) | | | | | | | | | | | 97,000 | | | | 737,701 | |
Siliconware Precision Industries Company (Information Technology, Semiconductors & Semiconductor Equipment) | | | | | | | | | | | 493,000 | | | | 745,964 | |
Taiwan Semiconductor Manufacturing Company Limited (Information Technology, Semiconductors & Semiconductor Equipment) | | | | | | | | | | | 413,000 | | | | 2,466,941 | |
Uni-President Enterprises Corporation (Consumer Staples, Food Products) | | | | | | | | | | | 413,000 | | | | 799,629 | |
United Microelectronics Corporation (Information Technology, Semiconductors & Semiconductor Equipment) | | | | | | | | | | | 2,180,000 | | | | 811,693 | |
The accompanying notes are an integral part of these financial statements.
| | | | |
| 12 | | Wells Fargo Asia Pacific Fund | | Portfolio of investments—October 31, 2016 |
| | | | | | | | | | | | | | | | |
| Security name | | | | | | | | Shares | | | Value | |
| | | | |
| Taiwan (continued) | | | | | | | | | | | | | | | | |
WPG Holdings Company Limited (Information Technology, Electronic Equipment, Instruments & Components) | | | | | | | | | | | 619,000 | | | $ | 725,755 | |
| | | | |
| | | | | | | | | | | | | | | 10,534,588 | |
| | | | | | | | | | | | | | | | |
| | | | |
| Thailand: 1.04% | | | | | | | | | | | | | | | | |
Bumrungrad Hospital PCL (Health Care, Health Care Providers & Services) | | | | | | | | | | | 150,500 | | | | 786,956 | |
Land & Houses PCL (Real Estate, Real Estate Management & Development) | | | | | | | | | | | 2,679,400 | | | | 704,350 | |
| | | | |
| | | | | | | | | | | | | | | 1,491,306 | |
| | | | | | | | | | | | | | | | |
| | | | |
| United States: 0.49% | | | | | | | | | | | | | | | | |
Samsonite International SA (Consumer Discretionary, Textiles, Apparel & Luxury Goods) | | | | | | | | | | | 225,300 | | | | 708,824 | |
| | | | | | | | | | | | | | | | |
| | | | |
Total Common Stocks (Cost $127,062,813) | | | | | | | | | | | | | | | 133,397,873 | |
| | | | | | | | | | | | | | | | |
| | | | |
| | | | | | Expiration date | | | | | | | |
| Participation Notes: 2.65% | | | | | | | | | | | | | | | | |
| | | | |
| China: 2.65% | | | | | | | | | | | | | | | | |
HSBC Bank plc (Han’s Laser Technology Industry Group Company Limited Class A) (Industrials, Machinery) † | | | | | | | 3-18-2019 | | | | 229,000 | | | | 763,570 | |
HSBC Bank plc (Hangzhou Hikvision Digital Technology Company Limited Class A) (Information Technology, Electronic Equipment, Instruments & Components) † | | | | | | | 12-7-2022 | | | | 192,000 | | | | 696,386 | |
HSBC Bank plc (Inner Mongolia Yili Industrial Group Company Limited Class A) (Consumer Staples, Food Products) † | | | | | | | 9-25-2023 | | | | 344,600 | | | | 916,265 | |
HSBC Bank plc (Tasly Pharmaceutical Group Company Limited Class A) (Health Care, Pharmaceuticals) † | | | | | | | 12-14-2022 | | | | 112,000 | | | | 683,995 | |
UBS AG (GoerTek Incorporated Class A) (Information Technology, Electronic Equipment, Instruments & Components) † | | | | | | | 7-26-2017 | | | | 165,700 | | | | 752,347 | |
| | | | |
Total Participation Notes (Cost $3,705,382) | | | | | | | | | | | | | | | 3,812,563 | |
| | | | | | | | | | | | | | | | |
| | | | |
| | | Dividend yield | | | | | | | | | | |
| Preferred Stocks: 1.92% | | | | | | | | | | | | | | | | |
| | | | |
| South Korea: 1.92% | | | | | | | | | | | | | | | | |
Samsung Electronics Company Limited (Information Technology, Technology Hardware, Storage & Peripherals) ± | | | 1.56 | % | | | | | | | 2,400 | | | | 2,762,333 | |
| | | | | | | | | | | | | | | | |
| | | | |
Total Preferred Stocks (Cost $1,866,044) | | | | | | | | | | | | | | | 2,762,333 | |
| | | | | | | | | | | | | | | | |
| | | | |
| | | Yield | | | | | | | | | | |
| Short-Term Investments: 2.29% | | | | | | | | | | | | | | | | |
| | | | |
| Investment Companies: 2.29% | | | | | | | | | | | | | | | | |
Securities Lending Cash Investment LLC (l)(r)(u) | | | 0.69 | | | | | | | | 1,315,692 | | | | 1,315,824 | |
Wells Fargo Government Money Market Fund Select Class (l)(u) | | | 0.32 | | | | | | | | 1,975,446 | | | | 1,975,446 | |
| | | | |
Total Short-Term Investments (Cost $3,291,211) | | | | | | | | | | | | | | | 3,291,270 | |
| | | | | | | | | | | | | | | | |
| | | | | | | | |
| Total investments in securities (Cost $135,925,450) * | | | 99.54 | % | | | 143,264,039 | |
Other assets and liabilities, net | | | 0.46 | | | | 660,471 | |
| | | | | | | | |
| Total net assets | | | 100.00 | % | | $ | 143,924,510 | |
| | | | | | | | |
The accompanying notes are an integral part of these financial statements.
| | | | | | |
| Portfolio of investments—October 31, 2016 | | Wells Fargo Asia Pacific Fund | | | 13 | |
| « | All or a portion of this security is on loan. |
| † | Non-income-earning security |
| ± | Variable rate investment. The rate shown is the rate in effect at period end. |
| (l) | The issuer of the security is an affiliated person of the Fund as defined in the Investment Company Act of 1940. |
| (r) | The investment is a non-registered investment vehicle purchased with cash collateral received from securities on loan. |
| (u) | The rate represents the 7-day annualized yield at period end. |
| * | Cost for federal income tax purposes is $137,194,189 and unrealized gains (losses) consists of: |
| | | | |
Gross unrealized gains | | $ | 14,207,264 | |
Gross unrealized losses | | | (8,137,414 | ) |
| | | | |
Net unrealized gains | | $ | 6,069,850 | |
The accompanying notes are an integral part of these financial statements.
| | | | |
| 14 | | Wells Fargo Asia Pacific Fund | | Statement of assets and liabilities—October 31, 2016 |
| | | | |
| | | | |
| |
Assets | | | | |
Investments | | | | |
In unaffiliated securities (including $1,251,920 of securities loaned), at value (cost $132,634,239) | | $ | 139,972,769 | |
In affiliated securities, at value (cost $3,291,211) | | | 3,291,270 | |
| | | | |
Total investments, at value (cost $135,925,450) | | | 143,264,039 | |
Cash | | | 1,452,436 | |
Foreign currency, at value (cost $1,007,541) | | | 1,004,686 | |
Receivable for investments sold | | | 2,287,671 | |
Receivable for Fund shares sold | | | 41,266 | |
Receivable for dividends | | | 282,948 | |
Receivable for securities lending income | | | 746 | |
Prepaid expenses and other assets | | | 34,339 | |
| | | | |
Total assets | | | 148,368,131 | |
| | | | |
| |
Liabilities | | | | |
Payable for investments purchased | | | 2,634,321 | |
Payable for Fund shares redeemed | | | 223,409 | |
Payable upon receipt of securities loaned | | | 1,315,763 | |
Management fee payable | | | 115,289 | |
Distribution fee payable | | | 1,455 | |
Administration fees payable | | | 24,367 | |
Accrued expenses and other liabilities | | | 129,017 | |
| | | | |
Total liabilities | | | 4,443,621 | |
| | | | |
Total net assets | | $ | 143,924,510 | |
| | | | |
| |
NET ASSETS CONSIST OF | | | | |
Paid-in capital | | $ | 220,688,325 | |
Undistributed net investment income | | | 1,270,787 | |
Accumulated net realized losses on investments | | | (85,358,301 | ) |
Net unrealized gains on investments | | | 7,323,699 | |
| | | | |
Total net assets | | $ | 143,924,510 | |
| | | | |
| |
COMPUTATION OF NET ASSET VALUE AND OFFERING PRICE PER SHARE | | | | |
Net assets – Class A | | $ | 120,107,719 | |
Shares outstanding – Class A1 | | | 9,916,323 | |
Net asset value per share – Class A | | | $12.11 | |
Maximum offering price per share – Class A2 | | | $12.85 | |
Net assets – Class C | | $ | 2,222,545 | |
Shares outstanding – Class C1 | | | 194,325 | |
Net asset value per share – Class C | | | $11.44 | |
Net assets – Administrator Class | | $ | 11,357,479 | |
Shares outstanding – Administrator Class1 | | | 955,745 | |
Net asset value per share – Administrator Class | | | $11.88 | |
Net assets – Institutional Class | | $ | 10,236,767 | |
Shares outstanding – Institutional Class1 | | | 860,805 | |
Net asset value per share – Institutional Class | | | $11.89 | |
| 1 | The Fund has an unlimited number of authorized shares. |
| 2 | Maximum offering price is computed as 100/94.25 of net asset value. On investments of $50,000 or more, the offering price is reduced. |
The accompanying notes are an integral part of these financial statements.
| | | | | | |
| Statement of operations—year ended October 31, 2016 | | Wells Fargo Asia Pacific Fund | | | 15 | |
| | | | |
| | | | |
| |
Investment income | | | | |
Dividends (net of foreign withholding taxes of $443,005) | | $ | 3,751,141 | |
Securities lending income, net | | | 12,806 | |
Income from affiliated securities | | | 9,842 | |
| | | | |
Total investment income | | | 3,773,789 | |
| | | | |
| |
Expenses | | | | |
Management fee | | | 1,474,349 | |
Administration fees | |
Class A | | | 259,511 | |
Class C | | | 5,649 | |
Administrator Class | | | 15,241 | |
Institutional Class | | | 12,278 | |
Shareholder servicing fees | |
Class A | | | 308,652 | |
Class C | | | 6,724 | |
Administrator Class | | | 29,310 | |
Distribution fee | |
Class C | | | 20,174 | |
Custody and accounting fees | | | 115,671 | |
Professional fees | | | 54,413 | |
Registration fees | | | 74,113 | |
Shareholder report expenses | | | 43,461 | |
Trustees’ fees and expenses | | | 22,173 | |
Other fees and expenses | | | 24,513 | |
| | | | |
Total expenses | | | 2,466,232 | |
Less: Fee waivers and/or expense reimbursements | | | (135,943 | ) |
| | | | |
Net expenses | | | 2,330,289 | |
| | | | |
Net investment income | | | 1,443,500 | |
| | | | |
| |
REALIZED AND UNREALIZED GAINS (LOSSES) ON INVESTMENTS | | | | |
| |
Net realized (gains) losses on: | | | | |
Unaffiliated securities | | | (3,319,118 | ) |
Affiiliated securities | | | 2 | |
| | | | |
Net realized losses on investments | | | (3,319,116 | ) |
| | | | |
| |
Net change in unrealized gains (losses) on: | | | | |
Unaffiliated securities | | | 5,861,361 | |
Affiiliated securities | | | 59 | |
| | | | |
Net change in unrealized gains (losses) on investments | | | 5,861,420 | |
| | | | |
Net realized and unrealized gains (losses) on investments | | | 2,542,304 | |
| | | | |
Net increase in net assets resulting from operations | | $ | 3,985,804 | |
| | | | |
The accompanying notes are an integral part of these financial statements.
| | | | |
| 16 | | Wells Fargo Asia Pacific Fund | | Statement of changes in net assets |
| | | | | | | | | | | | | | | | |
| | | Year ended
October 31, 2016 | | | Year ended
October 31, 2015 | |
| | | | |
Operations | | | | | | | | | | | | | | | | |
Net investment income | | | | | | $ | 1,443,500 | | | | | | | $ | 1,087,833 | |
Net realized gains (losses) on investments | | | | | | | (3,319,116 | ) | | | | | | | 5,808,777 | |
Net change in unrealized gains (losses) on investments | | | | | | | 5,861,420 | | | | | | | | (10,236,642 | ) |
| | | | |
Net increase (decrease) in net assets resulting from operations | | | | | | | 3,985,804 | | | | | | | | (3,340,032 | ) |
| | | | |
| | | | |
Distributions to shareholders from | | | | | | | | | | | | | | | | |
Net investment income | | | | | | | | | | | | | | | | |
Class A | | | | | | | (2,403,259 | ) | | | | | | | (82,320 | ) |
Class C | | | | | | | (44,466 | ) | | | | | | | (18,378 | ) |
Administrator Class | | | | | | | (274,359 | ) | | | | | | | (197,300 | ) |
Institutional Class | | | | | | | (250,376 | ) | | | | | | | (18,960 | ) |
Investor Class | | | | | | | N/A | | | | | | | | (1,661,776 | )1 |
| | | | |
Total distributions to shareholders | | | | | | | (2,972,460 | ) | | | | | | | (1,978,734 | ) |
| | | | |
| | | | |
Capital share transactions | | | Shares | | | | | | | | Shares | | | | | |
Proceeds from shares sold | | | | | | | | | | | | | | | | |
Class A | | | 1,604,531 | | | | 18,556,341 | | | | 11,260,731 | | | | 136,016,227 | |
Class C | | | 13,686 | | | | 149,151 | | | | 140,676 | | | | 1,691,622 | |
Administrator Class | | | 70,112 | | | | 783,199 | | | | 1,087,437 | | | | 13,023,913 | |
Institutional Class | | | 334,375 | | | | 3,796,409 | | | | 971,690 | | | | 10,822,354 | |
Investor Class | | | N/A | | | | N/A | | | | 3,572,603 | 1 | | | 44,979,487 | 1 |
| | | | |
| | | | | | | 23,285,100 | | | | | | | | 206,533,603 | |
| | | | |
Reinvestment of distributions | | | | | | | | | | | | | | | | |
Class A | | | 203,382 | | | | 2,336,858 | | | | 6,243 | | | | 74,538 | |
Class C | | | 3,274 | | | | 35,719 | | | | 1,201 | | | | 13,666 | |
Administrator Class | | | 24,161 | | | | 272,051 | | | | 16,772 | | | | 196,572 | |
Institutional Class | | | 20,214 | | | | 227,203 | | | | 687 | | | | 8,043 | |
Investor Class | | | N/A | | | | N/A | | | | 138,610 | 1 | | | 1,630,058 | 1 |
| | | | |
| | | | | | | 2,871,831 | | | | | | | | 1,922,877 | |
| | | | |
Payment for shares redeemed | | | | | | | | | | | | | | | | |
Class A | | | (3,431,646 | ) | | | (39,403,961 | ) | | | (281,262 | ) | | | (3,389,825 | ) |
Class C | | | (132,110 | ) | | | (1,420,868 | ) | | | (42,158 | ) | | | (493,632 | ) |
Administrator Class | | | (337,011 | ) | | | (3,756,219 | ) | | | (1,069,973 | ) | | | (12,472,235 | ) |
Institutional Class | | | (434,461 | ) | | | (4,818,709 | ) | | | (73,533 | ) | | | (850,292 | ) |
Investor Class | | | N/A | | | | N/A | | | | (16,272,754 | )1 | | | (194,126,550 | )1 |
| | | | |
| | | | | | | (49,399,757 | ) | | | | | | | (211,332,534 | ) |
| | | | |
Net decrease in net assets resulting from capital share transactions | | | | | | | (23,242,826 | ) | | | | | | | (2,876,054 | ) |
| | | | |
Total decrease in net assets | | | | | | | (22,229,482 | ) | | | | | | | (8,194,820 | ) |
| | | | |
| | | | |
Net assets | | | | | | | | | | | | | | | | |
Beginning of period | | | | | | | 166,153,992 | | | | | | | | 174,348,812 | |
| | | | |
End of period | | | | | | $ | 143,924,510 | | | | | | | $ | 166,153,992 | |
| | | | |
Undistributed net investment income | | | | | | $ | 1,270,787 | | | | | | | $ | 2,254,942 | |
| | | | |
| 1 | For the period from November 1, 2014 to October 23, 2015. Effective at the close of business on October 23, 2015, Investor Class shares were converted to Class A shares and are no longer offered by the Fund. |
The accompanying notes are an integral part of these financial statements.
| | | | | | |
| Financial highlights | | Wells Fargo Asia Pacific Fund | | | 17 | |
(For a share outstanding throughout each period)
| | | | | | | | | | | | | | | | | | | | |
| | | Year ended October 31 | |
| CLASS A | | 2016 | | | 2015 | | | 2014 | | | 2013 | | | 2012 | |
Net asset value, beginning of period | | | $11.92 | | | | $12.18 | | | | $11.72 | | | | $10.19 | | | | $9.30 | |
Net investment income | | | 0.11 | 1 | | | 0.04 | 1 | | | 0.09 | 1 | | | 0.12 | 1 | | | 0.10 | 1 |
Net realized and unrealized gains (losses) on investments | | | 0.29 | | | | (0.16 | ) | | | 0.67 | | | | 1.79 | | | | 0.79 | |
| | | | | | | | | | | | | | | | | | | | |
Total from investment operations | | | 0.40 | | | | (0.12 | ) | | | 0.76 | | | | 1.91 | | | | 0.89 | |
Distributions to shareholders from | | | | | | | | | | | | | | | | | | | | |
Net investment income | | | (0.21 | ) | | | (0.14 | ) | | | (0.30 | ) | | | (0.38 | ) | | | 0.00 | |
Net asset value, end of period | | | $12.11 | | | | $11.92 | | | | $12.18 | | | | $11.72 | | | | $10.19 | |
Total return2 | | | 3.47 | % | | | (0.95 | )% | | | 6.61 | % | | | 19.24 | % | | | 9.57 | % |
Ratios to average net assets (annualized) | | | | | | | | | | | | | | | | | | | | |
Gross expenses | | | 1.69 | % | | | 1.72 | % | | | 1.71 | % | | | 1.79 | % | | | 1.86 | % |
Net expenses | | | 1.60 | % | | | 1.60 | % | | | 1.60 | % | | | 1.60 | % | | | 1.60 | % |
Net investment income | | | 0.97 | % | | | 0.34 | % | | | 0.80 | % | | | 1.08 | % | | | 1.04 | % |
Supplemental data | | | | | | | | | | | | | | | | | | | | |
Portfolio turnover rate | | | 52 | % | | | 113 | % | | | 113 | % | | | 187 | % | | | 163 | % |
Net assets, end of period (000s omitted) | | | $120,108 | | | | $137,578 | | | | $6,755 | | | | $8,720 | | | | $5,699 | |
| 1 | Calculated based upon average shares outstanding |
| 2 | Total return calculations do not include any sales charges. |
The accompanying notes are an integral part of these financial statements.
| | | | |
| 18 | | Wells Fargo Asia Pacific Fund | | Financial highlights |
(For a share outstanding throughout each period)
| | | | | | | | | | | | | | | | | | | | |
| | | Year ended October 31 | |
| CLASS C | | 2016 | | | 2015 | | | 2014 | | | 2013 | | | 2012 | |
Net asset value, beginning of period | | | $11.29 | | | | $11.57 | | | | $11.15 | | | | $9.73 | | | | $8.98 | |
Net investment income (loss) | | | 0.02 | 1 | | | (0.00 | )1,2 | | | 0.01 | 1 | | | 0.05 | | | | 0.09 | 1 |
Net realized and unrealized gains (losses) on investments | | | 0.28 | | | | (0.20 | ) | | | 0.63 | | | | 1.69 | | | | 0.69 | |
| | | | | | | | | | | | | | | | | | | | |
Total from investment operations | | | 0.30 | | | | (0.20 | ) | | | 0.64 | | | | 1.74 | | | | 0.78 | |
Distributions to shareholders from | | | | | | | | | | | | | | | | | | | | |
Net investment income | | | (0.15 | ) | | | (0.08 | ) | | | (0.22 | ) | | | (0.32 | ) | | | (0.03 | ) |
Net asset value, end of period | | | $11.44 | | | | $11.29 | | | | $11.57 | | | | $11.15 | | | | $9.73 | |
Total return3 | | | 2.75 | % | | | (1.71 | )% | | | 5.76 | % | | | 18.44 | % | | | 8.78 | % |
Ratios to average net assets (annualized) | | | | | | | | | | | | | | | | | | | | |
Gross expenses | | | 2.44 | % | | | 2.46 | % | | | 2.46 | % | | | 2.54 | % | | | 2.62 | % |
Net expenses | | | 2.35 | % | | | 2.35 | % | | | 2.35 | % | | | 2.35 | % | | | 2.35 | % |
Net investment income (loss) | | | 0.14 | % | | | (0.01 | )% | | | 0.12 | % | | | 0.37 | % | | | 0.92 | % |
Supplemental data | | | | | | | | | | | | | | | | | | | | |
Portfolio turnover rate | | | 52 | % | | | 113 | % | | | 113 | % | | | 187 | % | | | 163 | % |
Net assets, end of period (000s omitted) | | | $2,223 | | | | $3,495 | | | | $2,427 | | | | $1,980 | | | | $1,673 | |
| 1 | Calculated based upon average shares outstanding |
| 2 | Amount is less than $0.005. |
| 3 | Total return calculations do not include any sales charges. |
The accompanying notes are an integral part of these financial statements.
| | | | | | |
| Financial highlights | | Wells Fargo Asia Pacific Fund | | | 19 | |
(For a share outstanding throughout each period)
| | | | | | | | | | | | | | | | | | | | |
| | | Year ended October 31 | |
| ADMINISTRATOR CLASS | | 2016 | | | 2015 | | | 2014 | | | 2013 | | | 2012 | |
Net asset value, beginning of period | | | $11.72 | | | | $11.99 | | | | $11.54 | | | | $10.04 | | | | $9.29 | |
Net investment income | | | 0.12 | | | | 0.11 | 1 | | | 0.12 | 1 | | | 0.14 | 1 | | | 0.17 | |
Net realized and unrealized gains (losses) on investments | | | 0.29 | | | | (0.21 | ) | | | 0.65 | | | | 1.77 | | | | 0.71 | |
| | | | | | | | | | | | | | | | | | | | |
Total from investment operations | | | 0.41 | | | | (0.10 | ) | | | 0.77 | | | | 1.91 | | | | 0.88 | |
Distributions to shareholders from | | | | | | | | | | | | | | | | | | | | |
Net investment income | | | (0.25 | ) | | | (0.17 | ) | | | (0.32 | ) | | | (0.41 | ) | | | (0.13 | ) |
Net asset value, end of period | | | $11.88 | | | | $11.72 | | | | $11.99 | | | | $11.54 | | | | $10.04 | |
Total return | | | 3.60 | % | | | (0.83 | )% | | | 6.86 | % | | | 19.57 | % | | | 9.66 | % |
Ratios to average net assets (annualized) | | | | | | | | | | | | | | | | | | | | |
Gross expenses | | | 1.61 | % | | | 1.56 | % | | | 1.52 | % | | | 1.61 | % | | | 1.67 | % |
Net expenses | | | 1.47 | % | | | 1.40 | % | | | 1.40 | % | | | 1.40 | % | | | 1.40 | % |
Net investment income | | | 1.07 | % | | | 0.87 | % | | | 1.04 | % | | | 1.26 | % | | | 1.74 | % |
Supplemental data | | | | | | | | | | | | | | | | | | | | |
Portfolio turnover rate | | | 52 | % | | | 113 | % | | | 113 | % | | | 187 | % | | | 163 | % |
Net assets, end of period (000s omitted) | | | $11,357 | | | | $14,048 | | | | $13,956 | | | | $12,577 | | | | $12,860 | |
| 1 | Calculated based upon average shares outstanding |
The accompanying notes are an integral part of these financial statements.
| | | | |
| 20 | | Wells Fargo Asia Pacific Fund | | Financial highlights |
(For a share outstanding throughout each period)
| | | | | | | | | | | | | | | | | | | | |
| | | Year ended October 31 | |
| INSTITUTIONAL CLASS | | 2016 | | | 2015 | | | 2014 | | | 2013 | | | 2012 | |
Net asset value, beginning of period | | | $11.73 | | | | $12.00 | | | | $11.55 | | | | $10.05 | | | | $9.30 | |
Net investment income | | | 0.13 | | | | 0.15 | 1 | | | 0.14 | 1 | | | 0.18 | 1 | | | 0.18 | |
Net realized and unrealized gains (losses) on investments | | | 0.30 | | | | (0.23 | ) | | | 0.65 | | | | 1.74 | | | | 0.71 | |
| | | | | | | | | | | | | | | | | | | | |
Total from investment operations | | | 0.43 | | | | (0.08 | ) | | | 0.79 | | | | 1.92 | | | | 0.89 | |
Distributions to shareholders from | | | | | | | | | | | | | | | | | | | | |
Net investment income | | | (0.27 | ) | | | (0.19 | ) | | | (0.34 | ) | | | (0.42 | ) | | | (0.14 | ) |
Net asset value, end of period | | | $11.89 | | | | $11.73 | | | | $12.00 | | | | $11.55 | | | | $10.05 | |
Total return | | | 3.83 | % | | | (0.65 | )% | | | 6.99 | % | | | 19.70 | % | | | 9.90 | % |
Ratios to average net assets (annualized) | | | | | | | | | | | | | | | | | | | | |
Gross expenses | | | 1.36 | % | | | 1.36 | % | | | 1.27 | % | | | 1.33 | % | | | 1.42 | % |
Net expenses | | | 1.25 | % | | | 1.25 | % | | | 1.25 | % | | | 1.25 | % | | | 1.25 | % |
Net investment income | | | 1.28 | % | | | 1.27 | % | | | 1.15 | % | | | 1.62 | % | | | 1.86 | % |
Supplemental data | | | | | | | | | | | | | | | | | | | | |
Portfolio turnover rate | | | 52 | % | | | 113 | % | | | 113 | % | | | 187 | % | | | 163 | % |
Net assets, end of period (000s omitted) | | | $10,237 | | | | $11,034 | | | | $502 | | | | $129 | | | | $12 | |
| 1 | Calculated based upon average shares outstanding |
The accompanying notes are an integral part of these financial statements.
| | | | | | |
| Notes to financial statements | | Wells Fargo Asia Pacific Fund | | | 21 | |
1. ORGANIZATION
Wells Fargo Funds Trust (the “Trust”), a Delaware statutory trust organized on March 10, 1999, is an open-end management investment company registered under the Investment Company Act of 1940, as amended (the “1940 Act”). As an investment company, the Trust follows the accounting and reporting guidance in Financial Accounting Standards Board (“FASB”) Accounting Standards Codification Topic 946, Financial Services – Investment Companies. These financial statements report on the Wells Fargo Asia Pacific Fund (the “Fund”) which is a diversified series of the Trust.
Effective at the close of business on October 23, 2015, Investor Class shares became Class A shares in a tax-free conversion. Shareholders of Investor Class received Class A shares at a value equal to the value of their Investor Class shares immediately prior to the conversion. Investor Class shares are no longer offered by the Fund.
2. SIGNIFICANT ACCOUNTING POLICIES
The following significant accounting policies, which are consistently followed in the preparation of the financial statements of the Fund, are in conformity with U.S. generally accepted accounting principles which require management to make estimates and assumptions that affect the reported amounts of assets and liabilities, disclosure of contingent assets and liabilities at the date of the financial statements, and the reported amounts of revenues and expenses during the reporting period. Actual results could differ from those estimates.
Securities valuation
All investments are valued each business day as of the close of regular trading on the New York Stock Exchange (generally 4 p.m. Eastern Time), although the Fund may deviate from this calculation time under unusual or unexpected circumstances.
Equity securities that are listed on a foreign or domestic exchange or market are valued at the official closing price or, if none, the last sales price. If no sale occurs on the principal exchange or market that day, the prior day’s price will be deemed “stale” and a fair value price will be determined in accordance with the Fund’s Valuation Procedures.
The values of securities denominated in foreign currencies are translated into U.S. dollars at rates provided by an independent foreign currency pricing source at a time each business day specified by the Management Valuation Team of Wells Fargo Funds Management, LLC (“Funds Management”).
Many securities markets and exchanges outside the U.S. close prior to the close of the New York Stock Exchange and therefore may not fully reflect trading or events that occur after the close of the principal exchange in which the foreign securities are traded, but before the close of the New York Stock Exchange. If such trading or events are expected to materially affect the value of such securities, then fair value pricing procedures approved by the Board of Trustees of the Fund are applied. These procedures take into account multiple factors including movements in U.S. securities markets after foreign exchanges close. Foreign securities that are fair valued under these procedures are categorized as Level 2 and the application of these procedures may result in transfers between Level 1 and Level 2. Depending on market activity, such fair valuations may be frequent. Such fair value pricing may result in net asset values that are higher or lower than net asset values based on the last reported sales price or latest quoted bid price. On October 31, 2016, such fair value pricing was not used in pricing foreign securities.
Investments in registered open-end investment companies are valued at net asset value. Interests in non-registered investment vehicles that are redeemable at net asset value are fair valued normally at net asset value.
Investments which are not valued using any of the methods discussed above are valued at their fair value, as determined in good faith by the Board of Trustees. The Board of Trustees has established a Valuation Committee comprised of the Trustees and has delegated to it the authority to take any actions regarding the valuation of portfolio securities that the Valuation Committee deems necessary or appropriate, including determining the fair value of portfolio securities, unless the determination has been delegated to the Management Valuation Team. The Board of Trustees retains the authority to make or ratify any valuation decisions or approve any changes to the Valuation Procedures as it deems appropriate. On a quarterly basis, the Board of Trustees receives reports on any valuation actions taken by the Valuation Committee or the Management Valuation Team which may include items for ratification.
Valuations of fair valued securities are compared to the next actual sales price when available, or other appropriate market values, to assess the continued appropriateness of the fair valuation methodologies used. These securities are fair valued on a day-to-day basis, taking into consideration changes to appropriate market information and any significant changes to the inputs considered in the valuation process until there is a readily available price provided on an exchange or by an independent pricing service. Valuations received from an independent pricing service or independent broker-dealer quotes are periodically validated by comparisons to most recent trades and valuations provided by other
| | | | |
| 22 | | Wells Fargo Asia Pacific Fund | | Notes to financial statements |
independent pricing services in addition to the review of prices by the manager and/or subadviser. Unobservable inputs used in determining fair valuations are identified based on the type of security, taking into consideration factors utilized by market participants in valuing the investment, knowledge about the issuer and the current market environment.
Foreign currency translation
The accounting records of the Fund are maintained in U.S. dollars. The values of other assets and liabilities denominated in foreign currencies are translated into U.S. dollars at rates provided by an independent foreign currency pricing source at a time each business day specified by the Management Valuation Team. Purchases and sales of securities, and income and expenses are converted at the rate of exchange on the respective dates of such transactions. Net realized foreign exchange gains or losses arise from sales of foreign currencies, currency gains or losses realized between the trade and settlement dates on securities transactions, and the difference between the amounts of dividends, interest and foreign withholding taxes recorded and the U.S. dollar equivalent of the amounts actually paid or received. Net unrealized foreign exchange gains and losses arise from changes in the fair value of assets and liabilities other than investments in securities resulting from changes in exchange rates. The changes in net assets arising from changes in exchange rates and the changes in net assets resulting from changes in market prices of securities are not separately presented. Such changes are included in net realized and unrealized gains or losses from investments.
Participation notes
The Fund may invest in participation notes to gain exposure to securities in certain foreign markets. Participation notes are issued by banks or broker-dealers and are designed to offer a return linked to a particular underlying foreign security. Participation notes involve transaction costs, which may be higher than those applicable to the underlying foreign security. The holder of the participation note is entitled to receive from the bank or broker-dealer, an amount equal to the dividend paid by the issuer of the underlying foreign security; however, the holder is not entitled to the same rights (i.e. dividends, voting rights) as an owner of the underlying foreign security. Investments in participation notes involve risks beyond those normally associated with a direct investment in an underlying security. The Fund has no rights against the issuer of the underlying foreign security and participation notes expose the Fund to counterparty risk in the event the counterparty does not perform. There is also no assurance there will be a secondary trading market for the participation note or that the trading price of the participation note will equal the underlying value of the foreign security that it seeks to replicate.
Forward foreign currency contracts
The Fund is subject to foreign currency exchange rate risk in the normal course of pursuing its investment objectives. A forward foreign currency contract is an agreement between two parties to purchase or sell a specific currency for an agreed-upon price at a future date. The Fund enters into forward foreign currency contracts to facilitate transactions in foreign-denominated securities and to attempt to minimize the risk to the Fund from adverse changes in the relationship between currencies. Forward foreign currency contracts are recorded at the forward rate and marked-to-market daily. When the contracts are closed, realized gains and losses arising from such transactions are recorded as realized gains or losses on forward foreign currency contract transactions. The Fund could be exposed to risks if the counterparties to the contracts are unable to meet the terms of their contracts or if the value of the foreign currency changes unfavorably. The Fund’s maximum risk of loss from counterparty credit risk is the unrealized gains on the contracts. This risk may be mitigated if there is a master netting arrangement between the Fund and the counterparty.
Security loans
The Fund may lend its securities from time to time in order to earn additional income in the form of fees or interest on securities received as collateral or the investment of any cash received as collateral. The Fund continues to receive interest or dividends on the securities loaned. The Fund receives collateral in the form of cash or securities with a value at least equal to the value of the securities on loan. The value of the loaned securities is determined at the close of each business day and any additional required collateral is delivered to the Fund on the next business day. In a securities lending transaction, the net asset value of the Fund will be affected by an increase or decrease in the value of the securities loaned and by an increase or decrease in the value of the instrument in which collateral is invested. The amount of securities lending activity undertaken by the Fund fluctuates from time to time. In the event of default or bankruptcy by the borrower, the Fund may be prevented from recovering the loaned securities or gaining access to the collateral or may experience delays or costs in doing so. In addition, the investment of any cash collateral received may lose all or part of its value. The Fund has the right under the lending agreement to recover the securities from the borrower on demand.
The Fund lends its securities through an unaffiliated securities lending agent. Cash collateral received in connection with its securities lending transactions is invested in Securities Lending Cash Investments, LLC (the “Securities Lending Fund”). The Securities Lending Fund is exempt from registration under Section 3(c)(7) of the 1940 Act and is managed by Funds
| | | | | | |
| Notes to financial statements | | Wells Fargo Asia Pacific Fund | | | 23 | |
Management and is subadvised by Wells Capital Management Incorporated (“WellsCap”), an affiliate of Funds Management and an indirect wholly owned subsidiary of Wells Fargo & Company (“Wells Fargo”). Funds Management receives an advisory fee starting at 0.05% and declining to 0.01% as the average daily net assets of the Securities Lending Fund increase. All of the fees received by Funds Management are paid to WellsCap for its services as subadviser. The Securities Lending Fund seeks to provide a positive return compared to the daily Fed Funds Open Rate by investing in high-quality, U.S. dollar-denominated short-term money market instruments. Securities Lending Fund investments are valued at the evaluated bid price provided by an independent pricing service. Income earned from investment in the Securities Lending Fund is included in securities lending income on the Statement of Operations.
Security transactions and income recognition
Securities transactions are recorded on a trade date basis. Realized gains or losses are recorded on the basis of identified cost.
Dividend income is recognized on the ex-dividend date, except for certain dividends from foreign securities, which are recorded as soon as the custodian verifies the ex-dividend date. Dividend income from foreign securities is recorded net of foreign taxes withheld where recovery of such taxes is not assured.
Distributions to shareholders
Distributions to shareholders from net investment income and net realized gains, if any, are recorded on the ex-dividend date. Such distributions are determined in conformity with federal income tax regulations, which may differ in amount or character from net investment income and realized gains recognized for purposes of U.S. generally accepted accounting principles.
Federal and other taxes
The Fund intends to continue to qualify as a regulated investment company by distributing substantially all of its investment company taxable income and any net realized capital gains (after reduction for capital loss carryforwards) sufficient to relieve it from all, or substantially all, federal income taxes. Accordingly, no provision for federal income taxes was required.
The Fund’s income and federal excise tax returns and all financial records supporting those returns for the prior three fiscal years are subject to examination by the federal and Delaware revenue authorities. Management has analyzed the Fund’s tax positions taken on federal, state, and foreign tax returns for all open tax years and does not believe that there are any uncertain tax positions that require recognition of a tax liability.
Reclassifications are made to the Fund’s capital accounts for permanent tax differences to reflect income and gains available for distribution (or available capital loss carryforwards) under federal income tax regulations. U.S. generally accepted accounting principles require that certain components of net assets be adjusted to reflect permanent differences between financial and tax reporting. These reclassifications have no effect on net assets or net asset values per share. The primary permanent differences causing such reclassifications are due to expiration of capital loss carryforwards and passive foreign investment companies. At October 31, 2016, as a result of permanent book-to-tax differences, the following reclassification adjustments were made on the Statement of Assets and Liabilities:
| | | | |
| Paid-in capital | | Undistributed net investment income | | Accumulated net realized losses on investments |
| $(32,386,341) | | $544,805 | | $31,841,536 |
Capital loss carryforwards that do not expire are required to be utilized prior to capital loss carryforwards that expire. As of October 31, 2016, capital loss carryforwards available to offset future net realized capital gains were as follows through the indicated expiration dates:
| | | | |
| | | No expiration |
| 2017 | | Short-term | | Long-term |
| $80,817,204 | | $463,465 | | $3,353,112 |
Class allocations
The separate classes of shares offered by the Fund differ principally in applicable sales charges, distribution, shareholder servicing, and administration fees. Class specific expenses are charged directly to that share class. Investment income, common expenses, and realized and unrealized gains (losses) on investments are allocated daily to each class of shares based on the relative proportion of net assets of each class.
| | | | |
| 24 | | Wells Fargo Asia Pacific Fund | | Notes to financial statements |
3. FAIR VALUATION MEASUREMENTS
Fair value measurements of investments are determined within a framework that has established a fair value hierarchy based upon the various data inputs utilized in determining the value of the Fund’s investments. The three-level hierarchy gives the highest priority to unadjusted quoted prices in active markets for identical assets or liabilities (Level 1) and the lowest priority to significant unobservable inputs (Level 3). The Fund’s investments are classified within the fair value hierarchy based on the lowest level of input that is significant to the fair value measurement. The inputs are summarized into three broad levels as follows:
| n | | Level 1 – quoted prices in active markets for identical securities |
| n | | Level 2 – other significant observable inputs (including quoted prices for similar securities, interest rates, prepayment speeds, credit risk, use of amortized cost, etc.) |
| n | | Level 3 – significant unobservable inputs (including the Fund’s own assumptions in determining the fair value of investments) |
The inputs or methodologies used for valuing investments in securities are not necessarily an indication of the risk associated with investing in those securities.
The following is a summary of the inputs used in valuing the Fund’s assets and liabilities as of October 31, 2016:
| | | | | | | | | | | | | | | | |
| | | Quoted prices (Level 1) | | | Other significant observable inputs (Level 2) | | | Significant unobservable inputs (Level 3) | | | Total | |
Assets | | | | | | | | | | | | | | | | |
Investments in: | | | | | | | | | | | | | | | | |
| | | | |
Common stocks | | | | | | | | | | | | | | | | |
Australia | | $ | 7,216,625 | | | $ | 0 | | | $ | 0 | | | $ | 7,216,625 | |
China | | | 36,376,134 | | | | 0 | | | | 0 | | | | 36,376,134 | |
Hong Kong | | | 1,611,994 | | | | 0 | | | | 0 | | | | 1,611,994 | |
India | | | 7,530,237 | | | | 0 | | | | 0 | | | | 7,530,237 | |
Indonesia | | | 5,974,459 | | | | 0 | | | | 0 | | | | 5,974,459 | |
Japan | | | 42,937,151 | | | | 0 | | | | 0 | | | | 42,937,151 | |
Malaysia | | | 1,423,767 | | | | 0 | | | | 0 | | | | 1,423,767 | |
New Zealand | | | 1,661,444 | | | | 0 | | | | 0 | | | | 1,661,444 | |
Philippines | | | 1,017,327 | | | | 0 | | | | 0 | | | | 1,017,327 | |
Singapore | | | 5,447,615 | | | | 0 | | | | 0 | | | | 5,447,615 | |
South Korea | | | 9,406,380 | | | | 60,022 | | | | 0 | | | | 9,466,402 | |
Taiwan | | | 10,534,588 | | | | 0 | | | | 0 | | | | 10,534,588 | |
Thailand | | | 1,491,306 | | | | 0 | | | | 0 | | | | 1,491,306 | |
United States | | | 708,824 | | | | 0 | | | | 0 | | | | 708,824 | |
| | | | |
Participation notes | | | | | | | | | | | | | | | | |
China | | | 0 | | | | 3,812,563 | | | | 0 | | | | 3,812,563 | |
| | | | |
Preferred stocks | | | | | | | | | | | | | | | | |
South Korea | | | 2,762,333 | | | | 0 | | | | 0 | | | | 2,762,333 | |
| | | | |
Short-term investments | | | | | | | | | | | | | | | | |
Investment companies | | | 1,975,446 | | | | 0 | | | | 0 | | | | 1,975,446 | |
Investments measured at net asset value* | | | | | | | | | | | | | | | 1,315,824 | |
Total assets | | $ | 138,075,630 | | | $ | 3,872,585 | | | $ | 0 | | | $ | 143,264,039 | |
| * | Investments that are measured at fair value using the net asset value per share (or its equivalent) as a practical expedient have not been categorized in the fair value hierarchy. The fair value amount presented in the table is intended to permit reconciliation of the fair value hierarchy to the amounts presented in the Statement of Assets and Liabilities. The Fund’s investment in Securities Lending Cash Investments, LLC valued at $1,315,824 does not have a redemption period notice, can be redeemed daily and does not have any unfunded commitments. |
The Fund recognizes transfers between levels within the fair value hierarchy at the end of the reporting period. Fair value pricing that was used in pricing certain foreign securities at the previous period end was not used at October 31, 2016. As a result, common stocks valued at $87,776,363 and preferred stocks valued at $2,762,333 were transferred from Level 2 to Level 1 within the fair value hierarchy. The Fund did not have any transfers into/out of Level 3.
| | | | | | |
| Notes to financial statements | | Wells Fargo Asia Pacific Fund | | | 25 | |
4. TRANSACTIONS WITH AFFILIATES
Management fee
Funds Management, an indirect wholly owned subsidiary of Wells Fargo, is the manager of the Fund and provides advisory and fund-level administrative services under an investment management agreement. Under the investment management agreement, Funds Management is responsible for, among other services, implementing the investment objectives and strategies of the Fund, supervising the subadviser, providing fund-level administrative services in connection with the Fund’s operations, and providing any other fund-level administrative services reasonably necessary for the operation of the Fund. As compensation for its services under the investment management agreement, Funds Management is entitled to receive an annual management fee starting at 1.00% and declining to 0.83% as the average daily net assets of the Fund increase. For the year ended October 31, 2016, the management fee was equivalent to an annual rate of 1.00% of the Fund’s average daily net assets.
Funds Management has retained the services of a subadviser to provide daily portfolio management to the Fund. The fee for subadvisory services is borne by Funds Management. WellsCap is the subadviser to the Fund and is entitled to receive a fee from Funds Management at an annual rate starting at 0.65% and declining to 0.45% as the average daily net assets of the Fund increase.
Administration fees
Under a class-level administration agreement, Funds Management provides class-level administrative services to the Fund, which includes paying fees and expenses for services provided by the transfer agent, sub-transfer agents, omnibus account servicers and record-keepers. As compensation for its services under the class-level administration agreement, Funds Management receives an annual fee which is calculated based on the average daily net assets of each class as follows:
| | | | |
| | | Class-level
administration fee | |
Class A, Class C | | | 0.21 | % |
Administrator Class, Institutional Class | | | 0.13 | |
Funds Management has contractually waived and/or reimbursed management and administration fees to the extent necessary to maintain certain net operating expense ratios for the Fund. Waiver of fees and/or reimbursement of expenses by Funds Management were made first from fund level expenses on a proportionate basis and then from class specific expenses. Funds Management has committed through February 28, 2017 to waive fees and/or reimburse expenses to the extent necessary to cap the Fund’s expenses at 1.60% for Class A shares, 2.35% for Class C shares, 1.50% for Administrator Class shares, and 1.25% for Institutional Class shares. After this time, the cap may be increased or the commitment to maintain the cap may be terminated only with the approval of the Board of Trustees. Prior to March 1, 2016, the Fund’s expenses were capped at 1.40% for Administrator Class shares.
Distribution fee
The Trust has adopted a distribution plan for Class C shares of the Fund pursuant to Rule 12b-1 under the 1940 Act. A distribution fee is charged to Class C shares and paid to Wells Fargo Funds Distributor, LLC (“Funds Distributor”), the principal underwriter, at an annual rate of 0.75% of the average daily net assets of Class C shares.
In addition, Funds Distributor is entitled to receive the front-end sales charge from the purchase of Class A shares and a contingent deferred sales charge on the redemption of certain Class A shares. Funds Distributor is also entitled to receive the contingent deferred sales charges from redemptions of Class C shares. For the year ended October 31, 2016, Funds Distributor received $1,090 from the sale of Class A shares and $179 in contingent deferred sales charges from redemptions of Class C shares.
Shareholder servicing fees
The Trust has entered into contracts with one or more shareholder servicing agents, whereby Class A, Class C, and Administrator Class of the Fund are charged a fee at an annual rate of 0.25% of the average daily net assets of each respective class.
A portion of these total shareholder servicing fees were paid to affiliates of Wells Fargo.
| | | | |
| 26 | | Wells Fargo Asia Pacific Fund | | Notes to financial statements |
5. INVESTMENT PORTFOLIO TRANSACTIONS
Purchases and sales of investments, excluding U.S. government obligations (if any) and short-term securities, for the year ended October 31, 2016 were $75,487,467 and $99,710,756, respectively.
The Fund may purchase or sell investment securities to other Wells Fargo funds under procedures adopted by the Board of Trustees. The procedures have been designed to ensure that these interfund transactions, which generally do not incur broker commissions, are effected at current market prices. Interfund trades are included within the respective purchases and sales amounts shown.
6. BANK BORROWINGS
The Trust (excluding the money market funds and certain other funds) and Wells Fargo Variable Trust are parties to a $250,000,000 revolving credit agreement whereby the Fund is permitted to use bank borrowings for temporary or emergency purposes, such as to fund shareholder redemption requests. Interest under the credit agreement is charged to the Fund based on a borrowing rate equal to the higher of the Federal Funds rate in effect on that day plus 1.25% or the overnight LIBOR rate in effect on that day plus 1.25%. In addition, an annual commitment fee equal to 0.25% of the unused balance is allocated to each participating fund. Prior to August 30, 2016, the revolving credit agreement amount was $200,000,000 and the annual commitment fee was equal to 0.20% of the unused balance which was allocated to each participating fund.
For the year ended October 31, 2016, there were no borrowings by the Fund under the agreement.
7. DISTRIBUTIONS TO SHAREHOLDERS
The tax character of distributions paid was $2,972,460 and $1,978,734 of ordinary income for the years ended October 31, 2016 and October 31, 2015, respectively.
As of October 31, 2016, the components of distributable earnings on a tax basis were as follows:
| | | | |
Undistributed ordinary income | | Unrealized gains | | Capital loss carryforward |
| $1,815,006 | | $6,054,960 | | $(84,633,781) |
8. CONCENTRATION RISK
Concentration risks result from exposure to a limited number of sectors or geographic region. Funds that invest a substantial portion of their assets in any sector or geographic region may be more affected by changes in that sector or geographic region than would be a fund whose investments are not heavily weighted in any sector or geographic region.
9. INDEMNIFICATION
Under the Trust’s organizational documents, the officers and Trustees have been granted certain indemnification rights against certain liabilities that may arise out of performance of their duties to the Trust. Additionally, in the normal course of business, the Trust may enter into contracts with service providers that contain a variety of indemnification clauses. The Trust’s maximum exposure under these arrangements is dependent on future claims that may be made against the Fund and, therefore, cannot be estimated.
10. REGULATORY CHANGES
In October 2016, the Securities and Exchange Commission (“SEC”) adopted new rules and forms and amended existing rules and forms (together, “final rules”) intended to modernize and enhance the reporting and disclosure of information by registered investment companies and to enhance liquidity risk management by open-end mutual funds and exchange-traded funds. The final rules will enhance the quality of information available to investors and will allow the SEC to more effectively collect and use data reported by funds. In part, the final rules amend Regulation S-X and require standardized, enhanced disclosure about derivatives in the Fund’s financial statements, as well as other amendments. The compliance date for the amendments to Regulation S-X is August 1, 2017 while the compliance date for the new form types is June 1, 2018 and the compliance date for the liquidity risk management program requirements is December 1, 2018. Management is currently assessing the potential impact of these enhancements and their impact on the financial statement disclosures and reporting requirements.
| | | | | | |
| Report of independent registered public accounting firm | | Wells Fargo Asia Pacific Fund | | | 27 | |
BOARD OF TRUSTEES AND SHAREHOLDERS OF WELLS FARGO FUNDS TRUST:
We have audited the accompanying statement of assets and liabilities, including the portfolio of investments, of the Wells Fargo Asia Pacific Fund (the “Fund”), one of the funds constituting the Wells Fargo Funds Trust, as of October 31, 2016, and the related statement of operations for the year then ended, the statements of changes in net assets for each of the years in the two-year period then ended, and the financial highlights for each of the years in the five-year period then ended. These financial statements and financial highlights are the responsibility of the Fund’s management. Our responsibility is to express an opinion on these financial statements and financial highlights based on our audits.
We conducted our audits in accordance with the standards of the Public Company Accounting Oversight Board (United States). Those standards require that we plan and perform the audit to obtain reasonable assurance about whether the financial statements and financial highlights are free of material misstatement. An audit includes examining, on a test basis, evidence supporting the amounts and disclosures in the financial statements. Our procedures included confirmation of securities owned as of October 31, 2016, by correspondence with the custodian and brokers, or by other appropriate auditing procedures. An audit also includes assessing the accounting principles used and significant estimates made by management, as well as evaluating the overall financial statement presentation. We believe that our audits provide a reasonable basis for our opinion.
In our opinion, the financial statements and financial highlights referred to above present fairly, in all material respects, the financial position of the Wells Fargo Asia Pacific Fund as of October 31, 2016, the results of its operations for the year then ended, the changes in its net assets for each of the years in the two-year period then ended, and the financial highlights for each of the years in the five-year period then ended, in conformity with U.S. generally accepted accounting principles.

Boston, Massachusetts
December 22, 2016
| | | | |
| 28 | | Wells Fargo Asia Pacific Fund | | Other information (unaudited) |
TAX INFORMATION
Pursuant to Section 854 of the Internal Revenue Code, $2,605,384 of income dividends paid during the fiscal year ended October 31, 2016 has been designated as qualified dividend income (QDI).
Pursuant to Section 853 of the Internal Revenue Code, the Fund expects to designate amounts as foreign taxes paid for the fiscal year ended October 31, 2016. Additional details will be available in the semiannual report.
PROXY VOTING INFORMATION
A description of the policies and procedures that the Fund uses to determine how to vote proxies relating to portfolio securities is available, upon request, by calling 1-800-222-8222, visiting our website at wellsfargofunds.com, or visiting the SEC website at sec.gov. Information regarding how the Fund voted proxies relating to portfolio securities during the most recent 12-month period ended June 30 is available on the Fund’s website at wellsfargofunds.com or by visiting the SEC website at sec.gov.
PORTFOLIO HOLDINGS INFORMATION
The complete portfolio holdings for the Fund are publicly available monthly on the Fund’s website (wellsfargofunds.com), on a one-month delayed basis. In addition, top ten holdings information (excluding derivative positions) for the Fund is publicly available on the Fund’s website on a monthly, seven-day or more delayed basis. The Fund files its complete schedule of portfolio holdings with the SEC for the first and third quarters of each fiscal year on Form N-Q, which is available by visiting the SEC website at sec.gov. In addition, the Fund’s Form N-Q may be reviewed and copied at the SEC’s Public Reference Room in Washington, DC, and at regional offices in New York City, at 233 Broadway, and in Chicago, at 175 West Jackson Boulevard, Suite 900. Information about the Public Reference Room may be obtained by calling 1-800-SEC-0330.
| | | | | | |
| Other information (unaudited) | | Wells Fargo Asia Pacific Fund | | | 29 | |
BOARD OF TRUSTEES AND OFFICERS
Each of the Trustees and Officers1 listed in the table below acts in identical capacities for each fund in the Wells Fargo family of funds, which consists of 139 mutual funds comprising the Wells Fargo Funds Trust, Wells Fargo Variable Trust, Wells Fargo Master Trust and four closed-end funds (collectively the “Fund Complex”). This table should be read in conjunction with the Prospectus and the Statement of Additional Information2. The mailing address of each Trustee and Officer is 525 Market Street, 12th Floor, San Francisco, CA 94105. Each Trustee and Officer serves an indefinite term, however, each Trustee serves such term until reaching the mandatory retirement age established by the Trustees.
Independent Trustees
| | | | | | |
Name and year of birth | | Position held and length of service* | | Principal occupations during past five years or longer | | Current other public company or
investment company
directorships |
| William R. Ebsworth (Born 1957) | | Trustee, since 2015 | | Retired. From 1984 to 2013, equities analyst, portfolio manager, research director and chief investment officer at Fidelity Management and Research Company in Boston, Tokyo, and Hong Kong and retired in 2013 as Chief Investment Officer of Fidelity Strategic Advisers, Inc. where he lead a team of investment professionals managing client assets. Prior thereto, Board member of Hong Kong Securities Clearing Co., Hong Kong Options Clearing Corp., the Thailand International Fund, Ltd., Fidelity Investments Life Insurance Company, and Empire Fidelity Investments Life Insurance Company. Mr. Ebsworth is a CFA® charterholder and an Adjunct Lecturer, Finance, at Babson College. | | Asset Allocation Trust |
Jane A. Freeman (Born 1953) | | Trustee, since 2015 | | Retired. From 2012 to 2014 and 1999 to 2008, Chief Financial Officer of Scientific Learning Corporation. From 2008 to 2012, Ms. Freeman provided consulting services related to strategic business projects. Prior to 1999, Portfolio Manager at Rockefeller & Co. and Scudder, Stevens & Clark. Board member of the Harding Loevner Funds from 1996 to 2014, serving as both Lead Independent Director and chair of the Audit Committee. Board member of the Russell Exchange Traded Funds Trust from 2011 to 2012 and the chair of the Audit Committee. Ms. Freeman is Chair of Taproot Foundation (non-profit organization), a Board Member of Ruth Bancroft Garden (non-profit organization) and an inactive chartered financial analyst. | | Asset Allocation Trust |
Peter G. Gordon** (Born 1942) | | Trustee, since 1998; Chairman, since 2005 | | Co-Founder, Retired Chairman, President and CEO of Crystal Geyser Water Company. Trustee Emeritus, Colby College. | | Asset Allocation Trust |
Isaiah Harris, Jr. (Born 1952) | | Trustee, since 2009 | | Retired. Chairman of the Board of CIGNA Corporation since 2009, and Director since 2005. From 2003 to 2011, Director of Deluxe Corporation. Prior thereto, President and CEO of BellSouth Advertising and Publishing Corp. from 2005 to 2007, President and CEO of BellSouth Enterprises from 2004 to 2005 and President of BellSouth Consumer Services from 2000 to 2003. Emeritus member of the Iowa State University Foundation Board of Governors. Emeritus Member of the Advisory Board of Iowa State University School of Business. Advisory Board Member, Palm Harbor Academy (charter school). Advisory Board Member, Child Evangelism Fellowship (non-profit). Mr. Harris is a certified public accountant (inactive status). | | CIGNA Corporation; Asset Allocation Trust |
Judith M. Johnson (Born 1949) | | Trustee, since 2008; Audit Committee Chairman, since 2008 | | Retired. Prior thereto, Chief Executive Officer and Chief Investment Officer of Minneapolis Employees Retirement Fund from 1996 to 2008. Ms. Johnson is an attorney, certified public accountant and a certified managerial accountant. | | Asset Allocation Trust |
David F. Larcker (Born 1950) | | Trustee, since 2009 | | James Irvin Miller Professor of Accounting at the Graduate School of Business, Stanford University, Director of the Corporate Governance Research Initiative and Senior Faculty of The Rock Center for Corporate Governance since 2006. From 2005 to 2008, Professor of Accounting at the Graduate School of Business, Stanford University. Prior thereto, Ernst & Young Professor of Accounting at The Wharton School, University of Pennsylvania from 1985 to 2005. | | Asset Allocation Trust |
| | | | |
| 30 | | Wells Fargo Asia Pacific Fund | | Other information (unaudited) |
| | | | | | |
Name and year of birth | | Position held and length of service* | | Principal occupations during past five years or longer | | Current other public company or
investment company
directorships |
Olivia S. Mitchell (Born 1953) | | Trustee, since 2006 | | International Foundation of Employee Benefit Plans Professor, Wharton School of the University of Pennsylvania since 1993. Director of Wharton’s Pension Research Council and Boettner Center on Pensions & Retirement Research, and Research Associate at the National Bureau of Economic Research. Previously, Cornell University Professor from 1978 to 1993. | | Asset Allocation Trust |
Timothy J. Penny (Born 1951) | | Trustee, since 1996 | | President and Chief Executive Officer of Southern Minnesota Initiative Foundation, a non-profit organization, since 2007 and Senior Fellow at the Humphrey Institute Policy Forum at the University of Minnesota since 1995. Member of the Board of Trustees of NorthStar Education Finance, Inc., a non-profit organization, since 2007. | | Asset Allocation Trust |
| Michael S. Scofield (Born 1943) | | Trustee, since 2010 | | Served on the Investment Company Institute’s Board of Governors and Executive Committee from 2008-2011 as well the Governing Council of the Independent Directors Council from 2006-2011 and the Independent Directors Council Executive Committee from 2008-2011. Chairman of the IDC from 2008-2010. Institutional Investor (Fund Directions) Trustee of Year in 2007. Trustee of the Evergreen Funds complex (and its predecessors) from 1984 to 2010. Chairman of the Evergreen Funds from 2000-2010. Former Trustee of the Mentor Funds. Retired Attorney, Law Offices of Michael S. Scofield. | | Asset Allocation Trust |
| * | Length of service dates reflect the Trustee’s commencement of service with the Trust’s predecessor entities, where applicable. |
| ** | Peter Gordon is expected to retire on December 31, 2017. |
Officers
| | | | | | |
Name and year of birth | | Position held and
length of service | | Principal occupations during past five years or longer | | |
Karla M. Rabusch (Born 1959) | | President, since 2003 | | Executive Vice President of Wells Fargo Bank, N.A. and President of Wells Fargo Funds Management, LLC since 2003. | | |
Jeremy DePalma1 (Born 1974) | | Treasurer, since 2012 | | Senior Vice President of Wells Fargo Funds Management, LLC since 2009. Senior Vice President of Evergreen Investment Management Company, LLC from 2008 to 2010 and head of the Fund Reporting and Control Team within Fund Administration from 2005 to 2010. | | |
C. David Messman (Born 1960) | | Secretary, since 2000; Chief Legal Officer, since 2003 | | Senior Vice President and Secretary of Wells Fargo Funds Management, LLC since 2001. Assistant General Counsel of Wells Fargo Bank, N.A. since 2013 and Vice President and Managing Counsel of Wells Fargo Bank, N.A. from 1996 to 2013. | | |
Michael Whitaker3 (Born 1967) | | Chief Compliance Officer, since 2016 | | Executive Vice President of Wells Fargo Funds Management, LLC since 2016. Chief Compliance Officer of Fidelity’s Fixed Income Funds and Asset Allocation Funds from 2008 to 2016, Compliance Officer of FMR Co., Inc. from 2014 to 2016, Fidelity Investments Money Management, Inc. from 2014 to 2016, Fidelity Investments from 2007 to 2016. | | |
David Berardi (Born 1975) | | Assistant Treasurer, since 2009 | | Vice President of Wells Fargo Funds Management, LLC since 2009. Vice President of Evergreen Investment Management Company, LLC from 2008 to 2010. Manager of Fund Reporting and Control for Evergreen Investment Management Company, LLC from 2004 to 2010. | | |
| 1 | Jeremy DePalma acts as Treasurer of 69 funds and Assistant Treasurer of 70 funds in the Fund Complex. |
| 2 | The Statement of Additional Information includes additional information about the Trustees and is available, without charge, upon request, by calling 1-800-222-8222 or by visiting the website at wellsfargofunds.com. |
| 3 | Michael Whitaker became Chief Compliance Officer effective May 16, 2016. |
| | | | | | |
| Other information (unaudited) | | Wells Fargo Asia Pacific Fund | | | 31 | |
BOARD CONSIDERATION OF INVESTMENT MANAGEMENT AND SUB-ADVISORY AGREEMENTS:
Under the Investment Company Act of 1940 (the “1940 Act”), the Board of Trustees (the “Board”) of Wells Fargo Funds Trust (the “Trust”) must determine annually whether to approve the continuation of the Trust’s investment management and sub-advisory agreements. In this regard, at an in-person meeting held on May 24-25, 2016 (the “Meeting”), the Board, all the members of which have no direct or indirect interest in the investment management and sub-advisory agreements and are not “interested persons” of the Trust, as defined in the 1940 Act (the “Independent Trustees”), reviewed and approved for Wells Fargo Asia Pacific Fund (the “Fund”): (i) an investment management agreement (the “Management Agreement”) with Wells Fargo Funds Management, LLC (“Funds Management”); and (ii) an investment sub-advisory agreement (the “Sub-Advisory Agreement”) with Wells Capital Management Incorporated (the “Sub-Adviser”), an affiliate of Funds Management. The Management Agreement and the Sub-Advisory Agreement are collectively referred to as the “Advisory Agreements.”
At the Meeting, the Board considered the factors and reached the conclusions described below relating to the selection of Funds Management and the Sub-Adviser and the approval of the Advisory Agreements. Prior to the Meeting, including at an in-person meeting in April 2016, the Trustees conferred extensively among themselves and with representatives of Funds Management about these matters. Also, the Board has adopted a team-based approach, with each team consisting of a sub-set of Trustees, to assist the full Board in the discharge of its duties in reviewing performance and other matters throughout the year. The Independent Trustees were assisted in their evaluation of the Advisory Agreements by independent legal counsel, from whom they received separate legal advice and with whom they met separately.
In providing information to the Board, Funds Management and the Sub-Adviser were guided by a detailed set of requests for information submitted to them by independent legal counsel on behalf of the Independent Trustees at the start of the Board’s annual contract renewal process earlier in 2016. In considering and approving the Advisory Agreements, the Trustees considered the information they believed relevant, including but not limited to the information discussed below. The Board considered not only the specific information presented in connection with the Meeting, but also the knowledge gained over time through interaction with Funds Management and the Sub-Adviser about various topics. In this regard, the Board reviewed reports of Funds Management at each of its quarterly meetings, which included, among other things, portfolio reviews and performance reports. In addition, the Board and the teams mentioned above confer with portfolio managers at various times throughout the year. The Board did not identify any particular information or consideration that was all-important or controlling, and each individual Trustee may have attributed different weights to various factors.
After its deliberations, the Board unanimously approved the continuation of the Advisory Agreements for a one-year term and determined that the compensation payable to Funds Management and the Sub-Adviser under each of the Advisory Agreements was reasonable. The Board considered the approval of the Advisory Agreements for the Fund as part of its consideration of agreements for funds across the complex, but its approvals were made on a fund-by-fund basis. The following summarizes a number of important, but not necessarily all, factors considered by the Board in support of its approvals.
Nature, extent and quality of services
The Board received and considered various information regarding the nature, extent and quality of services provided to the Fund by Funds Management and the Sub-Adviser under the Advisory Agreements. This information included a description of the investment advisory services and Fund-level administrative services covered by the Management Agreement, as well as, among other things, a summary of the background and experience of senior management of Funds Management, and the qualifications, background, tenure and responsibilities of each of the portfolio managers primarily responsible for the day-to-day portfolio management of the Fund.
The Board evaluated the ability of Funds Management and the Sub-Adviser to attract and retain qualified investment professionals, including research, advisory and supervisory personnel. The Board further considered the compliance programs and compliance records of Funds Management and the Sub-Adviser. In addition, the Board took into account the full range of services provided to the Fund by Funds Management and its affiliates.
Fund performance and expenses
The Board considered the performance results for the Fund over various time periods ended December 31, 2015. The Board considered these results in comparison to the performance of funds in a universe that was determined by Broadridge Inc. (“Broadridge”) to be similar to the Fund (the “Universe”), and in comparison to the Fund’s benchmark index and to other comparative data. Broadridge is an independent provider of investment company data. The Board received a description of the methodology used by Broadridge to select the mutual funds in the performance Universe.
| | | | |
| 32 | | Wells Fargo Asia Pacific Fund | | Other information (unaudited) |
The Board noted that the performance of the Fund (Class A) was higher than the average performance of the Universe for all periods under review. The Board also noted that the performance of the Fund was higher than its benchmark, the MSCI AC Asia Pacific Index (Net), for all periods under review.
The Board also received and considered information regarding the Fund’s net operating expense ratios and their various components, including actual management fees, custodian and other non-management fees, and Rule 12b-1 and non-Rule 12b-1 shareholder service fees. The Board considered these ratios in comparison to the median ratios of funds in class-specific expense groups that were determined by Broadridge to be similar to the Fund (the “Groups”). The Board received a description of the methodology used by Broadridge to select the mutual funds in the expense Groups and an explanation of how funds comprising expense groups and their expense ratios may vary from year-to-year. Based on the Broadridge reports, the Board noted that the net operating expense ratios of the Fund were lower than the median net operating expense ratios of the expense Groups.
The Board took into account the Fund performance and expense information provided to it among the factors considered in deciding to re-approve the Advisory Agreements.
Investment management and sub-advisory fee rates
The Board reviewed and considered the contractual fee rates payable by the Fund to Funds Management under the Management Agreement, as well as the contractual fee rates payable by the Fund to Funds Management for class-level administrative services under a Class-Level Administration Agreement, which include class-level transfer agency and sub-transfer agency costs (collectively, the “Management Rates”). The Board also reviewed and considered the contractual investment sub-advisory fee rates that are payable by Funds Management to the Sub-Adviser for investment sub-advisory services.
Among other information reviewed by the Board was a comparison of the Fund’s Management Rates with the average contractual investment management fee rates of funds in the expense Groups at a common asset level as well as transfer agency costs of the funds in the expense Groups. The Board noted that the Management Rates of the Fund were equal to or in range of the sum of these average rates for the Fund’s expense Groups for all share classes.
The Board also received and considered information about the portion of the total management fee that was retained by Funds Management after payment of the fee to the Sub-Adviser for sub-advisory services. In assessing the reasonableness of this amount, the Board received and evaluated information about the nature and extent of responsibilities retained and risks assumed by Funds Management and not delegated to or assumed by the Sub-Adviser, and about Funds Management’s on-going oversight services. However, given the affiliation between Funds Management and the Sub-Adviser, the Board ascribed limited relevance to the allocation of fees between them.
The Board also received and considered information about the nature and extent of services offered and fee rates charged by Funds Management and the Sub-Adviser to other types of clients with investment strategies similar to those of the Fund. In this regard, the Board received information about the significantly greater scope of services, and compliance, reporting and other legal burdens and risks of managing mutual funds compared with those associated with managing assets of non-mutual fund clients such as collective funds or institutional separate accounts.
Based on its consideration of the factors and information it deemed relevant, including those described here, the Board determined that the compensation payable to Funds Management under the Management Agreement and to the Sub-Adviser under the Sub-Advisory Agreement was reasonable, in light of the services covered by the Advisory Agreements.
Profitability
The Board received and considered information concerning the profitability of Funds Management, as well as the profitability of Wells Fargo as a whole, from providing services to the Fund and the fund family as a whole. The Board also received and considered information concerning the profitability of the Sub-Adviser from providing services to the fund family as a whole, noting that the Sub-Adviser’s profitability information with respect to providing services to the Fund was subsumed in the Wells Fargo and Funds Management profitability analysis.
Funds Management reported on the methodologies and estimates used in calculating profitability. Among other things, the Board noted that the levels of profitability reported on a fund-by-fund basis varied widely, depending on factors such as the size and type of fund. Based on its review, the Board did not deem the profits reported by Funds Management or Wells Fargo from its services to the Fund to be at a level that would prevent it from approving the continuation of the Advisory Agreements.
| | | | | | |
| Other information (unaudited) | | Wells Fargo Asia Pacific Fund | | | 33 | |
Economies of scale
With respect to possible economies of scale, the Board noted the existence of breakpoints in the Fund’s management fee structure, which operate generally to reduce the Fund’s expense ratios as the Fund grows in size. It considered that, for a small fund or a fund that shrinks in size, breakpoints conversely can result in higher fee levels. The Board also considered that fee waiver and expense reimbursement arrangements and competitive fee rates at the outset are means of sharing potential economies of scale with shareholders of the Fund and the fund family as a whole. The Board considered Funds Management’s view that any analyses of potential economies of scale in managing a particular fund are inherently limited in light of the joint and common costs and investments that Funds Management incurs across the fund family as a whole.
The Board concluded that the Fund’s fee and expense arrangements, including contractual breakpoints, constituted a reasonable approach to sharing potential economies of scale with the Fund and its shareholders.
Other benefits to Funds Management and the Sub-Adviser
The Board received and considered information regarding potential “fall-out” or ancillary benefits received by Funds Management and its affiliates, including the Sub-Adviser, as a result of their relationships with the Fund. Ancillary benefits could include, among others, benefits directly attributable to other relationships with the Fund and benefits potentially derived from an increase in Funds Management’s and the Sub-Adviser’s business as a result of their relationships with the Fund. The Board noted that various affiliates of Funds Management may receive distribution-related fees, shareholder servicing payments and sub-transfer agency fees in respect of shares sold or held through them and services provided.
The Board also reviewed information about soft dollar credits earned and utilized by the Sub-Adviser, fees earned by Funds Management and the Sub-Adviser from managing a private investment vehicle for the fund family’s securities lending collateral and commissions earned by an affiliated broker from portfolio transactions.
Based on its consideration of the factors and information it deemed relevant, including those described here, the Board did not find that any ancillary benefits received by Funds Management and its affiliates, including the Sub-Adviser, were unreasonable.
Conclusion
At the Meeting, after considering the above-described factors and based on its deliberations and its evaluation of the information described above, the Board unanimously approved the continuation of the Advisory Agreements for a one-year term and determined that the compensation payable to Funds Management and the Sub-Adviser under each of the Advisory Agreements was reasonable.
| | | | |
| 34 | | Wells Fargo Asia Pacific Fund | | List of abbreviations |
The following is a list of common abbreviations for terms and entities that may have appeared in this report.
| ACA | — ACA Financial Guaranty Corporation |
| ADR | — American depositary receipt |
| ADS | — American depositary shares |
| AGC | — Assured Guaranty Corporation |
| AGM | — Assured Guaranty Municipal |
| Ambac | — Ambac Financial Group Incorporated |
| AMT | — Alternative minimum tax |
| BAN | — Bond anticipation notes |
| BHAC | — Berkshire Hathaway Assurance Corporation |
| CAB | — Capital appreciation bond |
| CCAB | — Convertible capital appreciation bond |
| CDA | — Community Development Authority |
| CDO | — Collateralized debt obligation |
| DRIVER | — Derivative inverse tax-exempt receipts |
| DW&P | — Department of Water & Power |
| DWR | — Department of Water Resources |
| ECFA | — Educational & Cultural Facilities Authority |
| EDA | — Economic Development Authority |
| EDFA | — Economic Development Finance Authority |
| ETF | — Exchange-traded fund |
| FDIC | — Federal Deposit Insurance Corporation |
| FFCB | — Federal Farm Credit Banks |
| FGIC | — Financial Guaranty Insurance Corporation |
| FHA | — Federal Housing Administration |
| FHLB | — Federal Home Loan Bank |
| FHLMC | — Federal Home Loan Mortgage Corporation |
| FICO | — The Financing Corporation |
| FNMA | — Federal National Mortgage Association |
| GDR | — Global depositary receipt |
| GNMA | — Government National Mortgage Association |
| HCFR | — Healthcare facilities revenue |
| HEFA | — Health & Educational Facilities Authority |
| HEFAR | — Higher education facilities authority revenue |
| HFA | — Housing Finance Authority |
| HFFA | — Health Facilities Financing Authority |
| HUD | — Department of Housing and Urban Development |
| IDA | — Industrial Development Authority |
| IDAG | — Industrial Development Agency |
| KRW | — Republic of Korea won |
| LIBOR | — London Interbank Offered Rate |
| LIFER | — Long Inverse Floating Exempt Receipts |
| LLC | — Limited liability company |
| LLLP | — Limited liability limited partnership |
| LLP | — Limited liability partnership |
| MBIA | — Municipal Bond Insurance Association |
| MFHR | — Multifamily housing revenue |
| MSTR | — Municipal securities trust receipts |
| MUD | — Municipal Utility District |
| National | — National Public Finance Guarantee Corporation |
| PCFA | — Pollution Control Financing Authority |
| PCL | — Public Company Limited |
| PCR | — Pollution control revenue |
| PFA | — Public Finance Authority |
| PFFA | — Public Facilities Financing Authority |
| PFOTER | — Puttable floating option tax-exempt receipts |
| plc | — Public limited company |
| PUTTER | — Puttable tax-exempt receipts |
| R&D | — Research & development |
| Radian | — Radian Asset Assurance |
| RAN | — Revenue anticipation notes |
| RDA | — Redevelopment Authority |
| RDFA | — Redevelopment Finance Authority |
| REIT | — Real estate investment trust |
| ROC | — Reset option certificates |
| SAVRS | — Select auction variable rate securities |
| SBA | — Small Business Authority |
| SDR | — Swedish depositary receipt |
| SFHR | — Single-family housing revenue |
| SFMR | — Single-family mortgage revenue |
| SPA | — Standby purchase agreement |
| SPDR | — Standard & Poor’s Depositary Receipts |
| SPEAR | — Short Puttable Exempt Adjustable Receipts |
| STRIPS | — Separate trading of registered interest and |
| TAN | — Tax anticipation notes |
| TIPS | — Treasury inflation-protected securities |
| TRAN | — Tax revenue anticipation notes |
| TTFA | — Transportation Trust Fund Authority |
| TVA | — Tennessee Valley Authority |
This page is intentionally left blank.
This page is intentionally left blank.

For more information
More information about Wells Fargo Funds is available free upon request. To obtain literature, please write, email, visit the Fund’s website, or call:
Wells Fargo Funds
P.O. Box 8266
Boston, MA 02266-8266
Email: fundservice@wellsfargo.com
Website: wellsfargofunds.com
Individual investors: 1-800-222-8222
Retail investment professionals: 1-888-877-9275
Institutional investment professionals: 1-866-765-0778
This report and the financial statements contained herein are submitted for the general information of the shareholders of the Fund. If this report is used for promotional purposes, distribution of the report must be accompanied or preceded by a current prospectus. Before investing, please consider the investment objectives, risks, charges, and expenses of the investment. For a current prospectus and, if available, a summary prospectus, containing this information, call 1-800-222-8222 or visit the Fund’s website at wellsfargofunds.com. Read the prospectus carefully before you invest or send money.
Wells Fargo Asset Management (WFAM) is a trade name used by the asset management businesses of Wells Fargo & Company. Wells Fargo Funds Management, LLC, a wholly owned subsidiary of Wells Fargo & Company, provides investment advisory and administrative services for Wells Fargo Funds. Other affiliates of Wells Fargo & Company provide subadvisory and other services for the funds. The funds are distributed by Wells Fargo Funds Distributor, LLC, Member FINRA, an affiliate of Wells Fargo & Company. Neither Wells Fargo Funds Management nor Wells Fargo Funds Distributor has Fund customer accounts/assets, and neither provides investment advice/recommendations or acts as an investment advice fiduciary to any investor.
NOT FDIC INSURED ¡ NO BANK GUARANTEE ¡ MAY LOSE VALUE
© 2016 Wells Fargo Funds Management, LLC. All rights reserved.
| | |
 | | 247339 12-16 A236/AR236 10-16 |
Annual Report
October 31, 2016

Wells Fargo Diversified International Fund


Reduce clutter. Save trees.
Sign up for electronic delivery of prospectuses and shareholder reports at wellsfargo.com/advantagedelivery
Contents
The views expressed and any forward-looking statements are as of October 31, 2016, unless otherwise noted, and are those of the Fund managers and/or Wells Fargo Funds Management, LLC. Discussions of individual securities, or the markets generally, or any Wells Fargo Fund are not intended as individual recommendations. Future events or results may vary significantly from those expressed in any forward-looking statements. The views expressed are subject to change at any time in response to changing circumstances in the market. Wells Fargo Funds Management, LLC and the Fund disclaim any obligation to publicly update or revise any views expressed or forward-looking statements.
NOT FDIC INSURED ◾ NO BANK GUARANTEE ◾ MAY LOSE VALUE
| | | | |
| 2 | | Wells Fargo Diversified International Fund | | Letter to shareholders (unaudited) |

Karla M. Rabusch
President
Wells Fargo Funds
International equity investors entered the period confronting concerns about slowing economic growth, particularly in China.
Dear Shareholder:
We are pleased to offer you this annual report for the Wells Fargo Diversified International Fund for the 12-month period that ended October 31, 2016. Significant volatility in international equity markets during the final months of 2015 and early 2016 subsided during the last half of the period. The performance contrast in each half of the reporting period as measured by key benchmark indexes shows the improving investment environment during the previous 12 months.
| | | | | | | | |
| | | November 1, 2015 through
April 30, 2016 (%) | | | May 1, 2016 through
October 31, 2016 (%) | |
Morgan Stanley Capital International (MSCI) Europe, Australasia, Far East (EAFE) Index (Net)1 | | | (3.07 | ) | | | (0.16 | ) |
MSCI World Index (Net)2 | | | (1.05 | ) | | | 2.25 | |
MSCI All Country World Index (ACWI) ex USA Index (Net)3 | | | (1.75 | ) | | | 2.01 | |
S&P Developed SmallCap Index4 | | | 1.05 | | | | 2.36 | |
Past performance is no guarantee of future results.
Central bank policies demonstrated resolve to reignite global economic growth.
International equity investors entered the period confronting concerns about slowing economic growth, particularly in China. They also were uncertain if governments and their central banks could successfully address concerns about recessionary pressures and global business activity through monetary and economic policy. The December 2015 decision of the U.S. Federal Reserve (Fed) to increase its key interest rate caused elevated levels of volatility in global equity markets and sometimes drove significant fluctuations in the relative values of currencies around the world. The U.S. dollar tended to gain strength, which helped exporters in other countries but pressured importers who paid higher prices for goods and services.
The European Central Bank (ECB) pushed the interest rate it pays on deposits further into negative territory in late 2015. In January 2016, the Bank of Japan followed the ECB’s lead by setting a negative deposit rate. During the period, the People’s Bank of China guided its currency’s value lower relative to a basket of foreign currencies to enhance exports. Investors viewed the actions of major central banks as consistent with efforts to spark business activity. Observing the actions of central banks overseas to implement policies that would accommodate
| 1 | The Morgan Stanley Capital International (MSCI) Europe, Australasia, Far East (EAFE) Index (Net) is a free-float-adjusted market-capitalization weighted index that is designed to measure the equity market performance of developed markets, excluding the United States and Canada. The MSCI EAFE Index (Net) consists of the following 21 developed markets country indexes: Australia, Austria, Belgium, Denmark, Finland, France, Germany, Hong Kong, Ireland, Israel, Italy, Japan, the Netherlands, New Zealand, Norway, Portugal, Singapore, Spain, Sweden, Switzerland, and the United Kingdom. Source: MSCI. MSCI makes no express or implied warranties or representations and shall have no liability whatsoever with respect to any MSCI data contained herein. The MSCI data may not be further redistributed or used as a basis for other indexes or any securities or financial products. This report is not approved, reviewed, or produced by MSCI. You cannot invest directly in an index. |
| 2 | The MSCI World Index (Net) is a free-float-adjusted market-capitalization-weighted index that is designed to measure the equity market performance of developed markets. The MSCI World Index (Net) consists of the following 23 developed markets country indexes: Australia, Austria, Belgium, Canada, Denmark, Finland, France, Germany, Hong Kong, Ireland, Israel, Italy, Japan, the Netherlands, New Zealand, Norway, Portugal, Singapore, Spain, Sweden, Switzerland, the United Kingdom, and the United States. You cannot invest directly in an index. |
| 3 | The MSCI All Country World Index (ACWI) ex USA Index (Net) is a free-float-adjusted market-capitalization-weighted index that is designed to measure the equity market performance of developed markets, excluding the United States and Canada. You cannot invest directly in an index. |
| 4 | The S&P Developed SmallCap Index is a free-float-adjusted market-capitalization-weighted index designed to measure the equity market performance of small-capitalization companies located in developed markets. The index is composed of companies within the bottom 15% of the cumulative market capitalization in developed markets. The index covers all publicly listed equities with float-adjusted market values of U.S. $100 million or more and annual dollar value traded of at least U.S. $50 million in all included countries. You cannot invest directly in an index. |
| | | | | | |
| Letter to shareholders (unaudited) | | Wells Fargo Diversified International Fund | | | 3 | |
higher levels of business activity, the Fed acknowledged that risks to global growth existed and indicated it would base further rate increases on data that indicated successful management of the risks.
Investors closely watched changing sentiment in global markets during the period.
In the second quarter of 2016, equity market volatility levels declined and remained relatively low until the end of June, when voters in the United Kingdom surprised market participants and approved the Brexit referendum to leave the European Union. Investors reacted to the news negatively and fled to assets such as precious metals and U.S. Treasury bonds. As a result, interest rates fell sharply, and equity markets declined across the globe. In the weeks to follow, signs of resilience in major markets worldwide offset concerns stemming from the Brexit referendum.
Investors’ sentiments improved during the third quarter of 2016, which led to more favorable returns across global equity markets. The third-quarter saw a rotation that favored company fundamentals over macroeconomic fears, creating a more favorable market dynamic for active managers. Dispersion of returns from both the sector and country perspective tended to confirm the changing views of the markets among investors. On an improved perception of business health, economically sensitive sectors such as consumer discretionary, materials, financials, and industrials gained while traditionally defensive sectors (utilities, telecommunication services, health care, and consumer staples) benefited less during the market rally.
Don’t let short-term uncertainty derail long-term investment goals.
Periods of investment uncertainty can present challenges, but experience has taught us that maintaining long-term investment goals can be an effective way to plan for the future. To help you create a sound strategy based on your personal goals and risk tolerance, Wells Fargo Funds offers more than 100 mutual funds spanning a wide range of asset classes and investment styles. Although diversification cannot guarantee an investment profit or prevent losses, we believe it can be an effective way to manage investment risk and potentially smooth out overall portfolio performance. We encourage investors to know their investments and to understand that appropriate levels of risk-taking may unlock opportunities.
Thank you for choosing to invest with Wells Fargo Funds. We appreciate your confidence in us and remain committed to helping you meet your financial needs.
Sincerely,

Karla M. Rabusch
President
Wells Fargo Funds
Investors’ sentiments improved during the third quarter of 2016, which led to more favorable returns across global equity markets.
For further information about your Fund, contact your investment professional, visit our website at wellsfargofunds.com, or call us directly at 1-800-222-8222. We are available 24 hours a day, 7 days a week.
| | | | |
| 4 | | Wells Fargo Diversified International Fund | | Performance highlights (unaudited) |
Investment objective
The Fund seeks long-term capital appreciation.
Manager
Wells Fargo Funds Management, LLC
Subadvisers
Artisan Partners Limited Partnership
LSV Asset Management
Wells Capital Management Incorporated
Portfolio managers
Josef Lakonishok, Ph.D.
Puneet Mansharamani, CFA®
Menno Vermeulen, CFA®
Dale A. Winner, CFA®
Mark L. Yockey, CFA®
Average annual total returns (%) as of October 31, 20161
| | | | | | | | | | | | | | | | | | | | | | | | | | | | | | | | | | |
| | | | | Including sales charge | | | Excluding sales charge | | | Expense ratios2 (%) | |
| | | Inception date | | 1 year | | | 5 year | | | 10 year | | | 1 year | | | 5 year | | | 10 year | | | Gross | | | Net3 | |
| Class A (SILAX) | | 9-24-1997 | | | (9.48 | ) | | | 4.01 | | | | 0.13 | | | | (3.96 | ) | | | 5.25 | | | | 0.73 | | | | 1.82 | | | | 1.35 | |
| Class B (SILBX)* | | 9-24-1997 | | | (9.67 | ) | | | 4.14 | | | | 0.21 | | | | (4.67 | ) | | | 4.48 | | | | 0.21 | | | | 2.57 | | | | 2.10 | |
| Class C (WFECX) | | 4-1-1998 | | | (5.72 | ) | | | 4.45 | | | | (0.01 | ) | | | (4.72 | ) | | | 4.45 | | | | (0.01 | ) | | | 2.57 | | | | 2.10 | |
| Class R (WDIHX) | | 9-30-2015 | | | – | | | | – | | | | – | | | | (4.16 | ) | | | 5.04 | | | | 0.56 | | | | 2.07 | | | | 1.60 | |
| Class R6 (WDIRX) | | 9-30-2015 | | | – | | | | – | | | | – | | | | (3.55 | ) | | | 5.48 | | | | 0.95 | | | | 1.39 | | | | 0.89 | |
| Administrator Class (WFIEX) | | 11-8-1999 | | | – | | | | – | | | | – | | | | (3.90 | ) | | | 5.41 | | | | 0.91 | | | | 1.74 | | | | 1.25 | |
| Institutional Class (WFISX) | | 8-31-2006 | | | – | | | | – | | | | – | | | | (3.63 | ) | | | 5.60 | | | | 1.11 | | | | 1.49 | | | | 0.99 | |
| MSCI EAFE Index (Net)4 | | – | | | – | | | | – | | | | – | | | | (3.23 | ) | | | 4.99 | | | | 1.22 | | | | – | | | | – | |
| * | | At the close of business on December 5, 2016, existing Class B shareholders were converted to Class A shareholders. Effective December 6, 2016, Class B shares are no longer offered by the Fund. |
Figures quoted represent past performance, which is no guarantee of future results, and do not reflect taxes that a shareholder may pay on fund distributions or the redemption of fund shares. Investment return and principal value of an investment will fluctuate so that an investor’s shares, when redeemed, may be worth more or less than their original cost. Performance shown without sales charges would be lower if sales charges were reflected. Current performance may be lower or higher than the performance data quoted, which assumes the reinvestment of dividends and capital gains. Current month-end performance is available on the Fund’s website, wellsfargofunds.com.
Index returns do not include transaction costs associated with buying and selling securities, any mutual fund fees or expenses, or any taxes. It is not possible to invest directly in an index.
For Class A shares, the maximum front-end sales charge is 5.75%. For Class B shares, the maximum contingent deferred sales charge is 5.00%. For Class C shares, the maximum contingent deferred sales charge is 1.00%. Performance including a contingent deferred sales charge assumes the sales charge for the corresponding time period. Class R, Class R6, Administrator Class, and Institutional Class shares are sold without a front-end sales charge or contingent deferred sales charge.
Stock values fluctuate in response to the activities of individual companies and general market and economic conditions. Foreign investments are especially volatile and can rise or fall dramatically due to differences in the political and economic conditions of the host country. These risks are generally intensified in emerging markets. The use of derivatives may reduce returns and/or increase volatility. Certain investment strategies tend to increase the total risk of an investment (relative to the broader market). The Fund is exposed to smaller-company securities risk. Consult the Fund’s prospectus for additional information on these and other risks.
Please see footnotes on page 5.
| | | | | | |
| Performance highlights (unaudited) | | Wells Fargo Diversified International Fund | | | 5 | |
|
| Growth of $10,000 investment as of October 31, 20165 |
|
 |
| 1 | Historical performance shown for the Class R shares prior to their inception reflects the performance of the Administrator Class shares, adjusted to reflect the higher expenses applicable to Class R shares. Historical performance shown for the Class R6 shares prior to their inception reflects the performance of the Administrator Class shares, and includes the higher expenses applicable to Administrator Class shares. If these expenses had not been included, returns for Class R6 would be higher. If these expenses had not been included, returns would be higher. |
| 2 | Reflects the expense ratios as stated in the most recent prospectuses. The expense ratios shown are subject to change and may differ from the annualized expense ratios shown in the financial highlights of this report. |
| 3 | The manager has contractually committed through February 28, 2017, to waive fees and/or reimburse expenses to the extent necessary to cap the Fund’s Total Annual Operating Expenses After Fee Waiver at the amounts shown. After this time, the cap may be increased or the commitment to maintain the cap may be terminated only with the approval of the Board of Trustees. Brokerage commissions, stamp duty fees, interest, taxes, acquired fund fees and expenses, and extraordinary expenses are excluded from the expense cap. Without this cap, the Fund’s returns would have been lower. |
| 4 | The Morgan Stanley Capital International (MSCI) Europe, Australasia, and Far East (EAFE) Index (Net) is a free-float-adjusted market-capitalization weighted index that is designed to measure the equity market performance of developed markets, excluding the U.S. and Canada. The MSCI EAFE Index (Net) consists of the following 21 developed markets country indexes: Australia, Austria, Belgium, Denmark, Finland, France, Germany, Hong Kong, Ireland, Israel, Italy, Japan, the Netherlands, New Zealand, Norway, Portugal, Singapore, Spain, Sweden, Switzerland, and the United Kingdom. Source: MSCI. MSCI makes no express or implied warranties or representations and shall have no liability whatsoever with respect to any MSCI data contained herein. The MSCI data may not be further redistributed or used as a basis for other indexes or any securities or financial products. This report is not approved, reviewed, or produced by MSCI. You cannot invest directly in an index. |
| 5 | The chart compares the performance of Class A shares for the most recent ten years with the MSCI EAFE Index (Net). The chart assumes a hypothetical investment of $10,000 in Class A shares and reflects all operating expenses and assumes the maximum initial sales charge of 5.75%. |
| 6 | The ten largest holdings, excluding cash and cash equivalents, are calculated based on the value of the investments divided by total net assets of the Fund. Holdings are subject to change and may have changed since the date specified. |
| 7 | Amounts are calculated based on the total long-term investments of the Fund. These amounts are subject to change and may have changed since the date specified. |
| | | | |
| 6 | | Wells Fargo Diversified International Fund | | Performance highlights (unaudited) |
MANAGERS’ DISCUSSION
Fund highlights
| ∎ | | The Diversified International Fund underperformed its benchmark, the MSCI EAFE Index (Net) for the 12-month period that ended October 31, 2016. |
| ∎ | | Results from stock selection were mixed, but on balance slightly detracted from relative performance. Stronger results in the consumer staples and health care sectors were offset by weakness in the consumer discretionary, energy and industrials sectors. |
| ∎ | | All three teams continued to execute their disciplined investment approaches to identify investment opportunities in the current market that are consistent with their principal investment strategies. |
During the 12-month reporting period, the MSCI EAFE Index (Net) declined 1.9% in local-currency terms while the effect of an appreciating dollar caused the index to decline 3.2% in U.S. dollar terms. The Fund’s investments were modestly biased toward value stocks, which was a slight performance headwind because value shares tended to trail growth peers. Results from stock selection were mixed, but on balance detracted from relative performance. Stronger results in consumer staples and health care were offset by weakness in consumer discretionary, energy, and industrials. Strength in the consumer discretionary sector was concentrated in Asia, while weakness in the sector was attributable to auto related companies and investments in the textile apparel and luxury goods industry.
| | | | |
| Ten largest holdings (%) as of October 31, 20166 | |
Medtronic plc | | | 1.73 | |
Nestle SA | | | 1.57 | |
Japan Tobacco Incorporated | | | 1.53 | |
Muenchener Rueckversicherungs Gesellschaft AG | | | 1.51 | |
Linde AG | | | 1.38 | |
Nippon Telegraph & Telephone Corporation | | | 1.24 | |
Deutsche Boerse AG | | | 1.24 | |
Wolseley plc | | | 1.24 | |
Metro AG | | | 1.22 | |
AIA Group Limited | | | 1.21 | |
Artisan Partners
Artisan Partners invests in what the team considers to be dominant, high-quality companies that are exposed to positive secular growth trends or themes at reasonable valuations.
The Artisan Partners portion of the Fund was hampered particularly by stock selection in the industrials and information technology (IT) sectors. The Fund’s above-benchmark exposures to the consumer discretionary and consumer staples sectors and lack of exposure to energy were headwinds. Conversely, the Fund’s lighter exposure to financials was beneficial, as was stock selection in health care.
The Fund’s largest individual detractors included German health care and agricultural products company Bayer AG and global IT services outsourcer Cognizant Technology Solutions Corporation. The price of Bayer’s stock came under pressure on confirmation of its $66 billion takeover offer for U.S. agro-conglomerate Monsanto Company. The merger would come at a hefty price for Bayer—one that would likely dilute the value of existing shareholders’ holdings and reduce Bayer’s ability to invest in its health care businesses. As such, we exited our position. Cognizant struggled with budget cuts across its financial sector customers and delayed discretionary spending by its health care business in light of pending merger and acquisition activity. In late September, shares again fell on questions surrounding the unexpected resignation of the company’s president. Given these headwinds, we exited our position in this holding as well.
Conversely, top individual contributors included global medical device company Medtronic plc and global risk management and insurance services provider Aon plc. We believe Medtronic’s sustainable growth potential is underpinned by several competitive advantages, including its market-leading positions across multiple product lines. Aon benefited from solid organic revenue growth, effective capital management, and a lower tax rate gained by moving its headquarters from Chicago to London. The company is highly cash generative and has a record of driving increased cost efficiencies and margin expansion.
Looking forward, the outcomes of several anticipated events—including the U.S. Federal Reserve’s December 2016 meeting, the U.S. presidential election, and a November Organization of Petroleum Exporting Countries meeting—are capable of influencing the direction of equities markets over the short term. That said, we remain focused on factors within our control: finding companies with sustainable competitive advantages exposed to long-term areas of secular growth trading at reasonable valuations.
Please see footnotes on page 5.
| | | | | | |
| Performance highlights (unaudited) | | Wells Fargo Diversified International Fund | | | 7 | |
|
| Sector distribution as of October 31, 20167 |
|
 |
LSV
LSV seeks to add value through a quantitative selection process that favors deep-value stocks.
The overweight in the LSV portion of the Fund to financials had a negative impact on results as did an underweight to consumer staples. The LSV portion of the Fund benefited from exposure to emerging markets and stock selection across several sectors. Stock selection contributed to performance particularly in the financials, telecommunication services, and consumer staples sectors. Notable contributors included Challenger Limited, Banco do Brasil S.A., and Swiss Life Holding AG in the financials sector, NTT DOCOMO, and China
Communications Services Corporation Limited in the telecommunication services sector, and grocery stores Delhaize Group S.A. and Royal Ahold Delhaize N.V., which merged during the period, in the consumer staples sector. Detractors included Credit Suisse Group AG, easyJet PLC, The Berkeley Group Holdings PLC, Magna International Incorporated, and LM Ericsson Telefon AB.
The LSV portion of the Fund is overweight financials while underweight consumer staples, IT, and real estate. The portfolio is constructed from the bottom up and will overweight sectors and industries where the most attractive stocks are identified.
|
| Country allocation as of October 31, 20167 |
|
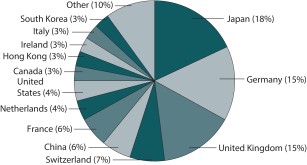 |
WellsCap
WellsCap maintains a blend equity style that emphasizes bottom-up stock selection based on rigorous, in-depth fundamental company research and incorporates consideration of top-down factors and developments as they affect market and economic activity within regions, countries, and sectors.
The WellsCap portion of the Fund was negatively impacted by performance of the stocks of investment managers and banks, as well as holdings in the apparel, motor vehicle, pharmaceutical, and real estate industries and sectors. The Fund remained overweight in the stocks
of a number of companies in Germany, the U.S., the Netherlands, Hong Kong (China), and South Korea and increased its positions in select undervalued European company stocks. The Fund benefited from positive stock-specific and sector allocation attribution across Korea, the Netherlands, Germany, and Norway as well as partial hedges of British pound and euro currency exposures. Industrial conglomerates, consumer products, electric equipment, agricultural commodity, and telecommunication services stocks contributed to performance.
Some of the best stock performances came from under-appreciated stock in each region of the world. In Asia, Coca-Cola East Japan Company Limited, Xinyi Glass Holdings Limited, and Hana Financial Group Incorporated were top performers; in Europe, sizable positive returns from Prysmian S.p.A., Smiths Group plc, Siemens AG, and Royal Philips N.V. were notable; and in the Americas, Lundin Mining Corporation was a positive standout. We have gradually increased our emerging markets equity exposure, notably in Korea and Brazil. Outside these countries and China and Hong Kong, we are evaluating a number of opportunities amid increasing emerging markets company, country, and currency risk and opportunity divergences. Negative performance effects came from stocks such as ANIMA Holding S.p.A., HUGO BOSS AG, Mitsubishi UFJ Financial Group, Incorporated, Cameco Corporation, Dongfeng Motor Group Company, Limited, Nomura Holdings, Incorporated, and Hitachi, Limited.
In Europe, opportunities arose amid signs of a cyclical economic recovery in the context of an alert European Central Bank (ECB) that is focused on managing systematic risks in banking and financial markets. The ECB’s actions continue to address challenges facing the European Union member states as they seek further political cooperation to secure their currency union. Companies engaged in self-help restructuring through operational efficiencies such as careful
Please see footnotes on page 5.
| | | | |
| 8 | | Wells Fargo Diversified International Fund | | Performance highlights (unaudited) |
investment of corporate resources, cost-cutting, and portfolio reshaping bolstered their profitability and benefited from the additional impetus of structural reforms and economic recovery.
In Asia, our base-case assessment suggests that while the policy challenges of transitioning from an exclusively state-controlled to more market-driven economy are not without difficulty in China, government officials have several policy levers at their disposal to accomplish an orderly and flexible liberalization, especially ahead of next year’s National People’s Congress milestone. We believe policy easing remains incremental, leaving room for further growth enhancement measures. In Hong Kong, we continued to build positions in undervalued and restructuring state-owned enterprises. In South Korea, positions provide long-term attractive total return upside based on micro restructuring benefits. And in Japan, where we are now underweight as of the beginning of this year, compared to an overweight in the portfolio years ago, we continue to find bifurcation between the new and old corporate regimes.
Please see footnotes on page 5.
| | | | | | |
| Fund expenses (unaudited) | | Wells Fargo Diversified International Fund | | | 9 | |
As a shareholder of the Fund, you incur two types of costs: (1) transaction costs, including sales charges (loads) on purchase payments and contingent deferred sales charges (if any) on redemptions and (2) ongoing costs, including management fees, distribution (12b-1) and/or shareholder servicing fees, and other Fund expenses. This example is intended to help you understand your ongoing costs (in dollars) of investing in the Fund and to compare these costs with the ongoing costs of investing in other mutual funds.
The example is based on an investment of $1,000 invested at the beginning of the six-month period and held for the entire period from May 1, 2016 to October 31, 2016.
Actual expenses
The “Actual” line of the table below provides information about actual account values and actual expenses. You may use the information in this line, together with the amount you invested, to estimate the expenses that you paid over the period. Simply divide your account value by $1,000 (for example, an $8,600 account value divided by $1,000 = 8.6), then multiply the result by the number in the “Actual” line under the heading entitled “Expenses paid during period” for your applicable class of shares to estimate the expenses you paid on your account during this period.
Hypothetical example for comparison purposes
The “Hypothetical” line of the table below provides information about hypothetical account values and hypothetical expenses based on the Fund’s actual expense ratio and an assumed rate of return of 5% per year before expenses, which is not the Fund’s actual return. The hypothetical account values and expenses may not be used to estimate the actual ending account balance or expenses you paid for the period. You may use this information to compare the ongoing costs of investing in the Fund and other funds. To do so, compare this 5% hypothetical example with the 5% hypothetical examples that appear in the shareholder reports of the other funds.
Please note that the expenses shown in the table are meant to highlight your ongoing costs only and do not reflect any transactional costs, such as sales charges (loads) and contingent deferred sales charges. Therefore, the “Hypothetical” line of the table is useful in comparing ongoing costs only and will not help you determine the relative total costs of owning different funds. In addition, if these transactional costs were included, your costs would have been higher.
| | | | | | | | | | | | | | | | |
| | | Beginning
account value
5-1-2016 | | | Ending
account value
10-31-2016 | | | Expenses
paid during
the period¹ | | | Annualized net
expense ratio | |
Class A | | | | | | | | | | | | | | | | |
Actual | | $ | 1,000.00 | | | $ | 1,003.62 | | | $ | 6.79 | | | | 1.35 | % |
Hypothetical (5% return before expenses) | | $ | 1,000.00 | | | $ | 1,018.36 | | | $ | 6.84 | | | | 1.35 | % |
Class B | | | | | | | | | | | | | | | | |
Actual | | $ | 1,000.00 | | | $ | 1,000.00 | | | $ | 10.30 | | | | 2.05 | % |
Hypothetical (5% return before expenses) | | $ | 1,000.00 | | | $ | 1,014.83 | | | $ | 10.38 | | | | 2.05 | % |
Class C | | | | | | | | | | | | | | | | |
Actual | | $ | 1,000.00 | | | $ | 999.02 | | | $ | 10.55 | | | | 2.10 | % |
Hypothetical (5% return before expenses) | | $ | 1,000.00 | | | $ | 1,014.58 | | | $ | 10.63 | | | | 2.10 | % |
Class R | | | | | | | | | | | | | | | | |
Actual | | $ | 1,000.00 | | | $ | 1,002.67 | | | $ | 8.06 | | | | 1.60 | % |
Hypothetical (5% return before expenses) | | $ | 1,000.00 | | | $ | 1,017.09 | | | $ | 8.11 | | | | 1.60 | % |
Class R6 | | | | | | | | | | | | | | | | |
Actual | | $ | 1,000.00 | | | $ | 1,005.32 | | | $ | 4.49 | | | | 0.89 | % |
Hypothetical (5% return before expenses) | | $ | 1,000.00 | | | $ | 1,020.66 | | | $ | 4.52 | | | | 0.89 | % |
Administrator Class | | | | | | | | | | | | | | | | |
Actual | | $ | 1,000.00 | | | $ | 1,003.56 | | | $ | 6.30 | | | | 1.25 | % |
Hypothetical (5% return before expenses) | | $ | 1,000.00 | | | $ | 1,018.85 | | | $ | 6.34 | | | | 1.25 | % |
Institutional Class | | | | | | | | | | | | | | | | |
Actual | | $ | 1,000.00 | | | $ | 1,004.74 | | | $ | 4.99 | | | | 0.99 | % |
Hypothetical (5% return before expenses) | | $ | 1,000.00 | | | $ | 1,020.16 | | | $ | 5.03 | | | | 0.99 | % |
| 1 | Expenses paid is equal to the annualized net expense ratio of each class multiplied by the average account value over the period, multiplied by the number of days in the most recent fiscal half-year divided by the number of days in the fiscal year (to reflect the one-half-year period). |
| | | | |
| 10 | | Wells Fargo Diversified International Fund | | Portfolio of investments—October 31, 2016 |
| | | | | | | | | | | | | | | | |
| Security name | | | | | | | | Shares | | | Value | |
| | | | |
Common Stocks: 91.82% | | | | | | | | | | | | | | | | |
| | | | |
| Australia: 1.79% | | | | | | | | | | | | | | | | |
Arrium Limited (Materials, Metals & Mining) †(a) | | | | | | | | | | | 397,400 | | | $ | 6,651 | |
Asaleo Care Limited (Consumer Staples, Personal Products) | | | | | | | | | | | 114,700 | | | | 127,388 | |
Automotive Holdings Group Limited (Consumer Discretionary, Specialty Retail) | | | | | | | | | | | 29,300 | | | | 90,268 | |
Bendigo Bank Limited (Financials, Banks) | | | | | | | | | | | 26,100 | | | | 220,978 | |
BHP Billiton Limited (Materials, Metals & Mining) | | | | | | | | | | | 5,275 | | | | 92,573 | |
BHP Billiton Limited ADR (Materials, Metals & Mining) | | | | | | | | | | | 1,878 | | | | 65,768 | |
Challenger Financial Services Group Limited (Financials, Diversified Financial Services) | | | | | | | | | | | 27,000 | | | | 220,999 | |
CSR Limited (Materials, Construction Materials) | | | | | | | | | | | 59,900 | | | | 166,771 | |
Downer EDI Limited (Industrials, Commercial Services & Supplies) | | | | | | | | | | | 42,300 | | | | 187,595 | |
Lendlease Corporation Limited (Real Estate, Real Estate Management & Development) | | | | | | | | | | | 24,500 | | | | 251,974 | |
Metcash Limited (Consumer Staples, Food & Staples Retailing) † | | | | | | | | | | | 28,500 | | | | 43,143 | |
Mineral Resources Limited (Industrials, Metals & Mining) | | | | | | | | | | | 14,900 | | | | 131,139 | |
Primary Health Care Limited (Health Care, Health Care Providers & Services) | | | | | | | | | | | 25,700 | | | | 75,072 | |
Qantas Airways Limited (Industrials, Airlines) | | | | | | | | | | | 59,300 | | | | 138,035 | |
Seven Group Holdings Limited (Industrials, Trading Companies & Distributors) | | | | | | | | | | | 15,300 | | | | 105,796 | |
| | | | |
| | | | | | | | | | | | | | | 1,924,150 | |
| | | | | | | | | | | | | | | | |
| | | | |
| Austria: 0.30% | | | | | | | | | | | | | | | | |
OMV AG (Energy, Oil, Gas & Consumable Fuels) | | | | | | | | | | | 5,300 | | | | 165,670 | |
Voestalpine AG (Materials, Metals & Mining) | | | | | | | | | | | 4,300 | | | | 152,136 | |
| | | | |
| | | | | | | | | | | | | | | 317,806 | |
| | | | | | | | | | | | | | | | |
| | | | |
| Belgium: 0.43% | | | | | | | | | | | | | | | | |
Telenet Group Holding NV (Consumer Discretionary, Media) † | | | | | | | | | | | 6,648 | | | | 355,879 | |
UCB SA (Health Care, Pharmaceuticals) | | | | | | | | | | | 1,559 | | | | 105,576 | |
| | | | |
| | | | | | | | | | | | | | | 461,455 | |
| | | | | | | | | | | | | | | | |
| | | | |
| Brazil: 0.47% | | | | | | | | | | | | | | | | |
Banco do Brasil SA (Financials, Banks) | | | | | | | | | | | 19,000 | | | | 174,345 | |
Companhia de Saneamento de Minas Gerais SA (Utilities, Water Utilities) | | | | | | | | | | | 5,300 | | | | 55,325 | |
Cosan Limited Class A (Energy, Oil, Gas & Consumable Fuels) | | | | | | | | | | | 7,976 | | | | 70,986 | |
JBS SA (Consumer Staples, Food Products) | | | | | | | | | | | 67,500 | | | | 205,334 | |
| | | | |
| | | | | | | | | | | | | | | 505,990 | |
| | | | | | | | | | | | | | | | |
| | | | |
| Canada: 2.45% | | | | | | | | | | | | | | | | |
Canadian Pacific Railway Limited (Industrials, Road & Rail) | | | | | | | | | | | 7,249 | | | | 1,036,317 | |
Lundin Mining Corporation (Materials, Metals & Mining) † | | | | | | | | | | | 206,170 | | | | 806,973 | |
Magna International Incorporated (Consumer Discretionary, Auto Components) | | | | | | | | | | | 9,100 | | | | 373,620 | |
Rogers Communications Incorporated Class B (Telecommunication Services, Wireless Telecommunication Services) | | | | | | | | | | | 6,633 | | | | 266,843 | |
WestJet Airlines Limited (Industrials, Airlines) | | | | | | | | | | | 9,200 | | | | 150,555 | |
| | | | |
| | | | | | | | | | | | | | | 2,634,308 | |
| | | | | | | | | | | | | | | | |
| | | | |
| China: 5.38% | | | | | | | | | | | | | | | | |
Alibaba Group Holding Limited ADR (Information Technology, Internet Software & Services) † | | | | | | | | | | | 12,219 | | | | 1,242,550 | |
China Communications Services Corporation Limited H Shares (Telecommunication Services, Diversified Telecommunication Services) | | | | | | | | | | | 220,000 | | | | 130,771 | |
China Construction Bank H Shares (Financials, Banks) | | | | | | | | | | | 135,289 | | | | 99,083 | |
The accompanying notes are an integral part of these financial statements.
| | | | | | |
| Portfolio of investments—October 31, 2016 | | Wells Fargo Diversified International Fund | | | 11 | |
| | | | | | | | | | | | | | | | |
| Security name | | | | | | | | Shares | | | Value | |
| | | | |
| China (continued) | | | | | | | | | | | | | | | | |
China Everbright Limited (Financials, Capital Markets) | | | | | | | | | | | 348,000 | | | $ | 682,041 | |
China Mobile Limited (Telecommunication Services, Wireless Telecommunication Services) | | | | | | | | | | | 101,000 | | | | 1,157,087 | |
China Petroleum & Chemical Corporation H Shares (Energy, Oil, Gas & Consumable Fuels) | | | | | | | | | | | 218,000 | | | | 158,815 | |
China Railway Construction Corporation Limited H Shares (Industrials, Construction & Engineering) | | | | | | | | | | | 141,500 | | | | 177,341 | |
Ctrip.com International Limited ADR (Consumer Discretionary, Internet & Direct Marketing Retail) † | | | | | | | | | | | 5,725 | | | | 252,759 | |
Dongfeng Motor Group Company Limited H Shares (Consumer Discretionary, Automobiles) | | | | | | | | | | | 106,000 | | | | 110,298 | |
Industrial & Commercial Bank of China Limited H Shares (Financials, Banks) | | | | | | | | | | | 721,000 | | | | 434,150 | |
PICC Property & Casualty Company Limited H Shares (Financials, Insurance) | | | | | | | | | | | 89,000 | | | | 144,134 | |
Shanghai Pharmaceuticals Holding Company Limited H Shares (Health Care, Health Care Providers & Services) | | | | | | | | | | | 245,000 | | | | 631,806 | |
Shenzhen International Holdings Limited H Shares (Industrials, Transportation Infrastructure) | | | | | | | | | | | 49,500 | | | | 76,590 | |
Universal Health International Group Holding Limited (Health Care, Health Care Providers & Services) † | | | | | | | | | | | 382,000 | | | | 17,239 | |
Xinyi Solar Holdings Limited (Information Technology, Semiconductors & Semiconductor Equipment) | | | | | | | | | | | 562,000 | | | | 208,697 | |
Xtep International Holdings Limited (Consumer Discretionary, Textiles, Apparel & Luxury Goods) | | | | | | | | | | | 468,050 | | | | 206,398 | |
Yantai Changyu Pioneer Wine Company Limited Class B (Consumer Staples, Beverages) | | | | | | | | | | | 23,400 | | | | 64,447 | |
| | | | |
| | | | | | | | | | | | | | | 5,794,206 | |
| | | | | | | | | | | | | | | | |
|
| Czech Republic: 0.09% | |
CEZ AS (Utilities, Electric Utilities) | | | | | | | | | | | 4,900 | | | | 92,350 | |
| | | | | | | | | | | | | | | | |
|
| Denmark: 0.84% | |
Danske Bank AS (Financials, Banks) | | | | | | | | | | | 9,300 | | | | 287,134 | |
ISS AS (Industrials, Commercial Services & Supplies) | | | | | | | | | | | 4,528 | | | | 178,025 | |
Novo Nordisk AS Class B (Health Care, Pharmaceuticals) | | | | | | | | | | | 8,910 | | | | 318,750 | |
Sydbank AS (Financials, Banks) | | | | | | | | | | | 4,000 | | | | 125,092 | |
| | | | |
| | | | | | | | | | | | | | | 909,001 | |
| | | | | | | | | | | | | | | | |
|
| Finland: 0.09% | |
Tieto Oyj (Information Technology, IT Services) | | | | | | | | | | | 3,500 | | | | 96,015 | |
| | | | | | | | | | | | | | | | |
|
| France: 5.50% | |
Arkema SA (Materials, Chemicals) | | | | | | | | | | | 910 | | | | 86,290 | |
AXA SA (Financials, Insurance) | | | | | | | | | | | 11,300 | | | | 254,728 | |
BNP Paribas SA (Financials, Banks) | | | | | | | | | | | 4,400 | | | | 255,223 | |
Cie Generale des Establissements Michelin (Consumer Discretionary, Auto Components) | | | | | | | | | | | 2,200 | | | | 238,196 | |
Compagnie de Saint-Gobain SA (Industrials, Building Products) | | | | | | | | | | | 25,134 | | | | 1,115,912 | |
Credit Agricole SA (Financials, Banks) | | | | | | | | | | | 13,900 | | | | 150,024 | |
Electricite de France SA (Utilities, Electric Utilities) « | | | | | | | | | | | 12,500 | | | | 140,100 | |
Engie SA (Utilities, Multi-Utilities) « | | | | | | | | | | | 13,300 | | | | 191,772 | |
LVMH Moet Hennessy Louis Vuitton SA (Consumer Discretionary, Textiles, Apparel & Luxury Goods) | | | | | | | | | | | 1,108 | | | | 201,360 | |
Orange SA (Telecommunication Services, Diversified Telecommunication Services) | | | | | | | | | | | 14,100 | | | | 222,113 | |
Pernod-Ricard SA (Consumer Staples, Beverages) | | | | | | | | | | | 3,672 | | | | 436,752 | |
Renault SA (Consumer Discretionary, Automobiles) | | | | | | | | | | | 3,100 | | | | 269,213 | |
Sanofi SA (Health Care, Pharmaceuticals) | | | | | | | | | | | 8,600 | | | | 669,909 | |
SCOR SE (Financials, Insurance) | | | | | | | | | | | 7,700 | | | | 249,269 | |
Societe Generale SA (Financials, Banks) | | | | | | | | | | | 3,700 | | | | 144,433 | |
Thales SA (Industrials, Aerospace & Defense) | | | | | | | | | | | 1,600 | | | | 150,646 | |
Total SA (Energy, Oil, Gas & Consumable Fuels) | | | | | | | | | | | 7,000 | | | | 335,955 | |
Zodiac Aerospace SA (Industrials, Aerospace & Defense) | | | | | | | | | | | 33,010 | | | | 803,368 | |
| | | | |
| | | | | | | | | | | | | | | 5,915,263 | |
| | | | | | | | | | | | | | | | |
The accompanying notes are an integral part of these financial statements.
| | | | |
| 12 | | Wells Fargo Diversified International Fund | | Portfolio of investments—October 31, 2016 |
| | | | | | | | | | | | | | | | |
| Security name | | | | | | | | Shares | | | Value | |
|
| Germany: 13.43% | |
Allianz AG (Financials, Insurance) | | | | | | | | | | | 8,330 | | | $ | 1,298,484 | |
Aurubis AG (Materials, Metals & Mining) | | | | | | | | | | | 2,300 | | | | 119,651 | |
BASF SE (Materials, Chemicals) | | | | | | | | | | | 3,500 | | | | 308,523 | |
Bayer AG (Health Care, Pharmaceuticals) | | | | | | | | | | | 11,644 | | | | 1,154,105 | |
Bayerische Motoren Werke AG (Consumer Discretionary, Automobiles) | | | | | | | | | | | 2,200 | | | | 191,683 | |
Beiersdorf AG (Consumer Staples, Personal Products) | | | | | | | | | | | 7,640 | | | | 672,622 | |
Daimler AG (Consumer Discretionary, Automobiles) | | | | | | | | | | | 6,200 | | | | 441,781 | |
Deutsche Bank AG (Financials, Capital Markets) † | | | | | | | | | | | 9,100 | | | | 131,412 | |
Deutsche Boerse AG (Financials, Diversified Financial Services) | | | | | | | | | | | 17,153 | | | | 1,334,650 | |
Deutsche Post AG (Industrials, Air Freight & Logistics) | | | | | | | | | | | 12,179 | | | | 377,421 | |
E.ON SE (Utilities, Multi-Utilities) | | | | | | | | | | | 8,100 | | | | 59,326 | |
Hannover Rueck SE (Financials, Insurance) | | | | | | | | | | | 1,200 | | | | 133,772 | |
Linde AG (Materials, Chemicals) | | | | | | | | | | | 9,001 | | | | 1,485,092 | |
Metro AG (Consumer Staples, Food & Staples Retailing) | | | | | | | | | | | 43,835 | | | | 1,313,192 | |
Muenchener Rueckversicherungs Gesellschaft AG (Financials, Insurance) | | | | | | | | | | | 8,370 | | | | 1,622,631 | |
Rheinmetall AG (Industrials, Industrial Conglomerates) | | | | | | | | | | | 7,868 | | | | 545,087 | |
SAP SE (Information Technology, Software) | | | | | | | | | | | 8,445 | | | | 743,865 | |
Siemens AG (Industrials, Industrial Conglomerates) | | | | | | | | | | | 7,723 | | | | 877,041 | |
Stada Arzneimittel AG (Health Care, Pharmaceuticals) | | | | | | | | | | | 2,600 | | | | 130,164 | |
Uniper SE (Utilities, Independent Power & Renewable Electricity Producers) | | | | | | | | | | | 810 | | | | 10,781 | |
Volkswagen AG (Consumer Discretionary, Automobiles) | | | | | | | | | | | 1,600 | | | | 238,870 | |
Vonovia SE (Real Estate, Real Estate Management & Development) | | | | | | | | | | | 15,669 | | | | 551,883 | |
Wirecard AG (Information Technology, IT Services) « | | | | | | | | | | | 14,878 | | | | 705,802 | |
| | | | |
| | | | | | | | | | | | | | | 14,447,838 | |
| | | | | | | | | | | | | | | | |
| | | |
| Hong Kong: 2.77% | | | | | | | | | | | | | |
AIA Group Limited (Financials, Insurance) | | | | | | | | | | | 206,400 | | | | 1,302,716 | |
China Resources Cement Holdings Limited (Materials, Construction Materials) | | | | | | | | | | | 168,000 | | | | 68,018 | |
Kingboard Laminates Holdings Limited (Information Technology, Electronic Equipment, Instruments & Components) | | | | | | | | | | | 226,500 | | | | 203,266 | |
Skyworth Digital Holdings Limited (Consumer Discretionary, Household Durables) | | | | | | | | | | | 320,000 | | | | 207,129 | |
Value Partners Group Limited (Financials, Capital Markets) | | | | | | | | | | | 375,000 | | | | 358,775 | |
Wheelock & Company Limited (Real Estate, Real Estate Management & Development) | | | | | | | | | | | 22,000 | | | | 135,877 | |
Xinyi Automobile Glass Hong Kong Enterprises Limited (Consumer Discretionary, Auto Components) † | | | | | | | | | | | 77,250 | | | | 15,041 | |
Xinyi Glass Holdings Limited (Consumer Discretionary, Auto Components) | | | | | | | | | | | 618,000 | | | | 531,498 | |
Yue Yuen Industrial Holdings Limited (Consumer Discretionary, Textiles, Apparel & Luxury Goods) | | | | | | | | | | | 42,000 | | | | 160,027 | |
| | | | |
| | | | | | | | | | | | | | | 2,982,347 | |
| | | | | | | | | | | | | | | | |
| | | |
| Hungary: 0.07% | | | | | | | | | | | | | |
Richter Gedeon (Health Care, Pharmaceuticals) | | | | | | | | | | | 3,500 | | | | 75,227 | |
| | | | | | | | | | | | | | | | |
| | | |
| India: 0.14% | | | | | | | | | | | | | |
Tata Motors Limited ADR (Consumer Discretionary, Automobiles) | | | | | | | | | | | 3,700 | | | | 145,817 | |
| | | | | | | | | | | | | | | | |
| | | |
| Indonesia: 0.09% | | | | | | | | | | | | | |
PT Bank Rakyat Indonesia Tbk (Financials, Banks) | | | | | | | | | | | 98,800 | | | | 92,379 | |
| | | | | | | | | | | | | | | | |
| | | |
| Ireland: 2.00% | | | | | | | | | | | | | |
Allegion plc (Industrials, Building Products) | | | | | | | | | | | 519 | | | | 33,133 | |
C&C Group plc (Consumer Staples, Beverages) | | | | | | | | | | | 18,600 | | | | 71,464 | |
Medtronic plc (Health Care, Health Care Equipment & Supplies) | | | | | | | | | | | 22,671 | | | | 1,859,475 | |
Smurfit Kappa Group plc (Materials, Containers & Packaging) | | | | | | | | | | | 8,800 | | | | 192,818 | |
| | | | |
| | | | | | | | | | | | | | | 2,156,890 | |
| | | | | | | | | | | | | | | | |
The accompanying notes are an integral part of these financial statements.
| | | | | | |
| Portfolio of investments—October 31, 2016 | | Wells Fargo Diversified International Fund | | | 13 | |
| | | | | | | | | | | | | | | | |
| Security name | | | | | | | | Shares | | | Value | |
| | | |
| Israel: 0.38% | | | | | | | | | | | | | |
Bank Hapoalim Limited (Financials, Banks) | | | | | | | | | | | 38,000 | | | $ | 219,305 | |
Teva Pharmaceutical Industries Limited (Health Care, Pharmaceuticals) | | | | | | | | | | | 4,600 | | | | 192,691 | |
| | | | |
| | | | | | | | | | | | | | | 411,996 | |
| | | | | | | | | | | | | | | | |
| | | |
| Italy: 2.37% | | | | | | | | | | | | | |
A2A SpA (Utilities, Multi-Utilities) | | | | | | | | | | | 104,600 | | | | 142,497 | |
Atlantia SpA (Industrials, Transportation Infrastructure) | | | | | | | | | | | 14,348 | | | | 351,394 | |
Enel SpA (Utilities, Electric Utilities) | | | | | | | | | | | 48,100 | | | | 206,983 | |
Eni SpA (Energy, Oil, Gas & Consumable Fuels) | | | | | | | | | | | 80,985 | | | | 1,174,386 | |
Mediobanca SpA (Financials, Banks) | | | | | | | | | | | 23,400 | | | | 171,463 | |
Prysmian SpA (Industrials, Electrical Equipment) | | | | | | | | | | | 20,306 | | | | 505,335 | |
| | | | |
| | | | | | | | | | | | | | | 2,552,058 | |
| | | | | | | | | | | | | | | | |
| | | |
| Japan: 17.09% | | | | | | | | | | | | | |
Adeka Corporation (Materials, Chemicals) | | | | | | | | | | | 13,000 | | | | 197,101 | |
Aisin Seiki Company Limited (Consumer Discretionary, Auto Components) | | | | | | | | | | | 3,300 | | | | 145,223 | |
Alpine Electronics Incorporated (Consumer Discretionary, Household Durables) | | | | | | | | | | | 7,500 | | | | 100,124 | |
Aoyama Trading Company Limited (Consumer Discretionary, Specialty Retail) | | | | | | | | | | | 1,800 | | | | 63,507 | |
Aozora Bank Limited (Financials, Banks) | | | | | | | | | | | 41,000 | | | | 135,663 | |
Astellas Pharma Incorporated (Health Care, Pharmaceuticals) | | | | | | | | | | | 17,100 | | | | 254,291 | |
Bridgestone Corporation (Consumer Discretionary, Auto Components) | | | | | | | | | | | 6,500 | | | | 242,658 | |
CALBEE Incorporated (Consumer Staples, Food Products) | | | | | | | | | | | 7,700 | | | | 279,746 | |
Calsonic Kansei Corporation (Consumer Discretionary, Auto Components) | | | | | | | | | | | 26,000 | | | | 326,023 | |
Central Glass Company Limited (Industrials, Building Products) | | | | | | | | | | | 34,000 | | | | 139,411 | |
Coca-Cola East Japan Company Limited (Consumer Staples, Beverages) | | | | | | | | | | | 47,100 | | | | 1,040,179 | |
Daiwa Securities Group Incorporated (Financials, Capital Markets) | | | | | | | | | | | 130,000 | | | | 778,116 | |
DCM Holdings Company Limited (Consumer Discretionary, Specialty Retail) | | | | | | | | | | | 14,100 | | | | 123,696 | |
Denka Company Limited (Materials, Chemicals) | | | | | | | | | | | 50,000 | | | | 227,424 | |
DIC Incorporated (Materials, Chemicals) | | | | | | | | | | | 5,300 | | | | 160,966 | |
Eizo Corporation (Information Technology, Technology Hardware, Storage & Peripherals) | | | | | | | | | | | 7,300 | | | | 231,105 | |
Fuji Oil Company Limited (Consumer Staples, Food Products) | | | | | | | | | | | 8,800 | | | | 170,009 | |
Fujikura Limited (Industrials, Electrical Equipment) | | | | | | | | | | | 25,000 | | | | 147,325 | |
Hitachi Limited (Information Technology, Electronic Equipment, Instruments & Components) | | | | | | | | | | | 171,000 | | | | 911,826 | |
Isuzu Motors Limited (Consumer Discretionary, Automobiles) | | | | | | | | | | | 16,500 | | | | 204,460 | |
Itochu Corporation (Industrials, Trading Companies & Distributors) | | | | | | | | | | | 14,600 | | | | 184,954 | |
Japan Airlines Company Limited (Industrials, Airlines) | | | | | | | | | | | 6,300 | | | | 185,990 | |
Japan Tobacco Incorporated (Consumer Staples, Tobacco) | | | | | | | | | | | 43,320 | | | | 1,649,853 | |
KDDI Corporation (Telecommunication Services, Wireless Telecommunication Services) | | | | | | | | | | | 29,500 | | | | 897,912 | |
Kyorin Company Limited (Health Care, Pharmaceuticals) | | | | | | | | | | | 7,900 | | | | 177,029 | |
Maeda Road Construction Company Limited (Industrials, Construction & Engineering) | | | | | | | | | | | 11,000 | | | | 203,910 | |
Marubeni Corporation (Industrials, Trading Companies & Distributors) | | | | | | | | | | | 36,300 | | | | 191,313 | |
Matsumotokiyoshi Holdings Company Limited (Consumer Staples, Food & Staples Retailing) | | | | | | | | | | | 3,000 | | | | 154,763 | |
Miraca Holdings Incorporated (Health Care, Health Care Providers & Services) | | | | | | | | | | | 1,800 | | | | 87,194 | |
Mitsubishi Gas Chemical Company Incorporated (Materials, Chemicals) | | | | | | | | | | | 21,000 | | | | 324,001 | |
Mitsubishi UFJ Financial Group Incorporated (Financials, Banks) | | | | | | | | | | | 203,000 | | | | 1,054,199 | |
Mitsui Fudosan Company Limited (Real Estate, Real Estate Management & Development) | | | | | | | | | | | 17,000 | | | | 387,513 | |
Mizuho Financial Group Incorporated (Financials, Banks) | | | | | | | | | | | 171,600 | | | | 289,791 | |
Nippon Telegraph & Telephone Corporation (Telecommunication Services, Diversified Telecommunication Services) | | | | | | | | | | | 30,100 | | | | 1,337,523 | |
Nissan Motor Company Limited (Consumer Discretionary, Automobiles) | | | | | | | | | | | 32,200 | | | | 328,080 | |
The accompanying notes are an integral part of these financial statements.
| | | | |
| 14 | | Wells Fargo Diversified International Fund | | Portfolio of investments—October 31, 2016 |
| | | | | | | | | | | | | | | | |
| Security name | | | | | | | | Shares | | | Value | |
| | | |
| Japan (continued) | | | | | | | | | | | | | |
Nisshinbo Holdings Incorporated (Industrials, Industrial Conglomerates) | | | | | | | | | | | 12,400 | | | $ | 123,799 | |
Nomura Holdings Incorporated (Financials, Capital Markets) | | | | | | | | | | | 173,400 | | | | 870,555 | |
NTT DOCOMO Incorporated (Telecommunication Services, Wireless Telecommunication Services) | | | | | | | | | | | 47,803 | | | | 1,203,622 | |
Resona Holdings Incorporated (Financials, Banks) | | | | | | | | | | | 75,000 | | | | 333,270 | |
S Foods Incorporated (Consumer Staples, Food Products) | | | | | | | | | | | 7,500 | | | | 200,963 | |
Sankyu Incorporated (Industrials, Road & Rail) | | | | | | | | | | | 28,000 | | | | 165,271 | |
Sawai Pharmaceutical Company Limited (Health Care, Pharmaceuticals) | | | | | | | | | | | 2,100 | | | | 135,968 | |
SEINO Holdings Company Limited (Industrials, Road & Rail) | | | | | | | | | | | 3,000 | | | | 33,327 | |
Seven & I Holdings Company Limited (Consumer Staples, Food & Staples Retailing) | | | | | | | | | | | 2,700 | | | | 112,845 | |
Sojitz Corporation (Industrials, Trading Companies & Distributors) | | | | | | | | | | | 77,400 | | | | 203,704 | |
Sumitomo Corporation (Industrials, Trading Companies & Distributors) | | | | | | | | | | | 19,900 | | | | 229,513 | |
Sumitomo Heavy Industries Limited (Industrials, Machinery) | | | | | | | | | | | 30,000 | | | | 158,482 | |
Sumitomo Mitsui Financial Group Incorporated (Financials, Banks) | | | | | | | | | | | 8,000 | | | | 278,669 | |
Sumitomo Osaka Cement Company (Materials, Construction Materials) | | | | | | | | | | | 37,600 | | | | 155,965 | |
Toho Holdings Company Limited (Health Care, Health Care Providers & Services) | | | | | | | | | | | 6,200 | | | | 130,361 | |
Toyo Ink SC Holding Company Limited (Materials, Chemicals) | | | | | | | | | | | 36,800 | | | | 171,595 | |
Toyo Tire & Rubber Company Limited (Consumer Discretionary, Auto Components) | | | | | | | | | | | 5,900 | | | | 91,085 | |
Tsumura & Company (Health Care, Pharmaceuticals) | | | | | | | | | | | 3,800 | | | | 108,199 | |
UBE Industries Limited (Materials, Chemicals) | | | | | | | | | | | 79,000 | | | | 163,469 | |
Yokohama Rubber Company Limited (Consumer Discretionary, Auto Components) | | | | | | | | | | | 10,500 | | | | 182,626 | |
| | | | |
| | | | | | | | | | | | | | | 18,386,166 | |
| | | | | | | | | | | | | | | | |
| | | |
| Liechtenstein: 0.11% | | | | | | | | | | | | | |
VP Bank AG (Financials, Capital Markets) | | | | | | | | | | | 1,177 | | | | 115,494 | |
| | | | | | | | | | | | | | | | |
| | | |
| Luxembourg: 0.11% | | | | | | | | | | | | | |
RTL Group SA (Consumer Discretionary, Media) | | | | | | | | | | | 1,513 | | | | 118,588 | |
| | | | | | | | | | | | | | | | |
|
| Netherlands: 3.57% | |
Aegon NV (Financials, Insurance) | | | | | | | | | | | 23,200 | | | | 100,038 | |
Akzo Nobel NV (Materials, Chemicals) | | | | | | | | | | | 5,295 | | | | 342,245 | |
ASML Holding NV (Information Technology, Semiconductors & Semiconductor Equipment) | | | | | | | | | | | 2,229 | | | | 236,124 | |
Heineken NV (Consumer Staples, Beverages) | | | | | | | | | | | 1,030 | | | | 84,858 | |
ING Groep NV (Financials, Banks) | | | | | | | | | | | 44,997 | | | | 592,499 | |
Koninklijke Ahold NV (Consumer Staples, Food & Staples Retailing) | | | | | | | | | | | 22,000 | | | | 502,210 | |
Koninklijke Philips NV (Industrials, Industrial Conglomerates) « | | | | | | | | | | | 34,831 | | | | 1,049,953 | |
NN Group NV (Financials, Insurance) | | | | | | | | | | | 30,802 | | | | 928,164 | |
| | | | |
| | | | | | | | | | | | | | | 3,836,091 | |
| | | | | | | | | | | | | | | | |
|
| Norway: 0.81% | |
DNB Nor ASA (Financials, Banks) | | | | | | | | | | | 12,100 | | | | 175,005 | |
Frontline Limited (Energy, Oil, Gas & Consumable Fuels) « | | | | | | | | | | | 17,543 | | | | 128,669 | |
Marine Harvest ASA (Consumer Staples, Food Products) | | | | | | | | | | | 22,503 | | | | 408,261 | |
Yara International ASA (Materials, Chemicals) | | | | | | | | | | | 4,600 | | | | 162,569 | |
| | | | |
| | | | | | | | | | | | | | | 874,504 | |
| | | | | | | | | | | | | | | | |
|
| Poland: 0.07% | |
Asseco Poland SA (Information Technology, Software) | | | | | | | | | | | 5,900 | | | | 78,727 | |
| | | | | | | | | | | | | | | | |
The accompanying notes are an integral part of these financial statements.
| | | | | | |
| Portfolio of investments—October 31, 2016 | | Wells Fargo Diversified International Fund | | | 15 | |
| | | | | | | | | | | | | | | | |
| Security name | | | | | | | | Shares | | | Value | |
|
| Russia: 0.33% | |
Gazprom Neft Sponsored ADR (Energy, Oil, Gas & Consumable Fuels) | | | | | | | | | | | 10,500 | | | $ | 152,775 | |
LUKOIL OAO ADR (Energy, Oil, Gas & Consumable Fuels) | | | | | | | | | | | 4,200 | | | | 204,162 | |
| | | | |
| | | | | | | | | | | | | | | 356,937 | |
| | | | | | | | | | | | | | | | |
|
| Singapore: 0.30% | |
DBS Group Holdings Limited (Financials, Banks) | | | | | | | | | | | 17,000 | | | | 183,288 | |
United Overseas Bank Limited (Financials, Banks) | | | | | | | | | | | 10,700 | | | | 144,436 | |
| | | | |
| | | | | | | | | | | | | | | 327,724 | |
| | | | | | | | | | | | | | | | |
|
| South Africa: 0.29% | |
Barclays Africa Group Limited (Financials, Banks) | | | | | | | | | | | 12,600 | | | | 146,112 | |
Imperial Holdings Limited (Consumer Discretionary, Distributors) | | | | | | | | | | | 5,700 | | | | 72,000 | |
Omnia Holdings Limited (Materials, Chemicals) | | | | | | | | | | | 7,600 | | | | 92,099 | |
| | | | |
| | | | | | | | | | | | | | | 310,211 | |
| | | | | | | | | | | | | | | | |
|
| South Korea: 3.06% | |
BNK Financial Group Incorporated (Financials, Banks) | | | | | | | | | | | 1,018 | | | | 8,265 | |
Hana Financial Group Incorporated (Financials, Banks) | | | | | | | | | | | 37,692 | | | | 1,080,444 | |
Industrial Bank of Korea (Financials, Banks) | | | | | | | | | | | 16,600 | | | | 191,497 | |
KT&G Corporation (Consumer Staples, Tobacco) | | | | | | | | | | | 2,300 | | | | 227,136 | |
Kwangju Bank (Financials, Banks) | | | | | | | | | | | 1,044 | | | | 9,215 | |
Orion Corporation (Consumer Staples, Food Products) | | | | | | | | | | | 3 | | | | 1,875 | |
Samsung Electronics Company Limited GDR (Information Technology, Technology Hardware, Storage & Peripherals) 144A | | | | | | | | | | | 578 | | | | 407,779 | |
SK Telecom Company Limited (Telecommunication Services, Wireless Telecommunication Services) | | | | | | | | | | | 6,237 | | | | 1,218,238 | |
Woori Bank (Financials, Banks) | | | | | | | | | | | 13,760 | | | | 150,317 | |
| | | | |
| | | | | | | | | | | | | | | 3,294,766 | |
| | | | | | | | | | | | | | | | |
|
| Spain: 1.24% | |
Banco Santander Central Hispano SA (Financials, Banks) | | | | | | | | | | | 29,500 | | | | 144,982 | |
Distribuidora Internacional SA (Consumer Staples, Food & Staples Retailing) | | | | | | | | | | | 33,900 | | | | 181,491 | |
Gas Natural SDG SA (Utilities, Gas Utilities) | | | | | | | | | | | 15,700 | | | | 309,793 | |
Grifols SA (Health Care, Biotechnology) | | | | | | | | | | | 11,464 | | | | 226,649 | |
Grifols SA ADR (Health Care, Biotechnology) | | | | | | | | | | | 26,016 | | | | 371,769 | |
International Consolidated Airlines Group SA (Industrials, Airlines) | | | | | | | | | | | 17,900 | | | | 95,175 | |
| | | | |
| | | | | | | | | | | | | | | 1,329,859 | |
| | | | | | | | | | | | | | | | |
|
| Sweden: 1.03% | |
Boliden AB (Materials, Metals & Mining) | | | | | | | | | | | 11,400 | | | | 264,170 | |
Nordea Bank AB (Financials, Banks) | | | | | | | | | | | 15,000 | | | | 157,687 | |
Swedbank AB Class A (Financials, Banks) | | | | | | | | | | | 17,288 | | | | 405,013 | |
Telefonaktiebolaget LM Ericsson Class B (Information Technology, Communications Equipment) | | | | | | | | | | | 25,000 | | | | 121,012 | |
Telia Company AB (Telecommunication Services, Diversified Telecommunication Services) | | | | | | | | | | | 40,300 | | | | 161,072 | |
| | | | |
| | | | | | | | | | | | | | | 1,108,954 | |
| | | | | | | | | | | | | | | | |
|
| Switzerland: 6.61% | |
Actelion Limited (Health Care, Biotechnology) | | | | | | | | | | | 3,028 | | | | 437,577 | |
Aryzta AG (Consumer Staples, Food Products) | | | | | | | | | | | 3,400 | | | | 149,393 | |
Baloise Holding AG (Financials, Insurance) | | | | | | | | | | | 2,000 | | | | 246,173 | |
The accompanying notes are an integral part of these financial statements.
| | | | |
| 16 | | Wells Fargo Diversified International Fund | | Portfolio of investments—October 31, 2016 |
| | | | | | | | | | | | | | | | |
| Security name | | | | | | | | Shares | | | Value | |
|
| Switzerland (continued) | |
Credit Suisse Group AG (Financials, Capital Markets) | | | | | | | | | | | 20,800 | | | $ | 290,492 | |
Georg Fischer AG (Industrials, Machinery) | | | | | | | | | | | 300 | | | | 266,030 | |
LafargeHolcim Limited (Materials, Construction Materials) | | | | | | | | | | | 1,649 | | | | 88,070 | |
Nestle SA (Consumer Staples, Food Products) | | | | | | | | | | | 23,337 | | | | 1,692,112 | |
Novartis AG (Health Care, Pharmaceuticals) | | | | | | | | | | | 13,026 | | | | 926,715 | |
Roche Holding AG (Health Care, Pharmaceuticals) | | | | | | | | | | | 1,893 | | | | 435,206 | |
Swiss Life Holding AG (Financials, Insurance) | | | | | | | | | | | 1,500 | | | | 397,150 | |
Swiss Reinsurance AG (Financials, Insurance) | | | | | | | | | | | 5,600 | | | | 520,075 | |
UBS Group AG (Financials, Capital Markets) | | | | | | | | | | | 18,822 | | | | 266,291 | |
Valiant Holding AG (Financials, Banks) | | | | | | | | | | | 1,900 | | | | 180,198 | |
Zurich Insurance Group AG (Financials, Insurance) | | | | | | | | | | | 4,645 | | | | 1,215,290 | |
| | | | |
| | | | | | | | | | | | | | | 7,110,772 | |
| | | | | | | | | | | | | | | | |
|
| Taiwan: 1.01% | |
Pegatron Corporation (Information Technology, Technology Hardware, Storage & Peripherals) | | | | | | | | | | | 83,000 | | | | 223,560 | |
Taiwan Semiconductor Manufacturing Company Limited (Information Technology, Semiconductors & Semiconductor Equipment) | | | | | | | | | | | 124,000 | | | | 740,680 | |
Zhen Ding Technology Holding (Information Technology, Electronic Equipment, Instruments & Components) | | | | | | | | | | | 55,000 | | | | 125,311 | |
| | | | |
| | | | | | | | | | | | | | | 1,089,551 | |
| | | | | | | | | | | | | | | | |
|
| Thailand: 0.30% | |
Bangchak Petroleum PCL (Energy, Oil, Gas & Consumable Fuels) | | | | | | | | | | | 135,400 | | | | 117,033 | |
Thai Beverage PCL (Consumer Staples, Beverages) | | | | | | | | | | | 80,000 | | | | 55,490 | |
Thai Oil PCL (Energy, Oil, Gas & Consumable Fuels) | | | | | | | | | | | 75,100 | | | | 150,211 | |
| | | | |
| | | | | | | | | | | | | | | 322,734 | |
| | | | | | | | | | | | | | | | |
|
| United Kingdom: 14.22% | |
3i Group plc (Financials, Capital Markets) | | | | | | | | | | | 27,100 | | | | 222,574 | |
Aon plc (Financials, Insurance) | | | | | | | | | | | 9,712 | | | | 1,076,381 | |
AstraZeneca plc (Health Care, Pharmaceuticals) | | | | | | | | | | | 2,700 | | | | 151,624 | |
Aviva plc (Financials, Insurance) | | | | | | | | | | | 22,000 | | | | 119,237 | |
Babcock International Group plc (Industrials, Commercial Services & Supplies) | | | | | | | | | | | 1,206 | | | | 14,599 | |
BAE Systems plc (Industrials, Aerospace & Defense) | | | | | | | | | | | 70,700 | | | | 469,462 | |
Barclays plc (Financials, Banks) | | | | | | | | | | | 66,900 | | | | 155,828 | |
Barratt Developments plc (Consumer Discretionary, Household Durables) | | | | | | | | | | | 23,400 | | | | 129,947 | |
Bellway plc (Consumer Discretionary, Household Durables) | | | | | | | | | | | 4,200 | | | | 121,631 | |
Berkeley Group Holdings plc (Consumer Discretionary, Household Durables) | | | | | | | | | | | 4,400 | | | | 127,046 | |
BHP Billiton plc (Materials, Metals & Mining) | | | | | | | | | | | 11,966 | | | | 180,810 | |
BHP Billiton plc ADR (Materials, Metals & Mining) | | | | | | | | | | | 527 | | | | 15,936 | |
Bovis Homes Group plc (Consumer Discretionary, Household Durables) | | | | | | | | | | | 8,600 | | | | 79,738 | |
BP plc (Energy, Oil, Gas & Consumable Fuels) | | | | | | | | | | | 91,700 | | | | 542,909 | |
British American Tobacco plc (Consumer Staples, Tobacco) | | | | | | | | | | | 9,939 | | | | 570,737 | |
BT Group plc (Telecommunication Services, Diversified Telecommunication Services) | | | | | | | | | | | 18,500 | | | | 85,130 | |
Carillion plc (Industrials, Construction & Engineering) | | | | | | | | | | | 30,400 | | | | 93,433 | |
Centrica plc (Utilities, Multi-Utilities) | | | | | | | | | | | 68,900 | | | | 180,643 | |
Coca-Cola European Partners plc (Consumer Staples, Beverages) | | | | | | | | | | | 19,177 | | | | 737,164 | |
Conva Tec Limited (Health Care, Health Care Equipment & Supplies) †144A | | | | | | | | | | | 91,891 | | | | 281,187 | |
Crest Nicholson Holdings plc (Consumer Discretionary, Household Durables) | | | | | | | | | | | 20,500 | | | | 102,099 | |
Debenhams plc (Consumer Discretionary, Multiline Retail) | | | | | | | | | | | 93,500 | | | | 61,456 | |
The accompanying notes are an integral part of these financial statements.
| | | | | | |
| Portfolio of investments—October 31, 2016 | | Wells Fargo Diversified International Fund | | | 17 | |
| | | | | | | | | | | | | | | | |
| Security name | | | | | | | | Shares | | | Value | |
| | | | |
| United Kingdom (continued) | | | | | | | | | | | | | | | | |
Delphi Automotive plc (Consumer Discretionary, Auto Components) | | | | | | | | | | | 4,979 | | | $ | 323,984 | |
easyJet plc (Industrials, Airlines) | | | | | | | | | | | 6,900 | | | | 79,135 | |
Firstgroup plc (Industrials, Road & Rail) † | | | | | | | | | | | 54,400 | | | | 72,978 | |
Galliford Try plc (Industrials, Construction & Engineering) | | | | | | | | | | | 6,500 | | | | 97,541 | |
GlaxoSmithKline plc (Health Care, Pharmaceuticals) | | | | | | | | | | | 8,800 | | | | 174,332 | |
Imperial Tobacco Group plc (Consumer Staples, Tobacco) | | | | | | | | | | | 6,931 | | | | 335,567 | |
J Sainsbury plc (Consumer Staples, Food & Staples Retailing) | | | | | | | | | | | 90,900 | | | | 279,156 | |
Kingfisher plc (Consumer Discretionary, Specialty Retail) | | | | | | | | | | | 29,100 | | | | 128,689 | |
Liberty Global plc Class A (Consumer Discretionary, Media) | | | | | | | | | | | 17,830 | | | | 581,258 | |
Liberty Global plc Class C (Consumer Discretionary, Media) | | | | | | | | | | | 27,948 | | | | 888,746 | |
Liberty Latin America and Caribbean Group Class A (Consumer Discretionary, Media) † | | | | | | | | | | | 2,356 | | | | 65,120 | |
Liberty Latin America and Caribbean Group Class C (Consumer Discretionary, Media) † | | | | | | | | | | | 3,601 | | | | 99,532 | |
Lloyds Banking Group plc (Financials, Banks) | | | | | | | | | | | 134,900 | | | | 94,546 | |
Marks & Spencer Group plc (Consumer Discretionary, Multiline Retail) | | | | | | | | | | | 33,900 | | | | 141,286 | |
Mitie Group plc (Industrials, Commercial Services & Supplies) « | | | | | | | | | | | 31,900 | | | | 82,230 | |
Mondi plc (Materials, Paper & Forest Products) | | | | | | | | | | | 4,200 | | | | 82,047 | |
Old Mutual plc (Financials, Insurance) | | | | | | | | | | | 59,600 | | | | 146,995 | |
Qinetiq Group plc (Industrials, Aerospace & Defense) | | | | | | | | | | | 47,700 | | | | 134,402 | |
Reckitt Benckiser Group plc (Consumer Staples, Household Products) | | | | | | | | | | | 4,124 | | | | 369,144 | |
Redrow plc (Consumer Discretionary, Household Durables) | | | | | | | | | | | 24,200 | | | | 112,381 | |
Royal Dutch Shell plc Class B (Energy, Oil, Gas & Consumable Fuels) | | | | | | | | | | | 13,800 | | | | 357,249 | |
Royal Mail plc (Industrials, Air Freight & Logistics) | | | | | | | | | | | 20,900 | | | | 125,606 | |
Smiths Group plc (Industrials, Industrial Conglomerates) | | | | | | | | | | | 61,544 | | | | 1,068,178 | |
St. James’s Place plc (Financials, Insurance) | | | | | | | | | | | 2,900 | | | | 33,544 | |
Tullett Prebon plc (Financials, Capital Markets) | | | | | | | | | | | 20,600 | | | | 89,511 | |
Unilever plc (Consumer Staples, Personal Products) | | | | | | | | | | | 17,720 | | | | 741,340 | |
United Business Media plc (Consumer Discretionary, Media) | | | | | | | | | | | 62,639 | | | | 550,875 | |
Vodafone Group plc (Telecommunication Services, Wireless Telecommunication Services) | | | | | | | | | | | 399,658 | | | | 1,099,680 | |
William Morrison Supermarkets plc (Consumer Staples, Food & Staples Retailing) | | | | | | | | | | | 34,200 | | | | 94,815 | |
Wolseley plc (Industrials, Trading Companies & Distributors) | | | | | | | | | | | 25,632 | | | | 1,333,691 | |
| | | | |
| | | | | | | | | | | | | | | 15,303,129 | |
| | | | | | | | | | | | | | | | |
| | | | |
| United States: 3.08% | | | | | | | | | | | | | | | | |
Amazon.com Incorporated (Consumer Discretionary, Internet & Direct Marketing Retail) † | | | | | | | | | | | 563 | | | | 444,669 | |
Apple Incorporated (Information Technology, Technology Hardware, Storage & Peripherals) | | | | | | | | | | | 5,011 | | | | 568,949 | |
Coach Incorporated (Consumer Discretionary, Textiles, Apparel & Luxury Goods) | | | | | | | | | | | 20,243 | | | | 726,521 | |
Pfizer Incorporated (Health Care, Pharmaceuticals) | | | | | | | | | | | 25,399 | | | | 805,402 | |
WABCO Holdings Incorporated (Industrials, Machinery) † | | | | | | | | | | | 3,212 | | | | 316,254 | |
Willis Towers Watson plc (Financials, Insurance) | | | | | | | | | | | 3,626 | | | | 456,513 | |
| | | | |
| | | | | | | | | | | | | | | 3,318,308 | |
| | | | | | | | | | | | | | | | |
| | | | |
Total Common Stocks (Cost $97,593,519) | | | | | | | | | | | | | | | 98,797,611 | |
| | | | | | | | | | | | | | | | |
| | | | |
Exchange-Traded Funds: 0.51% | | | | | | | | | | | | | | | | |
| | | | |
| United States: 0.51% | | | | | | | | | | | | | | | | |
iShares MSCI ACWI ex US ETF | | | | | | | | | | | 13,300 | | | | 541,975 | |
| | | | | | | | | | | | | | | | |
| | | | |
Total Exchange-Traded Funds (Cost $542,282) | | | | | | | | | | | | | | | 541,975 | |
| | | | | | | | | | | | | | | | |
The accompanying notes are an integral part of these financial statements.
| | | | |
| 18 | | Wells Fargo Diversified International Fund | | Portfolio of investments—October 31, 2016 |
| | | | | | | | | | | | | | | | |
| Security name | | | | | Expiration date | | | Shares | | | Value | |
| | | | |
Participation Notes: 1.15% | | | | | | | | | | | | | | | | |
| | | | |
| China: 0.53% | | | | | | | | | | | | | | | | |
HSBC Bank plc (Kweichow Moutai Company Limited Class A) (Consumer Staples, Beverages) † | | | | | | | 2-19-2019 | | | | 12,090 | | | $ | 568,145 | |
| | | | | | | | | | | | | | | | |
| | | | |
| Ireland: 0.62% | | | | | | | | | | | | | | | | |
HSBC Bank plc (Ryanair Holdings plc) (Industrials, Airlines) | | | | | | | 10-29-2018 | | | | 48,787 | | | | 672,816 | |
| | | | | | | | | | | | | | | | |
| | | | |
Total Participation Notes (Cost $957,954) | | | | | | | | | | | | | | | 1,240,961 | |
| | | | | | | | | | | | | | | | |
| | | | |
| | | Dividend yield | | | | | | | | | | |
| Preferred Stocks: 0.63% | | | | | | | | | | | | | | | | |
| | | | |
| Brazil: 0.04% | | | | | | | | | | | | | | | | |
Companhia Energetica de Minas Gerais SA (Utilities, Electric Utilities) ± | | | 3.23 | % | | | | | | | 13,600 | | | | 41,541 | |
| | | | | | | | | | | | | | | | |
| | | | |
| Germany: 0.59% | | | | | | | | | | | | | | | | |
Henkel AG & Company KGaA (Consumer Staples, Household Products) ± | | | 1.30 | | | | | | | | 4,924 | | | | 631,882 | |
| | | | | | | | | | | | | | | | |
| | | | |
Total Preferred Stocks (Cost $560,256) | | | | | | | | | | | | | | | 673,423 | |
| | | | | | | | | | | | | | | | |
| | | | |
Rights: 0.00% | | | | | | | | | | | | | | | | |
| | | | |
| Spain: 0.00% | | | | | | | | | | | | | | | | |
Banco Santander SA (Financials, Banks) † | | | | | | | 1-27-2017 | | | | 29,500 | | | | 1,652 | |
| | | | | | | | | | | | | | | | |
| | | | |
Total Rights (Cost $1,461) | | | | | | | | | | | | | | | 1,652 | |
| | | | | | | | | | | | | | | | |
| | | | |
| | | Yield | | | | | | | | | | |
| Short-Term Investments: 5.93% | | | | | | | | | | | | | | | | |
| | | | |
| Investment Companies: 5.93% | | | | | | | | | | | | | | | | |
Securities Lending Cash Investment LLC (l)(r)(u) | | | 0.69 | | | | | | | | 1,251,365 | | | | 1,251,490 | |
Wells Fargo Government Money Market Fund Select
Class (l)(u) | | | 0.32 | | | | | | | | 5,132,495 | | | | 5,132,495 | |
| | | | |
Total Short-Term Investments (Cost $6,383,931) | | | | | | | | | | | | | | | 6,383,985 | |
| | | | | | | | | | | | | | | | |
| | | | | | | | |
| Total investments in securities (Cost $106,039,403) * | | | 100.04 | % | | | 107,639,607 | |
Other assets and liabilities, net | | | (0.04 | ) | | | (38,140 | ) |
| | | | | | | | |
| Total net assets | | | 100.00 | % | | $ | 107,601,467 | |
| | | | | | | | |
| † | Non-income-earning security |
| (a) | The security is fair valued in accordance with procedures approved by the Board of Trustees. |
| « | All or a portion of this security is on loan. |
| 144A | The security may be resold in transactions exempt from registration, normally to qualified institutional buyers, pursuant to Rule 144A under the Securities Act of 1933. |
| ± | Variable rate investment. The rate shown is the rate in effect at period end. |
| (l) | The issuer of the security is an affiliated person of the Fund as defined in the Investment Company Act of 1940. |
| (r) | The investment is a non-registered investment vehicle purchased with cash collateral received from securities on loan. |
| (u) | The rate represents the 7-day annualized yield at period end. |
| * | Cost for federal income tax purposes is $107,016,742 and unrealized gains (losses) consists of: |
| | | | |
Gross unrealized gains | | $ | 9,751,435 | |
Gross unrealized losses | | | (9,128,570 | ) |
| | | | |
Net unrealized gains | | $ | 622,865 | |
The accompanying notes are an integral part of these financial statements.
| | | | | | |
| Statement of assets and liabilities—October 31, 2016 | | Wells Fargo Diversified International Fund | | | 19 | |
| | | | |
| | | | |
| |
Assets | | | | |
Investments | | | | |
In unaffiliated securities (including $1,188,558 of securities loaned), at value (cost $99,655,472) | | $ | 101,255,622 | |
In affiliated securities, at value (cost $6,383,931) | | | 6,383,985 | |
| | | | |
Total investments, at value (cost $106,039,403) | | | 107,639,607 | |
Foreign currency, at value (cost $811,352) | | | 786,251 | |
Receivable for investments sold | | | 1,074,691 | |
Receivable for Fund shares sold | | | 73,092 | |
Receivable for dividends | | | 402,969 | |
Receivable for securities lending income | | | 3,599 | |
Unrealized gains on forward foreign currency contracts | | | 117,922 | |
Prepaid expenses and other assets | | | 56,971 | |
| | | | |
Total assets | | | 110,155,102 | |
| | | | |
| |
Liabilities | | | | |
Payable for investments purchased | | | 1,013,952 | |
Payable for Fund shares redeemed | | | 78,142 | |
Payable upon receipt of securities loaned | | | 1,251,423 | |
Due to custodian bank | | | 43,018 | |
Management fee payable | | | 34,736 | |
Distribution fees payable | | | 2,906 | |
Administration fees payable | | | 16,067 | |
Accrued expenses and other liabilities | | | 113,391 | |
| | | | |
Total liabilities | | | 2,553,635 | |
| | | | |
Total net assets | | $ | 107,601,467 | |
| | | | |
| |
NET ASSETS CONSIST OF | | | | |
Paid-in capital | | $ | 208,519,009 | |
Undistributed net investment income | | | 2,027,832 | |
Accumulated net realized losses on investments | | | (104,625,041 | ) |
Net unrealized gains on investments | | | 1,679,667 | |
| | | | |
Total net assets | | $ | 107,601,467 | |
| | | | |
| |
COMPUTATION OF NET ASSET VALUE AND OFFERING PRICE PER SHARE | | | | |
Net assets – Class A | | $ | 61,031,144 | |
Shares outstanding – Class A1 | | | 5,510,248 | |
Net asset value per share – Class A | | | $11.08 | |
Maximum offering price per share – Class A2 | | | $11.76 | |
Net assets – Class B | | $ | 9,409 | |
Shares outstanding – Class B1 | | | 870 | |
Net asset value per share – Class B | | | $10.81 | |
Net assets – Class C | | $ | 4,350,630 | |
Shares outstanding – Class C1 | | | 428,057 | |
Net asset value per share – Class C | | | $10.16 | |
Net assets – Class R | | $ | 25,521 | |
Shares outstanding – Class R1 | | | 2,269 | |
Net asset value per share – Class R | | | $11.25 | |
Net assets – Class R6 | | $ | 5,523,159 | |
Shares outstanding – Class R61 | | | 487,311 | |
Net asset value per share – Class R6 | | | $11.33 | |
Net assets – Administrator Class | | $ | 12,333,612 | |
Shares outstanding – Administrator Class1 | | | 1,093,423 | |
Net asset value per share – Administrator Class | | | $11.28 | |
Net assets – Institutional Class | | $ | 24,327,992 | |
Shares outstanding – Institutional Class1 | | | 2,292,868 | |
Net asset value per share – Institutional Class | | | $10.61 | |
| 1 | The Fund has an unlimited number of authorized shares. |
| 2 | Maximum offering price is computed as 100/94.25 of net asset value. On investments of $50,000 or more, the offering price is reduced. |
The accompanying notes are an integral part of these financial statements.
| | | | |
| 20 | | Wells Fargo Diversified International Fund | | Statement of operations—year ended October 31, 2016 |
| | | | |
| | | | |
| |
Investment income | | | | |
Dividends (net of foreign withholding taxes of $279,088) | | $ | 3,181,332 | |
Securities lending income, net | | | 86,060 | |
Income from affiliated securities | | | 15,491 | |
| | | | |
Total investment income | | | 3,282,883 | |
| | | | |
| |
Expenses | | | | |
Management fee | | | 964,927 | |
Administration fees | | | | |
Class A | | | 138,194 | |
Class B | | | 29 | |
Class C | | | 9,148 | |
Class R | | | 53 | |
Class R6 | | | 1,450 | |
Administrator Class | | | 15,923 | |
Institutional Class | | | 25,910 | |
Shareholder servicing fees | | | | |
Class A | | | 164,161 | |
Class B | | | 35 | |
Class C | | | 10,891 | |
Class R | | | 63 | |
Administrator Class | | | 30,622 | |
Distribution fees | | | | |
Class B | | | 104 | |
Class C | | | 32,673 | |
Class R | | | 63 | |
Custody and accounting fees | | | 177,781 | |
Professional fees | | | 50,195 | |
Registration fees | | | 103,931 | |
Shareholder report expenses | | | 59,456 | |
Trustees’ fees and expenses | | | 18,027 | |
Other fees and expenses | | | 50,531 | |
| | | | |
Total expenses | | | 1,854,167 | |
Less: Fee waivers and/or expense reimbursements | | | (480,828 | ) |
| | | | |
Net expenses | | | 1,373,339 | |
| | | | |
Net investment income | | | 1,909,544 | |
| | | | |
| |
REALIZED AND UNREALIZED GAINS (LOSSES) ON INVESTMENTS | | | | |
| |
Net realized gains (losses) on: | | | | |
Unaffiliated securities | | | (2,372,926 | ) |
Forward foreign currency contract transactions | | | 269,813 | |
| | | | |
Net realized losses on investments | | | (2,103,113 | ) |
| | | | |
| |
Net change in unrealized gains (losses) on: | | | | |
Unaffiliated securities | | | (4,103,959 | ) |
Affiiliated securities | | | 54 | |
Forward foreign currency contract transactions | | | (5,369 | ) |
| | | | |
Net change in unrealized gains (losses) on investments | | | (4,109,274 | ) |
| | | | |
Net realized and unrealized gains (losses) on investments | | | (6,212,387 | ) |
| | | | |
Net decrease in net assets resulting from operations | | $ | (4,302,843 | ) |
| | | | |
The accompanying notes are an integral part of these financial statements.
| | | | | | |
| Statement of changes in net assets | | Wells Fargo Diversified International Fund | | | 21 | |
| | | | | | | | | | | | | | | | |
| | | Year ended October 31, 2016 | | | Year ended October 31, 2015 | |
| | | | |
Operations | | | | | | | | | | | | | | | | |
Net investment income | | | | | | $ | 1,909,544 | | | | | | | $ | 992,143 | |
Net realized gains (losses) on investments | | | | | | | (2,103,113 | ) | | | | | | | 2,645,943 | |
Net change in unrealized gains (losses) on investments | | | | | | | (4,109,274 | ) | | | | | | | (4,768,915 | ) |
| | | | |
Net decrease in net assets resulting from operations | | | | | | | (4,302,843 | ) | | | | | | | (1,130,829 | ) |
| | | | |
| | | | |
Distributions to shareholders from | | | | | | | | | | | | | | | | |
Net investment income | | | | | | | | | | | | | | | | |
Class A | | | | | | | (692,930 | ) | | | | | | | (567,395 | ) |
Class C | | | | | | | (30,743 | ) | | | | | | | (25,962 | ) |
Class R | | | | | | | (268 | ) | | | | | | | 0 | 1 |
Class R6 | | | | | | | (54,538 | ) | | | | | | | 0 | 1 |
Administrator Class | | | | | | | (136,524 | ) | | | | | | | (172,327 | ) |
Institutional Class | | | | | | | (249,898 | ) | | | | | | | (79,049 | ) |
Investor Class | | | | | | | N/A | | | | | | | | (1,116,769 | )2 |
| | | | |
Total distributions to shareholders | | | | | | | (1,164,901 | ) | | | | | | | (1,961,502 | ) |
| | | | |
| | | | |
Capital share transactions | | | Shares | | | | | | | | Shares | | | | | |
Proceeds from shares sold | | | | | | | | | | | | | | | | |
Class A | | | 322,484 | | | | 3,510,932 | | | | 4,606,846 | | | | 54,061,650 | |
Class B | | | 0 | | | | 0 | | | | 4,423 | | | | 54,704 | |
Class C | | | 281,595 | | | | 2,860,258 | | | | 226,478 | | | | 2,559,311 | |
Class R | | | 0 | | | | 0 | | | | 2,246 | 1 | | | 25,000 | 1 |
Class R6 | | | 517,935 | | | | 6,092,247 | | | | 2,246 | 1 | | | 25,000 | 1 |
Administrator Class | | | 459,760 | | | | 5,176,981 | | | | 459,323 | | | | 5,711,707 | |
Institutional Class | | | 1,803,946 | | | | 19,585,715 | | | | 523,640 | | | | 5,896,811 | |
Investor Class | | | N/A | | | | N/A | | | | 772,749 | 2 | | | 9,262,576 | 2 |
| | | | |
| | | | | | | 37,226,133 | | | | | | | | 77,596,759 | |
| | | | |
Reinvestment of distributions | | | | | | | | | | | | | | | | |
Class A | | | 60,092 | | | | 682,650 | | | | 45,755 | | | | 531,212 | |
Class C | | | 2,596 | | | | 27,233 | | | | 2,080 | | | | 22,425 | |
Class R | | | 23 | | | | 268 | | | | 0 | 1 | | | 0 | 1 |
Class R6 | | | 4,710 | | | | 54,538 | | | | 0 | 1 | | | 0 | 1 |
Administrator Class | | | 11,807 | | | | 136,486 | | | | 14,509 | | | | 171,495 | |
Institutional Class | | | 21,007 | | | | 227,935 | | | | 5,648 | | | | 62,524 | |
Investor Class | | | N/A | | | | N/A | | | | 94,956 | 2 | | | 1,098,641 | 2 |
| | | | |
| | | | | | | 1,129,110 | | | | | | | | 1,886,297 | |
| | | | |
Payment for shares redeemed | | | | | | | | | | | | | | | | |
Class A | | | (1,217,038 | ) | | | (13,371,782 | ) | | | (383,282 | ) | | | (4,674,632 | ) |
Class B | | | (3,553 | ) | | | (39,685 | ) | | | (3,247 | ) | | | (36,560 | ) |
Class C | | | (188,833 | ) | | | (1,877,720 | ) | | | (41,808 | ) | | | (464,550 | ) |
Class R6 | | | (37,580 | ) | | | (419,983 | ) | | | 0 | 1 | | | 0 | 1 |
Administrator Class | | | (266,367 | ) | | | (2,965,371 | ) | | | (180,963 | ) | | | (2,216,207 | ) |
Institutional Class | | | (169,927 | ) | | | (1,825,525 | ) | | | (124,691 | ) | | | (1,439,122 | ) |
Investor Class | | | N/A | | | | N/A | | | | (4,980,967 | )2 | | | (58,064,112 | )2 |
| | | | |
| | | | | | | (20,500,066 | ) | | | | | | | (66,895,183 | ) |
| | | | |
Net increase in net assets resulting from capital share transactions | | | | | | | 17,855,177 | | | | | | | | 12,587,873 | |
| | | | |
Total increase in net assets | | | | | | | 12,387,433 | | | | | | | | 9,495,542 | |
| | | | |
| | | | |
Net assets | | | | | | | | | | | | | | | | |
Beginning of period | | | | | | | 95,214,034 | | | | | | | | 85,718,492 | |
| | | | |
End of period | | | | | | $ | 107,601,467 | | | | | | | $ | 95,214,034 | |
| | | | |
Undistributed net investment income | | | | | | $ | 2,027,832 | | | | | | | $ | 1,033,199 | |
| | | | |
| 1 | For the period from September 30, 2015 (commencement of class operations) to October 31, 2015 |
| 2 | For the period from November 1, 2014 to October 23, 2015. Effective at the close of business on October 23, 2015, Investor Class shares were converted to Class A shares and are no longer offered by the Fund. |
The accompanying notes are an integral part of these financial statements.
| | | | |
| 22 | | Wells Fargo Diversified International Fund | | Financial highlights |
(For a share outstanding throughout each period)
| | | | | | | | | | | | | | | | | | | | |
| | | Year ended October 31 | |
| CLASS A | | 2016 | | | 2015 | | | 2014 | | | 2013 | | | 2012 | |
Net asset value, beginning of period | | | $11.65 | | | | $12.01 | | | | $12.25 | | | | $10.25 | | | | $9.69 | |
Net investment income | | | 0.17 | | | | 0.13 | 1 | | | 0.24 | 1 | | | 0.19 | 1 | | | 0.19 | 1 |
Net realized and unrealized gains (losses) on investments | | | (0.63 | ) | | | (0.21 | ) | | | (0.29 | ) | | | 2.41 | | | | 0.51 | |
| | | | | | | | | | | | | | | | | | | | |
Total from investment operations | | | (0.46 | ) | | | (0.08 | ) | | | (0.05 | ) | | | 2.60 | | | | 0.70 | |
Distributions to shareholders from | | | | | | | | | | | | | | | | | | | | |
Net investment income | | | (0.11 | ) | | | (0.28 | ) | | | (0.19 | ) | | | (0.60 | ) | | | (0.14 | ) |
Net asset value, end of period | | | $11.08 | | | | $11.65 | | | | $12.01 | | | | $12.25 | | | | $10.25 | |
Total return2 | | | (3.96 | )% | | | (0.66 | )% | | | (0.49 | )% | | | 26.59 | % | | | 7.45 | % |
Ratios to average net assets (annualized) | | | | | | | | | | | | | | | | | | | | |
Gross expenses | | | 1.79 | % | | | 1.85 | % | | | 1.76 | % | | | 1.92 | % | | | 1.68 | % |
Net expenses | | | 1.35 | % | | | 1.40 | % | | | 1.41 | % | | | 1.41 | % | | | 1.41 | % |
Net investment income | | | 1.67 | % | | | 1.07 | % | | | 1.93 | % | | | 1.75 | % | | | 1.96 | % |
Supplemental data | | | | | | | | | | | | | | | | | | | | |
Portfolio turnover rate | | | 50 | % | | | 31 | % | | | 33 | % | | | 40 | % | | | 57 | % |
Net assets, end of period (000s omitted) | | | $61,031 | | | | $73,891 | | | | $24,921 | | | | $28,928 | | | | $22,434 | |
| 1 | Calculated based upon average shares outstanding |
| 2 | Total return calculations do not include any sales charges. |
The accompanying notes are an integral part of these financial statements.
| | | | | | |
| Financial highlights | | Wells Fargo Diversified International Fund | | | 23 | |
(For a share outstanding throughout each period)
| | | | | | | | | | | | | | | | | | | | |
| | | Year ended October 31 | |
| CLASS B | | 2016 | | | 2015 | | | 2014 | | | 2013 | | | 2012 | |
Net asset value, beginning of period | | | $11.34 | | | | $11.50 | | | | $11.71 | | | | $9.80 | | | | $9.19 | |
Net investment income | | | 0.09 | 1 | | | 0.03 | 1 | | | 0.13 | 1 | | | 0.09 | 1 | | | 0.10 | 1 |
Net realized and unrealized gains (losses) on investments | | | (0.62 | ) | | | (0.19 | ) | | | (0.27 | ) | | | 2.32 | | | | 0.51 | |
| | | | | | | | | | | | | | | | | | | | |
Total from investment operations | | | (0.53 | ) | | | (0.16 | ) | | | (0.14 | ) | | | 2.41 | | | | 0.61 | |
Distributions to shareholders from | | | | | | | | | | | | | | | | | | | | |
Net investment income | | | 0.00 | | | | 0.00 | | | | (0.07 | ) | | | (0.50 | ) | | | (0.00 | )2 |
Net asset value, end of period | | | $10.81 | | | | $11.34 | | | | $11.50 | | | | $11.71 | | | | $9.80 | |
Total return3 | | | (4.67 | )% | | | (1.39 | )% | | | (1.25 | )% | | | 25.70 | % | | | 6.69 | % |
Ratios to average net assets (annualized) | | | | | | | | | | | | | | | | | | | | |
Gross expenses | | | 2.52 | % | | | 2.59 | % | | | 2.52 | % | | | 2.68 | % | | | 2.35 | % |
Net expenses | | | 2.08 | % | | | 2.15 | % | | | 2.16 | % | | | 2.16 | % | | | 2.12 | % |
Net investment income | | | 0.84 | % | | | 0.29 | % | | | 1.10 | % | | | 0.88 | % | | | 1.11 | % |
Supplemental data | | | | | | | | | | | | | | | | | | | | |
Portfolio turnover rate | | | 50 | % | | | 31 | % | | | 33 | % | | | 40 | % | | | 57 | % |
Net assets, end of period (000s omitted) | | | $9 | | | | $50 | | | | $37 | | | | $174 | | | | $299 | |
| 1 | Calculated based upon average shares outstanding |
| 2 | Amount is less than $0.005. |
| 3 | Total return calculations do not include any sales charges. |
The accompanying notes are an integral part of these financial statements.
| | | | |
| 24 | | Wells Fargo Diversified International Fund | | Financial highlights |
(For a share outstanding throughout each period)
| | | | | | | | | | | | | | | | | | | | |
| | | Year ended October 31 | |
| CLASS C | | 2016 | | | 2015 | | | 2014 | | | 2013 | | | 2012 | |
Net asset value, beginning of period | | | $10.74 | | | | $11.08 | | | | $11.35 | | | | $9.54 | | | | $9.01 | |
Net investment income | | | 0.10 | 1 | | | 0.04 | 1 | | | 0.13 | 1 | | | 0.09 | 1 | | | 0.11 | 1 |
Net realized and unrealized gains (losses) on investments | | | (0.60 | ) | | | (0.20 | ) | | | (0.27 | ) | | | 2.25 | | | | 0.48 | |
| | | | | | | | | | | | | | | | | | | | |
Total from investment operations | | | (0.50 | ) | | | (0.16 | ) | | | (0.14 | ) | | | 2.34 | | | | 0.59 | |
Distributions to shareholders from | | | | | | | | | | | | | | | | | | | | |
Net investment income | | | (0.08 | ) | | | (0.18 | ) | | | (0.13 | ) | | | (0.53 | ) | | | (0.06 | ) |
Net asset value, end of period | | | $10.16 | | | | $10.74 | | | | $11.08 | | | | $11.35 | | | | $9.54 | |
Total return2 | | | (4.72 | )% | | | (1.44 | )% | | | (1.24 | )% | | | 25.67 | % | | | 6.67 | % |
Ratios to average net assets (annualized) | | | | | | | | | | | | | | | | | | | | |
Gross expenses | | | 2.54 | % | | | 2.60 | % | | | 2.51 | % | | | 2.66 | % | | | 2.43 | % |
Net expenses | | | 2.10 | % | | | 2.15 | % | | | 2.16 | % | | | 2.16 | % | | | 2.16 | % |
Net investment income | | | 1.01 | % | | | 0.33 | % | | | 1.15 | % | | | 0.84 | % | | | 1.21 | % |
Supplemental data | | | | | | | | | | | | | | | | | | | | |
Portfolio turnover rate | | | 50 | % | | | 31 | % | | | 33 | % | | | 40 | % | | | 57 | % |
Net assets, end of period (000s omitted) | | | $4,351 | | | | $3,573 | | | | $1,616 | | | | $1,746 | | | | $628 | |
| 1 | Calculated based upon average shares outstanding |
| 2 | Total return calculations do not include any sales charges. |
The accompanying notes are an integral part of these financial statements.
| | | | | | |
| Financial highlights | | Wells Fargo Diversified International Fund | | | 25 | |
(For a share outstanding throughout each period)
| | | | | | | | |
| | | Year ended October 31 | |
| CLASS R | | 2016 | | | 20151 | |
Net asset value, beginning of period | | | $11.86 | | | | $11.13 | |
Net investment income (loss)1 | | | 0.16 | 2 | | | (0.01 | ) |
Net realized and unrealized gains (losses) on investments | | | (0.65 | ) | | | 0.74 | |
| | | | | | | | |
Total from investment operations | | | (0.49 | ) | | | 0.73 | |
Distributions to shareholders from | | | | | | | | |
Net investment income | | | (0.12 | ) | | | 0.00 | |
Net asset value, end of period | | | $11.25 | | | | $11.86 | |
Total return3 | | | (4.16 | )% | | | 6.56 | % |
Ratios to average net assets (annualized) | | | | | | | | |
Gross expenses | | | 2.04 | % | | | 2.15 | % |
Net expenses | | | 1.60 | % | | | 1.60 | % |
Net investment income (loss) | | | 1.42 | % | | | (0.65 | )% |
Supplemental data | | | | | | | | |
Portfolio turnover rate | | | 50 | % | | | 31 | % |
Net assets, end of period (000s omitted) | | | $26 | | | | $27 | |
| 1 | For the period from September 30, 2015 (commencement of class operations) to October 31, 2015 |
| 2 | Calculated based upon average shares outstanding |
| 3 | Returns for periods of less than one year are not annualized. |
The accompanying notes are an integral part of these financial statements.
| | | | |
| 26 | | Wells Fargo Diversified International Fund | | Financial highlights |
(For a share outstanding throughout each period)
| | | | | | | | |
| | | Year ended October 31 | |
| CLASS R6 | | 2016 | | | 20151 | |
Net asset value, beginning of period | | | $11.87 | | | | $11.13 | |
Net investment income | | | 0.26 | 2 | | | 0.00 | 3 |
Net realized and unrealized gains (losses) on investments | | | (0.68 | ) | | | 0.74 | |
| | | | | | | | |
Total from investment operations | | | (0.42 | ) | | | 0.74 | |
Distributions to shareholders from | | | | | | | | |
Net investment income | | | (0.12 | ) | | | 0.00 | |
Net asset value, end of period | | | $11.33 | | | | $11.87 | |
Total return4 | | | (3.55 | )% | | | 6.65 | % |
Ratios to average net assets (annualized) | | | | | | | | |
Gross expenses | | | 1.36 | % | | | 1.46 | % |
Net expenses | | | 0.89 | % | | | 0.89 | % |
Net investment income | | | 2.30 | % | | | 0.05 | % |
Supplemental data | | | | | | | | |
Portfolio turnover rate | | | 50 | % | | | 31 | % |
Net assets, end of period (000s omitted) | | | $5,523 | | | | $27 | |
| 1 | For the period from September 30, 2015 (commencement of class operations) to October 31, 2015 |
| 2 | Calculated based upon average shares outstanding |
| 3 | Amount is less than $0.005 per share. |
| 4 | Returns for periods of less than one year are not annualized. |
The accompanying notes are an integral part of these financial statements.
| | | | | | |
| Financial highlights | | Wells Fargo Diversified International Fund | | | 27 | |
(For a share outstanding throughout each period)
| | | | | | | | | | | | | | | | | | | | |
| | | Year ended October 31 | |
| ADMINISTRATOR CLASS | | 2016 | | | 2015 | | | 2014 | | | 2013 | | | 2012 | |
Net asset value, beginning of period | | | $11.87 | | | | $12.23 | | | | $12.47 | | | | $10.42 | | | | $9.68 | |
Net investment income | | | 0.20 | 1 | | | 0.16 | 1 | | | 0.26 | 1 | | | 0.19 | 1 | | | 0.21 | 1 |
Net realized and unrealized gains (losses) on investments | | | (0.66 | ) | | | (0.22 | ) | | | (0.30 | ) | | | 2.47 | | | | 0.53 | |
| | | | | | | | | | | | | | | | | | | | |
Total from investment operations | | | (0.46 | ) | | | (0.06 | ) | | | (0.04 | ) | | | 2.66 | | | | 0.74 | |
Distributions to shareholders from | | | | | | | | | | | | | | | | | | | | |
Net investment income | | | (0.13 | ) | | | (0.30 | ) | | | (0.20 | ) | | | (0.61 | ) | | | 0.00 | |
Net asset value, end of period | | | $11.28 | | | | $11.87 | | | | $12.23 | | | | $12.47 | | | | $10.42 | |
Total return | | | (3.90 | )% | | | (0.46 | )% | | | (0.39 | )% | | | 26.85 | % | | | 7.64 | % |
Ratios to average net assets (annualized) | | | | | | | | | | | | | | | | | | | | |
Gross expenses | | | 1.71 | % | | | 1.72 | % | | | 1.60 | % | | | 1.74 | % | | | 1.52 | % |
Net expenses | | | 1.25 | % | | | 1.25 | % | | | 1.25 | % | | | 1.25 | % | | | 1.25 | % |
Net investment income | | | 1.83 | % | | | 1.31 | % | | | 2.10 | % | | | 1.72 | % | | | 2.11 | % |
Supplemental data | | | | | | | | | | | | | | | | | | | | |
Portfolio turnover rate | | | 50 | % | | | 31 | % | | | 33 | % | | | 40 | % | | | 57 | % |
Net assets, end of period (000s omitted) | | | $12,334 | | | | $10,540 | | | | $7,283 | | | | $8,195 | | | | $3,504 | |
| 1 | Calculated based upon average shares outstanding |
The accompanying notes are an integral part of these financial statements.
| | | | |
| 28 | | Wells Fargo Diversified International Fund | | Financial highlights |
(For a share outstanding throughout each period)
| | | | | | | | | | | | | | | | | | | | |
| | | Year ended October 31 | |
| INSTITUTIONAL CLASS | | 2016 | | | 2015 | | | 2014 | | | 2013 | | | 2012 | |
Net asset value, beginning of period | | | $11.14 | | | | $11.50 | | | | $11.79 | | | | $10.20 | | | | $9.69 | |
Net investment income | | | 0.23 | 1 | | | 0.17 | 1 | | | 0.26 | 1 | | | 0.20 | 1 | | | 0.19 | 1 |
Net realized and unrealized gains (losses) on investments | | | (0.63 | ) | | | (0.20 | ) | | | (0.27 | ) | | | 2.37 | | | | 0.51 | |
| | | | | | | | | | | | | | | | | | | | |
Total from investment operations | | | (0.40 | ) | | | (0.03 | ) | | | (0.01 | ) | | | 2.57 | | | | 0.70 | |
Distributions to shareholders from | | | | | | | | | | | | | | | | | | | | |
Net investment income | | | (0.13 | ) | | | (0.33 | ) | | | (0.28 | ) | | | (0.98 | ) | | | (0.19 | ) |
Net asset value, end of period | | | $10.61 | | | | $11.14 | | | | $11.50 | | | | $11.79 | | | | $10.20 | |
Total return | | | (3.63 | )% | | | (0.23 | )% | | | (0.18 | )% | | | 27.28 | % | | | 7.51 | % |
Ratios to average net assets (annualized) | | | | | | | | | | | | | | | | | | | | |
Gross expenses | | | 1.46 | % | | | 1.47 | % | | | 1.33 | % | | | 1.50 | % | | | 1.20 | % |
Net expenses | | | 0.99 | % | | | 0.99 | % | | | 0.99 | % | | | 0.99 | % | | | 0.99 | % |
Net investment income | | | 2.16 | % | | | 1.45 | % | | | 2.23 | % | | | 1.94 | % | | | 1.96 | % |
Supplemental data | | | | | | | | | | | | | | | | | | | | |
Portfolio turnover rate | | | 50 | % | | | 31 | % | | | 33 | % | | | 40 | % | | | 57 | % |
Net assets, end of period (000s omitted) | | | $24,328 | | | | $7,106 | | | | $2,683 | | | | $2,406 | | | | $7,367 | |
| 1 | Calculated based upon average shares outstanding |
The accompanying notes are an integral part of these financial statements.
| | | | | | |
| Notes to financial statements | | Wells Fargo Diversified International Fund | | | 29 | |
1. ORGANIZATION
Wells Fargo Funds Trust (the “Trust”), a Delaware statutory trust organized on March 10, 1999, is an open-end management investment company registered under the Investment Company Act of 1940, as amended (the “1940 Act”). As an investment company, the Trust follows the accounting and reporting guidance in Financial Accounting Standards Board (“FASB”) Accounting Standards Codification Topic 946, Financial Services – Investment Companies. These financial statements report on the Wells Fargo Diversified International Fund (the “Fund”) which is a diversified series of the Trust.
Effective at the close of business on October 23, 2015, Investor Class shares became Class A shares in a tax-free conversion. Shareholders of Investor Class received Class A shares at a value equal to the value of their Investor Class shares immediately prior to the conversion. Investor Class shares are no longer offered by the Fund.
2. SIGNIFICANT ACCOUNTING POLICIES
The following significant accounting policies, which are consistently followed in the preparation of the financial statements of the Fund, are in conformity with U.S. generally accepted accounting principles which require management to make estimates and assumptions that affect the reported amounts of assets and liabilities, disclosure of contingent assets and liabilities at the date of the financial statements, and the reported amounts of revenues and expenses during the reporting period. Actual results could differ from those estimates.
Securities valuation
All investments are valued each business day as of the close of regular trading on the New York Stock Exchange (generally 4 p.m. Eastern Time), although the Fund may deviate from this calculation time under unusual or unexpected circumstances.
Equity securities that are listed on a foreign or domestic exchange or market are valued at the official closing price or, if none, the last sales price. If no sale occurs on the principal exchange or market that day, the prior day’s price will be deemed “stale” and a fair value price will be determined in accordance with the Fund’s Valuation Procedures.
The values of securities denominated in foreign currencies are translated into U.S. dollars at rates provided by an independent foreign currency pricing source at a time each business day specified by the Management Valuation Team of Wells Fargo Funds Management, LLC (“Funds Management”).
Many securities markets and exchanges outside the U.S. close prior to the close of the New York Stock Exchange and therefore may not fully reflect trading or events that occur after the close of the principal exchange in which the foreign securities are traded, but before the close of the New York Stock Exchange. If such trading or events are expected to materially affect the value of such securities, then fair value pricing procedures approved by the Board of Trustees of the Fund are applied. These procedures take into account multiple factors including movements in U.S. securities markets after foreign exchanges close. Foreign securities that are fair valued under these procedures are categorized as Level 2 and the application of these procedures may result in transfers between Level 1 and Level 2. Depending on market activity, such fair valuations may be frequent. Such fair value pricing may result in net asset values that are higher or lower than net asset values based on the last reported sales price or latest quoted bid price. On October 31, 2016, such fair value pricing was not used in pricing foreign securities.
Investments in registered open-end investment companies are valued at net asset value. Interests in non-registered investment vehicles that are redeemable at net asset value are fair valued normally at net asset value.
Investments which are not valued using any of the methods discussed above are valued at their fair value, as determined in good faith by the Board of Trustees. The Board of Trustees has established a Valuation Committee comprised of the Trustees and has delegated to it the authority to take any actions regarding the valuation of portfolio securities that the Valuation Committee deems necessary or appropriate, including determining the fair value of portfolio securities, unless the determination has been delegated to the Management Valuation Team. The Board of Trustees retains the authority to make or ratify any valuation decisions or approve any changes to the Valuation Procedures as it deems appropriate. On a quarterly basis, the Board of Trustees receives reports on any valuation actions taken by the Valuation Committee or the Management Valuation Team which may include items for ratification.
Valuations of fair valued securities are compared to the next actual sales price when available, or other appropriate market values, to assess the continued appropriateness of the fair valuation methodologies used. These securities are fair valued on a day-to-day basis, taking into consideration changes to appropriate market information and any significant changes to the inputs considered in the valuation process until there is a readily available price provided on an exchange
| | | | |
| 30 | | Wells Fargo Diversified International Fund | | Notes to financial statements |
or by an independent pricing service. Valuations received from an independent pricing service or independent broker-dealer quotes are periodically validated by comparisons to most recent trades and valuations provided by other independent pricing services in addition to the review of prices by the manager and/or subadviser. Unobservable inputs used in determining fair valuations are identified based on the type of security, taking into consideration factors utilized by market participants in valuing the investment, knowledge about the issuer and the current market environment
Foreign currency translation
The accounting records of the Fund are maintained in U.S. dollars. The values of other assets and liabilities denominated in foreign currencies are translated into U.S. dollars at rates provided by an independent foreign currency pricing source at a time each business day specified by the Management Valuation Team. Purchases and sales of securities, and income and expenses are converted at the rate of exchange on the respective dates of such transactions. Net realized foreign exchange gains or losses arise from sales of foreign currencies, currency gains or losses realized between the trade and settlement dates on securities transactions, and the difference between the amounts of dividends, interest and foreign withholding taxes recorded and the U.S. dollar equivalent of the amounts actually paid or received. Net unrealized foreign exchange gains and losses arise from changes in the fair value of assets and liabilities other than investments in securities resulting from changes in exchange rates. The changes in net assets arising from changes in exchange rates and the changes in net assets resulting from changes in market prices of securities are not separately presented. Such changes are included in net realized and unrealized gains or losses from investments.
Participation notes
The Fund may invest in participation notes to gain exposure to securities in certain foreign markets. Participation notes are issued by banks or broker-dealers and are designed to offer a return linked to a particular underlying foreign security. Participation notes involve transaction costs, which may be higher than those applicable to the underlying foreign security. The holder of the participation note is entitled to receive from the bank or broker-dealer, an amount equal to the dividend paid by the issuer of the underlying foreign security; however, the holder is not entitled to the same rights (i.e. dividends, voting rights) as an owner of the underlying foreign security. Investments in participation notes involve risks beyond those normally associated with a direct investment in an underlying security. The Fund has no rights against the issuer of the underlying foreign security and participation notes expose the Fund to counterparty risk in the event the counterparty does not perform. There is also no assurance there will be a secondary trading market for the participation note or that the trading price of the participation note will equal the underlying value of the foreign security that it seeks to replicate.
Forward foreign currency contracts
The Fund is subject to foreign currency risk in the normal course of pursuing its investment objectives. A forward foreign currency contract is an agreement between two parties to purchase or sell a specific currency for an agreed-upon price at a future date. The Fund enters into forward foreign currency contracts to facilitate transactions in foreign-denominated securities and to attempt to minimize the risk to the Fund from adverse changes in the relationship between currencies. Forward foreign currency contracts are recorded at the forward rate and marked-to-market daily. When the contracts are closed, realized gains and losses arising from such transactions are recorded as realized gains or losses on forward foreign currency contract transactions. The Fund could be exposed to risks if the counterparties to the contracts are unable to meet the terms of their contracts or if the value of the foreign currency changes unfavorably. The Fund’s maximum risk of loss from counterparty credit risk is the unrealized gains on the contracts. This risk may be mitigated if there is a master netting arrangement between the Fund and the counterparty.
Security loans
The Fund may lend its securities from time to time in order to earn additional income in the form of fees or interest on securities received as collateral or the investment of any cash received as collateral. The Fund continues to receive interest or dividends on the securities loaned. The Fund receives collateral in the form of cash or securities with a value at least equal to the value of the securities on loan. The value of the loaned securities is determined at the close of each business day and any additional required collateral is delivered to the Fund on the next business day. In a securities lending transaction, the net asset value of the Fund will be affected by an increase or decrease in the value of the securities loaned and by an increase or decrease in the value of the instrument in which collateral is invested. The amount of securities lending activity undertaken by the Fund fluctuates from time to time. In the event of default or bankruptcy by the borrower, the Fund may be prevented from recovering the loaned securities or gaining access to the collateral or may experience delays or costs in doing so. In addition, the investment of any cash collateral received may lose all or part of its value. The Fund has the right under the lending agreement to recover the securities from the borrower on demand.
The Fund lends its securities through an unaffiliated securities lending agent. Cash collateral received in connection with its securities lending transactions is invested in Securities Lending Cash Investments, LLC (the “Securities Lending Fund”). The Securities Lending Fund is exempt from registration under Section 3(c)(7) of the 1940 Act and is managed by Funds Management and is subadvised by Wells Capital Management Incorporated (“WellsCap”), an affiliate of Funds
| | | | | | |
| Notes to financial statements | | Wells Fargo Diversified International Fund | | | 31 | |
Management and an indirect wholly owned subsidiary of Wells Fargo & Company (“Wells Fargo”). Funds Management receives an advisory fee starting at 0.05% and declining to 0.01% as the average daily net assets of the Securities Lending Fund increase. All of the fees received by Funds Management are paid to WellsCap for its services as subadviser. The Securities Lending Fund seeks to provide a positive return compared to the daily Fed Funds Open Rate by investing in high-quality, U.S. dollar-denominated short-term money market instruments. Securities Lending Fund investments are valued at the evaluated bid price provided by an independent pricing service. Income earned from investment in the Securities Lending Fund is included in securities lending income on the Statement of Operations.
Security transactions and income recognition
Securities transactions are recorded on a trade date basis. Realized gains or losses are recorded on the basis of identified cost.
Dividend income is recognized on the ex-dividend date, except for certain dividends from foreign securities, which are recorded as soon as the custodian verifies the ex-dividend date. Dividend income from foreign securities is recorded net of foreign taxes withheld where recovery of such taxes is not assured.
Distributions to shareholders
Distributions to shareholders from net investment income and net realized gains, if any, are recorded on the ex-dividend date. Such distributions are determined in conformity with federal income tax regulations, which may differ in amount or character from net investment income and realized gains recognized for purposes of U.S. generally accepted accounting principles.
Federal and other taxes
The Fund intends to continue to qualify as a regulated investment company by distributing substantially all of its investment company taxable income and any net realized capital gains (after reduction for capital loss carryforwards) sufficient to relieve it from all, or substantially all, federal income taxes. Accordingly, no provision for federal income taxes was required.
The Fund’s income and federal excise tax returns and all financial records supporting those returns for the prior three fiscal years are subject to examination by the federal and Delaware revenue authorities. Management has analyzed the Fund’s tax positions taken on federal, state, and foreign tax returns for all open tax years and does not believe that there are any uncertain tax positions that require recognition of a tax liability.
Reclassifications are made to the Fund’s capital accounts for permanent tax differences to reflect income and gains available for distribution (or available capital loss carryforwards) under federal income tax regulations. U.S. generally accepted accounting principles require that certain components of net assets be adjusted to reflect permanent differences between financial and tax reporting. These reclassifications have no effect on net assets or net asset values per share. The primary permanent difference causing such reclassifications is due to foreign currency transactions. At October 31, 2016, as a result of permanent book-to-tax differences, the following reclassification adjustments were made on the Statement of Assets and Liabilities:
| | |
Undistributed net investment income | | Accumulated net
realized losses
on investments |
| $249,990 | | $(249,990) |
Capital loss carryforwards that do not expire are required to be utilized prior to capital loss carryforwards that expire. As of October 31, 2016, capital loss carryforwards available to offset future net realized capital gains were as follows through the indicated expiration dates:
| | | | |
| | | No expiration |
| 2017 | | Short-term | | Long-term |
| $89,306,475 | | $11,620,385 | | $2,744,226 |
Class allocations
The separate classes of shares offered by the Fund differ principally in applicable sales charges, distribution, shareholder servicing, and administration fees. Class specific expenses are charged directly to that share class. Investment income, common expenses, and realized and unrealized gains (losses) on investments are allocated daily to each class of shares based on the relative proportion of net assets of each class.
| | | | |
| 32 | | Wells Fargo Diversified International Fund | | Notes to financial statements |
3. FAIR VALUATION MEASUREMENTS
Fair value measurements of investments are determined within a framework that has established a fair value hierarchy based upon the various data inputs utilized in determining the value of the Fund’s investments. The three-level hierarchy gives the highest priority to unadjusted quoted prices in active markets for identical assets or liabilities (Level 1) and the lowest priority to significant unobservable inputs (Level 3). The Fund’s investments are classified within the fair value hierarchy based on the lowest level of input that is significant to the fair value measurement. The inputs are summarized into three broad levels as follows:
| ∎ | | Level 1 – quoted prices in active markets for identical securities |
| ∎ | | Level 2 – other significant observable inputs (including quoted prices for similar securities, interest rates, prepayment speeds, credit risk, use of amortized cost, etc.) |
| ∎ | | Level 3 – significant unobservable inputs (including the Fund’s own assumptions in determining the fair value of investments) |
The inputs or methodologies used for valuing investments in securities are not necessarily an indication of the risk associated with investing in those securities.
The following is a summary of the inputs used in valuing the Fund’s assets and liabilities as of October 31, 2016:
| | | | | | | | | | | | | | | | |
| | | Quoted prices
(Level 1) | | | Other significant
observable inputs (Level 2) | | | Significant
unobservable inputs (Level 3) | | | Total | |
Assets | | | | | | | | | | | | | | | | |
Investments in: | | | | | | | | | | | | | | | | |
| | | | |
Common stocks | | | | | | | | | | | | | | | | |
Australia | | $ | 1,917,499 | | | $ | 0 | | | $ | 6,651 | | | $ | 1,924,150 | |
Austria | | | 317,806 | | | | 0 | | | | 0 | | | | 317,806 | |
Belgium | | | 461,455 | | | | 0 | | | | 0 | | | | 461,455 | |
Brazil | | | 505,990 | | | | 0 | | | | 0 | | | | 505,990 | |
Canada | | | 2,634,308 | | | | 0 | | | | 0 | | | | 2,634,308 | |
China | | | 5,794,206 | | | | 0 | | | | 0 | | | | 5,794,206 | |
Czech Republic | | | 92,350 | | | | 0 | | | | 0 | | | | 92,350 | |
Denmark | | | 909,001 | | | | 0 | | | | 0 | | | | 909,001 | |
Finland | | | 96,015 | | | | 0 | | | | 0 | | | | 96,015 | |
France | | | 5,915,263 | | | | 0 | | | | 0 | | | | 5,915,263 | |
Germany | | | 14,447,838 | | | | 0 | | | | 0 | | | | 14,447,838 | |
Hong Kong | | | 2,982,347 | | | | 0 | | | | 0 | | | | 2,982,347 | |
Hungary | | | 75,227 | | | | 0 | | | | 0 | | | | 75,227 | |
India | | | 145,817 | | | | 0 | | | | 0 | | | | 145,817 | |
Indonesia | | | 92,379 | | | | 0 | | | | 0 | | | | 92,379 | |
Ireland | | | 2,156,890 | | | | 0 | | | | 0 | | | | 2,156,890 | |
Israel | | | 411,996 | | | | 0 | | | | 0 | | | | 411,996 | |
Italy | | | 2,552,058 | | | | 0 | | | | 0 | | | | 2,552,058 | |
Japan | | | 18,386,166 | | | | 0 | | | | 0 | | | | 18,386,166 | |
Liechtenstein | | | 115,494 | | | | 0 | | | | 0 | | | | 115,494 | |
Luxembourg | | | 118,588 | | | | 0 | | | | 0 | | | | 118,588 | |
Netherlands | | | 3,836,091 | | | | 0 | | | | 0 | | | | 3,836,091 | |
Norway | | | 874,504 | | | | 0 | | | | 0 | | | | 874,504 | |
Poland | | | 78,727 | | | | 0 | | | | 0 | | | | 78,727 | |
Russia | | | 356,937 | | | | 0 | | | | 0 | | | | 356,937 | |
Singapore | | | 327,724 | | | | 0 | | | | 0 | | | | 327,724 | |
South Africa | | | 310,211 | | | | 0 | | | | 0 | | | | 310,211 | |
South Korea | | | 3,294,766 | | | | 0 | | | | 0 | | | | 3,294,766 | |
Spain | | | 1,329,859 | | | | 0 | | | | 0 | | | | 1,329,859 | |
Sweden | | | 1,108,954 | | | | 0 | | | | 0 | | | | 1,108,954 | |
| | | | | | |
| Notes to financial statements | | Wells Fargo Diversified International Fund | | | 33 | |
| | | | | | | | | | | | | | | | |
| | | Quoted prices
(Level 1) | | | Other significant
observable inputs (Level 2) | | | Significant
unobservable inputs (Level 3) | | | Total | |
| | | | |
Common stocks (continued) | | | | | | | | | | | | | | | | |
Switzerland | | $ | 7,110,772 | | | $ | 0 | | | $ | 0 | | | $ | 7,110,772 | |
Taiwan | | | 1,089,551 | | | | 0 | | | | 0 | | | | 1,089,551 | |
Thailand | | | 322,734 | | | | 0 | | | | 0 | | | | 322,734 | |
United Kingdom | | | 15,303,129 | | | | 0 | | | | 0 | | | | 15,303,129 | |
United States | | | 3,318,308 | | | | 0 | | | | 0 | | | | 3,318,308 | |
| | | | |
Exchange-traded funds | | | | | | | | | | | | | | | | |
United States | | | 541,975 | | | | 0 | | | | 0 | | | | 541,975 | |
| | | | |
Participation notes | | | | | | | | | | | | | | | | |
China | | | 0 | | | | 568,145 | | | | 0 | | | | 568,145 | |
Ireland | | | 0 | | | | 672,816 | | | | 0 | | | | 672,816 | |
| | | | |
Preferred stocks | | | | | | | | | | | | | | | | |
Brazil | | | 41,541 | | | | 0 | | | | 0 | | | | 41,541 | |
Germany | | | 631,882 | | | | 0 | | | | 0 | | | | 631,882 | |
| | | | |
Rights | | | | | | | | | | | | | | | | |
Spain | | | 0 | | | | 1,652 | | | | 0 | | | | 1,652 | |
| | | | |
Short-term investments | | | | | | | | | | | | | | | | |
Investment companies | | | 5,132,495 | | | | 0 | | | | 0 | | | | 5,132,495 | |
Investments measured at net asset value* | | | | | | | | | | | 0 | | | | 1,251,490 | |
| | | 105,138,853 | | | | 1,242,613 | | | | 6,651 | | | | 107,639,607 | |
Forward foreign currency contracts | | | 0 | | | | 117,922 | | | | 0 | | | | 117,922 | |
Total assets | | $ | 105,138,853 | | | $ | 1,360,535 | | | $ | 6,651 | | | $ | 107,757,529 | |
| * | Investments that are measured at fair value using the net asset value per share (or its equivalent) as a practical expedient have not been categorized in the fair value hierarchy. The fair value amount presented in the table is intended to permit reconciliation of the fair value hierarchy to the amounts presented in the Statement of Assets and Liabilities. The Fund’s investment in Securities Lending Cash Investments, LLC valued at $1,251,490 does not have a redemption period notice, can be redeemed daily and does not have any unfunded commitments. |
Forward foreign currency contracts are reported at their unrealized gains (losses) at measurement date, which represents the change in the contract’s value from trade date. All other assets and liabilities are reported at their market value at measurement date.
The Fund recognizes transfers between levels within the fair value hierarchy at the end of the reporting period. Fair value pricing that was used in pricing certain foreign securities at the previous period end was not used at October 31, 2016. As a result, common stocks valued at $69,597,499 and preferred stocks valued at $673,423 were transferred from Level 2 to Level 1 within the fair value hierarchy. The Fund had no material transfers into/out of Level 3.
4. TRANSACTIONS WITH AFFILIATES AND OTHER EXPENSES
Management fee
Funds Management, an indirect wholly owned subsidiary of Wells Fargo & Company (“Wells Fargo”), is the manager of the Fund and provides advisory and fund-level administrative services under an investment management agreement. Under the investment management agreement, Funds Management is responsible for, among other services, implementing the investment objectives and strategies of the Fund, supervising the subadvisers, providing fund-level administrative services in connection with the Fund’s operations, and providing any other fund-level administrative services reasonably necessary for the operation of the Fund. As compensation for its services under the investment management agreement, Funds Management is entitled to receive an annual management fee starting at 0.90% and declining to 0.73% as the average daily net assets of the Fund increase. For the year ended October 31, 2016, the management fee was equivalent to an annual rate of 0.90% of the Fund’s average daily net assets.
Funds Management has retained the services of certain subadvisers to provide daily portfolio management to the Fund. The fee for subadvisory services is borne by Funds Management. Artisan Partners Limited Partnership, LSV Asset
| | | | |
| 34 | | Wells Fargo Diversified International Fund | | Notes to financial statements |
Management, and Wells Cap are the subadvisers to the Fund and are each entitled to receive a fee from Funds Management which is calculated based on the average daily net assets of the Fund as follows:
| | | | | | | | |
| | | Annual subadvisory fee | |
| | | starting at | | | declining to | |
Artisan Partners Limited Partnership | | | 0.80 | % | | | 0.50 | % |
LSV Asset Management | | | 0.35 | | | | 0.30 | |
WellsCap | | | 0.45 | | | | 0.40 | |
Administration fees
Under a class-level administration agreement, Funds Management provides class-level administrative services to the Fund, which includes paying fees and expenses for services provided by the transfer agent, sub-transfer agents, omnibus account servicers and record-keepers. As compensation for its services under the class-level administration agreement, Funds Management receives an annual fee which is calculated based on the average daily net assets of each class as follows:
| | | | |
| | | Class-level
administration fee | |
Class A, Class B, Class C, Class R | | | 0.21 | % |
Class R6 | | | 0.03 | |
Administrator Class, Institutional Class | | | 0.13 | |
Funds Management has contractually waived and/or reimbursed management and administration fees to the extent necessary to maintain certain net operating expense ratios for the Fund. Waiver of fees and/or reimbursement of expenses by Funds Management were made first from fund level expenses on a proportionate basis and then from class specific expenses. Funds Management has committed through February 28, 2017 to waive fees and/or reimburse expenses to the extent necessary to cap the Fund’s expenses at 1.35% for Class A shares, 2.10% for Class B shares, 2.10% for Class C shares, 1.60% for Class R shares, 0.89% for Class R6 shares, 1.25% for Administrator Class shares, and 0.99% for Institutional Class shares. After this time, the cap may be increased or the commitment to maintain the cap may be terminated only with the approval of the Board of Trustees. Prior to March 1, 2016, the Fund’s expenses were capped at 1.41% for Class A shares, 2.16% for Class B shares, and 2.16% for Class C shares.
Distribution fees
The Trust has adopted a distribution plan for Class B, Class C, and Class R shares of the Fund pursuant to Rule 12b-1 under the 1940 Act. Distribution fees are charged to Class B, Class C, and Class R shares and paid to Wells Fargo Funds Distributor, LLC (“Funds Distributor”), the principal underwriter, at an annual rate of 0.75% of the average daily net assets of Class B and Class C shares and 0.25% of the average daily net assets of Class R shares.
In addition, Funds Distributor is entitled to receive the front-end sales charge from the purchase of Class A shares and a contingent deferred sales charge on the redemption of certain Class A shares. Funds Distributor is also entitled to receive the contingent deferred sales charges from redemptions of Class B and Class C shares. For the year ended October 31, 2016, Funds Distributor received $719 from the sale of Class A shares and $46 in contingent deferred sales charges from redemptions of Class A.
Shareholder servicing fees
The Trust has entered into contracts with one or more shareholder servicing agents, whereby Class A, Class B, Class C, Class R, and Administrator Class of the Fund are charged a fee at an annual rate of 0.25% of the average daily net assets of each respective class.
A portion of these total shareholder servicing fees were paid to affiliates of Wells Fargo.
5. INVESTMENT PORTFOLIO TRANSACTIONS
Purchases and sales of investments, excluding U.S. government obligations (if any) and short-term securities, for the year ended October 31, 2016 were $68,974,551 and $50,831,615, respectively.
The Fund may purchase or sell investment securities to other Wells Fargo funds under procedures adopted by the Board of Trustees. The procedures have been designed to ensure that these interfund transactions, which generally do not incur broker commissions, are effected at current market prices. Interfund trades are included within the respective purchases and sales amounts shown.
| | | | | | |
| Notes to financial statements | | Wells Fargo Diversified International Fund | | | 35 | |
6. DERIVATIVE TRANSACTIONS
During the year ended October 31, 2016, the Fund entered into forward foreign currency contracts for economic hedging purposes.
At October 31, 2016, the Fund had forward foreign currency contracts outstanding as follows:
Forward foreign currency contracts to sell:
| | | | | | | | | | | | | | | | | | |
| Exchange date | | Counterparty | | Contracts to deliver | | | U.S. value at October 31, 2016 | | | In exchange for U.S. $ | | | Unrealized
gains | |
| 12-15-2016 | | Barclays | | | 2,450,000 | EUR | | $ | 2,694,621 | | | $ | 2,763,281 | | | $ | 68,660 | |
| 12-22-2016 | | Morgan Stanley | | | 595,000 | GBP | | | 729,160 | | | | 772,422 | | | | 43,262 | |
| 1-13-2017 | | Credit Suisse | | | 500,000 | EUR | | | 550,740 | | | | 556,740 | | | | 6,000 | |
The Fund had average contract amounts of $661,441 and $4,614,055 in forward foreign currency contracts to buy and forward foreign currency contracts to sell, respectively, during the year ended October 31, 2016.
The fair value, realized gains or losses and change in unrealized gains or losses, if any, on derivative instruments are reflected in the appropriate financial statements.
For certain types of derivative transactions, the Fund has entered into International Swaps and Derivatives Association, Inc. master agreements (“ISDA Master Agreements”) or similar agreements with approved counterparties. The ISDA Master Agreements or similar agreements may have requirements to deliver/deposit securities or cash to/with an exchange or broker-dealer as collateral and allows the Fund to offset, with each counterparty, certain derivative financial instrument’s assets and/or liabilities with collateral held or pledged. Collateral requirements differ by type of derivative. Collateral or margin requirements are set by the broker or exchange clearing house for exchange traded derivatives while collateral terms are contract specific for over-the-counter traded derivatives. Cash collateral that has been pledged to cover obligations of the Fund under ISDA Master Agreements or similar agreements, if any, are reported separately in the Statement of Assets and Liabilities. Securities pledged as collateral, if any, are noted in the Portfolio of Investments. With respect to balance sheet offsetting, absent an event of default by the counterparty or a termination of the agreement, the reported amounts of financial assets and financial liabilities in the Statement of Assets and Liabilities are not offset across transactions between the Fund and the applicable counterparty. A reconciliation of the gross amounts on the Statement of Assets and Liabilities to the net amounts by derivative type, including any collateral exposure, is as follows:
| | | | | | | | | | | | | | | | | | |
| Derivative type | | Counterparty | | Gross amounts
of assets in the
Statement of
Assets and
Liabilities | | | Amounts
subject to
netting
agreements | | | Collateral
received | | | Net amount
of assets | |
Forward foreign currency contracts | | Barclays | | | $68,660* | | | $ | 0 | | | $ | 0 | | | $ | 68,660 | |
| | Morgan Stanley | | | 43,262 | * | | | 0 | | | | 0 | | | | 43,262 | |
| | Credit Suisse | | | 6,000 | * | | | 0 | | | | 0 | | | | 6,000 | |
| | * | Amount represents net unrealized gains. | |
7. BANK BORROWINGS
The Trust (excluding the money market funds and certain other funds) and Wells Fargo Variable Trust are parties to a $250,000,000 revolving credit agreement whereby the Fund is permitted to use bank borrowings for temporary or emergency purposes, such as to fund shareholder redemption requests. Interest under the credit agreement is charged to the Fund based on a borrowing rate equal to the higher of the Federal Funds rate in effect on that day plus 1.25% or the overnight LIBOR rate in effect on that day plus 1.25%. In addition, an annual commitment fee equal to 0.25% of the unused balance is allocated to each participating fund. Prior to August 30, 2016, the revolving credit agreement amount was $200,000,000 and the annual commitment fee was equal to 0.20% of the unused balance which was allocated to each participating fund.
For the year ended October 31, 2016, there were no borrowings by the Fund under the agreement.
8. DISTRIBUTIONS TO SHAREHOLDERS
The tax character of distributions paid was $1,164,901 and $1,961,502 of ordinary income for the years ended October 31, 2016 and October 31, 2015, respectively.
| | | | |
| 36 | | Wells Fargo Diversified International Fund | | Notes to financial statements |
As of October 31, 2016, the components of distributable earnings on a tax basis were as follows:
| | | | |
Undistributed
ordinary
income | | Unrealized
gains | | Capital loss carryforward |
| $2,170,230 | | $583,314 | | $(103,671,086) |
9. INDEMNIFICATION
Under the Trust’s organizational documents, the officers and Trustees have been granted certain indemnification rights against certain liabilities that may arise out of performance of their duties to the Trust. Additionally, in the normal course of business, the Trust may enter into contracts with service providers that contain a variety of indemnification clauses. The Trust’s maximum exposure under these arrangements is dependent on future claims that may be made against the Fund and, therefore, cannot be estimated.
10. REGULATORY CHANGES
In October 2016, the Securities and Exchange Commission (“SEC”) adopted new rules and forms and amended existing rules and forms (together, “final rules”) intended to modernize and enhance the reporting and disclosure of information by registered investment companies and to enhance liquidity risk management by open-end mutual funds and exchange-traded funds. The final rules will enhance the quality of information available to investors and will allow the SEC to more effectively collect and use data reported by funds. In part, the final rules amend Regulation S-X and require standardized, enhanced disclosure about derivatives in the Fund’s financial statements, as well as other amendments. The compliance date for the amendments to Regulation S-X is August 1, 2017 while the compliance date for the new form types is June 1, 2018 and the compliance date for the liquidity risk management program requirements is December 1, 2018. Management is currently assessing the potential impact of these enhancements and their impact on the financial statement disclosures and reporting requirements.
| | | | | | |
| Report of independent registered public accounting firm | | Wells Fargo Diversified International Fund | | | 37 | |
BOARD OF TRUSTEES AND SHAREHOLDERS OF WELLS FARGO FUNDS TRUST:
We have audited the accompanying statement of assets and liabilities, including the portfolio of investments, of the Wells Fargo Diversified International Fund (the “Fund”), one of the funds constituting the Wells Fargo Funds Trust, as of October 31, 2016, and the related statement of operations for the year then ended, the statements of changes in net assets for each of the years in the two-year period then ended, and the financial highlights for each of the years or periods in the five-year period then ended. These financial statements and financial highlights are the responsibility of the Fund’s management. Our responsibility is to express an opinion on these financial statements and financial highlights based on our audits.
We conducted our audits in accordance with the standards of the Public Company Accounting Oversight Board (United States). Those standards require that we plan and perform the audit to obtain reasonable assurance about whether the financial statements and financial highlights are free of material misstatement. An audit includes examining, on a test basis, evidence supporting the amounts and disclosures in the financial statements. Our procedures included confirmation of securities owned as of October 31, 2016, by correspondence with the custodian and brokers, or by other appropriate auditing procedures. An audit also includes assessing the accounting principles used and significant estimates made by management, as well as evaluating the overall financial statement presentation. We believe that our audits provide a reasonable basis for our opinion.
In our opinion, the financial statements and financial highlights referred to above present fairly, in all material respects, the financial position of the Wells Fargo Diversified International Fund as of October 31, 2016, the results of its operations for the year then ended, the changes in its net assets for each of the years in the two-year period then ended, and the financial highlights for each of the years or periods in the five-year period then ended, in conformity with U.S. generally accepted accounting principles.

Boston, Massachusetts
December 22, 2016
| | | | |
| 38 | | Wells Fargo Diversified International Fund | | Other information (unaudited) |
TAX INFORMATION
For corporate shareholders, pursuant to Section 854 of the Internal Revenue Code, 1.37% of ordinary income dividends qualify for the corporate dividends-received deduction for the fiscal year ended October 31, 2016.
Pursuant to Section 854 of the Internal Revenue Code, $1,164,902 of income dividends paid during the fiscal year ended October 31, 2016 has been designated as qualified dividend income (QDI).
Pursuant to Section 853 of the Internal Revenue Code, the Fund expects to designate amounts as foreign taxes paid for the fiscal year ended October 31, 2016. Additional details will be available in the semiannual report.
PROXY VOTING INFORMATION
A description of the policies and procedures that the Fund uses to determine how to vote proxies relating to portfolio securities is available, upon request, by calling 1-800-222-8222, visiting our website at wellsfargofunds.com, or visiting the SEC website at sec.gov. Information regarding how the Fund voted proxies relating to portfolio securities during the most recent 12-month period ended June 30 is available on the Fund’s website at wellsfargofunds.com or by visiting the SEC website at sec.gov.
PORTFOLIO HOLDINGS INFORMATION
The complete portfolio holdings for the Fund are publicly available monthly on the Fund’s website (wellsfargofunds.com), on a one-month delayed basis. In addition, top ten holdings information (excluding derivative positions) for the Fund is publicly available on the Fund’s website on a monthly, seven-day or more delayed basis. The Fund files its complete schedule of portfolio holdings with the SEC for the first and third quarters of each fiscal year on Form N-Q, which is available by visiting the SEC website at sec.gov. In addition, the Fund’s Form N-Q may be reviewed and copied at the SEC’s Public Reference Room in Washington, DC, and at regional offices in New York City, at 233 Broadway, and in Chicago, at 175 West Jackson Boulevard, Suite 900. Information about the Public Reference Room may be obtained by calling 1-800-SEC-0330.
| | | | | | |
| Other information (unaudited) | | Wells Fargo Diversified International Fund | | | 39 | |
BOARD OF TRUSTEES AND OFFICERS
Each of the Trustees and Officers1 listed in the table below acts in identical capacities for each fund in the Wells Fargo family of funds, which consists of 139 mutual funds comprising the Wells Fargo Funds Trust, Wells Fargo Variable Trust, Wells Fargo Master Trust and four closed-end funds (collectively the “Fund Complex”). This table should be read in conjunction with the Prospectus and the Statement of Additional Information2. The mailing address of each Trustee and Officer is 525 Market Street, 12th Floor, San Francisco, CA 94105. Each Trustee and Officer serves an indefinite term, however, each Trustee serves such term until reaching the mandatory retirement age established by the Trustees.
Independent Trustees
| | | | | | |
Name and year of birth | | Position held and length of service* | | Principal occupations during past five years or longer | | Current other
public company or
investment company
directorships |
William R. Ebsworth (Born 1957) | | Trustee, since 2015 | | Retired. From 1984 to 2013, equities analyst, portfolio manager, research director and chief investment officer at Fidelity Management and Research Company in Boston, Tokyo, and Hong Kong and retired in 2013 as Chief Investment Officer of Fidelity Strategic Advisers, Inc. where he lead a team of investment professionals managing client assets. Prior thereto, Board member of Hong Kong Securities Clearing Co., Hong Kong Options Clearing Corp., the Thailand International Fund, Ltd., Fidelity Investments Life Insurance Company, and Empire Fidelity Investments Life Insurance Company. Mr. Ebsworth is a CFA® charterholder and an Adjunct Lecturer, Finance, at Babson College. | | Asset Allocation Trust |
Jane A. Freeman (Born 1953) | | Trustee, since 2015 | | Retired. From 2012 to 2014 and 1999 to 2008, Chief Financial Officer of Scientific Learning Corporation. From 2008 to 2012, Ms. Freeman provided consulting services related to strategic business projects. Prior to 1999, Portfolio Manager at Rockefeller & Co. and Scudder, Stevens & Clark. Board member of the Harding Loevner Funds from 1996 to 2014, serving as both Lead Independent Director and chair of the Audit Committee. Board member of the Russell Exchange Traded Funds Trust from 2011 to 2012 and the chair of the Audit Committee. Ms. Freeman is Chair of Taproot Foundation (non-profit organization), a Board Member of Ruth Bancroft Garden (non-profit organization) and an inactive chartered financial analyst. | | Asset Allocation Trust |
Peter G. Gordon** (Born 1942) | | Trustee, since 1998; Chairman, since 2005 | | Co-Founder, Retired Chairman, President and CEO of Crystal Geyser Water Company. Trustee Emeritus, Colby College. | | Asset Allocation Trust |
Isaiah Harris, Jr. (Born 1952) | | Trustee, since 2009 | | Retired. Chairman of the Board of CIGNA Corporation since 2009, and Director since 2005. From 2003 to 2011, Director of Deluxe Corporation. Prior thereto, President and CEO of BellSouth Advertising and Publishing Corp. from 2005 to 2007, President and CEO of BellSouth Enterprises from 2004 to 2005 and President of BellSouth Consumer Services from 2000 to 2003. Emeritus member of the Iowa State University Foundation Board of Governors. Emeritus Member of the Advisory Board of Iowa State University School of Business. Advisory Board Member, Palm Harbor Academy (charter school). Advisory Board Member, Child Evangelism Fellowship (non-profit). Mr. Harris is a certified public accountant (inactive status). | | CIGNA Corporation; Asset Allocation Trust |
Judith M. Johnson (Born 1949) | | Trustee, since 2008; Audit Committee Chairman, since 2008 | | Retired. Prior thereto, Chief Executive Officer and Chief Investment Officer of Minneapolis Employees Retirement Fund from 1996 to 2008. Ms. Johnson is an attorney, certified public accountant and a certified managerial accountant. | | Asset Allocation Trust |
David F. Larcker (Born 1950) | | Trustee, since 2009 | | James Irvin Miller Professor of Accounting at the Graduate School of Business, Stanford University, Director of the Corporate Governance Research Initiative and Senior Faculty of The Rock Center for Corporate Governance since 2006. From 2005 to 2008, Professor of Accounting at the Graduate School of Business, Stanford University. Prior thereto, Ernst & Young Professor of Accounting at The Wharton School, University of Pennsylvania from 1985 to 2005. | | Asset Allocation Trust |
| | | | |
| 40 | | Wells Fargo Diversified International Fund | | Other information (unaudited) |
| | | | | | |
Name and year of birth | | Position held and length of service* | | Principal occupations during past five years or longer | | Current other
public company or
investment company
directorships |
Olivia S. Mitchell (Born 1953) | | Trustee, since 2006 | | International Foundation of Employee Benefit Plans Professor, Wharton School of the University of Pennsylvania since 1993. Director of Wharton’s Pension Research Council and Boettner Center on Pensions & Retirement Research, and Research Associate at the National Bureau of Economic Research. Previously, Cornell University Professor from 1978 to 1993. | | Asset Allocation Trust |
Timothy J. Penny (Born 1951) | | Trustee, since 1996 | | President and Chief Executive Officer of Southern Minnesota Initiative Foundation, a non-profit organization, since 2007 and Senior Fellow at the Humphrey Institute Policy Forum at the University of Minnesota since 1995. Member of the Board of Trustees of NorthStar Education Finance, Inc., a non-profit organization, since 2007. | | Asset Allocation Trust |
Michael S. Scofield (Born 1943) | | Trustee, since 2010 | | Served on the Investment Company Institute’s Board of Governors and Executive Committee from 2008-2011 as well the Governing Council of the Independent Directors Council from 2006-2011 and the Independent Directors Council Executive Committee from 2008-2011. Chairman of the IDC from 2008-2010. Institutional Investor (Fund Directions) Trustee of Year in 2007. Trustee of the Evergreen Funds complex (and its predecessors) from 1984 to 2010. Chairman of the Evergreen Funds from 2000-2010. Former Trustee of the Mentor Funds. Retired Attorney, Law Offices of Michael S. Scofield. | | Asset Allocation Trust |
| * | Length of service dates reflect the Trustee’s commencement of service with the Trust’s predecessor entities, where applicable. |
| ** | Peter Gordon is expected to retire on December 31, 2017. |
Officers
| | | | | | |
Name and
year of birth | | Position held and
length of service | | Principal occupations during past five years or longer | | |
Karla M. Rabusch (Born 1959) | | President, since 2003 | | Executive Vice President of Wells Fargo Bank, N.A. and President of Wells Fargo Funds Management, LLC since 2003. | | |
Jeremy DePalma1 (Born 1974) | | Treasurer, since 2012 | | Senior Vice President of Wells Fargo Funds Management, LLC since 2009. Senior Vice President of Evergreen Investment Management Company, LLC from 2008 to 2010 and head of the Fund Reporting and Control Team within Fund Administration from 2005 to 2010. | | |
C. David Messman (Born 1960) | | Secretary, since 2000; Chief Legal Officer, since 2003 | | Senior Vice President and Secretary of Wells Fargo Funds Management, LLC since 2001. Assistant General Counsel of Wells Fargo Bank, N.A. since 2013 and Vice President and Managing Counsel of Wells Fargo Bank, N.A. from 1996 to 2013. | | |
Michael Whitaker3 (Born 1967) | | Chief Compliance Officer, since 2016 | | Executive Vice President of Wells Fargo Funds Management, LLC since 2016. Chief Compliance Officer of Fidelity’s Fixed Income Funds and Asset Allocation Funds from 2008 to 2016, Compliance Officer of FMR Co., Inc. from 2014 to 2016, Fidelity Investments Money Management, Inc. from 2014 to 2016, Fidelity Investments from 2007 to 2016. | | |
David Berardi (Born 1975) | | Assistant Treasurer, since 2009 | | Vice President of Wells Fargo Funds Management, LLC since 2009. Vice President of Evergreen Investment Management Company, LLC from 2008 to 2010. Manager of Fund Reporting and Control for Evergreen Investment Management Company, LLC from 2004 to 2010. | | |
| 1 | Jeremy DePalma acts as Treasurer of 69 funds and Assistant Treasurer of 70 funds in the Fund Complex. |
| 2 | The Statement of Additional Information includes additional information about the Trustees and is available, without charge, upon request, by calling 1-800-222-8222 or by visiting the website at wellsfargofunds.com. |
| 3 | Michael Whitaker became Chief Compliance Officer effective May 16, 2016. |
| | | | | | |
| Other information (unaudited) | | Wells Fargo Diversified International Fund | | | 41 | |
BOARD CONSIDERATION OF INVESTMENT MANAGEMENT AND SUB-ADVISORY AGREEMENTS:
Under the Investment Company Act of 1940 (the “1940 Act”), the Board of Trustees (the “Board”) of Wells Fargo Funds Trust (the “Trust”) must determine annually whether to approve the continuation of the Trust’s investment management and sub-advisory agreements. In this regard, at an in-person meeting held on May 24-25, 2016 (the “Meeting”), the Board, all the members of which have no direct or indirect interest in the investment management and sub-advisory agreements and are not “interested persons” of the Trust, as defined in the 1940 Act (the “Independent Trustees”), reviewed and approved for Wells Fargo Diversified International Fund (the “Fund”): (i) an investment management agreement (the “Management Agreement”) with Wells Fargo Funds Management, LLC (“Funds Management”); (ii) an investment sub-advisory agreement with Wells Capital Management Incorporated (“WellsCap”), an affiliate of Funds Management; (iii) an investment sub-advisory agreement with Artisan Partners, LP ( “Artisan”); and (iv) an investment sub-advisory agreement with LSV Asset Management (“LSV”). The sub-advisory agreements with WellsCap, Artisan and LSV (the “Sub-Advisers”) are collectively referred to as the “Sub-Advisory Agreements,” and the Management Agreement and the Sub-Advisory Agreements are collectively referred to as the “Advisory Agreements.”
At the Meeting, the Board considered the factors and reached the conclusions described below relating to the selection of Funds Management and the Sub-Advisers and the approval of the Advisory Agreements. Prior to the Meeting, including at an in-person meeting in April 2016, the Trustees conferred extensively among themselves and with representatives of Funds Management about these matters. Also, the Board has adopted a team-based approach, with each team consisting of a sub-set of Trustees, to assist the full Board in the discharge of its duties in reviewing performance and other matters throughout the year. The Independent Trustees were assisted in their evaluation of the Advisory Agreements by independent legal counsel, from whom they received separate legal advice and with whom they met separately.
In providing information to the Board, Funds Management and the Sub-Advisers were guided by a detailed set of requests for information submitted to them by independent legal counsel on behalf of the Independent Trustees at the start of the Board’s annual contract renewal process earlier in 2016. In considering and approving the Advisory Agreements, the Trustees considered the information they believed relevant, including but not limited to the information discussed below. The Board considered not only the specific information presented in connection with the Meeting, but also the knowledge gained over time through interaction with Funds Management and the Sub-Advisers about various topics. In this regard, the Board reviewed reports of Funds Management at each of its quarterly meetings, which included, among other things, portfolio reviews and performance reports. In addition, the Board and the teams mentioned above confer with portfolio managers at various times throughout the year. The Board did not identify any particular information or consideration that was all-important or controlling, and each individual Trustee may have attributed different weights to various factors.
After its deliberations, the Board unanimously approved the continuation of the Advisory Agreements for a one-year term and determined that the compensation payable to Funds Management and the Sub-Advisers under each of the Advisory Agreements was reasonable. The Board considered the approval of the Advisory Agreements for the Fund as part of its consideration of agreements for funds across the complex, but its approvals were made on a fund-by-fund basis. The following summarizes a number of important, but not necessarily all, factors considered by the Board in support of its approvals.
Nature, extent and quality of services
The Board received and considered various information regarding the nature, extent and quality of services provided to the Fund by Funds Management and the Sub-Advisers under the Advisory Agreements. This information included a description of the investment advisory services and Fund-level administrative services covered by the Management Agreement, as well as, among other things, a summary of the background and experience of senior management of Funds Management, and the qualifications, background, tenure and responsibilities of each of the portfolio managers primarily responsible for the day-to-day portfolio management of the Fund.
The Board evaluated the ability of Funds Management and the Sub-Advisers to attract and retain qualified investment professionals, including research, advisory and supervisory personnel. The Board further considered the compliance programs and compliance records of Funds Management and the Sub-Advisers. In addition, the Board took into account the full range of services provided to the Fund by Funds Management and its affiliates.
Fund performance and expenses
The Board considered the performance results for the Fund over various time periods ended December 31, 2015. The Board considered these results in comparison to the performance of funds in a universe that was determined by
| | | | |
| 42 | | Wells Fargo Diversified International Fund | | Other information (unaudited) |
Broadridge Inc. (“Broadridge”) to be similar to the Fund (the “Universe”), and in comparison to the Fund’s benchmark index and to other comparative data. Broadridge is an independent provider of investment company data. The Board received a description of the methodology used by Broadridge to select the mutual funds in the performance Universe. The Board noted that the performance of the Fund (Administrator Class) was higher than or in range of the average performance of the Universe for all periods under review. The Board also noted that the performance of the Fund was higher than or in range of its benchmark, the MSCI EAFE Index (Net), for all periods under review except the one-year period.
The Board also received and considered information regarding the Fund’s net operating expense ratios and their various components, including actual management fees, custodian and other non-management fees, and Rule 12b-1 and non-Rule 12b-1 shareholder service fees. The Board considered these ratios in comparison to the median ratios of funds in class-specific expense groups that were determined by Broadridge to be similar to the Fund (the “Groups”). The Board received a description of the methodology used by Broadridge to select the mutual funds in the expense Groups and an explanation of how funds comprising expense groups and their expense ratios may vary from year-to-year. Based on the Broadridge reports, the Board noted that the net operating expense ratios of the Fund were lower than or equal to the median net operating expense ratios of the expense Groups for all share classes except Class R.
The Board took into account the Fund performance and expense information provided to it among the factors considered in deciding to re-approve the Advisory Agreements.
Investment management and sub-advisory fee rates
The Board reviewed and considered the contractual fee rates payable by the Fund to Funds Management under the Management Agreement, as well as the contractual fee rates payable by the Fund to Funds Management for class-level administrative services under a Class-Level Administration Agreement, which include class-level transfer agency and sub-transfer agency costs (collectively, the “Management Rates”). The Board also reviewed and considered the contractual investment sub-advisory fee rates that are payable by Funds Management to each of the Sub-Advisers for investment sub-advisory services.
Among other information reviewed by the Board was a comparison of the Fund’s Management Rates with the average contractual investment management fee rates of funds in the expense Groups at a common asset level as well as transfer agency costs of the funds in the expense Groups. The Board noted that the Management Rates of the Fund were higher than the sum of these average rates for the Fund’s expense Groups for all share classes except Class A and Class R6. The Board also discussed and accepted Funds Management’s proposal to revise the Management Agreement to reduce fees at all asset levels for the Fund.
The Board also received and considered information about the portion of the total management fee that was retained by Funds Management after payment of the fee to the Sub-Advisers for sub-advisory services. The Board considered this amount in comparison to the median amount retained by advisers to funds in a sub-advised expense universe that was determined by Broadridge to be similar to the Fund. In assessing the reasonableness of this amount, the Board received and evaluated information about the nature and extent of responsibilities retained and risks assumed by Funds Management and not delegated to or assumed by the Sub-Advisers, and about Funds Management’s on-going oversight services. However, given the affiliation between Funds Management and WellsCap, the Board ascribed limited relevance to the allocation of fees between them. The Board also considered that the sub-advisory fees paid to Artisan and LSV had been negotiated by Funds Management on an arm’s length basis.
The Board also received and considered information about the nature and extent of services offered and fee rates charged by Funds Management and the Sub-Advisers to other types of clients with investment strategies similar to those of the Fund. In this regard, the Board received information about the significantly greater scope of services, and compliance, reporting and other legal burdens and risks of managing mutual funds compared with those associated with managing assets of non-mutual fund clients such as collective funds or institutional separate accounts.
Based on its consideration of the factors and information it deemed relevant, including those described here, the Board determined that the compensation payable to Funds Management under the Management Agreement and to the Sub-Advisers under the Sub-Advisory Agreements was reasonable, in light of the services covered by the Advisory Agreements.
Profitability
The Board received and considered information concerning the profitability of Funds Management, as well as the profitability of Wells Fargo as a whole, from providing services to the Fund and the fund family as a whole. The Board also
| | | | | | |
| Other information (unaudited) | | Wells Fargo Diversified International Fund | | | 43 | |
received and considered information concerning the profitability of WellsCap from providing services to the fund family as a whole, noting that WellsCap’s profitability information with respect to providing services to the Fund was subsumed in the Wells Fargo and Funds Management profitability analysis. The Board did not consider profitability with respect to Artisan or LSV, as the sub-advisory fees paid to the Artisan and LSV had been negotiated by Funds Management on an arm’s-length basis.
Funds Management reported on the methodologies and estimates used in calculating profitability. Among other things, the Board noted that the levels of profitability reported on a fund-by-fund basis varied widely, depending on factors such as the size and type of fund. Based on its review, the Board did not deem the profits reported by Funds Management or Wells Fargo from its services to the Fund to be at a level that would prevent it from approving the continuation of the Advisory Agreements.
Economies of scale
With respect to possible economies of scale, the Board noted the existence of breakpoints in the Fund’s management fee structure, which operate generally to reduce the Fund’s expense ratios as the Fund grows in size. It considered that, for a small fund or a fund that shrinks in size, breakpoints conversely can result in higher fee levels. The Board also considered that fee waiver and expense reimbursement arrangements and competitive fee rates at the outset are means of sharing potential economies of scale with shareholders of the Fund and the fund family as a whole. The Board also discussed and accepted Funds Management’s proposal to revise the Management Agreement to reduce fees at all asset levels for the Fund. The Board considered Funds Management’s view that any analyses of potential economies of scale in managing a particular fund are inherently limited in light of the joint and common costs and investments that Funds Management incurs across the fund family as a whole.
The Board concluded that the Fund’s fee and expense arrangements, including contractual breakpoints, constituted a reasonable approach to sharing potential economies of scale with the Fund and its shareholders.
Other benefits to Funds Management and the Sub-Advisers
The Board received and considered information regarding potential “fall-out” or ancillary benefits received by Funds Management and its affiliates including WellsCap, and Artisan and LSV, as a result of their relationships with the Fund. Ancillary benefits could include, among others, benefits directly attributable to other relationships with the Fund and benefits potentially derived from an increase in Funds Management’s and the Sub-Advisers’ business as a result of their relationships with the Fund. The Board noted that various affiliates of Funds Management may receive distribution-related fees, shareholder servicing payments and sub-transfer agency fees in respect of shares sold or held through them and services provided.
The Board also reviewed information about soft dollar credits earned and utilized by WellsCap and Artisan, fees earned by Funds Management and WellsCap from managing a private investment vehicle for the fund family’s securities lending collateral and commissions earned by an affiliated broker from portfolio transactions.
Based on its consideration of the factors and information it deemed relevant, including those described here, the Board did not find that any ancillary benefits received by Funds Management and its affiliates, including WellsCap, or either Artisan or LSV were unreasonable.
Conclusion
At the Meeting, after considering the above-described factors and based on its deliberations and its evaluation of the information described above, the Board unanimously approved the continuation of the Advisory Agreements for a one-year term and determined that the compensation payable to Funds Management and the Sub-Advisers under each of the Advisory Agreements was reasonable.
| | | | |
| 44 | | Wells Fargo Diversified International Fund | | List of abbreviations |
The following is a list of common abbreviations for terms and entities that may have appeared in this report.
| ACA | — ACA Financial Guaranty Corporation |
| ADR | — American depositary receipt |
| ADS | — American depositary shares |
| AGC | — Assured Guaranty Corporation |
| AGM | — Assured Guaranty Municipal |
| Ambac | — Ambac Financial Group Incorporated |
| AMT | — Alternative minimum tax |
| BAN | — Bond anticipation notes |
| BHAC | — Berkshire Hathaway Assurance Corporation |
| CAB | — Capital appreciation bond |
| CCAB | — Convertible capital appreciation bond |
| CDA | — Community Development Authority |
| CDO | — Collateralized debt obligation |
| DRIVER | — Derivative inverse tax-exempt receipts |
| DW&P | — Department of Water & Power |
| DWR | — Department of Water Resources |
| ECFA | — Educational & Cultural Facilities Authority |
| EDA | — Economic Development Authority |
| EDFA | — Economic Development Finance Authority |
| ETF | — Exchange-traded fund |
| FDIC | — Federal Deposit Insurance Corporation |
| FFCB | — Federal Farm Credit Banks |
| FGIC | — Financial Guaranty Insurance Corporation |
| FHA | — Federal Housing Administration |
| FHLB | — Federal Home Loan Bank |
| FHLMC | — Federal Home Loan Mortgage Corporation |
| FICO | — The Financing Corporation |
| FNMA | — Federal National Mortgage Association |
| GDR | — Global depositary receipt |
| GNMA | — Government National Mortgage Association |
| HCFR | — Healthcare facilities revenue |
| HEFA | — Health & Educational Facilities Authority |
| HEFAR | — Higher education facilities authority revenue |
| HFA | — Housing Finance Authority |
| HFFA | — Health Facilities Financing Authority |
| HUD | — Department of Housing and Urban Development |
| IDA | — Industrial Development Authority |
| IDAG | — Industrial Development Agency |
| KRW | — Republic of Korea won |
| LIBOR | — London Interbank Offered Rate |
| LIFER | — Long Inverse Floating Exempt Receipts |
| LLC | — Limited liability company |
| LLLP | — Limited liability limited partnership |
| LLP | — Limited liability partnership |
| MBIA | — Municipal Bond Insurance Association |
| MFHR | — Multifamily housing revenue |
| MSTR | — Municipal securities trust receipts |
| MUD | — Municipal Utility District |
| National | — National Public Finance Guarantee Corporation |
| PCFA | — Pollution Control Financing Authority |
| PCL | — Public Company Limited |
| PCR | — Pollution control revenue |
| PFA | — Public Finance Authority |
| PFFA | — Public Facilities Financing Authority |
| PFOTER | — Puttable floating option tax-exempt receipts |
| plc | — Public limited company |
| PUTTER | — Puttable tax-exempt receipts |
| R&D | — Research & development |
| Radian | — Radian Asset Assurance |
| RAN | — Revenue anticipation notes |
| RDA | — Redevelopment Authority |
| RDFA | — Redevelopment Finance Authority |
| REIT | — Real estate investment trust |
| ROC | — Reset option certificates |
| SAVRS | — Select auction variable rate securities |
| SBA | — Small Business Authority |
| SDR | — Swedish depositary receipt |
| SFHR | — Single-family housing revenue |
| SFMR | — Single-family mortgage revenue |
| SPA | — Standby purchase agreement |
| SPDR | — Standard & Poor’s Depositary Receipts |
| SPEAR | — Short Puttable Exempt Adjustable Receipts |
| STRIPS | — Separate trading of registered interest and |
| TAN | — Tax anticipation notes |
| TIPS | — Treasury inflation-protected securities |
| TRAN | — Tax revenue anticipation notes |
| TTFA | — Transportation Trust Fund Authority |
| TVA | — Tennessee Valley Authority |

For more information
More information about Wells Fargo Funds is available free upon request. To obtain literature, please write, email, visit the Fund’s website, or call:
Wells Fargo Funds
P.O. Box 8266
Boston, MA 02266-8266
Email: fundservice@wellsfargo.com
Website: wellsfargofunds.com
Individual investors: 1-800-222-8222
Retail investment professionals: 1-888-877-9275
Institutional investment professionals: 1-866-765-0778
This report and the financial statements contained herein are submitted for the general information of the shareholders of the Fund. If this report is used for promotional purposes, distribution of the report must be accompanied or preceded by a current prospectus. Before investing, please consider the investment objectives, risks, charges, and expenses of the investment. For a current prospectus and, if available, a summary prospectus, containing this information, call 1-800-222-8222 or visit the Fund’s website at wellsfargofunds.com. Read the prospectus carefully before you invest or send money.
Wells Fargo Asset Management (WFAM) is a trade name used by the asset management businesses of Wells Fargo & Company. Wells Fargo Funds Management, LLC, a wholly owned subsidiary of Wells Fargo & Company, provides investment advisory and administrative services for Wells Fargo Funds. Other affiliates of Wells Fargo & Company provide subadvisory and other services for the funds. The funds are distributed by Wells Fargo Funds Distributor, LLC, Member FINRA, an affiliate of Wells Fargo & Company. Neither Wells Fargo Funds Management nor Wells Fargo Funds Distributor has Fund customer accounts/assets, and neither provides investment advice/recommendations or acts as an investment advice fiduciary to any investor.
NOT FDIC INSURED ¡ NO BANK GUARANTEE ¡ MAY LOSE VALUE
© 2016 Wells Fargo Funds Management, LLC. All rights reserved.
| | |
 | | 247340 12-16 A237/AR237 10-16 |
Annual Report
October 31, 2016

Wells Fargo Emerging Markets Equity Fund


Reduce clutter. Save trees.
Sign up for electronic delivery of prospectuses and shareholder reports at wellsfargo.com/advantagedelivery
Contents
The views expressed and any forward-looking statements are as of October 31, 2016, unless otherwise noted, and are those of the Fund managers and/or Wells Fargo Funds Management, LLC. Discussions of individual securities, or the markets generally, or any Wells Fargo Fund are not intended as individual recommendations. Future events or results may vary significantly from those expressed in any forward-looking statements. The views expressed are subject to change at any time in response to changing circumstances in the market. Wells Fargo Funds Management, LLC and the Fund disclaim any obligation to publicly update or revise any views expressed or forward-looking statements.
NOT FDIC INSURED ¡ NO BANK GUARANTEE ¡ MAY LOSE VALUE
| | | | |
| 2 | | Wells Fargo Emerging Markets Equity Fund | | Letter to shareholders (unaudited) |

Karla M. Rabusch
President
Wells Fargo Funds
Political events in some countries prompted investor concern.
The business-supportive stance of major central banks helped offset volatility following the U.S. rate increase.
Dear Shareholder:
We are pleased to offer you this annual report for the Wells Fargo Emerging Markets Equity Fund for the 12-month period that ended October 31, 2016. Entering the reporting period, many emerging markets commentaries focused on the potential effect of the U.S. Federal Reserve (Fed) raising its key interest rate in December 2015 and concerns about slowing economic growth in China. Political events in some countries prompted investor concern. Throughout the period, the European Central Bank (ECB), the Bank of Japan (BOJ), and the People’s Bank of China (PBOC), maintained policies intended to encourage business activity including low—even negative—interest rates to boost lending and bond-buying programs to enhance liquidity. As the period ended, it appeared that these efforts, the Fed’s hesitancy to raise rates further, and effective resolution of some of the political issues contributed to improving economic data and investment results in several countries in the emerging markets.
In early 2016, emerging markets economies endured challenges.
Following the Fed’s decision in December 2015 to increase rates, the relative value of the U.S. dollar increased. The stronger U.S. dollar pressured emerging markets importers and benefited exporters. In November 2015, the PBOC reduced short-term borrowing costs. The ECB pushed interest rates paid on deposits further into negative territory in late 2015. In January 2016, the BOJ followed the ECB’s lead by setting a negative deposit rate. The Fed indicated that it would be cautious about further rate increases in consideration of global growth risks. The business-supportive stance of major central banks helped offset volatility following the U.S. rate increase.
Political issues affected some emerging markets during the period. Brazil endured a bribery scandal involving the state-owned oil company, Petróleo Brasileiro S.A., and the president was impeached after a scandal related to unauthorized loans from state-owned banks. In addition, a June 2016 referendum approved the U.K.’s exit from the European Union (Brexit), casting uncertainty, particularly on European emerging markets, such as the Czech Republic, Greece, Hungary, and Poland. Despite dire news headlines, each event appeared to have little lasting effect on the markets as governments worked to minimize any negative influence. The Morgan Stanley Capital International (MSCI) Emerging Markets (EM) Index (Net)1 finished the first half of the period with a (0.13)% return.
A second-half turnaround benefited investments in emerging markets.
Investors’ sentiments improved during the third quarter of 2016, which led to positive returns across global equity markets. The MSCI EM Index (Net) reflected the improved investment climate over the last six months of the period, gaining 9.41%. For the full 12-month period, the index gained 9.27%.
Equity market volatility levels, as measured by the Chicago Board Options Exchange (CBOE) Market Volatility Index (VIX),2 remained relatively low throughout the second half of the period with a brief spike following the Brexit vote. A recovery in commodity prices benefited oil-sensitive economies such as Colombia and other producers and exporters of natural resources in Asia. As political issues were resolved, equity markets
| 1 | The Morgan Stanley Capital International (MSCI) Emerging Markets (EM) Index (Net) is a free-float-adjusted market-capitalization-weighted index that is designed to measure the equity market performance of emerging markets. The MSCI EM Index (Net) consists of the following 23 emerging markets country indexes: Brazil, Chile, China, Colombia, Czech Republic, Egypt, Greece, Hungary, India, Indonesia, Korea, Malaysia, Mexico, Peru, the Philippines, Poland, Qatar, Russia, South Africa, Taiwan, Thailand, Turkey, and United Arab Emirates. Source: MSCI. MSCI makes no express or implied warranties or representations and shall have no liability whatsoever with respect to any MSCI data contained herein. The MSCI data may not be further redistributed or used as a basis for other indexes or any securities or financial products. This report is not approved, reviewed, or produced by MSCI. You cannot invest directly in an index. |
| 2 | The Chicago Board Options Exchange (CBOE) Market Volatility Index (VIX) is a popular measure of the implied volatility of S&P 500 Index options. It represents one measure of the market’s expectation of stock market volatility over the next 30-day period. You cannot invest directly in an index. |
| | | | | | |
| Letter to shareholders (unaudited) | | Wells Fargo Emerging Markets Equity Fund | | | 3 | |
in the respective countries moved higher; Brazilian shares advanced on the installation of a new government, and Peruvian shares gained on a market-friendly election outcome. Also, throughout the period and in several emerging markets countries, the passage of legislative and regulatory reforms that seek to enhance the structure, operations, and oversight of businesses tended to benefit investor confidence and encourage increased investment activity.
Don’t let short-term uncertainty derail long-term investment goals.
Periods of uncertainty can present challenges, but experience has taught us that maintaining long-term investment goals can be an effective way to plan for the future. To help you create a sound strategy based on your personal goals and risk tolerance, Wells Fargo Funds offers more than 100 mutual funds and other investments spanning a wide range of asset classes and investment styles. Although diversification cannot guarantee an investment profit or prevent losses, we believe it can be an effective way to manage investment risk and potentially smooth out overall portfolio performance. We encourage investors to know their investments and to understand that appropriate levels of risk-taking may unlock opportunities.
Thank you for choosing to invest with Wells Fargo Funds. We appreciate your confidence in us and remain committed to helping you meet your financial needs.
Sincerely,

Karla M. Rabusch
President
Wells Fargo Funds
For further information about your Fund, contact your investment professional, visit our website at wellsfargofunds.com, or call us directly at 1-800-222-8222. We are available 24 hours a day, 7 days a week.
| | | | |
| 4 | | Wells Fargo Emerging Markets Equity Fund | | Performance highlights (unaudited) |
Investment objective
The Fund seeks long-term capital appreciation.
Manager
Wells Fargo Funds Management, LLC
Subadviser
Wells Capital Management Incorporated
Portfolio managers
Derrick Irwin, CFA®
Richard Peck, CFA®
Yi (Jerry) Zhang, Ph.D., CFA®
Average annual total returns (%) as of October 31, 20161
| | | | | | | | | | | | | | | | | | | | | | | | | | | | | | | | | | |
| | | | | Including sales charge | | | Excluding sales charge | | | Expense ratios2 (%) | |
| | | Inception date | | 1 year | | | 5 year | | | 10 year | | | 1 year | | | 5 year | | | 10 year | | | Gross | | | Net3 | |
| Class A (EMGAX) | | 9-6-1994 | | | 7.40 | | | | (0.91 | ) | | | 3.95 | | | | 13.93 | | | | 0.27 | | | | 4.57 | | | | 1.61 | | | | 1.61 | |
| Class B (EMGBX)* | | 9-6-1994 | | | 8.05 | | | | (0.87 | ) | | | 4.03 | | | | 13.05 | | | | (0.47 | ) | | | 4.03 | | | | 2.36 | | | | 2.36 | |
| Class C (EMGCX) | | 9-6-1994 | | | 12.09 | | | | (0.47 | ) | | | 3.79 | | | | 13.09 | | | | (0.47 | ) | | | 3.79 | | | | 2.36 | | | | 2.36 | |
| Class R6 (EMGDX) | | 6-28-2013 | | | – | | | | – | | | | – | | | | 14.43 | | | | 0.73 | | | | 4.97 | | | | 1.18 | | | | 1.18 | |
| Administrator Class (EMGYX) | | 9-6-1994 | | | – | | | | – | | | | – | | | | 14.07 | | | | 0.43 | | | | 4.77 | | | | 1.53 | | | | 1.49 | |
| Institutional Class (EMGNX) | | 7-30-2010 | | | – | | | | – | | | | – | | | | 14.40 | | | | 0.70 | | | | 4.95 | | | | 1.28 | | | | 1.22 | |
| MSCI EM Index (Net)4 | | – | | | – | | | | – | | | | – | | | | 9.27 | | | | 0.55 | | | | 3.49 | | | | – | | | | – | |
| * | | Class B shares are closed to investment, except in connection with the reinvestment of any distributors and permitted exchanges. |
Figures quoted represent past performance, which is no guarantee of future results, and do not reflect taxes that a shareholder may pay on fund distributions or the redemption of fund shares. Investment return and principal value of an investment will fluctuate so that an investor’s shares, when redeemed, may be worth more or less than their original cost. Performance shown without sales charges would be lower if sales charges were reflected. Current performance may be lower or higher than the performance data quoted, which assumes the reinvestment of dividends and capital gains. Current month-end performance is available on the Fund’s website, wellsfargofunds.com.
Index returns do not include transaction costs associated with buying and selling securities, any mutual fund fees or expenses, or any taxes. It is not possible to invest directly in an index.
For Class A shares, the maximum front-end sales charge is 5.75%. For Class B shares, the maximum contingent deferred sales charge is 5.00%. For Class C shares, the maximum contingent deferred sales charge is 1.00%. Performance including a contingent deferred sales charge assumes the sales charge for the corresponding time period. Class R6, Administrator Class, and Institutional Class shares are sold without a front-end sales charge or contingent deferred sales charge.
Stock values fluctuate in response to the activities of individual companies and general market and economic conditions. Foreign investments are especially volatile and can rise or fall dramatically due to differences in the political and economic conditions of the host country. These risks are generally intensified in emerging markets. The use of derivatives may reduce returns and/or increase volatility. Certain investment strategies tend to increase the total risk of an investment (relative to the broader market). The Fund is exposed to smaller-company securities risk. Consult the Fund’s prospectus for additional information on these and other risks.
Please see footnotes on page 5.
| | | | | | |
| Performance highlights (unaudited) | | Wells Fargo Emerging Markets Equity Fund | | | 5 | |
|
| Growth of $10,000 investment as of October 31, 20165 |
|
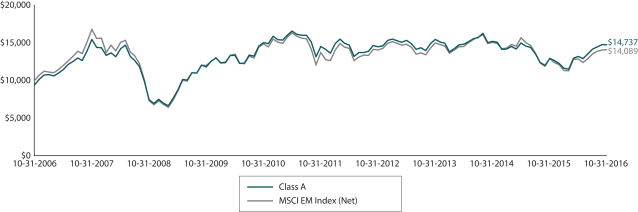 |
| 1 | Historical performance shown for Class R6 shares prior to their inception reflects the performance of Institutional Class shares and includes the higher expenses applicable to Institutional Class��shares. If these expenses had not been included, returns would have been higher. Historical performance shown for Institutional Class shares prior to their inception reflects the performance of Administrator Class shares and includes the higher expenses applicable to Administrator Class shares. If these expenses had not been included, returns would be higher. Historical performance shown for all classes of the Fund prior to July 19, 2010, is based on the performance of the Fund’s predecessor, Evergreen Emerging Markets Growth Fund. |
| 2 | Reflects the expense ratios as stated in the most recent prospectuses. The expense ratios shown are subject to change and may differ from the annualized expense ratios shown in the financial highlights of this report. |
| 3 | The manager has contractually committed through February 28, 2017, to waive fees and/or reimburse expenses to the extent necessary to cap the Fund’s Total Annual Operating Expenses After Fee Waiver at the amounts shown. After this time, the cap may be increased or the commitment to maintain the cap may be terminated only with the approval of the Board of Trustees. Brokerage commissions, stamp duty fees, interest, taxes, acquired fund fees and expenses, and extraordinary expenses are excluded from the expense cap. Without this cap, the Fund’s returns would have been lower. |
| 4 | The Morgan Stanley Capital International (MSCI) Emerging Markets (EM) Index (Net) is a free-float-adjusted market-capitalization-weighted index that is designed to measure the equity market performance of emerging markets. The MSCI EM Index (Net) consists of the following 23 emerging markets country indexes: Brazil, Chile, China, Colombia, Czech Republic, Egypt, Greece, Hungary, India, Indonesia, Korea, Malaysia, Mexico, Peru, the Philippines, Poland, Qatar, Russia, South Africa, Taiwan, Thailand, Turkey, and United Arab Emirates. Source: MSCI. MSCI makes no express or implied warranties or representations and shall have no liability whatsoever with respect to any MSCI data contained herein. The MSCI data may not be further redistributed or used as a basis for other indexes or any securities or financial products. This report is not approved, reviewed, or produced by MSCI. You cannot invest directly in an index |
| 5 | The chart compares the performance of Class A shares for the most recent ten years with the MSCI EM Index (Net). The chart assumes a hypothetical investment of $10,000 in Class A shares and reflects all operating expenses and assumes the maximum initial sales charge of 5.75%. |
| 6 | The ten largest holdings, excluding cash and cash equivalents, are calculated based on the value of the investments divided by total net assets of the Fund. Holdings are subject to change and may have changed since the date specified. |
| 7 | Amounts are calculated based on the total long-term investments of the Fund. These amounts are subject to change and may have changed since the date specified. |
| | | | |
| 6 | | Wells Fargo Emerging Markets Equity Fund | | Performance highlights (unaudited) |
MANAGER’S DISCUSSION
Fund highlights
| ∎ | | The Fund outperformed its benchmark, the Morgan Stanley Capital International (MSCI) Emerging Markets (EM) Index (Net), for the 12-month period that ended October 31, 2016. |
| ∎ | | The largest relative contributors among sectors included information technology (IT), consumer discretionary, and financials. China/Hong Kong and Korea were among the most notable contributors on a country basis. |
| ∎ | | Top detracting sectors included telecommunication services and real estate. Among countries, detractors included Mexico, Indonesia, and Turkey. |
Conditions turned positive for emerging markets equities by the spring of 2016.
Despite significant macroeconomic and political news during the period under review, we noted a shift towards stock-specific issues as drivers of emerging markets equity performance. This shift is an important change, in our view, from prior periods, when macroeconomic drivers dominated.
Emerging market equites began the period extending a decline than began in the spring of 2015 and fell decisively below their long-term trading range that had been in place since 2011. China was in the spotlight, with investors around the world watching the worrying outflow of foreign exchange reserves and speculating whether this circumstance might lead to an economic crisis. This toxic environment combined with fears of a global growth slowdown to weigh more broadly on emerging markets currencies and share prices. Between November 2015 and late January 2016, emerging markets equities fell 20%, as measured by the MSCI EM Index (Net).
Then, as if on cue, everything changed on January 21, 2016. The initial catalyst was the announcement that the People’s Bank of China would inject 600 billion yuan into the banking system, shoring up concerns over an imminent banking crisis. Financial markets rallied and dragged crude oil prices along for the ride, as investors also cheered better-than-expected U.S. crude inventory data.
By spring 2016, conditions turned supportive for emerging markets equities. Global central banks’ policies remained accommodative, the U.S. dollar continued to weaken, and commodity prices continued to rise. Volatility increased in June as investors focused on a referendum in the U.K. to leave the European Union, dubbed “Brexit.” However, it was not long before a more ebullient mood reemerged. With most of the major global central banks indicating that interest rates would remain low, funds flowed into both emerging markets bond and equity funds as investors began to search for higher yielding assets. With these events as a backdrop, stocks responded to positive earnings announcements and signs of stabilizing returns on capital at many companies.
In recent months, markets focused to a greater degree on global drivers including the U.S. Federal Reserve and speculation about a fourth quarter interest-rate hike. The U.S. presidential debates drew investor attention to the November presidential election, and concerns over potential protectionism in the U.S. led to increased volatility for the Mexican peso.
We made limited changes to the portfolio over the year, adding China’s Want Want China Holdings Limited and Gridsum Holding Incorporated, as well as AES Gener S.A. in Chile. Brazil’s Petroleo Brasileiro S.A. and Vale S.A., and South Africa’s Sasol Limited were eliminated while China’s Mindray Medical International Limited was removed because it was taken private.
| | | | |
| Ten largest holdings (%) as of October 31, 20166 | |
Samsung Electronics Company Limited | | | 5.05 | |
Taiwan Semiconductor Manufacturing Company Limited ADR | | | 3.18 | |
China Mobile Limited | | | 3.06 | |
Fomento Economico Mexicano SAB de CV ADR | | | 2.60 | |
SINA Corporation | | | 2.21 | |
Uni-President Enterprises Corporation | | | 2.13 | |
New Oriental Education & Technology Group Incorporated | | | 2.02 | |
China Life Insurance Company Limited H Shares | | | 1.91 | |
AIA Group Limited | | | 1.86 | |
WH Group Limited | | | 1.83 | |
In the portfolio, positive stock selection in China/Hong Kong, Korea, and Brazil was offset by weaker results among portfolio stocks in Mexico and Indonesia. In China/Hong Kong, the Fund benefited from strong performances from such companies as SINA Corporation, Weibo Corporation, New Oriental Education & Technology Group Incorporated, and WH Group Limited. Our biggest challenges were related to the Fund’s positions in China Life Insurance Company Limited and Belle International Holdings Limited, as well as our underweight positioning in Tencent Holdings Limited. Our overweight position in Mexico was impaired by a weak Mexican peso.
Please see footnotes on page 5.
| | | | | | |
| Performance highlights (unaudited) | | Wells Fargo Emerging Markets Equity Fund | | | 7 | |
Among sectors, IT was a key performance driver across a number of regions and business types. This included SINA, Weibo, Taiwan Semiconductor Manufacturing Company Limited, and Russia’s Yandex N.V. In consumer discretionary, portfolio performance benefited from the strong performance of New Oriental Education and Ctrip.com International, Limited, in China, and Lojas Americanas S.A. in Brazil. The Fund lagged in the telecommunication services sector, as America Movil, S.A.B. de C.V., in Mexico, China Mobile Limited, and Bharti Airtel Limited in India all underperformed. Our real estate holding in Mexico, Fibra Uno Administracion S.A. de C.V. also detracted.
|
| Sector distribution as of October 31, 20167 |
|
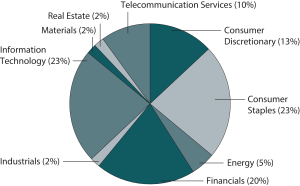 |
|
| Country allocation as of October 31, 20167 |
|
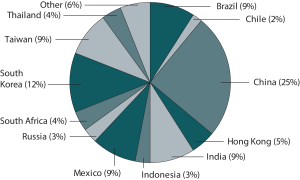
|
We remain cautiously optimistic about the opportunities in emerging markets.
Emerging markets equities have staged an impressive rally off of late-January 2016 lows. While fundamental drivers offer important support, markets clearly enjoy a tailwind from low interest rates and high levels of liquidity globally. Overall, it seems that many of the global macroeconomic trends currently in place should likely remain market drivers into 2017, although to a lesser degree perhaps. Declining margins, a key driver of the lower returns in emerging markets, are projected to stabilize in 2017 which should support returns on capital across the asset class.
While we are encouraged by signs of economic recovery and gradually improving company fundamentals in emerging markets, speculation about global interest rates may increase into 2017. Further, while growth in China has stabilized, the presence of speculative mini-bubbles could be indicative of larger problems below the surface that need to be monitored closely. Our approach has been to use market movements to continually improve the quality of our portfolios and to focus on the longer-term prospects of the companies in which we invest. We think this should be more profitable over time than trying to outguess short-term volatility.
Please see footnotes on page 5.
| | | | |
| 8 | | Wells Fargo Emerging Markets Equity Fund | | Fund expenses (unaudited) |
As a shareholder of the Fund, you incur two types of costs: (1) transaction costs, including sales charges (loads) on purchase payments and contingent deferred sales charges (if any) on redemptions and (2) ongoing costs, including management fees, distribution (12b-1) and/or shareholder servicing fees, and other Fund expenses. This example is intended to help you understand your ongoing costs (in dollars) of investing in the Fund and to compare these costs with the ongoing costs of investing in other mutual funds.
The example is based on an investment of $1,000 invested at the beginning of the six-month period and held for the entire period from May 1, 2016 to October 31, 2016.
Actual expenses
The “Actual” line of the table below provides information about actual account values and actual expenses. You may use the information in this line, together with the amount you invested, to estimate the expenses that you paid over the period. Simply divide your account value by $1,000 (for example, an $8,600 account value divided by $1,000 = 8.6), then multiply the result by the number in the “Actual” line under the heading entitled “Expenses paid during period” for your applicable class of shares to estimate the expenses you paid on your account during this period.
Hypothetical example for comparison purposes
The “Hypothetical” line of the table below provides information about hypothetical account values and hypothetical expenses based on the Fund’s actual expense ratio and an assumed rate of return of 5% per year before expenses, which is not the Fund’s actual return. The hypothetical account values and expenses may not be used to estimate the actual ending account balance or expenses you paid for the period. You may use this information to compare the ongoing costs of investing in the Fund and other funds. To do so, compare this 5% hypothetical example with the 5% hypothetical examples that appear in the shareholder reports of the other funds.
Please note that the expenses shown in the table are meant to highlight your ongoing costs only and do not reflect any transactional costs, such as sales charges (loads) and contingent deferred sales charges. Therefore, the “Hypothetical” line of the table is useful in comparing ongoing costs only and will not help you determine the relative total costs of owning different funds. In addition, if these transactional costs were included, your costs would have been higher.
| | | | | | | | | | | | | | | | |
| | | Beginning
account value
5-1-2016 | | | Ending
account value
10-31-2016 | | | Expenses
paid during
the period1 | | | Annualized net
expense ratio | |
Class A | | | | | | | | | | | | | | | | |
Actual | | $ | 1,000.00 | | | $ | 1,114.80 | | | $ | 8.50 | | | | 1.60 | % |
Hypothetical (5% return before expenses) | | $ | 1,000.00 | | | $ | 1,017.10 | | | $ | 8.10 | | | | 1.60 | % |
Class B | | | | | | | | | | | | | | | | |
Actual | | $ | 1,000.00 | | | $ | 1,110.33 | | | $ | 12.45 | | | | 2.35 | % |
Hypothetical (5% return before expenses) | | $ | 1,000.00 | | | $ | 1,013.33 | | | $ | 11.88 | | | | 2.35 | % |
Class C | | | | | | | | | | | | | | | | |
Actual | | $ | 1,000.00 | | | $ | 1,110.54 | | | $ | 12.46 | | | | 2.35 | % |
Hypothetical (5% return before expenses) | | $ | 1,000.00 | | | $ | 1,013.33 | | | $ | 11.89 | | | | 2.35 | % |
Class R6 | | | | | | | | | | | | | | | | |
Actual | | $ | 1,000.00 | | | $ | 1,117.13 | | | $ | 6.22 | | | | 1.17 | % |
Hypothetical (5% return before expenses) | | $ | 1,000.00 | | | $ | 1,019.26 | | | $ | 5.93 | | | | 1.17 | % |
Administrator Class | | | | | | | | | | | | | | | | |
Actual | | $ | 1,000.00 | | | $ | 1,114.97 | | | $ | 7.92 | | | | 1.49 | % |
Hypothetical (5% return before expenses) | | $ | 1,000.00 | | | $ | 1,017.64 | | | $ | 7.56 | | | | 1.49 | % |
Institutional Class | | | | | | | | | | | | | | | | |
Actual | | $ | 1,000.00 | | | $ | 1,116.55 | | | $ | 6.49 | | | | 1.22 | % |
Hypothetical (5% return before expenses) | | $ | 1,000.00 | | | $ | 1,019.00 | | | $ | 6.19 | | | | 1.22 | % |
| 1 | Expenses paid is equal to the annualized net expense ratio of each class multiplied by the average account value over the period, multiplied by the number of days in the most recent fiscal half-year divided by the number of days in the fiscal year (to reflect the one-half-year period). |
| | | | | | |
| Portfolio of investments—October 31, 2016 | | Wells Fargo Emerging Markets Equity Fund | | | 9 | |
| | | | | | | | | | | | | | | | |
| Security name | | | | | | | | Shares | | | Value | |
| | | | | | | | | | | | | | | | |
|
Common Stocks: 96.25% | |
|
| Argentina: 0.44% | |
MercadoLibre Incorporated (Information Technology, Internet Software & Services) | | | | | | | | | | | 82,800 | | | $ | 13,911,228 | |
| | | | | | | | | | | | | | | | |
|
| Brazil: 7.33% | |
Ambev SA ADR (Consumer Staples, Beverages) | | | | | | | | | | | 5,922,000 | | | | 34,939,800 | |
B2W Cia Digital (Consumer Discretionary, Internet & Direct Marketing Retail) † | | | | | | | | | | | 3,001,424 | | | | 14,743,837 | |
Banco Bradesco SA ADR (Financials, Banks) | | | | | | | | | | | 3,201,773 | | | | 33,330,457 | |
BM&F Bovespa SA (Financials, Capital Markets) | | | | | | | | | | | 5,839,000 | | | | 34,390,100 | |
BRF Brasil Foods SA ADR (Consumer Staples, Food Products) « | | | | | | | | | | | 976,078 | | | | 16,320,024 | |
CETIP SA (Financials, Capital Markets) | | | | | | | | | | | 2,441,437 | | | | 34,319,323 | |
Lojas Renner SA (Consumer Discretionary, Multiline Retail) | | | | | | | | | | | 2,927,500 | | | | 24,762,688 | |
Multiplan Empreendimentos Imobiliarios SA (Real Estate, Real Estate Management & Development) | | | | | | | | | | | 756,200 | | | | 15,197,440 | |
Raia Drogasil SA (Consumer Staples, Food & Staples Retailing) | | | | | | | | | | | 701,600 | | | | 15,574,992 | |
Rumo Logistica Operadora Multimodal SA (Industrials, Road & Rail) † | | | | | | | | | | | 2,395,351 | | | | 5,358,022 | |
| | | | |
| | | | | | | | | | | | | | | 228,936,683 | |
| | | | | | | | | | | | | | | | |
|
| Chile: 2.30% | |
AES Gener SA (Utilities, Independent Power & Renewable Electricity Producers) | | | | | | | | | | | 16,613,250 | | | | 5,656,013 | |
Banco Santander Chile SA ADR (Financials, Banks) « | | | | | | | | | | | 1,407,392 | | | | 32,158,907 | |
SACI Falabella (Consumer Discretionary, Multiline Retail) | | | | | | | | | | | 4,357,228 | | | | 34,185,716 | |
| | | | |
| | | | | | | | | | | | | | | 72,000,636 | |
| | | | | | | | | | | | | | | | |
|
| China: 24.83% | |
51Job Incorporated ADR (Industrials, Professional Services) † | | | | | | | | | | | 1,058,941 | | | | 36,003,994 | |
Alibaba Group Holding Limited ADR (Information Technology, Internet Software & Services) † | | | | | | | | | | | 292,037 | | | | 29,697,243 | |
Baidu Incorporated ADR (Information Technology, Internet Software & Services) † | | | | | | | | | | | 108,540 | | | | 19,196,384 | |
Belle International Holdings Limited (Consumer Discretionary, Textiles, Apparel & Luxury Goods) | | | | | | | | | | | 52,059,000 | | | | 31,548,672 | |
China Auto Rental Incorporated (Industrials, Road & Rail) Ǡ | | | | | | | | | | | 1,256,469 | | | | 1,276,631 | |
China International Capital Corporation Limited H Shares (Financials, Diversified Financial Services) Ǡ | | | | | | | | | | | 1,334,904 | | | | 1,962,196 | |
China Life Insurance Company Limited H Shares (Financials, Insurance) | | | | | | | | | | | 24,018,290 | | | | 59,646,610 | |
China Mobile Limited (Telecommunication Services, Wireless Telecommunication Services) | | | | | | | | | | | 8,350,165 | | | | 95,662,095 | |
CNOOC Limited (Energy, Oil, Gas & Consumable Fuels) | | | | | | | | | | | 24,574,000 | | | | 31,273,782 | |
Ctrip.com International Limited ADR (Consumer Discretionary, Internet & Direct Marketing Retail) † | | | | | | | | | | | 1,082,632 | | | | 47,798,203 | |
Gridsum Holding Incorporated ADR (Information Technology, Software) † | | | | | | | | | | | 391,040 | | | | 5,501,933 | |
Hengan International Group Company Limited (Consumer Staples, Personal Products) | | | | | | | | | | | 4,527,000 | | | | 36,044,155 | |
Legend Holdings Corporation H Shares (Financials, Diversified Financial Services) | | | | | | | | | | | 908,901 | | | | 2,266,525 | |
Li Ning Company Limited (Consumer Discretionary, Textiles, Apparel & Luxury Goods) † | | | | | | | | | | | 25,884,207 | | | | 18,489,792 | |
New Oriental Education & Technology Group Incorporated (Consumer Discretionary, Diversified Consumer Services) † | | | | | | | | | | | 1,260,182 | | | | 63,172,924 | |
PetroChina Company Limited H Shares (Energy, Oil, Gas & Consumable Fuels) | | | | | | | | | | | 11,566,000 | | | | 7,963,644 | |
Shandong Weigao Group Medical Polymer Company Limited H Shares (Health Care, Health Care Equipment & Supplies) | | | | | | | | | | | 18,024,000 | | | | 11,759,506 | |
SINA Corporation (Information Technology, Internet Software & Services) Ǡ | | | | | | | | | | | 955,907 | | | | 68,959,131 | |
Tencent Holdings Limited (Information Technology, Internet Software & Services) | | | | | | | | | | | 1,678,800 | | | | 44,548,361 | |
Tingyi Holding Corporation (Consumer Staples, Food Products) « | | | | | | | | | | | 15,898,000 | | | | 17,157,553 | |
Tsingtao Brewery Company Limited H Shares (Consumer Staples, Beverages) | | | | | | | | | | | 7,910,000 | | | | 31,617,358 | |
Vipshop Holdings Limited ADR (Consumer Discretionary, Internet & Direct Marketing Retail) † | | | | | | | | | | | 3,404,738 | | | | 46,542,768 | |
Want Want China Holdings Limited (Consumer Staples, Food Products) « | | | | | | | | | | | 32,004,000 | | | | 19,518,786 | |
Weibo Corporation ADR (Information Technology, Internet Software & Services) Ǡ | | | | | | | | | | | 1,052,436 | | | | 48,422,557 | |
| | | | |
| | | | | | | | | | | | | | | 776,030,803 | |
| | | | | | | | | | | | | | | | |
|
| Colombia: 0.54% | |
Bancolombia SA ADR (Financials, Banks) | | | | | | | | | | | 442,400 | | | | 16,935,072 | |
| | | | | | | | | | | | | | | | |
The accompanying notes are an integral part of these financial statements.
| | | | |
| 10 | | Wells Fargo Emerging Markets Equity Fund | | Portfolio of investments—October 31, 2016 |
| | | | | | | | | | | | | | | | |
| Security name | | | | | | | | Shares | | | Value | |
| | | | | | | | | | | | | | | | |
|
| Hong Kong: 4.65% | |
AIA Group Limited (Financials, Insurance) | | | | | | | | | | | 9,201,400 | | | $ | 58,075,640 | �� |
Johnson Electric Holdings Limited (Industrials, Electrical Equipment) | | | | | | | | | | | 4,214,250 | | | | 10,193,904 | |
Sun Art Retail Group Limited (Consumer Staples, Food & Staples Retailing) « | | | | | | | | | | | 28,090,500 | | | | 19,812,268 | |
WH Group Limited (Consumer Staples, Food Products) 144A | | | | | | | | | | | 70,405,500 | | | | 57,101,120 | |
| | | | |
| | | | | | | | | | | | | | | 145,182,932 | |
| | | | | | | | | | | | | | | | |
|
| India: 8.97% | |
Bharti Airtel Limited (Telecommunication Services, Wireless Telecommunication Services) | | | | | | | | | | | 3,738,728 | | | | 17,840,920 | |
Bharti Infratel Limited (Telecommunication Services, Diversified Telecommunication Services) | | | | | | | | | | | 3,253,851 | | | | 16,930,266 | |
HDFC Bank Limited ADR (Financials, Banks) | | | | | | | | | | | 123,826 | | | | 8,764,404 | |
Housing Development Finance Corporation Limited (Financials, Thrifts & Mortgage Finance) | | | | | | | | | | | 1,825,700 | | | | 37,655,840 | |
ICICI Bank Limited ADR (Financials, Banks) | | | | | | | | | | | 3,281,775 | | | | 27,205,915 | |
Indusind Bank Limited (Financials, Banks) | | | | | | | | | | | 817,217 | | | | 14,622,331 | |
Infosys Limited ADR (Information Technology, IT Services) | �� | | | | | | | | | | 2,217,460 | | | | 33,838,440 | |
ITC Limited (Consumer Staples, Tobacco) | | | | | | | | | | | 15,268,960 | | | | 55,246,857 | |
Reliance Industries Limited (Energy, Oil, Gas & Consumable Fuels) | | | | | | | | | | | 744,200 | | | | 11,713,491 | |
Reliance Industries Limited GDR (Energy, Oil, Gas & Consumable Fuels) 144A | | | | | | | | | | | 1,246,587 | | | | 39,516,808 | |
Ultra Tech Cement Limited (Materials, Construction Materials) | | | | | | | | | | | 286,000 | | | | 16,976,118 | |
| | | | |
| | | | | | | | | | | | | | | 280,311,390 | |
| | | | | | | | | | | | | | | | |
|
| Indonesia: 2.68% | |
PT Astra International Tbk (Consumer Discretionary, Automobiles) | | | | | | | | | | | 14,651,000 | | | | 9,235,475 | |
PT Bank Central Asia Tbk (Financials, Banks) | | | | | | | | | | | 9,549,500 | | | | 11,362,353 | |
PT Blue Bird Tbk (Industrials, Road & Rail) | | | | | | | | | | | 13,605,309 | | | | 2,919,594 | |
PT Link Net Tbk (Telecommunication Services, Diversified Telecommunication Services) | | | | | | | | | | | 42,078,161 | | | | 16,124,372 | |
PT Matahari Department Store Tbk (Consumer Discretionary, Multiline Retail) | | | | | | | | | | | 10,474,600 | | | | 14,470,008 | |
PT Telekomunikasi Indonesia Persero ADR Tbk (Telecommunication Services, Diversified Telecommunication Services) « | | | | | | | | | | | 907,754 | | | | 29,492,927 | |
| | | | |
| | | | | | | | | | | | | | | 83,604,729 | |
| | | | | | | | | | | | | | | | |
|
| Malaysia: 1.04% | |
Genting Bhd (Consumer Discretionary, Hotels, Restaurants & Leisure) | | | | | | | | | | | 8,480,900 | | | | 15,849,882 | |
Genting Malaysia Bhd (Consumer Discretionary, Hotels, Restaurants & Leisure) | | | | | | | | | | | 14,396,300 | | | | 16,335,253 | |
Sime Darby Bhd (Industrials, Industrial Conglomerates) | | | | | | | | | | | 115,937 | | | | 226,347 | |
| | | | |
| | | | | | | | | | | | | | | 32,411,482 | |
| | | | | | | | | | | | | | | | |
|
| Mexico: 9.27% | |
America Movil SAB de CV ADR (Telecommunication Services, Wireless Telecommunication Services) « | | | | | | | | | | | 2,782,320 | | | | 36,559,685 | |
Cemex SAB de CV ADR (Materials, Construction Materials) † | | | | | | | | | | | 2,616,393 | | | | 22,710,291 | |
Fibra Uno Administracion SAB de CV (Real Estate, Equity REITs) | | | | | | | | | | | 25,336,922 | | | | 48,218,035 | |
Fomento Economico Mexicano SAB de CV ADR (Consumer Staples, Beverages) | | | | | | | | | | | 850,100 | | | | 81,329,067 | |
Grupo Financiero Banorte SAB de CV (Financials, Banks) | | | | | | | | | | | 7,568,188 | | | | 44,645,943 | |
Grupo Financiero Santander SAB de CV ADR (Financials, Banks) | | | | | | | | | | | 2,048,441 | | | | 18,538,391 | |
Grupo Sanborns SAB de CV (Consumer Discretionary, Multiline Retail) | | | | | | | | | | | 814,226 | | | | 1,012,775 | |
Grupo Televisa SAB ADR (Consumer Discretionary, Media) | | | | | | | | | | | 722,000 | | | | 17,710,660 | |
Telesites SAB de CV (Telecommunication Services, Diversified Telecommunication Services) † | | | | | | | | | | | 3,052,320 | | | | 1,760,240 | |
Wal-Mart de Mexico SAB de CV (Consumer Staples, Food & Staples Retailing) | | | | | | | | | | | 8,127,100 | | | | 17,190,702 | |
| | | | |
| | | | | | | | | | | | | | | 289,675,789 | |
| | | | | | | | | | | | | | | | |
The accompanying notes are an integral part of these financial statements.
| | | | | | |
| Portfolio of investments—October 31, 2016 | | Wells Fargo Emerging Markets Equity Fund | | | 11 | |
| | | | | | | | | | | | | | | | |
| Security name | | | | | | | | Shares | | | Value | |
| | | | | | | | | | | | | | | | |
|
| Peru: 0.49% | |
Compania de Minas Buenaventura SA ADR (Materials, Metals & Mining) † | | | | | | | | | | | 1,152,495 | | | $ | 15,316,659 | |
| | | | | | | | | | | | | | | | |
|
| Philippines: 0.91% | |
Ayala Corporation (Financials, Diversified Financial Services) | | | | | | | | | | | 647,624 | | | | 11,167,660 | |
Metropolitan Bank & Trust Company (Financials, Banks) | | | | | | | | | | | 4,287,486 | | | | 7,198,567 | |
SM Investments Corporation (Industrials, Industrial Conglomerates) | | | | | | | | | | | 732,873 | | | | 10,170,699 | |
| | | | |
| | | | | | | | | | | | | | | 28,536,926 | |
| | | | | | | | | | | | | | | | |
|
| Russia: 2.65% | |
LUKOIL PJSC ADR (Energy, Oil, Gas & Consumable Fuels) | | | | | | | | | | | 434,249 | | | | 21,169,639 | |
Magnit (Consumer Staples, Food & Staples Retailing) (a) | | | | | | | | | | | 95,300 | | | | 15,979,161 | |
Mobile Telesystems ADR (Telecommunication Services, Wireless Telecommunication Services) | | | | | | | | | | | 1,217,800 | | | | 9,389,238 | |
Sberbank of Russia ADR (Financials, Banks) | | | | | | | | | | | 1,571,195 | | | | 14,910,641 | |
Yandex NV Class A (Information Technology, Internet Software & Services) † | | | | | | | | | | | 1,090,106 | | | | 21,464,187 | |
| | | | |
| | | | | | | | | | | | | | | 82,912,866 | |
| | | | | | | | | | | | | | | | |
|
| South Africa: 4.38% | |
AngloGold Ashanti Limited ADR (Materials, Metals & Mining) † | | | | | | | | | | | 878,071 | | | | 12,064,696 | |
Clicks Group Limited (Consumer Staples, Food & Staples Retailing) | | | | | | | | | | | 720,000 | | | | 6,701,400 | |
Impala Platinum Holdings Limited (Materials, Metals & Mining) † | | | | | | | | | | | 610,758 | | | | 2,455,035 | |
MTN Group Limited (Telecommunication Services, Wireless Telecommunication Services) | | | | | | | | | | | 2,102,643 | | | | 18,146,626 | |
Shoprite Holdings Limited (Consumer Staples, Food & Staples Retailing) | | | | | | | | | | | 2,838,100 | | | | 41,886,115 | |
Standard Bank Group Limited (Financials, Banks) | | | | | | | | | | | 1,710,190 | | | | 18,144,788 | |
Tiger Brands Limited (Consumer Staples, Food Products) | | | | | | | | | | | 1,320,333 | | | | 37,599,441 | |
| | | | |
| | | | | | | | | | | | | | | 136,998,101 | |
| | | | | | | | | | | | | | | | |
|
| South Korea: 11.60% | |
Amorepacific Corporation (Consumer Staples, Personal Products) | | | | | | | | | | | 29,300 | | | | 9,192,659 | |
KT Corporation ADR (Telecommunication Services, Diversified Telecommunication Services) « | | | | | | | | | | | 3,274,813 | | | | 52,364,260 | |
KT&G Corporation (Consumer Staples, Tobacco) | | | | | | | | | | | 218,091 | | | | 21,537,499 | |
Naver Corporation (Information Technology, Internet Software & Services) | | | | | | | | | | | 59,700 | | | | 44,713,043 | |
Samsung Biologics Company Limited (Health Care, Life Sciences Tools & Services) †(a) | | | | | | | | | | | 18,099 | | | | 2,172,671 | |
Samsung Electronics Company Limited (Information Technology, Technology Hardware, Storage & Peripherals) | | | | | | | | | | | 110,236 | | | | 157,899,763 | |
Samsung Life Insurance Company Limited (Financials, Insurance) | | | | | | | | | | | 445,337 | | | | 43,006,107 | |
SK Hynix Incorporated (Information Technology, Semiconductors & Semiconductor Equipment) | | | | | | | | | | | 883,000 | | | | 31,639,065 | |
| | | | |
| | | | | | | | | | | | | | | 362,525,067 | |
| | | | | | | | | | | | | | | | |
|
| Taiwan: 9.06% | |
104 Corporation (Industrials, Professional Services) | | | | | | | | | | | 1,655,000 | | | | 7,184,821 | |
Far Eastern New Century Corporation (Industrials, Industrial Conglomerates) | | | | | | | | | | | 7,466,448 | | | | 5,784,826 | |
MediaTek Incorporated (Information Technology, Semiconductors & Semiconductor Equipment) | | | | | | | | | | | 2,959,881 | | | | 22,510,384 | |
President Chain Store Corporation (Consumer Staples, Food & Staples Retailing) | | | | | | | | | | | 4,235,000 | | | | 31,671,077 | |
Taiwan Semiconductor Manufacturing Company Limited (Information Technology, Semiconductors & Semiconductor Equipment) | | | | | | | | | | | 8,385,224 | | | | 50,086,817 | |
Taiwan Semiconductor Manufacturing Company Limited ADR (Information Technology, Semiconductors & Semiconductor Equipment) | | | | | | | | | | | 3,192,852 | | | | 99,297,697 | |
Uni-President Enterprises Corporation (Consumer Staples, Food Products) | | | | | | | | | | | 34,362,368 | | | | 66,530,640 | |
| | | | |
| | | | | | | | | | | | | | | 283,066,262 | |
| | | | | | | | | | | | | | | | |
The accompanying notes are an integral part of these financial statements.
| | | | |
| 12 | | Wells Fargo Emerging Markets Equity Fund | | Portfolio of investments—October 31, 2016 |
| | | | | | | | | | | | | | | | |
| Security name | | | | | | | | Shares | | | Value | |
| | | | | | | | | | | | | | | | |
|
| Thailand: 3.54% | |
Bangkok Bank PCL (Financials, Banks) | | | | | | | | | | | 1,959,800 | | | $ | 8,903,727 | |
PTT Exploration & Production PCL (Energy, Oil, Gas & Consumable Fuels) | | | | | | | | | | | 4,128,139 | | | | 9,819,775 | |
PTT PCL (Energy, Oil, Gas & Consumable Fuels) | | | | | | | | | | | 2,115,900 | | | | 20,918,677 | |
Siam Commercial Bank PCL (Financials, Banks) | | | | | | | | | | | 7,405,100 | | | | 30,363,079 | |
Thai Beverage PCL (Consumer Staples, Beverages) | | | | | | | | | | | 58,527,000 | | | | 40,595,547 | |
| | | | |
| | | | | | | | | | | | | | | 110,600,805 | |
| | | | | | | | | | | | | | | | |
|
| Turkey: 0.80% | |
Anadolu Efes Biracilik Ve Malt Sanayii AS (Consumer Staples, Beverages) | | | | | | | | | | | 2,690,453 | | | | 16,442,261 | |
Avivasa Emeklilik Ve Hayat AS (Financials, Insurance) | | | | | | | | | | | 1,246,853 | | | | 8,413,764 | |
| | | | |
| | | | | | | | | | | | | | | 24,856,025 | |
| | | | | | | | | | | | | | | | |
|
| United Arab Emirates: 0.08% | |
Emaar Malls Group (Real Estate, Real Estate Management & Development) | | | | | | | | | | | 3,773,147 | | | | 2,640,109 | |
| | | | | | | | | | | | | | | | |
|
| United Kingdom: 0.69% | |
Standard Chartered plc (Financials, Banks) † | | | | | | | | | | | 2,475,244 | | | | 21,568,437 | |
| | | | | | | | | | | | | | | | |
| |
Total Common Stocks (Cost $2,672,714,109) | | | | 3,008,022,001 | |
| | | | | | | | | | | | | | | | |
| | | | |
| | | Interest rate | | | Maturity date | | | Principal | | | | |
| Convertible Debentures: 0.00% | |
| | |
| Brazil: 0.00% | | | | | | | | |
Lupatech SA (Energy, Energy Equipment &
Services) (a)(i)(s) | | | 6.50 | % | | | 4-15-2018 | | | $ | 303,000 | | | | 1,519 | |
| | | | | | | | | | | | | | | | |
| |
Total Convertible Debentures (Cost $160,691) | | | | 1,519 | |
| | | | | | | | | | | | | | | | |
| | | | |
| | | Dividend yield | | | | | | Shares | | | | |
| Preferred Stocks: 1.67% | |
|
| Brazil: 1.67% | |
Lojas Americanas SA (Consumer Discretionary, Multiline Retail) ± | | | 0.15 | | | | | | | | 8,039,193 | | | | 52,133,864 | |
| | | | | | | | | | | | | | | | |
| |
Total Preferred Stocks (Cost $31,353,641) | | | | 52,133,864 | |
| | | | | | | | | | | | | | | | |
| | | | |
| | | Yield | | | | | | | | | | |
| Short-Term Investments: 6.51% | |
|
| Investment Companies: 6.51% | |
Securities Lending Cash Investment LLC (l)(r)(u) | | | 0.69 | | | | | | | | 156,094,383 | | | | 156,109,992 | |
Wells Fargo Government Money Market Fund Select Class (l)(u) | | | 0.32 | | | | | | | | 47,363,740 | | | | 47,363,740 | |
| |
Total Short-Term Investments (Cost $203,464,225) | | | | 203,473,732 | |
| | | | | | | | | | | | | | | | |
| | | | | | | | |
| Total investments in securities (Cost $2,907,692,666) * | | | 104.43 | % | | | 3,263,631,116 | |
Other assets and liabilities, net | | | (4.43 | ) | | | (138,505,464 | ) |
| | | | | | | | |
| Total net assets | | | 100.00 | % | | $ | 3,125,125,652 | |
| | | | | | | | |
The accompanying notes are an integral part of these financial statements.
| | | | | | |
| Portfolio of investments—October 31, 2016 | | Wells Fargo Emerging Markets Equity Fund | | | 13 | |
| † | Non-income-earning security |
| « | All or a portion of this security is on loan. |
| 144A | The security may be resold in transactions exempt from registration, normally to qualified institutional buyers, pursuant to Rule 144A under the Securities Act of 1933. |
| (a) | The security is fair valued in accordance with procedures approved by the Board of Trustees. |
| (i) | Illiquid security for which the designation as illiquid is unaudited. |
| (s) | The security is currently in default with regards to scheduled interest and/or principal payments. The Fund has stopped accruing interest on the security. |
| ± | Variable rate investment. The rate shown is the rate in effect at period end. |
| (l) | The issuer of the security is an affiliated person of the Fund as defined in the Investment Company Act of 1940. |
| (r) | The investment is a non-registered investment vehicle purchased with cash collateral received from securities on loan. |
| (u) | The rate represents the 7-day annualized yield at period end. |
| * | Cost for federal income tax purposes is $2,930,369,338 and unrealized gains (losses) consists of: |
| | | | |
Gross unrealized gains | | $ | 746,868,811 | |
Gross unrealized losses | | | (413,607,033 | ) |
| | | | |
Net unrealized gains | | $ | 333,261,778 | |
The accompanying notes are an integral part of these financial statements.
| | | | |
| 14 | | Wells Fargo Emerging Markets Equity Fund | | Statement of assets and liabilities—October 31, 2016 |
| | | | |
| | | | |
| |
Assets | | | | |
Investments | | | | |
In unaffiliated securities (including $143,197,872 of securities loaned), at value (cost $2,704,228,441) | | $ | 3,060,157,384 | |
In affiliated securities, at value (cost $203,464,225) | | | 203,473,732 | |
| | | | |
Total investments, at value (cost $2,907,692,666) | | | 3,263,631,116 | |
Cash | | | 323,286 | |
Foreign currency, at value (cost $9,938,839) | | | 9,155,872 | |
Restricted cash held in escrow | | | 11,064,943 | |
Receivable for investments sold | | | 10,256,084 | |
Receivable for Fund shares sold | | | 4,654,383 | |
Receivable for dividends | | | 2,706,565 | |
Receivable for securities lending income | | | 98,518 | |
Prepaid expenses and other assets | | | 110,589 | |
| | | | |
Total assets | | | 3,302,001,356 | |
| | | | |
| |
Liabilities | | | | |
Payable for investments purchased | | | 4,538,225 | |
Payable for Fund shares redeemed | | | 10,748,060 | |
Payable upon receipt of securities loaned | | | 156,099,665 | |
Management fee payable | | | 2,817,657 | |
Distribution fees payable | | | 47,148 | |
Administration fees payable | | | 404,599 | |
Custodian and accounting fees payable | | | 1,535,958 | |
Accrued expenses and other liabilities | | | 684,392 | |
| | | | |
Total liabilities | | | 176,875,704 | |
| | | | |
Total net assets | | $ | 3,125,125,652 | |
| | | | |
| |
NET ASSETS CONSIST OF | | | | |
Paid-in capital | | $ | 3,108,905,007 | |
Undistributed net investment income | | | 7,243,488 | |
Accumulated net realized losses on investments | | | (346,196,487 | ) |
Net unrealized gains on investments | | | 355,173,644 | |
| | | | |
Total net assets | | $ | 3,125,125,652 | |
| | | | |
| |
COMPUTATION OF NET ASSET VALUE AND OFFERING PRICE PER SHARE | | | | |
Net assets – Class A | | $ | 874,624,893 | |
Shares outstanding – Class A1 | | | 42,680,170 | |
Net asset value per share – Class A | | | $20.49 | |
Maximum offering price per share – Class A2 | | | $21.74 | |
Net assets – Class B | | $ | 595,752 | |
Shares outstanding – Class B1 | | | 34,219 | |
Net asset value per share – Class B | | | $17.41 | |
Net assets – Class C | | $ | 71,900,137 | |
Shares outstanding – Class C1 | | | 4,161,187 | |
Net asset value per share – Class C | | | $17.28 | |
Net assets – Class R6 | | $ | 191,250,086 | |
Shares outstanding – Class R61 | | | 8,911,512 | |
Net asset value per share – Class R6 | | | $21.46 | |
Net assets – Administrator Class | | $ | 160,657,324 | |
Shares outstanding – Administrator Class1 | | | 7,460,643 | |
Net asset value per share – Administrator Class | | | $21.53 | |
Net assets – Institutional Class | | $ | 1,826,097,460 | |
Shares outstanding – Institutional Class1 | | | 85,092,527 | |
Net asset value per share – Institutional Class | | | $21.46 | |
| 1 | The Fund has an unlimited number of authorized shares. |
| 2 | Maximum offering price is computed as 100/94.25 of net asset value. On investments of $50,000 or more, the offering price is reduced. |
The accompanying notes are an integral part of these financial statements.
| | | | | | |
| Statement of operations—year ended October 31, 2016 | | Wells Fargo Emerging Markets Equity Fund | | | 15 | |
| | | | |
| | | | |
| |
Investment income | | | | |
Dividends (net of foreign withholding taxes of $7,221,075) | | $ | 69,834,741 | |
Securities lending income, net | | | 845,953 | |
Income from affiliated securities | | | 196,657 | |
| | | | |
Total investment income | | | 70,877,351 | |
| | | | |
| |
Expenses | | | | |
Management fee | | | 33,409,160 | |
Administration fees | | | | |
Class A | | | 1,795,073 | |
Class B | | | 1,868 | |
Class C | | | 149,226 | |
Class R6 | | | 37,650 | |
Administrator Class | | | 202,999 | |
Institutional Class | | | 2,508,236 | |
Shareholder servicing fees | | | | |
Class A | | | 2,136,991 | |
Class B | | | 2,224 | |
Class C | | | 177,650 | |
Administrator Class | | | 383,836 | |
Distribution fees | | | | |
Class B | | | 6,673 | |
Class C | | | 532,950 | |
Custody and accounting fees | | | 2,417,080 | |
Professional fees | | | 73,861 | |
Registration fees | | | 178,039 | |
Shareholder report expenses | | | 868,080 | |
Trustees’ fees and expenses | | | 23,886 | |
Interest expense | | | 3,358 | |
Other fees and expenses | | | 47,907 | |
| | | | |
Total expenses | | | 44,956,747 | |
Less: Fee waivers and/or expense reimbursements | | | (2,211,823 | ) |
| | | | |
Net expenses | | | 42,744,924 | |
| | | | |
Net investment income | | | 28,132,427 | |
| | | | |
| |
REALIZED AND UNREALIZED GAINS (LOSSES) ON INVESTMENTS | | | | |
| |
Net realized gains (losses) on: | | | | |
Unaffiliated securities | | | (78,866,315 | ) |
Forward foreign currency contract transactions | | | 3,514 | |
| | | | |
Net realized losses on investments | | | (78,862,801 | ) |
| | | | |
| |
Net change in unrealized gains (losses) on: | | | | |
Unaffiliated securities | | | 488,238,560 | |
Affiiliated securities | | | (1,861,168 | ) |
| | | | |
Net change in unrealized gains (losses) on investments | | | 486,377,392 | |
| | | | |
Net realized and unrealized gains (losses) on investments | | | 407,514,591 | |
| | | | |
Net increase in net assets resulting from operations | | $ | 435,647,018 | |
| | | | |
The accompanying notes are an integral part of these financial statements.
| | | | |
| 16 | | Wells Fargo Emerging Markets Equity Fund | | Statement of changes in net assets |
| | | | | | | | | | | | | | | | |
| | | Year ended
October 31, 2016 | | | Year ended
October 31, 2015 | |
| | | | |
Operations | | | | | | | | | | | | | | | | |
Net investment income | | | | | | $ | 28,132,427 | | | | | | | $ | 28,129,814 | |
Net realized losses on investments | | | | | | | (78,862,801 | ) | | | | | | | (251,701,617 | ) |
Net change in unrealized gains (losses) on investments | | | | | | | 486,377,392 | | | | | | | | (488,939,528 | ) |
| | | | |
Net increase (decrease) in net assets resulting from operations | | | | | | | 435,647,018 | | | | | | | | (712,511,331 | ) |
| | | | |
| | | | |
Distributions to shareholders from | | | | | | | | | | | | | | | | |
Net investment income | | | | | | | | | | | | | | | | |
Class A | | | | | | | (4,821,280 | ) | | | | | | | (9,924,128 | ) |
Class R6 | | | | | | | (1,207,067 | ) | | | | | | | (428,978 | ) |
Administrator Class | | | | | | | (915,237 | ) | | | | | | | (2,112,578 | ) |
Institutional Class | | | | | | | (22,745,172 | ) | | | | | | | (32,080,756 | ) |
| | | | |
Total distributions to shareholders | | | | | | | (29,688,756 | ) | | | | | | | (44,546,440 | ) |
| | | | |
| | | | |
Capital share transactions | | | Shares | | | | | | | | Shares | | | | | |
Proceeds from shares sold | | | | | | | | | | | | | | | | |
Class A | | | 14,276,408 | | | | 257,431,388 | | | | 18,081,212 | | | | 353,509,537 | |
Class B | | | 0 | | | | 0 | | | | 251 | | | | 4,375 | |
Class C | | | 284,656 | | | | 4,423,556 | | | | 176,868 | | | | 2,961,953 | |
Class R6 | | | 4,886,774 | | | | 94,696,839 | | | | 3,603,754 | | | | 73,604,149 | |
Administrator Class | | | 2,473,929 | | | | 47,026,221 | | | | 4,842,916 | | | | 101,861,997 | |
Institutional Class | | | 25,310,308 | | | | 470,045,141 | | | | 43,932,979 | | | | 875,566,645 | |
| | | | |
| | | | | | | 873,623,145 | | | | | | | | 1,407,508,656 | |
| | | | |
Reinvestment of distributions | | | | | | | | | | | | | | | | |
Class A | | | 275,442 | | | | 4,701,801 | | | | 489,710 | | | | 9,691,371 | |
Class R6 | | | 66,974 | | | | 1,193,482 | | | | 20,724 | | | | 428,978 | |
Administrator Class | | | 49,021 | | | | 878,463 | | | | 97,246 | | | | 2,017,592 | |
Institutional Class | | | 1,178,702 | | | | 21,004,467 | | | | 1,420,577 | | | | 29,405,954 | |
| �� | | | |
| | | | | | | 27,778,213 | | | | | | | | 41,543,895 | |
| | | | |
Payment for shares redeemed | | | | | | | | | | | | | | | | |
Class A | | | (20,179,942 | ) | | | (375,408,750 | ) | | | (40,351,435 | ) | | | (778,700,113 | ) |
Class B | | | (60,187 | ) | | | (925,067 | ) | | | (200,667 | ) | | | (3,410,499 | ) |
Class C | | | (1,621,268 | ) | | | (24,542,512 | ) | | | (2,307,745 | ) | | | (38,097,771 | ) |
Class R6 | | | (1,051,876 | ) | | | (20,911,449 | ) | | | (211,230 | ) | | | (4,141,231 | ) |
Administrator Class | | | (4,603,140 | ) | | | (87,710,425 | ) | | | (16,085,608 | ) | | | (308,944,371 | ) |
Institutional Class | | | (54,409,985 | ) | | | (1,055,274,030 | ) | | | (61,121,682 | ) | | | (1,222,764,057 | ) |
| | | | |
| | | | | | | (1,564,772,233 | ) | | | | | | | (2,356,058,042 | ) |
| | | | |
Net decrease in net assets resulting from capital share transactions | | | | | | | (663,370,875 | ) | | | | | | | (907,005,491 | ) |
| | | | |
Total decrease in net assets | | | | | | | (257,412,613 | ) | | | | | | | (1,664,063,262 | ) |
| | | | |
| | | | |
Net assets | | | | | | | | | | | | | | | | |
Beginning of period | | | | | | | 3,382,538,265 | | | | | | | | 5,046,601,527 | |
| | | | |
End of period | | | | | | $ | 3,125,125,652 | | | | | | | $ | 3,382,538,265 | |
| | | | |
Undistributed net investment income | | | | | | $ | 7,243,488 | | | | | | | $ | 6,664,024 | |
| | | | |
The accompanying notes are an integral part of these financial statements.
| | | | | | |
| Financial highlights | | Wells Fargo Emerging Markets Equity Fund | | | 17 | |
(For a share outstanding throughout each period)
| | | | | | | | | | | | | | | | | | | | |
| | | Year ended October 31 | |
| CLASS A | | 2016 | | | 2015 | | | 2014 | | | 2013 | | | 2012 | |
Net asset value, beginning of period | | | $18.09 | | | | $21.44 | | | | $21.77 | | | | $20.48 | | | | $20.93 | |
Net investment income | | | 0.12 | | | | 0.08 | | | | 0.07 | | | | 0.02 | | | | 0.10 | |
Net realized and unrealized gains (losses) on investments | | | 2.38 | | | | (3.29 | ) | | | (0.40 | ) | | | 1.33 | | | | (0.19 | ) |
| | | | | | | | | | | | | | | | | | | | |
Total from investment operations | | | 2.50 | | | | (3.21 | ) | | | (0.33 | ) | | | 1.35 | | | | (0.09 | ) |
Distributions to shareholders from | | | | | | | | | | | | | | | | | | | | |
Net investment income | | | (0.10 | ) | | | (0.14 | ) | | | 0.00 | | | | (0.06 | ) | | | (0.14 | ) |
Net realized gains | | | 0.00 | | | | 0.00 | | | | 0.00 | | | | 0.00 | | | | (0.22 | ) |
| | | | | | | | | | | | | | | | | | | | |
Total distributions to shareholders | | | (0.10 | ) | | | (0.14 | ) | | | 0.00 | | | | (0.06 | ) | | | (0.36 | ) |
Net asset value, end of period | | | $20.49 | | | | $18.09 | | | | $21.44 | | | | $21.77 | | | | $20.48 | |
Total return1 | | | 13.93 | % | | | (15.02 | )% | | | (1.52 | )% | | | 6.62 | % | | | (0.31 | )% |
Ratios to average net assets (annualized) | | | | | | | | | | | | | | | | | | | | |
Gross expenses | | | 1.64 | % | | | 1.64 | % | | | 1.64 | % | | | 1.65 | % | | | 1.67 | % |
Net expenses | | | 1.60 | % | | | 1.64 | % | | | 1.64 | % | | | 1.65 | % | | | 1.67 | % |
Net investment income | | | 0.64 | % | | | 0.37 | % | | | 0.36 | % | | | 0.15 | % | | | 0.51 | % |
Supplemental data | | | | | | | | | | | | | | | | | | | | |
Portfolio turnover rate | | | 8 | % | | | 8 | % | | | 7 | % | | | 13 | % | | | 7 | % |
Net assets, end of period (000s omitted) | | | $874,625 | | | | $873,992 | | | | $1,502,597 | | | | $1,306,269 | | | | $920,709 | |
| 1 | Total returns calculations do not include any sales charges. |
The accompanying notes are an integral part of these financial statements.
| | | | |
| 18 | | Wells Fargo Emerging Markets Equity Fund | | Financial highlights |
(For a share outstanding throughout each period)
| | | | | | | | | | | | | | | | | | | | |
| | | Year ended October 31 | |
| CLASS B | | 2016 | | | 2015 | | | 2014 | | | 2013 | | | 2012 | |
Net asset value, beginning of period | | | $15.40 | | | | $18.25 | | | | $18.67 | | | | $17.64 | | | | $18.06 | |
Net investment loss | | | (0.03 | )1 | | | (0.08 | )1 | | | (0.08 | )1 | | | (0.12 | )1 | | | (0.05 | )1 |
Net realized and unrealized gains (losses) on investments | | | 2.04 | | | | (2.77 | ) | | | (0.34 | ) | | | 1.15 | | | | (0.15 | ) |
| | | | | | | | | | | | | | | | | | | | |
Total from investment operations | | | 2.01 | | | | (2.85 | ) | | | (0.42 | ) | | | 1.03 | | | | (0.20 | ) |
Distributions to shareholders from | | | | | | | | | | | | | | | | | | | | |
Net realized gains | | | 0.00 | | | | 0.00 | | | | 0.00 | | | | 0.00 | | | | (0.22 | ) |
Net asset value, end of period | | | $17.41 | | | | $15.40 | | | | $18.25 | | | | $18.67 | | | | $17.64 | |
Total return2 | | | 13.05 | % | | | (15.62 | )% | | | (2.25 | )% | | | 5.84 | % | | | (1.06 | )% |
Ratios to average net assets (annualized) | | | | | | | | | | | | | | | | | | | | |
Gross expenses | | | 2.39 | % | | | 2.38 | % | | | 2.39 | % | | | 2.39 | % | | | 2.41 | % |
Net expenses | | | 2.35 | % | | | 2.38 | % | | | 2.39 | % | | | 2.39 | % | | | 2.41 | % |
Net investment loss | | | (0.22 | )% | | | (0.46 | )% | | | (0.46 | )% | | | (0.64 | )% | | | (0.28 | )% |
Supplemental data | | | | | | | | | | | | | | | | | | | | |
Portfolio turnover rate | | | 8 | % | | | 8 | % | | | 7 | % | | | 13 | % | | | 7 | % |
Net assets, end of period (000s omitted) | | | $596 | | | | $1,453 | | | | $5,380 | | | | $11,071 | | | | $15,408 | |
| 1 | Calculated based upon average shares outstanding |
| 2 | Total returns calculations do not include any sales charges. |
The accompanying notes are an integral part of these financial statements.
| | | | | | |
| Financial highlights | | Wells Fargo Emerging Markets Equity Fund | | | 19 | |
(For a share outstanding throughout each period)
| | | | | | | | | | | | | | | | | | | | |
| | | Year ended October 31 | |
| CLASS C | | 2016 | | | 2015 | | | 2014 | | | 2013 | | | 2012 | |
Net asset value, beginning of period | | | $15.28 | | | | $18.11 | | | | $18.53 | | | | $17.51 | | | | $17.92 | |
Net investment loss | | | (0.02 | )1 | | | (0.06 | )1 | | | (0.08 | )1 | | | (0.11 | )1 | | | (0.06 | ) |
Net realized and unrealized gains (losses) on investments | | | 2.02 | | | | (2.77 | ) | | | (0.34 | ) | | | 1.13 | | | | (0.13 | ) |
| | | | | | | | | | | | | | | | | | | | |
Total from investment operations | | | 2.00 | | | | (2.83 | ) | | | (0.42 | ) | | | 1.02 | | | | (0.19 | ) |
Distributions to shareholders from | | | | | | | | | | | | | | | | | | | | |
Net realized gains | | | 0.00 | | | | 0.00 | | | | 0.00 | | | | 0.00 | | | | (0.22 | ) |
Net asset value, end of period | | | $17.28 | | | | $15.28 | | | | $18.11 | | | | $18.53 | | | | $17.51 | |
Total return2 | | | 13.09 | % | | | (15.63 | )% | | | (2.27 | )% | | | 5.83 | % | | | (1.01 | )% |
Ratios to average net assets (annualized) | | | | | | | | | | | | | | | | | | | | |
Gross expenses | | | 2.39 | % | | | 2.39 | % | | | 2.39 | % | | | 2.39 | % | | | 2.42 | % |
Net expenses | | | 2.35 | % | | | 2.39 | % | | | 2.39 | % | | | 2.39 | % | | | 2.42 | % |
Net investment loss | | | (0.12 | )% | | | (0.39 | )% | | | (0.42 | )% | | | (0.62 | )% | | | (0.24 | )% |
Supplemental data | | | | | | | | | | | | | | | | | | | | |
Portfolio turnover rate | | | 8 | % | | | 8 | % | | | 7 | % | | | 13 | % | | | 7 | % |
Net assets, end of period (000s omitted) | | | $71,900 | | | | $84,004 | | | | $138,169 | | | | $173,454 | | | | $183,471 | |
| 1 | Calculated based upon average shares outstanding |
| 2 | Total returns calculations do not include any sales charges. |
The accompanying notes are an integral part of these financial statements.
| | | | |
| 20 | | Wells Fargo Emerging Markets Equity Fund | | Financial highlights |
(For a share outstanding throughout each period)
| | | | | | | | | | | | | | | | |
| | | Year ended October 31 | |
| CLASS R6 | | 2016 | | | 2015 | | | 2014 | | | 20131 | |
Net asset value, beginning of period | | | $19.00 | | | | $22.53 | | | | $22.86 | | | | $20.89 | |
Net investment income | | | 0.23 | 2 | | | 0.19 | | | | 0.21 | | | | 0.01 | 2 |
Net realized and unrealized gains (losses) on investments | | | 2.46 | | | | (3.46 | ) | | | (0.44 | ) | | | 1.96 | |
| | | | | | | | | | | | | | | | |
Total from investment operations | | | 2.69 | | | | (3.27 | ) | | | (0.23 | ) | | | 1.97 | |
Distributions to shareholders from | | | | | | | | | | | | | | | | |
Net investment income | | | (0.23 | ) | | | (0.26 | ) | | | (0.10 | ) | | | 0.00 | |
Net asset value, end of period | | | $21.46 | | | | $19.00 | | | | $22.53 | | | | $22.86 | |
Total return3 | | | 14.43 | % | | | (14.61 | )% | | | (1.01 | )% | | | 9.43 | % |
Ratios to average net assets (annualized) | | | | | | | | | | | | | | | | |
Gross expenses | | | 1.20 | % | | | 1.19 | % | | | 1.17 | % | | | 1.17 | % |
Net expenses | | | 1.17 | % | | | 1.18 | % | | | 1.17 | % | | | 1.17 | % |
Net investment income | | | 1.16 | % | | | 0.84 | % | | | 0.88 | % | | | 0.15 | % |
Supplemental data | | | | | | | | | | | | | | | | |
Portfolio turnover rate | | | 8 | % | | | 8 | % | | | 7 | % | | | 13 | % |
Net assets, end of period (000s omitted) | | | $191,250 | | | | $95,190 | | | | $35,967 | | | | $4,809 | |
| 1 | For the period from June 28, 2013 (commencement of class operations) to October 31, 2013 |
| 2 | Calculated based upon average shares outstanding |
| 3 | Returns for periods of less than one year are not annualized. |
The accompanying notes are an integral part of these financial statements.
| | | | | | |
| Financial highlights | | Wells Fargo Emerging Markets Equity Fund | | | 21 | |
(For a share outstanding throughout each period)
| | | | | | | | | | | | | | | | | | | | |
| | | Year ended October 31 | |
| ADMINISTRATOR CLASS | | 2016 | | | 2015 | | | 2014 | | | 2013 | | | 2012 | |
Net asset value, beginning of period | | | $18.99 | | | | $22.44 | | | | $22.79 | | | | $21.44 | | | | $21.90 | |
Net investment income | | | 0.15 | 1 | | | 0.12 | 1 | | | 0.13 | 1 | | | 0.05 | | | | 0.14 | |
Net realized and unrealized gains (losses) on investments | | | 2.50 | | | | (3.46 | ) | | | (0.44 | ) | | | 1.40 | | | | (0.18 | ) |
| | | | | | | | | | | | | | | | | | | | |
Total from investment operations | | | 2.65 | | | | (3.34 | ) | | | (0.31 | ) | | | 1.45 | | | | (0.04 | ) |
Distributions to shareholders from | | | | | | | | | | | | | | | | | | | | |
Net investment income | | | (0.11 | ) | | | (0.11 | ) | | | (0.04 | ) | | | (0.10 | ) | | | (0.20 | ) |
Net realized gains | | | 0.00 | | | | 0.00 | | | | 0.00 | | | | 0.00 | | | | (0.22 | ) |
| | | | | | | | | | | | | | | | | | | | |
Total distributions to shareholders | | | (0.11 | ) | | | (0.11 | ) | | | (0.04 | ) | | | (0.10 | ) | | | (0.42 | ) |
Net asset value, end of period | | | $21.53 | | | | $18.99 | | | | $22.44 | | | | $22.79 | | | | $21.44 | |
Total return | | | 14.07 | % | | | (14.91 | )% | | | (1.36 | )% | | | 6.83 | % | | | (0.13 | )% |
Ratios to average net assets (annualized) | | | | | | | | | | | | | | | | | | | | |
Gross expenses | | | 1.56 | % | | | 1.49 | % | | | 1.48 | % | | | 1.48 | % | | | 1.47 | % |
Net expenses | | | 1.49 | % | | | 1.48 | % | | | 1.48 | % | | | 1.48 | % | | | 1.47 | % |
Net investment income | | | 0.76 | % | | | 0.58 | % | | | 0.57 | % | | | 0.35 | % | | | 0.72 | % |
Supplemental data | | | | | | | | | | | | | | | | | | | | |
Portfolio turnover rate | | | 8 | % | | | 8 | % | | | 7 | % | | | 13 | % | | | 7 | % |
Net assets, end of period (000s omitted) | | | $160,657 | | | | $181,224 | | | | $464,135 | | | | $1,050,660 | | | | $634,428 | |
| 1 | Calculated based upon average shares outstanding |
The accompanying notes are an integral part of these financial statements.
| | | | |
| 22 | | Wells Fargo Emerging Markets Equity Fund | | Financial highlights |
(For a share outstanding throughout each period)
| | | | | | | | | | | | | | | | | | | | |
| | | Year ended October 31 | |
| INSTITUTIONAL CLASS | | 2016 | | | 2015 | | | 2014 | | | 2013 | | | 2012 | |
Net asset value, beginning of period | | | $18.99 | | | | $22.52 | | | | $22.86 | | | | $21.50 | | | | $21.96 | |
Net investment income | | | 0.20 | 1 | | | 0.17 | | | | 0.15 | | | | 0.11 | | | | 0.22 | |
Net realized and unrealized gains (losses) on investments | | | 2.49 | | | | (3.45 | ) | | | (0.40 | ) | | | 1.40 | | | | (0.22 | ) |
| | | | | | | | | | | | | | | | | | | | |
Total from investment operations | | | 2.69 | | | | (3.28 | ) | | | (0.25 | ) | | | 1.51 | | | | 0.00 | |
Distributions to shareholders from | | | | | | | | | | | | | | | | | | | | |
Net investment income | | | (0.22 | ) | | | (0.25 | ) | | | (0.09 | ) | | | (0.15 | ) | | | (0.24 | ) |
Net realized gains | | | 0.00 | | | | 0.00 | | | | 0.00 | | | | 0.00 | | | | (0.22 | ) |
| | | | | | | | | | | | | | | | | | | | |
Total distributions to shareholders | | | (0.22 | ) | | | (0.25 | ) | | | (0.09 | ) | | | (0.15 | ) | | | (0.46 | ) |
Net asset value, end of period | | | $21.46 | | | | $18.99 | | | | $22.52 | | | | $22.86 | | | | $21.50 | |
Total return | | | 14.40 | % | | | (14.66 | )% | | | (1.09 | )% | | | 7.07 | % | | | 0.13 | % |
Ratios to average net assets (annualized) | | | | | | | | | | | | | | | | | | | | |
Gross expenses | | | 1.31 | % | | | 1.24 | % | | | 1.21 | % | | | 1.22 | % | | | 1.24 | % |
Net expenses | | | 1.22 | % | | | 1.22 | % | | | 1.21 | % | | | 1.22 | % | | | 1.24 | % |
Net investment income | | | 1.04 | % | | | 0.82 | % | | | 0.77 | % | | | 0.57 | % | | | 1.04 | % |
Supplemental data | | | | | | | | | | | | | | | | | | | | |
Portfolio turnover rate | | | 8 | % | | | 8 | % | | | 7 | % | | | 13 | % | | | 7 | % |
Net assets, end of period (000s omitted) | | | $1,826,097 | | | | $2,146,675 | | | | $2,900,353 | | | | $2,183,281 | | | | $1,176,567 | |
| 1 | Calculated based upon average shares outstanding |
The accompanying notes are an integral part of these financial statements.
| | | | | | |
| Notes to financial statements | | Wells Fargo Emerging Markets Equity Fund | | | 23 | |
1. ORGANIZATION
Wells Fargo Funds Trust (the “Trust”), a Delaware statutory trust organized on March 10, 1999, is an open-end management investment company registered under the Investment Company Act of 1940, as amended (the “1940 Act”). As an investment company, the Trust follows the accounting and reporting guidance in Financial Accounting Standards Board (“FASB”) Accounting Standards Codification Topic 946, Financial Services – Investment Companies. These financial statements report on the Wells Fargo Emerging Markets Equity Fund (the “Fund”) which is a diversified series of the Trust.
2. SIGNIFICANT ACCOUNTING POLICIES
The following significant accounting policies, which are consistently followed in the preparation of the financial statements of the Fund, are in conformity with U.S. generally accepted accounting principles which require management to make estimates and assumptions that affect the reported amounts of assets and liabilities, disclosure of contingent assets and liabilities at the date of the financial statements, and the reported amounts of revenues and expenses during the reporting period. Actual results could differ from those estimates.
Securities valuation
All investments are valued each business day as of the close of regular trading on the New York Stock Exchange (generally 4 p.m. Eastern Time), although the Fund may deviate from this calculation time under unusual or unexpected circumstances.
Equity securities that are listed on a foreign or domestic exchange or market are valued at the official closing price or, if none, the last sales price. If no sale occurs on the principal exchange or market that day, the prior day’s price will be deemed “stale” and a fair value price will be determined in accordance with the Fund’s Valuation Procedures.
The values of securities denominated in foreign currencies are translated into U.S. dollars at rates provided by an independent foreign currency pricing source at a time each business day specified by the Management Valuation Team of Wells Fargo Funds Management, LLC (“Funds Management”).
Many securities markets and exchanges outside the U.S. close prior to the close of the New York Stock Exchange and therefore may not fully reflect trading or events that occur after the close of the principal exchange in which the foreign securities are traded, but before the close of the New York Stock Exchange. If such trading or events are expected to materially affect the value of such securities, then fair value pricing procedures approved by the Board of Trustees of the Fund are applied. These procedures take into account multiple factors including movements in U.S. securities markets after foreign exchanges close. Foreign securities that are fair valued under these procedures are categorized as Level 2 and the application of these procedures may result in transfers between Level 1 and Level 2. Depending on market activity, such fair valuations may be frequent. Such fair value pricing may result in net asset values that are higher or lower than net asset values based on the last reported sales price or latest quoted bid price. On October 31, 2016, such fair value pricing was not used in pricing foreign securities.
Debt securities are valued at the evaluated bid price provided by an independent pricing service or, if a reliable price is not available, the quoted bid price from an independent broker-dealer.
Investments in registered open-end investment companies are valued at net asset value. Interests in non-registered investment vehicles that are redeemable at net asset value are fair valued normally at net asset value.
Investments which are not valued using any of the methods discussed above are valued at their fair value, as determined in good faith by the Board of Trustees. The Board of Trustees has established a Valuation Committee comprised of the Trustees and has delegated to it the authority to take any actions regarding the valuation of portfolio securities that the Valuation Committee deems necessary or appropriate, including determining the fair value of portfolio securities, unless the determination has been delegated to the Management Valuation Team. The Board of Trustees retains the authority to make or ratify any valuation decisions or approve any changes to the Valuation Procedures as it deems appropriate. On a quarterly basis, the Board of Trustees receives reports on any valuation actions taken by the Valuation Committee or the Management Valuation Team which may include items for ratification.
Valuations of fair valued securities are compared to the next actual sales price when available, or other appropriate market values, to assess the continued appropriateness of the fair valuation methodologies used. These securities are fair valued on a day-to-day basis, taking into consideration changes to appropriate market information and any significant changes to the inputs considered in the valuation process until there is a readily available price provided on an exchange or by an independent pricing service. Valuations received from an independent pricing service or independent broker-dealer quotes are periodically validated by comparisons to most recent trades and valuations provided by other
| | | | |
| 24 | | Wells Fargo Emerging Markets Equity Fund | | Notes to financial statements |
independent pricing services in addition to the review of prices by the manager and/or subadviser. Unobservable inputs used in determining fair valuations are identified based on the type of security, taking into consideration factors utilized by market participants in valuing the investment, knowledge about the issuer and the current market environment.
Foreign currency translation
The accounting records of the Fund are maintained in U.S. dollars. The values of other assets and liabilities denominated in foreign currencies are translated into U.S. dollars at rates provided by an independent foreign currency pricing source at a time each business day specified by the Management Valuation Team. Purchases and sales of securities, and income and expenses are converted at the rate of exchange on the respective dates of such transactions. Net realized foreign exchange gains or losses arise from sales of foreign currencies, currency gains or losses realized between the trade and settlement dates on securities transactions, and the difference between the amounts of dividends, interest and foreign withholding taxes recorded and the U.S. dollar equivalent of the amounts actually paid or received. Net unrealized foreign exchange gains and losses arise from changes in the fair value of assets and liabilities other than investments in securities resulting from changes in exchange rates. The changes in net assets arising from changes in exchange rates and the changes in net assets resulting from changes in market prices of securities are not separately presented. Such changes are included in net realized and unrealized gains or losses from investments.
Forward foreign currency contracts
The Fund is subject to foreign currency exchange rate risk in the normal course of pursuing its investment objectives. A forward foreign currency contract is an agreement between two parties to purchase or sell a specific currency for an agreed-upon price at a future date. The Fund enters into forward foreign currency contracts to facilitate transactions in foreign-denominated securities and to attempt to minimize the risk to the Fund from adverse changes in the relationship between currencies. Forward foreign currency contracts are recorded at the forward rate and marked-to-market daily. When the contracts are closed, realized gains and losses arising from such transactions are recorded as realized gains or losses on forward foreign currency contract transactions. The Fund could be exposed to risks if the counterparties to the contracts are unable to meet the terms of their contracts or if the value of the foreign currency changes unfavorably. The Fund’s maximum risk of loss from counterparty credit risk is the unrealized gains on the contracts. This risk may be mitigated if there is a master netting arrangement between the Fund and the counterparty.
Security loans
The Fund may lend its securities from time to time in order to earn additional income in the form of fees or interest on securities received as collateral or the investment of any cash received as collateral. The Fund continues to receive interest or dividends on the securities loaned. The Fund receives collateral in the form of cash or securities with a value at least equal to the value of the securities on loan. The value of the loaned securities is determined at the close of each business day and any additional required collateral is delivered to the Fund on the next business day. In a securities lending transaction, the net asset value of the Fund will be affected by an increase or decrease in the value of the securities loaned and by an increase or decrease in the value of the instrument in which collateral is invested. The amount of securities lending activity undertaken by the Fund fluctuates from time to time. In the event of default or bankruptcy by the borrower, the Fund may be prevented from recovering the loaned securities or gaining access to the collateral or may experience delays or costs in doing so. In addition, the investment of any cash collateral received may lose all or part of its value. The Fund has the right under the lending agreement to recover the securities from the borrower on demand.
The Fund lends its securities through an unaffiliated securities lending agent. Cash collateral received in connection with its securities lending transactions is invested in Securities Lending Cash Investments, LLC (the “Securities Lending Fund”). The Securities Lending Fund is exempt from registration under Section 3(c)(7) of the 1940 Act and is managed by Funds Management and is subadvised by Wells Capital Management Incorporated (“WellsCap”), an affiliate of Funds Management and an indirect wholly owned subsidiary of Wells Fargo & Company (“Wells Fargo”). Funds Management receives an advisory fee starting at 0.05% and declining to 0.01% as the average daily net assets of the Securities Lending Fund increase. All of the fees received by Funds Management are paid to WellsCap for its services as subadviser. The Securities Lending Fund seeks to provide a positive return compared to the daily Fed Funds Open Rate by investing in high-quality, U.S. dollar-denominated short-term money market instruments. Securities Lending Fund investments are valued at the evaluated bid price provided by an independent pricing service. Income earned from investment in the Securities Lending Fund is included in securities lending income on the Statement of Operations.
Security transactions and income recognition
Securities transactions are recorded on a trade date basis. Realized gains or losses are recorded on the basis of identified cost.
| | | | | | |
| Notes to financial statements | | Wells Fargo Emerging Markets Equity Fund | | | 25 | |
Dividend income is recognized on the ex-dividend date, except for certain dividends from foreign securities, which are recorded as soon as the custodian verifies the ex-dividend date. Dividend income from foreign securities is recorded net of foreign taxes withheld where recovery of such taxes is not assured.
Distributions to shareholders
Distributions to shareholders from net investment income and net realized gains, if any, are recorded on the ex-dividend date. Such distributions are determined in conformity with federal income tax regulations, which may differ in amount or character from net investment income and realized gains recognized for purposes of U.S. generally accepted accounting principles.
Federal and other taxes
The Fund intends to continue to qualify as a regulated investment company by distributing substantially all of its investment company taxable income and any net realized capital gains (after reduction for capital loss carryforwards) sufficient to relieve it from all, or substantially all, federal income taxes. Accordingly, no provision for federal income taxes was required.
The Fund’s income and federal excise tax returns and all financial records supporting those returns for the prior three fiscal years are subject to examination by the federal and Delaware revenue authorities. Management has analyzed the Fund’s tax positions taken on federal, state, and foreign tax returns for all open tax years and does not believe that there are any uncertain tax positions that require recognition of a tax liability.
Reclassifications are made to the Fund’s capital accounts for permanent tax differences to reflect income and gains available for distribution (or available capital loss carryforwards) under federal income tax regulations. U.S. generally accepted accounting principles require that certain components of net assets be adjusted to reflect permanent differences between financial and tax reporting. These reclassifications have no effect on net assets or net asset values per share. The primary permanent difference causing such reclassifications is due to passive foreign investment companies. At October 31, 2016, as a result of permanent book-to-tax differences, the following reclassification adjustments were made on the Statement of Assets and Liabilities:
| | |
Undistributed
net investment income | | Accumulated net
realized losses
on investments |
| $2,135,793 | | $(2,135,793) |
Capital loss carryforwards that do not expire are required to be utilized prior to capital loss carryforwards that expire. As of October 31, 2016, capital loss carryforwards available to offset future net realized capital gains were as follows through the indicated expiration dates:
| | | | |
| | | No expiration |
| 2017 | | Short-term | | Long-term |
| $10,889,490 | | $28,743,201 | | $302,353,927 |
Class allocations
The separate classes of shares offered by the Fund differ principally in applicable sales charges, distribution, shareholder servicing, and administration fees. Class specific expenses are charged directly to that share class. Investment income, common expenses, and realized and unrealized gains (losses) on investments are allocated daily to each class of shares based on the relative proportion of net assets of each class.
3. FAIR VALUATION MEASUREMENTS
Fair value measurements of investments are determined within a framework that has established a fair value hierarchy based upon the various data inputs utilized in determining the value of the Fund’s investments. The three-level hierarchy gives the highest priority to unadjusted quoted prices in active markets for identical assets or liabilities (Level 1) and the lowest priority to significant unobservable inputs (Level 3). The Fund’s investments are classified within the fair value hierarchy based on the lowest level of input that is significant to the fair value measurement. The inputs are summarized into three broad levels as follows:
| | | | |
| 26 | | Wells Fargo Emerging Markets Equity Fund | | Notes to financial statements |
| n | | Level 1 – quoted prices in active markets for identical securities |
| n | | Level 2 – other significant observable inputs (including quoted prices for similar securities, interest rates, prepayment speeds, credit risk, use of amortized cost, etc.) |
| n | | Level 3 – significant unobservable inputs (including the Fund’s own assumptions in determining the fair value of investments) |
The inputs or methodologies used for valuing investments in securities are not necessarily an indication of the risk associated with investing in those securities.
The following is a summary of the inputs used in valuing the Fund’s assets and liabilities as of October 31, 2016:
| | | | | | | | | | | | | | | | |
| | | Quoted prices (Level 1) | | | Other significant
observable inputs
(Level 2) | | | Significant
unobservable inputs (Level 3) | | | Total | |
Assets | | | | | | | | | | | | | | | | |
Investments in: | | | | | | | | | | | | | | | | |
| | | | |
Common stocks | | | | | | | | | | | | | | | | |
Argentina | | $ | 13,911,228 | | | $ | 0 | | | $ | 0 | | | $ | 13,911,228 | |
Brazil | | | 228,936,683 | | | | 0 | | | | 0 | | | | 228,936,683 | |
Chile | | | 72,000,636 | | | | 0 | | | | 0 | | | | 72,000,636 | |
China | | | 776,030,803 | | | | 0 | | | | 0 | | | | 776,030,803 | |
Colombia | | | 16,935,072 | | | | 0 | | | | 0 | | | | 16,935,072 | |
Hong Kong | | | 145,182,932 | | | | 0 | | | | 0 | | | | 145,182,932 | |
India | | | 280,311,390 | | | | 0 | | | | 0 | | | | 280,311,390 | |
Indonesia | | | 83,604,729 | | | | 0 | | | | 0 | | | | 83,604,729 | |
Malaysia | | | 32,411,482 | | | | 0 | | | | 0 | | | | 32,411,482 | |
Mexico | | | 289,675,789 | | | | 0 | | | | 0 | | | | 289,675,789 | |
Peru | | | 15,316,659 | | | | 0 | | | | 0 | | | | 15,316,659 | |
Philippines | | | 28,536,926 | | | | 0 | | | | 0 | | | | 28,536,926 | |
Russia | | | 66,933,705 | | | | 15,979,161 | | | | 0 | | | | 82,912,866 | |
South Africa | | | 136,998,101 | | | | 0 | | | | 0 | | | | 136,998,101 | |
South Korea | | | 360,352,396 | | | | 2,172,671 | | | | 0 | | | | 362,525,067 | |
Taiwan | | | 283,066,262 | | | | 0 | | | | 0 | | | | 283,066,262 | |
Thailand | | | 110,600,805 | | | | 0 | | | | 0 | | | | 110,600,805 | |
Turkey | | | 24,856,025 | | | | 0 | | | | 0 | | | | 24,856,025 | |
United Arab Emirates | | | 2,640,109 | | | | 0 | | | | 0 | | | | 2,640,109 | |
United Kingdom | | | 21,568,437 | | | | 0 | | | | 0 | | | | 21,568,437 | |
| | | | |
Convertible debentures | | | | | | | 0 | | | | 1,519 | | | | 1,519 | |
| | | | |
Preferred stocks | | | | | | | | | | | | | | | | |
Brazil | | | 52,133,864 | | | | 0 | | | | 0 | | | | 52,133,864 | |
| | | | |
Short-term investments | | | | | | | | | | | | | | | | |
Investment companies | | | 47,363,740 | | | | 0 | | | | 0 | | | | 47,363,740 | |
Investments measured at net asset value* | | | | | | | | | | | | | | | 156,109,992 | |
Total assets | | $ | 3,089,367,773 | | | $ | 18,151,832 | | | $ | 1,519 | | | $ | 3,263,631,116 | |
| * | Investments that are measured at fair value using the net asset value per share (or its equivalent) as a practical expedient have not been categorized in the fair value hierarchy. The fair value amount presented in the table is intended to permit reconciliation of the fair value hierarchy to the amounts presented in the Statement of Assets and Liabilities. The Fund’s investment in Securities Lending Cash Investments, LLC valued at $156,109,992 does not have a redemption period notice, can be redeemed daily and does not have any unfunded commitments. |
The Fund recognizes transfers between levels within the fair value hierarchy at the end of the reporting period. Fair value pricing that was used in pricing certain foreign securities at the previous period end was not used at October 31, 2016. As a result, common stocks valued at $1,686,213,019 and preferred stocks valued at $52,133,864 were transferred from Level 2 to Level 1 within the fair value hierarchy. The Fund did not have any transfers into/out of Level 3.
| | | | | | |
| Notes to financial statements | | Wells Fargo Emerging Markets Equity Fund | | | 27 | |
4. TRANSACTIONS WITH AFFILIATES
Management fee
Funds Management, an indirect wholly owned subsidiary of Wells Fargo, is the manager of the Fund and provides advisory and fund-level administrative services under an investment management agreement. Under the investment management agreement, Funds Management is responsible for, among other services, implementing the investment objectives and strategies of the Fund, supervising the subadviser, providing fund-level administrative services in connection with the Fund’s operations, and providing any other fund-level administrative services reasonably necessary for the operation of the Fund. As compensation for its services under the investment management agreement, Funds Management is entitled to receive an annual management fee starting at 1.15% and declining to 0.955% as the average daily net assets of the Fund increase. For the year ended October 31, 2016, the management fee was equivalent to an annual rate of 1.06% of the Fund’s average daily net assets.
Funds Management has retained the services of a subadviser to provide daily portfolio management to the Fund. The fee for subadvisory services is borne by Funds Management. WellsCap is the subadviser to the Fund and is entitled to receive a fee from Funds Management at an annual rate starting at 0.65% and declining to 0.45% as the average daily net assets of the Fund increase.
Administration fees
Under a class-level administration agreement, Funds Management provides class-level administrative services to the Fund, which includes paying fees and expenses for services provided by the transfer agent, sub-transfer agents, omnibus account servicers and record-keepers. As compensation for its services under the class-level administration agreement, Funds Management receives an annual fee which is calculated based on the average daily net assets of each class as follows:
| | | | |
| | | Class-level
administration fee | |
Class A, Class B, Class C | | | 0.21 | % |
Class R6 | | | 0.03 | |
Administrator Class, Institutional Class | | | 0.13 | |
Funds Management has contractually waived and/or reimbursed management and administration fees to the extent necessary to maintain certain net operating expense ratios for the Fund. Waiver of fees and/or reimbursement of expenses by Funds Management were made first from fund level expenses on a proportionate basis and then from class specific expenses. Funds Management has committed through February 28, 2017 to waive fees and/or reimburse expenses to the extent necessary to cap the Fund’s expenses at 1.61% for Class A shares, 2.36% for Class B shares, 2.36% for Class C shares, 1.18% for Class R6 shares, 1.49% for Administrator Class shares, and 1.22% for Institutional Class shares. After this time, the cap may be increased or the commitment to maintain the cap may be terminated only with the approval of the Board of Trustees.
Distribution fees
The Trust has adopted a distribution plan for Class B and Class C shares of the Fund pursuant to Rule 12b-1 under the 1940 Act. Distribution fees are charged to Class B and Class C shares and paid to Wells Fargo Funds Distributor, LLC (“Funds Distributor”), and the principal underwriter, at an annual rate of 0.75% of the average daily net assets of Class B and Class C shares.
In addition, Funds Distributor is entitled to receive the front-end sales charge from the purchase of Class A shares and a contingent deferred sales charge on the redemption of certain Class A shares. Funds Distributor is also entitled to receive the contingent deferred sales charges from redemptions of Class B and Class C shares. For year ended October 31, 2016, Funds Distributor received $9,124 from the sale of Class A shares and $1,170 in contingent deferred sales charges from redemptions of Class C shares.
Shareholder servicing fees
The Trust has entered into contracts with one or more shareholder servicing agents, whereby Class A, Class B, Class C, and Administrator Class of the Fund are charged a fee at an annual rate of 0.25% of the average daily net assets of each respective class.
A portion of these total shareholder servicing fees were paid to affiliates of Wells Fargo.
| | | | |
| 28 | | Wells Fargo Emerging Markets Equity Fund | | Notes to financial statements |
5. INVESTMENT PORTFOLIO TRANSACTIONS
Purchases and sales of investments, excluding U.S. government obligations (if any) and short-term securities, for the year ended October 31, 2016 were $252,819,210 and $770,833,429, respectively.
The Fund may purchase or sell investment securities to other Wells Fargo funds under procedures adopted by the Board of Trustees. The procedures have been designed to ensure that these interfund transactions, which generally do not incur broker commissions, are effected at current market prices. Interfund trades are included within the respective purchases and sales amounts shown.
6. INVESTMENTS IN AFFILIATES
An affiliated investment is a company which is under common ownership or control of the Fund or which the Fund has ownership of at least 5% of the outstanding voting shares. The following is a summary of transactions for the long-term holdings of issuers that were either affiliates of the Fund at the beginning of the period or the end of the period.
| | | | | | | | | | | | | | | | | | | | | | | | | | | | |
| | | Shares, beginning of period | | | Shares purchased | | | Shares sold | | | Shares, end of period | | | Value, end of period | | | Income from affiliated securities | | | Realized gains | |
104 Corporation* | | | 1,655,000 | | | | 0 | | | | 0 | | | | 1,655,000 | | | $ | 7,184,821 | | | $ | 0 | | | $ | 0 | |
| * | No longer an affiliate of the Fund at the end of the period. |
7. DERIVATIVE TRANSACTIONS
During the year ended October 31, 2016, the Fund entered into forward foreign currency contracts for economic hedging purposes.
As of October 31, 2016, the Fund did not have any open forward foreign currency contracts. The Fund had average contract amounts of $6,985 in forward foreign currency contracts to sell during the year ended October 31, 2016.
The fair value, realized gains or losses and change in unrealized gains or losses, if any, on derivative instruments are reflected in the appropriate financial statements.
8. BANK BORROWINGS
The Trust (excluding the money market funds and certain other funds) and Wells Fargo Variable Trust are parties to a $250,000,000 revolving credit agreement whereby the Fund is permitted to use bank borrowings for temporary or emergency purposes, such as to fund shareholder redemption requests. Interest under the credit agreement is charged to the Fund based on a borrowing rate equal to the higher of the Federal Funds rate in effect on that day plus 1.25% or the overnight LIBOR rate in effect on that day plus 1.25%. In addition, an annual commitment fee equal to 0.25% of the unused balance is allocated to each participating fund. Prior to August 30, 2016, the revolving credit agreement amount was $200,000,000 and the annual commitment fee was equal to 0.20% of the unused balance which was allocated to each participating fund.
During the year ended October 31, 2016, the Fund had average borrowings outstanding of $258,308 at an average rate of 1.30% and paid interest in the amount of $3,358.
9. DISTRIBUTIONS TO SHAREHOLDERS
The tax character of distributions paid was $29,688,756 and $44,546,440 of ordinary income for the years ended October 31, 2016 and October 31, 2015, respectively.
As of October 31, 2016, the components of distributable earnings on a tax basis were as follows:
| | | | |
Undistributed
ordinary
income | | Unrealized
gains | | Capital loss
carryforward |
| $25,721,343 | | $332,495,070 | | $(341,986,618) |
10. INDEMNIFICATION
Under the Trust’s organizational documents, the officers and Trustees have been granted certain indemnification rights against certain liabilities that may arise out of performance of their duties to the Trust. Additionally, in the normal course
| | | | | | |
| Notes to financial statements | | Wells Fargo Emerging Markets Equity Fund | | | 29 | |
of business, the Trust may enter into contracts with service providers that contain a variety of indemnification clauses. The Trust’s maximum exposure under these arrangements is dependent on future claims that may be made against the Fund and, therefore, cannot be estimated.
11. REGULATORY CHANGES
In October 2016, the Securities and Exchange Commission (“SEC”) adopted new rules and forms and amended existing rules and forms (together, “final rules”) intended to modernize and enhance the reporting and disclosure of information by registered investment companies and to enhance liquidity risk management by open-end mutual funds and exchange-traded funds. The final rules will enhance the quality of information available to investors and will allow the SEC to more effectively collect and use data reported by funds. In part, the final rules amend Regulation S-X and require standardized, enhanced disclosure about derivatives in the Fund’s financial statements, as well as other amendments. The compliance date for the amendments to Regulation S-X is August 1, 2017 while the compliance date for the new form types is June 1, 2018 and the compliance date for the liquidity risk management program requirements is December 1, 2018. Management is currently assessing the potential impact of these enhancements and their impact on the financial statement disclosures and reporting requirements.
| | | | |
| 30 | | Wells Fargo Emerging Markets Equity Fund | | Report of independent registered public accounting firm |
BOARD OF TRUSTEES AND SHAREHOLDERS OF WELLS FARGO FUNDS TRUST:
We have audited the accompanying statement of assets and liabilities, including the portfolio of investments, of the Wells Fargo Emerging Markets Equity Fund (the “Fund”), one of the funds constituting the Wells Fargo Funds Trust, as of October 31, 2016, and the related statement of operations for the year then ended, the statements of changes in net assets for each of the years in the two-year period then ended, and the financial highlights for each of the years or periods in the five-year period then ended. These financial statements and financial highlights are the responsibility of the Fund’s management. Our responsibility is to express an opinion on these financial statements and financial highlights based on our audits.
We conducted our audits in accordance with the standards of the Public Company Accounting Oversight Board (United States). Those standards require that we plan and perform the audit to obtain reasonable assurance about whether the financial statements and financial highlights are free of material misstatement. An audit includes examining, on a test basis, evidence supporting the amounts and disclosures in the financial statements. Our procedures included confirmation of securities owned as of October 31, 2016, by correspondence with the custodian and brokers, or by other appropriate auditing procedures. An audit also includes assessing the accounting principles used and significant estimates made by management, as well as evaluating the overall financial statement presentation. We believe that our audits provide a reasonable basis for our opinion.
In our opinion, the financial statements and financial highlights referred to above present fairly, in all material respects, the financial position of the Wells Fargo Emerging Markets Equity Fund as of October 31, 2016, the results of its operations for the year then ended, the changes in its net assets for each of the years in the two-year period then ended, and the financial highlights for each of the years or periods in the five-year period then ended, in conformity with U.S. generally accepted accounting principles.

Boston, Massachusetts
December 22, 2016
| | | | | | |
| Other information (unaudited) | | Wells Fargo Emerging Markets Equity Fund | | | 31 | |
TAX INFORMATION
Pursuant to Section 854 of the Internal Revenue Code, $29,688,756 of income dividends paid during the fiscal year ended October 31, 2016 has been designated as qualified dividend income (QDI).
Pursuant to Section 853 of the Internal Revenue Code, the Fund expects to designate amounts as foreign taxes paid for the fiscal year ended October 31, 2016. Additional details will be available in the semiannual report.
PROXY VOTING INFORMATION
A description of the policies and procedures that the Fund uses to determine how to vote proxies relating to portfolio securities is available, upon request, by calling 1-800-222-8222, visiting our website at wellsfargofunds.com, or visiting the SEC website at sec.gov. Information regarding how the Fund voted proxies relating to portfolio securities during the most recent 12-month period ended June 30 is available on the Fund’s website at wellsfargofunds.com or by visiting the SEC website at sec.gov.
PORTFOLIO HOLDINGS INFORMATION
The complete portfolio holdings for the Fund are publicly available monthly on the Fund’s website (wellsfargofunds.com), on a one-month delayed basis. In addition, top ten holdings information (excluding derivative positions) for the Fund is publicly available on the Fund’s website on a monthly, seven-day or more delayed basis. The Fund files its complete schedule of portfolio holdings with the SEC for the first and third quarters of each fiscal year on Form N-Q, which is available by visiting the SEC website at sec.gov. In addition, the Fund’s Form N-Q may be reviewed and copied at the SEC’s Public Reference Room in Washington, DC, and at regional offices in New York City, at 233 Broadway, and in Chicago, at 175 West Jackson Boulevard, Suite 900. Information about the Public Reference Room may be obtained by calling 1-800-SEC-0330.
| | | | |
| 32 | | Wells Fargo Emerging Markets Equity Fund | | Other information (unaudited) |
BOARD OF TRUSTEES AND OFFICERS
Each of the Trustees and Officers1 listed in the table below acts in identical capacities for each fund in the Wells Fargo family of funds, which consists of 139 mutual funds comprising the Wells Fargo Funds Trust, Wells Fargo Variable Trust, Wells Fargo Master Trust and four closed-end funds (collectively the “Fund Complex”). This table should be read in conjunction with the Prospectus and the Statement of Additional Information2. The mailing address of each Trustee and Officer is 525 Market Street, 12th Floor, San Francisco, CA 94105. Each Trustee and Officer serves an indefinite term, however, each Trustee serves such term until reaching the mandatory retirement age established by the Trustees.
Independent Trustees
| | | | | | |
Name and year of birth | | Position held and length of service* | | Principal occupations during past five years or longer | | Current other public company or
investment company
directorships |
William R. Ebsworth (Born 1957) | | Trustee, since 2015 | | Retired. From 1984 to 2013, equities analyst, portfolio manager, research director and chief investment officer at Fidelity Management and Research Company in Boston, Tokyo, and Hong Kong and retired in 2013 as Chief Investment Officer of Fidelity Strategic Advisers, Inc. where he lead a team of investment professionals managing client assets. Prior thereto, Board member of Hong Kong Securities Clearing Co., Hong Kong Options Clearing Corp., the Thailand International Fund, Ltd., Fidelity Investments Life Insurance Company, and Empire Fidelity Investments Life Insurance Company. Mr. Ebsworth is a CFA® charterholder and an Adjunct Lecturer, Finance, at Babson College. | | Asset Allocation Trust |
Jane A. Freeman (Born 1953) | | Trustee, since 2015 | | Retired. From 2012 to 2014 and 1999 to 2008, Chief Financial Officer of Scientific Learning Corporation. From 2008 to 2012, Ms. Freeman provided consulting services related to strategic business projects. Prior to 1999, Portfolio Manager at Rockefeller & Co. and Scudder, Stevens & Clark. Board member of the Harding Loevner Funds from 1996 to 2014, serving as both Lead Independent Director and chair of the Audit Committee. Board member of the Russell Exchange Traded Funds Trust from 2011 to 2012 and the chair of the Audit Committee. Ms. Freeman is Chair of Taproot Foundation (non-profit organization), a Board Member of Ruth Bancroft Garden (non-profit organization) and an inactive chartered financial analyst. | | Asset Allocation Trust |
Peter G. Gordon** (Born 1942) | | Trustee, since 1998; Chairman, since 2005 | | Co-Founder, Retired Chairman, President and CEO of Crystal Geyser Water Company. Trustee Emeritus, Colby College. | | Asset Allocation Trust |
Isaiah Harris, Jr. (Born 1952) | | Trustee, since 2009 | | Retired. Chairman of the Board of CIGNA Corporation since 2009, and Director since 2005. From 2003 to 2011, Director of Deluxe Corporation. Prior thereto, President and CEO of BellSouth Advertising and Publishing Corp. from 2005 to 2007, President and CEO of BellSouth Enterprises from 2004 to 2005 and President of BellSouth Consumer Services from 2000 to 2003. Emeritus member of the Iowa State University Foundation Board of Governors. Emeritus Member of the Advisory Board of Iowa State University School of Business. Advisory Board Member, Palm Harbor Academy (charter school). Advisory Board Member, Child Evangelism Fellowship (non-profit). Mr. Harris is a certified public accountant (inactive status). | | CIGNA Corporation; Asset Allocation Trust |
Judith M. Johnson (Born 1949) | | Trustee, since 2008; Audit Committee Chairman, since 2008 | | Retired. Prior thereto, Chief Executive Officer and Chief Investment Officer of Minneapolis Employees Retirement Fund from 1996 to 2008. Ms. Johnson is an attorney, certified public accountant and a certified managerial accountant. | | Asset Allocation Trust |
David F. Larcker (Born 1950) | | Trustee, since 2009 | | James Irvin Miller Professor of Accounting at the Graduate School of Business, Stanford University, Director of the Corporate Governance Research Initiative and Senior Faculty of The Rock Center for Corporate Governance since 2006. From 2005 to 2008, Professor of Accounting at the Graduate School of Business, Stanford University. Prior thereto, Ernst & Young Professor of Accounting at The Wharton School, University of Pennsylvania from 1985 to 2005. | | Asset Allocation Trust |
| | | | | | |
| Other information (unaudited) | | Wells Fargo Emerging Markets Equity Fund | | | 33 | |
| | | | | | |
Name and year of birth | | Position held and length of service* | | Principal occupations during past five years or longer | | Current other public company or
investment company
directorships |
Olivia S. Mitchell (Born 1953) | | Trustee, since 2006 | | International Foundation of Employee Benefit Plans Professor, Wharton School of the University of Pennsylvania since 1993. Director of Wharton’s Pension Research Council and Boettner Center on Pensions & Retirement Research, and Research Associate at the National Bureau of Economic Research. Previously, Cornell University Professor from 1978 to 1993. | | Asset Allocation Trust |
Timothy J. Penny (Born 1951) | | Trustee, since 1996 | | President and Chief Executive Officer of Southern Minnesota Initiative Foundation, a non-profit organization, since 2007 and Senior Fellow at the Humphrey Institute Policy Forum at the University of Minnesota since 1995. Member of the Board of Trustees of NorthStar Education Finance, Inc., a non-profit organization, since 2007. | | Asset Allocation Trust |
Michael S. Scofield (Born 1943) | | Trustee, since 2010 | | Served on the Investment Company Institute’s Board of Governors and Executive Committee from 2008-2011 as well the Governing Council of the Independent Directors Council from 2006-2011 and the Independent Directors Council Executive Committee from 2008-2011. Chairman of the IDC from 2008-2010. Institutional Investor (Fund Directions) Trustee of Year in 2007. Trustee of the Evergreen Funds complex (and its predecessors) from 1984 to 2010. Chairman of the Evergreen Funds from 2000-2010. Former Trustee of the Mentor Funds. Retired Attorney, Law Offices of Michael S. Scofield. | | Asset Allocation Trust |
| * | Length of service dates reflect the Trustee’s commencement of service with the Trust’s predecessor entities, where applicable. |
| ** | Peter G. Gordon is expected to retire on December 31, 2017. |
Officers
| | | | | | |
Name and year of birth | | Position held and
length of service | | Principal occupations during past five years or longer | | |
Karla M. Rabusch (Born 1959) | | President, since 2003 | | Executive Vice President of Wells Fargo Bank, N.A. and President of Wells Fargo Funds Management, LLC since 2003. | | |
Jeremy DePalma1 (Born 1974) | | Treasurer, since 2012 | | Senior Vice President of Wells Fargo Funds Management, LLC since 2009. Senior Vice President of Evergreen Investment Management Company, LLC from 2008 to 2010 and head of the Fund Reporting and Control Team within Fund Administration from 2005 to 2010. | | |
C. David Messman (Born 1960) | | Secretary, since 2000; Chief Legal Officer, since 2003 | | Senior Vice President and Secretary of Wells Fargo Funds Management, LLC since 2001. Assistant General Counsel of Wells Fargo Bank, N.A. since 2013 and Vice President and Managing Counsel of Wells Fargo Bank, N.A. from 1996 to 2013. | | |
Michael Whitaker3 (Born 1967) | | Chief Compliance Officer, since 2016 | | Executive Vice President of Wells Fargo Funds Management, LLC since 2016. Chief Compliance Officer of Fidelity’s Fixed Income Funds and Asset Allocation Funds from 2008 to 2016, Compliance Officer of FMR Co., Inc. from 2014 to 2016, Fidelity Investments Money Management, Inc. from 2014 to 2016, Fidelity Investments from 2007 to 2016. | | |
David Berardi (Born 1975) | | Assistant Treasurer, since 2009 | | Vice President of Wells Fargo Funds Management, LLC since 2009. Vice President of Evergreen Investment Management Company, LLC from 2008 to 2010. Manager of Fund Reporting and Control for Evergreen Investment Management Company, LLC from 2004 to 2010. | | |
| 1 | Jeremy DePalma acts as Treasurer of 69 funds and Assistant Treasurer of 70 funds in the Fund Complex. |
| 2 | The Statement of Additional Information includes additional information about the Trustees and is available, without charge, upon request, by calling 1-800-222-8222 or by visiting the website at wellsfargofunds.com. |
| 3 | Michael Whitaker became Chief Compliance Officer effective May 16, 2016. |
| | | | |
| 34 | | Wells Fargo Emerging Markets Equity Fund | | Other information (unaudited) |
BOARD CONSIDERATION OF INVESTMENT MANAGEMENT AND SUB-ADVISORY AGREEMENTS:
Under the Investment Company Act of 1940 (the “1940 Act”), the Board of Trustees (the “Board”) of Wells Fargo Funds Trust (the “Trust”) must determine annually whether to approve the continuation of the Trust’s investment management and sub-advisory agreements. In this regard, at an in-person meeting held on May 24-25, 2016 (the “Meeting”), the Board, all the members of which have no direct or indirect interest in the investment management and sub-advisory agreements and are not “interested persons” of the Trust, as defined in the 1940 Act (the “Independent Trustees”), reviewed and approved for Wells Fargo Emerging Markets Equity Fund (the “Fund”): (i) an investment management agreement (the “Management Agreement”) with Wells Fargo Funds Management, LLC (“Funds Management”); and (ii) an investment sub-advisory agreement (the “Sub-Advisory Agreement”) with Wells Capital Management Incorporated (the “Sub-Adviser”), an affiliate of Funds Management. The Management Agreement and the Sub-Advisory Agreement are collectively referred to as the “Advisory Agreements.”
At the Meeting, the Board considered the factors and reached the conclusions described below relating to the selection of Funds Management and the Sub-Adviser and the approval of the Advisory Agreements. Prior to the Meeting, including at an in-person meeting in April 2016, the Trustees conferred extensively among themselves and with representatives of Funds Management about these matters. Also, the Board has adopted a team-based approach, with each team consisting of a sub-set of Trustees, to assist the full Board in the discharge of its duties in reviewing performance and other matters throughout the year. The Independent Trustees were assisted in their evaluation of the Advisory Agreements by independent legal counsel, from whom they received separate legal advice and with whom they met separately.
In providing information to the Board, Funds Management and the Sub-Adviser were guided by a detailed set of requests for information submitted to them by independent legal counsel on behalf of the Independent Trustees at the start of the Board’s annual contract renewal process earlier in 2016. In considering and approving the Advisory Agreements, the Trustees considered the information they believed relevant, including but not limited to the information discussed below. The Board considered not only the specific information presented in connection with the Meeting, but also the knowledge gained over time through interaction with Funds Management and the Sub-Adviser about various topics. In this regard, the Board reviewed reports of Funds Management at each of its quarterly meetings, which included, among other things, portfolio reviews and performance reports. In addition, the Board and the teams mentioned above confer with portfolio managers at various times throughout the year. The Board did not identify any particular information or consideration that was all-important or controlling, and each individual Trustee may have attributed different weights to various factors.
After its deliberations, the Board unanimously approved the continuation of the Advisory Agreements for a one-year term and determined that the compensation payable to Funds Management and the Sub-Adviser under each of the Advisory Agreements was reasonable. The Board considered the approval of the Advisory Agreements for the Fund as part of its consideration of agreements for funds across the complex, but its approvals were made on a fund-by-fund basis. The following summarizes a number of important, but not necessarily all, factors considered by the Board in support of its approvals.
Nature, extent and quality of services
The Board received and considered various information regarding the nature, extent and quality of services provided to the Fund by Funds Management and the Sub-Adviser under the Advisory Agreements. This information included a description of the investment advisory services and Fund-level administrative services covered by the Management Agreement, as well as, among other things, a summary of the background and experience of senior management of Funds Management, and the qualifications, background, tenure and responsibilities of each of the portfolio managers primarily responsible for the day-to-day portfolio management of the Fund.
The Board evaluated the ability of Funds Management and the Sub-Adviser to attract and retain qualified investment professionals, including research, advisory and supervisory personnel. The Board further considered the compliance programs and compliance records of Funds Management and the Sub-Adviser. In addition, the Board took into account the full range of services provided to the Fund by Funds Management and its affiliates.
Fund performance and expenses
The Board considered the performance results for the Fund over various time periods ended December 31, 2015. The Board considered these results in comparison to the performance of funds in a universe that was determined by Broadridge Inc. (“Broadridge”) to be similar to the Fund (the “Universe”), and in comparison to the Fund’s benchmark index and to other comparative data. Broadridge is an independent provider of investment company data. The Board received a description of the methodology used by Broadridge to select the mutual funds in the performance Universe. The Board noted that the performance of the Fund (Administrator Class) was higher than or in range of the
| | | | | | |
| Other information (unaudited) | | Wells Fargo Emerging Markets Equity Fund | | | 35 | |
average performance of the Universe for all periods under review except the three-year period under review. The Board also noted that the performance of the Fund was higher than or in range of its benchmark, the MSCI Emerging Markets Index (Net), for all periods under review.
The Board received information concerning, and discussed factors contributing to, the underperformance of the Fund relative to the Universe for the period noted above. The Board took note of the explanations for the relative underperformance in these periods, including with respect to market factors and investment decisions that affected the Fund’s performance and of outperformance relative to the benchmark index.
The Board also received and considered information regarding the Fund’s net operating expense ratios and their various components, including actual management fees, custodian and other non-management fees, and Rule 12b-1 and non-Rule 12b-1 shareholder service fees. The Board considered these ratios in comparison to the median ratios of funds in class-specific expense groups that were determined by Broadridge to be similar to the Fund (the “Groups”). The Board received a description of the methodology used by Broadridge to select the mutual funds in the expense Groups and an explanation of how funds comprising expense groups and their expense ratios may vary from year-to-year. Based on the Broadridge reports, the Board noted that the net operating expense ratios of the Fund were in range of the median net operating expense ratios of the expense Groups. The Board discussed and accepted Funds Management’s proposal to reduce the net operating expense ratio caps for the Class A, Class B, Class C, Administrator Class, Institutional Class and Class R6.
The Board took into account the Fund performance and expense information provided to it among the factors considered in deciding to re-approve the Advisory Agreements.
Investment management and sub-advisory fee rates
The Board reviewed and considered the contractual fee rates payable by the Fund to Funds Management under the Management Agreement, as well as the contractual fee rates payable by the Fund to Funds Management for class-level administrative services under a Class-Level Administration Agreement, which include class-level transfer agency and sub-transfer agency costs (collectively, the “Management Rates”). The Board also reviewed and considered the contractual investment sub-advisory fee rates that are payable by Funds Management to the Sub-Adviser for investment sub-advisory services.
Among other information reviewed by the Board was a comparison of the Fund’s Management Rates with the average contractual investment management fee rates of funds in the expense Groups at a common asset level as well as transfer agency costs of the funds in the expense Groups. The Board noted that the Management Rates of the Fund were in range of the sum of these average rates for the Fund’s expense Groups for all share classes except the Institutional Class. The Board noted that the net operating expense ratios of the Fund were in range of the median net operating expense ratios of the expense Groups for all share classes, including Institutional Class. The Board also discussed and accepted Funds Management’s proposal to revise the Management Agreement to reduce fees at all asset levels for the Fund.
The Board also received and considered information about the portion of the total management fee that was retained by Funds Management after payment of the fee to the Sub-Adviser for sub-advisory services. In assessing the reasonableness of this amount, the Board received and evaluated information about the nature and extent of responsibilities retained and risks assumed by Funds Management and not delegated to or assumed by the Sub-Adviser, and about Funds Management’s on-going oversight services. However, given the affiliation between Funds Management and the Sub-Adviser, the Board ascribed limited relevance to the allocation of fees between them.
The Board also received and considered information about the nature and extent of services offered and fee rates charged by Funds Management and the Sub-Adviser to other types of clients with investment strategies similar to those of the Fund. In this regard, the Board received information about the significantly greater scope of services, and compliance, reporting and other legal burdens and risks of managing mutual funds compared with those associated with managing assets of non-mutual fund clients such as collective funds or institutional separate accounts.
Based on its consideration of the factors and information it deemed relevant, including those described here, the Board determined that the compensation payable to Funds Management under the Management Agreement and to the Sub-Adviser under the Sub-Advisory Agreement was reasonable, in light of the services covered by the Advisory Agreements.
Profitability
The Board received and considered information concerning the profitability of Funds Management, as well as the profitability of Wells Fargo as a whole, from providing services to the Fund and the fund family as a whole. The Board also received and considered information concerning the profitability of the Sub-Adviser from providing services to the fund family as a whole, noting that the Sub-Adviser’s profitability information with respect to providing services to the Fund was subsumed in the Wells Fargo and Funds Management profitability analysis.
| | | | |
| 36 | | Wells Fargo Emerging Markets Equity Fund | | Other information (unaudited) |
Funds Management reported on the methodologies and estimates used in calculating profitability. Among other things, the Board noted that the levels of profitability reported on a fund-by-fund basis varied widely, depending on factors such as the size and type of fund. Based on its review, the Board did not deem the profits reported by Funds Management or Wells Fargo from its services to the Fund to be at a level that would prevent it from approving the continuation of the Advisory Agreements.
Economies of scale
With respect to possible economies of scale, the Board noted the existence of breakpoints in the Fund’s management fee structure, which operate generally to reduce the Fund’s expense ratios as the Fund grows in size. It considered that, for a small fund or a fund that shrinks in size, breakpoints conversely can result in higher fee levels. The Board also considered that fee waiver and expense reimbursement arrangements and competitive fee rates at the outset are means of sharing potential economies of scale with shareholders of the Fund and the fund family as a whole. The Board discussed and accepted Funds Management’s proposal to reduce the net operating expense ratio caps for the Class A, Class B, Class C, Administrator Class, Institutional Class and Class R6. The Board also discussed and accepted Funds Management’s proposal to revise the Management Agreement to reduce fees at all asset levels for the Fund. The Board considered Funds Management’s view that any analyses of potential economies of scale in managing a particular fund are inherently limited in light of the joint and common costs and investments that Funds Management incurs across the fund family as a whole.
The Board concluded that the Fund’s fee and expense arrangements, including contractual breakpoints, constituted a reasonable approach to sharing potential economies of scale with the Fund and its shareholders.
Other benefits to Funds Management and the Sub-Adviser
The Board received and considered information regarding potential “fall-out” or ancillary benefits received by Funds Management and its affiliates, including the Sub-Adviser, as a result of their relationships with the Fund. Ancillary benefits could include, among others, benefits directly attributable to other relationships with the Fund and benefits potentially derived from an increase in Funds Management’s and the Sub-Adviser’s business as a result of their relationships with the Fund. The Board noted that various affiliates of Funds Management may receive distribution-related fees, shareholder servicing payments and sub-transfer agency fees in respect of shares sold or held through them and services provided.
The Board also reviewed information about soft dollar credits earned and utilized by the Sub-Adviser, fees earned by Funds Management and the Sub-Adviser from managing a private investment vehicle for the fund family’s securities lending collateral and commissions earned by an affiliated broker from portfolio transactions.
Based on its consideration of the factors and information it deemed relevant, including those described here, the Board did not find that any ancillary benefits received by Funds Management and its affiliates, including the Sub-Adviser, were unreasonable.
Conclusion
At the Meeting, after considering the above-described factors and based on its deliberations and its evaluation of the information described above, the Board unanimously approved the continuation of the Advisory Agreements for a one-year term and determined that the compensation payable to Funds Management and the Sub-Adviser under each of the Advisory Agreements was reasonable.
| | | | | | |
| List of abbreviations | | Wells Fargo Emerging Markets Equity Fund | | | 37 | |
The following is a list of common abbreviations for terms and entities that may have appeared in this report.
| ACA | — ACA Financial Guaranty Corporation |
| ADR | — American depositary receipt |
| ADS | — American depositary shares |
| AGC | — Assured Guaranty Corporation |
| AGM | — Assured Guaranty Municipal |
| Ambac | — Ambac Financial Group Incorporated |
| AMT | — Alternative minimum tax |
| BAN | — Bond anticipation notes |
| BHAC | — Berkshire Hathaway Assurance Corporation |
| CAB | — Capital appreciation bond |
| CCAB | — Convertible capital appreciation bond |
| CDA | — Community Development Authority |
| CDO | — Collateralized debt obligation |
| DRIVER | — Derivative inverse tax-exempt receipts |
| DW&P | — Department of Water & Power |
| DWR | — Department of Water Resources |
| ECFA | — Educational & Cultural Facilities Authority |
| EDA | — Economic Development Authority |
| EDFA | — Economic Development Finance Authority |
| ETF | — Exchange-traded fund |
| FDIC | — Federal Deposit Insurance Corporation |
| FFCB | — Federal Farm Credit Banks |
| FGIC | — Financial Guaranty Insurance Corporation |
| FHA | — Federal Housing Administration |
| FHLB | — Federal Home Loan Bank |
| FHLMC | — Federal Home Loan Mortgage Corporation |
| FICO | — The Financing Corporation |
| FNMA | — Federal National Mortgage Association |
| GDR | — Global depositary receipt |
| GNMA | — Government National Mortgage Association |
| HCFR | — Healthcare facilities revenue |
| HEFA | — Health & Educational Facilities Authority |
| HEFAR | — Higher education facilities authority revenue |
| HFA | — Housing Finance Authority |
| HFFA | — Health Facilities Financing Authority |
| HUD | — Department of Housing and Urban Development |
| IDA | — Industrial Development Authority |
| IDAG | — Industrial Development Agency |
| KRW | — Republic of Korea won |
| LIBOR | — London Interbank Offered Rate |
| LIFER | — Long Inverse Floating Exempt Receipts |
| LLC | — Limited liability company |
| LLLP | — Limited liability limited partnership |
| LLP | — Limited liability partnership |
| MBIA | — Municipal Bond Insurance Association |
| MFHR | — Multifamily housing revenue |
| MSTR | — Municipal securities trust receipts |
| MUD | — Municipal Utility District |
| National | — National Public Finance Guarantee Corporation |
| PCFA | — Pollution Control Financing Authority |
| PCL | — Public Company Limited |
| PCR | — Pollution control revenue |
| PFA | — Public Finance Authority |
| PFFA | — Public Facilities Financing Authority |
| PFOTER | — Puttable floating option tax-exempt receipts |
| plc | — Public limited company |
| PUTTER | — Puttable tax-exempt receipts |
| R&D | — Research & development |
| Radian | — Radian Asset Assurance |
| RAN | — Revenue anticipation notes |
| RDA | — Redevelopment Authority |
| RDFA | — Redevelopment Finance Authority |
| REIT | — Real estate investment trust |
| ROC | — Reset option certificates |
| SAVRS | — Select auction variable rate securities |
| SBA | — Small Business Authority |
| SDR | — Swedish depositary receipt |
| SFHR | — Single-family housing revenue |
| SFMR | — Single-family mortgage revenue |
| SPA | — Standby purchase agreement |
| SPDR | — Standard & Poor’s Depositary Receipts |
| SPEAR | — Short Puttable Exempt Adjustable Receipts |
| STRIPS | — Separate trading of registered interest and |
| TAN | — Tax anticipation notes |
| TIPS | — Treasury inflation-protected securities |
| TRAN | — Tax revenue anticipation notes |
| TTFA | — Transportation Trust Fund Authority |
| TVA | — Tennessee Valley Authority |
This page is intentionally left blank.
This page is intentionally left blank.
This page is intentionally left blank.

For more information
More information about Wells Fargo Funds is available free upon request. To obtain literature, please write, email, visit the Fund’s website, or call:
Wells Fargo Funds
P.O. Box 8266
Boston, MA 02266-8266
Email: fundservice@wellsfargo.com
Website: wellsfargofunds.com
Individual investors: 1-800-222-8222
Retail investment professionals: 1-888-877-9275
Institutional investment professionals: 1-866-765-0778
This report and the financial statements contained herein are submitted for the general information of the shareholders of the Fund. If this report is used for promotional purposes, distribution of the report must be accompanied or preceded by a current prospectus. Before investing, please consider the investment objectives, risks, charges, and expenses of the investment. For a current prospectus and, if available, a summary prospectus, containing this information, call 1-800-222-8222 or visit the Fund’s website at wellsfargofunds.com. Read the prospectus carefully before you invest or send money.
Wells Fargo Asset Management (WFAM) is a trade name used by the asset management businesses of Wells Fargo & Company. Wells Fargo Funds Management, LLC, a wholly owned subsidiary of Wells Fargo & Company, provides investment advisory and administrative services for Wells Fargo Funds. Other affiliates of Wells Fargo & Company provide subadvisory and other services for the funds. The funds are distributed by Wells Fargo Funds Distributor, LLC, Member FINRA, an affiliate of Wells Fargo & Company. Neither Wells Fargo Funds Management nor Wells Fargo Funds Distributor has Fund customer accounts/assets, and neither provides investment advice/recommendations or acts as an investment advice fiduciary to any investor.
NOT FDIC INSURED ¡ NO BANK GUARANTEE ¡ MAY LOSE VALUE
© 2016 Wells Fargo Funds Management, LLC. All rights reserved.
| | |
 | | 247341 12-16 A238/AR238 10-16 |
Annual Report
October 31, 2016

Wells Fargo
Emerging Markets Equity Income Fund


Reduce clutter. Save trees.
Sign up for electronic delivery of prospectuses and shareholder reports at wellsfargo.com/advantagedelivery
Contents
The views expressed and any forward-looking statements are as of October 31, 2016, unless otherwise noted, and are those of the Fund managers and/or Wells Fargo Funds Management, LLC. Discussions of individual securities, or the markets generally, or any Wells Fargo Fund are not intended as individual recommendations. Future events or results may vary significantly from those expressed in any forward-looking statements. The views expressed are subject to change at any time in response to changing circumstances in the market. Wells Fargo Funds Management, LLC and the Fund disclaim any obligation to publicly update or revise any views expressed or forward-looking statements.
NOT FDIC INSURED ◾ NO BANK GUARANTEE ◾ MAY LOSE VALUE
| | | | |
| 2 | | Wells Fargo Emerging Markets Equity Income Fund | | Letter to shareholders (unaudited) |

Karla M. Rabusch
President
Wells Fargo Funds
Political events in some countries prompted investor concern.
The business-supportive stance of major central banks helped offset volatility following the U.S. rate increase.
Dear Shareholder:
We are pleased to offer you this annual report for the Wells Fargo Emerging Markets Equity Income Fund for the 12-month period that ended October 31, 2016. Entering the reporting period, many emerging markets commentaries focused on the potential effect of the U.S. Federal Reserve (Fed) raising its key interest rate in December 2015 and concerns about slowing economic growth in China. Political events in some countries prompted investor concern. Throughout the period, the European Central Bank (ECB), the Bank of Japan (BOJ), and the People’s Bank of China (PBOC), maintained policies intended to encourage business activity including low—even negative—interest rates to boost lending and bond-buying programs to enhance liquidity. As the period ended, it appeared that these efforts, the Fed’s hesitancy to raise rates further, and effective resolution of some of the political issues contributed to improving economic data and investment results in several countries in the emerging markets.
In early 2016, emerging markets economies endured challenges.
Following the Fed’s decision in December 2015 to increase rates, the relative value of the U.S. dollar increased. The stronger U.S. dollar pressured emerging markets importers and benefited exporters. In November 2015, the PBOC reduced short-term borrowing costs. The ECB pushed interest rates paid on deposits further into negative territory in late 2015. In January 2016, the BOJ followed the ECB’s lead by setting a negative deposit rate. The Fed indicated that it would be cautious about further rate increases in consideration of global growth risks. The business-supportive stance of major central banks helped offset volatility following the U.S. rate increase.
Political issues affected some emerging markets during the period. Brazil endured a bribery scandal involving the state-owned oil company, Petróleo Brasileiro S.A., and the president was impeached after a scandal related to unauthorized loans from state-owned banks. In addition, a June 2016 referendum approved the U.K.’s exit from the European Union (Brexit), casting uncertainty, particularly on European emerging markets, such as the Czech Republic, Greece, Hungary, and Poland. Despite dire news headlines, each event appeared to have little lasting effect on the markets as governments worked to minimize any negative influence. The Morgan Stanley Capital International (MSCI) Emerging Markets (EM) Index (Net)1 finished the first half of the period with a -0.13% return.
A second-half turnaround benefited investments in emerging markets.
Investors’ sentiments improved during the third quarter of 2016, which led to positive returns across global equity markets. The MSCI EM Index (Net) reflected the improved investment climate over the last six months of the period, gaining 9.41%. For the full 12-month period, the index gained 9.27%.
Equity market volatility levels, as measured by the Chicago Board Options Exchange (CBOE) Market Volatility Index (VIX),2 remained relatively low throughout the second half of the period with a brief spike following the Brexit vote. A recovery in commodity
| 1 | The Morgan Stanley Capital International (MSCI) Emerging Markets (EM) Index (Net) is a free-float-adjusted market-capitalization-weighted index that is designed to measure the equity market performance of emerging markets. The MSCI EM Index (Net) consists of the following 23 emerging markets country indexes: Brazil, Chile, China, Colombia, Czech Republic, Egypt, Greece, Hungary, India, Indonesia, Korea, Malaysia, Mexico, Peru, the Philippines, Poland, Qatar, Russia, South Africa, Taiwan, Thailand, Turkey, and United Arab Emirates. Source: MSCI. MSCI makes no express or implied warranties or representations and shall have no liability whatsoever with respect to any MSCI data contained herein. The MSCI data may not be further redistributed or used as a basis for other indexes or any securities or financial products. This report is not approved, reviewed, or produced by MSCI. You cannot invest directly in an index. |
| 2 | The Chicago Board Options Exchange (CBOE) Market Volatility Index (VIX) is a popular measure of the implied volatility of S&P 500 Index options. It represents one measure of the market’s expectation of stock market volatility over the next 30-day period. You cannot invest directly in an index. |
| | | | | | |
| Letter to shareholders (unaudited) | | Wells Fargo Emerging Markets Equity Income Fund | | | 3 | |
prices benefited oil-sensitive economies such as Colombia and other producers and exporters of natural resources in Asia. As political issues were resolved, equity markets in the respective countries moved higher; Brazilian shares advanced on the installation of a new government, and Peruvian shares gained on a market-friendly election outcome. Also, throughout the period and in several emerging markets countries, the passage of legislative and regulatory reforms that seek to enhance the structure, operations, and oversight of businesses tended to benefit investor confidence and encourage increased investment activity.
Don’t let short-term uncertainty derail long-term investment goals.
Periods of uncertainty can present challenges, but experience has taught us that maintaining long-term investment goals can be an effective way to plan for the future. To help you create a sound strategy based on your personal goals and risk tolerance, Wells Fargo Funds offers more than 100 mutual funds and other investments spanning a wide range of asset classes and investment styles. Although diversification cannot guarantee an investment profit or prevent losses, we believe it can be an effective way to manage investment risk and potentially smooth out overall portfolio performance. We encourage investors to know their investments and to understand that appropriate levels of risk-taking may unlock opportunities.
Thank you for choosing to invest with Wells Fargo Funds. We appreciate your confidence in us and remain committed to helping you meet your financial needs.
Sincerely,

Karla M. Rabusch
President
Wells Fargo Funds
For further information about your Fund, contact your investment professional, visit our website at wellsfargofunds.com, or call us directly at 1-800-222-8222. We are available 24 hours a day, 7 days a week.
| | | | |
| 4 | | Wells Fargo Emerging Markets Equity Income Fund | | Performance highlights (unaudited) |
Investment objective
The Fund seeks long-term capital appreciation and current income.
Manager
Wells Fargo Funds Management, LLC
Subadviser
Wells Capital Management Incorporated
Portfolio managers
Anthony L.T. Cragg
Alison Shimada
Average annual total returns (%) as of October 31, 20161
| | | | | | | | | | | | | | | | | | | | | | | | | | |
| | | | | Including sales charge | | | Excluding sales charge | | | Expense ratios2 (%) | |
| | | Inception date | | 1 year | | | Since inception | | | 1 year | | | Since inception | | | Gross | | | Net3 | |
| Class A (EQIAX) | | 5-31-2012 | | | (0.78 | ) | | | 2.93 | | | | 5.29 | | | | 4.32 | | | | 1.88 | | | | 1.67 | |
| Class C (EQICX) | | 5-31-2012 | | | 3.53 | | | | 3.57 | | | | 4.53 | | | | 3.57 | | | | 2.63 | | | | 2.42 | |
| Class R (EQIHX) | | 9-30-2015 | | | – | | | | – | | | | 5.13 | | | | 4.08 | | | | 2.13 | | | | 1.92 | |
| Class R6 (EQIRX) | | 9-30-2015 | | | – | | | | – | | | | 5.90 | | | | 4.77 | | | | 1.45 | | | | 1.22 | |
| Administrator Class (EQIDX) | | 5-31-2012 | | | – | | | | – | | | | 5.56 | | | | 4.56 | | | | 1.80 | | | | 1.47 | |
| Institutional Class (EQIIX) | | 5-31-2012 | | | – | | | | – | | | | 5.84 | | | | 4.77 | | | | 1.55 | | | | 1.27 | |
| MSCI EM Index (Net)4 | | – | | | – | | | | – | | | | 9.27 | | | | 2.47 | | | | – | | | | – | |
Figures quoted represent past performance, which is no guarantee of future results, and do not reflect taxes that a shareholder may pay on fund distributions or the redemption of fund shares. Investment return and principal value of an investment will fluctuate so that an investor’s shares, when redeemed, may be worth more or less than their original cost. Performance shown without sales charges would be lower if sales charges were reflected. Current performance may be lower or higher than the performance data quoted, which assumes the reinvestment of dividends and capital gains. Current month-end performance is available on the Fund’s website, wellsfargofunds.com.
Index returns do not include transaction costs associated with buying and selling securities, any mutual fund fees or expenses, or any taxes. It is not possible to invest directly in an index.
For Class A shares, the maximum front-end sales charge is 5.75%. For Class C shares, the maximum contingent deferred sales charge is 1.00%. Performance including a contingent deferred sales charge assumes the sales charge for the corresponding time period. Class R, Class R6, Administrator Class, and Institutional Class shares are sold without a front-end sales charge or contingent deferred sales charge.
Stock values fluctuate in response to the activities of individual companies and general market and economic conditions. Foreign investments are especially volatile and can rise or fall dramatically due to differences in the political and economic conditions of the host country. These risks are generally intensified in emerging markets. The use of derivatives may reduce returns and/or increase volatility. Certain investment strategies tend to increase the total risk of investment (relative to the broader market). The Fund is exposed to smaller-company securities risk. Consult the Fund’s prospectus for additional information on these and other risks.
Please see footnotes on page 5.
| | | | | | |
| Performance highlights (unaudited) | | Wells Fargo Emerging Markets Equity Income Fund | | | 5 | |
|
| Growth of $10,000 investment as of October 31, 20165 |
|
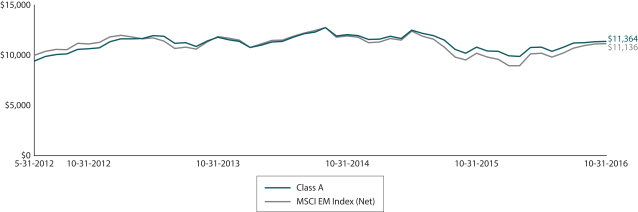 |
| 1 | Historical performance shown for the Class R shares prior to their inception reflects the performance of the Administrator Class shares, adjusted to reflect the higher expenses applicable to Class R shares. Historical performance shown for the Class R6 shares prior to their inception reflects the performance of the Institutional Class shares, and includes the higher expenses applicable to Institutional Class shares. If these expenses had not been included, returns for Class R6 shares would be higher. |
| 2 | Reflects the expense ratios as stated in the most recent prospectuses, which include the impact of 0.02% in acquired fund fees and expenses. The expense ratios shown are subject to change and may differ from the annualized expense ratios shown in the financial highlights of this report, which do not include acquired fund fees and expenses. |
| 3 | The manager has contractually committed through February 28, 2017, to waive fees and/or reimburse expenses to the extent necessary to cap the Fund’s Total Annual Operating Expenses After Fee Waiver at 1.65% for Class A, 2.40% for Class C, 1.90% for Class R, 1.20% for Class R6, 1.45% for Administrator Class, and 1.25% for Institutional Class. After this time, the cap may be increased or the commitment to maintain the cap may be terminated only with the approval of the Board of Trustees. Brokerage commissions, stamp duty fees, interest, taxes, acquired fund fees and expenses, and extraordinary expenses are excluded from the expense cap. Without this cap, the Fund’s returns would have been lower. |
| 4 | The Morgan Stanley Capital International (MSCI) Emerging Markets (EM) Index (Net) is a free-float-adjusted market-capitalization-weighted index that is designed to measure the equity market performance of emerging markets. The MSCI EM Index (Net) consists of the following 23 emerging markets country indexes: Brazil, Chile, China, Colombia, Czech Republic, Egypt, Greece, Hungary, India, Indonesia, Korea, Malaysia, Mexico, Peru, the Philippines, Poland, Qatar, Russia, South Africa, Taiwan, Thailand, Turkey, and United Arab Emirates. Source: MSCI. MSCI makes no express or implied warranties or representations and shall have no liability whatsoever with respect to any MSCI data contained herein. The MSCI data may not be further redistributed or used as a basis for other indexes or any securities or financial products. This report is not approved, reviewed, or produced by MSCI. You cannot invest directly in an index. |
| 5 | The chart compares the performance of Class A shares for the most recent ten years with the MSCI EM Index (Net). The chart assumes a hypothetical investment of $10,000 in Class A shares and reflects all operating expenses and assumes the maximum initial sales charge of 5.75%. |
| 6 | The ten largest holdings, excluding cash and cash equivalents, are calculated based on the value of the investments divided by total net assets of the Fund. Holdings are subject to change and may have changed since the date specified. |
| 7 | Amounts are calculated based on the total long-term investments of the Fund. These amounts are subject to change and may have changed since the date specified. |
| | | | |
| 6 | | Wells Fargo Emerging Markets Equity Income Fund | | Performance highlights (unaudited) |
MANAGER’S DISCUSSION
Fund highlights
| n | | The Fund underperformed its benchmark, the Morgan Stanley Capital International (MSCI) Emerging Markets (EM) Index (Net), for the 12-month period that ended October 31, 2016. |
| n | | On a sector basis, stock selection contributed to relative returns for the period. However, stock selection within energy and an underweight to information technology (IT) and overweight to telecommunication services detracted from relative returns. |
| n | | Among countries, strong stock selection helped the Fund’s relative outperformance in Mexico, Korea, and the Czech Republic. Unfavorable stock selection in Brazil, India, and the Philippines detracted from relative performance, as did an overweight to Mexico. |
The Fund underperformed its benchmark during a volatile market.
During the 12-month period, returns in emerging markets fluctuated as a result of factors including the impeachment of the Brazilian president, the lead-up to the U.S. presidential election, a general resurgence in commodities prices, measures to reduce volatility in the Chinese stock market, and the election of new leaders in Taiwan and the Philippines.
Against this backdrop, stock selection in telecommunication services, real estate, and industrials aided relative results but was partially offset by overweight positions to those sectors that underperformed the broad index. On the opposite side of the spectrum, stock selection within energy and utilities as well as an underweight to IT detracted from relative results.
Outperformance in the telecommunication services sector was primarily driven by the Fund’s exposure to Telekomunikasi Indonesia. Chinese real estate names such as China Vanke Company Limited and China Jinmao Holdings Group Limited also contributed to relative returns. Within energy, Coal India Limited and Oil & Natural Gas Corporation Limited detracted from returns as did an underweight to Petroleo Brasileiro S.A. in Brazil.
| | | | |
| Ten largest holdings (%) as of October 31, 20166 | |
China Construction Bank H Shares | | | 2.77 | |
Industrial & Commercial Bank of China Limited H Shares | | | 2.37 | |
Banco Bradesco SA | | | 2.26 | |
Itausa Investimentos Itau SA | | | 2.25 | |
Taiwan Semiconductor Manufacturing Company Limited | | | 2.09 | |
China Mobile Limited | | | 2.04 | |
China Petroleum & Chemical Corporation H Shares | | | 1.85 | |
SK Telecom Company Limited ADR | | | 1.82 | |
BB Seguridade Participacoes SA | | | 1.82 | |
Hon Hai Precision Industry Company Limited | | | 1.73 | |
|
| Sector distribution as of October 31, 20167 |
|
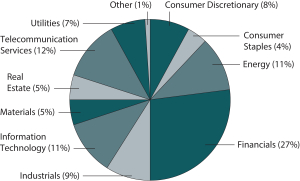
|
Please see footnotes on page 5.
| | | | | | |
| Performance highlights (unaudited) | | Wells Fargo Emerging Markets Equity Income Fund | | | 7 | |
|
| Country allocation as of October 31, 20167 |
|
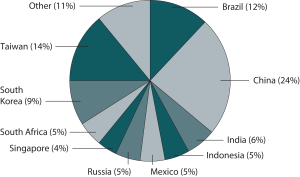 |
On a country basis, notable areas of success included Indonesia, Korea, and Mexico. In Korea, the Fund benefited from holdings in materials and financials. In Mexico, the Fund also benefited from holdings in the industrials sector, principally two airport companies. In China, negative attribution was due to allocations to utilities companies such as China Power International Development Limited and Huaneng Power International, Incorporated, as well as the Fund’s lack of investment in internet companies due to their below average dividend yields which are inconsistent with seeking the potential for maximum portfolio dividend yield while maintaining a controlled level of risk.
Our investment outlook on the emerging markets region remains positive.
We believe Chinese equities should continue to perform driven by earnings growth. Cyclical earnings recovery has been unfolding, and efforts to support industrial prices, continued monetary policy support, and weaker prior-year earnings should drive upside to earnings. Earnings growth remains challenging for Korea, and the export sector is not getting help from the recent strengthening of the won, but the market and our value names are performing on narrowing of deep discount valuations. The IT sector has enjoyed a period of new product launches and strengthening seasonality causing us to revisit our positioning in Taiwanese IT shares. Although we are cautious near term on valuation grounds, we remain positive on India over the medium term. Reform momentum has accelerated over the past five months with approval of the Goods and Services Tax by the Upper House, a new monetary policy committee in the Reserve Bank of India, and the passing of a new bankruptcy law. We are structurally bullish in Indonesia notwithstanding strong year-to-date performance. The tax amnesty program was an overwhelming success and has several positive implications including a widening of the tax base, currency stabilization, increased confidence, a boost to the president’s credibility, an increase in liquidity, and potential for easing of funding costs.
Latin America is experiencing another year of decelerating economic growth. We perceive the limits for faster growth to be cyclical in nature in Mexico, Peru, and Colombia. Conversely, we perceive the growth gap in Brazil and Chile to be structural. Despite the depressed price of crude oil, Mexico’s economic outlook stands out again, this time because of its diversification and visibility of economic policies. In Brazil, our long-held assumption that President Dilma Rousseff would retain her position proved overly conservative. The political climate hopefully will stabilize following the impeachment of President Rousseff so that reform can move forward. Specifically, current President Michel Temer is outlining the proper economic initiatives which, if approved, could start a virtuous cycle in Brazil that could earn a re-rating in the medium term similar to Mexico’s accomplishments over the past 15 years. We remain cautious on Colombia and Peru due to their exposure to commodities and rising taxation. Valuations in Chile could justify revisiting selected names.
Russia continues to be among the better market performers year to date. However, higher oil prices and/or higher visibility into sanctions removals next year in addition to supportive global macroeconomic drivers would be needed to sustain the market rally. We are more cautious on CEE3—the stock markets of the Czeck Republic, Hungary, and Poland—in the aftermath of the U.K.’s vote to leave the European Union (Brexit) and its potential negative effect on the region’s economic growth. We continue to closely monitor macroeconomic and political risks in Turkey, keeping a defensive bias. We are selective buyers of quality names in South Africa, as the overall market does not appear cheap and the economic picture remains weak. In addition, political risks have resurfaced in South Africa, bringing back our concerns about a sovereign credit rating downgrade by at least one credit rating agency.
Please see footnotes on page 5.
| | | | |
| 8 | | Wells Fargo Emerging Markets Equity Income Fund | | Fund expenses (unaudited) |
As a shareholder of the Fund, you incur two types of costs: (1) transaction costs, including sales charges (loads) on purchase payments and contingent deferred sales charges (if any) on redemptions and (2) ongoing costs, including management fees, distribution (12b-1) and/or shareholder servicing fees, and other Fund expenses. This example is intended to help you understand your ongoing costs (in dollars) of investing in the Fund and to compare these costs with the ongoing costs of investing in other mutual funds.
The example is based on an investment of $1,000 invested at the beginning of the six-month period and held for the entire period from May 1, 2016 to October 31, 2016.
Actual expenses
The “Actual” line of the table below provides information about actual account values and actual expenses. You may use the information in this line, together with the amount you invested, to estimate the expenses that you paid over the period. Simply divide your account value by $1,000 (for example, an $8,600 account value divided by $1,000 = 8.6), then multiply the result by the number in the “Actual” line under the heading entitled “Expenses paid during period” for your applicable class of shares to estimate the expenses you paid on your account during this period.
Hypothetical example for comparison purposes
The “Hypothetical” line of the table below provides information about hypothetical account values and hypothetical expenses based on the Fund’s actual expense ratio and an assumed rate of return of 5% per year before expenses, which is not the Fund’s actual return. The hypothetical account values and expenses may not be used to estimate the actual ending account balance or expenses you paid for the period. You may use this information to compare the ongoing costs of investing in the Fund and other funds. To do so, compare this 5% hypothetical example with the 5% hypothetical examples that appear in the shareholder reports of the other funds.
Please note that the expenses shown in the table are meant to highlight your ongoing costs only and do not reflect any transactional costs, such as sales charges (loads) and contingent deferred sales charges. Therefore, the “Hypothetical” line of the table is useful in comparing ongoing costs only and will not help you determine the relative total costs of owning different funds. In addition, if these transactional costs were included, your costs would have been higher.
| | | | | | | | | | | | | | | | |
| | | Beginning
account value
5-1-2016 | | | Ending
account value
10-31-2016 | | | Expenses
paid during
the period¹ | | | Annualized net
expense ratio | |
Class A | | | | | | | | | | | | | | | | |
Actual | | $ | 1,000.00 | | | $ | 1,053.35 | | | $ | 8.52 | | | | 1.65 | % |
Hypothetical (5% return before expenses) | | $ | 1,000.00 | | | $ | 1,016.84 | | | $ | 8.36 | | | | 1.65 | % |
Class C | | | | | | | | | | | | | | | | |
Actual | | $ | 1,000.00 | | | $ | 1,050.27 | | | $ | 12.37 | | | | 2.40 | % |
Hypothetical (5% return before expenses) | | $ | 1,000.00 | | | $ | 1,013.07 | | | $ | 12.14 | | | | 2.40 | % |
Class R | | | | | | | | | | | | | | | | |
Actual | | $ | 1,000.00 | | | $ | 1,053.14 | | | $ | 9.81 | | | | 1.90 | % |
Hypothetical (5% return before expenses) | | $ | 1,000.00 | | | $ | 1,015.58 | | | $ | 9.63 | | | | 1.90 | % |
Class R6 | | | | | | | | | | | | | | | | |
Actual | | $ | 1,000.00 | | | $ | 1,056.22 | | | $ | 6.20 | | | | 1.20 | % |
Hypothetical (5% return before expenses) | | $ | 1,000.00 | | | $ | 1,019.10 | | | $ | 6.09 | | | | 1.20 | % |
Administrator Class | | | | | | | | | | | | | | | | |
Actual | | $ | 1,000.00 | | | $ | 1,055.60 | | | $ | 7.49 | | | | 1.45 | % |
Hypothetical (5% return before expenses) | | $ | 1,000.00 | | | $ | 1,017.85 | | | $ | 7.35 | | | | 1.45 | % |
Institutional Class | | | | | | | | | | | | | | | | |
Actual | | $ | 1,000.00 | | | $ | 1,056.85 | | | $ | 6.46 | | | | 1.25 | % |
Hypothetical (5% return before expenses) | | $ | 1,000.00 | | | $ | 1,018.85 | | | $ | 6.34 | | | | 1.25 | % |
| 1 | Expenses paid is equal to the annualized net expense ratio of each class multiplied by the average account value over the period, multiplied by the number of days in the most recent fiscal half-year divided by the number of days in the fiscal year (to reflect the one-half-year period). |
| | | | | | |
| Portfolio of investments—October 31, 2016 | | Wells Fargo Emerging Markets Equity Income Fund | | | 9 | |
| | | | | | | | | | | | | | | | |
| Security name | | | | | | | | Shares | | | Value | |
| | | | |
Common Stocks: 88.12% | | | | | | | | | | | | | | | | |
| | | | |
| Brazil: 7.09% | | | | | | | | | | | | | | | | |
Ambev SA (Consumer Staples, Beverages) | | | | | | | | | | | 638,100 | | | $ | 3,764,230 | |
Banco do Brasil SA (Financials, Banks) | | | | | | | | | | | 586,300 | | | | 5,379,927 | |
BB Seguridade Participacoes SA (Financials, Insurance) | | | | | | | | | | | 940,696 | | | | 9,471,795 | |
Energisa SA (Utilities, Electric Utilities) | | | | | | | | | | | 401,000 | | | | 2,811,523 | |
Petroleo Brasileiro SA ADR Class A (Energy, Oil, Gas & Consumable Fuels) † | | | | | | | | | | | 608,011 | | | | 6,724,602 | |
Telefonica Brasil ADR (Telecommunication Services, Diversified Telecommunication Services) | | | | | | | | | | | 342,402 | | | | 4,930,589 | |
WEG SA (Industrials, Machinery) | | | | | | | | | | | 686,300 | | | | 3,784,110 | |
| | | | |
| | | | | | | | | | | | | | | 36,866,776 | |
| | | | | | | | | | | | | | | | |
| | | | |
| Cayman Islands: 1.14% | | | | | | | | | | | | | | | | |
KWG Property Holding Limited (Real Estate, Real Estate Management & Development) | | | | | | | | | | | 10,187,500 | | | | 5,911,089 | |
| | | | | | | | | | | | | | | | |
| | | | |
| Chile: 0.44% | | | | | | | | | | | | | | | | |
Aguas Andinas SA Class A (Utilities, Water Utilities) | | | | | | | | | | | 3,464,597 | | | | 2,287,826 | |
| | | | | | | | | | | | | | | | |
| | | | |
| China: 19.62% | | | | | | | | | | | | | | | | |
Anhui Conch Cement Company Limited H Shares (Materials, Construction Materials) | | | | | | | | | | | 1,446,500 | | | | 4,009,999 | |
Bank of China Limited H Shares (Financials, Banks) | | | | | | | | | | | 12,870,000 | | | | 5,774,910 | |
Beijing Capital International Airport Company Limited H Shares (Industrials, Transportation Infrastructure) | | | | | | | | | | | 3,998,000 | | | | 4,191,030 | |
China Communications Construction Company Limited H Shares (Industrials, Construction & Engineering) | | | | | | | | | | | 3,758,000 | | | | 4,138,110 | |
China Construction Bank H Shares (Financials, Banks) | | | | | | | | | | | 19,705,000 | | | | 14,431,523 | |
China Mobile Limited (Telecommunication Services, Wireless Telecommunication Services) | | | | | | | | | | | 924,500 | | | | 10,591,360 | |
China Petroleum & Chemical Corporation H Shares (Energy, Oil, Gas & Consumable Fuels) | | | | | | | | | | | 13,193,600 | | | | 9,611,677 | |
China Power International Development Limited (Utilities, Independent Power & Renewable Electricity Producers) | | | | | | | | | | | 18,561,000 | | | | 6,772,908 | |
China Resources Land Limited (Real Estate, Real Estate Management & Development) | | | | | | | | | | | 1,298,000 | | | | 3,236,820 | |
China State Construction International Holdings Limited (Industrials, Construction & Engineering) | | | | | | | | | | | 4,172,000 | | | | 6,100,210 | |
CNOOC Limited (Energy, Oil, Gas & Consumable Fuels) | | | | | | | | | | | 3,613,000 | | | | 4,598,038 | |
Huaneng Power International Incorporated H Shares (Utilities, Independent Power & Renewable Electricity Producers) | | | | | | | | | | | 4,580,000 | | | | 2,816,899 | |
Industrial & Commercial Bank of China Limited H Shares (Financials, Banks) | | | | | | | | | | | 20,473,000 | | | | 12,327,805 | |
PetroChina Company Limited H Shares (Energy, Oil, Gas & Consumable Fuels) | | | | | | | | | | | 9,000,000 | | | | 6,196,853 | |
PICC Property & Casualty Company Limited H Shares (Financials, Insurance) | | | | | | | | | | | 1,554,000 | | | | 2,516,680 | |
Sinotrans Limited H Shares (Industrials, Air Freight & Logistics) | | | | | | | | | | | 10,025,000 | | | | 4,730,999 | |
| | | | |
| | | | | | | | | | | | | | | 102,045,821 | |
| | | | | | | | | | | | | | | | |
| | | | |
| Cyprus: 0.31% | | | | | | | | | | | | | | | | |
Ros Agro plc (Consumer Staples, Food & Staples Retailing) | | | | | | | | | | | 121,961 | | | | 1,591,591 | |
| | | | | | | | | | | | | | | | |
| | | | |
| Czech Republic: 0.77% | | | | | | | | | | | | | | | | |
Moneta Money Bank (Financials, Banks) † | | | | | | | | | | | 1,154,968 | | | | 4,027,466 | |
| | | | | | | | | | | | | | | | |
| | | | |
| India: 5.88% | | | | | | | | | | | | | | | | |
Bharti Infratel Limited (Telecommunication Services, Diversified Telecommunication Services) | | | | | | | | | | | 1,221,462 | | | | 6,355,447 | |
Coal India Limited (Energy, Oil, Gas & Consumable Fuels) | | | | | | | | | | | 1,398,996 | | | | 6,816,247 | |
Credit Analysis & Research Limited (Financials, Capital Markets) | | | | | | | | | | | 27,249 | | | | 610,880 | |
HCL Technologies Limited (Information Technology, IT Services) | | | | | | | | | | | 218,837 | | | | 2,515,660 | |
Hero Honda Motors Limited (Consumer Discretionary, Automobiles) | | | | | | | | | | | 124,736 | | | | 6,260,660 | |
Infosys Technologies Limited (Information Technology, IT Services) | | | | | | | | | | | 172,719 | | | | 2,591,567 | |
NTPC Limited (Utilities, Independent Power & Renewable Electricity Producers) | | | | | | | | | | | 1,415,662 | | | | 3,201,781 | |
Oil & Natural Gas Corporation Limited (Energy, Oil, Gas & Consumable Fuels) | | | | | | | | | | | 516,440 | | | | 2,236,297 | |
| | | | |
| | | | | | | | | | | | | | | 30,588,539 | |
| | | | | | | | | | | | | | | | |
The accompanying notes are an integral part of these financial statements.
| | | | |
| 10 | | Wells Fargo Emerging Markets Equity Income Fund | | Portfolio of investments—October 31, 2016 |
| | | | | | | | | | | | | | | | |
| Security name | | | | | | | | Shares | | | Value | |
| | | | |
| Indonesia: 4.67% | | | | | | | | | | | | | | | | |
PT Bank Rakyat Indonesia Tbk (Financials, Banks) | | | | | | | | | | | 6,080,200 | | | $ | 5,685,043 | |
PT Cikarang Listrindo Tbk (Utilities, Independent Power & Renewable Electricity Producers) † | | | | | | | | | | | 33,924,800 | | | | 3,900,000 | |
PT Hanjaya Mandala Sampoerna Tbk (Consumer Staples, Tobacco) | | | | | | | | | | | 9,716,000 | | | | 2,941,309 | |
PT Matahari Department Store Tbk (Consumer Discretionary, Multiline Retail) | | | | | | | | | | | 2,154,000 | | | | 2,975,617 | |
PT Perusahaan Gas Negara Persero Tbk (Utilities, Gas Utilities) | | | | | | | | | | | 11,698,300 | | | | 2,295,191 | |
PT Telekomunikasi Indonesia Persero Tbk (Telecommunication Services, Diversified Telecommunication Services) | | | | | | | | | | | 20,081,200 | | | | 6,494,686 | |
| | | | |
| | | | | | | | | | | | | | | 24,291,846 | |
| | | | | | | | | | | | | | | | |
| | | | |
| Luxembourg: 0.70% | | | | | | | | | | | | | | | | |
Ternium SA (Materials, Metals & Mining) | | | | | | | | | | | 152,332 | | | | 3,642,258 | |
| | | | | | | | | | | | | | | | |
| | | | |
| Malaysia: 2.40% | | | | | | | | | | | | | | | | |
Malakoff Corporation Bhd (Utilities, Independent Power & Renewable Electricity Producers) | | | | | | | | | | | 9,032,375 | | | | 3,337,350 | |
Telecom Malaysia Bhd (Telecommunication Services, Diversified Telecommunication Services) | | | | | | | | | | | 2,531,281 | | | | 3,946,264 | |
Tenaga Nasional Bhd (Utilities, Electric Utilities) | | | | | | | | | | | 1,516,100 | | | | 5,182,568 | |
| | | | |
| | | | | | | | | | | | | | | 12,466,182 | |
| | | | | | | | | | | | | | | | |
| | | | |
| Mexico: 4.99% | | | | | | | | | | | | | | | | |
Bolsa Mexicana de Valores SAB de CV (Financials, Capital Markets) | | | | | | | | | | | 2,390,167 | | | | 3,825,329 | |
Grupo Aeroportuario del Centro Norte SAB de CV (Industrials, Transportation Infrastructure) | | | | | | | | | | | 1,107,912 | | | | 6,465,409 | |
Grupo Financiero Santander SAB de CV Class B (Financials, Banks) | | | | | | | | | | | 3,111,784 | | | | 5,635,488 | |
Macquarie Mexico Real Estate Management SA de CV (Real Estate, Equity REITs) 144A† | | | | | | | | | | | 4,101,276 | | | | 5,159,957 | |
Wal-Mart de Mexico SAB de CV (Consumer Staples, Food & Staples Retailing) | | | | | | | | | | | 2,312,751 | | | | 4,892,005 | |
| | | | |
| | | | | | | | | | | | | | | 25,978,188 | |
| | | | | | | | | | | | | | | | |
| | | | |
| Panama: 0.43% | | | | | | | | | | | | | | | | |
Banco Latinoamericano de Comercio Exterior SA (Financials, Banks) | | | | | | | | | | | 82,853 | | | | 2,234,545 | |
| | | | | | | | | | | | | | | | |
| | | | |
| Philippines: 1.78% | | | | | | | | | | | | | | | | |
Globe Telecom Incorporated (Telecommunication Services, Wireless Telecommunication Services) | | | | | | | | | | | 117,250 | | | | 4,310,083 | |
Semirara Mining and Power Corporation (Energy, Oil, Gas & Consumable Fuels) | | | | | | | | | | | 1,898,130 | | | | 4,935,197 | |
| | | | |
| | | | | | | | | | | | | | | 9,245,280 | |
| | | | | | | | | | | | | | | | |
| | | | |
| Russia: 4.84% | | | | | | | | | | | | | | | | |
Aeroflot PJSC (Industrials, Airlines) †(a) | | | | | | | | | | | 1,444,631 | | | | 2,961,160 | |
LUKOIL PJSC ADR (Energy, Oil, Gas & Consumable Fuels) | | | | | | | | | | | 142,550 | | | | 6,949,313 | |
MegaFon OAO (Telecommunication Services, Wireless Telecommunication Services) | | | | | | | | | | | 36,593 | | | | 349,254 | |
MMC Norilsk Nickel PJSC (Materials, Metals & Mining) | | | | | | | | | | | 167,343 | | | | 2,523,532 | |
Moscow Exchange MICEX-RTS OAO (Financials, Diversified Financial Services) (a) | | | | | | | | | | | 2,021,753 | | | | 3,721,894 | |
Severstal OAO GDR (Materials, Metals & Mining) | | | | | | | | | | | 318,315 | | �� | | 4,488,242 | |
Tatneft ADR (Energy, Oil, Gas & Consumable Fuels) | | | | | | | | | | | 124,922 | | | | 4,181,139 | |
| | | | |
| | | | | | | | | | | | | | | 25,174,534 | |
| | | | | | | | | | | | | | | | |
| | | | |
| Singapore: 4.25% | | | | | | | | | | | | | | | | |
Asian Pay Television Trust (Consumer Discretionary, Media) | | | | | | | | | | | 5,628,000 | | | | 2,083,321 | |
CapitaRetail China Trust (Real Estate, Equity REITs) | | | | | | | | | | | 4,153,300 | | | | 4,463,025 | |
Jardine Cycle & Carriage Limited (Consumer Discretionary, Distributors) | | | | | | | | | | | 157,600 | | | | 4,782,657 | |
Lippo Malls Indonesia Retail Trust (Real Estate, Equity REITs) | | | | | | | | | | | 10,093,700 | | | | 2,829,501 | |
Singapore Telecommunications Limited (Telecommunication Services, Diversified Telecommunication Services) | | | | | | | | | | | 2,856,200 | | | | 7,965,539 | |
| | | | |
| | | | | | | | | | | | | | | 22,124,043 | |
| | | | | | | | | | | | | | | | |
The accompanying notes are an integral part of these financial statements.
| | | | | | |
| Portfolio of investments—October 31, 2016 | | Wells Fargo Emerging Markets Equity Income Fund | | | 11 | |
| | | | | | | | | | | | | | | | |
| Security name | | | | | | | | Shares | | | Value | |
| | | | |
| South Africa: 4.41% | | | | | | | | | | | | | | | | |
Barclays Africa Group Limited (Financials, Banks) | | | | | | | | | | | 450,976 | | | $ | 5,229,599 | |
Foschini Limited (Consumer Discretionary, Specialty Retail) | | | | | | | | | | | 347,268 | | | | 3,574,732 | |
MTN Group Limited (Telecommunication Services, Wireless Telecommunication Services) | | | | | | | | | | | 228,136 | | | | 1,968,902 | |
Sanlam Limited (Financials, Insurance) | | | | | | | | | | | 820,069 | | | | 3,975,134 | |
Sasol Limited (Energy, Oil, Gas & Consumable Fuels) | | | | | | | | | | | 151,687 | | | | 4,212,081 | |
Truworths International Limited (Consumer Discretionary, Specialty Retail) | | | | | | | | | | | 755,722 | | | | 4,004,549 | |
| | | | |
| | | | | | | | | | | | | | | 22,964,997 | |
| | | | | | | | | | | | | | | | |
| | | | |
| South Korea: 9.09% | | | | | | | | | | | | | | | | |
Hana Financial Group Incorporated (Financials, Banks) | | | | | | | | | | | 93,764 | | | | 2,687,751 | |
Hite Jinro Company Limited (Consumer Staples, Beverages) | | | | | | | | | | | 96,034 | | | | 1,846,404 | |
Hyundai Motor Company (Consumer Discretionary, Automobiles) | | | | | | | | | | | 36,265 | | | | 4,437,055 | |
Kangwon Land Incorporated (Consumer Discretionary, Hotels, Restaurants & Leisure) | | | | | | | | | | | 57,518 | | | | 1,907,632 | |
KB Financial Group Incorporated (Financials, Banks) | | | | | | | | | | | 166,680 | | | | 6,161,734 | |
Korea Electric Power Corporation (Utilities, Electric Utilities) | | | | | | | | | | | 101,139 | | | | 4,353,153 | |
Korea Reinsurance Company (Financials, Insurance) | | | | | | | | | | | 407,475 | | | | 4,202,058 | |
POSCO (Materials, Metals & Mining) | | | | | | | | | | | 33,449 | | | | 6,928,043 | |
Shinhan Financial Group Company Limited (Financials, Banks) | | | | | | | | | | | 136,986 | | | | 5,249,584 | |
SK Telecom Company Limited ADR (Telecommunication Services, Wireless Telecommunication Services) | | | | | | | | | | | 434,031 | | | | 9,483,577 | |
| | | | |
| | | | | | | | | | | | | | | 47,256,991 | |
| | | | | | | | | | | | | | | | |
| | | | |
| Taiwan: 13.30% | | | | | | | | | | | | | | | | |
Advanced Semiconductor Engineering Incorporated (Information Technology, Semiconductors & Semiconductor Equipment) | | | | | | | | | | | 4,274,000 | | | | 5,024,650 | |
Cathay Financial Holding Company Limited (Financials, Insurance) | | | | | | | | | | | 2,484,000 | | | | 3,223,316 | |
Chicony Electronics Company Limited (Information Technology, Technology Hardware, Storage & Peripherals) | | | | | | | | | | | 2,500,996 | | | | 6,403,564 | |
CTBC Financial Holding Company Limited (Financials, Banks) | | | | | | | | | | | 5,140,130 | | | | 2,768,984 | |
CTCI Corporation (Industrials, Construction & Engineering) | | | | | | | | | | | 2,467,000 | | | | 3,623,400 | |
Delta Electronics Incorporated (Information Technology, Electronic Equipment, Instruments & Components) | | | | | | | | | | | 535,283 | | | | 2,824,198 | |
Far Eastone Telecommunications Company Limited (Telecommunication Services, Wireless Telecommunication Services) | | | | | | | | | | | 1,089,000 | | | | 2,574,329 | |
Hon Hai Precision Industry Company Limited (Information Technology, Electronic Equipment, Instruments & Components) | | | | | | | | | | | 3,326,630 | | | | 8,991,889 | |
Largan Precision Company Limited (Information Technology, Electronic Equipment, Instruments & Components) | | | | | | | | | | | 22,000 | | | | 2,603,818 | |
MediaTek Incorporated (Information Technology, Semiconductors & Semiconductor Equipment) | | | | | | | | | | | 299,000 | | | | 2,273,944 | |
Namchow Chemical Industrial Company Limited (Consumer Staples, Food Products) | | | | | | | | | | | 745,000 | | | | 1,588,798 | |
Novatek Microelectronics Corporation Limited (Information Technology, Semiconductors & Semiconductor Equipment) | | | | | | | | | | | 619,000 | | | | 2,324,376 | |
Siliconware Precision Industries Company (Information Technology, Semiconductors & Semiconductor Equipment) | | | | | | | | | | | 2,519,000 | | | | 3,811,527 | |
Taiwan Semiconductor Manufacturing Company Limited (Information Technology, Semiconductors & Semiconductor Equipment) | | | | | | | | | | | 1,820,000 | | | | 10,871,267 | |
Teco Electric & Machinery Company Limited (Industrials, Electrical Equipment) | | | | | | | | | | | 2,253,000 | | | | 2,002,587 | |
Uni-President Enterprises Corporation (Consumer Staples, Food Products) | | | | | | | | | | | 1,131,000 | | | | 2,189,784 | |
United Microelectronics Corporation ADR (Information Technology, Semiconductors & Semiconductor Equipment) | | | | | | | | | | | 2,024,690 | | | | 3,846,911 | |
WPG Holdings Company Limited (Information Technology, Electronic Equipment, Instruments & Components) | | | | | | | | | | | 1,921,000 | | | | 2,252,301 | |
| | | | |
| | | | | | | | | | | | | | | 69,199,643 | |
| | | | | | | | | | | | | | | | |
| | | | |
| Thailand: 0.81% | | | | | | | | | | | | | | | | |
Land & Houses PCL (Real Estate, Real Estate Management & Development) | | | | | | | | | | | 8,448,500 | | | | 2,220,907 | |
Major Cineplex Group PCL (Consumer Discretionary, Media) | | | | | | | | | | | 2,423,400 | | | | 2,008,103 | |
| | | | |
| | | | | | | | | | | | | | | 4,229,010 | |
| | | | | | | | | | | | | | | | |
The accompanying notes are an integral part of these financial statements.
| | | | |
| 12 | | Wells Fargo Emerging Markets Equity Income Fund | | Portfolio of investments—October 31, 2016 |
| | | | | | | | | | | | | | | | |
| Security name | | | | | | | | Shares | | | Value | |
| | | | |
| Turkey: 0.61% | | | | | | | | | | | | | | | | |
Emlak Konut Gayrimenkul Yati (Real Estate, Equity REITs) | | | | | | | | | | | 3,111,109 | | | $ | 3,177,217 | |
| | | | | | | | | | | | | | | | |
| | | | |
| United Arab Emirates: 0.59% | | | | | | | | | | | | | | | | |
Abu Dhabi Commercial Bank PJSC (Financials, Banks) | | | | | | | | | | | 1,849,537 | | | | 3,091,835 | |
| | | | | | | | | | | | | | | | |
| | | | |
Total Common Stocks (Cost $448,633,335) | | | | | | | | | | | | | | | 458,395,677 | |
| | | | | | | | | | | | | | | | |
| | | | |
Exchange-Traded Funds: 0.61% | | | | | | | | | | | | | | | | |
| | | | |
| United States: 0.61% | | | | | | | | | | | | | | | | |
VanEck Vectors Russia ETF | | | | | | | | | | | 170,835 | | | | 3,174,114 | |
| | | | | | | | | | | | | | | | |
| | | | |
Total Exchange-Traded Funds (Cost $2,861,163) | | | | | | | | | | | | | | | 3,174,114 | |
| | | | | | | | | | | | | | | | |
| | | | |
| | | | | | Expiration date | | | | | | | |
| Participation Notes: 3.35% | | | | | | | | | | | | | | | | |
| | | | |
| China: 3.35% | | | | | | | | | | | | | | | | |
HSBC Bank plc (China State Construction Engineering Corporation Limited) (Industrials, Construction & Engineering) † | | | | | | | 4-19-2017 | | | | 1,798,736 | | | | 1,908,826 | |
HSBC Bank plc (Huayu Automotive Systems Company Limited) (Consumer Discretionary, Auto Components) † | | | | | | | 3-24-2017 | | | | 1,016,000 | | | | 2,477,719 | |
HSBC Bank plc (Inner Mongolia Yili Industrial Group Company Limited Class A) (Consumer Staples, Food Products) † | | | | | | | 4-6-2017 | | | | 1,101,500 | | | | 2,928,802 | |
HSBC Bank plc (Midea Group Company Limited) (Consumer Discretionary, Household Durables) † | | | | | | | 4-1-2017 | | | | 512,000 | | | | 2,054,538 | |
UBS AG (Baoshan Iron & Steel Company Limited) (Materials, Metals & Mining) † | | | | | | | 4-6-2017 | | | | 3,179,000 | | | | 2,635,893 | |
UBS AG (China State Construction Engineering Corporation Limited) (Industrials, Construction & Engineering) † | | | | | | | 4-19-2017 | | | | 2,205,000 | | | | 2,339,955 | |
UBS AG (Midea Group Company Limited Class A) (Consumer Discretionary, Household Durables) † | | | | | | | 4-1-2017 | | | | 770,029 | | | | 3,089,949 | |
| | | | |
Total Participation Notes (Cost $16,523,094) | | | | | | | | | | | | | | | 17,435,682 | |
| | | | | | | | | | | | | | | | |
| | | | |
| | | Dividend yield | | | | | | | | | | |
| | | | |
Preferred Stocks: 4.52% | | | | | | | | | | | | | | | | |
| | | | |
| Brazil: 4.52% | | | | | | | | | | | | | | | | |
Banco Bradesco SA (Financials, Banks) | | | 15.53 | % | | | | | | | 1,123,000 | | | | 11,764,762 | |
Itausa Investimentos Itau SA (Financials, Banks) | | | 8.21 | | | | | | | | 3,965,450 | | | | 11,727,396 | |
| | | | |
Total Preferred Stocks (Cost $17,922,043) | | | | | | | | | | | | | | | 23,492,158 | |
| | | | | | | | | | | | | | | | |
| | | | |
| | | Yield | | | | | | | | | | |
| Short-Term Investments: 4.06% | | | | | | | | | | | | | | | | |
| | | | |
| Investment Companies: 4.06% | | | | | | | | | | | | | | | | |
Wells Fargo Government Money Market Fund Select Class (l)(u) | | | 0.32 | | | | | | | | 21,137,527 | | | | 21,137,527 | |
| | | | | | | | | | | | | | | | |
| | | | |
Total Short-Term Investments (Cost $21,137,527) | | | | | | | | | | | | | | | 21,137,527 | |
| | | | | | | | | | | | | | | | |
| | | | | | | | |
| Total investments in securities (Cost $507,077,162) * | | | 100.66 | % | | | 523,635,158 | |
Other assets and liabilities, net | | | (0.66 | ) | | | (3,458,339 | ) |
| | | | | | | | |
| Total net assets | | | 100.00 | % | | $ | 520,176,819 | |
| | | | | | | | |
The accompanying notes are an integral part of these financial statements.
| | | | | | |
| Portfolio of investments—October 31, 2016 | | Wells Fargo Emerging Markets Equity Income Fund | | | 13 | |
| † | Non-income-earning security |
| 144A | The security may be resold in transactions exempt from registration, normally to qualified institutional buyers, pursuant to Rule 144A under the Securities Act of 1933. |
| (a) | The security is fair valued in accordance with procedures approved by the Board of Trustees. |
| (l) | The issuer of the security is an affiliated person of the Fund as defined in the Investment Company Act of 1940. |
| (u) | The rate represents the 7-day annualized yield at period end. |
| * | Cost for federal income tax purposes is $508,934,120 and unrealized gains (losses) consists of: |
| | | | |
Gross unrealized gains | | $ | 33,400,040 | |
Gross unrealized losses | | | (18,699,002 | ) |
| | | | |
Net unrealized gains | | $ | 14,701,038 | |
The accompanying notes are an integral part of these financial statements.
| | | | |
| 14 | | Wells Fargo Emerging Markets Equity Income Fund | | Statement of assets and liabilities—October 31, 2016 |
| | | | |
| | | | |
| |
Assets | | | | |
Investments | | | | |
In unaffiliated securities, at value (cost $485,939,635) | | $ | 502,497,631 | |
In affiliated securities, at value (cost $21,137,527) | | | 21,137,527 | |
| | | | |
Total investments, at value (cost $507,077,162) | | | 523,635,158 | |
Foreign currency, at value (cost $2,452,370) | | | 2,465,982 | |
Receivable for investments sold | | | 9,400,481 | |
Receivable for Fund shares sold | | | 2,981,700 | |
Receivable for dividends | | | 479,239 | |
Prepaid expenses and other assets | | | 60,011 | |
| | | | |
Total assets | | | 539,022,571 | |
| | | | |
| |
Liabilities | | | | |
Payable for investments purchased | | | 7,233,237 | |
Payable for Fund shares redeemed | | | 10,921,187 | |
Management fee payable | | | 445,299 | |
Distribution fees payable | | | 8,559 | |
Administration fees payable | | | 60,406 | |
Accrued expenses and other liabilities | | | 177,064 | |
| | | | |
Total liabilities | | | 18,845,752 | |
| | | | |
Total net assets | | $ | 520,176,819 | |
| | | | |
| |
NET ASSETS CONSIST OF | | | | |
Paid-in capital | | $ | 523,709,732 | |
Undistributed net investment income | | | 407,795 | |
Accumulated net realized losses on investments | | | (20,529,396 | ) |
Net unrealized gains on investments | | | 16,588,688 | |
| | | | |
Total net assets | | $ | 520,176,819 | |
| | | | |
| |
COMPUTATION OF NET ASSET VALUE AND OFFERING PRICE PER SHARE | | | | |
Net assets – Class A | | $ | 26,459,208 | |
Shares outstanding – Class A1 | | | 2,575,174 | |
Net asset value per share – Class A | | | $10.27 | |
Maximum offering price per share – Class A2 | | | $10.90 | |
Net assets – Class C | | $ | 13,326,684 | |
Shares outstanding – Class C1 | | | 1,302,493 | |
Net asset value per share – Class C | | | $10.23 | |
Net assets – Class R | | $ | 27,820 | |
Shares outstanding – Class R1 | | | 2,701 | |
Net asset value per share – Class R | | | $10.30 | |
Net assets – Class R6 | | $ | 2,592,468 | |
Shares outstanding – Class R61 | | | 251,915 | |
Net asset value per share – Class R6 | | | $10.29 | |
Net assets – Administrator Class | | $ | 50,969,934 | |
Shares outstanding – Administrator Class1 | | | 4,940,154 | |
Net asset value per share – Administrator Class | | | $10.32 | |
Net assets – Institutional Class | | $ | 426,800,705 | |
Shares outstanding – Institutional Class1 | | | 41,455,437 | |
Net asset value per share – Institutional Class | | | $10.30 | |
| 1 | The Fund has an unlimited number of authorized shares. |
| 2 | Maximum offering price is computed as 100/94.25 of net asset value. On investments of $50,000 or more, the offering price is reduced. |
The accompanying notes are an integral part of these financial statements.
| | | | | | |
| Statement of operations—year ended October 31, 2016 | | Wells Fargo Emerging Markets Equity Income Fund | | | 15 | |
| | | | |
| | | | |
| |
Investment income | | | | |
Dividends (net of foreign withholding taxes of $1,419,068) | | $ | 12,679,043 | |
Income from affiliated securities | | | 53,494 | |
| | | | |
Total investment income | | | 12,732,537 | |
| | | | |
| |
Expenses | | | | |
Management fee | | | 3,658,424 | |
Administration fees | | | | |
Class A | | | 49,013 | |
Class C | | | 25,637 | |
Class R | | | 55 | |
Class R6 | | | 677 | |
Administrator Class | | | 61,428 | |
Institutional Class | | | 303,090 | |
Shareholder servicing fees | | | | |
Class A | | | 58,349 | |
Class C | | | 30,521 | |
Class R | | | 65 | |
Administrator Class | | | 116,704 | |
Distribution fees | | | | |
Class C | | | 91,562 | |
Class R | | | 65 | |
Custody and accounting fees | | | 281,036 | |
Professional fees | | | 51,577 | |
Registration fees | | | 134,377 | |
Shareholder report expenses | | | 57,367 | |
Trustees’ fees and expenses | | | 22,985 | |
Other fees and expenses | | | 17,195 | |
| | | | |
Total expenses | | | 4,960,127 | |
Less: Fee waivers and/or expense reimbursements | | | (654,959 | ) |
| | | | |
Net expenses | | | 4,305,168 | |
| | | | |
Net investment income | | | 8,427,369 | |
| | | | |
| |
REALIZED AND UNREALIZED GAINS (LOSSES) ON INVESTMENTS | | | | |
| |
Net realized gains (losses) on: | | | | |
Unaffiliated securities | | | (12,760,087 | ) |
Forward foreign currency contract transactions | | | 9,640 | |
| | | | |
Net realized losses on investments | | | (12,750,447 | ) |
Net change in unrealized gains (losses) on investments | | | 27,078,980 | |
| | | | |
Net realized and unrealized gains (losses) on investments | | | 14,328,533 | |
| | | | |
Net increase in net assets resulting from operations | | $ | 22,755,902 | |
| | | | |
The accompanying notes are an integral part of these financial statements.
| | | | |
| 16 | | Wells Fargo Emerging Markets Equity Income Fund | | Statement of changes in net assets |
| | | | | | | | | | | | | | | | |
| | | Year ended
October 31, 2016 | | | Year ended
October 31, 2015 | |
| | | | |
Operations | | | | | | | | | | | | | | | | |
Net investment income | | | | | | $ | 8,427,369 | | | | | | | $ | 3,115,405 | |
Net realized losses on investments | | | | | | | (12,750,447 | ) | | | | | | | (5,853,265 | ) |
Net change in unrealized gains (losses) on investments | | | | | | | 27,078,980 | | | | | | | | (14,976,313 | ) |
| | | | |
Net increase (decrease) in net assets resulting from operations | | | | | | | 22,755,902 | | | | | | | | (17,714,173 | ) |
| | | | |
| | | | |
Distributions to shareholders from | | | | | | | | | | | | | | | | |
Net investment income | | | | | | | | | | | | | | | | |
Class A | | | | | | | (520,415 | ) | | | | | | | (384,317 | ) |
Class C | | | | | | | (196,473 | ) | | | | | | | (127,515 | ) |
Class R | | | | | | | (512 | ) | | | | | | | (10 | )1 |
Class R6 | | | | | | | (62,106 | ) | | | | | | | (19 | )1 |
Administrator Class | | | | | | | (1,092,920 | ) | | | | | | | (1,016,111 | ) |
Institutional Class | | | | | | | (6,378,435 | ) | | | | | | | (1,553,325 | ) |
| | | | |
Total distributions to shareholders | | | | | | | (8,250,861 | ) | | | | | | | (3,081,297 | ) |
| | | | |
| | | | |
Capital share transactions | | | Shares | | | | | | | | Shares | | | | | |
Proceeds from shares sold | | | | | | | | | | | | | | | | |
Class A | | | 1,710,525 | | | | 16,669,000 | | | | 1,696,774 | | | | 18,394,271 | |
Class C | | | 735,242 | | | | 7,145,583 | | | | 795,767 | | | | 8,556,504 | |
Class R | | | 0 | | | | 0 | | | | 2,648 | 1 | | | 25,000 | 1 |
Class R6 | | | 280,056 | | | | 2,733,901 | | | | 2,654 | 1 | | | 25,000 | 1 |
Administrator Class | | | 3,295,035 | | | | 31,905,381 | | | | 5,721,244 | | | | 61,488,744 | |
Institutional Class | | | 42,218,845 | | | | 417,403,734 | | | | 12,481,918 | | | | 130,171,618 | |
| | | | |
| | | | | | | 475,857,599 | | | | | | | | 218,661,137 | |
| | | | |
Reinvestment of distributions | | | | | | | | | | | | | | | | |
Class A | | | 50,509 | | | | 495,441 | | | | 36,083 | | | | 380,492 | |
Class C | | | 16,592 | | | | 161,956 | | | | 11,577 | | | | 122,069 | |
Class R | | | 52 | | | | 512 | | | | 1 | 1 | | | 10 | 1 |
Class R6 | | | 6,334 | | | | 62,106 | | | | 2 | 1 | | | 19 | 1 |
Administrator Class | | | 110,594 | | | | 1,087,476 | | | | 94,283 | | | | 997,261 | |
Institutional Class | | | 526,646 | | | | 5,191,655 | | | | 77,609 | | | | 795,126 | |
| | | | |
| | | | | | | 6,999,146 | | | | | | | | 2,294,977 | |
| | | | |
Payment for shares redeemed | | | | | | | | | | | | | | | | |
Class A | | | (1,479,305 | ) | | | (14,314,963 | ) | | | (675,914 | ) | | | (7,063,488 | ) |
Class C | | | (474,574 | ) | | | (4,639,504 | ) | | | (346,771 | ) | | | (3,609,550 | ) |
Class R6 | | | (37,131 | ) | | | (356,931 | ) | | | 0 | 1 | | | 0 | 1 |
Administrator Class | | | (2,859,314 | ) | | | (27,376,015 | ) | | | (6,081,753 | ) | | | (63,197,111 | ) |
Institutional Class | | | (14,607,459 | ) | | | (140,452,239 | ) | | | (2,337,484 | ) | | | (24,746,171 | ) |
| | | | |
| | | | | | | (187,139,652 | ) | | | | | | | (98,616,320 | ) |
| | | | |
Net increase in net assets resulting from capital share transactions | | | | | | | 295,717,093 | | | | | | | | 122,339,794 | |
| | | | |
Total increase in net assets | | | | | | | 310,222,134 | | | | | | | | 101,544,324 | |
| | | | |
| | | | |
Net assets | | | | | | | | | | | | | | | | |
Beginning of period | | | | | | | 209,954,685 | | | | | | | | 108,410,361 | |
| | | | |
End of period | | | | | | $ | 520,176,819 | | | | | | | $ | 209,954,685 | |
| | | | |
Undistributed net investment income | | | | | | $ | 407,795 | | | | | | | $ | 85,687 | |
| | | | |
| 1 | For the period from September 30, 2015 (commencement of class operations) to October 31, 2015 |
The accompanying notes are an integral part of these financial statements.
| | | | | | |
| Financial highlights | | Wells Fargo Emerging Markets Equity Income Fund | | | 17 | |
(For a share outstanding throughout each period)
| | | | | | | | | | | | | | | | | | | | |
| | | Year ended October 31 | |
| CLASS A | | 2016 | | | 2015 | | | 2014 | | | 2013 | | | 20121 | |
Net asset value, beginning of period | | | $9.97 | | | | $11.33 | | | | $11.79 | | | | $11.17 | | | | $10.00 | |
Net investment income | | | 0.23 | 2 | | | 0.20 | | | | 0.33 | | | | 0.31 | | | | 0.13 | |
Net realized and unrealized gains (losses) on investments | | | 0.29 | | | | (1.36 | ) | | | (0.11 | ) | | | 0.88 | | | | 1.15 | |
| | | | | | | | | | | | | | | | | | | | |
Total from investment operations | | | 0.52 | | | | (1.16 | ) | | | 0.22 | | | | 1.19 | | | | 1.28 | |
Distributions to shareholders from | | | | | | | | | | | | | | | | | | | | |
Net investment income | | | (0.22 | ) | | | (0.20 | ) | | | (0.31 | ) | | | (0.34 | ) | | | (0.11 | ) |
Net realized gains | | | 0.00 | | | | 0.00 | | | | (0.37 | ) | | | (0.23 | ) | | | 0.00 | |
| | | | | | | | | | | | | | | | | | | | |
Total distributions to shareholders | | | (0.22 | ) | | | (0.20 | ) | | | (0.68 | ) | | | (0.57 | ) | | | (0.11 | ) |
Net asset value, end of period | | | $10.27 | | | | $9.97 | | | | $11.33 | | | | $11.79 | | | | $11.17 | |
Total return3 | | | 5.29 | % | | | (10.34 | )% | | | 2.05 | % | | | 10.94 | % | | | 12.80 | % |
Ratios to average net assets (annualized) | | | | | | | | | | | | | | | | | | | | |
Gross expenses | | | 1.79 | % | | | 1.89 | % | | | 2.09 | % | | | 2.88 | % | | | 4.29 | % |
Net expenses | | | 1.65 | % | | | 1.65 | % | | | 1.65 | % | | | 1.65 | % | | | 1.65 | % |
Net investment income | | | 2.34 | % | | | 2.22 | % | | | 3.12 | % | | | 2.64 | % | | | 2.94 | % |
Supplemental data | | | | | | | | | | | | | | | | | | | | |
Portfolio turnover rate | | | 64 | % | | | 84 | % | | | 91 | % | | | 85 | % | | | 39 | % |
Net assets, end of period (000s omitted) | | | $26,459 | | | | $22,866 | | | | $14,010 | | | | $8,658 | | | | $628 | |
| 1 | For the period from May 31, 2012 (commencement of class operations) to October 31, 2012 |
| 2 | Calculated based upon average shares outstanding |
| 3 | Total return calculations do not include any sales charges. Returns for periods of less than one year are not annualized. |
The accompanying notes are an integral part of these financial statements.
| | | | |
| 18 | | Wells Fargo Emerging Markets Equity Income Fund | | Financial highlights |
(For a share outstanding throughout each period)
| | | | | | | | | | | | | | | | | | | | |
| | | Year ended October 31 | |
| CLASS C | | 2016 | | | 2015 | | | 2014 | | | 2013 | | | 20121 | |
Net asset value, beginning of period | | | $9.94 | | | | $11.32 | | | | $11.79 | | | | $11.16 | | | | $10.00 | |
Net investment income | | | 0.16 | 2 | | | 0.14 | | | | 0.23 | | | | 0.22 | | | | 0.10 | |
Net realized and unrealized gains (losses) on investments | | | 0.28 | | | | (1.38 | ) | | | (0.08 | ) | | | 0.89 | | | | 1.13 | |
| | | | | | | | | | | | | | | | | | | | |
Total from investment operations | | | 0.44 | | | | (1.24 | ) | | | 0.15 | | | | 1.11 | | | | 1.23 | |
Distributions to shareholders from | | | | | | | | | | | | | | | | | | | | |
Net investment income | | | (0.15 | ) | | | (0.14 | ) | | | (0.25 | ) | | | (0.25 | ) | | | (0.07 | ) |
Net realized gains | | | 0.00 | | | | 0.00 | | | | (0.37 | ) | | | (0.23 | ) | | | 0.00 | |
| | | | | | | | | | | | | | | | | | | | |
Total distributions to shareholders | | | (0.15 | ) | | | (0.14 | ) | | | (0.62 | ) | | | (0.48 | ) | | | (0.07 | ) |
Net asset value, end of period | | | $10.23 | | | | $9.94 | | | | $11.32 | | | | $11.79 | | | | $11.16 | |
Total return3 | | | 4.53 | % | | | (10.95 | )% | | | 1.27 | % | | | 10.11 | % | | | 12.49 | % |
Ratios to average net assets (annualized) | | | | | | | | | | | | | | | | | | | | |
Gross expenses | | | 2.54 | % | | | 2.64 | % | | | 2.83 | % | | | 3.81 | % | | | 5.03 | % |
Net expenses | | | 2.40 | % | | | 2.40 | % | | | 2.40 | % | | | 2.40 | % | | | 2.41 | % |
Net investment income | | | 1.62 | % | | | 1.45 | % | | | 2.17 | % | | | 1.80 | % | | | 2.24 | % |
Supplemental data | | | | | | | | | | | | | | | | | | | | |
Portfolio turnover rate | | | 64 | % | | | 84 | % | | | 91 | % | | | 85 | % | | | 39 | % |
Net assets, end of period (000s omitted) | | | $13,327 | | | | $10,190 | | | | $6,390 | | | | $2,028 | | | | $562 | |
| 1 | For the period from May 31, 2012 (commencement of class operations) to October 31, 2012 |
| 2 | Calculated based upon average shares outstanding |
| 3 | Total return calculations do not include any sales charges. Returns for periods of less than one year are not annualized. |
The accompanying notes are an integral part of these financial statements.
| | | | | | |
| Financial highlights | | Wells Fargo Emerging Markets Equity Income Fund | | | 19 | |
(For a share outstanding throughout each period)
| | | | | | | | |
| | | Year ended October 31 | |
| CLASS R | | 2016 | | | 20151 | |
Net asset value, beginning of period | | | $9.99 | | | | $9.44 | |
Net investment income (loss) | | | 0.20 | 2 | | | (0.01 | )2 |
Net realized and unrealized gains (losses) on investments | | | 0.30 | | | | 0.56 | |
| | | | | | | | |
Total from investment operations | | | 0.50 | | | | 0.55 | |
Distributions to shareholders from | | | | | | | | |
Net investment income | | | (0.19 | ) | | | (0.00 | )3 |
Net asset value, end of period | | | $10.30 | | | | $9.99 | |
Total return4 | | | 5.13 | % | | | 5.87 | % |
Ratios to average net assets (annualized) | | | | | | | | |
Gross expenses | | | 2.04 | % | | | 2.10 | % |
Net expenses | | | 1.90 | % | | | 1.90 | % |
Net investment income (loss) | | | 2.08 | % | | | (0.90 | )% |
Supplemental data | | | | | | | | |
Portfolio turnover rate | | | 64 | % | | | 84 | % |
Net assets, end of period (000s omitted) | | | $28 | | | | $26 | |
| 1 | For the period from September 30, 2015 (commencement of class operations) to October 31, 2015 |
| 2 | Calculated based upon average shares outstanding |
| 3 | Amount is less than $0.005. |
| 4 | Returns for periods of less than one year are not annualized. |
The accompanying notes are an integral part of these financial statements.
| | | | |
| 20 | | Wells Fargo Emerging Markets Equity Income Fund | | Financial highlights |
(For a share outstanding throughout each period)
| | | | | | | | |
| | | Year ended October 31 | |
| CLASS R6 | | 2016 | | | 20151 | |
Net asset value, beginning of period | | | $9.97 | | | | $9.42 | |
Net investment income (loss) | | | 0.30 | 2 | | | (0.00 | )2,3 |
Net realized and unrealized gains (losses) on investments | | | 0.27 | | | | 0.56 | |
| | | | | | | | |
Total from investment operations | | | 0.57 | | | | 0.56 | |
Distributions to shareholders from | | | | | | | | |
Net investment income | | | (0.25 | ) | | | (0.01 | ) |
Net asset value, end of period | | | $10.29 | | | | $9.97 | |
Total return4 | | | 5.90 | % | | | 5.91 | % |
Ratios to average net assets (annualized) | | | | | | | | |
Gross expenses | | | 1.36 | % | | | 1.40 | % |
Net expenses | | | 1.20 | % | | | 1.20 | % |
Net investment income (loss) | | | 3.05 | % | | | (0.19 | )% |
Supplemental data | | | | | | | | |
Portfolio turnover rate | | | 64 | % | | | 84 | % |
Net assets, end of period (000s omitted) | | | $2,592 | | | | $26 | |
| 1 | For the period from September 30, 2015 (commencement of class operations) to October 31, 2015 |
| 2 | Amount is less than $0.005 per share. |
| 3 | Calculated based upon average shares outstanding |
| 4 | Returns for periods of less than one year are not annualized. |
The accompanying notes are an integral part of these financial statements.
| | | | | | |
| Financial highlights | | Wells Fargo Emerging Markets Equity Income Fund | | | 21 | |
(For a share outstanding throughout each period)
| | | | | | | | | | | | | | | | | | | | |
| | | Year ended October 31 | |
| ADMINISTRATOR CLASS | | 2016 | | | 2015 | | | 2014 | | | 2013 | | | 20121 | |
Net asset value, beginning of period | | | $10.00 | | | | $11.35 | | | | $11.80 | | | | $11.17 | | | | $10.00 | |
Net investment income | | | 0.25 | 2 | | | 0.23 | | | | 0.33 | 2 | | | 0.32 | | | | 0.14 | |
Net realized and unrealized gains (losses) on investments | | | 0.29 | | | | (1.37 | ) | | | (0.08 | ) | | | 0.89 | | | | 1.14 | |
| | | | | | | | | | | | | | | | | | | | |
Total from investment operations | | | 0.54 | | | | (1.14 | ) | | | 0.25 | | | | 1.21 | | | | 1.28 | |
Distributions to shareholders from | | | | | | | | | | | | | | | | | | | | |
Net investment income | | | (0.22 | ) | | | (0.21 | ) | | | (0.33 | ) | | | (0.35 | ) | | | (0.11 | ) |
Net realized gains | | | 0.00 | | | | 0.00 | | | | (0.37 | ) | | | (0.23 | ) | | | 0.00 | |
| | | | | | | | | | | | | | | | | | | | |
Total distributions to shareholders | | | (0.22 | ) | | | (0.21 | ) | | | (0.70 | ) | | | (0.58 | ) | | | (0.11 | ) |
Net asset value, end of period | | | $10.32 | | | | $10.00 | | | | $11.35 | | | | $11.80 | | | | $11.17 | |
Total return3 | | | 5.56 | % | | | (10.12 | )% | | | 2.30 | % | | | 11.13 | % | | | 12.89 | % |
Ratios to average net assets (annualized) | | | | | | | | | | | | | | | | | | | | |
Gross expenses | | | 1.71 | % | | | 1.76 | % | | | 1.91 | % | | | 2.94 | % | | | 4.14 | % |
Net expenses | | | 1.45 | % | | | 1.45 | % | | | 1.45 | % | | | 1.45 | % | | | 1.45 | % |
Net investment income | | | 2.54 | % | | | 2.38 | % | | | 2.89 | % | | | 2.70 | % | | | 3.17 | % |
Supplemental data | | | | | | | | | | | | | | | | | | | | |
Portfolio turnover rate | | | 64 | % | | | 84 | % | | | 91 | % | | | 85 | % | | | 39 | % |
Net assets, end of period (000s omitted) | | | $50,970 | | | | $43,928 | | | | $52,896 | | | | $13,527 | | | | $5,285 | |
| 1 | For the period from May 31, 2012 (commencement of class operations) to October 31, 2012 |
| 2 | Calculated based upon average shares outstanding |
| 3 | Returns for periods of less than one year are not annualized. |
The accompanying notes are an integral part of these financial statements.
| | | | |
| 22 | | Wells Fargo Emerging Markets Equity Income Fund | | Financial highlights |
(For a share outstanding throughout each period)
| | | | | | | | | | | | | | | | | | | | |
| | | Year ended October 31 | |
| INSTITUTIONAL CLASS | | 2016 | | | 2015 | | | 2014 | | | 2013 | | | 20121 | |
Net asset value, beginning of period | | | $9.98 | | | | $11.34 | | | | $11.79 | | | | $11.17 | | | | $10.00 | |
Net investment income | | | 0.27 | 2 | | | 0.25 | 2 | | | 0.35 | | | | 0.34 | | | | 0.15 | |
Net realized and unrealized gains (losses) on investments | | | 0.30 | | | | (1.36 | ) | | | (0.07 | ) | | | 0.89 | | | | 1.14 | |
| | | | | | | | | | | | | | | | | | | | |
Total from investment operations | | | 0.57 | | | | (1.11 | ) | | | 0.28 | | | | 1.23 | | | | 1.29 | |
Distributions to shareholders from | | | | | | | | | | | | | | | | | | | | |
Net investment income | | | (0.25 | ) | | | (0.25 | ) | | | (0.36 | ) | | | (0.38 | ) | | | (0.12 | ) |
Net realized gains | | | 0.00 | | | | 0.00 | | | | (0.37 | ) | | | (0.23 | ) | | | 0.00 | |
| | | | | | | | | | | | | | | | | | | | |
Total distributions to shareholders | | | (0.25 | ) | | | (0.25 | ) | | | (0.73 | ) | | | (0.61 | ) | | | (0.12 | ) |
Net asset value, end of period | | | $10.30 | | | | $9.98 | | | | $11.34 | | | | $11.79 | | | | $11.17 | |
Total return3 | | | 5.84 | % | | | (9.95 | )% | | | 2.52 | % | | | 11.32 | % | | | 12.98 | % |
Ratios to average net assets (annualized) | | | | | | | | | | | | | | | | | | | | |
Gross expenses | | | 1.45 | % | | | 1.51 | % | | | 1.62 | % | | | 2.74 | % | | | 3.92 | % |
Net expenses | | | 1.25 | % | | | 1.25 | % | | | 1.25 | % | | | 1.25 | % | | | 1.25 | % |
Net investment income | | | 2.75 | % | | | 2.41 | % | | | 3.69 | % | | | 2.88 | % | | | 3.39 | % |
Supplemental data | | | | | | | | | | | | | | | | | | | | |
Portfolio turnover rate | | | 64 | % | | | 84 | % | | | 91 | % | | | 85 | % | | | 39 | % |
Net assets, end of period (000s omitted) | | | $426,801 | | | | $132,918 | | | | $35,114 | | | | $6,077 | | | | $5,082 | |
| 1 | For the period from May 31, 2012 (commencement of class operations) to October 31, 2012 |
| 2 | Calculated based upon average shares outstanding |
| 2 | Returns for periods of less than one year are not annualized. |
The accompanying notes are an integral part of these financial statements.
| | | | | | |
| Notes to financial statements | | Wells Fargo Emerging Markets Equity Income Fund | | | 23 | |
1. ORGANIZATION
Wells Fargo Funds Trust (the “Trust”), a Delaware statutory trust organized on March 10, 1999, is an open-end management investment company registered under the Investment Company Act of 1940, as amended (the “1940 Act”). As an investment company, the Trust follows the accounting and reporting guidance in Financial Accounting Standards Board (“FASB”) Accounting Standards Codification Topic 946, Financial Services – Investment Companies. These financial statements report on the Wells Fargo Emerging Markets Equity Income Fund (the “Fund”) which is a diversified series of the Trust.
2. SIGNIFICANT ACCOUNTING POLICIES
The following significant accounting policies, which are consistently followed in the preparation of the financial statements of the Fund, are in conformity with U.S. generally accepted accounting principles which require management to make estimates and assumptions that affect the reported amounts of assets and liabilities, disclosure of contingent assets and liabilities at the date of the financial statements, and the reported amounts of revenues and expenses during the reporting period. Actual results could differ from those estimates.
Securities valuation
All investments are valued each business day as of the close of regular trading on the New York Stock Exchange (generally 4 p.m. Eastern Time), although the Fund may deviate from this calculation time under unusual or unexpected circumstances.
Equity securities that are listed on a foreign or domestic exchange or market are valued at the official closing price or, if none, the last sales price. If no sale occurs on the principal exchange or market that day, the prior day’s price will be deemed “stale” and a fair value price will be determined in accordance with the Fund’s Valuation Procedures.
The values of securities denominated in foreign currencies are translated into U.S. dollars at rates provided by an independent foreign currency pricing source at a time each business day specified by the Management Valuation Team of Wells Fargo Funds Management, LLC (“Funds Management”).
Many securities markets and exchanges outside the U.S. close prior to the close of the New York Stock Exchange and therefore may not fully reflect trading or events that occur after the close of the principal exchange in which the foreign securities are traded, but before the close of the New York Stock Exchange. If such trading or events are expected to materially affect the value of such securities, then fair value pricing procedures approved by the Board of Trustees of the Fund are applied. These procedures take into account multiple factors including movements in U.S. securities markets after foreign exchanges close. Foreign securities that are fair valued under these procedures are categorized as Level 2 and the application of these procedures may result in transfers between Level 1 and Level 2. Depending on market activity, such fair valuations may be frequent. Such fair value pricing may result in net asset values that are higher or lower than net asset values based on the last reported sales price or latest quoted bid price. On October 31, 2016, such fair value pricing was not used in pricing foreign securities.
Investments in registered open-end investment companies are valued at net asset value.
Investments which are not valued using any of the methods discussed above are valued at their fair value, as determined in good faith by the Board of Trustees. The Board of Trustees has established a Valuation Committee comprised of the Trustees and has delegated to it the authority to take any actions regarding the valuation of portfolio securities that the Valuation Committee deems necessary or appropriate, including determining the fair value of portfolio securities, unless the determination has been delegated to the Management Valuation Team. The Board of Trustees retains the authority to make or ratify any valuation decisions or approve any changes to the Valuation Procedures as it deems appropriate. On a quarterly basis, the Board of Trustees receives reports on any valuation actions taken by the Valuation Committee or the Management Valuation Team which may include items for ratification.
Valuations of fair valued securities are compared to the next actual sales price when available, or other appropriate market values, to assess the continued appropriateness of the fair valuation methodologies used. These securities are fair valued on a day-to-day basis, taking into consideration changes to appropriate market information and any significant changes to the inputs considered in the valuation process until there is a readily available price provided on an exchange or by an independent pricing service. Valuations received from an independent pricing service or independent broker-dealer quotes are periodically validated by comparisons to most recent trades and valuations provided by other independent pricing services in addition to the review of prices by the manager and/or subadviser. Unobservable inputs used in determining fair valuations are identified based on the type of security, taking into consideration factors utilized by market participants in valuing the investment, knowledge about the issuer and the current market environment.
| | | | |
| 24 | | Wells Fargo Emerging Markets Equity Income Fund | | Notes to financial statements |
Foreign currency translation
The accounting records of the Fund are maintained in U.S. dollars. The values of other assets and liabilities denominated in foreign currencies are translated into U.S. dollars at rates provided by an independent foreign currency pricing source at a time each business day specified by the Management Valuation Team. Purchases and sales of securities, and income and expenses are converted at the rate of exchange on the respective dates of such transactions. Net realized foreign exchange gains or losses arise from sales of foreign currencies, currency gains or losses realized between the trade and settlement dates on securities transactions, and the difference between the amounts of dividends, interest and foreign withholding taxes recorded and the U.S. dollar equivalent of the amounts actually paid or received. Net unrealized foreign exchange gains and losses arise from changes in the fair value of assets and liabilities other than investments in securities resulting from changes in exchange rates. The changes in net assets arising from changes in exchange rates and the changes in net assets resulting from changes in market prices of securities are not separately presented. Such changes are included in net realized and unrealized gains or losses from investments.
Participation notes
The Fund may invest in participation notes to gain exposure to securities in certain foreign markets. Participation notes are issued by banks or broker-dealers and are designed to offer a return linked to a particular underlying foreign security. Participation notes involve transaction costs, which may be higher than those applicable to the underlying foreign security. The holder of the participation note is entitled to receive from the bank or broker-dealer, an amount equal to the dividend paid by the issuer of the underlying foreign security; however, the holder is not entitled to the same rights (i.e. dividends, voting rights) as an owner of the underlying foreign security. Investments in participation notes involve risks beyond those normally associated with a direct investment in an underlying security. The Fund has no rights against the issuer of the underlying foreign security and participation notes expose the Fund to counterparty risk in the event the counterparty does not perform. There is also no assurance there will be a secondary trading market for the participation note or that the trading price of the participation note will equal the underlying value of the foreign security that it seeks to replicate.
Forward foreign currency contracts
The Fund is subject to foreign currency exchange rate risk in the normal course of pursuing its investment objectives. A forward foreign currency contract is an agreement between two parties to purchase or sell a specific currency for an agreed-upon price at a future date. The Fund enters into forward foreign currency contracts to facilitate transactions in foreign-denominated securities and to attempt to minimize the risk to the Fund from adverse changes in the relationship between currencies. Forward foreign currency contracts are recorded at the forward rate and marked-to-market daily. When the contracts are closed, realized gains and losses arising from such transactions are recorded as realized gains or losses on forward foreign currency contract transactions. The Fund could be exposed to risks if the counterparties to the contracts are unable to meet the terms of their contracts or if the value of the foreign currency changes unfavorably. The Fund’s maximum risk of loss from counterparty credit risk is the unrealized gains on the contracts. This risk may be mitigated if there is a master netting arrangement between the Fund and the counterparty.
Security transactions and income recognition
Securities transactions are recorded on a trade date basis. Realized gains or losses are recorded on the basis of identified cost.
Dividend income is recognized on the ex-dividend date, except for certain dividends from foreign securities, which are recorded as soon as the custodian verifies the ex-dividend date. Dividend income from foreign securities is recorded net of foreign taxes withheld where recovery of such taxes is not assured.
Distributions to shareholders
Distributions to shareholders from net investment income and net realized gains, if any, are recorded on the ex-dividend date. Such distributions are determined in conformity with federal income tax regulations, which may differ in amount or character from net investment income and realized gains recognized for purposes of U.S. generally accepted accounting principles.
Federal and other taxes
The Fund intends to continue to qualify as a regulated investment company by distributing substantially all of its investment company taxable income and any net realized capital gains (after reduction for capital loss carryforwards) sufficient to relieve it from all, or substantially all, federal income taxes. Accordingly, no provision for federal income taxes was required.
| | | | | | |
| Notes to financial statements | | Wells Fargo Emerging Markets Equity Income Fund | | | 25 | |
The Fund’s income and federal excise tax returns and all financial records supporting those returns for the prior three fiscal years are subject to examination by the federal and Delaware revenue authorities. Management has analyzed the Fund’s tax positions taken on federal, state, and foreign tax returns for all open tax years and does not believe that there are any uncertain tax positions that require recognition of a tax liability.
Reclassifications are made to the Fund’s capital accounts for permanent tax differences to reflect income and gains available for distribution (or available capital loss carryforwards) under federal income tax regulations. U.S. generally accepted accounting principles require that certain components of net assets be adjusted to reflect permanent differences between financial and tax reporting. These reclassifications have no effect on net assets or net asset values per share. The primary permanent differences causing such reclassifications are due to foreign currency transactions and passive foreign investment companies. At October 31, 2016, as a result of permanent book-to-tax differences, the following reclassification adjustments were made on the Statement of Assets and Liabilities:
| | |
Undistributed net
investment income | | Accumulated net
realized losses
on investments |
| $145,600 | | $(145,600) |
As of October 31, 2016, the Fund had capital loss carryforwards which consist of $14,095,175 in short-term capital losses and $5,166,871 in long-term capital losses.
Class allocations
The separate classes of shares offered by the Fund differ principally in applicable sales charges, distribution, shareholder servicing, and administration fees. Class specific expenses are charged directly to that share class. Investment income, common expenses, and realized and unrealized gains (losses) on investments are allocated daily to each class of shares based on the relative proportion of net assets of each class.
3. FAIR VALUATION MEASUREMENTS
Fair value measurements of investments are determined within a framework that has established a fair value hierarchy based upon the various data inputs utilized in determining the value of the Fund’s investments. The three-level hierarchy gives the highest priority to unadjusted quoted prices in active markets for identical assets or liabilities (Level 1) and the lowest priority to significant unobservable inputs (Level 3). The Fund’s investments are classified within the fair value hierarchy based on the lowest level of input that is significant to the fair value measurement. The inputs are summarized into three broad levels as follows:
| ∎ | | Level 1 – quoted prices in active markets for identical securities |
| ∎ | | Level 2 – other significant observable inputs (including quoted prices for similar securities, interest rates, prepayment speeds, credit risk, use of amortized cost, etc.) |
| ∎ | | Level 3 – significant unobservable inputs (including the Fund’s own assumptions in determining the fair value of investments) |
The inputs or methodologies used for valuing investments in securities are not necessarily an indication of the risk associated with investing in those securities.
| | | | |
| 26 | | Wells Fargo Emerging Markets Equity Income Fund | | Notes to financial statements |
The following is a summary of the inputs used in valuing the Fund’s assets and liabilities as of October 31, 2016:
| | | | | | | | | | | | | | | | |
| | | Quoted prices
(Level 1) | | | Other significant
observable inputs
(Level 2) | | | Significant
unobservable inputs (Level 3) | | | Total | |
Assets | | | | | | | | | | | | | | | | |
Investments in: | | | | | | | | | | | | | | | | |
| | | | |
Common stocks | | | | | | | | | | | | | | | | |
Brazil | | $ | 36,866,776 | | | $ | 0 | | | $ | 0 | | | $ | 36,866,776 | |
Cayman Islands | | | 5,911,089 | | | | 0 | | | | 0 | | | | 5,911,089 | |
Chile | | | 2,287,826 | | | | 0 | | | | 0 | | | | 2,287,826 | |
China | | | 102,045,821 | | | | 0 | | | | 0 | | | | 102,045,821 | |
Cyprus | | | 1,591,591 | | | | 0 | | | | 0 | | | | 1,591,591 | |
Czech Republic | | | 4,027,466 | | | | 0 | | | | 0 | | | | 4,027,466 | |
India | | | 30,588,539 | | | | 0 | | | | 0 | | | | 30,588,539 | |
Indonesia | | | 24,291,846 | | | | 0 | | | | 0 | | | | 24,291,846 | |
Luxembourg | | | 3,642,258 | | | | 0 | | | | 0 | | | | 3,642,258 | |
Malaysia | | | 12,466,182 | | | | 0 | | | | 0 | | | | 12,466,182 | |
Mexico | | | 25,978,188 | | | | 0 | | | | 0 | | | | 25,978,188 | |
Panama | | | 2,234,545 | | | | 0 | | | | 0 | | | | 2,234,545 | |
Philippines | | | 9,245,280 | | | | 0 | | | | 0 | | | | 9,245,280 | |
Russia | | | 18,491,480 | | | | 6,683,054 | | | | 0 | | | | 25,174,534 | |
Singapore | | | 22,124,043 | | | | 0 | | | | 0 | | | | 22,124,043 | |
South Africa | | | 22,964,997 | | | | 0 | | | | 0 | | | | 22,964,997 | |
South Korea | | | 47,256,991 | | | | 0 | | | | 0 | | | | 47,256,991 | |
Taiwan | | | 69,199,643 | | | | 0 | | | | 0 | | | | 69,199,643 | |
Thailand | | | 4,229,010 | | | | 0 | | | | 0 | | | | 4,229,010 | |
Turkey | | | 3,177,217 | | | | 0 | | | | 0 | | | | 3,177,217 | |
United Arab Emirates | | | 3,091,835 | | | | 0 | | | | 0 | | | | 3,091,835 | |
| | | | |
Exchange-traded funds | | | | | | | | | | | | | | | | |
United States | | | 3,174,114 | | | | 0 | | | | 0 | | | | 3,174,114 | |
| | | | |
Participation notes | | | | | | | | | | | | | | | | |
China | | | 0 | | | | 17,435,682 | | | | 0 | | | | 17,435,682 | |
| | | | |
Preferred stocks | | | | | | | | | | | | | | | | |
Brazil | | | 23,492,158 | | | | 0 | | | | 0 | | | | 23,492,158 | |
| | | | |
Short-term investments | | | | | | | | | | | | | | | | |
Investment companies | | | 21,137,527 | | | | 0 | | | | 0 | | | | 21,137,527 | |
Total assets | | $ | 499,516,422 | | | $ | 24,118,736 | | | $ | 0 | | | $ | 523,635,158 | |
The Fund recognizes transfers between levels within the fair value hierarchy at the end of the reporting period. Fair value pricing that was used in pricing certain foreign securities at the previous period end was not used at October 31, 2016. As a result, common stocks valued at $231,879,884 were transferred from Level 2 to Level 1 within the fair value hierarchy. The Fund did not have any transfers into/out of Level 3.
4. TRANSACTIONS WITH AFFILIATES
Management fee
Funds Management, an indirect wholly owned subsidiary of Wells Fargo & Company (“Wells Fargo”), is the manager of the Fund and provides advisory and fund-level administrative services under an investment management agreement. Under the investment management agreement, Funds Management is responsible for, among other services, implementing the investment objectives and strategies of the Fund, supervising the subadviser, providing fund-level administrative services in connection with the Fund’s operations, and providing any other fund-level administrative services reasonably necessary for the operation of the Fund. As compensation for its services under the investment management agreement, Funds Management is entitled to receive an annual management fee starting at 1.15% and
| | | | | | |
| Notes to financial statements | | Wells Fargo Emerging Markets Equity Income Fund | | | 27 | |
declining to 0.955% as the average daily net assets of the Fund increase. For the year ended October 31, 2016, the management fee was equivalent to an annual rate of 1.15% of the Fund’s average daily net assets.
Funds Management has retained the services of a subadviser to provide daily portfolio management to the Fund. The fee for subadvisory services is borne by Funds Management. Wells Capital Management Incorporated, an affiliate of Funds Management and an indirect wholly owned subsidiary of Wells Fargo, is the subadviser to the Fund and is entitled to receive a fee from Funds Management at an annual rate starting at 0.65% and declining to 0.45% as the average daily net assets of the Fund increase.
Administration fees
Under a class-level administration agreement, Funds Management provides class-level administrative services to the Fund, which includes paying fees and expenses for services provided by the transfer agent, sub-transfer agents, omnibus account servicers and record-keepers. As compensation for its services under the class-level administration agreement, Funds Management receives an annual fee which is calculated based on the average daily net assets of each class as follows:
| | | | |
| | | Class-level
administration fee | |
Class A, Class C, Class R | | | 0.21 | % |
Class R6 | | | 0.03 | |
Administrator Class, Institutional Class | | | 0.13 | |
Funds Management has contractually waived and/or reimbursed management and administration fees to the extent necessary to maintain certain net operating expense ratios for the Fund. Waiver of fees and/or reimbursement of expenses by Funds Management were made first from fund level expenses on a proportionate basis and then from class specific expenses. Funds Management has committed through February 28, 2017 to waive fees and/or reimburse expenses to the extent necessary to cap the Fund’s expenses at 1.65% for Class A shares, 2.40% for Class C shares, 1.90% for Class R shares, 1.20% for Class R6 shares, 1.45% for Administrator Class shares, and 1.25% for Institutional Class shares. After this time, the cap may be increased or the commitment to maintain the cap may be terminated only with the approval of the Board of Trustees.
Distribution fees
The Trust has adopted a distribution plan for Class C and Class R shares of the Fund pursuant to Rule 12b-1 under the 1940 Act. Distribution fees are charged to Class C and Class R shares and paid to Wells Fargo Funds Distributor, LLC (“Funds Distributor”), the principal underwriter, at an annual rate of 0.75% of the average daily net assets of Class C shares and 0.25% of the average daily net assets of Class R shares.
In addition, Funds Distributor is entitled to receive the front-end sales charge from the purchase of Class A shares and a contingent deferred sales charge on the redemption of certain Class A shares. Funds Distributor is also entitled to receive the contingent deferred sales charges from redemptions of Class C shares. For the year ended October 31, 2016, Funds Distributor received $15,414 from the sale of Class A shares and $500 in contingent deferred sales charges from redemptions of Class A shares.
Shareholder servicing fees
The Trust has entered into contracts with one or more shareholder servicing agents, whereby Class A, Class C, Class R, and Administrator Class of the Fund are charged a fee at an annual rate of 0.25% of the average daily net assets of each respective class.
A portion of these total shareholder servicing fees were paid to affiliates of Wells Fargo.
5. INVESTMENT PORTFOLIO TRANSACTIONS
Purchases and sales of investments, excluding U.S. government obligations (if any) and short-term securities, for the year ended October 31, 2016 were $486,111,265 and $195,494,914, respectively.
The Fund may purchase or sell investment securities to other Wells Fargo funds under procedures adopted by the Board of Trustees. The procedures have been designed to ensure that these interfund transactions, which generally do not incur broker commissions, are effected at current market prices. Interfund trades are included within the respective purchases and sales amounts shown.
| | | | |
| 28 | | Wells Fargo Emerging Markets Equity Income Fund | | Notes to financial statements |
6. DERIVATIVE TRANSACTIONS
During the year ended October 31, 2016, the Fund entered into forward foreign currency contracts for economic hedging purposes.
As of October 31, 2016, the Fund did not have any open forward foreign currency contracts. The Fund had average contract amounts of $10,397 in forward foreign currency contracts to sell during the year ended October 31, 2016.
The fair value, realized gains or losses and change in unrealized gains or losses, if any, on derivative instruments are reflected in the appropriate financial statements.
7. BANK BORROWINGS
The Trust (excluding the money market funds and certain other funds) and Wells Fargo Variable Trust are parties to a $250,000,000 revolving credit agreement whereby the Fund is permitted to use bank borrowings for temporary or emergency purposes, such as to fund shareholder redemption requests. Interest under the credit agreement is charged to the Fund based on a borrowing rate equal to the higher of the Federal Funds rate in effect on that day plus 1.25% or the overnight LIBOR rate in effect on that day plus 1.25%. In addition, an annual commitment fee equal to 0.25% of the unused balance is allocated to each participating fund. Prior to August 30, 2016, the revolving credit agreement amount was $200,000,000 and the annual commitment fee was equal to 0.20% of the unused balance which was allocated to each participating fund.
For the year ended October 31, 2016, there were no borrowings by the Fund under the agreement.
8. DISTRIBUTIONS TO SHAREHOLDERS
The tax character of distributions paid was $8,250,861 and $3,081,297 of ordinary income for the years ended October 31, 2016 and October 31, 2015, respectively.
As of October 31, 2016, the components of distributable earnings on a tax basis were as follows:
| | | | |
Undistributed
ordinary income | | Unrealized
gains | | Capital loss
carryforward |
| $1,004,246 | | $14,724,887 | | $(19,262,046) |
9. CONCENTRATION RISK
Concentration risks result from exposure to a limited number of sectors. A fund that invests a substantial portion of its assets in any sector may be more affected by changes in that sector than would be a fund whose investments are not heavily weighted in any sector.
10. INDEMNIFICATION
Under the Trust’s organizational documents, the officers and Trustees have been granted certain indemnification rights against certain liabilities that may arise out of performance of their duties to the Trust. Additionally, in the normal course of business, the Trust may enter into contracts with service providers that contain a variety of indemnification clauses. The Trust’s maximum exposure under these arrangements is dependent on future claims that may be made against the Fund and, therefore, cannot be estimated.
11. REGULATORY CHANGES
In October 2016, the Securities and Exchange Commission (“SEC”) adopted new rules and forms and amended existing rules and forms (together, “final rules”) intended to modernize and enhance the reporting and disclosure of information by registered investment companies and to enhance liquidity risk management by open-end mutual funds and exchange-traded funds. The final rules will enhance the quality of information available to investors and will allow the SEC to more effectively collect and use data reported by funds. In part, the final rules amend Regulation S-X and require standardized, enhanced disclosure about derivatives in the Fund’s financial statements, as well as other amendments. The compliance date for the amendments to Regulation S-X is August 1, 2017 while the compliance date for the new form types is June 1, 2018 and the compliance date for the liquidity risk management program requirements is December 1, 2018. Management is currently assessing the potential impact of these enhancements and their impact on the financial statement disclosures and reporting requirements.
| | | | | | |
| Notes to financial statements | | Wells Fargo Emerging Markets Equity Income Fund | | | 29 | |
12. SUBSEQUENT DISTRIBUTIONS
On November 23, 2016, the Fund declared distributions from net investment income to shareholders of record on November 22, 2016. The per share amounts payable on November 25, 2016 were as follows:
| | | | |
| | | Net
investment
income | |
Class A | | | $0.00795 | |
Class C | | | 0.00000 | |
Class R | | | 0.00457 | |
Class R6 | | | 0.01338 | |
Administrator Class | | | 0.00000 | |
Institutional Class | | | 0.01205 | |
These distributions are not reflected in the accompanying financial statements. The final determination of the source of all distributions is subject to change and made after the Fund’s tax year-end.
| | | | |
| 30 | | Wells Fargo Emerging Markets Equity Income Fund | | Report of independent registered public accounting firm |
BOARD OF TRUSTEES AND SHAREHOLDERS OF WELLS FARGO FUNDS TRUST:
We have audited the accompanying statement of assets and liabilities, including the portfolio of investments, of the Wells Fargo Emerging Markets Equity Income Fund (the “Fund”), one of the funds constituting the Wells Fargo Funds Trust, as of October 31, 2016, and the related statement of operations for the year then ended, the statements of changes in net assets for each of the years in the two-year period then ended, and the financial highlights for each of the years or periods in the five-year period then ended. These financial statements and financial highlights are the responsibility of the Fund’s management. Our responsibility is to express an opinion on these financial statements and financial highlights based on our audits.
We conducted our audits in accordance with the standards of the Public Company Accounting Oversight Board (United States). Those standards require that we plan and perform the audit to obtain reasonable assurance about whether the financial statements and financial highlights are free of material misstatement. An audit includes examining, on a test basis, evidence supporting the amounts and disclosures in the financial statements. Our procedures included confirmation of securities owned as of October 31, 2016, by correspondence with the custodian and brokers, or by other appropriate auditing procedures. An audit also includes assessing the accounting principles used and significant estimates made by management, as well as evaluating the overall financial statement presentation. We believe that our audits provide a reasonable basis for our opinion.
In our opinion, the financial statements and financial highlights referred to above present fairly, in all material respects, the financial position of the Wells Fargo Emerging Markets Equity Income Fund as of October 31, 2016 the results of its operations for the year then ended, the changes in its net assets for each of the years in the two-year period then ended, and the financial highlights for each of the years or periods in the five-year period then ended, in conformity with U.S. generally accepted accounting principles.

Boston, Massachusetts
December 22, 2016
| | | | | | |
| Other information (unaudited) | | Wells Fargo Emerging Markets Equity Income Fund | | | 31 | |
TAX INFORMATION
Pursuant to Section 854 of the Internal Revenue Code, $7,213,995 of income dividends paid during the fiscal year ended October 31, 2016 has been designated as qualified dividend income (QDI).
Pursuant to Section 853 of the Internal Revenue Code, the Fund expects to designate amounts as foreign taxes paid for the fiscal year ended October 31, 2016. Additional details will be available in the semiannual report.
PROXY VOTING INFORMATION
A description of the policies and procedures that the Fund uses to determine how to vote proxies relating to portfolio securities is available, upon request, by calling 1-800-222-8222, visiting our website at wellsfargofunds.com, or visiting the SEC website at sec.gov. Information regarding how the Fund voted proxies relating to portfolio securities during the most recent 12-month period ended June 30 is available on the Fund’s website at wellsfargofunds.com or by visiting the SEC website at sec.gov.
PORTFOLIO HOLDINGS INFORMATION
The complete portfolio holdings for the Fund are publicly available monthly on the Fund’s website (wellsfargofunds.com), on a one-month delayed basis. In addition, top ten holdings information (excluding derivative positions) for the Fund is publicly available on the Fund’s website on a monthly, seven-day or more delayed basis. The Fund files its complete schedule of portfolio holdings with the SEC for the first and third quarters of each fiscal year on Form N-Q, which is available by visiting the SEC website at sec.gov. In addition, the Fund’s Form N-Q may be reviewed and copied at the SEC’s Public Reference Room in Washington, DC, and at regional offices in New York City, at 233 Broadway, and in Chicago, at 175 West Jackson Boulevard, Suite 900. Information about the Public Reference Room may be obtained by calling 1-800-SEC-0330.
| | | | |
| 32 | | Wells Fargo Emerging Markets Equity Income Fund | | Other information (unaudited) |
BOARD OF TRUSTEES AND OFFICERS
Each of the Trustees and Officers1 listed in the table below acts in identical capacities for each fund in the Wells Fargo family of funds, which consists of 139 mutual funds comprising the Wells Fargo Funds Trust, Wells Fargo Variable Trust, Wells Fargo Master Trust and four closed-end funds (collectively the “Fund Complex”). This table should be read in conjunction with the Prospectus and the Statement of Additional Information2. The mailing address of each Trustee and Officer is 525 Market Street, 12th Floor, San Francisco, CA 94105. Each Trustee and Officer serves an indefinite term, however, each Trustee serves such term until reaching the mandatory retirement age established by the Trustees.
Independent Trustees
| | | | | | |
Name and year of birth | | Position held and length of service* | | Principal occupations during past five years or longer | | Current other
public company or
investment company
directorships |
William R. Ebsworth (Born 1957) | | Trustee, since 2015 | | Retired. From 1984 to 2013, equities analyst, portfolio manager, research director and chief investment officer at Fidelity Management and Research Company in Boston, Tokyo, and Hong Kong and retired in 2013 as Chief Investment Officer of Fidelity Strategic Advisers, Inc. where he lead a team of investment professionals managing client assets. Prior thereto, Board member of Hong Kong Securities Clearing Co., Hong Kong Options Clearing Corp., the Thailand International Fund, Ltd., Fidelity Investments Life Insurance Company, and Empire Fidelity Investments Life Insurance Company. Mr. Ebsworth is a CFA® charterholder and an Adjunct Lecturer, Finance, at Babson College. | | Asset Allocation Trust |
Jane A. Freeman
(Born 1953) | | Trustee, since 2015 | | Retired. From 2012 to 2014 and 1999 to 2008, Chief Financial Officer of Scientific Learning Corporation. From 2008 to 2012, Ms. Freeman provided consulting services related to strategic business projects. Prior to 1999, Portfolio Manager at Rockefeller & Co. and Scudder, Stevens & Clark. Board member of the Harding Loevner Funds from 1996 to 2014, serving as both Lead Independent Director and chair of the Audit Committee. Board member of the Russell Exchange Traded Funds Trust from 2011 to 2012 and the chair of the Audit Committee. Ms. Freeman is Chair of Taproot Foundation (non-profit organization), a Board Member of Ruth Bancroft Garden (non-profit organization) and an inactive chartered financial analyst. | | Asset Allocation Trust |
| Peter G. Gordon** (Born 1942) | | Trustee, since 1998; Chairman, since 2005 | | Co-Founder, Retired Chairman, President and CEO of Crystal Geyser Water Company. Trustee Emeritus, Colby College. | | Asset Allocation Trust |
Isaiah Harris, Jr.
(Born 1952) | | Trustee, since 2009 | | Retired. Chairman of the Board of CIGNA Corporation since 2009, and Director since 2005. From 2003 to 2011, Director of Deluxe Corporation. Prior thereto, President and CEO of BellSouth Advertising and Publishing Corp. from 2005 to 2007, President and CEO of BellSouth Enterprises from 2004 to 2005 and President of BellSouth Consumer Services from 2000 to 2003. Emeritus member of the Iowa State University Foundation Board of Governors. Emeritus Member of the Advisory Board of Iowa State University School of Business. Advisory Board Member, Palm Harbor Academy (charter school). Advisory Board Member, Child Evangelism Fellowship (non-profit). Mr. Harris is a certified public accountant (inactive status). | | CIGNA Corporation; Asset Allocation Trust |
Judith M. Johnson
(Born 1949) | | Trustee, since 2008; Audit Committee Chairman, since 2008 | | Retired. Prior thereto, Chief Executive Officer and Chief Investment Officer of Minneapolis Employees Retirement Fund from 1996 to 2008. Ms. Johnson is an attorney, certified public accountant and a certified managerial accountant. | | Asset Allocation Trust |
David F. Larcker
(Born 1950) | | Trustee, since 2009 | | James Irvin Miller Professor of Accounting at the Graduate School of Business, Stanford University, Director of the Corporate Governance Research Initiative and Senior Faculty of The Rock Center for Corporate Governance since 2006. From 2005 to 2008, Professor of Accounting at the Graduate School of Business, Stanford University. Prior thereto, Ernst & Young Professor of Accounting at The Wharton School, University of Pennsylvania from 1985 to 2005. | | Asset Allocation Trust |
| | | | | | |
| Other information (unaudited) | | Wells Fargo Emerging Markets Equity Income Fund | | | 33 | |
| | | | | | |
Name and year of birth | | Position held and length of service* | | Principal occupations during past five years or longer | | Current other
public company or
investment company
directorships |
Olivia S. Mitchell
(Born 1953) | | Trustee, since 2006 | | International Foundation of Employee Benefit Plans Professor, Wharton School of the University of Pennsylvania since 1993. Director of Wharton’s Pension Research Council and Boettner Center on Pensions & Retirement Research, and Research Associate at the National Bureau of Economic Research. Previously, Cornell University Professor from 1978 to 1993. | | Asset Allocation Trust |
Timothy J. Penny
(Born 1951) | | Trustee, since 1996 | | President and Chief Executive Officer of Southern Minnesota Initiative Foundation, a non-profit organization, since 2007 and Senior Fellow at the Humphrey Institute Policy Forum at the University of Minnesota since 1995. Member of the Board of Trustees of NorthStar Education Finance, Inc., a non-profit organization, since 2007. | | Asset Allocation Trust |
Michael S. Scofield
(Born 1943) | | Trustee, since 2010 | | Served on the Investment Company Institute’s Board of Governors and Executive Committee from 2008-2011 as well the Governing Council of the Independent Directors Council from 2006-2011 and the Independent Directors Council Executive Committee from 2008-2011. Chairman of the IDC from 2008-2010. Institutional Investor (Fund Directions) Trustee of Year in 2007. Trustee of the Evergreen Funds complex (and its predecessors) from 1984 to 2010. Chairman of the Evergreen Funds from 2000-2010. Former Trustee of the Mentor Funds. Retired Attorney, Law Offices of Michael S. Scofield. | | Asset Allocation Trust |
| * | Length of service dates reflect the Trustee’s commencement of service with the Trust’s predecessor entities, where applicable. |
| ** | Peter Gordon is expected to retire on December 31, 2017. |
Officers
| | | | | | |
Name and year of birth | | Position held and
length of service | | Principal occupations during past five years or longer | | |
Karla M. Rabusch
(Born 1959) | | President, since 2003 | | Executive Vice President of Wells Fargo Bank, N.A. and President of Wells Fargo Funds Management, LLC since 2003. | | |
Jeremy DePalma1
(Born 1974) | | Treasurer, since 2012 | | Senior Vice President of Wells Fargo Funds Management, LLC since 2009. Senior Vice President of Evergreen Investment Management Company, LLC from 2008 to 2010 and head of the Fund Reporting and Control Team within Fund Administration from 2005 to 2010. | | |
C. David Messman
(Born 1960) | | Secretary, since 2000; Chief Legal Officer, since 2003 | | Senior Vice President and Secretary of Wells Fargo Funds Management, LLC since 2001. Assistant General Counsel of Wells Fargo Bank, N.A. since 2013 and Vice President and Managing Counsel of Wells Fargo Bank, N.A. from 1996 to 2013. | | |
Michael Whitaker3 (Born 1967) | | Chief Compliance Officer, since 2016 | | Executive Vice President of Wells Fargo Funds Management, LLC since 2016. Chief Compliance Officer of Fidelity’s Fixed Income Funds and Asset Allocation Funds from 2008 to 2016, Compliance Officer of FMR Co., Inc. from 2014 to 2016, Fidelity Investments Money Management, Inc. from 2014 to 2016, Fidelity Investments from 2007 to 2016. | | |
David Berardi
(Born 1975) | | Assistant Treasurer, since 2009 | | Vice President of Wells Fargo Funds Management, LLC since 2009. Vice President of Evergreen Investment Management Company, LLC from 2008 to 2010. Manager of Fund Reporting and Control for Evergreen Investment Management Company, LLC from 2004 to 2010. | | |
| 1 | Jeremy DePalma acts as Treasurer of 69 funds and Assistant Treasurer of 70 funds in the Fund Complex. |
| 2 | The Statement of Additional Information includes additional information about the Trustees and is available, without charge, upon request, by calling
1-800-222-8222 or by visiting the website at wellsfargofunds.com. |
| 3 | Michael Whitaker became Chief Compliance Officer effective May 16, 2016. |
| | | | |
| 34 | | Wells Fargo Emerging Markets Equity Income Fund | | Other information (unaudited) |
BOARD CONSIDERATION OF INVESTMENT MANAGEMENT AND SUB-ADVISORY AGREEMENTS:
Under the Investment Company Act of 1940 (the “1940 Act”), the Board of Trustees (the “Board”) of Wells Fargo Funds Trust (the “Trust”) must determine annually whether to approve the continuation of the Trust’s investment management and sub-advisory agreements. In this regard, at an in-person meeting held on May 24-25, 2016 (the “Meeting”), the Board, all the members of which have no direct or indirect interest in the investment management and sub-advisory agreements and are not “interested persons” of the Trust, as defined in the 1940 Act (the “Independent Trustees”), reviewed and approved for Wells Fargo Emerging Markets Equity Income Fund (the “Fund”): (i) an investment management agreement (the “Management Agreement”) with Wells Fargo Funds Management, LLC (“Funds Management”); and (ii) an investment sub-advisory agreement (the “Sub-Advisory Agreement”) with Wells Capital Management Incorporated (the “Sub-Adviser”), an affiliate of Funds Management. The Management Agreement and the Sub-Advisory Agreement are collectively referred to as the “Advisory Agreements.”
At the Meeting, the Board considered the factors and reached the conclusions described below relating to the selection of Funds Management and the Sub-Adviser and the approval of the Advisory Agreements. Prior to the Meeting, including at an in-person meeting in April 2016, the Trustees conferred extensively among themselves and with representatives of Funds Management about these matters. Also, the Board has adopted a team-based approach, with each team consisting of a sub-set of Trustees, to assist the full Board in the discharge of its duties in reviewing performance and other matters throughout the year. The Independent Trustees were assisted in their evaluation of the Advisory Agreements by independent legal counsel, from whom they received separate legal advice and with whom they met separately.
In providing information to the Board, Funds Management and the Sub-Adviser were guided by a detailed set of requests for information submitted to them by independent legal counsel on behalf of the Independent Trustees at the start of the Board’s annual contract renewal process earlier in 2016. In considering and approving the Advisory Agreements, the Trustees considered the information they believed relevant, including but not limited to the information discussed below. The Board considered not only the specific information presented in connection with the Meeting, but also the knowledge gained over time through interaction with Funds Management and the Sub-Adviser about various topics. In this regard, the Board reviewed reports of Funds Management at each of its quarterly meetings, which included, among other things, portfolio reviews and performance reports. In addition, the Board and the teams mentioned above confer with portfolio managers at various times throughout the year. The Board did not identify any particular information or consideration that was all-important or controlling, and each individual Trustee may have attributed different weights to various factors.
After its deliberations, the Board unanimously approved the continuation of the Advisory Agreements for a one-year term and determined that the compensation payable to Funds Management and the Sub-Adviser under each of the Advisory Agreements was reasonable. The Board considered the approval of the Advisory Agreements for the Fund as part of its consideration of agreements for funds across the complex, but its approvals were made on a fund-by-fund basis. The following summarizes a number of important, but not necessarily all, factors considered by the Board in support of its approvals.
Nature, extent and quality of services
The Board received and considered various information regarding the nature, extent and quality of services provided to the Fund by Funds Management and the Sub-Adviser under the Advisory Agreements. This information included a description of the investment advisory services and Fund-level administrative services covered by the Management Agreement, as well as, among other things, a summary of the background and experience of senior management of Funds Management, and the qualifications, background, tenure and responsibilities of each of the portfolio managers primarily responsible for the day-to-day portfolio management of the Fund.
The Board evaluated the ability of Funds Management and the Sub-Adviser to attract and retain qualified investment professionals, including research, advisory and supervisory personnel. The Board further considered the compliance programs and compliance records of Funds Management and the Sub-Adviser. In addition, the Board took into account the full range of services provided to the Fund by Funds Management and its affiliates.
Fund performance and expenses
The Board considered the performance results for the Fund over various time periods ended December 31, 2015. The Board considered these results in comparison to the performance of funds in a universe that was determined by Broadridge Inc. (“Broadridge”) to be similar to the Fund (the “Universe”), and in comparison to the Fund’s benchmark index and to other comparative data. Broadridge is an independent provider of investment company data. The Board received a description of the methodology used by Broadridge to select the mutual funds in the performance Universe. The Board noted that the performance of the Fund (Administrator Class) was higher than the average performance of the
| | | | | | |
| Other information (unaudited) | | Wells Fargo Emerging Markets Equity Income Fund | | | 35 | |
Universe for all periods under review. The Board also noted that the performance of the Fund was higher than its benchmark, the MSCI Emerging Markets Index (Net), for all periods under review.
The Board also received and considered information regarding the Fund’s net operating expense ratios and their various components, including actual management fees, custodian and other non-management fees, and Rule 12b-1 and non-Rule 12b-1 shareholder service fees. The Board considered these ratios in comparison to the median ratios of funds in class-specific expense groups that were determined by Broadridge to be similar to the Fund (the “Groups”). The Board received a description of the methodology used by Broadridge to select the mutual funds in the expense Groups and an explanation of how funds comprising expense groups and their expense ratios may vary from year-to-year. Based on the Broadridge reports, the Board noted that the net operating expense ratios of the Fund were equal to or in range of the median net operating expense ratios of the expense Groups. The Board discussed and accepted Funds Management’s proposal to reduce the net operating expense ratio caps for the Class A, Class C, Class R, Institutional Class and Class R6.
The Board took into account the Fund performance and expense information provided to it among the factors considered in deciding to re-approve the Advisory Agreements.
Investment management and sub-advisory fee rates
The Board reviewed and considered the contractual fee rates payable by the Fund to Funds Management under the Management Agreement, as well as the contractual fee rates payable by the Fund to Funds Management for class-level administrative services under a Class-Level Administration Agreement, which include class-level transfer agency and sub-transfer agency costs (collectively, the “Management Rates”). The Board also reviewed and considered the contractual investment sub-advisory fee rates that are payable by Funds Management to the Sub-Adviser for investment sub-advisory services.
Among other information reviewed by the Board was a comparison of the Fund’s Management Rates with the average contractual investment management fee rates of funds in the expense Groups at a common asset level as well as transfer agency costs of the funds in the expense Groups. The Board noted that the Management Rates of the Fund were higher than the sum of these average rates for the Fund’s expense Groups for all share classes except Class A and Class R6. The Board noted that the net operating expense ratios of the Fund were equal to or in range of the median net operating expense ratios of the expense Groups for all share classes. The Board also discussed and accepted Funds Management’s proposal to revise the Management Agreement to reduce fees at all asset levels for the Fund.
The Board also received and considered information about the portion of the total management fee that was retained by Funds Management after payment of the fee to the Sub-Adviser for sub-advisory services. In assessing the reasonableness of this amount, the Board received and evaluated information about the nature and extent of responsibilities retained and risks assumed by Funds Management and not delegated to or assumed by the Sub-Adviser, and about Funds Management’s on-going oversight services. However, given the affiliation between Funds Management and the Sub-Adviser, the Board ascribed limited relevance to the allocation of fees between them.
The Board also received and considered information about the nature and extent of services offered and fee rates charged by Funds Management and the Sub-Adviser to other types of clients with investment strategies similar to those of the Fund. In this regard, the Board received information about the significantly greater scope of services, and compliance, reporting and other legal burdens and risks of managing mutual funds compared with those associated with managing assets of non-mutual fund clients such as collective funds or institutional separate accounts.
Based on its consideration of the factors and information it deemed relevant, including those described here, the Board determined that the compensation payable to Funds Management under the Management Agreement and to the Sub-Adviser under the Sub-Advisory Agreement was reasonable, in light of the services covered by the Advisory Agreements.
Profitability
The Board received and considered information concerning the profitability of Funds Management, as well as the profitability of Wells Fargo as a whole, from providing services to the Fund and the fund family as a whole. The Board also received and considered information concerning the profitability of the Sub-Adviser from providing services to the fund family as a whole, noting that the Sub-Adviser’s profitability information with respect to providing services to the Fund was subsumed in the Wells Fargo and Funds Management profitability analysis.
Funds Management reported on the methodologies and estimates used in calculating profitability. Among other things, the Board noted that the levels of profitability reported on a fund-by-fund basis varied widely, depending on factors such as the size and type of fund. Based on its review, the Board did not deem the profits reported by Funds Management or Wells Fargo from its services to the Fund to be at a level that would prevent it from approving the continuation of the Advisory Agreements.
| | | | |
| 36 | | Wells Fargo Emerging Markets Equity Income Fund | | Other information (unaudited) |
Economies of scale
With respect to possible economies of scale, the Board noted the existence of breakpoints in the Fund’s management fee structure, which operate generally to reduce the Fund’s expense ratios as the Fund grows in size. It considered that, for a small fund or a fund that shrinks in size, breakpoints conversely can result in higher fee levels. The Board also considered that fee waiver and expense reimbursement arrangements and competitive fee rates at the outset are means of sharing potential economies of scale with shareholders of the Fund and the fund family as a whole. The Board discussed and accepted Funds Management’s proposal to reduce the net operating expense ratio caps for the Class A, Class C, Class R, Institutional Class and Class R6. The Board also discussed and accepted Funds Management’s proposal to revise the Management Agreement to reduce fees at all asset levels for the Fund. The Board considered Funds Management’s view that any analyses of potential economies of scale in managing a particular fund are inherently limited in light of the joint and common costs and investments that Funds Management incurs across the fund family as a whole.
The Board concluded that the Fund’s fee and expense arrangements, including contractual breakpoints, constituted a reasonable approach to sharing potential economies of scale with the Fund and its shareholders.
Other benefits to Funds Management and the Sub-Adviser
The Board received and considered information regarding potential “fall-out” or ancillary benefits received by Funds Management and its affiliates, including the Sub-Adviser, as a result of their relationships with the Fund. Ancillary benefits could include, among others, benefits directly attributable to other relationships with the Fund and benefits potentially derived from an increase in Funds Management’s and the Sub-Adviser’s business as a result of their relationships with the Fund. The Board noted that various affiliates of Funds Management may receive distribution-related fees, shareholder servicing payments and sub-transfer agency fees in respect of shares sold or held through them and services provided.
The Board also reviewed information about soft dollar credits earned and utilized by the Sub-Adviser, fees earned by Funds Management and the Sub-Adviser from managing a private investment vehicle for the fund family’s securities lending collateral and commissions earned by an affiliated broker from portfolio transactions.
Based on its consideration of the factors and information it deemed relevant, including those described here, the Board did not find that any ancillary benefits received by Funds Management and its affiliates, including the Sub-Adviser, were unreasonable.
Conclusion
At the Meeting, after considering the above-described factors and based on its deliberations and its evaluation of the information described above, the Board unanimously approved the continuation of the Advisory Agreements for a one-year term and determined that the compensation payable to Funds Management and the Sub-Adviser under each of the Advisory Agreements was reasonable.
| | | | | | |
| List of abbreviations | | Wells Fargo Emerging Markets Equity Income Fund | | | 37 | |
The following is a list of common abbreviations for terms and entities that may have appeared in this report.
| ACA | — ACA Financial Guaranty Corporation |
| ADR | — American depositary receipt |
| ADS | — American depositary shares |
| AGC | — Assured Guaranty Corporation |
| AGM | — Assured Guaranty Municipal |
| Ambac | — Ambac Financial Group Incorporated |
| AMT | — Alternative minimum tax |
| BAN | — Bond anticipation notes |
| BHAC | — Berkshire Hathaway Assurance Corporation |
| CAB | — Capital appreciation bond |
| CCAB | — Convertible capital appreciation bond |
| CDA | — Community Development Authority |
| CDO | — Collateralized debt obligation |
| DRIVER | — Derivative inverse tax-exempt receipts |
| DW&P | — Department of Water & Power |
| DWR | — Department of Water Resources |
| ECFA | — Educational & Cultural Facilities Authority |
| EDA | — Economic Development Authority |
| EDFA | — Economic Development Finance Authority |
| ETF | — Exchange-traded fund |
| FDIC | — Federal Deposit Insurance Corporation |
| FFCB | — Federal Farm Credit Banks |
| FGIC | — Financial Guaranty Insurance Corporation |
| FHA | — Federal Housing Administration |
| FHLB | — Federal Home Loan Bank |
| FHLMC | — Federal Home Loan Mortgage Corporation |
| FICO | — The Financing Corporation |
| FNMA | — Federal National Mortgage Association |
| GDR | — Global depositary receipt |
| GNMA | — Government National Mortgage Association |
| HCFR | — Healthcare facilities revenue |
| HEFA | — Health & Educational Facilities Authority |
| HEFAR | — Higher education facilities authority revenue |
| HFA | — Housing Finance Authority |
| HFFA | — Health Facilities Financing Authority |
| HUD | — Department of Housing and Urban Development |
| IDA | — Industrial Development Authority |
| IDAG | — Industrial Development Agency |
| KRW | — Republic of Korea won |
| LIBOR | — London Interbank Offered Rate |
| LIFER | — Long Inverse Floating Exempt Receipts |
| LLC | — Limited liability company |
| LLLP | — Limited liability limited partnership |
| LLP | — Limited liability partnership |
| MBIA | — Municipal Bond Insurance Association |
| MFHR | — Multifamily housing revenue |
| MSTR | — Municipal securities trust receipts |
| MUD | — Municipal Utility District |
| National | — National Public Finance Guarantee Corporation |
| PCFA | — Pollution Control Financing Authority |
| PCL | — Public Company Limited |
| PCR | — Pollution control revenue |
| PFA | — Public Finance Authority |
| PFFA | — Public Facilities Financing Authority |
| PFOTER | — Puttable floating option tax-exempt receipts |
| plc | — Public limited company |
| PUTTER | — Puttable tax-exempt receipts |
| R&D | — Research & development |
| Radian | — Radian Asset Assurance |
| RAN | — Revenue anticipation notes |
| RDA | — Redevelopment Authority |
| RDFA | — Redevelopment Finance Authority |
| REIT | — Real estate investment trust |
| ROC | — Reset option certificates |
| SAVRS | — Select auction variable rate securities |
| SBA | — Small Business Authority |
| SDR | — Swedish depositary receipt |
| SFHR | — Single-family housing revenue |
| SFMR | — Single-family mortgage revenue |
| SPA | — Standby purchase agreement |
| SPDR | — Standard & Poor’s Depositary Receipts |
| SPEAR | — Short Puttable Exempt Adjustable Receipts |
| STRIPS | — Separate trading of registered interest and |
| TAN | — Tax anticipation notes |
| TIPS | — Treasury inflation-protected securities |
| TRAN | — Tax revenue anticipation notes |
| TTFA | — Transportation Trust Fund Authority |
| TVA | — Tennessee Valley Authority |
This page is intentionally left blank.
This page is intentionally left blank.
This page is intentionally left blank.

For more information
More information about Wells Fargo Funds is available free upon request. To obtain literature, please write, email, visit the Fund’s website, or call:
Wells Fargo Funds
P.O. Box 8266
Boston, MA 02266-8266
Email: fundservice@wellsfargo.com
Website: wellsfargofunds.com
Individual investors: 1-800-222-8222
Retail investment professionals: 1-888-877-9275
Institutional investment professionals: 1-866-765-0778
This report and the financial statements contained herein are submitted for the general information of the shareholders of the Fund. If this report is used for promotional purposes, distribution of the report must be accompanied or preceded by a current prospectus. Before investing, please consider the investment objectives, risks, charges, and expenses of the investment. For a current prospectus and, if available, a summary prospectus, containing this information, call 1-800-222-8222 or visit the Fund’s website at wellsfargofunds.com. Read the prospectus carefully before you invest or send money.
Wells Fargo Asset Management (WFAM) is a trade name used by the asset management businesses of Wells Fargo & Company. Wells Fargo Funds Management, LLC, a wholly owned subsidiary of Wells Fargo & Company, provides investment advisory and administrative services for Wells Fargo Funds. Other affiliates of Wells Fargo & Company provide subadvisory and other services for the funds. The funds are distributed by Wells Fargo Funds Distributor, LLC, Member FINRA, an affiliate of Wells Fargo & Company. Neither Wells Fargo Funds Management nor Wells Fargo Funds Distributor has Fund customer accounts/assets, and neither provides investment advice/recommendations or acts as an investment advice fiduciary to any investor.
NOT FDIC INSURED ◾ NO BANK GUARANTEE ◾ MAY LOSE VALUE
© 2016 Wells Fargo Funds Management, LLC. All rights reserved.
| | |
 | | 247342 12-16 A262/AR262 10-16 |
Annual Report
October 31, 2016

Wells Fargo Global Opportunities Fund


Reduce clutter. Save trees.
Sign up for electronic delivery of prospectuses and shareholder reports at wellsfargo.com/advantagedelivery
Contents
The views expressed and any forward-looking statements are as of October 31, 2016, unless otherwise noted, and are those of the Fund managers and/or Wells Fargo Funds Management, LLC. Discussions of individual securities, or the markets generally, or any Wells Fargo Fund are not intended as individual recommendations. Future events or results may vary significantly from those expressed in any forward-looking statements. The views expressed are subject to change at any time in response to changing circumstances in the market. Wells Fargo Funds Management, LLC and the Fund disclaim any obligation to publicly update or revise any views expressed or forward-looking statements.
NOT FDIC INSURED ◾ NO BANK GUARANTEE ◾ MAY LOSE VALUE
| | | | |
| 2 | | Wells Fargo Global Opportunities Fund | | Letter to shareholders (unaudited) |

Karla M. Rabusch
President
Wells Fargo Funds
International equity investors entered the period confronting concerns about slowing economic growth, particularly in China.
Dear Shareholder:
We are pleased to offer you this annual report for the Wells Fargo Global Opportunities Fund for the 12-month period that ended October 31, 2016. Significant volatility in international equity markets during the final months of 2015 and early 2016 subsided during the last half of the period. The performance contrast in each half of the reporting period as measured by key benchmark indexes shows the improving investment environment during the previous 12 months.
| | | | | | | | |
| | | November 1, 2015 through
April 30, 2016 (%) | | | May 1, 2016 through
October 31, 2016 (%) | |
Morgan Stanley Capital International (MSCI) Europe, Australasia, Far East (EAFE) Index (Net)1 | | | (3.07 | ) | | | (0.16 | ) |
MSCI World Index (Net)2 | | | (1.05 | ) | | | 2.25 | |
MSCI All Country World Index (ACWI) ex USA Index (Net)3 | | | (1.75 | ) | | | 2.01 | |
S&P Developed SmallCap Index4 | | | 1.05 | | | | 2.36 | |
Past performance is no guarantee of future results.
Central bank policies demonstrated resolve to reignite global economic growth.
International equity investors entered the period confronting concerns about slowing economic growth, particularly in China. They also were uncertain if governments and their central banks could successfully address concerns about recessionary pressures and global business activity through monetary and economic policy. The December 2015 decision of the U.S. Federal Reserve (Fed) to increase its key interest rate caused elevated levels of volatility in global equity markets and sometimes drove significant fluctuations in the relative values of currencies around the world. The U.S. dollar tended to gain strength, which helped exporters in other countries but pressured importers who paid higher prices for goods and services.
The European Central Bank (ECB) pushed the interest rate it pays on deposits further into negative territory in late 2015. In January 2016, the Bank of Japan followed the ECB’s lead by setting a negative deposit rate. During the period, the People’s Bank of China guided its currency’s value lower relative to a basket of foreign currencies to enhance exports. Investors viewed the actions of major central banks as consistent with efforts to spark business activity. Observing the actions of central banks overseas to implement policies that would accommodate
| 1 | The Morgan Stanley Capital International (MSCI) Europe, Australasia, Far East (EAFE) Index (Net) is a free-float-adjusted market-capitalization weighted index that is designed to measure the equity market performance of developed markets, excluding the United States and Canada. The MSCI EAFE Index (Net) consists of the following 21 developed markets country indexes: Australia, Austria, Belgium, Denmark, Finland, France, Germany, Hong Kong, Ireland, Israel, Italy, Japan, the Netherlands, New Zealand, Norway, Portugal, Singapore, Spain, Sweden, Switzerland, and the United Kingdom. Source: MSCI. MSCI makes no express or implied warranties or representations and shall have no liability whatsoever with respect to any MSCI data contained herein. The MSCI data may not be further redistributed or used as a basis for other indexes or any securities or financial products. This report is not approved, reviewed, or produced by MSCI. You cannot invest directly in an index. |
| 2 | The MSCI World Index (Net) is a free-float-adjusted market-capitalization-weighted index that is designed to measure the equity market performance of developed markets. The MSCI World Index (Net) consists of the following 23 developed markets country indexes: Australia, Austria, Belgium, Canada, Denmark, Finland, France, Germany, Hong Kong, Ireland, Israel, Italy, Japan, the Netherlands, New Zealand, Norway, Portugal, Singapore, Spain, Sweden, Switzerland, the United Kingdom, and the United States. You cannot invest directly in an index. |
| 3 | The MSCI All Country World Index (ACWI) ex USA Index (Net) is a free-float-adjusted market-capitalization-weighted index that is designed to measure the equity market performance of developed markets, excluding the United States and Canada. You cannot invest directly in an index. |
| 4 | The S&P Developed SmallCap Index is a free-float-adjusted market-capitalization-weighted index designed to measure the equity market performance of small-capitalization companies located in developed markets. The index is composed of companies within the bottom 15% of the cumulative market capitalization in developed markets. The index covers all publicly listed equities with float-adjusted market values of U.S. $100 million or more and annual dollar value traded of at least U.S. $50 million in all included countries. You cannot invest directly in an index. |
| | | | | | |
| Letter to shareholders (unaudited) | | Wells Fargo Global Opportunities Fund | | | 3 | |
higher levels of business activity, the Fed acknowledged that risks to global growth existed and indicated it would base further rate increases on data that indicated successful management of the risks.
Investors closely watched changing sentiment in global markets during the period.
In the second quarter of 2016, equity market volatility levels declined and remained relatively low until the end of June, when voters in the United Kingdom surprised market participants and approved the Brexit referendum to leave the European Union. Investors reacted to the news negatively and fled to assets such as precious metals and U.S. Treasury bonds. As a result, interest rates fell sharply, and equity markets declined across the globe. In the weeks to follow, signs of resilience in major markets worldwide offset concerns stemming from the Brexit referendum.
Investors’ sentiments improved during the third quarter of 2016, which led to more favorable returns across global equity markets. The third-quarter saw a rotation that favored company fundamentals over macroeconomic fears, creating a more favorable market dynamic for active managers. Dispersion of returns from both the sector and country perspective tended to confirm the changing views of the markets among investors. On an improved perception of business health, economically sensitive sectors such as consumer discretionary, materials, financials, and industrials gained while traditionally defensive sectors (utilities, telecommunication services, health care, and consumer staples) benefited less during the market rally.
Don’t let short-term uncertainty derail long-term investment goals.
Periods of investment uncertainty can present challenges, but experience has taught us that maintaining long-term investment goals can be an effective way to plan for the future. To help you create a sound strategy based on your personal goals and risk tolerance, Wells Fargo Funds offers more than 100 mutual funds spanning a wide range of asset classes and investment styles. Although diversification cannot guarantee an investment profit or prevent losses, we believe it can be an effective way to manage investment risk and potentially smooth out overall portfolio performance. We encourage investors to know their investments and to understand that appropriate levels of risk-taking may unlock opportunities.
Thank you for choosing to invest with Wells Fargo Funds. We appreciate your confidence in us and remain committed to helping you meet your financial needs.
Sincerely,

Karla M. Rabusch
President
Wells Fargo Funds
Investors’ sentiments improved during the third quarter of 2016, which led to more favorable returns across global equity markets.
For further information about your Fund, contact your investment professional, visit our website at wellsfargofunds.com, or call us directly at 1-800-222-8222. We are available 24 hours a day, 7 days a week.
| | | | |
| 4 | | Wells Fargo Global Opportunities Fund | | Performance highlights (unaudited) |
Investment objective
The Fund seeks long-term capital appreciation.
Manager
Wells Fargo Funds Management, LLC
Subadviser
Wells Capital Management Incorporated
Portfolio managers
Oleg Makhorine
Robert Rifkin, CFA®
James M. Tringas, CFA®, CPA
Bryant VanCronkhite, CFA®, CPA
Average annual total returns (%) as of October 31, 20161
| | | | | | | | | | | | | | | | | | | | | | | | | | | | | | | | | | |
| | | | | Including sales charge | | | Excluding sales charge | | | Expense ratios2 (%) | |
| | | Inception date | | 1 year | | | 5 year | | | 10 year | | | 1 year | | | 5 year | | | 10 year | | | Gross | | | Net3 | |
| Class A (EKGAX) | | 3-16-1988 | | | 2.84 | | | | 8.88 | | | | 5.03 | | | | 9.12 | | | | 10.18 | | | | 5.65 | | | | 1.55 | | | | 1.55 | |
| Class B (EKGBX)* | | 2-1-1993 | | | 3.32 | | | | 9.08 | | | | 5.10 | | | | 8.32 | | | | 9.36 | | | | 5.10 | | | | 2.30 | | | | 2.30 | |
| Class C (EKGCX) | | 2-1-1993 | | | 7.31 | | | | 9.36 | | | | 4.86 | | | | 8.31 | | | | 9.36 | | | | 4.86 | | | | 2.30 | | | | 2.30 | |
| Administrator Class (EKGYX) | | 1-13-1997 | | | – | | | | – | | | | – | | | | 9.30 | | | | 10.36 | | | | 5.86 | | | | 1.47 | | | | 1.41 | |
| Institutional Class (EKGIX) | | 7-30-2010 | | | – | | | | – | | | | – | | | | 9.56 | | | | 10.63 | | | | 6.03 | | | | 1.22 | �� | | | 1.16 | |
| S&P Developed SmallCap Index4 | | – | | | – | | | | – | | | | – | | | | 3.43 | | | | 10.25 | | | | 5.43 | | | | – | | | | – | |
| * | | Class B shares are closed to investment, except in connection with the reinvestment of any distributions and permitted exchanges. |
Figures quoted represent past performance, which is no guarantee of future results, and do not reflect taxes that a shareholder may pay on fund distributions or the redemption of fund shares. Investment return and principal value of an investment will fluctuate so that an investor’s shares, when redeemed, may be worth more or less than their original cost. Performance shown without sales charges would be lower if sales charges were reflected. Current performance may be lower or higher than the performance data quoted, which assumes the reinvestment of dividends and capital gains. Current month-end performance is available on the Fund’s website, wellsfargofunds.com.
Index returns do not include transaction costs associated with buying and selling securities, any mutual fund fees or expenses, or any taxes. It is not possible to invest directly in an index.
For Class A shares, the maximum front-end sales charge is 5.75%. For Class B shares, the maximum contingent deferred sales charge is 5.00%. For Class C shares, the maximum contingent deferred sales charge is 1.00%. Performance including a contingent deferred sales charge assumes the sales charge for the corresponding time period. Administrator Class and Institutional Class shares are sold without a front-end sales charge or contingent deferred sales charge.
Stock values fluctuate in response to the activities of individual companies and general market and economic conditions. Foreign investments are especially volatile and can rise or fall dramatically due to differences in the political and economic conditions of the host country. These risks are generally intensified in emerging markets. The use of derivatives may reduce returns and/or increase volatility. Certain investment strategies tend to increase the total risk of an investment (relative to the broader market). The Fund is exposed to geographic risk and smaller-company securities risk. Consult the Fund’s prospectus for additional information on these and other risks.
Please see footnotes on page 5.
| | | | | | |
| Performance highlights (unaudited) | | Wells Fargo Global Opportunities Fund | | | 5 | |
|
| Growth of $10,000 investment as of October 31, 20165 |
|
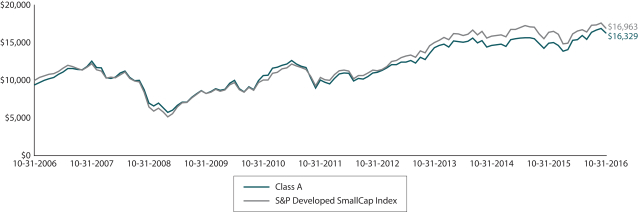 |
| 1 | Historical performance shown for Institutional Class shares prior to their inception reflects the performance of Administrator Class shares, and includes the higher expenses applicable to Administrator Class shares. If these expenses had not been included, returns would be higher. Historical performance shown for all classes of the Fund prior to July 19, 2010, is based on the performance of the Fund’s predecessor, Evergreen Global Opportunities Fund. |
| 2 | Reflects the expense ratios as stated in the most recent prospectuses, which include the impact of 0.01% in acquired fund fees and expenses. The expense ratios shown are subject to change and may differ from the annualized expense ratios shown in the financial highlights of this report, which do not include acquired fund fees and expenses. |
| 3 | The manager has contractually committed through February 28, 2017, to waive fees and/or reimburse expenses to the extent necessary to cap the Fund’s Total Annual Operating Expenses After Fee Waiver at 1.55% for Class A, 2.30% for Class B, 2.30% for Class C, 1.40% for Administrator Class, and 1.15% for Institutional Class. After this time, the cap may be increased or the commitment to maintain the cap may be terminated only with the approval of the Board of Trustees. Brokerage commissions, stamp duty fees, interest, taxes, acquired fund fees and expenses, and extraordinary expenses are excluded from the expense cap. Without this cap, the Fund’s returns would have been lower. |
| 4 | The S&P Developed SmallCap Index is a free-float-adjusted market-capitalization-weighted index designed to measure the equity market performance of small-capitalization companies located in developed markets. The index is composed of companies within the bottom 15% of the cumulative market capitalization in developed markets. The index covers all publicly listed equities with float-adjusted market values of U.S. $100 million or more and annual dollar value traded of at least U.S. $50 million in all included countries. You cannot invest directly in an index. |
| 5 | The chart compares the performance of Class A shares for the most recent ten years with the S&P Developed SmallCap Index. The chart assumes a hypothetical investment of $10,000 in Class A shares and reflects all operating expenses and assumes the maximum initial sales charge of 5.75%. |
| 6 | The ten largest holdings, excluding cash and cash equivalents, are calculated based on the value of the investments divided by total net assets of the Fund. Holdings are subject to change and may have changed since the date specified. |
| 7 | Amounts are calculated based on the total long-term investments of the Fund. These amounts are subject to change and may have changed since the date specified. |
| | | | |
| 6 | | Wells Fargo Global Opportunities Fund | | Performance highlights (unaudited) |
MANAGER’S DISCUSSION
Fund highlights
| ∎ | | The Fund outperformed its benchmark, the S&P Developed SmallCap Index, for the 12-month period that ended October 31, 2016. |
| ∎ | | Stock selection in the consumer staples, consumer discretionary, and information technology (IT) sectors contributed to relative performance. However, these gains were partly offset by an underweight to the utilities and real estate investment trust (REIT) sectors and stock selection in the financial sector. |
| ∎ | | Geographically, security selection in the U.S., Canada, Japan, and Europe were all positive contributors. A slight overweight to the U.K. and an underweight to Asia ex-Japan detracted from performance. |
The 3.43% return of the S&P Developed SmallCap Index does not reflect the high level of market volatility during the reporting period, which included several swings of 10% or more up or down, driven largely by investor reactions to macroeconomic headlines. The U.S. Federal Open Market Committee’s (FOMC) decision to raise interest rates in December of 2015 and comments that several potential rate increases might follow in 2016 caused global markets to plunge until February. FOMC Chair Janet Yellen subsequently stated that further rate increases were likely on hold, which caused global markets to move higher for the next several months. Investors then turned their attention towards the U.K.’s referendum in June to leave the European Union. After quickly digesting the news, the markets rallied back through the summer of 2016 until October when uncertainty surrounding the upcoming U.S. presidential election led to a decline during the final month of the period.
As bottom-up investors, we evaluate how these global macroeconomic events might affect the Fund’s holdings, but we do not derive our security selection from macroeconomic bets. We aim to use market volatility opportunistically, and we will seek to use any future volatility to the advantage of our bottom-up stock-selection process. This volatile period proved to be a great example of why we prefer to have security selection determine our fate as investors.
| | | | |
| Ten largest holdings (%) as of October 31, 20166 | |
Popeyes Louisiana Kitchen Incorporated | | | 2.22 | |
Novanta Incorporated | | | 2.20 | |
TreeHouse Foods Incorporated | | | 1.86 | |
Mueller Industries Incorporated | | | 1.84 | |
ICU Medical Incorporated | | | 1.84 | |
Analogic Corporation | | | 1.82 | |
Douglas Dynamics Incorporated | | | 1.80 | |
Denny’s Corporation | | | 1.71 | |
Vishay Intertechnology Incorporated | | | 1.56 | |
Helen of Troy Limited | | | 1.53 | |
Stock selection in the consumer staples, consumer discretionary, and IT sectors contributed to performance during the period.
In the consumer staples sector, Maple Leaf Foods, Incorporated, a Canadian packaged meat company contributed. The company’s multi-year capital reallocation effort led to very strong operational and financial results. Additionally, FamilyMart UNY Holdings Company Limited, a Japan-based holding company which operates convenience stores, saw its stock rewarded for solid performance and stronger than expected store expansions.
Within the consumer discretionary sector, a notable contributor was Krispy Kreme Doughnuts, Incorporated, a U.S.-based retailer and wholesaler of doughnuts and other food and beverage products. The shares appreciated after JAB Holding Company announced a merger agreement in May of 2016. Kuoni Reisen Holding AG, the Switzerland-based provider of global travel services, contributed after the company was acquired by EQT Partners AB.
Security selection in the IT sector was a contributor and was positively affected by our exposure to Coherent Incorporated. The U.S.-based supplier of photonics-based solutions consistently delivered strong results from its core organic light emitting diodes business. Also, Coherent’s acquisition of Rofin-Sinar Technologies Incorporated, an industrial laser manufacturer, expands and diversifies the company’s market reach.
An underweight to the interest rate sensitive utility and REIT sectors detracted from relative performance. Although we recognize our underweight to these sectors has been a detractor as investors looked for yield-oriented securities, our disciplined reward-to-risk valuation process continues to keep us underweight the utility and REIT sectors at this time.
Please see footnotes on page 5.
| | | | | | |
| Performance highlights (unaudited) | | Wells Fargo Global Opportunities Fund | | | 7 | |
Stock selection in the financial sector was also a detractor for the period. BinckBank N.V., a Netherlands-based provider of online brokerage services, underperformed due to a slowdown in its European retail brokerage transactions. Azimut Holding S.p.A, an Italian-based asset manager and provider of financial advisory services, also detracted from performance as investors expressed concerns about financial market volatility and the sustainability of its performance fees.
|
| Sector distribution as of October 31, 20167 |
|
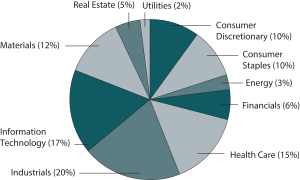 |
|
| Country allocation as of October 31, 20167 |
|
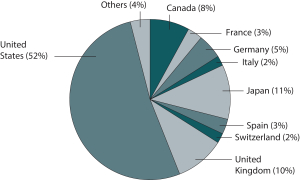 |
Our investment philosophy focuses on company-specific factors rather than on headline-dominating macroeconomic events.
We will continue to invest in companies that we believe control their destiny via distinct long-term competitive advantages, flexible balance sheets, and strong, sustainable free cash flow generation. We expect that our stock selection based on these attributes, along with thoughtful portfolio construction, should allow us to continue to strive toward our goal of consistent alpha generation with a low risk profile. As we look to the end of 2016, there are numerous market forces that could bring further volatility. Perhaps the biggest question mark facing investors over the next six to twelve months is how and when the U.S. Federal Reserve chooses to raise interest rates. Central banks around the globe are struggling with similar issues, and the recent attempt by the Bank of Japan to put a floor under long-term rates while still remaining accommodating will be worth watching to see if it is successful.
We believe our fundamental analysis, risk management, and active investment process are well suited to take advantage of new opportunities as the equity market evolves. While volatility may increase, the strong balance sheets and stable cash flow of the companies in our portfolio should support consistent long-term performance.
Please see footnotes on page 5.
| | | | |
| 8 | | Wells Fargo Global Opportunities Fund | | Fund expenses (unaudited) |
As a shareholder of the Fund, you incur two types of costs: (1) transaction costs, including sales charges (loads) on purchase payments and contingent deferred sales charges (if any) on redemptions and (2) ongoing costs, including management fees, distribution (12b-1) and/or shareholder servicing fees, and other Fund expenses. This example is intended to help you understand your ongoing costs (in dollars) of investing in the Fund and to compare these costs with the ongoing costs of investing in other mutual funds.
The example is based on an investment of $1,000 invested at the beginning of the six-month period and held for the entire period from May 1, 2016 to October 31, 2016.
Actual expenses
The “Actual” line of the table below provides information about actual account values and actual expenses. You may use the information in this line, together with the amount you invested, to estimate the expenses that you paid over the period. Simply divide your account value by $1,000 (for example, an $8,600 account value divided by $1,000 = 8.6), then multiply the result by the number in the “Actual” line under the heading entitled “Expenses paid during period” for your applicable class of shares to estimate the expenses you paid on your account during this period.
Hypothetical example for comparison purposes
The “Hypothetical” line of the table below provides information about hypothetical account values and hypothetical expenses based on the Fund’s actual expense ratio and an assumed rate of return of 5% per year before expenses, which is not the Fund’s actual return. The hypothetical account values and expenses may not be used to estimate the actual ending account balance or expenses you paid for the period. You may use this information to compare the ongoing costs of investing in the Fund and other funds. To do so, compare this 5% hypothetical example with the 5% hypothetical examples that appear in the shareholder reports of the other funds.
Please note that the expenses shown in the table are meant to highlight your ongoing costs only and do not reflect any transactional costs, such as sales charges (loads) and contingent deferred sales charges. Therefore, the “Hypothetical” line of the table is useful in comparing ongoing costs only and will not help you determine the relative total costs of owning different funds. In addition, if these transactional costs were included, your costs would have been higher.
| | | | | | | | | | | | | | | | |
| | | Beginning
account value
5-1-2016 | | | Ending
account value
10-31-2016 | | | Expenses
paid during
the period¹ | | | Annualized net
expense ratio | |
Class A | | | | | | | | | | | | | | | | |
Actual | | $ | 1,000.00 | | | $ | 1,058.11 | | | $ | 8.01 | | | | 1.55 | % |
Hypothetical (5% return before expenses) | | $ | 1,000.00 | | | $ | 1,017.36 | | | $ | 7.85 | | | | 1.55 | % |
Class B | | | | | | | | | | | | | | | | |
Actual | | $ | 1,000.00 | | | $ | 1,054.21 | | | $ | 11.86 | | | | 2.30 | % |
Hypothetical (5% return before expenses) | | $ | 1,000.00 | | | $ | 1,013.59 | | | $ | 11.62 | | | | 2.30 | % |
Class C | | | | | | | | | | | | | | | | |
Actual | | $ | 1,000.00 | | | $ | 1,054.22 | | | $ | 11.87 | | | | 2.30 | % |
Hypothetical (5% return before expenses) | | $ | 1,000.00 | | | $ | 1,013.58 | | | $ | 11.63 | | | | 2.30 | % |
Administrator Class | | | | | | | | | | | | | | | | |
Actual | | $ | 1,000.00 | | | $ | 1,059.09 | | | $ | 7.25 | | | | 1.40 | % |
Hypothetical (5% return before expenses) | | $ | 1,000.00 | | | $ | 1,018.10 | | | $ | 7.10 | | | | 1.40 | % |
Institutional Class | | | | | | | | | | | | | | | | |
Actual | | $ | 1,000.00 | | | $ | 1,060.33 | | | $ | 5.96 | | | | 1.15 | % |
Hypothetical (5% return before expenses) | | $ | 1,000.00 | | | $ | 1,019.36 | | | $ | 5.84 | | | | 1.15 | % |
| 1 | Expenses paid is equal to the annualized net expense ratio of each class multiplied by the average account value over the period, multiplied by the number of days in the most recent fiscal half-year divided by the number of days in the fiscal year (to reflect the one-half-year period). |
| | | | | | |
| Portfolio of investments—October 31, 2016 | | Wells Fargo Global Opportunities Fund | | | 9 | |
| | | | | | | | | | | | | | | | |
| Security name | | | | | | | | Shares | | | Value | |
| | | | |
Common Stocks: 92.55% | | | | | | | | | | | | | | | | |
| | | | |
| Australia: 0.63% | | | | | | | | | | | | | | | | |
Ansell Limited (Health Care, Health Care Equipment & Supplies) | | | | | | | | | | | 68,572 | | | $ | 1,131,409 | |
Spotless Group Holdings Limited (Industrials, Commercial Services & Supplies) | | | | | | | | | | | 310,180 | | | | 235,954 | |
| | | | |
| | | | | | | | | | | | | | | 1,367,363 | |
| | | | | | | | | | | | | | | | |
| | | | |
| Austria: 0.44% | | | | | | | | | | | | | | | | |
UNIQA Insurance Group AG (Financials, Insurance) | | | | | | | | | | | 38,383 | | | | 247,416 | |
Zumtobel Group AG (Industrials, Electrical Equipment) | | | | | | | | | | | 39,794 | | | | 698,724 | |
| | | | |
| | | | | | | | | | | | | | | 946,140 | |
| | | | | | | | | | | | | | | | |
| | | | |
| Canada: 7.35% | | | | | | | | | | | | | | | | |
Colliers International Group (Real Estate, Real Estate Management & Development) | | | | | | | | | | | 28,424 | | | | 989,637 | |
Cott Corporation (Consumer Staples, Beverages) | | | | | | | | | | | 91,640 | | | | 1,201,780 | |
Finning International Incorporated (Industrials, Trading Companies & Distributors) | | | | | | | | | | | 44,630 | | | | 830,511 | |
Maple Leaf Foods Incorporated (Consumer Staples, Food Products) | | | | | | | | | | | 77,542 | | | | 1,766,128 | |
MBAC Fertilizer Corporation - Legend Shares (Materials, Chemicals) (a)(i) | | | | | | | | | | | 84,000 | | | | 1,879 | |
MTY Food Group Incorporated (Consumer Discretionary, Hotels, Restaurants & Leisure) | | | | | | | | | | | 44,394 | | | | 1,601,931 | |
Mullen Group Limited (Energy, Energy Equipment & Services) « | | | | | | | | | | | 87,091 | | | | 1,207,054 | |
Novanta Incorporated (Information Technology, Electronic Equipment, Instruments & Components) † | | | | | | | | | | | 272,071 | | | | 4,747,639 | |
Parex Resources Incorporated (Energy, Oil, Gas & Consumable Fuels) † | | | | | | | | | | | 108,900 | | | | 1,252,760 | |
Tesco Corporation (Energy, Energy Equipment & Services) | | | | | | | | | | | 165,400 | | | | 1,132,990 | |
Western Forest Products Incorporated (Materials, Paper & Forest Products) | | | | | | | | | | | 751,499 | | | | 1,142,964 | |
| | | | |
| | | | | | | | | | | | | | | 15,875,273 | |
| | | | | | | | | | | | | | | | |
| | | | |
| China: 0.21% | | | | | | | | | | | | | | | | |
Plastec Technologies Limited (Materials, Chemicals) (a) | | | | | | | | | | | 150,788 | | | | 452,364 | |
| | | | | | | | | | | | | | | | |
| | | | |
| Finland: 0.61% | | | | | | | | | | | | | | | | |
Metsa Board OYJ (Materials, Paper & Forest Products) « | | | | | | | | | | | 229,674 | | | | 1,319,873 | |
| | | | | | | | | | | | | | | | |
| | | | |
| France: 2.93% | | | | | | | | | | | | | | | | |
ALTEN SA (Information Technology, IT Services) | | | | | | | | | | | 34,425 | | | | 2,460,510 | |
Europcar Groupe SA (Consumer Discretionary, Road & Rail) † | | | | | | | | | | | 40,073 | | | | 372,421 | |
Eutelsat Communications SA (Consumer Discretionary, Media) | | | | | | | | | | | 37,285 | | | | 781,756 | |
M6 Metropole Television SA (Consumer Discretionary, Media) | | | | | | | | | | | 85,741 | | | | 1,494,190 | |
Teleperformance SE (Industrials, Professional Services) | | | | | | | | | | | 11,540 | | | | 1,219,552 | |
| | | | |
| | | | | | | | | | | | | | | 6,328,429 | |
| | | | | | | | | | | | | | | | |
| | | | |
| Germany: 4.24% | | | | | | | | | | | | | | | | |
Cancom SE (Information Technology, IT Services) | | | | | | | | | | | 38,389 | | | | 1,742,974 | |
Gerresheimer AG (Health Care, Life Sciences Tools & Services) | | | | | | | | | | | 35,741 | | | | 2,695,816 | |
SMA Solar Technology AG (Information Technology, Semiconductors & Semiconductor Equipment) « | | | | | | | | | | | 49,736 | | | | 1,275,948 | |
TAG Immobilien AG (Real Estate, Real Estate Management & Development) « | | | | | | | | | | | 137,371 | | | | 1,833,716 | |
TLG Immobilien AG (Real Estate, Real Estate Management & Development) | | | | | | | | | | | 76,836 | | | | 1,609,336 | |
| | | | |
| | | | | | | | | | | | | | | 9,157,790 | |
| | | | | | | | | | | | | | | | |
| | | | |
| Hong Kong: 0.83% | | | | | | | | | | | | | | | | |
Sunlight REIT (Real Estate, Equity REITs) | | | | | | | | | | | 2,880,000 | | | | 1,782,465 | |
| | | | | | | | | | | | | | | | |
The accompanying notes are an integral part of these financial statements.
| | | | |
| 10 | | Wells Fargo Global Opportunities Fund | | Portfolio of investments—October 31, 2016 |
| | | | | | | | | | | | | | | | |
| Security name | | | | | | | | Shares | | | Value | |
| | | | |
| Ireland: 0.31% | | | | | | | | | | | | | | | | |
Horizon Pharma plc (Health Care, Pharmaceuticals) † | | | | | | | | | | | 40,200 | | | $ | 672,144 | |
| | | | | | | | | | | | | | | | |
| | | | |
| Israel: 0.79% | | | | | | | | | | | | | | | | |
Orbotech Limited (Information Technology, Electronic Equipment, Instruments & Components) † | | | | | | | | | | | 61,927 | | | | 1,696,800 | |
| | | | | | | | | | | | | | | | |
| | | | |
| Italy: 2.28% | | | | | | | | | | | | | | | | |
Autogrill SpA (Consumer Discretionary, Hotels, Restaurants & Leisure) | | | | | | | | | | | 89,619 | | | | 747,191 | |
Azimut Holding SpA (Financials, Capital Markets) | | | | | | | | | | | 133,643 | | | | 2,144,851 | |
Davide Campari-Milano SpA (Consumer Staples, Beverages) | | | | | | | | | | | 200,999 | | | | 2,024,433 | |
| | | | |
| | | | | | | | | | | | | | | 4,916,475 | |
| | | | | | | | | | | | | | | | |
| | | | |
| Japan: 9.74% | | | | | | | | | | | | | | | | |
Aeon Delight Company Limited (Industrials, Commercial Services & Supplies) | | | | | | | | | | | 101,400 | | | | 3,002,260 | |
DTS Corporation (Information Technology, IT Services) | | | | | | | | | | | 83,200 | | | | 1,846,950 | |
Ezaki Glico Company Limited (Consumer Staples, Food Products) | | | | | | | | | | | 10,000 | | | | 569,276 | |
FamilyMart Company Limited (Consumer Staples, Food & Staples Retailing) | | | | | | | | | | | 18,400 | | | | 1,154,496 | |
Fuji Seal International Incorporated (Materials, Containers & Packaging) | | | | | | | | | | | 33,500 | | | | 1,384,786 | |
Hitachi Chemical Company Limited (Materials, Chemicals) | | | | | | | | | | | 35,000 | | | | 821,017 | |
Horiba Limited (Information Technology, Electronic Equipment, Instruments & Components) | | | | | | | | | | | 20,600 | | | | 986,097 | |
Meitec Corporation (Industrials, Professional Services) | | | | | | | | | | | 45,100 | | | | 1,539,601 | |
Musashi Seimitsu Industry Company Limited (Consumer Discretionary, Auto Components) | | | | | | | | | | | 69,800 | | | | 1,707,894 | |
Nihon Parkerizing Company Limited (Materials, Chemicals) | | | | | | | | | | | 138,700 | | | | 1,917,755 | |
ORIX JREIT Incorporated (Real Estate, Equity REITs) | | | | | | | | | | | 775 | | | | 1,328,001 | |
OSG Corporation (Industrials, Machinery) « | | | | | | | | | | | 41,600 | | | | 888,170 | |
Ship Healthcare Holdings Incorporated (Health Care, Health Care Providers & Services) | | | | | | | | | | | 43,469 | | | | 1,274,599 | |
Sumitomo Warehouse Company Limited (Industrials, Transportation Infrastructure) | | | | | | | | | | | 223,000 | | | | 1,195,061 | |
Taikisha Limited (Industrials, Construction & Engineering) | | | | | | | | | | | 56,100 | | | | 1,420,287 | |
| | | | |
| | | | | | | | | | | | | | | 21,036,250 | |
| | | | | | | | | | | | | | | | |
| | | | |
| Netherlands: 0.36% | | | | | | | | | | | | | | | | |
TKH Group NV (Industrials, Electrical Equipment) | | | | | | | | | | | 19,992 | | | | 769,873 | |
| | | | | | | | | | | | | | | | |
| | | | |
| Norway: 0.23% | | | | | | | | | | | | | | | | |
SpareBank 1 SR Bank ASA (Financials, Banks) | | | | | | | | | | | 82,503 | | | | 492,281 | |
| | | | | | | | | | | | | | | | |
| | | | |
| Spain: 2.50% | | | | | | | | | | | | | | | | |
Almirall SA (Health Care, Pharmaceuticals) | | | | | | | | | | | 126,398 | | | | 1,819,058 | |
Merlin Properties Socimi SA (Real Estate, Equity REITs) | | | | | | | | | | | 160,285 | | | | 1,801,758 | |
Viscofan SA (Consumer Staples, Food Products) | | | | | | | | | | | 37,829 | | | | 1,782,953 | |
| | | | |
| | | | | | | | | | | | | | | 5,403,769 | |
| | | | | | | | | | | | | | | | |
| | | | |
| Sweden: 0.42% | | | | | | | | | | | | | | | | |
Rezidor Hotel Group AB (Consumer Discretionary, Hotels, Restaurants & Leisure) | | | | | | | | | | | 223,954 | | | | 914,943 | |
| | | | | | | | | | | | | | | | |
| | | | |
| Switzerland: 1.44% | | | | | | | | | | | | | | | | |
Aryzta AG (Consumer Staples, Food Products) | | | | | | | | | | | 24,498 | | | | 1,076,422 | |
OC Oerlikon Corporation AG (Information Technology, Electronic Equipment, Instruments & Components) † | | | | | | | | | | | 215,291 | | | | 2,025,526 | |
| | | | |
| | | | | | | | | | | | | | | 3,101,948 | |
| | | | | | | | | | | | | | | | |
The accompanying notes are an integral part of these financial statements.
| | | | | | |
| Portfolio of investments—October 31, 2016 | | Wells Fargo Global Opportunities Fund | | | 11 | |
| | | | | | | | | | | | | | | | |
| Security name | | | | | | | | Shares | | | Value | |
| | | | |
| United Kingdom: 9.51% | | | | | | | | | | | | | | | | |
Bovis Homes Group plc (Consumer Discretionary, Household Durables) | | | | | | | | | | | 98,218 | | | $ | 910,658 | |
Britvic plc (Consumer Staples, Beverages) | | | | | | | | | | | 186,430 | | | | 1,266,457 | |
Cambian Group plc (Health Care, Health Care Providers & Services) | | | | | | | | | | | 279,967 | | | | 418,926 | |
Consort Medical plc (Health Care, Health Care Equipment & Supplies) | | | | | | | | | | | 40,761 | | | | 570,260 | |
Devro plc (Consumer Staples, Food Products) | | | | | | | | | | | 65,230 | | | | 181,240 | |
Elementis plc (Materials, Chemicals) | | | | | | | | | | | 419,202 | | | | 1,222,213 | |
Hunting plc (Energy, Energy Equipment & Services) | | | | | | | | | | | 113,250 | | | | 697,942 | |
IMI plc (Industrials, Machinery) | | | | | | | | | | | 53,267 | | | | 648,077 | |
Jupiter Fund Management plc (Financials, Capital Markets) | | | | | | | | | | | 249,895 | | | | 1,320,448 | |
Keller Group plc (Industrials, Construction & Engineering) | | | | | | | | | | | 91,556 | | | | 762,600 | |
Lancashire Holdings Limited (Financials, Insurance) | | | | | | | | | | | 136,689 | | | | 1,166,133 | |
Mears Group plc (Industrials, Commercial Services & Supplies) | | | | | | | | | | | 218,957 | | | | 1,206,686 | |
Micro Focus International plc (Information Technology, Software) | | | | | | | | | | | 78,528 | | | | 2,057,893 | |
Morgan Advanced Materials plc (Industrials, Machinery) | | | | | | | | | | | 155,854 | | | | 519,836 | |
NCC Group plc (Information Technology, IT Services) | | | | | | | | | | | 299,144 | | | | 693,859 | |
Nomad Foods Limited (Consumer Staples, Food Products) † | | | | | | | | | | | 191,000 | | | | 2,347,390 | |
Savills plc (Real Estate, Real Estate Management & Development) | | | | | | | | | | | 177,381 | | | | 1,506,774 | |
Shawbrook Group plc (Financials, Banks) 144A† | | | | | | | | | | | 148,006 | | | | 407,246 | |
Spectris plc (Information Technology, Electronic Equipment, Instruments & Components) | | | | | | | | | | | 26,561 | | | | 666,144 | |
Steris Corporation (Health Care, Health Care Equipment & Supplies) | | | | | | | | | | | 21,709 | | | | 1,450,595 | |
Stock Spirits Group plc (Consumer Staples, Beverages) | | | | | | | | | | | 266,475 | | | | 516,157 | |
| | | | |
| | | | | | | | | | | | | | | 20,537,534 | |
| | | | | | | | | | | | | | | | |
| | | | |
| United States: 47.73% | | | | | | | | | | | | | | | | |
ACI Worldwide Incorporated (Information Technology, Software) † | | | | | | | | | | | 122,800 | | | | 2,225,136 | |
ALLETE Incorporated (Utilities, Electric Utilities) | | | | | | | | | | | 49,100 | | | | 3,009,339 | |
Analogic Corporation (Health Care, Health Care Equipment & Supplies) | | | | | | | | | | | 48,024 | | | | 3,930,764 | |
Aspen Insurance Holdings Limited (Financials, Insurance) | | | | | | | | | | | 48,700 | | | | 2,349,775 | |
Belden Incorporated (Information Technology, Electronic Equipment, Instruments & Components) | | | | | | | | | | | 17,600 | | | | 1,140,656 | |
Boston Beer Company Incorporated (Consumer Staples, Beverages) †« | | | | | | | | | | | 10,200 | | | | 1,583,550 | |
Compass Minerals International Incorporated (Materials, Metals & Mining) « | | | | | | | | | | | 35,600 | | | | 2,557,860 | |
Denny’s Corporation (Consumer Discretionary, Hotels, Restaurants & Leisure) † | | | | | | | | | | | 356,699 | | | | 3,698,969 | |
Douglas Dynamics Incorporated (Industrials, Machinery) | | | | | | | | | | | 120,802 | | | | 3,877,744 | |
Eagle Materials Incorporated (Materials, Construction Materials) | | | | | | | | | | | 22,000 | | | | 1,781,340 | |
Fitbit Incorporated Class A (Information Technology, Electronic Equipment, Instruments & Components) †« | | | | | | | | | | | 74,900 | | | | 993,174 | |
Forward Air Corporation (Industrials, Air Freight & Logistics) | | | | | | | | | | | 71,700 | | | | 2,962,644 | |
Franklin Electric Company Incorporated (Industrials, Machinery) | | | | | | | | | | | 76,862 | | | | 2,801,620 | |
Gulfport Energy Corporation (Energy, Oil, Gas & Consumable Fuels) † | | | | | | | | | | | 52,600 | | | | 1,268,186 | |
Haemonetics Corporation (Health Care, Health Care Equipment & Supplies) † | | | | | | | | | | | 63,376 | | | | 2,117,392 | |
HB Fuller Company (Materials, Chemicals) | | | | | | | | | | | 23,900 | | | | 1,005,473 | |
Helen of Troy Limited (Consumer Discretionary, Household Durables) † | | | | | | | | | | | 40,500 | | | | 3,300,750 | |
ICU Medical Incorporated (Health Care, Health Care Equipment & Supplies) † | | | | | | | | | | | 28,500 | | | | 3,970,050 | |
Impax Laboratories Incorporated (Health Care, Pharmaceuticals) † | | | | | | | | | | | 30,800 | | | | 619,080 | |
Innospec Incorporated (Materials, Chemicals) | | | | | | | | | | | 29,478 | | | | 1,776,049 | |
Innoviva Incorporated (Health Care, Pharmaceuticals) †« | | | | | | | | | | | 294,708 | | | | 3,035,492 | |
Korn/Ferry International (Industrials, Professional Services) | | | | | | | | | | | 147,900 | | | | 3,015,681 | |
Lannett Company Incorporated (Health Care, Pharmaceuticals) †« | | | | | | | | | | | 34,500 | | | | 755,550 | |
Molina Healthcare Incorporated (Health Care, Health Care Providers & Services) † | | | | | �� | | | | | | 25,900 | | | | 1,409,219 | |
Mueller Industries Incorporated (Industrials, Machinery) | | | | | | | | | | | 131,500 | | | | 3,983,135 | |
The accompanying notes are an integral part of these financial statements.
| | | | |
| 12 | | Wells Fargo Global Opportunities Fund | | Portfolio of investments—October 31, 2016 |
| | | | | | | | | | | | | | | | |
| Security name | | | | | | | | Shares | | | Value | |
| | | | |
| United States (continued) | | | | | | | | | | | | | | | | |
Multi Packaging Solutions International Limited (Materials, Containers & Packaging) † | | | | | | | | | | | 150,300 | | | $ | 2,030,553 | |
Myriad Genetics Incorporated (Health Care, Biotechnology) † | | | | | | | | | | | 43,600 | | | | 859,356 | |
NetScout Systems Incorporated (Information Technology, Communications Equipment) † | | | | | | | | | | | 85,900 | | | | 2,357,955 | |
PAREXEL International Corporation (Health Care, Life Sciences Tools & Services) † | | | | | | | | | | | 32,800 | | | | 1,910,928 | |
PharMerica Corporation (Health Care, Health Care Providers & Services) † | | | | | | | | | | | 31,400 | | | | 747,320 | |
Popeyes Louisiana Kitchen Incorporated (Consumer Discretionary, Hotels, Restaurants & Leisure) † | | | | | | | | | | | 89,675 | | | | 4,786,852 | |
Progress Software Corporation (Information Technology, Software) † | | | | | | | | | | | 116,100 | | | | 3,124,251 | |
Quaker Chemical Corporation (Materials, Chemicals) | | | | | | | | | | | 27,615 | | | | 2,968,613 | |
Quanex Building Products Corporation (Industrials, Building Products) | | | | | | | | | | | 105,800 | | | | 1,724,540 | |
Rogers Corporation (Information Technology, Electronic Equipment, Instruments & Components) † | | | | | | | | | | | 16,900 | | | | 919,867 | |
Ryder System Incorporated (Industrials, Road & Rail) | | | | | | | | | | | 29,500 | | | | 2,047,005 | |
Schweitzer-Mauduit International Incorporated (Materials, Paper & Forest Products) | | | | | | | | | | | 80,927 | | | | 2,987,016 | |
Simpson Manufacturing Company Incorporated (Industrials, Building Products) | | | | | | | | | | | 40,570 | | | | 1,736,396 | |
South Jersey Industries Incorporated (Utilities, Gas Utilities) | | | | | | | | | | | 53,100 | | | | 1,574,415 | |
Synergy Resources Corporation (Energy, Oil, Gas & Consumable Fuels) †« | | | | | | | | | | | 58,600 | | | | 400,824 | |
Thermon Group Holdings Incorporated (Industrials, Electrical Equipment) † | | | | | | | | | | | 97,300 | | | | 1,783,509 | |
TreeHouse Foods Incorporated (Consumer Staples, Food Products) † | | | | | | | | | | | 45,900 | | | | 4,015,332 | |
USG Corporation (Industrials, Building Products) † | | | | | | | | | | | 70,200 | | | | 1,767,636 | |
Vishay Intertechnology Incorporated (Information Technology, Electronic Equipment, Instruments & Components) | | | | | | | | | | | 238,190 | | | | 3,358,479 | |
Westwood Holdings Group Incorporated (Financials, Capital Markets) | | | | | | | | | | | 53,950 | | | | 2,781,122 | |
| | | | |
| | | | | | | | | | | | | | | 103,050,597 | |
| | | | | | | | | | | | | | | | |
| | | | |
Total Common Stocks (Cost $178,449,089) | | | | | | | | | | | | | | | 199,822,311 | |
| | | | | | | | | | | | | | | | |
| | | | |
| | | Dividend yield | | | | | | | | | | |
Preferred Stocks: 0.64% | | | | | | | | | | | | | | | | |
| | | | |
| Germany: 0.64% | | | | | | | | | | | | | | | | |
Draegerwerk AG & Company KGAA (Health Care, Health Care Equipment & Supplies) ± | | | 0.30 | % | | | | | | | 19,462 | | | | 1,388,260 | |
| | | | | | | | | | | | | | | | |
| | | | |
Total Preferred Stocks (Cost $1,703,050) | | | | | | | | | | | | | | | 1,388,260 | |
| | | | | | | | | | | | | | | | |
| | | | |
| | | Yield | | | | | | | | | | |
| Short-Term Investments: 9.90% | | | | | | | | | | | | | | | | |
| | | | |
| Investment Companies: 9.90% | | | | | | | | | | | | | | | | |
Securities Lending Cash Investment LLC (l)(r)(u) | | | 0.69 | | | | | | | | 10,081,201 | | | | 10,082,209 | |
Wells Fargo Government Money Market Fund Select Class (l)(u) | | | 0.32 | | | | | | | | 11,290,784 | | | | 11,290,784 | |
| | | | |
Total Short-Term Investments (Cost $21,372,203) | | | | | | | | | | | | | | | 21,372,993 | |
| | | | | | | | | | | | | | | | |
| | | | | | | | |
| Total investments in securities (Cost $201,524,342) * | | | 103.09 | % | | | 222,583,564 | |
Other assets and liabilities, net | | | (3.09 | ) | | | (6,663,750 | ) |
| | | | | | | | |
| Total net assets | | | 100.00 | % | | $ | 215,919,814 | |
| | | | | | | | |
The accompanying notes are an integral part of these financial statements.
| | | | | | |
| Portfolio of investments—October 31, 2016 | | Wells Fargo Global Opportunities Fund | | | 13 | |
| † | Non-income-earning security |
| « | All or a portion of this security is on loan. |
| (a) | The security is fair valued in accordance with procedures approved by the Board of Trustees. |
| (i) | Illiquid security for which the designation as illiquid is unaudited. |
| 144A | The security may be resold in transactions exempt from registration, normally to qualified institutional buyers, pursuant to Rule 144A under the Securities Act of 1933. |
| ± | Variable rate investment. The rate shown is the rate in effect at period end. |
| (l) | The issuer of the security is an affiliated person of the Fund as defined in the Investment Company Act of 1940. |
| (r) | The investment is a non-registered investment vehicle purchased with cash collateral received from securities on loan. |
| (u) | The rate represents the 7-day annualized yield at period end. |
| * | Cost for federal income tax purposes is $203,419,323 and unrealized gains (losses) consists of: |
| | | | |
Gross unrealized gains | | $ | 31,206,351 | |
Gross unrealized losses | | | (12,042,110 | ) |
| | | | |
Net unrealized gains | | $ | 19,164,241 | |
The accompanying notes are an integral part of these financial statements.
| | | | |
| 14 | | Wells Fargo Global Opportunities Fund | | Statement of assets and liabilities—October 31, 2016 |
| | | | |
| | | | |
| |
Assets | | | | |
Investments | | | | |
In unaffiliated securities (including $9,743,811 of securities loaned), at value (cost $180,152,139) | | $ | 201,210,571 | |
In affiliated securities, at value (cost $21,372,203) | | | 21,372,993 | |
| | | | |
Total investments, at value (cost $201,524,342) | | | 222,583,564 | |
Cash | | | 10,373 | |
Foreign currency, at value (cost $2,996,040) | | | 2,949,096 | |
Receivable for investments sold | | | 2,625,517 | |
Receivable for Fund shares sold | | | 291,259 | |
Receivable for dividends | | | 1,438,528 | |
Receivable for securities lending income | | | 19,645 | |
Prepaid expenses and other assets | | | 40,002 | |
| | | | |
Total assets | | | 229,957,984 | |
| | | | |
| |
Liabilities | | | | |
Payable for investments purchased | | | 3,075,273 | |
Payable for Fund shares redeemed | | | 500,163 | |
Payable upon receipt of securities loaned | | | 10,081,131 | |
Management fee payable | | | 175,032 | |
Distribution fees payable | | | 22,036 | |
Administration fees payable | | | 36,296 | |
Accrued expenses and other liabilities | | | 148,239 | |
| | | | |
Total liabilities | | | 14,038,170 | |
| | | | |
Total net assets | | $ | 215,919,814 | |
| | | | |
| |
NET ASSETS CONSIST OF | | | | |
Paid-in capital | | $ | 181,378,262 | |
Undistributed net investment income | | | 1,823,994 | |
Accumulated net realized gains on investments | | | 11,711,386 | |
Net unrealized gains on investments | | | 21,006,172 | |
| | | | |
Total net assets | | $ | 215,919,814 | |
| | | | |
| |
COMPUTATION OF NET ASSET VALUE AND OFFERING PRICE PER SHARE | | | | |
Net assets – Class A | | $ | 138,804,883 | |
Shares outstanding – Class A1 | | | 3,595,393 | |
Net asset value per share – Class A | | | $38.61 | |
Maximum offering price per share – Class A2 | | | $40.97 | |
Net assets – Class B | | $ | 888,332 | |
Shares outstanding – Class B1 | | | 30,860 | |
Net asset value per share – Class B | | | $28.79 | |
Net assets – Class C | | $ | 32,863,460 | |
Shares outstanding – Class C1 | | | 1,134,155 | |
Net asset value per share – Class C | | | $28.98 | |
Net assets – Administrator Class | | $ | 30,831,911 | |
Shares outstanding – Administrator Class1 | | | 767,945 | |
Net asset value per share – Administrator Class | | | $40.15 | |
Net assets – Institutional Class | | $ | 12,531,228 | |
Shares outstanding – Institutional Class1 | | | 312,692 | |
Net asset value per share – Institutional Class | | | $40.08 | |
| 1 | The Fund has an unlimited number of authorized shares. |
| 2 | Maximum offering price is computed as 100/94.25 of net asset value. On investments of $50,000 or more, the offering price is reduced. |
The accompanying notes are an integral part of these financial statements.
| | | | | | |
| Statement of operations—year ended October 31, 2016 | | Wells Fargo Global Opportunities Fund | | | 15 | |
| | | | |
| | | | |
| |
Investment income | | | | |
Dividends (net of foreign withholding taxes of $169,887) | | $ | 4,786,371 | |
Securities lending income, net | | | 158,334 | |
Income from affiliated securities | | | 33,040 | |
| | | | |
Total investment income | | | 4,977,745 | |
| | | | |
| |
Expenses | | | | |
Management fee | | | 2,073,309 | |
Administration fees | | | | |
Class A | | | 296,744 | |
Class B | | | 3,444 | |
Class C | | | 70,390 | |
Administrator Class | | | 39,634 | |
Institutional Class | | | 14,677 | |
Shareholder servicing fees | | | | |
Class A | | | 353,267 | |
Class B | | | 4,100 | |
Class C | | | 83,798 | |
Administrator Class | | | 75,726 | |
Distribution fees | | | | |
Class B | | | 12,300 | |
Class C | | | 251,393 | |
Custody and accounting fees | | | 96,568 | |
Professional fees | | | 65,813 | |
Registration fees | | | 68,676 | |
Shareholder report expenses | | | 46,898 | |
Trustees’ fees and expenses | | | 19,250 | |
Other fees and expenses | | | 16,811 | |
| | | | |
Total expenses | | | 3,592,798 | |
Less: Fee waivers and/or expense reimbursements | | | (39,180 | ) |
| | | | |
Net expenses | | | 3,553,618 | |
| | | | |
Net investment income | | | 1,424,127 | |
| | | | |
| |
REALIZED AND UNREALIZED GAINS (LOSSES) ON INVESTMENTS | | | | |
| |
Net realized gains on investments | | | 14,082,086 | |
| |
Net change in unrealized gains (losses) on: | | | | |
Unaffiliated securities | | | 2,224,835 | |
Affiiliated securities | | | 790 | |
| | | | |
Net change in unrealized gains (losses) on investments | | | 2,225,625 | |
| | | | |
Net realized and unrealized gains (losses) on investments | | | 16,307,711 | |
| | | | |
Net increase in net assets resulting from operations | | $ | 17,731,838 | |
| | | | |
The accompanying notes are an integral part of these financial statements.
| | | | |
| 16 | | Wells Fargo Global Opportunities Fund | | Statement of changes in net assets |
| | | | | | | | | | | | | | | | |
| | | Year ended
October 31, 2016 | | | Year ended
October 31, 2015 | |
| | | | |
Operations | | | | | | | | | | | | | | | | |
Net investment income | | | | | | $ | 1,424,127 | | | | | | | $ | 419,069 | |
Net realized gains on investments | | | | | | | 14,082,086 | | | | | | | | 10,609,101 | |
Net change in unrealized gains (losses) on investments | | | | | | | 2,225,625 | | | | | | | | (5,394,548 | ) |
| | | | |
Net increase in net assets resulting from operations | | | | | | | 17,731,838 | | | | | | | | 5,633,622 | |
| | | | |
| | | | |
Distributions to shareholders from | | | | | | | | | | | | | | | | |
Net investment income | | | | | | | | | | | | | | | | |
Class A | | | | | | | (886,928 | ) | | | | | | | (112,091 | ) |
Administrator Class | | | | | | | (231,280 | ) | | | | | | | (31,925 | ) |
Institutional Class | | | | | | | (115,938 | ) | | | | | | | (45,625 | ) |
Net realized gains | | | | | | | | | | | | | | | | |
Class A | | | | | | | (6,414,005 | ) | | | | | | | (25,688,232 | ) |
Class B | | | | | | | (179,734 | ) | | | | | | | (2,100,714 | ) |
Class C | | | | | | | (1,977,317 | ) | | | | | | | (7,981,435 | ) |
Administrator Class | | | | | | | (1,289,238 | ) | | | | | | | (5,573,313 | ) |
Institutional Class | | | | | | | (426,341 | ) | | | | | | | (1,170,657 | ) |
| | | | |
Total distributions to shareholders | | | | | | | (11,520,781 | ) | | | | | | | (42,703,992 | ) |
| | | | |
| | | | |
Capital share transactions | | | Shares | | | | | | | | Shares | | | | | |
Proceeds from shares sold | | | | | | | | | | | | | | | | |
Class A | | | 287,344 | | | | 10,463,647 | | | | 385,971 | | | | 14,800,661 | |
Class B | | | 67 | | | | 1,865 | | | | 2,614 | | | | 75,178 | |
Class C | | | 44,683 | | | | 1,201,168 | | | | 83,130 | | | | 2,405,203 | |
Administrator Class | | | 164,556 | | | | 6,297,087 | | | | 192,685 | | | | 7,651,580 | |
Institutional Class | | | 146,823 | | | | 5,639,061 | | | | 207,276 | | | | 8,364,650 | |
| | | | |
| | | | | | | 23,602,828 | | | | | | | | 33,297,272 | |
| | | | |
Reinvestment of distributions | | | | | | | | | | | | | | | | |
Class A | | | 196,310 | | | | 6,790,837 | | | | 656,362 | | | | 23,808,617 | |
Class B | | | 6,892 | | | | 177,539 | | | | 73,234 | | | | 2,024,915 | |
Class C | | | 63,376 | | | | 1,643,340 | | | | 236,312 | | | | 6,574,187 | |
Administrator Class | | | 41,455 | | | | 1,492,072 | | | | 146,011 | | | | 5,492,203 | |
Institutional Class | | | 11,643 | | | | 418,957 | | | | 21,540 | | | | 812,381 | |
| | | | |
| | | | | | | 10,522,745 | | | | | | | | 38,712,303 | |
| | | | |
Payment for shares redeemed | | | | | | | | | | | | | | | | |
Class A | | | (963,819 | ) | | | (34,320,655 | ) | | | (830,863 | ) | | | (31,796,199 | ) |
Class B | | | (125,178 | ) | | | (3,309,009 | ) | | | (267,575 | ) | | | (7,895,832 | ) |
Class C | | | (249,405 | ) | | | (6,823,638 | ) | | | (244,958 | ) | | | (7,212,225 | ) |
Administrator Class | | | (259,890 | ) | | | (9,801,894 | ) | | | (726,799 | ) | | | (30,614,585 | ) |
Institutional Class | | | (114,180 | ) | | | (4,457,864 | ) | | | (78,685 | ) | | | (3,130,872 | ) |
| | | | |
| | | | | | | (58,713,060 | ) | | | | | | | (80,649,713 | ) |
| | | | |
Net decrease in net assets resulting from capital share transactions | | | | | | | (24,587,487 | ) | | | | | | | (8,640,138 | ) |
| | | | |
Total decrease in net assets | | | | | | | (18,376,430 | ) | | | | | | | (45,710,508 | ) |
| | | | |
| | | | |
Net assets | | | | | | | | | | | | | | | | |
Beginning of period | | | | | | | 234,296,244 | | | | | | | | 280,006,752 | |
| | | | |
End of period | | | | | | $ | 215,919,814 | | | | | | | $ | 234,296,244 | |
| | | | |
Undistributed net investment income | | | | | | $ | 1,823,994 | | | | | | | $ | 1,188,486 | |
| | | | |
The accompanying notes are an integral part of these financial statements.
| | | | | | |
| Financial highlights | | Wells Fargo Global Opportunities Fund | | | 17 | |
(For a share outstanding throughout each period)
| | | | | | | | | | | | | | | | | | | | |
| | | Year ended October 31 | |
| CLASS A | | 2016 | | | 2015 | | | 2014 | | | 2013 | | | 2012 | |
Net asset value, beginning of period | | | $37.23 | | | | $43.26 | | | | $42.68 | | | | $33.17 | | | | $30.14 | |
Net investment income | | | 0.26 | 1 | | | 0.10 | 1 | | | 0.03 | 1 | | | 0.16 | 1 | | | 0.20 | 1 |
Net realized and unrealized gains (losses) on investments | | | 2.92 | | | | 0.64 | | | | 0.86 | | | | 9.58 | | | | 2.87 | |
| | | | | | | | | | | | | | | | | | | | |
Total from investment operations | | | 3.18 | | | | 0.74 | | | | 0.89 | | | | 9.74 | | | | 3.07 | |
Distributions to shareholders from | | | | | | | | | | | | | | | | | | | | |
Net investment income | | | (0.21 | ) | | | (0.03 | ) | | | (0.31 | ) | | | (0.23 | ) | | | (0.04 | ) |
Net realized gains | | | (1.59 | ) | | | (6.74 | ) | | | 0.00 | | | | 0.00 | | | | 0.00 | |
| | | | | | | | | | | | | | | | | | | | |
Total distributions to shareholders | | | (1.80 | ) | | | (6.77 | ) | | | (0.31 | ) | | | (0.23 | ) | | | (0.04 | ) |
Net asset value, end of period | | | $38.61 | | | | $37.23 | | | | $43.26 | | | | $42.68 | | | | $33.17 | |
Total return2 | | | 9.12 | % | | | 2.12 | % | | | 2.07 | % | | | 29.50 | % | | | 10.24 | % |
Ratios to average net assets (annualized) | | | | | | | | | | | | | | | | | | | | |
Gross expenses | | | 1.55 | % | | | 1.57 | % | | | 1.57 | % | | | 1.59 | % | | | 1.55 | % |
Net expenses | | | 1.55 | % | | | 1.55 | % | | | 1.55 | % | | | 1.55 | % | | | 1.54 | % |
Net investment income | | | 0.73 | % | | | 0.27 | % | | | 0.06 | % | | | 0.43 | % | | | 0.65 | % |
Supplemental data | | | | | | | | | | | | | | | | | | | | |
Portfolio turnover rate | | | 70 | % | | | 42 | % | | | 66 | % | | | 59 | % | | | 85 | % |
Net assets, end of period (000s omitted) | | | $138,805 | | | | $151,740 | | | | $167,166 | | | | $181,764 | | | | $156,433 | |
| 1 | Calculated based upon average shares outstanding |
| 2 | Total return calculations do not include any sales charges. |
The accompanying notes are an integral part of these financial statements.
| | | | |
| 18 | | Wells Fargo Global Opportunities Fund | | Financial highlights |
(For a share outstanding throughout each period)
| | | | | | | | | | | | | | | | | | | | |
| | | Year ended October 31 | |
| CLASS B | | 2016 | | | 2015 | | | 2014 | | | 2013 | | | 2012 | |
Net asset value, beginning of period | | | $28.21 | | | | $34.62 | | | | $34.18 | | | | $26.58 | | | | $24.30 | |
Net investment loss | | | (0.09 | )1 | | | (0.14 | )1 | | | (0.25 | )1 | | | (0.09 | )1 | | | (0.03 | )1 |
Net realized and unrealized gains (losses) on investments | | | 2.26 | | | | 0.47 | | | | 0.69 | | | | 7.69 | | | | 2.31 | |
| | | | | | | | | | | | | | | | | | | | |
Total from investment operations | | | 2.17 | | | | 0.33 | | | | 0.44 | | | | 7.60 | | | | 2.28 | |
Distributions to shareholders from | | | | | | | | | | | | | | | | | | | | |
Net realized gains | | | (1.59 | ) | | | (6.74 | ) | | | 0.00 | | | | 0.00 | | | | 0.00 | |
Net asset value, end of period | | | $28.79 | | | | $28.21 | | | | $34.62 | | | | $34.18 | | | | $26.58 | |
Total return2 | | | 8.32 | % | | | 1.34 | % | | | 1.29 | % | | | 28.54 | % | | | 9.42 | % |
Ratios to average net assets (annualized) | | | | | | | | | | | | | | | | | | | | |
Gross expenses | | | 2.31 | % | | | 2.32 | % | | | 2.32 | % | | | 2.34 | % | | | 2.30 | % |
Net expenses | | | 2.30 | % | | | 2.30 | % | | | 2.30 | % | | | 2.30 | % | | | 2.29 | % |
Net investment loss | | | (0.32 | )% | | | (0.49 | )% | | | (0.71 | )% | | | (0.32 | )% | | | (0.10 | )% |
Supplemental data | | | | | | | | | | | | | | | | | | | | |
Portfolio turnover rate | | | 70 | % | | | 42 | % | | | 66 | % | | | 59 | % | | | 85 | % |
Net assets, end of period (000s omitted) | | | $888 | | | | $4,206 | | | | $11,799 | | | | $19,446 | | | | $21,181 | |
| 1 | Calculated based upon average shares outstanding |
| 2 | Total return calculations do not include any sales charges. |
The accompanying notes are an integral part of these financial statements.
| | | | | | |
| Financial highlights | | Wells Fargo Global Opportunities Fund | | | 19 | |
(For a share outstanding throughout each period)
| | | | | | | | | | | | | | | | | | | | |
| | | Year ended October 31 | |
| CLASS C | | 2016 | | | 2015 | | | 2014 | | | 2013 | | | 2012 | |
Net asset value, beginning of period | | | $28.39 | | | | $34.80 | | | | $34.36 | | | | $26.73 | | | | $24.43 | |
Net investment loss | | | (0.01 | )1 | | | (0.14 | )1 | | | (0.24 | )1 | | | (0.09 | )1 | | | (0.03 | )1 |
Net realized and unrealized gains (losses) on investments | | | 2.19 | | | | 0.47 | | | | 0.69 | | | | 7.72 | | | | 2.33 | |
| | | | | | | | | | | | | | | | | | | | |
Total from investment operations | | | 2.18 | | | | 0.33 | | | | 0.45 | | | | 7.63 | | | | 2.30 | |
Distributions to shareholders from | | | | | | | | | | | | | | | | | | | | |
Net investment income | | | 0.00 | | | | 0.00 | | | | (0.01 | ) | | | 0.00 | | | | 0.00 | |
Net realized gains | | | (1.59 | ) | | | (6.74 | ) | | | 0.00 | | | | 0.00 | | | | 0.00 | |
| | | | | | | | | | | | | | | | | | | | |
Total distributions to shareholders | | | (1.59 | ) | | | (6.74 | ) | | | (0.01 | ) | | | 0.00 | | | | 0.00 | |
Net asset value, end of period | | | $28.98 | | | | $28.39 | | | | $34.80 | | | | $34.36 | | | | $26.73 | |
Total return2 | | | 8.31 | % | | | 1.34 | % | | | 1.32 | % | | | 28.54 | % | | | 9.41 | % |
Ratios to average net assets (annualized) | | | | | | | | | | | | | | | | | | | | |
Gross expenses | | | 2.30 | % | | | 2.32 | % | | | 2.32 | % | | | 2.34 | % | | | 2.30 | % |
Net expenses | | | 2.30 | % | | | 2.30 | % | | | 2.30 | % | | | 2.30 | % | | | 2.29 | % |
Net investment loss | | | (0.02 | )% | | | (0.48 | )% | | | (0.69 | )% | | | (0.31 | )% | | | (0.11 | )% |
Supplemental data | | | | | | | | | | | | | | | | | | | | |
Portfolio turnover rate | | | 70 | % | | | 42 | % | | | 66 | % | | | 59 | % | | | 85 | % |
Net assets, end of period (000s omitted) | | | $32,863 | | | | $36,215 | | | | $41,792 | | | | $44,618 | | | | $37,753 | |
| 1 | Calculated based upon average shares outstanding |
| 2 | Total return calculations do not include any sales charges. |
The accompanying notes are an integral part of these financial statements.
| | | | |
| 20 | | Wells Fargo Global Opportunities Fund | | Financial highlights |
(For a share outstanding throughout each period)
| | | | | | | | | | | | | | | | | | | | |
| | | Year ended October 31 | |
| ADMINISTRATOR CLASS | | 2016 | | | 2015 | | | 2014 | | | 2013 | | | 2012 | |
Net asset value, beginning of period | | | $38.65 | | | | $44.60 | | | | $44.00 | | | | $34.21 | | | | $31.10 | |
Net investment income | | | 0.41 | | | | 0.16 | 1 | | | 0.09 | | | | 0.22 | 1 | | | 0.26 | 1 |
Net realized and unrealized gains (losses) on investments | | | 2.95 | | | | 0.66 | | | | 0.90 | | | | 9.86 | | | | 2.96 | |
| | | | | | | | | | | | | | | | | | | | |
Total from investment operations | | | 3.36 | | | | 0.82 | | | | 0.99 | | | | 10.08 | | | | 3.22 | |
Distributions to shareholders from | | | | | | | | | | | | | | | | | | | | |
Net investment income | | | (0.27 | ) | | | (0.03 | ) | | | (0.39 | ) | | | (0.29 | ) | | | (0.11 | ) |
Net realized gains | | | (1.59 | ) | | | (6.74 | ) | | | 0.00 | | | | 0.00 | | | | 0.00 | |
| | | | | | | | | | | | | | | | | | | | |
Total distributions to shareholders | | | (1.86 | ) | | | (6.77 | ) | | | (0.39 | ) | | | (0.29 | ) | | | (0.11 | ) |
Net asset value, end of period | | | $40.15 | | | | $38.65 | | | | $44.60 | | | | $44.00 | | | | $34.21 | |
Total return | | | 9.30 | % | | | 2.27 | % | | | 2.22 | % | | | 29.73 | % | | | 10.44 | % |
Ratios to average net assets (annualized) | | | | | | | | | | | | | | | | | | | | |
Gross expenses | | | 1.47 | % | | | 1.43 | % | | | 1.41 | % | | | 1.42 | % | | | 1.38 | % |
Net expenses | | | 1.40 | % | | | 1.40 | % | | | 1.40 | % | | | 1.40 | % | | | 1.38 | % |
Net investment income | | | 0.90 | % | | | 0.41 | % | | | 0.22 | % | | | 0.58 | % | | | 0.81 | % |
Supplemental data | | | | | | | | | | | | | | | | | | | | |
Portfolio turnover rate | | | 70 | % | | | 42 | % | | | 66 | % | | | 59 | % | | | 85 | % |
Net assets, end of period (000s omitted) | | | $30,832 | | | | $31,765 | | | | $53,966 | | | | $52,461 | | | | $44,360 | |
| 1 | Calculated based upon average shares outstanding |
The accompanying notes are an integral part of these financial statements.
| | | | | | |
| Financial highlights | | Wells Fargo Global Opportunities Fund | | | 21 | |
(For a share outstanding throughout each period)
| | | | | | | | | | | | | | | | | | | | |
| | | Year ended October 31 | |
| INSTITUTIONAL CLASS | | 2016 | | | 2015 | | | 2014 | | | 2013 | | | 2012 | |
Net asset value, beginning of period | | | $38.63 | | | | $44.67 | | | | $44.05 | | | | $34.25 | | | | $31.18 | |
Net investment income | | | 0.45 | | | | 0.20 | | | | 0.15 | | | | 0.32 | 1 | | | 0.36 | 1 |
Net realized and unrealized gains (losses) on investments | | | 3.00 | | | | 0.72 | | | | 0.96 | | | | 9.86 | | | | 2.93 | |
| | | | | | | | | | | | | | | | | | | | |
Total from investment operations | | | 3.45 | | | | 0.92 | | | | 1.11 | | | | 10.18 | | | | 3.29 | |
Distributions to shareholders from | | | | | | | | | | | | | | | | | | | | |
Net investment income | | | (0.41 | ) | | | (0.22 | ) | | | (0.49 | ) | | | (0.38 | ) | | | (0.22 | ) |
Net realized gains | | | (1.59 | ) | | | (6.74 | ) | | | 0.00 | | | | 0.00 | | | | 0.00 | |
| | | | | | | | | | | | | | | | | | | | |
Total distributions to shareholders | | | (2.00 | ) | | | (6.96 | ) | | | (0.49 | ) | | | (0.38 | ) | | | (0.22 | ) |
Net asset value, end of period | | | $40.08 | | | | $38.63 | | | | $44.67 | | | | $44.05 | | | | $34.25 | |
Total return | | | 9.56 | % | | | 2.53 | % | | | 2.48 | % | | | 30.06 | % | | | 10.70 | % |
Ratios to average net assets (annualized) | | | | | | | | | | | | | | | | | | | | |
Gross expenses | | | 1.22 | % | | | 1.18 | % | | | 1.14 | % | | | 1.16 | % | | | 1.12 | % |
Net expenses | | | 1.15 | % | | | 1.15 | % | | | 1.14 | % | | | 1.15 | % | | | 1.12 | % |
Net investment income | | | 1.20 | % | | | 0.66 | % | | | 0.47 | % | | | 0.83 | % | | | 1.13 | % |
Supplemental data | | | | | | | | | | | | | | | | | | | | |
Portfolio turnover rate | | | 70 | % | | | 42 | % | | | 66 | % | | | 59 | % | | | 85 | % |
Net assets, end of period (000s omitted) | | | $12,531 | | | | $10,369 | | | | $5,284 | | | | $2,151 | | | | $1,263 | |
| 1 | Calculated based upon average shares outstanding |
The accompanying notes are an integral part of these financial statements.
| | | | |
| 22 | | Wells Fargo Global Opportunities Fund | | Notes to financial statements |
1. ORGANIZATION
Wells Fargo Funds Trust (the “Trust”), a Delaware statutory trust organized on March 10, 1999, is an open-end management investment company registered under the Investment Company Act of 1940, as amended (the “1940 Act”). As an investment company, the Trust follows the accounting and reporting guidance in Financial Accounting Standards Board (“FASB”) Accounting Standards Codification Topic 946, Financial Services – Investment Companies. These financial statements report on the Wells Fargo Global Opportunities Fund (the “Fund”) which is a diversified series of the Trust.
2. SIGNIFICANT ACCOUNTING POLICIES
The following significant accounting policies, which are consistently followed in the preparation of the financial statements of the Fund, are in conformity with U.S. generally accepted accounting principles which require management to make estimates and assumptions that affect the reported amounts of assets and liabilities, disclosure of contingent assets and liabilities at the date of the financial statements, and the reported amounts of revenues and expenses during the reporting period. Actual results could differ from those estimates.
Securities valuation
All investments are valued each business day as of the close of regular trading on the New York Stock Exchange (generally 4 p.m. Eastern Time), although the Fund may deviate from this calculation time under unusual or unexpected circumstances.
Equity securities that are listed on a foreign or domestic exchange or market are valued at the official closing price or, if none, the last sales price. If no sale occurs on the principal exchange or market that day, the prior day’s price will be deemed “stale” and a fair value price will be determined in accordance with the Fund’s Valuation Procedures.
The values of securities denominated in foreign currencies are translated into U.S. dollars at rates provided by an independent foreign currency pricing source at a time each business day specified by the Management Valuation Team of Wells Fargo Funds Management, LLC (“Funds Management”).
Many securities markets and exchanges outside the U.S. close prior to the close of the New York Stock Exchange and therefore may not fully reflect trading or events that occur after the close of the principal exchange in which the foreign securities are traded, but before the close of the New York Stock Exchange. If such trading or events are expected to materially affect the value of such securities, then fair value pricing procedures approved by the Board of Trustees of the Fund are applied. These procedures take into account multiple factors including movements in U.S. securities markets after foreign exchanges close. Foreign securities that are fair valued under these procedures are categorized as Level 2 and the application of these procedures may result in transfers between Level 1 and Level 2. Depending on market activity, such fair valuations may be frequent. Such fair value pricing may result in net asset values that are higher or lower than net asset values based on the last reported sales price or latest quoted bid price. On October 31, 2016, such fair value pricing was not used in pricing foreign securities.
Investments in registered open-end investment companies are valued at net asset value. Interests in non-registered investment vehicles that are redeemable at net asset value are fair valued normally at net asset value.
Investments which are not valued using any of the methods discussed above are valued at their fair value, as determined in good faith by the Board of Trustees. The Board of Trustees has established a Valuation Committee comprised of the Trustees and has delegated to it the authority to take any actions regarding the valuation of portfolio securities that the Valuation Committee deems necessary or appropriate, including determining the fair value of portfolio securities, unless the determination has been delegated to the Management Valuation Team. The Board of Trustees retains the authority to make or ratify any valuation decisions or approve any changes to the Valuation Procedures as it deems appropriate. On a quarterly basis, the Board of Trustees receives reports on any valuation actions taken by the Valuation Committee or the Management Valuation Team which may include items for ratification.
Valuations of fair valued securities are compared to the next actual sales price when available, or other appropriate market values, to assess the continued appropriateness of the fair valuation methodologies used. These securities are fair valued on a day-to-day basis, taking into consideration changes to appropriate market information and any significant changes to the inputs considered in the valuation process until there is a readily available price provided on an exchange or by an independent pricing service. Valuations received from an independent pricing service or independent broker-dealer quotes are periodically validated by comparisons to most recent trades and valuations provided by other independent pricing services in addition to the review of prices by the manager and/or subadviser. Unobservable inputs used in determining fair valuations are identified based on the type of security, taking into consideration factors utilized by market participants in valuing the investment, knowledge about the issuer and the current market environment.
| | | | | | |
| Notes to financial statements | | Wells Fargo Global Opportunities Fund | | | 23 | |
Foreign currency translation
The accounting records of the Fund are maintained in U.S. dollars. The values of other assets and liabilities denominated in foreign currencies are translated into U.S. dollars at rates provided by an independent foreign currency pricing source at a time each business day specified by the Management Valuation Team. Purchases and sales of securities, and income and expenses are converted at the rate of exchange on the respective dates of such transactions. Net realized foreign exchange gains or losses arise from sales of foreign currencies, currency gains or losses realized between the trade and settlement dates on securities transactions, and the difference between the amounts of dividends, interest and foreign withholding taxes recorded and the U.S. dollar equivalent of the amounts actually paid or received. Net unrealized foreign exchange gains and losses arise from changes in the fair value of assets and liabilities other than investments in securities resulting from changes in exchange rates. The changes in net assets arising from changes in exchange rates and the changes in net assets resulting from changes in market prices of securities are not separately presented. Such changes are included in net realized and unrealized gains or losses from investments.
Forward foreign currency contracts
The Fund is subject to foreign currency exchange rate risk in the normal course of pursuing its investment objectives. A forward foreign currency contract is an agreement between two parties to purchase or sell a specific currency for an agreed-upon price at a future date. The Fund enters into forward foreign currency contracts to facilitate transactions in foreign-denominated securities and to attempt to minimize the risk to the Fund from adverse changes in the relationship between currencies. Forward foreign currency contracts are recorded at the forward rate and marked-to-market daily. When the contracts are closed, realized gains and losses arising from such transactions are recorded as realized gains or losses on forward foreign currency contract transactions. The Fund could be exposed to risks if the counterparties to the contracts are unable to meet the terms of their contracts or if the value of the foreign currency changes unfavorably. The Fund’s maximum risk of loss from counterparty credit risk is the unrealized gains on the contracts. This risk may be mitigated if there is a master netting arrangement between the Fund and the counterparty.
Security loans
The Fund may lend its securities from time to time in order to earn additional income in the form of fees or interest on securities received as collateral or the investment of any cash received as collateral. The Fund continues to receive interest or dividends on the securities loaned. The Fund receives collateral in the form of cash or securities with a value at least equal to the value of the securities on loan. The value of the loaned securities is determined at the close of each business day and any additional required collateral is delivered to the Fund on the next business day. In a securities lending transaction, the net asset value of the Fund will be affected by an increase or decrease in the value of the securities loaned and by an increase or decrease in the value of the instrument in which collateral is invested. The amount of securities lending activity undertaken by the Fund fluctuates from time to time. In the event of default or bankruptcy by the borrower, the Fund may be prevented from recovering the loaned securities or gaining access to the collateral or may experience delays or costs in doing so. In addition, the investment of any cash collateral received may lose all or part of its value. The Fund has the right under the lending agreement to recover the securities from the borrower on demand.
The Fund lends its securities through an unaffiliated securities lending agent. Cash collateral received in connection with its securities lending transactions is invested in Securities Lending Cash Investments, LLC (the “Securities Lending Fund”). The Securities Lending Fund is exempt from registration under Section 3(c)(7) of the 1940 Act and is managed by Funds Management and is subadvised by Wells Capital Management Incorporated (“WellsCap”), an affiliate of Funds Management and an indirect wholly owned subsidiary of Wells Fargo & Company (“Wells Fargo”). Funds Management receives an advisory fee starting at 0.05% and declining to 0.01% as the average daily net assets of the Securities Lending Fund increase. All of the fees received by Funds Management are paid to WellsCap for its services as subadviser. The Securities Lending Fund seeks to provide a positive return compared to the daily Fed Funds Open Rate by investing in high-quality, U.S. dollar-denominated short-term money market instruments. Securities Lending Fund investments are valued at the evaluated bid price provided by an independent pricing service. Income earned from investment in the Securities Lending Fund is included in securities lending income on the Statement of Operations.
Security transactions and income recognition
Securities transactions are recorded on a trade date basis. Realized gains or losses are recorded on the basis of identified cost.
Dividend income is recognized on the ex-dividend date, except for certain dividends from foreign securities, which are recorded as soon as the custodian verifies the ex-dividend date. Dividend income from foreign securities is recorded net of foreign taxes withheld where recovery of such taxes is not assured.
| | | | |
| 24 | | Wells Fargo Global Opportunities Fund | | Notes to financial statements |
Distributions to shareholders
Distributions to shareholders from net investment income and net realized gains, if any, are recorded on the ex-dividend date. Such distributions are determined in conformity with federal income tax regulations, which may differ in amount or character from net investment income and realized gains recognized for purposes of U.S. generally accepted accounting principles.
Federal and other taxes
The Fund intends to continue to qualify as a regulated investment company by distributing substantially all of its investment company taxable income and any net realized capital gains (after reduction for capital loss carryforwards) sufficient to relieve it from all, or substantially all, federal income taxes. Accordingly, no provision for federal income taxes was required.
The Fund’s income and federal excise tax returns and all financial records supporting those returns for the prior three fiscal years are subject to examination by the federal and Delaware revenue authorities. Management has analyzed the Fund’s tax positions taken on federal, state, and foreign tax returns for all open tax years and does not believe that there are any uncertain tax positions that require recognition of a tax liability.
Reclassifications are made to the Fund’s capital accounts for permanent tax differences to reflect income and gains available for distribution (or available capital loss carryforwards) under federal income tax regulations. U.S. generally accepted accounting principles require that certain components of net assets be adjusted to reflect permanent differences between financial and tax reporting. These reclassifications have no effect on net assets or net asset values per share. The primary permanent differences causing such reclassifications are due to foreign currency transactions and passive foreign investment companies. At October 31, 2016, as a result of permanent book-to-tax differences, the following reclassification adjustments were made on the Statement of Assets and Liabilities:
| | |
Undistributed net
investment income | | Accumulated net
realized gains
on investments |
| $445,527 | | $(445,527) |
Class allocations
The separate classes of shares offered by the Fund differ principally in applicable sales charges, distribution, shareholder servicing, and administration fees. Class specific expenses are charged directly to that share class. Investment income, common expenses, and realized and unrealized gains (losses) on investments are allocated daily to each class of shares based on the relative proportion of net assets of each class.
3. FAIR VALUATION MEASUREMENTS
Fair value measurements of investments are determined within a framework that has established a fair value hierarchy based upon the various data inputs utilized in determining the value of the Fund’s investments. The three-level hierarchy gives the highest priority to unadjusted quoted prices in active markets for identical assets or liabilities (Level 1) and the lowest priority to significant unobservable inputs (Level 3). The Fund’s investments are classified within the fair value hierarchy based on the lowest level of input that is significant to the fair value measurement. The inputs are summarized into three broad levels as follows:
| ∎ | | Level 1 – quoted prices in active markets for identical securities |
| ∎ | | Level 2 – other significant observable inputs (including quoted prices for similar securities, interest rates, prepayment speeds, credit risk, use of amortized cost, etc.) |
| ∎ | | Level 3 – significant unobservable inputs (including the Fund’s own assumptions in determining the fair value of investments) |
The inputs or methodologies used for valuing investments in securities are not necessarily an indication of the risk associated with investing in those securities.
| | | | | | |
| Notes to financial statements | | Wells Fargo Global Opportunities Fund | | | 25 | |
The following is a summary of the inputs used in valuing the Fund’s assets and liabilities as of October 31, 2016:
| | | | | | | | | | | | | | | | |
| | | Quoted prices
(Level 1) | | | Other significant
observable inputs
(Level 2) | | | Significant
unobservable inputs (Level 3) | | | Total | |
Assets | | | | | | | | | | | | | | | | |
Investments in: | | | | | | | | | | | | | | | | |
| | | | |
Common stocks | | | | | | | | | | | | | | | | |
Australia | | $ | 1,367,363 | | | $ | 0 | | | $ | 0 | | | $ | 1,367,363 | |
Austria | | | 946,140 | | | | 0 | | | | 0 | | | | 946,140 | |
Canada | | | 15,873,394 | | | | 0 | | | | 1,879 | | | | 15,875,273 | |
China | | | 0 | | | | 0 | | | | 452,364 | | | | 452,364 | |
Finland | | | 1,319,873 | | | | 0 | | | | 0 | | | | 1,319,873 | |
France | | | 6,328,429 | | | | 0 | | | | 0 | | | | 6,328,429 | |
Germany | | | 9,157,790 | | | | 0 | | | | 0 | | | | 9,157,790 | |
Hong Kong | | | 1,782,465 | | | | 0 | | | | 0 | | | | 1,782,465 | |
Ireland | | | 672,144 | | | | 0 | | | | 0 | | | | 672,144 | |
Israel | | | 1,696,800 | | | | 0 | | | | 0 | | | | 1,696,800 | |
Italy | | | 4,916,475 | | | | 0 | | | | 0 | | | | 4,916,475 | |
Japan | | | 21,036,250 | | | | 0 | | | | 0 | | | | 21,036,250 | |
Netherlands | | | 769,873 | | | | 0 | | | | 0 | | | | 769,873 | |
Norway | | | 492,281 | | | | 0 | | | | 0 | | | | 492,281 | |
Spain | | | 5,403,769 | | | | 0 | | | | 0 | | | | 5,403,769 | |
Sweden | | | 914,943 | | | | 0 | | | | 0 | | | | 914,943 | |
Switzerland | | | 3,101,948 | | | | 0 | | | | 0 | | | | 3,101,948 | |
United Kingdom | | | 20,537,534 | | | | 0 | | | | 0 | | | | 20,537,534 | |
United States | | | 103,050,597 | | | | 0 | | | | 0 | | | | 103,050,597 | |
| | | | |
Preferred stocks | | | | | | | | | | | | | | | | |
Germany | | | 1,388,260 | | | | 0 | | | | 0 | | | | 1,388,260 | |
| | | | |
Short-term investments | | | | | | | | | | | | | | | | |
Investment companies | | | 11,290,784 | | | | 0 | | | | 0 | | | | 11,290,784 | |
Investments measured at net asset value* | | | | | | | | | | | | | | | 10,082,209 | |
Total assets | | $ | 212,047,112 | | | $ | 0 | | | $ | 454,243 | | | $ | 222,583,564 | |
| * | Investments that are measured at fair value using the net asset value per share (or its equivalent) as a practical expedient have not been categorized in the fair value hierarchy. The fair value amount presented in the table is intended to permit reconciliation of the fair value hierarchy to the amounts presented in the Statement of Assets and Liabilities. The Fund’s investment in Securities Lending Cash Investments, LLC valued at $10,082,209 does not have a redemption period notice, can be redeemed daily and does not have any unfunded commitments. |
The Fund recognizes transfers between levels within the fair value hierarchy at the end of the reporting period. Fair value pricing that was used in pricing certain foreign securities at the previous period end was not used at October 31, 2016. As a result, common stocks valued at $51,457,013 and preferred stocks valued at $1,388,260 were transferred from Level 2 to Level 1 within the fair value hierarchy. The Fund had no material transfers into/out of Level 3.
4. TRANSACTIONS WITH AFFILIATES
Management fee
Funds Management, an indirect wholly owned subsidiary of Wells Fargo, is the manager of the Fund and provides advisory and fund-level administrative services under an investment management agreement. Under the investment management agreement, Funds Management is responsible for, among other services, implementing the investment objectives and strategies of the Fund, supervising the subadviser, providing fund-level administrative services in connection with the Fund’s operations, and providing any other fund-level administrative services reasonably necessary for the operation of the Fund. As compensation for its services under the investment management agreement, Funds Management is entitled to receive an annual management fee starting at 0.95% and declining to 0.83% as the average daily net assets of the Fund increase. For the year ended October 31, 2016, the management fee was equivalent to an annual rate of 0.95% of the Fund’s average daily net assets.
| | | | |
| 26 | | Wells Fargo Global Opportunities Fund | | Notes to financial statements |
Funds Management has retained the services of a subadviser to provide daily portfolio management to the Fund. The fee for subadvisory services is borne by Funds Management. WellsCap is the subadviser to the Fund and is entitled to receive a fee from Funds Management at an annual rate starting at 0.55% and declining to 0.40% as the average daily net assets of the Fund increase.
Administration fees
Under a class-level administration agreement, Funds Management provides class-level administrative services to the Fund, which includes paying fees and expenses for services provided by the transfer agent, sub-transfer agents, omnibus account servicers and record-keepers. As compensation for its services under the class-level administration agreement, Funds Management receives an annual fee which is calculated based on the average daily net assets of each class as follows:
| | | | |
| | | Class-level
administration fee | |
Class A, Class B, Class C | | | 0.21 | % |
Administrator Class, Institutional Class | | | 0.13 | |
Funds Management has contractually waived and/or reimbursed management and administration fees to the extent necessary to maintain certain net operating expense ratios for the Fund. Waiver of fees and/or reimbursement of expenses by Funds Management were made first from fund level expenses on a proportionate basis and then from class specific expenses. Funds Management has committed through February 28, 2017 to waive fees and/or reimburse expenses to the extent necessary to cap the Fund’s expenses at 1.55% for Class A shares, 2.30% for Class B shares, 2.30% for Class C shares, 1.40% for Administrator Class shares, and 1.15% for Institutional Class shares. After this time, the cap may be increased or the commitment to maintain the cap may be terminated only with the approval of the Board of Trustees.
Distribution fees
The Trust has adopted a distribution plan for Class B and Class C shares of the Fund pursuant to Rule 12b-1 under the 1940 Act. Distribution fees are charged to Class B and Class C shares and paid to Wells Fargo Funds Distributor, LLC (“Funds Distributor”), the principal underwriter, at an annual rate of 0.75% of the average daily net assets of Class B and Class C shares.
In addition, Funds Distributor is entitled to receive the front-end sales charge from the purchase of Class A shares and a contingent deferred sales charge on the redemption of certain Class A shares. Funds Distributor is also entitled to receive the contingent deferred sales charges from redemptions of Class B and Class C shares. For the year ended October 31, 2016, Funds Distributor received $4,525 from the sale of Class A shares.
Shareholder servicing fees
The Trust has entered into contracts with one or more shareholder servicing agents, whereby Class A, Class B, Class C, and Administrator Class of the Fund are charged a fee at an annual rate of 0.25% of the average daily net assets of each respective class.
A portion of these total shareholder servicing fees were paid to affiliates of Wells Fargo.
5. INVESTMENT PORTFOLIO TRANSACTIONS
Purchases and sales of investments, excluding U.S. government obligations (if any) and short-term securities, for the year ended October 31, 2016 were $146,423,567 and $174,518,793, respectively.
The Fund may purchase or sell investment securities to other Wells Fargo funds under procedures adopted by the Board of Trustees. The procedures have been designed to ensure that these interfund transactions, which generally do not incur broker commissions, are effected at current market prices. Interfund trades are included within the respective purchases and sales amounts shown.
6. BANK BORROWINGS
The Trust (excluding the money market funds and certain other funds) and Wells Fargo Variable Trust are parties to a $250,000,000 revolving credit agreement whereby the Fund is permitted to use bank borrowings for temporary or emergency purposes, such as to fund shareholder redemption requests. Interest under the credit agreement is charged to the Fund based on a borrowing rate equal to the higher of the Federal Funds rate in effect on that day plus 1.25% or the overnight LIBOR rate in effect on that day plus 1.25%. In addition, an annual commitment fee equal to 0.25% of the unused balance is allocated to each participating fund. Prior to August 30, 2016, the revolving credit agreement amount was $200,000,000 and the annual commitment fee was equal to 0.20% of the unused balance which was allocated to each participating fund.
| | | | | | |
| Notes to financial statements | | Wells Fargo Global Opportunities Fund | | | 27 | |
For the year ended October 31, 2016, there were no borrowings by the Fund under the agreement.
7. DISTRIBUTIONS TO SHAREHOLDERS
The tax character of distributions paid during the years ended October 31, 2016 and October 31, 2015 were as follows:
| | | | | | | | |
| | | Year ended October 31 | |
| | | 2016 | | | 2015 | |
Ordinary income | | $ | 1,234,146 | | | $ | 9,467,443 | |
Long-term capital gain | | | 10,286,635 | | | | 33,236,549 | |
As of October 31, 2016, the components of distributable earnings on a tax basis were as follows:
| | | | |
Undistributed
ordinary
income | | Undistributed
long-term
gain | | Unrealized
gains |
| $4,472,360 | | $10,965,608 | | $19,111,007 |
8. INDEMNIFICATION
Under the Trust’s organizational documents, the officers and Trustees have been granted certain indemnification rights against certain liabilities that may arise out of performance of their duties to the Trust. Additionally, in the normal course of business, the Trust may enter into contracts with service providers that contain a variety of indemnification clauses. The Trust’s maximum exposure under these arrangements is dependent on future claims that may be made against the Fund and, therefore, cannot be estimated.
9. REGULATORY CHANGES
In October 2016, the Securities and Exchange Commission (“SEC”) adopted new rules and forms and amended existing rules and forms (together, “final rules”) intended to modernize and enhance the reporting and disclosure of information by registered investment companies and to enhance liquidity risk management by open-end mutual funds and exchange-traded funds. The final rules will enhance the quality of information available to investors and will allow the SEC to more effectively collect and use data reported by funds. In part, the final rules amend Regulation S-X and require standardized, enhanced disclosure about derivatives in the Fund’s financial statements, as well as other amendments. The compliance date for the amendments to Regulation S-X is August 1, 2017 while the compliance date for the new form types is June 1, 2018 and the compliance date for the liquidity risk management program requirements is December 1, 2018. Management is currently assessing the potential impact of these enhancements and their impact on the financial statement disclosures and reporting requirements.
10. SUBSEQUENT DISTRIBUTIONS
On December 9, 2016, the Fund declared distributions from short-term capital gains and long-term capital gains to shareholders of record on December 8, 2016. The per share amounts payable on December 12, 2016 were as follows:
| | | | | | | | |
| | | Short-term capital gains | | | Long-term capital gains | |
Class A | | | $0.45599 | | | | $1.89348 | |
Class B | | | 0.45599 | | | | 1.89348 | |
Class C | | | 0.45599 | | | | 1.89348 | |
Administrator Class | | | 0.45599 | | | | 1.89348 | |
Institutional Class | | | 0.45599 | | | | 1.89348 | |
These distributions are not reflected in the accompanying financial statements. The final determination of the source of all distributions is subject to change and made after the Fund’s tax year-end.
| | | | |
| 28 | | Wells Fargo Global Opportunities Fund | | Report of independent registered public accounting firm |
BOARD OF TRUSTEES AND SHAREHOLDERS OF WELLS FARGO FUNDS TRUST:
We have audited the accompanying statement of assets and liabilities, including the portfolio of investments, of the Wells Fargo Global Opportunities Fund (the “Fund”), one of the funds constituting the Wells Fargo Funds Trust, as of October 31, 2016, and the related statement of operations for the year then ended, the statements of changes in net assets for each of the years in the two-year period then ended, and the financial highlights for each of the years in the five-year period then ended. These financial statements and financial highlights are the responsibility of the Fund’s management. Our responsibility is to express an opinion on these financial statements and financial highlights based on our audits.
We conducted our audits in accordance with the standards of the Public Company Accounting Oversight Board (United States). Those standards require that we plan and perform the audit to obtain reasonable assurance about whether the financial statements and financial highlights are free of material misstatement. An audit includes examining, on a test basis, evidence supporting the amounts and disclosures in the financial statements. Our procedures included confirmation of securities owned as of October 31, 2016, by correspondence with the custodian and brokers, or by other appropriate auditing procedures. An audit also includes assessing the accounting principles used and significant estimates made by management, as well as evaluating the overall financial statement presentation. We believe that our audits provide a reasonable basis for our opinion.
In our opinion, the financial statements and financial highlights referred to above present fairly, in all material respects, the financial position of the Wells Fargo Global Opportunities Fund as of October 31, 2016 the results of its operations for the year then ended, the changes in its net assets for each of the years in the two-year period then ended, and the financial highlights for each of the years in the five-year period then ended, in conformity with U.S. generally accepted accounting principles.

Boston, Massachusetts
December 22, 2016
| | | | | | |
| Other information (unaudited) | | Wells Fargo Global Opportunities Fund | | | 29 | |
TAX INFORMATION
For corporate shareholders, pursuant to Section 854 of the Internal Revenue Code, 97.88% of ordinary income dividends qualify for the corporate dividends-received deduction for the fiscal year ended October 31, 2016.
Pursuant to Section 852 of the Internal Revenue Code, $10,286,635 was designated as a 20% rate gain distribution for the fiscal year ended October 31, 2016.
Pursuant to Section 854 of the Internal Revenue Code, $1,231,168 of income dividends paid during the fiscal year ended October 31, 2016 has been designated as qualified dividend income (QDI).
PROXY VOTING INFORMATION
A description of the policies and procedures that the Fund uses to determine how to vote proxies relating to portfolio securities is available, upon request, by calling 1-800-222-8222, visiting our website at wellsfargofunds.com, or visiting the SEC website at sec.gov. Information regarding how the Fund voted proxies relating to portfolio securities during the most recent 12-month period ended June 30 is available on the Fund’s website at wellsfargofunds.com or by visiting the SEC website at sec.gov.
PORTFOLIO HOLDINGS INFORMATION
The complete portfolio holdings for the Fund are publicly available monthly on the Fund’s website (wellsfargofunds.com), on a one-month delayed basis. In addition, top ten holdings information (excluding derivative positions) for the Fund is publicly available on the Fund’s website on a monthly, seven-day or more delayed basis. The Fund files its complete schedule of portfolio holdings with the SEC for the first and third quarters of each fiscal year on Form N-Q, which is available by visiting the SEC website at sec.gov. In addition, the Fund’s Form N-Q may be reviewed and copied at the SEC’s Public Reference Room in Washington, DC, and at regional offices in New York City, at 233 Broadway, and in Chicago, at 175 West Jackson Boulevard, Suite 900. Information about the Public Reference Room may be obtained by calling 1-800-SEC-0330.
| | | | |
| 30 | | Wells Fargo Global Opportunities Fund | | Other information (unaudited) |
BOARD OF TRUSTEES AND OFFICERS
Each of the Trustees and Officers1 listed in the table below acts in identical capacities for each fund in the Wells Fargo family of funds, which consists of 139 mutual funds comprising the Wells Fargo Funds Trust, Wells Fargo Variable Trust, Wells Fargo Master Trust and four closed-end funds (collectively the “Fund Complex”). This table should be read in conjunction with the Prospectus and the Statement of Additional Information2. The mailing address of each Trustee and Officer is 525 Market Street, 12th Floor, San Francisco, CA 94105. Each Trustee and Officer serves an indefinite term, however, each Trustee serves such term until reaching the mandatory retirement age established by the Trustees.
Independent Trustees
| | | | | | |
Name and
year of birth | | Position held and
length of service* | | Principal occupations during past five years or longer | | Current other
public company or
investment company
directorships |
William R. Ebsworth (Born 1957) | | Trustee, since 2015 | | Retired. From 1984 to 2013, equities analyst, portfolio manager, research director and chief financial officer at Fidelity Management and Research Company in Boston, Tokyo, and Hong Kong and retired in 2013 as Chief Investment Officer of Fidelity Strategic Advisers, Inc. where he lead a team of investment professionals managing client assets. Prior thereto, Board member of Hong Kong Securities Clearing Co., Hong Kong Options Clearing Corp., the Thailand International Fund, Ltd., Fidelity Investments Life Insurance Company, and Empire Fidelity Investments Life Insurance Company. Mr. Ebsworth is a CFA® charterholder and an Adjunct Lecturer, Finance, at Babson College. | | Asset Allocation Trust |
Jane A. Freeman (Born 1953) | | Trustee, since 2015 | | Retired. From 2012 to 2014 and 1999 to 2008, Chief Financial Officer of Scientific Learning Corporation. From 2008 to 2012, Ms. Freeman provided consulting services related to strategic business projects. Prior to 1999, Portfolio Manager at Rockefeller & Co. and Scudder, Stevens & Clark. Board member of the Harding Loevner Funds from 1996 to 2014, serving as both Lead Independent Director and chair of the Audit Committee. Board member of the Russell Exchange Traded Funds Trust from 2011 to 2012 and the chair of the Audit Committee. Ms. Freeman is Chair of Taproot Foundation (non-profit organization), a Board Member of Ruth Bancroft Garden (non-profit organization) and an inactive chartered financial analyst. | | Asset Allocation Trust |
Peter G. Gordon** (Born 1942) | | Trustee, since 1998; Chairman, since 2005 | | Co-Founder, Retired Chairman, President and CEO of Crystal Geyser Water Company. Trustee Emeritus, Colby College. | | Asset Allocation Trust |
Isaiah Harris, Jr. (Born 1952) | | Trustee, since 2009 | | Retired. Chairman of the Board of CIGNA Corporation since 2009, and Director since 2005. From 2003 to 2011, Director of Deluxe Corporation. Prior thereto, President and CEO of BellSouth Advertising and Publishing Corp. from 2005 to 2007, President and CEO of BellSouth Enterprises from 2004 to 2005 and President of BellSouth Consumer Services from 2000 to 2003. Emeritus member of the Iowa State University Foundation Board of Governors. Emeritus Member of the Advisory Board of Iowa State University School of Business. Advisory Board Member, Palm Harbor Academy (charter school). Advisory Board Member, Child Evangelism Fellowship (non-profit). Mr. Harris is a certified public accountant (inactive status). | | CIGNA Corporation; Asset Allocation Trust |
Judith M. Johnson (Born 1949) | | Trustee, since 2008; Audit Committee Chairman, since 2008 | | Retired. Prior thereto, Chief Executive Officer and Chief Investment Officer of Minneapolis Employees Retirement Fund from 1996 to 2008. Ms. Johnson is an attorney, certified public accountant and a certified managerial accountant. | | Asset Allocation Trust |
David F. Larcker (Born 1950) | | Trustee, since 2009 | | James Irvin Miller Professor of Accounting at the Graduate School of Business, Stanford University, Director of the Corporate Governance Research Initiative and Senior Faculty of The Rock Center for Corporate Governance since 2006. From 2005 to 2008, Professor of Accounting at the Graduate School of Business, Stanford University. Prior thereto, Ernst & Young Professor of Accounting at The Wharton School, University of Pennsylvania from 1985 to 2005. | | Asset Allocation Trust |
| | | | | | |
| Other information (unaudited) | | Wells Fargo Global Opportunities Fund | | | 31 | |
| | | | | | |
Name and
year of birth | | Position held and
length of service* | | Principal occupations during past five years or longer | | Current other
public company or
investment company
directorships |
Olivia S. Mitchell (Born 1953) | | Trustee, since 2006 | | International Foundation of Employee Benefit Plans Professor, Wharton School of the University of Pennsylvania since 1993. Director of Wharton’s Pension Research Council and Boettner Center on Pensions & Retirement Research, and Research Associate at the National Bureau of Economic Research. Previously, Cornell University Professor from 1978 to 1993. | | Asset Allocation Trust |
Timothy J. Penny (Born 1951) | | Trustee, since 1996 | | President and Chief Executive Officer of Southern Minnesota Initiative Foundation, a non-profit organization, since 2007 and Senior Fellow at the Humphrey Institute Policy Forum at the University of Minnesota since 1995. Member of the Board of Trustees of NorthStar Education Finance, Inc., a non-profit organization, since 2007. | | Asset Allocation Trust |
Michael S. Scofield (Born 1943) | | Trustee, since 2010 | | Served on the Investment Company Institute’s Board of Governors and Executive Committee from 2008-2011 as well the Governing Council of the Independent Directors Council from 2006-2011 and the Independent Directors Council Executive Committee from 2008-2011. Chairman of the IDC from 2008-2010. Institutional Investor (Fund Directions) Trustee of Year in 2007. Trustee of the Evergreen Funds complex (and its predecessors) from 1984 to 2010. Chairman of the Evergreen Funds from 2000-2010. Former Trustee of the Mentor Funds. Retired Attorney, Law Offices of Michael S. Scofield. | | Asset Allocation Trust |
| * | Length of service dates reflect the Trustee’s commencement of service with the Trust’s predecessor entities, where applicable. |
| ** | Peter Gordon is expected to retire on December 31, 2017. |
Officers
| | | | | | |
Name and
year of birth | | Position held and
length of service | | Principal occupations during past five years or longer | | |
Karla M. Rabusch (Born 1959) | | President, since 2003 | | Executive Vice President of Wells Fargo Bank, N.A. and President of Wells Fargo Funds Management, LLC since 2003. | | |
Jeremy DePalma1 (Born 1974) | | Treasurer, since 2012 | | Senior Vice President of Wells Fargo Funds Management, LLC since 2009. Senior Vice President of Evergreen Investment Management Company, LLC from 2008 to 2010 and head of the Fund Reporting and Control Team within Fund Administration from 2005 to 2010. | | |
C. David Messman (Born 1960) | | Secretary, since 2000; Chief Legal Officer, since 2003 | | Senior Vice President and Secretary of Wells Fargo Funds Management, LLC since 2001. Assistant General Counsel of Wells Fargo Bank, N.A. since 2013 and Vice President and Managing Counsel of Wells Fargo Bank, N.A. from 1996 to 2013. | | |
Michael Whitaker3 (Born 1967) | | Chief Compliance Officer, since 2016 | | Executive Vice President of Wells Fargo Funds Management, LLC since 2016. Chief Compliance Officer of Fidelity’s Fixed Income Funds and Asset Allocation Funds from 2008 to 2016, Compliance Officer of FMR Co., Inc. from 2014 to 2016, Fidelity Investments Money Management, Inc. from 2014 to 2016, Fidelity Investments from 2007 to 2016. | | |
David Berardi (Born 1975) | | Assistant Treasurer, since 2009 | | Vice President of Wells Fargo Funds Management, LLC since 2009. Vice President of Evergreen Investment Management Company, LLC from 2008 to 2010. Manager of Fund Reporting and Control for Evergreen Investment Management Company, LLC from 2004 to 2010. | | |
| 1 | Jeremy DePalma acts as Treasurer of 69 funds and Assistant Treasurer of 70 funds in the Fund Complex. |
| 2 | The Statement of Additional Information includes additional information about the Trustees and is available, without charge, upon request, by calling
1-800-222-8222 or by visiting the website at wellsfargofunds.com. |
| 3 | Michael Whitaker became Chief Compliance Officer effective May 16, 2016. |
| | | | |
| 32 | | Wells Fargo Global Opportunities Fund | | Other information (unaudited) |
BOARD CONSIDERATION OF INVESTMENT MANAGEMENT AND SUB-ADVISORY AGREEMENTS:
Under the Investment Company Act of 1940 (the “1940 Act”), the Board of Trustees (the “Board”) of Wells Fargo Funds Trust (the “Trust”) must determine annually whether to approve the continuation of the Trust’s investment management and sub-advisory agreements. In this regard, at an in-person meeting held on May 24-25, 2016 (the “Meeting”), the Board, all the members of which have no direct or indirect interest in the investment management and sub-advisory agreements and are not “interested persons” of the Trust, as defined in the 1940 Act (the “Independent Trustees”), reviewed and approved for Wells Fargo Global Opportunities Fund (the “Fund”): (i) an investment management agreement (the “Management Agreement”) with Wells Fargo Funds Management, LLC (“Funds Management”); and (ii) an investment sub-advisory agreement (the “Sub-Advisory Agreement”) with Wells Capital Management Incorporated (the “Sub-Adviser”), an affiliate of Funds Management. The Management Agreement and the Sub-Advisory Agreement are collectively referred to as the “Advisory Agreements.”
At the Meeting, the Board considered the factors and reached the conclusions described below relating to the selection of Funds Management and the Sub-Adviser and the approval of the Advisory Agreements. Prior to the Meeting, including at an in-person meeting in April 2016, the Trustees conferred extensively among themselves and with representatives of Funds Management about these matters. Also, the Board has adopted a team-based approach, with each team consisting of a sub-set of Trustees, to assist the full Board in the discharge of its duties in reviewing performance and other matters throughout the year. The Independent Trustees were assisted in their evaluation of the Advisory Agreements by independent legal counsel, from whom they received separate legal advice and with whom they met separately.
In providing information to the Board, Funds Management and the Sub-Adviser were guided by a detailed set of requests for information submitted to them by independent legal counsel on behalf of the Independent Trustees at the start of the Board’s annual contract renewal process earlier in 2016. In considering and approving the Advisory Agreements, the Trustees considered the information they believed relevant, including but not limited to the information discussed below. The Board considered not only the specific information presented in connection with the Meeting, but also the knowledge gained over time through interaction with Funds Management and the Sub-Adviser about various topics. In this regard, the Board reviewed reports of Funds Management at each of its quarterly meetings, which included, among other things, portfolio reviews and performance reports. In addition, the Board and the teams mentioned above confer with portfolio managers at various times throughout the year. The Board did not identify any particular information or consideration that was all-important or controlling, and each individual Trustee may have attributed different weights to various factors.
After its deliberations, the Board unanimously approved the continuation of the Advisory Agreements for a one-year term and determined that the compensation payable to Funds Management and the Sub-Adviser under each of the Advisory Agreements was reasonable. The Board considered the approval of the Advisory Agreements for the Fund as part of its consideration of agreements for funds across the complex, but its approvals were made on a fund-by-fund basis. The following summarizes a number of important, but not necessarily all, factors considered by the Board in support of its approvals.
Nature, extent and quality of services
The Board received and considered various information regarding the nature, extent and quality of services provided to the Fund by Funds Management and the Sub-Adviser under the Advisory Agreements. This information included a description of the investment advisory services and Fund-level administrative services covered by the Management Agreement, as well as, among other things, a summary of the background and experience of senior management of Funds Management, and the qualifications, background, tenure and responsibilities of each of the portfolio managers primarily responsible for the day-to-day portfolio management of the Fund.
The Board evaluated the ability of Funds Management and the Sub-Adviser to attract and retain qualified investment professionals, including research, advisory and supervisory personnel. The Board further considered the compliance programs and compliance records of Funds Management and the Sub-Adviser. In addition, the Board took into account the full range of services provided to the Fund by Funds Management and its affiliates.
Fund performance and expenses
The Board considered the performance results for the Fund over various time periods ended December 31, 2015. The Board considered these results in comparison to the performance of funds in a universe that was determined by Broadridge Inc. (“Broadridge”) to be similar to the Fund (the “Universe”), and in comparison to the Fund’s benchmark index and to other comparative data. Broadridge is an independent provider of investment company data. The Board received a description of the methodology used by Broadridge to select the mutual funds in the performance Universe.
| | | | | | |
| Other information (unaudited) | | Wells Fargo Global Opportunities Fund | | | 33 | |
The Board noted that the performance of the Fund (Administrator Class A) was higher than or in range of the average performance of the Universe for all periods under review except the five-year period. The Board also noted that the performance of the Fund lower than its benchmark, the S&P Developed SmallCap Index, for all periods under review except the ten-year period.
The Board received information concerning, and discussed factors contributing to, the underperformance of the Fund relative to the Universe and benchmark for the periods noted above. The Board took note of the explanations for the relative underperformance in these periods, including with respect to market factors and investment decisions that affected the Fund’s performance.
The Board also received and considered information regarding the Fund’s net operating expense ratios and their various components, including actual management fees, custodian and other non-management fees, and Rule 12b-1 and non-Rule 12b-1 shareholder service fees. The Board considered these ratios in comparison to the median ratios of funds in class-specific expense groups that were determined by Broadridge to be similar to the Fund (the “Groups”). The Board received a description of the methodology used by Broadridge to select the mutual funds in the expense Groups and an explanation of how funds comprising expense groups and their expense ratios may vary from year-to-year. Based on the Broadridge reports, the Board noted that the net operating expense ratios of the Fund were lower than or in range of the median net operating expense ratios of the expense Groups.
The Board took into account the Fund performance and expense information provided to it among the factors considered in deciding to re-approve the Advisory Agreements.
Investment management and sub-advisory fee rates
The Board reviewed and considered the contractual fee rates payable by the Fund to Funds Management under the Management Agreement, as well as the contractual fee rates payable by the Fund to Funds Management for class-level administrative services under a Class-Level Administration Agreement, which include class-level transfer agency and sub-transfer agency costs (collectively, the “Management Rates”). The Board also reviewed and considered the contractual investment sub-advisory fee rates that are payable by Funds Management to the Sub-Adviser for investment sub-advisory services.
Among other information reviewed by the Board was a comparison of the Fund’s Management Rates with the average contractual investment management fee rates of funds in the expense Groups at a common asset level as well as transfer agency costs of the funds in the expense Groups. The Board noted that the Management Rates of the Fund were lower than or in the range of the sum of these average rates for the Fund’s expense Groups for all share classes.
The Board also received and considered information about the portion of the total management fee that was retained by Funds Management after payment of the fee to the Sub-Adviser for sub-advisory services. In assessing the reasonableness of this amount, the Board received and evaluated information about the nature and extent of responsibilities retained and risks assumed by Funds Management and not delegated to or assumed by the Sub-Adviser, and about Funds Management’s on-going oversight services. However, given the affiliation between Funds Management and the Sub-Adviser, the Board ascribed limited relevance to the allocation of fees between them.
The Board also received and considered information about the nature and extent of services offered and fee rates charged by Funds Management and the Sub-Adviser to other types of clients with investment strategies similar to those of the Fund. In this regard, the Board received information about the significantly greater scope of services, and compliance, reporting and other legal burdens and risks of managing mutual funds compared with those associated with managing assets of non-mutual fund clients such as collective funds or institutional separate accounts.
Based on its consideration of the factors and information it deemed relevant, including those described here, the Board determined that the compensation payable to Funds Management under the Management Agreement and to the Sub-Adviser under the Sub-Advisory Agreement was reasonable, in light of the services covered by the Advisory Agreements.
Profitability
The Board received and considered information concerning the profitability of Funds Management, as well as the profitability of Wells Fargo as a whole, from providing services to the Fund and the fund family as a whole. The Board also received and considered information concerning the profitability of the Sub-Adviser from providing services to the fund family as a whole, noting that the Sub-Adviser’s profitability information with respect to providing services to the Fund was subsumed in the Wells Fargo and Funds Management profitability analysis.
| | | | |
| 34 | | Wells Fargo Global Opportunities Fund | | Other information (unaudited) |
Funds Management reported on the methodologies and estimates used in calculating profitability. Among other things, the Board noted that the levels of profitability reported on a fund-by-fund basis varied widely, depending on factors such as the size and type of fund. Based on its review, the Board did not deem the profits reported by Funds Management or Wells Fargo from its services to the Fund to be at a level that would prevent it from approving the continuation of the Advisory Agreements.
Economies of scale
With respect to possible economies of scale, the Board noted the existence of breakpoints in the Fund’s management fee structure, which operate generally to reduce the Fund’s expense ratios as the Fund grows in size. It considered that, for a small fund or a fund that shrinks in size, breakpoints conversely can result in higher fee levels. The Board also considered that fee waiver and expense reimbursement arrangements and competitive fee rates at the outset are means of sharing potential economies of scale with shareholders of the Fund and the fund family as a whole. The Board considered Funds Management’s view that any analyses of potential economies of scale in managing a particular fund are inherently limited in light of the joint and common costs and investments that Funds Management incurs across the fund family as a whole.
The Board concluded that the Fund’s fee and expense arrangements, including contractual breakpoints, constituted a reasonable approach to sharing potential economies of scale with the Fund and its shareholders.
Other benefits to Funds Management and the Sub-Adviser
The Board received and considered information regarding potential “fall-out” or ancillary benefits received by Funds Management and its affiliates, including the Sub-Adviser, as a result of their relationships with the Fund. Ancillary benefits could include, among others, benefits directly attributable to other relationships with the Fund and benefits potentially derived from an increase in Funds Management’s and the Sub-Adviser’s business as a result of their relationships with the Fund. The Board noted that various affiliates of Funds Management may receive distribution-related fees, shareholder servicing payments and sub-transfer agency fees in respect of shares sold or held through them and services provided.
The Board also reviewed information about soft dollar credits earned and utilized by the Sub-Adviser, fees earned by Funds Management and the Sub-Adviser from managing a private investment vehicle for the fund family’s securities lending collateral and commissions earned by an affiliated broker from portfolio transactions.
Based on its consideration of the factors and information it deemed relevant, including those described here, the Board did not find that any ancillary benefits received by Funds Management and its affiliates, including the Sub-Adviser, were unreasonable.
Conclusion
At the Meeting, after considering the above-described factors and based on its deliberations and its evaluation of the information described above, the Board unanimously approved the continuation of the Advisory Agreements for a one-year term and determined that the compensation payable to Funds Management and the Sub-Adviser under each of the Advisory Agreements was reasonable.
| | | | | | |
| List of abbreviations | | Wells Fargo Global Opportunities Fund | | | 35 | |
The following is a list of common abbreviations for terms and entities that may have appeared in this report.
| ACA | — ACA Financial Guaranty Corporation |
| ADR | — American depositary receipt |
| ADS | — American depositary shares |
| AGC | — Assured Guaranty Corporation |
| AGM | — Assured Guaranty Municipal |
| Ambac | — Ambac Financial Group Incorporated |
| AMT | — Alternative minimum tax |
| BAN | — Bond anticipation notes |
| BHAC | — Berkshire Hathaway Assurance Corporation |
| CAB | — Capital appreciation bond |
| CCAB | — Convertible capital appreciation bond |
| CDA | — Community Development Authority |
| CDO | — Collateralized debt obligation |
| DRIVER | — Derivative inverse tax-exempt receipts |
| DW&P | — Department of Water & Power |
| DWR | — Department of Water Resources |
| ECFA | — Educational & Cultural Facilities Authority |
| EDA | — Economic Development Authority |
| EDFA | — Economic Development Finance Authority |
| ETF | — Exchange-traded fund |
| FDIC | — Federal Deposit Insurance Corporation |
| FFCB | — Federal Farm Credit Banks |
| FGIC | — Financial Guaranty Insurance Corporation |
| FHA | — Federal Housing Administration |
| FHLB | — Federal Home Loan Bank |
| FHLMC | — Federal Home Loan Mortgage Corporation |
| FICO | — The Financing Corporation |
| FNMA | — Federal National Mortgage Association |
| GDR | — Global depositary receipt |
| GNMA | — Government National Mortgage Association |
| HCFR | — Healthcare facilities revenue |
| HEFA | — Health & Educational Facilities Authority |
| HEFAR | — Higher education facilities authority revenue |
| HFA | — Housing Finance Authority |
| HFFA | — Health Facilities Financing Authority |
| HUD | — Department of Housing and Urban Development |
| IDA | — Industrial Development Authority |
| IDAG | — Industrial Development Agency |
| KRW | — Republic of Korea won |
| LIBOR | — London Interbank Offered Rate |
| LIFER | — Long Inverse Floating Exempt Receipts |
| LLC | — Limited liability company |
| LLLP | — Limited liability limited partnership |
| LLP | — Limited liability partnership |
| MBIA | — Municipal Bond Insurance Association |
| MFHR | — Multifamily housing revenue |
| MSTR | — Municipal securities trust receipts |
| MUD | — Municipal Utility District |
| National | — National Public Finance Guarantee Corporation |
| PCFA | — Pollution Control Financing Authority |
| PCL | — Public Company Limited |
| PCR | — Pollution control revenue |
| PFA | — Public Finance Authority |
| PFFA | — Public Facilities Financing Authority |
| PFOTER | — Puttable floating option tax-exempt receipts |
| plc | — Public limited company |
| PUTTER | — Puttable tax-exempt receipts |
| R&D | — Research & development |
| Radian | — Radian Asset Assurance |
| RAN | — Revenue anticipation notes |
| RDA | — Redevelopment Authority |
| RDFA | — Redevelopment Finance Authority |
| REIT | — Real estate investment trust |
| ROC | — Reset option certificates |
| SAVRS | — Select auction variable rate securities |
| SBA | — Small Business Authority |
| SDR | — Swedish depositary receipt |
| SFHR | — Single-family housing revenue |
| SFMR | — Single-family mortgage revenue |
| SPA | — Standby purchase agreement |
| SPDR | — Standard & Poor’s Depositary Receipts |
| SPEAR | — Short Puttable Exempt Adjustable Receipts |
| STRIPS | — Separate trading of registered interest and |
| TAN | — Tax anticipation notes |
| TIPS | — Treasury inflation-protected securities |
| TRAN | — Tax revenue anticipation notes |
| TTFA | — Transportation Trust Fund Authority |
| TVA | — Tennessee Valley Authority |
This page is intentionally left blank.

For more information
More information about Wells Fargo Funds is available free upon request. To obtain literature, please write, email, visit the Fund’s website, or call:
Wells Fargo Funds
P.O. Box 8266
Boston, MA 02266-8266
Email: fundservice@wellsfargo.com
Website: wellsfargofunds.com
Individual investors: 1-800-222-8222
Retail investment professionals: 1-888-877-9275
Institutional investment professionals: 1-866-765-0778
This report and the financial statements contained herein are submitted for the general information of the shareholders of the Fund. If this report is used for promotional purposes, distribution of the report must be accompanied or preceded by a current prospectus. Before investing, please consider the investment objectives, risks, charges, and expenses of the investment. For a current prospectus and, if available, a summary prospectus, containing this information, call 1-800-222-8222 or visit the Fund’s website at wellsfargofunds.com. Read the prospectus carefully before you invest or send money.
Wells Fargo Asset Management (WFAM) is a trade name used by the asset management businesses of Wells Fargo & Company. Wells Fargo Funds Management, LLC, a wholly owned subsidiary of Wells Fargo & Company, provides investment advisory and administrative services for Wells Fargo Funds. Other affiliates of Wells Fargo & Company provide subadvisory and other services for the funds. The funds are distributed by Wells Fargo Funds Distributor, LLC, Member FINRA, an affiliate of Wells Fargo & Company. Neither Wells Fargo Funds Management nor Wells Fargo Funds Distributor has Fund customer accounts/assets, and neither provides investment advice/recommendations or acts as an investment advice fiduciary to any investor.
NOT FDIC INSURED ◾ NO BANK GUARANTEE ◾ MAY LOSE VALUE
© 2016 Wells Fargo Funds Management, LLC. All rights reserved.
| | |
 | | 247343 12-16 A239/AR239 10-16 |
Annual Report
October 31, 2016

Wells Fargo International Equity Fund


Reduce clutter. Save trees.
Sign up for electronic delivery of prospectuses and shareholder reports at wellsfargo.com/advantagedelivery
Contents
The views expressed and any forward-looking statements are as of October 31, 2016, unless otherwise noted, and are those of the Fund managers and/or Wells Fargo Funds Management, LLC. Discussions of individual securities, or the markets generally, or any Wells Fargo Fund are not intended as individual recommendations. Future events or results may vary significantly from those expressed in any forward-looking statements. The views expressed are subject to change at any time in response to changing circumstances in the market. Wells Fargo Funds Management, LLC and the Fund disclaim any obligation to publicly update or revise any views expressed or forward-looking statements.
NOT FDIC INSURED ¡ NO BANK GUARANTEE ¡ MAY LOSE VALUE
| | | | |
| 2 | | Wells Fargo International Equity Fund | | Letter to shareholders (unaudited) |

Karla M. Rabusch
President
Wells Fargo Funds
International equity investors entered the period confronting concerns about slowing economic growth, particularly in China.
Dear Shareholder:
We are pleased to offer you this annual report for the Wells Fargo International Equity Fund for the 12-month period that ended October 31, 2016. Significant volatility in international equity markets during the final months of 2015 and early 2016 subsided during the last half of the period. The performance contrast in each half of the reporting period as measured by key benchmark indexes shows the improving investment environment during the previous 12 months.
| | | | | | | | |
| | | November 1, 2015 through
April 30, 2016 (%) | | | May 1, 2016 through
October 31, 2016 (%) | |
Morgan Stanley Capital International (MSCI) Europe, Australasia, Far East (EAFE) Index (Net)1 | | | (3.07 | ) | | | (0.16 | ) |
MSCI World Index (Net)2 | | | (1.05 | ) | | | 2.25 | |
MSCI All Country World Index (ACWI) ex USA Index (Net)3 | | | (1.75 | ) | | | 2.01 | |
S&P Developed SmallCap Index4 | | | 1.05 | | | | 2.36 | |
Past performance is no guarantee of future results.
Central bank policies demonstrated resolve to reignite global economic growth.
International equity investors entered the period confronting concerns about slowing economic growth, particularly in China. They also were uncertain if governments and their central banks could successfully address concerns about recessionary pressures and global business activity through monetary and economic policy. The December 2015 decision of the U.S. Federal Reserve (Fed) to increase its key interest rate caused elevated levels of volatility in global equity markets and sometimes drove significant fluctuations in the relative values of currencies around the world. The U.S. dollar tended to gain strength, which helped exporters in other countries but pressured importers who paid higher prices for goods and services.
The European Central Bank (ECB) pushed the interest rate it pays on deposits further into negative territory in late 2015. In January 2016, the Bank of Japan followed the ECB’s lead by setting a negative deposit rate. During the period, the People’s Bank of China guided its currency’s value lower relative to a basket of foreign currencies to enhance exports. Investors viewed the actions of major central banks as consistent with efforts to spark business activity. Observing the actions of central banks overseas to implement policies that would accommodate
| 1 | The Morgan Stanley Capital International (MSCI) Europe, Australasia, Far East (EAFE) Index (Net) is a free-float-adjusted market-capitalization weighted index that is designed to measure the equity market performance of developed markets, excluding the United States and Canada. The MSCI EAFE Index (Net) consists of the following 21 developed markets country indexes: Australia, Austria, Belgium, Denmark, Finland, France, Germany, Hong Kong, Ireland, Israel, Italy, Japan, the Netherlands, New Zealand, Norway, Portugal, Singapore, Spain, Sweden, Switzerland, and the United Kingdom. Source: MSCI. MSCI makes no express or implied warranties or representations and shall have no liability whatsoever with respect to any MSCI data contained herein. The MSCI data may not be further redistributed or used as a basis for other indexes or any securities or financial products. This report is not approved, reviewed, or produced by MSCI. You cannot invest directly in an index. |
| 2 | The MSCI World Index (Net) is a free-float-adjusted market-capitalization-weighted index that is designed to measure the equity market performance of developed markets. The MSCI World Index (Net) consists of the following 23 developed markets country indexes: Australia, Austria, Belgium, Canada, Denmark, Finland, France, Germany, Hong Kong, Ireland, Israel, Italy, Japan, the Netherlands, New Zealand, Norway, Portugal, Singapore, Spain, Sweden, Switzerland, the United Kingdom, and the United States. You cannot invest directly in an index. |
| 3 | The MSCI All Country World Index (ACWI) ex USA Index (Net) is a free-float-adjusted market-capitalization-weighted index that is designed to measure the equity market performance of developed markets, excluding the United States and Canada. You cannot invest directly in an index. |
| 4 | The S&P Developed SmallCap Index is a free-float-adjusted market-capitalization-weighted index designed to measure the equity market performance of small-capitalization companies located in developed markets. The index is composed of companies within the bottom 15% of the cumulative market capitalization in developed markets. The index covers all publicly listed equities with float-adjusted market values of U.S. $100 million or more and annual dollar value traded of at least U.S. $50 million in all included countries. You cannot invest directly in an index. |
| | | | | | |
| Letter to shareholders (unaudited) | | Wells Fargo International Equity Fund | | | 3 | |
higher levels of business activity, the Fed acknowledged that risks to global growth existed and indicated it would base further rate increases on data that indicated successful management of the risks.
Investors closely watched changing sentiment in global markets during the period.
In the second quarter of 2016, equity market volatility levels declined and remained relatively low until the end of June, when voters in the United Kingdom surprised market participants and approved the Brexit referendum to leave the European Union. Investors reacted to the news negatively and fled to assets such as precious metals and U.S. Treasury bonds. As a result, interest rates fell sharply, and equity markets declined across the globe. In the weeks to follow, signs of resilience in major markets worldwide offset concerns stemming from the Brexit referendum.
Investors’ sentiments improved during the third quarter of 2016, which led to more favorable returns across global equity markets. The third-quarter saw a rotation that favored company fundamentals over macroeconomic fears, creating a more favorable market dynamic for active managers. Dispersion of returns from both the sector and country perspective tended to confirm the changing views of the markets among investors. On an improved perception of business health, economically sensitive sectors such as consumer discretionary, materials, financials, and industrials gained while traditionally defensive sectors (utilities, telecommunication services, health care, and consumer staples) benefited less during the market rally.
Don’t let short-term uncertainty derail long-term investment goals.
Periods of investment uncertainty can present challenges, but experience has taught us that maintaining long-term investment goals can be an effective way to plan for the future. To help you create a sound strategy based on your personal goals and risk tolerance, Wells Fargo Funds offers more than 100 mutual funds spanning a wide range of asset classes and investment styles. Although diversification cannot guarantee an investment profit or prevent losses, we believe it can be an effective way to manage investment risk and potentially smooth out overall portfolio performance. We encourage investors to know their investments and to understand that appropriate levels of risk-taking may unlock opportunities.
Thank you for choosing to invest with Wells Fargo Funds. We appreciate your confidence in us and remain committed to helping you meet your financial needs.
Sincerely,

Karla M. Rabusch
President
Wells Fargo Funds
Investors’ sentiments improved during the third quarter of 2016, which led to more favorable returns across global equity markets.
For further information about your Fund, contact your investment professional, visit our website at wellsfargofunds.com, or call us directly at 1-800-222-8222. We are available 24 hours a day, 7 days a week.
| | | | |
| 4 | | Wells Fargo International Equity Fund | | Performance highlights (unaudited) |
Investment objective
The Fund seeks long-term capital appreciation.
Manager
Wells Fargo Funds Management, LLC
Subadviser
Wells Capital Management Incorporated
Portfolio managers
Dale A. Winner, CFA®
Average annual total returns (%) as of October 31, 20161
| | | | | | | | | | | | | | | | | | | | | | | | | | | | | | | | | | |
| | | | | Including sales charge | | | Excluding sales charge | | | Expense ratios2 (%) | |
| | | Inception date | | 1 year | | | 5 year | | | 10 year | | | 1 year | | | 5 year | | | 10 year | | | Gross | | | Net3 | |
| Class A (WFEAX) | | 1-20-1998 | | | (8.33 | ) | | | 3.87 | | | | 0.35 | | | | (2.76 | ) | | | 5.11 | | | | 0.94 | | | | 1.51 | | | | 1.15 | |
| Class B (WFEBX)* | | 9-6-1979 | | | (8.28 | ) | | | 3.96 | | | | 0.41 | | | | (3.46 | ) | | | 4.30 | | | | 0.41 | | | | 2.26 | | | | 1.90 | |
| Class C (WFEFX) | | 3-6-1998 | | | (4.43 | ) | | | 4.33 | | | | 0.19 | | | | (3.43 | ) | | | 4.33 | | | | 0.19 | | | | 2.26 | | | | 1.90 | |
| Class R (WFERX) | | 10-10-2003 | | | – | | | | – | | | | – | | | | (2.94 | ) | | | 4.85 | | | | 0.69 | | | | 1.76 | | | | 1.40 | |
| Class R6 (WFEHX) | | 9-30-2015 | | | – | | | | – | | | | – | | | | (2.46 | ) | | | 5.33 | | | | 1.11 | | | | 1.08 | | | | 0.85 | |
| Administrator Class (WFEDX) | | 7-16-2010 | | | – | | | | – | | | | – | | | | (2.71 | ) | | | 5.13 | | | | 1.05 | | | | 1.43 | | | | 1.15 | |
| Institutional Class (WFENX) | | 3-9-1998 | | | – | | | | – | | | | – | | | | (2.48 | ) | | | 5.36 | | | | 1.20 | | | | 1.18 | | | | 0.90 | |
| MSCI ACWI ex USA Index (Net)4 | | – | | | – | | | | – | | | | – | | | | 0.22 | | | | 3.64 | | | | 1.61 | | | | – | | | | – | |
| * | | Class B shares are closed to investment, except in connection with the reinvestment of any distributions and permitted exchanges. |
Figures quoted represent past performance, which is no guarantee of future results, and do not reflect taxes that a shareholder may pay on fund distributions or the redemption of fund shares. Investment return and principal value of an investment will fluctuate so that an investor’s shares, when redeemed, may be worth more or less than their original cost. Performance shown without sales charges would be lower if sales charges were reflected. Current performance may be lower or higher than the performance data quoted, which assumes the reinvestment of dividends and capital gains. Current month-end performance is available on the Fund’s website, wellsfargofunds.com.
Index returns do not include transaction costs associated with buying and selling securities, any mutual fund fees or expenses, or any taxes. It is not possible to invest directly in an index.
For Class A shares, the maximum front-end sales charge is 5.75%. For Class B shares, the maximum contingent deferred sales charge is 5.00%. For Class C shares, the maximum contingent deferred sales charge is 1.00%. Performance including a contingent deferred sales charge assumes the sales charge for the corresponding time period. Class R, Class R6, Administrator Class, and Institutional Class shares are sold without a front-end sales charge or contingent deferred sales charge.
Stock values fluctuate in response to the activities of individual companies and general market and economic conditions. Foreign investments are especially volatile and can rise or fall dramatically due to differences in the political and economic conditions of the host country. These risks are generally intensified in emerging markets. The use of derivatives may reduce returns and/or increase volatility. Certain investment strategies tend to increase the total risk of an investment (relative to the broader market). The Fund is exposed to smaller-company securities risk. Consult the Fund’s prospectus for additional information on these and other risks.
Please see footnotes on page 5.
| | | | | | |
| Performance highlights (unaudited) | | Wells Fargo International Equity Fund | | | 5 | |
|
| Growth of $10,000 investment as of October 31, 20165 |
|
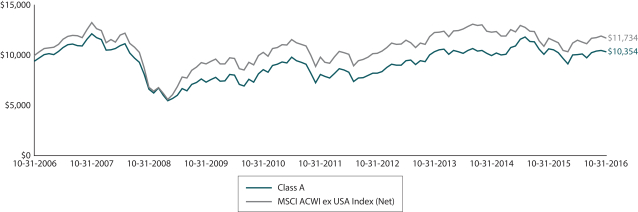 |
| 1 | Historical performance shown for Class R6 shares prior to their inception reflects the performance of Institutional Class shares and includes the higher expenses applicable to Institutional Class shares. If these expenses had not been included, returns would be higher. Historical performance shown for Administrator Class shares prior to their inception reflects the performance of Institutional Class shares and has been adjusted to reflect the higher expenses applicable to Administrator Class shares. Historical performance shown for all classes of the Fund prior to July 12, 2010, is based on the performance of the Fund’s predecessor, Evergreen International Equity Fund. |
| 2 | Reflects the expense ratios as stated in the most recent prospectuses, which include the impact of 0.01% in acquired fund fees and expenses. The expense ratios shown are subject to change and may differ from the annualized expense ratios shown in the financial highlights of this report, which do not include acquired fund fees and expenses. |
| 3 | The manager has contractually committed through February 28, 2017, to waive fees and/or reimburse expenses to the extent necessary to cap the Fund’s Total Annual Operating Expenses After Fee Waiver at 1.14% for Cass A, 1.89% for Class B, 1.89% for Class C, 1.39% for Class R, 0.84% for Class R6, 1.14% for Administrator Class, and 0.89% for Institutional Class. After this time, the cap may be increased or the commitment to maintain the cap may be terminated only with the approval of the Board of Trustees. Brokerage commissions, stamp duty fees, interest, taxes, acquired fund fees and expenses, and extraordinary expenses are excluded from the expense cap. Without this cap, the Fund’s returns would have been lower. |
| 4 | The Morgan Stanley Capital International (MSCI) All Country World Index (ACWI) ex USA Index (Net) is a free-float-adjusted market-capitalization-weighted index that is designed to measure the equity market performance of developed markets, excluding the U.S. and Canada. Source: MSCI. MSCI makes no express or implied warranties or representations and shall have no liability whatsoever with respect to any MSCI data contained herein. The MSCI data may not be further redistributed or used as a basis for other indexes or any securities or financial products. This report is not approved, reviewed, or produced by MSCI. You cannot invest directly in an index. |
| 5 | The chart compares the performance of Class A shares for the most recent ten years with the MSCI ACWI ex USA Index (Net). The chart assumes a hypothetical investment of $10,000 in Class A shares and reflects all operating expenses and assumes the maximum initial sales charge of 5.75%. |
| 6 | The ten largest holdings, excluding cash and cash equivalents, are calculated based on the value of the investments divided by total net assets of the Fund. Holdings are subject to change and may have changed since the date specified. |
| 7 | Amounts are calculated based on the total long-term investments of the Fund. These amounts are subject to change and may have changed since the date specified. |
| | | | |
| 6 | | Wells Fargo International Equity Fund | | Performance highlights (unaudited) |
MANAGER’S DISCUSSION
Fund highlights
| ∎ | | The Fund underperformed the MSCI ACWI ex USA Index (Net) for the 12-month period that ended October 31, 2016. |
| ∎ | | Financials, consumer discretionary, and real estate equities detracted from performance. Industrials conglomerates and consumer staple stocks contributed to performance. |
| ∎ | | The Fund remained overweight to stocks in Germany, the U.S., the Netherlands, Hong Kong (China), and South Korea and increased its positions in select undervalued European stocks. |
Global capital markets experienced bouts of volatility.
Over the course of the last year, global capital markets experienced bouts of volatility, especially during the early part of 2016’s first quarter and the latter part of the second quarter. Concerns over China’s credit risks, European banking liquidity concerns, and Japanese investment challenges in an environment of negative interest rates added to first quarter turbulence. During the second quarter, fears around the unexpected referendum for the U.K. to leave the European Union (Brexit) weighed on equity market sentiment. Since then, momentum trading across equity markets was less evident than the return to fundamental investment appetite across global equities. During the period, we continued to find underresearched and undervalued stocks that we believed were poised to capitalize on advantages stemming from self-help restructuring and targeted national structural reforms. These influences drove total return in many of our stock picks across Europe, Asia, and the Americas. We are steadily witnessing a transition in public policy support for international economic recovery from reliance on monetary policy easing to an increased role of fiscal stimulus and pro-growth structural reforms in Asia (especially Japan and China) and in Europe.
Negative performance effects came from stocks such as ANIMA Holding S.p.A., HUGO BOSS AG, Mitsubishi UFJ Financial Group, Incorporated, Cameco Corporation, Dongfeng Motor Group Company, Limited, Nomura Holdings Holdings, Incorporated, and Hitachi, Limited. Some of the best stock performances came from Coca-Cola East Japan Company Limited, Xinyi Glass Holdings Limited, and Hana Financial Group Incorporated in Asia; Prysmian S.p.A., Smiths Group plc, Siemens AG, and Royal Philips N.V. in Europe; and in the Americas, Lundin Mining Corporation. We have gradually increased our emerging markets equity exposure, notably in Korea and Brazil. Outside these countries and China and Hong Kong, we are evaluating a number of opportunities amid increasing emerging markets company, country, and currency risk and opportunity divergences.
Regionally, divergent and compelling investment opportunities continue to emerge.
In Europe, opportunities arose amid signs of a cyclical economic recovery in the context of an alert European Central Bank (ECB) that is focused on managing systematic risks in banking and financial markets. The ECB’s actions continue to help address challenges facing the European Union member states as they seek further political cooperation to secure their currency union. Companies engaged in self-help restructuring through operational efficiencies such as careful investment of corporate resources, cost-cutting, and portfolio reshaping bolstered their profitability and benefited from the additional impetus of structural reforms and economic recovery. Key core investment holdings include Munich Reinsurance Company, METRO AG, Eni S.p.A., Smiths Group, and Compagnie de Saint-Gobain S.A.
In Asia, our base-case assessment suggests that while the policy challenges in China of transitioning from an exclusively state-controlled to more market-driven economy are not without difficulty, government officials have several policy levers at their disposal to accomplish an orderly and flexible liberalization, especially ahead of next year’s National People’s Congress milestone. We believe policy easing remains incremental, leaving room for further growth-enhancement measures. In Hong Kong, we continued to build positions in undervalued and restructuring state-owned enterprises such as China Mobile Limited. In South Korea, positions including Hana Financial and SK Telecom Company Limited provide long-term attractive total return upside based on micro restructuring benefits. And in Japan—where we are now underweight as of the beginning of this year, compared to having been an overweight in the portfolio years ago—we continue to find bifurcation between the new and old corporate regimes. We have watched core holdings increase their operating margins through more company-specific actions, as opposed to the currency depreciation benefiting exporters or reflationary policies benefiting levered financials years ago, exemplified by Coca-Cola East Japan, Hitachi and Nomura Holdings.
Please see footnotes on page 5.
| | | | | | |
| Performance highlights (unaudited) | | Wells Fargo International Equity Fund | | | 7 | |
| | | | |
| Ten largest holdings (%) as of October 31, 20166 | |
Muenchener Rueckversicherungs Gesellschaft AG | | | 3.58 | |
Eni SpA | | | 3.23 | |
Compagnie de Saint-Gobain SA | | | 3.10 | |
Metro AG | | | 3.08 | |
Hana Financial Group Incorporated | | | 3.08 | |
Vodafone Group plc | | | 3.04 | |
Smiths Group plc | | | 2.95 | |
Coca-Cola East Japan Company Limited | | | 2.88 | |
Koninklijke Philips NV | | | 2.80 | |
Wolseley plc | | | 2.72 | |
We continue to adhere to our investment process.
We are identifying opportunities in select equities across developed and emerging markets. Many of the companies we are monitoring currently trade in domestic markets that are approximately half the book-to-value market multiple of U.S. equities, with substantial potential for profitability enhancement as they normalize earnings power and monetize benefits from the collapse of commodity prices, lower credit costs, and currency rates that can prove advantageous, particularly to exporters. Our bottom-up stock-selection process continues to steer our portfolio to what we deem to be more nonconsensus, underearning, and undervalued equities, particularly in Europe, Hong Kong and, selectively, in other emerging markets—companies benefiting from a confluence of restructuring, reflation, and/or reform tailwinds.
|
| Sector distribution as of October 31, 20167 |
|
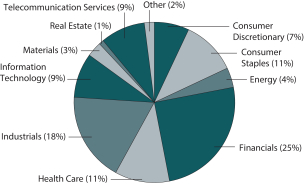 |
|
| Country allocation as of October 31, 20167 |
|
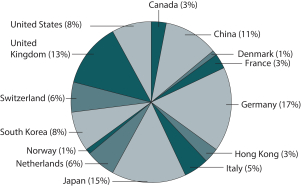 |
Please see footnotes on page 5.
| | | | |
| 8 | | Wells Fargo International Equity Fund | | Fund expenses (unaudited) |
As a shareholder of the Fund, you incur two types of costs: (1) transaction costs, including sales charges (loads) on purchase payments and contingent deferred sales charges (if any) on redemptions and (2) ongoing costs, including management fees, distribution (12b-1) and/or shareholder servicing fees, and other Fund expenses. This example is intended to help you understand your ongoing costs (in dollars) of investing in the Fund and to compare these costs with the ongoing costs of investing in other mutual funds.
The example is based on an investment of $1,000 invested at the beginning of the six-month period and held for the entire period from May 1, 2016 to October 31, 2016.
Actual expenses
The “Actual” line of the table below provides information about actual account values and actual expenses. You may use the information in this line, together with the amount you invested, to estimate the expenses that you paid over the period. Simply divide your account value by $1,000 (for example, an $8,600 account value divided by $1,000 = 8.6), then multiply the result by the number in the “Actual” line under the heading entitled “Expenses paid during period” for your applicable class of shares to estimate the expenses you paid on your account during this period.
Hypothetical example for comparison purposes
The “Hypothetical” line of the table below provides information about hypothetical account values and hypothetical expenses based on the Fund’s actual expense ratio and an assumed rate of return of 5% per year before expenses, which is not the Fund’s actual return. The hypothetical account values and expenses may not be used to estimate the actual ending account balance or expenses you paid for the period. You may use this information to compare the ongoing costs of investing in the Fund and other funds. To do so, compare this 5% hypothetical example with the 5% hypothetical examples that appear in the shareholder reports of the other funds.
Please note that the expenses shown in the table are meant to highlight your ongoing costs only and do not reflect any transactional costs, such as sales charges (loads) and contingent deferred sales charges. Therefore, the “Hypothetical” line of the table is useful in comparing ongoing costs only and will not help you determine the relative total costs of owning different funds. In addition, if these transactional costs were included, your costs would have been higher.
| | | | | | | | | | | | | | | | |
| | | Beginning
account value
5-1-2016 | | | Ending
account value
10-31-2016 | | | Expenses
paid during
the period¹ | | | Annualized net
expense ratio | |
Class A | | | | | | | | | | | | | | | | |
Actual | | $ | 1,000.00 | | | $ | 1,027.86 | | | $ | 5.81 | | | | 1.14 | % |
Hypothetical (5% return before expenses) | | $ | 1,000.00 | | | $ | 1,019.41 | | | $ | 5.79 | | | | 1.14 | % |
Class B | | | | | | | | | | | | | | | | |
Actual | | $ | 1,000.00 | | | $ | 1,023.70 | | | $ | 9.61 | | | | 1.89 | % |
Hypothetical (5% return before expenses) | | $ | 1,000.00 | | | $ | 1,015.63 | | | $ | 9.58 | | | | 1.89 | % |
Class C | | | | | | | | | | | | | | | | |
Actual | | $ | 1,000.00 | | | $ | 1,023.65 | | | $ | 9.61 | | | | 1.89 | % |
Hypothetical (5% return before expenses) | | $ | 1,000.00 | | | $ | 1,015.63 | | | $ | 9.58 | | | | 1.89 | % |
Class R | | | | | | | | | | | | | | | | |
Actual | | $ | 1,000.00 | | | $ | 1,026.58 | | | $ | 7.08 | | | | 1.39 | % |
Hypothetical (5% return before expenses) | | $ | 1,000.00 | | | $ | 1,018.15 | | | $ | 7.05 | | | | 1.39 | % |
Class R6 | | | | | | | | | | | | | | | | |
Actual | | $ | 1,000.00 | | | $ | 1,028.84 | | | $ | 4.28 | | | | 0.84 | % |
Hypothetical (5% return before expenses) | | $ | 1,000.00 | | | $ | 1,020.91 | | | $ | 4.27 | | | | 0.84 | % |
Administrator Class | | | | | | | | | | | | | | | | |
Actual | | $ | 1,000.00 | | | $ | 1,028.36 | | | $ | 5.81 | | | | 1.14 | % |
Hypothetical (5% return before expenses) | | $ | 1,000.00 | | | $ | 1,019.41 | | | $ | 5.79 | | | | 1.14 | % |
Institutional Class | | | | | | | | | | | | | | | | |
Actual | | $ | 1,000.00 | | | $ | 1,028.86 | | | $ | 4.54 | | | | 0.89 | % |
Hypothetical (5% return before expenses) | | $ | 1,000.00 | | | $ | 1,020.66 | | | $ | 4.52 | | | | 0.89 | % |
| 1 | Expenses paid is equal to the annualized net expense ratio of each class multiplied by the average account value over the period, multiplied by the number of days in the most recent fiscal half-year divided by the number of days in the fiscal year (to reflect the one-half-year period). |
| | | | | | |
| Portfolio of investments—October 31, 2016 | | Wells Fargo International Equity Fund | | | 9 | |
| | | | | | | | | | | | | | | | |
| Security name | | | | | | | | Shares | | | Value | |
| | | | |
Common Stocks: 85.24% | | | | | | | | | | | | | | | | |
| | | | |
| Brazil: 0.24% | | | | | | | | | | | | | | | | |
Cosan Limited Class A (Energy, Oil, Gas & Consumable Fuels) | | | | | | | | | | | 99,329 | | | $ | 884,028 | |
| | | | | | | | | | | | | | | | |
| | | | |
| Canada: 2.34% | | | | | | | | | | | | | | | | |
Lundin Mining Corporation (Materials, Metals & Mining) † | | | | | | | | | | | 2,217,053 | | | | 8,677,796 | |
| | | | | | | | | | | | | | | | |
| | | | |
| China: 7.77% | | | | | | | | | | | | | | | | |
China Everbright Limited (Financials, Capital Markets) | | | | | | | | | | | 3,586,000 | | | | 7,028,154 | |
China Mobile Limited (Telecommunication Services, Wireless Telecommunication Services) | | | | | | | | | | | 658,000 | | | | 7,538,253 | |
Industrial & Commercial Bank of China Limited H Shares (Financials, Banks) | | | | | | | | | | | 7,435,000 | | | | 4,476,981 | |
Shanghai Pharmaceuticals Holding Company Limited H Shares (Health Care, Health Care Providers & Services) | | | | | | | | | | | 1,861,900 | | | | 4,801,465 | |
Xinyi Solar Holdings Limited (Information Technology, Semiconductors & Semiconductor Equipment) « | | | | | | | | | | | 6,964,000 | | | | 2,586,060 | |
Xtep International Holdings Limited (Consumer Discretionary, Textiles, Apparel & Luxury Goods) | | | | | | | | | | | 5,524,180 | | | | 2,436,023 | |
| | | | |
| | | | | | | | | | | | | | | 28,866,936 | |
| | | | | | | | | | | | | | | | |
| | | | |
| Denmark: 0.88% | | | | | | | | | | | | | | | | |
Novo Nordisk AS Class B (Health Care, Pharmaceuticals) | | | | | | | | | | | 91,547 | | | | 3,275,037 | |
| | | | | | | | | | | | | | | | |
| | | | |
| France: 3.10% | | | | | | | | | | | | | | | | |
Compagnie de Saint-Gobain SA (Industrials, Building Products) | | | | | | | | | | | 259,129 | | | | 11,504,941 | |
| | | | | | | | | | | | | | | | |
| | | | |
| Germany: 14.66% | | | | | | | | | | | | | | | | |
Bayer AG (Health Care, Pharmaceuticals) | | | | | | | | | | | 89,712 | | | | 8,891,883 | |
Metro AG (Consumer Staples, Food & Staples Retailing) | | | | | | | | | | | 382,458 | | | | 11,457,526 | |
Muenchener Rueckversicherungs Gesellschaft AG (Financials, Insurance) | | | | | | | | | | | 68,576 | | | | 13,294,328 | |
Rheinmetall AG (Industrials, Industrial Conglomerates) | | | | | | | | | | | 81,057 | | | | 5,615,549 | |
SAP SE (Information Technology, Software) | | | | | | | | | | | 88,683 | | | | 7,811,507 | |
Siemens AG (Industrials, Industrial Conglomerates) | | | | | | | | | | | 65,189 | | | | 7,403,011 | |
| | | | |
| | | | | | | | | | | | | | | 54,473,804 | |
| | | | | | | | | | | | | | | | |
| | | | |
| Hong Kong: 2.45% | | | | | | | | | | | | | | | | |
Value Partners Group Limited (Financials, Capital Markets) | | | | | | | | | | | 3,605,000 | | | | 3,449,027 | |
Xinyi Automobile Glass Hong Kong Enterprises Limited (Consumer Discretionary, Auto Components) † | | | | | | | | | | | 958,500 | | | | 186,619 | |
Xinyi Glass Holdings Limited (Consumer Discretionary, Auto Components) | | | | | | | | | | | 6,368,000 | | | | 5,476,666 | |
| | | | |
| | | | | | | | | | | | | | | 9,112,312 | |
| | | | | | | | | | | | | | | | |
| | | | |
| Italy: 4.63% | | | | | | | | | | | | | | | | |
Eni SpA (Energy, Oil, Gas & Consumable Fuels) | | | | | | | | | | | 826,504 | | | | 11,985,367 | |
Prysmian SpA (Industrials, Electrical Equipment) | | | | | | | | | | | 209,064 | | | | 5,202,766 | |
| | | | |
| | | | | | | | | | | | | | | 17,188,133 | |
| | | | | | | | | | | | | | | | |
| | | | |
| Japan: 13.53% | | | | | | | | | | | | | | | | |
Coca-Cola East Japan Company Limited (Consumer Staples, Beverages) | | | | | | | | | | | 484,600 | | | | 10,702,142 | |
Daiwa Securities Group Incorporated (Financials, Capital Markets) | | | | | | | | | | | 1,367,000 | | | | 8,182,187 | |
Hitachi Limited (Information Technology, Electronic Equipment, Instruments & Components) | | | | | | | | | | | 1,829,000 | | | | 9,752,806 | |
Mitsubishi UFJ Financial Group Incorporated (Financials, Banks) | | | | | | | | | | | 1,507,000 | | | | 7,825,996 | |
Mitsui Fudosan Company Limited (Real Estate, Real Estate Management & Development) | | | | | | | | | | | 184,000 | | | | 4,194,260 | |
Nomura Holdings Incorporated (Financials, Capital Markets) | | | | | | | | | | | 1,913,700 | | | | 9,607,734 | |
| | | | |
| | | | | | | | | | | | | | | 50,265,125 | |
| | | | | | | | | | | | | | | | |
The accompanying notes are an integral part of these financial statements.
| | | | |
| 10 | | Wells Fargo International Equity Fund | | Portfolio of investments—October 31, 2016 |
| | | | | | | | | | | | | | | | |
| Security name | | | | | | | | Shares | | | Value | |
| | | | |
| Netherlands: 5.45% | | | | | | | | | | | | | | | | |
Koninklijke Philips NV (Industrials, Industrial Conglomerates) « | | | | | | | | | | | 344,438 | | | $ | 10,382,816 | |
NN Group NV (Financials, Insurance) | | | | | | | | | | | 327,527 | | | | 9,869,451 | |
| | | | |
| | | | | | | | | | | | | | | 20,252,267 | |
| | | | | | | | | | | | | | | | |
| | | | |
| Norway: 1.27% | | | | | | | | | | | | | | | | |
Frontline Limited (Energy, Oil, Gas & Consumable Fuels) « | | | | | | | | | | | 187,330 | | | | 1,373,967 | |
Marine Harvest ASA (Consumer Staples, Food Products) | | | | | | | | | | | 183,880 | | | | 3,336,050 | |
| | | | |
| | | | | | | | | | | | | | | 4,710,017 | |
| | | | | | | | | | | | | | | | |
| | | | |
| South Korea: 6.80% | | | | | | | | | | | | | | | | |
Hana Financial Group Incorporated (Financials, Banks) | | | | | | | | | | | 398,559 | | | | 11,424,719 | |
Samsung Electronics Company Limited GDR (Information Technology, Technology Hardware, Storage & Peripherals) 144A | | | | | | | | | | | 5,945 | | | | 4,194,198 | |
SK Telecom Company Limited (Telecommunication Services, Wireless Telecommunication Services) | | | | | | | | | | | 49,340 | | | | 9,637,308 | |
| | | | |
| | | | | | | | | | | | | | | 25,256,225 | |
| | | | | | | | | | | | | | | | |
| | | | |
| Switzerland: 4.95% | | | | | | | | | | | | | | | | |
Novartis AG (Health Care, Pharmaceuticals) | | | | | | | | | | | 134,176 | | | | 9,545,743 | |
Zurich Insurance Group AG (Financials, Insurance) | | | | | | | | | | | 33,797 | | | | 8,842,447 | |
| | | | |
| | | | | | | | | | | | | | | 18,388,190 | |
| | | | | | | | | | | | | | | | |
| | | | |
| United Kingdom: 11.37% | | | | | | | | | | | | | | | | |
Reckitt Benckiser Group plc (Consumer Staples, Household Products) | | | | | | | | | | | 42,387 | | | | 3,794,110 | |
Smiths Group plc (Industrials, Industrial Conglomerates) | | | | | | | | | | | 632,005 | | | | 10,969,287 | |
United Business Media plc (Consumer Discretionary, Media) | | | | | | | | | | | 692,118 | | | | 6,086,794 | |
Vodafone Group plc (Telecommunication Services, Wireless Telecommunication Services) | | | | | | | | | | | 4,099,644 | | | | 11,280,390 | |
Wolseley plc (Industrials, Trading Companies & Distributors) | | | | | | | | | | | 193,849 | | | | 10,086,405 | |
| | | | |
| | | | | | | | | | | | | | | 42,216,986 | |
| | | | | | | | | | | | | | | | |
| | | | |
| United States: 5.80% | | | | | | | | | | | | | | | | |
Apple Incorporated (Information Technology, Technology Hardware, Storage & Peripherals) | | | | | | | | | | | 51,588 | | | | 5,857,302 | |
Coach Incorporated (Consumer Discretionary, Textiles, Apparel & Luxury Goods) | | | | | | | | | | | 208,070 | | | | 7,467,632 | |
Pfizer Incorporated (Health Care, Pharmaceuticals) | | | | | | | | | | | 259,195 | | | | 8,219,073 | |
| | | | |
| | | | | | | | | | | | | | | 21,544,007 | |
| | | | | | | | | | | | | | | | |
| | | | |
Total Common Stocks (Cost $296,855,318) | | | | | | | | | | | | | | | 316,615,804 | |
| | | | | | | | | | | | | | | | |
| | | | |
Exchange-Traded Funds: 1.50% | | | | | | | | | | | | | | | | |
| | | | |
| United States: 1.50% | | | | | | | | | | | | | | | | |
iShares MSCI ACWI ex US ETF | | | | | | | | | | | 136,900 | | | | 5,578,675 | |
| | | | | | | | | | | | | | | | |
| | | | |
Total Exchange-Traded Funds (Cost $5,581,837) | | | | | | | | | | | | | | | 5,578,675 | |
| | | | | | | | | | | | | | | | |
| | | | |
| | | | | | Expiration date | | | | | | | |
| Participation Notes: 1.83% | | | | | | | | | | | | | | | | |
| | | | |
| China: 1.83% | | | | | | | | | | | | | | | | |
HSBC Bank plc (Kweichow Moutai Company Limited Class A) (Consumer Staples, Beverages) † | | | | | | | 2-19-2019 | | | | 101,006 | | | | 4,746,576 | |
HSBC Bank plc (Kweichow Moutai Company Limited Class A) (Consumer Staples, Beverages) † | | | | | | | 12-4-2024 | | | | 43,031 | | | | 2,022,156 | |
| | | | |
Total Participation Notes (Cost $4,522,600) | | | | | | | | | | | | | | | 6,768,732 | |
| | | | | | | | | | | | | | | | |
The accompanying notes are an integral part of these financial statements.
| | | | | | |
| Portfolio of investments—October 31, 2016 | | Wells Fargo International Equity Fund | | | 11 | |
| | | | | | | | | | | | | | | | |
| Security name | | Yield | | | | | | Shares | | | Value | |
| | | | |
Short-Term Investments: 11.31% | | | | | | | | | | | | | | | | |
| | | | |
| Investment Companies: 11.31% | | | | | | | | | | | | | | | | |
Securities Lending Cash Investment LLC (l)(r)(u) | | | 0.69 | % | | | | | | | 3,155,666 | | | $ | 3,155,981 | |
Wells Fargo Government Money Market Fund Select Class (l)(u) | | | 0.32 | | | | | | | | 38,856,450 | | | | 38,856,450 | |
| | | | |
Total Short-Term Investments (Cost $42,012,124) | | | | | | | | | | | | | | | 42,012,431 | |
| | | | | | | | | | | | | | | | |
| | | | | | | | |
| Total investments in securities (Cost $348,971,879) * | | | 99.88 | % | | | 370,975,642 | |
Other assets and liabilities, net | | | 0.12 | | | | 457,188 | |
| | | | | | | | |
| Total net assets | | | 100.00 | % | | $ | 371,432,830 | |
| | | | | | | | |
| † | Non-income-earning security |
| « | All or a portion of this security is on loan. |
| 144A | The security may be resold in transactions exempt from registration, normally to qualified institutional buyers, pursuant to Rule 144A under the Securities Act of 1933. |
| (l) | The issuer of the security is an affiliated person of the Fund as defined in the Investment Company Act of 1940. |
| (r) | The investment is a non-registered investment vehicle purchased with cash collateral received from securities on loan. |
| (u) | The rate represents the 7-day annualized yield at period end. |
| * | Cost for federal income tax purposes is $350,861,419 and unrealized gains (losses) consists of: |
| | | | |
Gross unrealized gains | | $ | 31,916,657 | |
Gross unrealized losses | | | (11,802,434 | ) |
| | | | |
Net unrealized gains | | $ | 20,114,223 | |
The accompanying notes are an integral part of these financial statements.
| | | | |
| 12 | | Wells Fargo International Equity Fund | | Statement of assets and liabilities—October 31, 2016 |
| | | | |
| | | | |
| |
Assets | | | | |
Investments | | | | |
In unaffiliated securities (including $2,985,651 of securities loaned), at value (cost $306,959,755) | | $ | 328,963,211 | |
In affiliated securities, at value (cost $42,012,124) | | | 42,012,431 | |
| | | | |
Total investments, at value (cost $348,971,879) | | | 370,975,642 | |
Foreign currency, at value (cost $64,510) | | | 62,482 | |
Receivable for investments sold | | | 10,487,336 | |
Receivable for Fund shares sold | | | 358,931 | |
Receivable for dividends | | | 1,280,475 | |
Receivable for securities lending income | | | 19,844 | |
Unrealized gains on forward foreign currency contracts | | | 1,221,034 | |
Prepaid expenses and other assets | | | 72,485 | |
| | | | |
Total assets | | | 384,478,229 | |
| | | | |
| |
Liabilities | | | | |
Payable for investments purchased | | | 7,076,043 | |
Payable for Fund shares redeemed | | | 914,791 | |
Payable upon receipt of securities loaned | | | 3,155,674 | |
Management fee payable | | | 182,754 | |
Distribution fees payable | | | 19,100 | |
Cash collateral due to broker | | | 1,505,000 | |
Administration fees payable | | | 52,176 | |
Accrued expenses and other liabilities | | | 139,861 | |
| | | | |
Total liabilities | | | 13,045,399 | |
| | | | |
Total net assets | | $ | 371,432,830 | |
| | | | |
| |
NET ASSETS CONSIST OF | | | | |
Paid-in capital | | $ | 367,641,931 | |
Undistributed net investment income | | | 10,190,249 | |
Accumulated net realized losses on investments | | | (29,598,200 | ) |
Net unrealized gains on investments | | | 23,198,850 | |
| | | | |
Total net assets | | $ | 371,432,830 | |
| | | | |
| |
COMPUTATION OF NET ASSET VALUE AND OFFERING PRICE PER SHARE | | | | |
Net assets – Class A | | $ | 122,248,466 | |
Shares outstanding – Class A1 | | | 11,039,106 | |
Net asset value per share – Class A | | | $11.07 | |
Maximum offering price per share – Class A2 | | | $11.75 | |
Net assets – Class B | | $ | 950,254 | |
Shares outstanding – Class B1 | | | 87,941 | |
Net asset value per share – Class B | | | $10.81 | |
Net assets – Class C | | $ | 27,508,301 | |
Shares outstanding – Class C1 | | | 2,542,515 | |
Net asset value per share – Class C | | | $10.82 | |
Net assets – Class R | | $ | 2,028,995 | |
Shares outstanding – Class R1 | | | 181,204 | |
Net asset value per share – Class R | | | $11.20 | |
Net assets – Class R6 | | $ | 26,294 | |
Shares outstanding – Class R61 | | | 2,377 | |
Net asset value per share – Class R6 | | | $11.06 | |
Net assets – Administrator Class | | $ | 36,031,541 | |
Shares outstanding – Administrator Class1 | | | 3,312,084 | |
Net asset value per share – Administrator Class | | | $10.88 | |
Net assets – Institutional Class | | $ | 182,638,979 | |
Shares outstanding – Institutional Class1 | | | 16,521,897 | |
Net asset value per share – Institutional Class | | | $11.05 | |
| 1 | The Fund has an unlimited number of authorized shares. |
| 2 | Maximum offering price is computed as 100/94.25 of net asset value. On investments of $50,000 or more, the offering price is reduced. |
The accompanying notes are an integral part of these financial statements.
| | | | | | |
| Statement of operations—year ended October 31, 2016 | | Wells Fargo International Equity Fund | | | 13 | |
| | | | |
| | | | |
| |
Investment income | | | | |
Dividends (net of foreign withholding taxes of $957,380) | | $ | 12,685,650 | |
Securities lending income, net | | | 150,945 | |
Income from affiliated securities | | | 78,989 | |
| | | | |
Total investment income | | | 12,915,584 | |
| | | | |
| |
Expenses | | | | |
Management fee | | | 3,699,876 | |
Administration fees | | | | |
Class A | | | 289,346 | |
Class B | | | 3,583 | |
Class C | | | 65,144 | |
Class R | | | 4,332 | |
Class R6 | | | 7 | |
Administrator Class | | | 57,114 | |
Institutional Class | | | 252,935 | |
Shareholder servicing fees | | | | |
Class A | | | 344,459 | |
Class B | | | 4,265 | |
Class C | | | 77,553 | |
Class R | | | 5,157 | |
Administrator Class | | | 107,933 | |
Distribution fees | | | | |
Class B | | | 12,795 | |
Class C | | | 232,658 | |
Class R | | | 5,157 | |
Custody and accounting fees | | | 127,408 | |
Professional fees | | | 64,807 | |
Registration fees | | | 138,950 | |
Shareholder report expenses | | | 71,436 | |
Trustees’ fees and expenses | | | 21,195 | |
Other fees and expenses | | | 10,728 | |
| | | | |
Total expenses | | | 5,596,838 | |
Less: Fee waivers and/or expense reimbursements | | | (1,218,122 | ) |
| | | | |
Net expenses | | | 4,378,716 | |
| | | | |
Net investment income | | | 8,536,868 | |
| | | | |
| |
REALIZED AND UNREALIZED GAINS (LOSSES) ON INVESTMENTS | | | | |
| |
Net realized gains (losses) on: | | | | |
Unaffiliated securities | | | (27,262,853 | ) |
Forward foreign currency contract transactions | | | 2,906,581 | |
| | | | |
Net realized losses on investments | | | (24,356,272 | ) |
| | | | |
| |
Net change in unrealized gains (losses) on: | | | | |
Unaffiliated securities | | | (1,627,156 | ) |
Affiliated securities | | | 307 | |
Forward foreign currency contract transactions | | | (14,350 | ) |
| | | | |
Net change in unrealized gains (losses) on investments | | | (1,641,199 | ) |
| | | | |
Net realized and unrealized gains (losses) on investments | | | (25,997,471 | ) |
| | | | |
Net decrease in net assets resulting from operations | | $ | (17,460,603 | ) |
| | | | |
The accompanying notes are an integral part of these financial statements.
| | | | |
| 14 | | Wells Fargo International Equity Fund | | Statement of changes in net assets |
| | | | | | | | | | | | | | | | |
| | | Year ended
October 31, 2016 | | | Year ended
October 31, 2015 | |
| | | | |
Operations | | | | | | | | | | | | | | | | |
Net investment income | | | | | | $ | 8,536,868 | | | | | | | $ | 3,816,017 | |
Net realized gains (losses) on investments | | | | | | | (24,356,272 | ) | | | | | | | 6,811,584 | |
Net change in unrealized gains (losses) on investments | | | | | | | (1,641,199 | ) | | | | | | | (5,436,792 | ) |
| | | | |
Net increase (decrease) in net assets resulting from operations | | | | | | | (17,460,603 | ) | | | | | | | 5,190,809 | |
| | | | |
| | | | |
Distributions to shareholders from | | | | | | | | | | | | | | | | |
Net investment income | | | | | | | | | | | | | | | | |
Class A | | | | | | | (1,980,548 | ) | | | | | | | (4,144,449 | ) |
Class B | | | | | | | (4,737 | ) | | | | | | | (133,491 | ) |
Class C | | | | | | | (292,082 | ) | | | | | | | (589,249 | ) |
Class R | | | | | | | (24,021 | ) | | | | | | | (58,692 | ) |
Class R6 | | | | | | | (338 | ) | | | | | | | 0 | 1 |
Administrator Class | | | | | | | (731,926 | ) | | | | | | | (444,265 | ) |
Institutional Class | | | | | | | (3,153,699 | ) | | | | | | | (3,012,972 | ) |
| | | | |
Total distributions to shareholders | | | | | | | (6,187,351 | ) | | | | | | | (8,383,118 | ) |
| | | | |
| | | | |
Capital share transactions | | | Shares | | | | | | | | Shares | | | | | |
Proceeds from shares sold | | | | | | | | | | | | | | | | |
Class A | | | 3,672,410 | | | | 40,169,639 | | | | 5,686,291 | | | | 68,771,982 | |
Class B | | | 815 | | | | 8,671 | | | | 4,367 | | | | 52,179 | |
Class C | | | 998,881 | | | | 10,835,255 | | | | 1,364,465 | | | | 16,286,613 | |
Class R | | | 72,262 | | | | 801,881 | | | | 127,293 | | | | 1,581,522 | |
Class R6 | | | 51 | | | | 541 | | | | 2,296 | 1 | | | 25,000 | 1 |
Administrator Class | | | 2,805,944 | | | | 30,263,453 | | | | 5,575,269 | | | | 66,219,302 | |
Institutional Class | | | 9,957,611 | | | | 108,139,415 | | | | 14,609,456 | | | | 168,904,517 | |
| | | | |
| | | | | | | 190,218,855 | | | | | | | | 321,841,115 | |
| | | | |
Reinvestment of distributions | | | | | | | | | | | | | | | | |
Class A | | | 167,795 | | | | 1,860,967 | | | | 350,957 | | | | 3,835,959 | |
Class B | | | 431 | | | | 4,689 | | | | 12,086 | | | | 129,201 | |
Class C | | | 23,355 | | | | 254,804 | | | | 47,129 | | | | 508,047 | |
Class R | | | 822 | | | | 9,244 | | | | 2,725 | | | | 30,167 | |
Class R6 | | | 30 | | | | 338 | | | | 0 | 1 | | | 0 | 1 |
Administrator Class | | | 67,082 | | | | 731,191 | | | | 41,287 | | | | 443,423 | |
Institutional Class | | | 230,119 | | | | 2,542,811 | | | | 220,501 | | | | 2,396,847 | |
| | | | |
| | | | | | | 5,404,044 | | | | | | | | 7,343,644 | |
| | | | |
Payment for shares redeemed | | | | | | | | | | | | | | | | |
Class A | | | (5,436,299 | ) | | | (57,973,044 | ) | | | (2,058,420 | ) | | | (23,991,275 | ) |
Class B | | | (148,673 | ) | | | (1,557,542 | ) | | | (158,096 | ) | | | (1,803,160 | ) |
Class C | | | (1,053,145 | ) | | | (11,165,445 | ) | | | (316,369 | ) | | | (3,631,747 | ) |
Class R | | | (76,036 | ) | | | (818,347 | ) | | | (84,187 | ) | | | (995,805 | ) |
Administrator Class | | | (4,192,576 | ) | | | (44,163,215 | ) | | | (2,153,660 | ) | | | (24,140,441 | ) |
Institutional Class | | | (10,441,636 | ) | | | (109,679,342 | ) | | | (3,722,844 | ) | | | (43,032,964 | ) |
| | | | |
| | | | | | | (225,356,935 | ) | | | | | | | (97,595,392 | ) |
| | | | |
Net increase (decrease) in net assets resulting from capital share transactions | | | | | | | (29,734,036 | ) | | | | | | | 231,589,367 | |
| | | | |
Total increase (decrease) in net assets | | | | | | | (53,381,990 | ) | | | | | | | 228,397,058 | |
| | | | |
| | | | |
Net assets | | | | | | | | | | | | | | | | |
Beginning of period | | | | | | | 424,814,820 | | | | | | | | 196,417,762 | |
| | | | |
End of period | | | | | | $ | 371,432,830 | | | | | | | $ | 424,814,820 | |
| | | | |
Undistributed net investment income | | | | | | $ | 10,190,249 | | | | | | | $ | 4,903,871 | |
| | | | |
| 1 | For the period from September 30, 2015 (commencement of class operations) to October 31, 2015 |
The accompanying notes are an integral part of these financial statements.
| | | | | | |
| Financial highlights | | Wells Fargo International Equity Fund | | | 15 | |
(For a share outstanding throughout each period)
| | | | | | | | | | | | | | | | | | | | |
| | | Year ended October 31 | |
| CLASS A | | 2016 | | | 2015 | | | 2014 | | | 2013 | | | 2012 | |
Net asset value, beginning of period | | | $11.53 | | | | $11.28 | | | | $11.98 | | | | $9.77 | | | | $9.82 | |
Net investment income | | | 0.22 | | | | 0.18 | 1 | | | 0.37 | 1 | | | 0.21 | | | | 0.25 | |
Net realized and unrealized gains (losses) on investments | | | (0.54 | ) | | | 0.57 | | | | (0.81 | ) | | | 2.27 | | | | (0.09 | ) |
| | | | | | | | | | | | | | | | | | | | |
Total from investment operations | | | (0.32 | ) | | | 0.75 | | | | (0.44 | ) | | | 2.48 | | | | 0.16 | |
Distributions to shareholders from | | | | | | | | | | | | | | | | | | | | |
Net investment income | | | (0.14 | ) | | | (0.50 | ) | | | (0.26 | ) | | | (0.27 | ) | | | (0.21 | ) |
Net asset value, end of period | | | $11.07 | | | | $11.53 | | | | $11.28 | | | | $11.98 | | | | $9.77 | |
Total return2 | | | (2.76 | )% | | | 6.85 | % | | | (3.77 | )% | | | 25.99 | % | | | 1.83 | % |
Ratios to average net assets (annualized) | | | | | | | | | | | | | | | | | | | | |
Gross expenses | | | 1.47 | % | | | 1.53 | % | | | 1.53 | % | | | 1.56 | % | | | 1.53 | % |
Net expenses | | | 1.12 | % | | | 1.09 | % | | | 1.09 | % | | | 1.09 | % | | | 1.09 | % |
Net investment income | | | 2.04 | % | | | 1.50 | % | | | 3.14 | % | | | 2.03 | % | | | 2.49 | % |
Supplemental data | | | | | | | | | | | | | | | | | | | | |
Portfolio turnover rate | | | 65 | % | | | 27 | % | | | 32 | % | | | 38 | % | | | 115 | % |
Net assets, end of period (000s omitted) | | | $122,248 | | | | $145,654 | | | | $97,640 | | | | $115,821 | | | | $114,219 | |
| 1 | Calculated based upon average shares outstanding |
| 2 | Total return calculations do not include any sales charges. |
The accompanying notes are an integral part of these financial statements.
| | | | |
| 16 | | Wells Fargo International Equity Fund | | Financial highlights |
(For a share outstanding throughout each period)
| | | | | | | | | | | | | | | | | | | | |
| | | Year ended October 31 | |
| CLASS B | | 2016 | | | 2015 | | | 2014 | | | 2013 | | | 2012 | |
Net asset value, beginning of period | | | $11.21 | | | | $10.95 | | | | $11.62 | | | | $9.47 | | | | $9.48 | |
Net investment income | | | 0.12 | 1 | | | 0.08 | 1 | | | 0.28 | 1 | | | 0.13 | 1 | | | 0.16 | 1 |
Net realized and unrealized gains (losses) on investments | | | (0.50 | ) | | | 0.56 | | | | (0.79 | ) | | | 2.21 | | | | (0.07 | ) |
| | | | | | | | | | | | | | | | | | | | |
Total from investment operations | | | (0.38 | ) | | | 0.64 | | | | (0.51 | ) | | | 2.34 | | | | 0.09 | |
Distributions to shareholders from | | | | | | | | | | | | | | | | | | | | |
Net investment income | | | (0.02 | ) | | | (0.38 | ) | | | (0.16 | ) | | | (0.19 | ) | | | (0.10 | ) |
Net asset value, end of period | | | $10.81 | | | | $11.21 | | | | $10.95 | | | | $11.62 | | | | $9.47 | |
Total return2 | | | (3.46 | )% | | | 6.00 | % | | | (4.48 | )% | | | 25.07 | % | | | 0.99 | % |
Ratios to average net assets (annualized) | | | | | | | | | | | | | | | | | | | | |
Gross expenses | | | 2.21 | % | | | 2.29 | % | | | 2.28 | % | | | 2.31 | % | | | 2.28 | % |
Net expenses | | | 1.87 | % | | | 1.84 | % | | | 1.84 | % | | | 1.84 | % | | | 1.84 | % |
Net investment income | | | 1.17 | % | | | 0.68 | % | | | 2.40 | % | | | 1.27 | % | | | 1.67 | % |
Supplemental data | | | | | | | | | | | | | | | | | | | | |
Portfolio turnover rate | | | 65 | % | | | 27 | % | | | 32 | % | | | 38 | % | | | 115 | % |
Net assets, end of period (000s omitted) | | | $950 | | | | $2,639 | | | | $4,127 | | | | $6,810 | | | | $8,303 | |
| 1 | Calculated based upon average shares outstanding |
| 2 | Total return calculations do not include any sales charges. |
The accompanying notes are an integral part of these financial statements.
| | | | | | |
| Financial highlights | | Wells Fargo International Equity Fund | | | 17 | |
(For a share outstanding throughout each period)
| | | | | | | | | | | | | | | | | | | | |
| | | Year ended October 31 | |
| CLASS C | | 2016 | | | 2015 | | | 2014 | | | 2013 | | | 2012 | |
Net asset value, beginning of period | | | $11.30 | | | | $11.06 | | | | $11.75 | | | | $9.58 | | | | $9.59 | |
Net investment income | | | 0.14 | | | | 0.08 | 1 | | | 0.27 | 1 | | | 0.14 | 1 | | | 0.16 | 1 |
Net realized and unrealized gains (losses) on investments | | | (0.53 | ) | | | 0.57 | | | | (0.79 | ) | | | 2.22 | | | | (0.07 | ) |
| | | | | | | | | | | | | | | | | | | | |
Total from investment operations | | | (0.39 | ) | | | 0.65 | | | | (0.52 | ) | | | 2.36 | | | | 0.09 | |
Distributions to shareholders from | | | | | | | | | | | | | | | | | | | | |
Net investment income | | | (0.09 | ) | | | (0.41 | ) | | | (0.17 | ) | | | (0.19 | ) | | | (0.10 | ) |
Net asset value, end of period | | | $10.82 | | | | $11.30 | | | | $11.06 | | | | $11.75 | | | | $9.58 | |
Total return2 | | | (3.43 | )% | | | 6.03 | % | | | (4.49 | )% | | | 25.05 | % | | | 1.08 | % |
Ratios to average net assets (annualized) | | | | | | | | | | | | | | | | | | | | |
Gross expenses | | | 2.22 | % | | | 2.28 | % | | | 2.28 | % | | | 2.31 | % | | | 2.28 | % |
Net expenses | | | 1.87 | % | | | 1.84 | % | | | 1.84 | % | | | 1.84 | % | | | 1.84 | % |
Net investment income | | | 1.33 | % | | | 0.72 | % | | | 2.37 | % | | | 1.30 | % | | | 1.72 | % |
Supplemental data | | | | | | | | | | | | | | | | | | | | |
Portfolio turnover rate | | | 65 | % | | | 27 | % | | | 32 | % | | | 38 | % | | | 115 | % |
Net assets, end of period (000s omitted) | | | $27,508 | | | | $29,080 | | | | $16,346 | | | | $16,997 | | | | $16,760 | |
| 1 | Calculated based upon average shares outstanding |
| 2 | Total return calculations do not include any sales charges. |
The accompanying notes are an integral part of these financial statements.
| | | | |
| 18 | | Wells Fargo International Equity Fund | | Financial highlights |
(For a share outstanding throughout each period)
| | | | | | | | | | | | | | | | | | | | |
| | | Year ended October 31 | |
| CLASS R | | 2016 | | | 2015 | | | 2014 | | | 2013 | | | 2012 | |
Net asset value, beginning of period | | | $11.66 | | | | $11.40 | | | | $11.96 | | | | $9.75 | | | | $9.79 | |
Net investment income | | | 0.19 | 1 | | | 0.15 | 1 | | | 0.32 | 1 | | | 0.18 | 1 | | | 0.20 | 1 |
Net realized and unrealized gains (losses) on investments | | | (0.53 | ) | | | 0.57 | | | | (0.79 | ) | | | 2.27 | | | | (0.06 | ) |
| | | | | | | | | | | | | | | | | | | | |
Total from investment operations | | | (0.34 | ) | | | 0.72 | | | | (0.47 | ) | | | 2.45 | | | | 0.14 | |
Distributions to shareholders from | | | | | | | | | | | | | | | | | | | | |
Net investment income | | | (0.12 | ) | | | (0.46 | ) | | | (0.09 | ) | | | (0.24 | ) | | | (0.18 | ) |
Net asset value, end of period | | | $11.20 | | | | $11.66 | | | | $11.40 | | | | $11.96 | | | | $9.75 | |
Total return | | | (2.94 | )% | | | 6.53 | % | | | (4.00 | )% | | | 25.68 | % | | | 1.58 | % |
Ratios to average net assets (annualized) | | | | | | | | | | | | | | | | | | | | |
Gross expenses | | | 1.72 | % | | | 1.78 | % | | | 1.78 | % | | | 1.81 | % | | | 1.78 | % |
Net expenses | | | 1.37 | % | | | 1.34 | % | | | 1.34 | % | | | 1.34 | % | | | 1.34 | % |
Net investment income | | | 1.77 | % | | | 1.23 | % | | | 2.71 | % | | | 1.72 | % | | | 2.11 | % |
Supplemental data | | | | | | | | | | | | | | | | | | | | |
Portfolio turnover rate | | | 65 | % | | | 27 | % | | | 32 | % | | | 38 | % | | | 115 | % |
Net assets, end of period (000s omitted) | | | $2,029 | | | | $2,147 | | | | $1,576 | | | | $2,234 | | | | $2,196 | |
| 1 | Calculated based upon average shares outstanding |
The accompanying notes are an integral part of these financial statements.
| | | | | | |
| Financial highlights | | Wells Fargo International Equity Fund | | | 19 | |
(For a share outstanding throughout each period)
| | | | | | | | |
| | | Year ended October 31 | |
| CLASS R6 | | 2016 | | | 20151 | |
Net asset value, beginning of period | | | $11.49 | | | | $10.89 | |
Net investment income | | | 0.24 | | | | 0.00 | 2 |
Net realized and unrealized gains (losses) on investments | | | (0.52 | ) | | | 0.60 | |
| | | | | | | | |
Total from investment operations | | | (0.28 | ) | | | 0.60 | |
Distributions to shareholders from | | | | | | | | |
Net investment income | | | (0.15 | ) | | | 0.00 | |
Net asset value, end of period | | | $11.06 | | | | $11.49 | |
Total return3 | | | (2.46 | )% | | | 5.51 | % |
Ratios to average net assets (annualized) | | | | | | | | |
Gross expenses | | | 1.04 | % | | | 1.05 | % |
Net expenses | | | 0.85 | % | | | 0.88 | % |
Net investment income | | | 2.31 | % | | | 0.23 | % |
Supplemental data | | | | | | | | |
Portfolio turnover rate | | | 65 | % | | | 27 | % |
Net assets, end of period (000s omitted) | | | $26 | | | | $26 | |
| 1 | For the period from September 30, 2015 (commencement of class operations) to October 31, 2015 |
| 2 | Amount is less than $0.005 per share. |
| 3 | Returns for periods of less than one year are not annualized. |
The accompanying notes are an integral part of these financial statements.
| | | | |
| 20 | | Wells Fargo International Equity Fund | | Financial highlights |
(For a share outstanding throughout each period)
| | | | | | | | | | | | | | | | | | | | |
| | | Year ended October 31 | |
| ADMINISTRATOR CLASS | | 2016 | | | 2015 | | | 2014 | | | 2013 | | | 2012 | |
Net asset value, beginning of period | | | $11.33 | | | | $11.09 | | | | $11.79 | | | | $9.62 | | | | $9.67 | |
Net investment income | | | 0.22 | | | | 0.17 | 1 | | | 0.37 | 1 | | | 0.22 | | | | 0.25 | |
Net realized and unrealized gains (losses) on investments | | | (0.53 | ) | | | 0.57 | | | | (0.80 | ) | | | 2.22 | | | | (0.09 | ) |
| | | | | | | | | | | | | | | | | | | | |
Total from investment operations | | | (0.31 | ) | | | 0.74 | | | | (0.43 | ) | | | 2.44 | | | | 0.16 | |
Distributions to shareholders from | | | | | | | | | | | | | | | | | | | | |
Net investment income | | | (0.14 | ) | | | (0.50 | ) | | | (0.27 | ) | | | (0.27 | ) | | | (0.21 | ) |
Net asset value, end of period | | | $10.88 | | | | $11.33 | | | | $11.09 | | | | $11.79 | | | | $9.62 | |
Total return | | | (2.71 | )% | | | 6.89 | % | | | (3.82 | )% | | | 26.00 | % | | | 1.88 | % |
Ratios to average net assets (annualized) | | | | | | | | | | | | | | | | | | | | |
Gross expenses | | | 1.38 | % | | | 1.40 | % | | | 1.37 | % | | | 1.37 | % | | | 1.36 | % |
Net expenses | | | 1.12 | % | | | 1.09 | % | | | 1.09 | % | | | 1.09 | % | | | 1.09 | % |
Net investment income | | | 1.93 | % | | | 1.44 | % | | | 3.21 | % | | | 2.08 | % | | | 2.52 | % |
Supplemental data | | | | | | | | | | | | | | | | | | | | |
Portfolio turnover rate | | | 65 | % | | | 27 | % | | | 32 | % | | | 38 | % | | | 115 | % |
Net assets, end of period (000s omitted) | | | $36,032 | | | | $52,469 | | | | $12,962 | | | | $3,955 | | | | $3,505 | |
| 1 | Calculated based upon average shares outstanding |
The accompanying notes are an integral part of these financial statements.
| | | | | | |
| Financial highlights | | Wells Fargo International Equity Fund | | | 21 | |
(For a share outstanding throughout each period)
| | | | | | | | | | | | | | | | | | | | |
| | | Year ended October 31 | |
| INSTITUTIONAL CLASS | | 2016 | | | 2015 | | | 2014 | | | 2013 | | | 2012 | |
Net asset value, beginning of period | | | $11.49 | | | | $11.25 | | | | $11.96 | | | | $9.76 | | | | $9.83 | |
Net investment income | | | 0.23 | | | | 0.19 | 1 | | | 0.37 | 1 | | | 0.24 | 1 | | | 0.37 | |
Net realized and unrealized gains (losses) on investments | | | (0.52 | ) | | | 0.58 | | | | (0.77 | ) | | | 2.26 | | | | (0.19 | ) |
| | | | | | | | | | | | | | | | | | | | |
Total from investment operations | | | (0.29 | ) | | | 0.77 | | | | (0.40 | ) | | | 2.50 | | | | 0.18 | |
Distributions to shareholders from | | | | | | | | | | | | | | | | | | | | |
Net investment income | | | (0.15 | ) | | | (0.53 | ) | | | (0.31 | ) | | | (0.30 | ) | | | (0.25 | ) |
Net asset value, end of period | | | $11.05 | | | | $11.49 | | | | $11.25 | | | | $11.96 | | | | $9.76 | |
Total return | | | (2.48 | )% | | | 7.07 | % | | | (3.53 | )% | | | 26.31 | % | | | 2.05 | % |
Ratios to average net assets (annualized) | | | | | | | | | | | | | | | | | | | | |
Gross expenses | | | 1.14 | % | | | 1.15 | % | | | 1.10 | % | | | 1.13 | % | | | 1.10 | % |
Net expenses | | | 0.87 | % | | | 0.84 | % | | | 0.84 | % | | | 0.84 | % | | | 0.84 | % |
Net investment income | | | 2.27 | % | | | 1.67 | % | | | 3.18 | % | | | 2.29 | % | | | 2.67 | % |
Supplemental data | | | | | | | | | | | | | | | | | | | | |
Portfolio turnover rate | | | 65 | % | | | 27 | % | | | 32 | % | | | 38 | % | | | 115 | % |
Net assets, end of period (000s omitted) | | | $182,639 | | | | $192,799 | | | | $63,766 | | | | $82,982 | | | | $138,245 | |
| 1 | Calculated based upon average shares outstanding |
The accompanying notes are an integral part of these financial statements.
| | | | |
| 22 | | Wells Fargo International Equity Fund | | Notes to financial statements |
1. ORGANIZATION
Wells Fargo Funds Trust (the “Trust”), a Delaware statutory trust organized on March 10, 1999, is an open-end management investment company registered under the Investment Company Act of 1940, as amended (the “1940 Act”). As an investment company, the Trust follows the accounting and reporting guidance in Financial Accounting Standards Board (“FASB”) Accounting Standards Codification Topic 946, Financial Services – Investment Companies. These financial statements report on the Wells Fargo International Equity Fund (the “Fund”) which is a diversified series of the Trust.
2. SIGNIFICANT ACCOUNTING POLICIES
The following significant accounting policies, which are consistently followed in the preparation of the financial statements of the Fund, are in conformity with U.S. generally accepted accounting principles which require management to make estimates and assumptions that affect the reported amounts of assets and liabilities, disclosure of contingent assets and liabilities at the date of the financial statements, and the reported amounts of revenues and expenses during the reporting period. Actual results could differ from those estimates.
Securities valuation
All investments are valued each business day as of the close of regular trading on the New York Stock Exchange (generally 4 p.m. Eastern Time), although the Fund may deviate from this calculation time under unusual or unexpected circumstances.
Equity securities that are listed on a foreign or domestic exchange or market are valued at the official closing price or, if none, the last sales price. If no sale occurs on the principal exchange or market that day, the prior day’s price will be deemed “stale” and a fair value price will be determined in accordance with the Fund’s Valuation Procedures.
The values of securities denominated in foreign currencies are translated into U.S. dollars at rates provided by an independent foreign currency pricing source at a time each business day specified by the Management Valuation Team of Wells Fargo Funds Management, LLC (“Funds Management”).
Many securities markets and exchanges outside the U.S. close prior to the close of the New York Stock Exchange and therefore may not fully reflect trading or events that occur after the close of the principal exchange in which the foreign securities are traded, but before the close of the New York Stock Exchange. If such trading or events are expected to materially affect the value of such securities, then fair value pricing procedures approved by the Board of Trustees of the Fund are applied. These procedures take into account multiple factors including movements in U.S. securities markets after foreign exchanges close. Foreign securities that are fair valued under these procedures are categorized as Level 2 and the application of these procedures may result in transfers between Level 1 and Level 2. Depending on market activity, such fair valuations may be frequent. Such fair value pricing may result in net asset values that are higher or lower than net asset values based on the last reported sales price or latest quoted bid price. On October 31, 2016, such fair value pricing was not used in pricing foreign securities.
Investments in registered open-end investment companies are valued at net asset value. Interests in non-registered investment vehicles that are redeemable at net asset value are fair valued normally at net asset value.
Investments which are not valued using any of the methods discussed above are valued at their fair value, as determined in good faith by the Board of Trustees. The Board of Trustees has established a Valuation Committee comprised of the Trustees and has delegated to it the authority to take any actions regarding the valuation of portfolio securities that the Valuation Committee deems necessary or appropriate, including determining the fair value of portfolio securities, unless the determination has been delegated to the Management Valuation Team. The Board of Trustees retains the authority to make or ratify any valuation decisions or approve any changes to the Valuation Procedures as it deems appropriate. On a quarterly basis, the Board of Trustees receives reports on any valuation actions taken by the Valuation Committee or the Management Valuation Team which may include items for ratification.
Valuations of fair valued securities are compared to the next actual sales price when available, or other appropriate market values, to assess the continued appropriateness of the fair valuation methodologies used. These securities are fair valued on a day-to-day basis, taking into consideration changes to appropriate market information and any significant changes to the inputs considered in the valuation process until there is a readily available price provided on an exchange or by an independent pricing service. Valuations received from an independent pricing service or independent broker-dealer quotes are periodically validated by comparisons to most recent trades and valuations provided by other independent pricing services in addition to the review of prices by the manager and/or subadviser. Unobservable inputs used in determining fair valuations are identified based on the type of security, taking into consideration factors utilized by market participants in valuing the investment, knowledge about the issuer and the current market environment.
| | | | | | |
| Notes to financial statements | | Wells Fargo International Equity Fund | | | 23 | |
Foreign currency translation
The accounting records of the Fund are maintained in U.S. dollars. The values of other assets and liabilities denominated in foreign currencies are translated into U.S. dollars at rates provided by an independent foreign currency pricing source at a time each business day specified by the Management Valuation Team. Purchases and sales of securities, and income and expenses are converted at the rate of exchange on the respective dates of such transactions. Net realized foreign exchange gains or losses arise from sales of foreign currencies, currency gains or losses realized between the trade and settlement dates on securities transactions, and the difference between the amounts of dividends, interest and foreign withholding taxes recorded and the U.S. dollar equivalent of the amounts actually paid or received. Net unrealized foreign exchange gains and losses arise from changes in the fair value of assets and liabilities other than investments in securities resulting from changes in exchange rates. The changes in net assets arising from changes in exchange rates and the changes in net assets resulting from changes in market prices of securities are not separately presented. Such changes are included in net realized and unrealized gains or losses from investments.
Participation notes
The Fund may invest in participation notes to gain exposure to securities in certain foreign markets. Participation notes are issued by banks or broker-dealers and are designed to offer a return linked to a particular underlying foreign security. Participation notes involve transaction costs, which may be higher than those applicable to the underlying foreign security. The holder of the participation note is entitled to receive from the bank or broker-dealer, an amount equal to the dividend paid by the issuer of the underlying foreign security; however, the holder is not entitled to the same rights (i.e. dividends, voting rights) as an owner of the underlying foreign security. Investments in participation notes involve risks beyond those normally associated with a direct investment in an underlying security. The Fund has no rights against the issuer of the underlying foreign security and participation notes expose the Fund to counterparty risk in the event the counterparty does not perform. There is also no assurance there will be a secondary trading market for the participation note or that the trading price of the participation note will equal the underlying value of the foreign security that it seeks to replicate.
Forward foreign currency contracts
The Fund is subject to foreign currency exchange rate risk in the normal course of pursuing its investment objectives. A forward foreign currency contract is an agreement between two parties to purchase or sell a specific currency for an agreed-upon price at a future date. The Fund enters into forward foreign currency contracts to facilitate transactions in foreign-denominated securities and to attempt to minimize the risk to the Fund from adverse changes in the relationship between currencies. Forward foreign currency contracts are recorded at the forward rate and marked-to-market daily. When the contracts are closed, realized gains and losses arising from such transactions are recorded as realized gains or losses on forward foreign currency contract transactions. The Fund could be exposed to risks if the counterparties to the contracts are unable to meet the terms of their contracts or if the value of the foreign currency changes unfavorably. The Fund’s maximum risk of loss from counterparty credit risk is the unrealized gains on the contracts. This risk may be mitigated if there is a master netting arrangement between the Fund and the counterparty.
Security loans
The Fund may lend its securities from time to time in order to earn additional income in the form of fees or interest on securities received as collateral or the investment of any cash received as collateral. The Fund continues to receive interest or dividends on the securities loaned. The Fund receives collateral in the form of cash or securities with a value at least equal to the value of the securities on loan. The value of the loaned securities is determined at the close of each business day and any additional required collateral is delivered to the Fund on the next business day. In a securities lending transaction, the net asset value of the Fund will be affected by an increase or decrease in the value of the securities loaned and by an increase or decrease in the value of the instrument in which collateral is invested. The amount of securities lending activity undertaken by the Fund fluctuates from time to time. In the event of default or bankruptcy by the borrower, the Fund may be prevented from recovering the loaned securities or gaining access to the collateral or may experience delays or costs in doing so. In addition, the investment of any cash collateral received may lose all or part of its value. The Fund has the right under the lending agreement to recover the securities from the borrower on demand.
The Fund lends its securities through an unaffiliated securities lending agent. Cash collateral received in connection with its securities lending transactions is invested in Securities Lending Cash Investments, LLC (the “Securities Lending Fund”). The Securities Lending Fund is exempt from registration under Section 3(c)(7) of the 1940 Act and is managed by Funds Management and is subadvised by Wells Capital Management Incorporated (“WellsCap”), an affiliate of Funds Management and an indirect wholly owned subsidiary of Wells Fargo & Company (“Wells Fargo”). Funds Management receives an advisory fee starting at 0.05% and declining to 0.01% as the average daily net assets of the Securities Lending
| | | | |
| 24 | | Wells Fargo International Equity Fund | | Notes to financial statements |
Fund increase. All of the fees received by Funds Management are paid to WellsCap for its services as subadviser. The Securities Lending Fund seeks to provide a positive return compared to the daily Fed Funds Open Rate by investing in high-quality, U.S. dollar-denominated short-term money market instruments. Securities Lending Fund investments are valued at the evaluated bid price provided by an independent pricing service. Income earned from investment in the Securities Lending Fund is included in securities lending income on the Statement of Operations.
Security transactions and income recognition
Securities transactions are recorded on a trade date basis. Realized gains or losses are recorded on the basis of identified cost.
Dividend income is recognized on the ex-dividend date, except for certain dividends from foreign securities, which are recorded as soon as the custodian verifies the ex-dividend date. Dividend income from foreign securities is recorded net of foreign taxes withheld where recovery of such taxes is not assured.
Distributions to shareholders
Distributions to shareholders from net investment income and net realized gains, if any, are recorded on the ex-dividend date. Such distributions are determined in conformity with federal income tax regulations, which may differ in amount or character from net investment income and realized gains recognized for purposes of U.S. generally accepted accounting principles.
Federal and other taxes
The Fund intends to continue to qualify as a regulated investment company by distributing substantially all of its investment company taxable income and any net realized capital gains (after reduction for capital loss carryforwards) sufficient to relieve it from all, or substantially all, federal income taxes. Accordingly, no provision for federal income taxes was required.
The Fund’s income and federal excise tax returns and all financial records supporting those returns for the prior three fiscal years are subject to examination by the federal and Delaware revenue authorities. Management has analyzed the Fund’s tax positions taken on federal, state, and foreign tax returns for all open tax years and does not believe that there are any uncertain tax positions that require recognition of a tax liability.
Reclassifications are made to the Fund’s capital accounts for permanent tax differences to reflect income and gains available for distribution (or available capital loss carryforwards) under federal income tax regulations. U.S. generally accepted accounting principles require that certain components of net assets be adjusted to reflect permanent differences between financial and tax reporting. These reclassifications have no effect on net assets or net asset values per share. The primary permanent differences causing such reclassifications are due to expiration of capital loss carryforwards and foreign currency transactions. At October 31, 2016, as a result of permanent book-to-tax differences, the following reclassification adjustments were made on the Statement of Assets and Liabilities:
| | | | |
| Paid-in capital | | Undistributed net
investment income | | Accumulated net
realized losses
on investments |
| $(43,946,020) | | $2,936,861 | | $41,009,159 |
As of October 31, 2016, the Fund had capital loss carryforwards which consist of $22,277,977 in short-term capital losses and $5,430,684 in long-term capital losses.
Class allocations
The separate classes of shares offered by the Fund differ principally in applicable sales charges, distribution, shareholder servicing, and administration fees. Class specific expenses are charged directly to that share class. Investment income, common expenses, and realized and unrealized gains (losses) on investments are allocated daily to each class of shares based on the relative proportion of net assets of each class.
3. FAIR VALUATION MEASUREMENTS
Fair value measurements of investments are determined within a framework that has established a fair value hierarchy based upon the various data inputs utilized in determining the value of the Fund’s investments. The three-level hierarchy gives the highest priority to unadjusted quoted prices in active markets for identical assets or liabilities (Level 1) and the
| | | | | | |
| Notes to financial statements | | Wells Fargo International Equity Fund | | | 25 | |
lowest priority to significant unobservable inputs (Level 3). The Fund’s investments are classified within the fair value hierarchy based on the lowest level of input that is significant to the fair value measurement. The inputs are summarized into three broad levels as follows:
| ∎ | | Level 1 – quoted prices in active markets for identical securities |
| ∎ | | Level 2 – other significant observable inputs (including quoted prices for similar securities, interest rates, prepayment speeds, credit risk, use of amortized cost, etc.) |
| ∎ | | Level 3 – significant unobservable inputs (including the Fund’s own assumptions in determining the fair value of investments) |
The inputs or methodologies used for valuing investments in securities are not necessarily an indication of the risk associated with investing in those securities.
The following is a summary of the inputs used in valuing the Fund’s assets and liabilities as of October 31, 2016:
| | | | | | | | | | | | | | | | |
| | | Quoted prices
(Level 1) | | | Other significant
observable inputs
(Level 2) | | | Significant
unobservable inputs
(Level 3) | | | Total | |
Assets | | | | | | | | | | | | | | | | |
Investments in: | | | | | | | | | | | | | | | | |
| | | | |
Common stocks | | | | | | | | | | | | | | | | |
Brazil | | $ | 884,028 | | | $ | 0 | | | $ | 0 | | | $ | 884,028 | |
Canada | | | 8,677,796 | | | | 0 | | | | 0 | | | | 8,677,796 | |
China | | | 28,866,936 | | | | 0 | | | | 0 | | | | 28,866,936 | |
Denmark | | | 3,275,037 | | | | 0 | | | | 0 | | | | 3,275,037 | |
France | | | 11,504,941 | | | | 0 | | | | 0 | | | | 11,504,941 | |
Germany | | | 54,473,804 | | | | 0 | | | | 0 | | | | 54,473,804 | |
Hong Kong | | | 9,112,312 | | | | 0 | | | | 0 | | | | 9,112,312 | |
Italy | | | 17,188,133 | | | | 0 | | | | 0 | | | | 17,188,133 | |
Japan | | | 50,265,125 | | | | 0 | | | | 0 | | | | 50,265,125 | |
Netherlands | | | 20,252,267 | | | | 0 | | | | 0 | | | | 20,252,267 | |
Norway | | | 4,710,017 | | | | 0 | | | | 0 | | | | 4,710,017 | |
South Korea | | | 25,256,225 | | | | 0 | | | | 0 | | | | 25,256,225 | |
Switzerland | | | 18,388,190 | | | | 0 | | | | 0 | | | | 18,388,190 | |
United Kingdom | | | 42,216,986 | | | | 0 | | | | 0 | | | | 42,216,986 | |
United States | | | 21,544,007 | | | | 0 | | | | 0 | | | | 21,544,007 | |
| | | | |
Exchange-traded funds | | | | | | | | | | | | | | | | |
United States | | | 5,578,675 | | | | 0 | | | | 0 | | | | 5,578,675 | |
| | | | |
Participation notes | | | | | | | | | | | | | | | | |
China | | | 0 | | | | 6,768,732 | | | | 0 | | | | 6,768,732 | |
| | | | |
Short-term investments | | | | | | | | | | | | | | | | |
Investment companies | | | 38,856,450 | | | | 0 | | | | 0 | | | | 38,856,450 | |
Investments measured at net asset value* | | | | | | | | | | | | | | | 3,155,981 | |
| | | | |
| | | 361,050,929 | | | | 6,768,732 | | | | 0 | | | | 370,975,642 | |
Forward foreign currency contracts | | | 0 | | | | 1,221,034 | | | | 0 | | | | 1,221,034 | |
Total assets | | $ | 361,050,929 | | | $ | 7,989,766 | | | $ | 0 | | | $ | 372,196,676 | |
| * | Investments that are measured at fair value using the net asset value per share (or its equivalent) as a practical expedient have not been categorized in the fair value hierarchy. The fair value amount presented in the table is intended to permit reconciliation of the fair value hierarchy to the amounts presented in the Statement of Assets and Liabilities. The Fund’s investment in Securities Lending Cash Investments, LLC valued at $3,155,981 does not have a redemption period notice, can be redeemed daily and does not have any unfunded commitments. |
Forward foreign currency contracts are reported at their unrealized gains (losses) at measurement date, which represents the change in the contract’s value from trade date. All other assets and liabilities are reported at their market value at measurement date.
| | | | |
| 26 | | Wells Fargo International Equity Fund | | Notes to financial statements |
The Fund recognizes transfers between levels within the fair value hierarchy at the end of the reporting period. Fair value pricing that was used in pricing certain foreign securities at the previous period end was not used at October 31, 2016. As a result, common stocks valued at $238,604,936 were transferred from Level 2 to Level 1 within the fair value hierarchy. The Fund did not have any transfers into/out of Level 3.
4. TRANSACTIONS WITH AFFILIATES
Management fee
Funds Management, an indirect wholly owned subsidiary of Wells Fargo, is the manager of the Fund and provides advisory and fund-level administrative services under an investment management agreement. Under the investment management agreement, Funds Management is responsible for, among other services, implementing the investment objectives and strategies of the Fund, supervising the subadviser, providing fund-level administrative services in connection with the Fund’s operations, and providing any other fund-level administrative services reasonably necessary for the operation of the Fund. As compensation for its services under the investment management agreement, Funds Management is entitled to receive an annual management fee starting at 0.90% and declining to 0.73% as the average daily net assets of the Fund increase. For the year ended October 31, 2016, the management fee was equivalent to an annual rate of 0.90% of the Fund’s average daily net assets.
Funds Management has retained the services of a subadviser to provide daily portfolio management to the Fund. The fee for subadvisory services is borne by Funds Management. WellsCap is the subadviser to the Fund and is entitled to receive a fee from Funds Management at an annual rate starting at 0.45% and declining to 0.40% as the average daily net assets of the Fund increase.
Administration fees
Under a class-level administration agreement, Funds Management provides class-level administrative services to the Fund, which includes paying fees and expenses for services provided by the transfer agent, sub-transfer agents, omnibus account servicers and record-keepers. As compensation for its services under the class-level administration agreement, Funds Management receives an annual fee which is calculated based on the average daily net assets of each class as follows:
| | | | |
| | | Class-level
administration fee | |
Class A, Class B, Class C, Class R | | | 0.21 | % |
Class R6 | | | 0.03 | |
Administrator Class, Institutional Class | | | 0.13 | |
Funds Management has contractually waived and/or reimbursed management and administration fees to the extent necessary to maintain certain net operating expense ratios for the Fund. Waiver of fees and/or reimbursement of expenses by Funds Management were made first from fund level expenses on a proportionate basis and then from class specific expenses. Funds Management has committed through February 28, 2017 to waive fees and/or reimburse expenses to the extent necessary to cap the Fund’s expenses at 1.14% for Class A shares, 1.89% for Class B shares, 1.89% for Class C shares, 1.39% for Class R shares, 0.84% for Class R6 shares, 1.14% for Administrator Class shares, and 0.89% for Institutional Class shares. After this time, the cap may be increased or the commitment to maintain the cap may be terminated only with the approval of the Board of Trustees. Prior to March 1, 2016, the Fund’s expense were capped at 1.09% for Class A shares, 1.84% for Class B shares, 1.84% for Class C shares, 1.34% for Class R shares, 0.88% for Class R6 shares, 1.09% for Administrator Class shares, and 0.84% for Institutional Class shares.
Distribution fees
The Trust has adopted a distribution plan for Class B, Class C, and Class R shares of the Fund pursuant to Rule 12b-1 under the 1940 Act. Distribution fees are charged to Class B, Class C, and Class R shares and paid to Wells Fargo Funds Distributor, LLC (“Funds Distributor”), the principal underwriter, at an annual rate of 0.75% of the average daily net assets of Class B and Class C shares and 0.25% of the average daily net assets of Class R shares.
In addition, Funds Distributor is entitled to receive the front-end sales charge from the purchase of Class A shares and a contingent deferred sales charge on the redemption of certain Class A shares. Funds Distributor is also entitled to receive the contingent deferred sales charges from redemptions of Class B and Class C shares. For the year ended October 31, 2016, Funds Distributor received $24,173 from the sale of Class A shares and $578 in contingent deferred sales charges from redemptions of Class C shares.
| | | | | | |
| Notes to financial statements | | Wells Fargo International Equity Fund | | | 27 | |
Shareholder servicing fees
The Trust has entered into contracts with one or more shareholder servicing agents, whereby Class A, Class B, Class C, Class R, and Administrator Class of the Fund are charged a fee at an annual rate of 0.25% of the average daily net assets of each respective class.
A portion of these total shareholder servicing fees were paid to affiliates of Wells Fargo.
5. INVESTMENT PORTFOLIO TRANSACTIONS
Purchases and sales of investments, excluding U.S. government obligations (if any) and short-term securities, for the year ended October 31, 2016 were $251,521,312 and $275,293,106, respectively.
The Fund may purchase or sell investment securities to other Wells Fargo funds under procedures adopted by the Board of Trustees. The procedures have been designed to ensure that these interfund transactions, which generally do not incur broker commissions, are effected at current market prices. Interfund trades are included within the respective purchases and sales amounts shown.
6. DERIVATIVE TRANSACTIONS
During the year ended October 31, 2016, the Fund entered into forward foreign currency contracts for economic hedging purposes.
At October 31, 2016, the Fund had forward foreign currency contracts outstanding as follows:
Forward foreign currency contracts to sell:
| | | | | | | | | | | | | | | | | | |
| Exchange date | | Counterparty | | Contracts to
deliver | | | U.S. value at
October 31, 2016 | | | In exchange
for U.S. $ | | | Unrealized
gains | |
| 11-30-2016 | | Barclays | | | 2,743,800 | EUR | | $ | 3,015,385 | | | $ | 3,082,439 | | | $ | 67,054 | |
| 12-15-2016 | | Barclays | | | 25,020,000 | EUR | | | 27,518,132 | | | | 28,219,307 | | | | 701,175 | |
| 12-22-2016 | | Morgan Stanley | | | 5,716,000 | GBP | | | 7,004,839 | | | | 7,420,443 | | | | 415,604 | |
| 1-13-2017 | | Credit Suisse | | | 3,100,000 | EUR | | | 3,414,587 | | | | 3,451,788 | | | | 37,201 | |
The Fund had average contract amounts of $8,364,657 and $55,001,524 in forward foreign currency contracts to buy and forward foreign currency contracts to sell, respectively, during the year ended October 31, 2016. As of October 31, 2016, the Fund had received $1,505,000 as cash collateral for open forward foreign currency contracts.
The fair value, realized gains or losses and change in unrealized gains or losses, if any, on derivative instruments are reflected in the appropriate financial statements.
For certain types of derivative transactions, the Fund has entered into International Swaps and Derivatives Association, Inc. master agreements (“ISDA Master Agreements”) or similar agreements with approved counterparties. The ISDA Master Agreements or similar agreements may have requirements to deliver/deposit securities or cash to/with an exchange or broker-dealer as collateral and allows the Fund to offset, with each counterparty, certain derivative financial instrument’s assets and/or liabilities with collateral held or pledged. Collateral requirements differ by type of derivative. Collateral or margin requirements are set by the broker or exchange clearing house for exchange traded derivatives while collateral terms are contract specific for over-the-counter traded derivatives. Cash collateral that has been pledged to cover obligations of the Fund under ISDA Master Agreements or similar agreements, if any, are reported separately in the Statement of Assets and Liabilities. Securities pledged as collateral, if any, are noted in the Portfolio of Investments. With respect to balance sheet offsetting, absent an event of default by the counterparty or a termination of the agreement, the reported amounts of financial assets and financial liabilities in the Statement of Assets and Liabilities are not offset across transactions between the Fund and the applicable counterparty. A reconciliation of the gross amounts on the Statement of Assets and Liabilities to the net amounts by derivative type, including any collateral exposure, is as follows:
| | | | | | | | | | | | | | | | | | |
| Derivative type | | Counterparty | | Gross amounts
of assets in the
Statement of
Assets and
Liabilities | | | Amounts
subject to
netting
agreements | | | Collateral
received | | | Net amount
of assets | |
Forward foreign currency contracts | | Barclays | | $ | 768,229 | * | | $ | 0 | | | $ | (768,229 | ) | | $ | 0 | |
| | Credit Suisse | | | 37,201 | * | | | 0 | | | | 0 | | | | 37,201 | |
| | Morgan Stanley | | | 415,604 | * | | | 0 | | | | (415,604 | ) | | | 0 | |
| | * | Amount represents net unrealized gains. | |
| | | | |
| 28 | | Wells Fargo International Equity Fund | | Notes to financial statements |
7. BANK BORROWINGS
The Trust (excluding the money market funds and certain other funds) and Wells Fargo Variable Trust are parties to a $250,000,000 revolving credit agreement whereby the Fund is permitted to use bank borrowings for temporary or emergency purposes, such as to fund shareholder redemption requests. Interest under the credit agreement is charged to the Fund based on a borrowing rate equal to the higher of the Federal Funds rate in effect on that day plus 1.25% or the overnight LIBOR rate in effect on that day plus 1.25%. In addition, an annual commitment fee equal to 0.25% of the unused balance is allocated to each participating fund. Prior to August 30, 2016, the revolving credit agreement amount was $200,000,000 and the annual commitment fee was equal to 0.20% of the unused balance which was allocated to each participating fund.
For the year ended October 31, 2016, there were no borrowings by the Fund under the agreement.
8. DISTRIBUTIONS TO SHAREHOLDERS
The tax character of distributions paid was $6,187,351 and $8,383,118 of ordinary income for the years ended October 31, 2016 and October 31, 2015, respectively.
As of October 31, 2016, the components of distributable earnings on a tax basis were as follows:
| | | | |
Undistributed ordinary income | | Unrealized gains | | Capital loss carryforward |
| $11,461,569 | | $20,078,071 | | $(27,708,661) |
9. CONCENTRATION RISK
Concentration risks result from exposure to a limited number of sectors. A fund that invests a substantial portion of its assets in any sector may be more affected by changes in that sector than would be a fund whose investments are not heavily weighted in any sector.
10. INDEMNIFICATION
Under the Trust’s organizational documents, the officers and Trustees have been granted certain indemnification rights against certain liabilities that may arise out of performance of their duties to the Trust. Additionally, in the normal course of business, the Trust may enter into contracts with service providers that contain a variety of indemnification clauses. The Trust’s maximum exposure under these arrangements is dependent on future claims that may be made against the Fund and, therefore, cannot be estimated.
11. REGULATORY CHANGES
In October 2016, the Securities and Exchange Commission (“SEC”) adopted new rules and forms and amended existing rules and forms (together, “final rules”) intended to modernize and enhance the reporting and disclosure of information by registered investment companies and to enhance liquidity risk management by open-end mutual funds and exchange-traded funds. The final rules will enhance the quality of information available to investors and will allow the SEC to more effectively collect and use data reported by funds. In part, the final rules amend Regulation S-X and require standardized, enhanced disclosure about derivatives in the Fund’s financial statements, as well as other amendments. The compliance date for the amendments to Regulation S-X is August 1, 2017 while the compliance date for the new form types is June 1, 2018 and the compliance date for the liquidity risk management program requirements is December 1, 2018. Management is currently assessing the potential impact of these enhancements and their impact on the financial statement disclosures and reporting requirements.
| | | | | | |
| Report of independent registered public accounting firm | | Wells Fargo International Equity Fund | | | 29 | |
BOARD OF TRUSTEES AND SHAREHOLDERS OF WELLS FARGO FUNDS TRUST:
We have audited the accompanying statement of assets and liabilities, including the portfolio of investments, of the Wells Fargo International Equity Fund (the “Fund”), one of the funds constituting the Wells Fargo Funds Trust, as of October 31, 2016, and the related statement of operations for the year then ended, the statements of changes in net assets for each of the years in the two-year period then ended, and the financial highlights for each of the years or periods in the five-year period then ended. These financial statements and financial highlights are the responsibility of the Fund’s management. Our responsibility is to express an opinion on these financial statements and financial highlights based on our audits.
We conducted our audits in accordance with the standards of the Public Company Accounting Oversight Board (United States). Those standards require that we plan and perform the audit to obtain reasonable assurance about whether the financial statements and financial highlights are free of material misstatement. An audit includes examining, on a test basis, evidence supporting the amounts and disclosures in the financial statements. Our procedures included confirmation of securities owned as of October 31, 2016, by correspondence with the custodian and brokers, or by other appropriate auditing procedures. An audit also includes assessing the accounting principles used and significant estimates made by management, as well as evaluating the overall financial statement presentation. We believe that our audits provide a reasonable basis for our opinion.
In our opinion, the financial statements and financial highlights referred to above present fairly, in all material respects, the financial position of the Wells Fargo International Equity Fund as of October 31, 2016 the results of its operations for the year then ended, the changes in its net assets for each of the years in the two-year period then ended, and the financial highlights for each of the years or periods in the five-year period then ended, in conformity with U.S. generally accepted accounting principles.

Boston, Massachusetts
December 22, 2016
| | | | |
| 30 | | Wells Fargo International Equity Fund | | Other information (unaudited) |
TAX INFORMATION
Pursuant to Section 854 of the Internal Revenue Code, $4,377,666 of income dividends paid during the fiscal year ended October 31, 2016 has been designated as qualified dividend income (QDI).
Pursuant to Section 853 of the Internal Revenue Code, the Fund expects to designate amounts as foreign taxes paid for the fiscal year ended October 31, 2016. Additional details will be available in the semiannual report.
PROXY VOTING INFORMATION
A description of the policies and procedures that the Fund uses to determine how to vote proxies relating to portfolio securities is available, upon request, by calling 1-800-222-8222, visiting our website at wellsfargofunds.com, or visiting the SEC website at sec.gov. Information regarding how the Fund voted proxies relating to portfolio securities during the most recent 12-month period ended June 30 is available on the Fund’s website at wellsfargofunds.com or by visiting the SEC website at sec.gov.
PORTFOLIO HOLDINGS INFORMATION
The complete portfolio holdings for the Fund are publicly available monthly on the Fund’s website (wellsfargofunds.com), on a one-month delayed basis. In addition, top ten holdings information (excluding derivative positions) for the Fund is publicly available on the Fund’s website on a monthly, seven-day or more delayed basis. The Fund files its complete schedule of portfolio holdings with the SEC for the first and third quarters of each fiscal year on Form N-Q, which is available by visiting the SEC website at sec.gov. In addition, the Fund’s Form N-Q may be reviewed and copied at the SEC’s Public Reference Room in Washington, DC, and at regional offices in New York City, at 233 Broadway, and in Chicago, at 175 West Jackson Boulevard, Suite 900. Information about the Public Reference Room may be obtained by calling 1-800-SEC-0330.
| | | | | | |
| Other information (unaudited) | | Wells Fargo International Equity Fund | | | 31 | |
BOARD OF TRUSTEES AND OFFICERS
Each of the Trustees and Officers1 listed in the table below acts in identical capacities for each fund in the Wells Fargo family of funds, which consists of 139 mutual funds comprising the Wells Fargo Funds Trust, Wells Fargo Variable Trust, Wells Fargo Master Trust and four closed-end funds (collectively the “Fund Complex”). This table should be read in conjunction with the Prospectus and the Statement of Additional Information2. The mailing address of each Trustee and Officer is 525 Market Street, 12th Floor, San Francisco, CA 94105. Each Trustee and Officer serves an indefinite term, however, each Trustee serves such term until reaching the mandatory retirement age established by the Trustees.
Independent Trustees
| | | | | | |
Name and
year of birth | | Position held and
length of service* | | Principal occupations during past five years or longer | | Current other
public company or
investment company
directorships |
William R. Ebsworth
(Born 1957) | | Trustee, since 2015 | | Retired. From 1984 to 2013, equities analyst, portfolio manager, research director and chief investment officer at Fidelity Management and Research Company in Boston, Tokyo, and Hong Kong and retired in 2013 as Chief Investment Officer of Fidelity Strategic Advisers, Inc. where he lead a team of investment professionals managing client assets. Prior thereto, Board member of Hong Kong Securities Clearing Co., Hong Kong Options Clearing Corp., the Thailand International Fund, Ltd., Fidelity Investments Life Insurance Company, and Empire Fidelity Investments Life Insurance Company. Mr. Ebsworth is a CFA® charterholder and an Adjunct Lecturer, Finance, at Babson College. | | Asset Allocation Trust |
Jane A. Freeman
(Born 1953) | | Trustee, since 2015 | | Retired. From 2012 to 2014 and 1999 to 2008, Chief Financial Officer of Scientific Learning Corporation. From 2008 to 2012, Ms. Freeman provided consulting services related to strategic business projects. Prior to 1999, Portfolio Manager at Rockefeller & Co. and Scudder, Stevens & Clark. Board member of the Harding Loevner Funds from 1996 to 2014, serving as both Lead Independent Director and chair of the Audit Committee. Board member of the Russell Exchange Traded Funds Trust from 2011 to 2012 and the chair of the Audit Committee. Ms. Freeman is Chair of Taproot Foundation (non-profit organization), a Board Member of Ruth Bancroft Garden (non-profit organization) and an inactive chartered financial analyst. | | Asset Allocation Trust |
Peter G. Gordon**
(Born 1942) | | Trustee, since 1998; Chairman, since 2005 | | Co-Founder, Retired Chairman, President and CEO of Crystal Geyser Water Company. Trustee Emeritus, Colby College. | | Asset Allocation Trust |
Isaiah Harris, Jr.
(Born 1952) | | Trustee, since 2009 | | Retired. Chairman of the Board of CIGNA Corporation since 2009, and Director since 2005. From 2003 to 2011, Director of Deluxe Corporation. Prior thereto, President and CEO of BellSouth Advertising and Publishing Corp. from 2005 to 2007, President and CEO of BellSouth Enterprises from 2004 to 2005 and President of BellSouth Consumer Services from 2000 to 2003. Emeritus member of the Iowa State University Foundation Board of Governors. Emeritus Member of the Advisory Board of Iowa State University School of Business. Advisory Board Member, Palm Harbor Academy (charter school). Advisory Board Member, Child Evangelism Fellowship (non-profit). Mr. Harris is a certified public accountant (inactive status). | | CIGNA Corporation; Asset Allocation Trust |
Judith M. Johnson
(Born 1949) | | Trustee, since 2008; Audit Committee Chairman, since 2008 | | Retired. Prior thereto, Chief Executive Officer and Chief Investment Officer of Minneapolis Employees Retirement Fund from 1996 to 2008. Ms. Johnson is an attorney, certified public accountant and a certified managerial accountant. | | Asset Allocation Trust |
David F. Larcker
(Born 1950) | | Trustee, since 2009 | | James Irvin Miller Professor of Accounting at the Graduate School of Business, Stanford University, Director of the Corporate Governance Research Initiative and Senior Faculty of The Rock Center for Corporate Governance since 2006. From 2005 to 2008, Professor of Accounting at the Graduate School of Business, Stanford University. Prior thereto, Ernst & Young Professor of Accounting at The Wharton School, University of Pennsylvania from 1985 to 2005. | | Asset Allocation Trust |
| | | | |
| 32 | | Wells Fargo International Equity Fund | | Other information (unaudited) |
| | | | | | |
Name and
year of birth | | Position held and
length of service* | | Principal occupations during past five years or longer | | Current other
public company or
investment company
directorships |
| Olivia S. Mitchell (Born 1953) | | Trustee, since 2006 | | International Foundation of Employee Benefit Plans Professor, Wharton School of the University of Pennsylvania since 1993. Director of Wharton’s Pension Research Council and Boettner Center on Pensions & Retirement Research, and Research Associate at the National Bureau of Economic Research. Previously, Cornell University Professor from 1978 to 1993. | | Asset Allocation Trust |
| Timothy J. Penny (Born 1951) | | Trustee, since 1996 | | President and Chief Executive Officer of Southern Minnesota Initiative Foundation, a non-profit organization, since 2007 and Senior Fellow at the Humphrey Institute Policy Forum at the University of Minnesota since 1995. Member of the Board of Trustees of NorthStar Education Finance, Inc., a non-profit organization, since 2007. | | Asset Allocation Trust |
| Michael S. Scofield (Born 1943) | | Trustee, since 2010 | | Served on the Investment Company Institute’s Board of Governors and Executive Committee from 2008-2011 as well the Governing Council of the Independent Directors Council from 2006-2011 and the Independent Directors Council Executive Committee from 2008-2011. Chairman of the IDC from 2008-2010. Institutional Investor (Fund Directions) Trustee of Year in 2007. Trustee of the Evergreen Funds complex (and its predecessors) from 1984 to 2010. Chairman of the Evergreen Funds from 2000-2010. Former Trustee of the Mentor Funds. Retired Attorney, Law Offices of Michael S. Scofield. | | Asset Allocation Trust |
| * | Length of service dates reflect the Trustee’s commencement of service with the Trust’s predecessor entities, where applicable. |
| ** | Peter Gordon is expected to retire on December 31, 2017. |
Officers
| | | | | | |
Name and
year of birth | | Position held and
length of service | | Principal occupations during past five years or longer | | |
Karla M. Rabusch
(Born 1959) | | President, since 2003 | | Executive Vice President of Wells Fargo Bank, N.A. and President of Wells Fargo Funds Management, LLC since 2003. | | |
Jeremy DePalma1
(Born 1974) | | Treasurer, since 2012 | | Senior Vice President of Wells Fargo Funds Management, LLC since 2009. Senior Vice President of Evergreen Investment Management Company, LLC from 2008 to 2010 and head of the Fund Reporting and Control Team within Fund Administration from 2005 to 2010. | | |
C. David Messman
(Born 1960) | | Secretary, since 2000; Chief Legal Officer, since 2003 | | Senior Vice President and Secretary of Wells Fargo Funds Management, LLC since 2001. Assistant General Counsel of Wells Fargo Bank, N.A. since 2013 and Vice President and Managing Counsel of Wells Fargo Bank, N.A. from 1996 to 2013. | | |
Michael Whitaker3
(Born 1967) | | Chief Compliance Officer, since 2016 | | Executive Vice President of Wells Fargo Funds Management, LLC since 2016. Chief Compliance Officer of Fidelity’s Fixed Income Funds and Asset Allocation Funds from 2008 to 2016, Compliance Officer of FMR Co., Inc. from 2014 to 2016, Fidelity Investments Money Management, Inc. from 2014 to 2016, Fidelity Investments from 2007 to 2016. | | |
David Berardi
(Born 1975) | | Assistant Treasurer, since 2009 | | Vice President of Wells Fargo Funds Management, LLC since 2009. Vice President of Evergreen Investment Management Company, LLC from 2008 to 2010. Manager of Fund Reporting and Control for Evergreen Investment Management Company, LLC from 2004 to 2010. | | |
| 1 | Jeremy DePalma acts as Treasurer of 69 funds and Assistant Treasurer of 70 funds in the Fund Complex. |
| 2 | The Statement of Additional Information includes additional information about the Trustees and is available, without charge, upon request, by calling 1-800-222-8222 or by visiting the website at wellsfargofunds.com. |
| 3 | Michael Whitaker became Chief Compliance Officer effective May 16, 2016. |
| | | | | | |
| Other information (unaudited) | | Wells Fargo International Equity Fund | | | 33 | |
BOARD CONSIDERATION OF INVESTMENT MANAGEMENT AND SUB-ADVISORY AGREEMENTS:
Under the Investment Company Act of 1940 (the “1940 Act”), the Board of Trustees (the “Board”) of Wells Fargo Funds Trust (the “Trust”) must determine annually whether to approve the continuation of the Trust’s investment management and sub-advisory agreements. In this regard, at an in-person meeting held on May 24-25, 2016 (the “Meeting”), the Board, all the members of which have no direct or indirect interest in the investment management and sub-advisory agreements and are not “interested persons” of the Trust, as defined in the 1940 Act (the “Independent Trustees”), reviewed and approved for Wells Fargo International Equity Fund (the “Fund”): (i) an investment management agreement (the “Management Agreement”) with Wells Fargo Funds Management, LLC (“Funds Management”); and (ii) an investment sub-advisory agreement (the “Sub-Advisory Agreement”) with Wells Capital Management Incorporated (the “Sub-Adviser”), an affiliate of Funds Management. The Management Agreement and the Sub-Advisory Agreement are collectively referred to as the “Advisory Agreements.”
At the Meeting, the Board considered the factors and reached the conclusions described below relating to the selection of Funds Management and the Sub-Adviser and the approval of the Advisory Agreements. Prior to the Meeting, including at an in-person meeting in April 2016, the Trustees conferred extensively among themselves and with representatives of Funds Management about these matters. Also, the Board has adopted a team-based approach, with each team consisting of a sub-set of Trustees, to assist the full Board in the discharge of its duties in reviewing performance and other matters throughout the year. The Independent Trustees were assisted in their evaluation of the Advisory Agreements by independent legal counsel, from whom they received separate legal advice and with whom they met separately.
In providing information to the Board, Funds Management and the Sub-Adviser were guided by a detailed set of requests for information submitted to them by independent legal counsel on behalf of the Independent Trustees at the start of the Board’s annual contract renewal process earlier in 2016. In considering and approving the Advisory Agreements, the Trustees considered the information they believed relevant, including but not limited to the information discussed below. The Board considered not only the specific information presented in connection with the Meeting, but also the knowledge gained over time through interaction with Funds Management and the Sub-Adviser about various topics. In this regard, the Board reviewed reports of Funds Management at each of its quarterly meetings, which included, among other things, portfolio reviews and performance reports. In addition, the Board and the teams mentioned above confer with portfolio managers at various times throughout the year. The Board did not identify any particular information or consideration that was all-important or controlling, and each individual Trustee may have attributed different weights to various factors.
After its deliberations, the Board unanimously approved the continuation of the Advisory Agreements for a one-year term and determined that the compensation payable to Funds Management and the Sub-Adviser under each of the Advisory Agreements was reasonable. The Board considered the approval of the Advisory Agreements for the Fund as part of its consideration of agreements for funds across the complex, but its approvals were made on a fund-by-fund basis. The following summarizes a number of important, but not necessarily all, factors considered by the Board in support of its approvals.
Nature, extent and quality of services
The Board received and considered various information regarding the nature, extent and quality of services provided to the Fund by Funds Management and the Sub-Adviser under the Advisory Agreements. This information included a description of the investment advisory services and Fund-level administrative services covered by the Management Agreement, as well as, among other things, a summary of the background and experience of senior management of Funds Management, and the qualifications, background, tenure and responsibilities of each of the portfolio managers primarily responsible for the day-to-day portfolio management of the Fund.
The Board evaluated the ability of Funds Management and the Sub-Adviser to attract and retain qualified investment professionals, including research, advisory and supervisory personnel. The Board further considered the compliance programs and compliance records of Funds Management and the Sub-Adviser. In addition, the Board took into account the full range of services provided to the Fund by Funds Management and its affiliates.
Fund performance and expenses
The Board considered the performance results for the Fund over various time periods ended December 31, 2015. The Board considered these results in comparison to the performance of funds in a universe that was determined by Broadridge Inc. (“Broadridge”) to be similar to the Fund (the “Universe”), and in comparison to the Fund’s benchmark index and to other comparative data. Broadridge is an independent provider of investment company data. The Board received a description of the methodology used by Broadridge to select the mutual funds in the performance Universe.
| | | | |
| 34 | | Wells Fargo International Equity Fund | | Other information (unaudited) |
The Board noted that the performance of the Fund (Class A) was higher than or in range of the average performance of the Universe for all periods under review except the one-year period under review. The Board also noted that the performance of the Fund was higher than its benchmark, the MSCI ACWI ex USA Index (Net), for all periods under review except the ten-year period.
The Board also received and considered information regarding the Fund’s net operating expense ratios and their various components, including actual management fees, custodian and other non-management fees, and Rule 12b-1 and non-Rule 12b-1 shareholder service fees. The Board considered these ratios in comparison to the median ratios of funds in class-specific expense groups that were determined by Broadridge to be similar to the Fund (the “Groups”). The Board received a description of the methodology used by Broadridge to select the mutual funds in the expense Groups and an explanation of how funds comprising expense groups and their expense ratios may vary from year-to-year. Based on the Broadridge reports, the Board noted that the net operating expense ratios of the Fund were lower than the median net operating expense ratios of the expense Groups.
The Board took into account the Fund performance and expense information provided to it among the factors considered in deciding to re-approve the Advisory Agreements.
Investment management and sub-advisory fee rates
The Board reviewed and considered the contractual fee rates payable by the Fund to Funds Management under the Management Agreement, as well as the contractual fee rates payable by the Fund to Funds Management for class-level administrative services under a Class-Level Administration Agreement, which include class-level transfer agency and sub-transfer agency costs (collectively, the “Management Rates”). The Board also reviewed and considered the contractual investment sub-advisory fee rates that are payable by Funds Management to the Sub-Adviser for investment sub-advisory services.
Among other information reviewed by the Board was a comparison of the Fund’s Management Rates with the average contractual investment management fee rates of funds in the expense Groups at a common asset level as well as transfer agency costs of the funds in the expense Groups. The Board noted that the Management Rates of the Fund were equal to or in range of the sum of these average rates for the Fund’s expense Groups for all share classes except Class R and Administrator Class. The Board noted that the net operating expense ratios of the Fund were lower than the median net operating expense ratios of the expense Groups for all share classes, including Class R and Administrator Class. The Board also discussed and accepted Funds Management’s proposal to revise the Management Agreement to reduce fees at all asset levels for the Fund.
The Board also received and considered information about the portion of the total management fee that was retained by Funds Management after payment of the fee to the Sub-Adviser for sub-advisory services. In assessing the reasonableness of this amount, the Board received and evaluated information about the nature and extent of responsibilities retained and risks assumed by Funds Management and not delegated to or assumed by the Sub-Adviser, and about Funds Management’s on-going oversight services. However, given the affiliation between Funds Management and the Sub-Adviser, the Board ascribed limited relevance to the allocation of fees between them.
The Board also received and considered information about the nature and extent of services offered and fee rates charged by Funds Management and the Sub-Adviser to other types of clients with investment strategies similar to those of the Fund. In this regard, the Board received information about the significantly greater scope of services, and compliance, reporting and other legal burdens and risks of managing mutual funds compared with those associated with managing assets of non-mutual fund clients such as collective funds or institutional separate accounts.
Based on its consideration of the factors and information it deemed relevant, including those described here, the Board determined that the compensation payable to Funds Management under the Management Agreement and to the Sub-Adviser under the Sub-Advisory Agreement was reasonable, in light of the services covered by the Advisory Agreements.
Profitability
The Board received and considered information concerning the profitability of Funds Management, as well as the profitability of Wells Fargo as a whole, from providing services to the Fund and the fund family as a whole. The Board also received and considered information concerning the profitability of the Sub-Adviser from providing services to the fund family as a whole, noting that the Sub-Adviser’s profitability information with respect to providing services to the Fund was subsumed in the Wells Fargo and Funds Management profitability analysis.
Funds Management reported on the methodologies and estimates used in calculating profitability. Among other things, the Board noted that the levels of profitability reported on a fund-by-fund basis varied widely, depending on factors such
| | | | | | |
| Other information (unaudited) | | Wells Fargo International Equity Fund | | | 35 | |
as the size and type of fund. Based on its review, the Board did not deem the profits reported by Funds Management or Wells Fargo from its services to the Fund to be at a level that would prevent it from approving the continuation of the Advisory Agreements.
Economies of scale
With respect to possible economies of scale, the Board noted the existence of breakpoints in the Fund’s management fee structure, which operate generally to reduce the Fund’s expense ratios as the Fund grows in size. It considered that, for a small fund or a fund that shrinks in size, breakpoints conversely can result in higher fee levels. The Board also considered that fee waiver and expense reimbursement arrangements and competitive fee rates at the outset are means of sharing potential economies of scale with shareholders of the Fund and the fund family as a whole. The Board also discussed and accepted Funds Management’s proposal to revise the Management Agreement to reduce fees at all asset levels for the Fund. The Board considered Funds Management’s view that any analyses of potential economies of scale in managing a particular fund are inherently limited in light of the joint and common costs and investments that Funds Management incurs across the fund family as a whole.
The Board concluded that the Fund’s fee and expense arrangements, including contractual breakpoints, constituted a reasonable approach to sharing potential economies of scale with the Fund and its shareholders.
Other benefits to Funds Management and the Sub-Adviser
The Board received and considered information regarding potential “fall-out” or ancillary benefits received by Funds Management and its affiliates, including the Sub-Adviser, as a result of their relationships with the Fund. Ancillary benefits could include, among others, benefits directly attributable to other relationships with the Fund and benefits potentially derived from an increase in Funds Management’s and the Sub-Adviser’s business as a result of their relationships with the Fund. The Board noted that various affiliates of Funds Management may receive distribution-related fees, shareholder servicing payments and sub-transfer agency fees in respect of shares sold or held through them and services provided.
The Board also reviewed information about soft dollar credits earned and utilized by the Sub-Adviser, fees earned by Funds Management and the Sub-Adviser from managing a private investment vehicle for the fund family’s securities lending collateral and commissions earned by an affiliated broker from portfolio transactions.
Based on its consideration of the factors and information it deemed relevant, including those described here, the Board did not find that any ancillary benefits received by Funds Management and its affiliates, including the Sub-Adviser, were unreasonable.
Conclusion
At the Meeting, after considering the above-described factors and based on its deliberations and its evaluation of the information described above, the Board unanimously approved the continuation of the Advisory Agreements for a one-year term and determined that the compensation payable to Funds Management and the Sub-Adviser under each of the Advisory Agreements was reasonable.
| | | | |
| 36 | | Wells Fargo International Equity Fund | | List of abbreviations |
The following is a list of common abbreviations for terms and entities that may have appeared in this report.
| ACA | — ACA Financial Guaranty Corporation |
| ADR | — American depositary receipt |
| ADS | — American depositary shares |
| AGC | — Assured Guaranty Corporation |
| AGM | — Assured Guaranty Municipal |
| Ambac | — Ambac Financial Group Incorporated |
| AMT | — Alternative minimum tax |
| BAN | — Bond anticipation notes |
| BHAC | — Berkshire Hathaway Assurance Corporation |
| CAB | — Capital appreciation bond |
| CCAB | — Convertible capital appreciation bond |
| CDA | — Community Development Authority |
| CDO | — Collateralized debt obligation |
| DRIVER | — Derivative inverse tax-exempt receipts |
| DW&P | — Department of Water & Power |
| DWR | — Department of Water Resources |
| ECFA | — Educational & Cultural Facilities Authority |
| EDA | — Economic Development Authority |
| EDFA | — Economic Development Finance Authority |
| ETF | — Exchange-traded fund |
| FDIC | — Federal Deposit Insurance Corporation |
| FFCB | — Federal Farm Credit Banks |
| FGIC | — Financial Guaranty Insurance Corporation |
| FHA | — Federal Housing Administration |
| FHLB | — Federal Home Loan Bank |
| FHLMC | — Federal Home Loan Mortgage Corporation |
| FICO | — The Financing Corporation |
| FNMA | — Federal National Mortgage Association |
| GDR | — Global depositary receipt |
| GNMA | — Government National Mortgage Association |
| HCFR | — Healthcare facilities revenue |
| HEFA | — Health & Educational Facilities Authority |
| HEFAR | — Higher education facilities authority revenue |
| HFA | — Housing Finance Authority |
| HFFA | — Health Facilities Financing Authority |
| HUD | — Department of Housing and Urban Development |
| IDA | — Industrial Development Authority |
| IDAG | — Industrial Development Agency |
| KRW | — Republic of Korea won |
| LIBOR | — London Interbank Offered Rate |
| LIFER | — Long Inverse Floating Exempt Receipts |
| LLC | — Limited liability company |
| LLLP | — Limited liability limited partnership |
| LLP | — Limited liability partnership |
| MBIA | — Municipal Bond Insurance Association |
| MFHR | — Multifamily housing revenue |
| MSTR | — Municipal securities trust receipts |
| MUD | — Municipal Utility District |
| National | — National Public Finance Guarantee Corporation |
| PCFA | — Pollution Control Financing Authority |
| PCL | — Public Company Limited |
| PCR | — Pollution control revenue |
| PFA | — Public Finance Authority |
| PFFA | — Public Facilities Financing Authority |
| PFOTER | — Puttable floating option tax-exempt receipts |
| plc | — Public limited company |
| PUTTER | — Puttable tax-exempt receipts |
| R&D | — Research & development |
| Radian | — Radian Asset Assurance |
| RAN | — Revenue anticipation notes |
| RDA | — Redevelopment Authority |
| RDFA | — Redevelopment Finance Authority |
| REIT | — Real estate investment trust |
| ROC | — Reset option certificates |
| SAVRS | — Select auction variable rate securities |
| SBA | — Small Business Authority |
| SDR | — Swedish depositary receipt |
| SFHR | — Single-family housing revenue |
| SFMR | — Single-family mortgage revenue |
| SPA | — Standby purchase agreement |
| SPDR | — Standard & Poor’s Depositary Receipts |
| SPEAR | — Short Puttable Exempt Adjustable Receipts |
| STRIPS | — Separate trading of registered interest and |
| TAN | — Tax anticipation notes |
| TIPS | — Treasury inflation-protected securities |
| TRAN | — Tax revenue anticipation notes |
| TTFA | — Transportation Trust Fund Authority |
| TVA | — Tennessee Valley Authority |

For more information
More information about Wells Fargo Funds is available free upon request. To obtain literature, please write, email, visit the Fund’s website, or call:
Wells Fargo Funds
P.O. Box 8266
Boston, MA 02266-8266
Email: fundservice@wellsfargo.com
Website: wellsfargofunds.com
Individual investors: 1-800-222-8222
Retail investment professionals: 1-888-877-9275
Institutional investment professionals: 1-866-765-0778
This report and the financial statements contained herein are submitted for the general information of the shareholders of the Fund. If this report is used for promotional purposes, distribution of the report must be accompanied or preceded by a current prospectus. Before investing, please consider the investment objectives, risks, charges, and expenses of the investment. For a current prospectus and, if available, a summary prospectus, containing this information, call 1-800-222-8222 or visit the Fund’s website at wellsfargofunds.com. Read the prospectus carefully before you invest or send money.
Wells Fargo Asset Management (WFAM) is a trade name used by the asset management businesses of Wells Fargo & Company. Wells Fargo Funds Management, LLC, a wholly owned subsidiary of Wells Fargo & Company, provides investment advisory and administrative services for Wells Fargo Funds. Other affiliates of Wells Fargo & Company provide subadvisory and other services for the funds. The funds are distributed by Wells Fargo Funds Distributor, LLC, Member FINRA, an affiliate of Wells Fargo & Company. Neither Wells Fargo Funds Management nor Wells Fargo Funds Distributor has Fund customer accounts/assets, and neither provides investment advice/recommendations or acts as an investment advice fiduciary to any investor.
NOT FDIC INSURED ¡ NO BANK GUARANTEE ¡ MAY LOSE VALUE
© 2016 Wells Fargo Funds Management, LLC. All rights reserved.
| | |
 | | 247344 12-16 A240/AR240 10-16 |
Annual Report
October 31, 2016

Wells Fargo Intrinsic World Equity Fund


Reduce clutter. Save trees.
Sign up for electronic delivery of prospectuses and shareholder reports at wellsfargo.com/advantagedelivery
Contents
The views expressed and any forward-looking statements are as of October 31, 2016, unless otherwise noted, and are those of the Fund managers and/or Wells Fargo Funds Management, LLC. Discussions of individual securities, or the markets generally, or any Wells Fargo Fund are not intended as individual recommendations. Future events or results may vary significantly from those expressed in any forward-looking statements. The views expressed are subject to change at any time in response to changing circumstances in the market. Wells Fargo Funds Management, LLC and the Fund disclaim any obligation to publicly update or revise any views expressed or forward-looking statements.
NOT FDIC INSURED ◾ NO BANK GUARANTEE ◾ MAY LOSE VALUE
| | | | |
| 2 | | Wells Fargo Intrinsic World Equity Fund | | Letter to shareholders (unaudited) |

Karla M. Rabusch
President
Wells Fargo Funds
International equity investors entered the period confronting concerns about slowing economic growth, particularly in China.
Dear Shareholder:
We are pleased to offer you this annual report for the Wells Fargo Intrinsic World Equity Fund for the 12-month period that ended October 31, 2016. Significant volatility in international equity markets during the final months of 2015 and early 2016 subsided during the last half of the period. The performance contrast in each half of the reporting period as measured by key benchmark indexes shows the improving investment environment during the previous 12 months.
| | | | | | | | |
| | | November 1, 2015 through
April 30, 2016 (%) | | | May 1, 2016 through
October 31, 2016 (%) | |
Morgan Stanley Capital International (MSCI)
Europe, Australasia, Far East (EAFE) Index (Net)1 | | | (3.07 | ) | | | (0.16 | ) |
MSCI World Index (Net)2 | | | (1.05 | ) | | | 2.25 | |
MSCI All Country World Index (ACWI) ex USA Index (Net)3 | | | (1.75 | ) | | | 2.01 | |
S&P Developed SmallCap Index4 | | | 1.05 | | | | 2.36 | |
Past performance is no guarantee of future results.
Central bank policies demonstrated resolve to reignite global economic growth.
International equity investors entered the period confronting concerns about slowing economic growth, particularly in China. They also were uncertain if governments and their central banks could successfully address concerns about recessionary pressures and global business activity through monetary and economic policy. The December 2015 decision of the U.S. Federal Reserve (Fed) to increase its key interest rate caused elevated levels of volatility in global equity markets and sometimes drove significant fluctuations in the relative values of currencies around the world. The U.S. dollar tended to gain strength, which helped exporters in other countries but pressured importers who paid higher prices for goods and services.
The European Central Bank (ECB) pushed the interest rate it pays on deposits further into negative territory in late 2015. In January 2016, the Bank of Japan followed the ECB’s lead by setting a negative deposit rate. During the period, the People’s Bank of China guided its currency’s value lower relative to a basket of foreign currencies to enhance exports. Investors viewed the actions of major central banks as consistent with efforts to spark business activity. Observing the actions of central banks overseas to implement policies that would accommodate
| 1 | The Morgan Stanley Capital International (MSCI) Europe, Australasia, Far East (EAFE) Index (Net) is a free-float-adjusted market-capitalization weighted index that is designed to measure the equity market performance of developed markets, excluding the United States and Canada. The MSCI EAFE Index (Net) consists of the following 21 developed markets country indexes: Australia, Austria, Belgium, Denmark, Finland, France, Germany, Hong Kong, Ireland, Israel, Italy, Japan, the Netherlands, New Zealand, Norway, Portugal, Singapore, Spain, Sweden, Switzerland, and the United Kingdom. Source: MSCI. MSCI makes no express or implied warranties or representations and shall have no liability whatsoever with respect to any MSCI data contained herein. The MSCI data may not be further redistributed or used as a basis for other indexes or any securities or financial products. This report is not approved, reviewed, or produced by MSCI. You cannot invest directly in an index. |
| 2 | The MSCI World Index (Net) is a free-float-adjusted market-capitalization-weighted index that is designed to measure the equity market performance of developed markets. The MSCI World Index (Net) consists of the following 23 developed markets country indexes: Australia, Austria, Belgium, Canada, Denmark, Finland, France, Germany, Hong Kong, Ireland, Israel, Italy, Japan, the Netherlands, New Zealand, Norway, Portugal, Singapore, Spain, Sweden, Switzerland, the United Kingdom, and the United States. You cannot invest directly in an index. |
| 3 | The MSCI All Country World Index (ACWI) ex USA Index (Net) is a free-float-adjusted market-capitalization-weighted index that is designed to measure the equity market performance of developed markets, excluding the United States and Canada. You cannot invest directly in an index. |
| 4 | The S&P Developed SmallCap Index is a free-float-adjusted market-capitalization-weighted index designed to measure the equity market performance of small-capitalization companies located in developed markets. The index is composed of companies within the bottom 15% of the cumulative market capitalization in developed markets. The index covers all publicly listed equities with float-adjusted market values of U.S. $100 million or more and annual dollar value traded of at least U.S. $50 million in all included countries. You cannot invest directly in an index. |
| | | | | | |
| Letter to shareholders (unaudited) | | Wells Fargo Intrinsic World Equity Fund | | | 3 | |
higher levels of business activity, the Fed acknowledged that risks to global growth existed and indicated it would base further rate increases on data that indicated successful management of the risks.
Investors closely watched changing sentiment in global markets during the period.
In the second quarter of 2016, equity market volatility levels declined and remained relatively low until the end of June, when voters in the United Kingdom surprised market participants and approved the Brexit referendum to leave the European Union. Investors reacted to the news negatively and fled to assets such as precious metals and U.S. Treasury bonds. As a result, interest rates fell sharply, and equity markets declined across the globe. In the weeks to follow, signs of resilience in major markets worldwide offset concerns stemming from the Brexit referendum.
Investors’ sentiments improved during the third quarter of 2016, which led to more favorable returns across global equity markets. The third-quarter saw a rotation that favored company fundamentals over macroeconomic fears, creating a more favorable market dynamic for active managers. Dispersion of returns from both the sector and country perspective tended to confirm the changing views of the markets among investors. On an improved perception of business health, economically sensitive sectors such as consumer discretionary, materials, financials, and industrials gained while traditionally defensive sectors (utilities, telecommunication services, health care, and consumer staples) benefited less during the market rally.
Don’t let short-term uncertainty derail long-term investment goals.
Periods of investment uncertainty can present challenges, but experience has taught us that maintaining long-term investment goals can be an effective way to plan for the future. To help you create a sound strategy based on your personal goals and risk tolerance, Wells Fargo Funds offers more than 100 mutual funds spanning a wide range of asset classes and investment styles. Although diversification cannot guarantee an investment profit or prevent losses, we believe it can be an effective way to manage investment risk and potentially smooth out overall portfolio performance. We encourage investors to know their investments and to understand that appropriate levels of risk-taking may unlock opportunities.
Thank you for choosing to invest with Wells Fargo Funds. We appreciate your confidence in us and remain committed to helping you meet your financial needs.
Sincerely,

Karla M. Rabusch
President
Wells Fargo Funds
Investors’ sentiments improved during the third quarter of 2016, which led to more favorable returns across global equity markets.
For further information about your Fund, contact your investment professional, visit our website at wellsfargofunds.com, or call us directly at 1-800-222-8222. We are available 24 hours a day, 7 days a week.
| | | | |
| 4 | | Wells Fargo Intrinsic World Equity Fund | | Performance highlights (unaudited) |
Investment objective
The Fund seeks long-term capital appreciation.
Manager
Wells Fargo Funds Management, LLC
Subadviser
Wells Capital Management Incorporated
Portfolio managers
Jean-Baptiste Nadal, CFA®
Jeffrey Peck
Average annual total returns (%) as of October 31, 20161
| | | | | | | | | | | | | | | | | | | | | | | | | | | | | | | | | | |
| | | | | Including sales charge | | | Excluding sales charge | | | Expense ratios2 (%) | |
| | | Inception date | | 1 year | | | 5 year | | | 10 year | | | 1 year | | | 5 year | | | 10 year | | | Gross | | | Net3 | |
| Class A (EWEAX) | | 4-30-1996 | | | (8.13 | ) | | | 7.33 | | | | 3.55 | | | | (2.54 | ) | | | 8.61 | | | | 4.17 | | | | 1.45 | | | | 1.35 | |
| Class C (EWECX) | | 5-18-2007 | | | (4.26 | ) | | | 7.79 | | | | 3.39 | | | | (3.26 | ) | | | 7.79 | | | | 3.39 | | | | 2.20 | | | | 2.10 | |
| Administrator Class (EWEIX) | | 5-18-2007 | | | – | | | | – | | | | – | | | | (2.43 | ) | | | 8.85 | | | | 4.39 | | | | 1.37 | | | | 1.25 | |
| Institutional Class (EWENX) | | 7-30-2010 | | | – | | | | – | | | | – | | | | (2.13 | ) | | | 9.09 | | | | 4.53 | | | | 1.12 | | | | 0.95 | |
| MSCI World Index (Net)4 | | – | | | – | | | | – | | | | – | | | | 1.18 | | | | 9.03 | | | | 3.89 | | | | – | | | | – | |
Figures quoted represent past performance, which is no guarantee of future results, and do not reflect taxes that a shareholder may pay on fund distributions or the redemption of fund shares. Investment return and principal value of an investment will fluctuate so that an investor’s shares, when redeemed, may be worth more or less than their original cost. Performance shown without sales charges would be lower if sales charges were reflected. Current performance may be lower or higher than the performance data quoted, which assumes the reinvestment of dividends and capital gains. Current month-end performance is available on the Fund’s website, wellsfargofunds.com.
Index returns do not include transaction costs associated with buying and selling securities, any mutual fund fees or expenses, or any taxes. It is not possible to invest directly in an index.
For Class A shares, the maximum front-end sales charge is 5.75%. For Class C shares, the maximum contingent deferred sales charge is 1.00%. Performance including a contingent deferred sales charge assumes the sales charge for the corresponding time period. Administrator Class and Institutional Class shares are sold without a front-end sales charge or contingent deferred sales charge.
Stock values fluctuate in response to the activities of individual companies and general market and economic conditions. Foreign investments are especially volatile and can rise or fall dramatically due to differences in the political and economic conditions of the host country. These risks are generally intensified in emerging markets. The use of derivatives may reduce returns and/or increase volatility. Certain investment strategies tend to increase the total risk of an investment (relative to the broader market). The Fund is exposed to focused portfolio risk, geographic risk, and smaller-company securities risk. Consult the Fund’s prospectus for additional information on these and other risks.
Please see footnotes on page 5.
| | | | | | |
| Performance highlights (unaudited) | | Wells Fargo Intrinsic World Equity Fund | | | 5 | |
|
| Growth of $10,000 investment as of October 31, 20165 |
|
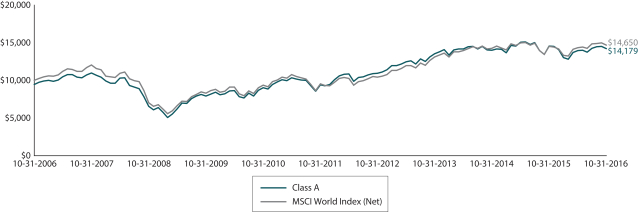 |
| 1 | Historical performance shown for Class C shares prior to their inception reflects the performance of Class A shares, and has been adjusted to reflect the higher expenses applicable to Class C shares. Historical performance shown for Institutional Class shares prior to their inception reflects the performance of Administrator Class shares, and includes the higher expenses applicable to Administrator Class shares. If these expenses had not been included, returns would be higher. Historical performance shown for Administrator Class shares prior to their inception reflects the performance of Class A shares, and includes the higher expenses applicable to Class A shares. If these expenses had not been included, returns would be higher. Historical performance shown for all classes of the Fund prior to July 19, 2010, is based on the performance of the Fund’s predecessor, Evergreen Intrinsic World Equity Fund. |
| 2 | Reflects the expense ratios as stated in the most recent prospectuses. The expense ratios shown are subject to change and may differ from the annualized expense ratios shown in the financial highlights of this report. |
| 3 | The manager has contractually committed through February 28, 2017, to waive fees and/or reimburse expenses to the extent necessary to cap the Fund’s Total Annual Operating Expenses After Fee Waiver at the amounts shown. After this time, the cap may be increased or the commitment to maintain the cap may be terminated only with the approval of the Board of Trustees. Brokerage commissions, stamp duty fees, interest, taxes, acquired fund fees and expenses, and extraordinary expenses are excluded from the expense cap. Without this cap, the Fund’s returns would have been lower. |
| 4 | The Morgan Stanley Capital International (MSCI) World Index (Net) is a free-float-adjusted market-capitalization-weighted index that is designed to measure the equity market performance of developed markets. The MSCI World Index (Net) consists of the following 23 developed markets country indexes: Australia, Austria, Belgium, Canada, Denmark, Finland, France, Germany, Hong Kong, Ireland, Israel, Italy, Japan, the Netherlands, New Zealand, Norway, Portugal, Singapore, Spain, Sweden, Switzerland, the United Kingdom, and the United States. Source: MSCI. MSCI makes no express or implied warranties or representations and shall have no liability whatsoever with respect to any MSCI data contained herein. The MSCI data may not be further redistributed or used as a basis for other indexes or any securities or financial products. This report is not approved, reviewed, or produced by MSCI. You cannot invest directly in an index. |
| 5 | The chart compares the performance of Class A shares for the most recent ten years with the MSCI World Index (Net). The chart assumes a hypothetical investment of $10,000 in Class A shares and reflects all operating expenses and assumes the maximum initial sales charge of 5.75%. |
| 6 | The ten largest holdings, excluding cash and cash equivalents, are calculated based on the value of the investments divided by total net assets of the Fund. Holdings are subject to change and may have changed since the date specified. |
| 7 | Amounts are calculated based on the total long-term investments of the Fund. These amounts are subject to change and may have changed since the date specified. |
| * | This security was not held in the Fund at the end of the reporting period. |
| | | | |
| 6 | | Wells Fargo Intrinsic World Equity Fund | | Performance highlights (unaudited) |
MANAGER’S DISCUSSION
Fund highlights
| ∎ | | The Fund underperformed its benchmark, the MSCI World Index (Net), for the 12-month period that ended October 31, 2016. |
| ∎ | | Stock selection drove the Fund’s underperformance. Relative sector weightings, which are a by-product of our bottom-up security-selection process, also had a net negative effect. |
| ∎ | | Security selection in the energy and information technology (IT) sectors contributed to performance relative to the index. Stock selection in the financials, health care, and materials sectors detracted from relative return. In addition, an overweight to the second-worst performing financials sector, and an underweight to the best-performing materials sector subtracted value. |
The Fund underperformed in a global stock market dominated by investor demand for yield in equity markets.
We adhered to the same intrinsic value investment philosophy and process and consistently applied it to investment selection for the Fund. Our fundamental analysis involves identifying the stocks that we believe are high-quality, value-creating businesses selling at a discount to our estimate of intrinsic or true value and that possess what we believe are identifiable catalysts that could close the valuation gap over our investment time horizon.
Stock selection in the energy and IT sectors contributed to relative performance. In energy, integrated oil and gas producer Chevron Corporation and exploration and production company EOG Resources, Incorporated were the principal contributors. In IT, contributors were Korean conglomerate Samsung Electronics Company, Limited and global electronics company Texas Instruments Incorporated.
By contrast, security selection in the financials, health care, and materials sectors detracted from performance relative to the benchmark. In financials, U.K.-based Barclays PLC* was the main detractor. Other detractors included Spanish regional bank CaixaBank, S.A. and Swiss wealth and investment bank UBS AG. In health care, Gilead Sciences, Incorporated was the worst performer. Within materials, industrial gas supplier Air Liquide S.A., a recent purchase, was the worst performer.
By country, stock selection in Japan contributed on a relative basis for the period, while stock selection in the U.S. and Switzerland detracted. Over the long term, we seek to add value primarily through stock selection due to our research intensive, bottom-up investment process.
| | | | |
| Ten largest holdings (%) as of October 31, 20166 | |
Microsoft Corporation | | | 2.68 | |
AIA Group Limited | | | 2.59 | |
EOG Resources Incorporated | | | 2.33 | |
AerCap Holdings NV | | | 2.31 | |
Merck & Company Incorporated | | | 2.24 | |
Sony Corporation | | | 2.23 | |
Cigna Corporation | | | 2.23 | |
Nidec Corporation | | | 2.22 | |
Motorola Solutions Incorporated | | | 2.20 | |
Visa Incorporated Class A | | | 2.13 | |
Our long-term investment process has typically resulted in low portfolio turnover as the team seeks to invest in businesses over a three- to five-year investment horizon. During the fiscal year, we sold six companies in three different sectors and invested in eight new companies across six sectors. The new additions to the Fund were: 1. Nestlé S.A. in consumer staples; 2. Bayer AG and CIGNA Corporation in health care; 3. General Dynamics Corporation in industrials; 4. Alphabet Incorporated in IT; 5. Air Liquide S.A. in materials; and 6. Deutsche Telekom AG and Vodafone Group Plc in telecommunication services. All of these trades were driven by company-specific, fundamental analysis rather than top-down sector allocation decisions.
Please see footnotes on page 5.
| | | | | | |
| Performance highlights (unaudited) | | Wells Fargo Intrinsic World Equity Fund | | | 7 | |
|
| Sector distribution as of October 31, 20167 |
|
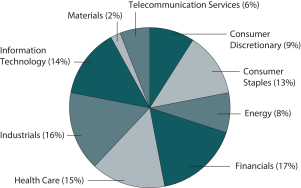 |
|
| Country allocation as of October 31, 20167 |
|
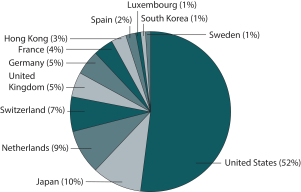 |
We remain confident that our investment process should create shareholder value over time.
During the first half of 2016 and despite very little evidence, investors believed that the global economy was slowing, that deflation was imminent, and central banks would extend dovish policies. These fears were compounded after the Brexit referendum in which the U.K. voted to leave the European Union, yet reversed rather quickly. While equity returns were positive, broadly these events lead investors to seek out those sectors, industries, and companies offering higher yield.
As the third quarter unfolded, other gauges of developed economies—especially the U.S.—were indicating greater strength. Additionally, while earnings growth slowed during the last four consecutive quarters, it is expected that weaker year-over-year comparisons will contribute to accelerated earnings growth in the coming quarters.
Outside of the U.S., the eurozone has proven fairly resilient after the initial Brexit vote shock. Despite some modest signs of weakness, investors remained reasonably optimistic about economic growth. However, growth in Japan stalled and depended on government stimulus, as corporate and consumer spending remains weak and the strong yen is discouraging exports.
The portfolio management team’s philosophy and process relies on the idea of buying a high-quality company’s intrinsic value at a price that the team believes represents a substantive discount, and where the
investment team feels it can identify catalysts that will close this value gap over a three- to five-year time horizon. High-quality companies typically perform better in a rising interest-rate environment as they are better able to finance shareholder-friendly actions.
While corporate earnings growth continues to slow, we believe the high-quality companies identified by the team have more flexibility and numerous tools to navigate this environment. With modest growth, growing inflation, and increasing wages in the U.S., rising interest rates are a more likely outcome and investor expectations lean in this direction. Therefore, the team contends that the developing environment is favorable to its approach.
Please see footnotes on page 5.
| | | | |
| 8 | | Wells Fargo Intrinsic World Equity Fund | | Fund expenses (unaudited) |
As a shareholder of the Fund, you incur two types of costs: (1) transaction costs, including sales charges (loads) on purchase payments and contingent deferred sales charges (if any) on redemptions and (2) ongoing costs, including management fees, distribution (12b-1) and/or shareholder servicing fees, and other Fund expenses. This example is intended to help you understand your ongoing costs (in dollars) of investing in the Fund and to compare these costs with the ongoing costs of investing in other mutual funds.
The example is based on an investment of $1,000 invested at the beginning of the six-month period and held for the entire period from May 1, 2016 to October 31, 2016.
Actual expenses
The “Actual” line of the table below provides information about actual account values and actual expenses. You may use the information in this line, together with the amount you invested, to estimate the expenses that you paid over the period. Simply divide your account value by $1,000 (for example, an $8,600 account value divided by $1,000 = 8.6), then multiply the result by the number in the “Actual” line under the heading entitled “Expenses paid during period” for your applicable class of shares to estimate the expenses you paid on your account during this period.
Hypothetical example for comparison purposes
The “Hypothetical” line of the table below provides information about hypothetical account values and hypothetical expenses based on the Fund’s actual expense ratio and an assumed rate of return of 5% per year before expenses, which is not the Fund’s actual return. The hypothetical account values and expenses may not be used to estimate the actual ending account balance or expenses you paid for the period. You may use this information to compare the ongoing costs of investing in the Fund and other funds. To do so, compare this 5% hypothetical example with the 5% hypothetical examples that appear in the shareholder reports of the other funds.
Please note that the expenses shown in the table are meant to highlight your ongoing costs only and do not reflect any transactional costs, such as sales charges (loads) and contingent deferred sales charges. Therefore, the “Hypothetical” line of the table is useful in comparing ongoing costs only and will not help you determine the relative total costs of owning different funds. In addition, if these transactional costs were included, your costs would have been higher.
| | | | | | | | | | | | | | | | |
| | | Beginning
account value
5-1-2016 | | | Ending
account value
10-31-2016 | | | Expenses
paid during
the period¹ | | | Annualized net
expense ratio | |
Class A | | | | | | | | | | | | | | | | |
Actual | | $ | 1,000.00 | | | $ | 1,016.66 | | | $ | 6.84 | | | | 1.35 | % |
Hypothetical (5% return before expenses) | | $ | 1,000.00 | | | $ | 1,018.35 | | | $ | 6.85 | | | | 1.35 | % |
Class C | | | | | | | | | | | | | | | | |
Actual | | $ | 1,000.00 | | | $ | 1,012.40 | | | $ | 10.62 | | | | 2.10 | % |
Hypothetical (5% return before expenses) | | $ | 1,000.00 | | | $ | 1,014.58 | | | $ | 10.63 | | | | 2.10 | % |
Administrator Class | | | | | | | | | | | | | | | | |
Actual | | $ | 1,000.00 | | | $ | 1,016.74 | | | $ | 6.34 | | | | 1.25 | % |
Hypothetical (5% return before expenses) | | $ | 1,000.00 | | | $ | 1,018.85 | | | $ | 6.34 | | | | 1.25 | % |
Institutional Class | | | | | | | | | | | | | | | | |
Actual | | $ | 1,000.00 | | | $ | 1,018.80 | | | $ | 4.82 | | | | 0.95 | % |
Hypothetical (5% return before expenses) | | $ | 1,000.00 | | | $ | 1,020.36 | | | $ | 4.82 | | | | 0.95 | % |
| 1 | Expenses paid is equal to the annualized net expense ratio of each class multiplied by the average account value over the period, multiplied by the number of days in the most recent fiscal half-year divided by the number of days in the fiscal year (to reflect the one-half-year period). |
| | | | | | |
| Portfolio of investments—October 31, 2016 | | Wells Fargo Intrinsic World Equity Fund | | | 9 | |
| | | | | | | | | | | | | | | | |
| Security name | | | | | | | | Shares | | | Value | |
| | | | |
Common Stocks: 99.40% | | | | | | | | | | | | | | | | |
| | | | |
| France: 3.77% | | | | | | | | | | | | | | | | |
Air Liquide SA (Materials, Chemicals) | | | | | | | | | | | 27,220 | | | $ | 2,769,349 | |
Societe Generale SA (Financials, Banks) | | | | | | | | | | | 68,000 | | | | 2,654,448 | |
| | | | |
| | | | | | | | | | | | | | | 5,423,797 | |
| | | | | | | | | | | | | | | | |
| | | | |
| Germany: 4.67% | | | | | | | | | | | | | | | | |
Bayer AG (Health Care, Pharmaceuticals) | | | | | | | | | | | 26,140 | | | | 2,590,889 | |
Deutsche Telekom AG (Telecommunication Services, Diversified Telecommunication Services) | | | | | | | | | | | 166,120 | | | | 2,707,109 | |
Siemens AG (Industrials, Industrial Conglomerates) | | | | | | | | | | | 12,420 | | | | 1,410,443 | |
| | | | |
| | | | | | | | | | | | | | | 6,708,441 | |
| | | | | | | | | | | | | | | | |
| | | | |
| Hong Kong: 2.59% | | | | | | | | | | | | | | | | |
AIA Group Limited (Financials, Insurance) | | | | | | | | | | | 590,800 | | | | 3,728,899 | |
| | | | | | | | | | | | | | | | |
| | | | |
| Japan: 10.30% | | | | | | | | | | | | | | | | |
Honda Motor Company Limited (Consumer Discretionary, Automobiles) | | | | | | | | | | | 94,600 | | | | 2,836,106 | |
Kao Corporation (Consumer Staples, Personal Products) | | | | | | | | | | | 50,600 | | | | 2,607,924 | |
Nidec Corporation (Industrials, Electrical Equipment) | | | | | | | | | | | 32,900 | | | | 3,190,550 | |
ORIX Corporation (Financials, Diversified Financial Services) | | | | | | | | | | | 186,650 | | | | 2,964,295 | |
Sony Corporation (Consumer Discretionary, Household Durables) | | | | | | | | | | | 100,040 | | | | 3,206,202 | |
| | | | |
| | | | | | | | | | | | | | | 14,805,077 | |
| | | | | | | | | | | | | | | | |
| | | | |
| Luxembourg: 1.09% | | | | | | | | | | | | | | | | |
Millicom International Cellular SA (Telecommunication Services, Wireless Telecommunication Services) | | | | | | | | | | | 35,750 | | | | 1,571,753 | |
| | | | | | | | | | | | | | | | |
| | | | |
| Netherlands: 9.40% | | | | | | | | | | | | | | | | |
AerCap Holdings NV (Industrials, Trading Companies & Distributors) † | | | | | | | | | | | 80,900 | | | | 3,325,799 | |
Airbus Group NV (Industrials, Aerospace & Defense) | | | | | | | | | | | 36,400 | | | | 2,163,732 | |
Heineken NV (Consumer Staples, Beverages) | | | | | | | | | | | 33,470 | | | | 2,757,465 | |
Sensata Technologies Holding NV (Industrials, Electrical Equipment) † | | | | | | | | | | | 74,880 | | | | 2,675,462 | |
Unilever NV (Consumer Staples, Personal Products) | | | | | | | | | | | 62,100 | | | | 2,597,022 | |
| | | | |
| | | | | | | | | | | | | | | 13,519,480 | |
| | | | | | | | | | | | | | | | |
| | | | |
| South Korea: 1.01% | | | | | | | | | | | | | | | | |
Samsung Electronics Company Limited (Information Technology, Technology Hardware, Storage & Peripherals) | | | | | | | | | | | 1,010 | | | | 1,446,703 | |
| | | | | | | | | | | | | | | | |
| | | | |
| Spain: 1.58% | | | | | | | | | | | | | | | | |
CaixaBank SA (Financials, Banks) | | | | | | | | | | | 748,700 | | | | 2,265,939 | |
| | | | | | | | | | | | | | | | |
| | | | |
| Sweden: 0.62% | | | | | | | | | | | | | | | | |
Autoliv Incorporated SDR (Consumer Discretionary, Auto Components) | | | | | | | | | | | 9,200 | | | | 886,677 | |
| | | | | | | | | | | | | | | | |
| | | | |
| Switzerland: 7.45% | | | | | | | | | | | | | | | | |
Nestle SA (Consumer Staples, Food Products) | | | | | | | | | | | 39,370 | | | | 2,854,628 | |
Novartis AG ADR (Health Care, Pharmaceuticals) | | | | | | | | | | | 42,940 | | | | 3,049,599 | |
Roche Holding AG (Health Care, Pharmaceuticals) | | | | | | | | | | | 11,450 | | | | 2,632,383 | |
UBS Group AG (Financials, Capital Markets) | | | | | | | | | | | 154,200 | | | | 2,181,598 | |
| | | | |
| | | | | | | | | | | | | | | 10,718,208 | |
| | | | | | | | | | | | | | | | |
The accompanying notes are an integral part of these financial statements.
| | | | |
| 10 | | Wells Fargo Intrinsic World Equity Fund | | Portfolio of investments—October 31, 2016 |
| | | | | | | | | | | | | | | | |
| Security name | | | | | | | | Shares | | | Value | |
| | | | |
| United Kingdom: 5.27% | | | | | | | | | | | | | | | | |
Diageo plc (Consumer Staples, Beverages) | | | | | | | | | | | 85,860 | | | $ | 2,290,495 | |
Royal Dutch Shell plc Class A (Energy, Oil, Gas & Consumable Fuels) | | | | | | | | | | | 112,801 | | | | 2,812,119 | |
Vodafone Group plc (Telecommunication Services, Wireless Telecommunication Services) | | | | | | | | | | | 899,176 | | | | 2,474,131 | |
| | | | |
| | | | | | | | | | | | | | | 7,576,745 | |
| | | | | | | | | | | | | | | | |
| | | | |
| United States: 51.65% | | | | | | | | | | | | | | | | |
Abbott Laboratories (Health Care, Health Care Equipment & Supplies) | | | | | | | | | | | 63,900 | | | | 2,507,444 | |
Alphabet Incorporated Class C (Information Technology, Internet Software & Services) † | | | | | | | | | | | 3,320 | | | | 2,604,673 | |
Apple Incorporated (Information Technology, Technology Hardware, Storage & Peripherals) | | | | | | | | | | | 24,800 | | | | 2,815,792 | |
BB&T Corporation (Financials, Banks) | | | | | | | | | | | 74,900 | | | | 2,936,080 | |
Charles Schwab Corporation (Financials, Capital Markets) | | | | | | | | | | | 74,700 | | | | 2,367,990 | |
Chevron Corporation (Energy, Oil, Gas & Consumable Fuels) | | | | | | | | | | | 28,540 | | | | 2,989,565 | |
Cigna Corporation (Health Care, Health Care Providers & Services) | | | | | | | | | | | 26,950 | | | | 3,202,469 | |
CIT Group Incorporated (Financials, Banks) | | | | | | | | | | | 80,200 | | | | 2,913,666 | |
EOG Resources Incorporated (Energy, Oil, Gas & Consumable Fuels) | | | | | | | | | | | 37,060 | | | | 3,350,965 | |
Express Scripts Holding Company (Health Care, Health Care Providers & Services)† | | | | | | | | | | | 19,890 | | | | 1,340,586 | |
General Dynamics Corporation (Industrials, Aerospace & Defense) | | | | | | | | | | | 19,300 | | | | 2,909,282 | |
Gilead Sciences Incorporated (Health Care, Biotechnology) | | | | | | | | | | | 33,670 | | | | 2,479,122 | |
Honeywell International Incorporated (Industrials, Industrial Conglomerates) | | | | | | | | | | | 22,600 | | | | 2,478,768 | |
Lockheed Martin Corporation (Industrials, Aerospace & Defense) | | | | | | | | | | | 8,550 | | | | 2,106,549 | |
Merck & Company Incorporated (Health Care, Pharmaceuticals) | | | | | | | | | | | 54,930 | | | | 3,225,490 | |
Microsoft Corporation (Information Technology, Software) | | | | | | | | | | | 64,240 | | | | 3,849,261 | |
Motorola Solutions Incorporated (Information Technology, Communications Equipment) | | | | | | | | | | | 43,580 | | | | 3,163,036 | |
Oracle Corporation (Information Technology, Software) | | | | | | | | | | | 68,000 | | | | 2,612,560 | |
PepsiCo Incorporated (Consumer Staples, Beverages) | | | | | | | | | | | 26,400 | | | | 2,830,080 | |
Samsonite International SA (Consumer Discretionary, Textiles, Apparel & Luxury Goods) | | | | | | | | | | | 957,590 | | | | 3,012,707 | |
Schlumberger Limited (Energy, Energy Equipment & Services) | | | | | | | | | | | 36,640 | | | | 2,866,347 | |
The Goldman Sachs Group Incorporated (Financials, Capital Markets) | | | | | | | | | | | 17,000 | | | | 3,030,080 | |
The Procter & Gamble Company (Consumer Staples, Household Products) | | | | | | | | | | | 24,900 | | | | 2,161,320 | |
The Walt Disney Company (Consumer Discretionary, Media) | | | | | | | | | | | 26,980 | | | | 2,500,776 | |
United Parcel Service Incorporated Class B (Industrials, Air Freight & Logistics) | | | | | | | | | | | 26,100 | | | | 2,812,536 | |
Verizon Communications Incorporated (Telecommunication Services, Diversified Telecommunication Services) | | | | | | | | | | | 44,450 | | | | 2,138,045 | |
Visa Incorporated Class A (Information Technology, IT Services) | | | | | | | | | | | 37,090 | | | | 3,060,296 | |
| | | | |
| | | | | | | | | | | | | | | 74,265,485 | |
| | | | | | | | | | | | | | | | |
| | | | |
Total Common Stocks (Cost $126,565,604) | | | | | | | | | | | | | | | 142,917,204 | |
| | | | | | | | | | | | | | | | |
| | | | |
| | | Yield | | | | | | | | | | |
| Short-Term Investments: 0.24% | | | | | | | | | | | | | | | | |
| | | | |
| Investment Companies: 0.24% | | | | | | | | | | | | | | | | |
Wells Fargo Government Money Market Fund Select Class (l)(u) | | | 0.32 | % | | | | | | | 343,055 | | | | 343,055 | |
| | | | | | | | | | | | | | | | |
| | | | |
Total Short-Term Investments (Cost $343,055) | | | | | | | | | | | | | | | 343,055 | |
| | | | | | | | | | | | | | | | |
| | | | | | | | |
| Total investments in securities (Cost $126,908,659) * | | | 99.64 | % | | | 143,260,259 | |
Other assets and liabilities, net | | | 0.36 | | | | 512,527 | |
| | | | | | | | |
| Total net assets | | | 100.00 | % | | $ | 143,772,786 | |
| | | | | | | | |
The accompanying notes are an integral part of these financial statements.
| | | | | | |
| Portfolio of investments—October 31, 2016 | | Wells Fargo Intrinsic World Equity Fund | | | 11 | |
| † | Non-income-earning security |
| (l) | The issuer of the security is an affiliated person of the Fund as defined in the Investment Company Act of 1940. |
| (u) | The rate represents the 7-day annualized yield at period end. |
| * | Cost for federal income tax purposes is $127,593,341 and unrealized gains (losses) consists of: |
| | | | |
Gross unrealized gains | | $ | 25,690,663 | |
Gross unrealized losses | | | (10,023,745 | ) |
| | | | |
Net unrealized gains | | $ | 15,666,918 | |
The accompanying notes are an integral part of these financial statements.
| | | | |
| 12 | | Wells Fargo Intrinsic World Equity Fund | | Statement of assets and liabilities—October 31, 2016 |
| | | | |
| | | | |
| |
Assets | | | | |
Investments | | | | |
In unaffiliated securities, at value (cost $126,565,604) | | $ | 142,917,204 | |
In affiliated securities, at value (cost $343,055) | | | 343,055 | |
| | | | |
Total investments, at value (cost $126,908,659) | | | 143,260,259 | |
Cash | | | 368 | |
Foreign currency, at value (cost $6,249) | | | 6,129 | |
Receivable for investments sold | | | 598,119 | |
Receivable for Fund shares sold | | | 14,427 | |
Receivable for dividends | | | 299,639 | |
Receivable for securities lending income | | | 179 | |
Prepaid expenses and other assets | | | 30,214 | |
| | | | |
Total assets | | | 144,209,334 | |
| | | | |
| |
Liabilities | | | | |
Payable for investments purchased | | | 152,639 | |
Payable for Fund shares redeemed | | | 79,643 | |
Management fee payable | | | 89,404 | |
Distribution fee payable | | | 4,681 | |
Administration fees payable | | | 25,367 | |
Custodian and accounting fees payable | | | 27,902 | |
Shareholder servicing fees payable | | | 29,984 | |
Accrued expenses and other liabilities | | | 26,928 | |
| | | | |
Total liabilities | | | 436,548 | |
| | | | |
Total net assets | | $ | 143,772,786 | |
| | | | |
| |
NET ASSETS CONSIST OF | | | | |
Paid-in capital | | $ | 119,503,277 | |
Undistributed net investment income | | | 1,144,741 | |
Accumulated net realized gains on investments | | | 6,778,799 | |
Net unrealized gains on investments | | | 16,345,969 | |
| | | | |
Total net assets | | $ | 143,772,786 | |
| | | | |
| |
COMPUTATION OF NET ASSET VALUE AND OFFERING PRICE PER SHARE | | | | |
Net assets – Class A | | $ | 127,427,972 | |
Shares outstanding – Class A1 | | | 6,526,117 | |
Net asset value per share – Class A | | | $19.53 | |
Maximum offering price per share – Class A2 | | | $20.72 | |
Net assets – Class C | | $ | 7,252,457 | |
Shares outstanding – Class C1 | | | 386,353 | |
Net asset value per share – Class C | | | $18.77 | |
Net assets – Administrator Class | | $ | 4,735,271 | |
Shares outstanding – Administrator Class1 | | | 243,669 | |
Net asset value per share – Administrator Class | | | $19.43 | |
Net assets – Institutional Class | | $ | 4,357,086 | |
Shares outstanding – Institutional Class1 | | | 223,363 | |
Net asset value per share – Institutional Class | | | $19.51 | |
| 1 | The Fund has an unlimited number of authorized shares. |
| 2 | Maximum offering price is computed as 100/94.25 of net asset value. On investments of $50,000 or more, the offering price is reduced. |
The accompanying notes are an integral part of these financial statements.
| | | | | | |
| Statement of operations—year ended October 31, 2016 | | Wells Fargo Intrinsic World Equity Fund | | | 13 | |
| | | | |
| | | | |
| |
Investment income | | | | |
Dividends (net of foreign withholding taxes of $210,933) | | $ | 3,673,050 | |
Securities lending income, net | | | 31,633 | |
Income from affiliated securities | | | 2,385 | |
| | | | |
Total investment income | | | 3,707,068 | |
| | | | |
| |
Expenses | | | | |
Management fee | | | 1,283,490 | |
Administration fees | | | | |
Class A | | | 279,939 | |
Class C | | | 16,135 | |
Administrator Class | | | 7,283 | |
Institutional Class | | | 5,732 | |
Shareholder servicing fees | | | | |
Class A | | | 333,260 | |
Class C | | | 19,209 | |
Administrator Class | | | 13,543 | |
Distribution fee | | | | |
Class C | | | 57,626 | |
Custody and accounting fees | | | 35,638 | |
Professional fees | | | 55,461 | |
Registration fees | | | 63,577 | |
Shareholder report expenses | | | 48,363 | |
Trustees’ fees and expenses | | | 18,026 | |
Other fees and expenses | | | 9,512 | |
| | | | |
Total expenses | | | 2,246,794 | |
Less: Fee waivers and/or expense reimbursements | | | (151,908 | ) |
| | | | |
Net expenses | | | 2,094,886 | |
| | | | |
Net investment income | | | 1,612,182 | |
| | | | |
| |
REALIZED AND UNREALIZED GAINS (LOSSES) ON INVESTMENTS | | | | |
Net realized gains on investments | | | 7,022,443 | |
Net change in unrealized gains (losses) on investments | | | (13,434,282 | ) |
| | | | |
Net realized and unrealized gains (losses) on investments | | | (6,411,839 | ) |
| | | | |
Net decrease in net assets resulting from operations | | $ | (4,799,657 | ) |
| | | | |
The accompanying notes are an integral part of these financial statements.
| | | | |
| 14 | | Wells Fargo Intrinsic World Equity Fund | | Statement of changes in net assets |
| | | | | | | | | | | | | | | | |
| | | Year ended October 31, 2016 | | | Year ended October 31, 2015 | |
| | | | |
Operations | | | | | | | | | | | | | | | | |
Net investment income | | | | | | $ | 1,612,182 | | | | | | | $ | 1,348,061 | |
Net realized gains on investments | | | | | | | 7,022,443 | | | | | | | | 18,667,164 | |
Net change in unrealized gains (losses) on investments | | | | | | | (13,434,282 | ) | | | | | | | (12,629,315 | ) |
| | | | |
Net increase (decrease) in net assets resulting from operations | | | | | | | (4,799,657 | ) | | | | | | | 7,385,910 | |
| | | | |
| | | | |
Distributions to shareholders from | | | | | | | | | | | | | | | | |
Net investment income | | | | | | | | | | | | | | | | |
Class A | | | | | | | (1,480,000 | ) | | | | | | | (856,992 | ) |
Class C | | | | | | | (5,766 | ) | | | | | | | 0 | |
Administrator Class | | | | | | | (77,002 | ) | | | | | | | (51,944 | ) |
Institutional Class | | | | | | | (77,098 | ) | | | | | | | (48,847 | ) |
Net realized gains | | | | | | | | | | | | | | | | |
Class A | | | | | | | (15,944,560 | ) | | | | | | | (2,600,451 | ) |
Class C | | | | | | | (992,532 | ) | | | | | | | (169,828 | ) |
Administrator Class | | | | | | | (637,316 | ) | | | | | | | (108,609 | ) |
Institutional Class | | | | | | | (554,534 | ) | | | | | | | (77,473 | ) |
| | | | |
Total distributions to shareholders | | | | | | | (19,768,808 | ) | | | | | | | (3,914,144 | ) |
| | | | |
| | | | |
Capital share transactions | | | Shares | | | | | | | | Shares | | | | | |
Proceeds from shares sold | | | | | | | | | | | | | | | | |
Class A | | | 77,894 | | | | 1,519,486 | | | | 179,787 | | | | 4,097,757 | |
Class C | | | 48,859 | | | | 912,817 | | | | 35,552 | | | | 773,618 | |
Administrator Class | | | 99,764 | | | | 1,871,151 | | | | 93,043 | | | | 2,104,873 | |
Institutional Class | | | 87,333 | | | | 1,706,229 | | | | 161,738 | | | | 3,667,260 | |
| | | | |
| | | | | | | 6,009,683 | | | | | | | | 10,643,508 | |
| | | | |
Reinvestment of distributions | | | | | | | | | | | | | | | | |
Class A | | | 871,879 | | | | 16,927,692 | | | | 152,110 | | | | 3,351,854 | |
Class C | | | 51,392 | | | | 955,480 | | | | 7,388 | | | | 156,548 | |
Administrator Class | | | 36,033 | | | | 697,376 | | | | 7,067 | | | | 155,486 | |
Institutional Class | | | 24,158 | | | | 469,358 | | | | 3,982 | | | | 87,906 | |
| | | | |
| | | | | | | 19,049,906 | | | | | | | | 3,751,794 | |
| | | | |
Payment for shares redeemed | | | | | | | | | | | | | | | | |
Class A | | | (975,567 | ) | | | (18,924,820 | ) | | | (795,378 | ) | | | (18,121,192 | ) |
Class C | | | (121,189 | ) | | | (2,191,011 | ) | | | (88,016 | ) | | | (1,946,944 | ) |
Administrator Class | | | (166,281 | ) | | | (3,242,731 | ) | | | (154,125 | ) | | | (3,437,971 | ) |
Institutional Class | | | (109,687 | ) | | | (2,106,188 | ) | | | (86,058 | ) | | | (1,969,384 | ) |
| | | | |
| | | | | | | (26,464,750 | ) | | | | | | | (25,475,491 | ) |
| | | | |
Net decrease in net assets resulting from capital share transactions | | | | | | | (1,405,161 | ) | | | | | | | (11,080,189 | ) |
| | | | |
Total decrease in net assets | | | | | | | (25,973,626 | ) | | | | | | | (7,608,423 | ) |
| | | | |
| | | | |
Net assets | | | | | | | | | | | | | | | | |
Beginning of period | | | | | | | 169,746,412 | | | | | | | | 177,354,835 | |
| | | | |
End of period | | | | | | $ | 143,772,786 | | | | | | | $ | 169,746,412 | |
| | | | |
Undistributed net investment income | | | | | | $ | 1,144,741 | | | | | | | $ | 1,000,309 | |
| | | | |
The accompanying notes are an integral part of these financial statements.
| | | | | | |
| Financial highlights | | Wells Fargo Intrinsic World Equity Fund | | | 15 | |
(For a share outstanding throughout each period)
| | | | | | | | | | | | | | | | | | | | |
| | | Year ended October 31 | |
| CLASS A | | 2016 | | | 2015 | | | 2014 | | | 2013 | | | 2012 | |
Net asset value, beginning of period | | | $22.82 | | | | $22.39 | | | | $21.88 | | | | $17.94 | | | | $15.55 | |
Net investment income | | | 0.20 | | | | 0.19 | | | | 0.17 | | | | 0.20 | | | | 0.16 | |
Net realized and unrealized gains (losses) on investments | | | (0.83 | ) | | | 0.73 | | | | 0.59 | | | | 4.00 | | | | 1.87 | |
| | | | | | | | | | | | | | | | | | | | |
Total from investment operations | | | (0.63 | ) | | | 0.92 | | | | 0.76 | | | | 4.20 | | | | 2.03 | |
Distributions to shareholders from | | | | | | | | | | | | | | | | | | | | |
Net investment income | | | (0.20 | ) | | | (0.12 | ) | | | (0.25 | ) | | | (0.26 | ) | | | (0.11 | ) |
Net realized gains | | | (2.46 | ) | | | (0.37 | ) | | | 0.00 | | | | 0.00 | | | | 0.00 | |
| | | | | | | | | | | | | | | | | | | | |
Total distributions to shareholders | | | (2.66 | ) | | | (0.49 | ) | | | (0.25 | ) | | | (0.26 | ) | | | (0.11 | ) |
Regulatory settlement proceeds | | | 0.00 | | | | 0.00 | | | | 0.00 | | | | 0.00 | | | | 0.47 | |
Net asset value, end of period | | | $19.53 | | | | $22.82 | | | | $22.39 | | | | $21.88 | | | | $17.94 | |
Total return1 | | | (2.54 | )% | | | 4.23 | % | | | 3.45 | % | | | 23.74 | % | | | 16.25 | %2 |
Ratios to average net assets (annualized) | | | | | | | | | | | | | | | | | | | | |
Gross expenses | | | 1.46 | % | | | 1.48 | % | | | 1.47 | % | | | 1.49 | % | | | 1.51 | % |
Net expenses | | | 1.37 | % | | | 1.40 | % | | | 1.40 | % | | | 1.40 | % | | | 1.40 | % |
Net investment income | | | 1.09 | % | | | 0.79 | % | | | 0.70 | % | | | 0.95 | % | | | 0.91 | % |
Supplemental data | | | | | | | | | | | | | | | | | | | | |
Portfolio turnover rate | | | 23 | % | | | 32 | % | | | 23 | % | | | 22 | % | | | 27 | % |
Net assets, end of period (000s omitted) | | | $127,428 | | | | $149,492 | | | | $157,061 | | | | $168,621 | | | | $146,930 | |
| 1 | Total return calculations do not include any sales charges. |
| 2 | During the year ended October 31, 2012, the Fund received a regulatory settlement from an unaffiliated third party which had an impact of 2.92% on the total return. |
The accompanying notes are an integral part of these financial statements.
| | | | |
| 16 | | Wells Fargo Intrinsic World Equity Fund | | Financial highlights |
(For a share outstanding throughout each period)
| | | | | | | | | | | | | | | | | | | | |
| | | Year ended October 31 | |
| CLASS C | | 2016 | | | 2015 | | | 2014 | | | 2013 | | | 2012 | |
Net asset value, beginning of period | | | $21.99 | | | | $21.64 | | | | $21.19 | | | | $17.37 | | | | $15.15 | |
Net investment income (loss) | | | 0.05 | | | | 0.01 | 1 | | | (0.02 | ) | | | 0.05 | | | | 0.02 | |
Net realized and unrealized gains (losses) on investments | | | (0.80 | ) | | | 0.71 | | | | 0.58 | | | | 3.89 | | | | 1.82 | |
| | | | | | | | | | | | | | | | | | | | |
Total from investment operations | | | (0.75 | ) | | | 0.72 | | | | 0.56 | | | | 3.94 | | | | 1.84 | |
Distributions to shareholders from | | | | | | | | | | | | | | | | | | | | |
Net investment income | | | (0.01 | ) | | | 0.00 | | | | (0.11 | ) | | | (0.12 | ) | | | (0.09 | ) |
Net realized gains | | | (2.46 | ) | | | (0.37 | ) | | | 0.00 | | | | 0.00 | | | | 0.00 | |
| | | | | | | | | | | | | | | | | | | | |
Total distributions to shareholders | | | (2.47 | ) | | | (0.37 | ) | | | (0.11 | ) | | | (0.12 | ) | | | (0.09 | ) |
Regulatory settlement proceeds | | | 0.00 | | | | 0.00 | | | | 0.00 | | | | 0.00 | | | | 0.47 | |
Net asset value, end of period | | | $18.77 | | | | $21.99 | | | | $21.64 | | | | $21.19 | | | | $17.37 | |
Total return2 | | | (3.26 | )% | | | 3.41 | % | | | 2.65 | % | | | 22.82 | % | | | 15.39 | %3 |
Ratios to average net assets (annualized) | | | | | | | | | | | | | | | | | | | | |
Gross expenses | | | 2.21 | % | | | 2.23 | % | | | 2.22 | % | | | 2.24 | % | | | 2.26 | % |
Net expenses | | | 2.12 | % | | | 2.15 | % | | | 2.15 | % | | | 2.15 | % | | | 2.15 | % |
Net investment income (loss) | | | 0.32 | % | | | 0.05 | % | | | (0.06 | )% | | | 0.20 | % | | | 0.16 | % |
Supplemental data | | | | | | | | | | | | | | | | | | | | |
Portfolio turnover rate | | | 23 | % | | | 32 | % | | | 23 | % | | | 22 | % | | | 27 | % |
Net assets, end of period (000s omitted) | | | $7,252 | | | | $8,958 | | | | $9,788 | | | | $9,949 | | | | $7,341 | |
| 1 | Calculated based upon average shares outstanding |
| 2 | Total return calculations do not include any sales charges. |
| 3 | During the year ended October 31, 2012, the Fund received a regulatory settlement from an unaffiliated third party which had an impact of 2.92% on the total return. |
The accompanying notes are an integral part of these financial statements.
| | | | | | |
| Financial highlights | | Wells Fargo Intrinsic World Equity Fund | | | 17 | |
(For a share outstanding throughout each period)
| | | | | | | | | | | | | | | | | | | | |
| | | Year ended October 31 | |
| ADMINISTRATOR CLASS | | 2016 | | | 2015 | | | 2014 | | | 2013 | | | 2012 | |
Net asset value, beginning of period | | | $22.76 | | | | $22.33 | | | | $21.81 | | | | $17.89 | | | | $15.52 | |
Net investment income | | | 0.24 | 1 | | | 0.23 | 1 | | | 0.22 | 1 | | | 0.24 | 1 | | | 0.19 | 1 |
Net realized and unrealized gains (losses) on investments | | | (0.84 | ) | | | 0.75 | | | | 0.59 | | | | 3.99 | | | | 1.87 | |
| | | | | | | | | | | | | | | | | | | | |
Total from investment operations | | | (0.60 | ) | | | 0.98 | | | | 0.81 | | | | 4.23 | | | | 2.06 | |
Distributions to shareholders from | | | | | | | | | | | | | | | | | | | | |
Net investment income | | | (0.27 | ) | | | (0.18 | ) | | | (0.29 | ) | | | (0.31 | ) | | | (0.16 | ) |
Net realized gains | | | (2.46 | ) | | | (0.37 | ) | | | 0.00 | | | | 0.00 | | | | 0.00 | |
| | | | | | | | | | | | | | | | | | | | |
Total distributions to shareholders | | | (2.73 | ) | | | (0.55 | ) | | | (0.29 | ) | | | (0.31 | ) | | | (0.16 | ) |
Regulatory settlement proceeds | | | 0.00 | | | | 0.00 | | | | 0.00 | | | | 0.00 | | | | 0.47 | |
Net asset value, end of period | | | $19.43 | | | | $22.76 | | | | $22.33 | | | | $21.81 | | | | $17.89 | |
Total return | | | (2.43 | )% | | | 4.51 | % | | | 3.70 | % | | | 24.03 | % | | | 16.52 | %2 |
Ratios to average net assets (annualized) | | | | | | | | | | | | | | | | | | | | |
Gross expenses | | | 1.37 | % | | | 1.34 | % | | | 1.29 | % | | | 1.31 | % | | | 1.34 | % |
Net expenses | | | 1.22 | % | | | 1.15 | % | | | 1.15 | % | | | 1.15 | % | | | 1.15 | % |
Net investment income | | | 1.27 | % | | | 1.01 | % | | | 0.96 | % | | | 1.18 | % | | | 1.14 | % |
Supplemental data | | | | | | | | | | | | | | | | | | | | |
Portfolio turnover rate | | | 23 | % | | | 32 | % | | | 23 | % | | | 22 | % | | | 27 | % |
Net assets, end of period (000s omitted) | | | $4,735 | | | | $6,239 | | | | $7,327 | | | | $5,306 | | | | $2,001 | |
| 1 | Calculated based upon average shares outstanding |
| 2 | During the year ended October 31, 2012, the Fund received a regulatory settlement from an unaffiliated third party which had an impact of 2.93% on the total return |
The accompanying notes are an integral part of these financial statements.
| | | | |
| 18 | | Wells Fargo Intrinsic World Equity Fund | | Financial highlights |
(For a share outstanding throughout each period)
| | | | | | | | | | | | | | | | | | | | |
| | | Year ended October 31 | |
| INSTITUTIONAL CLASS | | 2016 | | | 2015 | | | 2014 | | | 2013 | | | 2012 | |
Net asset value, beginning of period | | | $22.83 | | | | $22.40 | | | | $21.87 | | | | $17.93 | | | | $15.54 | |
Net investment income | | | 0.26 | | | | 0.28 | | | | 0.25 | 1 | | | 0.26 | 1 | | | 0.17 | 1 |
Net realized and unrealized gains (losses) on investments | | | (0.80 | ) | | | 0.75 | | | | 0.60 | | | | 4.02 | | | | 1.92 | |
| | | | | | | | | | | | | | | | | | | | |
Total from investment operations | | | (0.54 | ) | | | 1.03 | | | | 0.85 | | | | 4.28 | | | | 2.09 | |
Distributions to shareholders from | | | | | | | | | | | | | | | | | | | | |
Net investment income | | | (0.32 | ) | | | (0.23 | ) | | | (0.32 | ) | | | (0.34 | ) | | | (0.17 | ) |
Net realized gains | | | (2.46 | ) | | | (0.37 | ) | | | 0.00 | | | | 0.00 | | | | 0.00 | |
| | | | | | | | | | | | | | | | | | | | |
Total distributions to shareholders | | | (2.78 | ) | | | (0.60 | ) | | | (0.32 | ) | | | (0.34 | ) | | | (0.17 | ) |
Regulatory settlement proceeds | | | 0.00 | | | | 0.00 | | | | 0.00 | | | | 0.00 | | | | 0.47 | |
Net asset value, end of period | | | $19.51 | | | | $22.83 | | | | $22.40 | | | | $21.87 | | | | $17.93 | |
Total return | | | (2.13 | )% | | | 4.72 | % | | | 3.90 | % | | | 24.28 | % | | | 16.74 | %2 |
Ratios to average net assets (annualized) | | | | | | | | | | | | | | | | | | | | |
Gross expenses | | | 1.13 | % | | | 1.09 | % | | | 1.04 | % | | | 1.06 | % | | | 1.10 | % |
Net expenses | | | 0.95 | % | | | 0.95 | % | | | 0.95 | % | | | 0.95 | % | | | 0.95 | % |
Net investment income | | | 1.47 | % | | | 1.23 | % | | | 1.11 | % | | | 1.32 | % | | | 1.03 | % |
Supplemental data | | | | | | | | | | | | | | | | | | | | |
Portfolio turnover rate | | | 23 | % | | | 32 | % | | | 23 | % | | | 22 | % | | | 27 | % |
Net assets, end of period (000s omitted) | | | $4,357 | | | | $5,058 | | | | $3,179 | | | | $2,352 | | | | $561 | |
| 1 | Calculated based upon average shares outstanding |
| 2 | During the year ended October 31, 2012, the Fund received a regulatory settlement from an unaffiliated third party which had an impact of 2.93% on the total return. |
The accompanying notes are an integral part of these financial statements.
| | | | | | |
| Notes to financial statements | | Wells Fargo Intrinsic World Equity Fund | | | 19 | |
1. ORGANIZATION
Wells Fargo Funds Trust (the “Trust”), a Delaware statutory trust organized on March 10, 1999, is an open-end management investment company registered under the Investment Company Act of 1940, as amended (the “1940 Act”). As an investment company, the Trust follows the accounting and reporting guidance in Financial Accounting Standards Board (“FASB”) Accounting Standards Codification Topic 946, Financial Services – Investment Companies. These financial statements report on the Wells Fargo Intrinsic World Equity Fund (the “Fund”) which is a diversified series of the Trust.
2. SIGNIFICANT ACCOUNTING POLICIES
The following significant accounting policies, which are consistently followed in the preparation of the financial statements of the Fund, are in conformity with U.S. generally accepted accounting principles which require management to make estimates and assumptions that affect the reported amounts of assets and liabilities, disclosure of contingent assets and liabilities at the date of the financial statements, and the reported amounts of revenues and expenses during the reporting period. Actual results could differ from those estimates.
Securities valuation
All investments are valued each business day as of the close of regular trading on the New York Stock Exchange (generally 4 p.m. Eastern Time), although the Fund may deviate from this calculation time under unusual or unexpected circumstances.
Equity securities that are listed on a foreign or domestic exchange or market are valued at the official closing price or, if none, the last sales price. If no sale occurs on the principal exchange or market that day, the prior day’s price will be deemed “stale” and a fair value price will be determined in accordance with the Fund’s Valuation Procedures.
The values of securities denominated in foreign currencies are translated into U.S. dollars at rates provided by an independent foreign currency pricing source at a time each business day specified by the Management Valuation Team of Wells Fargo Funds Management, LLC (“Funds Management”).
Many securities markets and exchanges outside the U.S. close prior to the close of the New York Stock Exchange and therefore may not fully reflect trading or events that occur after the close of the principal exchange in which the foreign securities are traded, but before the close of the New York Stock Exchange. If such trading or events are expected to materially affect the value of such securities, then fair value pricing procedures approved by the Board of Trustees of the Fund are applied. These procedures take into account multiple factors including movements in U.S. securities markets after foreign exchanges close. Foreign securities that are fair valued under these procedures are categorized as Level 2 and the application of these procedures may result in transfers between Level 1 and Level 2. Depending on market activity, such fair valuations may be frequent. Such fair value pricing may result in net asset values that are higher or lower than net asset values based on the last reported sales price or latest quoted bid price. On October 31, 2016, such fair value pricing was not used in pricing foreign securities.
Investments in registered open-end investment companies are valued at net asset value. Interests in non-registered investment vehicles that are redeemable at net asset value are fair valued normally at net asset value.
Investments which are not valued using any of the methods discussed above are valued at their fair value, as determined in good faith by the Board of Trustees. The Board of Trustees has established a Valuation Committee comprised of the Trustees and has delegated to it the authority to take any actions regarding the valuation of portfolio securities that the Valuation Committee deems necessary or appropriate, including determining the fair value of portfolio securities, unless the determination has been delegated to the Management Valuation Team. The Board of Trustees retains the authority to make or ratify any valuation decisions or approve any changes to the Valuation Procedures as it deems appropriate. On a quarterly basis, the Board of Trustees receives reports on any valuation actions taken by the Valuation Committee or the Management Valuation Team which may include items for ratification.
Valuations of fair valued securities are compared to the next actual sales price when available, or other appropriate market values, to assess the continued appropriateness of the fair valuation methodologies used. These securities are fair valued on a day-to-day basis, taking into consideration changes to appropriate market information and any significant changes to the inputs considered in the valuation process until there is a readily available price provided on an exchange or by an independent pricing service. Valuations received from an independent pricing service or independent broker-dealer quotes are periodically validated by comparisons to most recent trades and valuations provided by other independent pricing services in addition to the review of prices by the manager and/or subadviser. Unobservable inputs used in determining fair valuations are identified based on the type of security, taking into consideration factors utilized by market participants in valuing the investment, knowledge about the issuer and the current market environment.
| | | | |
| 20 | | Wells Fargo Intrinsic World Equity Fund | | Notes to financial statements |
Foreign currency translation
The accounting records of the Fund are maintained in U.S. dollars. The values of other assets and liabilities denominated in foreign currencies are translated into U.S. dollars at rates provided by an independent foreign currency pricing source at a time each business day specified by the Management Valuation Team. Purchases and sales of securities, and income and expenses are converted at the rate of exchange on the respective dates of such transactions. Net realized foreign exchange gains or losses arise from sales of foreign currencies, currency gains or losses realized between the trade and settlement dates on securities transactions, and the difference between the amounts of dividends, interest and foreign withholding taxes recorded and the U.S. dollar equivalent of the amounts actually paid or received. Net unrealized foreign exchange gains and losses arise from changes in the fair value of assets and liabilities other than investments in securities resulting from changes in exchange rates. The changes in net assets arising from changes in exchange rates and the changes in net assets resulting from changes in market prices of securities are not separately presented. Such changes are included in net realized and unrealized gains or losses from investments.
Security loans
The Fund may lend its securities from time to time in order to earn additional income in the form of fees or interest on securities received as collateral or the investment of any cash received as collateral. The Fund continues to receive interest or dividends on the securities loaned. The Fund receives collateral in the form of cash or securities with a value at least equal to the value of the securities on loan. The value of the loaned securities is determined at the close of each business day and any additional required collateral is delivered to the Fund on the next business day. In a securities lending transaction, the net asset value of the Fund will be affected by an increase or decrease in the value of the securities loaned and by an increase or decrease in the value of the instrument in which collateral is invested. The amount of securities lending activity undertaken by the Fund fluctuates from time to time. In the event of default or bankruptcy by the borrower, the Fund may be prevented from recovering the loaned securities or gaining access to the collateral or may experience delays or costs in doing so. In addition, the investment of any cash collateral received may lose all or part of its value. The Fund has the right under the lending agreement to recover the securities from the borrower on demand.
The Fund lends its securities through an unaffiliated securities lending agent. Cash collateral received in connection with its securities lending transactions is invested in Securities Lending Cash Investments, LLC (the “Securities Lending Fund”). The Securities Lending Fund is exempt from registration under Section 3(c)(7) of the 1940 Act and is managed by Funds Management and is subadvised by Wells Capital Management Incorporated (“WellsCap”), an affiliate of Funds Management and an indirect wholly owned subsidiary of Wells Fargo & Company (“Wells Fargo”). Funds Management receives an advisory fee starting at 0.05% and declining to 0.01% as the average daily net assets of the Securities Lending Fund increase. All of the fees received by Funds Management are paid to WellsCap for its services as subadviser. The Securities Lending Fund seeks to provide a positive return compared to the daily Fed Funds Open Rate by investing in high-quality, U.S. dollar-denominated short-term money market instruments. Securities Lending Fund investments are valued at the evaluated bid price provided by an independent pricing service. Income earned from investment in the Securities Lending Fund is included in securities lending income on the Statement of Operations.
Security transactions and income recognition
Securities transactions are recorded on a trade date basis. Realized gains or losses are recorded on the basis of identified cost.
Dividend income is recognized on the ex-dividend date, except for certain dividends from foreign securities, which are recorded as soon as the custodian verifies the ex-dividend date. Dividend income from foreign securities is recorded net of foreign taxes withheld where recovery of such taxes is not assured.
Distributions to shareholders
Distributions to shareholders from net investment income and net realized gains, if any, are recorded on the ex-dividend date. Such distributions are determined in conformity with federal income tax regulations, which may differ in amount or character from net investment income and realized gains recognized for purposes of U.S. generally accepted accounting principles.
Federal and other taxes
The Fund intends to continue to qualify as a regulated investment company by distributing substantially all of its investment company taxable income and any net realized capital gains (after reduction for capital loss carryforwards) sufficient to relieve it from all, or substantially all, federal income taxes. Accordingly, no provision for federal income taxes was required.
| | | | | | |
| Notes to financial statements | | Wells Fargo Intrinsic World Equity Fund | | | 21 | |
The Fund’s income and federal excise tax returns and all financial records supporting those returns for the prior three fiscal years are subject to examination by the federal and Delaware revenue authorities. Management has analyzed the Fund’s tax positions taken on federal, state, and foreign tax returns for all open tax years and does not believe that there are any uncertain tax positions that require recognition of a tax liability.
Reclassifications are made to the Fund’s capital accounts for permanent tax differences to reflect income and gains available for distribution (or available capital loss carryforwards) under federal income tax regulations. U.S. generally accepted accounting principles require that certain components of net assets be adjusted to reflect permanent differences between financial and tax reporting. These reclassifications have no effect on net assets or net asset values per share. The primary permanent differences causing such reclassifications are due to foreign currency transactions and passive foreign investment companies. At October 31, 2016, as a result of permanent book-to-tax differences, the following reclassification adjustments were made on the Statement of Assets and Liabilities:
| | |
Undistributed net
investment income | | Accumulated net
realized gains on investments |
| $172,116 | | $(172,116) |
Class allocations
The separate classes of shares offered by the Fund differ principally in applicable sales charges, distribution, shareholder servicing, and administration fees. Class specific expenses are charged directly to that share class. Investment income, common expenses, and realized and unrealized gains (losses) on investments are allocated daily to each class of shares based on the relative proportion of net assets of each class.
3. FAIR VALUATION MEASUREMENTS
Fair value measurements of investments are determined within a framework that has established a fair value hierarchy based upon the various data inputs utilized in determining the value of the Fund’s investments. The three-level hierarchy gives the highest priority to unadjusted quoted prices in active markets for identical assets or liabilities (Level 1) and the lowest priority to significant unobservable inputs (Level 3). The Fund’s investments are classified within the fair value hierarchy based on the lowest level of input that is significant to the fair value measurement. The inputs are summarized into three broad levels as follows:
| ∎ | | Level 1 – quoted prices in active markets for identical securities |
| ∎ | | Level 2 – other significant observable inputs (including quoted prices for similar securities, interest rates, prepayment speeds, credit risk, use of amortized cost, etc.) |
| ∎ | | Level 3 – significant unobservable inputs (including the Fund’s own assumptions in determining the fair value of investments) |
The inputs or methodologies used for valuing investments in securities are not necessarily an indication of the risk associated with investing in those securities.
| | | | |
| 22 | | Wells Fargo Intrinsic World Equity Fund | | Notes to financial statements |
The following is a summary of the inputs used in valuing the Fund’s assets and liabilities as of October 31, 2016:
| | | | | | | | | | | | | | | | |
| | | Quoted prices
(Level 1) | | | Other significant
observable inputs
(Level 2) | | | Significant
unobservable inputs
(Level 3) | | | Total | |
Assets | | | | | | | | | | | | | | | | |
Investments in: | | | | | | | | | | | | | | | | |
| | | | |
Common stocks | | | | | | | | | | | | | | | | |
France | | $ | 5,423,797 | | | $ | 0 | | | $ | 0 | | | $ | 5,423,797 | |
Germany | | | 6,708,441 | | | | 0 | | | | 0 | | | | 6,708,441 | |
Hong Kong | | | 3,728,899 | | | | 0 | | | | 0 | | | | 3,728,899 | |
Japan | | | 14,805,077 | | | | 0 | | | | 0 | | | | 14,805,077 | |
Luxembourg | | | 1,571,753 | | | | 0 | | | | 0 | | | | 1,571,753 | |
Netherlands | | | 13,519,480 | | | | 0 | | | | 0 | | | | 13,519,480 | |
South Korea | | | 1,446,703 | | | | 0 | | | | 0 | | | | 1,446,703 | |
Spain | | | 2,265,939 | | | | 0 | | | | 0 | | | | 2,265,939 | |
Sweden | | | 886,677 | | | | 0 | | | | 0 | | | | 886,677 | |
Switzerland | | | 10,718,208 | | | | 0 | | | | 0 | | | | 10,718,208 | |
United Kingdom | | | 7,576,745 | | | | 0 | | | | 0 | | | | 7,576,745 | |
United States | | | 74,265,485 | | | | 0 | | | | 0 | | | | 74,265,485 | |
| | | | |
Short-term investments | | | | | | | | | | | | | | | | |
Investment companies | | | 343,055 | | | | 0 | | | | 0 | | | | 343,055 | |
Total assets | | $ | 143,260,259 | | | $ | 0 | | | $ | 0 | | | $ | 143,260,259 | |
The Fund recognizes transfers between levels within the fair value hierarchy at the end of the reporting period. Fair value pricing that was used in pricing certain foreign securities at the previous period end was not used at October 31, 2016. As a result, common stocks valued at $43,607,733 were transferred from Level 2 to Level 1 within the fair value hierarchy. The Fund did not have any transfers into/out of Level 3.
4. TRANSACTIONS WITH AFFILIATES
Management fee
Funds Management, an indirect wholly owned subsidiary of Wells Fargo, is the manager of the Fund and provides advisory and fund-level administrative services under an investment management agreement. Under the investment management agreement, Funds Management is responsible for, among other services, implementing the investment objectives and strategies of the Fund, supervising the subadviser, providing fund-level administrative services in connection with the Fund’s operations, and providing any other fund-level administrative services reasonably necessary for the operation of the Fund. As compensation for its services under the investment management agreement, Funds Management is entitled to receive an annual management fee starting at 0.85% and declining to 0.68% as the average daily net assets of the Fund increase. For the year ended October 31, 2016, the management fee was equivalent to an annual rate of 0.85% of the Fund’s average daily net assets.
Funds Management has retained the services of a subadviser to provide daily portfolio management to the Fund. The fee for subadvisory services is borne by Funds Management. WellsCap is the subadviser to the Fund and is entitled to receive a fee from Funds Management at an annual rate starting at 0.35% and declining to 0.20% as the average daily net assets of the Fund increase. Prior to July 1, 2016, Metropolitan West Capital Management, LLC was the subadviser and received a fee at the same annual rates. On July 1, 2016, Metropolitan West Capital Management, LLC merged with WellsCap.
Administration fees
Under a class-level administration agreement, Funds Management provides class-level administrative services to the Fund, which includes paying fees and expenses for services provided by the transfer agent, sub-transfer agents, omnibus
| | | | | | |
| Notes to financial statements | | Wells Fargo Intrinsic World Equity Fund | | | 23 | |
account servicers and record-keepers. As compensation for its services under the class-level administration agreement, Funds Management receives an annual fee which is calculated based on the average daily net assets of each class as follows:
| | | | |
| | | Class-level
administration fee | |
Class A, Class C | | | 0.21 | % |
Administrator Class, Institutional Class | | | 0.13 | |
Funds Management has contractually waived and/or reimbursed management and administration fees to the extent necessary to maintain certain net operating expense ratios for the Fund. Waiver of fees and/or reimbursement of expenses by Funds Management were made first from fund level expenses on a proportionate basis and then from class specific expenses. Funds Management has committed through February 28, 2017 to waive fees and/or reimburse expenses to the extent necessary to cap the Fund’s expenses at 1.35% for Class A shares, 2.10% for Class C shares, 1.25% for Administrator Class shares, and 0.95% for Institutional Class shares. After this time, the cap may be increased or the commitment to maintain the cap may be terminated only with the approval of the Board of Trustees. Prior to March 1, 2016, the Fund’s expenses were capped at 1.40% for Class A shares, 2.15% for Class C shares, and 1.15% for Administrator Class shares.
Distribution fee
The Trust has adopted a distribution plan for Class C shares of the Fund pursuant to Rule 12b-1 under the 1940 Act. A distribution fee is charged to Class C shares and paid to Wells Fargo Funds Distributor, LLC (“Funds Distributor”), the principal underwriter, at an annual rate of 0.75% of the average daily net assets of Class C shares.
In addition, Funds Distributor is entitled to receive the front-end sales charge from the purchase of Class A shares and a contingent deferred sales charge on the redemption of certain Class A shares. Funds Distributor is also entitled to receive the contingent deferred sales charges from redemptions of Class C shares. For the year ended October 31, 2016, Funds Distributor received $1,733 from the sale of Class A shares and $10 in contingent deferred sales charges from redemptions of Class C shares.
Shareholder servicing fees
The Trust has entered into contracts with one or more shareholder servicing agents, whereby Class A, Class C, and Administrator Class of the Fund are charged a fee at an annual rate of 0.25% of the average daily net assets of each respective class.
A portion of these total shareholder servicing fees were paid to affiliates of Wells Fargo.
5. INVESTMENT PORTFOLIO TRANSACTIONS
Purchases and sales of investments, excluding U.S. government obligations (if any) and short-term securities, for the year ended October 31, 2016 were $34,921,340 and $52,197,036, respectively.
The Fund may purchase or sell investment securities to other Wells Fargo funds under procedures adopted by the Board of Trustees. The procedures have been designed to ensure that these interfund transactions, which generally do not incur broker commissions, are effected at current market prices. Interfund trades are included within the respective purchases and sales amounts shown.
6. BANK BORROWINGS
The Trust (excluding the money market funds and certain other funds) and Wells Fargo Variable Trust are parties to a $250,000,000 revolving credit agreement whereby the Fund is permitted to use bank borrowings for temporary or emergency purposes, such as to fund shareholder redemption requests. Interest under the credit agreement is charged to the Fund based on a borrowing rate equal to the higher of the Federal Funds rate in effect on that day plus 1.25% or the overnight LIBOR rate in effect on that day plus 1.25%. In addition, an annual commitment fee equal to 0.25% of the unused balance is allocated to each participating fund. Prior to August 30, 2016, the revolving credit agreement amount was $200,000,000 and the annual commitment fee was equal to 0.20% of the unused balance which was allocated to each participating fund.
For the year ended October 31, 2016, there were no borrowings by the Fund under the agreement.
| | | | |
| 24 | | Wells Fargo Intrinsic World Equity Fund | | Notes to financial statements |
7. DISTRIBUTIONS TO SHAREHOLDERS
The tax character of distributions paid during the years ended October 31, 2016 and October 31, 2015 were as follows:
| | | | | | | | |
| | | Year ended October 31 | |
| | | 2016 | | | 2015 | |
Ordinary income | | $ | 2,314,580 | | | $ | 957,783 | |
Long-term capital gain | | | 17,454,228 | | | | 2,956,361 | |
As of October 31, 2016, the components of distributable earnings on a tax basis were as follows:
| | | | |
Undistributed ordinary income | | Undistributed long-term gain | | Unrealized gains |
| $1,716,337 | | $6,900,161 | | $15,662,073 |
8. INDEMNIFICATION
Under the Trust’s organizational documents, the officers and Trustees have been granted certain indemnification rights against certain liabilities that may arise out of performance of their duties to the Trust. Additionally, in the normal course of business, the Trust may enter into contracts with service providers that contain a variety of indemnification clauses. The Trust’s maximum exposure under these arrangements is dependent on future claims that may be made against the Fund and, therefore, cannot be estimated.
9. REGULATORY CHANGES
In October 2016, the Securities and Exchange Commission (“SEC”) adopted new rules and forms and amended existing rules and forms (together, “final rules”) intended to modernize and enhance the reporting and disclosure of information by registered investment companies and to enhance liquidity risk management by open-end mutual funds and exchange-traded funds. The final rules will enhance the quality of information available to investors and will allow the SEC to more effectively collect and use data reported by funds. In part, the final rules amend Regulation S-X and require standardized, enhanced disclosure about derivatives in the Fund’s financial statements, as well as other amendments. The compliance date for the amendments to Regulation S-X is August 1, 2017 while the compliance date for the new form types is June 1, 2018 and the compliance date for the liquidity risk management program requirements is December 1, 2018. Management is currently assessing the potential impact of these enhancements and their impact on the financial statement disclosures and reporting requirements.
10. SUBSEQUENT DISTRIBUTIONS
On December 9, 2016, the Fund declared distributions from long-term capital gains to shareholders of record on December 8, 2016. The per share amounts payable on December 12, 2016 were as follows:
| | | | |
| | | Long-term capital gains | |
Class A | | | $0.95091 | |
Class C | | | 0.95091 | |
Administrator Class | | | 0.95091 | |
Institutional Class | | | 0.95091 | |
These distributions are not reflected in the accompanying financial statements. The final determination of the source of all distributions is subject to change and made after the Fund’s tax year-end.
| | | | | | |
| Report of independent registered public accounting firm | | Wells Fargo Intrinsic World Equity Fund | | | 25 | |
BOARD OF TRUSTEES AND SHAREHOLDERS OF WELLS FARGO FUNDS TRUST:
We have audited the accompanying statement of assets and liabilities, including the portfolio of investments, of the Wells Fargo Intrinsic World Equity Fund (the “Fund”), one of the funds constituting the Wells Fargo Funds Trust, as of October 31, 2016, and the related statement of operations for the year then ended, the statements of changes in net assets for each of the years in the two-year period then ended, and the financial highlights for each of the years in the five-year period then ended. These financial statements and financial highlights are the responsibility of the Fund’s management. Our responsibility is to express an opinion on these financial statements and financial highlights based on our audits.
We conducted our audits in accordance with the standards of the Public Company Accounting Oversight Board (United States). Those standards require that we plan and perform the audit to obtain reasonable assurance about whether the financial statements and financial highlights are free of material misstatement. An audit includes examining, on a test basis, evidence supporting the amounts and disclosures in the financial statements. Our procedures included confirmation of securities owned as of October 31, 2016, by correspondence with the custodian and brokers, or by other appropriate auditing procedures. An audit also includes assessing the accounting principles used and significant estimates made by management, as well as evaluating the overall financial statement presentation. We believe that our audits provide a reasonable basis for our opinion.
In our opinion, the financial statements and financial highlights referred to above present fairly, in all material respects, the financial position of the Wells Fargo Intrinsic World Equity Fund as of October 31, 2016 the results of its operations for the year then ended, the changes in its net assets for each of the years in the two-year period then ended, and the financial highlights for each of the years in the five-year period then ended, in conformity with U.S. generally accepted accounting principles.

Boston, Massachusetts
December 22, 2016
| | | | |
| 26 | | Wells Fargo Intrinsic World Equity Fund | | Other information (unaudited) |
TAX INFORMATION
For corporate shareholders, pursuant to Section 854 of the Internal Revenue Code, 81.59% of ordinary income dividends qualify for the corporate dividends-received deduction for the fiscal year ended October 31, 2016.
Pursuant to Section 852 of the Internal Revenue Code, $17,454,228 was designated as a 20% rate gain distribution for the fiscal year ended October 31, 2016.
Pursuant to Section 854 of the Internal Revenue Code, $2,314,580 of income dividends paid during the fiscal year ended October 31, 2016 has been designated as qualified dividend income (QDI).
For the fiscal year ended October 31, 2016, $674,673 has been designated as short-term capital gain dividends for nonresident alien shareholders pursuant to Section 871 of the Internal Revenue Code.
Pursuant to Section 853 of the Internal Revenue Code, the Fund expects to designate amounts as foreign taxes paid for the fiscal year ended October 31, 2016. Additional details will be available in the semiannual report.
PROXY VOTING INFORMATION
A description of the policies and procedures that the Fund uses to determine how to vote proxies relating to portfolio securities is available, upon request, by calling 1-800-222-8222, visiting our website at wellsfargofunds.com, or visiting the SEC website at sec.gov. Information regarding how the Fund voted proxies relating to portfolio securities during the most recent 12-month period ended June 30 is available on the Fund’s website at wellsfargofunds.com or by visiting the SEC website at sec.gov.
PORTFOLIO HOLDINGS INFORMATION
The complete portfolio holdings for the Fund are publicly available monthly on the Fund’s website (wellsfargofunds.com), on a one-month delayed basis. In addition, top ten holdings information (excluding derivative positions) for the Fund is publicly available on the Fund’s website on a monthly, seven-day or more delayed basis. The Fund files its complete schedule of portfolio holdings with the SEC for the first and third quarters of each fiscal year on Form N-Q, which is available by visiting the SEC website at sec.gov. In addition, the Fund’s Form N-Q may be reviewed and copied at the SEC’s Public Reference Room in Washington, DC, and at regional offices in New York City, at 233 Broadway, and in Chicago, at 175 West Jackson Boulevard, Suite 900. Information about the Public Reference Room may be obtained by calling 1-800-SEC-0330.
| | | | | | |
| Other information (unaudited) | | Wells Fargo Intrinsic World Equity Fund | | | 27 | |
BOARD OF TRUSTEES AND OFFICERS
Each of the Trustees and Officers1 listed in the table below acts in identical capacities for each fund in the Wells Fargo family of funds, which consists of 139 mutual funds comprising the Wells Fargo Funds Trust, Wells Fargo Variable Trust, Wells Fargo Master Trust and four closed-end funds (collectively the “Fund Complex”). This table should be read in conjunction with the Prospectus and the Statement of Additional Information2. The mailing address of each Trustee and Officer is 525 Market Street, 12th Floor, San Francisco, CA 94105. Each Trustee and Officer serves an indefinite term, however, each Trustee serves such term until reaching the mandatory retirement age established by the Trustees.
Independent Trustees
| | | | | | |
Name and year of birth | | Position held and length of service* | | Principal occupations during past five years or longer | | Current other
public company or
investment company
directorships |
| William R. Ebsworth (Born 1957) | | Trustee, since 2015 | | Retired. From 1984 to 2013, equities analyst, portfolio manager, research director and chief investment officer at Fidelity Management and Research Company in Boston, Tokyo, and Hong Kong and retired in 2013 as Chief Investment Officer of Fidelity Strategic Advisers, Inc. where he lead a team of investment professionals managing client assets. Prior thereto, Board member of Hong Kong Securities Clearing Co., Hong Kong Options Clearing Corp., the Thailand International Fund, Ltd., Fidelity Investments Life Insurance Company, and Empire Fidelity Investments Life Insurance Company. Mr. Ebsworth is a CFA® charterholder and an Adjunct Lecturer, Finance, at Babson College. | | Asset Allocation Trust |
| Jane A. Freeman (Born 1953) | | Trustee, since 2015 | | Retired. From 2012 to 2014 and 1999 to 2008, Chief Financial Officer of Scientific Learning Corporation. From 2008 to 2012, Ms. Freeman provided consulting services related to strategic business projects. Prior to 1999, Portfolio Manager at Rockefeller & Co. and Scudder, Stevens & Clark. Board member of the Harding Loevner Funds from 1996 to 2014, serving as both Lead Independent Director and chair of the Audit Committee. Board member of the Russell Exchange Traded Funds Trust from 2011 to 2012 and the chair of the Audit Committee. Ms. Freeman is Chair of Taproot Foundation (non-profit organization), a Board Member of Ruth Bancroft Garden (non-profit organization) and an inactive chartered financial analyst. | | Asset Allocation Trust |
| Peter G. Gordon** (Born 1942) | | Trustee, since 1998; Chairman, since 2005 | | Co-Founder, Retired Chairman, President and CEO of Crystal Geyser Water Company. Trustee Emeritus, Colby College. | | Asset Allocation Trust |
| Isaiah Harris, Jr. (Born 1952) | | Trustee, since 2009 | | Retired. Chairman of the Board of CIGNA Corporation since 2009, and Director since 2005. From 2003 to 2011, Director of Deluxe Corporation. Prior thereto, President and CEO of BellSouth Advertising and Publishing Corp. from 2005 to 2007, President and CEO of BellSouth Enterprises from 2004 to 2005 and President of BellSouth Consumer Services from 2000 to 2003. Emeritus member of the Iowa State University Foundation Board of Governors. Emeritus Member of the Advisory Board of Iowa State University School of Business. Advisory Board Member, Palm Harbor Academy (charter school). Advisory Board Member, Child Evangelism Fellowship (non-profit). Mr. Harris is a certified public accountant (inactive status). | | CIGNA Corporation; Asset Allocation Trust |
| Judith M. Johnson (Born 1949) | | Trustee, since 2008; Audit Committee Chairman, since 2008 | | Retired. Prior thereto, Chief Executive Officer and Chief Investment Officer of Minneapolis Employees Retirement Fund from 1996 to 2008. Ms. Johnson is an attorney, certified public accountant and a certified managerial accountant. | | Asset Allocation Trust |
| David F. Larcker (Born 1950) | | Trustee, since 2009 | | James Irvin Miller Professor of Accounting at the Graduate School of Business, Stanford University, Director of the Corporate Governance Research Initiative and Senior Faculty of The Rock Center for Corporate Governance since 2006. From 2005 to 2008, Professor of Accounting at the Graduate School of Business, Stanford University. Prior thereto, Ernst & Young Professor of Accounting at The Wharton School, University of Pennsylvania from 1985 to 2005. | | Asset Allocation Trust |
| | | | |
| 28 | | Wells Fargo Intrinsic World Equity Fund | | Other information (unaudited) |
| | | | | | |
Name and year of birth | | Position held and length of service* | | Principal occupations during past five years or longer | | Current other
public company or
investment company
directorships |
| Olivia S. Mitchell (Born 1953) | | Trustee, since 2006 | | International Foundation of Employee Benefit Plans Professor, Wharton School of the University of Pennsylvania since 1993. Director of Wharton’s Pension Research Council and Boettner Center on Pensions & Retirement Research, and Research Associate at the National Bureau of Economic Research. Previously, Cornell University Professor from 1978 to 1993. | | Asset Allocation Trust |
| Timothy J. Penny (Born 1951) | | Trustee, since 1996 | | President and Chief Executive Officer of Southern Minnesota Initiative Foundation, a non-profit organization, since 2007 and Senior Fellow at the Humphrey Institute Policy Forum at the University of Minnesota since 1995. Member of the Board of Trustees of NorthStar Education Finance, Inc., a non-profit organization, since 2007. | | Asset Allocation Trust |
| Michael S. Scofield (Born 1943) | | Trustee, since 2010 | | Served on the Investment Company Institute’s Board of Governors and Executive Committee from 2008-2011 as well the Governing Council of the Independent Directors Council from 2006-2011 and the Independent Directors Council Executive Committee from 2008-2011. Chairman of the IDC from 2008-2010. Institutional Investor (Fund Directions) Trustee of Year in 2007. Trustee of the Evergreen Funds complex (and its predecessors) from 1984 to 2010. Chairman of the Evergreen Funds from 2000-2010. Former Trustee of the Mentor Funds. Retired Attorney, Law Offices of Michael S. Scofield. | | Asset Allocation Trust |
| * | Length of service dates reflect the Trustee’s commencement of service with the Trust’s predecessor entities, where applicable. |
| ** | Peter Gordon is expected to retire on December 31, 2017. |
Officers
| | | | | | |
Name and year of birth | | Position held and length of service | | Principal occupations during past five years or longer | | |
Karla M. Rabusch
(Born 1959) | | President, since 2003 | | Executive Vice President of Wells Fargo Bank, N.A. and President of Wells Fargo Funds Management, LLC since 2003. | | |
Jeremy DePalma1
(Born 1974) | | Treasurer, since 2012 | | Senior Vice President of Wells Fargo Funds Management, LLC since 2009. Senior Vice President of Evergreen Investment Management Company, LLC from 2008 to 2010 and head of the Fund Reporting and Control Team within Fund Administration from 2005 to 2010. | | |
C. David Messman
(Born 1960) | | Secretary, since 2000; Chief Legal Officer, since 2003 | | Senior Vice President and Secretary of Wells Fargo Funds Management, LLC since 2001. Assistant General Counsel of Wells Fargo Bank, N.A. since 2013 and Vice President and Managing Counsel of Wells Fargo Bank, N.A. from 1996 to 2013. | | |
Michael Whitaker3 (Born 1967) | | Chief Compliance Officer, since 2016 | | Executive Vice President of Wells Fargo Funds Management, LLC since 2016. Chief Compliance Officer of Fidelity’s Fixed Income Funds and Asset Allocation Funds from 2008 to 2016, Compliance Officer of FMR Co., Inc. from 2014 to 2016, Fidelity Investments Money Management, Inc. from 2014 to 2016, Fidelity Investments from 2007 to 2016. | | |
David Berardi
(Born 1975) | | Assistant Treasurer, since 2009 | | Vice President of Wells Fargo Funds Management, LLC since 2009. Vice President of Evergreen Investment Management Company, LLC from 2008 to 2010. Manager of Fund Reporting and Control for Evergreen Investment Management Company, LLC from 2004 to 2010. | | |
| 1 | Jeremy DePalma acts as Treasurer of 69 funds and Assistant Treasurer of 70 funds in the Fund Complex. |
| 2 | The Statement of Additional Information includes additional information about the Trustees and is available, without charge, upon request, by calling
1-800-222-8222 or by visiting the website at wellsfargofunds.com. |
| 3 | Michael Whitaker became Chief Compliance Officer effective May 16, 2016. |
| | | | | | |
| Other information (unaudited) | | Wells Fargo Intrinsic World Equity Fund | | | 29 | |
BOARD CONSIDERATION OF INVESTMENT MANAGEMENT AND SUB-ADVISORY AGREEMENTS:
Under the Investment Company Act of 1940 (the “1940 Act”), the Board of Trustees (the “Board”) of Wells Fargo Funds Trust (the “Trust”) must determine annually whether to approve the continuation of the Trust’s investment management and sub-advisory agreements. In this regard, at an in-person meeting held on May 24-25, 2016 (the “Meeting”), the Board, all the members of which have no direct or indirect interest in the investment management and sub-advisory agreements and are not “interested persons” of the Trust, as defined in the 1940 Act (the “Independent Trustees”), reviewed and approved for Wells Fargo Intrinsic World Equity Fund (the “Fund”): (i) an investment management agreement (the “Management Agreement”) with Wells Fargo Funds Management, LLC (“Funds Management”); and (ii) an investment sub-advisory agreement (the “Sub-Advisory Agreement”) with Metropolitan West Capital Management, LLC (the “Sub-Adviser”), an affiliate of Funds Management. The Management Agreement and the Sub-Advisory Agreement are collectively referred to as the “Advisory Agreements.”
At the Meeting, the Board considered the factors and reached the conclusions described below relating to the selection of Funds Management and the Sub-Adviser and the approval of the Advisory Agreements. Prior to the Meeting, including at an in-person meeting in April 2016, the Trustees conferred extensively among themselves and with representatives of Funds Management about these matters. Also, the Board has adopted a team-based approach, with each team consisting of a sub-set of Trustees, to assist the full Board in the discharge of its duties in reviewing performance and other matters throughout the year. The Independent Trustees were assisted in their evaluation of the Advisory Agreements by independent legal counsel, from whom they received separate legal advice and with whom they met separately.
In providing information to the Board, Funds Management and the Sub-Adviser were guided by a detailed set of requests for information submitted to them by independent legal counsel on behalf of the Independent Trustees at the start of the Board’s annual contract renewal process earlier in 2016. In considering and approving the Advisory Agreements, the Trustees considered the information they believed relevant, including but not limited to the information discussed below. The Board considered not only the specific information presented in connection with the Meeting, but also the knowledge gained over time through interaction with Funds Management and the Sub-Adviser about various topics. In this regard, the Board reviewed reports of Funds Management at each of its quarterly meetings, which included, among other things, portfolio reviews and performance reports. In addition, the Board and the teams mentioned above confer with portfolio managers at various times throughout the year. The Board did not identify any particular information or consideration that was all-important or controlling, and each individual Trustee may have attributed different weights to various factors.
After its deliberations, the Board unanimously approved the continuation of the Advisory Agreements for a one-year term and determined that the compensation payable to Funds Management and the Sub-Adviser under each of the Advisory Agreements was reasonable. The Board considered the approval of the Advisory Agreements for the Fund as part of its consideration of agreements for funds across the complex, but its approvals were made on a fund-by-fund basis. The following summarizes a number of important, but not necessarily all, factors considered by the Board in support of its approvals.
Nature, extent and quality of services
The Board received and considered various information regarding the nature, extent and quality of services provided to the Fund by Funds Management and the Sub-Adviser under the Advisory Agreements. This information included a description of the investment advisory services and Fund-level administrative services covered by the Management Agreement, as well as, among other things, a summary of the background and experience of senior management of Funds Management, and the qualifications, background, tenure and responsibilities of each of the portfolio managers primarily responsible for the day-to-day portfolio management of the Fund.
The Board evaluated the ability of Funds Management and the Sub-Adviser to attract and retain qualified investment professionals, including research, advisory and supervisory personnel. The Board further considered the compliance programs and compliance records of Funds Management and the Sub-Adviser. In addition, the Board took into account the full range of services provided to the Fund by Funds Management and its affiliates.
Fund performance and expenses
The Board considered the performance results for the Fund over various time periods ended December 31, 2015. The Board considered these results in comparison to the performance of funds in a universe that was determined by Broadridge Inc. (“Broadridge”) to be similar to the Fund (the “Universe”), and in comparison to the Fund’s benchmark index and to other comparative data. Broadridge is an independent provider of investment company data. The Board received a description of the methodology used by Broadridge to select the mutual funds in the performance Universe.
| | | | |
| 30 | | Wells Fargo Intrinsic World Equity Fund | | Other information (unaudited) |
The Board noted that the performance of the Fund (Administrator Class) was higher than or in range of the average performance of the Universe for all periods under review except the three-year period under review. The Board also noted that the performance of the Fund was higher than its benchmark, the MSCI World Index (Net), for all periods under review except the three-year period.
The Board received information concerning, and discussed factors contributing to, the underperformance of the Fund relative to the Universe and benchmark for the periods noted above. The Board took note of the explanations for the relative underperformance in these periods, including with respect to market factors and investment decisions that affected the Fund’s performance.
The Board also received and considered information regarding the Fund’s net operating expense ratios and their various components, including actual management fees, custodian and other non-management fees, and Rule 12b-1 and non-Rule 12b-1 shareholder service fees. The Board considered these ratios in comparison to the median ratios of funds in class-specific expense groups that were determined by Broadridge to be similar to the Fund (the “Groups”). The Board received a description of the methodology used by Broadridge to select the mutual funds in the expense Groups and an explanation of how funds comprising expense groups and their expense ratios may vary from year-to-year. Based on the Broadridge reports, the Board noted that the net operating expense ratios of the Fund were lower than or in range of the median net operating expense ratios of the expense Groups.
The Board took into account the Fund performance and expense information provided to it among the factors considered in deciding to re-approve the Advisory Agreements.
Investment management and sub-advisory fee rates
The Board reviewed and considered the contractual fee rates payable by the Fund to Funds Management under the Management Agreement, as well as the contractual fee rates payable by the Fund to Funds Management for class-level administrative services under a Class-Level Administration Agreement, which include class-level transfer agency and sub-transfer agency costs (collectively, the “Management Rates”). The Board also reviewed and considered the contractual investment sub-advisory fee rates that are payable by Funds Management to the Sub-Adviser for investment sub-advisory services.
Among other information reviewed by the Board was a comparison of the Fund’s Management Rates with the average contractual investment management fee rates of funds in the expense Groups at a common asset level as well as transfer agency costs of the funds in the expense Groups. The Board noted that the Management Rates of the Fund were in range of the sum of these average rates for the Fund’s expense Groups for all share classes.
The Board also received and considered information about the portion of the total management fee that was retained by Funds Management after payment of the fee to the Sub-Adviser for sub-advisory services. In assessing the reasonableness of this amount, the Board received and evaluated information about the nature and extent of responsibilities retained and risks assumed by Funds Management and not delegated to or assumed by the Sub-Adviser, and about Funds Management’s on-going oversight services. However, given the affiliation between Funds Management and the Sub-Adviser, the Board ascribed limited relevance to the allocation of fees between them.
The Board also received and considered information about the nature and extent of services offered and fee rates charged by Funds Management and the Sub-Adviser to other types of clients with investment strategies similar to those of the Fund. In this regard, the Board received information about the significantly greater scope of services, and compliance, reporting and other legal burdens and risks of managing mutual funds compared with those associated with managing assets of non-mutual fund clients such as collective funds or institutional separate accounts.
Based on its consideration of the factors and information it deemed relevant, including those described here, the Board determined that the compensation payable to Funds Management under the Management Agreement and to the Sub-Adviser under the Sub-Advisory Agreement was reasonable, in light of the services covered by the Advisory Agreements.
Profitability
The Board received and considered information concerning the profitability of Funds Management, as well as the profitability of Wells Fargo as a whole, from providing services to the Fund and the fund family as a whole. The Board also received and considered information concerning the profitability of the Sub-Adviser from providing services to the fund family as a whole, noting that the Sub-Adviser’s profitability information with respect to providing services to the Fund was subsumed in the Wells Fargo and Funds Management profitability analysis.
| | | | | | |
| Other information (unaudited) | | Wells Fargo Intrinsic World Equity Fund | | | 31 | |
Funds Management reported on the methodologies and estimates used in calculating profitability. Among other things, the Board noted that the levels of profitability reported on a fund-by-fund basis varied widely, depending on factors such as the size and type of fund. Based on its review, the Board did not deem the profits reported by Funds Management or Wells Fargo from its services to the Fund to be at a level that would prevent it from approving the continuation of the Advisory Agreements.
Economies of scale
With respect to possible economies of scale, the Board noted the existence of breakpoints in the Fund’s management fee structure, which operate generally to reduce the Fund’s expense ratios as the Fund grows in size. It considered that, for a small fund or a fund that shrinks in size, breakpoints conversely can result in higher fee levels. The Board also considered that fee waiver and expense reimbursement arrangements and competitive fee rates at the outset are means of sharing potential economies of scale with shareholders of the Fund and the fund family as a whole. The Board considered Funds Management’s view that any analyses of potential economies of scale in managing a particular fund are inherently limited in light of the joint and common costs and investments that Funds Management incurs across the fund family as a whole.
The Board concluded that the Fund’s fee and expense arrangements, including contractual breakpoints, constituted a reasonable approach to sharing potential economies of scale with the Fund and its shareholders.
Other benefits to Funds Management and the Sub-Adviser
The Board received and considered information regarding potential “fall-out” or ancillary benefits received by Funds Management and its affiliates, including the Sub-Adviser, as a result of their relationships with the Fund. Ancillary benefits could include, among others, benefits directly attributable to other relationships with the Fund and benefits potentially derived from an increase in Funds Management’s and the Sub-Adviser’s business as a result of their relationships with the Fund. The Board noted that various affiliates of Funds Management may receive distribution-related fees, shareholder servicing payments and sub-transfer agency fees in respect of shares sold or held through them and services provided.
The Board also reviewed information about soft dollar credits earned and utilized by the Sub-Adviser, fees earned by Funds Management from managing a private investment vehicle for the fund family’s securities lending collateral and commissions earned by an affiliated broker from portfolio transactions.
Based on its consideration of the factors and information it deemed relevant, including those described here, the Board did not find that any ancillary benefits received by Funds Management and its affiliates, including the Sub-Adviser, were unreasonable.
Conclusion
At the Meeting, after considering the above-described factors and based on its deliberations and its evaluation of the information described above, the Board unanimously approved the continuation of the Advisory Agreements for a one-year term and determined that the compensation payable to Funds Management and the Sub-Adviser under each of the Advisory Agreements was reasonable.
| | | | |
| 32 | | Wells Fargo Intrinsic World Equity Fund | | List of abbreviations |
The following is a list of common abbreviations for terms and entities that may have appeared in this report.
| ACA | — ACA Financial Guaranty Corporation |
| ADR | — American depositary receipt |
| ADS | — American depositary shares |
| AGC | — Assured Guaranty Corporation |
| AGM | — Assured Guaranty Municipal |
| Ambac | — Ambac Financial Group Incorporated |
| AMT | — Alternative minimum tax |
| BAN | — Bond anticipation notes |
| BHAC | — Berkshire Hathaway Assurance Corporation |
| CAB | — Capital appreciation bond |
| CCAB | — Convertible capital appreciation bond |
| CDA | — Community Development Authority |
| CDO | — Collateralized debt obligation |
| DRIVER | — Derivative inverse tax-exempt receipts |
| DW&P | — Department of Water & Power |
| DWR | — Department of Water Resources |
| ECFA | — Educational & Cultural Facilities Authority |
| EDA | — Economic Development Authority |
| EDFA | — Economic Development Finance Authority |
| ETF | — Exchange-traded fund |
| FDIC | — Federal Deposit Insurance Corporation |
| FFCB | — Federal Farm Credit Banks |
| FGIC | — Financial Guaranty Insurance Corporation |
| FHA | — Federal Housing Administration |
| FHLB | — Federal Home Loan Bank |
| FHLMC | — Federal Home Loan Mortgage Corporation |
| FICO | — The Financing Corporation |
| FNMA | — Federal National Mortgage Association |
| GBP | —�� Great British pound |
| GDR | — Global depositary receipt |
| GNMA | — Government National Mortgage Association |
| HCFR | — Healthcare facilities revenue |
| HEFA | — Health & Educational Facilities Authority |
| HEFAR | — Higher education facilities authority revenue |
| HFA | — Housing Finance Authority |
| HFFA | — Health Facilities Financing Authority |
| HUD | — Department of Housing and Urban Development |
| IDA | — Industrial Development Authority |
| IDAG | — Industrial Development Agency |
| KRW | — Republic of Korea won |
| LIBOR | — London Interbank Offered Rate |
| LIFER | — Long Inverse Floating Exempt Receipts |
| LLC | — Limited liability company |
| LLLP | — Limited liability limited partnership |
| LLP | — Limited liability partnership |
| MBIA | — Municipal Bond Insurance Association |
| MFHR | — Multifamily housing revenue |
| MSTR | — Municipal securities trust receipts |
| MUD | — Municipal Utility District |
| National | — National Public Finance Guarantee Corporation |
| PCFA | — Pollution Control Financing Authority |
| PCL | — Public Company Limited |
| PCR | — Pollution control revenue |
| PFA | — Public Finance Authority |
| PFFA | — Public Facilities Financing Authority |
| PFOTER | — Puttable floating option tax-exempt receipts |
| plc | — Public limited company |
| PUTTER | — Puttable tax-exempt receipts |
| R&D | — Research & development |
| Radian | — Radian Asset Assurance |
| RAN | — Revenue anticipation notes |
| RDA | — Redevelopment Authority |
| RDFA | — Redevelopment Finance Authority |
| REIT | — Real estate investment trust |
| ROC | — Reset option certificates |
| SAVRS | — Select auction variable rate securities |
| SBA | — Small Business Authority |
| SDR | — Swedish depositary receipt |
| SFHR | — Single-family housing revenue |
| SFMR | — Single-family mortgage revenue |
| SPA | — Standby purchase agreement |
| SPDR | — Standard & Poor’s Depositary Receipts |
| SPEAR | — Short Puttable Exempt Adjustable Receipts |
| STRIPS | — Separate trading of registered interest and |
| TAN | — Tax anticipation notes |
| TIPS | — Treasury inflation-protected securities |
| TRAN | — Tax revenue anticipation notes |
| TTFA | — Transportation Trust Fund Authority |
| TVA | — Tennessee Valley Authority |

For more information
More information about Wells Fargo Funds is available free upon request. To obtain literature, please write, email, visit the Fund’s website, or call:
Wells Fargo Funds
P.O. Box 8266
Boston, MA 02266-8266
Email: fundservice@wellsfargo.com
Website: wellsfargofunds.com
Individual investors: 1-800-222-8222
Retail investment professionals: 1-888-877-9275
Institutional investment professionals: 1-866-765-0778
This report and the financial statements contained herein are submitted for the general information of the shareholders of the Fund. If this report is used for promotional purposes, distribution of the report must be accompanied or preceded by a current prospectus. Before investing, please consider the investment objectives, risks, charges, and expenses of the investment. For a current prospectus and, if available, a summary prospectus, containing this information, call 1-800-222-8222 or visit the Fund’s website at wellsfargofunds.com. Read the prospectus carefully before you invest or send money.
Wells Fargo Asset Management (WFAM) is a trade name used by the asset management businesses of Wells Fargo & Company. Wells Fargo Funds Management, LLC, a wholly owned subsidiary of Wells Fargo & Company, provides investment advisory and administrative services for Wells Fargo Funds. Other affiliates of Wells Fargo & Company provide subadvisory and other services for the funds. The funds are distributed by Wells Fargo Funds Distributor, LLC, Member FINRA, an affiliate of Wells Fargo & Company. Neither Wells Fargo Funds Management nor Wells Fargo Funds Distributor has Fund customer accounts/assets, and neither provides investment advice/recommendations or acts as an investment advice fiduciary to any investor.
NOT FDIC INSURED ◾ NO BANK GUARANTEE ◾ MAY LOSE VALUE
© 2016 Wells Fargo Funds Management, LLC. All rights reserved.
| | |
 | | 247345 12-16 A241/AR241 10-16 |
ITEM 2. CODE OF ETHICS
(a) As of the end of the period covered by the report, Wells Fargo Funds Trust has adopted a code of ethics that applies to its President and Treasurer. A copy of the code of ethics is filed as an exhibit to this Form N-CSR.
(c) During the period covered by this report, there were no amendments to the provisions of the code of ethics adopted in Item 2(a) above.
(d) During the period covered by this report, there were no implicit or explicit waivers to the provisions of the code of ethics adopted in Item 2(a) above.
ITEM 3. AUDIT COMMITTEE FINANCIAL EXPERT
The Board of Trustees of Wells Fargo Funds Trust has determined that Judith Johnson is an audit committee financial expert, as defined in Item 3 of Form N-CSR. Mrs. Johnson is independent for purposes of Item 3 of Form N-CSR.
ITEM 4. PRINCIPAL ACCOUNTANT FEES AND SERVICES
(a), (b), (c), (d) The following table presents aggregate fees billed in each of the last two fiscal years for services rendered to the Registrant by the Registrant’s principal accountant. These fees were billed to the registrant and were approved by the Registrant’s audit committee.
| | | | | | | | |
| | | Fiscal
year ended
October 31, 2016 | | | Fiscal
year ended
October 31, 2015 | |
Audit fees | | $ | 244,446 | | | $ | 237,690 | |
Audit-related fees | | | — | | | | — | |
Tax fees (1) | | | 34,610 | | | | 32,210 | |
All other fees | | | — | | | | — | |
| | | | | | | | |
| | $ | 279,056 | | | $ | 269,900 | |
| | | | | | | | |
| (1) | Tax fees consist of fees for tax compliance, tax advice, tax planning and excise tax. |
(e) The Chairman of the Audit Committees is authorized to pre-approve: (1) audit services for the mutual funds of Wells Fargo Funds Trust; (2) non-audit tax or compliance consulting or training services provided to the Funds by the independent auditors (“Auditors”) if the fees for any particular engagement are not anticipated to exceed $50,000; and (3) non-audit tax or compliance consulting or training services provided by the Auditors to a Fund’s investment adviser and its controlling entities (where pre-approval is required because the engagement relates directly to the operations and financial reporting of the Fund) if the fee to the Auditors for any particular engagement is not anticipated to exceed $50,000. For any such pre-approval
sought from the Chairman, Management shall prepare a brief description of the proposed services. If the Chairman approves of such service, he or she shall sign the statement prepared by Management. Such written statement shall be presented to the full Committees at their next regularly scheduled meetings.
(f) Not applicable
(g) Not applicable
(h) Not applicable
ITEM 5. AUDIT COMMITTEE OF LISTED REGISTRANTS
Not applicable.
ITEM 6. INVESTMENTS
A Portfolio of Investments for each series of Wells Fargo Funds Trust is included as part of the report to shareholders filed under Item 1 of this Form.
ITEM 7. DISCLOSURE OF PROXY VOTING POLICIES AND PROCEDURES FOR CLOSED-END MANAGEMENT INVESTMENT COMPANIES
Not applicable.
ITEM 8. PORTFOLIO MANAGERS OF CLOSED-END MANAGEMENT INVESTMENT COMPANIES
Not applicable.
ITEM 9. PURCHASES OF EQUITY SECURITIES BY CLOSED-END MANAGEMENT INVESTMENT COMPANY AND AFFILIATED PURCHASERS
Not applicable.
ITEM 10. SUBMISSION OF MATTERS TO A VOTE OF SECURITY HOLDERS
There have been no material changes to the procedures by which shareholders may recommend nominees to the registrant’s Board of Trustees that have been implemented since the registrant’s last provided disclosure in response to the requirements of this Item.
ITEM 11. CONTROLS AND PROCEDURES
(a) The President and Treasurer have concluded that the Wells Fargo Funds Trust (the “Trust”) disclosure controls and procedures (as defined in Rule 30a-3(c) under the Investment Company Act of 1940) provide reasonable assurances that material information relating to the Trust is made known to them by the appropriate persons based on their evaluation of these controls and procedures as of a date within 90 days of the filing of this report.
(b) There were no significant changes in the Trust’s internal controls over financial reporting (as defined in Rule 30a-3(d) under the Investment Company Act of 1940) that occurred during the second fiscal quarter of the period covered by this report that materially affected, or is reasonably likely to materially affect, the registrant’s internal control over financial reporting.
ITEM 12. EXHIBITS
(a)(1) Code of Ethics pursuant to Item 2 of Form N-CSR is filed and attached hereto as Exhibit COE.
(a)(2) Certification pursuant to Rule 30a-2(a) under the Investment Company Act of 1940 (17 CFR 270.30a-2(a)) is filed and attached hereto as Exhibit 99.CERT.
(a)(3) Not applicable.
(b) Certification pursuant to Rule 30a-2(b) under the Investment Company Act of 1940 (17 CFR 270.30a-2(b)) is filed and attached hereto as Exhibit 99.906CERT.
SIGNATURES
Pursuant to the requirements of the Securities Exchange Act of 1934 and the Investment Company Act of 1940, the registrant has duly caused this report to be signed on its behalf by the undersigned, thereunto duly authorized.
| | |
| Wells Fargo Funds Trust |
| |
| By: | | |
| |
| | /s/ Karla M. Rabusch |
| |
| | Karla M. Rabusch |
| | President |
| |
| Date: | | December 22, 2016 |
Pursuant to the requirements of the Securities Exchange Act of 1934 and the Investment Company Act of 1940, this report has been signed below by the following persons on behalf of the registrant and in the capacities and on the date indicated.
| | |
| Wells Fargo Funds Trust |
| |
| By: | | |
| |
| | /s/ Karla M. Rabusch |
| |
| | Karla M. Rabusch |
| | President |
| |
| Date: | | December 22, 2016 |
| |
| By: | | |
| |
| | /s/ Jeremy DePalma |
| |
| | Jeremy DePalma |
| | Treasurer |
| |
| Date: | | December 22, 2016 |