
UNITED STATES
SECURITIES AND EXCHANGE COMMISSION
Washington, D.C. 20549
FORM N-CSR
CERTIFIED SHAREHOLDER REPORT OF REGISTERED
MANAGEMENT INVESTMENT COMPANIES
Investment Company Act file number: 811-09253
Wells Fargo Funds Trust
(Exact name of registrant as specified in charter)
525 Market St., San Francisco, CA 94105
(Address of principal executive offices) (Zip code)
C. David Messman
Wells Fargo Funds Management, LLC
525 Market St., San Francisco, CA 94105
(Name and address of agent for service)
Registrant’s telephone number, including area code: 800-222-8222
Date of fiscal year end: September 30
Registrant is making a filing for 11 of its series:
Wells Fargo Diversified Capital Builder Fund, Wells Fargo Diversified Income Builder Fund, Wells Fargo Index Asset Allocation Fund, Wells Fargo International Bond Fund, Wells Fargo Strategic Income Fund, Wells Fargo C&B Mid Cap Value Fund, Wells Fargo Common Stock Fund, Wells Fargo Discovery Fund, Wells Fargo Enterprise Fund, Wells Fargo Opportunity Fund, and Wells Fargo Special Mid Cap Value Fund.
Date of reporting period: September 30, 2016
| ITEM 1. | REPORT TO STOCKHOLDERS |
Annual Report
September 30, 2016

Wells Fargo
Diversified Capital Builder Fund


Reduce clutter. Save trees.
Sign up for electronic delivery of prospectuses and shareholder reports at wellsfargo.com/advantagedelivery
Contents
The views expressed and any forward-looking statements are as of September 30, 2016, unless otherwise noted, and are those of the Fund managers and/or Wells Fargo Funds Management, LLC. Discussions of individual securities, or the markets generally, or any Wells Fargo Fund are not intended as individual recommendations. Future events or results may vary significantly from those expressed in any forward-looking statements. The views expressed are subject to change at any time in response to changing circumstances in the market. Wells Fargo Funds Management, LLC and the Fund disclaim any obligation to publicly update or revise any views expressed or forward-looking statements.
NOT FDIC INSURED ¡ NO BANK GUARANTEE ¡ MAY LOSE VALUE
| | | | |
| 2 | | Wells Fargo Diversified Capital Builder Fund | | Letter to shareholders (unaudited) |

Karla M. Rabusch
President
Wells Fargo Funds
Even though the Fed raised its key rate during the period as anticipated, it was a modest increase, and further rate hikes were not immediately forthcoming. As a result, market yields declined and bond prices rose.
Dear Shareholder:
We are pleased to offer you this annual report for the Wells Fargo Diversified Capital Builder Fund for the 12-month period that ended September 30, 2016. During this period, which began October 1, 2015, both stock and fixed-income markets benefited from a combination of accommodative monetary policy, continued (if low) U.S. economic growth, and a moderate high-yield default rate outside of commodity-related sectors.
The U.S. economy achieved low but continued growth over the reporting period.
Toward the beginning of the reporting period, real U.S. gross domestic product (GDP) came in at a solid 2% year-over-year growth rate for the third quarter of 2015. Real GDP growth remained positive, even as it trailed off in subsequent quarters—falling below 1% in the fourth quarter of 2015 and the first quarter of 2016 and just topping 1% in the second quarter of 2016.
Global central bank policy remained accommodative.
The U.S. economy remained strong enough that in December 2015, the Federal Reserve (Fed) raised its target interest rate by 25 basis points (bps; 100 bps equals 1.00%) after keeping it near zero for seven years. However, the Fed clarified that future interest-rate increases would be gradual; as of the end of the reporting period, the Fed remained on hold. Other major central banks continued to pressure interest rates into historically low and even negative territory. In Europe, the European Central Bank (ECB) pushed its rate for banks’ excess reserves to -0.40% in March 2016 in an effort to encourage lending. In addition, the ECB kept its main refinancing rate at zero and continued to provide liquidity through an asset-purchasing program.
As a result of the favorable macroeconomic backdrop, fixed-income markets rallied across the board.
Even though the Fed raised its key rate during the period as anticipated, it was a modest increase, and further rate hikes were not immediately forthcoming. As a result, market yields declined and bond prices rose. Since the end of the financial crisis, structural changes in the fixed-income markets have reduced trading liquidity (the degree to which assets can be bought or sold without affecting the price). New regulations and capital requirements have caused traditional liquidity suppliers (banks and broker/dealers) to be more risk averse and hold less inventory. Meanwhile, corporate debt issuance has spiked as companies finance themselves at record-low yields, bond mutual funds hold larger amounts of this new debt supply, trading volumes are lower, and large-size trades are more difficult to execute. However, fixed-income markets appeared to function well over the past year with sufficient liquidity. The Bloomberg Barclays U.S. Aggregate Bond Index,1 a proxy for the broad investment-grade market, returned 5.97%.
| 1 | The Bloomberg Barclays U.S. Aggregate Bond Index (formerly known as Barclays U.S. Aggregate Bond Index) is a broad-based benchmark that measures the investment-grade, U.S. dollar–denominated, fixed-rate taxable bond market, including Treasuries, government-related and corporate securities, mortgage-backed securities (agency fixed-rate and hybrid adjustable-rate mortgage pass-throughs), asset-backed securities, and commercial mortgage-backed securities. You cannot invest directly in an index. |
| | | | | | |
| Letter to shareholders (unaudited) | | Wells Fargo Diversified Capital Builder Fund | | | 3 | |
Low global yields and a solid U.S. economy incented investors to take on additional risk by purchasing stocks and high-yield bonds. The high-yield bond market was further helped by the fact that the high-yield default rate remained low for non-commodity-related companies. Although Moody’s Investors Service, Incorporated, projected in July 2016 that the U.S. high-yield default rate could reach 6.4% by the end of 2016, much of that number came from metals and mining firms (10.2% projected default rate) and oil and gas companies (8.6% projected default rate). The Bloomberg Barclays U.S. Corporate High Yield Bond Index2 returned 12.73% for the period, and the S&P 500 Index,3 a proxy for large-cap stocks, returned 15.43%.
Don’t let short-term uncertainty derail long-term investment goals.
Periods of uncertainty can present challenges, but experience has taught us that maintaining long-term investment goals can be an effective way to plan for the future. To help you create a sound strategy based on your personal goals and risk tolerance, Wells Fargo Funds offers more than 100 mutual funds spanning a wide range of asset classes and investment styles. Although diversification cannot guarantee an investment profit or prevent losses, we believe it can be an effective way to manage investment risk and potentially smooth out overall portfolio performance. We encourage investors to know their investments and to understand that appropriate levels of risk-taking may unlock opportunities.
Thank you for choosing to invest in Wells Fargo Funds. We appreciate your confidence in us and remain committed to helping you meet your financial needs.
Sincerely,

Karla M. Rabusch
President
Wells Fargo Funds
Low global yields and a solid U.S. economy incented investors to take on additional risk by purchasing stocks and high-yield bonds.
For further information about your Fund, contact your investment professional, visit our website at wellsfargofunds.com, or call us directly at 1-800-222-8222. We are available 24 hours a day, 7 days a week.
| 2 | The Bloomberg Barclays U.S. Corporate High Yield Bond Index (formerly known as Barclays U.S. Corporate High Yield Bond Index) is an unmanaged, U.S. dollar–denominated, nonconvertible, non-investment-grade debt index. The index consists of domestic corporate bonds rated Ba and below with a minimum outstanding amount of $150 million. You cannot invest directly in an index. |
| 3 | The S&P 500 Index consists of 500 stocks chosen for market size, liquidity, and industry group representation. It is a market-value-weighted index with each stock’s weight in the index proportionate to its market value. You cannot invest directly in an index. |
| | | | |
| 4 | | Wells Fargo Diversified Capital Builder Fund | | Performance highlights (unaudited) |
Investment objective
The Fund seeks long-term total return, consisting of capital appreciation and current income.
Manager
Wells Fargo Funds Management, LLC
Subadviser
Wells Capital Management Incorporated
Portfolio manager
Margaret Patel
Average annual total returns (%) as of September 30, 20161
| | | | | | | | | | | | | | | | | | | | | | | | | | | | | | | | | | |
| | | | | Including sales charge | | | Excluding sales charge | | | Expense ratios2 (%) | |
| | | Inception date | | 1 year | | | 5 year | | | 10 year | | | 1 year | | | 5 year | | | 10 year | | | Gross | | | Net3 | |
| Class A (EKBAX) | | 1-20-1998 | | | 15.74 | | | | 14.70 | | | | 5.65 | | | | 22.85 | | | | 16.05 | | | | 6.28 | | | | 1.15 | | | | 1.15 | |
| Class B (EKBBX)* | | 9-11-1935 | | | 17.06 | | | | 14.94 | | | | 5.78 | | | | 22.06 | | | | 15.17 | | | | 5.78 | | | | 1.90 | | | | 1.90 | |
| Class C (EKBCX) | | 1-22-1998 | | | 20.96 | | | | 15.15 | | | | 5.49 | | | | 21.96 | | | | 15.15 | | | | 5.49 | | | | 1.90 | | | | 1.90 | |
| Administrator Class (EKBDX) | | 7-30-2010 | | | – | | | | – | | | | – | | | | 23.14 | | | | 16.30 | | | | 6.47 | | | | 1.07 | | | | 1.05 | |
| Institutional Class (EKBYX) | | 1-26-1998 | | | – | | | | – | | | | – | | | | 23.28 | | | | 16.52 | | | | 6.66 | | | | 0.82 | | | | 0.78 | |
| Diversified Capital Builder Blended Index4 | | – | | | – | | | | – | | | | – | | | | 14.47 | | | | 14.37 | | | | 7.54 | | | | – | | | | – | |
| BofA Merrill Lynch High Yield U.S. Corporates, Cash Pay Index5 | | – | | | – | | | | – | | | | – | | | | 12.79 | | | | 8.19 | | | | 7.51 | | | | – | | | | – | |
| Russell 1000® Index6 | | – | | | – | | | | – | | | | – | | | | 14.93 | | | | 16.41 | | | | 7.40 | | | | – | | | | – | |
| * | | Class B shares are closed to investment, except in connection with the reinvestment of any distributions and permitted exchanges. |
Figures quoted represent past performance, which is no guarantee of future results, and do not reflect taxes that a shareholder may pay on fund distributions or the redemption of fund shares. Investment return and principal value of an investment will fluctuate so that an investor’s shares, when redeemed, may be worth more or less than their original cost. Performance shown without sales charges would be lower if sales charges were reflected. Current performance may be lower or higher than the performance data quoted, which assumes the reinvestment of dividends and capital gains. Current month-end performance is available on the Fund’s website, wellsfargofunds.com.
Index returns do not include transaction costs associated with buying and selling securities, any mutual fund fees or expenses, or any taxes. It is not possible to invest directly in an index.
For Class A shares, the maximum front-end sales charge is 5.75%. For Class B shares, the maximum contingent deferred sales charge is 5.00%. For Class C shares, the maximum contingent deferred sales charge is 1.00%. Performance including a contingent deferred sales charge assumes the sales charge for the corresponding time period. Administrator Class and Institutional Class shares are sold without a front-end sales charge or contingent deferred sales charge.
Balanced funds may invest in stocks and bonds. Stock values fluctuate in response to the activities of individual companies and general market and economic conditions. Bond values fluctuate in response to the financial condition of individual issuers, general market and economic conditions, and changes in interest rates. Changes in market conditions and government policies may lead to periods of heightened volatility in the bond market and reduced liquidity for certain bonds held by the Fund. In general, when interest rates rise, bond values fall and investors may lose principal value. Interest-rate changes and their impact on the Fund and its share price can be sudden and unpredictable. Certain investment strategies tend to increase the total risk of an investment (relative to the broader market). The Fund is exposed to foreign investment risk, high-yield securities risk, and smaller-company securities risk. Consult the Fund’s prospectus for additional information on these and other risks.
Please see footnotes on page 5.
| | | | | | |
| Performance highlights (unaudited) | | Wells Fargo Diversified Capital Builder Fund | | | 5 | |
|
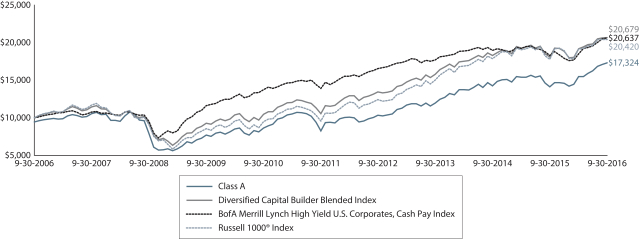
| Growth of $10,000 investment as of September 30, 20167 |
|
|
| 1 | Historical performance shown for Administrator Class shares prior to their inception reflects the performance of Institutional Class shares and has been adjusted to reflect the higher expenses applicable to Administrator Class shares. Historical performance shown for all classes of the Fund prior to July 12, 2010, is based on the performance of the Fund’s predecessor, Evergreen Diversified Capital Builder Fund. |
| 2 | Reflects the expense ratios as stated in the most recent prospectuses. The expense ratios shown are subject to change and may differ from the annualized expense ratios shown in the financial highlights of this report. |
| 3 | The manager has contractually committed through January 31, 2017, to waive fees and/or reimburse expenses to the extent necessary to cap the Fund’s Total Annual Fund Operating Expenses After Fee Waiver at 1.20% for Class A, 1.95% for Class B, 1.95% for Class C, 1.05% for Administrator Class, and 0.78% for Institutional Class. After this time, the cap may be increased or the commitment to maintain the cap may be terminated only with the approval of the Board of Trustees. Brokerage commissions, stamp duty fees, interest, taxes, acquired fund fees and expenses, and extraordinary expenses are excluded from the expense cap. Without this cap, the Fund’s returns would have been lower. |
| 4 | Source: Wells Fargo Funds Management, LLC. The Diversified Capital Builder Blended Index is composed of the BofA Merrill Lynch High Yield U.S. Corporates, Cash Pay Index (25%) and Russell 1000® Index (75%). You cannot invest directly in an index. |
| 5 | The BofA Merrill Lynch High Yield U.S. Corporates, Cash Pay Index is an unmanaged market index that provides a broad-based performance measure of the non-investment grade U.S. domestic bond index. You cannot invest directly in an index. |
| 6 | The Russell 1000® Index measures the performance of the 1,000 largest companies in the Russell 3000® Index, which represents approximately 92% of the total market capitalization of the Russell 3000® Index. You cannot invest directly in an index. |
| 7 | The chart compares the performance of Class A shares for the most recent ten years with the Diversified Capital Builder Blended Index, BofA Merrill Lynch High Yield U.S. Corporates, Cash Pay Index, and the Russell 1000® Index. The chart assumes a hypothetical investment of $10,000 in Class A shares and reflects all operating expenses and assumes the maximum initial sales charge of 5.75%. |
| 8 | The ten largest holdings, excluding cash and cash equivalents, are calculated based on the value of the investments divided by total net assets of the Fund. Holdings are subject to change and may have changed since the date specified. |
| 9 | Amounts are calculated based on the total long-term investments of the Fund. These amounts are subject to change and may have changed since the date specified. |
| | | | |
| 6 | | Wells Fargo Diversified Capital Builder Fund | | Performance highlights (unaudited) |
MANAGER’S DISCUSSION
Fund highlights
| n | | The Fund outperformed its benchmark, the Diversified Capital Builder Blended Index, for the 12-month period that ended September 30, 2016. |
| n | | The Fund outperformed the benchmark in part because of its above-benchmark weighting to stocks during a period in which stocks outperformed the high-yield market. In its stock holdings, the Fund benefited from additions to the energy sector in the second half of the fiscal year, after having an underweight to the sector in the earlier part of the fiscal year. The Fund also gained relative performance from takeovers of four of its holdings. Equity detractors were primarily in the technology sector, as well as in the health care space, specifically pharmaceutical companies. |
| n | | In the bond portfolio, holdings in basic materials companies were considerable outperformers, as were selected energy bonds. Detractors from bond performance fell in the pharmaceutical, information technology, and energy services sectors. |
Stocks held up better than high-yield bonds in a volatile period.
In the stock market, the fiscal year was marked by short-term swings as measured by the Russell 1000® Index. After rising modestly through the fourth quarter of 2015, stock prices dropped sharply in the first two months of 2016, reflecting concerns about falling energy prices, lower economic growth, and the possibility of rising interest rates. After this period of uncertainty, the market advanced more or less steadily in the remainder of the fiscal year, as it became clear that the Federal Reserve was sensitive to market concerns about rising rates and would most likely move at a gradual pace. In addition, economic growth continued to advance, albeit at a relatively low rate compared to previous economic recoveries.
In the fixed-income market, fears of higher U.S. Treasury rates once again proved to be wrong, and longer-term bond yields declined in the fiscal year. To illustrate, interest rates as measured by the 10-year U.S. Treasury bond began the fiscal year at 2.04%, and ended the fiscal year at 1.60%. High-yield bond yields also fell over the period, resulting in notable capital gains for many bonds as measured by the BofA Merrill Lynch High Yield U.S. Corporates, Cash Pay Index, particularly in the hard-hit energy industry. Lower-rated bonds in general produced low double-digit returns across many sectors. High-yield bonds benefited not only from lower Treasury rates, but also from diminished concerns about a slowing economy and rising defaults. Investors’ increased risk appetites caused yields on high-yield bonds to decline more than the yields on comparable Treasuries.
| | | | |
| Ten largest holdings (%) as of September 30, 20168 | |
Kinder Morgan Incorporated | | | 5.52 | |
Plains All American Pipeline LP | | | 4.89 | |
Crown Castle International Corporation | | | 4.15 | |
The Williams Companies Incorporated | | | 3.66 | |
Tronox Finance LLC, 6.38%, 8-15-2020 | | | 3.06 | |
John Bean Technologies Corporation | | | 3.01 | |
Broadcom Limited | | | 2.96 | |
Equinix Incorporated | | | 2.91 | |
Xilinx Incorporated | | | 2.75 | |
Tesoro Logistics LP | | | 2.56 | |
In the Fund’s stock portfolio, several energy-related names were major contributors to performance: Kinder Morgan, Incorporated; Plains All American Pipeline, L.P.; Williams Companies, Incorporated; and Columbia Pipeline Group, Incorporated (which was acquired by TransCanada Corporation). FEI Company, a technology company specializing in microscopes, contributed as a result of substantial price appreciation after its acquisition by Thermo Fisher Scientific Incorporated was announced. John Bean Technologies Corporation, a manufacturer of systems and products for the food-processing industry, was a significant outperformer. In the health care sector, Medtronic Plc, Mylan N.V., and Becton, Dickinson and Company also outperformed.
Detractors were primarily in the technology sector, and included Akami Technologies, Incorporated; Seagate Technology plc, and FireEye, Incorporated. In the pharmaceuticals sector, Eli Lilly and Company, AMAG Pharmaceuticals Incorporated, and McKesson Corporation were underperformers.
Please see footnotes on page 5.
| | | | | | |
| Performance highlights (unaudited) | | Wells Fargo Diversified Capital Builder Fund | | | 7 | |
|
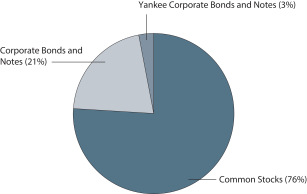
| Portfolio allocation as of September 30, 20169 |
|
 |
Specific to the Fund’s fixed-income portfolio, we emphasized relatively high-quality high-yield bonds, believing that better-quality issues that were available for modestly lower yields represented superior investment value compared with higher-yielding, but lower-rated bonds. Fixed-income contributors included Tronox Finance LLC, Rayonier Advanced Materials Products Incorporated, and Olin Corporation. Bonds of energy companies Kinder Morgan Incorporated and Plains All American Pipeline, L.P., also contributed to outperformance. Bonds of Lear Corporation, a manufacturer of auto seating systems, were upgraded to investment grade and further aided relative results. Detractors included AMAG Pharmaceuticals Incorporated; energy services company Bristow Group Incorporated, and hard disk drive maker Seagate HDD.
We continue to focus on high-yield bonds of U.S.–based companies that have publicly issued common stock and that we judge to have competitive business positions and flexible balance sheets. We believe such companies could withstand a slowdown in their sales and profits or diminished access to credit should there be a reduction in liquidity provided by financial lenders. We continue to minimize exposure to the energy services and metals and mining sectors because these areas face continued challenges from declining demand and soft pricing for their products.
Our outlook remains one of cautious optimism.
While the pace of economic growth is low compared with previous recoveries after recessions, we believe the intrinsic dynamism, creativity, and basic strengths of the U.S. economy should provide opportunities for both the stock and high-yield bond markets over the next year. The housing and automobile sectors are on multiyear upswings. Slow but steady gains in employment should help stimulate demand for goods and services. Furthermore, the expansion of low-cost shale gas and petroleum liquids should continue to provide a boon to both businesses and consumers, improving the competitive positions of U.S. companies and offering some cost relief to consumers for utility and fuel costs. Despite current financial uncertainties, we believe the strong fundamentals of the U.S. economy will provide attractive investment potential for stocks over time.
In our view, the high-yield bond market may benefit from relatively attractive fundamentals—improving, albeit slow, business conditions, ample financial liquidity, and historically low default rates, excluding high-risk sectors such as commodities. We are cautious given that high-yield interest rates could rise against a backdrop of a slowing economy. However, with the currently wide yield differentials for high-yield versus investment grade bonds, we think high-yield bonds could provide enough income to compensate for their credit risks.
Please see footnotes on page 5.
| | | | |
| 8 | | Wells Fargo Diversified Capital Builder Fund | | Fund expenses (unaudited) |
As a shareholder of the Fund, you incur two types of costs: (1) transaction costs, including sales charges (loads) on purchase payments and contingent deferred sales charges (if any) on redemptions and (2) ongoing costs, including management fees, distribution (12b-1) and/or shareholder servicing fees, and other Fund expenses. This example is intended to help you understand your ongoing costs (in dollars) of investing in the Fund and to compare these costs with the ongoing costs of investing in other mutual funds.
The example is based on an investment of $1,000 invested at the beginning of the six-month period and held for the entire period from April 1, 2016 to September 30, 2016.
Actual expenses
The “Actual” line of the table below provides information about actual account values and actual expenses. You may use the information in this line, together with the amount you invested, to estimate the expenses that you paid over the period. Simply divide your account value by $1,000 (for example, an $8,600 account value divided by $1,000 = 8.6), then multiply the result by the number in the “Actual” line under the heading entitled “Expenses paid during period” for your applicable class of shares to estimate the expenses you paid on your account during this period.
Hypothetical example for comparison purposes
The “Hypothetical” line of the table below provides information about hypothetical account values and hypothetical expenses based on the Fund’s actual expense ratio and an assumed rate of return of 5% per year before expenses, which is not the Fund’s actual return. The hypothetical account values and expenses may not be used to estimate the actual ending account balance or expenses you paid for the period. You may use this information to compare the ongoing costs of investing in the Fund and other funds. To do so, compare this 5% hypothetical example with the 5% hypothetical examples that appear in the shareholder reports of the other funds.
Please note that the expenses shown in the table are meant to highlight your ongoing costs only and do not reflect any transactional costs, such as sales charges (loads) and contingent deferred sales charges. Therefore, the “Hypothetical” line of the table is useful in comparing ongoing costs only and will not help you determine the relative total costs of owning different funds. In addition, if these transactional costs were included, your costs would have been higher.
| | | | | | | | | | | | | | | | |
| | | Beginning
account value
4-1-2016 | | | Ending
account value
9-30-2016 | | | Expenses
paid during
the period¹ | | | Annualized net
expense ratio | |
Class A | | | | | | | | | | | | | | | | |
Actual | | $ | 1,000.00 | | | $ | 1,118.58 | | | $ | 6.01 | | | | 1.13 | % |
Hypothetical (5% return before expenses) | | $ | 1,000.00 | | | $ | 1,019.33 | | | $ | 5.73 | | | | 1.13 | % |
Class B | | | | | | | | | | | | | | | | |
Actual | | $ | 1,000.00 | | | $ | 1,115.78 | | | $ | 9.96 | | | | 1.88 | % |
Hypothetical (5% return before expenses) | | $ | 1,000.00 | | | $ | 1,015.59 | | | $ | 9.49 | | | | 1.88 | % |
Class C | | | | | | | | | | | | | | | | |
Actual | | $ | 1,000.00 | | | $ | 1,114.49 | | | $ | 9.96 | | | | 1.89 | % |
Hypothetical (5% return before expenses) | | $ | 1,000.00 | | | $ | 1,015.57 | | | $ | 9.50 | | | | 1.89 | % |
Administrator Class | | | | | | | | | | | | | | | | |
Actual | | $ | 1,000.00 | | | $ | 1,120.32 | | | $ | 5.56 | | | | 1.05 | % |
Hypothetical (5% return before expenses) | | $ | 1,000.00 | | | $ | 1,019.75 | | | $ | 5.30 | | | | 1.05 | % |
Institutional Class | | | | | | | | | | | | | | | | |
Actual | | $ | 1,000.00 | | | $ | 1,121.31 | | | $ | 4.14 | | | | 0.78 | % |
Hypothetical (5% return before expenses) | | $ | 1,000.00 | | | $ | 1,021.10 | | | $ | 3.94 | | | | 0.78 | % |
| 1 | Expenses paid is equal to the annualized net expense ratio of each class multiplied by the average account value over the period, multiplied by the number of days in the most recent fiscal half-year divided by the number of days in the fiscal year (to reflect the one-half-year period). |
| | | | | | |
| Portfolio of investments—September 30, 2016 | | Wells Fargo Diversified Capital Builder Fund | | | 9 | |
| | | | | | | | | | | | | | | | |
| Security name | | | | | | | | Shares | | | Value | |
| | | | |
Common Stocks: 75.68% | | | | | | | | | | | | | | | | |
| | | | |
Consumer Discretionary: 5.81% | | | | | | | | | | | | | | | | |
| | | | |
| Auto Components: 1.16% | | | | | | | | | | | | | | | | |
Gentex Corporation | | | | | | | | | | | 450,000 | | | $ | 7,902,000 | |
| | | | | | | | | | | | | | | | |
| | | | |
| Distributors: 0.44% | | | | | | | | | | | | | | | | |
Genuine Parts Company | | | | | | | | | | | 30,000 | | | | 3,013,500 | |
| | | | | | | | | | | | | | | | |
| | | | |
| Household Durables: 4.11% | | | | | | | | | | | | | | | | |
Harman International Industries Incorporated | | | | | | | | | | | 80,000 | | | | 6,756,000 | |
Leggett & Platt Incorporated | | | | | | | | | | | 165,000 | | | | 7,520,700 | |
Newell Rubbermaid Incorporated | | | | | | | | | | | 260,000 | | | | 13,691,600 | |
| | | | |
| | | | | | | | | | | | | | | 27,968,300 | |
| | | | | | | | | | | | | | | | |
| | | | |
| Media: 0.10% | | | | | | | | | | | | | | | | |
Comcast Corporation Class A | | | | | | | | | | | 10,000 | | | | 663,400 | |
| | | | | | | | | | | | | | | | |
| | | | |
Consumer Staples: 4.86% | | | | | | | | | | | | | | | | |
| | | | |
| Food Products: 2.49% | | | | | | | | | | | | | | | | |
ConAgra Foods Incorporated | | | | | | | | | | | 360,000 | | | | 16,959,600 | |
| | | | | | | | | | | | | | | | |
| | | | |
| Household Products: 0.42% | | | | | | | | | | | | | | | | |
Church & Dwight Company Incorporated | | | | | | | | | | | 60,000 | | | | 2,875,200 | |
| | | | | | | | | | | | | | | | |
| | | | |
| Personal Products: 1.95% | | | | | | | | | | | | | | | | |
The Estee Lauder Companies Incorporated Class A | | | | | | | | | | | 150,000 | | | | 13,284,000 | |
| | | | | | | | | | | | | | | | |
| | | | |
Energy: 18.39% | | | | | | | | | | | | | | | | |
| | | | |
| Oil, Gas & Consumable Fuels: 18.39% | | | | | | | | | | | | | | | | |
Cabot Oil & Gas Corporation | | | | | | | | | | | 100,000 | | | | 2,580,000 | |
EOG Resources Incorporated | | | | | | | | | | | 30,000 | | | | 2,901,300 | |
EQT Corporation | | | | | | | | | | | 90,000 | | | | 6,535,800 | |
Kinder Morgan Incorporated | | | | | | | | | | | 1,625,000 | | | | 37,586,250 | |
Plains All American Pipeline LP | | | | | | | | | | | 1,060,000 | | | | 33,294,600 | |
Tesoro Logistics LP | | | | | | | | | | | 360,000 | | | | 17,438,400 | |
The Williams Companies Incorporated | | | | | | | | | | | 810,000 | | | | 24,891,300 | |
| | | | |
| | | | | | | | | | | | | | | 125,227,650 | |
| | | | | | | | | | | | | | | | |
| | | | |
Health Care: 6.57% | | | | | | | | | | | | | | | | |
| | | | |
| Biotechnology: 0.30% | | | | | | | | | | | | | | | | |
Shire plc ADR | | | | | | | | | | | 10,374 | | | | 2,011,104 | |
| | | | | | | | | | | | | | | | |
| | | | |
| Health Care Equipment & Supplies: 2.29% | | | | | | | | | | | | | | | | |
Becton Dickinson & Company | | | | | | | | | | | 30,000 | | | | 5,391,900 | |
C.R. Bard Incorporated | | | | | | | | | | | 20,000 | | | | 4,485,600 | |
Medtronic plc | | | | | | | | | | | 35,000 | | | | 3,024,000 | |
West Pharmaceutical Services Incorporated | | | | | | | | | | | 10,000 | | | | 745,000 | |
Zimmer Holdings Incorporated | | | | | | | | | | | 15,000 | | | | 1,950,300 | |
| | | | |
| | | | | | | | | | | | | | | 15,596,800 | |
| | | | | | | | | | | | | | | | |
The accompanying notes are an integral part of these financial statements.
| | | | |
| 10 | | Wells Fargo Diversified Capital Builder Fund | | Portfolio of investments—September 30, 2016 |
| | | | | | | | | | | | | | | | |
| Security name | | | | | | | | Shares | | | Value | |
| | | | |
| Health Care Providers & Services: 0.12% | | | | | | | | | | | | | | | | |
McKesson Corporation | | | | | | | | | | | 5,000 | | | $ | 833,750 | |
| | | | | | | | | | | | | | | | |
| | | | |
| Life Sciences Tools & Services: 1.40% | | | | | | | | | | | | | | | | |
Thermo Fisher Scientific Incorporated | | | | | | | | | | | 10,000 | | | | 1,590,600 | |
Waters Corporation † | | | | | | | | | | | 50,000 | | | | 7,924,500 | |
| | | | |
| | | | | | | | | | | | | | | 9,515,100 | |
| | | | | | | | | | | | | | | | |
| | | | |
| Pharmaceuticals: 2.46% | | | | | | | | | | | | | | | | |
Eli Lilly & Company | | | | | | | | | | | 200,000 | | | | 16,052,000 | |
Mallinckrodt plc † | | | | | | | | | | | 10,000 | | | | 697,800 | |
| | | | |
| | | | | | | | | | | | | | | 16,749,800 | |
| | | | | | | | | | | | | | | | |
| | | | |
Industrials: 11.61% | | | | | | | | | | | | | | | | |
| | | | |
| Aerospace & Defense: 5.46% | | | | | | | | | | | | | | | | |
Huntington Ingalls Industries Incorporated | | | | | | | | | | | 85,000 | | | | 13,040,700 | |
Lockheed Martin Corporation | | | | | | | | | | | 13,792 | | | | 3,306,218 | |
Raytheon Company | | | | | | | | | | | 100,000 | | | | 13,613,000 | |
TransDigm Group Incorporated † | | | | | | | | | | | 25,000 | | | | 7,228,000 | |
| | | | |
| | | | | | | | | | | | | | | 37,187,918 | |
| | | | | | | | | | | | | | | | |
| | | | |
| Building Products: 0.80% | | | | | | | | | | | | | | | | |
Apogee Enterprises Incorporated | | | | | | | | | | | 70,000 | | | | 3,128,300 | |
Lennox International Incorporated | | | | | | | | | | | 15,000 | | | | 2,355,450 | |
| | | | |
| | | | | | | | | | | | | | | 5,483,750 | |
| | | | | | | | | | | | | | | | |
| | | | |
| Electrical Equipment: 0.32% | | | | | | | | | | | | | | | | |
AMETEK Incorporated | | | | | | | | | | | 45,000 | | | | 2,150,100 | |
| | | | | | | | | | | | | | | | |
| | | | |
| Machinery: 4.85% | | | | | | | | | | | | | | | | |
Donaldson Company Incorporated | | | | | | | | | | | 20,000 | | | | 746,600 | |
IDEX Corporation | | | | | | | | | | | 80,000 | | | | 7,485,600 | |
John Bean Technologies Corporation | | | | | | | | | | | 290,000 | | | | 20,459,500 | |
The Middleby Corporation † | | | | | | | | | | | 35,000 | | | | 4,326,700 | |
| | | | |
| | | | | | | | | | | | | | | 33,018,400 | |
| | | | | | | | | | | | | | | | |
| | | | |
| Trading Companies & Distributors: 0.18% | | | | | | | | | | | | | | | | |
WESCO International Incorporated † | | | | | | | | | | | 20,000 | | | | 1,229,800 | |
| | | | | | | | | | | | | | | | |
| | | | |
Information Technology: 16.32% | | | | | | | | | | | | | | | | |
| | | | |
| Communications Equipment: 0.07% | | | | | | | | | | | | | | | | |
CommScope Holdings Incorporated † | | | | | | | | | | | 15,000 | | | | 451,650 | |
| | | | | | | | | | | | | | | | |
| | | | |
| Electronic Equipment, Instruments & Components: 2.74% | | | | | | | | | | | | | | | | |
Amphenol Corporation Class A | | | | | | | | | | | 250,000 | | | | 16,230,000 | |
Belden Incorporated | | | | | | | | | | | 35,000 | | | | 2,414,650 | |
| | | | |
| | | | | | | | | | | | | | | 18,644,650 | |
| | | | | | | | | | | | | | | | |
The accompanying notes are an integral part of these financial statements.
| | | | | | |
| Portfolio of investments—September 30, 2016 | | Wells Fargo Diversified Capital Builder Fund | | | 11 | |
| | | | | | | | | | | | | | | | |
| Security name | | | | | | | | Shares | | | Value | |
| | | | |
| Internet Software & Services: 1.29% | | | | | | | | | | | | | | | | |
Akamai Technologies Incorporated † | | | | | | | | | | | 165,000 | | | $ | 8,743,350 | |
| | | | | | | | | | | | | | | | |
| | | | |
| IT Services: 2.54% | | | | | | | | | | | | | | | | |
Leidos Holdings Incorporated | | | | | | | | | | | 240,000 | | | | 10,387,200 | |
NeuStar Incorporated Class A Ǡ | | | | | | | | | | | 260,000 | | | | 6,913,400 | |
| | | | |
| | | | | | | | | | | | | | | 17,300,600 | |
| | | | | | | | | | | | | | | | |
| | | | |
| Semiconductors & Semiconductor Equipment: 7.38% | | | | | | | | | | | | | | | | |
Broadcom Limited | | | | | | | | | | | 117,000 | | | | 20,184,840 | |
Microsemi Corporation † | | | | | | | | | | | 270,000 | | | | 11,334,600 | |
Xilinx Incorporated | | | | | | | | | | | 345,000 | | | | 18,747,300 | |
| | | | |
| | | | | | | | | | | | | | | 50,266,740 | |
| | | | | | | | | | | | | | | | |
| | | | |
| Software: 2.02% | | | | | | | | | | | | | | | | |
Adobe Systems Incorporated † | | | | | | | | | | | 100,000 | | | | 10,854,000 | |
CDK Global Incorporated | | | | | | | | | | | 20,000 | | | | 1,147,200 | |
Splunk Incorporated † | | | | | | | | | | | 30,000 | | | | 1,760,400 | |
| | | | |
| | | | | | | | | | | | | | | 13,761,600 | |
| | | | | | | | | | | | | | | | |
| | | | |
| Technology Hardware, Storage & Peripherals: 0.28% | | | | | | | | | | | | | | | | |
Diebold Incorporated | | | | | | | | | | | 30,000 | | | | 743,700 | |
Western Digital Corporation | | | | | | | | | | | 20,000 | | | | 1,179,876 | |
| | | | |
| | | | | | | | | | | | | | | 1,923,576 | |
| | | | | | | | | | | | | | | | |
| | | | |
Materials: 2.67% | | | | | | | | | | | | | | | | |
| | | | |
| Chemicals: 2.67% | | | | | | | | | | | | | | | | |
Celanese Corporation Series A | | | | | | | | | | | 250,000 | | | | 16,640,000 | |
Olin Corporation | | | | | | | | | | | 75,000 | | | | 1,539,000 | |
| | | | |
| | | | | | | | | | | | | | | 18,179,000 | |
| | | | | | | | | | | | | | | | |
| | | | |
Real Estate: 8.19% | | | | | | | | | | | | | | | | |
| | | | |
| Equity REITs: 8.19% | | | | | | | | | | | | | | | | |
Boston Properties Incorporated | | | | | | | | | | | 5,000 | | | | 681,450 | |
Crown Castle International Corporation | | | | | | | | | | | 300,000 | | | | 28,263,000 | |
Equinix Incorporated | | | | | | | | | | | 55,000 | | | | 19,813,750 | |
Saul Centers Incorporated | | | | | | | | | | | 105,000 | | | | 6,993,000 | |
| | | | |
| | | | | | | | | | | | | | | 55,751,200 | |
| | | | | | | | | | | | | | | | |
| | | | |
Utilities: 1.26% | | | | | | | | | | | | | | | | |
| | | | |
| Gas Utilities: 1.26% | | | | | | | | | | | | | | | | |
Atmos Energy Corporation | | | | | | | | | | | 115,000 | | | | 8,564,050 | |
| | | | | | | | | | | | | | | | |
| | | | |
Total Common Stocks (Cost $446,272,191) | | | | | | | | | | | | | | | 515,256,588 | |
| | | | | | | | | | | | | | | | |
The accompanying notes are an integral part of these financial statements.
| | | | |
| 12 | | Wells Fargo Diversified Capital Builder Fund | | Portfolio of investments—September 30, 2016 |
| | | | | | | | | | | | | | | | |
| Security name | | Interest rate | | | Maturity date | | | Principal | | | Value | |
| | | | |
Corporate Bonds and Notes: 21.10% | | | | | | | | | | | | | | | | |
| | | | |
Consumer Discretionary: 1.57% | | | | | | | | | | | | | | | | |
| | | | |
| Auto Components: 0.08% | | | | | | | | | | | | | | | | |
Dana Holding Corporation | | | 5.50 | % | | | 12-15-2024 | | | $ | 500,000 | | | $ | 508,750 | |
| | | | | | | | | | | | | | | | |
| | | | |
| Hotels, Restaurants & Leisure: 0.30% | | | | | | | | | | | | | | | | |
Speedway Motorsports Incorporated | | | 5.13 | | | | 2-1-2023 | | | | 2,000,000 | | | | 2,045,000 | |
| | | | | | | | | | | | | | | | |
| | | | |
| Media: 0.48% | | | | | | | | | | | | | | | | |
McGraw-Hill Global Education Holdings LLC 144A | | | 7.88 | | | | 5-15-2024 | | | | 3,000,000 | | | | 3,240,000 | |
| | | | | | | | | | | | | | | | |
| | | | |
| Specialty Retail: 0.71% | | | | | | | | | | | | | | | | |
Group 1 Automotive Incorporated | | | 5.00 | | | | 6-1-2022 | | | | 500,000 | | | | 502,500 | |
Penske Auto Group Incorporated | | | 5.75 | | | | 10-1-2022 | | | | 4,200,000 | | | | 4,357,500 | |
| | | | |
| | | | | | | | | | | | | | | 4,860,000 | |
| | | | | | | | | | | | | | | | |
| | | | |
Energy: 3.19% | | | | | | | | | | | | | | | | |
| | | | |
| Oil, Gas & Consumable Fuels: 3.19% | | | | | | | | | | | | | | | | |
ONEOK Incorporated | | | 4.25 | | | | 2-1-2022 | | | | 1,737,000 | | | | 1,702,260 | |
ONEOK Incorporated | | | 7.50 | | | | 9-1-2023 | | | | 1,000,000 | | | | 1,120,000 | |
Plains All American Pipeline LP | | | 4.65 | | | | 10-15-2025 | | | | 6,000,000 | | | | 6,237,396 | |
Tennessee Gas Pipeline Company | | | 7.00 | | | | 3-15-2027 | | | | 10,534,000 | | | | 12,626,190 | |
| | | | |
| | | | | | | | | | | | | | | 21,685,846 | |
| | | | | | | | | | | | | | | | |
| | | | |
Health Care: 1.48% | | | | | | | | | | | | | | | | |
| | | | |
| Biotechnology: 0.25% | | | | | | | | | | | | | | | | |
AMAG Pharmaceuticals Incorporated 144A | | | 7.88 | | | | 9-1-2023 | | | | 1,800,000 | | | | 1,719,000 | |
| | | | | | | | | | | | | | | | |
| | | | |
| Health Care Equipment & Supplies: 0.38% | | | | | | | | | | | | | | | | |
Teleflex Incorporated | | | 4.88 | | | | 6-1-2026 | | | | 2,500,000 | | | | 2,587,500 | |
| | | | | | | | | | | | | | | | |
| | | | |
| Health Care Providers & Services: 0.61% | | | | | | | | | | | | | | | | |
DaVita HealthCare Partners Incorporated | | | 5.13 | | | | 7-15-2024 | | | | 1,000,000 | | | | 1,020,000 | |
HCA Incorporated | | | 5.25 | | | | 6-15-2026 | | | | 2,000,000 | | | | 2,125,000 | |
HealthSouth Corporation | | | 5.13 | | | | 3-15-2023 | | | | 1,000,000 | | | | 997,500 | |
| | | | |
| | | | | | | | | | | | | | | 4,142,500 | |
| | | | | | | | | | | | | | | | |
| | | | |
| Life Sciences Tools & Services: 0.24% | | | | | | | | | | | | | | | | |
Quintiles Transnational Corporation 144A | | | 4.88 | | | | 5-15-2023 | | | | 1,600,000 | | | | 1,644,000 | |
| | | | | | | | | | | | | | | | |
| | | | |
Industrials: 3.52% | | | | | | | | | | | | | | | | |
| | | | |
| Aerospace & Defense: 2.15% | | | | | | | | | | | | | | | | |
Huntington Ingalls Industries Incorporated 144A | | | 5.00 | | | | 11-15-2025 | | | | 6,926,000 | | | | 7,324,245 | |
Moog Incorporated 144A | | | 5.25 | | | | 12-1-2022 | | | | 1,500,000 | | | | 1,552,500 | |
Orbital ATK Incorporated | | | 5.50 | | | | 10-1-2023 | | | | 2,000,000 | | | | 2,095,000 | |
TransDigm Group Incorporated 144A | | | 6.38 | | | | 6-15-2026 | | | | 2,000,000 | | | | 2,075,000 | |
TransDigm Group Incorporated | | | 6.50 | | | | 5-15-2025 | | | | 1,500,000 | | | | 1,565,625 | |
| | | | |
| | | | | | | | | | | | | | | 14,612,370 | |
| | | | | | | | | | | | | | | | |
The accompanying notes are an integral part of these financial statements.
| | | | | | |
| Portfolio of investments—September 30, 2016 | | Wells Fargo Diversified Capital Builder Fund | | | 13 | |
| | | | | | | | | | | | | | | | |
| Security name | | Interest rate | | | Maturity date | | | Principal | | | Value | |
| | | | |
| Machinery: 0.46% | | | | | | | | | | | | | | | | |
Oshkosh Corporation | | | 5.38 | % | | | 3-1-2025 | | | $ | 2,000,000 | | | $ | 2,100,000 | |
SPX FLOW Incorporated 144A | | | 5.88 | | | | 8-15-2026 | | | | 1,000,000 | | | | 1,016,250 | |
| | | | |
| | | | | | | | | | | | | | | 3,116,250 | |
| | | | | | | | | | | | | | | | |
| | | | |
| Trading Companies & Distributors: 0.91% | | | | | | | | | | | | | | | | |
HD Supply Incorporated 144A | | | 5.75 | | | | 4-15-2024 | | | | 4,015,000 | | | | 4,215,750 | |
Wesco Distribution Incorporated 144A | | | 5.38 | | | | 6-15-2024 | | | | 2,000,000 | | | | 2,003,760 | |
| | | | |
| | | | | | | | | | | | | | | 6,219,510 | |
| | | | | | | | | | | | | | | | |
| | | | |
Information Technology: 3.97% | | | | | | | | | | | | | | | | |
| | | | |
| Communications Equipment: 0.93% | | | | | | | | | | | | | | | | |
CommScope Incorporated 144A | | | 5.50 | | | | 6-15-2024 | | | | 6,000,000 | | | | 6,330,000 | |
| | | | | | | | | | | | | | | | |
| | | | |
| Electronic Equipment, Instruments & Components: 0.60% | | | | | | | | | | | | | | | | |
Belden Incorporated 144A | | | 5.25 | | | | 7-15-2024 | | | | 3,000,000 | | | | 3,045,000 | |
Belden Incorporated 144A | | | 5.50 | | | | 9-1-2022 | | | | 1,000,000 | | | | 1,042,500 | |
| | | | |
| | | | | | | | | | | | | | | 4,087,500 | |
| | | | | | | | | | | | | | | | |
| | | | |
| IT Services: 0.46% | | | | | | | | | | | | | | | | |
NeuStar Incorporated «(i) | | | 4.50 | | | | 1-15-2023 | | | | 3,500,000 | | | | 3,132,500 | |
| | | | | | | | | | | | | | | | |
| | | | |
| Semiconductors & Semiconductor Equipment: 0.38% | | | | | | | | | | | | | | | | |
Micron Technology Incorporated 144A | | | 5.25 | | | | 8-1-2023 | | | | 1,500,000 | | | | 1,470,000 | |
Microsemi Corporation 144A | | | 9.13 | | | | 4-15-2023 | | | | 1,000,000 | | | | 1,140,000 | |
| | | | |
| | | | | | | | | | | | | | | 2,610,000 | |
| | | | | | | | | | | | | | | | |
| | | | |
| Software: 0.31% | | | | | | | | | | | | | | | | |
Nuance Communications Company 144A | | | 6.00 | | | | 7-1-2024 | | | | 2,000,000 | | | | 2,085,000 | |
| | | | | | | | | | | | | | | | |
| | | | |
| Technology Hardware, Storage & Peripherals: 1.29% | | | | | | | | | | | | | | | | |
Diebold Incorporated 144A | | | 8.50 | | | | 4-15-2024 | | | | 8,500,000 | | | | 8,808,125 | |
| | | | | | | | | | | | | | | | |
| | | | |
Materials: 6.84% | | | | | | | | | | | | | | | | |
| | | | |
| Chemicals: 6.38% | | | | | | | | | | | | | | | | |
A. Schulman Incorporated 144A | | | 6.88 | | | | 6-1-2023 | | | | 6,375,000 | | | | 6,438,750 | |
Olin Corporation | | | 5.50 | | | | 8-15-2022 | | | | 6,000,000 | | | | 6,060,000 | |
Rayonier Advanced Materials Products Incorporated 144A | | | 5.50 | | | | 6-1-2024 | | | | 6,835,000 | | | | 6,254,025 | |
Scotts Miracle-Gro Company 144A | | | 6.00 | | | | 10-15-2023 | | | | 3,600,000 | | | | 3,834,000 | |
Tronox Finance LLC | | | 6.38 | | | | 8-15-2020 | | | | 22,588,000 | | | | 20,837,430 | |
| | | | |
| | | | | | | | | | | | | | | 43,424,205 | |
| | | | | | | | | | | | | | | | |
| | | | |
| Containers & Packaging: 0.46% | | | | | | | | | | | | | | | | |
Berry Plastics Corporation | | | 5.13 | | | | 7-15-2023 | | | | 3,120,000 | | | | 3,172,650 | |
| | | | | | | | | | | | | | | | |
| | | | |
Real Estate: 0.53% | | | | | | | | | | | | | | | | |
| | | | |
| Equity REITs: 0.53% | | | | | | | | | | | | | | | | |
Equinix Incorporated | | | 5.75 | | | | 1-1-2025 | | | | 1,000,000 | | | | 1,062,500 | |
Iron Mountain Incorporated 144A | | | 5.38 | | | | 6-1-2026 | | | | 2,000,000 | | | | 2,000,000 | |
The accompanying notes are an integral part of these financial statements.
| | | | |
| 14 | | Wells Fargo Diversified Capital Builder Fund | | Portfolio of investments—September 30, 2016 |
| | | | | | | | | | | | | | | | |
| Security name | | Interest rate | | | Maturity date | | | Principal | | | Value | |
| | | | |
| Equity REITs (continued) | | | | | | | | | | | | | | | | |
Iron Mountain Incorporated | | | 5.75 | % | | | 8-15-2024 | | | $ | 500,000 | | | $ | 513,750 | |
| | | | |
| | | | | | | | | | | | | | | 3,576,250 | |
| | | | | | | | | | | | | | | | |
| | | | |
Total Corporate Bonds and Notes (Cost $140,784,289) | | | | | | | | | | | | | | | 143,606,956 | |
| | | | | | | | | | | | | | | | |
| | | | |
Yankee Corporate Bonds and Notes: 2.52% | | | | | | | | | | | | | | | | |
| | | | |
Industrials: 0.30% | | | | | | | | | | | | | | | | |
| | | | |
| Electrical Equipment: 0.30% | | | | | | | | | | | | | | | | |
Sensata Technologies BV 144A | | | 4.88 | | | | 10-15-2023 | | | | 2,000,000 | | | | 2,080,000 | |
| | | | | | | | | | | | | | | | |
| | | | |
Information Technology: 2.22% | | | | | | | | | | | | | | | | |
| | | | |
| Technology Hardware, Storage & Peripherals: 2.22% | | | | | | | | | | | | | | | | |
Seagate HDD Cayman | | | 4.75 | | | | 6-1-2023 | | | | 9,500,000 | | | | 9,405,000 | |
Seagate HDD Cayman | | | 4.88 | | | | 6-1-2027 | | | | 6,396,000 | | | | 5,679,648 | |
| | | | |
| | | | | | | | | | | | | | | 15,084,648 | |
| | | | | | | | | | | | | | | | |
| | | | |
Total Yankee Corporate Bonds and Notes (Cost $16,468,795) | | | | | | | | | | | | | | | 17,164,648 | |
| | | | | | | | | | | | | | | | |
| | | | |
| | | Yield | | | | | | Shares | | | | |
| Short-Term Investments: 1.88% | | | | | | | | | | | | | | | | |
| | | | |
| Investment Companies: 1.88% | | | | | | | | | | | | | | | | |
Securities Lending Cash Investments LLC (l)(r)(u) | | | 0.65 | | | | | | | | 9,035,155 | | | | 9,035,155 | |
Wells Fargo Government Money Market Fund Select Class (l)(u) | | | 0.34 | | | | | | | | 3,773,354 | | | | 3,773,354 | |
| | | | |
Total Short-Term Investments (Cost $12,808,509) | | | | | | | | | | | | | | | 12,808,509 | |
| | | | | | | | | | | | | | | | |
| | | | | | | | |
| Total investments in securities (Cost $616,333,784) * | | | 101.18 | % | | | 688,836,701 | |
Other assets and liabilities, net | | | (1.18 | ) | | | (8,023,046 | ) |
| | | | | | | | |
| Total net assets | | | 100.00 | % | | $ | 680,813,655 | |
| | | | | | | | |
| † | Non-income-earning security |
| « | All or a portion of this security is on loan. |
| 144A | The security may be resold in transactions exempt from registration, normally to qualified institutional buyers, pursuant to Rule 144A under the Securities Act of 1933. |
| (i) | Illiquid security for which the designation as illiquid is unaudited. |
| (l) | The issuer of the security is an affiliated person of the Fund as defined in the Investment Company Act of 1940. |
| (r) | The investment is a non-registered investment vehicle purchased with cash collateral received from securities on loan. |
| (u) | The rate represents the 7-day annualized yield at period end. |
| * | Cost for federal income tax purposes is $615,673,007 and unrealized gains (losses) consists of: |
| | | | |
Gross unrealized gains | | $ | 82,047,323 | |
Gross unrealized losses | | | (8,883,629 | ) |
| | | | |
Net unrealized gains | | $ | 73,163,694 | |
The accompanying notes are an integral part of these financial statements.
| | | | | | |
| Statement of assets and liabilities—September 30, 2016 | | Wells Fargo Diversified Capital Builder Fund | | | 15 | |
| | | | |
| | | | |
| |
Assets | | | | |
Investments | | | | |
In unaffiliated securities (including $8,827,796 of securities loaned), at value (cost $603,525,275) | | $ | 676,028,192 | |
In affiliated securities, at value (cost $12,808,509) | | | 12,808,509 | |
| | | | |
Total investments, at value (cost $616,333,784) | | | 688,836,701 | |
Receivable for investments sold | | | 9,702,674 | |
Receivable for Fund shares sold | | | 1,170,870 | |
Receivable for dividends and interest | | | 2,863,932 | |
Receivable for securities lending income | | | 9,542 | |
Prepaid expenses and other assets | | | 126,386 | |
| | | | |
Total assets | | | 702,710,105 | |
| | | | |
| |
Liabilities | | | | |
Payable for investments purchased | | | 11,289,676 | |
Payable for Fund shares redeemed | | | 750,117 | |
Payable upon receipt of securities loaned | | | 9,035,155 | |
Management fee payable | | | 369,667 | |
Distribution fees payable | | | 44,159 | |
Administration fees payable | | | 112,806 | |
Accrued expenses and other liabilities | | | 294,870 | |
| | | | |
Total liabilities | | | 21,896,450 | |
| | | | |
Total net assets | | $ | 680,813,655 | |
| | | | |
| |
NET ASSETS CONSIST OF | | | | |
Paid-in capital | | $ | 551,365,111 | |
Undistributed net investment income | | | 422,976 | |
Accumulated net realized gains on investments | | | 56,522,651 | |
Net unrealized gains on investments | | | 72,502,917 | |
| | | | |
Total net assets | | $ | 680,813,655 | |
| | | | |
| |
COMPUTATION OF NET ASSET VALUE AND OFFERING PRICE PER SHARE | | | | |
Net assets – Class A | | $ | 467,502,982 | |
Shares outstanding – Class A1 | | | 46,934,960 | |
Net asset value per share – Class A | | | $9.96 | |
Maximum offering price per share – Class A2 | | | $10.57 | |
Net assets – Class B | | $ | 1,514,768 | |
Shares outstanding – Class B1 | | | 150,497 | |
Net asset value per share – Class B | | | $10.07 | |
Net assets – Class C | | $ | 67,629,719 | |
Shares outstanding – Class C1 | | | 6,786,975 | |
Net asset value per share – Class C | | | $9.96 | |
Net assets – Administrator Class | | $ | 21,397,651 | |
Shares outstanding – Administrator Class1 | | | 2,146,960 | |
Net asset value per share – Administrator Class | | | $9.97 | |
Net assets – Institutional Class | | $ | 122,768,535 | |
Shares outstanding – Institutional Class1 | | | 12,396,637 | |
Net asset value per share – Institutional Class | | | $9.90 | |
| 1 | The Fund has an unlimited number of authorized shares. |
| 2 | Maximum offering price is computed as 100/94.25 of net asset value. On investments of $50,000 or more, the offering price is reduced. |
The accompanying notes are an integral part of these financial statements.
| | | | |
| 16 | | Wells Fargo Diversified Capital Builder Fund | | Statement of operations—year ended September 30, 2016 |
| | | | |
| | | | |
| |
Investment income | | | | |
Interest | | $ | 9,084,301 | |
Dividends | | | 8,314,674 | |
Securities lending income, net | | | 48,562 | |
Income from affiliated securities | | | 25,688 | |
| | | | |
Total investment income | | | 17,473,225 | |
| | | | |
| |
Expenses | | | | |
Management fee | | | 3,847,353 | |
Administration fees | | | | |
Class A | | | 885,160 | |
Class B | | | 4,614 | |
Class C | | | 122,020 | |
Administrator Class | | | 15,931 | |
Institutional Class | | | 136,851 | |
Shareholder servicing fees | | | | |
Class A | | | 1,053,762 | |
Class B | | | 5,493 | |
Class C | | | 145,262 | |
Administrator Class | | | 30,635 | |
Distribution fees | | | | |
Class B | | | 16,478 | |
Class C | | | 435,785 | |
Custody and accounting fees | | | 39,991 | |
Professional fees | | | 46,489 | |
Registration fees | | | 65,169 | |
Shareholder report expenses | | | 50,722 | |
Trustees’ fees and expenses | | | 21,225 | |
Other fees and expenses | | | 6,449 | |
| | | | |
Total expenses | | | 6,929,389 | |
Less: Fee waivers and/or expense reimbursements | | | (35,301 | ) |
| | | | |
Net expenses | | | 6,894,088 | |
| | | | |
Net investment income | | | 10,579,137 | |
| | | | |
| |
REALIZED AND UNREALIZED GAINS (LOSSES) ON INVESTMENTS | | | | |
Net realized gains on investments | | | 56,562,113 | |
Net change in unrealized gains (losses) on investments | | | 57,125,458 | |
| | | | |
Net realized and unrealized gains (losses) on investments | | | 113,687,571 | |
| | | | |
Net increase in net assets resulting from operations | | $ | 124,266,708 | |
| | | | |
The accompanying notes are an integral part of these financial statements.
| | | | | | |
| Statement of changes in net assets | | Wells Fargo Diversified Capital Builder Fund | | | 17 | |
| | | | | | | | | | | | | | | | |
| | | Year ended
September 30, 2016 | | | Year ended
September 30, 2015 | |
| | | |
Operations | | | | | | | | | | | | |
Net investment income | | | | | | $ | 10,579,137 | | | | | | | $ | 7,234,900 | |
Net realized gains on investments | | | | | | | 56,562,113 | | | | | | | | 59,544,695 | |
Net change in unrealized gains (losses) on investments | | | | | | | 57,125,458 | | | | | | | | (71,976,899 | ) |
| | | | |
Net increase (decrease) in net assets resulting from operations | | | | | | | 124,266,708 | | | | | | | | (5,197,304 | ) |
| | | | |
| | | | |
Distributions to shareholders from | | | | | | | | | | | | | | | | |
Net investment income | | | | | | | | | | | | | | | | |
Class A | | | | | | | (7,154,781 | ) | | | | | | | (4,369,242 | ) |
Class B | | | | | | | (13,202 | ) | | | | | | | (7,771 | ) |
Class C | | | | | | | (576,356 | ) | | | | | | | (141,210 | ) |
Administrator Class | | | | | | | (281,790 | ) | | | | | | | (120,391 | ) |
Institutional Class | | | | | | | (2,192,889 | ) | | | | | | | (1,482,197 | ) |
Net realized gains | | | | | | | | | | | | | | | | |
Class A | | | | | | | (38,200,806 | ) | | | | | | | 0 | |
Class B | | | | | | | (258,301 | ) | | | | | | | 0 | |
Class C | | | | | | | (5,148,475 | ) | | | | | | | 0 | |
Administrator Class | | | | | | | (504,792 | ) | | | | | | | 0 | |
Institutional Class | | | | | | | (9,439,938 | ) | | | | | | | 0 | |
| | | | |
Total distributions to shareholders | | | | | | | (63,771,330 | ) | | | | | | | (6,120,811 | ) |
| | | | |
| | | | |
Capital share transactions | | | Shares | | | | | | | | Shares | | | | | |
Proceeds from shares sold | | | | | | | | | | | | | | | | |
Class A | | | 3,675,778 | | | | 34,640,601 | | | | 2,083,460 | | | | 20,605,565 | |
Class B | | | 6,490 | | | | 57,479 | | | | 13,876 | | | | 136,786 | |
Class C | | | 1,407,777 | | | | 13,010,103 | | | | 1,628,588 | | | | 15,975,268 | |
Administrator Class | | | 1,842,765 | | | | 16,600,389 | | | | 597,936 | | | | 5,892,607 | |
Institutional Class | | | 2,616,107 | | | | 24,432,480 | | | | 1,457,516 | | | | 14,260,256 | |
| | | | |
| | | | | | | 88,741,052 | | | | | | | | 56,870,482 | |
| | | | |
Reinvestment of distributions | | | | | | | | | | | | | | | | |
Class A | | | 5,090,728 | | | | 43,117,960 | | | | 423,836 | | | | 4,106,343 | |
Class B | | | 25,632 | | | | 216,784 | | | | 676 | | | | 6,705 | |
Class C | | | 606,197 | | | | 5,111,831 | | | | 12,912 | | | | 126,376 | |
Administrator Class | | | 89,236 | | | | 775,222 | | | | 12,215 | | | | 118,673 | |
Institutional Class | | | 1,260,658 | | | | 10,654,067 | | | | 140,068 | | | | 1,347,977 | |
| | | | |
| | | | | | | 59,875,864 | | | | | | | | 5,706,074 | |
| | | | |
Payment for shares redeemed | | | | | | | | | | | | | | | | |
Class A | | | (5,956,354 | ) | | | (54,335,024 | ) | | | (4,696,961 | ) | | | (46,170,825 | ) |
Class B | | | (212,484 | ) | | | (1,934,449 | ) | | | (235,677 | ) | | | (2,347,105 | ) |
Class C | | | (1,077,109 | ) | | | (9,826,218 | ) | | | (690,709 | ) | | | (6,779,827 | ) |
Administrator Class | | | (650,695 | ) | | | (5,982,660 | ) | | | (754,084 | ) | | | (7,409,406 | ) |
Institutional Class | | | (2,203,621 | ) | | | (20,087,169 | ) | | | (1,683,456 | ) | | | (16,493,344 | ) |
| | | | |
| | | | | | | (92,165,520 | ) | | | | | | | (79,200,507 | ) |
| | | | |
Net increase (decrease) in net assets resulting from capital share transactions | | | | | | | 56,451,396 | | | | | | | | (16,623,951 | ) |
| | | | |
Total increase (decrease) in net assets | | | | | | | 116,946,774 | | | | | | | | (27,942,066 | ) |
| | | | |
| | |
Net assets | | | | | | | | |
Beginning of period | | | | | | | 563,866,881 | | | | | | | | 591,808,947 | |
| | | | |
End of period | | | | | | $ | 680,813,655 | | | | | | | $ | 563,866,881 | |
| | | | |
Undistributed (overdistributed) net investment income | | | | | | $ | 422,976 | | | | | | | $ | (109,688 | ) |
| | | | |
The accompanying notes are an integral part of these financial statements.
| | | | |
| 18 | | Wells Fargo Diversified Capital Builder Fund | | Financial highlights |
(For a share outstanding throughout each period)
| | | | | | | | | | | | | | | | | | | | |
| | | Year ended September 30 | |
| CLASS A | | 2016 | | | 2015 | | | 2014 | | | 2013 | | | 2012 | |
Net asset value, beginning of period | | | $9.12 | | | | $9.31 | | | | $7.89 | | | | $6.93 | | | | $5.65 | |
Net investment income | | | 0.17 | | | | 0.11 | | | | 0.09 | | | | 0.12 | | | | 0.15 | |
Net realized and unrealized gains (losses) on investments | | | 1.71 | | | | (0.20 | ) | | | 1.41 | | | | 0.96 | | | | 1.29 | |
| | | | | | | | | | | | | | | | | | | | |
Total from investment operations | | | 1.88 | | | | (0.09 | ) | | | 1.50 | | | | 1.08 | | | | 1.44 | |
Distributions to shareholders from | | | | | | | | | | | | | | | | | | | | |
Net investment income | | | (0.15 | ) | | | (0.10 | ) | | | (0.08 | ) | | | (0.12 | ) | | | (0.16 | ) |
Net realized gains | | | (0.89 | ) | | | 0.00 | | | | 0.00 | | | | 0.00 | | | | 0.00 | |
| | | | | | | | | | | | | | | | | | | | |
Total distributions to shareholders | | | (1.04 | ) | | | (0.10 | ) | | | (0.08 | ) | | | (0.12 | ) | | | (0.16 | ) |
Net asset value, end of period | | | $9.96 | | | | $9.12 | | | | $9.31 | | | | $7.89 | | | | $6.93 | |
Total return1 | | | 22.85 | % | | | (1.05 | )% | | | 19.10 | % | | | 15.75 | % | | | 25.58 | % |
Ratios to average net assets (annualized) | | | | | | | | | | | | | | | | | | | | |
Gross expenses | | | 1.14 | % | | | 1.19 | % | | | 1.21 | % | | | 1.20 | % | | | 1.21 | % |
Net expenses | | | 1.14 | % | | | 1.19 | % | | | 1.20 | % | | | 1.20 | % | | | 1.20 | % |
Net investment income | | | 1.77 | % | | | 1.17 | % | | | 1.09 | % | | | 1.66 | % | | | 2.40 | % |
Supplemental data | | | | | | | | | | | | | | | | | | | | |
Portfolio turnover rate | | | 73 | % | | | 69 | % | | | 82 | % | | | 70 | % | | | 79 | % |
Net assets, end of period (000s omitted) | | | $467,503 | | | | $402,303 | | | | $431,388 | | | | $399,535 | | | | $390,705 | |
| 1 | Total return calculations do not include any sales charges. |
The accompanying notes are an integral part of these financial statements.
| | | | | | |
| Financial highlights | | Wells Fargo Diversified Capital Builder Fund | | | 19 | |
(For a share outstanding throughout each period)
| | | | | | | | | | | | | | | | | | | | |
| | | Year ended September 30 | |
| CLASS B | | 2016 | | | 2015 | | | 2014 | | | 2013 | | | 2012 | |
Net asset value, beginning of period | | | $9.19 | | | | $9.38 | | | | $7.95 | | | | $6.98 | | | | $5.69 | |
Net investment income | | | 0.09 | 1 | | | 0.04 | 1 | | | 0.03 | 1 | | | 0.07 | 1 | | | 0.11 | 1 |
Net realized and unrealized gains (losses) on investments | | | 1.75 | | | | (0.21 | ) | | | 1.41 | | | | 0.96 | | | | 1.28 | |
| | | | | | | | | | | | | | | | | | | | |
Total from investment operations | | | 1.84 | | | | (0.17 | ) | | | 1.44 | | | | 1.03 | | | | 1.39 | |
Distributions to shareholders from | | | | | | | | | | | | | | | | | | | | |
Net investment income | | | (0.07 | ) | | | (0.02 | ) | | | (0.01 | ) | | | (0.06 | ) | | | (0.10 | ) |
Net realized gains | | | (0.89 | ) | | | 0.00 | | | | 0.00 | | | | 0.00 | | | | 0.00 | |
| | | | | | | | | | | | | | | | | | | | |
Total distributions to shareholders | | | (0.96 | ) | | | (0.02 | ) | | | (0.01 | ) | | | (0.06 | ) | | | (0.10 | ) |
Net asset value, end of period | | | $10.07 | | | | $9.19 | | | | $9.38 | | | | $7.95 | | | | $6.98 | |
Total return2 | | | 22.06 | % | | | (1.86 | )% | | | 18.15 | % | | | 14.87 | % | | | 24.62 | % |
Ratios to average net assets (annualized) | | | | | | | | | | | | | | | | | | | | |
Gross expenses | | | 1.89 | % | | | 1.94 | % | | | 1.96 | % | | | 1.95 | % | | | 1.96 | % |
Net expenses | | | 1.89 | % | | | 1.94 | % | | | 1.95 | % | | | 1.95 | % | | | 1.95 | % |
Net investment income | | | 0.99 | % | | | 0.44 | % | | | 0.34 | % | | | 0.94 | % | | | 1.65 | % |
Supplemental data | | | | | | | | | | | | | | | | | | | | |
Portfolio turnover rate | | | 73 | % | | | 69 | % | | | 82 | % | | | 70 | % | | | 79 | % |
Net assets, end of period (000s omitted) | | | $1,515 | | | | $3,042 | | | | $5,180 | | | | $6,502 | | | | $8,077 | |
| 1 | Calculated based upon average shares outstanding |
| 2 | Total return calculations do not include any sales charges. |
The accompanying notes are an integral part of these financial statements.
| | | | |
| 20 | | Wells Fargo Diversified Capital Builder Fund | | Financial highlights |
(For a share outstanding throughout each period)
| | | | | | | | | | | | | | | | | | | | |
| | | Year ended September 30 | |
| CLASS C | | 2016 | | | 2015 | | | 2014 | | | 2013 | | | 2012 | |
Net asset value, beginning of period | | | $9.12 | | | | $9.32 | | | | $7.90 | | | | $6.94 | | | | $5.66 | |
Net investment income | | | 0.10 | | | | 0.05 | | | | 0.03 | | | | 0.07 | | | | 0.10 | |
Net realized and unrealized gains (losses) on investments | | | 1.72 | | | | (0.22 | ) | | | 1.41 | | | | 0.96 | | | | 1.29 | |
| | | | | | | | | | | | | | | | | | | | |
Total from investment operations | | | 1.82 | | | | (0.17 | ) | | | 1.44 | | | | 1.03 | | | | 1.39 | |
Distributions to shareholders from | | | | | | | | | | | | | | | | | | | | |
Net investment income | | | (0.09 | ) | | | (0.03 | ) | | | (0.02 | ) | | | (0.07 | ) | | | (0.11 | ) |
Net realized gains | | | (0.89 | ) | | | 0.00 | | | | 0.00 | | | | 0.00 | | | | 0.00 | |
| | | | | | | | | | | | | | | | | | | | |
Total distributions to shareholders | | | (0.98 | ) | | | (0.03 | ) | | | (0.02 | ) | | | (0.07 | ) | | | (0.11 | ) |
Net asset value, end of period | | | $9.96 | | | | $9.12 | | | | $9.32 | | | | $7.90 | | | | $6.94 | |
Total return1 | | | 21.96 | % | | | (1.88 | )% | | | 18.21 | % | | | 14.86 | % | | | 24.63 | % |
Ratios to average net assets (annualized) | | | | | | | | | | | | | | | | | | | | |
Gross expenses | | | 1.89 | % | | | 1.94 | % | | | 1.96 | % | | | 1.95 | % | | | 1.96 | % |
Net expenses | | | 1.89 | % | | | 1.94 | % | | | 1.95 | % | | | 1.95 | % | | | 1.95 | % |
Net investment income | | | 1.03 | % | | | 0.41 | % | | | 0.34 | % | | | 0.91 | % | | | 1.65 | % |
Supplemental data | | | | | | | | | | | | | | | | | | | | |
Portfolio turnover rate | | | 73 | % | | | 69 | % | | | 82 | % | | | 70 | % | | | 79 | % |
Net assets, end of period (000s omitted) | | | $67,630 | | | | $53,373 | | | | $45,670 | | | | $39,758 | | | | $38,279 | |
| 1 | Total return calculations do not include any sales charges. |
The accompanying notes are an integral part of these financial statements.
| | | | | | |
| Financial highlights | | Wells Fargo Diversified Capital Builder Fund | | | 21 | |
(For a share outstanding throughout each period)
| | | | | | | | | | | | | | | | | | | | |
| | | Year ended September 30 | |
| ADMINISTRATOR CLASS | | 2016 | | | 2015 | | | 2014 | | | 2013 | | | 2012 | |
Net asset value, beginning of period | | | $9.12 | | | | $9.32 | | | | $7.90 | | | | $6.94 | | | | $5.66 | |
Net investment income | | | 0.18 | 1 | | | 0.14 | 1 | | | 0.12 | 1 | | | 0.14 | 1 | | | 0.17 | 1 |
Net realized and unrealized gains (losses) on investments | | | 1.73 | | | | (0.22 | ) | | | 1.41 | | | | 0.96 | | | | 1.28 | |
| | | | | | | | | | | | | | | | | | | | |
Total from investment operations | | | 1.91 | | | | (0.08 | ) | | | 1.53 | | | | 1.10 | | | | 1.45 | |
Distributions to shareholders from | | | | | | | | | | | | | | | | | | | | |
Net investment income | | | (0.17 | ) | | | (0.12 | ) | | | (0.11 | ) | | | (0.14 | ) | | | (0.17 | ) |
Net realized gains | | | (0.89 | ) | | | 0.00 | | | | 0.00 | | | | 0.00 | | | | 0.00 | |
| | | | | | | | | | | | | | | | | | | | |
Total distributions to shareholders | | | (1.06 | ) | | | (0.12 | ) | | | (0.11 | ) | | | (0.14 | ) | | | (0.17 | ) |
Net asset value, end of period | | | $9.97 | | | | $9.12 | | | | $9.32 | | | | $7.90 | | | | $6.94 | |
Total return | | | 23.14 | % | | | (0.92 | )% | | | 19.39 | % | | | 16.06 | % | | | 25.84 | % |
Ratios to average net assets (annualized) | | | | | | | | | | | | | | | | | | | | |
Gross expenses | | | 1.06 | % | | | 1.05 | % | | | 1.04 | % | | | 1.04 | % | | | 1.03 | % |
Net expenses | | | 1.03 | % | | | 0.95 | % | | | 0.95 | % | | | 0.95 | % | | | 0.95 | % |
Net investment income | | | 1.89 | % | | | 1.41 | % | | | 1.33 | % | | | 1.84 | % | | | 2.65 | % |
Supplemental data | | | | | | | | | | | | | | | | | | | | |
Portfolio turnover rate | | | 73 | % | | | 69 | % | | | 82 | % | | | 70 | % | | | 79 | % |
Net assets, end of period (000s omitted) | | | $21,398 | | | | $7,898 | | | | $9,411 | | | | $6,836 | | | | $3,015 | |
| 1 | Calculated based upon average shares outstanding |
The accompanying notes are an integral part of these financial statements.
| | | | |
| 22 | | Wells Fargo Diversified Capital Builder Fund | | Financial highlights |
(For a share outstanding throughout each period)
| | | | | | | | | | | | | | | | | | | | |
| | | Year ended September 30 | |
| INSTITUTIONAL CLASS | | 2016 | | | 2015 | | | 2014 | | | 2013 | | | 2012 | |
Net asset value, beginning of period | | | $9.07 | | | | $9.27 | | | | $7.85 | | | | $6.90 | | | | $5.62 | |
Net investment income | | | 0.20 | | | | 0.15 | | | | 0.13 | 1 | | | 0.15 | | | | 0.18 | 1 |
Net realized and unrealized gains (losses) on investments | | | 1.71 | | | | (0.21 | ) | | | 1.41 | | | | 0.95 | | | | 1.28 | |
| | | | | | | | | | | | | | | | | | | | |
Total from investment operations | | | 1.91 | | | | (0.06 | ) | | | 1.54 | | | | 1.10 | | | | 1.46 | |
Distributions to shareholders from | | | | | | | | | | | | | | | | | | | | |
Net investment income | | | (0.19 | ) | | | (0.14 | ) | | | (0.12 | ) | | | (0.15 | ) | | | (0.18 | ) |
Net realized gains | | | (0.89 | ) | | | 0.00 | | | | 0.00 | | | | 0.00 | | | | 0.00 | |
| | | | | | | | | | | | | | | | | | | | |
Total distributions to shareholders | | | (1.08 | ) | | | (0.14 | ) | | | (0.12 | ) | | | (0.15 | ) | | | (0.18 | ) |
Net asset value, end of period | | | $9.90 | | | | $9.07 | | | | $9.27 | | | | $7.85 | | | | $6.90 | |
Total return | | | 23.28 | % | | | (0.75 | )% | | | 19.68 | % | | | 16.17 | % | | | 26.23 | % |
Ratios to average net assets (annualized) | | | | | | | | | | | | | | | | | | | | |
Gross expenses | | | 0.81 | % | | | 0.79 | % | | | 0.78 | % | | | 0.77 | % | | | 0.78 | % |
Net expenses | | | 0.78 | % | | | 0.77 | % | | | 0.78 | % | | | 0.77 | % | | | 0.78 | % |
Net investment income | | | 2.14 | % | | | 1.58 | % | | | 1.52 | % | | | 2.08 | % | | | 2.80 | % |
Supplemental data | | | | | | | | | | | | | | | | | | | | |
Portfolio turnover rate | | | 73 | % | | | 69 | % | | | 82 | % | | | 70 | % | | | 79 | % |
Net assets, end of period (000s omitted) | | | $122,769 | | | | $97,251 | | | | $100,160 | | | | $149,790 | | | | $142,256 | |
| 1 | Calculated based upon average shares outstanding |
The accompanying notes are an integral part of these financial statements.
| | | | | | |
| Notes to financial statements | | Wells Fargo Diversified Capital Builder Fund | | | 23 | |
1. ORGANIZATION
Wells Fargo Funds Trust (the “Trust”), a Delaware statutory trust organized on March 10, 1999, is an open-end management investment company registered under the Investment Company Act of 1940, as amended (the “1940 Act”). As an investment company, the Trust follows the accounting and reporting guidance in Financial Accounting Standards Board (“FASB”) Accounting Standards Codification Topic 946, Financial Services – Investment Companies. These financial statements report on the Wells Fargo Diversified Capital Builder Fund (the “Fund”) which is a diversified series of the Trust.
2. SIGNIFICANT ACCOUNTING POLICIES
The following significant accounting policies, which are consistently followed in the preparation of the financial statements of the Fund, are in conformity with U.S. generally accepted accounting principles which require management to make estimates and assumptions that affect the reported amounts of assets and liabilities, disclosure of contingent assets and liabilities at the date of the financial statements, and the reported amounts of revenues and expenses during the reporting period. Actual results could differ from those estimates.
Securities valuation
All investments are valued each business day as of the close of regular trading on the New York Stock Exchange (generally 4 p.m. Eastern Time), although the Fund may deviate from this calculation time under unusual or unexpected circumstances.
Equity securities that are listed on a foreign or domestic exchange or market are valued at the official closing price or, if none, the last sales price. If no sale occurs on the principal exchange or market that day, the prior day’s price will be deemed “stale” and a fair value price will be determined in accordance with the Fund’s Valuation Procedures.
Debt securities are valued at the evaluated bid price provided by an independent pricing service or, if a reliable price is not available, the quoted bid price from an independent broker-dealer.
Investments in registered open-end investment companies are valued at net asset value. Interests in non-registered investment vehicles that are redeemable at net asset value are fair valued normally at net asset value.
Investments which are not valued using any of the methods discussed above are valued at their fair value, as determined in good faith by the Board of Trustees of the Fund. The Board of Trustees has established a Valuation Committee comprised of the Trustees and has delegated to it the authority to take any actions regarding the valuation of portfolio securities that the Valuation Committee deems necessary or appropriate, including determining the fair value of portfolio securities, unless the determination has been delegated to the Management Valuation Team of Wells Fargo Funds Management, LLC (“Funds Management”). The Board of Trustees retains the authority to make or ratify any valuation decisions or approve any changes to the Valuation Procedures as it deems appropriate. On a quarterly basis, the Board of Trustees receives reports on any valuation actions taken by the Valuation Committee or the Management Valuation Team which may include items for ratification.
Valuations of fair valued securities are compared to the next actual sales price when available, or other appropriate market values, to assess the continued appropriateness of the fair valuation methodologies used. These securities are fair valued on a day-to-day basis, taking into consideration changes to appropriate market information and any significant changes to the inputs considered in the valuation process until there is a readily available price provided on an exchange or by an independent pricing service. Valuations received from an independent pricing service or independent broker-dealer quotes are periodically validated by comparisons to most recent trades and valuations provided by other independent pricing services in addition to the review of prices by the manager and/or subadviser. Unobservable inputs used in determining fair valuations are identified based on the type of security, taking into consideration factors utilized by market participants in valuing the investment, knowledge about the issuer and the current market environment.
Security loans
The Fund may lend its securities from time to time in order to earn additional income in the form of fees or interest on securities received as collateral or the investment of any cash received as collateral. The Fund continues to receive interest or dividends on the securities loaned. The Fund receives collateral in the form of cash or securities with a value at least equal to the value of the securities on loan. The value of the loaned securities is determined at the close of each business day and any additional required collateral is delivered to the Fund on the next business day. In a securities lending transaction, the net asset value of the Fund will be affected by an increase or decrease in the value of the securities loaned and by an increase or decrease in the value of the instrument in which collateral is invested. The amount of securities lending activity undertaken by the Fund fluctuates from time to time. In the event of default or bankruptcy by the borrower, the Fund may be prevented from recovering the loaned securities or gaining access to the collateral or may experience delays or costs in doing so. In addition, the investment of any cash collateral received may lose all or part of its value. The Fund has the right under the lending agreement to recover the securities from the borrower on demand.
| | | | |
| 24 | | Wells Fargo Diversified Capital Builder Fund | | Notes to financial statements |
The Fund lends its securities through an unaffiliated securities lending agent. Cash collateral received in connection with its securities lending transactions is invested in Securities Lending Cash Investments, LLC (the “Securities Lending Fund”). The Securities Lending Fund is exempt from registration under Section 3(c)(7) of the 1940 Act and is managed by Funds Management and is subadvised by Wells Capital Management Incorporated (“WellsCap”), an affiliate of Funds Management and an indirect wholly owned subsidiary of Wells Fargo & Company (“Wells Fargo”). Funds Management receives an advisory fee starting at 0.05% and declining to 0.01% as the average daily net assets of the Securities Lending Fund increase. All of the fees received by Funds Management are paid to WellsCap for its services as subadviser. The Securities Lending Fund seeks to provide a positive return compared to the daily Fed Funds Open rate by investing in high-quality, U.S. dollar-denominated short-term money market instruments. Securities Lending Fund investments are fair valued based upon the amortized cost valuation technique. Income earned from investment in the Securities Lending Fund is included in securities lending income on the Statement of Operations.
When-issued transactions
The Fund may purchase securities on a forward commitment or when-issued basis. The Fund records a when-issued transaction on the trade date and will segregate assets in an amount at least equal in value to the Fund’s commitment to purchase when-issued securities. Securities purchased on a when-issued basis are marked-to-market daily and the Fund begins earning interest on the settlement date. Losses may arise due to changes in the market value of the underlying securities or if the counterparty does not perform under the contract.
Security transactions and income recognition
Securities transactions are recorded on a trade date basis. Realized gains or losses are recorded on the basis of identified cost.
Dividend income is recognized on the ex-dividend date.
Interest income is accrued daily and bond discounts are accreted and premiums are amortized daily based on the effective interest method. To the extent debt obligations are placed on non-accrual status, any related interest income may be reduced by writing off interest receivables when the collection of all or a portion of interest has become doubtful based on consistently applied procedures. If the issuer subsequently resumes interest payments or when the collectability of interest is reasonably assured, the debt obligation is removed from non-accrual status.
Distributions to shareholders
Distributions to shareholders from net investment income and net realized gains, if any, are recorded on the ex-dividend date. Such distributions are determined in conformity with federal income tax regulations, which may differ in amount or character from net investment income and realized gains recognized for purposes of U.S. generally accepted accounting principles.
Federal and other taxes
The Fund intends to continue to qualify as a regulated investment company by distributing substantially all of its investment company taxable income and any net realized capital gains (after reduction for capital loss carryforwards) sufficient to relieve it from all, or substantially all, federal income taxes. Accordingly, no provision for federal income taxes was required.
The Fund’s income and federal excise tax returns and all financial records supporting those returns for the prior three fiscal years are subject to examination by the federal and Delaware revenue authorities. Management has analyzed the Fund’s tax positions taken on federal, state, and foreign tax returns for all open tax years and does not believe that there are any uncertain tax positions that require recognition of a tax liability.
Reclassifications are made to the Fund’s capital accounts for permanent tax differences to reflect income and gains available for distribution (or available capital loss carryforwards) under federal income tax regulations. U.S. generally accepted accounting principles require that certain components of net assets be adjusted to reflect permanent differences between financial and tax reporting. These reclassifications have no effect on net assets or net asset values per share. The primary permanent difference causing such reclassifications is due to recognition of partnership income. At September 30, 2016, as a result of permanent book-to-tax differences, the following reclassification adjustments were made on the Statement of Assets and Liabilities:
| | | | |
| Paid-in capital | | Undistributed net investment income | | Accumulated net realized gains on investments |
| $(18,724) | | $172,545 | | $(153,821) |
| | | | | | |
| Notes to financial statements | | Wells Fargo Diversified Capital Builder Fund | | | 25 | |
Class allocations
The separate classes of shares offered by the Fund differ principally in applicable sales charges, distribution, shareholder servicing, and administration fees. Class specific expenses are charged directly to that share class. Investment income, common expenses, and realized and unrealized gains (losses) on investments are allocated daily to each class of shares based on the relative proportion of net assets of each class.
3. FAIR VALUATION MEASUREMENTS
Fair value measurements of investments are determined within a framework that has established a fair value hierarchy based upon the various data inputs utilized in determining the value of the Fund’s investments. The three-level hierarchy gives the highest priority to unadjusted quoted prices in active markets for identical assets or liabilities (Level 1) and the lowest priority to significant unobservable inputs (Level 3). The Fund’s investments are classified within the fair value hierarchy based on the lowest level of input that is significant to the fair value measurement. The inputs are summarized into three broad levels as follows:
| n | | Level 1 – quoted prices in active markets for identical securities |
| n | | Level 2 – other significant observable inputs (including quoted prices for similar securities, interest rates, prepayment speeds, credit risk, use of amortized cost, etc.) |
| n | | Level 3 – significant unobservable inputs (including the Fund’s own assumptions in determining the fair value of investments) |
The inputs or methodologies used for valuing investments in securities are not necessarily an indication of the risk associated with investing in those securities.
The following is a summary of the inputs used in valuing the Fund’s assets and liabilities as of September 30, 2016:
| | | | | | | | | | | | | | | | |
| | | Quoted prices
(Level 1) | | | Other significant
observable inputs
(Level 2) | | | Significant
unobservable inputs (Level 3) | | | Total | |
Assets | | | | | | | | | | | | | | | | |
Investments in: | | | | | | | | | | | | | | | | |
| | | | |
Common stocks | | | | | | | | | | | | | | | | |
Consumer discretionary | | $ | 39,547,200 | | | $ | 0 | | | $ | 0 | | | $ | 39,547,200 | |
Consumer staples | | | 33,118,800 | | | | 0 | | | | 0 | | | | 33,118,800 | |
Energy | | | 125,227,650 | | | | 0 | | | | 0 | | | | 125,227,650 | |
Health care | | | 44,706,554 | | | | 0 | | | | 0 | | | | 44,706,554 | |
Industrials | | | 79,069,968 | | | | 0 | | | | 0 | | | | 79,069,968 | |
Information technology | | | 111,092,166 | | | | 0 | | | | 0 | | | | 111,092,166 | |
Materials | | | 18,179,000 | | | | 0 | | | | 0 | | | | 18,179,000 | |
Real estate | | | 55,751,200 | | | | 0 | | | | 0 | | | | 55,751,200 | |
Utilities | | | 8,564,050 | | | | 0 | | | | 0 | | | | 8,564,050 | |
| | | | |
Corporate bonds and notes | | | 0 | | | | 143,606,956 | | | | 0 | | | | 143,606,956 | |
| | | | |
Yankee corporate bonds and notes | | | 0 | | | | 17,164,648 | | | | 0 | | | | 17,164,648 | |
| | | | |
Short-term investments | | | | | | | | | | | | | | | | |
Investment companies | | | 3,773,354 | | | | 0 | | | | 0 | | | | 3,773,354 | |
Investments measured at net asset value* | | | | | | | | | | | | | | | 9,035,155 | |
Total assets | | $ | 519,029,942 | | | $ | 160,771,604 | | | $ | 0 | | | $ | 688,836,701 | |
| * | Investments that are measured at fair value using the net asset value per share (or its equivalent) as a practical expedient have not been categorized in the fair value hierarchy. The fair value amount presented in the table is intended to permit reconciliation of the fair value hierarchy to the amounts presented in the Statement of Assets and Liabilities. The Fund’s investment in Securities Lending Cash Investments, LLC valued at $9,035,155 does not have a redemption period notice, can be redeemed daily and does not have any unfunded commitments. |
The Fund recognizes transfers between levels within the fair value hierarchy at the end of the reporting period. At September 30, 2016, the Fund did not have any transfers into/out of Level 1, Level 2, or Level 3.
| | | | |
| 26 | | Wells Fargo Diversified Capital Builder Fund | | Notes to financial statements |
4. TRANSACTIONS WITH AFFILIATES
Management fee
Funds Management, an indirect wholly owned subsidiary of Wells Fargo, is the manager of the Fund and provides advisory and fund-level administrative services under an investment management agreement. Under the investment management agreement, Funds Management is responsible for, among other services, implementing the investment objectives and strategies of the Fund, supervising the subadviser, providing fund-level administrative services in connection with the Fund’s operations, and providing any other fund-level administrative services reasonably necessary for the operation of the Fund. As compensation for its services under the investment management agreement, Funds Management is entitled to receive an annual management fee starting at 0.65% and declining to 0.48% as the average daily net assets of the Fund increase. For the year ended September 30, 2016, the management fee was equivalent to an annual rate of 0.64% of the Fund’s average daily net assets.
Funds Management has retained the services of a subadviser to provide daily portfolio management to the Fund. The fee for subadvisory services is borne by Funds Management. WellsCap is the subadviser to the Fund and is entitled to receive a fee from Funds Management at an annual rate starting at 0.35% and declining to 0.20% as the average daily net assets of the Fund increase.
Administration fees
Under a class-level administration agreement, Funds Management provides class-level administrative services to the Fund, which includes paying fees and expenses for services provided by the transfer agent, sub-transfer agents, omnibus account servicers and record-keepers. As compensation for its services under the class-level administration agreement, Funds Management receives an annual fee which is calculated based on the average daily net assets of each class as follows:
| | | | |
| | | Class-level
administration fee | |
Class A, Class B, Class C | | | 0.21 | % |
Administrator Class, Institutional Class | | | 0.13 | |
Funds Management has contractually waived and/or reimbursed management and administration fees to the extent necessary to maintain certain net operating expense ratios for the Fund. Waiver of fees and/or reimbursement of expenses by Funds Management were made first from fund level expenses on a proportionate basis and then from class specific expenses. Funds Management has committed through January 31, 2017 to waive fees and/or reimburse expenses to the extent necessary to cap the Fund’s expenses at 1.20% for Class A shares, 1.95% for Class B shares, 1.95% for Class C shares, 1.05% for Administrator Class shares, and 0.78% for Institutional Class shares After this time, the cap may be increased or the commitment to maintain the cap may be terminated only with the approval of the Board of Trustees. Prior to February 1, 2016, the Fund’s expenses were capped at 0.95% for Administrator Class shares.
Distribution fees
The Trust has adopted a distribution plan for Class B and Class C shares of the Fund pursuant to Rule 12b-1 under the 1940 Act. Distribution fees are charged to Class B and Class C shares and paid to Wells Fargo Funds Distributor, LLC (“Funds Distributor”), the principal underwriter, at an annual rate of 0.75% of the average daily net assets of Class B and Class C shares.
In addition, Funds Distributor is entitled to receive the front-end sales charge from the purchase of Class A shares and a contingent deferred sales charge on the redemption of certain Class A shares. Funds Distributor is also entitled to receive the contingent deferred sales charges from redemptions of Class B and Class C shares. For the year ended September 30, 2016, Funds Distributor received $39,034 from the sale of Class A shares and $1,185, and $316 in contingent deferred sales charges from redemptions of Class B and Class C shares, respectively.
Shareholder servicing fees
The Trust has entered into contracts with one or more shareholder servicing agents, whereby Class A, Class B, Class C, and Administrator Class of the Fund are charged a fee at an annual rate of 0.25% of the average daily net assets of each respective class.
A portion of these total shareholder servicing fees were paid to affiliates of Wells Fargo.
| | | | | | |
| Notes to financial statements | | Wells Fargo Diversified Capital Builder Fund | | | 27 | |
5. INVESTMENT PORTFOLIO TRANSACTIONS
Purchases and sales of investments, excluding U.S. government obligations (if any) and short-term securities, for the year ended September 30, 2016 were $486,249,186 and $429,134,120, respectively.
The Fund may purchase or sell investment securities to other Wells Fargo funds under procedures adopted by the Board of Trustees. The procedures have been designed to ensure that these interfund transactions, which generally do not incur broker commissions, are effected at current market prices. Interfund trades are included within the respective purchases and sales amounts shown.
6. BANK BORROWINGS
The Trust (excluding the money market funds and certain other funds) and Wells Fargo Variable Trust are parties to a $250,000,000 revolving credit agreement whereby the Fund is permitted to use bank borrowings for temporary or emergency purposes, such as to fund shareholder redemption requests. Interest under the credit agreement is charged to the Fund based on a borrowing rate equal to the higher of the Federal Funds rate in effect on that day plus 1.25% or the overnight LIBOR rate in effect on that day plus 1.25%. In addition, an annual commitment fee equal to 0.25% of the unused balance is allocated to each participating fund. Prior to August 30, 2016, the revolving credit agreement amount was $200,000,000 and the annual commitment fee was equal to 0.20% of the unused balance which was allocated to each participating fund.
For the year ended September 30, 2016, there were no borrowings by the Fund under the agreement.
7. DISTRIBUTIONS TO SHAREHOLDERS
The tax character of distributions paid during the years ended September 30, 2016 and September 30, 2016 were as follows:
| | | | | | | | |
| | | Year ended September 30, | |
| | | 2016 | | | 2015 | |
Ordinary income | | $ | 10,219,018 | | | $ | 5,395,444 | |
Long-term capital gain | | | 53,552,312 | | | | 725,367 | |
As of September 30, 2016, the components of distributable earnings on a tax basis were as follows:
| | | | |
Undistributed ordinary income | | Undistributed long-term gain | | Unrealized gains |
| $988,855 | | $55,403,143 | | $73,163,694 |
8. INDEMNIFICATION
Under the Trust’s organizational documents, the officers and Trustees have been granted certain indemnification rights against certain liabilities that may arise out of performance of their duties to the Trust. Additionally, in the normal course of business, the Trust may enter into contracts with service providers that contain a variety of indemnification clauses. The Trust’s maximum exposure under these arrangements is dependent on future claims that may be made against the Fund and, therefore, cannot be estimated.
| | | | |
| 28 | | Wells Fargo Diversified Capital Builder Fund | | Report of independent registered public accounting firm |
BOARD OF TRUSTEES AND SHAREHOLDERS OF WELLS FARGO FUNDS TRUST:
We have audited the accompanying statement of assets and liabilities, including the portfolio of investments, of the Wells Fargo Diversified Capital Builder Fund (formerly known as Wells Fargo Advantage Diversified Capital Builder Fund) (the “Fund”), one of the funds constituting the Wells Fargo Funds Trust, as of September 30, 2016, and the related statement of operations for the year then ended, the statements of changes in net assets for each of the years in the two-year period then ended, and the financial highlights for each of the years in the five-year period then ended. These financial statements and financial highlights are the responsibility of the Fund’s management. Our responsibility is to express an opinion on these financial statements and financial highlights based on our audits.
We conducted our audits in accordance with the standards of the Public Company Accounting Oversight Board (United States). Those standards require that we plan and perform the audit to obtain reasonable assurance about whether the financial statements and financial highlights are free of material misstatement. An audit includes examining, on a test basis, evidence supporting the amounts and disclosures in the financial statements. Our procedures included confirmation of securities owned as of September 30, 2016, by correspondence with the custodian and brokers, or by other appropriate auditing procedures. An audit also includes assessing the accounting principles used and significant estimates made by management, as well as evaluating the overall financial statement presentation. We believe that our audits provide a reasonable basis for our opinion.
In our opinion, the financial statements and financial highlights referred to above present fairly, in all material respects, the financial position of the Wells Fargo Diversified Capital Builder Fund as of September 30, 2016, the results of its operations for the year then ended, the changes in its net assets for each of the years in the two-year period then ended, and the financial highlights for each of the years in the five-year period then ended, in conformity with U.S. generally accepted accounting principles.

Boston, Massachusetts
November 23, 2016
| | | | | | |
| Other information (unaudited) | | Wells Fargo Diversified Capital Builder Fund | | | 29 | |
TAX INFORMATION
For corporate shareholders, pursuant to Section 854 of the Internal Revenue Code, 63.35% of ordinary income dividends qualify for the corporate dividends-received deduction for the fiscal year ended September 30, 2016.
Pursuant to Section 852 of the Internal Revenue Code, $53,552,312 was designated as a 20% rate gain distribution for the fiscal year ended September 30, 2016.
Pursuant to Section 854 of the Internal Revenue Code, $6,582,427 of income dividends paid during the fiscal year ended September 30, 2016 has been designated as qualified dividend income (QDI).
For the fiscal year ended September 30, 2016, $5,428,133 has been designated as interest-related dividends for nonresident alien shareholders pursuant to Section 871 of the Internal Revenue Code.
PROXY VOTING INFORMATION
A description of the policies and procedures that the Fund uses to determine how to vote proxies relating to portfolio securities is available, upon request, by calling 1-800-222-8222, visiting our website at wellsfargofunds.com, or visiting the SEC website at sec.gov. Information regarding how the Fund voted proxies relating to portfolio securities during the most recent 12-month period ended June 30 is available on the Fund’s website at wellsfargofunds.com or by visiting the SEC website at sec.gov.
PORTFOLIO HOLDINGS INFORMATION
The complete portfolio holdings for the Fund are publicly available monthly on the Fund’s website (wellsfargofunds.com), on a one-month delayed basis. In addition, top ten holdings information (excluding derivative positions) for the Fund is publicly available on the Fund’s website on a monthly, seven-day or more delayed basis. The Fund files its complete schedule of portfolio holdings with the SEC for the first and third quarters of each fiscal year on Form N-Q, which is available by visiting the SEC website at sec.gov. In addition, the Fund’s Form N-Q may be reviewed and copied at the SEC’s Public Reference Room in Washington, DC, and at regional offices in New York City, at 233 Broadway, and in Chicago, at 175 West Jackson Boulevard, Suite 900. Information about the Public Reference Room may be obtained by calling 1-800-SEC-0330.
| | | | |
| 30 | | Wells Fargo Diversified Capital Builder Fund | | Other information (unaudited) |
BOARD OF TRUSTEES AND OFFICERS
Each of the Trustees and Officers1 listed in the table below acts in identical capacities for each fund in the Wells Fargo family of funds, which consists of 138 mutual funds comprising the Wells Fargo Funds Trust, Wells Fargo Variable Trust, Wells Fargo Master Trust and four closed-end funds (collectively the “Fund Complex”). This table should be read in conjunction with the Prospectus and the Statement of Additional Information2. The mailing address of each Trustee and Officer is 525 Market Street, 12th Floor, San Francisco, CA 94105. Each Trustee and Officer serves an indefinite term, however, each Trustee serves such term until reaching the mandatory retirement age established by the Trustees.
Independent Trustees
| | | | | | |
Name and year of birth | | Position held and length of service* | | Principal occupations during past five years or longer | | Current other public company or investment company directorships |
| William R. Ebsworth (Born 1957) | | Trustee, since 2015 | | Retired. From 1984 to 2013, equities analyst, portfolio manager, research director and chief financial officer at Fidelity Management and Research Company in Boston, Tokyo, and Hong Kong and retired in 2013 as Chief Investment Officer of Fidelity Strategic Advisers, Inc. where he lead a team of investment professionals managing client assets. Prior thereto, Board member of Hong Kong Securities Clearing Co., Hong Kong Options Clearing Corp., the Thailand International Fund, Ltd., Fidelity Investments Life Insurance Company, and Empire Fidelity Investments Life Insurance Company. Mr. Ebsworth is a CFA® charterholder and an Adjunct Lecturer, Finance, at Babson College. | | Asset Allocation Trust |
| Jane A. Freeman (Born 1953) | | Trustee, since 2015 | | Retired. From 2012 to 2014 and 1999 to 2008, Chief Financial Officer of Scientific Learning Corporation. From 2008 to 2012, Ms. Freeman provided consulting services related to strategic business projects. Prior to 1999, Portfolio Manager at Rockefeller & Co. and Scudder, Stevens & Clark. Board member of the Harding Loevner Funds from 1996 to 2014, serving as both Lead Independent Director and chair of the Audit Committee. Board member of the Russell Exchange Traded Funds Trust from 2011 to 2012 and the chair of the Audit Committee. Ms. Freeman is a Board Member of Ruth Bancroft Garden (non-profit organization) and an inactive chartered financial analyst. | | Asset Allocation Trust |
| Peter G. Gordon (Born 1942) | | Trustee, since 1998; Chairman, since 2005 | | Co-Founder, Retired Chairman, President and CEO of Crystal Geyser Water Company. Trustee Emeritus, Colby College. | | Asset Allocation Trust |
Isaiah Harris, Jr. (Born 1952) | | Trustee, since 2009 | | Retired. Chairman of the Board of CIGNA Corporation since 2009, and Director since 2005. From 2003 to 2011, Director of Deluxe Corporation. Prior thereto, President and CEO of BellSouth Advertising and Publishing Corp. from 2005 to 2007, President and CEO of BellSouth Enterprises from 2004 to 2005 and President of BellSouth Consumer Services from 2000 to 2003. Emeritus member of the Iowa State University Foundation Board of Governors. Emeritus Member of the Advisory Board of Iowa State University School of Business. Advisory Board Member, Palm Harbor Academy (charter school). Advisory Board Member, Child Evangelism Fellowship (non-profit). Mr. Harris is a certified public accountant (inactive status). | | CIGNA Corporation; Asset Allocation Trust |
| Judith M. Johnson (Born 1949) | | Trustee, since 2008;
Audit Committee Chairman, since 2008 | | Retired. Prior thereto, Chief Executive Officer and Chief Investment Officer of Minneapolis Employees Retirement Fund from 1996 to 2008. Ms. Johnson is an attorney, certified public accountant and a certified managerial accountant. | | Asset Allocation Trust |
| David F. Larcker (Born 1950) | | Trustee, since 2009 | | James Irvin Miller Professor of Accounting at the Graduate School of Business, Stanford University, Director of the Corporate Governance Research Initiative and Senior Faculty of The Rock Center for Corporate Governance since 2006. From 2005 to 2008, Professor of Accounting at the Graduate School of Business, Stanford University. Prior thereto, Ernst & Young Professor of Accounting at The Wharton School, University of Pennsylvania from 1985 to 2005. | | Asset Allocation Trust |
| | | | | | |
| Other information (unaudited) | | Wells Fargo Diversified Capital Builder Fund | | | 31 | |
| | | | | | |
Name and year of birth | | Position held and length of service* | | Principal occupations during past five years or longer | | Current other public company or investment company directorships |
| Olivia S. Mitchell (Born 1953) | | Trustee, since 2006 | | International Foundation of Employee Benefit Plans Professor, Wharton School of the University of Pennsylvania since 1993. Director of Wharton’s Pension Research Council and Boettner Center on Pensions & Retirement Research, and Research Associate at the National Bureau of Economic Research. Previously, Cornell University Professor from 1978 to 1993. | | Asset Allocation Trust |
| Timothy J. Penny (Born 1951) | | Trustee, since 1996 | | President and Chief Executive Officer of Southern Minnesota Initiative Foundation, a non-profit organization, since 2007 and Senior Fellow at the Humphrey Institute Policy Forum at the University of Minnesota since 1995. Member of the Board of Trustees of NorthStar Education Finance, Inc., a non-profit organization, since 2007. | | Asset Allocation Trust |
| Michael S. Scofield (Born 1943) | | Trustee, since 2010 | | Served on the Investment Company Institute’s Board of Governors and Executive Committee from 2008-2011 as well the Governing Council of the Independent Directors Council from 2006-2011 and the Independent Directors Council Executive Committee from 2008-2011. Chairman of the IDC from 2008-2010. Institutional Investor (Fund Directions) Trustee of Year in 2007. Trustee of the Evergreen Funds complex (and its predecessors) from 1984 to 2010. Chairman of the Evergreen Funds from 2000-2010. Former Trustee of the Mentor Funds. Retired Attorney, Law Offices of Michael S. Scofield. | | Asset Allocation Trust |
| * | Length of service dates reflect the Trustee’s commencement of service with the Trust’s predecessor entities, where applicable. |
Officers
| | | | | | |
Name and year of birth | | Position held and
length of service | | Principal occupations during past five years or longer | | |
Karla M. Rabusch
(Born 1959) | | President, since 2003 | | Executive Vice President of Wells Fargo Bank, N.A. and President of Wells Fargo Funds Management, LLC since 2003. | | |
Jeremy DePalma1
(Born 1974) | | Treasurer, since 2012 | | Senior Vice President of Wells Fargo Funds Management, LLC since 2009. Senior Vice President of Evergreen Investment Management Company, LLC from 2008 to 2010 and head of the Fund Reporting and Control Team within Fund Administration from 2005 to 2010. | | |
C. David Messman
(Born 1960) | | Secretary, since 2000; Chief Legal Officer, since 2003 | | Senior Vice President and Secretary of Wells Fargo Funds Management, LLC since 2001. Assistant General Counsel of Wells Fargo Bank, N.A. since 2013 and Vice President and Managing Counsel of Wells Fargo Bank, N.A. from 1996 to 2013. | | |
Michael Whitaker
(Born 1967) | | Chief Compliance Officer, since 20163 | | Executive Vice President of Wells Fargo Funds Management, LLC since 2016. Chief Compliance Officer of Fidelity’s Fixed Income Funds and Asset Allocation Funds from 2008 to 2016, Compliance Officer of FMR Co., Inc. from 2014 to 2016, Fidelity Investments Money Management, Inc. from 2014 to 2016, Fidelity Investments from 2007 to 2016. | | |
David Berardi
(Born 1975) | | Assistant Treasurer, since 2009 | | Vice President of Wells Fargo Funds Management, LLC since 2009. Vice President of Evergreen Investment Management Company, LLC from 2008 to 2010. Manager of Fund Reporting and Control for Evergreen Investment Management Company, LLC from 2004 to 2010. | | |
| 1 | Jeremy DePalma acts as Treasurer of 68 funds and Assistant Treasurer of 70 funds in the Fund Complex. |
| 2 | The Statement of Additional Information includes additional information about the Trustees and is available, without charge, upon request, by calling 1-800-222-8222 or by visiting the website at wellsfargofunds.com. |
| 3 | Michael Whitaker became Chief Compliance Officer effective May 16, 2016. |
| | | | |
| 32 | | Wells Fargo Diversified Capital Builder Fund | | Other information (unaudited) |
BOARD CONSIDERATION OF INVESTMENT MANAGEMENT AND SUB-ADVISORY AGREEMENTS:
Under the Investment Company Act of 1940 (the “1940 Act”), the Board of Trustees (the “Board”) of Wells Fargo Funds Trust (the “Trust”) must determine annually whether to approve the continuation of the Trust’s investment management and sub-advisory agreements. In this regard, at an in-person meeting held on May 24-25, 2016 (the “Meeting”), the Board, all the members of which have no direct or indirect interest in the investment management and sub-advisory agreements and are not “interested persons” of the Trust, as defined in the 1940 Act (the “Independent Trustees”), reviewed and approved for Wells Fargo Diversified Capital Builder Fund (the “Fund”): (i) an investment management agreement (the “Management Agreement”) with Wells Fargo Funds Management, LLC (“Funds Management”); and (ii) an investment sub-advisory agreement (the “Sub-Advisory Agreement”) with Wells Capital Management Incorporated (the “Sub-Adviser”), an affiliate of Funds Management. The Management Agreement and the Sub-Advisory Agreement are collectively referred to as the “Advisory Agreements.”
At the Meeting, the Board considered the factors and reached the conclusions described below relating to the selection of Funds Management and the Sub-Adviser and the approval of the Advisory Agreements. Prior to the Meeting, including at an in-person meeting in April 2016, the Trustees conferred extensively among themselves and with representatives of Funds Management about these matters. Also, the Board has adopted a team-based approach, with each team consisting of a sub-set of Trustees, to assist the full Board in the discharge of its duties in reviewing performance and other matters throughout the year. The Independent Trustees were assisted in their evaluation of the Advisory Agreements by independent legal counsel, from whom they received separate legal advice and with whom they met separately.
In providing information to the Board, Funds Management and the Sub-Adviser were guided by a detailed set of requests for information submitted to them by independent legal counsel on behalf of the Independent Trustees at the start of the Board’s annual contract renewal process earlier in 2016. In considering and approving the Advisory Agreements, the Trustees considered the information they believed relevant, including but not limited to the information discussed below. The Board considered not only the specific information presented in connection with the Meeting, but also the knowledge gained over time through interaction with Funds Management and the Sub-Adviser about various topics. In this regard, the Board reviewed reports of Funds Management at each of its quarterly meetings, which included, among other things, portfolio reviews and performance reports. In addition, the Board and the teams mentioned above confer with portfolio managers at various times throughout the year. The Board did not identify any particular information or consideration that was all-important or controlling, and each individual Trustee may have attributed different weights to various factors.
After its deliberations, the Board unanimously approved the continuation of the Advisory Agreements for a one-year term and determined that the compensation payable to Funds Management and the Sub-Adviser under each of the Advisory Agreements was reasonable. The Board considered the approval of the Advisory Agreements for the Fund as part of its consideration of agreements for funds across the complex, but its approvals were made on a fund-by-fund basis. The following summarizes a number of important, but not necessarily all, factors considered by the Board in support of its approvals.
Nature, extent and quality of services
The Board received and considered various information regarding the nature, extent and quality of services provided to the Fund by Funds Management and the Sub-Adviser under the Advisory Agreements. This information included a description of the investment advisory services and Fund-level administrative services covered by the Management Agreement, as well as, among other things, a summary of the background and experience of senior management of Funds Management, and the qualifications, background, tenure and responsibilities of each of the portfolio managers primarily responsible for the day-to-day portfolio management of the Fund.
The Board evaluated the ability of Funds Management and the Sub-Adviser to attract and retain qualified investment professionals, including research, advisory and supervisory personnel. The Board further considered the compliance programs and compliance records of Funds Management and the Sub-Adviser. In addition, the Board took into account the full range of services provided to the Fund by Funds Management and its affiliates.
Fund performance and expenses
The Board considered the performance results for the Fund over various time periods ended December 31, 2015. The Board considered these results in comparison to the performance of funds in a universe that was determined by Broadridge Inc. (“Broadridge”) to be similar to the Fund (the “Universe”), and in comparison to the Fund’s benchmark index and to other comparative data. Broadridge is an independent provider of investment company data. The Board received a description of the methodology used by Broadridge to select the mutual funds in the performance Universe.
| | | | | | |
| Other information (unaudited) | | Wells Fargo Diversified Capital Builder Fund | | | 33 | |
The Board noted that the performance of the Fund (Class A) was higher than or in range of the average performance of the Universe for all periods under review except the one-year period under review. The Board also noted that the performance of the Fund was in range of its benchmark, the Diversified Capital Builder Blended Index, for all periods under review except the one, five and ten-year periods.
The Board received information concerning, and discussed factors contributing to, the underperformance of the Fund relative to the Universe and benchmark for the periods noted above. The Board took note of the explanations for the relative underperformance in these periods, including with respect to market factors and investment decisions that affected the Fund’s performance.
The Board also received and considered information regarding the Fund’s net operating expense ratios and their various components, including actual management fees, custodian and other non-management fees, and Rule 12b-1 and non-Rule 12b-1 shareholder service fees. The Board considered these ratios in comparison to the median ratios of funds in class-specific expense groups that were determined by Broadridge to be similar to the Fund (the “Groups”). The Board received a description of the methodology used by Broadridge to select the mutual funds in the expense Groups and an explanation of how funds comprising expense groups and their expense ratios may vary from year-to-year. Based on the Broadridge reports, the Board noted that the net operating expense ratios of the Fund were lower than or in range of the median net operating expense ratios of the expense Groups.
The Board took into account the Fund performance and expense information provided to it among the factors considered in deciding to re-approve the Advisory Agreements.
Investment management and sub-advisory fee rates
The Board reviewed and considered the contractual fee rates payable by the Fund to Funds Management under the Management Agreement, as well as the contractual fee rates payable by the Fund to Funds Management for class-level administrative services under a Class-Level Administration Agreement, which include class-level transfer agency and sub-transfer agency costs (collectively, the “Management Rates”). The Board also reviewed and considered the contractual investment sub-advisory fee rates that are payable by Funds Management to the Sub-Adviser for investment sub-advisory services.
Among other information reviewed by the Board was a comparison of the Fund’s Management Rates with the average contractual investment management fee rates of funds in the expense Groups at a common asset level as well as transfer agency costs of the funds in the expense Groups. The Board noted that the Management Rates of the Fund were in range of the sum of these average rates for the Fund’s expense Groups for all share classes.
The Board also received and considered information about the portion of the total management fee that was retained by Funds Management after payment of the fee to the Sub-Adviser for sub-advisory services. In assessing the reasonableness of this amount, the Board received and evaluated information about the nature and extent of responsibilities retained and risks assumed by Funds Management and not delegated to or assumed by the Sub-Adviser, and about Funds Management’s on-going oversight services. However, given the affiliation between Funds Management and the Sub-Adviser, the Board ascribed limited relevance to the allocation of fees between them.
The Board also received and considered information about the nature and extent of services offered and fee rates charged by Funds Management and the Sub-Adviser to other types of clients with investment strategies similar to those of the Fund. In this regard, the Board received information about the significantly greater scope of services, and compliance, reporting and other legal burdens and risks of managing mutual funds compared with those associated with managing assets of non-mutual fund clients such as collective funds or institutional separate accounts.
Based on its consideration of the factors and information it deemed relevant, including those described here, the Board determined that the compensation payable to Funds Management under the Management Agreement and to the Sub-Adviser under the Sub-Advisory Agreement was reasonable, in light of the services covered by the Advisory Agreements.
Profitability
The Board received and considered information concerning the profitability of Funds Management, as well as the profitability of Wells Fargo as a whole, from providing services to the Fund and the fund family as a whole. The Board also received and considered information concerning the profitability of the Sub-Adviser from providing services to the fund family as a whole, noting that the Sub-Adviser’s profitability information with respect to providing services to the Fund was subsumed in the Wells Fargo and Funds Management profitability analysis.
Funds Management reported on the methodologies and estimates used in calculating profitability. Among other things, the Board noted that the levels of profitability reported on a fund-by-fund basis varied widely, depending on factors such
| | | | |
| 34 | | Wells Fargo Diversified Capital Builder Fund | | Other information (unaudited) |
as the size and type of fund. Based on its review, the Board did not deem the profits reported by Funds Management or Wells Fargo from its services to the Fund to be at a level that would prevent it from approving the continuation of the Advisory Agreements.
Economies of scale
With respect to possible economies of scale, the Board noted the existence of breakpoints in the Fund’s management fee structure, which operate generally to reduce the Fund’s expense ratios as the Fund grows in size. It considered that, for a small fund or a fund that shrinks in size, breakpoints conversely can result in higher fee levels. The Board also considered that fee waiver and expense reimbursement arrangements and competitive fee rates at the outset are means of sharing potential economies of scale with shareholders of the Fund and the fund family as a whole. The Board considered Funds Management’s view that any analyses of potential economies of scale in managing a particular fund are inherently limited in light of the joint and common costs and investments that Funds Management incurs across the fund family as a whole.
The Board concluded that the Fund’s fee and expense arrangements, including contractual breakpoints, constituted a reasonable approach to sharing potential economies of scale with the Fund and its shareholders.
Other benefits to Funds Management and the Sub-Adviser
The Board received and considered information regarding potential “fall-out” or ancillary benefits received by Funds Management and its affiliates, including the Sub-Adviser, as a result of their relationships with the Fund. Ancillary benefits could include, among others, benefits directly attributable to other relationships with the Fund and benefits potentially derived from an increase in Funds Management’s and the Sub-Adviser’s business as a result of their relationships with the Fund. The Board noted that various affiliates of Funds Management may receive distribution-related fees, shareholder servicing payments and sub-transfer agency fees in respect of shares sold or held through them and services provided.
The Board also reviewed information about soft dollar credits earned and utilized by the Sub-Adviser, fees earned by Funds Management and the Sub-Adviser from managing a private investment vehicle for the fund family’s securities lending collateral and commissions earned by an affiliated broker from portfolio transactions.
Based on its consideration of the factors and information it deemed relevant, including those described here, the Board did not find that any ancillary benefits received by Funds Management and its affiliates, including the Sub-Adviser, were unreasonable.
Conclusion
At the Meeting, after considering the above-described factors and based on its deliberations and its evaluation of the information described above, the Board unanimously approved the continuation of the Advisory Agreements for a one-year term and determined that the compensation payable to Funds Management and the Sub-Adviser under each of the Advisory Agreements was reasonable.
| | | | | | |
| List of abbreviations | | Wells Fargo Diversified Capital Builder Fund | | | 35 | |
The following is a list of common abbreviations for terms and entities that may have appeared in this report.
| ACA | — ACA Financial Guaranty Corporation |
| ADR | — American depositary receipt |
| ADS | — American depositary shares |
| AGC | — Assured Guaranty Corporation |
| AGM | — Assured Guaranty Municipal |
| Ambac | — Ambac Financial Group Incorporated |
| AMT | — Alternative minimum tax |
| BAN | — Bond anticipation notes |
| BHAC | — Berkshire Hathaway Assurance Corporation |
| CAB | — Capital appreciation bond |
| CCAB | — Convertible capital appreciation bond |
| CDA | — Community Development Authority |
| CDO | — Collateralized debt obligation |
| DRIVER | — Derivative inverse tax-exempt receipts |
| DW&P | — Department of Water & Power |
| DWR | — Department of Water Resources |
| ECFA | — Educational & Cultural Facilities Authority |
| EDA | — Economic Development Authority |
| EDFA | — Economic Development Finance Authority |
| ETF | — Exchange-traded fund |
| FDIC | — Federal Deposit Insurance Corporation |
| FFCB | — Federal Farm Credit Banks |
| FGIC | — Financial Guaranty Insurance Corporation |
| FHA | — Federal Housing Administration |
| FHLB | — Federal Home Loan Bank |
| FHLMC | — Federal Home Loan Mortgage Corporation |
| FICO | — The Financing Corporation |
| FNMA | — Federal National Mortgage Association |
| GDR | — Global depositary receipt |
| GNMA | — Government National Mortgage Association |
| HCFR | — Healthcare facilities revenue |
| HEFA | — Health & Educational Facilities Authority |
| HEFAR | — Higher education facilities authority revenue |
| HFA | — Housing Finance Authority |
| HFFA | — Health Facilities Financing Authority |
| HUD | — Department of Housing and Urban Development |
| IDA | — Industrial Development Authority |
| IDAG | — Industrial Development Agency |
| KRW | — Republic of Korea won |
| LIBOR | — London Interbank Offered Rate |
| LIFER | — Long Inverse Floating Exempt Receipts |
| LLC | — Limited liability company |
| LLLP | — Limited liability limited partnership |
| LLP | — Limited liability partnership |
| MBIA | — Municipal Bond Insurance Association |
| MFHR | — Multifamily housing revenue |
| MSTR | — Municipal securities trust receipts |
| MUD | — Municipal Utility District |
| National | — National Public Finance Guarantee Corporation |
| PCFA | — Pollution Control Financing Authority |
| PCL | — Public Company Limited |
| PCR | — Pollution control revenue |
| PFA | — Public Finance Authority |
| PFFA | — Public Facilities Financing Authority |
| PFOTER | — Puttable floating option tax-exempt receipts |
| plc | — Public limited company |
| PUTTER | — Puttable tax-exempt receipts |
| R&D | — Research & development |
| Radian | — Radian Asset Assurance |
| RAN | — Revenue anticipation notes |
| RDA | — Redevelopment Authority |
| RDFA | — Redevelopment Finance Authority |
| REIT | — Real estate investment trust |
| ROC | — Reset option certificates |
| SAVRS | — Select auction variable rate securities |
| SBA | — Small Business Authority |
| SDR | — Swedish depositary receipt |
| SFHR | — Single-family housing revenue |
| SFMR | — Single-family mortgage revenue |
| SPA | — Standby purchase agreement |
| SPDR | — Standard & Poor’s Depositary Receipts |
| SPEAR | — Short Puttable Exempt Adjustable Receipts |
| STRIPS | — Separate trading of registered interest and |
| TAN | — Tax anticipation notes |
| TIPS | — Treasury inflation-protected securities |
| TRAN | — Tax revenue anticipation notes |
| TTFA | — Transportation Trust Fund Authority |
| TVA | — Tennessee Valley Authority |
This page is intentionally left blank.

For more information
More information about Wells Fargo Funds is available free upon request. To obtain literature, please write, email, visit the Fund’s website, or call:
Wells Fargo Funds
P.O. Box 8266
Boston, MA 02266-8266
Email: fundservice@wellsfargo.com
Website: wellsfargofunds.com
Individual investors: 1-800-222-8222
Retail investment professionals: 1-888-877-9275
Institutional investment professionals: 1-866-765-0778
This report and the financial statements contained herein are submitted for the general information of the shareholders of the Fund. If this report is used for promotional purposes, distribution of the report must be accompanied or preceded by a current prospectus. Before investing, please consider the investment objectives, risks, charges, and expenses of the investment. For a current prospectus and, if available, a summary prospectus, containing this information, call 1-800-222-8222 or visit the Fund’s website at wellsfargofunds.com. Read the prospectus carefully before you invest or send money.
Wells Fargo Asset Management (WFAM) is a trade name used by the asset management businesses of Wells Fargo & Company. Wells Fargo Funds Management, LLC, a wholly owned subsidiary of Wells Fargo & Company, provides investment advisory and administrative services for Wells Fargo Funds. Other affiliates of Wells Fargo & Company provide subadvisory and other services for the funds. The funds are distributed by Wells Fargo Funds Distributor, LLC, Member FINRA, an affiliate of Wells Fargo & Company. Neither Wells Fargo Funds Management nor Wells Fargo Funds Distributor has Fund customer accounts/assets, and neither provides investment advice/recommendations or acts as an investment advice fiduciary to any investor.
NOT FDIC INSURED ¡ NO BANK GUARANTEE ¡ MAY LOSE VALUE
© 2016 Wells Fargo Funds Management, LLC. All rights reserved.
| | |
 | | 246387 11-16 A225/AR225 09-16 |
Annual Report
September 30, 2016

Wells Fargo Diversified Income Builder Fund


Reduce clutter. Save trees.
Sign up for electronic delivery of prospectuses and shareholder reports at wellsfargo.com/advantagedelivery
Contents
The views expressed and any forward-looking statements are as of September 30, 2016, unless otherwise noted, and are those of the Fund managers and/or Wells Fargo Funds Management, LLC. Discussions of individual securities, or the markets generally, or any Wells Fargo Fund are not intended as individual recommendations. Future events or results may vary significantly from those expressed in any forward-looking statements. The views expressed are subject to change at any time in response to changing circumstances in the market. Wells Fargo Funds Management, LLC and the Fund disclaim any obligation to publicly update or revise any views expressed or forward-looking statements.
NOT FDIC INSURED ¡ NO BANK GUARANTEE ¡ MAY LOSE VALUE
| | | | |
| 2 | | Wells Fargo Diversified Income Builder Fund | | Letter to shareholders (unaudited) |

Karla M. Rabusch
President
Wells Fargo Funds
Even though the Fed raised its key rate during the period, it was a modest increase, and further rate hikes were not immediately forthcoming. As a result, market yields declined and bond prices rose.
Dear Shareholder:
We are pleased to offer you this annual report for the Wells Fargo Diversified Income Builder Fund for the 12-month period that ended September 30, 2016. During this period, which began October 1, 2015, both stock and fixed-income markets benefited from a combination of accommodative monetary policy, continued (if low) U.S. economic growth, and a moderate high-yield default rate outside of commodity-related sectors.
The U.S. economy achieved low but continued growth over the reporting period.
Toward the beginning of the reporting period, real U.S. gross domestic product (GDP) came in at a solid 2% year-over-year growth rate for the third quarter of 2015. Real GDP growth remained positive, even as it trailed off in subsequent quarters—falling below 1% in the fourth quarter of 2015 and the first quarter of 2016 and just topping 1% in the second quarter of 2016.
Global central bank policy remained accommodative.
The U.S. economy remained strong enough that in December 2015, the Federal Reserve (Fed) raised its target interest rate by 25 basis points (bps; 100 bps equals 1.00%) after keeping it near zero for seven years. However, the Fed clarified that future interest-rate increases would be gradual; as of the end of the reporting period, the Fed remained on hold. Other major central banks continued to pressure interest rates into historically low and even negative territory. In Europe, the European Central Bank (ECB) pushed its rate for banks’ excess reserves to -0.40% in March 2016 in an effort to encourage lending. In addition, the ECB kept its main refinancing rate at zero and continued to provide liquidity through an asset-purchasing program.
As a result of the favorable macroeconomic backdrop, fixed-income markets rallied across the board.
Even though the Fed raised its key rate during the period, it was a modest increase, and further rate hikes were not immediately forthcoming. As a result, market yields declined and bond prices rose. Since the end of the financial crisis, structural changes in the fixed-income markets have reduced trading liquidity (the degree to which assets can be bought or sold without affecting the price). New regulations and capital requirements have caused traditional liquidity suppliers (banks and broker/dealers) to be more risk averse and hold less inventory. Meanwhile, corporate debt issuance has spiked as companies finance themselves at record-low yields, bond mutual funds hold larger amounts of this new debt supply, trading volumes are lower, and large-size trades are more difficult to execute. However, fixed-income markets appeared to function well over the past year with sufficient liquidity. The Bloomberg Barclays U.S. Aggregate Bond Index,1 a proxy for the broad investment-grade market, returned 5.97%.
| 1 | The Bloomberg Barclays U.S. Aggregate Bond Index (formerly known as Barclays U.S. Aggregate Bond Index) is a broad-based benchmark that measures the investment-grade, U.S. dollar–denominated, fixed-rate taxable bond market, including Treasuries, government-related and corporate securities, mortgage-backed securities (agency fixed-rate and hybrid adjustable-rate mortgage pass-throughs), asset-backed securities, and commercial mortgage-backed securities. You cannot invest directly in an index. |
| | | | | | |
| Letter to shareholders (unaudited) | | Wells Fargo Diversified Income Builder Fund | | | 3 | |
Low global yields and a solid U.S. economy incented investors to take on additional risk by purchasing stocks and high-yield bonds. The high-yield bond market was further helped by the fact that the high-yield default rate remained low for non-commodity-related companies. Although Moody’s Investors Service, Incorporated, projected in July 2016 that the U.S. high-yield default rate could reach 6.4% by the end of 2016, much of that number came from metals and mining firms (10.2% projected default rate) and oil and gas companies (8.6% projected default rate). The Bloomberg Barclays U.S. Corporate High Yield Bond Index2 returned 12.73% for the period, and the S&P 500 Index,3 a proxy for large-cap stocks, returned 15.43%.
Don’t let short-term uncertainty derail long-term investment goals.
Periods of uncertainty can present challenges, but experience has taught us that maintaining long-term investment goals can be an effective way to plan for the future. To help you create a sound strategy based on your personal goals and risk tolerance, Wells Fargo Funds offers more than 100 mutual funds spanning a wide range of asset classes and investment styles. Although diversification cannot guarantee an investment profit or prevent losses, we believe it can be an effective way to manage investment risk and potentially smooth out overall portfolio performance. We encourage investors to know their investments and to understand that appropriate levels of risk-taking may unlock opportunities.
Thank you for choosing to invest in Wells Fargo Funds. We appreciate your confidence in us and remain committed to helping you meet your financial needs.
Sincerely,

Karla M. Rabusch
President
Wells Fargo Funds
Low global yields and a solid U.S. economy incented investors to take on additional risk by purchasing stocks and high-yield bonds.
For further information about your Fund, contact your investment professional, visit our website at wellsfargofunds.com, or call us directly at 1-800-222-8222. We are available 24 hours a day, 7 days a week.
| 2 | The Bloomberg Barclays U.S. Corporate High Yield Bond Index (formerly known as Barclays U.S. Corporate High Yield Bond Index) is an unmanaged, U.S. dollar–denominated, nonconvertible, non-investment-grade debt index. The index consists of domestic corporate bonds rated Ba and below with a minimum outstanding amount of $150 million. You cannot invest directly in an index. |
| 3 | The S&P 500 Index consists of 500 stocks chosen for market size, liquidity, and industry group representation. It is a market-value-weighted index with each stock’s weight in the index proportionate to its market value. You cannot invest directly in an index. |
| | | | |
| 4 | | Wells Fargo Diversified Income Builder Fund | | Performance highlights (unaudited) |
Investment objective
The Fund seeks long-term total return, consisting of current income and capital appreciation.
Manager
Wells Fargo Funds Management, LLC
Subadviser
Wells Capital Management Incorporated
Portfolio manager
Margaret Patel
Average annual total returns (%) as of September 30, 20161
| | | | | | | | | | | | | | | | | | | | | | | | | | | | | | | | | | |
| | | | | Including sales charge | | | Excluding sales charge | | | Expense ratios2 (%) | |
| | | Inception date | | 1 year | | | 5 year | | | 10 year | | | 1 year | | | 5 year | | | 10 year | | | Gross | | | Net3 | |
| Class A (EKSAX) | | 4-14-1987 | | | 8.73 | | | | 8.42 | | | | 5.00 | | | | 15.39 | | | | 9.71 | | | | 5.62 | | | | 1.07 | | | | 1.07 | |
| Class B (EKSBX)* | | 2-1-1993 | | | 9.49 | | | | 8.58 | | | | 5.07 | | | | 14.49 | | | | 8.87 | | | | 5.07 | | | | 1.82 | | | | 1.82 | |
| Class C (EKSCX) | | 2-1-1993 | | | 13.51 | | | | 8.88 | | | | 4.84 | | | | 14.51 | | | | 8.88 | | | | 4.84 | | | | 1.82 | | | | 1.82 | |
| Administrator Class (EKSDX) | | 7-30-2010 | | | – | | | | – | | | | – | | | | 15.45 | | | | 9.90 | | | | 5.74 | | | | 0.99 | | | | 0.90 | |
| Institutional Class (EKSYX) | | 1-13-1997 | | | – | | | | – | | | | – | | | | 15.88 | | | | 10.12 | | | | 5.95 | | | | 0.74 | | | | 0.71 | |
| Diversified Income Builder Blended Index4 | | – | | | – | | | | – | | | | – | | | | 13.40 | | | | 10.26 | | | | 7.59 | | | | – | | | | – | |
| BofA Merrill Lynch High Yield U.S. Corporates, Cash Pay Index5 | | – | | | – | | | | – | | | | – | | | | 12.79 | | | | 8.19 | | | | 7.51 | | | | – | | | | – | |
| Russell 1000® Index6 | | – | | | – | | | | – | | | | – | | | | 14.93 | | | | 16.41 | | | | 7.40 | | | | – | | | | – | |
| * | | Class B shares are closed to investment, except in connection with the reinvestment of any distributions and permitted exchanges. |
Figures quoted represent past performance, which is no guarantee of future results, and do not reflect taxes that a shareholder may pay on fund distributions or the redemption of fund shares. Investment return and principal value of an investment will fluctuate so that an investor’s shares, when redeemed, may be worth more or less than their original cost. Performance shown without sales charges would be lower if sales charges were reflected. Current performance may be lower or higher than the performance data quoted, which assumes the reinvestment of dividends and capital gains. Current month-end performance is available on the Fund’s website, wellsfargofunds.com.
Index returns do not include transaction costs associated with buying and selling securities, any mutual fund fees or expenses, or any taxes. It is not possible to invest directly in an index.
For Class A shares, the maximum front-end sales charge is 5.75%. For Class B shares, the maximum contingent deferred sales charge is 5.00%. For Class C shares, the maximum contingent deferred sales charge is 1.00%. Performance including a contingent deferred sales charge assumes the sales charge for the corresponding time period. Administrator Class and Institutional Class shares are sold without a front-end sales charge or contingent deferred sales charge.
Balanced funds may invest in stocks and bonds. Stock values fluctuate in response to the activities of individual companies and general market and economic conditions. Bond values fluctuate in response to the financial condition of individual issuers, general market and economic conditions, and changes in interest rates. Changes in market conditions and government policies may lead to periods of heightened volatility in the bond market and reduced liquidity for certain bonds held by the Fund. In general, when interest rates rise, bond values fall and investors may lose principal value. Interest-rate changes and their impact on the Fund and its share price can be sudden and unpredictable. Certain investment strategies tend to increase the total risk of an investment (relative to the broader market). The Fund is exposed to foreign investment risk, high-yield securities risk, and smaller-company securities risk. Consult the Fund’s prospectus for additional information on these and other risks.
Please see footnotes on page 5.
| | | | | | |
| Performance highlights (unaudited) | | Wells Fargo Diversified Income Builder Fund | | | 5 | |
|
| Growth of $10,000 investment as of September 30, 20167 |
|
 |
| 1 | Historical performance shown for Administrator Class shares prior to their inception reflects the performance of Institutional Class shares and has been adjusted to reflect the higher expenses applicable to Administrator Class shares. Historical performance shown for all classes of the Fund prior to July 12, 2010, is based on the performance of the Fund’s predecessor, Evergreen Diversified Income Builder Fund. |
| 2 | Reflects the expense ratios as stated in the most recent prospectuses. The expense ratios shown are subject to change and may differ from the annualized expense ratios shown in the financial highlights of this report. |
| 3 | The manager has contractually committed through January 31, 2017, to waive fees and/or reimburse expenses to the extent necessary to cap the Fund’s Total Annual Fund Operating Expenses After Fee Waiver at 1.08% for Class A, 1.83% for Class B, 1.83% for Class C, 0.90% for Administrator Class, and 0.71% for Institutional Class. After this time, the cap may be increased or the commitment to maintain the cap may be terminated only with the approval of the Board of Trustees. Brokerage commissions, stamp duty fees, interest, taxes, acquired fund fees and expenses, and extraordinary expenses are excluded from the expense cap. Without this cap, the Fund’s returns would have been lower. |
| 4 | Source: Wells Fargo Funds Management, LLC. The Diversified Income Builder Blended Index is composed of the BofA Merrill Lynch High Yield U.S. Corporates, Cash Pay Index (75%) and Russell 1000® Index (25%). You cannot invest directly in an index. |
| 5 | The BofA Merrill Lynch High Yield U.S. Corporates, Cash Pay Index is an unmanaged market index that provides a broad-based performance measure of the non-investment grade U.S. domestic bond index. You cannot invest directly in an index. |
| 6 | The Russell 1000® Index measures the performance of the 1,000 largest companies in the Russell 3000® Index, which represents approximately 92% of the total market capitalization of the Russell 3000® Index. You cannot invest directly in an index. |
| 7 | The chart compares the performance of Class A shares for the most recent ten years with the Diversified Income Builder Blended Index, BofA Merrill Lynch High Yield U.S. Corporates, Cash Pay Index, and the Russell 1000® Index. The chart assumes a hypothetical investment of $10,000 in Class A shares and reflects all operating expenses and assumes the maximum initial sales charge of 5.75%. |
| 8 | The ten largest holdings, excluding cash and cash equivalents, are calculated based on the value of the investments divided by total net assets of the Fund. Holdings are subject to change and may have changed since the date specified. |
| 9 | Amounts are calculated based on the total long-term investments of the Fund. These amounts are subject to change and may have changed since the date specified. |
| | | | |
| 6 | | Wells Fargo Diversified Income Builder Fund | | Performance highlights (unaudited) |
MANAGER’S DISCUSSION
Fund highlights
| n | | The Fund outperformed its benchmark, the Diversified Income Builder Blended Index, for the 12-month period that ended September 30, 2016. |
| n | | In the Fund’s bond portfolio, holdings in basic materials companies were considerable outperformers, as were selected energy bonds. Detractors from bond performance were in the pharmaceuticals, technology, and energy services sectors. |
| n | | In its stock holdings, the Fund benefited from our additions to the energy sector in the second half of the fiscal year, after having an underweight to the sector in the earlier part of the fiscal year. The Fund also gained relative performance from takeovers of four of its holdings. Equity detractors were in the information technology sector, as well as in the health care space, specifically pharmaceutical companies. |
Although high-yield bonds produced surprisingly strong double-digit returns, stocks outperformed high-yield bonds in a volatile period.
In the fixed-income market, fears of higher U.S. Treasury rates once again proved to be wrong, and longer-term bond yields declined in the fiscal year. To illustrate, interest rates as measured by the 10-year U.S. Treasury bond began the fiscal year at 2.04%, and ended the fiscal year at 1.60%. High-yield bond yields also fell over the period, resulting in notable capital gains for many bonds as measured by the BofA Merrill Lynch High Yield U.S. Corporates, Cash Pay Index, particularly in the hard-hit energy industry. Lower-rated bonds in general produced low double-digit returns across many sectors. High-yield bonds benefited not only from lower Treasury rates, but also from diminished concerns about a slowing economy and rising defaults. Investors’ increased risk appetites caused yields on high-yield bonds to decline more than the yields on comparable Treasuries.
In the stock market, the fiscal year was marked by short-term swings as measured by the Russell 1000® Index. After rising modestly through the fourth quarter of 2015, stock prices dropped sharply in the first two months of 2016, reflecting concerns about falling energy prices, lower economic growth, and the possibility of rising interest rates. After this period of uncertainty, the market advanced more or less steadily in the remainder of the fiscal year, as it became clear that the Federal Reserve was sensitive to market concerns about rising rates and would most likely move at a gradual pace. In addition, economic growth continued to advance, albeit at a relatively low rate compared to previous economic recoveries.
| | | | |
| Ten largest holdings (%) as of September 30, 20168 | |
National Fuel Gas Company, 4.90%, 12-1-2021 | | | 2.70 | |
Tronox Finance LLC, 6.38%, 8-15-2020 | | | 2.58 | |
TransDigm Group Incorporated, 6.38%, 6-15-2026 | | | 2.56 | |
Penske Auto Group Incorporated, 5.75%, 10-1-2022 | | | 2.34 | |
Kinder Morgan Incorporated | | | 2.22 | |
CommScope Incorporated, 5.50%, 6-15,2024 | | | 2.09 | |
Plains All American Pipeline LP | | | 2.03 | |
McGraw-Hill Global Education Holdings LLC, 7.88%, 5-15-2024 | | | 1.94 | |
Orbital ATK Incorporated, 5.50%, 10-1-2023 | | | 1.89 | |
Olin Corporation, 5.50%, 8-15-2022 | | | 1.79 | |
In the Fund’s fixed-income portfolio, we emphasized relatively high-quality high-yield bonds, believing that better-quality issues that were available for modestly lower yields represented superior investment value compared with higher-yielding, but lower-rated bonds. Fixed-income contributors included commodity chemical bonds Tronox Finance LLC, Rayonier Advanced Materials Products Incorporated, and Olin Corporation. Bonds of energy companies National Fuel Gas Company and Kinder Morgan Incorporated also contributed to outperformance. Bonds of Lear Corporation, a manufacturer of auto seating systems, were upgraded to investment grade and further aided relative results. Detractors included AMAG Pharmaceuticals Incorporated, energy services company Bristow Group Incorporated, and hard disk drive maker Seagate HDD.
Please see footnotes on page 5.
| | | | | | |
| Performance highlights (unaudited) | | Wells Fargo Diversified Income Builder Fund | | | 7 | |
|
| Portfolio allocation as of September 30, 20169 |
|
 |
We continue to focus on high-yield bonds of U.S.-based companies that have publicly issued common stock and that we judge to have competitive business positions and flexible balance sheets. We believe such companies could withstand a slowdown in their sales and profits or diminished access to credit should there be a reduction in liquidity provided by financial lenders. We continue to minimize exposure to the energy services and metals and mining sectors because these areas face continued challenges from declining demand and soft pricing for their products.
In the Fund’s stock portfolio, several energy names contributed to performance: Kinder Morgan, Plains All American Pipeline LP, and Columbia Pipeline Group
Incorporated (which was acquired by TransCanada Corporation). FEI Company, a technology company specializing in microscopes, contributed as a result of substantial price appreciation after its acquisition by Thermo Fisher Scientific Incorporated was announced. John Bean Technologies Corporation, a manufacturer of systems and products for the food-processing industry, was a significant outperformer. Several regulated utility companies also contributed, namely Sempra Energy, CMS Energy Corporation, Atmos Energy Corporation, and DTE Energy Company.
Our outlook remains one of cautious optimism.
While the pace of economic growth is low compared with previous recoveries after recessions, we believe the intrinsic dynamism, creativity, and basic strengths of the U.S. economy should provide opportunities for both the stock and high-yield bond markets over the next year. The housing and automobile sectors are on multiyear upswings. Slow but steady gains in employment should help stimulate demand for goods and services. Furthermore, the expansion of low-cost shale gas and petroleum liquids should continue to provide a boon to both businesses and consumers, improving the competitive positions of U.S. companies and offering some cost relief to consumers for utility and fuel costs. Despite current financial uncertainties, we believe the strong fundamentals of the U.S. economy will provide attractive investment potential for stocks over time.
In our view, the high-yield bond market may benefit from relatively attractive fundamentals—improving albeit slow business conditions, ample financial liquidity, and historically low default rates, excluding high-risk sectors such as commodities. We are cautious given that high-yield interest rates could rise against a backdrop of a slowing economy. However, with the currently wide yield differentials for high-yield versus investment grade bonds, we think high-yield bonds could provide enough income to compensate for their credit risks.
Please see footnotes on page 5.
| | | | |
| 8 | | Wells Fargo Diversified Income Builder Fund | | Fund expenses (unaudited) |
As a shareholder of the Fund, you incur two types of costs: (1) transaction costs, including sales charges (loads) on purchase payments and contingent deferred sales charges (if any) on redemptions and (2) ongoing costs, including management fees, distribution (12b-1) and/or shareholder servicing fees, and other Fund expenses. This example is intended to help you understand your ongoing costs (in dollars) of investing in the Fund and to compare these costs with the ongoing costs of investing in other mutual funds.
The example is based on an investment of $1,000 invested at the beginning of the six-month period and held for the entire period from April 1, 2016 to September 30, 2016.
Actual expenses
The “Actual” line of the table below provides information about actual account values and actual expenses. You may use the information in this line, together with the amount you invested, to estimate the expenses that you paid over the period. Simply divide your account value by $1,000 (for example, an $8,600 account value divided by $1,000 = 8.6), then multiply the result by the number in the “Actual” line under the heading entitled “Expenses paid during period” for your applicable class of shares to estimate the expenses you paid on your account during this period.
Hypothetical example for comparison purposes
The “Hypothetical” line of the table below provides information about hypothetical account values and hypothetical expenses based on the Fund’s actual expense ratio and an assumed rate of return of 5% per year before expenses, which is not the Fund’s actual return. The hypothetical account values and expenses may not be used to estimate the actual ending account balance or expenses you paid for the period. You may use this information to compare the ongoing costs of investing in the Fund and other funds. To do so, compare this 5% hypothetical example with the 5% hypothetical examples that appear in the shareholder reports of the other funds.
Please note that the expenses shown in the table are meant to highlight your ongoing costs only and do not reflect any transactional costs, such as sales charges (loads) and contingent deferred sales charges. Therefore, the “Hypothetical” line of the table is useful in comparing ongoing costs only and will not help you determine the relative total costs of owning different funds. In addition, if these transactional costs were included, your costs would have been higher.
| | | | | | | | | | | | | | | | |
| | | Beginning
account value
4-1-2016 | | | Ending
account value
9-30-2016 | | | Expenses
paid during
the period¹ | | | Annualized net
expense ratio | |
Class A | | | | | | | | | | | | | | | | |
Actual | | $ | 1,000.00 | | | $ | 1,086.90 | | | $ | 5.60 | | | | 1.07 | % |
Hypothetical (5% return before expenses) | | $ | 1,000.00 | | | $ | 1,019.63 | | | $ | 5.42 | | | | 1.07 | % |
Class B | | | | | | | | | | | | | | | | |
Actual | | $ | 1,000.00 | | | $ | 1,082.63 | | | $ | 9.49 | | | | 1.82 | % |
Hypothetical (5% return before expenses) | | $ | 1,000.00 | | | $ | 1,015.88 | | | $ | 9.19 | | | | 1.82 | % |
Class C | | | | | | | | | | | | | | | | |
Actual | | $ | 1,000.00 | | | $ | 1,082.75 | | | $ | 9.49 | | | | 1.82 | % |
Hypothetical (5% return before expenses) | | $ | 1,000.00 | | | $ | 1,015.88 | | | $ | 9.19 | | | | 1.82 | % |
Administrator Class | | | | | | | | | | | | | | | | |
Actual | | $ | 1,000.00 | | | $ | 1,087.51 | | | $ | 4.70 | | | | 0.90 | % |
Hypothetical (5% return before expenses) | | $ | 1,000.00 | | | $ | 1,020.50 | | | $ | 4.55 | | | | 0.90 | % |
Institutional Class | | | | | | | | | | | | | | | | |
Actual | | $ | 1,000.00 | | | $ | 1,090.46 | | | $ | 3.71 | | | | 0.71 | % |
Hypothetical (5% return before expenses) | | $ | 1,000.00 | | | $ | 1,021.45 | | | $ | 3.59 | | | | 0.71 | % |
| 1 | Expenses paid is equal to the annualized net expense ratio of each class multiplied by the average account value over the period, multiplied by the number of days in the most recent fiscal half-year divided by the number of days in the fiscal year (to reflect the one-half-year period). |
| | | | | | |
| Portfolio of investments—September 30, 2016 | | Wells Fargo Diversified Income Builder Fund | | | 9 | |
| | | | | | | | | | | | | | | | |
| Security name | | | | | | | | Shares | | | Value | |
| | | | |
Common Stocks: 25.69% | | | | | | | | | | | | | | | | |
| | | | |
Consumer Discretionary: 1.67% | | | | | | | | | | | | | | | | |
| | | | |
| Auto Components: 0.37% | | | | | | | | | | | | | | | | |
Gentex Corporation | | | | | | | | | | | 100,000 | | | $ | 1,756,000 | |
| | | | | | | | | | | | | | | | |
| | | | |
| Household Durables: 1.30% | | | | | | | | | | | | | | | | |
Harman International Industries Incorporated | | | | | | | | | | | 20,000 | | | | 1,689,000 | |
Leggett & Platt Incorporated | | | | | | | | | | | 65,000 | | | | 2,962,700 | |
Newell Rubbermaid Incorporated | | | | | | | | | | | 30,000 | | | | 1,579,800 | |
| | | | |
| | | | | | | | | | | | | | | 6,231,500 | |
| | | | | | | | | | | | | | | | |
| | | | |
Consumer Staples: 1.62% | | | | | | | | | | | | | | | | |
| | | | |
| Food Products: 0.88% | | | | | | | | | | | | | | | | |
ConAgra Foods Incorporated | | | | | | | | | | | 90,000 | | | | 4,239,900 | |
| | | | | | | | | | | | | | | | |
| | | | |
| Personal Products: 0.74% | | | | | | | | | | | | | | | | |
The Estee Lauder Companies Incorporated Class A | | | | | | | | | | | 40,000 | | | | 3,542,400 | |
| | | | | | | | | | | | | | | | |
| | | | |
Energy: 6.91% | | | | | | | | | | | | | | | | |
| | | | |
| Oil, Gas & Consumable Fuels: 6.91% | | | | | | | | | | | | | | | | |
Cabot Oil & Gas Corporation | | | | | | | | | | | 25,000 | | | | 645,000 | |
EOG Resources Incorporated | | | | | | | | | | | 5,000 | | | | 483,550 | |
EQT Corporation | | | | | | | | | | | 25,000 | | | | 1,815,500 | |
Kinder Morgan Incorporated | | | | | | | | | | | 460,000 | | | | 10,639,800 | |
Plains All American Pipeline LP | | | | | | | | | | | 310,000 | | | | 9,737,100 | |
Tesoro Logistics LP | | | | | | | | | | | 100,000 | | | | 4,844,000 | |
The Williams Companies Incorporated | | | | | | | | | | | 160,000 | | | | 4,916,800 | |
| | | | |
| | | | | | | | | | | | | | | 33,081,750 | |
| | | | | | | | | | | | | | | | |
| | | | |
Health Care: 1.30% | | | | | | | | | | | | | | | | |
| | | | |
| Biotechnology: 0.06% | | | | | | | | | | | | | | | | |
Shire plc ADR | | | | | | | | | | | 1,482 | | | | 287,301 | |
| | | | | | | | | | | | | | | | |
| | | | |
| Health Care Equipment & Supplies: 0.08% | | | | | | | | | | | | | | | | |
West Pharmaceutical Services Incorporated | | | | | | | | | | | 5,000 | | | | 372,500 | |
| | | | | | | | | | | | | | | | |
| | | | |
| Life Sciences Tools & Services: 0.49% | | | | | | | | | | | | | | | | |
Thermo Fisher Scientific Incorporated | | | | | | | | | | | 5,000 | | | | 795,300 | |
Waters Corporation † | | | | | | | | | | | 10,000 | | | | 1,584,900 | |
| | | | |
| | | | | | | | | | | | | | | 2,380,200 | |
| | | | | | | | | | | | | | | | |
| | | | |
| Pharmaceuticals: 0.67% | | | | | | | | | | | | | | | | |
Eli Lilly & Company | | | | | | | | | | | 40,000 | | | | 3,210,400 | |
| | | | | | | | | | | | | | | | |
| | | | |
Industrials: 3.47% | | | | | | | | | | | | | | | | |
| | | | |
| Aerospace & Defense: 2.21% | | | | | | | | | | | | | | | | |
Huntington Ingalls Industries Incorporated | | | | | | | | | | | 28,000 | | | | 4,295,760 | |
Raytheon Company | | | | | | | | | | | 25,000 | | | | 3,403,250 | |
TransDigm Group Incorporated † | | | | | | | | | | | 10,000 | | | | 2,891,200 | |
| | | | |
| | | | | | | | | | | | | | | 10,590,210 | |
| | | | | | | | | | | | | | | | |
The accompanying notes are an integral part of these financial statements.
| | | | |
| 10 | | Wells Fargo Diversified Income Builder Fund | | Portfolio of investments—September 30, 2016 |
| | | | | | | | | | | | | | | | |
| Security name | | | | | | | | Shares | | | Value | |
| | | | |
| Building Products: 0.09% | | | | | | | | | | | | | | | | |
Apogee Enterprises Incorporated | | | | | | | | | | | 10,000 | | | $ | 446,900 | |
| | | | | | | | | | | | | | | | |
| | | | |
| Machinery: 1.17% | | | | | | | | | | | | | | | | |
John Bean Technologies Corporation | | | | | | | | | | | 65,000 | | | | 4,585,750 | |
The Middleby Corporation † | | | | | | | | | | | 8,000 | | | | 988,960 | |
| | | | |
| | | | | | | | | | | | | | | 5,574,710 | |
| | | | | | | | | | | | | | | | |
| | | | |
Information Technology: 5.24% | | | | | | | | | | | | | | | | |
| | | | |
| Electronic Equipment, Instruments & Components: 0.41% | | | | | | | | | | | | | | | | |
Amphenol Corporation Class A | | | | | | | | | | | 20,000 | | | | 1,298,400 | |
Belden Incorporated | | | | | | | | | | | 10,000 | | | | 689,900 | |
| | | | |
| | | | | | | | | | | | | | | 1,988,300 | |
| | | | | | | | | | | | | | | | |
| | | | |
| Internet Software & Services: 0.39% | | | | | | | | | | | | | | | | |
Akamai Technologies Incorporated † | | | | | | | | | | | 35,000 | | | | 1,854,650 | |
| | | | | | | | | | | | | | | | |
| | | | |
| IT Services: 0.84% | | | | | | | | | | | | | | | | |
Leidos Holdings Incorporated | | | | | | | | | | | 65,000 | | | | 2,813,200 | |
NeuStar Incorporated Class A †« | | | | | | | | | | | 45,000 | | | | 1,196,550 | |
| | | | |
| | | | | | | | | | | | | | | 4,009,750 | |
| | | | | | | | | | | | | | | | |
| | | | |
| Semiconductors & Semiconductor Equipment: 2.91% | | | | | | | | | | | | | | | | |
Broadcom Limited | | | | | | | | | | | 37,000 | | | | 6,383,240 | |
Microsemi Corporation † | | | | | | | | | | | 70,000 | | | | 2,938,600 | |
Xilinx Incorporated | | | | | | | | | | | 85,000 | | | | 4,618,900 | |
| | | | |
| | | | | | | | | | | | | | | 13,940,740 | |
| | | | | | | | | | | | | | | | |
| | | | |
| Software: 0.57% | | | | | | | | | | | | | | | | |
Adobe Systems Incorporated † | | | | | | | | | | | 25,000 | | | | 2,713,500 | |
| | | | | | | | | | | | | | | | |
| | | | |
| Technology Hardware, Storage & Peripherals: 0.12% | | | | | | | | | | | | | | | | |
Western Digital Corporation | | | | | | | | | | | 10,000 | | | | 589,938 | |
| | | | | | | | | | | | | | | | |
| | | | |
Materials: 1.67% | | | | | | | | | | | | | | | | |
| | | | |
| Chemicals: 1.67% | | | | | | | | | | | | | | | | |
Celanese Corporation Series A | | | | | | | | | | | 120,000 | | | | 7,987,200 | |
| | | | | | | | | | | | | | | | |
| | | | |
Real Estate: 3.19% | | | | | | | | | | | | | | | | |
| | | | |
| Equity REITs: 3.19% | | | | | | | | | | | | | | | | |
Crown Castle International Corporation | | | | | | | | | | | 80,000 | | | | 7,536,800 | |
Equinix Incorporated | | | | | | | | | | | 15,000 | | | | 5,403,750 | |
Saul Centers Incorporated | | | | | | | | | | | 35,000 | | | | 2,331,000 | |
| | | | |
| | | | | | | | | | | | | | | 15,271,550 | |
| | | | | | | | | | | | | | | | |
| | | | |
Utilities: 0.62% | | | | | | | | | | | | | | | | |
| | | | |
| Gas Utilities: 0.62% | | | | | | | | | | | | | | | | |
Atmos Energy Corporation | | | | | | | | | | | 40,000 | | | | 2,978,800 | |
| | | | | | | | | | | | | | | | |
| | | | |
Total Common Stocks (Cost $111,524,727) | | | | | | | | | | | | | | | 123,048,199 | |
| | | | | | | | | | | | | | | | |
The accompanying notes are an integral part of these financial statements.
| | | | | | |
| Portfolio of investments—September 30, 2016 | | Wells Fargo Diversified Income Builder Fund | | | 11 | |
| | | | | | | | | | | | | | | | |
| Security name | | Interest rate | | | Maturity date | | | Principal | | | Value | |
| | | | |
Corporate Bonds and Notes: 65.51% | | | | | | | | | | | | | | | | |
| | | | |
Consumer Discretionary: 9.95% | | | | | | | | | | | | | | | | |
| | | | |
| Auto Components: 3.46% | | | | | | | | | | | | | | | | |
Dana Holding Corporation | | | 5.50 | % | | | 12-15-2024 | | | $ | 3,925,000 | | | $ | 3,993,688 | |
Lear Corporation | | | 4.75 | | | | 1-15-2023 | | | | 4,875,000 | | | | 5,076,094 | |
Lear Corporation | | | 5.25 | | | | 1-15-2025 | | | | 4,000,000 | | | | 4,340,000 | |
Lear Corporation | | | 5.38 | | | | 3-15-2024 | | | | 2,000,000 | | | | 2,147,500 | |
Tenneco Incorporated | | | 5.00 | | | | 7-15-2026 | | | | 1,000,000 | | | | 1,013,750 | |
| | | | |
| | | | | | | | | | | | | | | 16,571,032 | |
| | | | | | | | | | | | | | | | |
| | | | |
| Hotels, Restaurants & Leisure: 1.00% | | | | | | | | | | | | | | | | |
Speedway Motorsports Incorporated | | | 5.13 | | | | 2-1-2023 | | | | 4,700,000 | | | | 4,805,750 | |
| | | | | | | | | | | | | | | | |
| | | | |
| Household Durables: 0.27% | | | | | | | | | | | | | | | | |
Newell Brands Incorporated 144A | | | 5.00 | | | | 11-15-2023 | | | | 1,200,000 | | | | 1,277,796 | |
| | | | | | | | | | | | | | | | |
| | | | |
| Media: 1.94% | | | | | | | | | | | | | | | | |
McGraw-Hill Global Education Holdings LLC 144A | | | 7.88 | | | | 5-15-2024 | | | | 8,598,000 | | | | 9,285,840 | |
| | | | | | | | | | | | | | | | |
| | | | |
| Specialty Retail: 3.28% | | | | | | | | | | | | | | | | |
Group 1 Automotive Incorporated | | | 5.00 | | | | 6-1-2022 | | | | 4,453,000 | | | | 4,475,265 | |
Penske Auto Group Incorporated | | | 5.75 | | | | 10-1-2022 | | | | 10,813,000 | | | | 11,218,488 | |
| | | | |
| | | | | | | | | | | | | | | 15,693,753 | |
| | | | | | | | | | | | | | | | |
| | | | |
Consumer Staples: 1.51% | | | | | | | | | | | | | | | | |
| | | | |
| Beverages: 1.10% | | | | | | | | | | | | | | | | |
Constellation Brands Incorporated | | | 4.75 | | | | 11-15-2024 | | | | 4,850,000 | | | | 5,250,125 | |
| | | | | | | | | | | | | | | | |
| | | | |
| Food Products: 0.41% | | | | | | | | | | | | | | | | |
Post Holdings Incorporated 144A | | | 5.00 | | | | 8-15-2026 | | | | 2,000,000 | | | | 1,990,000 | |
| | | | | | | | | | | | | | | | |
| | | | |
Energy: 2.64% | | | | | | | | | | | | | | | | |
| | | | |
| Oil, Gas & Consumable Fuels: 2.64% | | | | | | | | | | | | | | | | |
Kinder Morgan Energy Partners LP | | | 4.30 | | | | 6-1-2025 | | | | 3,500,000 | | | | 3,639,584 | |
ONEOK Incorporated | | | 4.25 | | | | 2-1-2022 | | | | 2,000,000 | | | | 1,960,000 | |
ONEOK Incorporated | | | 7.50 | | | | 9-1-2023 | | | | 1,000,000 | | | | 1,120,000 | |
Plains All American Pipeline LP | | | 3.85 | | | | 10-15-2023 | | | | 2,345,000 | | | | 2,335,601 | |
Tennessee Gas Pipeline Company | | | 7.00 | | | | 3-15-2027 | | | | 3,000,000 | | | | 3,595,839 | |
| | | | |
| | | | | | | | | | | | | | | 12,651,024 | |
| | | | | | | | | | | | | | | | |
| | | | |
Health Care: 6.84% | | | | | | | | | | | | | | | | |
| | | | |
| Biotechnology: 0.38% | | | | | | | | | | | | | | | | |
AMAG Pharmaceuticals Incorporated 144A | | | 7.88 | | | | 9-1-2023 | | | | 1,900,000 | | | | 1,814,500 | |
| | | | | | | | | | | | | | | | |
| | | | |
| Health Care Equipment & Supplies: 1.08% | | | | | | | | | | | | | | | | |
Halyard Health Incorporated | | | 6.25 | | | | 10-15-2022 | | | | 1,000,000 | | | | 1,022,500 | |
Teleflex Incorporated | | | 4.88 | | | | 6-1-2026 | | | | 4,000,000 | | | | 4,140,000 | |
| | | | |
| | | | | | | | | | | | | | | 5,162,500 | |
| | | | | | | | | | | | | | | | |
The accompanying notes are an integral part of these financial statements.
| | | | |
| 12 | | Wells Fargo Diversified Income Builder Fund | | Portfolio of investments—September 30, 2016 |
| | | | | | | | | | | | | | | | |
| Security name | | Interest rate | | | Maturity date | | | Principal | | | Value | |
| | | | |
| Health Care Providers & Services: 3.66% | | | | | | | | | | | | | | | | |
AMN Healthcare Incorporated 144A%% | | | 5.13 | % | | | 10-1-2024 | | | $ | 1,500,000 | | | $ | 1,515,000 | |
DaVita HealthCare Partners Incorporated | | | 5.13 | | | | 7-15-2024 | | | | 3,000,000 | | | | 3,060,000 | |
HCA Incorporated | | | 5.25 | | | | 6-15-2026 | | | | 5,000,000 | | | | 5,312,500 | |
HCA Incorporated | | | 5.38 | | | | 2-1-2025 | | | | 5,500,000 | | | | 5,678,750 | |
HealthSouth Corporation | | | 5.13 | | | | 3-15-2023 | | | | 2,000,000 | | | | 1,995,000 | |
| | | | |
| | | | | | | | | | | | | | | 17,561,250 | |
| | | | | | | | | | | | | | | | |
| | | | |
| Health Care Technology: 0.22% | | | | | | | | | | | | | | | | |
Quintiles IMS Incorporated 144A | | | 5.00 | | | | 10-15-2026 | | | | 1,000,000 | | | | 1,040,000 | |
| | | | | | | | | | | | | | | | |
| | | | |
| Life Sciences Tools & Services: 1.50% | | | | | | | | | | | | | | | | |
Quintiles Transnational Corporation 144A | | | 4.88 | | | | 5-15-2023 | | | | 7,000,000 | | | | 7,192,500 | |
| | | | | | | | | | | | | | | | |
| | | | |
Industrials: 15.06% | | | | | | | | | | | | | | | | |
| | | | |
| Aerospace & Defense: 8.27% | | | | | | | | | | | | | | | | |
Huntington Ingalls Industries Incorporated 144A | | | 5.00 | | | | 11-15-2025 | | | | 8,000,000 | | | | 8,460,000 | |
Moog Incorporated 144A | | | 5.25 | | | | 12-1-2022 | | | | 5,500,000 | | | | 5,692,500 | |
Orbital ATK Incorporated | | | 5.50 | | | | 10-1-2023 | | | | 8,640,000 | | | | 9,050,400 | |
TransDigm Group Incorporated 144A | | | 6.38 | | | | 6-15-2026 | | | | 11,800,000 | | | | 12,242,500 | |
TransDigm Group Incorporated | | | 6.50 | | | | 5-15-2025 | | | | 4,000,000 | | | | 4,175,000 | |
| | | | |
| | | | | | | | | | | | | | | 39,620,400 | |
| | | | | | | | | | | | | | | | |
| | | | |
| Commercial Services & Supplies: 0.63% | | | | | | | | | | | | | | | | |
Clean Harbors Incorporated | | | 5.13 | | | | 6-1-2021 | | | | 2,922,000 | | | | 2,995,050 | |
| | | | | | | | | | | | | | | | |
| | | | |
| Machinery: 2.76% | | | | | | | | | | | | | | | | |
Actuant Corporation | | | 5.63 | | | | 6-15-2022 | | | | 1,165,000 | | | | 1,213,790 | |
Oshkosh Corporation | | | 5.38 | | | | 3-1-2022 | | | | 5,550,000 | | | | 5,841,375 | |
Oshkosh Corporation | | | 5.38 | | | | 3-1-2025 | | | | 3,675,000 | | | | 3,858,750 | |
SPX FLOW Incorporated 144A | | | 5.88 | | | | 8-15-2026 | | | | 2,253,000 | | | | 2,289,611 | |
| | | | |
| | | | | | | | | | | | | | | 13,203,526 | |
| | | | | | | | | | | | | | | | |
| | | | |
| Road & Rail: 0.62% | | | | | | | | | | | | | | | | |
The Hertz Corporation «144A | | | 5.50 | | | | 10-15-2024 | | | | 3,000,000 | | | | 2,985,000 | |
| | | | | | | | | | | | | | | | |
| | | | |
| Trading Companies & Distributors: 2.78% | | | | | | | | | | | | | | | | |
HD Supply Incorporated 144A | | | 5.75 | | | | 4-15-2024 | | | | 7,450,000 | | | | 7,822,500 | |
Wesco Distribution Incorporated 144A | | | 5.38 | | | | 6-15-2024 | | | | 5,474,000 | | | | 5,484,291 | |
| | | | |
| | | | | | | | | | | | | | | 13,306,791 | |
| | | | | | | | | | | | | | | | |
| | | | |
Information Technology: 11.01% | | | | | | | | | | | | | | | | |
| | | | |
| Communications Equipment: 2.09% | | | | | | | | | | | | | | | | |
CommScope Incorporated 144A | | | 5.50 | | | | 6-15-2024 | | | | 9,479,000 | | | | 10,000,345 | |
| | | | | | | | | | | | | | | | |
| | | | |
| Electronic Equipment, Instruments & Components: 2.48% | | | | | | | | | | | | | | | | |
Anixter International Incorporated | | | 5.13 | | | | 10-1-2021 | | | | 4,000,000 | | | | 4,185,000 | |
Belden Incorporated 144A | | | 5.25 | | | | 7-15-2024 | | | | 3,485,000 | | | | 3,537,275 | |
Belden Incorporated 144A | | | 5.50 | | | | 9-1-2022 | | | | 4,000,000 | | | | 4,170,000 | |
| | | | |
| | | | | | | | | | | | | | | 11,892,275 | |
| | | | | | | | | | | | | | | | |
The accompanying notes are an integral part of these financial statements.
| | | | | | |
| Portfolio of investments—September 30, 2016 | | Wells Fargo Diversified Income Builder Fund | | | 13 | |
| | | | | | | | | | | | | | | | |
| Security name | | Interest rate | | | Maturity date | | | Principal | | | Value | |
| | | | |
| IT Services: 1.40% | | | | | | | | | | | | | | | | |
NeuStar Incorporated «(i) | | | 4.50 | % | | | 1-15-2023 | | | $ | 7,500,000 | | | $ | 6,712,500 | |
| | | | | | | | | | | | | | | | |
| | | | |
| Semiconductors & Semiconductor Equipment: 2.75% | | | | | | | | | | | | | | | | |
Micron Technology Incorporated 144A | | | 5.25 | | | | 8-1-2023 | | | | 3,700,000 | | | | 3,626,000 | |
Micron Technology Incorporated | | | 5.50 | | | | 2-1-2025 | | | | 4,750,000 | | | | 4,655,000 | |
Micron Technology Incorporated 144A | | | 7.50 | | | | 9-15-2023 | | | | 1,000,000 | | | | 1,110,740 | |
Microsemi Corporation 144A | | | 9.13 | | | | 4-15-2023 | | | | 3,328,000 | | | | 3,793,920 | |
| | | | |
| | | | | | | | | | | | | | | 13,185,660 | |
| | | | | | | | | | | | | | | | |
| | | | |
| Software: 0.44% | | | | | | | | | | | | | | | | |
Nuance Communications Company 144A | | | 6.00 | | | | 7-1-2024 | | | | 2,000,000 | | | | 2,085,000 | |
| | | | | | | | | | | | | | | | |
| | | | |
| Technology Hardware, Storage & Peripherals: 1.85% | | | | | | | | | | | | | | | | |
Diebold Incorporated 144A | | | 8.50 | | | | 4-15-2024 | | | | 7,500,000 | | | | 7,771,875 | |
Western Digital Corporation 144A | | | 7.38 | | | | 4-1-2023 | | | | 1,000,000 | | | | 1,097,500 | |
| | | | |
| | | | | | | | | | | | | | | 8,869,375 | |
| | | | | | | | | | | | | | | | |
| | | | |
Materials: 13.04% | | | | | | | | | | | | | | | | |
| | | | |
| Chemicals: 6.52% | | | | | | | | | | | | | | | | |
A. Schulman Incorporated 144A | | | 6.88 | | | | 6-1-2023 | | | | 7,500,000 | | | | 7,575,000 | |
Olin Corporation | | | 5.50 | | | | 8-15-2022 | | | | 8,500,000 | | | | 8,585,000 | |
Rayonier Advanced Materials Products Incorporated 144A | | | 5.50 | | | | 6-1-2024 | | | | 8,945,000 | | | | 8,184,675 | |
Scotts Miracle-Gro Company 144A | | | 6.00 | | | | 10-15-2023 | | | | 6,000,000 | | | | 6,390,000 | |
Valvoline Incorporated 144A | | | 5.50 | | | | 7-15-2024 | | | | 500,000 | | | | 523,750 | |
| | | | |
| | | | | | | | | | | | | | | 31,258,425 | |
| | | | | | | | | | | | | | | | |
| | | | |
| Containers & Packaging: 3.49% | | | | | | | | | | | | | | | | |
Ball Corporation | | | 5.00 | | | | 3-15-2022 | | | | 2,500,000 | | | | 2,703,125 | |
Berry Plastics Corporation | | | 5.13 | | | | 7-15-2023 | | | | 2,500,000 | | | | 2,542,188 | |
Berry Plastics Corporation | | | 6.00 | | | | 10-15-2022 | | | | 5,100,000 | | | | 5,380,500 | |
Greif Incorporated | | | 7.75 | | | | 8-1-2019 | | | | 545,000 | | | | 611,763 | |
Sealed Air Corporation 144A | | | 5.25 | | | | 4-1-2023 | | | | 4,650,000 | | | | 4,952,250 | |
Sealed Air Corporation 144A | | | 5.50 | | | | 9-15-2025 | | | | 500,000 | | | | 536,250 | |
| | | | |
| | | | | | | | | | | | | | | 16,726,076 | |
| | | | | | | | | | | | | | | | |
| | | | |
| Metals & Mining: 3.03% | | | | | | | | | | | | | | | | |
Commercial Metals Company | | | 4.88 | | | | 5-15-2023 | | | | 2,150,000 | | | | 2,133,875 | |
Tronox Finance LLC | | | 6.38 | | | | 8-15-2020 | | | | 13,400,000 | | | | 12,361,500 | |
| | | | |
| | | | | | | | | | | | | | | 14,495,375 | |
| | | | | | | | | | | | | | | | |
| | | | |
Real Estate: 2.54% | | | | | | | | | | | | | | | | |
| | | | |
| Equity REITs: 2.54% | | | | | | | | | | | | | | | | |
Equinix Incorporated | | | 5.75 | | | | 1-1-2025 | | | | 1,500,000 | | | | 1,593,750 | |
Iron Mountain Incorporated 144A | | | 5.38 | | | | 6-1-2026 | | | | 5,000,000 | | | | 5,000,000 | |
Iron Mountain Incorporated | | | 5.75 | | | | 8-15-2024 | | | | 3,927,000 | | | | 4,034,993 | |
Sabra Health Care REIT Incorporated | | | 5.38 | | | | 6-1-2023 | | | | 1,500,000 | | | | 1,537,500 | |
| | | | |
| | | | | | | | | | | | | | | 12,166,243 | |
| | | | | | | | | | | | | | | | |
The accompanying notes are an integral part of these financial statements.
| | | | |
| 14 | | Wells Fargo Diversified Income Builder Fund | | Portfolio of investments—September 30, 2016 |
| | | | | | | | | | | | | | | | |
| Security name | | Interest rate | | | Maturity date | | | Principal | | | Value | |
| | | | |
Telecommunication Services: 0.22% | | | | | | | | | | | | | | | | |
| | | | |
| Diversified Telecommunication Services: 0.22% | | | | | | | | | | | | | | | | |
Level 3 Financing Incorporated 144A | | | 5.25 | % | | | 3-15-2026 | | | $ | 1,000,000 | | | $ | 1,032,500 | |
| | | | | | | | | | | | | | | | |
| | | | |
Utilities: 2.70% | | | | | | | | | | | | | | | | |
| | | | |
| Gas Utilities: 2.70% | | | | | | | | | | | | | | | | |
National Fuel Gas Company | | | 4.90 | | | | 12-1-2021 | | | | 12,000,000 | | | | 12,954,420 | |
| | | | | | | | | | | | | | | | |
| | | | |
Total Corporate Bonds and Notes (Cost $306,962,066) | | | | | | | | | | | | | | | 313,785,031 | |
| | | | | | | | | | | | | | | | |
| | | | |
Yankee Corporate Bonds and Notes: 7.08% | | | | | | | | | | | | | | | | |
| | | | |
Health Care: 1.12% | | | | | | | | | | | | | | | | |
| | | | |
| Pharmaceuticals: 1.12% | | | | | | | | | | | | | | | | |
Mallinckrodt plc 144A | | | 5.50 | | | | 4-15-2025 | | | | 5,655,000 | | | | 5,372,250 | |
| | | | | | | | | | | | | | | | |
| | | | |
Industrials: 2.28% | | | | | | | | | | | | | | | | |
| | | | |
| Electrical Equipment: 2.28% | | | | | | | | | | | | | | | | |
Sensata Technologies BV 144A | | | 4.88 | | | | 10-15-2023 | | | | 6,700,000 | | | | 6,968,000 | |
Sensata Technologies BV 144A | | | 5.63 | | | | 11-1-2024 | | | | 3,750,000 | | | | 3,960,934 | |
| | | | |
| | | | | | | | | | | | | | | 10,928,934 | |
| | | | | | | | | | | | | | | | |
| | | | |
Information Technology: 3.68% | | | | | | | | | | | | | | | | |
| | | | |
| Semiconductors & Semiconductor Equipment: 0.44% | | | | | | | | | | | | | | | | |
NXP Funding LLC 144A | | | 3.88 | | | | 9-1-2022 | | | | 2,000,000 | | | | 2,095,000 | |
| | | | | | | | | | | | | | | | |
| | | | |
| Technology Hardware, Storage & Peripherals: 3.24% | | | | | | | | | | | | | | | | |
Seagate HDD Cayman | | | 4.75 | | | | 6-1-2023 | | | | 8,500,000 | | | | 8,415,000 | |
Seagate HDD Cayman | | | 4.88 | | | | 6-1-2027 | | | | 8,000,000 | | | | 7,104,000 | |
| | | | |
| | | | | | | | | | | | | | | 15,519,000 | |
| | | | | | | | | | | | | | | | |
| | | | |
Total Yankee Corporate Bonds and Notes (Cost $33,326,409) | | | | | | | | | | | | | | | 33,915,184 | |
| | | | | | | | | | | | | | | | |
| | | | |
| | | Yield | | | | | | Shares | | | | |
| Short-Term Investments: 1.93% | | | | | | | | | | | | | | | | |
| | | | |
| Investment Companies: 1.93% | | | | | | | | | | | | | | | | |
Securities Lending Cash Investments LLC (l)(r)(u) | | | 0.65 | | | | | | | | 6,023,805 | | | | 6,023,805 | |
Wells Fargo Government Money Market Fund Select Class (l)(u)## | | | 0.34 | | | | | | | | 3,232,384 | | | | 3,232,384 | |
| | | | |
Total Short-Term Investments (Cost $9,256,189) | | | | | | | | | | | | | | | 9,256,189 | |
| | | | | | | | | | | | | | | | |
| | | | | | | | |
| Total investments in securities (Cost $461,069,391) * | | | 100.21 | % | | | 480,004,603 | |
Other assets and liabilities, net | | | (0.21 | ) | | | (1,019,641 | ) |
| | | | | | | | |
| Total net assets | | | 100.00 | % | | $ | 478,984,962 | |
| | | | | | | | |
The accompanying notes are an integral part of these financial statements.
| | | | | | |
| Portfolio of investments—September 30, 2016 | | Wells Fargo Diversified Income Builder Fund | | | 15 | |
| † | Non-income-earning security |
| « | All or a portion of this security is on loan. |
| 144A | The security may be resold in transactions exempt from registration, normally to qualified institutional buyers, pursuant to Rule 144A under the Securities Act of 1933. |
| %% | The security is issued on a when-issued basis. |
| (i) | Illiquid security for which the designation as illiquid is unaudited. |
| (l) | The issuer of the security is an affiliated person of the Fund as defined in the Investment Company Act of 1940. |
| (r) | The investment is a non-registered investment vehicle purchased with cash collateral received from securities on loan. |
| (u) | The rate represents the 7-day annualized yield at period end. |
| ## | All or a portion of this security is segregated for when-issued securities. |
| * | Cost for federal income tax purposes is $461,069,391 and unrealized gains (losses) consists of: |
| | | | |
Gross unrealized gains | | $ | 23,367,287 | |
Gross unrealized losses | | | (4,432,075 | ) |
| | | | |
Net unrealized gains | | $ | 18,935,212 | |
The accompanying notes are an integral part of these financial statements.
| | | | |
| 16 | | Wells Fargo Diversified Income Builder Fund | | Statement of assets and liabilities—September 30, 2016 |
| | | | |
| | | | |
| |
Assets | | | | |
Investments | | | | |
In unaffiliated securities (including $5,907,028 of securities loaned), at value (cost $451,813,202) | | $ | 470,748,414 | |
In affiliated securities, at value (cost $9,256,189) | | | 9,256,189 | |
| | | | |
Total investments, at value (cost $461,069,391) | | | 480,004,603 | |
Receivable for investments sold | | | 7,239,921 | |
Receivable for Fund shares sold | | | 1,818,558 | |
Receivable for dividends and interest | | | 6,085,530 | |
Receivable for securities lending income | | | 4,807 | |
Prepaid expenses and other assets | | | 81,382 | |
| | | | |
Total assets | | | 495,234,801 | |
| | | | |
| |
Liabilities | | | | |
Dividends payable | | | 155,458 | |
Payable for investments purchased | | | 8,333,425 | |
Payable for Fund shares redeemed | | | 1,239,031 | |
Payable upon receipt of securities loaned | | | 6,023,805 | |
Management fee payable | | | 217,452 | |
Distribution fees payable | | | 83,456 | |
Administration fees payable | | | 72,966 | |
Accrued expenses and other liabilities | | | 124,246 | |
| | | | |
Total liabilities | | | 16,249,839 | |
| | | | |
Total net assets | | $ | 478,984,962 | |
| | | | |
| |
NET ASSETS CONSIST OF | | | | |
Paid-in capital | | $ | 456,747,620 | |
Overdistributed net investment income | | | (168,444 | ) |
Accumulated net realized gains on investments | | | 3,470,574 | |
Net unrealized gains on investments | | | 18,935,212 | |
| | | | |
Total net assets | | $ | 478,984,962 | |
| | | | |
| |
COMPUTATION OF NET ASSET VALUE AND OFFERING PRICE PER SHARE | | | | |
Net assets – Class A | | $ | 154,496,325 | |
Shares outstanding – Class A1 | | | 25,216,024 | |
Net asset value per share – Class A | | | $6.13 | |
Maximum offering price per share – Class A2 | | | $6.50 | |
Net assets – Class B | | $ | 466,316 | |
Shares outstanding – Class B1 | | | 75,800 | |
Net asset value per share – Class B | | | $6.15 | |
Net assets – Class C | | $ | 129,855,665 | |
Shares outstanding – Class C1 | | | 21,147,824 | |
Net asset value per share – Class C | | | $6.14 | |
Net assets – Administrator Class | | $ | 70,051,151 | |
Shares outstanding – Administrator Class1 | | | 11,670,387 | |
Net asset value per share – Administrator Class | | | $6.00 | |
Net assets – Institutional Class | | $ | 124,115,505 | |
Shares outstanding – Institutional Class1 | | | 20,699,717 | |
Net asset value per share – Institutional Class | | | $6.00 | |
| 1 | The Fund has an unlimited number of authorized shares. |
| 2 | Maximum offering price is computed as 100/94.25 of net asset value. On investments of $50,000 or more, the offering price is reduced. |
The accompanying notes are an integral part of these financial statements.
| | | | | | |
| Statement of operations—year ended September 30, 2016 | | Wells Fargo Diversified Income Builder Fund | | | 17 | |
| | | | |
| | | | |
| |
Investment income | | | | |
Interest | | $ | 16,112,207 | |
Dividends | | | 1,683,480 | |
Securities lending income, net | | | 72,428 | |
Income from affiliated securities | | | 25,617 | |
| | | | |
Total investment income | | | 17,893,732 | |
| | | | |
| |
Expenses | | | | |
Management fee | | | 2,127,264 | |
Administration fees | | | | |
Class A | | | 285,756 | |
Class B | | | 2,029 | |
Class C | | | 238,075 | |
Administrator Class | | | 59,451 | |
Institutional Class | | | 117,825 | |
Shareholder servicing fees | | | | |
Class A | | | 340,186 | |
Class B | | | 2,416 | |
Class C | | | 283,422 | |
Administrator Class | | | 114,001 | |
Distribution fees | | | | |
Class B | | | 7,247 | |
Class C | | | 850,266 | |
Custody and accounting fees | | | 28,481 | |
Professional fees | | | 58,538 | |
Registration fees | | | 109,388 | |
Shareholder report expenses | | | 46,972 | |
Trustees’ fees and expenses | | | 15,283 | |
Other fees and expenses | | | 11,067 | |
| | | | |
Total expenses | | | 4,697,667 | |
Less: Fee waivers and/or expense reimbursements | | | (89,422 | ) |
| | | | |
Net expenses | | | 4,608,245 | |
| | | | |
Net investment income | | | 13,285,487 | |
| | | | |
| |
REALIZED AND UNREALIZED GAINS (LOSSES) ON INVESTMENTS | | | | |
Net realized gains on investments | | | 3,608,586 | |
Net change in unrealized gains (losses) on investments | | | 38,971,424 | |
| | | | |
Net realized and unrealized gains (losses) on investments | | | 42,580,010 | |
| | | | |
Net increase in net assets resulting from operations | | $ | 55,865,497 | |
| | | | |
The accompanying notes are an integral part of these financial statements.
| | | | |
| 18 | | Wells Fargo Diversified Income Builder Fund | | Statement of changes in net assets |
| | | | | | | | | | | | | | | | |
| | | Year ended
September 30, 2016 | | | Year ended
September 30, 2015 | |
| | | | |
Operations | | | | | | | | | | | | | | | | |
Net investment income | | | | | | $ | 13,285,487 | | | | | | | $ | 11,987,706 | |
Net realized gains on investments | | | | | | | 3,608,586 | | | | | | | | 12,354,202 | |
Net change in unrealized gains (losses) on investments | | | | | | | 38,971,424 | | | | | | | | (31,717,824 | ) |
| | | | |
Net increase (decrease) in net assets resulting from operations | | | | | | | 55,865,497 | | | | | | | | (7,375,916 | ) |
| | | | |
| | | | |
Distributions to shareholders from | | | | | | | | | | | | | | | | |
Net investment income | | | | | | | | | | | | | | | | |
Class A | | | | | | | (4,830,169 | ) | | | | | | | (4,749,720 | ) |
Class B | | | | | | | (26,929 | ) | | | | | | | (63,936 | ) |
Class C | | | | | | | (3,170,739 | ) | | | | | | | (3,030,262 | ) |
Administrator Class | | | | | | | (1,702,969 | ) | | | | | | | (1,676,989 | ) |
Institutional Class | | | | | | | (3,550,714 | ) | | | | | | | (2,456,799 | ) |
Net realized gains | | | | | | | | | | | | | | | | |
Class A | | | | | | | (4,558,034 | ) | | | | | | | (7,807,842 | ) |
Class B | | | | | | | (41,594 | ) | | | | | | | (161,998 | ) |
Class C | | | | | | | (3,924,833 | ) | | | | | | | (6,201,022 | ) |
Administrator Class | | | | | | | (1,131,639 | ) | | | | | | | (2,904,026 | ) |
Institutional Class | | | | | | | (2,810,835 | ) | | | | | | | (3,326,577 | ) |
| | | | |
Total distributions to shareholders | | | | | | | (25,748,455 | ) | | | | | | | (32,379,171 | ) |
| | | | |
| | | | |
Capital share transactions | | | Shares | | | | | | | | Shares | | | | | |
Proceeds from shares sold | | | | | | | | | | | | | | | | |
Class A | | | 7,444,175 | | | | 43,402,347 | | | | 4,241,152 | | | | 26,154,843 | |
Class B | | | 9,699 | | | | 56,089 | | | | 23,198 | | | | 143,786 | |
Class C | | | 5,591,017 | | | | 32,728,412 | | | | 3,886,301 | | | | 23,984,622 | |
Administrator Class | | | 10,156,014 | | | | 57,752,782 | | | | 4,464,133 | | | | 26,956,519 | |
Institutional Class | | | 12,005,792 | | | | 68,220,100 | | | | 7,757,218 | | | | 46,139,832 | |
| | | | |
| | | | | | | 202,159,730 | | | | | | | | 123,379,602 | |
| | | | |
Reinvestment of distributions | | | | | | | | | | | | | | | | |
Class A | | | 1,540,577 | | | | 8,715,930 | | | | 1,878,275 | | | | 11,337,103 | |
Class B | | | 8,851 | | | | 49,757 | | | | 30,536 | | | | 185,089 | |
Class C | | | 1,039,282 | | | | 5,870,456 | | | | 1,238,763 | | | | 7,487,729 | |
Administrator Class | | | 501,237 | | | | 2,803,982 | | | | 626,804 | | | | 3,713,014 | |
Institutional Class | | | 916,214 | | | | 5,097,329 | | | | 930,533 | | | | 5,503,062 | |
| | | | |
| | | | | | | 22,537,454 | | | | | | | | 28,225,997 | |
| | | | |
Payment for shares redeemed | | | | | | | | | | | | | | | | |
Class A | | | (6,057,888 | ) | | | (35,108,089 | ) | | | (6,277,811 | ) | | | (38,460,578 | ) |
Class B | | | (186,708 | ) | | | (1,095,883 | ) | | | (318,762 | ) | | | (1,971,499 | ) |
Class C | | | (4,790,025 | ) | | | (27,491,552 | ) | | | (3,207,318 | ) | | | (19,688,593 | ) |
Administrator Class | | | (4,588,670 | ) | | | (25,939,656 | ) | | | (7,273,755 | ) | | | (43,352,349 | ) |
Institutional Class | | | (6,093,878 | ) | | | (34,215,881 | ) | | | (4,599,131 | ) | | | (27,541,817 | ) |
| | | | |
| | | | | | | (123,851,061 | ) | | | | | | | (131,014,836 | ) |
| | | | |
Net increase in net assets resulting from capital share transactions | | | | | | | 100,846,123 | | | | | | | | 20,590,763 | |
| | | | |
Total increase (decrease) in net assets | | | | | | | 130,963,165 | | | | | | | | (19,164,324 | ) |
| | | | |
| | | | |
Net assets | | | | | | | | | | | | | | | | |
Beginning of period | | | | | | | 348,021,797 | | | | | | | | 367,186,121 | |
| | | | |
End of period | | | | | | $ | 478,984,962 | | | | | | | $ | 348,021,797 | |
| | | | |
Overdistributed net investment income | | | | | | $ | (168,444 | ) | | | | | | $ | (145,081 | ) |
| | | | |
The accompanying notes are an integral part of these financial statements.
| | | | | | |
| Financial highlights | | Wells Fargo Diversified Income Builder Fund | | | 19 | |
(For a share outstanding throughout each period)
| | | | | | | | | | | | | | | | | | | | |
| | | Year ended September 30 | |
| CLASS A | | 2016 | | | 2015 | | | 2014 | | | 2013 | | | 2012 | |
Net asset value, beginning of period | | | $5.71 | | | | $6.37 | | | | $6.13 | | | | $6.00 | | | | $5.26 | |
Net investment income | | | 0.20 | | | | 0.21 | | | | 0.23 | | | | 0.25 | | | | 0.28 | |
Net realized and unrealized gains (losses) on investments | | | 0.64 | | | | (0.31 | ) | | | 0.38 | | | | 0.13 | | | | 0.74 | |
| | | | | | | | | | | | | | | | | | | | |
Total from investment operations | | | 0.84 | | | | (0.10 | ) | | | 0.61 | | | | 0.38 | | | | 1.02 | |
Distributions to shareholders from | | | | | | | | | | | | | | | | | | | | |
Net investment income | | | (0.21 | ) | | | (0.21 | ) | | | (0.23 | ) | | | (0.25 | ) | | | (0.28 | ) |
Net realized gains | | | (0.21 | ) | | | (0.35 | ) | | | (0.14 | ) | | | 0.00 | | | | 0.00 | |
| | | | | | | | | | | | | | | | | | | | |
Total distributions to shareholders | | | (0.42 | ) | | | (0.56 | ) | | | (0.37 | ) | | | (0.25 | ) | | | (0.28 | ) |
Net asset value, end of period | | | $6.13 | | | | $5.71 | | | | $6.37 | | | | $6.13 | | | | $6.00 | |
Total return1 | | | 15.39 | % | | | (1.92 | )% | | | 10.13 | % | | | 6.37 | % | | | 19.86 | % |
Ratios to average net assets (annualized) | | | | | | | | | | | | | | | | | | | | |
Gross expenses | | | 1.08 | % | | | 1.11 | % | | | 1.13 | % | | | 1.12 | % | | | 1.14 | % |
Net expenses | | | 1.08 | % | | | 1.08 | % | | | 1.08 | % | | | 1.08 | % | | | 1.08 | % |
Net investment income | | | 3.55 | % | | | 3.38 | % | | | 3.60 | % | | | 4.03 | % | | | 4.93 | % |
Supplemental data | | | | | | | | | | | | | | | | | | | | |
Portfolio turnover rate | | | 38 | % | | | 63 | % | | | 52 | % | | | 60 | % | | | 72 | % |
Net assets, end of period (000s omitted) | | | $154,496 | | | | $127,242 | | | | $143,062 | | | | $159,229 | | | | $145,156 | |
| 1 | Total return calculations do not include any sales charges. |
The accompanying notes are an integral part of these financial statements.
| | | | |
| 20 | | Wells Fargo Diversified Income Builder Fund | | Financial highlights |
(For a share outstanding throughout each period)
| | | | | | | | | | | | | | | | | | | | |
| | | Year ended September 30 | |
| CLASS B | | 2016 | | | 2015 | | | 2014 | | | 2013 | | | 2012 | |
Net asset value, beginning of period | | | $5.73 | | | | $6.40 | | | | $6.15 | | | | $6.02 | | | | $5.28 | |
Net investment income | | | 0.16 | 1 | | | 0.16 | 1 | | | 0.18 | 1 | | | 0.21 | 1 | | | 0.24 | 1 |
Net realized and unrealized gains (losses) on investments | | | 0.63 | | | | (0.32 | ) | | | 0.39 | | | | 0.12 | | | | 0.74 | |
| | | | | | | | | | | | | | | | | | | | |
Total from investment operations | | | 0.79 | | | | (0.16 | ) | | | 0.57 | | | | 0.33 | | | | 0.98 | |
Distributions to shareholders from | | | | | | | | | | | | | | | | | | | | |
Net investment income | | | (0.16 | ) | | | (0.16 | ) | | | (0.18 | ) | | | (0.20 | ) | | | (0.24 | ) |
Net realized gains | | | (0.21 | ) | | | (0.35 | ) | | | (0.14 | ) | | | 0.00 | | | | 0.00 | |
| | | | | | | | | | | | | | | | | | | | |
Total distributions to shareholders | | | (0.37 | ) | | | (0.51 | ) | | | (0.32 | ) | | | (0.20 | ) | | | (0.24 | ) |
Net asset value, end of period | | | $6.15 | | | | $5.73 | | | | $6.40 | | | | $6.15 | | | | $6.02 | |
Total return2 | | | 14.49 | % | | | (2.80 | )% | | | 9.46 | % | | | 5.57 | % | | | 18.92 | % |
Ratios to average net assets (annualized) | | | | | | | | | | | | | | | | | | | | |
Gross expenses | | | 1.83 | % | | | 1.86 | % | | | 1.88 | % | | | 1.87 | % | | | 1.88 | % |
Net expenses | | | 1.83 | % | | | 1.83 | % | | | 1.83 | % | | | 1.83 | % | | | 1.83 | % |
Net investment income | | | 2.80 | % | | | 2.65 | % | | | 2.86 | % | | | 3.31 | % | | | 4.21 | % |
Supplemental data | | | | | | | | | | | | | | | | | | | | |
Portfolio turnover rate | | | 38 | % | | | 63 | % | | | 52 | % | | | 60 | % | | | 72 | % |
Net assets, end of period (000s omitted) | | | $466 | | | | $1,398 | | | | $3,256 | | | | $4,557 | | | | $6,449 | |
| 1 | Calculated based upon average shares outstanding |
| 2 | Total return calculations do not include any sales charges. |
The accompanying notes are an integral part of these financial statements.
| | | | | | |
| Financial highlights | | Wells Fargo Diversified Income Builder Fund | | | 21 | |
(For a share outstanding throughout each period)
| | | | | | | | | | | | | | | | | | | | |
| | | Year ended September 30 | |
| CLASS C | | 2016 | | | 2015 | | | 2014 | | | 2013 | | | 2012 | |
Net asset value, beginning of period | | | $5.72 | | | | $6.39 | | | | $6.14 | | | | $6.01 | | | | $5.27 | |
Net investment income | | | 0.16 | 1 | | | 0.16 | 1 | | | 0.18 | | | | 0.20 | | | | 0.24 | |
Net realized and unrealized gains (losses) on investments | | | 0.63 | | | | (0.32 | ) | | | 0.39 | | | | 0.13 | | | | 0.74 | |
| | | | | | | | | | | | | | | | | | | | |
Total from investment operations | | | 0.79 | | | | (0.16 | ) | | | 0.57 | | | | 0.33 | | | | 0.98 | |
Distributions to shareholders from | | | | | | | | | | | | | | | | | | | | |
Net investment income | | | (0.16 | ) | | | (0.16 | ) | | | (0.18 | ) | | | (0.20 | ) | | | (0.24 | ) |
Net realized gains | | | (0.21 | ) | | | (0.35 | ) | | | (0.14 | ) | | | 0.00 | | | | 0.00 | |
| | | | | | | | | | | | | | | | | | | | |
Total distributions to shareholders | | | (0.37 | ) | | | (0.51 | ) | | | (0.32 | ) | | | (0.20 | ) | | | (0.24 | ) |
Net asset value, end of period | | | $6.14 | | | | $5.72 | | | | $6.39 | | | | $6.14 | | | | $6.01 | |
Total return2 | | | 14.51 | % | | | (2.81 | )% | | | 9.47 | % | | | 5.58 | % | | | 18.94 | % |
Ratios to average net assets (annualized) | | | | | | | | | | | | | | | | | | | | |
Gross expenses | | | 1.83 | % | | | 1.86 | % | | | 1.88 | % | | | 1.87 | % | | | 1.89 | % |
Net expenses | | | 1.83 | % | | | 1.83 | % | | | 1.83 | % | | | 1.83 | % | | | 1.83 | % |
Net investment income | | | 2.80 | % | | | 2.62 | % | | | 2.85 | % | | | 3.29 | % | | | 4.18 | % |
Supplemental data | | | | | | | | | | | | | | | | | | | | |
Portfolio turnover rate | | | 38 | % | | | 63 | % | | | 52 | % | | | 60 | % | | | 72 | % |
Net assets, end of period (000s omitted) | | | $129,856 | | | | $110,457 | | | | $111,045 | | | | $112,113 | | | | $114,896 | |
| 1 | Calculated based upon average shares outstanding |
| 2 | Total return calculations do not include any sales charges. |
The accompanying notes are an integral part of these financial statements.
| | | | |
| 22 | | Wells Fargo Diversified Income Builder Fund | | Financial highlights |
(For a share outstanding throughout each period)
| | | | | | | | | | | | | | | | | | | | |
| | | Year ended September 30 | |
| ADMINISTRATOR CLASS | | 2016 | | | 2015 | | | 2014 | | | 2013 | | | 2012 | |
Net asset value, beginning of period | | | $5.60 | | | | $6.25 | | | | $6.01 | | | | $5.89 | | | | $5.16 | |
Net investment income | | | 0.21 | 1 | | | 0.21 | 1 | | | 0.24 | | | | 0.26 | | | | 0.28 | |
Net realized and unrealized gains (losses) on investments | | | 0.61 | | | | (0.30 | ) | | | 0.38 | | | | 0.12 | | | | 0.74 | |
| | | | | | | | | | | | | | | | | | | | |
Total from investment operations | | | 0.82 | | | | (0.09 | ) | | | 0.62 | | | | 0.38 | | | | 1.02 | |
Distributions to shareholders from | | | | | | | | | | | | | | | | | | | | |
Net investment income | | | (0.21 | ) | | | (0.21 | ) | | | (0.24 | ) | | | (0.26 | ) | | | (0.29 | ) |
Net realized gains | | | (0.21 | ) | | | (0.35 | ) | | | (0.14 | ) | | | 0.00 | | | | 0.00 | |
| | | | | | | | | | | | | | | | | | | | |
Total distributions to shareholders | | | (0.42 | ) | | | (0.56 | ) | | | (0.38 | ) | | | (0.26 | ) | | | (0.29 | ) |
Net asset value, end of period | | | $6.00 | | | | $5.60 | | | | $6.25 | | | | $6.01 | | | | $5.89 | |
Total return | | | 15.45 | % | | | (1.69 | )% | | | 10.46 | % | | | 6.43 | % | | | 20.15 | % |
Ratios to average net assets (annualized) | | | | | | | | | | | | | | | | | | | | |
Gross expenses | | | 1.00 | % | | | 0.97 | % | | | 0.96 | % | | | 0.96 | % | | | 0.97 | % |
Net expenses | | | 0.90 | % | | | 0.90 | % | | | 0.90 | % | | | 0.90 | % | | | 0.90 | % |
Net investment income | | | 3.72 | % | | | 3.56 | % | | | 3.77 | % | | | 4.21 | % | | | 5.10 | % |
Supplemental data | | | | | | | | | | | | | | | | | | | | |
Portfolio turnover rate | | | 38 | % | | | 63 | % | | | 52 | % | | | 60 | % | | | 72 | % |
Net assets, end of period (000s omitted) | | | $70,051 | | | | $31,367 | | | | $48,690 | | | | $43,135 | | | | $35,727 | |
| 1 | Calculated based upon average shares outstanding |
The accompanying notes are an integral part of these financial statements.
| | | | | | |
| Financial highlights | | Wells Fargo Diversified Income Builder Fund | | | 23 | |
(For a share outstanding throughout each period)
| | | | | | | | | | | | | | | | | | | | |
| | | Year ended September 30 | |
| INSTITUTIONAL CLASS | | 2016 | | | 2015 | | | 2014 | | | 2013 | | | 2012 | |
Net asset value, beginning of period | | | $5.59 | | | | $6.25 | | | | $6.01 | | | | $5.88 | | | | $5.16 | |
Net investment income | | | 0.23 | | | | 0.24 | | | | 0.25 | 1 | | | 0.27 | 1 | | | 0.30 | 1 |
Net realized and unrealized gains (losses) on investments | | | 0.61 | | | | (0.32 | ) | | | 0.38 | | | | 0.13 | | | | 0.72 | |
| | | | | | | | | | | | | | | | | | | | |
Total from investment operations | | | 0.84 | | | | (0.08 | ) | | | 0.63 | | | | 0.40 | | | | 1.02 | |
Distributions to shareholders from | | | | | | | | | | | | | | | | | | | | |
Net investment income | | | (0.22 | ) | | | (0.23 | ) | | | (0.25 | ) | | | (0.27 | ) | | | (0.30 | ) |
Net realized gains | | | (0.21 | ) | | | (0.35 | ) | | | (0.14 | ) | | | 0.00 | | | | 0.00 | |
| | | | | | | | | | | | | | | | | | | | |
Total distributions to shareholders | | | (0.43 | ) | | | (0.58 | ) | | | (0.39 | ) | | | (0.27 | ) | | | (0.30 | ) |
Net asset value, end of period | | | $6.00 | | | | $5.59 | | | | $6.25 | | | | $6.01 | | | | $5.88 | |
Total return | | | 15.88 | % | | | (1.65 | )% | | | 10.68 | % | | | 6.83 | % | | | 20.18 | % |
Ratios to average net assets (annualized) | | | | | | | | | | | | | | | | | | | | |
Gross expenses | | | 0.75 | % | | | 0.71 | % | | | 0.70 | % | | | 0.69 | % | | | 0.71 | % |
Net expenses | | | 0.71 | % | | | 0.69 | % | | | 0.70 | % | | | 0.69 | % | | | 0.71 | % |
Net investment income | | | 3.92 | % | | | 3.76 | % | | | 3.98 | % | | | 4.43 | % | | | 5.32 | % |
Supplemental data | | | | | | | | | | | | | | | | | | | | |
Portfolio turnover rate | | | 38 | % | | | 63 | % | | | 52 | % | | | 60 | % | | | 72 | % |
Net assets, end of period (000s omitted) | | | $124,116 | | | | $77,558 | | | | $61,133 | | | | $49,807 | | | | $59,031 | |
| 1 | Calculated based upon average shares outstanding |
The accompanying notes are an integral part of these financial statements.
| | | | |
| 24 | | Wells Fargo Diversified Income Builder Fund | | Notes to financial statements |
1. ORGANIZATION
Wells Fargo Funds Trust (the “Trust”), a Delaware statutory trust organized on March 10, 1999, is an open-end management investment company registered under the Investment Company Act of 1940, as amended (the “1940 Act”). As an investment company, the Trust follows the accounting and reporting guidance in Financial Accounting Standards Board (“FASB”) Accounting Standards Codification Topic 946, Financial Services – Investment Companies. These financial statements report on the Wells Fargo Diversified Income Builder Fund (the “Fund”) which is a diversified series of the Trust.
2. SIGNIFICANT ACCOUNTING POLICIES
The following significant accounting policies, which are consistently followed in the preparation of the financial statements of the Fund, are in conformity with U.S. generally accepted accounting principles which require management to make estimates and assumptions that affect the reported amounts of assets and liabilities, disclosure of contingent assets and liabilities at the date of the financial statements, and the reported amounts of revenues and expenses during the reporting period. Actual results could differ from those estimates.
Securities valuation
All investments are valued each business day as of the close of regular trading on the New York Stock Exchange (generally 4 p.m. Eastern Time), although the Fund may deviate from this calculation time under unusual or unexpected circumstances.
Debt securities are valued at the evaluated bid price provided by an independent pricing service or, if a reliable price is not available, the quoted bid price from an independent broker-dealer.
Equity securities that are listed on a foreign or domestic exchange or market are valued at the official closing price or, if none, the last sales price. If no sale occurs on the principal exchange or market that day, the prior day’s price will be deemed “stale” and a fair value price will be determined in accordance with the Fund’s Valuation Procedures.
Investments in registered open-end investment companies are valued at net asset value. Interests in non-registered investment vehicles that are redeemable at net asset value are fair valued normally at net asset value.
Investments which are not valued using any of the methods discussed above are valued at their fair value, as determined in good faith by the Board of Trustees of the Fund. The Board of Trustees has established a Valuation Committee comprised of the Trustees and has delegated to it the authority to take any actions regarding the valuation of portfolio securities that the Valuation Committee deems necessary or appropriate, including determining the fair value of portfolio securities, unless the determination has been delegated to the Management Valuation Team of Wells Fargo Funds Management, LLC (“Funds Management”). The Board of Trustees retains the authority to make or ratify any valuation decisions or approve any changes to the Valuation Procedures as it deems appropriate. On a quarterly basis, the Board of Trustees receives reports on any valuation actions taken by the Valuation Committee or the Management Valuation Team which may include items for ratification.
Valuations of fair valued securities are compared to the next actual sales price when available, or other appropriate market values, to assess the continued appropriateness of the fair valuation methodologies used. These securities are fair valued on a day-to-day basis, taking into consideration changes to appropriate market information and any significant changes to the inputs considered in the valuation process until there is a readily available price provided on an exchange or by an independent pricing service. Valuations received from an independent pricing service or independent broker-dealer quotes are periodically validated by comparisons to most recent trades and valuations provided by other independent pricing services in addition to the review of prices by the manager and/or subadviser. Unobservable inputs used in determining fair valuations are identified based on the type of security, taking into consideration factors utilized by market participants in valuing the investment, knowledge about the issuer and the current market environment.
Security loans
The Fund may lend its securities from time to time in order to earn additional income in the form of fees or interest on securities received as collateral or the investment of any cash received as collateral. The Fund continues to receive interest or dividends on the securities loaned. The Fund receives collateral in the form of cash or securities with a value at least equal to the value of the securities on loan. The value of the loaned securities is determined at the close of each business day and any additional required collateral is delivered to the Fund on the next business day. In a securities lending transaction, the net asset value of the Fund will be affected by an increase or decrease in the value of the securities loaned and by an increase or decrease in the value of the instrument in which collateral is invested. The amount of securities lending activity undertaken by the Fund fluctuates from time to time. In the event of default or bankruptcy
| | | | | | |
| Notes to financial statements | | Wells Fargo Diversified Income Builder Fund | | | 25 | |
by the borrower, the Fund may be prevented from recovering the loaned securities or gaining access to the collateral or may experience delays or costs in doing so. In addition, the investment of any cash collateral received may lose all or part of its value. The Fund has the right under the lending agreement to recover the securities from the borrower on demand.
The Fund lends its securities through an unaffiliated securities lending agent. Cash collateral received in connection with its securities lending transactions is invested in Securities Lending Cash Investments, LLC (the “Securities Lending Fund”). The Securities Lending Fund is exempt from registration under Section 3(c)(7) of the 1940 Act and is managed by Funds Management and is subadvised by Wells Capital Management Incorporated (“WellsCap”), an affiliate of Funds Management and an indirect wholly owned subsidiary of Wells Fargo & Company (“Wells Fargo”). Funds Management receives an advisory fee starting at 0.05% and declining to 0.01% as the average daily net assets of the Securities Lending Fund increase. All of the fees received by Funds Management are paid to WellsCap for its services as subadviser. The Securities Lending Fund seeks to provide a positive return compared to the daily Fed Funds Open rate by investing in high-quality, U.S. dollar-denominated short-term money market instruments. Securities Lending Fund investments are fair valued based upon the amortized cost valuation technique. Income earned from investment in the Securities Lending Fund is included in securities lending income on the Statement of Operations.
When-issued transactions
The Fund may purchase securities on a forward commitment or when-issued basis. The Fund records a when-issued transaction on the trade date and will segregate assets in an amount at least equal in value to the Fund’s commitment to purchase when-issued securities. Securities purchased on a when-issued basis are marked-to-market daily and the Fund begins earning interest on the settlement date. Losses may arise due to changes in the market value of the underlying securities or if the counterparty does not perform under the contract.
Security transactions and income recognition
Securities transactions are recorded on a trade date basis. Realized gains or losses are recorded on the basis of identified cost.
Interest income is accrued daily and bond discounts are accreted and premiums are amortized daily based on the effective interest method. To the extent debt obligations are placed on non-accrual status, any related interest income may be reduced by writing off interest receivables when the collection of all or a portion of interest has become doubtful based on consistently applied procedures. If the issuer subsequently resumes interest payments or when the collectability of interest is reasonably assured, the debt obligation is removed from non-accrual status.
Dividend income is recognized on the ex-dividend date.
Distributions to shareholders
Distributions to shareholders from net investment income are accrued daily and paid monthly. Distributions from net realized gains, if any, are recorded on the ex-dividend date. Such distributions are determined in conformity with federal income tax regulations, which may differ in amount or character from net investment income and realized gains recognized for purposes of U.S. generally accepted accounting principles.
Federal and other taxes
The Fund intends to continue to qualify as a regulated investment company by distributing substantially all of its investment company taxable income and any net realized capital gains (after reduction for capital loss carryforwards) sufficient to relieve it from all, or substantially all, federal income taxes. Accordingly, no provision for federal income taxes was required.
The Fund’s income and federal excise tax returns and all financial records supporting those returns for the prior three fiscal years are subject to examination by the federal and Delaware revenue authorities. Management has analyzed the Fund’s tax positions taken on federal, state, and foreign tax returns for all open tax years and does not believe that there are any uncertain tax positions that require recognition of a tax liability.
Reclassifications are made to the Fund’s capital accounts for permanent tax differences to reflect income and gains available for distribution (or available capital loss carryforwards) under federal income tax regulations. U.S. generally accepted accounting principles require that certain components of net assets be adjusted to reflect permanent differences between financial and tax reporting. These reclassifications have no effect on net assets or net asset values per share. The primary permanent differences causing such reclassifications are due to certain distributions paid and recognition of partnership income. At September 30, 2016, as a result of permanent book-to-tax differences, the following reclassification adjustments were made on the Statement of Assets and Liabilities:
| | | | |
| 26 | | Wells Fargo Diversified Income Builder Fund | | Notes to financial statements |
| | | | |
| Paid-in capital | | Overdistributed net investment income | | Accumulated net realized gains on investments |
$162,248 | | $(27,330) | | $(134,918) |
Class allocations
The separate classes of shares offered by the Fund differ principally in applicable sales charges, distribution, shareholder servicing, and administration fees. Class specific expenses are charged directly to that share class. Investment income, common expenses, and realized and unrealized gains (losses) on investments are allocated daily to each class of shares based on the relative proportion of net assets of each class.
3. FAIR VALUATION MEASUREMENTS
Fair value measurements of investments are determined within a framework that has established a fair value hierarchy based upon the various data inputs utilized in determining the value of the Fund’s investments. The three-level hierarchy gives the highest priority to unadjusted quoted prices in active markets for identical assets or liabilities (Level 1) and the lowest priority to significant unobservable inputs (Level 3). The Fund’s investments are classified within the fair value hierarchy based on the lowest level of input that is significant to the fair value measurement. The inputs are summarized into three broad levels as follows:
| n | | Level 1 – quoted prices in active markets for identical securities |
| n | | Level 2 – other significant observable inputs (including quoted prices for similar securities, interest rates, prepayment speeds, credit risk, use of amortized cost, etc.) |
| n | | Level 3 – significant unobservable inputs (including the Fund’s own assumptions in determining the fair value of investments) |
The inputs or methodologies used for valuing investments in securities are not necessarily an indication of the risk associated with investing in those securities.
The following is a summary of the inputs used in valuing the Fund’s assets and liabilities as of September 30, 2016:
| | | | | | | | | | | | | | | | |
| | | Quoted prices (Level 1) | | | Other significant
observable inputs
(Level 2) | | | Significant
unobservable inputs
(Level 3) | | | Total | |
Assets | | | | | | | | | | | | | | | | |
Investments in: | | | | | | | | | | | | | | | | |
| | | | |
Common stocks | | | | | | | | | | | | | | | | |
Consumer discretionary | | $ | 7,987,500 | | | $ | 0 | | | $ | 0 | | | $ | 7,987,500 | |
Consumer staples | | | 7,782,300 | | | | 0 | | | | 0 | | | | 7,782,300 | |
Energy | | | 33,081,750 | | | | 0 | | | | 0 | | | | 33,081,750 | |
Health care | | | 6,250,401 | | | | 0 | | | | 0 | | | | 6,250,401 | |
Industrials | | | 16,611,820 | | | | 0 | | | | 0 | | | | 16,611,820 | |
Information technology | | | 25,096,878 | | | | 0 | | | | 0 | | | | 25,096,878 | |
Materials | | | 7,987,200 | | | | 0 | | | | 0 | | | | 7,987,200 | |
Real estate | | | 15,271,550 | | | | 0 | | | | 0 | | | | 15,271,550 | |
Utilities | | | 2,978,800 | | | | 0 | | | | 0 | | | | 2,978,800 | |
| | | | |
Corporate bonds and notes | | | 0 | | | | 313,785,031 | | | | 0 | | | | 313,785,031 | |
| | | | |
Yankee corporate bonds and notes | | | 0 | | | | 33,915,184 | | | | 0 | | | | 33,915,184 | |
| | | | |
Short-term investments | | | | | | | | | | | | | | | | |
Investment companies | | | 3,232,384 | | | | 0 | | | | 0 | | | | 3,232,384 | |
Investments measured at net asset value* | | | | | | | | | | | | | | | 6,023,805 | |
Total assets | | $ | 126,280,583 | | | $ | 347,700,215 | | | $ | 0 | | | $ | 480,004,603 | |
| * | Investments that are measured at fair value using the net asset value per share (or its equivalent) as a practical expedient have not been categorized in the fair value hierarchy. The fair value amount presented in the table is intended to permit reconciliation of the fair value hierarchy to the amounts presented in the Statement of Assets and Liabilities. The Fund’s investment in Securities Lending Cash Investments, LLC valued at $6,023,805 does not have a redemption period notice, can be redeemed daily and does not have any unfunded commitments. |
| | | | | | |
| Notes to financial statements | | Wells Fargo Diversified Income Builder Fund | | | 27 | |
The Fund recognizes transfers between levels within the fair value hierarchy at the end of the reporting period. At September 30, 2016, the Fund did not have any transfers into/out of Level 1, Level 2, or Level 3.
4. TRANSACTIONS WITH AFFILIATES
Management fee
Funds Management, an indirect wholly owned subsidiary of Wells Fargo, is the manager of the Fund and provides advisory and fund-level administrative services under an investment management agreement. Under the investment management agreement, Funds Management is responsible for, among other services, implementing the investment objectives and strategies of the Fund, supervising the subadviser, providing fund-level administrative services in connection with the Fund’s operations, and providing any other fund-level administrative services reasonably necessary for the operation of the Fund. As compensation for its services under the investment management agreement, Funds Management is entitled to receive an annual management fee starting at 0.55% and declining to 0.43% as the average daily net assets of the Fund increase. For the year ended September 30, 2016, the management fee was equivalent to an annual rate of 0.55% of the Fund’s average daily net assets.
Funds Management has retained the services of a subadviser to provide daily portfolio management to the Fund. The fee for subadvisory services is borne by Funds Management. WellsCap is the subadviser to the Fund and is entitled to receive a fee from Funds Management at an annual rate starting at 0.35% and declining to 0.20% as the average daily net assets of the Fund increase.
Administration fees
Under a class-level administration agreement, Funds Management provides class-level administrative services to the Fund, which includes paying fees and expenses for services provided by the transfer agent, sub-transfer agents, omnibus account servicers and record-keepers. As compensation for its services under the class-level administration agreement, Funds Management receives an annual fee which is calculated based on the average daily net assets of each class as follows:
| | | | |
| | | Class-level
administration fee | |
Class A, Class B, Class C | | | 0.21 | % |
Administrator Class, Institutional Class | | | 0.13 | |
Funds Management has contractually waived and/or reimbursed management and administration fees to the extent necessary to maintain certain net operating expense ratios for the Fund. Waiver of fees and/or reimbursement of expenses by Funds Management were made first from fund level expenses on a proportionate basis and then from class specific expenses. Funds Management has committed through January 31, 2017 to waive fees and/or reimburse expenses to the extent necessary to cap the Fund’s expenses at 1.08% for Class A shares, 1.83% for Class B shares, 1.83% for Class C shares, 0.90% for Administrator Class shares, and 0.71% for Institutional Class. After this time, the cap may be increased or the commitment to maintain the cap may be terminated only with the approval of the Board of Trustees.
Distribution fees
The Trust has adopted a distribution plan for Class B and Class C shares of the Fund pursuant to Rule 12b-1 under the 1940 Act. Distribution fees are charged to Class B and Class C shares and paid to Wells Fargo Funds Distributor, LLC (“Funds Distributor”), the principal underwriter, at an annual rate of 0.75% of the average daily net assets of Class B and Class C shares.
In addition, Funds Distributor is entitled to receive the front-end sales charge from the purchase of Class A shares and a contingent deferred sales charge on the redemption of certain Class A shares. Funds Distributor is also entitled to receive the contingent deferred sales charges from redemptions of Class B and Class C shares. For the year ended September 30, 2016, Funds Distributor received $53,746 from the sale of Class A shares and $107 in contingent deferred sales charges from redemptions of Class C shares.
Shareholder servicing fees
The Trust has entered into contracts with one or more shareholder servicing agents, whereby Class A, Class B, Class C, and Administrator Class of the Fund are charged a fee at an annual rate of 0.25% of the average daily net assets of each respective class.
A portion of these total shareholder servicing fees were paid to affiliates of Wells Fargo.
| | | | |
| 28 | | Wells Fargo Diversified Income Builder Fund | | Notes to financial statements |
5. INVESTMENT PORTFOLIO TRANSACTIONS
Purchases and sales of investments, excluding U.S. government obligations (if any) and short-term securities, for the year ended September 30, 2016 were $257,974,617 and $ 144,944,295, respectively.
The Fund may purchase or sell investment securities to other Wells Fargo funds under procedures adopted by the Board of Trustees. The procedures have been designed to ensure that these interfund transactions, which generally do not incur broker commissions, are effected at current market prices. Interfund trades are included within the respective purchases and sales amounts shown.
6. BANK BORROWINGS
The Trust (excluding the money market funds and certain other funds) and Wells Fargo Variable Trust are parties to a $250,000,000 revolving credit agreement whereby the Fund is permitted to use bank borrowings for temporary or emergency purposes, such as to fund shareholder redemption requests. Interest under the credit agreement is charged to the Fund based on a borrowing rate equal to the higher of the Federal Funds rate in effect on that day plus 1.25% or the overnight LIBOR rate in effect on that day plus 1.25%. In addition, an annual commitment fee equal to 0.25% of the unused balance is allocated to each participating fund. Prior to August 30, 2016, the revolving credit agreement amount was $200,000,000 and the annual commitment fee was equal to 0.20% of the unused balance which was allocated to each participating fund.
For the year ended September 30, 2016, there were no borrowings by the Fund under the agreement.
7. DISTRIBUTIONS TO SHAREHOLDERS
The tax character of distributions paid during the years ended September 30, 2016 and September 30, 2015 were as follows:
| | | | | | | | |
| | | Year ended September 30 | |
| | | 2016 | | | 2015 | |
Ordinary income | | $ | 15,910,256 | | | $ | 18,803,192 | |
Long-term capital gain | | | 9,838,199 | | | | 13,575,979 | |
As of September 30, 2016, the components of distributable earnings on a tax basis were as follows:
| | |
Undistributed long-term gain | | Unrealized gains |
| $3,470,576 | | $18,935,212 |
8. INDEMNIFICATION
Under the Trust’s organizational documents, the officers and Trustees have been granted certain indemnification rights against certain liabilities that may arise out of performance of their duties to the Trust. Additionally, in the normal course of business, the Trust may enter into contracts with service providers that contain a variety of indemnification clauses. The Trust’s maximum exposure under these arrangements is dependent on future claims that may be made against the Fund and, therefore, cannot be estimated.
| | | | | | |
| Report of independent registered public accounting firm | | Wells Fargo Diversified Income Builder Fund | | | 29 | |
BOARD OF TRUSTEES AND SHAREHOLDERS OF WELLS FARGO FUNDS TRUST:
We have audited the accompanying statement of assets and liabilities, including the portfolio of investments, of the Wells Fargo Diversified Income Builder Fund (formerly known as Wells Fargo Advantage Diversified Income Builder Fund) (the “Fund”), one of the funds constituting the Wells Fargo Funds Trust, as of September 30, 2016, and the related statement of operations for the year then ended, the statements of changes in net assets for each of the years in the two-year period then ended, and the financial highlights for each of the years in the five-year period then ended. These financial statements and financial highlights are the responsibility of the Fund’s management. Our responsibility is to express an opinion on these financial statements and financial highlights based on our audits.
We conducted our audits in accordance with the standards of the Public Company Accounting Oversight Board (United States). Those standards require that we plan and perform the audit to obtain reasonable assurance about whether the financial statements and financial highlights are free of material misstatement. An audit includes examining, on a test basis, evidence supporting the amounts and disclosures in the financial statements. Our procedures included confirmation of securities owned as of September 30, 2016, by correspondence with the custodian and brokers, or by other appropriate auditing procedures. An audit also includes assessing the accounting principles used and significant estimates made by management, as well as evaluating the overall financial statement presentation. We believe that our audits provide a reasonable basis for our opinion.
In our opinion, the financial statements and financial highlights referred to above present fairly, in all material respects, the financial position of the Wells Fargo Diversified Income Builder Fund as of September 30, 2016, the results of its operations for the year then ended, the changes in its net assets for each of the years in the two-year period then ended, and the financial highlights for each of the years in the five-year period then ended, in conformity with U.S. generally accepted accounting principles.

Boston, Massachusetts
November 23, 2016
| | | | |
| 30 | | Wells Fargo Diversified Income Builder Fund | | Other information (unaudited) |
TAX INFORMATION
For corporate shareholders, pursuant to Section 854 of the Internal Revenue Code, 9.47% of ordinary income dividends qualify for the corporate dividends-received deduction for the fiscal year ended September 30, 2016.
Pursuant to Section 852 of the Internal Revenue Code, $9,838,199 was designated as a 20% rate gain distribution for the fiscal year ended September 30, 2016.
Pursuant to Section 854 of the Internal Revenue Code, $1,526,931 of income dividends paid during the fiscal year ended September 30, 2016 has been designated as qualified dividend income (QDI).
For the fiscal year ended September 30, 2016, $10,864,059 has been designated as interest-related dividends for nonresident alien shareholders pursuant to Section 871 of the Internal Revenue Code.
For the fiscal year ended September 30, 2016, $2,788,205 has been designated as short-term capital gain dividends for nonresident alien shareholders pursuant to Section 871 of the Internal Revenue Code.
PROXY VOTING INFORMATION
A description of the policies and procedures that the Fund uses to determine how to vote proxies relating to portfolio securities is available, upon request, by calling 1-800-222-8222, visiting our website at wellsfargofunds.com, or visiting the SEC website at sec.gov. Information regarding how the Fund voted proxies relating to portfolio securities during the most recent 12-month period ended June 30 is available on the Fund’s website at wellsfargofunds.com or by visiting the SEC website at sec.gov.
PORTFOLIO HOLDINGS INFORMATION
The complete portfolio holdings for the Fund are publicly available monthly on the Fund’s website (wellsfargofunds.com), on a one-month delayed basis. In addition, top ten holdings information (excluding derivative positions) for the Fund is publicly available on the Fund’s website on a monthly, seven-day or more delayed basis. The Fund files its complete schedule of portfolio holdings with the SEC for the first and third quarters of each fiscal year on Form N-Q, which is available by visiting the SEC website at sec.gov. In addition, the Fund’s Form N-Q may be reviewed and copied at the SEC’s Public Reference Room in Washington, DC, and at regional offices in New York City, at 233 Broadway, and in Chicago, at 175 West Jackson Boulevard, Suite 900. Information about the Public Reference Room may be obtained by calling 1-800-SEC-0330.
| | | | | | |
| Other information (unaudited) | | Wells Fargo Diversified Income Builder Fund | | | 31 | |
BOARD OF TRUSTEES AND OFFICERS
Each of the Trustees and Officers1 listed in the table below acts in identical capacities for each fund in the Wells Fargo family of funds, which consists of 138 mutual funds comprising the Wells Fargo Funds Trust, Wells Fargo Variable Trust, Wells Fargo Master Trust and four closed-end funds (collectively the “Fund Complex”). This table should be read in conjunction with the Prospectus and the Statement of Additional Information2. The mailing address of each Trustee and Officer is 525 Market Street, 12th Floor, San Francisco, CA 94105. Each Trustee and Officer serves an indefinite term, however, each Trustee serves such term until reaching the mandatory retirement age established by the Trustees.
Independent Trustees
| | | | | | |
Name and year of birth | | Position held and length of service* | | Principal occupations during past five years or longer | | Current other public company or investment company directorships |
William R. Ebsworth (Born 1957) | | Trustee, since 2015 | | Retired. From 1984 to 2013, equities analyst, portfolio manager, research director and chief financial officer at Fidelity Management and Research Company in Boston, Tokyo, and Hong Kong and retired in 2013 as Chief Investment Officer of Fidelity Strategic Advisers, Inc. where he lead a team of investment professionals managing client assets. Prior thereto, Board member of Hong Kong Securities Clearing Co., Hong Kong Options Clearing Corp., the Thailand International Fund, Ltd., Fidelity Investments Life Insurance Company, and Empire Fidelity Investments Life Insurance Company. Mr. Ebsworth is a CFA® charterholder and an Adjunct Lecturer, Finance, at Babson College. | | Asset Allocation Trust |
Jane A. Freeman (Born 1953) | | Trustee, since 2015 | | Retired. From 2012 to 2014 and 1999 to 2008, Chief Financial Officer of Scientific Learning Corporation. From 2008 to 2012, Ms. Freeman provided consulting services related to strategic business projects. Prior to 1999, Portfolio Manager at Rockefeller & Co. and Scudder, Stevens & Clark. Board member of the Harding Loevner Funds from 1996 to 2014, serving as both Lead Independent Director and chair of the Audit Committee. Board member of the Russell Exchange Traded Funds Trust from 2011 to 2012 and the chair of the Audit Committee. Ms. Freeman is a Board Member of Ruth Bancroft Garden (non-profit organization) and an inactive chartered financial analyst. | | Asset Allocation Trust |
Peter G. Gordon (Born 1942) | | Trustee, since 1998; Chairman, since 2005 | | Co-Founder, Retired Chairman, President and CEO of Crystal Geyser Water Company. Trustee Emeritus, Colby College. | | Asset Allocation Trust |
Isaiah Harris, Jr. (Born 1952) | | Trustee, since 2009 | | Retired. Chairman of the Board of CIGNA Corporation since 2009, and Director since 2005. From 2003 to 2011, Director of Deluxe Corporation. Prior thereto, President and CEO of BellSouth Advertising and Publishing Corp. from 2005 to 2007, President and CEO of BellSouth Enterprises from 2004 to 2005 and President of BellSouth Consumer Services from 2000 to 2003. Emeritus member of the Iowa State University Foundation Board of Governors. Emeritus Member of the Advisory Board of Iowa State University School of Business. Advisory Board Member, Palm Harbor Academy (charter school). Advisory Board Member, Child Evangelism Fellowship (non-profit). Mr. Harris is a certified public accountant (inactive status). | | CIGNA Corporation; Asset Allocation Trust |
Judith M. Johnson (Born 1949) | | Trustee, since 2008; Audit Committee Chairman, since 2008 | | Retired. Prior thereto, Chief Executive Officer and Chief Investment Officer of Minneapolis Employees Retirement Fund from 1996 to 2008. Ms. Johnson is an attorney, certified public accountant and a certified managerial accountant. | | Asset Allocation Trust |
David F. Larcker (Born 1950) | | Trustee, since 2009 | | James Irvin Miller Professor of Accounting at the Graduate School of Business, Stanford University, Director of the Corporate Governance Research Initiative and Senior Faculty of The Rock Center for Corporate Governance since 2006. From 2005 to 2008, Professor of Accounting at the Graduate School of Business, Stanford University. Prior thereto, Ernst & Young Professor of Accounting at The Wharton School, University of Pennsylvania from 1985 to 2005. | | Asset Allocation Trust |
| | | | |
| 32 | | Wells Fargo Diversified Income Builder Fund | | Other information (unaudited) |
| | | | | | |
Name and year of birth | | Position held and length of service* | | Principal occupations during past five years or longer | | Current other public company or investment company directorships |
Olivia S. Mitchell (Born 1953) | | Trustee, since 2006 | | International Foundation of Employee Benefit Plans Professor, Wharton School of the University of Pennsylvania since 1993. Director of Wharton’s Pension Research Council and Boettner Center on Pensions & Retirement Research, and Research Associate at the National Bureau of Economic Research. Previously, Cornell University Professor from 1978 to 1993. | | Asset Allocation Trust |
Timothy J. Penny (Born 1951) | | Trustee, since 1996 | | President and Chief Executive Officer of Southern Minnesota Initiative Foundation, a non-profit organization, since 2007 and Senior Fellow at the Humphrey Institute Policy Forum at the University of Minnesota since 1995. Member of the Board of Trustees of NorthStar Education Finance, Inc., a non-profit organization, since 2007. | | Asset Allocation Trust |
Michael S. Scofield (Born 1943) | | Trustee, since 2010 | | Served on the Investment Company Institute’s Board of Governors and Executive Committee from 2008-2011 as well the Governing Council of the Independent Directors Council from 2006-2011 and the Independent Directors Council Executive Committee from 2008-2011. Chairman of the IDC from 2008-2010. Institutional Investor (Fund Directions) Trustee of Year in 2007. Trustee of the Evergreen Funds complex (and its predecessors) from 1984 to 2010. Chairman of the Evergreen Funds from 2000-2010. Former Trustee of the Mentor Funds. Retired Attorney, Law Offices of Michael S. Scofield. | | Asset Allocation Trust |
| * | Length of service dates reflect the Trustee’s commencement of service with the Trust’s predecessor entities, where applicable. |
Officers
| | | | | | |
Name and year of birth | | Position held and
length of service | | Principal occupations during past five years or longer | | |
Karla M. Rabusch (Born 1959) | | President, since 2003 | | Executive Vice President of Wells Fargo Bank, N.A. and President of Wells Fargo Funds Management, LLC since 2003. | | |
Jeremy DePalma1 (Born 1974) | | Treasurer, since 2012 | | Senior Vice President of Wells Fargo Funds Management, LLC since 2009. Senior Vice President of Evergreen Investment Management Company, LLC from 2008 to 2010 and head of the Fund Reporting and Control Team within Fund Administration from 2005 to 2010. | | |
C. David Messman (Born 1960) | | Secretary, since 2000; Chief Legal Officer, since 2003 | | Senior Vice President and Secretary of Wells Fargo Funds Management, LLC since 2001. Assistant General Counsel of Wells Fargo Bank, N.A. since 2013 and Vice President and Managing Counsel of Wells Fargo Bank, N.A. from 1996 to 2013. | | |
Michael Whitaker (Born 1967) | | Chief Compliance Officer, since 20163 | | Executive Vice President of Wells Fargo Funds Management, LLC since 2016. Chief Compliance Officer of Fidelity’s Fixed Income Funds and Asset Allocation Funds from 2008 to 2016, Compliance Officer of FMR Co., Inc. from 2014 to 2016, Fidelity Investments Money Management, Inc. from 2014 to 2016, Fidelity Investments from 2007 to 2016. | | |
David Berardi (Born 1975) | | Assistant Treasurer, since 2009 | | Vice President of Wells Fargo Funds Management, LLC since 2009. Vice President of Evergreen Investment Management Company, LLC from 2008 to 2010. Manager of Fund Reporting and Control for Evergreen Investment Management Company, LLC from 2004 to 2010. | | |
| 1 | Jeremy DePalma acts as Treasurer of 68 funds and Assistant Treasurer of 70 funds in the Fund Complex. |
| 2 | The Statement of Additional Information includes additional information about the Trustees and is available, without charge, upon request, by calling 1-800-222-8222 or by visiting the website at wellsfargofunds.com. |
| 3 | Michael Whitaker became Chief Compliance Officer effective May 16, 2016. |
| | | | | | |
| Other information (unaudited) | | Wells Fargo Diversified Income Builder Fund | | | 33 | |
BOARD CONSIDERATION OF INVESTMENT MANAGEMENT AND SUB-ADVISORY AGREEMENTS:
Under the Investment Company Act of 1940 (the “1940 Act”), the Board of Trustees (the “Board”) of Wells Fargo Funds Trust (the “Trust”) must determine annually whether to approve the continuation of the Trust’s investment management and sub-advisory agreements. In this regard, at an in-person meeting held on May 24-25, 2016 (the “Meeting”), the Board, all the members of which have no direct or indirect interest in the investment management and sub-advisory agreements and are not “interested persons” of the Trust, as defined in the 1940 Act (the “Independent Trustees”), reviewed and approved for Wells Fargo Diversified Income Builder Fund (the “Fund”): (i) an investment management agreement (the “Management Agreement”) with Wells Fargo Funds Management, LLC (“Funds Management”); and (ii) an investment sub-advisory agreement (the “Sub-Advisory Agreement”) with Wells Capital Management Incorporated (the “Sub-Adviser”), an affiliate of Funds Management. The Management Agreement and the Sub-Advisory Agreement are collectively referred to as the “Advisory Agreements.”
At the Meeting, the Board considered the factors and reached the conclusions described below relating to the selection of Funds Management and the Sub-Adviser and the approval of the Advisory Agreements. Prior to the Meeting, including at an in-person meeting in April 2016, the Trustees conferred extensively among themselves and with representatives of Funds Management about these matters. Also, the Board has adopted a team-based approach, with each team consisting of a sub-set of Trustees, to assist the full Board in the discharge of its duties in reviewing performance and other matters throughout the year. The Independent Trustees were assisted in their evaluation of the Advisory Agreements by independent legal counsel, from whom they received separate legal advice and with whom they met separately.
In providing information to the Board, Funds Management and the Sub-Adviser were guided by a detailed set of requests for information submitted to them by independent legal counsel on behalf of the Independent Trustees at the start of the Board’s annual contract renewal process earlier in 2016. In considering and approving the Advisory Agreements, the Trustees considered the information they believed relevant, including but not limited to the information discussed below. The Board considered not only the specific information presented in connection with the Meeting, but also the knowledge gained over time through interaction with Funds Management and the Sub-Adviser about various topics. In this regard, the Board reviewed reports of Funds Management at each of its quarterly meetings, which included, among other things, portfolio reviews and performance reports. In addition, the Board and the teams mentioned above confer with portfolio managers at various times throughout the year. The Board did not identify any particular information or consideration that was all-important or controlling, and each individual Trustee may have attributed different weights to various factors.
After its deliberations, the Board unanimously approved the continuation of the Advisory Agreements for a one-year term and determined that the compensation payable to Funds Management and the Sub-Adviser under each of the Advisory Agreements was reasonable. The Board considered the approval of the Advisory Agreements for the Fund as part of its consideration of agreements for funds across the complex, but its approvals were made on a fund-by-fund basis. The following summarizes a number of important, but not necessarily all, factors considered by the Board in support of its approvals.
Nature, extent and quality of services
The Board received and considered various information regarding the nature, extent and quality of services provided to the Fund by Funds Management and the Sub-Adviser under the Advisory Agreements. This information included a description of the investment advisory services and Fund-level administrative services covered by the Management Agreement, as well as, among other things, a summary of the background and experience of senior management of Funds Management, and the qualifications, background, tenure and responsibilities of each of the portfolio managers primarily responsible for the day-to-day portfolio management of the Fund.
The Board evaluated the ability of Funds Management and the Sub-Adviser to attract and retain qualified investment professionals, including research, advisory and supervisory personnel. The Board further considered the compliance programs and compliance records of Funds Management and the Sub-Adviser. In addition, the Board took into account the full range of services provided to the Fund by Funds Management and its affiliates.
Fund performance and expenses
The Board considered the performance results for the Fund over various time periods ended December 31, 2015. The Board considered these results in comparison to the performance of funds in a universe that was determined by Broadridge Inc. (“Broadridge”) to be similar to the Fund (the “Universe”), and in comparison to the Fund’s benchmark index and to other comparative data. Broadridge is an independent provider of investment company data. The Board received a description of the methodology used by Broadridge to select the mutual funds in the performance Universe.
| | | | |
| 34 | | Wells Fargo Diversified Income Builder Fund | | Other information (unaudited) |
The Board noted that the performance of the Fund (Class A) was higher than or in range of the average performance of the Universe for all periods under review. The Board also noted that the performance of the Fund was higher than its benchmark, the Diversified Income Builder Blended Index, for all periods under review except the three, five, and ten-year periods.
The Board also received and considered information regarding the Fund’s net operating expense ratios and their various components, including actual management fees, custodian and other non-management fees, and Rule 12b-1 and non-Rule 12b-1 shareholder service fees. The Board considered these ratios in comparison to the median ratios of funds in class-specific expense groups that were determined by Broadridge to be similar to the Fund (the “Groups”). The Board received a description of the methodology used by Broadridge to select the mutual funds in the expense Groups and an explanation of how funds comprising expense groups and their expense ratios may vary from year-to-year. Based on the Broadridge reports, the Board noted that the net operating expense ratios of the Fund were lower than or in range of the median net operating expense ratios of the expense Groups.
The Board took into account the Fund performance and expense information provided to it among the factors considered in deciding to re-approve the Advisory Agreements.
Investment management and sub-advisory fee rates
The Board reviewed and considered the contractual fee rates payable by the Fund to Funds Management under the Management Agreement, as well as the contractual fee rates payable by the Fund to Funds Management for class-level administrative services under a Class-Level Administration Agreement, which include class-level transfer agency and sub-transfer agency costs (collectively, the “Management Rates”). The Board also reviewed and considered the contractual investment sub-advisory fee rates that are payable by Funds Management to the Sub-Adviser for investment sub-advisory services.
Among other information reviewed by the Board was a comparison of the Fund’s Management Rates with the average contractual investment management fee rates of funds in the expense Groups at a common asset level as well as transfer agency costs of the funds in the expense Groups. The Board noted that the Management Rates of the Fund were lower than, in range of, or equal to the sum of these average rates for the Fund’s expense Groups for all share classes.
The Board also received and considered information about the portion of the total management fee that was retained by Funds Management after payment of the fee to the Sub-Adviser for sub-advisory services. In assessing the reasonableness of this amount, the Board received and evaluated information about the nature and extent of responsibilities retained and risks assumed by Funds Management and not delegated to or assumed by the Sub-Adviser, and about Funds Management’s on-going oversight services. However, given the affiliation between Funds Management and the Sub-Adviser, the Board ascribed limited relevance to the allocation of fees between them.
The Board also received and considered information about the nature and extent of services offered and fee rates charged by Funds Management and the Sub-Adviser to other types of clients with investment strategies similar to those of the Fund. In this regard, the Board received information about the significantly greater scope of services, and compliance, reporting and other legal burdens and risks of managing mutual funds compared with those associated with managing assets of non-mutual fund clients such as collective funds or institutional separate accounts.
Based on its consideration of the factors and information it deemed relevant, including those described here, the Board determined that the compensation payable to Funds Management under the Management Agreement and to the Sub-Adviser under the Sub-Advisory Agreement was reasonable, in light of the services covered by the Advisory Agreements.
Profitability
The Board received and considered information concerning the profitability of Funds Management, as well as the profitability of Wells Fargo as a whole, from providing services to the Fund and the fund family as a whole. The Board also received and considered information concerning the profitability of the Sub-Adviser from providing services to the fund family as a whole, noting that the Sub-Adviser’s profitability information with respect to providing services to the Fund was subsumed in the Wells Fargo and Funds Management profitability analysis.
Funds Management reported on the methodologies and estimates used in calculating profitability. Among other things, the Board noted that the levels of profitability reported on a fund-by-fund basis varied widely, depending on factors such as the size and type of fund. Based on its review, the Board did not deem the profits reported by Funds Management or Wells Fargo from its services to the Fund to be at a level that would prevent it from approving the continuation of the Advisory Agreements.
| | | | | | |
| Other information (unaudited) | | Wells Fargo Diversified Income Builder Fund | | | 35 | |
Economies of scale
With respect to possible economies of scale, the Board noted the existence of breakpoints in the Fund’s management fee structure, which operate generally to reduce the Fund’s expense ratios as the Fund grows in size. It considered that, for a small fund or a fund that shrinks in size, breakpoints conversely can result in higher fee levels. The Board also considered that fee waiver and expense reimbursement arrangements and competitive fee rates at the outset are means of sharing potential economies of scale with shareholders of the Fund and the fund family as a whole. The Board considered Funds Management’s view that any analyses of potential economies of scale in managing a particular fund are inherently limited in light of the joint and common costs and investments that Funds Management incurs across the fund family as a whole.
The Board concluded that the Fund’s fee and expense arrangements, including contractual breakpoints, constituted a reasonable approach to sharing potential economies of scale with the Fund and its shareholders.
Other benefits to Funds Management and the Sub-Adviser
The Board received and considered information regarding potential “fall-out” or ancillary benefits received by Funds Management and its affiliates, including the Sub-Adviser, as a result of their relationships with the Fund. Ancillary benefits could include, among others, benefits directly attributable to other relationships with the Fund and benefits potentially derived from an increase in Funds Management’s and the Sub-Adviser’s business as a result of their relationships with the Fund. The Board noted that various affiliates of Funds Management may receive distribution-related fees, shareholder servicing payments and sub-transfer agency fees in respect of shares sold or held through them and services provided.
The Board also reviewed information about soft dollar credits earned and utilized by the Sub-Adviser, fees earned by Funds Management and the Sub-Adviser from managing a private investment vehicle for the fund family’s securities lending collateral and commissions earned by an affiliated broker from portfolio transactions.
Based on its consideration of the factors and information it deemed relevant, including those described here, the Board did not find that any ancillary benefits received by Funds Management and its affiliates, including the Sub-Adviser, were unreasonable.
Conclusion
At the Meeting, after considering the above-described factors and based on its deliberations and its evaluation of the information described above, the Board unanimously approved the continuation of the Advisory Agreements for a one-year term and determined that the compensation payable to Funds Management and the Sub-Adviser under each of the Advisory Agreements was reasonable.
| | | | |
| 36 | | Wells Fargo Diversified Income Builder Fund | | List of abbreviations |
The following is a list of common abbreviations for terms and entities that may have appeared in this report.
| ACA | — ACA Financial Guaranty Corporation |
| ADR | — American depositary receipt |
| ADS | — American depositary shares |
| AGC | — Assured Guaranty Corporation |
| AGM | — Assured Guaranty Municipal |
| Ambac | — Ambac Financial Group Incorporated |
| AMT | — Alternative minimum tax |
| BAN | — Bond anticipation notes |
| BHAC | — Berkshire Hathaway Assurance Corporation |
| CAB | — Capital appreciation bond |
| CCAB | — Convertible capital appreciation bond |
| CDA | — Community Development Authority |
| CDO | — Collateralized debt obligation |
| DRIVER | — Derivative inverse tax-exempt receipts |
| DW&P | — Department of Water & Power |
| DWR | — Department of Water Resources |
| ECFA | — Educational & Cultural Facilities Authority |
| EDA | — Economic Development Authority |
| EDFA | — Economic Development Finance Authority |
| ETF | — Exchange-traded fund |
| FDIC | — Federal Deposit Insurance Corporation |
| FFCB | — Federal Farm Credit Banks |
| FGIC | — Financial Guaranty Insurance Corporation |
| FHA | — Federal Housing Administration |
| FHLB | — Federal Home Loan Bank |
| FHLMC | — Federal Home Loan Mortgage Corporation |
| FICO | — The Financing Corporation |
| FNMA | — Federal National Mortgage Association |
| GDR | — Global depositary receipt |
| GNMA | — Government National Mortgage Association |
| HCFR | — Healthcare facilities revenue |
| HEFA | — Health & Educational Facilities Authority |
| HEFAR | — Higher education facilities authority revenue |
| HFA | — Housing Finance Authority |
| HFFA | — Health Facilities Financing Authority |
| HUD | — Department of Housing and Urban Development |
| IDA | — Industrial Development Authority |
| IDAG | — Industrial Development Agency |
| KRW | — Republic of Korea won |
| LIBOR | — London Interbank Offered Rate |
| LIFER | — Long Inverse Floating Exempt Receipts |
| LLC | — Limited liability company |
| LLLP | — Limited liability limited partnership |
| LLP | — Limited liability partnership |
| MBIA | — Municipal Bond Insurance Association |
| MFHR | — Multifamily housing revenue |
| MSTR | — Municipal securities trust receipts |
| MUD | — Municipal Utility District |
| National | — National Public Finance Guarantee Corporation |
| PCFA | — Pollution Control Financing Authority |
| PCL | — Public Company Limited |
| PCR | — Pollution control revenue |
| PFA | — Public Finance Authority |
| PFFA | — Public Facilities Financing Authority |
| PFOTER | — Puttable floating option tax-exempt receipts |
| plc | — Public limited company |
| PUTTER | — Puttable tax-exempt receipts |
| R&D | — Research & development |
| Radian | — Radian Asset Assurance |
| RAN | — Revenue anticipation notes |
| RDA | — Redevelopment Authority |
| RDFA | — Redevelopment Finance Authority |
| REIT | — Real estate investment trust |
| ROC | — Reset option certificates |
| SAVRS | — Select auction variable rate securities |
| SBA | — Small Business Authority |
| SDR | — Swedish depositary receipt |
| SFHR | — Single-family housing revenue |
| SFMR | — Single-family mortgage revenue |
| SPA | — Standby purchase agreement |
| SPDR | — Standard & Poor’s Depositary Receipts |
| SPEAR | — Short Puttable Exempt Adjustable Receipts |
| STRIPS | — Separate trading of registered interest and |
| TAN | — Tax anticipation notes |
| TIPS | — Treasury inflation-protected securities |
| TRAN | — Tax revenue anticipation notes |
| TTFA | — Transportation Trust Fund Authority |
| TVA | — Tennessee Valley Authority |

For more information
More information about Wells Fargo Funds is available free upon request. To obtain literature, please write, email, visit the Fund’s website, or call:
Wells Fargo Funds
P.O. Box 8266
Boston, MA 02266-8266
Email: fundservice@wellsfargo.com
Website: wellsfargofunds.com
Individual investors: 1-800-222-8222
Retail investment professionals: 1-888-877-9275
Institutional investment professionals: 1-866-765-0778
This report and the financial statements contained herein are submitted for the general information of the shareholders of the Fund. If this report is used for promotional purposes, distribution of the report must be accompanied or preceded by a current prospectus. Before investing, please consider the investment objectives, risks, charges, and expenses of the investment. For a current prospectus and, if available, a summary prospectus, containing this information, call 1-800-222-8222 or visit the Fund’s website at wellsfargofunds.com. Read the prospectus carefully before you invest or send money.
Wells Fargo Asset Management (WFAM) is a trade name used by the asset management businesses of Wells Fargo & Company. Wells Fargo Funds Management, LLC, a wholly owned subsidiary of Wells Fargo & Company, provides investment advisory and administrative services for Wells Fargo Funds. Other affiliates of Wells Fargo & Company provide subadvisory and other services for the funds. The funds are distributed by Wells Fargo Funds Distributor, LLC, Member FINRA, an affiliate of Wells Fargo & Company. Neither Wells Fargo Funds Management nor Wells Fargo Funds Distributor has Fund customer accounts/assets, and neither provides investment advice/recommendations or acts as an investment advice fiduciary to any investor.
NOT FDIC INSURED ¡ NO BANK GUARANTEE ¡ MAY LOSE VALUE
© 2016 Wells Fargo Funds Management, LLC. All rights reserved.
| | |
 | | 246388 11-16 A226/AR226 09-16 |
Annual Report
September 30, 2016

Wells Fargo Index Asset Allocation Fund


Reduce clutter. Save trees.
Sign up for electronic delivery of prospectuses and shareholder reports at wellsfargo.com/advantagedelivery
Contents
The views expressed and any forward-looking statements are as of September 30, 2016, unless otherwise noted, and are those of the Fund managers and/or Wells Fargo Funds Management, LLC. Discussions of individual securities, or the markets generally, or any Wells Fargo Fund are not intended as individual recommendations. Future events or results may vary significantly from those expressed in any forward-looking statements. The views expressed are subject to change at any time in response to changing circumstances in the market. Wells Fargo Funds Management, LLC and the Fund disclaim any obligation to publicly update or revise any views expressed or forward-looking statements.
NOT FDIC INSURED ¡ NO BANK GUARANTEE ¡ MAY LOSE VALUE
| | | | |
| 2 | | Wells Fargo Index Asset Allocation Fund | | Letter to shareholders (unaudited) |

Karla M. Rabusch
President
Wells Fargo Funds
Even though the Fed raised its key rate during the period, it was a modest increase as anticipated, and further rate hikes were not immediately forthcoming. As a result, market yields declined and bond prices rose.
Dear Shareholder:
We are pleased to offer you this annual report for the Wells Fargo Index Asset Allocation Fund for the 12-month period that ended September 30, 2016. During this period, which began October 1, 2015, both stock and fixed-income markets benefited from a combination of accommodative monetary policy, continued (if low) U.S. economic growth, and a moderate high-yield default rate outside of commodity-related sectors.
The U.S. economy achieved low but continued growth over the reporting period.
Toward the beginning of the reporting period, real U.S. gross domestic product (GDP) came in at a solid 2% year-over-year growth rate for the third quarter of 2015. Real GDP growth remained positive, even as it trailed off in subsequent quarters—falling below 1% in the fourth quarter of 2015 and the first quarter of 2016 and just topping 1% in the second quarter of 2016.
Global central bank policy remained accommodative.
The U.S. economy remained strong enough that in December 2015, the Federal Reserve (Fed) raised its target interest rate by 25 basis points (bps; 100 bps equals 1.00%) after keeping it near zero for seven years. However, the Fed clarified that future interest-rate increases would be gradual; as of the end of the reporting period, the Fed remained on hold. Other major central banks continued to pressure interest rates into historically low and even negative territory. In Europe, the European Central Bank (ECB) pushed its rate for banks’ excess reserves to -0.40% in March 2016 in an effort to encourage lending. In addition, the ECB kept its main refinancing rate at zero and continued to provide liquidity through an asset-purchasing program.
As a result of the favorable macroeconomic backdrop, fixed-income markets rallied across the board.
Even though the Fed raised its key rate during the period, it was a modest increase as anticipated, and further rate hikes were not immediately forthcoming. As a result, market yields declined and bond prices rose. Since the end of the financial crisis, structural changes in the fixed-income markets have reduced trading liquidity (the degree to which assets can be bought or sold without affecting the price). New regulations and capital requirements have caused traditional liquidity suppliers (banks and broker/dealers) to be more risk averse and hold less inventory. Meanwhile, corporate debt issuance has spiked as companies finance themselves at record-low yields, bond mutual funds hold larger amounts of this new debt supply, trading volumes are lower, and large-size trades are more difficult to execute. However, fixed-income markets appeared to function well over the past year with sufficient liquidity. The Bloomberg Barclays U.S. Aggregate Bond Index,1 a proxy for the broad investment-grade market, returned 5.97%.
| 1 | The Bloomberg Barclays U.S. Aggregate Bond Index (formerly known as Barclays U.S. Aggregate Bond Index) is a broad-based benchmark that measures the investment-grade, U.S. dollar–denominated, fixed-rate taxable bond market, including Treasuries, government-related and corporate securities, mortgage-backed securities (agency fixed-rate and hybrid adjustable-rate mortgage pass-throughs), asset-backed securities, and commercial mortgage-backed securities. You cannot invest directly in an index. |
| | | | | | |
| Letter to shareholders (unaudited) | | Wells Fargo Index Asset Allocation Fund | | | 3 | |
Low global yields and a solid U.S. economy incented investors to take on additional risk by purchasing stocks and high-yield bonds. The high-yield bond market was further helped by the fact that the high-yield default rate remained low for non-commodity-related companies. Although Moody’s Investors Service, Incorporated, projected in July 2016 that the U.S. high-yield default rate could reach 6.4% by the end of 2016, much of that number came from metals and mining firms (10.2% projected default rate) and oil and gas companies (8.6% projected default rate). The Bloomberg Barclays U.S. Corporate High Yield Bond Index2 returned 12.73% for the period, and the S&P 500 Index,3 a proxy for large-cap stocks, returned 15.43%.
Don’t let short-term uncertainty derail long-term investment goals.
Periods of uncertainty can present challenges, but experience has taught us that maintaining long-term investment goals can be an effective way to plan for the future. To help you create a sound strategy based on your personal goals and risk tolerance, Wells Fargo Funds offers more than 100 mutual funds spanning a wide range of asset classes and investment styles. Although diversification cannot guarantee an investment profit or prevent losses, we believe it can be an effective way to manage investment risk and potentially smooth out overall portfolio performance. We encourage investors to know their investments and to understand that appropriate levels of risk-taking may unlock opportunities.
Thank you for choosing to invest in Wells Fargo Funds. We appreciate your confidence in us and remain committed to helping you meet your financial needs.
Sincerely,

Karla M. Rabusch
President
Wells Fargo Funds
Low global yields and a solid U.S. economy incented investors to take on additional risk by purchasing stocks and high-yield bonds.
For further information about your Fund, contact your investment professional, visit our website at wellsfargofunds.com, or call us directly at 1-800-222-8222. We are available 24 hours a day, 7 days a week.
| 2 | The Bloomberg Barclays U.S. Corporate High Yield Bond Index (formerly known as Barclays U.S. Corporate High Yield Bond Index) is an unmanaged, U.S. dollar–denominated, nonconvertible, non-investment-grade debt index. The index consists of domestic corporate bonds rated Ba and below with a minimum outstanding amount of $150 million. You cannot invest directly in an index. |
| 3 | The S&P 500 Index consists of 500 stocks chosen for market size, liquidity, and industry group representation. It is a market-value-weighted index with each stock’s weight in the index proportionate to its market value. You cannot invest directly in an index. |
| | | | |
| 4 | | Wells Fargo Index Asset Allocation Fund | | Performance highlights (unaudited) |
Investment objective
The Fund seeks long-term total return, consisting of capital appreciation and current income.
Manager
Wells Fargo Funds Management, LLC
Subadviser
Wells Capital Management Incorporated
Portfolio managers
Kandarp Acharya, CFA®, FRM
Christian Chan, CFA®
Average annual total returns (%) as of September 30, 2016
| | | | | | | | | | | | | | | | | | | | | | | | | | | | | | | | | | |
| | | | | Including sales charge | | | Excluding sales charge | | | Expense ratios1 (%) | |
| | | Inception date | | 1 year | | | 5 year | | | 10 year | | | 1 year | | | 5 year | | | 10 year | | | Gross | | | Net2 | |
| Class A (SFAAX) | | 11-13-1986 | | | 3.38 | | | | 11.70 | | | | 5.92 | | | | 9.68 | | | | 13.04 | | | | 6.55 | | | | 1.20 | | | | 1.16 | |
| Class B (SASBX)* | | 1-1-1995 | | | 3.85 | | | | 11.92 | | | | 6.01 | | | | 8.85 | | | | 12.17 | | | | 6.01 | | | | 1.95 | | | | 1.91 | |
| Class C (WFALX) | | 4-1-1998 | | | 7.86 | | | | 12.19 | | | | 5.76 | | | | 8.86 | | | | 12.19 | | | | 5.76 | | | | 1.95 | | | | 1.91 | |
| Administrator Class (WFAIX) | | 11-8-1999 | | | – | | | | – | | | | – | | | | 9.91 | | | | 13.30 | | | | 6.82 | | | | 1.12 | | | | 0.91 | |
| Index Asset Allocation Composite Index3 | | – | | | – | | | | – | | | | – | | | | 11.00 | | | | 11.98 | | | | 8.11 | | | | – | | | | – | |
| Bloomberg Barclays U.S. Treasury Index4 | | – | | | – | | | | – | | | | – | | | | 4.09 | | | | 2.18 | | | | 4.45 | | | | – | | | | – | |
| S&P 500 Index5 | | – | | | – | | | | – | | | | – | | | | 15.43 | | | | 16.37 | | | | 7.24 | | | | – | | | | – | |
| * | | At the close of business on December 5, 2016, existing Class B shareholders were converted to Class A shareholders. Effective December 6, 2016, Class B shares are no longer offered by the Fund. |
Figures quoted represent past performance, which is no guarantee of future results, and do not reflect taxes that a shareholder may pay on fund distributions or the redemption of fund shares. Investment return and principal value of an investment will fluctuate so that an investor’s shares, when redeemed, may be worth more or less than their original cost. Performance shown without sales charges would be lower if sales charges were reflected. Current performance may be lower or higher than the performance data quoted, which assumes the reinvestment of dividends and capital gains. Current month-end performance is available on the Fund’s website, wellsfargofunds.com.
Index returns do not include transaction costs associated with buying and selling securities, any mutual fund fees or expenses, or any taxes. It is not possible to invest directly in an index.
For Class A shares, the maximum front-end sales charge is 5.75%. For Class B shares, the maximum contingent deferred sales charge is 5.00%. For Class C shares, the maximum contingent deferred sales charge is 1.00%. Performance including a contingent deferred sales charge assumes the sales charge for the corresponding time period. Administrator Class shares are sold without a front-end sales charge or contingent deferred sales charge.
Balanced funds may invest in stocks and bonds. Stock values fluctuate in response to the activities of individual companies and general market and economic conditions. Bond values fluctuate in response to the financial condition of individual issuers, general market and economic conditions, and changes in interest rates. Changes in market conditions and government policies may lead to periods of heightened volatility in the bond market and reduced liquidity for certain bonds held by the Fund. In general, when interest rates rise, bond values fall and investors may lose principal value. Interest-rate changes and their impact on the Fund and its share price can be sudden and unpredictable. The use of derivatives may reduce returns and/or increase volatility. Consult the Fund’s prospectus for additional information on these and other risks.
Please see footnotes on page 5.
| | | | | | |
| Performance highlights (unaudited) | | Wells Fargo Index Asset Allocation Fund | | | 5 | |
|
| Growth of $10,000 investment as of September 30, 20166 |
|
|
| 1 | Reflects the expense ratios as stated in the most recent prospectuses, which include the impact of 0.01% in acquired fund fees and expenses. The expense ratios shown are subject to change and may differ from the annualized expense ratios shown in the financial highlights of this report, which do not include acquired fund fees and expenses. |
| 2 | The manager has contractually committed through January 31, 2017, to waive fees and/or reimburse expenses to the extent necessary to cap the Fund’s Total Annual Fund Operating Expenses After Fee Waiver at 1.15% for Class A, 1.90% for Class B, 1.90% for Class C, and 0.90% for Administrator Class. After this time, the cap may be increased or the commitment to maintain the cap may be terminated only with the approval of the Board of Trustees. Brokerage commissions, stamp duty fees, interest, taxes, acquired fund fees and expenses, and extraordinary expenses are excluded from the expense cap. Without this cap, the Fund’s returns would have been lower. |
| 3 | Source: Wells Fargo Funds Management, LLC. Effective April 1, 2015, the Index Asset Allocation Composite Index is weighted 60% in the S&P 500 Index and 40% in the Bloomberg Barclays U.S. Treasury Index. Prior to April 1, 2015, the Index Asset Allocation Composite Index was weighted 60% in the S&P 500 Index and 40% in the Bloomberg Barclays U.S. Treasury 20+ Year Index (fomerly known as Barclays U.S. Treasury 20+ Year Index). You cannot invest directly in an index. |
| 4 | The Bloomberg Barclays U.S. Treasury Index (formerly known as Barclays U.S. Treasury Index) is an unmanaged index of prices of U.S. Treasury bonds with maturities of 1 to 30 years. You cannot invest directly in an index. |
| 5 | The S&P 500 Index consists of 500 stocks chosen for market size, liquidity, and industry group representation. It is a market-value weighted index with each stock’s weight in the index proportionate to its market value. You cannot invest directly in an index. |
| 6 | The chart compares the performance of Class A shares for the most recent ten years with the Index Asset Allocation Composite Index, Bloomberg Barclays U.S. Treasury Index, and the S&P 500 Index. The chart assumes a hypothetical investment of $10,000 in Class A shares and reflects all operating expenses and assumes the maximum initial sales charge of 5.75%. |
| 7 | The Morgan Stanley Capital International (MSCI) Europe, Australasia, Far East (EAFE) Index (Net) is a free-float-adjusted market-capitalization-weighted index that is designed to measure the equity market performance of developed markets, excluding the United States and Canada. The MSCI EAFE Index (Net) consists of the following 21 developed markets country indexes: Australia, Austria, Belgium, Denmark, Finland, France, Germany, Hong Kong, Ireland, Israel, Italy, Japan, the Netherlands, New Zealand, Norway, Portugal, Singapore, Spain, Sweden, Switzerland, and the United Kingdom. Source: MSCI. MSCI makes no express or implied warranties or representations and shall have no liability whatsoever with respect to any MSCI data contained herein. The MSCI data may not be further redistributed or used as a basis for other indexes or any securities or financial products. This report is not approved, reviewed, or produced by MSCI.You cannot invest directly in an index. |
| 8 | The MSCI Emerging Markets (EM) Index (Net) is a free-float-adjusted market-capitalization-weighted index that is designed to measure the equity market performance of emerging markets. The MSCI EM Index (Net) consists of the following 23 emerging markets country indexes: Brazil, Chile, China, Colombia, Czech Republic, Egypt, Greece, Hungary, India, Indonesia, Korea, Malaysia, Mexico, Peru, the Philippines, Poland, Qatar, Russia, South Africa, Taiwan, Thailand, Turkey, and United Arab Emirates. You cannot invest directly in an index. |
| 9 | The ten largest holdings, excluding cash and cash equivalents, are calculated based on the value of the investments divided by total net assets of the Fund. Holdings are subject to change and may have changed since the date specified. |
| 10 | Amounts are calculated based on the total long-term investments of the Fund. These amounts are subject to change and may have changed since the date specified. |
| 11 | Current target allocation includes the effect of any tactical futures overlay that may be in place. These amounts are subject to change and may have changed since the date specified. |
| | | | |
| 6 | | Wells Fargo Index Asset Allocation Fund | | Performance highlights (unaudited) |
MANAGER’S DISCUSSION
Fund highlights
| n | | The Fund underperformed its benchmark, the Index Asset Allocation Composite Index, for the 12-month period that ended September 30, 2016. |
| n | | The Fund’s tactical asset allocation shifts between stocks and bonds contributed to relative performance. |
| n | | However, the bond allocation’s lower duration, relative to the underlying Bloomberg Barclays U.S. Treasury Index, detracted from performance during the period. |
Despite a correction in January 2016, the S&P 500 returned more than 15% for the period.
The past 12 months featured large swings in both the equity and fixed income markets. Although the S&P 500 Index began the period with a strong rally in October 2015, the market correction in early 2016 left markets in a period of heightened volatility. The Federal Reserve increased rates for the first time in more than a decade in December 2015. Although the widely anticipated move was largely priced into markets, it did raise investor concern about the pace of future rate hikes. Early in 2016, amid falling oil prices and lowered production numbers from China, market fears came to a head and equity prices fell. The resultant flight to less risky assets put government yields well below historical averages. The mix of low global interest rates and weak first quarter 2016 equity performance further pushed yields to new lows.
These were not the lowest yields for the period. In June 2016, the United Kingdom voted to leave the European Union, a decision popularly known as Brexit. Prior to the vote, a successful vote for Brexit was viewed as unlikely at best; the shock of the referendum’s passing caused a short-term sell-off in the U.K. stock market and currency. Investors fled to perceived havens, including the U.S. government bond market.
For the period as a whole, the S&P 500 Index posted a return of 15.43%. Other segments of the global equity market displayed mixed performance. Developed non-U.S. markets, as measured by the Morgan Stanley Capital International (MSCI) Europe, Australasia, Far East (EAFE) Index (Net),7 returned 6.52%. Emerging markets as measured by the MSCI Emerging Markets (EM) Index (Net)8 posted a 16.78% return, outperforming the S&P 500 Index after five years of underperforming U.S. stocks.
Government bond prices rose during the period as yields fell across the curve. The Bloomberg Barclays U.S. Treasury Index, a broad measure of U.S. Treasury notes and bonds, gained 4.09% during the 12-month period.
| | | | |
| Ten largest holdings (%) as of September 30, 20169 | |
Apple Incorporated | | | 1.93 | |
Microsoft Corporation | | | 1.42 | |
Exxon Mobil Corporation | | | 1.15 | |
Amazon.com Incorporated | | | 1.04 | |
Johnson & Johnson | | | 1.03 | |
Facebook Incorporated Class A | | | 0.95 | |
Berkshire Hathaway Incorporated Class B | | | 0.87 | |
General Electric Company | | | 0.84 | |
AT&T Incorporated | | | 0.79 | |
JPMorgan Chase & Company | | | 0.76 | |
Tactical shifts between stocks and bonds contributed positively while a lower duration detracted from performance.
The Fund’s stock holdings seek to replicate the holdings of the S&P 500 Index, and its bond holdings seek to replicate the holdings of the Bloomberg Barclays U.S. Treasury Index. The Fund’s neutral target allocation is 60% stocks and 40% bonds. As of fiscal year-end, the Fund had an effective target allocation of 60% stocks and 40% bonds.
During the period, the portfolio management team implemented tactical shifts between stocks and bonds in order to adjust the Fund’s effective allocations based on the relative attractiveness of the two asset classes. The
allocation changes are implemented as an overlay with futures used as an alternative to holding the underlying asset. The Fund began the period with an equity tilt in October 2015. After returning the portfolio to neutral, which added value to the funds, the team saw another opportunity to go long equities during the January 2016 correction. After equity prices recovered, the higher equity allocation added value to the Fund. Though the Fund returned to a neutral equity allocation in March, it maintained the short Treasury position, reducing the duration of the bond portfolio. The team further reduced the duration of the Fund in July. This second duration reduction contributed positively to the Fund returns. The tactical shifts in equity and bond allocations that the portfolio management team implemented added value through the period that ended in September 30, 2016.
Please see footnotes on page 5.
| | | | | | |
| Performance highlights (unaudited) | | Wells Fargo Index Asset Allocation Fund | | | 7 | |
Due to all-time historical lows in U.S. Treasury yields, the portfolio management team lowered the duration of its bond portfolio. The reduced exposure to longer-term bonds during this period detracted from performance as bond yields fell. In light of the historical lows, the team continues to view this as a prudent measure in a rising interest-rate environment.
|
| Sector distribution as of September 30, 201610 |
|
 |
Relative to its benchmark, the Fund is neutral towards stocks and bonds.
The Fund’s effective allocation is determined by a combination of inputs from multiple quantitative and qualitative factors. As of the close of the period, the Fund was neutral with regards to stocks relative to bonds and held a lower duration relative to its benchmark. All of the changes to the effective allocation were implemented with futures contracts.
|
| Neutral target allocation |
|
 |
|
| Current target allocation as of September 30, 201611 |
|
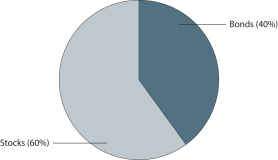 |
Please see footnotes on page 5.
| | | | |
| 8 | | Wells Fargo Index Asset Allocation Fund | | Fund expenses (unaudited) |
As a shareholder of the Fund, you incur two types of costs: (1) transaction costs, including sales charges (loads) on purchase payments and contingent deferred sales charges (if any) on redemptions and (2) ongoing costs, including management fees, distribution (12b-1) and/or shareholder servicing fees, and other Fund expenses. This example is intended to help you understand your ongoing costs (in dollars) of investing in the Fund and to compare these costs with the ongoing costs of investing in other mutual funds.
The example is based on an investment of $1,000 invested at the beginning of the six-month period and held for the entire period from April 1, 2016 to September 30, 2016.
Actual expenses
The “Actual” line of the table below provides information about actual account values and actual expenses. You may use the information in this line, together with the amount you invested, to estimate the expenses that you paid over the period. Simply divide your account value by $1,000 (for example, an $8,600 account value divided by $1,000 = 8.6), then multiply the result by the number in the “Actual” line under the heading entitled “Expenses paid during period” for your applicable class of shares to estimate the expenses you paid on your account during this period.
Hypothetical example for comparison purposes
The “Hypothetical” line of the table below provides information about hypothetical account values and hypothetical expenses based on the Fund’s actual expense ratio and an assumed rate of return of 5% per year before expenses, which is not the Fund’s actual return. The hypothetical account values and expenses may not be used to estimate the actual ending account balance or expenses you paid for the period. You may use this information to compare the ongoing costs of investing in the Fund and other funds. To do so, compare this 5% hypothetical example with the 5% hypothetical examples that appear in the shareholder reports of the other funds.
Please note that the expenses shown in the table are meant to highlight your ongoing costs only and do not reflect any transactional costs, such as sales charges (loads) and contingent deferred sales charges. Therefore, the “Hypothetical” line of the table is useful in comparing ongoing costs only and will not help you determine the relative total costs of owning different funds. In addition, if these transactional costs were included, your costs would have been higher.
| | | | | | | | | | | | | | | | |
| | | Beginning
account value
4-1-2016 | | | Ending
account value
9-30-2016 | | | Expenses
paid during
the period¹ | | | Annualized net expense ratio | |
Class A | | | | | | | | | | | | | | | | |
Actual | | $ | 1,000.00 | | | $ | 1,038.32 | | | $ | 5.54 | | | | 1.09 | % |
Hypothetical (5% return before expenses) | | $ | 1,000.00 | | | $ | 1,019.57 | | | $ | 5.49 | | | | 1.09 | % |
Class B | | | | | | | | | | | | | | | | |
Actual | | $ | 1,000.00 | | | $ | 1,034.80 | | | $ | 9.34 | | | | 1.84 | % |
Hypothetical (5% return before expenses) | | $ | 1,000.00 | | | $ | 1,015.82 | | | $ | 9.25 | | | | 1.84 | % |
Class C | | | | | | | | | | | | | | | | |
Actual | | $ | 1,000.00 | | | $ | 1,034.72 | | | $ | 9.35 | | | | 1.84 | % |
Hypothetical (5% return before expenses) | | $ | 1,000.00 | | | $ | 1,015.81 | | | $ | 9.26 | | | | 1.84 | % |
Administrator Class | | | | | | | | | | | | | | | | |
Actual | | $ | 1,000.00 | | | $ | 1,039.26 | | | $ | 4.59 | | | | 0.90 | % |
Hypothetical (5% return before expenses) | | $ | 1,000.00 | | | $ | 1,020.50 | | | $ | 4.55 | | | | 0.90 | % |
| 1 | Expenses paid is equal to the annualized net expense ratio of each class multiplied by the average account value over the period, multiplied by the number of days in the most recent fiscal half-year divided by the number of days in the fiscal year (to reflect the one-half-year period). |
| | | | | | |
| Portfolio of investments—September 30, 2016 | | Wells Fargo Index Asset Allocation Fund | | | 9 | |
| | | | | | | | | | | | | | | | |
| Security name | | Interest rate | | | Maturity date | | | Principal | | | Value | |
| | | | |
Agency Securities: 0.01% | | | | | | | | | | | | | | | | |
FNMA Series 2002-T1 Class A4 | | | 9.50 | % | | | 11-25-2031 | | | $ | 69,153 | | | $ | 84,972 | |
| | | | | | | | | | | | | | | | |
| | | | |
Total Agency Securities (Cost $70,947) | | | | | | | | | | | | | | | 84,972 | |
| | | | | | | | | | | | | | | | |
| | | | |
| | | | | | | | | Shares | | | | |
| Common Stocks: 59.44% | | | | | | | | | | | | | | | | |
| | | | |
Consumer Discretionary: 7.45% | | | | | | | | | | | | | | | | |
| | | | |
| Auto Components: 0.25% | | | | | | | | | | | | | | | | |
BorgWarner Incorporated | | | | | | | | | | | 7,489 | | | | 263,463 | |
Delphi Automotive plc | | | | | | | | | | | 10,142 | | | | 723,327 | |
Johnson Controls International plc | | | | | | | | | | | 35,099 | | | | 1,633,156 | |
The Goodyear Tire & Rubber Company | | | | | | | | | | | 9,759 | | | | 315,216 | |
| | | | |
| | | | | | | | | | | | | | | 2,935,162 | |
| | | | | | | | | | | | | | | | |
| | | | |
| Automobiles: 0.32% | | | | | | | | | | | | | | | | |
Ford Motor Company | | | | | | | | | | | 145,107 | | | | 1,751,441 | |
General Motors Company | | | | | | | | | | | 52,852 | | | | 1,679,108 | |
Harley-Davidson Incorporated | | | | | | | | | | | 6,648 | | | | 349,618 | |
| | | | |
| | | | | | | | | | | | | | | 3,780,167 | |
| | | | | | | | | | | | | | | | |
| | | | |
| Distributors: 0.08% | | | | | | | | | | | | | | | | |
Genuine Parts Company | | | | | | | | | | | 5,537 | | | | 556,192 | |
LKQ Corporation † | | | | | | | | | | | 11,419 | | | | 404,918 | |
| | | | |
| | | | | | | | | | | | | | | 961,110 | |
| | | | | | | | | | | | | | | | |
| | | | |
| Diversified Consumer Services: 0.02% | | | | | | | | | | | | | | | | |
H&R Block Incorporated | | | | | | | | | | | 8,146 | | | | 188,580 | |
| | | | | | | | | | | | | | | | |
| | | | |
| Hotels, Restaurants & Leisure: 0.96% | | | | | | | | | | | | | | | | |
Carnival Corporation | | | | | | | | | | | 16,097 | | | | 785,856 | |
Chipotle Mexican Grill Incorporated † | | | | | | | | | | | 1,083 | | | | 458,651 | |
Darden Restaurants Incorporated | | | | | | | | | | | 4,692 | | | | 287,713 | |
Marriott International Incorporated Class A | | | | | | | | | | | 11,948 | | | | 804,472 | |
McDonald’s Corporation | | | | | | | | | | | 31,731 | | | | 3,660,488 | |
Royal Caribbean Cruises Limited | | | | | | | | | | | 6,243 | | | | 467,913 | |
Starbucks Corporation | | | | | | | | | | | 54,534 | | | | 2,952,471 | |
Wyndham Worldwide Corporation | | | | | | | | | | | 4,085 | | | | 275,043 | |
Wynn Resorts Limited | | | | | | | | | | | 2,952 | | | | 287,584 | |
Yum! Brands Incorporated | | | | | | | | | | | 13,772 | | | | 1,250,635 | |
| | | | |
| | | | | | | | | | | | | | | 11,230,826 | |
| | | | | | | | | | | | | | | | |
| | | | |
| Household Durables: 0.29% | | | | | | | | | | | | | | | | |
D.R. Horton Incorporated | | | | | | | | | | | 12,597 | | | | 380,429 | |
Garmin Limited | | | | | | | | | | | 4,283 | | | | 206,055 | |
Harman International Industries Incorporated | | | | | | | | | | | 2,595 | | | | 219,148 | |
Leggett & Platt Incorporated | | | | | | | | | | | 4,969 | | | | 226,487 | |
Lennar Corporation Class A | | | | | | | | | | | 6,984 | | | | 295,703 | |
The accompanying notes are an integral part of these financial statements.
| | | | |
| 10 | | Wells Fargo Index Asset Allocation Fund | | Portfolio of investments—September 30, 2016 |
| | | | | | | | | | | | | | | | |
| Security name | | | | | | | | Shares | | | Value | |
| | | | |
| Household Durables (continued) | | | | | | | | | | | | | | | | |
Mohawk Industries Incorporated † | | | | | | | | | | | 2,343 | | | $ | 469,397 | |
Newell Rubbermaid Incorporated | | | | | | | | | | | 17,930 | | | | 944,194 | |
PulteGroup Incorporated | | | | | | | | | | | 11,499 | | | | 230,440 | |
Whirlpool Corporation | | | | | | | | | | | 2,805 | | | | 454,859 | |
| | | | |
| | | | | | | | | | | | | | | 3,426,712 | |
| | | | | | | | | | | | | | | | |
| | | | |
| Internet & Direct Marketing Retail: 1.48% | | | | | | | | | | | | | | | | |
Amazon.com Incorporated † | | | | | | | | | | | 14,631 | | | | 12,250,683 | |
Expedia Incorporated | | | | | | | | | | | 4,480 | | | | 522,906 | |
Netflix Incorporated † | | | | | | | | | | | 15,941 | | | | 1,570,986 | |
The Priceline Group Incorporated † | | | | | | | | | | | 1,845 | | | | 2,714,899 | |
TripAdvisor Incorporated † | | | | | | | | | | | 4,248 | | | | 268,389 | |
| | | | |
| | | | | | | | | | | | | | | 17,327,863 | |
| | | | | | | | | | | | | | | | |
| | | | |
| Leisure Products: 0.06% | | | | | | | | | | | | | | | | |
Hasbro Incorporated | | | | | | | | | | | 4,196 | | | | 332,869 | |
Mattel Incorporated | | | | | | | | | | | 12,665 | | | | 383,496 | |
| | | | |
| | | | | | | | | | | | | | | 716,365 | |
| | | | | | | | | | | | | | | | |
| | | | |
| Media: 1.74% | | | | | | | | | | | | | | | | |
CBS Corporation Class B | | | | | | | | | | | 15,128 | | | | 828,107 | |
Charter Communications Incorporated Class A † | | | | | | | | | | | 8,059 | | | | 2,175,688 | |
Comcast Corporation Class A | | | | | | | | | | | 89,330 | | | | 5,926,152 | |
Discovery Communications Incorporated Class A † | | | | | | | | | | | 5,610 | | | | 151,021 | |
Discovery Communications Incorporated Class C † | | | | | | | | | | | 8,337 | | | | 219,346 | |
Interpublic Group of Companies Incorporated | | | | | | | | | | | 14,899 | | | | 332,993 | |
News Corporation Class A | | | | | | | | | | | 14,149 | | | | 197,803 | |
News Corporation Class B | | | | | | | | | | | 4,454 | | | | 63,336 | |
Omnicom Group Incorporated | | | | | | | | | | | 8,795 | | | | 747,575 | |
Scripps Networks Interactive Incorporated Class A | | | | | | | | | | | 3,540 | | | | 224,755 | |
Tegna Incorporated | | | | | | | | | | | 7,969 | | | | 174,202 | |
The Walt Disney Company | | | | | | | | | | | 54,977 | | | | 5,105,164 | |
Time Warner Incorporated | | | | | | | | | | | 28,923 | | | | 2,302,560 | |
Twenty-First Century Fox Incorporated Class A | | | | | | | | | | | 39,564 | | | | 958,240 | |
Twenty-First Century Fox Incorporated Class B | | | | | | | | | | | 18,112 | | | | 448,091 | |
Viacom Incorporated Class B | | | | | | | | | | | 12,910 | | | | 491,871 | |
| | | | |
| | | | | | | | | | | | | | | 20,346,904 | |
| | | | | | | | | | | | | | | | |
| | | | |
| Multiline Retail: 0.32% | | | | | | | | | | | | | | | | |
Dollar General Corporation | | | | | | | | | | | 9,638 | | | | 674,564 | |
Dollar Tree Incorporated † | | | | | | | | | | | 8,766 | | | | 691,900 | |
Kohl’s Corporation | | | | | | | | | | | 6,678 | | | | 292,163 | |
Macy’s Incorporated | | | | | | | | | | | 11,469 | | | | 424,926 | |
Nordstrom Incorporated « | | | | | | | | | | | 4,321 | | | �� | 224,173 | |
Target Corporation | | | | | | | | | | | 21,375 | | | | 1,468,035 | |
| | | | |
| | | | | | | | | | | | | | | 3,775,761 | |
| | | | | | | | | | | | | | | | |
The accompanying notes are an integral part of these financial statements.
| | | | | | |
| Portfolio of investments—September 30, 2016 | | Wells Fargo Index Asset Allocation Fund | | | 11 | |
| | | | | | | | | | | | | | | | |
| Security name | | | | | | | | Shares | | | Value | |
| | | | |
| Specialty Retail: 1.47% | | | | | | | | | | | | | | | | |
Advance Auto Parts Incorporated | | | | | | | | | | | 2,738 | | | $ | 408,291 | |
AutoNation Incorporated † | | | | | | | | | | | 2,467 | | | | 120,168 | |
AutoZone Incorporated † | | | | | | | | | | | 1,087 | | | | 835,186 | |
Bed Bath & Beyond Incorporated | | | | | | | | | | | 5,740 | | | | 247,451 | |
Best Buy Company Incorporated | | | | | | | | | | | 10,264 | | | | 391,880 | |
CarMax Incorporated † | | | | | | | | | | | 7,120 | | | | 379,852 | |
Foot Locker Incorporated | | | | | | | | | | | 5,031 | | | | 340,699 | |
L Brands Incorporated | | | | | | | | | | | 8,932 | | | | 632,118 | |
Lowe’s Companies Incorporated | | | | | | | | | | | 32,523 | | | | 2,348,486 | |
O’Reilly Automotive Incorporated † | | | | | | | | | | | 3,530 | | | | 988,788 | |
Ross Stores Incorporated | | | | | | | | | | | 14,747 | | | | 948,232 | |
Signet Jewelers Limited | | | | | | | | | | | 2,810 | | | | 209,429 | |
Staples Incorporated | | | | | | | | | | | 24,185 | | | | 206,782 | |
The Gap Incorporated « | | | | | | | | | | | 8,149 | | | | 181,234 | |
The Home Depot Incorporated | | | | | | | | | | | 45,943 | | | | 5,911,945 | |
The TJX Companies Incorporated | | | | | | | | | | | 24,416 | | | | 1,825,828 | |
Tiffany & Company | | | | | | | | | | | 3,994 | | | | 290,084 | |
Tractor Supply Company | | | | | | | | | | | 4,970 | | | | 334,730 | |
ULTA Salon Cosmetics & Fragrance Incorporated † | | | | | | | | | | | 2,180 | | | | 518,796 | |
Urban Outfitters Incorporated † | | | | | | | | | | | 3,309 | | | | 114,227 | |
| | | | |
| | | | | | | | | | | | | | | 17,234,206 | |
| | | | | | | | | | | | | | | | |
| | | | |
| Textiles, Apparel & Luxury Goods: 0.46% | | | | | | | | | | | | | | | | |
Coach Incorporated | | | | | | | | | | | 10,372 | | | | 379,200 | |
HanesBrands Incorporated | | | | | | | | | | | 14,048 | | | | 354,712 | |
Michael Kors Holdings Limited † | | | | | | | | | | | 6,284 | | | | 294,028 | |
Nike Incorporated Class B | | | | | | | | | | | 50,138 | | | | 2,639,766 | |
PVH Corporation | | | | | | | | | | | 2,983 | | | | 329,622 | |
Ralph Lauren Corporation | | | | | | | | | | | 2,096 | | | | 211,989 | |
Under Armour Incorporated Class A Ǡ | | | | | | | | | | | 6,819 | | | | 263,759 | |
Under Armour Incorporated Class C † | | | | | | | | | | | 6,854 | | | | 232,076 | |
VF Corporation | | | | | | | | | | | 12,337 | | | | 691,489 | |
| | | | |
| | | | | | | | | | | | | | | 5,396,641 | |
| | | | | | | | | | | | | | | | |
| | | | |
Consumer Staples: 5.88% | | | | | | | | | | | | | | | | |
| | | | |
| Beverages: 1.32% | | | | | | | | | | | | | | | | |
Brown-Forman Corporation Class B | | | | | | | | | | | 6,782 | | | | 321,738 | |
Constellation Brands Incorporated Class A | | | | | | | | | | | 6,587 | | | | 1,096,670 | |
Dr Pepper Snapple Group Incorporated | | | | | | | | | | | 6,893 | | | | 629,400 | |
Molson Coors Brewing Company Class B | | | | | | | | | | | 6,849 | | | | 752,020 | |
Monster Beverage Corporation † | | | | | | | | | | | 5,025 | | | | 737,720 | |
PepsiCo Incorporated | | | | | | | | | | | 53,513 | | | | 5,820,609 | |
The Coca-Cola Company | | | | | | | | | | | 144,439 | | | | 6,112,658 | |
| | | | |
| | | | | | | | | | | | | | | 15,470,815 | |
| | | | | | | | | | | | | | | | |
| | | | |
| Food & Staples Retailing: 1.28% | | | | | | | | | | | | | | | | |
Costco Wholesale Corporation | | | | | | | | | | | 16,289 | | | | 2,484,235 | |
CVS Health Corporation | | | | | | | | | | | 39,645 | | | | 3,528,009 | |
Sysco Corporation | | | | | | | | | | | 18,990 | | | | 930,700 | |
The accompanying notes are an integral part of these financial statements.
| | | | |
| 12 | | Wells Fargo Index Asset Allocation Fund | | Portfolio of investments—September 30, 2016 |
| | | | | | | | | | | | | | | | |
| Security name | | | | | | | | Shares | | | Value | |
| | | | |
| Food & Staples Retailing (continued) | | | | | | | | | | | | | | | | |
The Kroger Company | | | | | | | | | | | 35,286 | | | $ | 1,047,288 | |
Wal-Mart Stores Incorporated | | | | | | | | | | | 56,359 | | | | 4,064,611 | |
Walgreens Boots Alliance Incorporated | | | | | | | | | | | 31,793 | | | | 2,563,152 | |
Whole Foods Market Incorporated | | | | | | | | | | | 11,854 | | | | 336,061 | |
| | | | |
| | | | | | | | | | | | | | | 14,954,056 | |
| | | | | | | | | | | | | | | | |
| | | | |
| Food Products: 1.02% | | | | | | | | | | | | | | | | |
Archer Daniels Midland Company | | | | | | | | | | | 21,632 | | | | 912,221 | |
Campbell Soup Company | | | | | | | | | | | 7,230 | | | | 395,481 | |
ConAgra Foods Incorporated | | | | | | | | | | | 15,497 | | | | 730,064 | |
General Mills Incorporated | | | | | | | | | | | 22,199 | | | | 1,418,072 | |
Hormel Foods Corporation | | | | | | | | | | | 10,048 | | | | 381,121 | |
Kellogg Company | | | | | | | | | | | 9,377 | | | | 726,436 | |
McCormick & Company Incorporated | | | | | | | | | | | 4,277 | | | | 427,358 | |
Mead Johnson Nutrition Company | | | | | | | | | | | 6,866 | | | | 542,483 | |
Mondelez International Incorporated Class A | | | | | | | | | | | 57,841 | | | | 2,539,220 | |
The Hershey Company | | | | | | | | | | | 5,219 | | | | 498,936 | |
The J.M. Smucker Company | | | | | | | | | | | 4,329 | | | | 586,753 | |
The Kraft Heinz Company | | | | | | | | | | | 22,155 | | | | 1,983,094 | |
Tyson Foods Incorporated Class A | | | | | | | | | | | 11,059 | | | | 825,776 | |
| | | | |
| | | | | | | | | | | | | | | 11,967,015 | |
| | | | | | | | | | | | | | | | |
| | | | |
| Household Products: 1.20% | | | | | | | | | | | | | | | | |
Church & Dwight Company Incorporated | | | | | | | | | | | 9,578 | | | | 458,978 | |
Colgate-Palmolive Company | | | | | | | | | | | 33,149 | | | | 2,457,667 | |
Kimberly-Clark Corporation | | | | | | | | | | | 13,373 | | | | 1,686,870 | |
The Clorox Company | | | | | | | | | | | 4,814 | | | | 602,617 | |
The Procter & Gamble Company | | | | | | | | | | | 99,235 | | | | 8,906,341 | |
| | | | |
| | | | | | | | | | | | | | | 14,112,473 | |
| | | | | | | | | | | | | | | | |
| | | | |
| Personal Products: 0.07% | | | | | | | | | | | | | | | | |
Coty Incorporated | | | | | | | | | | | 2,565 | | | | 60,294 | |
The Estee Lauder Companies Incorporated Class A | | | | | | | | | | | 8,215 | | | | 727,520 | |
| | | | |
| | | | | | | | | | | | | | | 787,814 | |
| | | | | | | | | | | | | | | | |
| | | | |
| Tobacco: 0.99% | | | | | | | | | | | | | | | | |
Altria Group Incorporated | | | | | | | | | | | 72,652 | | | | 4,593,786 | |
Philip Morris International | | | | | | | | | | | 57,684 | | | | 5,608,038 | |
Reynolds American Incorporated | | | | | | | | | | | 30,783 | | | | 1,451,418 | |
| | | | |
| | | | | | | | | | | | | | | 11,653,242 | |
| | | | | | | | | | | | | | | | |
| | | | |
Energy: 4.32% | | | | | | | | | | | | | | | | |
| | | | |
| Energy Equipment & Services: 0.64% | | | | | | | | | | | | | | | | |
Baker Hughes Incorporated | | | | | | | | | | | 15,911 | | | | 803,028 | |
FMC Technologies Incorporated † | | | | | | | | | | | 8,390 | | | | 248,931 | |
Halliburton Company | | | | | | | | | | | 32,019 | | | | 1,437,013 | |
Helmerich & Payne Incorporated « | | | | | | | | | | | 4,018 | | | | 270,411 | |
National Oilwell Varco Incorporated | | | | | | | | | | | 14,041 | | | | 515,866 | |
The accompanying notes are an integral part of these financial statements.
| | | | | | |
| Portfolio of investments—September 30, 2016 | | Wells Fargo Index Asset Allocation Fund | | | 13 | |
| | | | | | | | | | | | | | | | |
| Security name | | | | | | | | Shares | | | Value | |
| | | | |
| Energy Equipment & Services (continued) | | | | | | | | | | | | | | | | |
Schlumberger Limited | | | | | | | | | | | 51,711 | | | $ | 4,066,553 | |
Transocean Limited Ǡ | | | | | | | | | | | 12,771 | | | | 136,139 | |
| | | | |
| | | | | | | | | | | | | | | 7,477,941 | |
| | | | | | | | | | | | | | | | |
| | | | |
| Oil, Gas & Consumable Fuels: 3.68% | | | | | | | | | | | | | | | | |
Anadarko Petroleum Corporation | | | | | | | | | | | 20,365 | | | | 1,290,326 | |
Apache Corporation | | | | | | | | | | | 14,108 | | | | 901,078 | |
Cabot Oil & Gas Corporation | | | | | | | | | | | 17,296 | | | | 446,237 | |
Chesapeake Energy Corporation Ǡ | | | | | | | | | | | 24,268 | | | | 152,160 | |
Chevron Corporation | | | | | | | | | | | 70,149 | | | | 7,219,735 | |
Cimarex Energy Company | | | | | | | | | | | 3,532 | | | | 474,595 | |
Concho Resources Incorporated † | | | | | | | | | | | 5,285 | | | | 725,895 | |
ConocoPhillips | | | | | | | | | | | 46,053 | | | | 2,001,924 | |
Devon Energy Corporation | | | | | | | | | | | 19,469 | | | | 858,778 | |
EOG Resources Incorporated | | | | | | | | | | | 20,475 | | | | 1,980,137 | |
EQT Corporation | | | | | | | | | | | 6,423 | | | | 466,438 | |
Exxon Mobil Corporation | | | | | | | | | | | 154,189 | | | | 13,457,616 | |
Hess Corporation | | | | | | | | | | | 10,008 | | | | 536,629 | |
Kinder Morgan Incorporated | | | | | | | | | | | 71,386 | | | | 1,651,158 | |
Marathon Oil Corporation | | | | | | | | | | | 31,505 | | | | 498,094 | |
Marathon Petroleum Corporation | | | | | | | | | | | 19,661 | | | | 798,040 | |
Murphy Oil Corporation | | | | | | | | | | | 6,018 | | | | 182,947 | |
Newfield Exploration Company † | | | | | | | | | | | 7,384 | | | | 320,909 | |
Noble Energy Incorporated | | | | | | | | | | | 15,976 | | | | 570,982 | |
Occidental Petroleum Corporation | | | | | | | | | | | 28,406 | | | | 2,071,366 | |
ONEOK Incorporated | | | | | | | | | | | 7,824 | | | | 402,075 | |
Phillips 66 Company | | | | | | | | | | | 16,525 | | | | 1,331,089 | |
Pioneer Natural Resources Company | | | | | | | | | | | 6,306 | | | | 1,170,709 | |
Range Resources Corporation | | | | | | | | | | | 6,989 | | | | 270,824 | |
Southwestern Energy Company † | | | | | | | | | | | 18,348 | | | | 253,936 | |
Spectra Energy Corporation | | | | | | | | | | | 26,070 | | | | 1,114,493 | |
Tesoro Corporation | | | | | | | | | | | 4,417 | | | | 351,417 | |
The Williams Companies Incorporated | | | | | | | | | | | 25,397 | | | | 780,450 | |
Valero Energy Corporation | | | | | | | | | | | 17,154 | | | | 909,162 | |
| | | | |
| | | | | | | | | | | | | | | 43,189,199 | |
| | | | | | | | | | | | | | | | |
| | | | |
Financials: 7.59% | | | | | | | | | | | | | | | | |
| | | | |
| Banks: 3.19% | | | | | | | | | | | | | | | | |
Bank of America Corporation | | | | | | | | | | | 379,457 | | | | 5,938,502 | |
BB&T Corporation | | | | | | | | | | | 30,286 | | | | 1,142,388 | |
Citigroup Incorporated | | | | | | | | | | | 108,033 | | | | 5,102,399 | |
Citizens Financial Group Incorporated | | | | | | | | | | | 19,316 | | | | 477,298 | |
Comerica Incorporated | | | | | | | | | | | 6,466 | | | | 305,971 | |
Fifth Third Bancorp | | | | | | | | | | | 28,497 | | | | 583,049 | |
Huntington Bancshares Incorporated | | | | | | | | | | | 40,364 | | | | 397,989 | |
JPMorgan Chase & Company | | | | | | | | | | | 134,308 | | | | 8,943,570 | |
KeyCorp | | | | | | | | | | | 40,240 | | | | 489,721 | |
M&T Bank Corporation | | | | | | | | | | | 5,829 | | | | 676,747 | |
People’s United Financial Incorporated | | | | | | | | | | | 11,563 | | | | 182,927 | |
The accompanying notes are an integral part of these financial statements.
| | | | |
| 14 | | Wells Fargo Index Asset Allocation Fund | | Portfolio of investments—September 30, 2016 |
| | | | | | | | | | | | | | | | |
| Security name | | | | | | | | Shares | | | Value | |
| | | | |
| Banks (continued) | | | | | | | | | | | | | | | | |
PNC Financial Services Group Incorporated | | | | | | | | | | | 18,272 | | | $ | 1,646,124 | |
Regions Financial Corporation | | | | | | | | | | | 46,673 | | | | 460,663 | |
SunTrust Banks Incorporated | | | | | | | | | | | 18,644 | | | | 816,607 | |
US Bancorp | | | | | | | | | | | 59,823 | | | | 2,565,808 | |
Wells Fargo & Company (l) | | | | | | | | | | | 168,853 | | | | 7,476,811 | |
Zions Bancorporation | | | | | | | | | | | 7,627 | | | | 236,590 | |
| | | | |
| | | | | | | | | | | | | | | 37,443,164 | |
| | | | | | | | | | | | | | | | |
| | | | |
| Capital Markets: 1.51% | | | | | | | | | | | | | | | | |
Affiliated Managers Group Incorporated † | | | | | | | | | | | 2,003 | | | | 289,834 | |
Ameriprise Financial Incorporated | | | | | | | | | | | 6,002 | | | | 598,820 | |
Bank of New York Mellon Corporation | | | | | | | | | | | 39,701 | | | | 1,583,276 | |
BlackRock Incorporated | | | | | | | | | | | 4,536 | | | | 1,644,119 | |
Charles Schwab Corporation | | | | | | | | | | | 44,767 | | | | 1,413,294 | |
CME Group Incorporated | | | | | | | | | | | 12,600 | | | | 1,316,952 | |
E*TRADE Financial Corporation † | | | | | | | | | | | 10,176 | | | | 296,325 | |
Franklin Resources Incorporated | | | | | | | | | | | 13,067 | | | | 464,793 | |
Intercontinental Exchange Incorporated | | | | | | | | | | | 4,430 | | | | 1,193,265 | |
Invesco Limited | | | | | | | | | | | 15,242 | | | | 476,617 | |
Legg Mason Incorporated | | | | | | | | | | | 3,429 | | | | 114,803 | |
Moody’s Corporation | | | | | | | | | | | 6,221 | | | | 673,610 | |
Morgan Stanley | | | | | | | | | | | 54,738 | | | | 1,754,900 | |
Northern Trust Corporation | | | | | | | | | | | 7,919 | | | | 538,413 | |
S&P Global Incorporated | | | | | | | | | | | 9,816 | | | | 1,242,313 | |
State Street Corporation | | | | | | | | | | | 13,632 | | | | 949,196 | |
T. Rowe Price Group Incorporated | | | | | | | | | | | 9,241 | | | | 614,527 | |
The Goldman Sachs Group Incorporated | | | | | | | | | | | 14,021 | | | | 2,261,167 | |
The NASDAQ OMX Group Incorporated | | | | | | | | | | | 4,244 | | | | 286,640 | |
| | | | |
| | | | | | | | | | | | | | | 17,712,864 | |
| | | | | | | | | | | | | | | | |
| | | | |
| Consumer Finance: 0.43% | | | | | | | | | | | | | | | | |
American Express Company | | | | | | | | | | | 28,854 | | | | 1,847,810 | |
Capital One Financial Corporation | | | | | | | | | | | 18,818 | | | | 1,351,697 | |
Discover Financial Services | | | | | | | | | | | 15,008 | | | | 848,702 | |
Navient Corporation | | | | | | | | | | | 11,788 | | | | 170,572 | |
Synchrony Financial | | | | | | | | | | | 29,458 | | | | 824,824 | |
| | | | |
| | | | | | | | | | | | | | | 5,043,605 | |
| | | | | | | | | | | | | | | | |
| | | | |
| Diversified Financial Services: 0.89% | | | | | | | | | | | | | | | | |
Berkshire Hathaway Incorporated Class B † | | | | | | | | | | | 70,600 | | | | 10,199,582 | |
Leucadia National Corporation | | | | | | | | | | | 12,061 | | | | 229,641 | |
| | | | |
| | | | | | | | | | | | | | | 10,429,223 | |
| | | | | | | | | | | | | | | | |
| | | | |
| Insurance: 1.57% | | | | | | | | | | | | | | | | |
AFLAC Incorporated | | | | | | | | | | | 15,230 | | | | 1,094,580 | |
American International Group Incorporated | | | | | | | | | | | 37,820 | | | | 2,244,239 | |
Aon plc | | | | | | | | | | | 9,876 | | | | 1,110,951 | |
Arthur J. Gallagher & Company | | | | | | | | | | | 6,583 | | | | 334,877 | |
Assurant Incorporated | | | | | | | | | | | 2,238 | | | | 206,456 | |
The accompanying notes are an integral part of these financial statements.
| | | | | | |
| Portfolio of investments—September 30, 2016 | | Wells Fargo Index Asset Allocation Fund | | | 15 | |
| | | | | | | | | | | | | | | | |
| Security name | | | | | | | | Shares | | | Value | |
| | | | |
| Insurance (continued) | | | | | | | | | | | | | | | | |
Chubb Limited | | | | | | | | | | | 17,293 | | | $ | 2,172,865 | |
Cincinnati Financial Corporation | | | | | | | | | | | 5,568 | | | | 419,939 | |
Lincoln National Corporation | | | | | | | | | | | 8,656 | | | | 406,659 | |
Loews Corporation | | | | | | | | | | | 10,279 | | | | 422,981 | |
Marsh & McLennan Companies Incorporated | | | | | | | | | | | 19,269 | | | | 1,295,840 | |
MetLife Incorporated | | | | | | | | | | | 40,860 | | | | 1,815,410 | |
Principal Financial Group Incorporated | | | | | | | | | | | 9,945 | | | | 512,267 | |
Prudential Financial Incorporated | | | | | | | | | | | 16,249 | | | | 1,326,731 | |
The Allstate Corporation | | | | | | | | | | | 13,812 | | | | 955,514 | |
The Hartford Financial Services Group Incorporated | | | | | | | | | | | 14,352 | | | | 614,553 | |
The Progressive Corporation | | | | | | | | | | | 21,638 | | | | 681,597 | |
The Travelers Companies Incorporated | | | | | | | | | | | 10,719 | | | | 1,227,861 | |
Torchmark Corporation | | | | | | | | | | | 4,141 | | | | 264,568 | |
Unum Group | | | | | | | | | | | 8,724 | | | | 308,044 | |
Willis Towers Watson plc | | | | | | | | | | | 4,825 | | | | 640,615 | |
XL Group Limited | | | | | | | | | | | 10,225 | | | | 343,867 | |
| | | | |
| | | | | | | | | | | | | | | 18,400,414 | |
| | | | | | | | | | | | | | | | |
| | | | |
Health Care: 8.72% | | | | | | | | | | | | | | | | |
| | | | |
| Biotechnology: 1.78% | | | | | | | | | | | | | | | | |
AbbVie Incorporated | | | | | | | | | | | 60,556 | | | | 3,819,267 | |
Alexion Pharmaceuticals Incorporated † | | | | | | | | | | | 8,338 | | | | 1,021,739 | |
Amgen Incorporated | | | | | | | | | | | 27,826 | | | | 4,641,655 | |
Biogen Incorporated † | | | | | | | | | | | 8,147 | | | | 2,550,255 | |
Celgene Corporation † | | | | | | | | | | | 28,822 | | | | 3,012,764 | |
Gilead Sciences Incorporated | | | | | | | | | | | 49,070 | | | | 3,882,418 | |
Regeneron Pharmaceuticals Incorporated † | | | | | | | | | | | 2,806 | | | | 1,128,068 | |
Vertex Pharmaceuticals Incorporated † | | | | | | | | | | | 9,213 | | | | 803,466 | |
| | | | |
| | | | | | | | | | | | | | | 20,859,632 | |
| | | | | | | | | | | | | | | | |
| | | | |
| Health Care Equipment & Supplies: 1.65% | | | | | | | | | | | | | | | | |
Abbott Laboratories | | | | | | | | | | | 54,661 | | | | 2,311,614 | |
Baxter International Incorporated | | | | | | | | | | | 18,201 | | | | 866,368 | |
Becton Dickinson & Company | | | | | | | | | | | 7,917 | | | | 1,422,922 | |
Boston Scientific Corporation † | | | | | | | | | | | 50,598 | | | | 1,204,232 | |
C.R. Bard Incorporated | | | | | | | | | | | 2,731 | | | | 612,509 | |
Danaher Corporation | | | | | | | | | | | 22,596 | | | | 1,771,300 | |
Dentsply Sirona Incorporated | | | | | | | | | | | 8,664 | | | | 514,902 | |
Edwards Lifesciences Corporation † | | | | | | | | | | | 7,915 | | | | 954,232 | |
Hologic Incorporated † | | | | | | | | | | | 10,316 | | | | 400,570 | |
Intuitive Surgical Incorporated † | | | | | | | | | | | 1,431 | | | | 1,037,232 | |
Medtronic plc | | | | | | | | | | | 51,385 | | | | 4,439,664 | |
St. Jude Medical Incorporated | | | | | | | | | | | 10,594 | | | | 844,977 | |
Stryker Corporation | | | | | | | | | | | 11,551 | | | | 1,344,652 | |
The Cooper Companies Incorporated | | | | | | | | | | | 1,804 | | | | 323,385 | |
Varian Medical Systems Incorporated † | | | | | | | | | | | 3,472 | | | | 345,568 | |
Zimmer Holdings Incorporated | | | | | | | | | | | 7,436 | | | | 966,829 | |
| | | | |
| | | | | | | | | | | | | | | 19,360,956 | |
| | | | | | | | | | | | | | | | |
The accompanying notes are an integral part of these financial statements.
| | | | |
| 16 | | Wells Fargo Index Asset Allocation Fund | | Portfolio of investments—September 30, 2016 |
| | | | | | | | | | | | | | | | |
| Security name | | | | | | | | Shares | | | Value | |
| | | | |
| Health Care Providers & Services: 1.54% | | | | | | | | | | | | | | | | |
Aetna Incorporated | | | | | | | | | | | 13,044 | | | $ | 1,505,930 | |
AmerisourceBergen Corporation | | | | | | | | | | | 6,723 | | | | 543,084 | |
Anthem Incorporated | | | | | | | | | | | 9,786 | | | | 1,226,284 | |
Cardinal Health Incorporated | | | | | | | | | | | 11,846 | | | | 920,434 | |
Centene Corporation † | | | | | | | | | | | 6,348 | | | | 425,062 | |
Cigna Corporation | | | | | | | | | | | 9,540 | | | | 1,243,253 | |
DaVita HealthCare Partners Incorporated † | | | | | | | | | | | 6,155 | | | | 406,661 | |
Express Scripts Holding Company † | | | | | | | | | | | 23,433 | | | | 1,652,729 | |
HCA Holdings Incorporated † | | | | | | | | | | | 10,981 | | | | 830,493 | |
Henry Schein Incorporated † | | | | | | | | | | | 3,041 | | | | 495,622 | |
Humana Incorporated | | | | | | | | | | | 5,542 | | | | 980,324 | |
Laboratory Corporation of America Holdings † | | | | | | | | | | | 3,803 | | | | 522,836 | |
McKesson Corporation | | | | | | | | | | | 8,393 | | | | 1,399,533 | |
Patterson Companies Incorporated | | | | | | | | | | | 3,098 | | | | 142,322 | |
Quest Diagnostics Incorporated | | | | | | | | | | | 5,168 | | | | 437,368 | |
UnitedHealth Group Incorporated | | | | | | | | | | | 35,413 | | | | 4,957,820 | |
Universal Health Services Incorporated Class B | | | | | | | | | | | 3,349 | | | | 412,664 | |
| | | | |
| | | | | | | | | | | | | | | 18,102,419 | |
| | | | | | | | | | | | | | | | |
| | | | |
| Health Care Technology: 0.06% | | | | | | | | | | | | | | | | |
Cerner Corporation † | | | | | | | | | | | 11,176 | | | | 690,118 | |
| | | | | | | | | | | | | | | | |
| | | | |
| Life Sciences Tools & Services: 0.43% | | | | | | | | | | | | | | | | |
Agilent Technologies Incorporated | | | | | | | | | | | 12,104 | | | | 569,977 | |
Illumina Incorporated † | | | | | | | | | | | 5,451 | | | | 990,229 | |
Mettler-Toledo International Incorporated † | | | | | | | | | | | 984 | | | | 413,113 | |
PerkinElmer Incorporated | | | | | | | | | | | 4,068 | | | | 228,255 | |
Thermo Fisher Scientific Incorporated | | | | | | | | | | | 14,660 | | | | 2,331,820 | |
Waters Corporation † | | | | | | | | | | | 2,995 | | | | 474,678 | |
| | | | |
| | | | | | | | | | | | | | | 5,008,072 | |
| | | | | | | | | | | | | | | | |
| | | | |
| Pharmaceuticals: 3.26% | | | | | | | | | | | | | | | | |
Allergan plc † | | | | | | | | | | | 14,722 | | | | 3,390,624 | |
Bristol-Myers Squibb Company | | | | | | | | | | | 62,129 | | | | 3,349,996 | |
Eli Lilly & Company | | | | | | | | | | | 36,120 | | | | 2,898,991 | |
Endo International plc † | | | | | | | | | | | 7,371 | | | | 148,526 | |
Johnson & Johnson | | | | | | | | | | | 101,731 | | | | 12,017,483 | |
Mallinckrodt plc † | | | | | | | | | | | 4,005 | | | | 279,469 | |
Merck & Company Incorporated | | | | | | | | | | | 102,822 | | | | 6,417,121 | |
Mylan NV † | | | | | | | | | | | 17,105 | | | | 652,043 | |
Perrigo Company plc | | | | | | | | | | | 5,328 | | | | 491,934 | |
Pfizer Incorporated | | | | | | | | | | | 225,547 | | | | 7,639,277 | |
Zoetis Incorporated | | | | | | | | | | | 18,408 | | | | 957,400 | |
| | | | |
| | | | | | | | | | | | | | | 38,242,864 | |
| | | | | | | | | | | | | | | | |
| | | | |
Industrials: 5.78% | | | | | | | | | | | | | | | | |
| | | | |
| Aerospace & Defense: 1.23% | | | | | | | | | | | | | | | | |
General Dynamics Corporation | | | | | | | | | | | 10,670 | | | | 1,655,557 | |
L-3 Communications Holdings Incorporated | | | | | | | | | | | 2,871 | | | | 432,746 | |
The accompanying notes are an integral part of these financial statements.
| | | | | | |
| Portfolio of investments—September 30, 2016 | | Wells Fargo Index Asset Allocation Fund | | | 17 | |
| | | | | | | | | | | | | | | | |
| Security name | | | | | | | | Shares | | | Value | |
| | | | |
| Aerospace & Defense (continued) | | | | | | | | | | | | | | | | |
Lockheed Martin Corporation | | | | | | | | | | | 9,387 | | | $ | 2,250,252 | |
Northrop Grumman Corporation | | | | | | | | | | | 6,640 | | | | 1,420,628 | |
Raytheon Company | | | | | | | | | | | 10,972 | | | | 1,493,618 | |
Rockwell Collins Incorporated | | | | | | | | | | | 4,831 | | | | 407,447 | |
Textron Incorporated | | | | | | | | | | | 10,019 | | | | 398,255 | |
The Boeing Company | | | | | | | | | | | 21,573 | | | | 2,842,027 | |
TransDigm Group Incorporated † | | | | | | | | | | | 1,861 | | | | 538,052 | |
United Technologies Corporation | | | | | | | | | | | 28,942 | | | | 2,940,507 | |
| | | | |
| | | | | | | | | | | | | | | 14,379,089 | |
| | | | | | | | | | | | | | | | |
| | | | |
| Air Freight & Logistics: 0.44% | | | | | | | | | | | | | | | | |
C.H. Robinson Worldwide Incorporated | | | | | | | | | | | 5,306 | | | | 373,861 | |
Expeditors International of Washington Incorporated | | | | | | | | | | | 6,731 | | | | 346,781 | |
FedEx Corporation | | | | | | | | | | | 9,083 | | | | 1,586,618 | |
United Parcel Service Incorporated Class B | | | | | | | | | | | 25,704 | | | | 2,810,989 | |
| | | | |
| | | | | | | | | | | | | | | 5,118,249 | |
| | | | | | | | | | | | | | | | |
| | | | |
| Airlines: 0.30% | | | | | | | | | | | | | | | | |
Alaska Air Group Incorporated | | | | | | | | | | | 4,576 | | | | 301,375 | |
American Airlines Group Incorporated | | | | | | | | | | | 19,703 | | | | 721,327 | |
Delta Air Lines Incorporated | | | | | | | | | | | 27,847 | | | | 1,096,058 | |
Southwest Airlines Company | | | | | | | | | | | 23,063 | | | | 896,920 | |
United Continental Holdings Incorporated † | | | | | | | | | | | 10,909 | | | | 572,395 | |
| | | | |
| | | | | | | | | | | | | | | 3,588,075 | |
| | | | | | | | | | | | | | | | |
| | | | |
| Building Products: 0.08% | | | | | | | | | | | | | | | | |
Allegion plc | | | | | | | | | | | 3,566 | | | | 245,733 | |
Fortune Brands Home & Security Incorporated | | | | | | | | | | | 5,723 | | | | 332,506 | |
Masco Corporation | | | | | | | | | | | 12,278 | | | | 421,258 | |
| | | | |
| | | | | | | | | | | | | | | 999,497 | |
| | | | | | | | | | | | | | | | |
| | | | |
| Commercial Services & Supplies: 0.18% | | | | | | | | | | | | | | | | |
Cintas Corporation | | | | | | | | | | | 3,177 | | | | 357,730 | |
Pitney Bowes Incorporated | | | | | | | | | | | 6,900 | | | | 125,304 | |
Republic Services Incorporated | | | | | | | | | | | 8,668 | | | | 437,301 | |
Stericycle Incorporated † | | | | | | | | | | | 3,162 | | | | 253,403 | |
Waste Management Incorporated | | | | | | | | | | | 15,130 | | | | 964,689 | |
| | | | |
| | | | | | | | | | | | | | | 2,138,427 | |
| | | | | | | | | | | | | | | | |
| | | | |
| Construction & Engineering: 0.06% | | | | | | | | | | | | | | | | |
Fluor Corporation | | | | | | | | | | | 5,177 | | | | 265,684 | |
Jacobs Engineering Group Incorporated † | | | | | | | | | | | 4,515 | | | | 233,516 | |
Quanta Services Incorporated † | | | | | | | | | | | 5,618 | | | | 157,248 | |
| | | | |
| | | | | | | | | | | | | | | 656,448 | |
| | | | | | | | | | | | | | | | |
| | | | |
| Electrical Equipment: 0.33% | | | | | | | | | | | | | | | | |
Acuity Brands Incorporated | | | | | | | | | | | 1,632 | | | | 431,827 | |
AMETEK Incorporated | | | | | | | | | | | 8,642 | | | | 412,915 | |
Eaton Corporation plc | | | | | | | | | | | 16,907 | | | | 1,110,959 | |
The accompanying notes are an integral part of these financial statements.
| | | | |
| 18 | | Wells Fargo Index Asset Allocation Fund | | Portfolio of investments—September 30, 2016 |
| | | | | | | | | | | | | | | | |
| Security name | | | | | | | | Shares | | | Value | |
| | | | |
| Electrical Equipment (continued) | | | | | | | | | | | | | | | | |
Emerson Electric Company | | | | | | | | | | | 23,929 | | | $ | 1,304,370 | |
Rockwell Automation Incorporated | | | | | | | | | | | 4,812 | | | | 588,700 | |
| | | | |
| | | | | | | | | | | | | | | 3,848,771 | |
| | | | | | | | | | | | | | | | |
| | | | |
| Industrial Conglomerates: 1.52% | | | | | | | | | | | | | | | | |
3M Company | | | | | | | | | | | 22,474 | | | | 3,960,593 | |
General Electric Company | | | | | | | | | | | 333,216 | | | | 9,869,858 | |
Honeywell International Incorporated | | | | | | | | | | | 28,292 | | | | 3,298,564 | |
Roper Industries Incorporated | | | | | | | | | | | 3,767 | | | | 687,364 | |
| | | | |
| | | | | | | | | | | | | | | 17,816,379 | |
| | | | | | | | | | | | | | | | |
| | | | |
| Machinery: 0.86% | | | | | | | | | | | | | | | | |
Caterpillar Incorporated | | | | | | | | | | | 21,724 | | | | 1,928,439 | |
Cummins Incorporated | | | | | | | | | | | 5,769 | | | | 739,297 | |
Deere & Company | | | | | | | | | | | 10,756 | | | | 918,025 | |
Dover Corporation | | | | | | | | | | | 5,771 | | | | 424,976 | |
Flowserve Corporation | | | | | | | | | | | 4,848 | | | | 233,868 | |
Fortive Corporation | | | | | | | | | | | 11,179 | | | | 569,011 | |
Illinois Tool Works Incorporated | | | | | | | | | | | 11,878 | | | | 1,423,460 | |
Ingersoll-Rand plc | | | | | | | | | | | 9,593 | | | | 651,748 | |
Paccar Incorporated | | | | | | | | | | | 13,034 | | | | 766,139 | |
Parker-Hannifin Corporation | | | | | | | | | | | 4,979 | | | | 625,014 | |
Pentair plc | | | | | | | | | | | 6,195 | | | | 397,967 | |
Snap-on Incorporated | | | | | | | | | | | 2,160 | | | | 328,234 | |
Stanley Black & Decker Incorporated | | | | | | | | | | | 5,593 | | | | 687,827 | |
Xylem Incorporated | | | | | | | | | | | 6,663 | | | | 349,474 | |
| | | | |
| | | | | | | | | | | | | | | 10,043,479 | |
| | | | | | | | | | | | | | | | |
| | | | |
| Professional Services: 0.18% | | | | | | | | | | | | | | | | |
Dun & Bradstreet Corporation | | | | | | | | | | | 1,350 | | | | 184,437 | |
Equifax Incorporated | | | | | | | | | | | 4,437 | | | | 597,131 | |
Nielsen Holdings plc | | | | | | | | | | | 12,490 | | | | 669,089 | |
Robert Half International Incorporated | | | | | | | | | | | 4,839 | | | | 183,205 | |
Verisk Analytics Incorporated † | | | | | | | | | | | 5,843 | | | | 474,919 | |
| | | | |
| | | | | | | | | | | | | | | 2,108,781 | |
| | | | | | | | | | | | | | | | |
| | | | |
| Road & Rail: 0.50% | | | | | | | | | | | | | | | | |
CSX Corporation | | | | | | | | | | | 35,176 | | | | 1,072,868 | |
J.B. Hunt Transport Services Incorporated | | | | | | | | | | | 3,267 | | | | 265,084 | |
Kansas City Southern | | | | | | | | | | | 4,015 | | | | 374,680 | |
Norfolk Southern Corporation | | | | | | | | | | | 10,915 | | | | 1,059,410 | |
Ryder System Incorporated | | | | | | | | | | | 1,989 | | | | 131,175 | |
Union Pacific Corporation | | | | | | | | | | | 30,970 | | | | 3,020,504 | |
| | | | |
| | | | | | | | | | | | | | | 5,923,721 | |
| | | | | | | | | | | | | | | | |
| | | | |
| Trading Companies & Distributors: 0.10% | | | | | | | | | | | | | | | | |
Fastenal Company | | | | | | | | | | | 10,745 | | | | 448,926 | |
United Rentals Incorporated † | | | | | | | | | | | 3,203 | | | | 251,403 | |
W.W. Grainger Incorporated | | | | | | | | | | | 2,067 | | | | 464,744 | |
| | | | |
| | | | | | | | | | | | | | | 1,165,073 | |
| | | | | | | | | | | | | | | | |
The accompanying notes are an integral part of these financial statements.
| | | | | | |
| Portfolio of investments—September 30, 2016 | | Wells Fargo Index Asset Allocation Fund | | | 19 | |
| | | | | | | | | | | | | | | | |
| Security name | | | | | | | | Shares | | | Value | |
| | | | |
Information Technology: 12.63% | | | | | | | | | | | | | | | | |
| | | | |
| Communications Equipment: 0.64% | | | | | | | | | | | | | | | | |
Cisco Systems Incorporated | | | | | | | | | | | 187,026 | | | $ | 5,932,465 | |
F5 Networks Incorporated † | | | | | | | | | | | 2,461 | | | | 306,739 | |
Harris Corporation | | | | | | | | | | | 4,618 | | | | 423,055 | |
Juniper Networks Incorporated | | | | | | | | | | | 14,239 | | | | 342,590 | |
Motorola Solutions Incorporated | | | | | | | | | | | 6,199 | | | | 472,860 | |
| | | | |
| | | | | | | | | | | | | | | 7,477,709 | |
| | | | | | | | | | | | | | | | |
| | | | |
| Electronic Equipment, Instruments & Components: 0.23% | | | | | | | | | | | | | | | | |
Amphenol Corporation Class A | | | | | | | | | | | 11,479 | | | | 745,217 | |
Corning Incorporated | | | | | | | | | | | 38,555 | | | | 911,826 | |
FLIR Systems Incorporated | | | | | | | | | | | 5,104 | | | | 160,368 | |
TE Connectivity Limited | | | | | | | | | | | 13,220 | | | | 851,104 | |
| | | | |
| | | | | | | | | | | | | | | 2,668,515 | |
| | | | | | | | | | | | | | | | |
| | | | |
| Internet Software & Services: 2.71% | | | | | | | | | | | | | | | | |
Akamai Technologies Incorporated † | | | | | | | | | | | 6,496 | | | | 344,223 | |
Alphabet Incorporated Class A † | | | | | | | | | | | 10,963 | | | | 8,814,910 | |
Alphabet Incorporated Class C † | | | | | | | | | | | 10,987 | | | | 8,540,085 | |
eBay Incorporated † | | | | | | | | | | | 39,042 | | | | 1,284,482 | |
Facebook Incorporated Class A † | | | | | | | | | | | 86,377 | | | | 11,079,578 | |
VeriSign Incorporated † | | | | | | | | | | | 3,454 | | | | 270,241 | |
Yahoo! Incorporated † | | | | | | | | | | | 32,560 | | | | 1,403,336 | |
| | | | |
| | | | | | | | | | | | | | | 31,736,855 | |
| | | | | | | | | | | | | | | | |
| | | | |
| IT Services: 2.24% | | | | | | | | | | | | | | | | |
Accenture plc Class A | | | | | | | | | | | 23,148 | | | | 2,827,991 | |
Alliance Data Systems Corporation † | | | | | | | | | | | 2,176 | | | | 466,817 | |
Automatic Data Processing Incorporated | | | | | | | | | | | 16,962 | | | | 1,496,048 | |
Cognizant Technology Solutions Corporation Class A † | | | | | | | | | | | 22,568 | | | | 1,076,719 | |
CSRA Incorporated | | | | | | | | | | | 5,415 | | | | 145,664 | |
Fidelity National Information Services Incorporated | | | | | | | | | | | 12,190 | | | | 938,996 | |
Fiserv Incorporated † | | | | | | | | | | | 8,173 | | | | 812,968 | |
Global Payments Incorporated | | | | | | | | | | | 5,713 | | | | 438,530 | |
International Business Machines Corporation | | | | | | | | | | | 32,343 | | | | 5,137,686 | |
MasterCard Incorporated Class A | | | | | | | | | | | 35,657 | | | | 3,628,813 | |
Paychex Incorporated | | | | | | | | | | | 11,931 | | | | 690,447 | |
PayPal Holdings Incorporated † | | | | | | | | | | | 41,736 | | | | 1,709,924 | |
Teradata Corporation † | | | | | | | | | | | 4,849 | | | | 150,319 | |
The Western Union Company | | | | | | | | | | | 18,136 | | | | 377,592 | |
Total System Services Incorporated | | | | | | | | | | | 6,152 | | | | 290,067 | |
Visa Incorporated Class A | | | | | | | | | | | 70,145 | | | | 5,800,992 | |
Xerox Corporation | | | | | | | | | | | 31,650 | | | | 320,615 | |
| | | | |
| | | | | | | | | | | | | | | 26,310,188 | |
| | | | | | | | | | | | | | | | |
| | | | |
| Semiconductors & Semiconductor Equipment: 1.96% | | | | | | | | | | | | | | | | |
Analog Devices Incorporated | | | | | | | | | | | 11,432 | | | | 736,792 | |
Applied Materials Incorporated | | | | | | | | | | | 40,192 | | | | 1,211,789 | |
The accompanying notes are an integral part of these financial statements.
| | | | |
| 20 | | Wells Fargo Index Asset Allocation Fund | | Portfolio of investments—September 30, 2016 |
| | | | | | | | | | | | | | | | |
| Security name | | | | | | | | Shares | | | Value | |
| | | | |
| Semiconductors & Semiconductor Equipment (continued) | | | | | | | | | | | | | | | | |
Broadcom Limited | | | | | | | | | | | 14,706 | | | $ | 2,537,079 | |
First Solar Incorporated Ǡ | | | | | | | | | | | 2,854 | | | | 112,704 | |
Intel Corporation | | | | | | | | | | | 175,918 | | | | 6,640,905 | |
KLA-Tencor Corporation | | | | | | | | | | | 5,800 | | | | 404,318 | |
Lam Research Corporation | | | | | | | | | | | 5,959 | | | | 564,377 | |
Linear Technology Corporation | | | | | | | | | | | 8,914 | | | | 528,511 | |
Microchip Technology Incorporated | | | | | | | | | | | 8,005 | | | | 497,431 | |
Micron Technology Incorporated † | | | | | | | | | | | 38,611 | | | | 686,504 | |
NVIDIA Corporation | | | | | | | | | | | 19,893 | | | | 1,363,068 | |
Qorvo Incorporated † | | | | | | | | | | | 4,755 | | | | 265,044 | |
QUALCOMM Incorporated | | | | | | | | | | | 54,796 | | | | 3,753,526 | |
Skyworks Solutions Incorporated | | | | | | | | | | | 6,971 | | | | 530,772 | |
Texas Instruments Incorporated | | | | | | | | | | | 37,303 | | | | 2,617,925 | |
Xilinx Incorporated | | | | | | | | | | | 9,425 | | | | 512,155 | |
| | | | |
| | | | | | | | | | | | | | | 22,962,900 | |
| | | | | | | | | | | | | | | | |
| | | | |
| Software: 2.59% | | | | | | | | | | | | | | | | |
Activision Blizzard Incorporated | | | | | | | | | | | 25,365 | | | | 1,123,670 | |
Adobe Systems Incorporated † | | | | | | | | | | | 18,528 | | | | 2,011,029 | |
Autodesk Incorporated † | | | | | | | | | | | 7,260 | | | | 525,116 | |
CA Incorporated | | | | | | | | | | | 11,683 | | | | 386,474 | |
Citrix Systems Incorporated † | | | | | | | | | | | 5,790 | | | | 493,424 | |
Electronic Arts Incorporated † | | | | | | | | | | | 11,184 | | | | 955,114 | |
Intuit Incorporated | | | | | | | | | | | 9,111 | | | | 1,002,301 | |
Microsoft Corporation | | | | | | | | | | | 289,758 | | | | 16,690,061 | |
Oracle Corporation | | | | | | | | | | | 111,909 | | | | 4,395,786 | |
Red Hat Incorporated † | | | | | | | | | | | 6,734 | | | | 544,309 | |
Salesforce.com Incorporated † | | | | | | | | | | | 23,943 | | | | 1,707,854 | |
Symantec Corporation | | | | | | | | | | | 22,890 | | | | 574,539 | |
| | | | |
| | | | | | | | | | | | | | | 30,409,677 | |
| | | | | | | | | | | | | | | | |
| | | | |
| Technology Hardware, Storage & Peripherals: 2.26% | | | | | | | | | | | | | | | | |
Apple Incorporated | | | | | | | | | | | 200,365 | | | | 22,651,263 | |
Hewlett Packard Enterprise Company | | | | | | | | | | | 61,789 | | | | 1,405,700 | |
HP Incorporated | | | | | | | | | | | 63,617 | | | | 987,972 | |
NetApp Incorporated | | | | | | | | | | | 10,362 | | | | 371,167 | |
Seagate Technology plc | | | | | | | | | | | 11,104 | | | | 428,059 | |
Western Digital Corporation | | | | | | | | | | | 10,569 | | | | 617,969 | |
| | | | |
| | | | | | | | | | | | | | | 26,462,130 | |
| | | | | | | | | | | | | | | | |
| | | | |
Materials: 1.73% | | | | | | | | | | | | | | | | |
| | | | |
| Chemicals: 1.24% | | | | | | | | | | | | | | | | |
Air Products & Chemicals Incorporated | | | | | | | | | | | 8,052 | | | | 1,210,538 | |
Albemarle Corporation | | | | | | | | | | | 4,179 | | | | 357,263 | |
CF Industries Holdings Incorporated | | | | | | | | | | | 8,668 | | | | 211,066 | |
E.I. du Pont de Nemours & Company | | | | | | | | | | | 32,511 | | | | 2,177,262 | |
Eastman Chemical Company | | | | | | | | | | | 5,492 | | | | 371,699 | |
Ecolab Incorporated | | | | | | | | | | | 9,757 | | | | 1,187,622 | |
FMC Corporation | | | | | | | | | | | 4,975 | | | | 240,492 | |
The accompanying notes are an integral part of these financial statements.
| | | | | | |
| Portfolio of investments—September 30, 2016 | | Wells Fargo Index Asset Allocation Fund | | | 21 | |
| | | | | | | | | | | | | | | | |
| Security name | | | | | | | | Shares | | | Value | |
| | | | |
| Chemicals (continued) | | | | | | | | | | | | | | | | |
International Flavors & Fragrances Incorporated | | | | | | | | | | | 2,960 | | | $ | 423,191 | |
LyondellBasell Industries NV Class A | | | | | | | | | | | 12,675 | | | | 1,022,366 | |
Monsanto Company | | | | | | | | | | | 16,271 | | | | 1,662,896 | |
PPG Industries Incorporated | | | | | | | | | | | 9,901 | | | | 1,023,367 | |
Praxair Incorporated | | | | | | | | | | | 10,605 | | | | 1,281,402 | |
The Dow Chemical Company | | | | | | | | | | | 41,899 | | | | 2,171,625 | |
The Mosaic Company | | | | | | | | | | | 13,022 | | | | 318,518 | |
The Sherwin-Williams Company | | | | | | | | | | | 2,983 | | | | 825,277 | |
| | | | |
| | | | | | | | | | | | | | | 14,484,584 | |
| | | | | | | | | | | | | | | | |
| | | | |
| Construction Materials: 0.08% | | | | | | | | | | | | | | | | |
Martin Marietta Materials Incorporated | | | | | | | | | | | 2,358 | | | | 422,341 | |
Vulcan Materials Company | | | | | | | | | | | 4,948 | | | | 562,736 | |
| | | | |
| | | | | | | | | | | | | | | 985,077 | |
| | | | | | | | | | | | | | | | |
| | | | |
| Containers & Packaging: 0.21% | | | | | | | | | | | | | | | | |
Avery Dennison Corporation | | | | | | | | | | | 3,303 | | | | 256,940 | |
Ball Corporation | | | | | | | | | | | 6,478 | | | | 530,872 | |
International Paper Company | | | | | | | | | | | 15,290 | | | | 733,614 | |
Owens-Illinois Incorporated † | | | | | | | | | | | 6,026 | | | | 110,818 | |
Sealed Air Corporation | | | | | | | | | | | 7,314 | | | | 335,127 | |
WestRock Company | | | | | | | | | | | 9,351 | | | | 453,336 | |
| | | | |
| | | | | | | | | | | | | | | 2,420,707 | |
| | | | | | | | | | | | | | | | |
| | | | |
| Metals & Mining: 0.20% | | | | | | | | | | | | | | | | |
Alcoa Incorporated | | | | | | | | | | | 48,911 | | | | 495,958 | |
Freeport-McMoRan Incorporated † | | | | | | | | | | | 45,438 | | | | 493,457 | |
Newmont Mining Corporation | | | | | | | | | | | 19,730 | | | | 775,192 | |
Nucor Corporation | | | | | | | | | | | 11,837 | | | | 585,340 | |
| | | | |
| | | | | | | | | | | | | | | 2,349,947 | |
| | | | | | | | | | | | | | | | |
| | | | |
Real Estate: 1.82% | | | | | | | | | | | | | | | | |
| | | | |
| Equity REITs: 1.79% | | | | | | | | | | | | | | | | |
American Tower Corporation | | | | | | | | | | | 15,821 | | | | 1,792,994 | |
Apartment Investment & Management Company Class A | | | | | | | | | | | 5,823 | | | | 267,334 | |
AvalonBay Communities Incorporated | | | | | | | | | | | 5,105 | | | | 907,873 | |
Boston Properties Incorporated | | | | | | | | | | | 5,715 | | | | 778,897 | |
Crown Castle International Corporation | | | | | | | | | | | 12,552 | | | | 1,182,524 | |
Digital Realty Trust Incorporated | | | | | | | | | | | 5,460 | | | | 530,275 | |
Equinix Incorporated | | | | | | | | | | | 2,643 | | | | 952,141 | |
Equity Residential | | | | | | | | | | | 13,592 | | | | 874,373 | |
Essex Property Trust Incorporated | | | | | | | | | | | 2,435 | | | | 542,275 | |
Extra Space Storage Incorporated | | | | | | | | | | | 4,677 | | | | 371,401 | |
Federal Realty Investment Trust | | | | | | | | | | | 2,636 | | | | 405,759 | |
General Growth Properties Incorporated | | | | | | | | | | | 21,712 | | | | 599,251 | |
HCP Incorporated | | | | | | | | | | | 17,386 | | | | 659,799 | |
Host Hotels & Resorts Incorporated | | | | | | | | | | | 27,608 | | | | 429,857 | |
Iron Mountain Incorporated | | | | | | | | | | | 9,103 | | | | 341,636 | |
The accompanying notes are an integral part of these financial statements.
| | | | |
| 22 | | Wells Fargo Index Asset Allocation Fund | | Portfolio of investments—September 30, 2016 |
| | | | | | | | | | | | | | | | |
| Security name | | | | | | | | Shares | | | Value | |
| | | | |
| Equity REITs (continued) | | | | | | | | | | | | | | | | |
Kimco Realty Corporation | | | | | | | | | | | 15,618 | | | $ | 452,141 | |
Prologis Incorporated | | | | | | | | | | | 19,594 | | | | 1,049,063 | |
Public Storage Incorporated | | | | | | | | | | | 5,544 | | | | 1,237,088 | |
Realty Income Corporation | | | | | | | | | | | 9,614 | | | | 643,465 | |
Simon Property Group Incorporated | | | | | | | | | | | 11,684 | | | | 2,418,705 | |
SL Green Realty Corporation | | | | | | | | | | | 3,730 | | | | 403,213 | |
The Macerich Company | | | | | | | | | | | 4,486 | | | | 362,783 | |
UDR Incorporated | | | | | | | | | | | 9,930 | | | | 357,381 | |
Ventas Incorporated | | | | | | | | | | | 13,064 | | | | 922,710 | |
Vornado Realty Trust | | | | | | | | | | | 6,389 | | | | 646,631 | |
Welltower Incorporated | | | | | | | | | | | 13,308 | | | | 995,039 | |
Weyerhaeuser Company | | | | | | | | | | | 27,840 | | | | 889,210 | |
| | | | |
| | | | | | | | | | | | | | | 21,013,818 | |
| | | | | | | | | | | | | | | | |
| | | | |
| Real Estate Management & Development: 0.03% | | | | | | | | | | | | | | | | |
CBRE Group Incorporated Class A † | | | | | | | | | | | 11,107 | | | | 310,774 | |
| | | | | | | | | | | | | | | | |
| | | | |
Telecommunication Services: 1.57% | | | | | | | | | | | | | | | | |
| | | | |
| Diversified Telecommunication Services: 1.57% | | | | | | | | | | | | | | | | |
AT&T Incorporated | | | | | | | | | | | 228,757 | | | | 9,289,822 | |
CenturyLink Incorporated | | | | | | | | | | | 20,301 | | | | 556,856 | |
Frontier Communications Corporation | | | | | | | | | | | 43,619 | | | | 181,455 | |
Level 3 Communications Incorporated † | | | | | | | | | | | 10,828 | | | | 502,203 | |
Verizon Communications Incorporated | | | | | | | | | | | 151,573 | | | | 7,878,765 | |
| | | | |
| | | | | | | | | | | | | | | 18,409,101 | |
| | | | | | | | | | | | | | | | |
| | | | |
Utilities: 1.95% | | | | | | | | | | | | | | | | |
| | | | |
| Electric Utilities: 1.22% | | | | | | | | | | | | | | | | |
Alliant Energy Corporation | | | | | | | | | | | 8,453 | | | | 323,834 | |
American Electric Power Company Incorporated | | | | | | | | | | | 18,283 | | | | 1,173,951 | |
Duke Energy Corporation | | | | | | | | | | | 25,617 | | | | 2,050,385 | |
Edison International | | | | | | | | | | | 12,115 | | | | 875,309 | |
Entergy Corporation | | | | | | | | | | | 6,655 | | | | 510,638 | |
Eversource Energy | | | | | | | | | | | 11,795 | | | | 639,053 | |
Exelon Corporation | | | | | | | | | | | 34,316 | | | | 1,142,380 | |
FirstEnergy Corporation | | | | | | | | | | | 15,810 | | | | 522,995 | |
NextEra Energy Incorporated | | | | | | | | | | | 17,367 | | | | 2,124,331 | |
PG&E Corporation | | | | | | | | | | | 18,536 | | | | 1,133,847 | |
Pinnacle West Capital Corporation | | | | | | | | | | | 4,133 | | | | 314,067 | |
PPL Corporation | | | | | | | | | | | 25,214 | | | | 871,648 | |
The Southern Company | | | | | | | | | | | 36,392 | | | | 1,866,910 | |
Xcel Energy Incorporated | | | | | | | | | | | 18,888 | | | | 777,052 | |
| | | | |
| | | | | | | | | | | | | | | 14,326,400 | |
| | | | | | | | | | | | | | | | |
| | | | |
| Independent Power & Renewable Electricity Producers: 0.04% | | | | | | | | | | | | | | | | |
AES Corporation | | | | | | | | | | | 24,507 | | | | 314,915 | |
NRG Energy Incorporated | | | | | | | | | | | 11,723 | | | | 131,415 | |
| | | | |
| | | | | | | | | | | | | | | 446,330 | |
| | | | | | | | | | | | | | | | |
The accompanying notes are an integral part of these financial statements.
| | | | | | |
| Portfolio of investments—September 30, 2016 | | Wells Fargo Index Asset Allocation Fund | | | 23 | |
| | | | | | | | | | | | | | | | |
| Security name | | | | | | | | Shares | | | Value | |
| | | | |
| Multi-Utilities: 0.65% | | | | | | | | | | | | | | | | |
Ameren Corporation | | | | | | | | | | | 9,022 | | | $ | 443,702 | |
CenterPoint Energy Incorporated | | | | | | | | | | | 16,014 | | | | 372,005 | |
CMS Energy Corporation | | | | | | | | | | | 10,375 | | | | 435,854 | |
Consolidated Edison Incorporated | | | | | | | | | | | 11,319 | | | | 852,321 | |
Dominion Resources Incorporated | | | | | | | | | | | 23,268 | | | | 1,728,114 | |
DTE Energy Company | | | | | | | | | | | 6,672 | | | | 624,966 | |
NiSource Incorporated | | | | | | | | | | | 11,979 | | | | 288,814 | |
Public Service Enterprise Group Incorporated | | | | | | | | | | | 18,812 | | | | 787,658 | |
SCANA Corporation | | | | | | | | | | | 5,314 | | | | 384,574 | |
Sempra Energy | | | | | | | | | | | 9,288 | | | | 995,581 | |
WEC Energy Group Incorporated | | | | | | | | | | | 11,736 | | | | 702,752 | |
| | | | |
| | | | | | | | | | | | | | | 7,616,341 | |
| | | | | | | | | | | | | | | | |
| | | | |
| Water Utilities: 0.04% | | | | | | | | | | | | | | | | |
American Water Works Company Incorporated | | | | | | | | | | | 6,615 | | | | 495,067 | |
| | | | | | | | | | | | | | | | |
| | | | |
Total Common Stocks (Cost $439,442,236) | | | | | | | | | | | | | | | 696,898,292 | |
| | | | | | | | | | | | | | | | |
| | | | |
| | | Interest rate | | | Maturity date | | | Principal | | | | |
| Non-Agency Mortgage-Backed Securities: 0.00% | | | | | | | | | | | | | | | | |
Citigroup Mortgage Loan Trust Incorporated Series 2004-HYB4 Class AA ± | | | 0.85 | % | | | 12-25-2034 | | | $ | 18,660 | | | | 16,312 | |
| | | | | | | | | | | | | | | | |
| | | | |
Total Non-Agency Mortgage-Backed Securities (Cost $18,660) | | | | | | | | | | | | | | | 16,312 | |
| | | | | | | | | | | | | | | | |
| | | | |
| | | | | | Expiration date | | | Shares | | | | |
| Rights: 0.00% | | | | | | | | | | | | | | | | |
| | | | |
Consumer Staples: 0.00% | | | | | | | | | | | | | | | | |
| | | | |
| Food & Staples Retailing: 0.00% | | | | | | | | | | | | | | | | |
Safeway Casa Ley Contingent Value Rights †(a)(i) | | | | | | | 1-30-2019 | | | | 6,765 | | | | 0 | |
Safeway PDC LLC Contingent Value Rights †(a)(i) | | | | | | | 1-30-2017 | | | | 6,765 | | | | 0 | |
| | | | |
| | | | | | | | | | | | | | | 0 | |
| | | | | | | | | | | | | | | | |
| | | | |
Total Rights (Cost $7,171) | | | | | | | | | | | | | | | 0 | |
| | | | | | | | | | | | | | | | |
| | | | |
| | | | | | Maturity date | | | Principal | | | | |
| U.S. Treasury Securities: 39.01% | | | | | | | | | | | | | | | | |
U.S. Treasury Bond | | | 2.75 | | | | 8-15-2042 | | | $ | 1,340,000 | | | | 1,464,368 | |
U.S. Treasury Bond | | | 2.75 | | | | 11-15-2042 | | | | 1,781,000 | | | | 1,944,490 | |
U.S. Treasury Bond | | | 2.88 | | | | 5-15-2043 | | | | 2,534,000 | | | | 2,829,568 | |
U.S. Treasury Bond | | | 3.00 | | | | 5-15-2042 | | | | 904,000 | | | | 1,033,350 | |
U.S. Treasury Bond | | | 3.13 | | | | 11-15-2041 | | | | 846,000 | | | | 987,374 | |
U.S. Treasury Bond | | | 3.13 | | | | 2-15-2042 | | | | 1,066,000 | | | | 1,244,888 | |
U.S. Treasury Bond | | | 3.13 | | | | 2-15-2043 | | | | 1,783,000 | | | | 2,083,534 | |
U.S. Treasury Bond | | | 3.50 | | | | 2-15-2039 | | | | 731,000 | | | | 907,325 | |
U.S. Treasury Bond | | | 3.75 | | | | 8-15-2041 | | | | 929,000 | | | | 1,196,632 | |
U.S. Treasury Bond | | | 3.88 | | | | 8-15-2040 | | | | 946,000 | | | | 1,237,043 | |
U.S. Treasury Bond | | | 4.25 | | | | 5-15-2039 | | | | 681,000 | | | | 935,710 | |
U.S. Treasury Bond | | | 4.25 | | | | 11-15-2040 | | | | 977,000 | | | | 1,348,451 | |
The accompanying notes are an integral part of these financial statements.
| | | | |
| 24 | | Wells Fargo Index Asset Allocation Fund | | Portfolio of investments—September 30, 2016 |
| | | | | | | | | | | | | | | | |
| Security name | | Interest rate | | | Maturity date | | | Principal | | | Value | |
| | | | |
U.S. Treasury Securities (continued) | | | | | | | | | | | | | | | | |
U.S. Treasury Bond | | | 4.38 | % | | | 2-15-2038 | | | $ | 381,000 | | | $ | 532,462 | |
U.S. Treasury Bond | | | 4.38 | | | | 11-15-2039 | | | | 757,000 | | | | 1,057,967 | |
U.S. Treasury Bond | | | 4.38 | | | | 5-15-2040 | | | | 1,078,000 | | | | 1,509,748 | |
U.S. Treasury Bond | | | 4.38 | | | | 5-15-2041 | | | | 842,000 | | | | 1,185,510 | |
U.S. Treasury Bond | | | 4.50 | | | | 2-15-2036 | | | | 837,000 | | | | 1,179,942 | |
U.S. Treasury Bond | | | 4.50 | | | | 5-15-2038 | | | | 428,000 | | | | 608,763 | |
U.S. Treasury Bond | | | 4.50 | | | | 8-15-2039 | | | | 721,000 | | | | 1,024,214 | |
U.S. Treasury Bond | | | 4.63 | | | | 2-15-2040 | | | | 1,276,000 | | | | 1,845,216 | |
U.S. Treasury Bond | | | 4.75 | | | | 2-15-2037 | | | | 264,000 | | | | 383,821 | |
U.S. Treasury Bond | | | 4.75 | | | | 2-15-2041 | | | | 1,084,000 | | | | 1,602,923 | |
U.S. Treasury Bond | | | 5.00 | | | | 5-15-2037 | | | | 375,000 | | | | 562,822 | |
U.S. Treasury Bond | | | 5.25 | | | | 11-15-2028 | | | | 479,000 | | | | 663,845 | |
U.S. Treasury Bond | | | 5.25 | | | | 2-15-2029 | | | | 349,000 | | | | 485,792 | |
U.S. Treasury Bond | | | 5.38 | | | | 2-15-2031 | | | | 752,000 | | | | 1,098,302 | |
U.S. Treasury Bond | | | 5.50 | | | | 8-15-2028 | | | | 369,000 | | | | 519,267 | |
U.S. Treasury Bond | | | 6.00 | | | | 2-15-2026 | | | | 445,000 | | | | 617,281 | |
U.S. Treasury Bond | | | 6.13 | | | | 11-15-2027 | | | | 525,000 | | | | 762,726 | |
U.S. Treasury Bond | | | 6.13 | | | | 8-15-2029 | | | | 293,000 | | | | 441,056 | |
U.S. Treasury Bond | | | 6.25 | | | | 5-15-2030 | | | | 478,000 | | | | 738,622 | |
U.S. Treasury Bond | | | 6.38 | | | | 8-15-2027 | | | | 224,000 | | | | 329,446 | |
U.S. Treasury Bond | | | 6.50 | | | | 11-15-2026 | | | | 296,000 | | | | 431,420 | |
U.S. Treasury Bond | | | 6.63 | | | | 2-15-2027 | | | | 215,000 | | | | 318,124 | |
U.S. Treasury Note | | | 0.50 | | | | 4-30-2017 | | | | 1,456,000 | | | | 1,455,601 | |
U.S. Treasury Note | | | 0.50 | | | | 7-31-2017 | | | | 1,713,000 | | | | 1,711,260 | |
U.S. Treasury Note | | | 0.63 | | | | 5-31-2017 | | | | 3,382,000 | | | | 3,382,528 | |
U.S. Treasury Note | | | 0.63 | | | | 6-30-2017 | | | | 1,440,000 | | | | 1,440,112 | |
U.S. Treasury Note | | | 0.63 | | | | 7-31-2017 | | | | 1,401,000 | | | | 1,400,836 | |
U.S. Treasury Note | | | 0.63 | | | | 8-31-2017 | | | | 3,435,000 | | | | 3,433,791 | |
U.S. Treasury Note | | | 0.63 | | | | 9-30-2017 | | | | 3,180,000 | | | | 3,178,487 | |
U.S. Treasury Note | | | 0.63 | | | | 11-30-2017 | | | | 1,966,000 | | | | 1,964,388 | |
U.S. Treasury Note | | | 0.63 | | | | 4-30-2018 | | | | 1,753,000 | | | | 1,750,192 | |
U.S. Treasury Note | | | 0.63 | | | | 6-30-2018 | | | | 1,609,000 | | | | 1,605,417 | |
U.S. Treasury Note | | | 0.75 | | | | 6-30-2017 | | | | 1,845,000 | | | | 1,846,878 | |
U.S. Treasury Note | | | 0.75 | | | | 10-31-2017 | | | | 3,139,000 | | | | 3,140,839 | |
U.S. Treasury Note | | | 0.75 | | | | 12-31-2017 | �� | | | 1,742,000 | | | | 1,742,613 | |
U.S. Treasury Note | | | 0.75 | | | | 1-31-2018 | | | | 1,502,000 | | | | 1,502,410 | |
U.S. Treasury Note | | | 0.75 | | | | 2-28-2018 | | | | 3,204,000 | | | | 3,204,875 | |
U.S. Treasury Note | | | 0.75 | | | | 3-31-2018 | | | | 1,422,000 | | | | 1,422,333 | |
U.S. Treasury Note | | | 0.75 | | | | 4-15-2018 | | | | 1,350,000 | | | | 1,350,211 | |
U.S. Treasury Note | | | 0.75 | | | | 4-30-2018 | | | | 1,588,000 | | | | 1,588,248 | |
U.S. Treasury Note | | | 0.75 | | | | 7-31-2018 | | | | 1,717,000 | | | | 1,716,531 | |
U.S. Treasury Note « | | | 0.75 | | | | 8-31-2018 | | | | 1,718,000 | | | | 1,717,598 | |
U.S. Treasury Note | | | 0.75 | | | | 2-15-2019 | | | | 1,392,000 | | | | 1,389,281 | |
U.S. Treasury Note | | | 0.75 | | | | 7-15-2019 | | | | 1,583,000 | | | | 1,577,683 | |
U.S. Treasury Note | | | 0.75 | | | | 8-15-2019 | | | | 1,584,000 | | | | 1,578,369 | |
U.S. Treasury Note | | | 0.88 | | | | 4-15-2017 | | | | 1,697,000 | | | | 1,700,182 | |
U.S. Treasury Note | | | 0.88 | | | | 4-30-2017 | | | | 1,951,000 | | | | 1,954,760 | |
U.S. Treasury Note | | | 0.88 | | | | 5-15-2017 | | | | 1,620,000 | | | | 1,623,038 | |
U.S. Treasury Note | | | 0.88 | | | | 6-15-2017 | | | | 1,586,000 | | | | 1,588,974 | |
The accompanying notes are an integral part of these financial statements.
| | | | | | |
| Portfolio of investments—September 30, 2016 | | Wells Fargo Index Asset Allocation Fund | | | 25 | |
| | | | | | | | | | | | | | | | |
| Security name | | Interest rate | | | Maturity date | | | Principal | | | Value | |
| | | | |
U.S. Treasury Securities (continued) | | | | | | | | | | | | | | | | |
U.S. Treasury Note | | | 0.88 | % | | | 7-15-2017 | | | $ | 1,515,000 | | | $ | 1,517,782 | |
U.S. Treasury Note | | | 0.88 | | | | 8-15-2017 | | | | 1,518,000 | | | | 1,520,905 | |
U.S. Treasury Note | | | 0.88 | | | | 10-15-2017 | | | | 1,521,000 | | | | 1,523,971 | |
U.S. Treasury Note | | | 0.88 | | | | 11-15-2017 | | | | 1,445,000 | | | | 1,447,709 | |
U.S. Treasury Note | | | 0.88 | | | | 11-30-2017 | | | | 1,474,000 | | | | 1,476,936 | |
U.S. Treasury Note | | | 0.88 | | | | 1-15-2018 | | | | 1,339,000 | | | | 1,341,720 | |
U.S. Treasury Note | | | 0.88 | | | | 1-31-2018 | | | | 1,231,000 | | | | 1,233,548 | |
U.S. Treasury Note | | | 0.88 | | | | 3-31-2018 | | | | 1,577,000 | | | | 1,580,141 | |
U.S. Treasury Note | | | 0.88 | | | | 5-31-2018 | | | | 1,585,000 | | | | 1,588,219 | |
U.S. Treasury Note | | | 0.88 | | | | 7-15-2018 | | | | 1,294,000 | | | | 1,296,325 | |
U.S. Treasury Note | | | 0.88 | | | | 10-15-2018 | | | | 1,390,000 | | | | 1,392,227 | |
U.S. Treasury Note | | | 0.88 | | | | 4-15-2019 | | | | 1,460,000 | | | | 1,460,913 | |
U.S. Treasury Note | | | 0.88 | | | | 5-15-2019 | | | | 1,466,000 | | | | 1,466,630 | |
U.S. Treasury Note | | | 0.88 | | | | 6-15-2019 | | | | 1,485,000 | | | | 1,485,232 | |
U.S. Treasury Note | | | 0.88 | | | | 7-31-2019 | | | | 811,000 | | | | 811,127 | |
U.S. Treasury Note | | | 1.00 | | | | 3-31-2017 | | | | 1,836,000 | | | | 1,840,955 | |
U.S. Treasury Note | | | 1.00 | | | | 9-15-2017 | | | | 1,515,000 | | | | 1,519,734 | |
U.S. Treasury Note | | | 1.00 | | | | 12-15-2017 | | | | 1,405,000 | | | | 1,409,940 | |
U.S. Treasury Note | | | 1.00 | | | | 12-31-2017 | | | | 1,473,000 | | | | 1,478,064 | |
U.S. Treasury Note | | | 1.00 | | | | 2-15-2018 | | | | 1,336,000 | | | | 1,340,906 | |
U.S. Treasury Note | | | 1.00 | | | | 3-15-2018 | | | | 1,338,000 | | | | 1,343,226 | |
U.S. Treasury Note | | | 1.00 | | | | 5-15-2018 | | | | 1,328,000 | | | | 1,333,239 | |
U.S. Treasury Note | | | 1.00 | | | | 5-31-2018 | | | | 1,878,000 | | | | 1,885,555 | |
U.S. Treasury Note | | | 1.00 | | | | 8-15-2018 | | | | 1,291,000 | | | | 1,296,447 | |
U.S. Treasury Note | | | 1.00 | | | | 9-15-2018 | | | | 1,292,000 | | | | 1,297,147 | |
U.S. Treasury Note | | | 1.00 | | | | 3-15-2019 | | | | 1,383,000 | | | | 1,388,186 | |
U.S. Treasury Note | | | 1.00 | | | | 6-30-2019 | | | | 622,000 | | | | 624,308 | |
U.S. Treasury Note | | | 1.00 | | | | 8-31-2019 | | | | 1,842,000 | | | | 1,847,613 | |
U.S. Treasury Note | | | 1.00 | | | | 9-30-2019 | | | | 1,695,000 | | | | 1,699,966 | |
U.S. Treasury Note | | | 1.00 | | | | 11-30-2019 | | | | 1,985,000 | | | | 1,988,722 | |
U.S. Treasury Note | | | 1.13 | | | | 6-15-2018 | | | | 1,326,000 | | | | 1,334,184 | |
U.S. Treasury Note | | | 1.13 | | | | 1-15-2019 | | | | 1,444,000 | | | | 1,453,590 | |
U.S. Treasury Note | | | 1.13 | | | | 5-31-2019 | | | | 690,000 | | | | 695,040 | |
U.S. Treasury Note | | | 1.13 | | | | 12-31-2019 | | | | 1,247,000 | | | | 1,253,771 | |
U.S. Treasury Note | | | 1.13 | | | | 3-31-2020 | | | | 1,987,000 | | | | 1,996,315 | |
U.S. Treasury Note | | | 1.13 | | | | 4-30-2020 | | | | 1,330,000 | | | | 1,335,611 | |
U.S. Treasury Note | | | 1.13 | | | | 2-28-2021 | | | | 3,264,000 | | | | 3,266,167 | |
U.S. Treasury Note | | | 1.13 | | | | 6-30-2021 | | | | 3,343,000 | | | | 3,339,343 | |
U.S. Treasury Note | | | 1.13 | | | | 7-31-2021 | | | | 2,232,000 | | | | 2,228,949 | |
U.S. Treasury Note | | | 1.13 | | | | 8-31-2021 | | | | 2,233,000 | | | | 2,230,905 | |
U.S. Treasury Note | | | 1.25 | | | | 10-31-2018 | | | | 1,759,000 | | | | 1,774,871 | |
U.S. Treasury Note | | | 1.25 | | | | 11-15-2018 | | | | 1,370,000 | | | | 1,382,470 | |
U.S. Treasury Note | | | 1.25 | | | | 11-30-2018 | | | | 1,654,000 | | | | 1,669,184 | |
U.S. Treasury Note | | | 1.25 | | | | 12-15-2018 | | | | 1,363,000 | | | | 1,375,725 | |
U.S. Treasury Note | | | 1.25 | | | | 1-31-2019 | | | | 1,335,000 | | | | 1,347,986 | |
U.S. Treasury Note | | | 1.25 | | | | 4-30-2019 | | | | 586,000 | | | | 591,974 | |
U.S. Treasury Note | | | 1.25 | | | | 10-31-2019 | | | | 804,000 | | | | 812,040 | |
U.S. Treasury Note | | | 1.25 | | | | 1-31-2020 | | | | 3,442,000 | | | | 3,473,463 | |
U.S. Treasury Note | | | 1.25 | | | | 2-29-2020 | | | | 1,745,000 | | | | 1,760,405 | |
U.S. Treasury Note | | | 1.25 | | | | 3-31-2021 | | | | 3,250,000 | | | | 3,267,011 | |
The accompanying notes are an integral part of these financial statements.
| | | | |
| 26 | | Wells Fargo Index Asset Allocation Fund | | Portfolio of investments—September 30, 2016 |
| | | | | | | | | | | | | | | | |
| Security name | | Interest rate | | | Maturity date | | | Principal | | | Value | |
| | | | |
U.S. Treasury Securities (continued) | | | | | | | | | | | | | | | | |
U.S. Treasury Note | | | 1.25 | % | | | 7-31-2023 | | | $ | 1,829,000 | | | $ | 1,810,282 | |
U.S. Treasury Note | | | 1.38 | | | | 6-30-2018 | | | | 1,357,000 | | | | 1,371,206 | |
U.S. Treasury Note | | | 1.38 | | | | 7-31-2018 | | | | 1,610,000 | | | | 1,627,483 | |
U.S. Treasury Note | | | 1.38 | | | | 9-30-2018 | | | | 2,875,000 | | | | 2,907,344 | |
U.S. Treasury Note | | | 1.38 | | | | 11-30-2018 | | | | 787,000 | | | | 796,407 | |
U.S. Treasury Note | | | 1.38 | | | | 12-31-2018 | | | | 968,000 | | | | 979,759 | |
U.S. Treasury Note | | | 1.38 | | | | 2-28-2019 | | | | 1,295,000 | | | | 1,311,339 | |
U.S. Treasury Note | | | 1.38 | | | | 1-31-2020 | | | | 2,293,000 | | | | 2,322,917 | |
U.S. Treasury Note | | | 1.38 | | | | 2-29-2020 | | | | 3,442,000 | | | | 3,486,639 | |
U.S. Treasury Note | | | 1.38 | | | | 3-31-2020 | | | | 3,442,000 | | | | 3,487,042 | |
U.S. Treasury Note | | | 1.38 | | | | 4-30-2020 | | | | 3,442,000 | | | | 3,486,908 | |
U.S. Treasury Note | | | 1.38 | | | | 5-31-2020 | | | | 1,380,000 | | | | 1,397,304 | |
U.S. Treasury Note | | | 1.38 | | | | 8-31-2020 | | | | 3,350,000 | | | | 3,390,960 | |
U.S. Treasury Note | | | 1.38 | | | | 9-30-2020 | | | | 3,356,000 | | | | 3,395,983 | |
U.S. Treasury Note | | | 1.38 | | | | 10-31-2020 | | | | 3,178,000 | | | | 3,214,995 | |
U.S. Treasury Note | | | 1.38 | | | | 1-31-2021 | | | | 3,192,000 | | | | 3,226,914 | |
U.S. Treasury Note | | | 1.38 | | | | 4-30-2021 | | | | 3,245,000 | | | | 3,279,225 | |
U.S. Treasury Note | | | 1.38 | | | | 5-31-2021 | | | | 3,248,000 | | | | 3,283,527 | |
U.S. Treasury Note | | | 1.38 | | | | 6-30-2023 | | | | 1,733,000 | | | | 1,730,361 | |
U.S. Treasury Note | | | 1.38 | | | | 8-31-2023 | | | | 1,817,000 | | | | 1,811,961 | |
U.S. Treasury Note | | | 1.50 | | | | 8-31-2018 | | | | 2,781,000 | | | | 2,818,371 | |
U.S. Treasury Note | | | 1.50 | | | | 12-31-2018 | | | | 1,855,000 | | | | 1,882,753 | |
U.S. Treasury Note | | | 1.50 | | | | 1-31-2019 | | | | 1,716,000 | | | | 1,742,275 | |
U.S. Treasury Note | | | 1.50 | | | | 2-28-2019 | | | | 1,826,000 | | | | 1,854,389 | |
U.S. Treasury Note | | | 1.50 | | | | 3-31-2019 | | | | 645,000 | | | | 655,456 | |
U.S. Treasury Note | | | 1.50 | | | | 5-31-2019 | | | | 1,966,000 | | | | 1,998,716 | |
U.S. Treasury Note | | | 1.50 | | | | 10-31-2019 | | | | 3,442,000 | | | | 3,502,101 | |
U.S. Treasury Note | | | 1.50 | | | | 11-30-2019 | | | | 3,133,000 | | | | 3,187,583 | |
U.S. Treasury Note | | | 1.50 | | | | 5-31-2020 | | | | 3,442,000 | | | | 3,501,161 | |
U.S. Treasury Note | | | 1.50 | | | | 1-31-2022 | | | | 1,625,000 | | | | 1,646,772 | |
U.S. Treasury Note | | | 1.50 | | | | 2-28-2023 | | | | 1,635,000 | | | | 1,648,221 | |
U.S. Treasury Note | | | 1.50 | | | | 3-31-2023 | | | | 1,679,000 | | | | 1,691,527 | |
U.S. Treasury Note | | | 1.50 | | | | 8-15-2026 | | | | 1,493,000 | | | | 1,479,529 | |
U.S. Treasury Note | | | 1.63 | | | | 3-31-2019 | | | | 2,104,000 | | | | 2,143,860 | |
U.S. Treasury Note | | | 1.63 | | | | 4-30-2019 | | | | 1,703,000 | | | | 1,735,863 | |
U.S. Treasury Note | | | 1.63 | | | | 6-30-2019 | | | | 2,157,000 | | | | 2,200,561 | |
U.S. Treasury Note | | | 1.63 | | | | 7-31-2019 | | | | 2,128,000 | | | | 2,172,056 | |
U.S. Treasury Note | | | 1.63 | | | | 8-31-2019 | | | | 3,442,000 | | | | 3,514,337 | |
U.S. Treasury Note | | | 1.63 | | | | 12-31-2019 | | | | 3,442,000 | | | | 3,515,545 | |
U.S. Treasury Note | | | 1.63 | | | | 6-30-2020 | | | | 3,442,000 | | | | 3,517,160 | |
U.S. Treasury Note | | | 1.63 | | | | 7-31-2020 | | | | 3,213,000 | | | | 3,282,908 | |
U.S. Treasury Note | | | 1.63 | | | | 11-30-2020 | | | | 2,166,000 | | | | 2,212,959 | |
U.S. Treasury Note | | | 1.63 | | | | 8-15-2022 | | | | 1,250,000 | | | | 1,272,754 | |
U.S. Treasury Note | | | 1.63 | | | | 11-15-2022 | | | | 2,108,000 | | | | 2,143,655 | |
U.S. Treasury Note | | | 1.63 | | | | 4-30-2023 | | | | 1,711,000 | | | | 1,736,532 | |
U.S. Treasury Note | | | 1.63 | | | | 5-31-2023 | | | | 1,714,000 | | | | 1,739,175 | |
U.S. Treasury Note | | | 1.63 | | | | 2-15-2026 | | | | 3,818,000 | | | | 3,827,396 | |
U.S. Treasury Note | | | 1.63 | | | | 5-15-2026 | | | | 2,661,000 | | | | 2,666,197 | |
U.S. Treasury Note | | | 1.75 | | | | 10-31-2018 | | | | 704,000 | | | | 717,613 | |
U.S. Treasury Note | | | 1.75 | | | | 9-30-2019 | | | | 3,441,000 | | | | 3,526,622 | |
The accompanying notes are an integral part of these financial statements.
| | | | | | |
| Portfolio of investments—September 30, 2016 | | Wells Fargo Index Asset Allocation Fund | | | 27 | |
| | | | | | | | | | | | | | | | |
| Security name | | Interest rate | | | Maturity date | | | Principal | | | Value | |
| | | | |
U.S. Treasury Securities (continued) | | | | | | | | | | | | | | | | |
U.S. Treasury Note | | | 1.75 | % | | | 10-31-2020 | | | $ | 1,585,000 | | | $ | 1,626,668 | |
U.S. Treasury Note | | | 1.75 | | | | 12-31-2020 | | | | 3,353,000 | | | | 3,442,589 | |
U.S. Treasury Note | | | 1.75 | | | | 2-28-2022 | | | | 1,637,000 | | | | 1,679,844 | |
U.S. Treasury Note | | | 1.75 | | | | 3-31-2022 | | | | 1,640,000 | | | | 1,682,538 | |
U.S. Treasury Note | | | 1.75 | | | | 4-30-2022 | | | | 1,612,000 | | | | 1,653,245 | |
U.S. Treasury Note | | | 1.75 | | | | 5-15-2022 | | | | 1,448,000 | | | | 1,484,595 | |
U.S. Treasury Note | | | 1.75 | | | | 9-30-2022 | | | | 1,771,000 | | | | 1,814,861 | |
U.S. Treasury Note | | | 1.75 | | | | 1-31-2023 | | | | 1,684,000 | | | | 1,724,061 | |
U.S. Treasury Note | | | 1.75 | | | | 5-15-2023 | | | | 3,117,000 | | | | 3,188,230 | |
U.S. Treasury Note | | | 1.88 | | | | 8-31-2017 | | | | 1,517,000 | | | | 1,533,587 | |
U.S. Treasury Note | | | 1.88 | | | | 9-30-2017 | | | | 1,307,000 | | | | 1,322,419 | |
U.S. Treasury Note | | | 1.88 | | | | 10-31-2017 | | | | 1,485,000 | | | | 1,503,794 | |
U.S. Treasury Note | | | 1.88 | | | | 6-30-2020 | | | | 1,888,000 | | | | 1,945,820 | |
U.S. Treasury Note | | | 1.88 | | | | 11-30-2021 | | | | 1,649,000 | | | | 1,703,237 | |
U.S. Treasury Note | | | 1.88 | | | | 5-31-2022 | | | | 1,795,000 | | | | 1,853,127 | |
U.S. Treasury Note | | | 1.88 | | | | 8-31-2022 | | | | 1,754,000 | | | | 1,810,114 | |
U.S. Treasury Note | | | 1.88 | | | | 10-31-2022 | | | | 1,650,000 | | | | 1,702,594 | |
U.S. Treasury Note | | | 2.00 | | | | 7-31-2020 | | | | 1,306,000 | | | | 1,352,117 | |
U.S. Treasury Note | | | 2.00 | | | | 9-30-2020 | | | | 2,093,000 | | | | 2,168,626 | |
U.S. Treasury Note | | | 2.00 | | | | 11-30-2020 | | | | 2,266,000 | | | | 2,348,940 | |
U.S. Treasury Note | | | 2.00 | | | | 2-28-2021 | | | | 2,421,000 | | | | 2,510,935 | |
U.S. Treasury Note | | | 2.00 | | | | 5-31-2021 | | | | 1,559,000 | | | | 1,618,376 | |
U.S. Treasury Note | | | 2.00 | | | | 8-31-2021 | | | | 1,641,000 | | | | 1,704,589 | |
U.S. Treasury Note | | | 2.00 | | | | 10-31-2021 | | | | 1,649,000 | | | | 1,713,413 | |
U.S. Treasury Note | | | 2.00 | | | | 11-15-2021 | | | | 2,485,000 | | | | 2,581,875 | |
U.S. Treasury Note | | | 2.00 | | | | 2-15-2022 | | | | 1,679,000 | | | | 1,745,242 | |
U.S. Treasury Note | | | 2.00 | | | | 7-31-2022 | | | | 1,778,000 | | | | 1,847,801 | |
U.S. Treasury Note | | | 2.00 | | | | 11-30-2022 | | | | 1,625,000 | | | | 1,688,541 | |
U.S. Treasury Note | | | 2.00 | | | | 2-15-2023 | | | | 3,077,000 | | | | 3,197,074 | |
U.S. Treasury Note | | | 2.00 | | | | 2-15-2025 | | | | 4,005,000 | | | | 4,149,400 | |
U.S. Treasury Note | | | 2.00 | | | | 8-15-2025 | | | | 4,012,000 | | | | 4,154,615 | |
U.S. Treasury Note | | | 2.13 | | | | 8-31-2020 | | | | 1,477,000 | | | | 1,536,658 | |
U.S. Treasury Note | | | 2.13 | | | | 1-31-2021 | | | | 1,409,000 | | | | 1,468,387 | |
U.S. Treasury Note | | | 2.13 | | | | 6-30-2021 | | | | 1,516,000 | | | | 1,583,036 | |
U.S. Treasury Note | | | 2.13 | | | | 8-15-2021 | | | | 2,440,000 | | | | 2,548,180 | |
U.S. Treasury Note | | | 2.13 | | | | 9-30-2021 | | | | 1,633,000 | | | | 1,706,421 | |
U.S. Treasury Note | | | 2.13 | | | | 12-31-2021 | | | | 1,626,000 | | | | 1,699,806 | |
U.S. Treasury Note | | | 2.13 | | | | 6-30-2022 | | | | 1,615,000 | | | | 1,689,379 | |
U.S. Treasury Note | | | 2.13 | | | | 12-31-2022 | | | | 1,678,000 | | | | 1,756,000 | |
U.S. Treasury Note | | | 2.13 | | | | 5-15-2025 | | | | 3,986,000 | | | | 4,169,731 | |
U.S. Treasury Note | | | 2.25 | | | | 11-30-2017 | | | | 1,250,000 | | | | 1,272,266 | |
U.S. Treasury Note | | | 2.25 | | | | 7-31-2018 | | | | 521,000 | | | | 534,961 | |
U.S. Treasury Note | | | 2.25 | | | | 3-31-2021 | | | | 1,440,000 | | | | 1,509,637 | |
U.S. Treasury Note | | | 2.25 | | | | 4-30-2021 | | | | 1,514,000 | | | | 1,588,280 | |
U.S. Treasury Note | | | 2.25 | | | | 7-31-2021 | | | | 2,618,000 | | | | 2,749,822 | |
U.S. Treasury Note | | | 2.25 | | | | 11-15-2024 | | | | 4,019,000 | | | | 4,245,069 | |
U.S. Treasury Note | | | 2.25 | | | | 11-15-2025 | | | | 3,988,000 | | | | 4,212,325 | |
U.S. Treasury Note | | | 2.38 | | | | 7-31-2017 | | | | 1,253,000 | | | | 1,270,919 | |
U.S. Treasury Note | | | 2.38 | | | | 5-31-2018 | | | | 621,000 | | | | 637,520 | |
U.S. Treasury Note | | | 2.38 | | | | 6-30-2018 | | | | 795,000 | | | | 817,049 | |
The accompanying notes are an integral part of these financial statements.
| | | | |
| 28 | | Wells Fargo Index Asset Allocation Fund | | Portfolio of investments—September 30, 2016 |
| | | | | | | | | | | | | | | | |
| Security name | | Interest rate | | | Maturity date | | | Principal | | | Value | |
| | | | |
U.S. Treasury Securities (continued) | | | | | | | | | | | | | | | | |
U.S. Treasury Note | | | 2.38 | % | | | 12-31-2020 | | | $ | 1,317,000 | | | $ | 1,385,937 | |
U.S. Treasury Note | | | 2.38 | | | | 8-15-2024 | | | | 4,000,000 | | | | 4,263,436 | |
U.S. Treasury Note | | | 2.50 | | | | 6-30-2017 | | | | 1,144,000 | | | | 1,160,000 | |
U.S. Treasury Note | | | 2.50 | | | | 8-15-2023 | | | | 2,662,000 | | | | 2,852,605 | |
U.S. Treasury Note | | | 2.50 | | | | 5-15-2024 | | | | 3,897,000 | | | | 4,189,123 | |
U.S. Treasury Note | | | 2.63 | | | | 1-31-2018 | | | | 861,000 | | | | 882,391 | |
U.S. Treasury Note | | | 2.63 | | | | 4-30-2018 | | | | 657,000 | | | | 676,351 | |
U.S. Treasury Note | | | 2.63 | | | | 8-15-2020 | | | | 3,367,000 | | | | 3,566,128 | |
U.S. Treasury Note | | | 2.63 | | | | 11-15-2020 | | | | 5,315,000 | | | | 5,642,202 | |
U.S. Treasury Note | | | 2.75 | | | | 5-31-2017 | | | | 1,136,000 | | | | 1,152,064 | |
U.S. Treasury Note | | | 2.75 | | | | 12-31-2017 | | | | 960,000 | | | | 984,075 | |
U.S. Treasury Note | | | 2.75 | | | | 2-28-2018 | | | | 756,000 | | | | 777,380 | |
U.S. Treasury Note | | | 2.75 | | | | 2-15-2019 | | | | 1,365,000 | | | | 1,426,744 | |
U.S. Treasury Note | | | 2.75 | | | | 11-15-2023 | | | | 3,481,000 | | | | 3,794,290 | |
U.S. Treasury Note | | | 2.75 | | | | 2-15-2024 | | | | 3,003,000 | | | | 3,277,844 | |
U.S. Treasury Note | | | 2.88 | | | | 3-31-2018 | | | | 858,000 | | | | 885,080 | |
U.S. Treasury Note | | | 3.13 | | | | 4-30-2017 | | | | 1,142,000 | | | | 1,158,954 | |
U.S. Treasury Note | | | 3.13 | | | | 5-15-2019 | | | | 1,768,000 | | | | 1,871,663 | |
U.S. Treasury Note | | | 3.13 | | | | 5-15-2021 | | | | 1,657,000 | | | | 1,803,088 | |
U.S. Treasury Note | | | 3.25 | | | | 3-31-2017 | | | | 1,276,000 | | | | 1,293,530 | |
U.S. Treasury Note | | | 3.38 | | | | 11-15-2019 | | | | 3,180,000 | | | | 3,418,376 | |
U.S. Treasury Note | | | 3.50 | | | | 2-15-2018 | | | | 1,278,000 | | | | 1,326,025 | |
U.S. Treasury Note | | | 3.50 | | | | 5-15-2020 | | | | 2,864,000 | | | | 3,115,047 | |
U.S. Treasury Note | | | 3.63 | | | | 8-15-2019 | | | | 1,545,000 | | | | 1,664,738 | |
U.S. Treasury Note | | | 3.63 | | | | 2-15-2020 | | | | 2,648,000 | | | | 2,879,390 | |
U.S. Treasury Note | | | 3.63 | | | | 2-15-2021 | | | | 2,765,000 | | | | 3,058,997 | |
U.S. Treasury Note | | | 3.75 | | | | 11-15-2018 | | | | 1,505,000 | | | | 1,598,122 | |
U.S. Treasury Note | | | 3.88 | | | | 5-15-2018 | | | | 689,000 | | | | 723,961 | |
U.S. Treasury Note | | | 4.00 | | | | 8-15-2018 | | | | 788,000 | | | | 835,988 | |
U.S. Treasury Note | | | 4.25 | | | | 11-15-2017 | | | | 919,000 | | | | 955,183 | |
U.S. Treasury Note | | | 4.50 | | | | 5-15-2017 | | | | 694,000 | | | | 710,754 | |
U.S. Treasury Note | | | 4.75 | | | | 8-15-2017 | | | | 857,000 | | | | 887,263 | |
U.S. Treasury Note | | | 6.25 | | | | 8-15-2023 | | | | 378,000 | | | | 498,621 | |
U.S. Treasury Note | | | 6.75 | | | | 8-15-2026 | | | | 221,000 | | | | 325,543 | |
U.S. Treasury Note | | | 6.88 | | | | 8-15-2025 | | | | 224,000 | | | | 324,056 | |
U.S. Treasury Note | | | 7.13 | | | | 2-15-2023 | | | | 260,000 | | | | 352,198 | |
U.S. Treasury Note | | | 7.25 | | | | 8-15-2022 | | | | 261,000 | | | | 349,353 | |
U.S. Treasury Note | | | 7.50 | | | | 11-15-2024 | | | | 240,000 | | | | 351,581 | |
U.S. Treasury Note | | | 7.63 | | | | 11-15-2022 | | | | 140,000 | | | | 192,134 | |
U.S. Treasury Note | | | 7.63 | | | | 2-15-2025 | | | | 216,000 | | | | 320,895 | |
U.S. Treasury Note | | | 7.88 | | | | 2-15-2021 | | | | 180,000 | | | | 231,933 | |
U.S. Treasury Note | | | 8.00 | | | | 11-15-2021 | | | | 511,000 | | | | 683,602 | |
U.S. Treasury Note | | | 8.13 | | | | 8-15-2019 | | | | 307,000 | | | | 369,635 | |
U.S. Treasury Note | | | 8.13 | | | | 5-15-2021 | | | | 181,000 | | | | 237,881 | |
U.S. Treasury Note | | | 8.13 | | | | 8-15-2021 | | | | 175,000 | | | | 232,545 | |
U.S. Treasury Note | | | 8.50 | | | | 2-15-2020 | | | | 162,000 | | | | 202,525 | |
U.S. Treasury Note | | | 8.75 | | | | 5-15-2017 | | | | 452,000 | | | | 474,706 | |
U.S. Treasury Note | | | 8.75 | | | | 5-15-2020 | | | | 130,000 | | | | 165,704 | |
U.S. Treasury Note | | | 8.75 | | | | 8-15-2020 | | | | 288,000 | | | | 372,420 | |
U.S. Treasury Note | | | 8.88 | | | | 8-15-2017 | | | | 271,000 | | | | 290,203 | |
The accompanying notes are an integral part of these financial statements.
| | | | | | |
| Portfolio of investments—September 30, 2016 | | Wells Fargo Index Asset Allocation Fund | | | 29 | |
| | | | | | | | | | | | | | | | |
| Security name | | Interest rate | | | Maturity date | | | Principal | | | Value | |
| | | | |
U.S. Treasury Securities (continued) | | | | | | | | | | | | | | | | |
U.S. Treasury Note | | | 8.88 | % | | | 2-15-2019 | | | $ | 306,000 | | | $ | 364,272 | |
U.S. Treasury Note | | | 9.00 | | | | 11-15-2018 | | | | 193,000 | | | | 226,436 | |
U.S. Treasury Note | | | 9.13 | | | | 5-15-2018 | | | | 169,000 | | | | 191,756 | |
| | | | |
Total U.S. Treasury Securities (Cost $446,550,180) | | | | | | | | | | | | | | | 457,381,478 | |
| | | | | | | | | | | | | | | | |
| | | | |
| | | Yield | | | | | | Shares | | | | |
| Short-Term Investments: 1.52% | | | | | | | | | | | | | | | | |
| | | | |
| Investment Companies: 1.31% | | | | | | | | | | | | | | | | |
Securities Lending Cash Investments LLC (l)(r)(u) | | | 0.65 | | | | | | | | 2,850,409 | | | | 2,850,409 | |
Wells Fargo Government Money Market Fund Select
Class (l)(u) | | | 0.34 | | | | | | | | 12,501,900 | | | | 12,501,900 | |
| | | | |
| | | | | | | | | | | | | | | 15,352,309 | |
| | | | | | | | | | | | | | | | |
| | | | |
| | | | | | | | | Principal | | | | |
| U.S. Treasury Securities: 0.21% | | | | | | | | | | | | | | | | |
U.S. Treasury Bill (z)# | | | 0.12 | | | | 10-13-2016 | | | $ | 2,477,000 | | | | 2,476,889 | |
| | | | | | | | | | | | | | | | |
| | | | |
Total Short-Term Investments (Cost $17,829,155) | | | | | | | | | | | | | | | 17,829,198 | |
| | | | | | | | | | | | | | | | |
| | | | | | | | |
| Total investments in securities (Cost $903,918,349) * | | | 99.98 | % | | | 1,172,210,252 | |
Other assets and liabilities, net | | | 0.02 | | | | 211,520 | |
| | | | | | | | |
| Total net assets | | | 100.00 | % | | $ | 1,172,421,772 | |
| | | | | | | | |
| † | Non-income-earning security |
| « | All or a portion of this security is on loan. |
| (l) | The issuer of the security is an affiliated person of the Fund as defined in the Investment Company Act of 1940. |
| ± | Variable rate investment. The rate shown is the rate in effect at period end. |
| (a) | The security is fair valued in accordance with procedures approved by the Board of Trustees. |
| (i) | Illiquid security for which the designation as illiquid is unaudited. |
| (r) | The investment is a non-registered investment vehicle purchased with cash collateral received from securities on loan. |
| (u) | The rate represents the 7-day annualized yield at period end. |
| (z) | Zero coupon security. The rate represents the current yield to maturity. |
| # | All or a portion of this security is segregated as collateral for investments in derivative instruments. |
| * | Cost for federal income tax purposes is $926,944,991 and unrealized gains (losses) consists of: |
| | | | |
Gross unrealized gains | | $ | 276,187,177 | |
Gross unrealized losses | | | (30,921,916 | ) |
| | | | |
Net unrealized gains | | $ | 245,265,261 | |
The accompanying notes are an integral part of these financial statements.
| | | | |
| 30 | | Wells Fargo Index Asset Allocation Fund | | Statement of assets and liabilities—September 30, 2016 |
| | | | |
| | | | |
| |
Assets | | | | |
Investments | | | | |
In unaffiliated securities (including $2,804,101 of securities loaned), at value (cost $882,758,589) | | $ | 1,149,381,132 | |
In affiliated securities, at value (cost $21,159,760) | | | 22,829,120 | |
| | | | |
Total investments, at value (cost $903,918,349) | | | 1,172,210,252 | |
Cash | | | 2,929 | |
Receivable for investments sold | | | 42,214 | |
Receivable for Fund shares sold | | | 2,838,482 | |
Receivable for dividends and interest | | | 2,738,406 | |
Receivable for daily variation margin on open futures contracts | | | 765,858 | |
Receivable for securities lending income | | | 1,925 | |
Prepaid expenses and other assets | | | 122,554 | |
| | | | |
Total assets | | | 1,178,722,620 | |
| | | | |
| |
Liabilities | | | | |
Payable for investments purchased | | | 60,294 | |
Payable for Fund shares redeemed | | | 1,993,254 | |
Payable upon receipt of securities loaned | | | 2,850,409 | |
Payable for daily variation margin on open futures contracts | | | 7,805 | |
Management fee payable | | | 609,407 | |
Distribution fees payable | | | 88,321 | |
Administration fees payable | | | 200,079 | |
Accrued expenses and other liabilities | | | 491,279 | |
| | | | |
Total liabilities | | | 6,300,848 | |
| | | | |
Total net assets | | $ | 1,172,421,772 | |
| | | | |
| |
NET ASSETS CONSIST OF | | | | |
Paid-in capital | | $ | 921,348,916 | |
Undistributed net investment income | | | 1,796,877 | |
Accumulated net realized losses on investments | | | (19,384,176 | ) |
Net unrealized gains on investments | | | 268,660,155 | |
| | | | |
Total net assets | | $ | 1,172,421,772 | |
| | | | |
| |
COMPUTATION OF NET ASSET VALUE AND OFFERING PRICE PER SHARE | | | | |
Net assets – Class A | | $ | 828,420,600 | |
Shares outstanding – Class A1 | | | 27,981,680 | |
Net asset value per share – Class A | | | $29.61 | |
Maximum offering price per share – Class A2 | | | $31.42 | |
Net assets – Class B | | $ | 212,078 | |
Shares outstanding – Class B1 | | | 11,694 | |
Net asset value per share – Class B | | | $18.14 | |
Net assets – Class C | | $ | 136,880,907 | |
Shares outstanding – Class C1 | | | 7,610,193 | |
Net asset value per share – Class C | | | $17.99 | |
Net assets – Administrator Class | | $ | 206,908,187 | |
Shares outstanding – Administrator Class1 | | | 6,983,775 | |
Net asset value per share – Administrator Class | | | $29.63 | |
| 1 | The Fund has an unlimited number of authorized shares. |
| 2 | Maximum offering price is computed as 100/94.25 of net asset value. On investments of $50,000 or more, the offering price is reduced. |
The accompanying notes are an integral part of these financial statements.
| | | | | | |
| Statement of operations—year ended September 30, 2016 | | Wells Fargo Index Asset Allocation Fund | | | 31 | |
| | | | |
| | | | |
| |
Investment income | | | | |
Dividends | | $ | 13,320,938 | |
Interest | | | 5,868,898 | |
Income from affiliated securities | | | 325,421 | |
Securities lending income, net | | | 43,604 | |
| | | | |
Total investment income | | | 19,558,861 | |
| | | | |
| |
Expenses | | | | |
Management fee | | | 6,431,904 | |
Administration fees | | | | |
Class A | | | 1,657,529 | |
Class B | | | 402 | |
Class C | | | 198,586 | |
Administrator Class | | | 196,264 | |
Shareholder servicing fees | | | | |
Class A | | | 1,973,218 | |
Class B | | | 478 | |
Class C | | | 236,406 | |
Administrator Class | | | 376,393 | |
Distribution fees | | | | |
Class B | | | 1,434 | |
Class C | | | 709,220 | |
Custody and accounting fees | | | 77,324 | |
Professional fees | | | 24,718 | |
Registration fees | | | 37,217 | |
Shareholder report expenses | | | 49,777 | |
Trustees’ fees and expenses | | | 3,512 | |
Other fees and expenses | | | 26,203 | |
| | | | |
Total expenses | | | 12,000,585 | |
Less: Fee waivers and/or expense reimbursements | | | (180,779 | ) |
| | | | |
Net expenses | | | 11,819,806 | |
| | | | |
Net investment income | | | 7,739,055 | |
| | | | |
| |
REALIZED AND UNREALIZED GAINS (LOSSES) ON INVESTMENTS | | | | |
| |
Net realized gains (losses) on: | | | | |
Unaffiliated securities | | | 8,178,375 | |
Affiliated securities | | | (19,337 | ) |
Futures transactions | | | 933,861 | |
| | | | |
Net realized gains on investments | | | 9,092,899 | |
| | | | |
| |
Net change in unrealized gains (losses) on: | | | | |
Unaffiliated securities | | | 77,713,382 | |
Affiiliated securities | | | (1,110,451 | ) |
Futures transactions | | | 469,738 | |
| | | | |
Net change in unrealized gains (losses) on investments | | | 77,072,669 | |
| | | | |
Net realized and unrealized gains (losses) on investments | | | 86,165,568 | |
| | | | |
Net increase in net assets resulting from operations | | $ | 93,904,623 | |
| | | | |
The accompanying notes are an integral part of these financial statements.
| | | | |
| 32 | | Wells Fargo Index Asset Allocation Fund | | Statement of changes in net assets |
| | | | | | | | | | | | | | | | |
| | | Year ended
September 30, 2016 | | | Year ended
September 30, 2015 | |
| | | | |
Operations | | | | | | | | | | | | | | | | |
Net investment income | | | | | | $ | 7,739,055 | | | | | | | $ | 8,053,389 | |
Net realized gains on investments | | | | | | | 9,092,899 | | | | | | | | 68,963,643 | |
Net change in unrealized gains (losses) on investments | | | | | | | 77,072,669 | | | | | | | | (49,489,229 | ) |
| | | | |
Net increase in net assets resulting from operations | | | | | | | 93,904,623 | | | | | | | | 27,527,803 | |
| | | | |
| | | | |
Distributions to shareholders from | | | | | | | | | | | | | | | | |
Net investment income | | | | | | | | | | | | | | | | |
Class A | | | | | | | (5,683,773 | ) | | | | | | | (5,736,797 | ) |
Class B | | | | | | | (266 | ) | | | | | | | (465 | ) |
Class C | | | | | | | (93,279 | ) | | | | | | | (112,773 | ) |
Administrator Class | | | | | | | (1,345,968 | ) | | | | | | | (895,510 | ) |
Net realized gains | | | | | | | | | | | | | | | | |
Class A | | | | | | | (40,013,880 | ) | | | | | | | (7,330,092 | ) |
Class B | | | | | | | (8,382 | ) | | | | | | | (2,581 | ) |
Class C | | | | | | | (3,781,718 | ) | | | | | | | (323,336 | ) |
Administrator Class | | | | | | | (5,677,540 | ) | | | | | | | (748,042 | ) |
| | | | |
Total distributions to shareholders | | | | | | | (56,604,806 | ) | | | | | | | (15,149,596 | ) |
| | | | |
| | | | |
Capital share transactions | | | Shares | | | | | | | | Shares | | | | | |
Proceeds from shares sold | | | | | | | | | | | | | | | | |
Class A | | | 4,200,951 | | | | 120,374,602 | | | | 3,196,418 | | | | 94,634,140 | |
Class B | | | 15,531 | | | | 269,837 | | | | 8,812 | | | | 160,971 | |
Class C | | | 4,802,237 | | | | 84,206,499 | | | | 2,545,026 | | | | 46,057,126 | |
Administrator Class | | | 5,938,408 | | | | 170,655,831 | | | | 2,296,361 | | | | 67,965,420 | |
| | | | |
| | | | | | | 375,506,769 | | | | | | | | 208,817,657 | |
| | | | |
Reinvestment of distributions | | | | | | | | | | | | | | | | |
Class A | | | 1,593,398 | | | | 44,672,620 | | | | 433,559 | | | | 12,743,979 | |
Class B | | | 338 | | | | 5,803 | | | | 119 | | | | 2,135 | |
Class C | | | 192,234 | | | | 3,269,192 | | | | 22,174 | | | | 396,402 | |
Administrator Class | | | 187,396 | | | | 5,266,424 | | | | 37,826 | | | | 1,115,474 | |
| | | | |
| | | | | | | 53,214,039 | | | | | | | | 14,257,990 | |
| | | | |
Payment for shares redeemed | | | | | | | | | | | | | | | | |
Class A | | | (3,450,379 | ) | | | (99,644,371 | ) | | | (3,132,440 | ) | | | (92,758,439 | ) |
Class B | | | (12,802 | ) | | | (225,638 | ) | | | (21,993 | ) | | | (397,688 | ) |
Class C | | | (934,641 | ) | | | (16,428,230 | ) | | | (417,663 | ) | | | (7,559,550 | ) |
Administrator Class | | | (2,111,814 | ) | | | (61,128,010 | ) | | | (1,483,497 | ) | | | (44,036,539 | ) |
| | | | |
| | | | | | | (177,426,249 | ) | | | | | | | (144,752,216 | ) |
| | | | |
Net increase in net assets resulting from capital share transactions | | | | | | | 251,294,559 | | | | | | | | 78,323,431 | |
| | | | |
Total increase in net assets | | | | | | | 288,594,376 | | | | | | | | 90,701,638 | |
| | | | |
| | | | |
Net assets | | | | | | | | | | | | | | | | |
Beginning of period | | | | | | | 883,827,396 | | | | | | | | 793,125,758 | |
| | | | |
End of period | | | | | | $ | 1,172,421,772 | | | | | | | $ | 883,827,396 | |
| | | | |
Undistributed net investment income | | | | | | $ | 1,796,877 | | | | | | | $ | 1,416,982 | |
| | | | |
The accompanying notes are an integral part of these financial statements.
| | | | | | |
| Financial highlights | | Wells Fargo Index Asset Allocation Fund | | | 33 | |
(For a share outstanding throughout each period)
| | | | | | | | | | | | | | | | | | | | |
| | | Year ended September 30 | |
| CLASS A | | 2016 | | | 2015 | | | 2014 | | | 2013 | | | 2012 | |
Net asset value, beginning of period | | | $28.72 | | | | $28.20 | | | | $24.48 | | | | $22.17 | | | | $18.12 | |
Net investment income | | | 0.22 | | | | 0.27 | | | | 0.38 | | | | 0.34 | | | | 0.29 | |
Net realized and unrealized gains (losses) on investments | | | 2.45 | | | | 0.76 | | | | 3.72 | | | | 2.31 | | | | 4.05 | |
| | | | | | | | | | | | | | | | | | | | |
Total from investment operations | | | 2.67 | | | | 1.03 | | | | 4.10 | | | | 2.65 | | | | 4.34 | |
Distributions to shareholders from | | | | | | | | | | | | | | | | | | | | |
Net investment income | | | (0.21 | ) | | | (0.22 | ) | | | (0.38 | ) | | | (0.34 | ) | | | (0.29 | ) |
Net realized gains | | | (1.57 | ) | | | (0.29 | ) | | | 0.00 | | | | 0.00 | | | | 0.00 | |
| | | | | | | | | | | | | | | | | | | | |
Total distributions to shareholders | | | (1.78 | ) | | | (0.51 | ) | | | (0.38 | ) | | | (0.34 | ) | | | (0.29 | ) |
Net asset value, end of period | | | $29.61 | | | | $28.72 | | | | $28.20 | | | | $24.48 | | | | $22.17 | |
Total return1 | | | 9.68 | % | | | 3.62 | % | | | 16.83 | % | | | 12.02 | % | | | 24.07 | % |
Ratios to average net assets (annualized) | | | | | | | | | | | | | | | | | | | | |
Gross expenses | | | 1.10 | % | | | 1.22 | % | | | 1.20 | % | | | 1.18 | % | | | 1.17 | % |
Net expenses | | | 1.10 | % | | | 1.15 | % | | | 1.15 | % | | | 1.15 | % | | | 1.15 | % |
Net investment income | | | 0.79 | % | | | 0.90 | % | | | 1.42 | % | | | 1.43 | % | | | 1.39 | % |
Supplemental data | | | | | | | | | | | | | | | | | | | | |
Portfolio turnover rate | | | 8 | % | | | 43 | % | | | 9 | % | | | 11 | % | | | 16 | % |
Net assets, end of period (000s omitted) | | | $828,421 | | | | $736,276 | | | | $708,873 | | | | $657,702 | | | | $644,365 | |
| 1 | Total return calculations do not include any sales charges. |
The accompanying notes are an integral part of these financial statements.
| | | | |
| 34 | | Wells Fargo Index Asset Allocation Fund | | Financial highlights |
(For a share outstanding throughout each period)
| | | | | | | | | | | | | | | | | | | | |
| | | Year ended September 30 | |
| CLASS B | | 2016 | | | 2015 | | | 2014 | | | 2013 | | | 2012 | |
Net asset value, beginning of period | | | $17.62 | | | | $17.33 | | | | $15.03 | | | | $13.59 | | | | $11.10 | |
Net investment income | | | 0.00 | 1,2 | | | 0.04 | 1 | | | 0.11 | 1 | | | 0.10 | 1 | | | 0.08 | 1 |
Net realized and unrealized gains (losses) on investments | | | 1.50 | | | | 0.46 | | | | 2.28 | | | | 1.42 | | | | 2.48 | |
| | | | | | | | | | | | | | | | | | | | |
Total from investment operations | | | 1.50 | | | | 0.50 | | | | 2.39 | | | | 1.52 | | | | 2.56 | |
Distributions to shareholders from | | | | | | | | | | | | | | | | | | | | |
Net investment income | | | (0.02 | ) | | | (0.03 | ) | | | (0.09 | ) | | | (0.08 | ) | | | (0.07 | ) |
Net realized gains | | | (0.96 | ) | | | (0.18 | ) | | | 0.00 | | | | 0.00 | | | | 0.00 | |
| | | | | | | | | | | | | | | | | | | | |
Total distributions to shareholders | | | (0.98 | ) | | | (0.21 | ) | | | (0.09 | ) | | | (0.08 | ) | | | (0.07 | ) |
Net asset value, end of period | | | $18.14 | | | | $17.62 | | | | $17.33 | | | | $15.03 | | | | $13.59 | |
Total return3 | | | 8.85 | % | | | 2.85 | % | | | 15.90 | % | | | 11.22 | % | | | 23.08 | % |
Ratios to average net assets (annualized) | | | | | | | | | | | | | | | | | | | | |
Gross expenses | | | 1.85 | % | | | 1.97 | % | | | 1.94 | % | | | 1.93 | % | | | 1.93 | % |
Net expenses | | | 1.85 | % | | | 1.90 | % | | | 1.90 | % | | | 1.90 | % | | | 1.90 | % |
Net investment income | | | 0.02 | % | | | 0.21 | % | | | 0.67 | % | | | 0.68 | % | | | 0.65 | % |
Supplemental data | | | | | | | | | | | | | | | | | | | | |
Portfolio turnover rate | | | 8 | % | | | 43 | % | | | 9 | % | | | 11 | % | | | 16 | % |
Net assets, end of period (000s omitted) | | | $212 | | | | $152 | | | | $376 | | | | $1,085 | | | | $2,171 | |
| 1 | Calculated based upon average shares outstanding |
| 2 | Amount is less than $0.005. |
| 3 | Total return calculations do not include any sales charges. |
The accompanying notes are an integral part of these financial statements.
| | | | | | |
| Financial highlights | | Wells Fargo Index Asset Allocation Fund | | | 35 | |
(For a share outstanding throughout each period)
| | | | | | | | | | | | | | | | | | | | |
| | | Year ended September 30 | |
| CLASS C | | 2016 | | | 2015 | | | 2014 | | | 2013 | | | 2012 | |
Net asset value, beginning of period | | | $17.47 | | | | $17.20 | | | | $14.94 | | | | $13.53 | | | | $11.06 | |
Net investment income | | | 0.01 | 1 | | | 0.05 | | | | 0.11 | | | | 0.10 | | | | 0.08 | |
Net realized and unrealized gains (losses) on investments | | | 1.48 | | | | 0.45 | | | | 2.27 | | | | 1.41 | | | | 2.47 | |
| | | | | | | | | | | | | | | | | | | | |
Total from investment operations | | | 1.49 | | | | 0.50 | | | | 2.38 | | | | 1.51 | | | | 2.55 | |
Distributions to shareholders from | | | | | | | | | | | | | | | | | | | | |
Net investment income | | | (0.02 | ) | | | (0.05 | ) | | | (0.12 | ) | | | (0.10 | ) | | | (0.08 | ) |
Net realized gains | | | (0.95 | ) | | | (0.18 | ) | | | 0.00 | | | | 0.00 | | | | 0.00 | |
| | | | | | | | | | | | | | | | | | | | |
Total distributions to shareholders | | | (0.97 | ) | | | (0.23 | ) | | | (0.12 | ) | | | (0.10 | ) | | | (0.08 | ) |
Net asset value, end of period | | | $17.99 | | | | $17.47 | | | | $17.20 | | | | $14.94 | | | | $13.53 | |
Total return2 | | | 8.86 | % | | | 2.86 | % | | | 15.96 | % | | | 11.20 | % | | | 23.11 | % |
Ratios to average net assets (annualized) | | | | | | | | | | | | | | | | | | | | |
Gross expenses | | | 1.85 | % | | | 1.98 | % | | | 1.95 | % | | | 1.93 | % | | | 1.92 | % |
Net expenses | | | 1.85 | % | | | 1.90 | % | | | 1.90 | % | | | 1.90 | % | | | 1.90 | % |
Net investment income | | | 0.03 | % | | | 0.10 | % | | | 0.67 | % | | | 0.68 | % | | | 0.64 | % |
Supplemental data | | | | | | | | | | | | | | | | | | | | |
Portfolio turnover rate | | | 8 | % | | | 43 | % | | | 9 | % | | | 11 | % | | | 16 | % |
Net assets, end of period (000s omitted) | | | $136,881 | | | | $62,019 | | | | $24,093 | | | | $19,164 | | | | $16,699 | |
| 1 | Calculated based upon average shares outstanding |
| 2 | Total return calculations do not include any sales charges. |
The accompanying notes are an integral part of these financial statements.
| | | | |
| 36 | | Wells Fargo Index Asset Allocation Fund | | Financial highlights |
(For a share outstanding throughout each period)
| | | | | | | | | | | | | | | | | | | | |
| | | Year ended September 30 | |
| ADMINISTRATOR CLASS | | 2016 | | | 2015 | | | 2014 | | | 2013 | | | 2012 | |
Net asset value, beginning of period | | | $28.75 | | | | $28.21 | | | | $24.49 | | | | $22.18 | | | | $18.14 | |
Net investment income | | | 0.28 | | | | 0.35 | | | | 0.45 | | | | 0.40 | | | | 0.34 | |
Net realized and unrealized gains (losses) on investments | | | 2.45 | | | | 0.76 | | | | 3.72 | | | | 2.30 | | | | 4.04 | |
| | | | | | | | | | | | | | | | | | | | |
Total from investment operations | | | 2.73 | | | | 1.11 | | | | 4.17 | | | | 2.70 | | | | 4.38 | |
Distributions to shareholders from | | | | | | | | | | | | | | | | | | | | |
Net investment income | | | (0.28 | ) | | | (0.28 | ) | | | (0.45 | ) | | | (0.39 | ) | | | (0.34 | ) |
Net realized gains | | | (1.57 | ) | | | (0.29 | ) | | | 0.00 | | | | 0.00 | | | | 0.00 | |
| | | | | | | | | | | | | | | | | | | | |
Total distributions to shareholders | | | (1.85 | ) | | | (0.57 | ) | | | (0.45 | ) | | | (0.39 | ) | | | (0.34 | ) |
Net asset value, end of period | | | $29.63 | | | | $28.75 | | | | $28.21 | | | | $24.49 | | | | $22.18 | |
Total return | | | 9.91 | % | | | 3.89 | % | | | 17.12 | % | | | 12.31 | % | | | 24.30 | % |
Ratios to average net assets (annualized) | | | | | | | | | | | | | | | | | | | | |
Gross expenses | | | 1.02 | % | | | 1.09 | % | | | 1.04 | % | | | 1.02 | % | | | 1.01 | % |
Net expenses | | | 0.90 | % | | | 0.90 | % | | | 0.90 | % | | | 0.90 | % | | | 0.90 | % |
Net investment income | | | 0.98 | % | | | 1.12 | % | | | 1.68 | % | | | 1.69 | % | | | 1.63 | % |
Supplemental data | | | | | | | | | | | | | | | | | | | | |
Portfolio turnover rate | | | 8 | % | | | 43 | % | | | 9 | % | | | 11 | % | | | 16 | % |
Net assets, end of period (000s omitted) | | | $206,908 | | | | $85,380 | | | | $59,783 | | | | $34,536 | | | | $29,920 | |
The accompanying notes are an integral part of these financial statements.
| | | | | | |
| Notes to financial statements | | Wells Fargo Index Asset Allocation Fund | | | 37 | |
1. ORGANIZATION
Wells Fargo Funds Trust (the “Trust”), a Delaware statutory trust organized on March 10, 1999, is an open-end management investment company registered under the Investment Company Act of 1940, as amended (the “1940 Act”). As an investment company, the Trust follows the accounting and reporting guidance in Financial Accounting Standards Board (“FASB”) Accounting Standards Codification Topic 946, Financial Services – Investment Companies. These financial statements report on the Wells Fargo Index Asset Allocation Fund (the “Fund”) which is a diversified series of the Trust.
2. SIGNIFICANT ACCOUNTING POLICIES
The following significant accounting policies, which are consistently followed in the preparation of the financial statements of the Fund, are in conformity with U.S. generally accepted accounting principles which require management to make estimates and assumptions that affect the reported amounts of assets and liabilities, disclosure of contingent assets and liabilities at the date of the financial statements, and the reported amounts of revenues and expenses during the reporting period. Actual results could differ from those estimates.
Securities valuation
All investments are valued each business day as of the close of regular trading on the New York Stock Exchange (generally 4 p.m. Eastern Time), although the Fund may deviate from this calculation time under unusual or unexpected circumstances.
Equity securities and futures that are listed on a foreign or domestic exchange or market are valued at the official closing price or, if none, the last sales price. If no sale occurs on the principal exchange or market that day, the prior day’s price will be deemed “stale” and a fair value price will be determined in accordance with the Fund’s Valuation Procedures.
Debt securities are valued at the evaluated bid price provided by an independent pricing service or, if a reliable price is not available, the quoted bid price from an independent broker-dealer.
Investments in registered open-end investment companies are valued at net asset value. Interests in non-registered investment vehicles that are redeemable at net asset value are fair valued normally at net asset value.
Investments which are not valued using any of the methods discussed above are valued at their fair value, as determined in good faith by the Board of Trustees of the Fund. The Board of Trustees has established a Valuation Committee comprised of the Trustees and has delegated to it the authority to take any actions regarding the valuation of portfolio securities that the Valuation Committee deems necessary or appropriate, including determining the fair value of portfolio securities, unless the determination has been delegated to the Management Valuation Team of Wells Fargo Funds Management, LLC (“Funds Management”). The Board of Trustees retains the authority to make or ratify any valuation decisions or approve any changes to the Valuation Procedures as it deems appropriate. On a quarterly basis, the Board of Trustees receives reports on any valuation actions taken by the Valuation Committee or the Management Valuation Team which may include items for ratification.
Valuations of fair valued securities are compared to the next actual sales price when available, or other appropriate market values, to assess the continued appropriateness of the fair valuation methodologies used. These securities are fair valued on a day-to-day basis, taking into consideration changes to appropriate market information and any significant changes to the inputs considered in the valuation process until there is a readily available price provided on an exchange or by an independent pricing service. Valuations received from an independent pricing service or independent broker-dealer quotes are periodically validated by comparisons to most recent trades and valuations provided by other independent pricing services in addition to the review of prices by the manager and/or subadviser. Unobservable inputs used in determining fair valuations are identified based on the type of security, taking into consideration factors utilized by market participants in valuing the investment, knowledge about the issuer and the current market environment.
Security loans
The Fund may lend its securities from time to time in order to earn additional income in the form of fees or interest on securities received as collateral or the investment of any cash received as collateral. The Fund continues to receive interest or dividends on the securities loaned. The Fund receives collateral in the form of cash or securities with a value at least equal to the value of the securities on loan. The value of the loaned securities is determined at the close of each business day and any additional required collateral is delivered to the Fund on the next business day. In a securities lending transaction, the net asset value of the Fund will be affected by an increase or decrease in the value of the securities loaned and by an increase or decrease in the value of the instrument in which collateral is invested. The amount of securities lending activity undertaken by the Fund fluctuates from time to time. In the event of default or bankruptcy by the borrower, the Fund may be prevented from recovering the loaned securities or gaining access to the collateral or
| | | | |
| 38 | | Wells Fargo Index Asset Allocation Fund | | Notes to financial statements |
may experience delays or costs in doing so. In addition, the investment of any cash collateral received may lose all or part of its value. The Fund has the right under the lending agreement to recover the securities from the borrower on demand.
The Fund lends its securities through an unaffiliated securities lending agent. Cash collateral received in connection with its securities lending transactions is invested in Securities Lending Cash Investments, LLC (the “Securities Lending Fund”). The Securities Lending Fund is exempt from registration under Section 3(c)(7) of the 1940 Act and is managed by Funds Management and is subadvised by Wells Capital Management Incorporated (“WellsCap”), an affiliate of Funds Management and an indirect wholly owned subsidiary of Wells Fargo & Company (“Wells Fargo”). Funds Management receives an advisory fee starting at 0.05% and declining to 0.01% as the average daily net assets of the Securities Lending Fund increase. All of the fees received by Funds Management are paid to WellsCap for its services as subadviser. The Securities Lending Fund seeks to provide a positive return compared to the daily Fed Funds Open rate by investing in high-quality, U.S. dollar-denominated short-term money market instruments. Securities Lending Fund investments are fair valued based upon the amortized cost valuation technique. Income earned from investment in the Securities Lending Fund is included in securities lending income on the Statement of Operations.
Futures contracts
The Fund is subject to interest rate risk and equity price risk in the normal course of pursuing its investment objectives. The Fund may buy and sell futures contracts in order to gain exposure to, or protect against, changes in security values and interest rates. The primary risks associated with the use of futures contracts are the imperfect correlation between changes in market values of securities held by the Fund and the prices of futures contracts, and the possibility of an illiquid market.
The aggregate principal amounts of the contracts are not recorded in the financial statements. Fluctuations in the value of the contracts are recorded in the Statement of Assets and Liabilities as an asset or liability and in the Statement of Operations as unrealized gains or losses until the contracts are closed, at which point they are recorded as net realized gains or losses on futures contracts. With futures contracts, there is minimal counterparty risk to the Fund since futures are exchange traded and the exchange’s clearinghouse, as counterparty to all exchange traded futures, guarantees the futures against default.
Security transactions and income recognition
Securities transactions are recorded on a trade date basis. Realized gains or losses are recorded on the basis of identified cost.
Dividend income is recognized on the ex-dividend date.
Interest income is accrued daily and bond discounts are accreted and premiums are amortized daily based on the effective interest method. To the extent debt obligations are placed on non-accrual status, any related interest income may be reduced by writing off interest receivables when the collection of all or a portion of interest has become doubtful based on consistently applied procedures. If the issuer subsequently resumes interest payments or when the collectability of interest is reasonably assured, the debt obligation is removed from non-accrual status.
Distributions to shareholders
Distributions to shareholders from net investment income and net realized gains, if any, are recorded on the ex-dividend date. Such distributions are determined in conformity with federal income tax regulations, which may differ in amount or character from net investment income and realized gains recognized for purposes of U.S. generally accepted accounting principles.
Federal and other taxes
The Fund intends to continue to qualify as a regulated investment company by distributing substantially all of its investment company taxable income and any net realized capital gains (after reduction for capital loss carryforwards) sufficient to relieve it from all, or substantially all, federal income taxes. Accordingly, no provision for federal income taxes was required.
The Fund’s income and federal excise tax returns and all financial records supporting those returns for the prior three fiscal years are subject to examination by the federal and Delaware revenue authorities. Management has analyzed the Fund’s tax positions taken on federal, state, and foreign tax returns for all open tax years and does not believe that there are any uncertain tax positions that require recognition of a tax liability.
| | | | | | |
| Notes to financial statements | | Wells Fargo Index Asset Allocation Fund | | | 39 | |
Reclassifications are made to the Fund’s capital accounts for permanent tax differences to reflect income and gains available for distribution (or available capital loss carryforwards) under federal income tax regulations. U.S. generally accepted accounting principles require that certain components of net assets be adjusted to reflect permanent differences between financial and tax reporting. These reclassifications have no effect on net assets or net asset values per share. At September 30, 2016, as a result of permanent book-to-tax differences, the following reclassification adjustments were made on the Statement of Assets and Liabilities:
| | |
Undistributed net investment income | | Accumulated net realized losses on investments |
| $(235,874) | | $235,874 |
Class allocations
The separate classes of shares offered by the Fund differ principally in applicable sales charges, distribution, shareholder servicing, and administration fees. Class specific expenses are charged directly to that share class. Investment income, common expenses, and realized and unrealized gains (losses) on investments are allocated daily to each class of shares based on the relative proportion of net assets of each class.
3. FAIR VALUATION MEASUREMENTS
Fair value measurements of investments are determined within a framework that has established a fair value hierarchy based upon the various data inputs utilized in determining the value of the Fund’s investments. The three-level hierarchy gives the highest priority to unadjusted quoted prices in active markets for identical assets or liabilities (Level 1) and the lowest priority to significant unobservable inputs (Level 3). The Fund’s investments are classified within the fair value hierarchy based on the lowest level of input that is significant to the fair value measurement. The inputs are summarized into three broad levels as follows:
| n | | Level 1 – quoted prices in active markets for identical securities |
| n | | Level 2 – other significant observable inputs (including quoted prices for similar securities, interest rates, prepayment speeds, credit risk, use of amortized cost, etc.) |
| n | | Level 3 – significant unobservable inputs (including the Fund’s own assumptions in determining the fair value of investments) |
The inputs or methodologies used for valuing investments in securities are not necessarily an indication of the risk associated with investing in those securities.
| | | | |
| 40 | | Wells Fargo Index Asset Allocation Fund | | Notes to financial statements |
The following is a summary of the inputs used in valuing the Fund’s assets and liabilities as of September 30, 2016:
| | | | | | | | | | | | | | | | |
| | | Quoted prices
(Level 1) | | | Other significant
observable inputs
(Level 2) | | | Significant
unobservable inputs
(Level 3) | | | Total | |
Assets | | | | | | | | | | | | | | | | |
Investments in: | | | | | | | | | | | | | | | | |
| | | | |
Agency securities | | $ | 0 | | | $ | 84,972 | | | $ | 0 | | | $ | 84,972 | |
| | | | |
Common stocks | | | | | | | | | | | | | | | | |
Consumer discretionary | | | 87,320,297 | | | | 0 | | | | 0 | | | | 87,320,297 | |
Consumer staples | | | 68,945,415 | | | | 0 | | | | 0 | | | | 68,945,415 | |
Energy | | | 50,667,140 | | | | 0 | | | | 0 | | | | 50,667,140 | |
Financials | | | 89,029,270 | | | | 0 | | | | 0 | | | | 89,029,270 | |
Health care | | | 102,264,061 | | | | 0 | | | | 0 | | | | 102,264,061 | |
Industrials | | | 67,785,989 | | | | 0 | | | | 0 | | | | 67,785,989 | |
Information technology | | | 148,027,974 | | | | 0 | | | | 0 | | | | 148,027,974 | |
Materials | | | 20,240,315 | | | | | | | | | | | | 20,240,315 | |
Real estate | | | 21,324,592 | | | | 0 | | | | 0 | | | | 21,324,592 | |
Telecommunication services | | | 18,409,101 | | | | 0 | | | | 0 | | | | 18,409,101 | |
Utilities | | | 22,884,138 | | | | 0 | | | | 0 | | | | 22,884,138 | |
| | | | |
Non-agency mortgage-backed securities | | | 0 | | | | 16,312 | | | | 0 | | | | 16,312 | |
| | | | |
Rights | | | | | | | | | | | | | | | | |
Consumer staples | | | 0 | | | | 0 | | | | 0 | | | | 0 | |
| | | | |
U.S. Treasury securities | | | 457,381,478 | | | | 0 | | | | 0 | | | | 457,381,478 | |
| | | | |
Short-term investments | | | | | | | | | | | | | | | | |
Investment companies | | | 12,501,900 | | | | 0 | | | | 0 | | | | 12,501,900 | |
U.S. Treasury securities | | | 2,476,889 | | | | 0 | | | | 0 | | | | 2,476,889 | |
Investments measured at net asset value* | | | | | | | | | | | | | | | 2,850,409 | |
| | | 1,169,258,559 | | | | 101,284 | | | | 0 | | | | 1,172,210,252 | |
Futures contracts | | | 765,858 | | | | 0 | | | | 0 | | | | 765,858 | |
Total assets | | $ | 1,170,024,417 | | | $ | 101,284 | | | $ | 0 | | | $ | 1,172,976,110 | |
Liabilities | | | | | | | | | | | | | | | | |
Futures contracts | | $ | 7,805 | | | $ | 0 | | | $ | 0 | | | $ | 7,805 | |
Total liabilities | | $ | 7,805 | | | $ | 0 | | | $ | 0 | | | $ | 7,805 | |
| * | Investments that are measured at fair value using the net asset value per share (or its equivalent) as a practical expedient have not been categorized in the fair value hierarchy. The fair value amount presented in the table is intended to permit reconciliation of the fair value hierarchy to the amounts presented in the Statement of Assets and Liabilities. The Portfolio’s investment in Securities Lending Cash Investments LLC valued at $2,850,409 does not have a redemption period notice, can be redeemed daily and does not have any unfunded commitments. |
Futures contracts are reported at their variation margin at measurement date, which represents the amount due to/from the Fund at that date. All other assets and liabilities are reported at their market value at measurement date.
The Fund recognizes transfers between levels within the fair value hierarchy at the end of the reporting period. At September 30, 2016, the Fund did not have any transfers into/out of Level 1, Level 2, or Level 3.
4. TRANSACTIONS WITH AFFILIATES
Management fee
Funds Management, an indirect wholly owned subsidiary of Wells Fargo, is the manager of the Fund and provides advisory and fund-level administrative services under an investment management agreement. Under the investment management agreement, Funds Management is responsible for, among other services, implementing the investment objectives and strategies of the Fund, supervising the subadviser, providing fund-level administrative services in connection with the Fund’s operations, and providing any other fund-level administrative services reasonably necessary for the operation of the Fund. As compensation for its services under the investment management agreement, Funds
| | | | | | |
| Notes to financial statements | | Wells Fargo Index Asset Allocation Fund | | | 41 | |
Management is entitled to receive an annual management fee starting at 0.65% and declining to 0.48% as the average daily net assets of the Fund increase. For the year ended September 30, 2016, the management fee was equivalent to an annual rate of 0.62% of the Fund’s average daily net assets.
Funds Management has retained the services of a subadviser to provide daily portfolio management to the Fund. The fee for subadvisory services is borne by Funds Management. WellsCap is the subadviser to the Fund and is entitled to receive a fee from Funds Management at an annual rate starting at 0.15% and declining to 0.10% as the average daily net assets of the Fund increase.
Administration fees
Under a class-level administration agreement, Funds Management provides class-level administrative services to the Fund, which includes paying fees and expenses for services provided by the transfer agent, sub-transfer agents, omnibus account servicers and record-keepers. As compensation for its services under the class-level administration agreement, Funds Management receives an annual fee which is calculated based on the average daily net assets of each class as follows:
| | | | |
| | | Class-level
administration fee | |
Class A, Class B, Class C | | | 0.21 | % |
Administrator Class | | | 0.13 | |
Funds Management has contractually waived and/or reimbursed management and administration fees to the extent necessary to maintain certain net operating expense ratios for the Fund. Waiver of fees and/or reimbursement of expenses by Funds Management were made first from fund level expenses on a proportionate basis and then from class specific expenses. Funds Management has committed through January 31, 2017 to waive fees and/or reimburse expenses to the extent necessary to cap the Fund’s expenses at 1.15% for Class A shares, 1.90% for Class B shares, 1.90% for Class C shares, and 0.90% for Administrator Class shares. After this time, the cap may be increased or the commitment to maintain the cap may be terminated only with the approval of the Board of Trustees.
Distribution fees
The Trust has adopted a distribution plan for Class B and Class C shares of the Fund pursuant to Rule 12b-1 under the 1940 Act. Distribution fees are charged to Class B and Class C shares and paid to Wells Fargo Funds Distributor, LLC (“Funds Distributor”), the principal underwriter, at an annual rate of 0.75% of the average daily net assets of Class B and Class C shares.
In addition, Funds Distributor is entitled to receive the front-end sales charge from the purchase of Class A shares and a contingent deferred sales charge on the redemption of certain Class A shares. Funds Distributor is also entitled to receive the contingent deferred sales charges from redemptions of Class B and Class C shares. For the year ended September 30, 2016, Funds Distributor received $183,968 from the sale of Class A shares and $887 in contingent deferred sales charges from redemptions of Class C shares.
Shareholder servicing fees
The Trust has entered into contracts with one or more shareholder servicing agents, whereby each class of the Fund are charged a fee at an annual rate of 0.25% of the average daily net assets of each respective class.
A portion of these total shareholder servicing fees were paid to affiliates of Wells Fargo.
5. INVESTMENT PORTFOLIO TRANSACTIONS
Purchases and sales of investments, excluding short-term securities, for the year ended September 30, 2016 were as follows:
| | | | | | |
Purchases at cost | | Sales proceeds |
U.S.
government | | Non-U.S.
government | | U.S. government | | Non-U.S.
government |
| $158,080,531 | | $132,141,345 | | $65,064,362 | | $11,249,711 |
| | | | |
| 42 | | Wells Fargo Index Asset Allocation Fund | | Notes to financial statements |
The Fund may purchase or sell investment securities to other Wells Fargo funds under procedures adopted by the Board of Trustees. The procedures have been designed to ensure that these interfund transactions, which generally do not incur broker commissions, are effected at current market prices. Interfund trades are included within the respective purchases and sales amounts shown.
6. INVESTMENTS IN AFFILIATES
An affiliated investment is a company which is under common ownership or control of the Fund or which the Fund has ownership of at least 5% of the outstanding voting shares. The following is a summary of transactions for the long-term holdings of issuers that were either affiliates of the Fund at the beginning of the period or the end of the period.
| | | | | | | | | | | | | | | | | | | | | | | | | | | | |
| | | Shares,
beginning of period | | | Shares
purchased | | | Shares
sold | | | Shares, end of period | | | Value, end of period | | | Income from affiliated securities | | | Realized losses | |
Wells Fargo & Company | | | 141,327 | | | | 29,437 | | | | 1,911 | | | | 168,853 | | | $ | 7,476,811 | | | $ | 231,968 | | | $ | (19,337 | ) |
7. DERIVATIVE TRANSACTIONS
During the year ended September 30, 2016, the Fund entered into futures contracts to gain market exposure to certain asset classes in accordance with an active asset allocation strategy.
At September 30, 2016, the Fund had long and short futures contracts outstanding as follows:
| | | | | | | | | | | | | | |
| Expiration date | | Counterparty | | Contracts | | Type | | Contract value at September 30, 2016 | | | Unrealized
gains (losses) | |
| 12-16-2016 | | Goldman Sachs | | 74 Long | | S&P 500 E-Mini Index | | $ | 7,993,480 | | | $ | 19,120 | |
| 12-20-2016 | | Goldman Sachs | | 135 Short | | U.S. Treasury Bonds | | | 24,823,125 | | | | 374,833 | |
| 12-20-2016 | | Goldman Sachs | | 1,021 Short | | 10-Year U.S. Treasury Notes | | | 133,878,625 | | | | (34,775 | ) |
| 12-30-2016 | | Goldman Sachs | | 37 Long | | 5-Year U.S. Treasury Notes | | | 4,496,078 | | | | 9,074 | |
The Fund had an average notional amount of $41,552,390 and $123,904,163 in long and short futures contracts, respectively, during the year ended September 30, 2016.
On September 30, 2016, the cumulative unrealized gains on futures contracts in the amount of $368,252 are reflected in net unrealized gains on investments on the Statement of Assets and Liabilities. The receivable and payable for daily variation margin on open futures contracts reflected in the Statement of Assets and Liabilities only represents the current day’s variation margin. The realized gains and change in unrealized gains (losses) on futures contracts are reflected in the Statement of Operations.
A summary of derivative instruments by primary risk exposure is outlined in the following tables.
The fair value of derivative instruments as of September 30, 2016 was as follows for the Fund:
| | | | | | | | | | | | |
| | | Asset derivatives | | | Liability derivatives | |
| | | Statement of Assets and
Liabilities location | | Fair value | | | Statement of Assets and Liabilities location | | Fair value | |
Equity contracts | | Receivable for daily variation margin on open futures contracts | | $ | 44,030 | * | | Payable for daily variation margin on open futures contracts | | $ | 0 | * |
Interest rate contracts | | Receivable for daily variation margin on open futures contracts | | | 721,828 | * | | Payable for daily variation margin on open futures contracts | | | 7,805 | * |
| | | | | $ | 765,858 | | | | | $ | 7,805 | |
| * | Only the current day’s variation margin as of September 30, 2016 is reported separately on the Statement of Assets and Liabilities. |
| | | | | | |
| Notes to financial statements | | Wells Fargo Index Asset Allocation Fund | | | 43 | |
The effect of derivative instruments on the Statement of Operations for the year ended September 30, 2016 was as follows for the Fund:
| | | | | | | | |
| | | Amount of realized
gains (losses) on
derivatives | | | Change in unrealized
gains (losses) on
derivatives | |
Equity contracts | | $ | 7,921,057 | | | $ | (178,232 | ) |
Interest rate contracts | | | (6,987,196 | ) | | | 647,970 | |
| | | $ | 933,861 | | | $ | 469,738 | |
For certain types of derivative transactions, the Fund has entered into International Swaps and Derivatives Association, Inc. master agreements (“ISDA Master Agreements”) or similar agreements with approved counterparties. The ISDA Master Agreements or similar agreements may have requirements to deliver/deposit securities or cash to/with an exchange or broker-dealer as collateral and allows the Fund to offset, with each counterparty, certain derivative financial instrument’s assets and/or liabilities with collateral held or pledged. Collateral requirements differ by type of derivative. Collateral or margin requirements are set by the broker or exchange clearing house for exchange traded derivatives while collateral terms are contract specific for over-the-counter traded derivatives. Cash collateral that has been pledged to cover obligations of the Fund under ISDA Master Agreements or similar agreements, if any, will be reported separately in the Statement of Assets and Liabilities. Securities pledged as collateral, if any, for the same purpose are noted in the Portfolio of Investments. With respect to balance sheet offsetting, absent an event of default by the counterparty or a termination of the agreement, the reported amounts of financial assets and financial liabilities in the Statement of Assets and Liabilities are not offset across transactions between the Fund and the applicable counterparty. A reconciliation of the gross amounts on the Statement of Assets and Liabilities to the net amounts by derivative type, including any collateral exposure, is as follows:
| | | | | | | | | | | | | | |
| Derivative type | | Counterparty | | Gross amounts
of assets in the
Statement of
Assets and
Liabilities | | Amounts
subject to
netting
agreements | | | Collateral
received | | | Net amount
of assets |
Futures – variation margin | | Goldman Sachs | | $765,858 | | $ | (7,805 | ) | | $ | 0 | | | $758,053 |
| | | | | | | | | | | | | | |
| Derivative type | | Counterparty | | Gross amounts
of liabilities in the
Statement of
Assets and
Liabilities | | Amounts
subject to
netting
agreements | | | Collateral
pledged | | | Net amount
of liabilities |
Futures – variation margin | | Goldman Sachs | | $7,805 | | $ | (7,805 | ) | | $ | 0 | | | $0 |
8. BANK BORROWINGS
The Trust (excluding the money market funds and certain other funds) and Wells Fargo Variable Trust are parties to a $250,000,000 revolving credit agreement whereby the Fund is permitted to use bank borrowings for temporary or emergency purposes, such as to fund shareholder redemption requests. Interest under the credit agreement is charged to the Fund based on a borrowing rate equal to the higher of the Federal Funds rate in effect on that day plus 1.25% or the overnight LIBOR rate in effect on that day plus 1.25%. In addition, an annual commitment fee equal to 0.25% of the unused balance is allocated to each participating fund. Prior to August 30, 2016, the revolving credit agreement amount was $200,000,000 and the annual commitment fee was equal to 0.20% of the unused balance which was allocated to each participating fund.
For the year ended September 30, 2016, there were no borrowings by the Fund under the agreement.
9. DISTRIBUTIONS TO SHAREHOLDERS
The tax character of distributions paid during the years ended September 30, 2016 and September 30, 2015 were as follows:
| | | | | | | | |
| | | Year ended September 30 | |
| | | 2016 | | | 2015 | |
Ordinary income | | $ | 16,458,803 | | | $ | 8,393,216 | |
Long-term capital gain | | | 40,146,003 | | | | 6,756,380 | |
| | | | |
| 44 | | Wells Fargo Index Asset Allocation Fund | | Notes to financial statements |
As of September 30, 2016, the components of distributable earnings on a tax basis were as follows:
| | | | |
Undistributed ordinary income | | Undistributed long-term gain | | Unrealized gains |
| $6,691,092 | | $4,509,209 | | $239,872,555 |
10. INDEMNIFICATION
Under the Trust’s organizational documents, the officers and Trustees have been granted certain indemnification rights against certain liabilities that may arise out of performance of their duties to the Trust. Additionally, in the normal course of business, the Trust may enter into contracts with service providers that contain a variety of indemnification clauses. The Trust’s maximum exposure under these arrangements is dependent on future claims that may be made against the Fund and, therefore, cannot be estimated.
| | | | | | |
| Report of independent registered public accounting firm | | Wells Fargo Index Asset Allocation Fund | | | 45 | |
BOARD OF TRUSTEES AND SHAREHOLDERS OF WELLS FARGO FUNDS TRUST:
We have audited the accompanying statement of assets and liabilities, including the portfolio of investments, of the Wells Fargo Index Asset Allocation Fund (formerly known as Wells Fargo Advantage Index Asset Allocation Fund) (the “Fund”), one of the funds constituting the Wells Fargo Funds Trust, as of September 30, 2016, and the related statement of operations for the year then ended, the statements of changes in net assets for each of the years in the two-year period then ended, and the financial highlights for each of the years in the five-year period then ended. These financial statements and financial highlights are the responsibility of the Fund’s management. Our responsibility is to express an opinion on these financial statements and financial highlights based on our audits.
We conducted our audits in accordance with the standards of the Public Company Accounting Oversight Board (United States). Those standards require that we plan and perform the audit to obtain reasonable assurance about whether the financial statements and financial highlights are free of material misstatement. An audit includes examining, on a test basis, evidence supporting the amounts and disclosures in the financial statements. Our procedures included confirmation of securities owned as of September 30, 2016, by correspondence with the custodian and brokers, or by other appropriate auditing procedures. An audit also includes assessing the accounting principles used and significant estimates made by management, as well as evaluating the overall financial statement presentation. We believe that our audits provide a reasonable basis for our opinion.
In our opinion, the financial statements and financial highlights referred to above present fairly, in all material respects, the financial position of the Wells Fargo Index Asset Allocation Fund as of September 30, 2016, the results of its operations for the year then ended, the changes in its net assets for each of the years in the two-year period then ended, and the financial highlights for each of the years in the five-year period then ended, in conformity with U.S. generally accepted accounting principles.

Boston, Massachusetts
November 23, 2016
| | | | |
| 46 | | Wells Fargo Index Asset Allocation Fund | | Other information (unaudited) |
TAX INFORMATION
For corporate shareholders, pursuant to Section 854 of the Internal Revenue Code, 70.56% of ordinary income dividends qualify for the corporate dividends-received deduction for the fiscal year ended September 30, 2016.
Pursuant to Section 852 of the Internal Revenue Code, $40,146,003 was designated as a 20% rate gain distribution for the fiscal year ended September 30, 2016.
Pursuant to Section 854 of the Internal Revenue Code, $12,047,328 of income dividends paid during the fiscal year ended September 30, 2016 has been designated as qualified dividend income (QDI).
For the fiscal year ended September 30, 2016, $2,310,318 has been designated as interest-related dividends for nonresident alien shareholders pursuant to Section 871 of the Internal Revenue Code.
For the fiscal year ended September 30, 2016, $9,335,517 has been designated as short-term capital gain dividends for nonresident alien shareholders pursuant to Section 871 of the Internal Revenue Code.
For the fiscal year ended September 30, 2016, 13.12% of the ordinary income distributed was derived from interest on U.S. government securities.
PROXY VOTING INFORMATION
A description of the policies and procedures that the Fund uses to determine how to vote proxies relating to portfolio securities is available, upon request, by calling 1-800-222-8222, visiting our website at wellsfargofunds.com, or visiting the SEC website at sec.gov. Information regarding how the Fund voted proxies relating to portfolio securities during the most recent 12-month period ended June 30 is available on the Fund’s website at wellsfargofunds.com or by visiting the SEC website at sec.gov.
PORTFOLIO HOLDINGS INFORMATION
The complete portfolio holdings for the Fund are publicly available monthly on the Fund’s website (wellsfargofunds.com), on a one-month delayed basis. In addition, top ten holdings information (excluding derivative positions) for the Fund is publicly available on the Fund’s website on a monthly, seven-day or more delayed basis. The Fund files its complete schedule of portfolio holdings with the SEC for the first and third quarters of each fiscal year on Form N-Q, which is available by visiting the SEC website at sec.gov. In addition, the Fund’s Form N-Q may be reviewed and copied at the SEC’s Public Reference Room in Washington, DC, and at regional offices in New York City, at 233 Broadway, and in Chicago, at 175 West Jackson Boulevard, Suite 900. Information about the Public Reference Room may be obtained by calling 1-800-SEC-0330.
| | | | | | |
| Other information (unaudited) | | Wells Fargo Index Asset Allocation Fund | | | 47 | |
BOARD OF TRUSTEES AND OFFICERS
Each of the Trustees and Officers1 listed in the table below acts in identical capacities for each fund in the Wells Fargo family of funds, which consists of 138 mutual funds comprising the Wells Fargo Funds Trust, Wells Fargo Variable Trust, Wells Fargo Master Trust and four closed-end funds (collectively the “Fund Complex”). This table should be read in conjunction with the Prospectus and the Statement of Additional Information2. The mailing address of each Trustee and Officer is 525 Market Street, 12th Floor, San Francisco, CA 94105. Each Trustee and Officer serves an indefinite term, however, each Trustee serves such term until reaching the mandatory retirement age established by the Trustees.
Independent Trustees
| | | | | | |
Name and year of birth | | Position held and length of service* | | Principal occupations during past five years or longer | | Current other
public company or
investment company
directorships |
William R. Ebsworth (Born 1957) | | Trustee, since 2015 | | Retired. From 1984 to 2013, equities analyst, portfolio manager, research director and chief financial officer at Fidelity Management and Research Company in Boston, Tokyo, and Hong Kong and retired in 2013 as Chief Investment Officer of Fidelity Strategic Advisers, Inc. where he lead a team of investment professionals managing client assets. Prior thereto, Board member of Hong Kong Securities Clearing Co., Hong Kong Options Clearing Corp., the Thailand International Fund, Ltd., Fidelity Investments Life Insurance Company, and Empire Fidelity Investments Life Insurance Company. Mr. Ebsworth is a CFA® charterholder and an Adjunct Lecturer, Finance, at Babson College. | | Asset Allocation Trust |
Jane A. Freeman (Born 1953) | | Trustee, since 2015 | | Retired. From 2012 to 2014 and 1999 to 2008, Chief Financial Officer of Scientific Learning Corporation. From 2008 to 2012, Ms. Freeman provided consulting services related to strategic business projects. Prior to 1999, Portfolio Manager at Rockefeller & Co. and Scudder, Stevens & Clark. Board member of the Harding Loevner Funds from 1996 to 2014, serving as both Lead Independent Director and chair of the Audit Committee. Board member of the Russell Exchange Traded Funds Trust from 2011 to 2012 and the chair of the Audit Committee. Ms. Freeman is a Board Member of Ruth Bancroft Garden (non-profit organization) and an inactive chartered financial analyst. | | Asset Allocation Trust |
Peter G. Gordon (Born 1942) | | Trustee, since 2010; Chairman, since 2010 | | Co-Founder, Retired Chairman, President and CEO of Crystal Geyser Water Company. Trustee Emeritus, Colby College. | | Asset Allocation Trust |
Isaiah Harris, Jr. (Born 1952) | | Trustee, since 2010 | | Retired. Chairman of the Board of CIGNA Corporation since 2009, and Director since 2005. From 2003 to 2011, Director of Deluxe Corporation. Prior thereto, President and CEO of BellSouth Advertising and Publishing Corp. from 2005 to 2007, President and CEO of BellSouth Enterprises from 2004 to 2005 and President of BellSouth Consumer Services from 2000 to 2003. Emeritus member of the Iowa State University Foundation Board of Governors. Emeritus Member of the Advisory Board of Iowa State University School of Business. Advisory Board Member, Palm Harbor Academy (charter school). Advisory Board Member, Child Evangelism Fellowship (non-profit). Mr. Harris is a certified public accountant (inactive status). | | CIGNA Corporation; Asset Allocation Trust |
Judith M. Johnson (Born 1949) | | Trustee, since 2010; Audit Committee Chairman, since 2010 | | Retired. Prior thereto, Chief Executive Officer and Chief Investment Officer of Minneapolis Employees Retirement Fund from 1996 to 2008. Ms. Johnson is an attorney, certified public accountant and a certified managerial accountant. | | Asset Allocation Trust |
David F. Larcker (Born 1950) | | Trustee, since 2010 | | James Irvin Miller Professor of Accounting at the Graduate School of Business, Stanford University, Director of the Corporate Governance Research Initiative and Senior Faculty of The Rock Center for Corporate Governance since 2006. From 2005 to 2008, Professor of Accounting at the Graduate School of Business, Stanford University. Prior thereto, Ernst & Young Professor of Accounting at The Wharton School, University of Pennsylvania from 1985 to 2005. | | Asset Allocation Trust |
| | | | |
| 48 | | Wells Fargo Index Asset Allocation Fund | | Other information (unaudited) |
| | | | | | |
Name and year of birth | | Position held and length of service* | | Principal occupations during past five years or longer | | Current other
public company or
investment company
directorships |
Olivia S. Mitchell (Born 1953) | | Trustee, since 2010 | | International Foundation of Employee Benefit Plans Professor, Wharton School of the University of Pennsylvania since 1993. Director of Wharton’s Pension Research Council and Boettner Center on Pensions & Retirement Research, and Research Associate at the National Bureau of Economic Research. Previously, Cornell University Professor from 1978 to 1993. | | Asset Allocation Trust |
Timothy J. Penny (Born 1951) | | Trustee, since 2010 | | President and Chief Executive Officer of Southern Minnesota Initiative Foundation, a non-profit organization, since 2007 and Senior Fellow at the Humphrey Institute Policy Forum at the University of Minnesota since 1995. Member of the Board of Trustees of NorthStar Education Finance, Inc., a non-profit organization, since 2007. | | Asset Allocation Trust |
Michael S. Scofield (Born 1943) | | Trustee, since 2005 | | Served on the Investment Company Institute’s Board of Governors and Executive Committee from 2008-2011 as well the Governing Council of the Independent Directors Council from 2006-2011 and the Independent Directors Council Executive Committee from 2008-2011. Chairman of the IDC from 2008-2010. Institutional Investor (Fund Directions) Trustee of Year in 2007. Trustee of the Evergreen Funds complex (and its predecessors) from 1984 to 2010. Chairman of the Evergreen Funds from 2000-2010. Former Trustee of the Mentor Funds. Retired Attorney, Law Offices of Michael S. Scofield. | | Asset Allocation Trust |
| * | Length of service dates reflect the Trustee’s commencement of service with the Trust’s predecessor entities, where applicable. |
Officers
| | | | | | |
Name and year of birth | | Position held and
length of service | | Principal occupations during past five years or longer | | |
Karla M. Rabusch (Born 1959) | | President, since 2010 | | Executive Vice President of Wells Fargo Bank, N.A. and President of Wells Fargo Funds Management, LLC since 2003. | | |
Jeremy DePalma1 (Born 1974) | | Treasurer, since 2012 | | Senior Vice President of Wells Fargo Funds Management, LLC since 2009. Senior Vice President of Evergreen Investment Management Company, LLC from 2008 to 2010 and head of the Fund Reporting and Control Team within Fund Administration from 2005 to 2010. | | |
C. David Messman (Born 1960) | | Secretary, since 2010; Chief Legal Officer, since 2010 | | Senior Vice President and Secretary of Wells Fargo Funds Management, LLC since 2001. Assistant General Counsel of Wells Fargo Bank, N.A. since 2013 and Vice President and Managing Counsel of Wells Fargo Bank, N.A. from 1996 to 2013. | | |
Michael Whitaker (Born 1967) | | Chief Compliance Officer, since 20163 | | Executive Vice President of Wells Fargo Funds Management, LLC since 2016. Chief Compliance Officer of Fidelity’s Fixed Income Funds and Asset Allocation Funds from 2008 to 2016, Compliance Officer of FMR Co., Inc. from 2014 to 2016, Fidelity Investments Money Management, Inc. from 2014 to 2016, Fidelity Investments from 2007 to 2016. | | |
David Berardi (Born 1975) | | Assistant Treasurer, since 2009 | | Vice President of Wells Fargo Funds Management, LLC since 2009. Vice President of Evergreen Investment Management Company, LLC from 2008 to 2010. Manager of Fund Reporting and Control for Evergreen Investment Management Company, LLC from 2004 to 2010. | | |
| 1 | Jeremy DePalma acts as Treasurer of 68 funds and Assistant Treasurer of 70 funds in the Fund Complex. |
| 2 | The Statement of Additional Information includes additional information about the Trustees and is available, without charge, upon request, by calling 1-800-222-8222 or by visiting the website at wellsfargofunds.com. |
| 3 | Michael Whitaker became Chief Compliance Officer effective May 16, 2016. |
| | | | | | |
| Other information (unaudited) | | Wells Fargo Index Asset Allocation Fund | | | 49 | |
BOARD CONSIDERATION OF INVESTMENT MANAGEMENT AND SUB-ADVISORY AGREEMENTS:
Under the Investment Company Act of 1940 (the “1940 Act”), the Board of Trustees (the “Board”) of Wells Fargo Funds Trust (the “Trust”) must determine annually whether to approve the continuation of the Trust’s investment management and sub-advisory agreements. In this regard, at an in-person meeting held on May 24-25, 2016 (the “Meeting”), the Board, all the members of which have no direct or indirect interest in the investment management and sub-advisory agreements and are not “interested persons” of the Trust, as defined in the 1940 Act (the “Independent Trustees”), reviewed and approved for Wells Fargo Index Asset Allocation Fund (the “Fund”): (i) an investment management agreement (the “Management Agreement”) with Wells Fargo Funds Management, LLC (“Funds Management”); and (ii) an investment sub-advisory agreement (the “Sub-Advisory Agreement”) with Wells Capital Management Incorporated (the “Sub-Adviser”), an affiliate of Funds Management. The Management Agreement and the Sub-Advisory Agreement are collectively referred to as the “Advisory Agreements.”
At the Meeting, the Board considered the factors and reached the conclusions described below relating to the selection of Funds Management and the Sub-Adviser and the approval of the Advisory Agreements. Prior to the Meeting, including at an in-person meeting in April 2016, the Trustees conferred extensively among themselves and with representatives of Funds Management about these matters. Also, the Board has adopted a team-based approach, with each team consisting of a sub-set of Trustees, to assist the full Board in the discharge of its duties in reviewing performance and other matters throughout the year. The Independent Trustees were assisted in their evaluation of the Advisory Agreements by independent legal counsel, from whom they received separate legal advice and with whom they met separately.
In providing information to the Board, Funds Management and the Sub-Adviser were guided by a detailed set of requests for information submitted to them by independent legal counsel on behalf of the Independent Trustees at the start of the Board’s annual contract renewal process earlier in 2016. In considering and approving the Advisory Agreements, the Trustees considered the information they believed relevant, including but not limited to the information discussed below. The Board considered not only the specific information presented in connection with the Meeting, but also the knowledge gained over time through interaction with Funds Management and the Sub-Adviser about various topics. In this regard, the Board reviewed reports of Funds Management at each of its quarterly meetings, which included, among other things, portfolio reviews and performance reports. In addition, the Board and the teams mentioned above confer with portfolio managers at various times throughout the year. The Board did not identify any particular information or consideration that was all-important or controlling, and each individual Trustee may have attributed different weights to various factors.
After its deliberations, the Board unanimously approved the continuation of the Advisory Agreements for a one-year term and determined that the compensation payable to Funds Management and the Sub-Adviser under each of the Advisory Agreements was reasonable. The Board considered the approval of the Advisory Agreements for the Fund as part of its consideration of agreements for funds across the complex, but its approvals were made on a fund-by-fund basis. The following summarizes a number of important, but not necessarily all, factors considered by the Board in support of its approvals.
Nature, extent and quality of services
The Board received and considered various information regarding the nature, extent and quality of services provided to the Fund by Funds Management and the Sub-Adviser under the Advisory Agreements. This information included a description of the investment advisory services and Fund-level administrative services covered by the Management Agreement, as well as, among other things, a summary of the background and experience of senior management of Funds Management, and the qualifications, background, tenure and responsibilities of each of the portfolio managers primarily responsible for the day-to-day portfolio management of the Fund.
The Board evaluated the ability of Funds Management and the Sub-Adviser to attract and retain qualified investment professionals, including research, advisory and supervisory personnel. The Board further considered the compliance programs and compliance records of Funds Management and the Sub-Adviser. In addition, the Board took into account the full range of services provided to the Fund by Funds Management and its affiliates.
Fund performance and expenses
The Board considered the performance results for the Fund over various time periods ended December 31, 2015. The Board considered these results in comparison to the performance of funds in a universe that was determined by Broadridge Inc. (“Broadridge”) to be similar to the Fund (the “Universe”), and in comparison to the Fund’s benchmark index and to other comparative data. Broadridge is an independent provider of investment company data. The Board received a description of the methodology used by Broadridge to select the mutual funds in the performance Universe.
| | | | |
| 50 | | Wells Fargo Index Asset Allocation Fund | | Other information (unaudited) |
The Board noted that the performance of the Fund (Administrator Class) was higher than the average performance of the Universe for all periods under review. The Board also noted that the performance of the Fund was higher than or in range of its benchmark, the Index Asset Allocation Composite Index, for all periods under review except the one- and ten-year periods.
The Board also received and considered information regarding the Fund’s net operating expense ratios and their various components, including actual management fees, custodian and other non-management fees, and Rule 12b-1 and non-Rule 12b-1 shareholder service fees. The Board considered these ratios in comparison to the median ratios of funds in class-specific expense groups that were determined by Broadridge to be similar to the Fund (the “Groups”). The Board received a description of the methodology used by Broadridge to select the mutual funds in the expense Groups and an explanation of how funds comprising expense groups and their expense ratios may vary from year-to-year. Based on the Broadridge reports, the Board noted that the net operating expense ratios of the Fund were lower than or in range of the median net operating expense ratios of the expense Groups.
The Board took into account the Fund performance and expense information provided to it among the factors considered in deciding to re-approve the Advisory Agreements.
Investment management and sub-advisory fee rates
The Board reviewed and considered the contractual fee rates payable by the Fund to Funds Management under the Management Agreement, as well as the contractual fee rates payable by the Fund to Funds Management for class-level administrative services under a Class-Level Administration Agreement, which include class-level transfer agency and sub-transfer agency costs (collectively, the “Management Rates”). The Board also reviewed and considered the contractual investment sub-advisory fee rates that are payable by Funds Management to the Sub-Adviser for investment sub-advisory services.
Among other information reviewed by the Board was a comparison of the Fund’s Management Rates with the average contractual investment management fee rates of funds in the expense Groups at a common asset level as well as transfer agency costs of the funds in the expense Groups. The Board noted that the Management Rates of the Fund were lower than or in range of the sum of these average rates for the Fund’s expense Groups for all share classes.
The Board also received and considered information about the portion of the total management fee that was retained by Funds Management after payment of the fee to the Sub-Adviser for sub-advisory services. In assessing the reasonableness of this amount, the Board received and evaluated information about the nature and extent of responsibilities retained and risks assumed by Funds Management and not delegated to or assumed by the Sub-Adviser, and about Funds Management’s on-going oversight services. However, given the affiliation between Funds Management and the Sub-Adviser, the Board ascribed limited relevance to the allocation of fees between them.
The Board also received and considered information about the nature and extent of services offered and fee rates charged by Funds Management and the Sub-Adviser to other types of clients with investment strategies similar to those of the Fund. In this regard, the Board received information about the significantly greater scope of services, and compliance, reporting and other legal burdens and risks of managing mutual funds compared with those associated with managing assets of non-mutual fund clients such as collective funds or institutional separate accounts.
Based on its consideration of the factors and information it deemed relevant, including those described here, the Board determined that the compensation payable to Funds Management under the Management Agreement and to the Sub-Adviser under the Sub-Advisory Agreement was reasonable, in light of the services covered by the Advisory Agreements.
Profitability
The Board received and considered information concerning the profitability of Funds Management, as well as the profitability of Wells Fargo as a whole, from providing services to the Fund and the fund family as a whole. The Board also received and considered information concerning the profitability of the Sub-Adviser from providing services to the fund family as a whole, noting that the Sub-Adviser’s profitability information with respect to providing services to the Fund was subsumed in the Wells Fargo and Funds Management profitability analysis.
Funds Management reported on the methodologies and estimates used in calculating profitability. Among other things, the Board noted that the levels of profitability reported on a fund-by-fund basis varied widely, depending on factors such as the size and type of fund. Based on its review, the Board did not deem the profits reported by Funds Management or Wells Fargo from its services to the Fund to be at a level that would prevent it from approving the continuation of the Advisory Agreements.
| | | | | | |
| Other information (unaudited) | | Wells Fargo Index Asset Allocation Fund | | | 51 | |
Economies of scale
With respect to possible economies of scale, the Board noted the existence of breakpoints in the Fund’s management fee structure, which operate generally to reduce the Fund’s expense ratios as the Fund grows in size. It considered that, for a small fund or a fund that shrinks in size, breakpoints conversely can result in higher fee levels. The Board also considered that fee waiver and expense reimbursement arrangements and competitive fee rates at the outset are means of sharing potential economies of scale with shareholders of the Fund and the fund family as a whole. The Board considered Funds Management’s view that any analyses of potential economies of scale in managing a particular fund are inherently limited in light of the joint and common costs and investments that Funds Management incurs across the fund family as a whole.
The Board concluded that the Fund’s fee and expense arrangements, including contractual breakpoints, constituted a reasonable approach to sharing potential economies of scale with the Fund and its shareholders.
Other benefits to Funds Management and the Sub-Adviser
The Board received and considered information regarding potential “fall-out” or ancillary benefits received by Funds Management and its affiliates, including the Sub-Adviser, as a result of their relationships with the Fund. Ancillary benefits could include, among others, benefits directly attributable to other relationships with the Fund and benefits potentially derived from an increase in Funds Management’s and the Sub-Adviser’s business as a result of their relationships with the Fund. The Board noted that various affiliates of Funds Management may receive distribution-related fees, shareholder servicing payments and sub-transfer agency fees in respect of shares sold or held through them and services provided.
The Board also reviewed information about soft dollar credits earned and utilized by the Sub-Adviser, fees earned by Funds Management and the Sub-Adviser from managing a private investment vehicle for the fund family’s securities lending collateral and commissions earned by an affiliated broker from portfolio transactions.
Based on its consideration of the factors and information it deemed relevant, including those described here, the Board did not find that any ancillary benefits received by Funds Management and its affiliates, including the Sub-Adviser, were unreasonable.
Conclusion
At the Meeting, after considering the above-described factors and based on its deliberations and its evaluation of the information described above, the Board unanimously approved the continuation of the Advisory Agreements for a one-year term and determined that the compensation payable to Funds Management and the Sub-Adviser under each of the Advisory Agreements was reasonable.
| | | | |
| 52 | | Wells Fargo Index Asset Allocation Fund | | List of abbreviations |
The following is a list of common abbreviations for terms and entities that may have appeared in this report.
| ACA | — ACA Financial Guaranty Corporation |
| ADR | — American depositary receipt |
| ADS | — American depositary shares |
| AGC | — Assured Guaranty Corporation |
| AGM | — Assured Guaranty Municipal |
| Ambac | — Ambac Financial Group Incorporated |
| AMT | — Alternative minimum tax |
| BAN | — Bond anticipation notes |
| BHAC | — Berkshire Hathaway Assurance Corporation |
| CAB | — Capital appreciation bond |
| CCAB | — Convertible capital appreciation bond |
| CDA | — Community Development Authority |
| CDO | — Collateralized debt obligation |
| DRIVER | — Derivative inverse tax-exempt receipts |
| DW&P | — Department of Water & Power |
| DWR | — Department of Water Resources |
| ECFA | — Educational & Cultural Facilities Authority |
| EDA | — Economic Development Authority |
| EDFA | — Economic Development Finance Authority |
| ETF | — Exchange-traded fund |
| FDIC | — Federal Deposit Insurance Corporation |
| FFCB | — Federal Farm Credit Banks |
| FGIC | — Financial Guaranty Insurance Corporation |
| FHA | — Federal Housing Administration |
| FHLB | — Federal Home Loan Bank |
| FHLMC | — Federal Home Loan Mortgage Corporation |
| FICO | — The Financing Corporation |
| FNMA | — Federal National Mortgage Association |
| GDR | — Global depositary receipt |
| GNMA | — Government National Mortgage Association |
| HCFR | — Healthcare facilities revenue |
| HEFA | — Health & Educational Facilities Authority |
| HEFAR | — Higher education facilities authority revenue |
| HFA | — Housing Finance Authority |
| HFFA | — Health Facilities Financing Authority |
| HUD | — Department of Housing and Urban Development |
| IDA | — Industrial Development Authority |
| IDAG | — Industrial Development Agency |
| KRW | — Republic of Korea won |
| LIBOR | — London Interbank Offered Rate |
| LIFER | — Long Inverse Floating Exempt Receipts |
| LLC | — Limited liability company |
| LLLP | — Limited liability limited partnership |
| LLP | — Limited liability partnership |
| MBIA | — Municipal Bond Insurance Association |
| MFHR | — Multifamily housing revenue |
| MSTR | — Municipal securities trust receipts |
| MUD | — Municipal Utility District |
| National | — National Public Finance Guarantee Corporation |
| PCFA | — Pollution Control Financing Authority |
| PCL | — Public Company Limited |
| PCR | — Pollution control revenue |
| PFA | — Public Finance Authority |
| PFFA | — Public Facilities Financing Authority |
| PFOTER | — Puttable floating option tax-exempt receipts |
| plc | — Public limited company |
| PUTTER | — Puttable tax-exempt receipts |
| R&D | — Research & development |
| Radian | — Radian Asset Assurance |
| RAN | — Revenue anticipation notes |
| RDA | — Redevelopment Authority |
| RDFA | — Redevelopment Finance Authority |
| REIT | — Real estate investment trust |
| ROC | — Reset option certificates |
| SAVRS | — Select auction variable rate securities |
| SBA | — Small Business Authority |
| SDR | — Swedish depositary receipt |
| SFHR | — Single-family housing revenue |
| SFMR | — Single-family mortgage revenue |
| SPA | — Standby purchase agreement |
| SPDR | — Standard & Poor’s Depositary Receipts |
| SPEAR | — Short Puttable Exempt Adjustable Receipts |
| STRIPS | — Separate trading of registered interest and |
| TAN | — Tax anticipation notes |
| TIPS | — Treasury inflation-protected securities |
| TRAN | — Tax revenue anticipation notes |
| TTFA | — Transportation Trust Fund Authority |
| TVA | — Tennessee Valley Authority |

For more information
More information about Wells Fargo Funds is available free upon request. To obtain literature, please write, email, visit the Fund’s website, or call:
Wells Fargo Funds
P.O. Box 8266
Boston, MA 02266-8266
Email: fundservice@wellsfargo.com
Website: wellsfargofunds.com
Individual investors: 1-800-222-8222
Retail investment professionals: 1-888-877-9275
Institutional investment professionals: 1-866-765-0778
This report and the financial statements contained herein are submitted for the general information of the shareholders of the Fund. If this report is used for promotional purposes, distribution of the report must be accompanied or preceded by a current prospectus. Before investing, please consider the investment objectives, risks, charges, and expenses of the investment. For a current prospectus and, if available, a summary prospectus, containing this information, call 1-800-222-8222 or visit the Fund’s website at wellsfargofunds.com. Read the prospectus carefully before you invest or send money.
Wells Fargo Asset Management (WFAM) is a trade name used by the asset management businesses of Wells Fargo & Company. Wells Fargo Funds Management, LLC, a wholly owned subsidiary of Wells Fargo & Company, provides investment advisory and administrative services for Wells Fargo Funds. Other affiliates of Wells Fargo & Company provide subadvisory and other services for the funds. The funds are distributed by Wells Fargo Funds Distributor, LLC, Member FINRA, an affiliate of Wells Fargo & Company. Neither Wells Fargo Funds Management nor Wells Fargo Funds Distributor has Fund customer accounts/assets, and neither provides investment advice/recommendations or acts as an investment advice fiduciary to any investor.
NOT FDIC INSURED ¡ NO BANK GUARANTEE ¡ MAY LOSE VALUE
© 2016 Wells Fargo Funds Management, LLC. All rights reserved.
| | |
 | | 246389 11-16 A227/AR227 09-16 |
Annual Report
September 30, 2016

Wells Fargo International Bond Fund


Reduce clutter. Save trees.
Sign up for electronic delivery of prospectuses and shareholder reports at wellsfargo.com/advantagedelivery
Contents
The views expressed and any forward-looking statements are as of September 30, 2016, unless otherwise noted, and are those of the Fund managers and/or Wells Fargo Funds Management, LLC. Discussions of individual securities, or the markets generally, or any Wells Fargo Fund are not intended as individual recommendations. Future events or results may vary significantly from those expressed in any forward-looking statements. The views expressed are subject to change at any time in response to changing circumstances in the market. Wells Fargo Funds Management, LLC and the Fund disclaim any obligation to publicly update or revise any views expressed or forward-looking statements.
NOT FDIC INSURED ¡ NO BANK GUARANTEE ¡ MAY LOSE VALUE
| | | | |
| 2 | | Wells Fargo International Bond Fund | | Letter to shareholders (unaudited) |

Karla M. Rabusch
President
Wells Fargo Funds
The U.S. Federal Reserve (Fed) continued an easy monetary policy although it raised the federal funds target rate in December 2015 because it believed the U.S. economy was strong enough to begin normalizing monetary policy.
Dear Shareholder:
We are pleased to offer you this annual report for the Wells Fargo International Bond Fund for the 11-month period that ended September 30, 2016. We are reporting on an 11-month basis at this time because the fiscal year end of the Fund changed from October 31 to September 30, effective September 30, 2016. During this period, which began November 1, 2015, fixed-income markets benefited from a combination of accommodative monetary policy, continued (if low) U.S. economic growth, and a moderate high-yield default rate outside of commodity-related sectors.
Major central banks continued to provide stimulus, helping support global economies and keep interest rates low.
The U.S. Federal Reserve (Fed) continued an easy monetary policy although it raised the federal funds target rate in December 2015 because it believed the U.S. economy was strong enough to begin normalizing monetary policy. During the subsequent nine months of 2016, the Fed kept the federal funds rate steady. Outside the U.S., the eurozone fell into deflation in February; in response, the European Central Bank (ECB) announced an expansion of its stimulus program. The ECB cut all three of its short-term rates during the reporting period, increased its asset-purchase program from 60 billion euros per month to 80 billion, expanded the list of eligible securities to include investment-grade nonbank debt, and created a fund-to-lend program where banks could be paid to lend money. Likewise, after the United Kingdom voted to leave the European Union in June 2016, the Bank of England announced that it would buy corporate bonds with the goal of lowering borrowing costs and encouraging businesses to invest. In Japan, the Bank of Japan maintained an aggressive monetary program aimed at combating deflation.
The U.S. economy proved resilient; non-U.S. economies generally were weaker.
The divergence between U.S. and non-U.S. economic growth continued, with persistent weakness in European and Japanese inflation, risks of a hard landing in China, and the recalibration of energy and commodity prices weighing on the markets. In the U.S., economic growth advanced and inflation trended higher but remained tame. Meanwhile, oil prices fell dramatically (reaching a secular low of $26 per barrel in February) before increasing to $48 per barrel by the end of the reporting period. In addition, the U.K. vote on June 23, 2016, to exit the European Union exacerbated uncertainty about its economic growth, financial markets, and political responses to a number of policy issues.
As a result of the favorable macroeconomic backdrop, fixed-income markets rallied across the board.
Even though the Fed raised its key rate during the period, it was a modest increase, and further rate hikes were not immediately forthcoming. As a result, market yields declined and bond prices rose. Within the reporting period, episodes of greater volatility aided perceived safe-haven investments, such as U.S. Treasuries. As volatility waned, riskier assets tended to outperform. After several years of appreciating, U.S. dollar currency movements traded within a relatively stable range.
Low global yields incented investors to take on additional risk by purchasing high-yield bonds. It helped that the solid U.S. economy kept the high-yield default rate low for non-commodity-related companies. Although Moody’s Investors Service, Inc., projected in July 2016 that the U.S. high-yield default rate could reach 6.4% by
| | | | | | |
| Letter to shareholders (unaudited) | | Wells Fargo International Bond Fund | | | 3 | |
the end of 2016, much of that number came from metals and mining firms (10.2% projected default rate) and oil and gas companies (8.6% projected default rate).
Since the end of the financial crisis, structural changes in the fixed-income markets have reduced trading liquidity (the degree to which assets can be bought or sold without affecting the price). New regulations and capital requirements have caused traditional liquidity suppliers (banks and broker/dealers) to be more risk-averse and hold less inventory. Meanwhile, corporate debt issuance has spiked as companies finance themselves at record-low yields, bond mutual funds hold larger amounts of this new debt supply, trading volumes are lower, and large-size trades are more difficult to execute. However, fixed-income markets appeared to function well over the past year with sufficient liquidity.
Don’t let short-term uncertainty derail long-term investment goals.
Periods of uncertainty can present challenges, but experience has taught us that maintaining long-term investment goals can be an effective way to plan for the future. To help you create a sound strategy based on your personal goals and risk tolerance, Wells Fargo Funds offers more than 100 mutual funds spanning a wide range of asset classes and investment styles. Although diversification cannot guarantee an investment profit or prevent losses, we believe it can be an effective way to manage investment risk and potentially smooth out overall portfolio performance. We encourage investors to know their investments and to understand that appropriate levels of risk-taking may unlock opportunities.
Thank you for choosing to invest in Wells Fargo Funds. We appreciate your confidence in us and remain committed to helping you meet your financial needs.
Sincerely,

Karla M. Rabusch
President
Wells Fargo Funds
Periods of uncertainty can present challenges, but experience has taught us that maintaining long-term investment goals can be an effective way to plan for the future.
For further information about your Fund, contact your investment professional, visit our website at wellsfargofunds.com, or call us directly at 1-800-222-8222. We are available 24 hours a day, 7 days a week.
| | | | |
| 4 | | Wells Fargo International Bond Fund | | Performance highlights (unaudited) |
Investment objective
The Fund seeks total return, consisting of income and capital appreciation.
Manager
Wells Fargo Funds Management, LLC
Subadviser
First International Advisors, LLC
Portfolio managers
Michael Lee
Tony Norris
Alex Perrin
Christopher Wightman
Peter Wilson
Average annual total returns (%) as of September 30, 20161
| | | | | | | | | | | | | | | | | | | | | | | | | | | | | | | | | | |
| | | | | Including sales charge | | | Excluding sales charge | | | Expense ratios2 (%) | |
| | | Inception date | | 1 year | | | 5 year | | | 10 year | | | 1 year | | | 5 year | | | 10 year | | | Gross | | | Net3 | |
| Class A (ESIYX) | | 9-30-2003 | | | 5.81 | | | | (0.40 | ) | | | 3.86 | | | | 10.79 | | | | 0.52 | | | | 4.34 | | | | 1.06 | | | | 1.03 | |
| Class B (ESIUX)* | | 9-30-2003 | | | 5.03 | | | | (0.60 | ) | | | 3.79 | | | | 10.03 | | | | (0.23 | ) | | | 3.79 | | | | 1.81 | | | | 1.78 | |
| Class C (ESIVX) | | 9-30-2003 | | | 8.91 | | | | (0.24 | ) | | | 3.56 | | | | 9.91 | | | | (0.24 | ) | | | 3.56 | | | | 1.81 | | | | 1.78 | |
| Class R6 (ESIRX) | | 11-30-2012 | | | – | | | | – | | | | – | | | | 11.23 | | | | 0.90 | | | | 4.68 | | | | 0.68 | | | | 0.65 | |
| Administrator Class (ESIDX) | | 7-30-2010 | | | – | | | | – | | | | – | | | | 10.98 | | | | 0.70 | | | | 4.51 | | | | 1.00 | | | | 0.85 | |
| Institutional Class (ESICX) | | 12-15-1993 | | | – | | | | – | | | | – | | | | 11.14 | | | | 0.85 | | | | 4.65 | | | | 0.73 | | | | 0.70 | |
| Bloomberg Barclays Global Aggregate ex-USD Index (unhedged)4 | | – | | | – | | | | – | | | | – | | | | 11.67 | | | | 0.70 | | | | 3.82 | | | | – | | | | – | |
| BofA Merrill Lynch Global Broad Market ex U.S. Index5 | | – | | | – | | | | – | | | | – | | | | 11.91 | | | | 0.78 | | | | 3.89 | | | | – | | | | – | |
| * | | At the close of business on December 5, 2016, existing Class B shareholders were converted to Class A shareholders. Effective December 6, 2016, Class B shares are no longer offered by the Fund. |
Figures quoted represent past performance, which is no guarantee of future results, and do not reflect taxes that a shareholder may pay on fund distributions or the redemption of fund shares. Investment return and principal value of an investment will fluctuate so that an investor’s shares, when redeemed, may be worth more or less than their original cost. Performance shown without sales charges would be lower if sales charges were reflected. Current performance may be lower or higher than the performance data quoted, which assumes the reinvestment of dividends and capital gains. Current month-end performance is available on the Fund’s website, wellsfargofunds.com.
Index returns do not include transaction costs associated with buying and selling securities, any mutual fund fees or expenses, or any taxes. It is not possible to invest directly in an index.
For Class A shares, the maximum front-end sales charge is 4.50%. For Class B shares, the maximum contingent deferred sales charge is 5.00%. For Class C shares, the maximum contingent deferred sales charge is 1.00%. Performance including a contingent deferred sales charge assumes the sales charge for the corresponding time period. Class R6, Administrator Class, and Institutional Class shares are sold without a front-end sales charge or contingent deferred sales charge.
Bond values fluctuate in response to the financial condition of individual issuers, general market and economic conditions, and changes in interest rates. Changes in market conditions and government policies may lead to periods of heightened volatility in the bond market and reduced liquidity for certain bonds held by the Fund. In general, when interest rates rise, bond values fall and investors may lose principal value. Interest-rate changes and their impact on the fund and its share price can be sudden and unpredictable. Foreign investments are especially volatile and can rise or fall dramatically due to differences in the political and economic conditions of the host country. These risks are generally intensified in emerging markets. The use of derivatives may reduce returns and/or increase volatility. Securities issued by U.S. government agencies or government-sponsored entities may not be guaranteed by the U.S. Treasury. Certain investment strategies tend to increase the total risk of an investment (relative to the broader market). The Fund is exposed to high-yield securities risk and geographic risk. Consult the Fund’s prospectus for additional information on these and other risks.
Please see footnotes on page 5.
| | | | | | |
| Performance highlights (unaudited) | | Wells Fargo International Bond Fund | | | 5 | |
|
| Growth of $10,000 investment as of September 30, 20166 |
|
 |
| 1 | Historical performance shown for Class R6 shares prior to their inception reflects the performance of Institutional Class shares and includes the higher expenses applicable to Institutional Class shares. If these expenses had not been included, returns would be higher. Historical performance shown for Administrator Class shares prior to their inception reflects the performance of Institutional Class shares and has been adjusted to reflect the higher expenses applicable to Administrator Class shares. Historical performance shown for all classes of the Fund prior to July 12, 2010, is based on the performance of the Fund’s predecessor, Evergreen International Bond Fund. |
| 2 | Reflects the expense ratios as stated in the most recent prospectuses. The expense ratios shown are subject to change and may differ from the annualized expense ratios shown in the financial highlights of this report. |
| 3 | The manager has contractually committed through February 28, 2017, to waive fees and/or reimburse expenses to the extent necessary to cap the Fund’s Total Annual Fund Operating Expenses After Fee Waiver at the amounts shown. After this time, the cap may be increased or the commitment to maintain the cap may be terminated only with the approval of the Board of Trustees. Brokerage commissions, stamp duty fees, interest, taxes, acquired fund fees and expenses, and extraordinary expenses are excluded from the expense cap. Without this cap, the Fund’s returns would have been lower. |
| 4 | Effective March 1, 2016, the Fund changed its benchmark from the BofA Merrill Lynch Global Broad Market ex U.S. Index to Bloomberg Barclays Global Aggregate ex-USD Index (unhedged) (formerly known as Barclays Global Aggregate ex-USD Index (unhedged)). The new index creates consistency among our taxable intermediate funds that now all have a Bloomberg Barclays benchmark. The Bloomberg Barclays Global Aggregate ex-USD Index (unhedged) is an unmanaged index that provides a broad-based measure of the global investment grade fixed income markets excluding the U.S. dollar denominated debt market. You cannot invest directly in an index. |
| 5 | The BofA Merrill Lynch Global Broad Market ex U.S. Index tracks the performance of investment-grade debt publicly issued in the major domestic and euro bond markets, including sovereign, quasi-government, corporate, securitized, and collateralized securities, and excludes all securities denominated in U.S. dollars. You cannot invest directly in an index. |
| 6 | The chart compares the performance of Class A shares for the most recent ten years with the Bloomberg Barclays Global Aggregate ex-USD Index (unhedged), and the BofA Merrill Lynch Global Broad Market ex U.S. Index. The chart assumes a hypothetical investment of $10,000 in Class A shares and reflects all operating expenses and assumes the maximum initial sales charge of 4.50%. |
| 7 | The ten largest holdings, excluding cash and cash equivalents, are calculated based on the value of the investments divided by total net assets of the Fund. Holdings are subject to change and may have changed since the date specified. |
| 8 | Amounts are calculated based on the total long-term investments of the Fund. These amounts are subject to change and may have changed since the date specified. |
| | | | |
| 6 | | Wells Fargo International Bond Fund | | Performance highlights (unaudited) |
MANAGER’S DISCUSSION
Fund highlights
| ∎ | | The Fund underperformed its benchmark, the Bloomberg Barclays Global Aggregate ex-USD Index (unhedged), for the 11-month period that ended September 30, 2016. |
| ∎ | | Country allocation was the largest contributor to relative performance, with the largest contributions coming from overweights to the Australian, Brazilian, and U.K. bond markets, as well as from an underweight to the Japanese bond market. Duration management was a drag on performance because the Fund was underweight the very long end of the yield curve. |
| ∎ | | Currency was an overall contributor, with the largest contribution coming from an underweight to the British pound. An overweight to the Brazilian real significantly aided relative performance. However, the Mexican peso, South African rand, and Polish zloty were a drag on performance. |
The 11-month period was marked by low interest rates around the globe.
Yields fell in most markets over the 11-month period. Earlier in the reporting period, there was an expectation that yields might rise, but the U.K.’s June 2016 vote to exit the European Union (Brexit) caused significant short-term volatility and increased demand for fixed income. Consequently, the fact that the Fund maintained a duration that was similiar to that of the benchmark was a slight drag on performance. That overall short duration profile is largely coming from an underweight positioning to the low-yielding developed markets of Japan and Germany.
The Fund maintained overweight positions to emerging market currencies such as the Mexican peso, the Brazilian real, and the South African rand throughout most of the 11-month reporting period. But after a sizeable recovery in emerging market currencies in 2016, particularly the real and the rand, we hedged these exposures toward the end of the period to mitigate the potential effects of medium-term fluctuations as we enter a traditionally volatile period and the U.S. election.
| | | | |
| Ten largest holdings (%) as of September 30, 20167 | |
New Zealand, 4.50%, 4-15-2027 | | | 4.54 | |
United Kingdom Gilt, 2.00%, 9-7-2025 | | | 4.47 | |
Poland, 2.50%, 7-25-2026 | | | 4.40 | |
Bonos y Obligaciones del Estado, 1.30%, 10-31-2026 | | | 3.84 | |
Malaysia, 3.96%, 9-15-2025 | | | 3.48 | |
Thailand, 3.85%, 12-12-2025 | | | 2.98 | |
Singapore, 3.00%, 9-1-2024 | | | 2.74 | |
U.S. Treasury Note, 2.13%, 12-31-2022 | | | 2.71 | |
Norway, 0.00%, 12-21-2016 | | | 2.68 | |
Hungary, 5.50%, 6-24-2025 | | | 2.44 | |
The Fund’s shorter relative duration which was predominantly due to an underweight to developed market bonds with maturities of more than 10 years restrained performance. These bonds rallied most following the U.K.’s Brexit referendum. While the Fund did have some longer dated bonds in the smaller preferred markets, they rallied less during the same timeframe. While overall currency was a positive contributor, notably overweights to the Brazilian real and Norwegian krona, and underweights to British pounds and Japanese yen, some of this was offset by overweights to the Australian dollar, Mexican peso, and Polish zloty. Also, euro positioning restrained performance. As a result, overall, the Fund trailed the performance of the index for the period.
We continue to expect the higher real yields and lower debt levels offered by the bond markets of smaller economies to lead to outperformance of these markets versus the core developed markets. Central banks outside of major developed economies have room to ease monetary policy further in response to lower growth and inflation; indeed, in the second quarter of 2016, we saw interest-rate cuts in Indonesia, South Korea, Hungary, Russia, and Australia. Growth levels narrowed between the U.S. and Europe over the course of 2015 and into 2016, and we expected this to translate into the outperformance of the U.S. bond market relative to other developed-market economies. As a result, we maintained an off-benchmark position in the U.S. bond market.
After the Brexit vote and the U.K. rate cut in early August 2016, we took advantage of the rally in U.K. bonds to reduce the Fund’s positioning in that market from overweight to neutral. As of the end of September, the Fund’s positioning in local bond markets was as follows: underweight the bond markets of Japan, Germany, France, Canada, Italy, and Belgium, and overweight the bond markets of the U.S., Australia, New Zealand, Brazil, South Korea, Mexico, Poland, Romania, Singapore, and South Africa, with neutral exposure to the U.K.
Please see footnotes on page 5.
| | | | | | |
| Performance highlights (unaudited) | | Wells Fargo International Bond Fund | | | 7 | |
|
| Portfolio allocation as of September 30, 20168 |
|
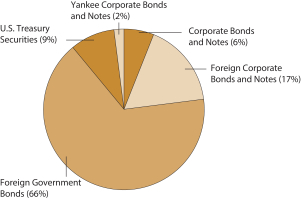 |
Against a backdrop of sluggish developed-market growth, we favored smaller economies.
As of the end of the reporting period, data for global growth remained low and continued to trend lower. Consensus forecasts for global economic growth were in the range of 3.0%, the lowest level since 2009. But the global numbers were skewed by relatively strong growth in large emerging economies like India and China. The developed economies faced an increasingly desperate plight as on-going record monetary stimulus failed to ignite growth. At the same time sovereign, consumer, and corporate debt levels remained high and continue to expand.
The trends of deteriorating debt dynamics and low nominal economic growth both feed on each other to create a spiral that all major developed economies are struggling to contend with. Developed market central banks have largely refrained from excessive monetary tightening for fear of damaging what little growth there is. The European Central Bank’s interest-rate hike in April 2011 was reversed eight months later. After raising its key rate in December 2015, the Federal Reserve has remained on hold, with expectations of further interest-rate increases continually pushed back.
In our view, this macroeconomic backdrop is unlikely to change in the near term. Low inflation, low growth, and extraordinary central bank policies will most likely drag on and may even be accompanied by occasional panics and episodes of risk aversion. Many years of low, and in some places negative, interest rates have encouraged risk taking in a desperate search for yield that has stretched valuations in many asset classes. We continue to see much better long-term value in many of the smaller markets, maintaining a broad diversification of overweights to those countries.
Please see footnotes on page 5.
| | | | |
| 8 | | Wells Fargo International Bond Fund | | Fund expenses (unaudited) |
As a shareholder of the Fund, you incur two types of costs: (1) transaction costs, including sales charges (loads) on purchase payments and contingent deferred sales charges (if any) on redemptions and (2) ongoing costs, including management fees, distribution (12b-1) and/or shareholder servicing fees, and other Fund expenses. This example is intended to help you understand your ongoing costs (in dollars) of investing in the Fund and to compare these costs with the ongoing costs of investing in other mutual funds.
The example is based on an investment of $1,000 invested at the beginning of the six-month period and held for the entire period from April 1, 2016 to September 30, 2016.
Actual expenses
The “Actual” line of the table below provides information about actual account values and actual expenses. You may use the information in this line, together with the amount you invested, to estimate the expenses that you paid over the period. Simply divide your account value by $1,000 (for example, an $8,600 account value divided by $1,000 = 8.6), then multiply the result by the number in the “Actual” line under the heading entitled “Expenses paid during period” for your applicable class of shares to estimate the expenses you paid on your account during this period.
Hypothetical example for comparison purposes
The “Hypothetical” line of the table below provides information about hypothetical account values and hypothetical expenses based on the Fund’s actual expense ratio and an assumed rate of return of 5% per year before expenses, which is not the Fund’s actual return. The hypothetical account values and expenses may not be used to estimate the actual ending account balance or expenses you paid for the period. You may use this information to compare the ongoing costs of investing in the Fund and other funds. To do so, compare this 5% hypothetical example with the 5% hypothetical examples that appear in the shareholder reports of the other funds.
Please note that the expenses shown in the table are meant to highlight your ongoing costs only and do not reflect any transactional costs, such as sales charges (loads) and contingent deferred sales charges. Therefore, the “Hypothetical” line of the table is useful in comparing ongoing costs only and will not help you determine the relative total costs of owning different funds. In addition, if these transactional costs were included, your costs would have been higher.
| | | | | | | | | | | | | | | | |
| | | Beginning
account value
4-1-2016 | | | Ending
account value
9-30-2016 | | | Expenses
paid during
the period¹ | | | Annualized net
expense ratio | |
Class A | | | | | | | | | | | | | | | | |
Actual | | $ | 1,000.00 | | | $ | 1,053.80 | | | $ | 5.29 | | | | 1.03 | % |
Hypothetical (5% return before expenses) | | $ | 1,000.00 | | | $ | 1,019.85 | | | $ | 5.20 | | | | 1.03 | % |
Class B | | | | | | | | | | | | | | | | |
Actual | | $ | 1,000.00 | | | $ | 1,050.40 | | | $ | 9.12 | | | | 1.78 | % |
Hypothetical (5% return before expenses) | | $ | 1,000.00 | | | $ | 1,016.10 | | | $ | 8.97 | | | | 1.78 | % |
Class C | | | | | | | | | | | | | | | | |
Actual | | $ | 1,000.00 | | | $ | 1,049.90 | | | $ | 9.12 | | | | 1.78 | % |
Hypothetical (5% return before expenses) | | $ | 1,000.00 | | | $ | 1,016.10 | | | $ | 8.97 | | | | 1.78 | % |
Class R6 | | | | | | | | | | | | | | | | |
Actual | | $ | 1,000.00 | | | $ | 1,056.30 | | | $ | 3.34 | | | | 0.65 | % |
Hypothetical (5% return before expenses) | | $ | 1,000.00 | | | $ | 1,021.75 | | | $ | 3.29 | | | | 0.65 | % |
Administrator Class | | | | | | | | | | | | | | | | |
Actual | | $ | 1,000.00 | | | $ | 1,054.70 | | | $ | 4.37 | | | | 0.85 | % |
Hypothetical (5% return before expenses) | | $ | 1,000.00 | | | $ | 1,020.75 | | | $ | 4.29 | | | | 0.85 | % |
Institutional Class | | | | | | | | | | | | | | | | |
Actual | | $ | 1,000.00 | | | $ | 1,056.40 | | | $ | 3.60 | | | | 0.70 | % |
Hypothetical (5% return before expenses) | | $ | 1,000.00 | | | $ | 1,021.50 | | | $ | 3.54 | | | | 0.70 | % |
| 1 | Expenses paid is equal to the annualized net expense ratio of each class multiplied by the average account value over the period, multiplied by the number of days in the most recent fiscal half-year divided by the number of days in the fiscal year (to reflect the one-half-year period). |
| | | | | | |
| Portfolio of investments—September 30, 2016 | | Wells Fargo International Bond Fund | | | 9 | |
| | | | | | | | | | | | | | | | |
| Security name | | Interest rate | | | Maturity date | | | Principal | | | Value | |
| | | | |
Corporate Bonds and Notes: 5.00% | | | | | | | | | | | | | | | | |
| | | | |
| United States: 5.00% | | | | | | | | | | | | | | | | |
AbbVie Incorporated (Health Care, Biotechnology) | | | 3.20 | % | | | 5-14-2026 | | | $ | 900,000 | | | $ | 911,689 | |
Amazon.com Incorporated (Consumer Discretionary, Internet & Direct Marketing Retail) | | | 3.80 | | | | 12-5-2024 | | | | 2,300,000 | | | | 2,550,737 | |
Anheuser-Busch InBev Finance Incorporated (Consumer Staples, Beverages) | | | 3.65 | | | | 2-1-2026 | | | | 2,200,000 | | | | 2,355,943 | |
Apple Incorporated (Information Technology, Technology Hardware, Storage & Peripherals) | | | 2.45 | | | | 8-4-2026 | | | | 2,000,000 | | | | 2,006,612 | |
Arrow Electronics Incorporated (Information Technology, Electronic Equipment, Instruments & Components) | | | 3.50 | | | | 4-1-2022 | | | | 4,775,000 | | | | 4,904,560 | |
AT&T Incorporated (Telecommunication Services, Diversified Telecommunication Services) | | | 3.60 | | | | 2-17-2023 | | | | 2,625,000 | | | | 2,767,824 | |
Ford Motor Credit Company LLC (Consumer Discretionary, Automobiles) | | | 2.46 | | | | 3-27-2020 | | | | 2,600,000 | | | | 2,624,398 | |
Gilead Sciences Incorporated (Health Care, Biotechnology) | | | 2.95 | | | | 3-1-2027 | | | | 2,000,000 | | | | 2,022,410 | |
Goldman Sachs Group Incorporated (Financials, Capital Markets) | | | 3.75 | | | | 2-25-2026 | | | | 3,000,000 | | | | 3,151,980 | |
JPMorgan Chase & Company (Financials, Banks) | | | 3.30 | | | | 4-1-2026 | | | | 2,575,000 | | | | 2,659,548 | |
Kraft Heinz Foods Company (Consumer Staples, Food Products) | | | 3.00 | | | | 6-1-2026 | | | | 2,000,000 | | | | 2,017,234 | |
Lam Research Corporation (Information Technology, Semiconductors & Semiconductor Equipment) | | | 3.90 | | | | 6-15-2026 | | | | 1,900,000 | | | | 1,979,574 | |
Microsoft Corporation (Information Technology, Software) | | | 2.40 | | | | 8-8-2026 | | | | 2,000,000 | | | | 2,001,286 | |
Oracle Corporation (Information Technology, Software) | | | 2.65 | | | | 7-15-2026 | | | | 1,900,000 | | | | 1,898,370 | |
| | | | |
Total Corporate Bonds and Notes (Cost $33,050,516) | | | | | | | | | | | | | | | 33,852,165 | |
| | | | | | | | | | | | | | | | |
| | | | |
Foreign Corporate Bonds and Notes @: 14.12% | | | | | | | | | | | | | | | | |
| | | | |
| Australia: 0.54% | | | | | | | | | | | | | | | | |
General Electric Capital Corporation (Financials, Diversified Financial Services, AUD) | | | 6.00 | | | | 3-15-2019 | | | | 1,367,000 | | | | 1,135,839 | |
Transurban Finance Company Limited (Financials, Diversified Financial Services, EUR) | | | 1.88 | | | | 9-16-2024 | | | | 2,090,000 | | | | 2,535,887 | |
| | | | |
| | | | | | | | | | | | | | | 3,671,726 | |
| | | | | | | | | | | | | | | | |
| | | | |
| Austria: 0.17% | | | | | | | | | | | | | | | | |
Sappi Papier Holding GmbH (Materials, Paper & Forest Products, EUR) 144A | | | 4.00 | | | | 4-1-2023 | | | | 1,000,000 | | | | 1,153,680 | |
| | | | | | | | | | | | | | | | |
| | | | |
| Bermuda: 0.42% | | | | | | | | | | | | | | | | |
Bacardi Limited (Consumer Staples, Beverages, EUR) | | | 2.75 | | | | 7-3-2023 | | | | 2,204,000 | | | | 2,818,395 | |
| | | | | | | | | | | | | | | | |
| | | | |
| Brazil: 0.55% | | | | | | | | | | | | | | | | |
BRF SA (Consumer Staples, Food Products, BRL) 144A | | | 7.75 | | | | 5-22-2018 | | | | 13,137,000 | | | | 3,748,639 | |
| | | | | | | | | | | | | | | | |
| | | | |
| France: 0.51% | | | | | | | | | | | | | | | | |
Bisoho SAS (Consumer Discretionary, Textiles, Apparel & Luxury Goods, EUR) 144A | | | 5.88 | | | | 5-1-2023 | | | | 525,000 | | | | 624,879 | |
Casino Guichard Perrachon SA (Consumer Staples, Food & Staples Retailing, EUR) | | | 3.25 | | | | 3-7-2024 | | | | 1,700,000 | | | | 2,066,201 | |
Europcar Groupe SA (Industrials, Road & Rail, EUR) 144A | | | 5.75 | | | | 6-15-2022 | | | | 650,000 | | | | 746,606 | |
| | | | |
| | | | | | | | | | | | | | | 3,437,686 | |
| | | | | | | | | | | | | | | | |
| | | | |
| Germany: 1.54% | | | | | | | | | | | | | | | | |
HP Pelzer Holding GmbH (Consumer Discretionary, Auto Components, EUR) | | | 7.50 | | | | 7-15-2021 | | | | 875,000 | | | | 1,043,872 | |
KfW (Financials, Banks, TRY) | | | 5.00 | | | | 1-16-2017 | | | | 3,745,000 | | | | 1,233,832 | |
KfW (Financials, Banks, AUD) | | | 5.00 | | | | 3-19-2024 | | | | 6,900,000 | | | | 6,230,116 | |
Landwirtschaftliche Rentenbank (Financials, Banks, ZAR) | | | 8.25 | | | | 5-23-2022 | | | | 5,400,000 | | | | 394,695 | |
Rapid Holding GmbH (Energy, Energy Equipment & Services, EUR) 144A | | | 6.63 | | | | 11-15-2020 | | | | 1,300,000 | | | | 1,518,768 | |
| | | | |
| | | | | | | | | | | | | | | 10,421,283 | |
| | | | | | | | | | | | | | | | |
The accompanying notes are an integral part of these financial statements.
| | | | |
| 10 | | Wells Fargo International Bond Fund | | Portfolio of investments—September 30, 2016 |
| | | | | | | | | | | | | | | | |
| Security name | | Interest rate | | | Maturity date | | | Principal | | | Value | |
| | | | |
| Ireland: 0.68% | | | | | | | | | | | | | | | | |
GE Capital UK Funding Company (Financials, Capital Markets, GBP) | | | 5.13 | % | | | 5-24-2023 | | | | 1,000,000 | | | $ | 1,628,585 | |
Ryanair Limited (Industrials, Airlines, EUR) | | | 1.13 | | | | 3-10-2023 | | | | 2,580,000 | | | | 2,971,793 | |
| | | | |
| | | | | | | | | | | | | | | 4,600,378 | |
| | | | | | | | | | | | | | | | |
| | | | |
| Luxembourg: 0.63% | | | | | | | | | | | | | | | | |
Befesa Zinc Aser SA (Utilities, Water Utilities, EUR) | | | 8.88 | | | | 5-15-2018 | | | | 1,925,000 | | | | 2,203,534 | |
European Investment Bank (Financials, Banks, ZAR) | | | 9.00 | | | | 3-31-2021 | | | | 5,790,000 | | | | 434,124 | |
Gestamp Funding Luxembourg SA (Financials, Diversified Financial Services, EUR) 144A | | | 3.50 | | | | 5-15-2023 | | | | 1,400,000 | | | | 1,619,870 | |
| | | | |
| | | | | | | | | | | | | | | 4,257,528 | |
| | | | | | | | | | | | | | | | |
| | | | |
| Mexico: 0.10% | | | | | | | | | | | | | | | | |
America Movil SAB de CV (Telecommunication Services, Wireless Telecommunication Services, MXN) | | | 7.13 | | | | 12-9-2024 | | | | 7,250,000 | | | | 372,488 | |
Petroleos Mexicanos (Energy, Oil, Gas & Consumable Fuels, MXN) 144A | | | 7.19 | | | | 9-12-2024 | | | | 6,532,000 | | | | 311,132 | |
| | | | |
| | | | | | | | | | | | | | | 683,620 | |
| | | | | | | | | | | | | | | | |
| | | | |
| Netherlands: 0.34% | | | | | | | | | | | | | | | | |
Ziggo Secured Finance BV (Consumer Discretionary, Media, EUR) 144A | | | 4.25 | | | | 1-15-2027 | | | | 2,100,000 | | | | 2,327,817 | |
| | | | | | | | | | | | | | | | |
| | | | |
| Norway: 0.88% | | | | | | | | | | | | | | | | |
Kommunalbanken AS (Financials, Banks, AUD) | | | 5.25 | | | | 7-15-2024 | | | | 6,500,000 | | | | 5,918,285 | |
| | | | | | | | | | | | | | | | |
| | | | |
| Philippines: 0.90% | | | | | | | | | | | | | | | | |
Asian Development Bank (Financials, Banks, AUD) | | | 3.75 | | | | 3-12-2025 | | | | 7,231,000 | | | | 6,094,283 | |
| | | | | | | | | | | | | | | | |
| | | | |
| Spain: 0.50% | | | | | | | | | | | | | | | | |
Ence Energia Y Celulosa (Materials, Paper & Forest Products, EUR) | | | 5.38 | | | | 11-1-2022 | | | | 1,200,000 | | | | 1,396,321 | |
Grupo Antolin Irausa SA (Consumer Discretionary, Auto Components, EUR) 144A | | | 5.13 | | | | 6-30-2022 | | | | 500,000 | | | | 598,184 | |
PortAventura Entertainment Barcelona BV (Consumer Discretionary, Hotels, Restaurants & Leisure, EUR) | | | 7.25 | | | | 12-1-2020 | | | | 1,150,000 | | | | 1,340,181 | |
| | | | |
| | | | | | | | | | | | | | | 3,334,686 | |
| | | | | | | | | | | | | | | | |
| | | | |
| United Kingdom: 3.83% | | | | | | | | | | | | | | | | |
AA Bond Company Limited (Financials, Diversified Financial Services, GBP) | | | 5.50 | | | | 7-31-2043 | | | | 1,000,000 | | | | 1,279,948 | |
British Telecommunications plc (Telecommunication Services, Diversified Telecommunication Services, EUR) | | | 1.13 | | | | 3-10-2023 | | | | 1,600,000 | | | | 1,879,484 | |
Delphi Automotive plc (Consumer Discretionary, Auto Components, EUR) | | | 1.50 | | | | 3-10-2025 | | | | 3,100,000 | | | | 3,605,485 | |
FirstGroup plc (Industrials, Road & Rail, GBP) | | | 5.25 | | | | 11-29-2022 | | | | 1,300,000 | | | | 1,993,594 | |
Heathrow Funding Limited (Industrials, Transportation Infrastructure, EUR) | | | 1.88 | | | | 5-23-2024 | | | | 561,000 | | | | 685,215 | |
Heathrow Funding Limited (Industrials, Transportation Infrastructure, GBP) | | | 7.13 | | | | 2-14-2024 | | | | 1,900,000 | | | | 3,308,842 | |
Jaguar Land Rover plc (Consumer Discretionary, Automobiles, GBP) | | | 5.00 | | | | 2-15-2022 | | | | 1,000,000 | | | | 1,422,524 | |
Lincoln Finance Limited (Financials, Diversified Financial Services, EUR) 144A | | | 6.88 | | | | 4-15-2021 | | | | 500,000 | | | | 603,800 | |
Merlin Entertainments plc (Consumer Discretionary, Hotels, Restaurants & Leisure, EUR) | | | 2.75 | | | | 3-15-2022 | | | | 1,100,000 | | | | 1,263,487 | |
New Look Secured Issuer plc (Consumer Discretionary, Textiles, Apparel & Luxury Goods, GBP) 144A | | | 6.50 | | | | 7-1-2022 | | | | 1,600,000 | | | | 1,911,126 | |
Tesco plc (Consumer Staples, Food & Staples Retailing, GBP) | | | 6.13 | | | | 2-24-2022 | | | | 1,400,000 | | | | 2,076,905 | |
Twinkle Pizza plc (Consumer Discretionary, Hotels, Restaurants & Leisure, GBP) | | | 6.63 | | | | 8-1-2021 | | | | 700,000 | | | | 883,487 | |
Virgin Media Receivable (Consumer Discretionary, Media, GBP) 144A%% | | | 5.50 | | | | 9-15-2024 | | | | 1,700,000 | | | | 2,200,700 | |
Vodafone Group plc (Telecommunication Services, Wireless Telecommunication Services, EUR) | | | 1.75 | | | | 8-25-2023 | | | | 1,250,000 | | | | 1,514,458 | |
The accompanying notes are an integral part of these financial statements.
| | | | | | |
| Portfolio of investments—September 30, 2016 | | Wells Fargo International Bond Fund | | | 11 | |
| | | | | | | | | | | | | | | | |
| Security name | | Interest rate | | | Maturity date | | | Principal | | | Value | |
| | | | |
| United Kingdom (continued) | | | | | | | | | | | | | | | | |
Wagamama Finance plc (Financials, Diversified Financial Services, GBP) 144A | | | 7.88 | % | | | 2-1-2020 | | | | 450,000 | | | $ | 612,722 | |
Worldpay Finance plc (Financials, Diversified Financial Services, EUR) | | | 3.75 | | | | 11-15-2022 | | | | 550,000 | | | | 661,091 | |
| | | | |
| | | | | | | | | | | | | | | 25,902,868 | |
| | | | | | | | | | | | | | | | |
| | | | |
| United States: 2.53% | | | | | | | | | | | | | | | | |
Albemarle Corporation (Materials, Chemicals, EUR) | | | 1.88 | | | | 12-8-2021 | | | | 2,410,000 | | | | 2,865,593 | |
Ball Corporation (Materials, Containers & Packaging, EUR) | | | 4.38 | | | | 12-15-2023 | | | | 650,000 | | | | 814,147 | |
Cemex Finance LLC (Financials, Diversified Financial Services, EUR) 144A | | | 4.63 | | | | 6-15-2024 | | | | 1,350,000 | | | | 1,552,084 | |
Fedex Corporation (Industrials, Air Freight & Logistics, EUR) | | | 1.63 | | | | 1-11-2027 | | | | 1,450,000 | | | | 1,713,178 | |
Morgan Stanley (Financials, Capital Markets, EUR) | | | 1.75 | | | | 1-30-2025 | | | | 2,000,000 | | | | 2,378,895 | |
Priceline Group Incorporated (Consumer Discretionary, Internet & Direct Marketing Retail, EUR) | | | 2.38 | | | | 9-23-2024 | | | | 2,159,000 | | | | 2,635,996 | |
Thermo Fisher Scientific Incorporated (Health Care, Life Sciences Tools & Services, EUR) | | | 0.75 | | | | 9-12-2024 | | | | 1,625,000 | | | | 1,831,184 | |
Verizon Communications Incorporated (Telecommunication Services, Diversified Telecommunication Services, EUR) | | | 3.25 | | | | 2-17-2026 | | | | 1,164,000 | | | | 1,600,502 | |
VF Corporation (Consumer Discretionary, Textiles, Apparel & Luxury Goods, EUR) | | | 0.63 | | | | 9-20-2023 | | | | 1,525,000 | | | | 1,737,489 | |
| | | | |
| | | | | | | | | | | | | | | 17,129,068 | |
| | | | | | | | | | | | | | | | |
| | |
Total Foreign Corporate Bonds and Notes (Cost $102,058,811) | | | | | | | | 95,499,942 | |
| | | | | | | | | | | | | | | | |
| | | | |
Foreign Government Bonds @: 66.57% | | | | | | | | | | | | | | | | |
Australian Government Bond Series 138 (AUD) | | | 3.25 | | | | 4-21-2029 | | | | 17,050,000 | | | | 14,676,204 | |
Australian Government Bond Series 148 (AUD) | | | 2.75 | | | | 11-21-2027 | | | | 19,400,000 | | | | 15,933,903 | |
Bonos y Obligaciones del Estado 144A (EUR) | | | 1.30 | | | | 10-31-2026 | | | | 22,395,000 | | | | 26,001,617 | |
Brazil (BRL) | | | 10.00 | | | | 1-1-2019 | | | | 21,955,000 | | | | 6,560,019 | |
Brazil (BRL) | | | 10.00 | | | | 1-1-2025 | | | | 46,040,000 | | | | 13,091,594 | |
Canada 144A (CAD) | | | 2.90 | | | | 6-15-2024 | | | | 11,000,000 | | | | 9,347,757 | |
Colombia (COP) | | | 7.00 | | | | 5-4-2022 | | | | 11,100,000,000 | | | | 3,914,171 | |
Hungary (HUF) | | | 3.00 | | | | 10-27-2027 | | | | 450,000,000 | | | | 1,667,901 | |
Hungary (HUF) | | | 5.50 | | | | 6-24-2025 | | | | 3,730,000,000 | | | | 16,507,754 | |
Indonesia (IDR) | | | 8.38 | | | | 3-15-2024 | | | | 13,750,000,000 | | | | 1,139,424 | |
Indonesia (IDR) | | | 8.38 | | | | 9-15-2026 | | | | 45,000,000,000 | | | | 3,746,258 | |
Korea (KRW) | | | 3.00 | | | | 9-10-2024 | | | | 10,100,000,000 | | | | 10,280,046 | |
Korea (KRW) | | | 3.13 | | | | 3-10-2019 | | | | 6,400,000,000 | | | | 6,064,999 | |
Malaysia (MYR) | | | 3.66 | | | | 10-15-2020 | | | | 7,650,000 | | | | 1,879,421 | |
Malaysia (MYR) | | | 3.90 | | | | 11-30-2026 | | | | 14,250,000 | | | | 3,541,808 | |
Malaysia (MYR) | | | 3.96 | | | | 9-15-2025 | | | | 95,575,000 | | | | 23,575,675 | |
Malaysia (MYR) | | | 4.50 | | | | 4-15-2030 | | | | 8,950,000 | | | | 2,277,423 | |
Mexico (MXN) | | | 5.75 | | | | 3-5-2026 | | | | 301,000,000 | | | | 15,221,917 | |
Mexico (MXN) | | | 6.50 | | | | 6-10-2021 | | | | 225,000,000 | | | | 11,955,162 | |
Mexico (MXN) | | | 10.00 | | | | 12-5-2024 | | | | 39,450,000 | | | | 2,570,267 | |
New Zealand (NZD) | | | 4.50 | | | | 4-15-2027 | | | | 35,000,000 | | | | 30,741,694 | |
Norway 144A (NOK) ¤ | | | 0.00 | | | | 12-21-2016 | | | | 145,025,000 | | | | 18,119,799 | |
Norway 144A (NOK) ¤ | | | 0.00 | | | | 3-15-2017 | | | | 115,100,000 | | | | 14,363,989 | |
Poland (PLN) | | | 1.50 | | | | 4-25-2020 | | | | 5,000,000 | | | | 1,281,284 | |
Poland (PLN) | | | 2.50 | | | | 7-25-2026 | | | | 118,000,000 | | | | 29,763,038 | |
Poland (PLN) | | | 3.25 | | | | 7-25-2025 | | | | 7,000,000 | | | | 1,888,254 | |
Province of British Columbia (AUD) | | | 4.25 | | | | 11-27-2024 | | | | 7,590,000 | | | | 6,507,486 | |
The accompanying notes are an integral part of these financial statements.
| | | | |
| 12 | | Wells Fargo International Bond Fund | | Portfolio of investments—September 30, 2016 |
| | | | | | | | | | | | | | | | |
| Security name | | Interest rate | | | Maturity date | | | Principal | | | Value | |
| | | | |
Foreign Government Bonds @ (continued) | | | | | | | | | | | | | | | | |
Province of Ontario (AUD) | | | 6.25 | % | | | 9-29-2020 | | | | 9,400,000 | | | $ | 8,237,266 | |
Queensland Treasury 144A (AUD) | | | 3.25 | | | | 7-21-2026 | | | | 7,350,000 | | | | 6,031,503 | |
Queensland Treasury (AUD) | | | 5.75 | | | | 7-22-2024 | | | | 9,000,000 | | | | 8,612,996 | |
Republic of Peru (PEN) | | | 5.70 | | | | 8-12-2024 | | | | 5,000,000 | | | | 1,515,464 | |
Republic of Philippines (PHP) | | | 3.90 | | | | 11-26-2022 | | | | 40,000,000 | | | | 822,765 | |
Republic of South Africa (ZAR) | | | 7.75 | | | | 2-28-2023 | | | | 209,156,000 | | | | 14,792,195 | |
Republic of South Africa (ZAR) | | | 8.00 | | | | 12-21-2018 | | | | 104,675,000 | | | | 7,671,920 | |
Romania (RON) | | | 5.75 | | | | 4-29-2020 | | | | 22,600,000 | | | | 6,481,785 | |
Singapore (SGD) | | | 2.88 | | | | 9-1-2030 | | | | 11,900,000 | | | | 9,610,404 | |
Singapore (SGD) | | | 3.00 | | | | 9-1-2024 | | | | 23,090,000 | | | | 18,557,337 | |
State of New South Wales Australia (AUD) | | | 5.00 | | | | 8-20-2024 | | | | 9,000,000 | | | | 8,367,144 | |
Thailand (THB) | | | 3.85 | | | | 12-12-2025 | | | | 611,025,000 | | | | 20,194,914 | |
Turkey (TRY) | | | 9.00 | | | | 3-8-2017 | | | | 3,269,000 | | | | 1,092,749 | |
Turkey (TRY) | | | 9.40 | | | | 7-8-2020 | | | | 1,500,000 | | | | 506,626 | |
United Kingdom Gilt (GBP) | | | 1.50 | | | | 7-22-2026 | | | | 4,175,000 | | | | 5,788,708 | |
United Kingdom Gilt (GBP) | | | 2.00 | | | | 9-7-2025 | | | | 20,900,000 | | | | 30,226,218 | |
United Kingdom Gilt (GBP) | | | 4.25 | | | | 6-7-2032 | | | | 5,000,000 | | | | 9,324,304 | |
| | | | |
Total Foreign Government Bonds (Cost $443,773,011) | | | | | | | | | | | | | | | 450,453,162 | |
| | | | | | | | | | | | | | | | |
| | | | |
U.S. Treasury Securities: 9.23% | | | | | | | | | | | | | | | | |
U.S. Treasury Bond | | | 3.00 | | | | 11-15-2045 | | | $ | 9,500,000 | | | | 10,873,786 | |
U.S. Treasury Note | | | 1.38 | | | | 10-31-2020 | | | | 6,900,000 | | | | 6,980,323 | |
U.S. Treasury Note | | | 1.50 | | | | 8-15-2026 | | | | 14,300,000 | | | | 14,170,971 | |
U.S. Treasury Note | | | 1.63 | | | | 5-15-2026 | | | | 5,000,000 | | | | 5,009,765 | |
U.S. Treasury Note | | | 2.13 | | | | 12-31-2022 | | | | 17,500,000 | | | | 18,313,470 | |
U.S. Treasury Note | | | 2.25 | | | | 11-15-2025 | | | | 6,750,000 | | | | 7,129,688 | |
| | | | |
Total U.S. Treasury Securities (Cost $60,395,878) | | | | | | | | | | | | | | | 62,478,003 | |
| | | | | | | | | | | | | | | | |
| | | | |
Yankee Corporate Bonds and Notes: 2.36% | | | | | | | | | | | | | | | | |
| | | | |
| Cayman Islands: 0.18% | | | | | | | | | | | | | | | | |
UPCB Finance IV Limited (Financials, Diversified Financial Services) 144A | | | 5.38 | | | | 1-15-2025 | | | | 1,200,000 | | | | 1,205,580 | |
| | | | | | | | | | | | | | | | |
| | | | |
| Ireland: 0.22% | | | | | | | | | | | | | | | | |
Ardagh Packaging Finance plc (Financials, Diversified Financial Services) 144A | | | 4.63 | | | | 5-15-2023 | | | | 1,500,000 | | | | 1,509,375 | |
| | | | | | | | | | | | | | | | |
| | | | |
| Netherlands: 1.18% | | | | | | | | | | | | | | | | |
Fiat Chrysler Automobiles NV (Consumer Discretionary, Automobiles) | | | 5.25 | | | | 4-15-2023 | | | | 1,650,000 | | | | 1,697,438 | |
Mubadala Development Company (Energy, Oil, Gas & Consumable Fuels) | | | 5.50 | | | | 4-20-2021 | | | | 1,700,000 | | | | 1,949,070 | |
Myriad International Holdings BV (Consumer Discretionary, Media) | | | 6.00 | | | | 7-18-2020 | | | | 1,950,000 | | | | 2,145,390 | |
Siemens Financieringsmat Company (Financials, Diversified Financial
Services) 144A | | | 2.35 | | | | 10-15-2026 | | | | 2,200,000 | | | | 2,174,227 | |
| | | | |
| | | | | | | | | | | | | | | 7,966,125 | |
| | | | | | | | | | | | | | | | |
| | | | |
| Switzerland: 0.36% | | | | | | | | | | | | | | | | |
Credit Suisse Group Funding Limited (Financials, Diversified Financial Services) | | | 3.80 | | | | 9-15-2022 | | | | 2,400,000 | | | | 2,452,010 | |
| | | | | | | | | | | | | | | | |
The accompanying notes are an integral part of these financial statements.
| | | | | | |
| Portfolio of investments—September 30, 2016 | | Wells Fargo International Bond Fund | | | 13 | |
| | | | | | | | | | | | | | | | |
| Security name | | Interest rate | | | Maturity date | | | Principal | | | Value | |
| | | | |
| United Kingdom: 0.42% | | | | | | | | | | | | | | | | |
International Game Technology plc (Consumer Discretionary, Hotels, Restaurants & Leisure) 144A | | | 6.25 | % | | | 2-15-2022 | | | $ | 1,500,000 | | | $ | 1,596,570 | |
Jaguar Land Rover Automobiles plc (Consumer Discretionary, Automobiles) 144A | | | 3.50 | | | | 3-15-2020 | | | | 1,200,000 | | | | 1,227,000 | |
| | | | |
| | | | | | | | | | | | | | | 2,823,570 | |
| | | | | | | | | | | | | | | | |
| | | | |
Total Yankee Corporate Bonds and Notes (Cost $15,325,702) | | | | | | | | | | | | | | | 15,956,660 | |
| | | | | | | | | | | | | | | | |
| | | | |
| | | Yield | | | | | | Shares | | | | |
| Short-Term Investments: 0.91% | | | | | | | | | | | | | | | | |
| | | | |
| Investment Companies: 0.91% | | | | | | | | | | | | | | | | |
Wells Fargo Government Money Market Fund Select Class (l)(u)## | | | 0.34 | | | | | | | | 6,152,065 | | | | 6,152,065 | |
| | | | | | | | | | | | | | | | |
| | | | |
Total Short-Term Investments (Cost $6,152,065) | | | | | | | | | | | | | | | 6,152,065 | |
| | | | | | | | | | | | | | | | |
| | | | | | | | |
| Total investments in securities (Cost $660,755,983) * | | | 98.19 | % | | | 664,391,997 | |
Other assets and liabilities, net | | | 1.81 | | | | 12,231,659 | |
| | | | | | | | |
| Total net assets | | | 100.00 | % | | $ | 676,623,656 | |
| | | | | | | | |
| 144A | The security may be resold in transactions exempt from registration, normally to qualified institutional buyers, pursuant to Rule 144A under the Securities Act of 1933. |
| %% | The security is issued on a when-issued basis. |
| ¤ | The security is issued in zero coupon form with no periodic interest payments. |
| @ | Foreign bond principal is denominated in the local currency of the issuer. |
| (l) | The issuer of the security is an affiliated person of the Fund as defined in the Investment Company Act of 1940. |
| (u) | The rate represents the 7-day annualized yield at period end. |
| ## | All or a portion of this security is segregated for when-issued securities. |
| * | Cost for federal income tax purposes is $663,844,935 and unrealized gains (losses) consists of: |
| | | | |
Gross unrealized gains | | $ | 4,158,317 | |
Gross unrealized losses | | | (3,611,255 | ) |
| | | | |
Net unrealized gains | | $ | 547,062 | |
The accompanying notes are an integral part of these financial statements.
| | | | |
| 14 | | Wells Fargo International Bond Fund | | Statement of assets and liabilities—September 30, 2016 |
| | | | |
| | | | |
| |
Assets | | | | |
Investments | | | | |
In unaffiliated securities, at value (cost $654,603,918) | | $ | 658,239,932 | |
In affiliated securities, at value (cost $6,152,065) | | | 6,152,065 | |
| | | | |
Total investments, at value (cost $660,755,983) | | | 664,391,997 | |
Cash | | | 11,612 | |
Foreign currency, at value (cost $3,556,575) | | | 3,587,269 | |
Receivable for investments sold | | | 7,016,268 | |
Receivable for Fund shares sold | | | 1,131,749 | |
Receivable for interest | | | 5,749,108 | |
Receivable for securities lending income | | | 10,111 | |
Unrealized gains on forward foreign currency contracts | | | 2,728,369 | |
Prepaid expenses and other assets | | | 67,565 | |
| | | | |
Total assets | | | 684,694,048 | |
| | | | |
| |
Liabilities | | | | |
Payable for investments purchased | | | 2,203,454 | |
Payable for Fund shares redeemed | | | 657,152 | |
Unrealized losses on forward foreign currency contracts | | | 4,482,614 | |
Management fee payable | | | 327,342 | |
Distribution fees payable | | | 3,765 | |
Administration fees payable | | | 51,978 | |
Accrued expenses and other liabilities | | | 344,087 | |
| | | | |
Total liabilities | | | 8,070,392 | |
| | | | |
Total net assets | | $ | 676,623,656 | |
| | | | |
| |
NET ASSETS CONSIST OF | | | | |
Paid-in capital | | $ | 667,228,893 | |
Accumulated net investment loss | | | (383,143 | ) |
Accumulated net realized gains on investments | | | 7,868,238 | |
Net unrealized gains on investments | | | 1,909,668 | |
| | | | |
Total net assets | | $ | 676,623,656 | |
| | | | |
| |
COMPUTATION OF NET ASSET VALUE AND OFFERING PRICE PER SHARE1 | | | | |
Net assets – Class A | | $ | 54,398,701 | |
Shares outstanding – Class A1 | | | 5,050,559 | |
Net asset value per share – Class A | | | $10.77 | |
Maximum offering price per share – Class A2 | | | $11.28 | |
Net assets – Class B | | $ | 170,820 | |
Shares outstanding – Class B1 | | | 16,076 | |
Net asset value per share – Class B | | | $10.63 | |
Net assets – Class C | | $ | 5,519,955 | |
Shares outstanding – Class C1 | | | 524,530 | |
Net asset value per share – Class C | | | $10.52 | |
Net assets – Class R6 | | $ | 12,501,483 | |
Shares outstanding – Class R61 | | | 1,149,313 | |
Net asset value per share – Class R6 | | | $10.88 | |
Net assets – Administrator Class | | $ | 50,825,033 | |
Shares outstanding – Administrator Class1 | | | 4,707,205 | |
Net asset value per share – Administrator Class | | | $10.80 | |
Net assets – Institutional Class | | $ | 553,207,664 | |
Shares outstanding – Institutional Class1 | | | 50,957,360 | |
Net asset value per share – Institutional Class | | | $10.86 | |
| 1 | The Fund has an unlimited number of authorized shares. |
| 2 | Maximum offering price is computed as 100/95.50 of net asset value. On investments of $50,000 or more, the offering price is reduced. |
The accompanying notes are an integral part of these financial statements.
| | | | | | |
| Statements of operations | | Wells Fargo International Bond Fund | | | 15 | |
| | | | | | | | |
| | | Year ended September 30, 20161 | | | Year ended October 31, 2015 | |
| | |
Investment income | | | | | | | | |
Interest (net of foreign interest withholding taxes of $148,465 and $289,910, respectively) | | $ | 28,417,868 | | | $ | 49,115,686 | |
Securities lending income, net | | | 18,999 | | | | 65,132 | |
Income from affiliated securities | | | 56,308 | | | | 19,471 | |
| | | | |
Total investment income | | | 28,493,175 | | | | 49,200,289 | |
| | | | |
| | |
Expenses | | | | | | | | |
Management fee | | | 4,589,689 | | | | 6,962,399 | |
Administration fees | | | | | | | | |
Class A | | | 80,351 | | | | 154,374 | |
Class B | | | 392 | | | | 936 | |
Class C | | | 8,673 | | | | 14,271 | |
Class R6 | | | 3,789 | | | | 3,030 | |
Administrator Class | | | 171,448 | | | | 307,448 | |
Institutional Class | | | 430,725 | | | | 619,487 | |
Shareholder servicing fees | | | | | | | | |
Class A | | | 125,548 | | | | 241,210 | |
Class B | | | 613 | | | | 1,407 | |
Class C | | | 13,551 | | | | 22,298 | |
Administrator Class | | | 426,800 | | | | 765,262 | |
Distribution fees | | | | | | | | |
Class B | | | 1,839 | | | | 4,388 | |
Class C | | | 40,652 | | | | 66,894 | |
Custody and accounting fees | | | 298,856 | | | | 441,778 | |
Professional fees | | | 61,589 | | | | 55,312 | |
Registration fees | | | 103,722 | | | | 89,654 | |
Shareholder report expenses | | | 113,755 | | | | 144,643 | |
Trustees’ fees and expenses | | | 24,665 | | | | 12,770 | |
Other fees and expenses | | | 17,998 | | | | 30,395 | |
| | | | |
Total expenses | | | 6,514,655 | | | | 9,937,956 | |
Less: Fee waivers and/or expense reimbursements | | | (588,314 | ) | | | (675,670 | ) |
| | | | |
Net expenses | | | 5,926,341 | | | | 9,262,286 | |
| | | | |
Net investment income | | | 22,566,834 | | | | 39,938,003 | |
| | | | |
| | |
REALIZED AND UNREALIZED GAINS (LOSSES) ON INVESTMENTS | | | | | | | | |
| | |
Net realized gains (losses) on: | | | | | | | | |
Unaffiliated securities | | | (70,901,922 | ) | | | (119,914,620 | ) |
Forward foreign currency contract transactions | | | 30,693,097 | | | | 16,037,918 | |
| | | | |
Net realized losses on investments | | | (40,208,825 | ) | | | (103,876,702 | ) |
| | | | |
| | |
Net change in unrealized gains (losses) on: | | | | | | | | |
Unaffiliated securities | | | 97,938,697 | | | | (58,530,596 | ) |
Forward foreign currency contract transactions | | | 5,346,217 | | | | 1,726,564 | |
| | | | |
Net change in unrealized gains (losses) on investments | | | 103,284,914 | | | | (56,804,032 | ) |
| | | | |
Net realized and unrealized gains (losses) on investments | | | 63,076,089 | | | | (160,680,734 | ) |
| | | | |
Net increase (decrease) in net assets resulting from operations | | $ | 85,642,923 | | | $ | (120,742,731 | ) |
| | | | |
| 1 | For the eleven months ended September 30, 2016. The Fund changed its fiscal year end from October 31 to September 30, effective September 30, 2016. |
The accompanying notes are an integral part of these financial statements.
| | | | |
| 16 | | Wells Fargo International Bond Fund | | Statements of changes in net assets |
| | | | | | | | | | | | | | | | | | | | | | | | |
| | | Year ended
September 30, 20161 | | | Year ended
October 31, 2015 | | | Year ended
October 31, 2014 | |
| | | | | | |
Operations | | | | | | | | | | | | | | | | | | | | | | | | |
Net investment income | | | | | | $ | 22,566,834 | | | | | | | $ | 39,938,003 | | | | | | | $ | 51,017,278 | |
Net realized losses on investments | | | | | | | (40,208,825 | ) | | | | | | | (103,876,702 | ) | | | | | | | (19,851,675 | ) |
Net change in unrealized gains (losses) on investments | | | | | | | 103,284,914 | | | | | | | | (56,804,032 | ) | | | | | | | (23,841,553 | ) |
| | | | |
Net increase (decrease) in net assets resulting from operations | | | | | | | 85,642,923 | | | | | | | | (120,742,731 | ) | | | | | | | 7,324,050 | |
| | | | |
| | | | | | |
Distributions to shareholders from | | | | | | | | | | | | | | | | | | | | | | | | |
Net investment income | | | | | | | | | | | | | | | | | | | | | | | | |
Class A | | | | | | | 0 | | | | | | | | (423,572 | ) | | | | | | | (1,131,543 | ) |
Class B | | | | | | | 0 | | | | | | | | 0 | | | | | | | | (3,281 | ) |
Class C | | | | | | | 0 | | | | | | | | 0 | | | | | | | | (58,435 | ) |
Class R6 | | | | | | | 0 | | | | | | | | (48,140 | ) | | | | | | | (51,175 | ) |
Administrator Class | | | | | | | 0 | | | | | | | | (1,661,619 | ) | | | | | | | (4,290,193 | ) |
Institutional Class | | | | | | | 0 | | | | | | | | (4,268,266 | ) | | | | | | | (13,007,391 | ) |
Net realized gains | | | | | | | | | | | | | | | | | | | | | | | | |
Class A | | | | | | | (400,990 | ) | | | | | | | (287,937 | ) | | | | | | | (3,719,413 | ) |
Class B | | | | | | | (2,261 | ) | | | | | | | (2,272 | ) | | | | | | | (57,769 | ) |
Class C | | | | | | | (38,344 | ) | | | | | | | (31,156 | ) | | | | | | | (526,829 | ) |
Class R6 | | | | | | | (83,111 | ) | | | | | | | (18,411 | ) | | | | | | | (83,684 | ) |
Administrator Class | | | | | | | (1,513,668 | ) | | | | | | | (1,004,296 | ) | | | | | | | (11,543,115 | ) |
Institutional Class | | | | | | | (3,929,124 | ) | | | | | | | (2,298,056 | ) | | | | | | | (36,033,594 | ) |
| | | | |
Total distributions to shareholders | | | | | | | (5,967,498 | ) | | | | | | | (10,043,725 | ) | | | | | | | (70,506,422 | ) |
| | | | |
| | | | | | |
Capital share transactions | | | Shares | | | | | | | | Shares | | | | | | | | Shares | | | | | |
Proceeds from shares sold | | | | | | | | | | | | | | | | | | | | | | | | |
Class A | | | 1,868,356 | | | | 19,443,142 | | | | 4,376,785 | | | | 44,490,295 | | | | 2,749,646 | | | | 30,368,557 | |
Class B | | | 0 | | | | 0 | | | | 2 | | | | 19 | | | | 891 | | | | 9,492 | |
Class C | | | 23,455 | | | | 236,461 | | | | 29,172 | | | | 297,439 | | | | 72,519 | | | | 795,278 | |
Class R6 | | | 895,392 | | | | 8,893,640 | | | | 1,089,162 | | | | 11,067,245 | | | | 408,110 | | | | 4,564,894 | |
Administrator Class | | | 4,435,890 | | | | 44,153,170 | | | | 7,459,622 | | | | 76,084,803 | | | | 10,060,042 | | | | 111,082,502 | |
Institutional Class | | | 16,131,984 | | | | 163,749,468 | | | | 21,605,888 | | | | 222,681,252 | | | | 17,799,377 | | | | 196,135,780 | |
| | | | |
| | | | | | | 236,475,881 | | | | | | | | 354,621,053 | | | | | | | | 342,956,503 | |
| | | | |
Reinvestment of distributions | | | | | | | | | | | | | | | | | | | | | | | | |
Class A | | | 41,796 | | | | 395,809 | | | | 66,631 | | | | 705,372 | | | | 437,747 | | | | 4,731,956 | |
Class B | | | 202 | | | | 1,896 | | | | 185 | | | | 1,968 | | | | 5,011 | | | | 53,798 | |
Class C | | | 3,463 | | | | 32,237 | | | | 2,403 | | | | 25,233 | | | | 43,996 | | | | 468,648 | |
Class R6 | | | 8,721 | | | | 83,111 | | | | 6,273 | | | | 66,551 | | | | 12,385 | | | | 134,859 | |
Administrator Class | | | 158,255 | | | | 1,500,258 | | | | 250,106 | | | | 2,645,484 | | | | 1,432,764 | | | | 15,504,058 | |
Institutional Class | | | 345,507 | | | | 3,289,229 | | | | 440,841 | | | | 4,675,573 | | | | 3,278,437 | | | | 35,575,623 | |
| | | | |
| | | | | | | 5,302,540 | | | | | | | | 8,120,181 | | | | | | | | 56,468,942 | |
| | | | |
Payment for shares redeemed | | | | | | | | | | | | | | | | | | | | | | | | |
Class A | | | (5,046,620 | ) | | | (49,633,874 | ) | | | (5,719,183 | ) | | | (57,542,516 | ) | | | (3,778,957 | ) | | | (41,860,001 | ) |
Class B | | | (25,770 | ) | | | (256,696 | ) | | | (41,312 | ) | | | (422,819 | ) | | | (100,427 | ) | | | (1,099,942 | ) |
Class C | | | (222,003 | ) | | | (2,168,648 | ) | | | (395,376 | ) | | | (3,980,181 | ) | | | (471,593 | ) | | | (5,113,839 | ) |
Class R6 | | | (1,096,795 | ) | | | (11,289,059 | ) | | | (279,791 | ) | | | (2,789,621 | ) | | | (108,372 | ) | | | (1,209,097 | ) |
Administrator Class | | | (27,263,086 | ) | | | (278,792,881 | ) | | | (13,481,584 | ) | | | (136,684,425 | ) | | | (7,924,711 | ) | | | (87,207,416 | ) |
Institutional Class | | | (36,026,612 | ) | | | (359,679,067 | ) | | | (28,068,413 | ) | | | (285,845,548 | ) | | | (42,834,796 | ) | | | (471,768,358 | ) |
| | | | |
| | | | | | | (701,820,225 | ) | | | | | | | (487,265,110 | ) | | | | | | | (608,258,653 | ) |
| | | | |
Net decrease in net assets resulting from capital share transactions | | | | | | | (460,041,804 | ) | | | | | | | (124,523,876 | ) | | | | | | | (208,833,208 | ) |
| | | | |
Total decrease in net assets | | | | | | | (380,366,379 | ) | | | | | | | (255,310,332 | ) | | | | | | | (272,015,580 | ) |
| | | | |
| | | | | | |
Net assets | | | | | | | | | | | | | | | | | | | | | | | | |
Beginning of period | | | | | | | 1,056,990,035 | | | | | | | | 1,312,300,367 | | | | | | | | 1,584,315,947 | |
| | | | |
End of period | | | | | | $ | 676,623,656 | | | | | | | $ | 1,056,990,035 | | | | | | | $ | 1,312,300,367 | |
| | | | |
Undistributed (overdistributed) (accumulated) net investment income (loss) | | | | | | $ | (383,143 | ) | | | | | | $ | (48,221,909 | ) | | | | | | $ | 2,633,136 | |
| | | | |
| 1 | For the eleven months ended September 30, 2016. The Fund changed its fiscal year end from October 31 to September 30, effective September 30, 2016. |
The accompanying notes are an integral part of these financial statements.
| | | | | | |
| Financial highlights | | Wells Fargo International Bond Fund | | | 17 | |
(For a share outstanding throughout each period)
| | | | | | | | | | | | | | | | | | | | | | | | |
| | | Year ended September 30, 20161 | | | Year ended October 31 | |
| CLASS A | | | 2015 | | | 2014 | | | 2013 | | | 2012 | | | 2011 | |
Net asset value, beginning of period | | | $9.74 | | | | $10.84 | | | | $11.32 | | | | $11.83 | | | | $11.85 | | | | $12.23 | |
Net investment income | | | 0.24 | 2 | | | 0.31 | 2 | | | 0.37 | 2 | | | 0.36 | 2 | | | 0.33 | 2 | | | 0.39 | 2 |
Net realized and unrealized gains (losses) on investments | | | 0.85 | | | | (1.33 | ) | | | (0.34 | ) | | | (0.73 | ) | | | 0.08 | | | | (0.18 | ) |
| | | | | | | | | | | | | | | | | | | | | | | | |
Total from investment operations | | | 1.09 | | | | (1.02 | ) | | | 0.03 | | | | (0.37 | ) | | | 0.41 | | | | 0.21 | |
Distributions to shareholders from | | | | | | | | | | | | | | | | | | | | | | | | |
Net investment income | | | 0.00 | | | | (0.05 | ) | | | (0.12 | ) | | | (0.02 | ) | | | (0.29 | ) | | | (0.51 | ) |
Net realized gains | | | (0.06 | ) | | | (0.03 | ) | | | (0.39 | ) | | | (0.12 | ) | | | (0.14 | ) | | | (0.08 | ) |
| | | | | | | | | | | | | | | | | | | | | | | | |
Total distributions to shareholders | | | (0.06 | ) | | | (0.08 | ) | | | (0.51 | ) | | | (0.14 | ) | | | (0.43 | ) | | | (0.59 | ) |
Net asset value, end of period | | | $10.77 | | | | $9.74 | | | | $10.84 | | | | $11.32 | | | | $11.83 | | | | $11.85 | |
Total return3 | | | 11.24 | % | | | (9.50 | )% | | | 0.26 | % | | | (3.18 | )% | | | 3.66 | % | | | 1.93 | % |
Ratios to average net assets (annualized) | | | | | | | | | | | | | | | | | | | | | | | | |
Gross expenses | | | 1.08 | % | | | 1.06 | % | | | 1.05 | % | | | 1.05 | % | | | 1.04 | % | | | 1.02 | % |
Net expenses | | | 1.03 | % | | | 1.03 | % | | | 1.03 | % | | | 1.03 | % | | | 1.03 | % | | | 1.02 | % |
Net investment income | | | 2.64 | %�� | | | 3.07 | % | | | 3.29 | % | | | 2.93 | % | | | 2.88 | % | | | 3.26 | % |
Supplemental data | | | | | | | | | | | | | | | | | | | | | | | | |
Portfolio turnover rate | | | 96 | % | | | 136 | % | | | 103 | % | | | 129 | % | | | 79 | % | | | 88 | % |
Net assets, end of period (000s omitted) | | | $54,399 | | | | $79,727 | | | | $102,624 | | | | $113,846 | | | | $139,600 | | | | $286,577 | |
| 1 | For the eleven months ended September 30, 2016. The Fund changed its fiscal year end from October 31 to September 30, effective September 30, 2016. |
| 2 | Calculated based upon average shares outstanding |
| 3 | Total return calculations do not include any sales charges. Returns for periods of less than one year are not annualized. |
The accompanying notes are an integral part of these financial statements.
| | | | |
| 18 | | Wells Fargo International Bond Fund | | Financial highlights |
(For a share outstanding throughout each period)
| | | | | | | | | | | | | | | | | | | | | | | | |
| | | Year ended September 30, 20161 | | | Year ended October 31 | |
| CLASS B | | | 2015 | | | 2014 | | | 2013 | | | 2012 | | | 2011 | |
Net asset value, beginning of period | | | $9.67 | | | | $10.81 | | | | $11.27 | | | | $11.85 | | | | $11.88 | | | | $12.25 | |
Net investment income | | | 0.17 | 2 | | | 0.24 | 2 | | | 0.29 | 2 | | | 0.27 | 2 | | | 0.24 | 2 | | | 0.31 | 2 |
Net realized and unrealized gains (losses) on investments | | | 0.85 | | | | (1.35 | ) | | | (0.34 | ) | | | (0.73 | ) | | | 0.09 | | | | (0.19 | ) |
| | | | | | | | | | | | | | | | | | | | | | | | |
Total from investment operations | | | 1.02 | | | | (1.11 | ) | | | (0.05 | ) | | | (0.46 | ) | | | 0.33 | | | | 0.12 | |
Distributions to shareholders from | | | | | | | | | | | | | | | | | | | | | | | | |
Net investment income | | | 0.00 | | | | 0.00 | | | | (0.02 | ) | | | 0.00 | | | | (0.22 | ) | | | (0.41 | ) |
Net realized gains | | | (0.06 | ) | | | (0.03 | ) | | | (0.39 | ) | | | (0.12 | ) | | | (0.14 | ) | | | (0.08 | ) |
| | | | | | | | | | | | | | | | | | | | | | | | |
Total distributions to shareholders | | | (0.06 | ) | | | (0.03 | ) | | | (0.41 | ) | | | (0.12 | ) | | | (0.36 | ) | | | (0.49 | ) |
Net asset value, end of period | | | $10.63 | | | | $9.67 | | | | $10.81 | | | | $11.27 | | | | $11.85 | | | | $11.88 | |
Total return3 | | | 10.60 | % | | | (10.29 | )% | | | (0.44 | )% | | | (3.90 | )% | | | 2.90 | % | | | 1.15 | % |
Ratios to average net assets (annualized) | | | | | | | | | | | | | | | | | | | | | | | | |
Gross expenses | | | 1.83 | % | | | 1.80 | % | | | 1.78 | % | | | 1.80 | % | | | 1.79 | % | | | 1.77 | % |
Net expenses | | | 1.78 | % | | | 1.77 | % | | | 1.77 | % | | | 1.78 | % | | | 1.78 | % | | | 1.77 | % |
Net investment income | | | 1.91 | % | | | 2.33 | % | | | 2.57 | % | | | 2.13 | % | | | 2.12 | % | | | 2.53 | % |
Supplemental data | | | | | | | | | | | | | | | | | | | | | | | | |
Portfolio turnover rate | | | 96 | % | | | 136 | % | | | 103 | % | | | 129 | % | | | 79 | % | | | 88 | % |
Net assets, end of period (000s omitted) | | | $171 | | | | $403 | | | | $895 | | | | $1,998 | | | | $4,008 | | | | $6,925 | |
| 1 | For the eleven months ended September 30, 2016. The Fund changed its fiscal year end from October 31 to September 30, effective September 30, 2016. |
| 2 | Calculated based upon average shares outstanding |
| 3 | Total return calculations do not include any sales charges. Returns for periods of less than one year are not annualized. |
The accompanying notes are an integral part of these financial statements.
| | | | | | |
| Financial highlights | | Wells Fargo International Bond Fund | | | 19 | |
(For a share outstanding throughout each period)
| | | | | | | | | | | | | | | | | | | | | | | | |
| | | Year ended September 30, 20161 | | | Year ended October 31 | |
| CLASS C | | | 2015 | | | 2014 | | | 2013 | | | 2012 | | | 2011 | |
Net asset value, beginning of period | | | $9.58 | | | | $10.70 | | | | $11.19 | | | | $11.76 | | | | $11.81 | | | | $12.20 | |
Net investment income | | | 0.17 | 2 | | | 0.23 | 2 | | | 0.28 | 2 | | | 0.26 | 2 | | | 0.24 | 2 | | | 0.31 | 2 |
Net realized and unrealized gains (losses) on investments | | | 0.83 | | | | (1.32 | ) | | | (0.34 | ) | | | (0.71 | ) | | | 0.08 | | | | (0.19 | ) |
| | | | | | | | | | | | | | | | | | | | | | | | |
Total from investment operations | | | 1.00 | | | | (1.09 | ) | | | (0.06 | ) | | | (0.45 | ) | | | 0.32 | | | | 0.12 | |
Distributions to shareholders from | | | | | | | | | | | | | | | | | | | | | | | | |
Net investment income | | | 0.00 | | | | 0.00 | | | | (0.04 | ) | | | (0.00 | )3 | | | (0.23 | ) | | | (0.43 | ) |
Net realized gains | | | (0.06 | ) | | | (0.03 | ) | | | (0.39 | ) | | | (0.12 | ) | | | (0.14 | ) | | | (0.08 | ) |
| | | | | | | | | | | | | | | | | | | | | | | | |
Total distributions to shareholders | | | (0.06 | ) | | | (0.03 | ) | | | (0.43 | ) | | | (0.12 | ) | | | (0.37 | ) | | | (0.51 | ) |
Net asset value, end of period | | | $10.52 | | | | $9.58 | | | | $10.70 | | | | $11.19 | | | | $11.76 | | | | $11.81 | |
Total return4 | | | 10.49 | % | | | (10.21 | )% | | | (0.52 | )% | | | (3.84 | )% | | | 2.86 | % | | | 1.11 | % |
Ratios to average net assets (annualized) | | | | | | | | | | | | | | | | | | | | | | | | |
Gross expenses | | | 1.83 | % | | | 1.81 | % | | | 1.80 | % | | | 1.80 | % | | | 1.79 | % | | | 1.77 | % |
Net expenses | | | 1.78 | % | | | 1.78 | % | | | 1.78 | % | | | 1.78 | % | | | 1.78 | % | | | 1.77 | % |
Net investment income | | | 1.86 | % | | | 2.33 | % | | | 2.54 | % | | | 2.15 | % | | | 2.12 | % | | | 2.50 | % |
Supplemental data | | | | | | | | | | | | | | | | | | | | | | | | |
Portfolio turnover rate | | | 96 | % | | | 136 | % | | | 103 | % | | | 129 | % | | | 79 | % | | | 88 | % |
Net assets, end of period (000s omitted) | | | $5,520 | | | | $6,895 | | | | $11,597 | | | | $16,097 | | | | $23,448 | | | | $27,861 | |
| 1 | For the eleven months ended September 30, 2016. The Fund changed its fiscal year end from October 31 to September 30, effective September 30, 2016. |
| 2 | Calculated based upon average shares outstanding |
| 3 | Amount is less than $0.005 per share. |
| 4 | Total return calculations do not include any sales charges. Returns for periods of less than one year are not annualized. |
The accompanying notes are an integral part of these financial statements.
| | | | |
| 20 | | Wells Fargo International Bond Fund | | Financial highlights |
(For a share outstanding throughout each period)
| | | | | | | | | | | | | | | | |
| | | Year ended September 30, 20161 | | | Year ended October 31 | |
| CLASS R6 | | | 2015 | | | 2014 | | | 20132 | |
Net asset value, beginning of period | | | $9.80 | | | | $10.88 | | | | $11.36 | | | | $11.80 | |
Net investment income | | | 0.28 | 3 | | | 0.35 | 3 | | | 0.42 | 3 | | | 0.39 | 3 |
Net realized and unrealized gains (losses) on investments | | | 0.86 | | | | (1.34 | ) | | | (0.35 | ) | | | (0.69 | ) |
| | | | | | | | | | | | | | | | |
Total from investment operations | | | 1.14 | | | | (0.99 | ) | | | 0.07 | | | | (0.30 | ) |
Distributions to shareholders from | | | | | | | | | | | | | | | | |
Net investment income | | | 0.00 | | | | (0.06 | ) | | | (0.16 | ) | | | (0.02 | ) |
Net realized gains | | | (0.06 | ) | | | (0.03 | ) | | | (0.39 | ) | | | (0.12 | ) |
| | | | | | | | | | | | | | | | |
Total distributions to shareholders | | | (0.06 | ) | | | (0.09 | ) | | | (0.55 | ) | | | (0.14 | ) |
Net asset value, end of period | | | $10.88 | | | | $9.80 | | | | $10.88 | | | | $11.36 | |
Total return4 | | | 11.69 | % | | | (9.18 | )% | | | 0.60 | % | | | (2.52 | )% |
Ratios to average net assets (annualized) | | | | | | | | | | | | | | | | |
Gross expenses | | | 0.70 | % | | | 0.68 | % | | | 0.67 | % | | | 0.68 | % |
Net expenses | | | 0.65 | % | | | 0.65 | % | | | 0.65 | % | | | 0.65 | % |
Net investment income | | | 3.00 | % | | | 3.46 | % | | | 3.64 | % | | | 3.70 | % |
Supplemental data | | | | | | | | | | | | | | | | |
Portfolio turnover rate | | | 96 | % | | | 136 | % | | | 103 | % | | | 129 | % |
Net assets, end of period (000s omitted) | | | $12,501 | | | | $13,152 | | | | $5,729 | | | | $2,433 | |
| 1 | For the eleven months ended September 30, 2016. The Fund changed its fiscal year end from October 31 to September 30, effective September 30, 2016. |
| 2 | For the period from November 30, 2012 (commencement of class operations) to October 31, 2013 |
| 3 | Calculated based upon average shares outstanding |
| 4 | Returns for periods of less than one year are not annualized. |
The accompanying notes are an integral part of these financial statements.
| | | | | | |
| Financial highlights | | Wells Fargo International Bond Fund | | | 21 | |
(For a share outstanding throughout each period)
| | | | | | | | | | | | | | | | | | | | | | | | |
| | | Year ended September 30, 20161 | | | Year ended October 31 | |
| ADMINISTRATOR CLASS | | | 2015 | | | 2014 | | | 2013 | | | 2012 | | | 2011 | |
Net asset value, beginning of period | | | $9.75 | | | | $10.84 | | | | $11.32 | | | | $11.81 | | | | $11.83 | | | | $12.23 | |
Net investment income | | | 0.26 | 2 | | | 0.33 | 2 | | | 0.39 | 2 | | | 0.36 | 2 | | | 0.35 | 2 | | | 0.38 | 2 |
Net realized and unrealized gains (losses) on investments | | | 0.85 | | | | (1.34 | ) | | | (0.34 | ) | | | (0.71 | ) | | | 0.08 | | | | (0.16 | ) |
| | | | | | | | | | | | | | | | | | | | | | | | |
Total from investment operations | | | 1.11 | | | | (1.01 | ) | | | 0.05 | | | | (0.35 | ) | | | 0.43 | | | | 0.22 | |
Distributions to shareholders from | | | | | | | | | | | | | | | | | | | | | | | | |
Net investment income | | | 0.00 | | | | (0.05 | ) | | | (0.14 | ) | | | (0.02 | ) | | | (0.31 | ) | | | (0.54 | ) |
Net realized gains | | | (0.06 | ) | | | (0.03 | ) | | | (0.39 | ) | | | (0.12 | ) | | | (0.14 | ) | | | (0.08 | ) |
| | | | | | | | | | | | | | | | | | | | | | | | |
Total distributions to shareholders | | | (0.06 | ) | | | (0.08 | ) | | | (0.53 | ) | | | (0.14 | ) | | | (0.45 | ) | | | (0.62 | ) |
Net asset value, end of period | | | $10.80 | | | | $9.75 | | | | $10.84 | | | | $11.32 | | | | $11.81 | | | | $11.83 | |
Total return3 | | | 11.44 | % | | | (9.36 | )% | | | 0.43 | % | | | (2.98 | )% | | | 3.89 | % | | | 2.03 | % |
Ratios to average net assets (annualized) | | | | | | | | | | | | | | | | | | | | | | | | |
Gross expenses | | | 1.02 | % | | | 0.99 | % | | | 0.99 | % | | | 0.99 | % | | | 0.97 | % | | | 0.95 | % |
Net expenses | | | 0.85 | % | | | 0.85 | % | | | 0.85 | % | | | 0.85 | % | | | 0.85 | % | | | 0.85 | % |
Net investment income | | | 2.85 | % | | | 3.26 | % | | | 3.47 | % | | | 3.15 | % | | | 3.04 | % | | | 3.21 | % |
Supplemental data | | | | | | | | | | | | | | | | | | | | | | | | |
Portfolio turnover rate | | | 96 | % | | | 136 | % | | | 103 | % | | | 129 | % | | | 79 | % | | | 88 | % |
Net assets, end of period (000s omitted) | | | $50,825 | | | | $266,849 | | | | $359,383 | | | | $334,778 | | | | $294,330 | | | | $170,836 | |
| 1 | For the eleven months ended September 30, 2016. The Fund changed its fiscal year end from October 31 to September 30, effective September 30, 2016. |
| 2 | Calculated based upon average shares outstanding |
| 3 | Returns for periods of less than one year are not annualized. |
The accompanying notes are an integral part of these financial statements.
| | | | |
| 22 | | Wells Fargo International Bond Fund | | Financial highlights |
(For a share outstanding throughout each period)
| | | | | | | | | | | | | | | | | | | | | | | | |
| | | Year ended September 30, 20161 | | | Year ended October 31 | |
| INSTITUTIONAL CLASS | | | 2015 | | | 2014 | | | 2013 | | | 2012 | | | 2011 | |
Net asset value, beginning of period | | | $9.79 | | | | $10.87 | | | | $11.35 | | | | $11.82 | | | | $11.84 | | | | $12.23 | |
Net investment income | | | 0.27 | 2 | | | 0.35 | 2 | | | 0.41 | 2 | | | 0.37 | | | | 0.36 | | | | 0.44 | |
Net realized and unrealized gains (losses) on investments | | | 0.86 | | | | (1.34 | ) | | | (0.35 | ) | | | (0.70 | ) | | | 0.09 | | | | (0.20 | ) |
| | | | | | | | | | | | | | | | | | | | | | | | |
Total from investment operations | | | 1.13 | | | | (0.99 | ) | | | 0.06 | | | | (0.33 | ) | | | 0.45 | | | | 0.24 | |
Distributions to shareholders from | | | | | | | | | | | | | | | | | | | | | | | | |
Net investment income | | | 0.00 | | | | (0.06 | ) | | | (0.15 | ) | | | (0.02 | ) | | | (0.33 | ) | | | (0.55 | ) |
Net realized gains | | | (0.06 | ) | | | (0.03 | ) | | | (0.39 | ) | | | (0.12 | ) | | | (0.14 | ) | | | (0.08 | ) |
| | | | | | | | | | | | | | | | | | | | | | | | |
Total distributions to shareholders | | | (0.06 | ) | | | (0.09 | ) | | | (0.54 | ) | | | (0.14 | ) | | | (0.47 | ) | | | (0.63 | ) |
Net asset value, end of period | | | $10.86 | | | | $9.79 | | | | $10.87 | | | | $11.35 | | | | $11.82 | | | | $11.84 | |
Total return3 | | | 11.60 | % | | | (9.20 | )% | | | 0.55 | % | | | (2.78 | )% | | | 3.99 | % | | | 2.19 | % |
Ratios to average net assets (annualized) | | | | | | | | | | | | | | | | | | | | | | | | |
Gross expenses | | | 0.75 | % | | | 0.73 | % | | | 0.72 | % | | | 0.72 | % | | | 0.71 | % | | | 0.69 | % |
Net expenses | | | 0.70 | % | | | 0.70 | % | | | 0.70 | % | | | 0.70 | % | | | 0.71 | % | | | 0.69 | % |
Net investment income | | | 2.95 | % | | | 3.41 | % | | | 3.62 | % | | | 3.26 | % | | | 3.19 | % | | | 3.60 | % |
Supplemental data | | | | | | | | | | | | | | | | | | | | | | | | |
Portfolio turnover rate | | | 96 | % | | | 136 | % | | | 103 | % | | | 129 | % | | | 79 | % | | | 88 | % |
Net assets, end of period (000s omitted) | | | $553,208 | | | | $689,964 | | | | $832,072 | | | | $1,115,163 | | | | $1,270,164 | | | | $1,228,793 | |
| 1 | For the eleven months ended September 30, 2016. The Fund changed its fiscal year end from October 31 to September 30, effective September 30, 2016. |
| 2 | Calculated based upon average shares outstanding |
| 3 | Returns for periods of less than one year are not annualized. |
The accompanying notes are an integral part of these financial statements.
| | | | | | |
| Notes to financial statements | | Wells Fargo International Bond Fund | | | 23 | |
1. ORGANIZATION
Wells Fargo Funds Trust (the “Trust”), a Delaware statutory trust organized on March 10, 1999, is an open-end management investment company registered under the Investment Company Act of 1940, as amended (the “1940 Act”). As an investment company, the Trust follows the accounting and reporting guidance in Financial Accounting Standards Board (“FASB”) Accounting Standards Codification Topic 946, Financial Services – Investment Companies. These financial statements report on the Wells Fargo International Bond Fund (the “Fund”) which is a diversified series of the Trust.
2. SIGNIFICANT ACCOUNTING POLICIES
The following significant accounting policies, which are consistently followed in the preparation of the financial statements of the Fund, are in conformity with U.S. generally accepted accounting principles which require management to make estimates and assumptions that affect the reported amounts of assets and liabilities, disclosure of contingent assets and liabilities at the date of the financial statements, and the reported amounts of revenues and expenses during the reporting period. Actual results could differ from those estimates.
Securities valuation
All investments are valued each business day as of the close of regular trading on the New York Stock Exchange (generally 4 p.m. Eastern Time), although the Fund may deviate from this calculation time under unusual or unexpected circumstances.
Debt securities are valued at the evaluated bid price provided by an independent pricing service or, if a reliable price is not available, the quoted bid price from an independent broker-dealer.
The values of securities denominated in foreign currencies are translated into U.S. dollars at rates provided by an independent foreign currency pricing source at a time each business day specified by the Management Valuation Team of Wells Fargo Funds Management, LLC (“Funds Management”).
Investments in registered open-end investment companies are valued at net asset value. Interests in non-registered investment vehicles that are redeemable at net asset value are fair valued normally at net asset value.
Investments which are not valued using any of the methods discussed above are valued at their fair value, as determined in good faith by the Board of Trustees of the Fund. The Board of Trustees has established a Valuation Committee comprised of the Trustees and has delegated to it the authority to take any actions regarding the valuation of portfolio securities that the Valuation Committee deems necessary or appropriate, including determining the fair value of portfolio securities, unless the determination has been delegated to the Management Valuation Team. The Board of Trustees retains the authority to make or ratify any valuation decisions or approve any changes to the Valuation Procedures as it deems appropriate. On a quarterly basis, the Board of Trustees receives reports on any valuation actions taken by the Valuation Committee or the Management Valuation Team which may include items for ratification.
Valuations of fair valued securities are compared to the next actual sales price when available, or other appropriate market values, to assess the continued appropriateness of the fair valuation methodologies used. These securities are fair valued on a day-to-day basis, taking into consideration changes to appropriate market information and any significant changes to the inputs considered in the valuation process until there is a readily available price provided on an exchange or by an independent pricing service. Valuations received from an independent pricing service or independent broker-dealer quotes are periodically validated by comparisons to most recent trades and valuations provided by other independent pricing services in addition to the review of prices by the manager and/or subadviser. Unobservable inputs used in determining fair valuations are identified based on the type of security, taking into consideration factors utilized by market participants in valuing the investment, knowledge about the issuer and the current market environment.
Foreign currency translation
The accounting records of the Fund are maintained in U.S. dollars. The values of other assets and liabilities denominated in foreign currencies are translated into U.S. dollars at rates provided by an independent foreign currency pricing source at a time each business day specified by the Management Valuation Team. Purchases and sales of securities, and income and expenses are converted at the rate of exchange on the respective dates of such transactions. Net realized foreign exchange gains or losses arise from sales of foreign currencies, currency gains or losses realized between the trade and settlement dates on securities transactions, and the difference between the amounts of dividends, interest and foreign withholding taxes recorded and the U.S. dollar equivalent of the amounts actually paid or received. Net unrealized foreign exchange gains and losses arise from changes in the fair value of assets and liabilities other than investments in securities resulting from changes in exchange rates. The changes in net assets arising from changes in exchange rates and the changes in net assets resulting from changes in market prices of securities are not separately presented. Such changes are included in net realized and unrealized gains or losses from investments.
| | | | |
| 24 | | Wells Fargo International Bond Fund | | Notes to financial statements |
Forward foreign currency contracts
The Fund is subject to foreign currency exchange rate risk in the normal course of pursuing its investment objectives. A forward foreign currency contract is an agreement between two parties to purchase or sell a specific currency for an agreed-upon price at a future date. The Fund enters into forward foreign currency contracts to facilitate transactions in foreign-denominated securities and to attempt to minimize the risk to the Fund from adverse changes in the relationship between currencies. Forward foreign currency contracts are recorded at the forward rate and marked-to-market daily. When the contracts are closed, realized gains and losses arising from such transactions are recorded as realized gains or losses on forward foreign currency contract transactions. The Fund could be exposed to risks if the counterparties to the contracts are unable to meet the terms of their contracts or if the value of the foreign currency changes unfavorably. The Fund’s maximum risk of loss from counterparty credit risk is the unrealized gains on the contracts. This risk may be mitigated if there is a master netting arrangement between the Fund and the counterparty.
Security loans
The Fund may lend its securities from time to time in order to earn additional income in the form of fees or interest on securities received as collateral or the investment of any cash received as collateral. The Fund continues to receive interest or dividends on the securities loaned. The Fund receives collateral in the form of cash or securities with a value at least equal to the value of the securities on loan. The value of the loaned securities is determined at the close of each business day and any additional required collateral is delivered to the Fund on the next business day. In a securities lending transaction, the net asset value of the Fund will be affected by an increase or decrease in the value of the securities loaned and by an increase or decrease in the value of the instrument in which collateral is invested. The amount of securities lending activity undertaken by the Fund fluctuates from time to time. In the event of default or bankruptcy by the borrower, the Fund may be prevented from recovering the loaned securities or gaining access to the collateral or may experience delays or costs in doing so. In addition, the investment of any cash collateral received may lose all or part of its value. The Fund has the right under the lending agreement to recover the securities from the borrower on demand.
The Fund lends its securities through an unaffiliated securities lending agent. Cash collateral received in connection with its securities lending transactions is invested in Securities Lending Cash Investments, LLC (the “Securities Lending Fund”). The Securities Lending Fund is exempt from registration under Section 3(c)(7) of the 1940 Act and is managed by Funds Management and is subadvised by Wells Capital Management Incorporated (“WellsCap”), an affiliate of Funds Management and an indirect wholly owned subsidiary of Wells Fargo & Company (“Wells Fargo”). Funds Management receives an advisory fee starting at 0.05% and declining to 0.01% as the average daily net assets of the Securities Lending Fund increase. All of the fees received by Funds Management are paid to WellsCap for its services as subadviser. The Securities Lending Fund seeks to provide a positive return compared to the daily Fed Funds Open rate by investing in high-quality, U.S. dollar-denominated short-term money market instruments. Securities Lending Fund investments are fair valued based upon the amortized cost valuation technique. Income earned from investment in the Securities Lending Fund is included in securities lending income on the Statement of Operations.
When-issued transactions
The Fund may purchase securities on a forward commitment or when-issued basis. The Fund records a when-issued transaction on the trade date and will segregate assets in an amount at least equal in value to the Fund’s commitment to purchase when-issued securities. Securities purchased on a when-issued basis are marked-to-market daily and the Fund begins earning interest on the settlement date. Losses may arise due to changes in the market value of the underlying securities or if the counterparty does not perform under the contract.
Security transactions and income recognition
Securities transactions are recorded on a trade date basis. Realized gains or losses are recorded on the basis of identified cost.
Interest income is accrued daily and bond discounts are accreted and premiums are amortized daily based on the effective interest method. To the extent debt obligations are placed on non-accrual status, any related interest income may be reduced by writing off interest receivables when the collection of all or a portion of interest has become doubtful based on consistently applied procedures. If the issuer subsequently resumes interest payments or when the collectability of interest is reasonably assured, the debt obligation is removed from non-accrual status.
Income from foreign securities is recorded net of foreign taxes withheld where recovery of such taxes is not assured.
Distributions to shareholders
Distributions to shareholders from net investment income and net realized gains, if any, are recorded on the ex-dividend date. Such distributions are determined in conformity with federal income tax regulations, which may differ in amount or character from net investment income and realized gains recognized for purposes of U.S. generally accepted accounting principles.
| | | | | | |
| Notes to financial statements | | Wells Fargo International Bond Fund | | | 25 | |
Federal and other taxes
The Fund intends to continue to qualify as a regulated investment company by distributing substantially all of its investment company taxable income and any net realized capital gains (after reduction for capital loss carryforwards) sufficient to relieve it from all, or substantially all, federal income taxes. Accordingly, no provision for federal income taxes was required.
The Fund’s income and federal excise tax returns and all financial records supporting those returns for the prior three fiscal years are subject to examination by the federal and Delaware revenue authorities. Management has analyzed the Fund’s tax positions taken on federal, state, and foreign tax returns for all open tax years and does not believe that there are any uncertain tax positions that require recognition of a tax liability.
Reclassifications are made to the Fund’s capital accounts for permanent tax differences to reflect income and gains available for distribution (or available capital loss carryforwards) under federal income tax regulations. U.S. generally accepted accounting principles require that certain components of net assets be adjusted to reflect permanent differences between financial and tax reporting. These reclassifications have no effect on net assets or net asset values per share. The primary permanent differences causing such reclassifications are due to foreign currency transactions and net operating losses. At September 30, 2016, as a result of permanent book-to-tax differences, the following reclassification adjustments were made on the Statement of Assets and Liabilities:
| | | | |
| Paid-in capital | | Accumulated net investment loss | | Accumulated net
realized gains
on investments |
| $(67,551,058) | | $25,271,932 | | $42,279,126 |
Class allocations
The separate classes of shares offered by the Fund differ principally in applicable sales charges, distribution, shareholder servicing, and administration fees. Class specific expenses are charged directly to that share class. Investment income, common expenses, and realized and unrealized gains (losses) on investments are allocated daily to each class of shares based on the relative proportion of net assets of each class.
3. FAIR VALUATION MEASUREMENTS
Fair value measurements of investments are determined within a framework that has established a fair value hierarchy based upon the various data inputs utilized in determining the value of the Fund’s investments. The three-level hierarchy gives the highest priority to unadjusted quoted prices in active markets for identical assets or liabilities (Level 1) and the lowest priority to significant unobservable inputs (Level 3). The Fund’s investments are classified within the fair value hierarchy based on the lowest level of input that is significant to the fair value measurement. The inputs are summarized into three broad levels as follows:
| ∎ | | Level 1 – quoted prices in active markets for identical securities |
| ∎ | | Level 2 – other significant observable inputs (including quoted prices for similar securities, interest rates, prepayment speeds, credit risk, use of amortized cost, etc.) |
| ∎ | | Level 3 – significant unobservable inputs (including the Fund’s own assumptions in determining the fair value of investments) |
The inputs or methodologies used for valuing investments in securities are not necessarily an indication of the risk associated with investing in those securities.
| | | | |
| 26 | | Wells Fargo International Bond Fund | | Notes to financial statements |
The following is a summary of the inputs used in valuing the Fund’s assets and liabilities as of September 30, 2016:
| | | | | | | | | | | | | | | | |
| | | Quoted prices
(Level 1) | | | Other significant
observable inputs
(Level 2) | | | Significant
unobservable inputs
(Level 3) | | | Total | |
Assets | | | | | | | | | | | | | | | | |
Investments in: | | | | | | | | | | | | | | | | |
| | | | |
Corporate bonds and notes | | $ | 0 | | | $ | 33,852,165 | | | $ | 0 | | | $ | 33,852,165 | |
| | | | |
Foreign corporate bonds and notes | | | 0 | | | | 95,499,942 | | | | 0 | | | | 95,499,942 | |
| | | | |
Foreign government bonds | | | 0 | | | | 450,453,162 | | | | 0 | | | | 450,453,162 | |
| | | | |
U.S Treasury securities | | | 62,478,003 | | | | 0 | | | | 0 | | | | 62,478,003 | |
| | | | |
Yankee corporate bonds and notes | | | 0 | | | | 15,956,660 | | | | 0 | | | | 15,956,660 | |
| | | | |
Short-term investments | | | | | | | | | | | | | | | | |
Investment companies | | | 6,152,065 | | | | 0 | | | | 0 | | | | 6,152,065 | |
| | | 68,630,068 | | | | 595,761,929 | | | | 0 | | | | 664,391,997 | |
| | | | |
Forward foreign currency contracts | | | 0 | | | | 2,728,369 | | | | 0 | | | | 2,728,369 | |
Total assets | | $ | 68,630,068 | | | $ | 598,490,298 | | | $ | 0 | | | $ | 667,120,366 | |
Liabilities | | | | | | | | | | | | | | | | |
| | | | |
Forward foreign currency contracts | | $ | 0 | | | $ | 4,482,614 | | | $ | 0 | | | $ | 4,482,614 | |
Total liabilities | | $ | 0 | | | $ | 4,482,614 | | | $ | 0 | | | $ | 4,482,614 | |
Forward foreign currency contracts are reported at their unrealized gains (losses) at measurement date, which represents the change in the contract’s value from trade date. All other assets and liabilities are reported at their market value at measurement date.
The Fund recognizes transfers between levels within the fair value hierarchy at the end of the reporting period. At September 30, 2016, the Fund did not have any transfers into/out of Level 1, Level 2, or Level 3.
4. TRANSACTIONS WITH AFFILIATES
Management fee
Funds Management, an indirect wholly owned subsidiary of Wells Fargo, is the manager of the Fund and provides advisory and fund-level administrative services under an investment management agreement. Under the investment management agreement, Funds Management is responsible for, among other services, implementing the investment objectives and strategies of the Fund, supervising the subadviser, providing fund-level administrative services in connection with the Fund’s operations, and providing any other fund-level administrative services reasonably necessary for the operation of the Fund. As compensation for its services under the investment management agreement, Funds Management is entitled to receive an annual management fee starting at 0.60% and declining to 0.48% as the average daily net assets of the Fund increase.
Prior to July 1, 2015, Funds Management provided advisory services pursuant to an investment advisory agreement and was entitled to receive an annual fee which started at 0.55% and declined to 0.45% as the average daily net assets of the Fund increased. In addition, fund-level administrative services were provided by Funds Management under a separate administration agreement at an annual fee which started at 0.05% and declined to 0.03% as the average daily net assets of the Fund increased. For financial statement purposes, the advisory fee and fund-level administration fee for the year ended October 31, 2015 have been included in management fee on the Statement of Operations.
For the eleven months ended September 30, 2016 and the year ended October 31, 2015, the management fee was equivalent to an annual rate of 0.59% and 0.58%, respectively, of the Fund’s average daily net assets.
Funds Management has retained the services of a subadviser to provide daily portfolio management to the Fund. The fee for subadvisory services is borne by Funds Management. First International Advisors, LLC, an affiliate of Funds Management and an indirect wholly owned subsidiary of Wells Fargo, is the subadviser to the Fund and is entitled to receive a fee from Funds Management at an annual rate starting at 0.35% and declining to 0.20% as the average daily net assets of the Fund increase.
Administration fees
Under a class-level administration agreement, Funds Management provides class-level administrative services to the Fund, which includes paying fees and expenses for services provided by the transfer agent, sub-transfer agents, omnibus account
| | | | | | |
| Notes to financial statements | | Wells Fargo International Bond Fund | | | 27 | |
servicers and record-keepers. As compensation for its services under the class-level administration agreement, Funds Management receives an annual fee which is calculated based on the average daily net assets of each class as follows:
| | | | |
| | | Class-level
administration fee | |
Class A, Class B, Class C | | | 0.16 | % |
Class R6 | | | 0.03 | |
Administrator Class | | | 0.10 | |
Institutional Class | | | 0.08 | |
Funds Management has contractually waived and/or reimbursed management and administration fees to the extent necessary to maintain certain net operating expense ratios for the Fund. Waiver of fees and/or reimbursement of expenses by Funds Management were made first from fund level expenses on a proportionate basis and then from class specific expenses. Funds Management has committed through February 28, 2017 to waive fees and/or reimburse expenses to the extent necessary to cap the Fund’s expenses at 1.03% for Class A shares, 1.78% for Class B shares, 1.78% for Class C shares, 0.65% for Class R6 shares, 0.85% for Administrator Class shares, and 0.70% for Institutional Class shares. After this time, the cap may be increased or the commitment to maintain the cap may be terminated only with the approval of the Board of Trustees.
Distribution fees
The Trust has adopted a distribution plan for Class B and Class C shares of the Fund pursuant to Rule 12b-1 under the 1940 Act. Distribution fees are charged to Class B and Class C shares and paid to Wells Fargo Funds Distributor, LLC (“Funds Distributor”), the principal underwriter, at an annual rate of 0.75% of the average daily net assets of Class B and Class C shares.
In addition, Funds Distributor is entitled to receive the front-end sales charge from the purchase of Class A shares and a contingent deferred sales charge on the redemption of certain Class A shares. Funds Distributor is also entitled to receive the contingent deferred sales charges from redemptions of Class B and Class C shares. For the eleven months ended September 30, 2016, Funds Distributors received $980 from the sale of Class A shares.
Shareholder servicing fees
The Trust has entered into contracts with one or more shareholder servicing agents, whereby Class A, Class B, Class C, and Administrator Class of the Fund are charged a fee at an annual rate of 0.25% of the average daily net assets of each respective class.
A portion of these total shareholder servicing fees were paid to affiliates of Wells Fargo.
5. INVESTMENT PORTFOLIO TRANSACTIONS
Purchases and sales of investments, excluding short-term securities, were as follows:
| | | | | | | | | | | | | | | | |
| | | Purchases at cost | | | Sales proceeds | |
| | | U.S.
government | | | Non-U.S.
government | | | U.S.
government | | | Non-U.S.
government | |
Year ended September 30, 2016* | | $ | 183,745,171 | | | $ | 603,904,518 | | | $ | 209,175,048 | | | $ | 970,646,812 | |
Year ended October 31, 2015 | | | 187,277,756 | | | | 1,401,900,814 | | | | 102,829,321 | | | | 1,568,037,531 | |
| * | For the eleven months ended September 30, 2016. The Fund changed its fiscal year end from October 31 to September 30, effective September 30, 2016 |
The Fund may purchase or sell investment securities to other Wells Fargo funds under procedures adopted by the Board of Trustees. The procedures have been designed to ensure that these interfund transactions, which generally do not incur broker commissions, are effected at current market prices. Interfund trades are included within the respective purchases and sales amounts shown.
6. DERIVATIVE TRANSACTIONS
During the eleven months ended September 30, 2016 and the year ended October 31, 2015, the Fund entered into forward foreign currency contracts for economic hedging purposes.
At September 30, 2016, the Fund had forward foreign currency contracts outstanding as follows:
Forward foreign currency contracts to buy:
| | | | | | | | | | | | | | | | | | |
| Exchange date | | Counterparty | | Contracts to receive | | | U.S. value at September 30, 2016 | | | In exchange for U.S. $ | | | Unrealized gains (losses) | |
| 10-12-2016 | | State Street Bank | | | 3,500,000,000 | KRW | | $ | 3,177,774 | | | $ | 3,076,247 | | | $ | 101,527 | |
| 10-17-2016 | | State Street Bank | | | 45,650,000 | SGD | | | 33,478,603 | | | | 33,892,743 | | | | (414,140 | ) |
| 10-28-2016 | | State Street Bank | | | 28,600,000 | CAD | | | 21,803,809 | | | | 21,689,482 | | | | 114,327 | |
| 11-14-2016 | | State Street Bank | | | 22,360,000,000 | JPY | | | 220,869,663 | | | | 221,318,866 | | | | (449,203 | ) |
| 12-16-2016 | | State Street Bank | | | 117,500,000 | EUR | | | 132,435,274 | | | | 132,428,140 | | | | 7,134 | |
| | | | |
| 28 | | Wells Fargo International Bond Fund | | Notes to financial statements |
Forward foreign currency contracts to sell:
| | | | | | | | | | | | | | | | | | |
| Exchange date | | Counterparty | | Contracts to deliver | | | U.S. value at September 30, 2016 | | | In exchange for U.S. $ | | | Unrealized gains (losses) | |
| 11-14-2016 | | State Street Bank | | | 74,500,000 | MYR | | $ | 17,975,106 | | | $ | 17,995,169 | | | $ | 20,063 | |
| 12-13-2016 | | State Street Bank | | | 31,550,000 | GBP | | | 40,949,582 | | | | 42,021,603 | | | | 1,072,021 | |
| 11-14-2016 | | State Street Bank | | | 650,000,000 | JPY | | | 6,420,630 | | | | 6,488,107 | | | | 67,477 | |
| 10-28-2016 | | State Street Bank | | | 2,000,000 | CAD | | | 1,524,742 | | | | 1,519,040 | | | | (5,702 | ) |
| 10-12-2016 | | State Street Bank | | | 3,500,000,000 | KRW | | | 3,177,774 | | | | 3,018,412 | | | | (159,362 | ) |
| 10-17-2016 | | State Street Bank | | | 45,650,000 | SGD | | | 33,478,603 | | | | 33,856,195 | | | | 377,592 | |
| 11-10-2016 | | State Street Bank | | | 668,000,000 | THB | | | 19,268,264 | | | | 19,094,716 | | | | (173,548 | ) |
| 12-8-2016 | | State Street Bank | | | 51,850,000 | BRL | | | 15,649,972 | | | | 15,447,639 | | | | (202,333 | ) |
| 12-8-2016 | | State Street Bank | | | 11,735,000 | BRL | | | 3,541,995 | | | | 3,496,201 | | | | (45,794 | ) |
| 12-6-2016 | | State Street Bank | | | 233,000,000 | ZAR | | | 16,775,608 | | | | 15,687,383 | | | | (1,088,225 | ) |
| 11-7-2016 | | State Street Bank | | | 540,000,000 | MXN | | | 27,740,340 | | | | 28,640,681 | | | | 900,341 | |
| 12-6-2016 | | State Street Bank | | | 39,500,000 | ZAR | | | 2,843,934 | | | | 2,659,449 | | | | (184,485 | ) |
| 12-14-2016 | | State Street Bank | | | 42,650,000 | NZD | | | 30,969,958 | | | | 31,022,331 | | | | 52,373 | |
| 12-19-2016 | | State Street Bank | | | 96,400,000 | AUD | | | 73,654,460 | | | | 71,894,638 | | | | (1,759,822 | ) |
| 11-14-2016 | | State Street Bank | | | 575,000,000 | JPY | | | 5,679,788 | | | | 5,695,302 | | | | 15,514 | |
The Fund had average contract amounts of $709,144,531 and $493,977,653 in forward foreign currency contracts to buy and forward foreign currency contracts to sell, respectively, during the eleven months ended September 30, 2016.
The Fund had average contract amounts of $721,056,475 and $586,207,170 in forward foreign currency contracts to buy and forward foreign currency contracts to sell, respectively, during the year ended October 31, 2015.
The fair value, realized gains or losses and change in unrealized gains or losses, if any, on derivative instruments are reflected in the appropriate financial statements.
For certain types of derivative transactions, the Fund has entered into International Swaps and Derivatives Association, Inc. master agreements (“ISDA Master Agreements”) or similar agreements with approved counterparties. The ISDA Master Agreements or similar agreements may have requirements to deliver/deposit securities or cash to/with an exchange or broker-dealer as collateral and allows the Fund to offset, with each counterparty, certain derivative financial instrument’s assets and/or liabilities with collateral held or pledged. Collateral requirements differ by type of derivative. Collateral or margin requirements are set by the broker or exchange clearing house for exchange traded derivatives while collateral terms are contract specific for over-the-counter traded derivatives. Cash collateral that has been pledged to cover obligations of the Fund under ISDA Master Agreements or similar agreements, if any, are reported separately in the Statement of Assets and Liabilities. Securities pledged as collateral, if any, are noted in the Portfolio of Investments. With respect to balance sheet offsetting, absent an event of default by the counterparty or a termination of the agreement, the reported amounts of financial assets and financial liabilities in the Statement of Assets and Liabilities are not offset across transactions between the Fund and the applicable counterparty. A reconciliation of the gross amounts on the Statement of Assets and Liabilities to the net amounts by derivative type, including any collateral exposure, is as follows:
| | | | | | | | | | | | | | | | |
| Derivative type | | Counterparty | | Gross amounts
of assets in the
Statement of Assets and
Liabilities | | Amounts
subject to
netting
agreements | | | Collateral
received | | | Net amount
of assets | |
Forward foreign currency contracts | | State Street Bank | | $2,728,369* | | $ | (2,728,369 | ) | | $ | 0 | | | $ | 0 | |
| * | | Amount represents net unrealized gains. |
| | | | | | | | | | | | | | | | |
| Derivative type | | Counterparty | | Gross amounts
of liabilities in the
Statement of
Assets and
Liabilities | | Amounts
subject to
netting
agreements | | | Collateral
pledged | | | Net amount
of liabilities | |
Forward foreign currency contracts | | State Street Bank | | $4,482,614* | | $ | (2,728,369 | ) | | $ | 0 | | | $ | 1,754,245 | |
| * | | Amount represents net unrealized losses. |
| | | | | | |
| Notes to financial statements | | Wells Fargo International Bond Fund | | | 29 | |
7. BANK BORROWINGS
The Trust (excluding the money market funds and certain other funds) and Wells Fargo Variable Trust are parties to a $250,000,000 revolving credit agreement whereby the Fund is permitted to use bank borrowings for temporary or emergency purposes, such as to fund shareholder redemption requests. Interest under the credit agreement is charged to the Fund based on a borrowing rate equal to the higher of the Federal Funds rate in effect on that day plus 1.25% or the overnight LIBOR rate in effect on that day plus 1.25%. In addition, an annual commitment fee equal to 0.25% of the unused balance is allocated to each participating fund. Prior to August 30, 2016, the revolving credit agreement amount was $200,000,000 and an annual commitment fee equal to 0.20% of the unused balance was allocated to each participating fund. Prior to September 1, 2015, the revolving credit agreement amount was $150,000,000 and an annual commitment fee equal to 0.10% of the unused balance was allocated to each participating fund.
For the eleven months ended September 30, 2016 and the year ended October 31, 2015, there were no borrowings by the Fund under the agreement.
8. DISTRIBUTIONS TO SHAREHOLDERS
The tax character of distributions paid were as follows:
| | | | | | | | | | | | |
| | | Eleven months ended
September 30, 2016 | | | Year ended October 31, 2015 | | | Year ended October 31, 2014 | |
Ordinary income | | $ | 0 | | | $ | 10,043,689 | | | $ | 21,238,755 | |
Long-term capital gain | | | 5,967,498 | | | | 36 | | | | 49,267,667 | |
As of September 30, 2016, the components of distributable earnings on a tax basis were as follows:
| | |
Undistributed
long-term
gain | | Unrealized
gains |
| $9,016,229 | | $392,734 |
9. INDEMNIFICATION
Under the Trust’s organizational documents, the officers and Trustees have been granted certain indemnification rights against certain liabilities that may arise out of performance of their duties to the Trust. Additionally, in the normal course of business, the Trust may enter into contracts with service providers that contain a variety of indemnification clauses. The Trust’s maximum exposure under these arrangements is dependent on future claims that may be made against the Fund and, therefore, cannot be estimated.
| | | | |
| 30 | | Wells Fargo International Bond Fund | | Report of independent registered public accounting firm |
BOARD OF TRUSTEES AND SHAREHOLDERS OF WELLS FARGO FUNDS TRUST:
We have audited the accompanying statement of assets and liabilities, including the portfolio of investments, of the Wells Fargo International Bond Fund (the “Fund”), one of the funds constituting the Wells Fargo Funds Trust, as of September 30, 2016, and the related statements of operations for the period then ended and year ended October 31, 2015, the statements of changes in net assets for the period ended September 30, 2016 and for each of the years in the two-year period ended October 31, 2015, and the financial highlights for the period ended September 30, 2016 and for each of the years or periods in the five-year period ended October 31, 2015. These financial statements and financial highlights are the responsibility of the Fund’s management. Our responsibility is to express an opinion on these financial statements and financial highlights based on our audits.
We conducted our audits in accordance with the standards of the Public Company Accounting Oversight Board (United States). Those standards require that we plan and perform the audit to obtain reasonable assurance about whether the financial statements and financial highlights are free of material misstatement. An audit includes examining, on a test basis, evidence supporting the amounts and disclosures in the financial statements. Our procedures included confirmation of securities owned as of September 30, 2016, by correspondence with the custodian and brokers, or by other appropriate auditing procedures. An audit also includes assessing the accounting principles used and significant estimates made by management, as well as evaluating the overall financial statement presentation. We believe that our audits provide a reasonable basis for our opinion.
In our opinion, the financial statements and financial highlights referred to above present fairly, in all material respects, the financial position of the Wells Fargo International Bond Fund as of September 30, 2016, the results of its operations for the period then ended and year ended October 31, 2015, the changes in its net assets for the period ended September 30, 2016 and each of the years in the two-year period ended October 31, 2015, and the financial highlights for the period ended September 30, 2016 and each of the years or periods in the five-year period ended October 31, 2015, in conformity with U.S. generally accepted accounting principles.

Boston, Massachusetts
November 23, 2016
| | | | | | |
| Other information (unaudited) | | Wells Fargo International Bond Fund | | | 31 | |
TAX INFORMATION
Pursuant to Section 852 of the Internal Revenue Code, $5,967,498 was designated as long-term capital gain distributions for the fiscal year ended September 30, 2016.
PROXY VOTING INFORMATION
A description of the policies and procedures that the Fund uses to determine how to vote proxies relating to portfolio securities is available, upon request, by calling 1-800-222-8222, visiting our website at wellsfargofunds.com, or visiting the SEC website at sec.gov. Information regarding how the Fund voted proxies relating to portfolio securities during the most recent 12-month period ended June 30 is available on the Fund’s website at wellsfargofunds.com or by visiting the SEC website at sec.gov.
PORTFOLIO HOLDINGS INFORMATION
The complete portfolio holdings for the Fund are publicly available monthly on the Fund’s website (wellsfargofunds.com), on a one-month delayed basis. In addition, top ten holdings information (excluding derivative positions) for the Fund is publicly available on the Fund’s website on a monthly, seven-day or more delayed basis. The Fund files its complete schedule of portfolio holdings with the SEC for the first and third quarters of each fiscal year on Form N-Q, which is available by visiting the SEC website at sec.gov. In addition, the Fund’s Form N-Q may be reviewed and copied at the SEC’s Public Reference Room in Washington, DC, and at regional offices in New York City, at 233 Broadway, and in Chicago, at 175 West Jackson Boulevard, Suite 900. Information about the Public Reference Room may be obtained by calling 1-800-SEC-0330.
| | | | |
| 32 | | Wells Fargo International Bond Fund | | Other information (unaudited) |
BOARD OF TRUSTEES AND OFFICERS
Each of the Trustees and Officers1 listed in the table below acts in identical capacities for each fund in the Wells Fargo family of funds, which consists of 138 mutual funds comprising the Wells Fargo Funds Trust, Wells Fargo Variable Trust, Wells Fargo Master Trust and four closed-end funds (collectively the “Fund Complex”). This table should be read in conjunction with the Prospectus and the Statement of Additional Information2. The mailing address of each Trustee and Officer is 525 Market Street, 12th Floor, San Francisco, CA 94105. Each Trustee and Officer serves an indefinite term, however, each Trustee serves such term until reaching the mandatory retirement age established by the Trustees.
Independent Trustees
| | | | | | |
Name and year of birth | | Position held and
length of service* | | Principal occupations during past five years or longer | | Current other public company or investment company directorships |
William R. Ebsworth (Born 1957) | | Trustee, since 2015 | | Retired. From 1984 to 2013, equities analyst, portfolio manager, research director and chief financial officer at Fidelity Management and Research Company in Boston, Tokyo, and Hong Kong and retired in 2013 as Chief Investment Officer of Fidelity Strategic Advisers, Inc. where he lead a team of investment professionals managing client assets. Prior thereto, Board member of Hong Kong Securities Clearing Co., Hong Kong Options Clearing Corp., the Thailand International Fund, Ltd., Fidelity Investments Life Insurance Company, and Empire Fidelity Investments Life Insurance Company. Mr. Ebsworth is a CFA® charterholder and an Adjunct Lecturer, Finance, at Babson College. | | Asset Allocation Trust |
Jane A. Freeman (Born 1953) | | Trustee, since 2015 | | Retired. From 2012 to 2014 and 1999 to 2008, Chief Financial Officer of Scientific Learning Corporation. From 2008 to 2012, Ms. Freeman provided consulting services related to strategic business projects. Prior to 1999, Portfolio Manager at Rockefeller & Co. and Scudder, Stevens & Clark. Board member of the Harding Loevner Funds from 1996 to 2014, serving as both Lead Independent Director and chair of the Audit Committee. Board member of the Russell Exchange Traded Funds Trust from 2011 to 2012 and the chair of the Audit Committee. Ms. Freeman is a Board Member of Ruth Bancroft Garden (non-profit organization) and an inactive chartered financial analyst. | | Asset Allocation Trust |
Peter G. Gordon (Born 1942) | | Trustee, since 1998; Chairman, since 2005 | | Co-Founder, Retired Chairman, President and CEO of Crystal Geyser Water Company. Trustee Emeritus, Colby College. | | Asset Allocation Trust |
Isaiah Harris, Jr. (Born 1952) | | Trustee, since 2009 | | Retired. Chairman of the Board of CIGNA Corporation since 2009, and Director since 2005. From 2003 to 2011, Director of Deluxe Corporation. Prior thereto, President and CEO of BellSouth Advertising and Publishing Corp. from 2005 to 2007, President and CEO of BellSouth Enterprises from 2004 to 2005 and President of BellSouth Consumer Services from 2000 to 2003. Emeritus member of the Iowa State University Foundation Board of Governors. Emeritus Member of the Advisory Board of Iowa State University School of Business. Advisory Board Member, Palm Harbor Academy (charter school). Advisory Board Member, Child Evangelism Fellowship (non-profit). Mr. Harris is a certified public accountant (inactive status). | | CIGNA Corporation; Asset Allocation Trust |
Judith M. Johnson (Born 1949) | | Trustee, since 2008; Audit Committee Chairman, since 2008 | | Retired. Prior thereto, Chief Executive Officer and Chief Investment Officer of Minneapolis Employees Retirement Fund from 1996 to 2008. Ms. Johnson is an attorney, certified public accountant and a certified managerial accountant. | | Asset Allocation Trust |
David F. Larcker (Born 1950) | | Trustee, since 2009 | | James Irvin Miller Professor of Accounting at the Graduate School of Business, Stanford University, Director of the Corporate Governance Research Initiative and Senior Faculty of The Rock Center for Corporate Governance since 2006. From 2005 to 2008, Professor of Accounting at the Graduate School of Business, Stanford University. Prior thereto, Ernst & Young Professor of Accounting at The Wharton School, University of Pennsylvania from 1985 to 2005. | | Asset Allocation Trust |
| | | | | | |
| Other information (unaudited) | | Wells Fargo International Bond Fund | | | 33 | |
| | | | | | |
Name and year of birth | | Position held and
length of service* | | Principal occupations during past five years or longer | | Current other public company or investment company directorships |
Olivia S. Mitchell (Born 1953) | | Trustee, since 2006 | | International Foundation of Employee Benefit Plans Professor, Wharton School of the University of Pennsylvania since 1993. Director of Wharton’s Pension Research Council and Boettner Center on Pensions & Retirement Research, and Research Associate at the National Bureau of Economic Research. Previously, Cornell University Professor from 1978 to 1993. | | Asset Allocation Trust |
Timothy J. Penny (Born 1951) | | Trustee, since 1996 | | President and Chief Executive Officer of Southern Minnesota Initiative Foundation, a non-profit organization, since 2007 and Senior Fellow at the Humphrey Institute Policy Forum at the University of Minnesota since 1995. Member of the Board of Trustees of NorthStar Education Finance, Inc., a non-profit organization, since 2007. | | Asset Allocation Trust |
Michael S. Scofield (Born 1943) | | Trustee, since 2010 | | Served on the Investment Company Institute’s Board of Governors and Executive Committee from 2008-2011 as well the Governing Council of the Independent Directors Council from 2006-2011 and the Independent Directors Council Executive Committee from 2008-2011. Chairman of the IDC from 2008-2010. Institutional Investor (Fund Directions) Trustee of Year in 2007. Trustee of the Evergreen Funds complex (and its predecessors) from 1984 to 2010. Chairman of the Evergreen Funds from 2000-2010. Former Trustee of the Mentor Funds. Retired Attorney, Law Offices of Michael S. Scofield. | | Asset Allocation Trust |
| * | Length of service dates reflect the Trustee’s commencement of service with the Trust’s predecessor entities, where applicable. |
Officers
| | | | | | |
Name and year of birth | | Position held and length of service | | Principal occupations during past five years or longer | | |
Karla M. Rabusch
(Born 1959) | | President, since 2003 | | Executive Vice President of Wells Fargo Bank, N.A. and President of Wells Fargo Funds Management, LLC since 2003. | | |
Nancy Wiser1
(Born 1967) | | Treasurer, since 2012 | | Executive Vice President of Wells Fargo Funds Management, LLC since 2011. Chief Operating Officer and Chief Compliance Officer at LightBox Capital Management LLC, from 2008 to 2011. | | |
C. David Messman (Born 1960) | | Secretary, since 2000; Chief Legal Officer, since 2003 | | Senior Vice President and Secretary of Wells Fargo Funds Management, LLC since 2001. Assistant General Counsel of Wells Fargo Bank, N.A. since 2013 and Vice President and Managing Counsel of Wells Fargo Bank, N.A. from 1996 to 2013. | | |
Michael Whitaker (Born 1967) | | Chief Compliance Officer, since 20163 | | Executive Vice President of Wells Fargo Funds Management, LLC since 2016. Chief Compliance Officer of Fidelity’s Fixed Income Funds and Asset Allocation Funds from 2008 to 2016, Compliance Officer of FMR Co., Inc. from 2014 to 2016, Fidelity Investments Money Management, Inc. from 2014 to 2016, Fidelity Investments from 2007 to 2016. | | |
David Berardi (Born 1975) | | Assistant Treasurer, since 2009 | | Vice President of Wells Fargo Funds Management, LLC since 2009. Vice President of Evergreen Investment Management Company, LLC from 2008 to 2010. Manager of Fund Reporting and Control for Evergreen Investment Management Company, LLC from 2004 to 2010. | | |
Jeremy DePalma1 (Born 1974) | | Assistant Treasurer, since 2009 | | Senior Vice President of Wells Fargo Funds Management, LLC since 2009. Senior Vice President of Evergreen Investment Management Company, LLC from 2008 to 2010 and head of the Fund Reporting and Control Team within Fund Administration from 2005 to 2010. | | |
| 1 | Nancy Wiser acts as Treasurer of 70 funds in the Fund Complex. Jeremy DePalma acts as Treasurer of 68 funds and Assistant Treasurer of 70 funds in the Fund Complex. |
| 2 | The Statement of Additional Information includes additional information about the Trustees and is available, without charge, upon request, by calling 1-800-222-8222 or by visiting the website at wellsfargofunds.com. |
| 3 | Michael Whitaker became Chief Compliance Officer effective May 16, 2016. |
| | | | |
| 34 | | Wells Fargo International Bond Fund | | Other information (unaudited) |
BOARD CONSIDERATION OF INVESTMENT MANAGEMENT AND SUB-ADVISORY AGREEMENTS:
Under the Investment Company Act of 1940 (the “1940 Act”), the Board of Trustees (the “Board”) of Wells Fargo Funds Trust (the “Trust”) must determine annually whether to approve the continuation of the Trust’s investment management and sub-advisory agreements. In this regard, at an in-person meeting held on May 24-25, 2016 (the “Meeting”), the Board, all the members of which have no direct or indirect interest in the investment management and sub-advisory agreements and are not “interested persons” of the Trust, as defined in the 1940 Act (the “Independent Trustees”), reviewed and approved for Wells Fargo International Bond Fund (the “Fund”): (i) an investment management agreement (the “Management Agreement”) with Wells Fargo Funds Management, LLC (“Funds Management”); and (ii) an investment sub-advisory agreement (the “Sub-Advisory Agreement”) with First International Advisors, LLC (the “Sub-Adviser”), an affiliate of Funds Management. The Management Agreement and the Sub-Advisory Agreement are collectively referred to as the “Advisory Agreements.”
At the Meeting, the Board considered the factors and reached the conclusions described below relating to the selection of Funds Management and the Sub-Adviser and the approval of the Advisory Agreements. Prior to the Meeting, including at an in-person meeting in April 2016, the Trustees conferred extensively among themselves and with representatives of Funds Management about these matters. Also, the Board has adopted a team-based approach, with each team consisting of a sub-set of Trustees, to assist the full Board in the discharge of its duties in reviewing performance and other matters throughout the year. The Independent Trustees were assisted in their evaluation of the Advisory Agreements by independent legal counsel, from whom they received separate legal advice and with whom they met separately.
In providing information to the Board, Funds Management and the Sub-Adviser were guided by a detailed set of requests for information submitted to them by independent legal counsel on behalf of the Independent Trustees at the start of the Board’s annual contract renewal process earlier in 2016. In considering and approving the Advisory Agreements, the Trustees considered the information they believed relevant, including but not limited to the information discussed below. The Board considered not only the specific information presented in connection with the Meeting, but also the knowledge gained over time through interaction with Funds Management and the Sub-Adviser about various topics. In this regard, the Board reviewed reports of Funds Management at each of its quarterly meetings, which included, among other things, portfolio reviews and performance reports. In addition, the Board and the teams mentioned above confer with portfolio managers at various times throughout the year. The Board did not identify any particular information or consideration that was all-important or controlling, and each individual Trustee may have attributed different weights to various factors.
After its deliberations, the Board unanimously approved the continuation of the Advisory Agreements for a one-year term and determined that the compensation payable to Funds Management and the Sub-Adviser under each of the Advisory Agreements was reasonable. The Board considered the approval of the Advisory Agreements for the Fund as part of its consideration of agreements for funds across the complex, but its approvals were made on a fund-by-fund basis. The following summarizes a number of important, but not necessarily all, factors considered by the Board in support of its approvals.
Nature, extent and quality of services
The Board received and considered various information regarding the nature, extent and quality of services provided to the Fund by Funds Management and the Sub-Adviser under the Advisory Agreements. This information included a description of the investment advisory services and Fund-level administrative services covered by the Management Agreement, as well as, among other things, a summary of the background and experience of senior management of Funds Management, and the qualifications, background, tenure and responsibilities of each of the portfolio managers primarily responsible for the day-to-day portfolio management of the Fund.
The Board evaluated the ability of Funds Management and the Sub-Adviser to attract and retain qualified investment professionals, including research, advisory and supervisory personnel. The Board further considered the compliance programs and compliance records of Funds Management and the Sub-Adviser. In addition, the Board took into account the full range of services provided to the Fund by Funds Management and its affiliates.
Fund performance and expenses
The Board considered the performance results for the Fund over various time periods ended December 31, 2015. The Board considered these results in comparison to the performance of funds in a universe that was determined by Broadridge Inc. (“Broadridge”) to be similar to the Fund (the “Universe”), and in comparison to the Fund’s benchmark index and to other comparative data. Broadridge is an independent provider of investment company data. The Board received a description of the methodology used by Broadridge to select the mutual funds in the performance Universe.
| | | | | | |
| Other information (unaudited) | | Wells Fargo International Bond Fund | | | 35 | |
The Board noted that the performance of the Fund (Class A) was lower than the average performance of the Universe for all periods under review. The Board also noted that the performance of the Fund was lower than its benchmark, the Barclays Global Aggregate ex-USD Index (unhedged), for all periods under review except the ten-year period.
The Board received information concerning, and discussed factors contributing to, the underperformance of the Fund relative to the Universe and benchmark for the periods noted above. The Board took note of the explanations for the relative underperformance in these periods, including with respect to market factors and investment decisions that affected the Fund’s performance.
The Board also received and considered information regarding the Fund’s net operating expense ratios and their various components, including actual management fees, custodian and other non-management fees, and Rule 12b-1 and non-Rule 12b-1 shareholder service fees. The Board considered these ratios in comparison to the median ratios of funds in class-specific expense groups that were determined by Broadridge to be similar to the Fund (the “Groups”). The Board received a description of the methodology used by Broadridge to select the mutual funds in the expense Groups and an explanation of how funds comprising expense groups and their expense ratios may vary from year-to-year. Based on the Broadridge reports, the Board noted that the net operating expense ratios of the Fund were lower than the median net operating expense ratios of the expense Groups.
The Board took into account the Fund performance and expense information provided to it among the factors considered in deciding to re-approve the Advisory Agreements.
Investment management and sub-advisory fee rates
The Board reviewed and considered the contractual fee rates payable by the Fund to Funds Management under the Management Agreement, as well as the contractual fee rates payable by the Fund to Funds Management for class-level administrative services under a Class-Level Administration Agreement, which include class-level transfer agency and sub-transfer agency costs (collectively, the “Management Rates”). The Board also reviewed and considered the contractual investment sub-advisory fee rates that are payable by Funds Management to the Sub-Adviser for investment sub-advisory services.
Among other information reviewed by the Board was a comparison of the Fund’s Management Rates with the average contractual investment management fee rates of funds in the expense Groups at a common asset level as well as transfer agency costs of the funds in the expense Groups. The Board noted that the Management Rates of the Fund were lower than the sum of these average rates for the Fund’s expense Groups for all share classes.
The Board also received and considered information about the portion of the total advisory fee that was retained by Funds Management after payment of the fee to the Sub-Adviser for sub-advisory services. In assessing the reasonableness of this amount, the Board received and evaluated information about the nature and extent of responsibilities retained and risks assumed by Funds Management and not delegated to or assumed by the Sub-Adviser, and about Funds Management’s on-going oversight services. However, given the affiliation between Funds Management and the Sub-Adviser, the Board ascribed limited relevance to the allocation of fees between them.
The Board also received and considered information about the nature and extent of services offered and fee rates charged by Funds Management and the Sub-Adviser to other types of clients with investment strategies similar to those of the Fund. In this regard, the Board received information about the significantly greater scope of services, and compliance, reporting and other legal burdens and risks of managing mutual funds compared with those associated with managing assets of non-mutual fund clients such as collective funds or institutional separate accounts.
Based on its consideration of the factors and information it deemed relevant, including those described here, the Board determined that the compensation payable to Funds Management under the Management Agreement and to the Sub-Adviser under the Sub-Advisory Agreement was reasonable, in light of the services covered by the Advisory Agreements.
Profitability
The Board received and considered information concerning the profitability of Funds Management, as well as the profitability of Wells Fargo as a whole, from providing services to the Fund and the fund family as a whole. The Board also received and considered information concerning the profitability of the Sub-Adviser from providing services to the fund family as a whole, noting that the Sub-Adviser’s profitability information with respect to providing services to the Fund was subsumed in the Wells Fargo and Funds Management profitability analysis.
Funds Management reported on the methodologies and estimates used in calculating profitability. Among other things, the Board noted that the levels of profitability reported on a fund-by-fund basis varied widely, depending on factors such
| | | | |
| 36 | | Wells Fargo International Bond Fund | | Other information (unaudited) |
as the size and type of fund. Based on its review, the Board did not deem the profits reported by Funds Management or Wells Fargo from its services to the Fund to be at a level that would prevent it from approving the continuation of the Advisory Agreements.
Economies of scale
With respect to possible economies of scale, the Board noted the existence of breakpoints in the Fund’s management fee structure, which operate generally to reduce the Fund’s expense ratios as the Fund grows in size. It considered that, for a small fund or a fund that shrinks in size, breakpoints conversely can result in higher fee levels. The Board also considered that fee waiver and expense reimbursement arrangements and competitive fee rates at the outset are means of sharing potential economies of scale with shareholders of the Fund and the fund family as a whole. The Board considered Funds Management’s view that any analyses of potential economies of scale in managing a particular fund are inherently limited in light of the joint and common costs and investments that Funds Management incurs across the fund family as a whole.
The Board concluded that the Fund’s fee and expense arrangements, including contractual breakpoints, constituted a reasonable approach to sharing potential economies of scale with the Fund and its shareholders.
Other benefits to Funds Management and the Sub-Adviser
The Board received and considered information regarding potential “fall-out” or ancillary benefits received by Funds Management and its affiliates, including the Sub-Adviser, as a result of their relationships with the Fund. Ancillary benefits could include, among others, benefits directly attributable to other relationships with the Fund and benefits potentially derived from an increase in Funds Management’s and the Sub-Adviser’s business as a result of their relationships with the Fund. The Board noted that various affiliates of Funds Management may receive distribution-related fees, shareholder servicing payments and sub-transfer agency fees in respect of shares sold or held through them and services provided.
The Board also reviewed information about soft dollar credits earned and utilized by the Sub-Adviser, fees earned by Funds Management from managing a private investment vehicle for the fund family’s securities lending collateral and commissions earned by an affiliated broker from portfolio transactions.
Based on its consideration of the factors and information it deemed relevant, including those described here, the Board did not find that any ancillary benefits received by Funds Management and its affiliates, including the Sub-Adviser, were unreasonable.
Conclusion
At the Meeting, after considering the above-described factors and based on its deliberations and its evaluation of the information described above, the Board unanimously approved the continuation of the Advisory Agreements for a one-year term and determined that the compensation payable to Funds Management and the Sub-Adviser under each of the Advisory Agreements was reasonable.
| | | | | | |
| List of abbreviations | | Wells Fargo International Bond Fund | | | 37 | |
The following is a list of common abbreviations for terms and entities that may have appeared in this report.
| ACA | — ACA Financial Guaranty Corporation |
| ADR | — American depositary receipt |
| ADS | — American depositary shares |
| AGC | — Assured Guaranty Corporation |
| AGM | — Assured Guaranty Municipal |
| Ambac | — Ambac Financial Group Incorporated |
| AMT | — Alternative minimum tax |
| BAN | — Bond anticipation notes |
| BHAC | — Berkshire Hathaway Assurance Corporation |
| CAB | — Capital appreciation bond |
| CCAB | — Convertible capital appreciation bond |
| CDA | — Community Development Authority |
| CDO | — Collateralized debt obligation |
| DRIVER | — Derivative inverse tax-exempt receipts |
| DW&P | — Department of Water & Power |
| DWR | — Department of Water Resources |
| ECFA | — Educational & Cultural Facilities Authority |
| EDA | — Economic Development Authority |
| EDFA | — Economic Development Finance Authority |
| ETF | — Exchange-traded fund |
| FDIC | — Federal Deposit Insurance Corporation |
| FFCB | — Federal Farm Credit Banks |
| FGIC | — Financial Guaranty Insurance Corporation |
| FHA | — Federal Housing Administration |
| FHLB | — Federal Home Loan Bank |
| FHLMC | — Federal Home Loan Mortgage Corporation |
| FICO | — The Financing Corporation |
| FNMA | — Federal National Mortgage Association |
| GDR | — Global depositary receipt |
| GNMA | — Government National Mortgage Association |
| HCFR | — Healthcare facilities revenue |
| HEFA | — Health & Educational Facilities Authority |
| HEFAR | — Higher education facilities authority revenue |
| HFA | — Housing Finance Authority |
| HFFA | — Health Facilities Financing Authority |
| HUD | — Department of Housing and Urban Development |
| IDA | — Industrial Development Authority |
| IDAG | — Industrial Development Agency |
| KRW | — Republic of Korea won |
| LIBOR | — London Interbank Offered Rate |
| LIFER | — Long Inverse Floating Exempt Receipts |
| LLC | — Limited liability company |
| LLLP | — Limited liability limited partnership |
| LLP | — Limited liability partnership |
| MBIA | — Municipal Bond Insurance Association |
| MFHR | — Multifamily housing revenue |
| MSTR | — Municipal securities trust receipts |
| MUD | — Municipal Utility District |
| National | — National Public Finance Guarantee Corporation |
| PCFA | — Pollution Control Financing Authority |
| PCL | — Public Company Limited |
| PCR | — Pollution control revenue |
| PFA | — Public Finance Authority |
| PFFA | — Public Facilities Financing Authority |
| PFOTER | — Puttable floating option tax-exempt receipts |
| plc | — Public limited company |
| PUTTER | — Puttable tax-exempt receipts |
| R&D | — Research & development |
| Radian | — Radian Asset Assurance |
| RAN | — Revenue anticipation notes |
| RDA | — Redevelopment Authority |
| RDFA | — Redevelopment Finance Authority |
| REIT | — Real estate investment trust |
| ROC | — Reset option certificates |
| SAVRS | — Select auction variable rate securities |
| SBA | — Small Business Authority |
| SDR | — Swedish depositary receipt |
| SFHR | — Single-family housing revenue |
| SFMR | — Single-family mortgage revenue |
| SPA | — Standby purchase agreement |
| SPDR | — Standard & Poor’s Depositary Receipts |
| SPEAR | — Short Puttable Exempt Adjustable Receipts |
| STRIPS | — Separate trading of registered interest and |
| TAN | — Tax anticipation notes |
| TIPS | — Treasury inflation-protected securities |
| TRAN | — Tax revenue anticipation notes |
| TTFA | — Transportation Trust Fund Authority |
| TVA | — Tennessee Valley Authority |
This page is intentionally left blank.
This page is intentionally left blank.
This page is intentionally left blank.

For more information
More information about Wells Fargo Funds is available free upon request. To obtain literature, please write, email, visit the Fund’s website, or call:
Wells Fargo Funds
P.O. Box 8266
Boston, MA 02266-8266
Email: fundservice@wellsfargo.com
Website: wellsfargofunds.com
Individual investors: 1-800-222-8222
Retail investment professionals: 1-888-877-9275
Institutional investment professionals: 1-866-765-0778
This report and the financial statements contained herein are submitted for the general information of the shareholders of the Fund. If this report is used for promotional purposes, distribution of the report must be accompanied or preceded by a current prospectus. Before investing, please consider the investment objectives, risks, charges, and expenses of the investment. For a current prospectus and, if available, a summary prospectus, containing this information, call 1-800-222-8222 or visit the Fund’s website at wellsfargofunds.com. Read the prospectus carefully before you invest or send money.
Wells Fargo Asset Management (WFAM) is a trade name used by the asset management businesses of Wells Fargo & Company. Wells Fargo Funds Management, LLC, a wholly owned subsidiary of Wells Fargo & Company, provides investment advisory and administrative services for Wells Fargo Funds. Other affiliates of Wells Fargo & Company provide subadvisory and other services for the funds. The funds are distributed by Wells Fargo Funds Distributor, LLC, Member FINRA, an affiliate of Wells Fargo & Company. Neither Wells Fargo Funds Management nor Wells Fargo Funds Distributor has Fund customer accounts/assets, and neither provides investment advice/recommendations or acts as an investment advice fiduciary to any investor.
NOT FDIC INSURED ¡ NO BANK GUARANTEE ¡ MAY LOSE VALUE
© 2016 Wells Fargo Funds Management, LLC. All rights reserved.
| | |
 | | 246390 11-16 A235/AR235 09-16 |
Annual Report
September 30, 2016

Wells Fargo Strategic Income Fund


Reduce clutter. Save trees.
Sign up for electronic delivery of prospectuses and shareholder reports at wellsfargo.com/advantagedelivery
Contents
The views expressed and any forward-looking statements are as of September 30, 2016, unless otherwise noted, and are those of the Fund managers and/or Wells Fargo Funds Management, LLC. Discussions of individual securities, or the markets generally, or any Wells Fargo Fund are not intended as individual recommendations. Future events or results may vary significantly from those expressed in any forward-looking statements. The views expressed are subject to change at any time in response to changing circumstances in the market. Wells Fargo Funds Management, LLC and the Fund disclaim any obligation to publicly update or revise any views expressed or forward-looking statements.
NOT FDIC INSURED ¡ NO BANK GUARANTEE ¡ MAY LOSE VALUE
| | | | |
| 2 | | Wells Fargo Strategic Income Fund | | Letter to shareholders (unaudited) |

Karla M. Rabusch
President
Wells Fargo Funds
The U.S. Federal Reserve (Fed) continued an easy monetary policy although it raised the federal funds target rate in December 2015 because it believed the U.S. economy was strong enough to begin normalizing monetary policy.
Dear Shareholder:
We are pleased to offer you this annual report for the Wells Fargo Strategic Income Fund for the 11-month period that ended September 30, 2016. We are reporting on an 11-month basis at this time because the fiscal year end of the Fund changed from October 31 to September 30, effective September 30, 2016. During this period, which began November 1, 2015, fixed-income markets benefited from a combination of accommodative monetary policy, continued (if low) U.S. economic growth, and a moderate high-yield default rate outside of commodity-related sectors.
Major central banks continued to provide stimulus, helping support global economies and keep interest rates low.
The U.S. Federal Reserve (Fed) continued an easy monetary policy although it raised the federal funds target rate in December 2015 because it believed the U.S. economy was strong enough to begin normalizing monetary policy. During the subsequent nine months of 2016, the Fed kept the federal funds rate steady. Outside the U.S., the eurozone fell into deflation in February; in response, the European Central Bank (ECB) announced an expansion of its stimulus program. The ECB cut all three of its short-term rates during the reporting period, increased its asset-purchase program from 60 billion euros per month to 80 billion, expanded the list of eligible securities to include investment-grade nonbank debt, and created a fund-to-lend program where banks could be paid to lend money. Likewise, after the United Kingdom voted to leave the European Union in June 2016, the Bank of England announced that it would buy corporate bonds with the goal of lowering borrowing costs and encouraging businesses to invest. In Japan, the Bank of Japan maintained an aggressive monetary program aimed at combating deflation.
The U.S. economy proved resilient; non-U.S. economies generally were weaker.
The divergence between U.S. and non-U.S. economic growth continued, with persistent weakness in European and Japanese inflation, risks of a hard landing in China, and the recalibration of energy and commodity prices weighing on the markets. In the U.S., economic growth advanced and inflation trended higher but remained tame. Meanwhile, oil prices fell dramatically (reaching a secular low of $26 per barrel in February) before increasing to $48 per barrel by the end of the reporting period. In addition, the U.K. vote on June 23, 2016, to exit the European Union exacerbated uncertainty about its economic growth, financial markets, and political responses to a number of policy issues.
As a result of the favorable macroeconomic backdrop, fixed-income markets rallied across the board.
Even though the Fed raised its key rate during the period, it was a modest increase, and further rate hikes were not immediately forthcoming. As a result, market yields declined and bond prices rose. Within the reporting period, episodes of greater volatility aided perceived safe-haven investments, such as U.S. Treasuries. As volatility waned, riskier assets tended to outperform. After several years of appreciating, U.S. dollar currency movements traded within a relatively stable range.
Low global yields incented investors to take on additional risk by purchasing high-yield bonds. It helped that the solid U.S. economy kept the high-yield default rate low for non-commodity-related companies. Although Moody’s Investors Service, Inc., projected in July 2016 that the U.S. high-yield default rate could reach 6.4% by the end of 2016, much of that number came from metals and mining firms (10.2% projected default rate) and oil and gas companies (8.6% projected default rate).
| | | | | | |
| Letter to shareholders (unaudited) | | Wells Fargo Strategic Income Fund | | | 3 | |
Since the end of the financial crisis, structural changes in the fixed-income markets have reduced trading liquidity (the degree to which assets can be bought or sold without affecting the price). New regulations and capital requirements have caused traditional liquidity suppliers (banks and broker/dealers) to be more risk-averse and hold less inventory. Meanwhile, corporate debt issuance has spiked as companies finance themselves at record-low yields, bond mutual funds hold larger amounts of this new debt supply, trading volumes are lower, and large-size trades are more difficult to execute. However, fixed-income markets appeared to function well over the past year with sufficient liquidity.
Don’t let short-term uncertainty derail long-term investment goals.
Periods of uncertainty can present challenges, but experience has taught us that maintaining long-term investment goals can be an effective way to plan for the future. To help you create a sound strategy based on your personal goals and risk tolerance, Wells Fargo Funds offers more than 100 mutual funds spanning a wide range of asset classes and investment styles. Although diversification cannot guarantee an investment profit or prevent losses, we believe it can be an effective way to manage investment risk and potentially smooth out overall portfolio performance. We encourage investors to know their investments and to understand that appropriate levels of risk-taking may unlock opportunities.
Thank you for choosing to invest in Wells Fargo Funds. We appreciate your confidence in us and remain committed to helping you meet your financial needs.
Sincerely,

Karla M. Rabusch
President
Wells Fargo Funds
Periods of uncertainty can present challenges, but experience has taught us that maintaining long-term investment goals can be an effective way to plan for the future.
For further information about your Fund, contact your investment professional, visit our website at wellsfargofunds.com, or call us directly at 1-800-222-8222. We are available 24 hours a day, 7 days a week.
| | | | |
| 4 | | Wells Fargo Strategic Income Fund | | Performance highlights (unaudited) |
Investment objective
The Fund seeks total return, consisting of a high level of current income and capital appreciation.
Manager
Wells Fargo Funds Management, LLC
Subadvisers
First International Advisors, LLC
Wells Capital Management Incorporated
Portfolio managers
Ashok Bhatia, CFA®
David Germany, Ph.D.
Niklas Nordenfelt, CFA®
Tony Norris
Margaret D. Patel
Alex Perrin
Thomas M. Price, CFA®
Scott M. Smith, CFA®
Noah Wise, CFA®
Average annual total returns (%) as of September 30, 2016
| | | | | | | | | | | | | | | | | | | | | | | | | | |
| | | | | Including sales charge | | | Excluding sales charge | | | Expense ratios1 (%) | |
| | | Inception date | | 1 year | | | Since inception | | | 1 year | | | Since inception | | | Gross | | | Net2 | |
| Class A (WSIAX) | | 1-31-2013 | | | 0.05 | | | | (0.58 | ) | | | 4.25 | | | | 0.54 | | | | 1.54 | | | | 0.91 | |
| Class C (WSICX) | | 1-31-2013 | | | 2.47 | | | | (0.21 | ) | | | 3.47 | | | | (0.21 | ) | | | 2.29 | | | | 1.66 | |
| Administrator Class (WSIDX) | | 1-31-2013 | | | – | | | | – | | | | 4.43 | | | | 0.71 | | | | 1.48 | | | | 0.76 | |
| Institutional Class (WSINX) | | 1-31-2013 | | | – | | | | – | | | | 4.46 | | | | 0.83 | | | | 1.21 | | | | 0.61 | |
| Bloomberg Barclays U.S. Universal Bond Index3 | | – | | | – | | | | – | | | | 6.11 | | | | 3.18 | | | | – | | | | – | |
| BofA Merrill Lynch 3 Month U.S. Dollar LIBOR Constant Maturity Index4 | | – | | | – | | | | – | | | | 0.49 | | | | 0.32 | | | | – | | | | – | |
Figures quoted represent past performance, which is no guarantee of future results, and do not reflect taxes that a shareholder may pay on fund distributions or the redemption of fund shares. Investment return and principal value of an investment will fluctuate so that an investor’s shares, when redeemed, may be worth more or less than their original cost. Performance shown without sales charges would be lower if sales charges were reflected. Current performance may be lower or higher than the performance data quoted, which assumes the reinvestment of dividends and capital gains. Current month-end performance is available on the Fund’s website, wellsfargofunds.com.
Index returns do not include transaction costs associated with buying and selling securities, any mutual fund fees or expenses, or any taxes. It is not possible to invest directly in an index.
For Class A shares, the maximum front-end sales charge is 4.00%. For Class C shares, the maximum contingent deferred sales charge is 1.00%. Performance including a contingent deferred sales charge assumes the sales charge for the corresponding time period. Administrator Class and Institutional Class shares are sold without a front-end sales charge or contingent deferred sales charge.
Please see footnotes on page 5.
| | | | | | |
| Performance highlights (unaudited) | | Wells Fargo Strategic Income Fund | | | 5 | |
|
| Growth of $10,000 investment as of September 30, 20165 |
|
 |
Bond values fluctuate in response to the financial condition of individual issuers, general market and economic conditions, and changes in interest rates. Changes in market conditions and government policies may lead to periods of heightened volatility in the bond market and reduced liquidity for certain bonds held by the Fund. In general, when interest rates rise, bond values fall and investors may lose principal value. Interest-rate changes and their impact on the fund and its share price can be sudden and unpredictable. High-yield securities have a greater risk of default and tend to be more volatile than higher-rated debt securities. Loans are subject to risks similar to those associated with other below-investment-grade bond investments, such as credit risk (for example, risk of issuer default), below-investment-grade bond risk (for example, risk of greater volatility in value), and risk that the loan may become illiquid or difficult to price. Foreign investments are especially volatile and can rise or fall dramatically due to differences in the political and economic conditions of the host country. These risks are generally intensified in emerging markets. The use of derivatives may reduce returns and/or increase volatility. Certain investment strategies tend to increase the total risk of an investment (relative to the broader market). The Fund is exposed to mortgage- and asset-backed securities risk, regulatory risk, and geographic risk. Consult the Fund’s prospectus for additional information on these and other risks.
| 1 | Reflects the expense ratios as stated in the most recent prospectuses, which include the impact of 0.01% in acquired fund fees and expenses. The expense ratios shown are subject to change and may differ from the annualized expense ratios shown in the financial highlights of this report, which do not include acquired fund fees and expenses. |
| 2 | The manager has contractually committed through February 28, 2017, to waive fees and/or reimburse expenses to the extent necessary to cap the Fund’s Total Annual Operating Expenses After Fee Waiver at 0.90% for Class A, 1.65% for Class C, 0.75% for Administrator Class, and 0.60% for Institutional Class. After this time, the cap may be increased or the commitment to maintain the cap may be terminated only with the approval of the Board of Trustees. Brokerage commissions, stamp duty fees, interest, taxes, acquired fund fees and expenses, and extraordinary expenses are excluded from the expense cap. Without this cap, the Fund’s returns would have been lower. |
| 3 | The Bloomberg Barclays U.S. Universal Bond Index (formerly known as Barclays U.S. Universal Bond Index) is an unmanaged market-value-weighted performance benchmark for the U.S. dollar–denominated bond market, which includes investment-grade, high-yield, and emerging markets debt securities with maturities of one year or more. You cannot invest directly in an index. |
| 4 | The BofA Merrill Lynch 3 Month U.S. Dollar LIBOR Constant Maturity Index is based on the assumed purchase of a synthetic instrument having 3 months to maturity and with a coupon equal to the closing quote for 3-Month LIBOR. That issue is sold the following day (priced at a yield equal to the current day closing 3-Month LIBOR rate) and is rolled into a new 3-Month instrument. The index, therefore, will always have a constant maturity equal to exactly 3 months. You cannot invest directly in an index. |
| 5 | The chart compares the performance of Class A shares since inception with the Bloomberg Barclays U.S. Universal Bond Index and the BofA Merrill Lynch 3 Month U.S. Dollar LIBOR Constant Maturity Index. The chart assumes a hypothetical investment of $10,000 in Class A shares and reflects all operating expenses and assumes the maximum initial sales charge of 4.00%. |
| 6 | The ten largest holdings, excluding cash and cash equivalents, are calculated based on the value of the investments divided by total net assets of the Fund. Holdings are subject to change and may have changed since the date specified. |
| 7 | The Core Personal Consumption Expenditures (PCE) Price Index is defined as personal consumption expenditures prices excluding food and energy prices. The core PCE price index measures the prices paid by consumers for goods and services without the volatility caused by movements in food and energy prices to reveal underlying inflation trends. Food prices consist of those included in the PCE category of “food and beverages purchased for off-premises consumption. Prices included in the PCE category “food services and accommodations” are not included in the “food” price index because these services prices tend to be far less volatile than those for food commodities such as meats, fresh vegetables and fruits. Energy prices consist of those included in the PCE categories of “gasoline and other energy goods” and of “electricity and gas” utilities. All PCE prices appear in National Income and Product Accounts Table 2.4.4. Price Indexes for Personal Consumption Expenditures by Type of Product. You cannot invest directly in an index. |
| 8 | Amounts are calculated based on the total long-term investments of the Fund. These amounts are subject to change and may have changed since the date specified. |
| | | | |
| 6 | | Wells Fargo Strategic Income Fund | | Performance highlights (unaudited) |
MANAGER’S DISCUSSION
Fund highlights
| n | | The Fund (Class A, excluding sales charges) returned 3.34% during the 11-month period that ended September 30, 2016. The Fund has a flexible fixed-income strategy that seeks to invest in the best relative-value opportunities. The Fund underperformed the Bloomberg Barclays U.S. Universal Bond Index but outperformed short-maturity benchmarks. |
| n | | Relative to the Bloomberg Barclays U.S. Universal Bond Index, the Fund’s holdings in high yield, corporate, and emerging markets debt contributed to performance. |
| n | | Meanwhile, the Fund’s shorter duration posture compared with the Bloomberg Barclays U.S. Universal Bond Index detracted from performance. |
| | | | |
| Ten largest holdings (%) as of September 30, 20166 | |
Indonesia Government, 7.88%, 4-15-2019 | | | 2.50 | |
Hertz Fleet Lease Funding LP Series 2014-1 Class C, 1.67%, 4-10-2028 | | | 2.34 | |
Colombia, 7.00%, 9-11-2019 | | | 2.06 | |
ACAS CLO Limited Trust Series 2015-1A Class B, 2.78%, 4-18-2027 | | | 1.95 | |
Mexico, 4.75%, 6-14-2018 | | | 1.91 | |
321 Henderson Receivables LLC Series 2015-2A Class A, 3.87%, 3-15-2058 | | | 1.81 | |
Citi Held For Asset Issuance Trust Series 2015-PM3 Class B, 4.31%, 5-16-2022 | | | 1.76 | |
JPMBB Commercial Mortgage Securities Trust Series 2014-C19 Class D, 4.83%, 4-15-2047 | | | 1.66 | |
Ascentium Equipment Receivables LLC Series 2016-1A Class B , 2.85%, 7-10-2020 | | | 1.59 | |
Social Professional Loan Program LLC Series 2016-A Class A2, 2.76%, 12-26-2036 | | | 1.58 | |
The economic climate remained benign.
After decelerating due to weak global growth and volatile commodity prices, the U.S. economy recovered somewhat during the second quarter of 2016, with currently available data suggesting that gross domestic product excluding inventory effects grew at an annualized rate of around 2%. Healthy consumer activity continued to offset relatively weak business investment over the period, while trade and inventories remained swing factors. The labor market tightened modestly during the period, with the unemployment rate standing at 5.0% as of September 2016, nonfarm jobs averaging slightly more than 200,000 per month, and the labor force participation rate improving to 62.9%. Meanwhile, inflation trended higher. Both the headline Consumer Price Index (CPI) as well as CPI excluding food and energy showed annual inflation increasing over the period with the former measure increasing to 1.1% and the latter increasing to 2.3% as of August 2016. The core Personal Consumption Expenditure Price Index,7 the U.S. Federal Reserve’s (Fed’s) preferred measure of inflation,
rose 1.7% over the 12-month period ending August 2016, which is a bit below the Fed’s stated 2% longer-term target for inflation.
In December 2015, the Federal Open Market Committee (FOMC) took its first step toward policy normalization by increasing the federal funds target by 25 basis points (bps; 100 bps equals 1.00%) to a new range of 0.25% to 0.50%, citing ongoing job gains and declining unemployment as justification. The monetary authorities reiterated their commitment to a gradual, data-dependent approach to normalization. Subsequent FOMC meetings indicated an even more gradual timeline, with concern expressed over sluggish business investment and global economic and financial developments.
During the period, the European Central Bank announced and began a new quantitative easing program focused on corporate bonds, while the Bank of Japan moved to a negative interest rate policy. Volatility in the markets caused by the U.K.’s surprise vote to leave the European Union was sharp but short lived.
Globally, economic growth remained slow. China experienced a period of weakness in late 2015 and early 2016, tied to its devaluation of its currency, but its growth was stable for most of 2016. Emerging markets generally saw improvements in growth and inflation rates over this period, while European growth remained stable.
Please see footnotes on page 5.
| | | | | | |
| Performance highlights (unaudited) | | Wells Fargo Strategic Income Fund | | | 7 | |
|
| Portfolio allocation as of September 30, 20168 |
|
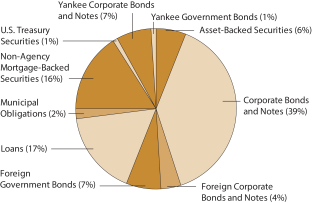 |
The Fund remained overweight corporate securities, emerging market debt, and securitized debt.
During the period, the Fund maintained its positions in U.S. high yield, U.S. corporate, and emerging markets debt. Those asset classes typically have higher yields than Treasury securities, and they therefore benefited the Fund. Toward the end of the reporting period, we reduced positions in emerging markets and increased positions in U.S. corporate debt and European high yield debt. We did this to reduce risk by rotating into more conservative holdings. We added U.S. bank loans—which tend to have less interest-rate sensitivity and normally sit higher in the capital structure—rather than U.S. fixed-rate high yield. We also added European high yield because it offers relative value (attractive yields and solid fundamentals).
The Fund’s duration, which was shorter than the duration of the Bloomberg Barclays U.S. Universal Bond Index, held back results because longer-term yields declined during the period. The Fund’s duration helped it outperform short-term bonds due to the positively sloped yield curve and the extra income that longer-term bonds earned.
We expect a gradual rise in short-term interest rates.
The relatively benign economic conditions described above are likely to result in an eventual further increase in short-term interest rates. We believe the FOMC is likely to raise its target rate by 0.25% to 0.50% over the next 12-months, a result that is largely reflected in the term structure of interest rates. Should market rates diverge from the policy path we think most likely, we are prepared to modify our duration and yield-curve posture in response to the opportunities presented. We believe credit-oriented fixed income, such as U.S. corporates and U.S. high yield, are attractive, and we expect to maintain current exposures.
Please see footnotes on page 5.
| | | | |
| 8 | | Wells Fargo Strategic Income Fund | | Fund expenses (unaudited) |
As a shareholder of the Fund, you incur two types of costs: (1) transaction costs, including sales charges (loads) on purchase payments and contingent deferred sales charges (if any) on redemptions and (2) ongoing costs, including management fees, distribution (12b-1) and/or shareholder servicing fees, and other Fund expenses. This example is intended to help you understand your ongoing costs (in dollars) of investing in the Fund and to compare these costs with the ongoing costs of investing in other mutual funds.
The example is based on an investment of $1,000 invested at the beginning of the six-month period and held for the entire period from April 1, 2016 to September 30, 2016.
Actual expenses
The “Actual” line of the table below provides information about actual account values and actual expenses. You may use the information in this line, together with the amount you invested, to estimate the expenses that you paid over the period. Simply divide your account value by $1,000 (for example, an $8,600 account value divided by $1,000 = 8.6), then multiply the result by the number in the “Actual” line under the heading entitled “Expenses paid during period” for your applicable class of shares to estimate the expenses you paid on your account during this period.
Hypothetical example for comparison purposes
The “Hypothetical” line of the table below provides information about hypothetical account values and hypothetical expenses based on the Fund’s actual expense ratio and an assumed rate of return of 5% per year before expenses, which is not the Fund’s actual return. The hypothetical account values and expenses may not be used to estimate the actual ending account balance or expenses you paid for the period. You may use this information to compare the ongoing costs of investing in the Fund and other funds. To do so, compare this 5% hypothetical example with the 5% hypothetical examples that appear in the shareholder reports of the other funds.
Please note that the expenses shown in the table are meant to highlight your ongoing costs only and do not reflect any transactional costs, such as sales charges (loads) and contingent deferred sales charges. Therefore, the “Hypothetical” line of the table is useful in comparing ongoing costs only and will not help you determine the relative total costs of owning different funds. In addition, if these transactional costs were included, your costs would have been higher.
| | | | | | | | | | | | | | | | |
| | | Beginning account value 4-1-2016 | | | Ending account value 9-30-2016 | | | Expenses paid during the period¹ | | | Annualized net expense ratio | |
Class A | | | | | | | | | | | | | | | | |
Actual | | $ | 1,000.00 | | | $ | 1,044.20 | | | $ | 4.60 | | | | 0.90 | % |
Hypothetical (5% return before expenses) | | $ | 1,000.00 | | | $ | 1,020.50 | | | $ | 4.55 | | | | 0.90 | % |
Class C | | | | | | | | | | | | | | | | |
Actual | | $ | 1,000.00 | | | $ | 1,040.70 | | | $ | 8.42 | | | | 1.65 | % |
Hypothetical (5% return before expenses) | | $ | 1,000.00 | | | $ | 1,016.75 | | | $ | 8.32 | | | | 1.65 | % |
Administrator Class | | | | | | | | | | | | | | | | |
Actual | | $ | 1,000.00 | | | $ | 1,045.40 | | | $ | 3.84 | | | | 0.75 | % |
Hypothetical (5% return before expenses) | | $ | 1,000.00 | | | $ | 1,021.25 | | | $ | 3.79 | | | | 0.75 | % |
Institutional Class | | | | | | | | | | | | | | | | |
Actual | | $ | 1,000.00 | | | $ | 1,045.60 | | | $ | 3.07 | | | | 0.60 | % |
Hypothetical (5% return before expenses) | | $ | 1,000.00 | | | $ | 1,022.00 | | | $ | 3.03 | | | | 0.60 | % |
| 1 | Expenses paid is equal to the annualized net expense ratio of each class multiplied by the average account value over the period, multiplied by the number of days in the most recent fiscal half-year divided by the number of days in the fiscal year (to reflect the one-half-year period). |
| | | | | | |
| Portfolio of investments—September 30, 2016 | | Wells Fargo Strategic Income Fund | | | 9 | |
| | | | | | | | | | | | | | | | |
| Security name | | Interest rate | | | Maturity date | | | Principal | | | Value | |
| | | | |
Asset-Backed Securities: 5.71% | | | | | | | | | | | | | | | | |
AmeriCredit Automobile Receivables Trust Series 2015-4 Class D | | | 3.72 | % | | | 12-8-2021 | | | $ | 300,000 | | | $ | 311,395 | |
Avis Budget Rental Car Funding LLC Series 2012-3A Class B 144A | | | 3.04 | | | | 3-20-2019 | | | | 250,000 | | | | 251,338 | |
Dell Equipment Finance Trust Series 2014-1 Class D 144A | | | 2.68 | | | | 6-22-2020 | | | | 300,000 | | | | 300,065 | |
Hertz Fleet Lease Funding LP Series 2014-1 Class C 144A± | | | 1.67 | | | | 4-10-2028 | | | | 600,000 | | | | 597,990 | |
| | | | |
Total Asset-Backed Securities (Cost $1,447,104) | | | | | | | | | | | | | | | 1,460,788 | |
| | | | | | | | | | | | | | | | |
| | | | |
Corporate Bonds and Notes: 36.62% | | | | | | | | | | | | | | | | |
| | | | |
Consumer Discretionary: 8.08% | | | | | | | | | | | | | | | | |
| | | | |
| Auto Components: 0.20% | | | | | | | | | | | | | | | | |
Allison Transmission Incorporated 144A | | | 5.00 | | | | 10-1-2024 | | | | 50,000 | | | | 51,145 | |
| | | | | | | | | | | | | | | | |
| | | | |
| Automobiles: 1.03% | | | | | | | | | | | | | | | | |
Ford Motor Company | | | 7.45 | | | | 7-16-2031 | | | | 200,000 | | | | 264,740 | |
| | | | | | | | | | | | | | | | |
| | | | |
| Hotels, Restaurants & Leisure: 1.33% | | | | | | | | | | | | | | | | |
Brinker International Incorporated 144A | | | 5.00 | | | | 10-1-2024 | | | | 25,000 | | | | 25,342 | |
CCM Merger Incorporated 144A | | | 9.13 | | | | 5-1-2019 | | | | 100,000 | | | | 104,500 | |
Greektown Holdings LLC 144A | | | 8.88 | | | | 3-15-2019 | | | | 200,000 | | | | 211,500 | |
| | | | |
| | | | | | | | | | | | | | | 341,342 | |
| | | | | | | | | | | | | | | | |
| | | | |
| Leisure Products: 0.20% | | | | | | | | | | | | | | | | |
Vista Outdoor Incorporated 144A | | | 5.88 | | | | 10-1-2023 | | | | 50,000 | | | | 52,250 | |
| | | | | | | | | | | | | | | | |
| | | | |
| Media: 3.93% | | | | | | | | | | | | | | | | |
Altice US Finance I Corporation 144A | | | 5.50 | | | | 5-15-2026 | | | | 125,000 | | | | 129,063 | |
CCO Holdings LLC | | | 5.13 | | | | 2-15-2023 | | | | 115,000 | | | | 119,888 | |
CCO Holdings LLC 144A | | | 5.13 | | | | 5-1-2023 | | | | 35,000 | | | | 36,531 | |
CCO Holdings LLC | | | 5.25 | | | | 9-30-2022 | | | | 50,000 | | | | 52,250 | |
CCO Holdings LLC 144A | | | 5.38 | | | | 5-1-2025 | | | | 5,000 | | | | 5,244 | |
Charter Communications 144A | | | 4.91 | | | | 7-23-2025 | | | | 300,000 | | | | 331,184 | |
Gray Television Incorporated 144A | | | 5.13 | | | | 10-15-2024 | | | | 50,000 | | | | 49,063 | |
Gray Television Incorporated 144A | | | 5.88 | | | | 7-15-2026 | | | | 50,000 | | | | 50,375 | |
National CineMedia LLC 144A | | | 5.75 | | | | 8-15-2026 | | | | 50,000 | | | | 51,875 | |
Nexstar Broadcasting Group Incorporated 144A | | | 5.63 | | | | 8-1-2024 | | | | 25,000 | | | | 25,188 | |
Nexstar Broadcasting Group Incorporated 144A | | | 6.13 | | | | 2-15-2022 | | | | 50,000 | | | | 51,625 | |
Outfront Media Capital Corporation | | | 5.25 | | | | 2-15-2022 | | | | 100,000 | | | | 104,000 | |
| | | | |
| | | | | | | | | | | | | | | 1,006,286 | |
| | | | | | | | | | | | | | | | |
| | | | |
| Specialty Retail: 0.78% | | | | | | | | | | | | | | | | |
Asbury Automotive Group Incorporated | | | 6.00 | | | | 12-15-2024 | | | | 75,000 | | | | 77,250 | |
Century Intermediate Holding Company (PIK at 10.50%) 144A¥ | | | 9.75 | | | | 2-15-2019 | | | | 5,000 | | | | 5,100 | |
Penske Auto Group Incorporated | | | 5.75 | | | | 10-1-2022 | | | | 50,000 | | | | 51,875 | |
Sonic Automotive Incorporated | | | 5.00 | | | | 5-15-2023 | | | | 65,000 | | | | 64,025 | |
| | | | |
| | | | | | | | | | | | | | | 198,250 | |
| | | | | | | | | | | | | | | | |
| | | | |
| Textiles, Apparel & Luxury Goods: 0.61% | | | | | | | | | | | | | | | | |
Levi Strauss & Company | | | 5.00 | | | | 5-1-2025 | | | | 100,000 | | | | 104,250 | |
Wolverine World Wide Company 144A | | | 5.00 | | | | 9-1-2026 | | | | 50,000 | | | | 50,500 | |
| | | | |
| | | | | | | | | | | | | | | 154,750 | |
| | | | | | | | | | | | | | | | |
The accompanying notes are an integral part of these financial statements.
| | | | |
| 10 | | Wells Fargo Strategic Income Fund | | Portfolio of investments—September 30, 2016 |
| | | | | | | | | | | | | | | | |
| Security name | | Interest rate | | | Maturity date | | | Principal | | | Value | |
| | | | |
Consumer Staples: 1.16% | | | | | | | | | | | | | | | | |
| | | | |
| Beverages: 0.84% | | | | | | | | | | | | | | | | |
Anheuser-Busch InBev Finance Incorporated | | | 3.65 | % | | | 2-1-2026 | | | $ | 200,000 | | | $ | 214,177 | |
| | | | | | | | | | | | | | | | |
| | | | |
| Tobacco: 0.32% | | | | | | | | | | | | | | | | |
Altria Group Incorporated | | | 3.88 | | | | 9-16-2046 | | | | 80,000 | | | | 83,277 | |
| | | | | | | | | | | | | | | | |
| | | | |
Energy: 6.46% | | | | | | | | | | | | | | | | |
| | | | |
| Energy Equipment & Services: 1.93% | | | | | | | | | | | | | | | | |
Bristow Group Incorporated | | | 6.25 | | | | 10-15-2022 | | | | 150,000 | | | | 109,875 | |
Era Group Incorporated | | | 7.75 | | | | 12-15-2022 | | | | 40,000 | | | | 33,400 | |
Hilcorp Energy Company 144A | | | 5.75 | | | | 10-1-2025 | | | | 50,000 | | | | 49,750 | |
Hornbeck Offshore Services Incorporated | | | 1.50 | | | | 9-1-2019 | | | | 25,000 | | | | 14,250 | |
NGPL PipeCo LLC 144A | | | 7.77 | | | | 12-15-2037 | | | | 175,000 | | | | 189,875 | |
PHI Incorporated | | | 5.25 | | | | 3-15-2019 | | | | 100,000 | | | | 95,750 | |
| | | | |
| | | | | | | | | | | | | | | 492,900 | |
| | | | | | | | | | | | | | | | |
| | | | |
| Oil, Gas & Consumable Fuels: 4.53% | | | | | | | | | | | | | | | | |
Buckeye Partners LP | | | 4.35 | | | | 10-15-2024 | | | | 100,000 | | | | 101,539 | |
Crestwood Midstream Partners LP | | | 6.25 | | | | 4-1-2023 | | | | 50,000 | | | | 50,625 | |
Enable Midstream Partner LP | | | 3.90 | | | | 5-15-2024 | | | | 100,000 | | | | 93,300 | |
Enlink Midstream LLC | | | 4.40 | | | | 4-1-2024 | | | | 50,000 | | | | 48,849 | |
Exterran Partners LP | | | 6.00 | | | | 4-1-2021 | | | | 50,000 | | | | 46,875 | |
Gulfport Energy Corporation | | | 6.63 | | | | 5-1-2023 | | | | 75,000 | | | | 76,875 | |
Murphy Oil Corporation | | | 4.70 | | | | 12-1-2022 | | | | 25,000 | | | | 23,871 | |
PDC Energy Incorporated 144A | | | 6.13 | | | | 9-15-2024 | | | | 25,000 | | | | 26,000 | |
Rockies Express Pipeline LLC 144A | | | 5.63 | | | | 4-15-2020 | | | | 225,000 | | | | 237,375 | |
Rose Rock Midstream LP | | | 5.63 | | | | 11-15-2023 | | | | 100,000 | | | | 91,000 | |
Sabine Pass Liquefaction LLC | | | 5.63 | | | | 2-1-2021 | | | | 100,000 | | | | 106,375 | |
Sabine Pass Liquefaction LLC 144A | | | 5.88 | | | | 6-30-2026 | | | | 75,000 | | | | 81,516 | |
Tallgrass Energy Partners LP 144A | | | 5.50 | | | | 9-15-2024 | | | | 50,000 | | | | 50,375 | |
TC Pipelines LP | | | 4.38 | | | | 3-13-2025 | | | | 100,000 | | | | 101,904 | |
Ultra Petroleum Corporation 144A(s) | | | 6.13 | | | | 10-1-2024 | | | | 30,000 | | | | 23,700 | |
| | | | |
| | | | | | | | | | | | | | | 1,160,179 | |
| | | | | | | | | | | | | | | | |
| | | | |
Financials: 6.83% | | | | | | | | | | | | | | | | |
| | | | |
| Banks: 1.82% | | | | | | | | | | | | | | | | |
Bank of America Corporation ± | | | 6.30 | | | | 12-29-2049 | | | | 200,000 | | | | 217,250 | |
CIT Group Incorporated | | | 5.00 | | | | 8-1-2023 | | | | 100,000 | | | | 105,875 | |
JPMorgan Chase & Company ± | | | 6.00 | | | | 12-31-2049 | | | | 135,000 | | | | 140,906 | |
| | | | |
| | | | | | | | | | | | | | | 464,031 | |
| | | | | | | | | | | | | | | | |
| | | | |
| Capital Markets: 1.02% | | | | | | | | | | | | | | | | |
Goldman Sachs Group Incorporated | | | 4.25 | | | | 10-21-2025 | | | | 200,000 | | | | 210,602 | |
Jefferies Finance LLC 144A | | | 6.88 | | | | 4-15-2022 | | | | 55,000 | | | | 51,150 | |
| | | | |
| | | | | | | | | | | | | | | 261,752 | |
| | | | | | | | | | | | | | | | |
| | | | |
| Consumer Finance: 1.70% | | | | | | | | | | | | | | | | |
Ally Financial Incorporated | | | 7.50 | | | | 9-15-2020 | | | | 75,000 | | | | 85,313 | |
General Motors Financial Company Incorporated | | | 3.20 | | | | 7-6-2021 | | | | 200,000 | | | | 202,471 | |
The accompanying notes are an integral part of these financial statements.
| | | | | | |
| Portfolio of investments—September 30, 2016 | | Wells Fargo Strategic Income Fund | | | 11 | |
| | | | | | | | | | | | | | | | |
| Security name | | Interest rate | | | Maturity date | | | Principal | | | Value | |
| | | | |
| Consumer Finance (continued) | | | | | | | | | | | | | | | | |
Springleaf Finance Corporation | | | 7.75 | % | | | 10-1-2021 | | | $ | 100,000 | | | $ | 104,875 | |
Springleaf Finance Corporation | | | 8.25 | | | | 10-1-2023 | | | | 40,000 | | | | 42,000 | |
| | | | |
| | | | | | | | | | | | | | | 434,659 | |
| | | | | | | | | | | | | | | | |
| | | | |
| Insurance: 2.29% | | | | | | | | | | | | | | | | |
American International Group Incorporated | | | 4.80 | | | | 7-10-2045 | | | | 80,000 | | | | 84,872 | |
Fairfax US Incorporated 144A | | | 4.88 | | | | 8-13-2024 | | | | 200,000 | | | | 204,393 | |
Hub Holdings LLC (PIK at 8.88%) 144A¥ | | | 8.13 | | | | 7-15-2019 | | | | 30,000 | | | | 29,250 | |
Hub International Limited 144A | | | 7.88 | | | | 10-1-2021 | | | | 100,000 | | | | 102,000 | |
MetLife Incorporated | | | 6.40 | | | | 12-15-2066 | | | | 150,000 | | | | 166,031 | |
| | | | |
| | | | | | | | | | | | | | | 586,546 | |
| | | | | | | | | | | | | | | | |
| | | | |
Health Care: 2.37% | | | | | | | | | | | | | | | | |
| | | | |
| Health Care Providers & Services: 1.57% | | | | | | | | | | | | | | | | |
DaVita HealthCare Partners Incorporated | | | 5.00 | | | | 5-1-2025 | | | | 100,000 | | | | 100,375 | |
MPH Acquisition Holdings LLC 144A | | | 7.13 | | | | 6-1-2024 | | | | 75,000 | | | | 80,625 | |
Tenet Healthcare Corporation | | | 6.25 | | | | 11-1-2018 | | | | 100,000 | | | | 106,750 | |
Vizient Incorporated 144A | | | 10.38 | | | | 3-1-2024 | | | | 100,000 | | | | 114,750 | |
| | | | |
| | | | | | | | | | | | | | | 402,500 | |
| | | | | | | | | | | | | | | | |
| | | | |
| Health Care Technology: 0.41% | | | | | | | | | | | | | | | | |
Change Healthcare Holdings Incorporated 144A | | | 6.00 | | | | 2-15-2021 | | | | 100,000 | | | | 105,500 | |
| | | | | | | | | | | | | | | | |
| | | | |
| Life Sciences Tools & Services: 0.39% | | | | | | | | | | | | | | | | |
Thermo Fisher Scientific Incorporated | | | 2.95 | | | | 9-19-2026 | | | | 100,000 | | | | 99,672 | |
| | | | | | | | | | | | | | | | |
| | | | |
Industrials: 1.00% | | | | | | | | | | | | | | | | |
| | | | |
| Airlines: 0.43% | | | | | | | | | | | | | | | | |
American Airlines Incorporated | | | 4.38 | | | | 4-1-2024 | | | | 108,072 | | | | 109,823 | |
| | | | | | | | | | | | | | | | |
| | | | |
| Commercial Services & Supplies: 0.57% | | | | | | | | | | | | | | | | |
Covanta Holding Corporation | | | 5.88 | | | | 3-1-2024 | | | | 145,000 | | | | 145,363 | |
| | | | | | | | | | | | | | | | |
| | | | |
Information Technology: 3.76% | | | | | | | | | | | | | | | | |
| | | | |
| Electronic Equipment, Instruments & Components: 0.42% | | | | | | | | | | | | | | | | |
Zebra Technologies Corporation | | | 7.25 | | | | 10-15-2022 | | | | 100,000 | | | | 108,500 | |
| | | | | | | | | | | | | | | | |
| | | | |
| Internet Software & Services: 0.31% | | | | | | | | | | | | | | | | |
Zayo Group LLC | | | 6.38 | | | | 5-15-2025 | | | | 75,000 | | | | 79,875 | |
| | | | | | | | | | | | | | | | |
| | | | |
| Semiconductors & Semiconductor Equipment: 1.22% | | | | | | | | | | | | | | | | |
KLA-Tencor Corporation | | | 4.13 | | | | 11-1-2021 | | | | 200,000 | | | | 215,269 | |
Micron Technology Incorporated 144A | | | 5.63 | | | | 1-15-2026 | | | | 100,000 | | | | 96,250 | |
| | | | |
| | | | | | | | | | | | | | | 311,519 | |
| | | | | | | | | | | | | | | | |
| | | | |
| Software: 0.24% | | | | | | | | | | | | | | | | |
Activision Blizzard Incorporated 144A | | | 5.63 | | | | 9-15-2021 | | | | 15,000 | | | | 15,651 | |
Boxer Parent Company Incorporated (PIK at 9.75%) 144A¥ | | | 9.00 | | | | 10-15-2019 | | | | 50,000 | | | | 45,250 | |
| | | | |
| | | | | | | | | | | | | | | 60,901 | |
| | | | | | | | | | | | | | | | |
The accompanying notes are an integral part of these financial statements.
| | | | |
| 12 | | Wells Fargo Strategic Income Fund | | Portfolio of investments—September 30, 2016 |
| | | | | | | | | | | | | | | | |
| Security name | | Interest rate | | | Maturity date | | | Principal | | | Value | |
| | | | |
| Technology Hardware, Storage & Peripherals: 1.57% | | | | | | | | | | | | | | | | |
Diamond 1 Finance Corporation 144A | | | 5.88 | % | | | 6-15-2021 | | | $ | 50,000 | | | $ | 53,125 | |
Diamond 1 Finance Corporation 144A | | | 7.13 | | | | 6-15-2024 | | | | 75,000 | | | | 82,486 | |
Diamond 1 Finance Corporation 144A | | | 8.35 | | | | 7-15-2046 | | | | 55,000 | | | | 65,884 | |
NCR Corporation | | | 5.00 | | | | 7-15-2022 | | | | 175,000 | | | | 178,938 | |
NCR Corporation | | | 5.88 | | | | 12-15-2021 | | | | 10,000 | | | | 10,525 | |
NCR Corporation | | | 6.38 | | | | 12-15-2023 | | | | 10,000 | | | | 10,575 | |
| | | | |
| | | | | | | | | | | | | | | 401,533 | |
| | | | | | | | | | | | | | | | |
| | | | |
Materials: 0.83% | | | | | | | | | | | | | | | | |
| | | | |
| Construction Materials: 0.40% | | | | | | | | | | | | | | | | |
LafargeHolcim Finance US LLC 144A | | | 3.50 | | | | 9-22-2026 | | | | 100,000 | | | | 101,696 | |
| | | | | | | | | | | | | | | | |
| | | | |
| Containers & Packaging: 0.43% | | | | | | | | | | | | | | | | |
Owens-Illinois Incorporated 144A | | | 6.38 | | | | 8-15-2025 | | | | 100,000 | | | | 110,125 | |
| | | | | | | | | | | | | | | | |
| | | | |
Real Estate: 2.68% | | | | | | | | | | | | | | | | |
| | | | |
| Equity REITs: 2.29% | | | | | | | | | | | | | | | | |
DuPont Fabros Technology Incorporated LP | | | 5.63 | | | | 6-15-2023 | | | | 50,000 | | | | 52,625 | |
DuPont Fabros Technology Incorporated LP | | | 5.88 | | | | 9-15-2021 | | | | 85,000 | | | | 88,931 | |
ESH Hospitality Incorporated 144A | | | 5.25 | | | | 5-1-2025 | | | | 100,000 | | | | 99,875 | |
Iron Mountain Incorporated | | | 6.00 | | | | 8-15-2023 | | | | 75,000 | | | | 80,063 | |
Omega Healthcare Investors Incorporated | | | 4.50 | | | | 1-15-2025 | | | | 175,000 | | | | 178,125 | |
The Geo Group Incorporated | | | 5.88 | | | | 10-15-2024 | | | | 100,000 | | | | 86,000 | |
| | | | |
| | | | | | | | | | | | | | | 585,619 | |
| | | | | | | | | | | | | | | | |
| | | | |
| Real Estate Management & Development: 0.39% | | | | | | | | | | | | | | | | |
Onex Corporation 144A | | | 7.75 | | | | 1-15-2021 | | | | 100,000 | | | | 101,500 | |
| | | | | | | | | | | | | | | | |
| | | | |
Telecommunication Services: 2.95% | | | | | | | | | | | | | | | | |
| | | | |
| Diversified Telecommunication Services: 0.87% | | | | | | | | | | | | | | | | |
GCI Incorporated | | | 6.75 | | | | 6-1-2021 | | | | 115,000 | | | | 118,134 | |
SBA Communications Corporation | | | 4.88 | | | | 7-15-2022 | | | | 100,000 | | | | 103,500 | |
| | | | |
| | | | | | | | | | | | | | | 221,634 | |
| | | | | | | | | | | | | | | | |
| | | | |
| Wireless Telecommunication Services: 2.08% | | | | | | | | | | | | | | | | |
CC Holdings GS V LLC | | | 3.85 | | | | 4-15-2023 | | | | 200,000 | | | | 214,293 | |
Sprint Communications Incorporated 144A | | | 7.00 | | | | 3-1-2020 | | | | 150,000 | | | | 161,625 | |
T-Mobile USA Incorporated | | | 6.38 | | | | 3-1-2025 | | | | 20,000 | | | | 21,750 | |
T-Mobile USA Incorporated | | | 6.50 | | | | 1-15-2024 | | | | 100,000 | | | | 108,182 | |
T-Mobile USA Incorporated | | | 6.84 | | | | 4-28-2023 | | | | 25,000 | | | | 26,875 | |
| | | | |
| | | | | | | | | | | | | | | 532,725 | |
| | | | | | | | | | | | | | | | |
| | | | |
Utilities: 0.50% | | | | | | | | | | | | | | | | |
| | | | |
| Electric Utilities: 0.09% | | | | | | | | | | | | | | | | |
NRG Yield Operating LLC 144A | | | 5.00 | | | | 9-15-2026 | | | | 25,000 | | | | 24,500 | |
| | | | | | | | | | | | | | | | |
The accompanying notes are an integral part of these financial statements.
| | | | | | |
| Portfolio of investments—September 30, 2016 | | Wells Fargo Strategic Income Fund | | | 13 | |
| | | | | | | | | | | | | | | | |
| Security name | | Interest rate | | | Maturity date | | | Principal | | | Value | |
| | |
| Independent Power & Renewable Electricity Producers: 0.41% | | | | | | | | | |
NSG Holdings LLC 144A | | | 7.75 | % | | | 12-15-2025 | | | $ | 97,090 | | | $ | 104,372 | |
| | | | | | | | | | | | | | | | |
| | | | |
Total Corporate Bonds and Notes (Cost $9,116,024) | | | | | | | | | | | | | | | 9,373,641 | |
| | | | | | | | | | | | | | | | |
| | | | |
Foreign Corporate Bonds and Notes @: 3.48% | | | | | | | | | | | | | | | | |
| | | | |
Consumer Discretionary: 1.21% | | | | | | | | | | | | | | | | |
| | | | |
| Hotels, Restaurants & Leisure: 1.21% | | | | | | | | | | | | | | | | |
Schumann SpA 144A (EUR) | | | 7.00 | | | | 7-31-2023 | | | | 125,000 | | | | 138,976 | |
William Hill plc (GBP) | | | 4.88 | | | | 9-7-2023 | | | | 125,000 | | | | 169,917 | |
| | | | |
| | | | | | | | | | | | | | | 308,893 | |
| | | | | | | | | | | | | | | | |
| | | | |
Financials: 1.16% | | | | | | | | | | | | | | | | |
| | | | |
| Diversified Financial Services: 1.16% | | | | | | | | | | | | | | | | |
Arrow Global Finance plc 144A (GBP) | | | 5.13 | | | | 9-15-2024 | | | | 125,000 | | | | 156,590 | |
Ineos Finance plc 144A (EUR) | | | 4.00 | | | | 5-1-2023 | | | | 125,000 | | | | 140,615 | |
| | | | |
| | | | | | | | | | | | | | | 297,205 | |
| | | | | | | | | | | | | | | | |
| | | | |
Materials: 0.54% | | | | | | | | | | | | | | | | |
| | | | |
| Paper & Forest Products: 0.54% | | | | | | | | | | | | | | | | |
Lecta SA 144A (EUR) | | | 6.50 | | | | 8-1-2023 | | | | 125,000 | | | | 138,551 | |
| | | | | | | | | | | | | | | | |
| | | | |
Telecommunication Services: 0.57% | | | | | | | | | | | | | | | | |
| | | | |
| Diversified Telecommunication Services: 0.57% | | | | | | | | | | | | | | | | |
SFR Group SA 144A (EUR) | | | 5.63 | | | | 5-15-2024 | | | | 125,000 | | | | 144,912 | |
| | | | | | | | | | | | | | | | |
| | | | |
Total Foreign Corporate Bonds and Notes (Cost $906,950) | | | | | | | | | | | | | | | 889,561 | |
| | | | | | | | | | | | | | | | |
| | | | |
Foreign Government Bonds @: 6.47% | | | | | | | | | | | | | | | | |
Colombia (COP) | | | 7.00 | | | | 9-11-2019 | | | | 1,500,000,000 | | | | 527,638 | |
Indonesia Government (IDR) | | | 7.88 | | | | 4-15-2019 | | | | 8,100,000,000 | | | | 640,503 | |
Mexico (MXN) | | | 4.75 | | | | 6-14-2018 | | | | 9,565,000 | | | | 488,869 | |
| | | | |
Total Foreign Government Bonds (Cost $1,775,978) | | | | | | | | | | | | | | | 1,657,010 | |
| | | | | | | | | | | | | | | | |
| | | | |
Loans: 15.92% | | | | | | | | | | | | | | | | |
| | | | |
Consumer Discretionary: 4.66% | | | | | | | | | | | | | | | | |
| | | | |
| Auto Components: 0.72% | | | | | | | | | | | | | | | | |
Allison Transmission Incorporated ± | | | 3.25 | | | | 8-23-2019 | | | $ | 85,035 | | | | 85,596 | |
Federal-Mogul Holdings Corporation ±< | | | 0.00 | | | | 4-15-2018 | | | | 100,000 | | | | 98,839 | |
| | | | |
| | | | | | | | | | | | | | | 184,435 | |
| | | | | | | | | | | | | | | | |
| | | | |
| Distributors: 1.20% | | | | | | | | | | | | | | | | |
Spin Holdco Incorporated ± | | | 4.25 | | | | 11-14-2019 | | | | 307,931 | | | | 306,315 | |
| | | | | | | | | | | | | | | | |
| | | | |
| Hotels, Restaurants & Leisure: 0.40% | | | | | | | | | | | | | | | | |
Belmond Interfin Limited ± | | | 4.00 | | | | 3-21-2021 | | | | 102,375 | | | | 101,735 | |
| | | | | | | | | | | | | | | | |
| | | | |
| Household Products: 0.39% | | | | | | | | | | | | | | | | |
Anchor Glass Container Corporation ±< | | | 0.00 | | | | 7-1-2022 | | | | 100,000 | | | | 100,542 | |
| | | | | | | | | | | | | | | | |
The accompanying notes are an integral part of these financial statements.
| | | | |
| 14 | | Wells Fargo Strategic Income Fund | | Portfolio of investments—September 30, 2016 |
| | | | | | | | | | | | | | | | |
| Security name | | Interest rate | | | Maturity date | | | Principal | | | Value | |
| | | | |
| Media: 1.38% | | | | | | | | | | | | | | | | |
Altice US Finance I Corporation ± | | | 4.25 | % | | | 12-14-2022 | | | $ | 150,000 | | | $ | 150,938 | |
Learfield Communications Incorporated ± | | | 4.25 | | | | 10-9-2020 | | | | 176,095 | | | | 176,021 | |
Salem Communications Corporation ± | | | 4.50 | | | | 3-16-2020 | | | | 26,900 | | | | 26,396 | |
| | | | |
| | | | | | | | | | | | | | | 353,355 | |
| | | | | | | | | | | | | | | | |
| | | | |
| Specialty Retail: 0.57% | | | | | | | | | | | | | | | | |
Focus Brands Incorporated ± | | | 4.25 | | | | 2-21-2018 | | | | 146,999 | | | | 146,963 | |
| | | | | | | | | | | | | | | | |
| | | | |
Energy: 0.97% | | | | | | | | | | | | | | | | |
| | | | |
| Energy Equipment & Services: 0.49% | | | | | | | | | | | | | | | | |
ExGen Renewables I LLC ± | | | 5.25 | | | | 2-14-2021 | | | | 16,531 | | | | 16,675 | |
Hummel Station LLC ±< | | | 0.00 | | | | 10-27-2022 | | | | 112,613 | | | | 108,297 | |
| | | | |
| | | | | | | | | | | | | | | 124,972 | |
| | | | | | | | | | | | | | | | |
| | | | |
| Oil, Gas & Consumable Fuels: 0.48% | | | | | | | | | | | | | | | | |
Veresen Midstream LP ± | | | 5.25 | | | | 3-31-2022 | | | | 124,684 | | | | 123,540 | |
| | | | | | | | | | | | | | | | |
| | | | |
Financials: 0.39% | | | | | | | | | | | | | | | | |
| | | | |
| Capital Markets: 0.39% | | | | | | | | | | | | | | | | |
La Quinta Intermediate Holdings LLC ± | | | 3.75 | | | | 4-14-2021 | | | | 100,000 | | | | 99,813 | |
| | | | | | | | | | | | | | | | |
| | | | |
Health Care: 1.49% | | | | | | | | | | | | | | | | |
| | | | |
| Health Care Providers & Services: 0.85% | | | | | | | | | | | | | | | | |
Community Health Systems Incorporated ± | | | 4.00 | | | | 1-27-2021 | | | | 69,087 | | | | 67,775 | |
Surgery Center Holdings Incorporated ± | | | 4.75 | | | | 11-3-2020 | | | | 49,114 | | | | 49,114 | |
Team Health Incorporated ± | | | 3.84 | | | | 11-23-2022 | | | | 99,749 | | | | 100,186 | |
| | | | |
| | | | | | | | | | | | | | | 217,075 | |
| | | | | | | | | | | | | | | | |
| | | | |
| Pharmaceuticals: 0.64% | | | | | | | | | | | | | | | | |
Valeant Pharmaceuticals International Incorporated ± | | | 5.25 | | | | 12-11-2019 | | | | 165,408 | | | | 165,498 | |
| | | | | | | | | | | | | | | | |
| | | | |
Industrials: 1.87% | | | | | | | | | | | | | | | | |
| | | | |
| Aerospace & Defense: 0.39% | | | | | | | | | | | | | | | | |
TransDigm Incorporated ± | | | 3.83 | | | | 6-4-2021 | | | | 99,745 | | | | 99,662 | |
| | | | | | | | | | | | | | | | |
| | | | |
| Commercial Services & Supplies: 0.91% | | | | | | | | | | | | | | | | |
KAR Auction Services Incorporated ± | | | 4.06 | | | | 3-9-2021 | | | | 133,991 | | | | 134,717 | |
Sedgwick Claims Management Services Incorporated ± | | | 3.75 | | | | 3-1-2021 | | | | 99,744 | | | | 98,892 | |
| | | | |
| | | | | | | | | | | | | | | 233,609 | |
| | | | | | | | | | | | | | | | |
| | | | |
| Construction & Engineering: 0.13% | | | | | | | | | | | | | | | | |
USIC Holdings Incorporated ± | | | 4.00 | | | | 7-10-2020 | | | | 34,086 | | | | 33,873 | |
| | | | | | | | | | | | | | | | |
| | | | |
| Transportation Infrastructure: 0.44% | | | | | | | | | | | | | | | | |
OSG Bulk Ships Incorporated ± | | | 5.25 | | | | 8-5-2019 | | | | 12,360 | | | | 12,314 | |
OSG International Incorporated ± | | | 5.75 | | | | 8-5-2019 | | | | 99,177 | | | | 98,929 | |
| | | | |
| | | | | | | | | | | | | | | 111,243 | |
| | | | | | | | | | | | | | | | |
The accompanying notes are an integral part of these financial statements.
| | | | | | |
| Portfolio of investments—September 30, 2016 | | Wells Fargo Strategic Income Fund | | | 15 | |
| | | | | | | | | | | | | | | | |
| Security name | | Interest rate | | | Maturity date | | | Principal | | | Value | |
| | | | |
Information Technology: 1.94% | | | | | | | | | | | | | | | | |
| | | | |
| Internet Software & Services: 0.56% | | | | | | | | | | | | | | | | |
Applied Systems Incorporated ± | | | 4.00 | % | | | 1-25-2021 | | | $ | 143,617 | | | $ | 143,796 | |
| | | | | | | | | | | | | | | | |
| | | | |
| IT Services: 1.38% | | | | | | | | | | | | | | | | |
First Data Corporation ± | | | 4.28 | | | | 7-8-2022 | | | | 350,000 | | | | 351,838 | |
| | | | | | | | | | | | | | | | |
| | | | |
Materials: 0.96% | | | | | | | | | | | | | | | | |
| | | | |
| Containers & Packaging: 0.96% | | | | | | | | | | | | | | | | |
Berry Plastics Group Incorporated ± | | | 3.75 | | | | 10-1-2022 | | | | 94,987 | | | | 95,251 | |
Reynolds Group Holdings Incorporated ±< | | | 4.25 | | | | 2-5-2023 | | | | 150,000 | | | | 150,422 | |
| | | | |
| | | | | | | | | | | | | | | 245,673 | |
| | | | | | | | | | | | | | | | |
| | | | |
Real Estate: 0.36% | | | | | | | | | | | | | | | | |
| | | | |
| Real Estate Management & Development: 0.36% | | | | | | | | | | | | | | | | |
Capital Automotive LP ± | | | 4.00 | | | | 4-10-2019 | | | | 90,311 | | | | 90,961 | |
| | | | | | | | | | | | | | | | |
| | | | |
Telecommunication Services: 2.84% | | | | | | | | | | | | | | | | |
| | | | |
| Diversified Telecommunication Services: 2.02% | | | | | | | | | | | | | | | | |
Intelsat Jackson Holdings SA ± | | | 3.75 | | | | 6-30-2019 | | | | 240,332 | | | | 228,260 | |
Level 3 Financing Incorporated ± | | | 4.00 | | | | 8-1-2019 | | | | 288,205 | | | | 289,286 | |
| | | | |
| | | | | | | | | | | | | | | 517,546 | |
| | | | | | | | | | | | | | | | |
| | | | |
| Wireless Telecommunication Services: 0.82% | | | | | | | | | | | | | | | | |
Syniverse Holdings Incorporated ± | | | 4.00 | | | | 4-23-2019 | | | | 236,857 | | | | 209,026 | |
| | | | | | | | | | | | | | | | |
| | | | |
Utilities: 0.44% | | | | | | | | | | | | | | | | |
| | | | |
| Electric Utilities: 0.44% | | | | | | | | | | | | | | | | |
Texas Competitive Electric Holdings Company LLC ±(s) | | | 4.66 | | | | 10-10-2016 | | | | 400,000 | | | | 113,928 | |
| | | | | | | | | | | | | | | | |
| | | | |
Total Loans (Cost $4,402,226) | | | | | | | | | | | | | | | 4,075,398 | |
| | | | | | | | | | | | | | | | |
| | | | |
Municipal Obligations: 2.20% | | | | | | | | | | | | | | | | |
| | | | |
| Idaho: 0.17% | | | | | | | | | | | | | | | | |
Idaho Housing & Finance Association Legacy Public Charter School Series B (Education Revenue) | | | 7.00 | | | | 5-1-2017 | | | | 45,000 | | | | 45,037 | |
| | | | | | | | | | | | | | | | |
| | | | |
| Illinois: 0.81% | | | | | | | | | | | | | | | | |
Chicago IL Refunding Bonds Taxable Project Series E (GO Revenue) | | | 6.05 | | | | 1-1-2029 | | | | 200,000 | | | | 208,092 | |
| | | | | | | | | | | | | | | | |
| | | | |
| Michigan: 0.24% | | | | | | | | | | | | | | | | |
Wayne County MI Series 2016 (GO Revenue) | | | 4.25 | | | | 12-1-2018 | | | | 60,000 | | | | 60,671 | |
| | | | | | | | | | | | | | | | |
| | | | |
| Texas: 0.98% | | | | | | | | | | | | | | | | |
North Texas Tollway Authority Build America Bonds Sub Lien Series B-2 (Transportation Revenue) | | | 8.91 | | | | 2-1-2030 | | | | 210,000 | | | | 250,610 | |
| | | | | | | | | | | | | | | | |
| | | | |
Total Municipal Obligations (Cost $559,979) | | | | | | | | | | | | | | | 564,410 | |
| | | | | | | | | | | | | | | | |
The accompanying notes are an integral part of these financial statements.
| | | | |
| 16 | | Wells Fargo Strategic Income Fund | | Portfolio of investments—September 30, 2016 |
| | | | | | | | | | | | | | | | |
| Security name | | Interest rate | | | Maturity date | | | Principal | | | Value | |
| | | | |
Non-Agency Mortgage-Backed Securities: 14.80% | | | | | | | | | | | | | | | | |
321 Henderson Receivables LLC Series 2015-2A Class A 144A | | | 3.87 | % | | | 3-15-2058 | | | $ | 444,308 | | | $ | 464,338 | |
ACAS CLO Limited Trust Series 2015-1A Class B 144A± | | | 2.78 | | | | 4-18-2027 | | | | 500,000 | | | | 499,997 | |
Ascentium Equipment Receivables LLC Series 2016-1A Class B 144A | | | 2.85 | | | | 7-10-2020 | | | | 400,000 | | | | 406,221 | |
BB-UBS Trust Series 2012-TFT Class C 144A± | | | 3.58 | | | | 6-5-2030 | | | | 150,000 | | | | 147,884 | |
BCC Funding Corporation Series 2016-1 Class B 144A | | | 2.73 | | | | 4-20-2022 | | | | 400,000 | | | | 400,037 | |
Citi Held For Asset Issuance Trust Series 2015-PM3 Class B 144A | | | 4.31 | | | | 5-16-2022 | | | | 450,000 | | | | 450,791 | |
Commercial Mortgage Trust Series 2015-LC23 Class C ± | | | 4.80 | | | | 10-10-2053 | | | | 300,000 | | | | 312,145 | |
GS Mortgage Securities Trust Series 2014-GC24 Class D 144A± | | | 4.66 | | | | 9-10-2047 | | | | 325,000 | | | | 252,124 | |
JPMBB Commercial Mortgage Securities Trust Series 2014-C19 Class D 144A± | | | 4.83 | | | | 4-15-2047 | | | | 493,000 | | | | 425,624 | |
Morgan Stanley Capital I Trust Series 2007-HQ11 Class AM ± | | | 5.48 | | | | 2-12-2044 | | | | 25,000 | | | | 25,121 | |
Social Professional Loan Program LLC Series 2016-A Class A2 144A | | | 2.76 | | | | 12-26-2036 | | | | 395,639 | | | | 405,477 | |
| | | | |
Total Non-Agency Mortgage-Backed Securities (Cost $3,818,846) | | | | | | | | | | | | | | | 3,789,759 | |
| | | | | | | | | | | | | | | | |
| | | | |
U.S. Treasury Securities: 0.51% | | | | | | | | | | | | | | | | |
U.S. Treasury Note | | | 1.63 | | | | 2-15-2026 | | | | 130,000 | | | | 130,320 | |
| | | | | | | | | | | | | | | | |
| | | | |
Total U.S. Treasury Securities (Cost $126,660) | | | | | | | | | | | | | | | 130,320 | |
| | | | | | | | | | | | | | | | |
| | | | |
Yankee Corporate Bonds and Notes: 6.44% | | | | | | | | | | | | | | | | |
| | | | |
Energy: 0.25% | | | | | | | | | | | | | | | | |
| | | | |
| Oil, Gas & Consumable Fuels: 0.25% | | | | | | | | | | | | | | | | |
Teekay Corporation | | | 8.50 | | | | 1-15-2020 | | | | 75,000 | | | | 64,875 | |
| | | | | | | | | | | | | | | | |
| | | | |
Financials: 4.15% | | | | | | | | | | | | | | | | |
| | | | |
| Banks: 3.02% | | | | | | | | | | | | | | | | |
BPCE SA 144A | | | 5.15 | | | | 7-21-2024 | | | | 230,000 | | | | 242,046 | |
Credit Agricole SA 144A± | | | 8.13 | | | | 12-29-2049 | | | | 200,000 | | | | 212,000 | |
Credit Suisse Group Funding (Guernsey) Limited 144A | | | 3.45 | | | | 4-16-2021 | | | | 210,000 | | | | 214,289 | |
Nielsen Holding and Finance BV 144A | | | 5.50 | | | | 10-1-2021 | | | | 100,000 | | | | 104,250 | |
| | | | |
| | | | | | | | | | | | | | | 772,585 | |
| | | | | | | | | | | | | | | | |
| | | | |
| Diversified Financial Services: 1.13% | | | | | | | | | | | | | | | | |
Deutsche Bank AG (London) | | | 6.00 | | | | 9-1-2017 | | | | 285,000 | | | | 289,620 | |
| | | | | | | | | | | | | | | | |
| | | | |
Health Care: 0.17% | | | | | | | | | | | | | | | | |
| | | | |
| Pharmaceuticals: 0.17% | | | | | | | | | | | | | | | | |
Valeant Pharmaceuticals International Incorporated 144A | | | 6.13 | | | | 4-15-2025 | | | | 50,000 | | | | 43,063 | |
| | | | | | | | | | | | | | | | |
| | | | |
Industrials: 0.20% | | | | | | | | | | | | | | | | |
| | | | |
| Commercial Services & Supplies: 0.20% | | | | | | | | | | | | | | | | |
GFL Environmental Incorporated 144A | | | 7.88 | | | | 4-1-2020 | | | | 50,000 | | | | 52,500 | |
| | | | | | | | | | | | | | | | |
| | | | |
Information Technology: 0.65% | | | | | | | | | | | | | | | | |
| | | | |
| Technology Hardware, Storage & Peripherals: 0.65% | | | | | | | | | | | | | | | | |
Seagate HDD Cayman | | | 4.75 | | | | 1-1-2025 | | | | 175,000 | | | | 165,375 | |
| | | | | | | | | | | | | | | | |
| | | | |
Materials: 0.20% | | | | | | | | | | | | | | | | |
| | | | |
| Containers & Packaging: 0.20% | | | | | | | | | | | | | | | | |
Ardagh Packaging Finance plc 144A± | | | 3.65 | | | | 12-15-2019 | | | | 50,000 | | | | 50,690 | |
| | | | | | | | | | | | | | | | |
The accompanying notes are an integral part of these financial statements.
| | | | | | |
| Portfolio of investments—September 30, 2016 | | Wells Fargo Strategic Income Fund | | | 17 | |
| | | | | | | | | | | | | | | | |
| Security name | | Interest rate | | | Maturity date | | | Principal | | | Value | |
| | | | |
Telecommunication Services: 0.40% | | | | | | | | | | | | | | | | |
| | | | |
| Diversified Telecommunication Services: 0.40% | | | | | | | | | | | | | | | | |
Intelsat Jackson Holdings SA | | | 5.50 | % | | | 8-1-2023 | | | $ | 100,000 | | | $ | 69,250 | |
Intelsat Luxembourg SA | | | 8.13 | | | | 6-1-2023 | | | | 85,000 | | | | 28,688 | |
Virgin Media Finance plc 144A | | | 5.38 | | | | 4-15-2021 | | | | 4,500 | | | | 4,691 | |
| | | | |
| | | | | | | | | | | | | | | 102,629 | |
| | | | | | | | | | | | | | | | |
| | | | |
Utilities: 0.42% | | | | | | | | | | | | | | | | |
| | | | |
| Electric Utilities: 0.42% | | | | | | | | | | | | | | | | |
Comision Federal de Electricidad 144A | | | 6.13 | | | | 6-16-2045 | | | | 100,000 | | | | 107,000 | |
| | | | | | | | | | | | | | | | |
| | | | |
Total Yankee Corporate Bonds and Notes (Cost $1,722,058) | | | | | | | | | | | | | | | 1,648,337 | |
| | | | | | | | | | | | | | | | |
| | | | |
Yankee Government Bonds: 0.88% | | | | | | | | | | | | | | | | |
Republic of Argentina 144A | | | 7.50 | | | | 4-22-2026 | | | | 200,000 | | | | 225,700 | |
| | | | | | | | | | | | | | | | |
| | | | |
Total Yankee Government Bonds (Cost $200,000) | | | | | | | | | | | | | | | 225,700 | |
| | | | | | | | | | | | | | | | |
| | | | |
| | | Yield | | | | | | Shares | | | | |
| Short-Term Investments: 8.11% | | | | | | | | | | | | | | | | |
| | | | |
| Investment Companies: 7.29% | | | | | | | | | | | | | | | | |
Wells Fargo Government Money Market Select Class (l)(u) | | | 0.34 | | | | | | | | 1,867,108 | | | | 1,867,108 | |
| | | | | | | | | | | | | | | | |
| | | | |
| | | | | | | | | Principal | | | | |
| U.S. Treasury Securities: 0.82% | | | | | | | | | | | | | | | | |
U.S. Treasury Bill #(z) | | | 0.33 | | | | 12-15-2016 | | | $ | 210,000 | | | | 209,916 | |
| | | | | | | | | | | | | | | | |
| | | | |
Total Short-Term Investments (Cost $2,076,963) | | | | | | | | | | | | | | | 2,077,024 | |
| | | | | | | | | | | | | | | | |
| | | | | | | | |
| Total investments in securities (Cost $26,152,788) * | | | 101.14 | % | | | 25,891,948 | |
Other assets and liabilities, net | | | (1.14 | ) | | | (292,112 | ) |
| | | | | | | | |
| Total net assets | | | 100.00 | % | | $ | 25,599,836 | |
| | | | | | | | |
| 144A | The security may be resold in transactions exempt from registration, normally to qualified institutional buyers, pursuant to Rule 144A under the Securities Act of 1933. |
| ± | Variable rate investment. The rate shown is the rate in effect at period end. |
| ¥ | A payment-in-kind (PIK) security is a security in which the issuer may make interest or dividend payments in cash or additional securities. These additional securities generally have the same terms as the original holdings. |
| (s) | The security is currently in default with regards to scheduled interest and/or principal payments. The Fund has stopped accruing interest on the security. |
| @ | Foreign bond principal is denominated in the local currency of the issuer. |
| < | All or a portion of the position represents an unfunded loan commitment. |
| (l) | The issuer of the security is an affiliated person of the Fund as defined in the Investment Company Act of 1940. |
| (u) | The rate represents the 7-day annualized yield at period end. |
| # | All or a portion of this security is segregated as collateral for investments in derivative instruments. |
| (z) | Zero coupon security. The rate represents the current yield to maturity. |
| * | Cost for federal income tax purposes is $26,155,608 and unrealized gains (losses) consists of: |
| | | | |
Gross unrealized gains | | $ | 515,621 | |
Gross unrealized losses | | | (779,281 | ) |
| | | | |
Net unrealized losses | | $ | (263,660 | ) |
The accompanying notes are an integral part of these financial statements.
| | | | |
| 18 | | Wells Fargo Strategic Income Fund | | Statement of assets and liabilities—September 30, 2016 |
| | | | |
| | | | |
| |
Assets | | | | |
Investments | | | | |
In unaffiliated securities, at value (cost $24,285,680) | | $ | 24,024,840 | |
In affiliated securities, at value (cost $1,867,108) | | | 1,867,108 | |
| | | | |
Total investments, at value (cost $26,152,788) | | | 25,891,948 | |
Foreign currency, at value (cost $143,273) | | | 143,273 | |
Segregated cash | | | 41,443 | |
Receivable for investments sold | | | 49,341 | |
Receivable for Fund shares sold | | | 941 | |
Receivable for interest | | | 255,218 | |
Receivable for daily variation margin on open futures contracts | | | 21,906 | |
Unrealized gains on forward foreign currency contracts | | | 7,020 | |
Receivable from manager | | | 12,742 | |
Prepaid expenses and other assets | | | 26,053 | |
| | | | |
Total assets | | | 26,449,885 | |
| | | | |
| |
Liabilities | | | | |
Payable for investments purchased | | | 728,228 | |
Payable for Fund shares redeemed | | | 24,113 | |
Due to custodian bank | | | 13,831 | |
Unrealized losses on forward foreign currency contracts | | | 57,120 | |
Payable for daily variation margin on open futures contracts | | | 4,313 | |
Distribution fee payable | | | 498 | |
Administration fees payable | | | 1,932 | |
Accrued expenses and other liabilities | | | 20,014 | |
| | | | |
Total liabilities | | | 850,049 | |
| | | | |
Total net assets | | $ | 25,599,836 | |
| | | | |
| |
NET ASSETS CONSIST OF | | | | |
Paid-in capital | | $ | 27,534,402 | |
Undistributed net investment income | | | 49,038 | |
Accumulated net realized losses on investments | | | (1,659,650 | ) |
Net unrealized losses on investments | | | (323,954 | ) |
| | | | |
Total net assets | | $ | 25,599,836 | |
| | | | |
| |
COMPUTATION OF NET ASSET VALUE AND OFFERING PRICE PER SHARE | | | | |
Net assets – Class A | | $ | 1,046,833 | |
Shares outstanding – Class A1 | | | 113,193 | |
Net asset value per share – Class A | | | $9.25 | |
Maximum offering price per share – Class A2 | | | $9.64 | |
Net assets – Class C | | $ | 765,914 | |
Shares outstanding – Class C1 | | | 83,095 | |
Net asset value per share – Class C | | | $9.22 | |
Net assets – Administrator Class | | $ | 596,889 | |
Shares outstanding – Administrator Class1 | | | 64,276 | |
Net asset value per share – Administrator Class | | | $9.29 | |
Net assets – Institutional Class | | $ | 23,190,200 | |
Shares outstanding – Institutional Class1 | | | 2,508,445 | |
Net asset value per share – Institutional Class | | | $9.24 | |
| 1 | The Fund has an unlimited number of authorized shares. |
| 2 | Maximum offering price is computed as 100/96 of net asset value. On investments of $50,000 or more, the offering price is reduced. |
The accompanying notes are an integral part of these financial statements.
| | | | | | |
| Statements of operations | | Wells Fargo Strategic Income Fund | | | 19 | |
| | | | | | | | |
| | | Year ended
September 30, 20161 | | | Year ended
October 31, 2015 | |
| | |
Investment income | | | | | | | | |
Interest (net of foreign interest withholding taxes of $10,670 and $2,760, respectively) | | $ | 1,022,952 | | | $ | 1,523,963 | |
Income from affiliated securities | | | 7,157 | | | | 2,341 | |
Securities lending income, net | | | 924 | | | | 352 | |
| | | | |
Total investment income | | | 1,031,033 | | | | 1,526,656 | |
| | | | |
| | |
Expenses | | | | | | | | |
Management fee | | | 113,817 | | | | 172,383 | |
Administration fees | | | | | | | | |
Class A | | | 1,391 | | | | 1,481 | |
Class C | | | 1,070 | | | | 1,184 | |
Administrator Class | | | 466 | | | | 522 | |
Institutional Class | | | 15,740 | | | | 24,518 | |
Shareholder servicing fees | | | | | | | | |
Class A | | | 2,173 | | | | 2,314 | |
Class C | | | 1,672 | | | | 1,850 | |
Administrator Class | | | 1,166 | | | | 1,305 | |
Distribution fee | | | | | | | | |
Class C | | | 5,014 | | | | 5,549 | |
Custody and accounting fees | | | 29,995 | | | | 33,480 | |
Professional fees | | | 48,967 | | | | 51,018 | |
Registration fees | | | 56,229 | | | | 60,961 | |
Shareholder report expenses | | | 30,205 | | | | 15,165 | |
Trustees’ fees and expenses | | | 13,747 | | | | 24,839 | |
Other fees and expenses | | | 6,851 | | | | 9,087 | |
| | | | |
Total expenses | | | 328,503 | | | | 405,656 | |
Less: Fee waivers and/or expense reimbursements | | | (188,099 | ) | | | (196,175 | ) |
| | | | |
Net expenses | | | 140,404 | | | | 209,481 | |
| | | | |
Net investment income | | | 890,629 | | | | 1,317,175 | |
| | | | |
| | |
REALIZED AND UNREALIZED GAINS (LOSSES) ON INVESTMENTS | | | | | | | | |
| | |
Net realized gains (losses) on: | | | | | | | | |
Unaffiliated securities | | | (422,626 | ) | | | (1,424,645 | ) |
Futures transactions | | | (312,731 | ) | | | (614,950 | ) |
Forward foreign currency contract transactions | | | (176,269 | ) | | | 740,294 | |
Credit default swap transactions | | | (7,531 | ) | | | 2,320 | |
| | | | |
Net realized losses on investments | | | (919,157 | ) | | | (1,296,981 | ) |
| | | | |
| | |
Net change in unrealized gains (losses) on: | | | | | | | | |
Unaffiliated securities | | | 1,065,406 | | | | (606,214 | ) |
Futures transactions | | | (70,666 | ) | | | 169,920 | |
Forward foreign currency contract transactions | | | (5,202 | ) | | | (231,831 | ) |
Credit default swap transactions | | | (1,436 | ) | | | 1,436 | |
| | | | |
Net change in unrealized gains (losses) on investments | | | 988,102 | | | | (666,689 | ) |
| | | | |
Net realized and unrealized gains (losses) on investments | | | 68,945 | | | | (1,963,670 | ) |
| | | | |
Net increase (decrease) in net assets resulting from operations | | $ | 959,574 | | | $ | (646,495 | ) |
| | | | |
| 1 | For the eleven months ended September 30, 2016. The Fund changed its fiscal year end from October 31 to September 30, effective September 30, 2016. |
The accompanying notes are an integral part of these financial statements.
| | | | |
| 20 | | Wells Fargo Strategic Income Fund | | Statements of changes in net assets |
| | | | | | | | | | | | | | | | | | | | | | | | |
| | | Year ended
September 30, 20161 | | | Year ended
October 31, 2015 | | | Year ended
October 31, 2014 | |
| | | | | | |
Operations | | | | | | | | | | | | | | | | | | | | | | | | |
Net investment income | | | | | | $ | 890,629 | | | | | | | $ | 1,317,175 | | | | | | | $ | 1,331,266 | |
Net realized losses on investments | | | | | | | (919,157 | ) | | | | | | | (1,296,981 | ) | | | | | | | (982,908 | ) |
Net change in unrealized gains (losses) on investments | | | | | | | 988,102 | | | | | | | | (666,689 | ) | | | | | | | 537,097 | |
| | | | |
Net increase (decrease) in net assets resulting from operations | | | | | | | 959,574 | | | | | | | | (646,495 | ) | | | | | | | 885,455 | |
| | | | |
| | | | | | |
Distributions to shareholders from | | | | | | | | | | | | | | | | | | | | | | | | |
Net investment income | | | | | | | | | | | | | | | | | | | | | | | | |
Class A | | | | | | | (13,014 | ) | | | | | | | (21,334 | ) | | | | | | | (15,762 | ) |
Class C | | | | | | | (6,442 | ) | | | | | | | (14,917 | ) | | | | | | | (13,400 | ) |
Administrator Class | | | | | | | (7,355 | ) | | | | | | | (12,399 | ) | | | | | | | (13,793 | ) |
Institutional Class | | | | | | | (365,738 | ) | | | | | | | (935,496 | ) | | | | | | | (852,736 | ) |
Tax basis return of capital | | | | | | | | | | | | | | | | | | | | | | | | |
Class A | | | | | | | (5,130 | ) | | | | | | | (2,416 | ) | | | | | | | 0 | |
Class C | | | | | | | (2,540 | ) | | | | | | | (1,689 | ) | | | | | | | 0 | |
Administrator Class | | | | | | | (2,900 | ) | | | | | | | (1,404 | ) | | | | | | | 0 | |
Institutional Class | | | | | | | (144,185 | ) | | | | | | | (105,941 | ) | | | | | | | 0 | |
| | | | |
Total distributions to shareholders | | | | | | | (547,304 | ) | | | | | | | (1,095,596 | ) | | | | | | | (895,691 | ) |
| | | | |
| | | | | | |
Capital share transactions | | | Shares | | | | | | | | Shares | | | | | | | | Shares | | | | | |
Proceeds from shares sold | | | | | | | | | | | | | | | | | | | | | | | | |
Class A | | | 117,382 | | | | 1,055,716 | | | | 44,768 | | | | 426,513 | | | | 22,517 | | | | 217,023 | |
Class C | | | 12,099 | | | | 109,873 | | | | 5,907 | | | | 55,667 | | | | 46,130 | | | | 444,536 | |
Administrator Class | | | 9,037 | | | | 83,300 | | | | 0 | | | | 0 | | | | 4,115 | | | | 40,000 | |
Institutional Class | | | 621,194 | | | | 5,533,801 | | | | 190,379 | | | | 1,736,500 | | | | 1,475,076 | | | | 14,500,000 | |
| | | | |
| | | | | | | 6,782,690 | | | | | | | | 2,218,680 | | | | | | | | 15,201,559 | |
| | | | |
Reinvestment of distributions | | | | | | | | | | | | | | | | | | | | | | | | |
Class A | | | 1,995 | | | | 17,957 | | | | 2,260 | | | | 21,553 | | | | 1,619 | | | | 15,592 | |
Class C | | | 979 | | | | 8,774 | | | | 1,740 | | | | 16,606 | | | | 1,394 | | | | 13,400 | |
Administrator Class | | | 1,137 | | | | 10,255 | | | | 1,443 | | | | 13,803 | | | | 1,431 | | | | 13,793 | |
Institutional Class | | | 56,806 | | | | 509,923 | | | | 109,213 | | | | 1,041,437 | | | | 88,370 | | | | 852,736 | |
| | | | |
| | | | | | | 546,909 | | | | | | | | 1,093,399 | | | | | | | | 895,521 | |
| | | | |
Payment for shares redeemed | | | | | | | | | | | | | | | | | | | | | | | | |
Class A | | | (107,748 | ) | | | (971,689 | ) | | | (18,900 | ) | | | (178,898 | ) | | | (4,382 | ) | | | (42,882 | ) |
Class C | | | (8,141 | ) | | | (73,072 | ) | | | (15,520 | ) | | | (148,738 | ) | | | (15,103 | ) | | | (147,854 | ) |
Administrator Class | | | (14 | ) | | | (129 | ) | | | (4,192 | ) | | | (39,990 | ) | | | 0 | | | | 0 | |
Institutional Class | | | (90,476 | ) | | | (795,724 | ) | | | (2,358,709 | ) | | | (22,270,242 | ) | | | 0 | | | | 0 | |
| | | | |
| | | | | | | (1,840,614 | ) | | | | | | | (22,637,868 | ) | | | | | | | (190,736 | ) |
| | | | |
Net increase (decrease) in net assets resulting from capital share transactions | | | | | | | 5,488,985 | | | | | | | | (19,325,789 | ) | | | | | | | 15,906,344 | |
| | | | |
Total increase (decrease) in net assets | | | | | | | 5,901,255 | | | | | | | | (21,067,880 | ) | | | | | | | 15,896,108 | |
| | | | |
| | | | | | |
Net assets | | | | | | | | | | | | | | | | | | | | | | | | |
Beginning of period | | | | | | | 19,698,581 | | | | | | | | 40,766,461 | | | | | | | | 24,870,353 | |
| | | | |
End of period | | | | | | $ | 25,599,836 | | | | | | | $ | 19,698,581 | | | | | | | $ | 40,766,461 | |
| | | | |
Undistributed net investment income | | | | | | $ | 49,038 | | | | | | | $ | 44,882 | | | | | | | $ | 164,697 | |
| | | | |
| 1 | For the eleven months ended September 30, 2016. The Fund changed its fiscal year end from October 31 to September 30, effective September 31, 2016. |
The accompanying notes are an integral part of these financial statements.
| | | | | | |
| Financial highlights | | Wells Fargo Strategic Income Fund | | | 21 | |
(For a share outstanding throughout each period)
| | | | | | | | | | | | | | | | |
| | | Year ended September 30, 20161 | | | Year ended October 31 | |
| CLASS A | | | 2015 | | | 2014 | | | 20132 | |
Net asset value, beginning of period | | | $9.13 | | | | $9.72 | | | | $9.66 | | | | $10.00 | |
Net investment income | | | 0.31 | | | | 0.34 | | | | 0.37 | | | | 0.27 | |
Net realized and unrealized gains (losses) on investments | | | (0.01 | ) | | | (0.69 | ) | | | (0.05 | ) | | | (0.36 | ) |
| | | | | | | | | | | | | | | | |
Total from investment operations | | | 0.30 | | | | (0.35 | ) | | | 0.32 | | | | (0.09 | ) |
Distributions to shareholders from | | | | | | | | | | | | | | | | |
Net investment income | | | (0.13 | ) | | | (0.22 | ) | | | (0.26 | ) | | | (0.25 | ) |
Tax basis return of capital | | | (0.05 | ) | | | (0.02 | ) | | | 0.00 | | | | 0.00 | |
| | | | | | | | | | | | | | | | |
Total distributions to shareholders | | | (0.18 | ) | | | (0.24 | ) | | | (0.26 | ) | | | (0.25 | ) |
Net asset value, end of period | | | $9.25 | | | | $9.13 | | | | $9.72 | | | | $9.66 | |
Total return3 | | | 3.34 | % | | | (3.64 | )% | | | 3.36 | % | | | (0.89 | )% |
Ratios to average net assets (annualized) | | | | | | | | | | | | | | | | |
Gross expenses | | | 1.80 | % | | | 1.63 | % | | | 1.51 | % | | | 1.85 | % |
Net expenses | | | 0.90 | % | | | 0.90 | % | | | 0.90 | % | | | 0.90 | % |
Net investment income | | | 3.85 | % | | | 3.77 | % | | | 4.02 | % | | | 3.76 | % |
Supplemental data | | | | | | | | | | | | | | | | |
Portfolio turnover rate | | | 52 | % | | | 53 | % | | | 51 | % | | | 39 | % |
Net assets, end of period (000s omitted) | | | $1,047 | | | | $928 | | | | $714 | | | | $518 | |
| 1 | For the eleven months ended September 30, 2016. The Fund changed its fiscal year end from October 31 to September 30, effective September 31, 2016. |
| 2 | For the period from January 31, 2013 (commencement of class operations) to October 31, 2013 |
| 3 | Total return calculations do not include any sales charges. Returns for periods of less than one year are not annualized. |
The accompanying notes are an integral part of these financial statements.
| | | | |
| 22 | | Wells Fargo Strategic Income Fund | | Financial highlights |
(For a share outstanding throughout each period)
| | | | | | | | | | | | | | | | |
| | | Year ended September 30, 20161 | | | Year ended October 31 | |
| CLASS C | | | 2015 | | | 2014 | | | 20132 | |
Net asset value, beginning of period | | | $9.10 | | | | $9.71 | | | | $9.65 | | | | $10.00 | |
Net investment income | | | 0.25 | | | | 0.28 | | | | 0.31 | | | | 0.21 | |
Net realized and unrealized gains (losses) on investments | | | (0.02 | ) | | | (0.68 | ) | | | (0.06 | ) | | | (0.37 | ) |
| | | | | | | | | | | | | | | | |
Total from investment operations | | | 0.23 | | | | (0.40 | ) | | | 0.25 | | | | (0.16 | ) |
Distributions to shareholders from | | | | | | | | | | | | | | | | |
Net investment income | | | (0.08 | ) | | | (0.19 | ) | | | (0.19 | ) | | | (0.19 | ) |
Tax basis return of capital | | | (0.03 | ) | | | (0.02 | ) | | | 0.00 | | | | 0.00 | |
| | | | | | | | | | | | | | | | |
Total distributions to shareholders | | | (0.11 | ) | | | (0.21 | ) | | | (0.19 | ) | | | (0.19 | ) |
Net asset value, end of period | | | $9.22 | | | | $9.10 | | | | $9.71 | | | | $9.65 | |
Total return3 | | | 2.67 | % | | | (4.35 | )% | | | 2.61 | % | | | (1.51 | )% |
Ratios to average net assets (annualized) | | | | | | | | | | | | | | | | |
Gross expenses | | | 2.54 | % | | | 2.37 | % | | | 2.25 | % | | | 2.60 | % |
Net expenses | | | 1.65 | % | | | 1.65 | % | | | 1.65 | % | | | 1.65 | % |
Net investment income | | | 3.10 | % | | | 3.02 | % | | | 3.25 | % | | | 3.01 | % |
Supplemental data | | | | | | | | | | | | | | | | |
Portfolio turnover rate | | | 52 | % | | | 53 | % | | | 51 | % | | | 39 | % |
Net assets, end of period (000s omitted) | | | $766 | | | | $711 | | | | $835 | | | | $518 | |
| 1 | For the eleven months ended September 30, 2016. The Fund changed its fiscal year end from October 31 to September 30, effective September 31, 2016. |
| 2 | For the period from January 31, 2013 (commencement of class operations) to October 31, 2013 |
| 3 | Total return calculations do not include any sales charges. Returns for periods of less than one year are not annualized. |
The accompanying notes are an integral part of these financial statements.
| | | | | | |
| Financial highlights | | Wells Fargo Strategic Income Fund | | | 23 | |
(For a share outstanding throughout each period)
| | | | | | | | | | | | | | | | |
| | | Year ended September 30, 20161 | | | Year ended October 31 | |
| ADMINISTRATOR CLASS | | | 2015 | | | 2014 | | | 20132 | |
Net asset value, beginning of period | | | $9.16 | | | | $9.74 | | | | $9.66 | | | | $10.00 | |
Net investment income | | | 0.33 | 3 | | | 0.37 | | | | 0.39 | | | | 0.28 | |
Net realized and unrealized gains (losses) on investments | | | (0.01 | ) | | | (0.70 | ) | | | (0.05 | ) | | | (0.37 | ) |
| | | | | | | | | | | | | | | | |
Total from investment operations | | | 0.32 | | | | (0.33 | ) | | | 0.34 | | | | (0.09 | ) |
Distributions to shareholders from | | | | | | | | | | | | | | | | |
Net investment income | | | (0.14 | ) | | | (0.22 | ) | | | (0.26 | ) | | | (0.25 | ) |
Tax basis return of capital | | | (0.05 | ) | | | (0.03 | ) | | | 0.00 | | | | 0.00 | |
| | | | | | | | | | | | | | | | |
Total distributions to shareholders | | | (0.19 | ) | | | (0.25 | ) | | | (0.26 | ) | | | (0.25 | ) |
Net asset value, end of period | | | $9.29 | | | | $9.16 | | | | $9.74 | | | | $9.66 | |
Total return4 | | | 3.52 | % | | | (3.51 | )% | | | 3.63 | % | | | (0.85 | )% |
Ratios to average net assets (annualized) | | | | | | | | | | | | | | | | |
Gross expenses | | | 1.74 | % | | | 1.56 | % | | | 1.46 | % | | | 1.79 | % |
Net expenses | | | 0.75 | % | | | 0.75 | % | | | 0.75 | % | | | 0.75 | % |
Net investment income | | | 4.00 | % | | | 3.92 | % | | | 4.18 | % | | | 3.90 | % |
Supplemental data | | | | | | | | | | | | | | | | |
Portfolio turnover rate | | | 52 | % | | | 53 | % | | | 51 | % | | | 39 | % |
Net assets, end of period (000s omitted) | | | $597 | | | | $496 | | | | $554 | | | | $496 | |
| 1 | For the eleven months ended September 30, 2016. The Fund changed its fiscal year end from October 31 to September 30, effective September 31, 2016. |
| 2 | For the period from January 31, 2013 (commencement of class operations) to October 31, 2013 |
| 3 | Calculated based upon average shares outstanding |
| 4 | Returns for periods of less than one year are not annualized. |
The accompanying notes are an integral part of these financial statements.
| | | | |
| 24 | | Wells Fargo Strategic Income Fund | | Financial highlights |
(For a share outstanding throughout each period)
| | | | | | | | | | | | | | | | |
| | | Year ended September 30, 20161 | | | Year ended October 31 | |
| INSTITUTIONAL CLASS | | | 2015 | | | 2014 | | | 20132 | |
Net asset value, beginning of period | | | $9.14 | | | | $9.71 | | | | $9.66 | | | | $10.00 | |
Net investment income | | | 0.34 | | | | 0.40 | | | | 0.41 | 3 | | | 0.29 | |
Net realized and unrealized gains (losses) on investments | | | (0.02 | ) | | | (0.71 | ) | | | (0.07 | ) | | | (0.36 | ) |
| | | | | | | | | | | | | | | | |
Total from investment operations | | | 0.32 | | | | (0.31 | ) | | | 0.34 | | | | (0.07 | ) |
Distributions to shareholders from | | | | | | | | | | | | | | | | |
Net investment income | | | (0.16 | ) | | | (0.23 | ) | | | (0.29 | ) | | | (0.27 | ) |
Tax basis return of capital | | | (0.06 | ) | | | (0.03 | ) | | | 0.00 | | | | 0.00 | |
| | | | | | | | | | | | | | | | |
Total distributions to shareholders | | | (0.22 | ) | | | (0.26 | ) | | | (0.29 | ) | | | (0.27 | ) |
Net asset value, end of period | | | $9.24 | | | | $9.14 | | | | $9.71 | | | | $9.66 | |
Total return4 | | | 3.55 | % | | | (3.28 | )% | | | 3.60 | % | | | (0.66 | )% |
Ratios to average net assets (annualized) | | | | | | | | | | | | | | | | |
Gross expenses | | | 1.46 | % | | | 1.19 | % | | | 1.14 | % | | | 1.52 | % |
Net expenses | | | 0.60 | % | | | 0.60 | % | | | 0.60 | % | | | 0.60 | % |
Net investment income | | | 4.16 | % | | | 4.04 | % | | | 4.25 | % | | | 4.05 | % |
Supplemental data | | | | | | | | | | | | | | | | |
Portfolio turnover rate | | | 52 | % | | | 53 | % | | | 51 | % | | | 39 | % |
Net assets, end of period (000s omitted) | | | $23,190 | | | | $17,564 | | | | $38,664 | | | | $23,338 | |
| 1 | For the eleven months ended September 30, 2016. The Fund changed its fiscal year end from October 31 to September 30, effective September 31, 2016. |
| 2 | For the period from January 31, 2013 (commencement of class operations) to October 31, 2013 |
| 3 | Calculated based upon average shares outstanding |
| 4 | Returns for periods of less than one year are not annualized. |
The accompanying notes are an integral part of these financial statements.
| | | | | | |
| Notes to financial statements | | Wells Fargo Strategic Income Fund | | | 25 | |
1. ORGANIZATION
Wells Fargo Funds Trust (the “Trust”), a Delaware statutory trust organized on March 10, 1999, is an open-end management investment company registered under the Investment Company Act of 1940, as amended (the “1940 Act”). As an investment company, the Trust follows the accounting and reporting guidance in Financial Accounting Standards Board (“FASB”) Accounting Standards Codification Topic 946, Financial Services – Investment Companies. These financial statements report on the Wells Fargo Strategic Income Fund (the “Fund”) which is a diversified series of the Trust.
2. SIGNIFICANT ACCOUNTING POLICIES
The following significant accounting policies, which are consistently followed in the preparation of the financial statements of the Fund, are in conformity with U.S. generally accepted accounting principles which require management to make estimates and assumptions that affect the reported amounts of assets and liabilities, disclosure of contingent assets and liabilities at the date of the financial statements, and the reported amounts of revenues and expenses during the reporting period. Actual results could differ from those estimates.
Securities valuation
All investments are valued each business day as of the close of regular trading on the New York Stock Exchange (generally 4 p.m. Eastern Time), although the Fund may deviate from this calculation time under unusual or unexpected circumstances.
Debt securities are valued at the evaluated bid price provided by an independent pricing service or, if a reliable price is not available, the quoted bid price from an independent broker-dealer.
Futures that are listed on a foreign or domestic exchange or market are valued at the official closing price or, if none, the last sales price.
Non-listed swaps are valued at the evaluated price provided by an independent pricing service or, if a reliable price is not available, the quoted bid price from an independent broker-dealer.
The values of securities denominated in foreign currencies are translated into U.S. dollars at rates provided by an independent foreign currency pricing source at a time each business day specified by the Management Valuation Team of Wells Fargo Funds Management, LLC (“Funds Management”).
Investments in registered open-end investment companies are valued at net asset value. Interests in non-registered investment vehicles that are redeemable at net asset value are fair valued normally at net asset value.
Investments which are not valued using any of the methods discussed above are valued at their fair value, as determined in good faith by the Board of Trustees of the Fund. The Board of Trustees has established a Valuation Committee comprised of the Trustees and has delegated to it the authority to take any actions regarding the valuation of portfolio securities that the Valuation Committee deems necessary or appropriate, including determining the fair value of portfolio securities, unless the determination has been delegated to the Management Valuation Team. The Board of Trustees retains the authority to make or ratify any valuation decisions or approve any changes to the Valuation Procedures as it deems appropriate. On a quarterly basis, the Board of Trustees receives reports on any valuation actions taken by the Valuation Committee or the Management Valuation Team which may include items for ratification.
Valuations of fair valued securities are compared to the next actual sales price when available, or other appropriate market values, to assess the continued appropriateness of the fair valuation methodologies used. These securities are fair valued on a day-to-day basis, taking into consideration changes to appropriate market information and any significant changes to the inputs considered in the valuation process until there is a readily available price provided on an exchange or by an independent pricing service. Valuations received from an independent pricing service or independent broker-dealer quotes are periodically validated by comparisons to most recent trades and valuations provided by other independent pricing services in addition to the review of prices by the manager and/or subadviser. Unobservable inputs used in determining fair valuations are identified based on the type of security, taking into consideration factors utilized by market participants in valuing the investment, knowledge about the issuer and the current market environment.
Foreign currency translation
The accounting records of the Fund are maintained in U.S. dollars. The values of other assets and liabilities denominated in foreign currencies are translated into U.S. dollars at rates provided by an independent foreign currency pricing source at a time each business day specified by the Management Valuation Team. Purchases and sales of securities, and income and expenses are converted at the rate of exchange on the respective dates of such transactions. Net realized foreign exchange gains or losses arise from sales of foreign currencies, currency gains or losses realized between the trade and
| | | | |
| 26 | | Wells Fargo Strategic Income Fund | | Notes to financial statements |
settlement dates on securities transactions, and the difference between the amounts of dividends, interest and foreign withholding taxes recorded and the U.S. dollar equivalent of the amounts actually paid or received. Net unrealized foreign exchange gains and losses arise from changes in the fair value of assets and liabilities other than investments in securities resulting from changes in exchange rates. The changes in net assets arising from changes in exchange rates and the changes in net assets resulting from changes in market prices of securities are not separately presented. Such changes are included in net realized and unrealized gains or losses from investments.
Forward foreign currency contracts
The Fund is subject to foreign currency exchange rate risk in the normal course of pursuing its investment objectives. A forward foreign currency contract is an agreement between two parties to purchase or sell a specific currency for an agreed-upon price at a future date. The Fund enters into forward foreign currency contracts to facilitate transactions in foreign-denominated securities and to attempt to minimize the risk to the Fund from adverse changes in the relationship between currencies. Forward foreign currency contracts are recorded at the forward rate and marked-to-market daily. When the contracts are closed, realized gains and losses arising from such transactions are recorded as realized gains or losses on forward foreign currency contract transactions. The Fund could be exposed to risks if the counterparties to the contracts are unable to meet the terms of their contracts or if the value of the foreign currency changes unfavorably. The Fund’s maximum risk of loss from counterparty credit risk is the unrealized gains on the contracts. This risk may be mitigated if there is a master netting arrangement between the Fund and the counterparty.
Security loans
The Fund may lend its securities from time to time in order to earn additional income in the form of fees or interest on securities received as collateral or the investment of any cash received as collateral. The Fund continues to receive interest or dividends on the securities loaned. The Fund receives collateral in the form of cash or securities with a value at least equal to the value of the securities on loan. The value of the loaned securities is determined at the close of each business day and any additional required collateral is delivered to the Fund on the next business day. In a securities lending transaction, the net asset value of the Fund will be affected by an increase or decrease in the value of the securities loaned and by an increase or decrease in the value of the instrument in which collateral is invested. The amount of securities lending activity undertaken by the Fund fluctuates from time to time. In the event of default or bankruptcy by the borrower, the Fund may be prevented from recovering the loaned securities or gaining access to the collateral or may experience delays or costs in doing so. In addition, the investment of any cash collateral received may lose all or part of its value. The Fund has the right under the lending agreement to recover the securities from the borrower on demand.
The Fund lends its securities through an unaffiliated securities lending agent. Cash collateral received in connection with its securities lending transactions is invested in Securities Lending Cash Investments, LLC (the “Securities Lending Fund”). The Securities Lending Fund is exempt from registration under Section 3(c)(7) of the 1940 Act and is managed by Funds Management and is subadvised by Wells Capital Management Incorporated (“WellsCap”), an affiliate of Funds Management and an indirect wholly owned subsidiary of Wells Fargo & Company (“Wells Fargo”). Funds Management receives an advisory fee starting at 0.05% and declining to 0.01% as the average daily net assets of the Securities Lending Fund increase. All of the fees received by Funds Management are paid to WellsCap for its services as subadviser. The Securities Lending Fund seeks to provide a positive return compared to the daily Fed Funds Open rate by investing in high-quality, U.S. dollar-denominated short-term money market instruments. Securities Lending Fund investments are fair valued based upon the amortized cost valuation technique. Income earned from investment in the Securities Lending Fund is included in securities lending income on the Statement of Operations.
When-issued transactions
The Fund may purchase securities on a forward commitment or when-issued basis. The Fund records a when-issued transaction on the trade date and will segregate assets in an amount at least equal in value to the Fund’s commitment to purchase when-issued securities. Securities purchased on a when-issued basis are marked-to-market daily and the Fund begins earning interest on the settlement date. Losses may arise due to changes in the market value of the underlying securities or if the counterparty does not perform under the contract.
Loans
The Fund may invest in direct debt instruments which are interests in amounts owed to lenders by corporate or other borrowers. The loans pay interest at rates which are periodically reset by reference to a base lending rate plus a spread. Investments in loans may be in the form of participations in loans or assignments of all or a portion of loans from third parties. When the Fund purchases participations, it generally has no rights to enforce compliance with terms of the loan agreement with the borrower. As a result, the Fund assumes the credit risk of both the borrower and the lender that is selling the participation. When the Fund purchases assignments from lenders, it acquires direct rights against the
| | | | | | |
| Notes to financial statements | | Wells Fargo Strategic Income Fund | | | 27 | |
borrower on the loan and may enforce compliance by the borrower with the terms of the loan agreement. Loans may include fully funded term loans or unfunded loan commitments, which are contractual obligations for future funding.
Futures contracts
The Fund is subject to interest rate risk in the normal course of pursuing its investment objectives. The Fund may buy and sell futures contracts in order to gain exposure to, or protect against, changes in security values and interest rates. The primary risks associated with the use of futures contracts are the imperfect correlation between changes in market values of securities held by the Fund and the prices of futures contracts, and the possibility of an illiquid market.
The aggregate principal amounts of the contracts are not recorded in the financial statements. Fluctuations in the value of the contracts are recorded in the Statement of Assets and Liabilities as an asset or liability and in the Statement of Operations as unrealized gains or losses until the contracts are closed, at which point they are recorded as net realized gains or losses on futures contracts. With futures contracts, there is minimal counterparty risk to the Fund since futures are exchange traded and the exchange’s clearinghouse, as counterparty to all exchange traded futures, guarantees the futures against default.
Credit default swaps
The Fund is subject to credit risk in the normal course of pursuing its investment objectives. The Fund may enter into credit default swap contracts for hedging or speculative purposes to provide or receive a measure of protection against default on a referenced entity, obligation or index or for investment gains. Credit default swaps involve an exchange of a stream of payments for protection against the loss in value of an underlying security or index. Under the terms of the swap, one party acts as a guarantor (referred to as the seller of protection) and receives a periodic stream of payments, provided that there is no credit event, from another party (referred to as the buyer of protection) that is a fixed percentage applied to a notional principal amount over the term of the swap. An index credit default swap references all the names in the index, and if a credit event is triggered, the credit event is settled based on that name’s weight in the index. A credit event includes bankruptcy, failure to pay, obligation default, obligation acceleration, repudiation/moratorium, and restructuring. The Fund may enter into credit default swaps as either the seller of protection or the buyer of protection. As the seller of protection, the Fund is subject to investment exposure on the notional amount of the swap and has assumed the risk of default of the underlying security or index. As the buyer of protection, the Fund could be exposed to risks if the seller of the protection defaults on its obligation to perform, or if there are unfavorable changes in the fluctuation of interest rates. The maximum potential amount of future payments (undiscounted) that the Fund as the seller of protection could be required to make under the credit default swap contract would be an amount equal to the notional amount of the swap contract. The Fund’s maximum risk of loss from counterparty risk, either as the protection seller or as the protection buyer, is the fair value of the contract. This risk is mitigated by having a master netting arrangement between the Fund and the counterparty and by having the counterparty post collateral to cover the Fund’s exposure to the counterparty.
If the Fund is the seller of protection and a credit event occurs, as defined under the terms of that particular swap agreement, the Fund will pay to the buyer of protection the notional amount of the swap and take delivery of the referenced obligation or underlying securities comprising the referenced index. If the Fund is the buyer of protection and a credit event occurs, as defined under the terms of that particular swap agreement, the Fund will receive from the seller of protection the notional amount of the swap and deliver the referenced obligation or underlying securities comprising the referenced index.
Any premiums paid or received on the transactions are recorded as an asset or liability on the Statement of Assets and Liabilities and amortized. The value of the swap contract is marked-to-market daily based on quotations from an independent pricing service or an independent broker-dealer and any change in value is recorded as an unrealized gain or loss. Periodic payments made or received are recorded as realized gains or losses. In addition, payments received or made as a result of a credit event or termination of the contract are recognized as realized gains or losses.
Certain credit default swap contracts entered into by the Fund provide for conditions that result in events of default or termination that enable the counterparty to the agreement to cause an early termination of the transactions under those agreements.
Security transactions and income recognition
Securities transactions are recorded on a trade date basis. Realized gains or losses are recorded on the basis of identified cost.
Interest income is accrued daily and bond discounts are accreted and premiums are amortized daily based on the effective interest method. To the extent debt obligations are placed on non-accrual status, any related interest income
| | | | |
| 28 | | Wells Fargo Strategic Income Fund | | Notes to financial statements |
may be reduced by writing off interest receivables when the collection of all or a portion of interest has become doubtful based on consistently applied procedures. If the issuer subsequently resumes interest payments or when the collectability of interest is reasonably assured, the debt obligation is removed from non-accrual status.
Income from foreign securities is recorded net of foreign taxes withheld where recovery of such taxes is not assured.
Distributions to shareholders
Distributions to shareholders from net investment income and net realized gains, if any, are recorded on the ex-dividend date. Such distributions are determined in conformity with federal income tax regulations, which may differ in amount or character from net investment income and realized gains recognized for purposes of U.S. generally accepted accounting principles.
Federal and other taxes
The Fund intends to continue to qualify as a regulated investment company by distributing substantially all of its investment company taxable income and any net realized capital gains (after reduction for capital loss carryforwards) sufficient to relieve it from all, or substantially all, federal income taxes. Accordingly, no provision for federal income taxes was required.
The Fund’s income and federal excise tax returns and all financial records supporting those returns for the prior three fiscal years are subject to examination by the federal and Delaware revenue authorities. Management has analyzed the Fund’s tax positions taken on federal, state, and foreign tax returns for all open tax years and does not believe that there are any uncertain tax positions that require recognition of a tax liability.
Reclassifications are made to the Fund’s capital accounts for permanent tax differences to reflect income and gains available for distribution (or available capital loss carryforwards) under federal income tax regulations. U.S. generally accepted accounting principles require that certain components of net assets be adjusted to reflect permanent differences between financial and tax reporting. These reclassifications have no effect on net assets or net asset values per share. The primary permanent differences causing such reclassifications are due to foreign currency transactions and swap transactions. At September 30, 2016, as a result of permanent book-to-tax differences, the following reclassification adjustments were made on the Statement of Assets and Liabilities:
| | |
Undistributed net
investment income | | Accumulated net
realized losses
on investments |
| $(493,924) | | $493,924 |
As of September 30, 2016, the Fund had capital loss carryforwards which consist of $588,918 in short-term capital losses and $1,081,979 in long-term capital losses.
Class allocations
The separate classes of shares offered by the Fund differ principally in applicable sales charges, distribution, shareholder servicing, and administration fees. Class specific expenses are charged directly to that share class. Investment income, common expenses, and realized and unrealized gains (losses) on investments are allocated daily to each class of shares based on the relative proportion of net assets of each class.
3. FAIR VALUATION MEASUREMENTS
Fair value measurements of investments are determined within a framework that has established a fair value hierarchy based upon the various data inputs utilized in determining the value of the Fund’s investments. The three-level hierarchy gives the highest priority to unadjusted quoted prices in active markets for identical assets or liabilities (Level 1) and the lowest priority to significant unobservable inputs (Level 3). The Fund’s investments are classified within the fair value hierarchy based on the lowest level of input that is significant to the fair value measurement. The inputs are summarized into three broad levels as follows:
| ∎ | | Level 1 – quoted prices in active markets for identical securities |
| ∎ | | Level 2 – other significant observable inputs (including quoted prices for similar securities, interest rates, prepayment speeds, credit risk, use of amortized cost, etc.) |
| ∎ | | Level 3 – significant unobservable inputs (including the Fund’s own assumptions in determining the fair value of investments) |
| | | | | | |
| Notes to financial statements | | Wells Fargo Strategic Income Fund | | | 29 | |
The inputs or methodologies used for valuing investments in securities are not necessarily an indication of the risk associated with investing in those securities.
The following is a summary of the inputs used in valuing the Fund’s assets and liabilities as of September 30, 2016:
| | | | | | | | | | | | | | | | |
| | | Quoted prices (Level 1) | | | Other significant observable inputs (Level 2) | | | Significant unobservable inputs (Level 3) | | | Total | |
Assets | | | | | | | | | | | | | | | | |
Investments in: | | | | | | | | | | | | | | | | |
| | | | |
Asset-backed securities | | $ | 0 | | | $ | 1,460,788 | | | $ | 0 | | | $ | 1,460,788 | |
| | | | |
Corporate bonds and notes | | | 0 | | | | 9,373,641 | | | | 0 | | | | 9,373,641 | |
| | | | |
Foreign corporate bonds and notes | | | 0 | | | | 889,561 | | | | 0 | | | | 889,561 | |
| | | | |
Foreign government bonds | | | 0 | | | | 1,657,010 | | | | 0 | | | | 1,657,010 | |
| | | | |
Loans | | | 0 | | | | 3,725,434 | | | | 349,964 | | | | 4,075,398 | |
| | | | |
Municipal obligations | | | 0 | | | | 564,410 | | | | 0 | | | | 564,410 | |
| | | | |
Non-agency mortgage-backed securities | | | 0 | | | | 3,789,759 | | | | 0 | | | | 3,789,759 | |
| | | | |
U.S. Treasury securities | | | 130,320 | | | | 0 | | | | 0 | | | | 130,320 | |
| | | | |
Yankee corporate bonds and notes | | | 0 | | | | 1,648,337 | | | | 0 | | | | 1,648,337 | |
| | | | |
Yankee government bonds | | | 0 | | | | 225,700 | | | | 0 | | | | 225,700 | |
| | | | |
Short-term investments | | | | | | | | | | | | | | | | |
Investment companies | | | 1,867,108 | | | | 0 | | | | 0 | | | | 1,867,108 | |
U.S. Treasury securities | | | 209,916 | | | | 0 | | | | 0 | | | | 209,916 | |
| | | 2,207,344 | | | | 23,334,640 | | | | 349,964 | | | | 25,891,948 | |
| | | | |
Forward foreign currency contracts | | | 0 | | | | 7,020 | | | | 0 | | | | 7,020 | |
Futures contracts | | | 21,906 | | | | 0 | | | | 0 | | | | 21,906 | |
Total assets | | $ | 2,229,250 | | | $ | 23,341,660 | | | $ | 349,964 | | | $ | 25,920,874 | |
Liabilities | | | | | | | | | | | | | | | | |
| | | | |
Forward foreign currency contracts | | $ | 0 | | | $ | 57,120 | | | $ | 0 | | | $ | 57,120 | |
Futures contracts | | | 4,313 | | | | 0 | | | | 0 | | | | 4,313 | |
Total liabilities | | $ | 4,313 | | | $ | 57,120 | | | $ | 0 | | | $ | 61,433 | |
Forward foreign currency contracts are reported at their unrealized gains (losses) at measurement date, which represents the change in the contract’s value from trade date. Futures contracts are reported at their variation margin at measurement date, which represents the amount due to/from the Fund at that date. All other assets and liabilities are reported at their market value at measurement date.
The Fund recognizes transfers between levels within the fair value hierarchy at the end of the reporting period. At September 30, 2016, the Fund did not have any transfers between Level 1 and Level 2.
The following is a reconciliation of assets in which significant unobservable inputs (Level 3) were used in determining fair value:
| | | | |
| | | Loans | |
Balance as of October 31, 2015 | | $ | 242,048 | |
Accrued discounts (premiums) | | | 40 | |
Realized gains (losses) | | | (890 | ) |
Change in unrealized gains (losses) | | | 2,354 | |
Purchases | | | 100,625 | |
Sales | | | (116,073 | ) |
Transfers into Level 3 | | | 150,849 | |
Transfers out of Level 3 | | | (28,989 | ) |
Balance as of September 30, 2016 | | $ | 349,964 | |
Change in unrealized gains (losses) relating to securities still held at September 30, 2016 | | $ | 314 | |
| | | | |
| 30 | | Wells Fargo Strategic Income Fund | | Notes to financial statements |
The investment type categorized above was valued using indicative broker quotes. These indicative broker quotes are considered Level 3 inputs. Quantitative unobservable inputs used by the brokers are often proprietary and not provided to the Fund and therefore the disclosure that would address these inputs is not included above.
4. TRANSACTIONS WITH AFFILIATES
Management fee
Funds Management, an indirect wholly owned subsidiary of Wells Fargo, is the manager of the Fund and provides advisory and fund-level administrative services under an investment management agreement. Under the investment management agreement, Funds Management is responsible for, among other services, implementing the investment objectives and strategies of the Fund, supervising the subadvisers, providing fund-level administrative services in connection with the Fund’s operations, and providing any other fund-level administrative services reasonably necessary for the operation of the Fund. As compensation for its services under the investment management agreement, Funds Management is entitled to receive an annual management fee starting at 0.525% and declining to 0.405% as the average daily net assets of the Fund increase.
Prior to July 1, 2015, Funds Management provided advisory services pursuant to an investment advisory agreement and was entitled to receive an annual fee which started at 0.475% and declined to 0.375% as the average daily net assets of the Fund increased. In addition, fund-level administrative services were provided by Funds Management under a separate administration agreement at an annual fee which started at 0.05% and declined to 0.03% as the average daily net assets of the Fund increased. For financial statement purposes, the advisory fee and fund-level administration fee for the year ended October 31, 2015 were included in management fee on the Statement of Operations.
For the eleven months ended September 30, 2016 and the year ended October 31, 2015, the management fee was equivalent to an annual rate of 0.525% of the Fund’s average daily net assets.
Funds Management has retained the services of a certain subadvisers to provide daily portfolio management to the Fund. The fee for subadvisory services is borne by Funds Management. WellsCap is a subadviser to the Fund and is entitled to receive a fee from Funds Management at an annual rate starting at 0.30% and declining to 0.15% as the average daily net assets of the Fund increase. First International Advisors, LLC, an affiliate of Funds Management and an indirect, wholly owned subsidiary of Wells Fargo, is also a subadviser to the Fund and is entitled to receive a fee from Funds Management at an annual rate starting at 0.35% and declining to 0.20% as the average daily net assets of the Fund increase.
Administration fees
Under a class-level administration agreement, Funds Management provides class-level administrative services to the Fund, which includes paying fees and expenses for services provided by the transfer agent, sub-transfer agents, omnibus account servicers and record-keepers. As compensation for its services under the class-level administration agreement, Funds Management receives an annual fee which is calculated based on the average daily net assets of each class as follows:
| | | | |
| | | Class-level administration fee | |
Class A, Class C | | | 0.16 | % |
Administrator Class | | | 0.10 | |
Institutional Class | | | 0.08 | |
Funds Management has contractually waived and/or reimbursed management and administration fees to the extent necessary to maintain certain net operating expense ratios for the Fund. Waiver of fees and/or reimbursement of expenses by Funds Management were made first from fund level expenses on a proportionate basis and then from class specific expenses. Funds Management has committed through February 28, 2017 to waive fees and/or reimburse expenses to the extent necessary to cap the Fund’s expenses at 0.90% for Class A shares, 1.65% for Class C shares, 0.75% for Administrator Class shares, and 0.60% for Institutional Class shares. After this time, the cap may be increased or the commitment to maintain the cap may be terminated only with the approval of the Board of Trustees.
Distribution fee
The Trust has adopted a distribution plan for Class C shares of the Fund pursuant to Rule 12b-1 under the 1940 Act. A distribution fee is charged to Class C shares and paid to Wells Fargo Funds Distributor, LLC (“Funds Distributor”), the principal underwriter, at an annual rate of 0.75% of the average daily net assets of Class C shares.
| | | | | | |
| Notes to financial statements | | Wells Fargo Strategic Income Fund | | | 31 | |
In addition, Funds Distributor is entitled to receive the front-end sales charge from the purchase of Class A shares and a contingent deferred sales charge on the redemption of certain Class A shares. Funds Distributor is also entitled to receive the contingent deferred sales charges from redemptions of Class C shares.
Shareholder servicing fees
The Trust has entered into contracts with one or more shareholder servicing agents, whereby Class A, Class C, and Administrator Class of the Fund are charged a fee at an annual rate of 0.25% of the average daily net assets of each respective class.
A portion of these total shareholder servicing fees were paid to affiliates of Wells Fargo.
5. INVESTMENT PORTFOLIO TRANSACTIONS
Purchases and sales of investments, excluding U.S. government obligations (if any) and short-term securities were as follows:
| | | | | | | | | | | | | | | | |
| | | Purchases at cost | | | Sales proceeds | |
| | | U.S.
government | | | Non-U.S.
government | | | U.S.
government | | | Non-U.S.
government | |
Year ended September 30, 2016* | | $ | 703,248 | | | $ | 17,486,496 | | | $ | 577,055 | | | $ | 10,288,417 | |
Year ended October 31, 2015 | | | 228,167 | | | | 15,748,263 | | | | 227,134 | | | | 33,719,095 | |
| * | For the eleven months ended September 30, 2016. The Fund changed its fiscal year end from October 31 to September 30, effective September 30, 2016 |
The Fund may purchase or sell investment securities to other Wells Fargo funds under procedures adopted by the Board of Trustees. The procedures have been designed to ensure that these interfund transactions, which generally do not incur broker commissions, are effected at current market prices. Interfund trades are included within the respective purchases and sales amounts shown.
As of September 30, 2016, the Fund had unfunded term loan commitments of $334,391.
6. DERIVATIVE TRANSACTIONS
During the eleven months ended September 30, 2016 and the year ended October 31, 2015, the Fund entered into futures contracts to manage duration exposure.
At September 30, 2016, the Fund had long and short futures contracts outstanding as follows:
| | | | | | | | | | | | | | |
| Expiration date | | Counterparty | | Contracts | | Type | | Contract value at September 30, 2016 | | | Unrealized
gains
(losses) | |
| 12-20-2016 | | JPMorgan | | 4 Short | | U.S. Treasury Bonds | | $ | 672,625 | | | $ | (7,351 | ) |
| 12-20-2016 | | JPMorgan | | 2 Long | | U.S. Treasury Bonds | | | 367,750 | | | | 809 | |
| 12-20-2016 | | JPMorgan | | 20 Short | | 10-Year U.S. Treasury Notes | | | 2,622,500 | | | | 1,837 | |
| 12-30-2016 | | JPMorgan | | 36 Short | | 5-Year U.S. Treasury Notes | | | 4,374,563 | | | | (8,300 | ) |
The Fund had an average notional amount of $157,089 in long futures contracts and $7,576,737 in short futures contracts during the eleven months ended September 30, 2016. As of September 30, 2016, the Fund had segregated securities on its portfolio and $41,443 as cash collateral for open futures contracts.
The Fund had an average notional amount of $1,410,978 in long futures contracts and $15,066,258 in short futures contracts during the year ended October 31, 2015.
During the eleven months ended September 30, 2016 and the year ended October 31, 2015, the Fund entered into forward foreign currency contracts for economic hedging purposes.
| | | | |
| 32 | | Wells Fargo Strategic Income Fund | | Notes to financial statements |
At September 30, 2016, the Fund had forward foreign currency contracts outstanding as follows:
Forward foreign currency contracts to buy:
| | | | | | | | | | | | | | | | | | |
| Exchange date | | Counterparty | | Contracts to receive | | | U.S. value at September 30, 2016 | | | In exchange for U.S. $ | | | Unrealized losses | |
| 10-11-2016 | | State Street Bank | | | 1,450,000 | GBP | | $ | 1,879,736 | | | $ | 1,927,881 | | | $ | (48,145 | ) |
Forward foreign currency contracts to sell:
| | | | | | | | | | | | | | | | | | |
| Exchange date | | Counterparty | | Contracts to deliver | | | U.S. value at September 30, 2016 | | | In exchange for U.S. $ | | | Unrealized
gains
(losses) | |
| 10-11-2016 | | State Street Bank | | | 1,450,000 | GBP | | $ | 1,879,736 | | | $ | 1,870,761 | | | $ | (8,975 | ) |
| 10-31-2016 | | Morgan Stanley | | | 250,000 | GBP | | | 324,217 | | | | 330,583 | | | | 6,366 | |
| 10-31-2016 | | Morgan Stanley | | | 500,000 | EUR | | | 562,380 | | | | 563,034 | | | | 654 | |
The Fund had average contract amounts of $675,060 and $1,754,496 in forward foreign currency contracts to buy and forward foreign currency contracts to sell, respectively, during the eleven months ended September 30, 2016.
The Fund had average contract amounts of $1,063,731 and $6,412,336 in forward foreign currency contracts to buy and forward foreign currency contracts to sell, respectively, during the year ended October 31, 2015.
The Fund enters into credit default swap contracts as a substitute for taking a position in the underlying security or basket of securities or to potentially enhance the Fund’s total return.
As of September 30, 2016, the Fund did not have any open credit default swaps. The Fund had an average notional balance of $463,567 and $138,329 during the eleven months ended September 30, 2016 and the year ended October 31, 2015, respectively.
A summary of derivative instruments by primary risk exposure is outlined in the following tables.
The fair value of derivative instruments as of September 30, 2016 was as follows for the Fund:
| | | | | | | | | | | | |
| | | Asset derivatives | | | Liability derivatives | |
| | | Statement of Assets and Liabilities location | | Fair value | | | Statement of Assets and Liabilities location | | Fair value | |
Interest rate risk | | Receivable for daily variation margin on open futures contracts | | $ | 21,906 | * | | Payable for daily variation margin on open futures contracts | | $ | 4,313 | * |
Foreign currency risk | | Unrealized gains on forward foreign currency contracts | | | 7,020 | | | Unrealized losses on forward foreign currency contracts | | | 57,120 | |
| | | | | $ | 28,926 | | | | | $ | 61,433 | |
| * | Only the current day’s variation margin as of September 30, 2016 is reported separately on the Statement of Assets and Liabilities. |
The effect of derivative instruments on the Statement of Operations for the eleven months ended September 30, 2016 was as follows for the Fund:
| | | | | | | | | | | | | | | | | | | | | | | | |
| | | Amount of realized losses on derivatives | | | Change in unrealized gains (losses) on derivatives | |
| | | Futures contracts | | | Forward currency
contracts | | | Credit
default
swaps | | | Futures contracts | | | Forward currency
contracts | | | Credit
default
swaps | |
Interest rate risk | | $ | (312,731 | ) | | $ | 0 | | | $ | 0 | | | $ | (70,666 | ) | | $ | 0 | | | $ | 0 | |
Foreign currency risk | | | 0 | | | | (176,269 | ) | | | 0 | | | | 0 | | | | (5,202 | ) | | | 0 | |
Credit risk | | | 0 | | | | 0 | | | | (7,531 | ) | | | 0 | | | | 0 | | | | (1,436 | ) |
| | | $ | (312,731 | ) | | $ | (176,269 | ) | | $ | (7,531 | ) | | $ | (70,666 | ) | | $ | (5,202 | ) | | $ | (1,436 | ) |
| | | | | | |
| Notes to financial statements | | Wells Fargo Strategic Income Fund | | | 33 | |
The effect of derivative instruments on the Statement of Operations for the year ended October 31, 2015 was as follows for the Fund:
| | | | | | | | | | | | | | | | | | | | | | | | |
| | |
| | | Amount of realized gains (losses) on derivatives | | | Change in unrealized gains (losses) on derivatives | |
| | | Futures
contracts | | | Forward
currency
contracts | | | Credit
default
swaps | | | Futures
contracts | | | Forward
currency
contracts | | | Credit
default
swaps | |
Interest rate risk | | $ | (614,950 | ) | | $ | 0 | | | $ | 0 | | | $ | 169,920 | | | $ | 0 | | | $ | 0 | |
Foreign currency risk | | | 0 | | | | 740,294 | | | | 0 | | | | 0 | | | | (231,831 | ) | | | 0 | |
Credit risk | | | 0 | | | | 0 | | | | 2,320 | | | | 0 | | | | 0 | | | | 1,436 | |
| | | $ | (614,950 | ) | | $ | 740,294 | | | $ | 2,320 | | | $ | 169,920 | | | $ | (231,831 | ) | | $ | 1,436 | |
For certain types of derivative transactions, the Fund has entered into International Swaps and Derivatives Association, Inc. master agreements (“ISDA Master Agreements”) or similar agreements with approved counterparties. The ISDA Master Agreements or similar agreements may have requirements to deliver/deposit securities or cash to/with an exchange or broker-dealer as collateral and allows the Fund to offset, with each counterparty, certain derivative financial instrument’s assets and/or liabilities with collateral held or pledged. Collateral requirements differ by type of derivative. Collateral or margin requirements are set by the broker or exchange clearing house for exchange traded derivatives while collateral terms are contract specific for over-the-counter traded derivatives. Cash collateral that has been pledged to cover obligations of the Fund under ISDA Master Agreements or similar agreements, if any, are reported separately in the Statement of Assets and Liabilities. Securities pledged as collateral, if any, are noted in the Portfolio of Investments. With respect to balance sheet offsetting, absent an event of default by the counterparty or a termination of the agreement, the reported amounts of financial assets and financial liabilities in the Statement of Assets and Liabilities are not offset across transactions between the Fund and the applicable counterparty. A reconciliation of the gross amounts on the Statement of Assets and Liabilities to the net amounts by derivative type, including any collateral exposure, is as follows:
| | | | | | | | | | | | | | | | | | |
| Derivative type | | Counterparty | | Gross amounts of assets in the Statement of Assets and Liabilities | | | Amounts subject to netting agreements | | | Collateral received | | | Net amount of assets | |
Futures – variation margin | | JPMorgan | | $ | 21,906 | | | $ | (4,313 | ) | | $ | 0 | | | $ | 17,593 | |
Forward foreign currency contracts | | Morgan Stanley | | | 7,020 | * | | | 0 | | | | 0 | | | | 7,020 | |
| | * | Amount represents net unrealized gains. | |
| | | | | | | | | | | | | | | | | | |
| Derivative type | | Counterparty | | Gross amounts of liabilities in the Statement of Assets and Liabilities | | | Amounts subject to netting agreements | | | Collateral pledged | | | Net amount of liabilities | |
Futures – variation margin | | JPMorgan | | $ | 4,313 | | | $ | (4,313 | ) | | $ | 0 | | | $ | 0 | |
Forward foreign currency contracts | | State Street Bank | | | 57,120 | ** | | | 0 | | | | 0 | | | | 57,120 | |
| | ** | Amount represents net unrealized losses. | |
7. BANK BORROWINGS
The Trust (excluding the money market funds and certain other funds) and Wells Fargo Variable Trust are parties to a $250,000,000 revolving credit agreement whereby the Fund is permitted to use bank borrowings for temporary or emergency purposes, such as to fund shareholder redemption requests. Interest under the credit agreement is charged to the Fund based on a borrowing rate equal to the higher of the Federal Funds rate in effect on that day plus 1.25% or the overnight LIBOR rate in effect on that day plus 1.25%. In addition, an annual commitment fee equal to 0.25% of the unused balance is allocated to each participating fund. Prior to August 30, 2016, the revolving credit agreement amount was $200,000,000 and an annual commitment fee equal to 0.20% of the unused balance was allocated to each participating fund. Prior to September 1, 2015, the revolving credit agreement amount was $150,000,000 and an annual commitment fee equal to 0.10% of the unused balance was allocated to each participating fund.
For the eleven months ended September 30, 2016 and the year ended October 31, 2015, there were no borrowings by the Fund under the agreement.
| | | | |
| 34 | | Wells Fargo Strategic Income Fund | | Notes to financial statements |
8. DISTRIBUTIONS TO SHAREHOLDERS
The tax character of distributions paid were as follows:
| | | | | | | | | | | | |
| | | Eleven months ended
September 30, 2016 | | | Year ended October 31 | |
| | | | 2015 | | | 2014 | |
Ordinary income | | $ | 392,549 | | | $ | 984,146 | | | $ | 893,748 | |
Long-term capital gain | | | 0 | | | | 0 | | | | 1,943 | |
Tax basis return of capital | | | 154,755 | | | | 111,450 | | | | 0 | |
As of September 30, 2016, the components of distributable earnings on a tax basis were as follows:
| | |
Unrealized losses | | Capital loss carryforward |
| $(263,669) | | $(1,670,897) |
9. INDEMNIFICATION
Under the Trust’s organizational documents, the officers and Trustees have been granted certain indemnification rights against certain liabilities that may arise out of performance of their duties to the Trust. Additionally, in the normal course of business, the Trust may enter into contracts with service providers that contain a variety of indemnification clauses. The Trust’s maximum exposure under these arrangements is dependent on future claims that may be made against the Fund and, therefore, cannot be estimated.
10. SUBSEQUENT DISTRIBUTIONS
On November 23, 2016, the Fund declared distributions from net investment income to shareholders of record on November 22, 2016. The per share amounts payable on November 25, 2016 were as follows:
| | | | |
| | | Net investment income | |
Class A | | $ | 0.02795 | |
Class C | | | 0.01977 | |
Administrator Class | | | 0.02820 | |
Institutional Class | | | 0.03155 | |
These distributions are not reflected in the accompanying financial statements. The final determination of the source of all distributions is subject to change and made after the Fund’s tax year-end.
| | | | | | |
| Report of independent registered public accounting firm | | Wells Fargo Strategic Income Fund | | | 35 | |
BOARD OF TRUSTEES AND SHAREHOLDERS OF WELLS FARGO FUNDS TRUST:
We have audited the accompanying statement of assets and liabilities, including the portfolio of investments, of the Wells Fargo Strategic Income Fund (the “Fund”), one of the funds constituting the Wells Fargo Funds Trust, as of September 30, 2016, and the related statements of operations for the period then ended and year ended October 31, 2015, the statements of changes in net assets for the period ended September 30, 2016 and for each of the years in the two-year period ended October 31, 2015, and the financial highlights for the period ended September 30, 2016 and each of the years or periods in the three-year period ended October 31, 2015. These financial statements and financial highlights are the responsibility of the Fund’s management. Our responsibility is to express an opinion on these financial statements and financial highlights based on our audits.
We conducted our audits in accordance with the standards of the Public Company Accounting Oversight Board (United States). Those standards require that we plan and perform the audit to obtain reasonable assurance about whether the financial statements and financial highlights are free of material misstatement. An audit includes examining, on a test basis, evidence supporting the amounts and disclosures in the financial statements. Our procedures included confirmation of securities owned as of September 30, 2016, by correspondence with the custodian and brokers, or by other appropriate auditing procedures. An audit also includes assessing the accounting principles used and significant estimates made by management, as well as evaluating the overall financial statement presentation. We believe that our audits provide a reasonable basis for our opinion.
In our opinion, the financial statements and financial highlights referred to above present fairly, in all material respects, the financial position of the Wells Fargo Strategic Income Fund as of September 30, 2016, the results of its operations for the period then ended and year ended October 31, 2015, the changes in its net assets for the period ended September 30, 2016 and for each of the years in the two-year period ended October 31, 2015, and the financial highlights for the period ended September 30, 2016 and each of the years or periods in the three-year period ended October 31, 2015, in conformity with U.S. generally accepted accounting principles.

Boston, Massachusetts
November 23, 2016
| | | | |
| 36 | | Wells Fargo Strategic Income Fund | | Other information (unaudited) |
TAX INFORMATION
For the fiscal eleven months ended September 30, 2016, $392,549 has been designated as interest-related dividends for nonresident alien shareholders pursuant to Section 871 of the Internal Revenue Code.
PROXY VOTING INFORMATION
A description of the policies and procedures that the Fund uses to determine how to vote proxies relating to portfolio securities is available, upon request, by calling 1-800-222-8222, visiting our website at wellsfargofunds.com, or visiting the SEC website at sec.gov. Information regarding how the Fund voted proxies relating to portfolio securities during the most recent 12-month period ended June 30 is available on the Fund’s website at wellsfargofunds.com or by visiting the SEC website at sec.gov.
PORTFOLIO HOLDINGS INFORMATION
The complete portfolio holdings for the Fund are publicly available monthly on the Fund’s website (wellsfargofunds.com), on a one-month delayed basis. In addition, top ten holdings information (excluding derivative positions) for the Fund is publicly available on the Fund’s website on a monthly, seven-day or more delayed basis. The Fund files its complete schedule of portfolio holdings with the SEC for the first and third quarters of each fiscal year on Form N-Q, which is available by visiting the SEC website at sec.gov. In addition, the Fund’s Form N-Q may be reviewed and copied at the SEC’s Public Reference Room in Washington, DC, and at regional offices in New York City, at 233 Broadway, and in Chicago, at 175 West Jackson Boulevard, Suite 900. Information about the Public Reference Room may be obtained by calling 1-800-SEC-0330.
| | | | | | |
| Other information (unaudited) | | Wells Fargo Strategic Income Fund | | | 37 | |
BOARD OF TRUSTEES AND OFFICERS
Each of the Trustees and Officers1 listed in the table below acts in identical capacities for each fund in the Wells Fargo family of funds, which consists of 138 mutual funds comprising the Wells Fargo Funds Trust, Wells Fargo Variable Trust, Wells Fargo Master Trust and four closed-end funds (collectively the “Fund Complex”). This table should be read in conjunction with the Prospectus and the Statement of Additional Information2. The mailing address of each Trustee and Officer is 525 Market Street, 12th Floor, San Francisco, CA 94105. Each Trustee and Officer serves an indefinite term, however, each Trustee serves such term until reaching the mandatory retirement age established by the Trustees.
Independent Trustees
| | | | | | |
Name and year of birth | | Position held and length of service* | | Principal occupations during past five years or longer | | Current other public company or investment company directorships |
William R. Ebsworth
(Born 1957) | | Trustee, since 2015 | | Retired. From 1984 to 2013, equities analyst, portfolio manager, research director and chief financial officer at Fidelity Management and Research Company in Boston, Tokyo, and Hong Kong and retired in 2013 as Chief Investment Officer of Fidelity Strategic Advisers, Inc. where he lead a team of investment professionals managing client assets. Prior thereto, Board member of Hong Kong Securities Clearing Co., Hong Kong Options Clearing Corp., the Thailand International Fund, Ltd., Fidelity Investments Life Insurance Company, and Empire Fidelity Investments Life Insurance Company. Mr. Ebsworth is a CFA® charterholder and an Adjunct Lecturer, Finance, at Babson College. | | Asset Allocation Trust |
Jane A. Freeman
(Born 1953) | | Trustee, since 2015 | | Retired. From 2012 to 2014 and 1999 to 2008, Chief Financial Officer of Scientific Learning Corporation. From 2008 to 2012, Ms. Freeman provided consulting services related to strategic business projects. Prior to 1999, Portfolio Manager at Rockefeller & Co. and Scudder, Stevens & Clark. Board member of the Harding Loevner Funds from 1996 to 2014, serving as both Lead Independent Director and chair of the Audit Committee. Board member of the Russell Exchange Traded Funds Trust from 2011 to 2012 and the chair of the Audit Committee. Ms. Freeman is a Board Member of Ruth Bancroft Garden (non-profit organization) and an inactive chartered financial analyst. | | Asset Allocation Trust |
Peter G. Gordon
(Born 1942) | | Trustee, since 1998; Chairman, since 2005 | | Co-Founder, Retired Chairman, President and CEO of Crystal Geyser Water Company. Trustee Emeritus, Colby College. | | Asset Allocation Trust |
Isaiah Harris, Jr.
(Born 1952) | | Trustee, since 2009 | | Retired. Chairman of the Board of CIGNA Corporation since 2009, and Director since 2005. From 2003 to 2011, Director of Deluxe Corporation. Prior thereto, President and CEO of BellSouth Advertising and Publishing Corp. from 2005 to 2007, President and CEO of BellSouth Enterprises from 2004 to 2005 and President of BellSouth Consumer Services from 2000 to 2003. Emeritus member of the Iowa State University Foundation Board of Governors. Emeritus Member of the Advisory Board of Iowa State University School of Business. Advisory Board Member, Palm Harbor Academy (charter school). Advisory Board Member, Child Evangelism Fellowship (non-profit). Mr. Harris is a certified public accountant (inactive status). | | CIGNA Corporation; Asset Allocation Trust |
Judith M. Johnson
(Born 1949) | | Trustee, since 2008; Audit Committee Chairman, since 2008 | | Retired. Prior thereto, Chief Executive Officer and Chief Investment Officer of Minneapolis Employees Retirement Fund from 1996 to 2008. Ms. Johnson is an attorney, certified public accountant and a certified managerial accountant. | | Asset Allocation Trust |
David F. Larcker
(Born 1950) | | Trustee, since 2009 | | James Irvin Miller Professor of Accounting at the Graduate School of Business, Stanford University, Director of the Corporate Governance Research Initiative and Senior Faculty of The Rock Center for Corporate Governance since 2006. From 2005 to 2008, Professor of Accounting at the Graduate School of Business, Stanford University. Prior thereto, Ernst & Young Professor of Accounting at The Wharton School, University of Pennsylvania from 1985 to 2005. | | Asset Allocation Trust |
| | | | |
| 38 | | Wells Fargo Strategic Income Fund | | Other information (unaudited) |
| | | | | | |
Name and year of birth | | Position held and length of service* | | Principal occupations during past five years or longer | | Current other public company or investment company directorships |
Olivia S. Mitchell
(Born 1953) | | Trustee, since 2006 | | International Foundation of Employee Benefit Plans Professor, Wharton School of the University of Pennsylvania since 1993. Director of Wharton’s Pension Research Council and Boettner Center on Pensions & Retirement Research, and Research Associate at the National Bureau of Economic Research. Previously, Cornell University Professor from 1978 to 1993. | | Asset Allocation Trust |
Timothy J. Penny
(Born 1951) | | Trustee, since 1996 | | President and Chief Executive Officer of Southern Minnesota Initiative Foundation, a non-profit organization, since 2007 and Senior Fellow at the Humphrey Institute Policy Forum at the University of Minnesota since 1995. Member of the Board of Trustees of NorthStar Education Finance, Inc., a non-profit organization, since 2007. | | Asset Allocation Trust |
Michael S. Scofield
(Born 1943) | | Trustee, since 2010 | | Served on the Investment Company Institute’s Board of Governors and Executive Committee from 2008-2011 as well the Governing Council of the Independent Directors Council from 2006-2011 and the Independent Directors Council Executive Committee from 2008-2011. Chairman of the IDC from 2008-2010. Institutional Investor (Fund Directions) Trustee of Year in 2007. Trustee of the Evergreen Funds complex (and its predecessors) from 1984 to 2010. Chairman of the Evergreen Funds from 2000-2010. Former Trustee of the Mentor Funds. Retired Attorney, Law Offices of Michael S. Scofield. | | Asset Allocation Trust |
| * | Length of service dates reflect the Trustee’s commencement of service with the Trust’s predecessor entities, where applicable. |
Officers
| | | | | | |
Name and year of birth | | Position held and length of service | | Principal occupations during past five years or longer | | |
Karla M. Rabusch
(Born 1959) | | President, since 2003 | | Executive Vice President of Wells Fargo Bank, N.A. and President of Wells Fargo Funds Management, LLC since 2003. | | |
Nancy Wiser1
(Born 1967) | | Treasurer, since 2012 | | Executive Vice President of Wells Fargo Funds Management, LLC since 2011. Chief Operating Officer and Chief Compliance Officer at LightBox Capital Management LLC, from 2008 to 2011. | | |
C. David Messman
(Born 1960) | | Secretary, since 2000; Chief Legal Officer, since 2003 | | Senior Vice President and Secretary of Wells Fargo Funds Management, LLC since 2001. Assistant General Counsel of Wells Fargo Bank, N.A. since 2013 and Vice President and Managing Counsel of Wells Fargo Bank, N.A. from 1996 to 2013. | | |
Michael Whitaker
(Born 1967) | | Chief Compliance Officer, since 20163 | | Executive Vice President of Wells Fargo Funds Management, LLC since 2016. Chief Compliance Officer of Fidelity’s Fixed Income Funds and Asset Allocation Funds from 2008 to 2016, Compliance Officer of FMR Co., Inc. from 2014 to 2016, Fidelity Investments Money Management, Inc. from 2014 to 2016, Fidelity Investments from 2007 to 2016. | | |
David Berardi
(Born 1975) | | Assistant Treasurer, since 2009 | | Vice President of Wells Fargo Funds Management, LLC since 2009. Vice President of Evergreen Investment Management Company, LLC from 2008 to 2010. Manager of Fund Reporting and Control for Evergreen Investment Management Company, LLC from 2004 to 2010. | | |
Jeremy DePalma1
(Born 1974) | | Assistant Treasurer, since 2009 | | Senior Vice President of Wells Fargo Funds Management, LLC since 2009. Senior Vice President of Evergreen Investment Management Company, LLC from 2008 to 2010 and head of the Fund Reporting and Control Team within Fund Administration from 2005 to 2010. | | |
| 1 | Nancy Wiser acts as Treasurer of 70 funds in the Fund Complex. Jeremy DePalma acts as Treasurer of 68 funds and Assistant Treasurer of 70 funds in the Fund Complex. |
| 2 | The Statement of Additional Information includes additional information about the Trustees and is available, without charge, upon request, by calling
1-800-222-8222 or by visiting the website at wellsfargofunds.com. |
| 3 | Michael Whitaker became Chief Compliance Officer effective May 16, 2016. |
| | | | | | |
| Other information (unaudited) | | Wells Fargo Strategic Income Fund | | | 39 | |
BOARD CONSIDERATION OF INVESTMENT MANAGEMENT AND SUB-ADVISORY AGREEMENTS:
Under the Investment Company Act of 1940 (the “1940 Act”), the Board of Trustees (the “Board”) of Wells Fargo Funds Trust (the “Trust”) must determine annually whether to approve the continuation of the Trust’s investment management and sub-advisory agreements. In this regard, at an in-person meeting held on May 24-25, 2016 (the “Meeting”), the Board, all the members of which have no direct or indirect interest in the investment management and sub-advisory agreements and are not “interested persons” of the Trust, as defined in the 1940 Act (the “Independent Trustees”), reviewed and approved for Wells Fargo Strategic Income Fund (the “Fund”): (i) an investment management agreement (the “Management Agreement”) with Wells Fargo Funds Management, LLC (“Funds Management”); (ii) an investment sub-advisory agreement with Wells Capital Management Incorporated (“WellsCap”), an affiliate of Funds Management; and (iii) an investment sub-advisory agreement with First International Advisors, LLC (“FIA”), an affiliate of Funds Management. The sub-advisory agreements with WellsCap and FIA (the “Sub-Advisers”) are collectively referred to as the “Sub-Advisory Agreements,” and the Management Agreement and the Sub-Advisory Agreements are collectively referred to as the “Advisory Agreements.”
At the Meeting, the Board considered the factors and reached the conclusions described below relating to the selection of Funds Management and the Sub-Advisers and the approval of the Advisory Agreements. Prior to the Meeting, including at an in-person meeting in April 2016, the Trustees conferred extensively among themselves and with representatives of Funds Management about these matters. Also, the Board has adopted a team-based approach, with each team consisting of a sub-set of Trustees, to assist the full Board in the discharge of its duties in reviewing performance and other matters throughout the year. The Independent Trustees were assisted in their evaluation of the Advisory Agreements by independent legal counsel, from whom they received separate legal advice and with whom they met separately.
In providing information to the Board, Funds Management and the Sub-Advisers were guided by a detailed set of requests for information submitted to them by independent legal counsel on behalf of the Independent Trustees at the start of the Board’s annual contract renewal process earlier in 2016. In considering and approving the Advisory Agreements, the Trustees considered the information they believed relevant, including but not limited to the information discussed below. The Board considered not only the specific information presented in connection with the Meeting, but also the knowledge gained over time through interaction with Funds Management and the Sub-Advisers about various topics. In this regard, the Board reviewed reports of Funds Management at each of its quarterly meetings, which included, among other things, portfolio reviews and performance reports. In addition, the Board and the teams mentioned above confer with portfolio managers at various times throughout the year. The Board did not identify any particular information or consideration that was all-important or controlling, and each individual Trustee may have attributed different weights to various factors.
After its deliberations, the Board unanimously approved the continuation of the Advisory Agreements for a one-year term and determined that the compensation payable to Funds Management and the Sub-Advisers under each of the Advisory Agreements was reasonable. The Board considered the approval of the Advisory Agreements for the Fund as part of its consideration of agreements for funds across the complex, but its approvals were made on a fund-by-fund basis. The following summarizes a number of important, but not necessarily all, factors considered by the Board in support of its approvals.
Nature, extent and quality of services
The Board received and considered various information regarding the nature, extent and quality of services provided to the Fund by Funds Management and the Sub-Advisers under the Advisory Agreements. This information included a description of the investment advisory services and Fund-level administrative services covered by the Management Agreement, as well as, among other things, a summary of the background and experience of senior management of Funds Management, and the qualifications, background, tenure and responsibilities of each of the portfolio managers primarily responsible for the day-to-day portfolio management of the Fund.
The Board evaluated the ability of Funds Management and the Sub-Advisers to attract and retain qualified investment professionals, including research, advisory and supervisory personnel. The Board further considered the compliance programs and compliance records of Funds Management and the Sub-Advisers. In addition, the Board took into account the full range of services provided to the Fund by Funds Management and its affiliates.
Fund performance and expenses
The Board considered the performance results for the Fund over various time periods ended December 31, 2015. The Board considered these results in comparison to the performance of funds in a universe that was determined by Broadridge Inc. (“Broadridge”) to be similar to the Fund (the “Universe”), and in comparison to the Fund’s benchmark
| | | | |
| 40 | | Wells Fargo Strategic Income Fund | | Other information (unaudited) |
index and to other comparative data. Broadridge is an independent provider of investment company data. The Board received a description of the methodology used by Broadridge to select the mutual funds in the performance Universe. The Board noted that the performance of the Fund (Administrator Class) was lower than the average performance of the Universe for all periods under review. The Board also noted that the performance of the Fund was lower than its benchmark, the Barclays U.S. Universal Bond Index, for all periods under review.
The Board received information concerning, and discussed factors contributing to, the underperformance of the Fund relative to the Universe and benchmark for the periods noted above. The Board took note of the explanations for the relative underperformance in these periods, including with respect to market factors and investment decisions that affected the Fund’s performance and noted the short performance history of the Fund.
The Board also received and considered information regarding the Fund’s net operating expense ratios and their various components, including actual management fees, custodian and other non-management fees, and Rule 12b-1 and non-Rule 12b-1 shareholder service fees. The Board considered these ratios in comparison to the median ratios of funds in class-specific expense groups that were determined by Broadridge to be similar to the Fund (the “Groups”). The Board received a description of the methodology used by Broadridge to select the mutual funds in the expense Groups and an explanation of how funds comprising expense groups and their expense ratios may vary from year-to-year. Based on the Broadridge reports, the Board noted that the net operating expense ratios of the Fund were lower than the median net operating expense ratios of the expense Groups.
The Board took into account the Fund performance and expense information provided to it among the factors considered in deciding to re-approve the Advisory Agreements.
Investment management and sub-advisory fee rates
The Board reviewed and considered the contractual fee rates payable by the Fund to Funds Management under the Management Agreement, as well as the contractual fee rates payable by the Fund to Funds Management for class-level administrative services under a Class-Level Administration Agreement, which include class-level transfer agency and sub-transfer agency costs (collectively, the “Management Rates”). The Board also reviewed and considered the contractual investment sub-advisory fee rates that are payable by Funds Management to each of the Sub-Advisers for investment sub-advisory services.
Among other information reviewed by the Board was a comparison of the Fund’s Management Rates with the average contractual investment management fee rates of funds in the expense Groups at a common asset level as well as transfer agency costs of the funds in the expense Groups. The Board noted that the Management Rates of the Fund were lower than the sum of these average rates for the Fund’s expense Groups for all share classes.
The Board also received and considered information about the portion of the total management fee that was retained by Funds Management after payment of the fee to the Sub-Advisers for sub-advisory services. In assessing the reasonableness of this amount, the Board received and evaluated information about the nature and extent of responsibilities retained and risks assumed by Funds Management and not delegated to or assumed by the Sub-Advisers, and about Funds Management’s on-going oversight services. However, given the affiliation between Funds Management and the Sub-Advisers, the Board ascribed limited relevance to the allocation of fees between them.
Based on its consideration of the factors and information it deemed relevant, including those described here, the Board determined that the compensation payable to Funds Management under the Management Agreement and to the Sub-Advisers under the Sub-Advisory Agreements was reasonable, in light of the services covered by the Advisory Agreements.
Profitability
The Board received and considered information concerning the profitability of Funds Management, as well as the profitability of Wells Fargo as a whole, from providing services to the Fund and the fund family as a whole. The Board also received and considered information concerning the profitability of the Sub-Advisers from providing services to the fund family as a whole, noting that the Sub-Advisers’ profitability information with respect to providing services to the Fund was subsumed in the Wells Fargo and Funds Management profitability analysis.
Funds Management reported on the methodologies and estimates used in calculating profitability. Among other things, the Board noted that the levels of profitability reported on a fund-by-fund basis varied widely, depending on factors such as the size and type of fund. Based on its review, the Board did not deem the profits reported by Funds Management or Wells Fargo from its services to the Fund to be at a level that would prevent it from approving the continuation of the Advisory Agreements.
| | | | | | |
| Other information (unaudited) | | Wells Fargo Strategic Income Fund | | | 41 | |
Economies of scale
With respect to possible economies of scale, the Board noted the existence of breakpoints in the Fund’s management fee structure, which operate generally to reduce the Fund’s expense ratios as the Fund grows in size. It considered that, for a small fund or a fund that shrinks in size, breakpoints conversely can result in higher fee levels. The Board also considered that fee waiver and expense reimbursement arrangements and competitive fee rates at the outset are means of sharing potential economies of scale with shareholders of the Fund and the fund family as a whole. The Board considered Funds Management’s view that any analyses of potential economies of scale in managing a particular fund are inherently limited in light of the joint and common costs and investments that Funds Management incurs across the fund family as a whole.
The Board concluded that the Fund’s fee and expense arrangements, including contractual breakpoints, constituted a reasonable approach to sharing potential economies of scale with the Fund and its shareholders.
Other benefits to Funds Management and the Sub-Advisers
The Board received and considered information regarding potential “fall-out” or ancillary benefits received by Funds Management and its affiliates, including the Sub-Advisers, as a result of their relationships with the Fund. Ancillary benefits could include, among others, benefits directly attributable to other relationships with the Fund and benefits potentially derived from an increase in Funds Management’s and the Sub-Advisers’ business as a result of their relationships with the Fund. The Board noted that various affiliates of Funds Management may receive distribution-related fees, shareholder servicing payments and sub-transfer agency fees in respect of shares sold or held through them and services provided.
The Board also reviewed information about soft dollar credits earned and utilized by the Sub-Advisers, fees earned by Funds Management and WellsCap from managing a private investment vehicle for the fund family’s securities lending collateral and commissions earned by an affiliated broker from portfolio transactions.
Based on its consideration of the factors and information it deemed relevant, including those described here, the Board did not find that any ancillary benefits received by Funds Management and its affiliates, including the Sub-Advisers, were unreasonable.
Conclusion
At the Meeting, after considering the above-described factors and based on its deliberations and its evaluation of the information described above, the Board unanimously approved the continuation of the Advisory Agreements for a one-year term and determined that the compensation payable to Funds Management and the Sub-Advisers under each of the Advisory Agreements was reasonable.
| | | | |
| 42 | | Wells Fargo Strategic Income Fund | | List of abbreviations |
The following is a list of common abbreviations for terms and entities that may have appeared in this report.
| ACA | — ACA Financial Guaranty Corporation |
| ADR | — American depositary receipt |
| ADS | — American depositary shares |
| AGC | — Assured Guaranty Corporation |
| AGM | — Assured Guaranty Municipal |
| Ambac | — Ambac Financial Group Incorporated |
| AMT | — Alternative minimum tax |
| BAN | — Bond anticipation notes |
| BHAC | — Berkshire Hathaway Assurance Corporation |
| CAB | — Capital appreciation bond |
| CCAB | — Convertible capital appreciation bond |
| CDA | — Community Development Authority |
| CDO | — Collateralized debt obligation |
| DRIVER | — Derivative inverse tax-exempt receipts |
| DW&P | — Department of Water & Power |
| DWR | — Department of Water Resources |
| ECFA | — Educational & Cultural Facilities Authority |
| EDA | — Economic Development Authority |
| EDFA | — Economic Development Finance Authority |
| ETF | — Exchange-traded fund |
| FDIC | — Federal Deposit Insurance Corporation |
| FFCB | — Federal Farm Credit Banks |
| FGIC | — Financial Guaranty Insurance Corporation |
| FHA | — Federal Housing Administration |
| FHLB | — Federal Home Loan Bank |
| FHLMC | — Federal Home Loan Mortgage Corporation |
| FICO | — The Financing Corporation |
| FNMA | — Federal National Mortgage Association |
| GDR | — Global depositary receipt |
| GNMA | — Government National Mortgage Association |
| HCFR | — Healthcare facilities revenue |
| HEFA | — Health & Educational Facilities Authority |
| HEFAR | — Higher education facilities authority revenue |
| HFA | — Housing Finance Authority |
| HFFA | — Health Facilities Financing Authority |
| HUD | — Department of Housing and Urban Development |
| IDA | — Industrial Development Authority |
| IDAG | — Industrial Development Agency |
| KRW | — Republic of Korea won |
| LIBOR | — London Interbank Offered Rate |
| LIFER | — Long Inverse Floating Exempt Receipts |
| LLC | — Limited liability company |
| LLLP | — Limited liability limited partnership |
| LLP | — Limited liability partnership |
| MBIA | — Municipal Bond Insurance Association |
| MFHR | — Multifamily housing revenue |
| MSTR | — Municipal securities trust receipts |
| MUD | — Municipal Utility District |
| National | — National Public Finance Guarantee Corporation |
| PCFA | — Pollution Control Financing Authority |
| PCL | — Public Company Limited |
| PCR | — Pollution control revenue |
| PFA | — Public Finance Authority |
| PFFA | — Public Facilities Financing Authority |
| PFOTER | — Puttable floating option tax-exempt receipts |
| plc | — Public limited company |
| PUTTER | — Puttable tax-exempt receipts |
| R&D | — Research & development |
| Radian | — Radian Asset Assurance |
| RAN | — Revenue anticipation notes |
| RDA | — Redevelopment Authority |
| RDFA | — Redevelopment Finance Authority |
| REIT | — Real estate investment trust |
| ROC | — Reset option certificates |
| SAVRS | — Select auction variable rate securities |
| SBA | — Small Business Authority |
| SDR | — Swedish depositary receipt |
| SFHR | — Single-family housing revenue |
| SFMR | — Single-family mortgage revenue |
| SPA | — Standby purchase agreement |
| SPDR | — Standard & Poor’s Depositary Receipts |
| SPEAR | — Short Puttable Exempt Adjustable Receipts |
| STRIPS | — Separate trading of registered interest and |
| TAN | — Tax anticipation notes |
| TIPS | — Treasury inflation-protected securities |
| TRAN | — Tax revenue anticipation notes |
| TTFA | — Transportation Trust Fund Authority |
| TVA | — Tennessee Valley Authority |
This page is intentionally left blank.
This page is intentionally left blank.

For more information
More information about Wells Fargo Funds is available free upon request. To obtain literature, please write, email, visit the Fund’s website, or call:
Wells Fargo Funds
P.O. Box 8266
Boston, MA 02266-8266
Email: fundservice@wellsfargo.com
Website: wellsfargofunds.com
Individual investors: 1-800-222-8222
Retail investment professionals: 1-888-877-9275
Institutional investment professionals: 1-866-765-0778
This report and the financial statements contained herein are submitted for the general information of the shareholders of the Fund. If this report is used for promotional purposes, distribution of the report must be accompanied or preceded by a current prospectus. Before investing, please consider the investment objectives, risks, charges, and expenses of the investment. For a current prospectus and, if available, a summary prospectus, containing this information, call
1-800-222-8222 or visit the Fund’s website at wellsfargofunds.com. Read the prospectus carefully before you invest or send money.
Wells Fargo Asset Management (WFAM) is a trade name used by the asset management businesses of Wells Fargo & Company. Wells Fargo Funds Management, LLC, a wholly owned subsidiary of Wells Fargo & Company, provides investment advisory and administrative services for Wells Fargo Funds. Other affiliates of Wells Fargo & Company provide subadvisory and other services for the funds. The funds are distributed by Wells Fargo Funds Distributor, LLC, Member FINRA, an affiliate of Wells Fargo & Company. Neither Wells Fargo Funds Management nor Wells Fargo Funds Distributor has Fund customer accounts/assets, and neither provides investment advice/recommendations or acts as an investment advice fiduciary to any investor.
NOT FDIC INSURED ¡ NO BANK GUARANTEE ¡ MAY LOSE VALUE
© 2016 Wells Fargo Funds Management, LLC. All rights reserved.
| | |
 | | 246391 11-16 A263/AR263 09-16 |
Annual Report
September 30, 2016

Wells Fargo C&B Mid Cap Value Fund


Reduce clutter. Save trees.
Sign up for electronic delivery of prospectuses and shareholder reports at wellsfargo.com/advantagedelivery
Contents
The views expressed and any forward-looking statements are as of September 30, 2016, unless otherwise noted, and are those of the Fund managers and/or Wells Fargo Funds Management, LLC. Discussions of individual securities, or the markets generally, or any Wells Fargo Fund are not intended as individual recommendations. Future events or results may vary significantly from those expressed in any forward-looking statements. The views expressed are subject to change at any time in response to changing circumstances in the market. Wells Fargo Funds Management, LLC and the Fund disclaim any obligation to publicly update or revise any views expressed or forward-looking statements.
NOT FDIC INSURED ¡ NO BANK GUARANTEE ¡ MAY LOSE VALUE
| | | | |
| 2 | | Wells Fargo C&B Mid Cap Value Fund | | Letter to shareholders (unaudited) |

Karla M. Rabusch
President
Wells Fargo Funds
Dear Shareholder:
We are pleased to offer you this annual report for the Wells Fargo C&B Mid Cap Value Fund for the 12-month period that ended September 30, 2016. During this period, which began October 1, 2015, U.S. and international stock markets experienced bouts of heightened volatility, with intermittent sell-offs interspersed with rebounds. Despite market fluctuations throughout the year, U.S. small-, mid-, and large-cap stocks delivered double-digit positive results overall for the 12-month reporting period, as measured by the Russell 2000® Index,1 the Russell Midcap® Index,2 and the Russell 1000® Index,3 respectively. Small-cap U.S. stocks performed best, followed by large- and mid-cap stocks. International stocks overall also delivered positive results for the period.
Despite ongoing concerns, U.S. stocks generally rose in the fourth quarter of 2015; international markets lagged.
While U.S. stocks overall delivered favorable results in the quarter, stock markets outside the U.S. failed to keep pace as economic concerns, including China’s ongoing slowdown, continued to affect many countries. U.S. economic data released during the quarter indicated the economy remained solid, although the strong U.S. dollar and weakness in international economies remained headwinds. In December, the Federal Reserve (Fed), as expected, raised its target interest rate by 25 basis points (100 basis points equals 1.00%) after keeping it near zero for seven years. The move reflected confidence in the U.S. economy’s ability to stay healthy with less central-bank support. The Fed also clarified that future interest-rate increases would be gradual.
In the first quarter of 2016, market volatility increased globally amid ongoing concerns.
Stock markets worldwide fluctuated widely in the first quarter of 2016. Most sold off sharply in the first six weeks of the year on concerns such as weak global growth, falling commodity prices, and uncertainty over the timing and impact of the Fed’s interest-rate increases. As the quarter progressed, fears abated somewhat and global markets generally rallied. The U.S. economy ended the quarter on a positive note as much of the quarter’s data reflected resiliency. With ongoing uncertainties about global growth and financial markets, however, the Fed held off from raising the target interest rate during the quarter. Outside the U.S., the eurozone fell into deflation in February; in response, the European Central Bank (ECB) announced an expansion of its stimulus program. In China, the government in March set an anticipated growth rate of 6.5% to 7.0% for 2016, an acknowledgment of weakening growth. In emerging markets, although central-bank stimulus and improved prices for oil and other commodities led to stock-market rallies in the quarter, many of these countries’ economies face the potential of credit downgrades due to challenges such as the likelihood of a stronger U.S. dollar, which would make dollar-denominated debt more expensive.
Worries over interest rates and the U.K.’s Brexit vote largely drove markets during the second quarter of 2016.
U.S. stocks began the quarter in positive territory but started to lose steam in early May on worries that a possible June interest-rate increase by the Fed could hurt
| 1 | The Russell 2000® Index measures the performance of the 2,000 smallest companies in the Russell 3000® Index, which represents approximately 8% of the total market capitalization of the Russell 3000® Index. You cannot invest directly in an index. |
| 2 | The Russell Midcap® Index measures the performance of the 800 smallest companies in the Russell 1000® Index, which represent approximately 25% of the total market capitalization of the Russell 1000® Index. You cannot invest directly in an index. |
| 3 | The Russell 1000® Index measures the performance of the 1,000 largest companies in the Russell 3000® Index, which represents approximately 92% of the total market capitalization of the Russell 3000® Index. You cannot invest directly in an index. |
| | | | | | |
| Letter to shareholders (unaudited) | | Wells Fargo C&B Mid Cap Value Fund | | | 3 | |
the market. In mid-May, stocks briefly plunged following comments by Fed officials noting that a June interest-rate increase remained on the table. But once investors had processed this information, stocks again rallied, finishing up for the month. The first three weeks of June brought heightened volatility, spurred largely by a disappointing jobs report and uncertainty over whether the U.K. would remain in the E.U. The U.K.’s Brexit vote on June 23 shocked countries in Europe and much of the rest of the world. Stock markets fell as investors worried that the U.K.’s departure from the E.U. would slow global growth and prolong the low-interest-rate environment. Following the initial rout, however, U.S. stocks rallied as investors seemed to decide that any negative effects would be more localized and not create a serious risk for global growth. By quarter-end, the broad U.S. stock market had moved back into positive territory.
U.S. stocks delivered generally positive results in the third quarter of 2016.
The rally in U.S. stocks continued into early July 2016. U.S. stocks then generally continued to move upward at a more moderate pace, reaching a quarterly peak in August before the upward momentum started to lose some steam. Markets worldwide have been supported to varying degrees by accommodative policies from leading central banks, including the Fed, ECB, Bank of England, and Bank of Japan. As a result, investors have watched closely for any signs that global central banks might tighten their measures. Although many U.S. investors had doubted the Fed would increase interest rates in September, hawkish comments by several Fed officials in early September raised concerns, sending stock and bond prices downward. However, immediately following the Fed’s September 20 meeting, stocks surged on news that the Fed had decided to leave short-term interest rates unchanged for the time being and had signaled its intention to increase rates by year-end. The Fed also lowered its estimates for long-term economic growth and adjusted its anticipated pace of future rate increases. U.S. small-cap stocks in particular benefited from a renewed investor focus on fundamentals and from healthy merger and acquisition activity.
Don’t let short-term uncertainty derail long-term investment goals.
Periods of uncertainty can present challenges, but experience has taught us that maintaining long-term investment goals can be an effective way to plan for the future. To help you create a sound strategy based on your personal goals and risk tolerance, Wells Fargo Funds offers more than 100 mutual funds spanning a wide range of asset classes and investment styles. Although diversification cannot guarantee an investment profit or prevent losses, we believe it can be an effective way to manage investment risk and potentially smooth out overall portfolio performance. We encourage investors to know their investments and to understand that appropriate levels of risk-taking may unlock opportunities.
Thank you for choosing to invest in Wells Fargo Funds. We appreciate your confidence in us and remain committed to helping you meet your financial needs.
Sincerely,

Karla M. Rabusch
President
Wells Fargo Funds
Markets worldwide have been supported to varying degrees by accommodative policies from leading central banks, including the Fed, ECB, Bank of England, and Bank of Japan.
Although diversification cannot guarantee an investment profit or prevent losses, we believe it can be an effective way to manage investment risk and potentially smooth out overall portfolio performance.
For further information about your Fund, contact your investment professional, visit our website at wellsfargofunds.com, or call us directly at 1-800-222-8222. We are available 24 hours a day, 7 days a week.
| | | | |
| 4 | | Wells Fargo C&B Mid Cap Value Fund | | Performance highlights (unaudited) |
Investment objective
The Fund seeks maximum long-term return (current income and capital appreciation), consistent with minimizing risk to principal.
Manager
Wells Fargo Funds Management, LLC
Subadviser
Cooke and Bieler, L.P.
Portfolio managers
Andrew B. Armstrong, CFA®
Steve Lyons, CFA®
Michael M. Meyer, CFA®
Edward W. O’Connor, CFA®
R. James O’Neil, CFA®
Mehul Trivedi, CFA®
William Weber, CFA®
Average annual total returns (%) as of September 30, 2016
| | | | | | | | | | | | | | | | | | | | | | | | | | | | | | | | | | |
| | | | | Including sales charge | | | Excluding sales charge | | | Expense ratios1 (%) | |
| | | Inception date | | 1 year | | | 5 year | | | 10 year | | | 1 year | | | 5 year | | | 10 year | | | Gross | | | Net2 | |
| Class A (CBMAX) | | 7-26-2004 | | | 10.02 | | | | 14.97 | | | | 6.08 | | | | 16.73 | | | | 16.34 | | | | 6.71 | | | | 1.31 | | | | 1.25 | |
| Class B (CBMBX)* | | 7-26-2004 | | | 10.85 | | | | 15.25 | | | | 6.14 | | | | 15.85 | | | | 15.47 | | | | 6.14 | | | | 2.06 | | | | 2.00 | |
| Class C (CBMCX) | | 7-26-2004 | | | 14.86 | | | | 15.48 | | | | 5.91 | | | | 15.86 | | | | 15.48 | | | | 5.91 | | | | 2.06 | | | | 2.00 | |
| Administrator Class (CBMIX) | | 7-26-2004 | | | – | | | | – | | | | – | | | | 16.82 | | | | 16.40 | | | | 6.79 | | | | 1.23 | | | | 1.15 | |
| Institutional Class (CBMSX) | | 7-26-2004 | | | – | | | | – | | | | – | | | | 17.11 | | | | 16.69 | | | | 7.06 | | | | 0.98 | | | | 0.90 | |
| Russell Midcap® Value Index3 | | – | | | – | | | | – | | | | – | | | | 17.26 | | | | 17.38 | | | | 7.89 | | | | – | | | | – | |
| * | | At the close of business on December 5, 2016, existing Class B shareholders were converted to Class A shareholders. Effective December 6, 2016, Class B shares are no longer offered by the Fund. |
Figures quoted represent past performance, which is no guarantee of future results, and do not reflect taxes that a shareholder may pay on fund distributions or the redemption of fund shares. Investment return and principal value of an investment will fluctuate so that an investor’s shares, when redeemed, may be worth more or less than their original cost. Performance shown without sales charges would be lower if sales charges were reflected. Current performance may be lower or higher than the performance data quoted, which assumes the reinvestment of dividends and capital gains. Current month-end performance is available on the Fund’s website, wellsfargofunds.com.
Index returns do not include transaction costs associated with buying and selling securities, any mutual fund fees or expenses, or any taxes. It is not possible to invest directly in an index.
For Class A shares, the maximum front-end sales charge is 5.75%. For Class B shares, the maximum contingent deferred sales charge is 5.00%. For Class C shares, the maximum contingent deferred sales charge is 1.00%. Performance including a contingent deferred sales charge assumes the sales charge for the corresponding time period. Administrator Class and Institutional Class shares are sold without a front-end sales charge or contingent deferred sales charge.
Stock values fluctuate in response to the activities of individual companies and general market and economic conditions. Smaller-company stocks tend to be more volatile and less liquid than those of larger companies. Consult the Fund’s prospectus for additional information on these and other risks.
Please see footnotes on page 5.
| | | | | | |
| Performance highlights (unaudited) | | Wells Fargo C&B Mid Cap Value Fund | | | 5 | |
|
| Growth of $10,000 investment as of September 30, 20164 |
|
 |
| 1 | Reflects the expense ratios as stated in the most recent prospectuses. The expense ratios shown are subject to change and may differ from the annualized expense ratios shown in the financial highlights of this report. |
| 2 | The manager has contractually committed through January 31, 2017, to waive fees and/or reimburse expenses to the extent necessary to cap the Fund’s Total Annual Operating Expenses After Fee Waiver at the amounts shown. After this time, the cap may be increased or the commitment to maintain the cap may be terminated only with the approval of the Board of Trustees. Brokerage commissions, stamp duty fees, interest, taxes, acquired fund fees and expenses, and extraordinary expenses are excluded from the expense cap. Without this cap, the Fund’s returns would have been lower. |
| 3 | The Russell Midcap® Value Index measures the performance of those Russell Midcap companies with lower price/book ratios and lower forecasted growth values. The stocks are also members of the Russell 1000® Value Index. You cannot invest directly in an index. |
| 4 | The chart compares the performance of Class A shares for the most recent ten years with the Russell Midcap® Value Index. The chart assumes a hypothetical investment of $10,000 in Class A shares and reflects all operating expenses and assumes the maximum initial sales charge of 5.75%. |
| 5 | The ten largest holdings, excluding cash and cash equivalents, are calculated based on the value of the investments divided by total net assets of the Fund. Holdings are subject to change and may have changed since the date specified. |
| 6 | Amounts are calculated based on the total long-term investments of the Fund. These amounts are subject to change and may have changed since the date specified. |
| | | | |
| 6 | | Wells Fargo C&B Mid Cap Value Fund | | Performance highlights (unaudited) |
MANAGER’S DISCUSSION
Fund highlights
| n | | The Fund underperformed the Russell Midcap® Value Index for the 12-month period that ended September 30, 2016. |
| n | | Sector allocation negatively affected the Fund’s performance; underweights to the real estate and utilities sectors continued to drag on results. Strong stock selection contributed positively to performance, driven primarily by holdings in the consumer discretionary, health care, and energy sectors. |
| n | | Increasing economic and political uncertainties worldwide led investors to trade into higher-dividend-yielding stocks. However, we remain committed to our disciplined, fundamental stock-selection process. |
Increasing economic and political uncertainty around the globe has pushed interest rates down, and investors have responded by trading into stocks that offer the highest dividend yields. The late-June 2016 decision by U.K. voters to leave the European Union added further fuel to this trend. In this context, we believe our long-term, fundamental perspective in an increasingly short-term-oriented world may continue to drive value creation.
The primary detractor from relative performance was sector allocation, due largely to the Fund’s lack of exposure to high-dividend-yielding equity sectors.
Lack of exposure to higher-dividend-yielding equity sectors, including utilities and real estate, hindered the Fund’s performance. High valuations in these sectors have led us to refrain from currently investing in these sectors. Also, overweights to the health care, consumer discretionary, and financials sectors negatively affected results as these sectors underperformed relative to the benchmark index. Individual holdings that detracted from results included PRA Group, Incorporated; MEDNAX, Incorporated; TCF Financial Corporation; Gildan Activewear Incorporated; and Quanex Building Products Corporation.
| | | | |
| Ten largest holdings (%) as of September 30, 20165 | |
RenaissanceRe Holdings Limited | | | 3.61 | |
Laboratory Corporation of America Holdings | | | 3.18 | |
PRA Group Incorporated | | | 3.15 | |
State Street Corporation | | | 3.04 | |
Omnicom Group Incorporated | | | 2.85 | |
MEDNAX Incorporated | | | 2.82 | |
Endurance Specialty Holdings Limited | | | 2.82 | |
Crown Holdings Incorporated | | | 2.80 | |
First Cash Finacial Services Incorporated | | | 2.70 | |
TCF Financial Corporation | | | 2.68 | |
|
| Sector distribution as of September 30, 20166 |
|
[CHART] |
Stock selection delivered the primary contribution to the Fund’s relative performance during the 12-month period.
A number of the Fund’s holdings generated strong returns, especially in the consumer discretionary, health care, and energy sectors. Among individual stocks, contributors included Woodward, Incorporated; Reliance Steel & Aluminum Company; Tetra Tech Incorporated; Penske Automotive Group, Incorporated; and Linear Technology Corporation.
During the period, we added a number of holdings to the Fund and exited some other positions.
Our investment process has continued to function well, and volatility in the market has allowed us to uncover a number of potentially attractive opportunities. During the 12-month period, we purchased companies with, in our view, attractive valuations as well as companies that may enhance our strategic positioning. These included the following: Alliance Data Systems Corporation, a data-driven and transaction-based provider of loyalty and marketing solutions; AMETEK, Incorporated, a global manufacturer of electronic instruments and electrochemical devices; Axalta Coating Systems Limited, a manufacturer of coatings for industrial applications; Brinker International, Incorporated, a leading casual-dining restaurant company; CBRE Group, Incorporated, the world’s largest commercial real estate-services provider; Penske Automotive Group, Incorporated,
Please see footnotes on page 5.
| | | | | | |
| Performance highlights (unaudited) | | Wells Fargo C&B Mid Cap Value Fund | | | 7 | |
a leading automotive retailer; SVB Financial Group, a commercial bank; Tiffany & Company, a high-end jewelry retailer; United Natural Foods, Incorporated, a specialty foods distributor; and Whirlpool Corporation, a global manufacturer of home appliances.
We eliminated several positions that had reached our valuation targets: Devon Energy Corporation, an independent natural gas and petroleum producer; G&K Services, Incorporated, a workplace uniform and facilities services provider; Hasbro, Incorporated, a multinational toy manufacturer; Kennametal Incorporated, a manufacturer of highly engineered metal tools and materials; Steelcase Incorporated, a designer, manufacturer, and marketer of office furniture; Stewart Information Services Corporation, a global title-insurance and real estate-services company; and Teleflex Incorporated, a provider of specialty medical devices.
We also eliminated Noble Energy, Incorporated, a petroleum and natural gas exploration and production company, as we felt investors had become overly enthusiastic about its prospects. We eliminated Knowles Corporation, a provider of components and services for a broad range of hearing instruments, when we became disappointed with some recent management decisions and found a solid exit opportunity.
We remain focused on our process and optimistic about the future.
Although certain areas of the market currently appear expensive in terms of valuations, we remain generally constructive on the economy and the equity market and especially on the Fund’s positioning in stocks that we view as high quality. Perhaps more than any other major stock index, the Russell Midcap® Value Index has challenged active managers for a number of years. It has heavy allocations to sectors heavily composed of high-dividend-yielding stocks that can serve as bond proxies; as interest rates have fallen, those sectors have done well. While some active managers have thrown in the towel in the face of this challenge, we have stayed true to our belief that long-term success is built by holding positions in companies that display attractive fundamentals and not just attractive current yields. We are confident in the Fund’s portfolio of financially strong companies with favorable underlying economics. We believe our patience may be rewarded, driven by our disciplined, fundamental stock-selection process.
Please see footnotes on page 5.
| | | | |
| 8 | | Wells Fargo C&B Mid Cap Value Fund | | Fund expenses (unaudited) |
As a shareholder of the Fund, you incur two types of costs: (1) transaction costs, including sales charges (loads) on purchase payments and contingent deferred sales charges (if any) on redemptions and (2) ongoing costs, including management fees, distribution (12b-1) and/or shareholder servicing fees, and other Fund expenses. This example is intended to help you understand your ongoing costs (in dollars) of investing in the Fund and to compare these costs with the ongoing costs of investing in other mutual funds.
The example is based on an investment of $1,000 invested at the beginning of the six-month period and held for the
entire period from April 1, 2016 to September 30, 2016.
Actual expenses
The “Actual” line of the table below provides information about actual account values and actual expenses. You may use the information in this line, together with the amount you invested, to estimate the expenses that you paid over the period. Simply divide your account value by $1,000 (for example, an $8,600 account value divided by $1,000 = 8.6), then multiply the result by the number in the “Actual” line under the heading entitled “Expenses paid during period” for your applicable class of shares to estimate the expenses you paid on your account during this period.
Hypothetical example for comparison purposes
The “Hypothetical” line of the table below provides information about hypothetical account values and hypothetical expenses based on the Fund’s actual expense ratio and an assumed rate of return of 5% per year before expenses, which is not the Fund’s actual return. The hypothetical account values and expenses may not be used to estimate the actual ending account balance or expenses you paid for the period. You may use this information to compare the ongoing costs of investing in the Fund and other funds. To do so, compare this 5% hypothetical example with the 5% hypothetical examples that appear in the shareholder reports of the other funds.
Please note that the expenses shown in the table are meant to highlight your ongoing costs only and do not reflect any transactional costs, such as sales charges (loads) and contingent deferred sales charges. Therefore, the “Hypothetical” line of the table is useful in comparing ongoing costs only and will not help you determine the relative total costs of owning different funds. In addition, if these transactional costs were included, your costs would have been higher.
| | | | | | | | | | | | | | | | |
| | | Beginning
account value
4-1-2016 | | | Ending
account value
9-30-2016 | | | Expenses
paid during
the period¹ | | | Annualized net
expense ratio | |
Class A | | | | | | | | | | | | | | | | |
Actual | | $ | 1,000.00 | | | $ | 1,084.48 | | | $ | 6.51 | | | | 1.25 | % |
Hypothetical (5% return before expenses) | | $ | 1,000.00 | | | $ | 1,018.75 | | | $ | 6.31 | | | | 1.25 | % |
Class B | | | | | | | | | | | | | | | | |
Actual | | $ | 1,000.00 | | | $ | 1,080.50 | | | $ | 10.40 | | | | 2.00 | % |
Hypothetical (5% return before expenses) | | $ | 1,000.00 | | | $ | 1,015.00 | | | $ | 10.08 | | | | 2.00 | % |
Class C | | | | | | | | | | | | | | | | |
Actual | | $ | 1,000.00 | | | $ | 1,080.36 | | | $ | 10.40 | | | | 2.00 | % |
Hypothetical (5% return before expenses) | | $ | 1,000.00 | | | $ | 1,015.00 | | | $ | 10.08 | | | | 2.00 | % |
Administrator Class | | | | | | | | | | | | | | | | |
Actual | | $ | 1,000.00 | | | $ | 1,084.95 | | | $ | 5.99 | | | | 1.15 | % |
Hypothetical (5% return before expenses) | | $ | 1,000.00 | | | $ | 1,019.25 | | | $ | 5.81 | | | | 1.15 | % |
Institutional Class | | | | | | | | | | | | | | | | |
Actual | | $ | 1,000.00 | | | $ | 1,086.46 | | | $ | 4.69 | | | | 0.90 | % |
Hypothetical (5% return before expenses) | | $ | 1,000.00 | | | $ | 1,020.50 | | | $ | 4.55 | | | | 0.90 | % |
| 1 | Expenses paid is equal to the annualized net expense ratio of each class multiplied by the average account value over the period, multiplied by the number of days in the most recent fiscal half-year divided by the number of days in the fiscal year (to reflect the one-half-year period). |
| | | | | | |
| Portfolio of investments—September 30, 2016 | | Wells Fargo C&B Mid Cap Value Fund | | | 9 | |
| | | | | | | | | | | | | | | | |
| Security name | | | | | | | | Shares | | | Value | |
| | | | |
Common Stocks: 98.83% | | | | | | | | | | | | | | | | |
| | | | |
Consumer Discretionary: 14.63% | | | | | | | | | | | | | | | | |
| | | | |
| Automobiles: 0.98% | | | | | | | | | | | | | | | | |
Winnebago Industries Incorporated | | | | | | | | | | | 72,000 | | | $ | 1,697,040 | |
| | | | | | | | | | | | | | | | |
| | | | |
| Hotels, Restaurants & Leisure: 1.44% | | | | | | | | | | | | | | | | |
Brinker International Incorporated | | | | | | | | | | | 49,600 | | | | 2,501,328 | |
| | | | | | | | | | | | | | | | |
| | | | |
| Household Durables: 2.38% | | | | | | | | | | | | | | | | |
Helen of Troy Limited † | | | | | | | | | | | 22,700 | | | | 1,956,059 | |
Whirlpool Corporation | | | | | | | | | | | 13,500 | | | | 2,189,160 | |
| | | | |
| | | | | | | | | | | | | | | 4,145,219 | |
| | | | | | | | | | | | | | | | |
| | | | |
| Media: 2.85% | | | | | | | | | | | | | | | | |
Omnicom Group Incorporated | | | | | | | | | | | 58,300 | | | | 4,955,500 | |
| | | | | | | | | | | | | | | | |
| | | | |
| Specialty Retail: 4.86% | | | | | | | | | | | | | | | | |
Penske Auto Group Incorporated « | | | | | | | | | | | 53,000 | | | | 2,553,540 | |
Sally Beauty Holdings Incorporated † | | | | | | | | | | | 152,400 | | | | 3,913,632 | |
Tiffany & Company | | | | | | | | | | | 27,300 | | | | 1,982,799 | |
| | | | |
| | | | | | | | | | | | | | | 8,449,971 | |
| | | | | | | | | | | | | | | | |
| | | | |
| Textiles, Apparel & Luxury Goods: 2.12% | | | | | | | | | | | | | | | | |
Gildan Activewear Incorporated « | | | | | | | | | | | 131,800 | | | | 3,683,810 | |
| | | | | | | | | | | | | | | | |
| | | | |
Consumer Staples: 1.21% | | | | | | | | | | | | | | | | |
| | | | |
| Food & Staples Retailing: 1.21% | | | | | | | | | | | | | | | | |
United Natural Foods Incorporated † | | | | | | | | | | | 52,500 | | | | 2,102,100 | |
| | | | | | | | | | | | | | | | |
| | | | |
Energy: 1.78% | | | | | | | | | | | | | | | | |
| | | | |
| Oil, Gas & Consumable Fuels: 1.78% | | | | | | | | | | | | | | | | |
World Fuel Services Corporation | | | | | | | | | | | 67,000 | | | | 3,099,420 | |
| | | | | | | | | | | | | | | | |
| | | | |
Financials: 28.49% | | | | | | | | | | | | | | | | |
| | | | |
| Banks: 7.24% | | | | | | | | | | | | | | | | |
Commerce Bancshares Incorporated | | | | | | | | | | | 73,802 | | | | 3,635,487 | |
SVB Financial Group † | | | | | | | | | | | 38,800 | | | | 4,288,952 | |
TCF Financial Corporation | | | | | | | | | | | 320,800 | | | | 4,654,808 | |
| | | | |
| | | | | | | | | | | | | | | 12,579,247 | |
| | | | | | | | | | | | | | | | |
| | | | |
| Capital Markets: 3.04% | | | | | | | | | | | | | | | | |
State Street Corporation | | | | | | | | | | | 75,900 | | | | 5,284,917 | |
| | | | | | | | | | | | | | | | |
| | | | |
| Consumer Finance: 5.86% | | | | | | | | | | | | | | | | |
First Cash Finacial Services Incorporated | | | | | | | | | | | 99,900 | | | | 4,703,292 | |
PRA Group Incorporated † | | | | | | | | | | | 158,800 | | | | 5,484,952 | |
| | | | |
| | | | | | | | | | | | | | | 10,188,244 | |
| | | | | | | | | | | | | | | | |
The accompanying notes are an integral part of these financial statements.
| | | | |
| 10 | | Wells Fargo C&B Mid Cap Value Fund | | Portfolio of investments—September 30, 2016 |
| | | | | | | | | | | | | | | | |
| Security name | | | | | | | | Shares | | | Value | |
| | | | |
| Insurance: 12.35% | | | | | | | | | | | | | | | | |
Endurance Specialty Holdings Limited | | | | | | | | | | | 74,900 | | | $ | 4,902,205 | |
FNF Group | | | | | | | | | | | 113,200 | | | | 4,178,212 | |
RenaissanceRe Holdings Limited | | | | | | | | | | | 52,300 | | | | 6,284,368 | |
The Progressive Corporation | | | | | | | | | | | 104,090 | | | | 3,278,835 | |
Torchmark Corporation | | | | | | | | | | | 44,400 | | | | 2,836,716 | |
| | | | |
| | | | | | | | | | | | | | | 21,480,336 | |
| | | | | | | | | | | | | | | | |
| | | | |
Health Care: 9.80% | | | | | | | | | | | | | | | | |
| | | | |
| Health Care Equipment & Supplies: 1.54% | | | | | | | | | | | | | | | | |
Becton Dickinson & Company | | | | | | | | | | | 14,900 | | | | 2,677,977 | |
| | | | | | | | | | | | | | | | |
| | | | |
| Health Care Providers & Services: 8.26% | | | | | | | | | | | | | | | | |
Cardinal Health Incorporated | | | | | | | | | | | 50,500 | | | | 3,923,850 | |
Laboratory Corporation of America Holdings † | | | | | | | | | | | 40,200 | | | | 5,526,696 | |
MEDNAX Incorporated † | | | | | | | | | | | 74,100 | | | | 4,909,125 | |
| | | | |
| | | | | | | | | | | | | | | 14,359,671 | |
| | | | | | | | | | | | | | | | |
| | | | |
Industrials: 23.25% | | | | | | | | | | | | | | | | |
| | | | |
| Aerospace & Defense: 2.01% | | | | | | | | | | | | | | | | |
Rockwell Collins Incorporated | | | | | | | | | | | 41,500 | | | | 3,500,110 | |
| | | | | | | | | | | | | | | | |
| | | | |
| Building Products: 2.01% | | | | | | | | | | | | | | | | |
Quanex Building Products Corporation | | | | | | | | | | | 203,100 | | | | 3,505,506 | |
| | | | | | | | | | | | | | | | |
| | | | |
| Commercial Services & Supplies: 1.85% | | | | | | | | | | | | | | | | |
Tetra Tech Incorporated | | | | | | | | | | | 90,600 | | | | 3,213,582 | |
| | | | | | | | | | | | | | | | |
| | | | |
| Electrical Equipment: 3.72% | | | | | | | | | | | | | | | | |
AMETEK Incorporated | | | | | | | | | | | 45,100 | | | | 2,154,878 | |
Eaton Corporation plc | | | | | | | | | | | 65,700 | | | | 4,317,147 | |
| | | | |
| | | | | | | | | | | | | | | 6,472,025 | |
| | | | | | | | | | | | | | | | |
| | | | |
| Machinery: 8.22% | | | | | | | | | | | | | | | | |
Donaldson Company Incorporated | | | | | | | | | | | 69,700 | | | | 2,601,901 | |
Graco Incorporated | | | | | | | | | | | 42,200 | | | | 3,122,800 | |
Parker-Hannifin Corporation | | | | | | | | | | | 32,300 | | | | 4,054,619 | |
Woodward Governor Company | | | | | | | | | | | 72,200 | | | | 4,511,056 | |
| | | | |
| | | | | | | | | | | | | | | 14,290,376 | |
| | | | | | | | | | | | | | | | |
| | | | |
| Trading Companies & Distributors: 5.44% | | | | | | | | | | | | | | | | |
AerCap Holdings NV † | | | | | | | | | | | 119,400 | | | | 4,595,706 | |
W.W. Grainger Incorporated | | | | | | | | | | | 11,100 | | | | 2,495,724 | |
WESCO International Incorporated † | | | | | | | | | | | 38,400 | | | | 2,361,216 | |
| | | | |
| | | | | | | | | | | | | | | 9,452,646 | |
| | | | | | | | | | | | | | | | |
| | | | |
Information Technology: 8.73% | | | | | | | | | | | | | | | | |
| | | | |
| IT Services: 4.44% | | | | | | | | | | | | | | | | |
Alliance Data Systems Corporation † | | | | | | | | | | | 16,700 | | | | 3,582,651 | |
Moneygram International Incorporated † | | | | | | | | | | | 292,493 | | | | 2,076,700 | |
The accompanying notes are an integral part of these financial statements.
| | | | | | |
| Portfolio of investments—September 30, 2016 | | Wells Fargo C&B Mid Cap Value Fund | | | 11 | |
| | | | | | | | | | | | | | | | |
| Security name | | | | | | | | Shares | | | Value | |
| | | | |
| IT Services (continued) | | | | | | | | | | | | | | | | |
The Western Union Company | | | | | | | | | | | 99,000 | | | $ | 2,061,180 | |
| | | | |
| | | | | | | | | | | | | | | 7,720,531 | |
| | | | | | | | | | | | | | | | |
| | | | |
| Semiconductors & Semiconductor Equipment: 4.29% | | | | | | | | | | | | | | | | |
Entegris Incorporated † | | | | | | | | | | | 194,900 | | | | 3,395,158 | |
Linear Technology Corporation | | | | | | | | | | | 68,600 | | | | 4,067,294 | |
| | | | |
| | | | | | | | | | | | | | | 7,462,452 | |
| | | | | | | | | | | | | | | | |
| | | | |
Materials: 9.96% | | | | | | | | | | | | | | | | |
| | | | |
| Chemicals: 1.90% | | | | | | | | | | | | | | | | |
Axalta Coating Systems Limited † | | | | | | | | | | | 117,100 | | | | 3,310,417 | |
| | | | | | | | | | | | | | | | |
| | | | |
| Containers & Packaging: 4.45% | | | | | | | | | | | | | | | | |
Ball Corporation | | | | | | | | | | | 35,000 | | | | 2,868,250 | |
Crown Holdings Incorporated † | | | | | | | | | | | 85,300 | | | | 4,869,777 | |
| | | | |
| | | | | | | | | | | | | | | 7,738,027 | |
| | | | | | | | | | | | | | | | |
| | | | |
| Metals & Mining: 1.40% | | | | | | | | | | | | | | | | |
Reliance Steel & Aluminum Company | | | | | | | | | | | 33,800 | | | | 2,434,614 | |
| | | | | | | | | | | | | | | | |
| | | | |
| Paper & Forest Products: 2.21% | | | | | | | | | | | | | | | | |
Schweitzer-Mauduit International Incorporated | | | | | | | | | | | 99,500 | | | | 3,836,720 | |
| | | | | | | | | | | | | | | | |
| | | | |
Real Estate: 0.98% | | | | | | | | | | | | | | | | |
| | | | |
| Real Estate Management & Development: 0.98% | | | | | | | | | | | | | | | | |
CBRE Group Incorporated Class A † | | | | | | | | | | | 60,900 | | | | 1,703,982 | |
| | | | | | | | | | | | | | | | |
| | | | |
Total Common Stocks (Cost $142,311,285) | | | | | | | | | | | | | | | 171,845,768 | |
| | | | | | | | | | | | | | | | |
| | | | |
| | | Yield | | | | | | | | | | |
| Short-Term Investments: 4.54% | | | | | | | | | | | | | | | | |
| | | | |
| Investment Companies: 4.54% | | | | | | | | | | | | | | | | |
Securities Lending Cash Investments LLC (l)(r)(u) | | | 0.65 | % | | | | | | | 5,691,200 | | | | 5,691,200 | |
Wells Fargo Government Money Market Fund Select Class (l)(u) | | | 0.34 | | | | | | | | 2,192,563 | | | | 2,192,563 | |
| |
Total Short-Term Investments (Cost $7,883,763) | | | | 7,883,763 | |
| | | | | | | | | | | | | | | | |
| | | | | | | | |
| Total investments in securities (Cost $150,195,048) * | | | 103.37 | % | | | 179,729,531 | |
Other assets and liabilities, net | | | (3.37 | ) | | | (5,854,152 | ) |
| | | | | | | | |
| Total net assets | | | 100.00 | % | | $ | 173,875,379 | |
| | | | | | | | |
| † | Non-income-earning security |
| « | All or a portion of this security is on loan. |
| (l) | The issuer of the security is an affiliated person of the Fund as defined in the Investment Company Act of 1940. |
| (r) | The investment is a non-registered investment vehicle purchased with cash collateral received from securities on loan. |
| (u) | The rate represents the 7-day annualized yield at period end. |
| * | Cost for federal income tax purposes is $150,679,658 and unrealized gains (losses) consists of: |
| | | | |
Gross unrealized gains | | $ | 32,859,197 | |
Gross unrealized losses | | | (3,809,324 | ) |
| | | | |
Net unrealized gains | | $ | 29,049,873 | |
The accompanying notes are an integral part of these financial statements.
| | | | |
| 12 | | Wells Fargo C&B Mid Cap Value Fund | | Statement of assets and liabilities—September 30, 2016 |
| | | | |
| | | | |
| |
Assets | | | | |
Investments | | | | |
In unaffiliated securities (including $5,619,260 of securities loaned), at value (cost $142,311,285) | | $ | 171,845,768 | |
In affiliated securities, at value (cost $7,883,763) | | | 7,883,763 | |
| | | | |
Total investments, at value (cost $150,195,048) | | | 179,729,531 | |
Receivable for Fund shares sold | | | 77,471 | |
Receivable for dividends | | | 100,444 | |
Receivable for securities lending income | | | 2,556 | |
Prepaid expenses and other assets | | | 34,867 | |
| | | | |
Total assets | | | 179,944,869 | |
| | | | |
| |
Liabilities | | | | |
Payable for Fund shares redeemed | | | 168,138 | |
Payable upon receipt of securities loaned | | | 5,691,200 | |
Management fee payable | | | 101,690 | |
Distribution fees payable | | | 4,799 | |
Administration fees payable | | | 28,704 | |
Accrued expenses and other liabilities | | | 74,959 | |
| | | | |
Total liabilities | | | 6,069,490 | |
| | | | |
Total net assets | | $ | 173,875,379 | |
| | | | |
| |
NET ASSETS CONSIST OF | | | | |
Paid-in capital | | $ | 218,706,521 | |
Undistributed net investment income | | | 242,876 | |
Accumulated net realized losses on investments | | | (74,608,501 | ) |
Net unrealized gains on investments | | | 29,534,483 | |
| | | | |
Total net assets | | $ | 173,875,379 | |
| | | | |
| |
COMPUTATION OF NET ASSET VALUE AND OFFERING PRICE PER SHARE | | | | |
Net assets – Class A | | $ | 120,020,373 | |
Shares outstanding – Class A1 | | | 4,100,182 | |
Net asset value per share – Class A | | | $29.27 | |
Maximum offering price per share – Class A2 | | | $31.06 | |
Net assets – Class B | | $ | 77,990 | |
Shares outstanding – Class B1 | | | 2,793 | |
Net asset value per share – Class B | | | $27.92 | |
Net assets – Class C | | $ | 7,314,270 | |
Shares outstanding – Class C1 | | | 262,796 | |
Net asset value per share – Class C | | | $27.83 | |
Net assets – Administrator Class | | $ | 8,302,160 | |
Shares outstanding – Administrator Class1 | | | 280,178 | |
Net asset value per share – Administrator Class | | | $29.63 | |
Net assets – Institutional Class | | $ | 38,160,586 | |
Shares outstanding – Institutional Class1 | | | 1,292,250 | |
Net asset value per share – Institutional Class | | | $29.53 | |
| 1 | The Fund has an unlimited number of authorized shares. |
| 2 | Maximum offering price is computed as 100/94.25 of net asset value. On investments of $50,000 or more, the offering price is reduced. |
The accompanying notes are an integral part of these financial statements.
| | | | | | |
| Statement of operations—year ended September 30, 2016 | | Wells Fargo C&B Mid Cap Value Fund | | | 13 | |
| | | | |
| | | | |
| |
Investment income | | | | |
Dividends (net of foreign withholding taxes of $6,884) | | $ | 2,325,207 | |
Securities lending income, net | | | 32,060 | |
Income from affiliated securities | | | 16,094 | |
| | | | |
Total investment income | | | 2,373,361 | |
| | | | |
| |
Expenses | | | | |
Management fee | | | 1,238,509 | |
Administration fees | | | | |
Class A | | | 248,527 | |
Class B | | | 202 | |
Class C | | | 14,747 | |
Administrator Class | | | 11,030 | |
Institutional Class | | | 31,026 | |
Investor Class | | | 23,421 | 1 |
Shareholder servicing fees | | | | |
Class A | | | 295,866 | |
Class B | | | 241 | |
Class C | | | 17,556 | |
Administrator Class | | | 21,211 | |
Investor Class | | | 18,297 | 1 |
Distribution fees | | | | |
Class B | | | 721 | |
Class C | | | 52,668 | |
Custody and accounting fees | | | 18,488 | |
Professional fees | | | 40,270 | |
Registration fees | | | 68,621 | |
Shareholder report expenses | | | 49,643 | |
Trustees’ fees and expenses | | | 15,942 | |
Other fees and expenses | | | 9,321 | |
| | | | |
Total expenses | | | 2,176,307 | |
Less: Fee waivers and/or expense reimbursements | | | (169,341 | ) |
| | | | |
Net expenses | | | 2,006,966 | |
| | | | |
Net investment income | | | 366,395 | |
| | | | |
| |
REALIZED AND UNREALIZED GAINS (LOSSES) ON INVESTMENTS | | | | |
Net realized gains on investments | | | 7,300,682 | |
Net change in unrealized gains (losses) on investments | | | 17,600,698 | |
| | | | |
Net realized and unrealized gains (losses) on investments | | | 24,901,380 | |
| | | | |
Net increase in net assets resulting from operations | | $ | 25,267,775 | |
| | | | |
| 1 | For the period from October 1, 2015 to October 23, 2015. Effective at the close of business on October 23, 2015, Investor Class shares were converted to Class A shares and are no longer offered by the Fund. |
The accompanying notes are an integral part of these financial statements.
| | | | |
| 14 | | Wells Fargo C&B Mid Cap Value Fund | | Statement of changes in net assets |
| | | | | | | | | | | | | | | | |
| | | Year ended
September 30, 2016 | | | Year ended
September 30, 2015 | |
| | | | |
Operations | | | | | | | | | | | | | | | | |
Net investment income | | | | | | $ | 366,395 | | | | | | | $ | 307,783 | |
Net realized gains on investments | | | | | | | 7,300,682 | | | | | | | | 21,451,778 | |
Net change in unrealized gains (losses) on investments | | | | | | | 17,600,698 | | | | | | | | (19,714,772 | ) |
| | | | |
Net increase in net assets resulting from operations | | | | | | | 25,267,775 | | | | | | | | 2,044,789 | |
| | | | |
| | | | |
Distributions to shareholders from | | | | | | | | | | | | | | | | |
Net investment income | | | | | | | | | | | | | | | | |
Class A | | | | | | | (221,257 | ) | | | | | | | (42,042 | ) |
Administrator Class | | | | | | | (20,557 | ) | | | | | | | (21,549 | ) |
Institutional Class | | | | | | | (109,235 | ) | | | | | | | (168,429 | ) |
Investor Class | | | | | | | 0 | 1 | | | | | | | (138,589 | ) |
| | | | |
Total distributions to shareholders | | | | | | | (351,049 | ) | | | | | | | (370,609 | ) |
| | | | |
| | | | |
Capital share transactions | | | Shares | | | | | | | | Shares | | | | | |
Proceeds from shares sold | | | | | | | | | | | | | | | | |
Class A | | | 4,470,268 | | | | 119,152,053 | | | | 72,922 | | | | 1,938,440 | |
Class B | | | 0 | | | | 0 | | | | 307 | | | | 8,000 | |
Class C | | | 34,688 | | | | 897,420 | | | | 25,429 | | | | 655,305 | |
Administrator Class | | | 23,525 | | | | 632,143 | | | | 32,971 | | | | 883,924 | |
Institutional Class | | | 948,461 | | | | 26,675,954 | | | | 316,984 | | | | 8,567,375 | |
Investor Class | | | 29,800 | 1 | | | 784,378 | 1 | | | 538,848 | | | | 14,534,157 | |
| | | | |
| | | | | | | 148,141,948 | | | | | | | | 26,587,201 | |
| | | | |
Reinvestment of distributions | | | | | | | | | | | | | | | | |
Class A | | | 8,427 | | | | 219,598 | | | | 1,632 | | | | 41,628 | |
Administrator Class | | | 474 | | | | 12,485 | | | | 502 | | | | 12,938 | |
Institutional Class | | | 2,752 | | | | 72,162 | | | | 4,856 | | | | 124,658 | |
Investor Class | | | 0 | 1 | | | 0 | 1 | | | 5,349 | | | | 137,151 | |
| | | | |
| | | | | | | 304,245 | | | | | | | | 316,375 | |
| | | | |
Payment for shares redeemed | | | | | | | | | | | | | | | | |
Class A | | | (1,169,247 | ) | | | (32,299,187 | ) | | | (133,726 | ) | | | (3,568,794 | ) |
Class B | | | (1,734 | ) | | | (44,690 | ) | | | (2,747 | ) | | | (69,330 | ) |
Class C | | | (52,342 | ) | | | (1,354,172 | ) | | | (55,081 | ) | | | (1,405,528 | ) |
Administrator Class | | | (126,420 | ) | | | (3,361,427 | ) | | | (153,262 | ) | | | (4,133,075 | ) |
Institutional Class | | | (378,243 | ) | | | (10,129,726 | ) | | | (931,932 | ) | | | (25,602,156 | ) |
Investor Class | | | (4,103,703 | )1 | | | (109,800,701 | )1 | | | (1,121,227 | ) | | | (30,196,090 | ) |
| | | | |
| | | | | | | (156,989,903 | ) | | | | | | | (64,974,973 | ) |
| | | | |
Net decrease in net assets resulting from capital share transactions | | | | | | | (8,543,710 | ) | | | | | | | (38,071,397 | ) |
| | | | |
Total increase (decrease) in net assets | | | | | | | 16,373,016 | | | | | | | | (36,397,217 | ) |
| | | | |
| | | | |
Net assets | | | | | | | | | | | | | | | | |
Beginning of period | | | | | | | 157,502,363 | | | | | | | | 193,899,580 | |
| | | | |
End of period | | | | | | $ | 173,875,379 | | | | | | | $ | 157,502,363 | |
| | | | |
Undistributed net investment income | | | | | | $ | 242,876 | | | | | | | $ | 263,500 | |
| | | | |
| 1 | For the period from October 1, 2015 to October 23, 2015. Effective at the close of business on October 23, 2015, Investor Class shares were converted to Class A shares and are no longer offered by the Fund. |
The accompanying notes are an integral part of these financial statements.
| | | | | | |
| Financial highlights | | Wells Fargo C&B Mid Cap Value Fund | | | 15 | |
(For a share outstanding throughout each period)
| | | | | | | | | | | | | | | | | | | | |
| | | Year ended September 30 | |
| CLASS A | | 2016 | | | 2015 | | | 2014 | | | 2013 | | | 2012 | |
Net asset value, beginning of period | | | $25.12 | | | | $25.26 | | | | $23.74 | | | | $18.22 | | | | $14.06 | |
Net investment income | | | 0.07 | 1 | | | 0.05 | 1 | | | 0.06 | | | | 0.10 | 1 | | | 0.16 | |
Net realized and unrealized gains (losses) on investments | | | 4.13 | | | | (0.14 | ) | | | 1.55 | | | | 5.60 | | | | 4.10 | |
| | | | | | | | | | | | | | | | | | | | |
Total from investment operations | | | 4.20 | | | | (0.09 | ) | | | 1.61 | | | | 5.70 | | | | 4.26 | |
Distributions to shareholders from | | | | | | | | | | | | | | | | | | | | |
Net investment income | | | (0.05 | ) | | | (0.05 | ) | | | (0.09 | ) | | | (0.18 | ) | | | (0.10 | ) |
Net asset value, end of period | | | $29.27 | | | | $25.12 | | | | $25.26 | | | | $23.74 | | | | $18.22 | |
Total return2 | | | 16.73 | % | | | (0.36 | )% | | | 6.78 | % | | | 31.59 | % | | | 30.42 | % |
Ratios to average net assets (annualized) | | | | | | | | | | | | | | | | | | | | |
Gross expenses | | | 1.33 | % | | | 1.35 | % | | | 1.35 | % | | | 1.38 | % | | | 1.38 | % |
Net expenses | | | 1.24 | % | | | 1.20 | % | | | 1.20 | % | | | 1.20 | % | | | 1.20 | % |
Net investment income | | | 0.27 | % | | | 0.18 | % | | | 0.24 | % | | | 0.49 | % | | | 0.97 | % |
Supplemental data | | | | | | | | | | | | | | | | | | | | |
Portfolio turnover rate | | | 35 | % | | | 41 | % | | | 55 | % | | | 48 | % | | | 25 | % |
Net assets, end of period (000s omitted) | | | $120,020 | | | | $19,862 | | | | $21,465 | | | | $19,468 | | | | $13,466 | |
| 1 | Calculated based upon average shares outstanding |
| 2 | Total return calculations do not include any sales charges. |
The accompanying notes are an integral part of these financial statements.
| | | | |
| 16 | | Wells Fargo C&B Mid Cap Value Fund | | Financial highlights |
(For a share outstanding throughout each period)
| | | | | | | | | | | | | | | | | | | | |
| | | Year ended September 30 | |
| CLASS B | | 2016 | | | 2015 | | | 2014 | | | 2013 | | | 2012 | |
Net asset value, beginning of period | | | $24.10 | | | | $24.36 | | | | $22.99 | | | | $17.61 | | | | $13.60 | |
Net investment income (loss) | | | (0.14 | )1 | | | (0.15 | )1 | | | (0.14 | )1 | | | (0.05 | )1 | | | 0.02 | 1 |
Net realized and unrealized gains (losses) on investments | | | 3.96 | | | | (0.11 | ) | | | 1.51 | | | | 5.43 | | | | 3.99 | |
| | | | | | | | | | | | | | | | | | | | |
Total from investment operations | | | 3.82 | | | | (0.26 | ) | | | 1.37 | | | | 5.38 | | | | 4.01 | |
Net asset value, end of period | | | $27.92 | | | | $24.10 | | | | $24.36 | | | | $22.99 | | | | $17.61 | |
Total return2 | | | 15.85 | % | | | (1.11 | )% | | | 6.00 | % | | | 30.55 | % | | | 29.49 | % |
Ratios to average net assets (annualized) | | | | | | | | | | | | | | | | | | | | |
Gross expenses | | | 2.08 | % | | | 2.10 | % | | | 2.10 | % | | | 2.13 | % | | | 2.12 | % |
Net expenses | | | 1.98 | % | | | 1.95 | % | | | 1.95 | % | | | 1.95 | % | | | 1.95 | % |
Net investment income (loss) | | | (0.54 | )% | | | (0.59 | )% | | | (0.56 | )% | | | (0.26 | )% | | | 0.14 | % |
Supplemental data | | | | | | | | | | | | | | | | | | | | |
Portfolio turnover rate | | | 35 | % | | | 41 | % | | | 55 | % | | | 48 | % | | | 25 | % |
Net assets, end of period (000s omitted) | | | $78 | | | | $109 | | | | $170 | | | | $701 | | | | $1,338 | |
| 1 | Calculated based upon average shares outstanding |
| 2 | Total return calculations do not include any sales charges. |
The accompanying notes are an integral part of these financial statements.
| | | | | | |
| Financial highlights | | Wells Fargo C&B Mid Cap Value Fund | | | 17 | |
(For a share outstanding throughout each period)
| | | | | | | | | | | | | | | | | | | | |
| | | Year ended September 30 | |
| CLASS C | | 2016 | | | 2015 | | | 2014 | | | 2013 | | | 2012 | |
Net asset value, beginning of period | | | $24.02 | | | | $24.29 | | | | $22.92 | | | | $17.60 | | | | $13.59 | |
Net investment income (loss) | | | (0.14 | )1 | | | (0.15 | )1 | | | (0.13 | )1 | | | (0.05 | )1 | | | 0.03 | 1 |
Net realized and unrealized gains (losses) on investments | | | 3.95 | | | | (0.12 | ) | | | 1.50 | | | | 5.42 | | | | 3.98 | |
| | | | | | | | | | | | | | | | | | | | |
Total from investment operations | | | 3.81 | | | | (0.27 | ) | | | 1.37 | | | | 5.37 | | | | 4.01 | |
Distributions to shareholders from | | | | | | | | | | | | | | | | | | | | |
Net investment income | | | 0.00 | | | | 0.00 | | | | 0.00 | | | | (0.05 | ) | | | 0.00 | |
Net asset value, end of period | | | $27.83 | | | | $24.02 | | | | $24.29 | | | | $22.92 | | | | $17.60 | |
Total return2 | | | 15.86 | % | | | (1.11 | )% | | | 5.98 | % | | | 30.58 | % | | | 29.51 | % |
Ratios to average net assets (annualized) | | | | | | | | | | | | | | | | | | | | |
Gross expenses | | | 2.08 | % | | | 2.10 | % | | | 2.10 | % | | | 2.13 | % | | | 2.13 | % |
Net expenses | | | 1.98 | % | | | 1.95 | % | | | 1.95 | % | | | 1.95 | % | | | 1.95 | % |
Net investment income (loss) | | | (0.55 | )% | | | (0.57 | )% | | | (0.52 | )% | | | (0.26 | )% | | | 0.21 | % |
Supplemental data | | | | | | | | | | | | | | | | | | | | |
Portfolio turnover rate | | | 35 | % | | | 41 | % | | | 55 | % | | | 48 | % | | | 25 | % |
Net assets, end of period (000s omitted) | | | $7,314 | | | | $6,737 | | | | $7,531 | | | | $7,598 | | | | $5,254 | |
| 1 | Calculated based upon average shares outstanding |
| 2 | Total return calculations do not include any sales charges. |
The accompanying notes are an integral part of these financial statements.
| | | | |
| 18 | | Wells Fargo C&B Mid Cap Value Fund | | Financial highlights |
(For a share outstanding throughout each period)
| | | | | | | | | | | | | | | | | | | | |
| | | Year ended September 30 | |
| ADMINISTRATOR CLASS | | 2016 | | | 2015 | | | 2014 | | | 2013 | | | 2012 | |
Net asset value, beginning of period | | | $25.42 | | | | $25.54 | | | | $24.01 | | | | $18.42 | | | | $14.22 | |
Net investment income | | | 0.08 | 1 | | | 0.06 | 1 | | | 0.07 | 1 | | | 0.11 | 1 | | | 0.17 | 1 |
Net realized and unrealized gains (losses) on investments | | | 4.19 | | | | (0.13 | ) | | | 1.56 | | | | 5.67 | | | | 4.14 | |
| | | | | | | | | | | | | | | | | | | | |
Total from investment operations | | | 4.27 | | | | (0.07 | ) | | | 1.63 | | | | 5.78 | | | | 4.31 | |
Distributions to shareholders from | | | | | | | | | | | | | | | | | | | | |
Net investment income | | | (0.06 | ) | | | (0.05 | ) | | | (0.10 | ) | | | (0.19 | ) | | | (0.11 | ) |
Net asset value, end of period | | | $29.63 | | | | $25.42 | | | | $25.54 | | | | $24.01 | | | | $18.42 | |
Total return | | | 16.82 | % | | | (0.30 | )% | | | 6.82 | % | | | 31.65 | % | | | 30.44 | % |
Ratios to average net assets (annualized) | | | | | | | | | | | | | | | | | | | | |
Gross expenses | | | 1.25 | % | | | 1.21 | % | | | 1.19 | % | | | 1.21 | % | | | 1.21 | % |
Net expenses | | | 1.15 | % | | | 1.15 | % | | | 1.15 | % | | | 1.15 | % | | | 1.15 | % |
Net investment income | | | 0.28 | % | | | 0.22 | % | | | 0.26 | % | | | 0.53 | % | | | 1.00 | % |
Supplemental data | | | | | | | | | | | | | | | | | | | | |
Portfolio turnover rate | | | 35 | % | | | 41 | % | | | 55 | % | | | 48 | % | | | 25 | % |
Net assets, end of period (000s omitted) | | | $8,302 | | | | $9,725 | | | | $12,830 | | | | $19,525 | | | | $10,636 | |
| 1 | Calculated based upon average shares outstanding |
The accompanying notes are an integral part of these financial statements.
| | | | | | |
| Financial highlights | | Wells Fargo C&B Mid Cap Value Fund | | | 19 | |
(For a share outstanding throughout each period)
| | | | | | | | | | | | | | | | | | | | |
| | | Year ended September 30 | |
| INSTITUTIONAL CLASS | | 2016 | | | 2015 | | | 2014 | | | 2013 | | | 2012 | |
Net asset value, beginning of period | | | $25.34 | | | | $25.49 | | | | $23.95 | | | | $18.38 | | | | $14.19 | |
Net investment income | | | 0.16 | | | | 0.10 | | | | 0.14 | | | | 0.17 | 1 | | | 0.23 | |
Net realized and unrealized gains (losses) on investments | | | 4.17 | | | | (0.12 | ) | | | 1.55 | | | | 5.64 | | | | 4.11 | |
| | | | | | | | | | | | | | | | | | | | |
Total from investment operations | | | 4.33 | | | | (0.02 | ) | | | 1.69 | | | | 5.81 | | | | 4.34 | |
Distributions to shareholders from | | | | | | | | | | | | | | | | | | | | |
Net investment income | | | (0.14 | ) | | | (0.13 | ) | | | (0.15 | ) | | | (0.24 | ) | | | (0.15 | ) |
Net asset value, end of period | | | $29.53 | | | | $25.34 | | | | $25.49 | | | | $23.95 | | | | $18.38 | |
Total return | | | 17.11 | % | | | (0.09 | )%2 | | | 7.09 | % | | | 31.98 | % | | | 30.80 | % |
Ratios to average net assets (annualized) | | | | | | | | | | | | | | | | | | | | |
Gross expenses | | | 1.00 | % | | | 0.94 | % | | | 0.92 | % | | | 0.95 | % | | | 0.95 | % |
Net expenses | | | 0.90 | % | | | 0.90 | % | | | 0.90 | % | | | 0.90 | % | | | 0.90 | % |
Net investment income | | | 0.54 | % | | | 0.47 | % | | | 0.54 | % | | | 0.82 | % | | | 1.31 | % |
Supplemental data | | | | | | | | | | | | | | | | | | | | |
Portfolio turnover rate | | | 35 | % | | | 41 | % | | | 55 | % | | | 48 | % | | | 25 | % |
Net assets, end of period (000s omitted) | | | $38,161 | | | | $18,229 | | | | $33,881 | | | | $24,628 | | | | $24,983 | |
| 1 | Calculated based upon average shares outstanding |
| 2 | Total return reflects adjustments to conform with generally accepted accounting principles. |
The accompanying notes are an integral part of these financial statements.
| | | | |
| 20 | | Wells Fargo C&B Mid Cap Value Fund | | Notes to financial statements |
1. ORGANIZATION
Wells Fargo Funds Trust (the “Trust”), a Delaware statutory trust organized on March 10, 1999, is an open-end management investment company registered under the Investment Company Act of 1940, as amended (the “1940 Act”). As an investment company, the Trust follows the accounting and reporting guidance in Financial Accounting Standards Board (“FASB”) Accounting Standards Codification Topic 946, Financial Services – Investment Companies. These financial statements report on the Wells Fargo C&B Mid Cap Value Fund (the “Fund”) which is a diversified series of the Trust.
Effective at the close of business on October 23, 2015, Investor Class shares became Class A shares in a tax-free conversion. Shareholders of Investor Class received Class A shares at a value equal to the value of their Investor Class shares immediately prior to the conversion. Investor Class shares are no longer offered by the Fund.
2. SIGNIFICANT ACCOUNTING POLICIES
The following significant accounting policies, which are consistently followed in the preparation of the financial statements of the Fund, are in conformity with U.S. generally accepted accounting principles which require management to make estimates and assumptions that affect the reported amounts of assets and liabilities, disclosure of contingent assets and liabilities at the date of the financial statements, and the reported amounts of revenues and expenses during the reporting period. Actual results could differ from those estimates.
Securities valuation
All investments are valued each business day as of the close of regular trading on the New York Stock Exchange (generally 4 p.m. Eastern Time), although the Fund may deviate from this calculation time under unusual or unexpected circumstances.
Equity securities that are listed on a foreign or domestic exchange or market are valued at the official closing price or, if none, the last sales price. If no sale occurs on the principal exchange or market that day, the prior day’s price will be deemed “stale” and a fair value price will be determined in accordance with the Fund’s Valuation Procedures.
Investments in registered open-end investment companies are valued at net asset value. Interests in non-registered investment vehicles that are redeemable at net asset value are fair valued normally at net asset value.
Investments which are not valued using any of the methods discussed above are valued at their fair value, as determined in good faith by the Board of Trustees of the Fund. The Board of Trustees has established a Valuation Committee comprised of the Trustees and has delegated to it the authority to take any actions regarding the valuation of portfolio securities that the Valuation Committee deems necessary or appropriate, including determining the fair value of portfolio securities, unless the determination has been delegated to the Management Valuation Team of Wells Fargo Funds Management, LLC (“Funds Management”). The Board of Trustees retains the authority to make or ratify any valuation decisions or approve any changes to the Valuation Procedures as it deems appropriate. On a quarterly basis, the Board of Trustees receives reports on any valuation actions taken by the Valuation Committee or the Management Valuation Team which may include items for ratification.
Valuations of fair valued securities are compared to the next actual sales price when available, or other appropriate market values, to assess the continued appropriateness of the fair valuation methodologies used. These securities are fair valued on a day-to-day basis, taking into consideration changes to appropriate market information and any significant changes to the inputs considered in the valuation process until there is a readily available price provided on an exchange or by an independent pricing service. Valuations received from an independent pricing service or independent broker-dealer quotes are periodically validated by comparisons to most recent trades and valuations provided by other independent pricing services in addition to the review of prices by the manager and/or subadviser. Unobservable inputs used in determining fair valuations are identified based on the type of security, taking into consideration factors utilized by market participants in valuing the investment, knowledge about the issuer and the current market environment.
Security loans
The Fund may lend its securities from time to time in order to earn additional income in the form of fees or interest on securities received as collateral or the investment of any cash received as collateral. The Fund continues to receive interest or dividends on the securities loaned. The Fund receives collateral in the form of cash or securities with a value at least equal to the value of the securities on loan. The value of the loaned securities is determined at the close of each business day and any additional required collateral is delivered to the Fund on the next business day. In a securities lending transaction, the net asset value of the Fund will be affected by an increase or decrease in the value of the securities loaned and by an increase or decrease in the value of the instrument in which collateral is invested. The amount of securities lending activity undertaken by the Fund fluctuates from time to time. In the event of default or bankruptcy
| | | | | | |
| Notes to financial statements | | Wells Fargo C&B Mid Cap Value Fund | | | 21 | |
by the borrower, the Fund may be prevented from recovering the loaned securities or gaining access to the collateral or may experience delays or costs in doing so. In addition, the investment of any cash collateral received may lose all or part of its value. The Fund has the right under the lending agreement to recover the securities from the borrower on demand.
The Fund lends its securities through an unaffiliated securities lending agent. Cash collateral received in connection with its securities lending transactions is invested in Securities Lending Cash Investments, LLC (the “Securities Lending Fund”). The Securities Lending Fund is exempt from registration under Section 3(c)(7) of the 1940 Act and is managed by Funds Management and is subadvised by Wells Capital Management Incorporated (“WellsCap”), an affiliate of Funds Management and an indirect wholly owned subsidiary of Wells Fargo & Company (“Wells Fargo”). Funds Management receives an advisory fee starting at 0.05% and declining to 0.01% as the average daily net assets of the Securities Lending Fund increase. All of the fees received by Funds Management are paid to WellsCap for its services as subadviser. The Securities Lending Fund seeks to provide a positive return compared to the daily Fed Funds Open rate by investing in high-quality, U.S. dollar-denominated short-term money market instruments. Securities Lending Fund investments are fair valued based upon the amortized cost valuation technique. Income earned from investment in the Securities Lending Fund is included in securities lending income on the Statement of Operations.
Security transactions and income recognition
Securities transactions are recorded on a trade date basis. Realized gains or losses are recorded on the basis of identified cost.
Dividend income is recognized on the ex-dividend date. Dividend income is recorded net of foreign taxes withheld where recovery of such taxes is not assured.
Distributions to shareholders
Distributions to shareholders from net investment income and net realized gains, if any, are recorded on the ex-dividend date. Such distributions are determined in conformity with federal income tax regulations, which may differ in amount or character from net investment income and realized gains recognized for purposes of U.S. generally accepted accounting principles.
Federal and other taxes
The Fund intends to continue to qualify as a regulated investment company by distributing substantially all of its investment company taxable income and any net realized capital gains (after reduction for capital loss carryforwards) sufficient to relieve it from all, or substantially all, federal income taxes. Accordingly, no provision for federal income taxes was required.
The Fund’s income and federal excise tax returns and all financial records supporting those returns for the prior three fiscal years are subject to examination by the federal and Delaware revenue authorities. Management has analyzed the Fund’s tax positions taken on federal, state, and foreign tax returns for all open tax years and does not believe that there are any uncertain tax positions that require recognition of a tax liability.
Reclassifications are made to the Fund’s capital accounts for permanent tax differences to reflect income and gains available for distribution (or available capital loss carryforwards) under federal income tax regulations. U.S. generally accepted accounting principles require that certain components of net assets be adjusted to reflect permanent differences between financial and tax reporting. These reclassifications have no effect on net assets or net asset values per share. At September 30, 2016, as a result of permanent book-to-tax differences, the following reclassification adjustments were made on the Statement of Assets and Liabilities:
| | |
Underdistributed net
investment income | | Accumulated net
realized losses
on investments |
| $(35,970) | | $35,970 |
As of September 30, 2016, the Fund had capital loss carryforwards available to offset future net realized capital gains in the amount of $74,123,891 with $54,905,219 expiring in 2017 and $19,218,672 expiring in 2018.
Class allocations
The separate classes of shares offered by the Fund differ principally in applicable sales charges, distribution, shareholder servicing, and administration fees. Class specific expenses are charged directly to that share class. Investment income, common expenses, and realized and unrealized gains (losses) on investments are allocated daily to each class of shares based on the relative proportion of net assets of each class.
| | | | |
| 22 | | Wells Fargo C&B Mid Cap Value Fund | | Notes to financial statements |
3. FAIR VALUATION MEASUREMENTS
Fair value measurements of investments are determined within a framework that has established a fair value hierarchy based upon the various data inputs utilized in determining the value of the Fund’s investments. The three-level hierarchy gives the highest priority to unadjusted quoted prices in active markets for identical assets or liabilities (Level 1) and the lowest priority to significant unobservable inputs (Level 3). The Fund’s investments are classified within the fair value hierarchy based on the lowest level of input that is significant to the fair value measurement. The inputs are summarized into three broad levels as follows:
| n | | Level 1 – quoted prices in active markets for identical securities |
| n | | Level 2 – other significant observable inputs (including quoted prices for similar securities, interest rates, prepayment speeds, credit risk, use of amortized cost, etc.) |
| n | | Level 3 – significant unobservable inputs (including the Fund’s own assumptions in determining the fair value of investments) |
The inputs or methodologies used for valuing investments in securities are not necessarily an indication of the risk associated with investing in those securities.
The following is a summary of the inputs used in valuing the Fund’s assets and liabilities as of September 30, 2016:
| | | | | | | | | | | | | | | | |
| | | Quoted prices
(Level 1) | | | Other significant
observable inputs
(Level 2) | | | Significant
unobservable inputs (Level 3) | | | Total | |
Assets | | | | | | | | | | | | | | | | |
Investments in: | | | | | | | | | | | | | | | | |
| | | | |
Common stocks | | | | | | | | | | | | | | | | |
Consumer discretionary | | $ | 25,432,868 | | | $ | 0 | | | $ | 0 | | | $ | 25,432,868 | |
Consumer staples | | | 2,102,100 | | | | 0 | | | | 0 | | | | 2,102,100 | |
Energy | | | 3,099,420 | | | | 0 | | | | 0 | | | | 3,099,420 | |
Financials | | | 49,532,744 | | | | 0 | | | | 0 | | | | 49,532,744 | |
Health care | | | 17,037,648 | | | | 0 | | | | 0 | | | | 17,037,648 | |
Industrials | | | 40,434,245 | | | | 0 | | | | 0 | | | | 40,434,245 | |
Information technology | | | 15,182,983 | | | | 0 | | | | 0 | | | | 15,182,983 | |
Materials | | | 17,319,778 | | | | 0 | | | | 0 | | | | 17,319,778 | |
Real estate | | | 1,703,982 | | | | 0 | | | | 0 | | | | 1,703,982 | |
| | | | |
Short-term investments | | | | | | | | | | | | | | | | |
Investment companies | | | 2,192,563 | | | | 0 | | | | 0 | | | | 2.192,563 | |
Investments measured at net asset value* | | | | | | | | | | | | | | | 5,691,200 | |
Total assets | | $ | 174,038,331 | | | $ | 0 | | | $ | 0 | | | $ | 179,729,531 | |
| * | Investments that are measured at fair value using the net asset value per share (or its equivalent) as a practical expedient have not been categorized in the fair value hierarchy. The fair value amount presented in the table is intended to permit reconciliation of the fair value hierarchy to the amounts presented in the Statement of Assets and Liabilities. The Fund’s investment in Securities Lending Cash Investments, LLC valued at $5,691,200 does not have a redemption period notice, can be redeemed daily and does not have any unfunded commitments. |
The Fund recognizes transfers between levels within the fair value hierarchy at the end of the reporting period. At September 30, 2016, the Fund did not have any transfers into/out of Level 1, Level 2, or Level 3.
4. TRANSACTIONS WITH AFFILIATES AND OTHER EXPENSES
Management fee
Funds Management, an indirect wholly owned subsidiary of Wells Fargo, is the manager of the Fund and provides advisory and fund-level administrative services under an investment management agreement. Under the investment management agreement, Funds Management is responsible for, among other services, implementing the investment objectives and strategies of the Fund, supervising the subadviser, providing fund-level administrative services in connection with the Fund’s operations, and providing any other fund-level administrative services reasonably necessary for the operation of the Fund. As compensation for its services under the investment management agreement, Funds Management is entitled to receive an annual management fee starting at 0.75% and declining to 0.63% as the average daily net assets of the Fund increase. For the year ended September 30, 2016, the management fee was equivalent to an annual rate of 0.75% of the Fund’s average daily net assets.
| | | | | | |
| Notes to financial statements | | Wells Fargo C&B Mid Cap Value Fund | | | 23 | |
Funds Management has retained the services of a subadviser to provide daily portfolio management to the Fund. The fee for subadvisory services is borne by Funds Management. Cooke & Bieler, L.P. is the subadviser to the Fund and is entitled to receive a fee from Funds Management at an annual rate starting at 0.45% and declining to 0.35% as the average daily net assets of the Fund increase.
Administration fees
Under a class-level administration agreement, Funds Management provides class-level administrative services to the Fund, which includes paying fees and expenses for services provided by the transfer agent, sub-transfer agents, omnibus account servicers and record-keepers. As compensation for its services under the class-level administration agreement, Funds Management receives an annual fee which is calculated based on the average daily net assets of each class as follows:
| | | | |
| | | Class-level
administration fee | |
Class A, Class B, Class C | | | 0.21 | % |
Administrator Class, Institutional Class | | | 0.13 | |
Investor Class | | | 0.32 | |
Funds Management has contractually waived and/or reimbursed management and administration fees to the extent necessary to maintain certain net operating expense ratios for the Fund. Waiver of fees and/or reimbursement of expenses by Funds Management were made first from fund level expenses on a proportionate basis and then from class specific expenses. Funds Management has committed through January 31, 2017 to waive fees and/or reimburse expenses to the extent necessary to cap the Fund’s expenses at 1.25% for Class A shares, 2.00% for Class B shares, 2.00% for Class C shares, 1.15% for Administrator Class shares, and 0.90% for Institutional Class shares. After this time, the cap may be increased or the commitment to maintain the cap may be terminated only with the approval of the Board of Trustees. Prior to February 1, 2016, the Fund’s expenses were capped at 1.20% for Class A shares, 1.95% for Class B, and 1.95% for Class C shares.
Distribution fees
The Trust has adopted a distribution plan for Class B and Class C shares of the Fund pursuant to Rule 12b-1 under the 1940 Act. Distribution fees are charged to Class B and Class C shares and paid to Wells Fargo Funds Distributor, LLC (“Funds Distributor”), the principal underwriter, at an annual rate of 0.75% of the average daily net assets of Class B and Class C shares.
In addition, Funds Distributor is entitled to receive the front-end sales charge from the purchase of Class A shares and a contingent deferred sales charge on the redemption of certain Class A shares. Funds Distributor is also entitled to receive the contingent deferred sales charges from redemptions of Class B and Class C shares. For the year ended September 30, 2016, Funds Distributor received $2,816 from the sale of Class A shares.
Shareholder servicing fees
The Trust has entered into contracts with one or more shareholder servicing agents, whereby Class A, Class B, Class C, Administrator Class, and Investor Class of the Fund are charged a fee at an annual rate of 0.25% of the average daily net assets of each respective class.
A portion of these total shareholder servicing fees were paid to affiliates of Wells Fargo.
5. INVESTMENT PORTFOLIO TRANSACTIONS
Purchases and sales of investments, excluding U.S. government obligations (if any) and short-term securities, for the year ended September 30, 2016 were $55,276,287 and $65,634,283, respectively.
The Fund may purchase or sell investment securities to other Wells Fargo funds under procedures adopted by the Board of Trustees. The procedures have been designed to ensure that these interfund transactions, which generally do not incur broker commissions, are effected at current market prices. Interfund trades are included within the respective purchases and sales amounts shown.
6. BANK BORROWINGS
The Trust (excluding the money market funds and certain other funds) and Wells Fargo Variable Trust are parties to a $250,000,000 revolving credit agreement whereby the Fund is permitted to use bank borrowings for temporary or emergency purposes, such as to fund shareholder redemption requests. Interest under the credit agreement is charged
| | | | |
| 24 | | Wells Fargo C&B Mid Cap Value Fund | | Notes to financial statements |
to the Fund based on a borrowing rate equal to the higher of the Federal Funds rate in effect on that day plus 1.25% or the overnight LIBOR rate in effect on that day plus 1.25%. In addition, an annual commitment fee equal to 0.25% of the unused balance is allocated to each participating fund. Prior to August 30, 2016, the revolving credit agreement amount was $200,000,000 and the annual commitment fee was equal to 0.20% of the unused balance which was allocated to each participating fund.
For the year ended September 30, 2016, there were no borrowings by the Fund under the agreement.
7. DISTRIBUTIONS TO SHAREHOLDERS
The tax character of distributions paid was $351,049 and $370,609 of ordinary income for the years ended September 30, 2016 and September 30, 2015, respectively.
As of September 30, 2016, the components of distributable earnings on a tax basis were as follows:
| | | | |
Undistributed
ordinary
income | | Unrealized
gains | | Capital loss
carryforward |
| $242,876 | | $29,049,873 | | $(74,123,891) |
8. CONCENTRATION RISK
Concentration risks result from exposure to a limited number of sectors. A fund that invests a substantial portion of its assets in any sector may be more affected by changes in that sector than would be a fund whose investments are not heavily weighted in any sector.
9. INDEMNIFICATION
Under the Trust’s organizational documents, the officers and Trustees have been granted certain indemnification rights against certain liabilities that may arise out of performance of their duties to the Trust. Additionally, in the normal course of business, the Trust may enter into contracts with service providers that contain a variety of indemnification clauses. The Trust’s maximum exposure under these arrangements is dependent on future claims that may be made against the Fund and, therefore, cannot be estimated.
| | | | | | |
| Report of independent registered public accounting firm | | Wells Fargo C&B Mid Cap Value Fund | | | 25 | |
BOARD OF TRUSTEES AND SHAREHOLDERS OF WELLS FARGO FUNDS TRUST:
We have audited the accompanying statement of assets and liabilities, including the portfolio of investments, of the Wells Fargo C&B Mid Cap Value Fund (formerly known as Wells Fargo Advantage C&B Mid Cap Value Fund) (the “Fund”), one of the funds constituting the Wells Fargo Funds Trust, as of September 30, 2016, and the related statement of operations for the year then ended, the statements of changes in net assets for each of the years in the two-year period then ended, and the financial highlights for each of the years in the five-year period then ended. These financial statements and financial highlights are the responsibility of the Fund’s management. Our responsibility is to express an opinion on these financial statements and financial highlights based on our audits.
We conducted our audits in accordance with the standards of the Public Company Accounting Oversight Board (United States). Those standards require that we plan and perform the audit to obtain reasonable assurance about whether the financial statements and financial highlights are free of material misstatement. An audit includes examining, on a test basis, evidence supporting the amounts and disclosures in the financial statements. Our procedures included confirmation of securities owned as of September 30, 2016, by correspondence with the custodian, or by other appropriate auditing procedures. An audit also includes assessing the accounting principles used and significant estimates made by management, as well as evaluating the overall financial statement presentation. We believe that our audits provide a reasonable basis for our opinion.
In our opinion, the financial statements and financial highlights referred to above present fairly, in all material respects, the financial position of the Wells Fargo C&B Mid Cap Value Fund as of September 30, 2016, the results of its operations for the year then ended, the changes in its net assets for each of the years in the two-year period then ended, and the financial highlights for each of the years in the five-year period then ended, in conformity with U.S. generally accepted accounting principles.

Boston, Massachusetts
November 23, 2016
| | | | |
| 26 | | Wells Fargo C&B Mid Cap Value Fund | | Other information (unaudited) |
TAX INFORMATION
For corporate shareholders, pursuant to Section 854 of the Internal Revenue Code, 100% of ordinary income dividends qualify for the corporate dividends-received deduction for the fiscal year ended September 30, 2016.
Pursuant to Section 854 of the Internal Revenue Code, $351,049 of income dividends paid during the fiscal year ended September 30, 2016 has been designated as qualified dividend income (QDI).
PROXY VOTING INFORMATION
A description of the policies and procedures that the Fund uses to determine how to vote proxies relating to portfolio securities is available, upon request, by calling 1-800-222-8222, visiting our website at wellsfargofunds.com, or visiting the SEC website at sec.gov. Information regarding how the Fund voted proxies relating to portfolio securities during the most recent 12-month period ended June 30 is available on the Fund’s website at wellsfargofunds.com or by visiting the SEC website at sec.gov.
PORTFOLIO HOLDINGS INFORMATION
The complete portfolio holdings for the Fund are publicly available monthly on the Fund’s website (wellsfargofunds.com), on a one-month delayed basis. In addition, top ten holdings information (excluding derivative positions) for the Fund is publicly available on the Fund’s website on a monthly, seven-day or more delayed basis. The Fund files its complete schedule of portfolio holdings with the SEC for the first and third quarters of each fiscal year on Form N-Q, which is available by visiting the SEC website at sec.gov. In addition, the Fund’s Form N-Q may be reviewed and copied at the SEC’s Public Reference Room in Washington, DC, and at regional offices in New York City, at 233 Broadway, and in Chicago, at 175 West Jackson Boulevard, Suite 900. Information about the Public Reference Room may be obtained by calling 1-800-SEC-0330.
| | | | | | |
| Other information (unaudited) | | Wells Fargo C&B Mid Cap Value Fund | | | 27 | |
BOARD OF TRUSTEES AND OFFICERS
Each of the Trustees and Officers1 listed in the table below acts in identical capacities for each fund in the Wells Fargo family of funds, which consists of 138 mutual funds comprising the Wells Fargo Funds Trust, Wells Fargo Variable Trust, Wells Fargo Master Trust and four closed-end funds (collectively the “Fund Complex”). This table should be read in conjunction with the Prospectus and the Statement of Additional Information2. The mailing address of each Trustee and Officer is 525 Market Street, 12th Floor, San Francisco, CA 94105. Each Trustee and Officer serves an indefinite term, however, each Trustee serves such term until reaching the mandatory retirement age established by the Trustees.
Independent Trustees
| | | | | | |
Name and
year of birth | | Position held and
length of service* | | Principal occupations during past five years or longer | | Current other
public company or
investment company
directorships |
William R. Ebsworth (Born 1957) | | Trustee, since 2015 | | Retired. From 1984 to 2013, equities analyst, portfolio manager, research director and chief financial officer at Fidelity Management and Research Company in Boston, Tokyo, and Hong Kong and retired in 2013 as Chief Investment Officer of Fidelity Strategic Advisers, Inc. where he lead a team of investment professionals managing client assets. Prior thereto, Board member of Hong Kong Securities Clearing Co., Hong Kong Options Clearing Corp., the Thailand International Fund, Ltd., Fidelity Investments Life Insurance Company, and Empire Fidelity Investments Life Insurance Company. Mr. Ebsworth is a CFA® charterholder and an Adjunct Lecturer, Finance, at Babson College. | | Asset Allocation Trust |
Jane A. Freeman (Born 1953) | | Trustee, since 2015 | | Retired. From 2012 to 2014 and 1999 to 2008, Chief Financial Officer of Scientific Learning Corporation. From 2008 to 2012, Ms. Freeman provided consulting services related to strategic business projects. Prior to 1999, Portfolio Manager at Rockefeller & Co. and Scudder, Stevens & Clark. Board member of the Harding Loevner Funds from 1996 to 2014, serving as both Lead Independent Director and chair of the Audit Committee. Board member of the Russell Exchange Traded Funds Trust from 2011 to 2012 and the chair of the Audit Committee. Ms. Freeman is a Board Member of Ruth Bancroft Garden (non-profit organization) and an inactive chartered financial analyst. | | Asset Allocation Trust |
Peter G. Gordon (Born 1942) | | Trustee, since 1998; Chairman, since 2005 | | Co-Founder, Retired Chairman, President and CEO of Crystal Geyser Water Company. Trustee Emeritus, Colby College. | | Asset Allocation Trust |
Isaiah Harris, Jr. (Born 1952) | | Trustee, since 2009 | | Retired. Chairman of the Board of CIGNA Corporation since 2009, and Director since 2005. From 2003 to 2011, Director of Deluxe Corporation. Prior thereto, President and CEO of BellSouth Advertising and Publishing Corp. from 2005 to 2007, President and CEO of BellSouth Enterprises from 2004 to 2005 and President of BellSouth Consumer Services from 2000 to 2003. Emeritus member of the Iowa State University Foundation Board of Governors. Emeritus Member of the Advisory Board of Iowa State University School of Business. Advisory Board Member, Palm Harbor Academy (charter school). Advisory Board Member, Child Evangelism Fellowship (non-profit). Mr. Harris is a certified public accountant (inactive status). | | CIGNA Corporation; Asset Allocation Trust |
Judith M. Johnson (Born 1949) | | Trustee, since 2008; Audit Committee Chairman, since 2008 | | Retired. Prior thereto, Chief Executive Officer and Chief Investment Officer of Minneapolis Employees Retirement Fund from 1996 to 2008. Ms. Johnson is an attorney, certified public accountant and a certified managerial accountant. | | Asset Allocation Trust |
David F. Larcker (Born 1950) | | Trustee, since 2009 | | James Irvin Miller Professor of Accounting at the Graduate School of Business, Stanford University, Director of the Corporate Governance Research Initiative and Senior Faculty of The Rock Center for Corporate Governance since 2006. From 2005 to 2008, Professor of Accounting at the Graduate School of Business, Stanford University. Prior thereto, Ernst & Young Professor of Accounting at The Wharton School, University of Pennsylvania from 1985 to 2005. | | Asset Allocation Trust |
| | | | |
| 28 | | Wells Fargo C&B Mid Cap Value Fund | | Other information (unaudited) |
| | | | | | |
Name and
year of birth | | Position held and
length of service* | | Principal occupations during past five years or longer | | Current other
public company or
investment company
directorships |
Olivia S. Mitchell (Born 1953) | | Trustee, since 2006 | | International Foundation of Employee Benefit Plans Professor, Wharton School of the University of Pennsylvania since 1993. Director of Wharton’s Pension Research Council and Boettner Center on Pensions & Retirement Research, and Research Associate at the National Bureau of Economic Research. Previously, Cornell University Professor from 1978 to 1993. | | Asset Allocation Trust |
Timothy J. Penny (Born 1951) | | Trustee, since 1996 | | President and Chief Executive Officer of Southern Minnesota Initiative Foundation, a non-profit organization, since 2007 and Senior Fellow at the Humphrey Institute Policy Forum at the University of Minnesota since 1995. Member of the Board of Trustees of NorthStar Education Finance, Inc., a non-profit organization, since 2007. | | Asset Allocation Trust |
Michael S. Scofield (Born 1943) | | Trustee, since 2010 | | Served on the Investment Company Institute’s Board of Governors and Executive Committee from 2008-2011 as well the Governing Council of the Independent Directors Council from 2006-2011 and the Independent Directors Council Executive Committee from 2008-2011. Chairman of the IDC from 2008-2010. Institutional Investor (Fund Directions) Trustee of Year in 2007. Trustee of the Evergreen Funds complex (and its predecessors) from 1984 to 2010. Chairman of the Evergreen Funds from 2000-2010. Former Trustee of the Mentor Funds. Retired Attorney, Law Offices of Michael S. Scofield. | | Asset Allocation Trust |
| * | Length of service dates reflect the Trustee’s commencement of service with the Trust’s predecessor entities, where applicable. |
Officers
| | | | | | |
Name and year of birth | | Position held and
length of service | | Principal occupations during past five years or longer | | |
Karla M. Rabusch (Born 1959) | | President, since 2003 | | Executive Vice President of Wells Fargo Bank, N.A. and President of Wells Fargo Funds Management, LLC since 2003. | | |
Nancy Wiser1 (Born 1967) | | Treasurer, since 2012 | | Executive Vice President of Wells Fargo Funds Management, LLC since 2011. Chief Operating Officer and Chief Compliance Officer at LightBox Capital Management LLC, from 2008 to 2011. | | |
C. David Messman (Born 1960) | | Secretary, since 2000; Chief Legal Officer, since 2003 | | Senior Vice President and Secretary of Wells Fargo Funds Management, LLC since 2001. Assistant General Counsel of Wells Fargo Bank, N.A. since 2013 and Vice President and Managing Counsel of Wells Fargo Bank, N.A. from 1996 to 2013. | | |
Michael Whitaker (Born 1967) | | Chief Compliance Officer, since 20163 | | Executive Vice President of Wells Fargo Funds Management, LLC since 2016. Chief Compliance Officer of Fidelity’s Fixed Income Funds and Asset Allocation Funds from 2008 to 2016, Compliance Officer of FMR Co., Inc. from 2014 to 2016, Fidelity Investments Money Management, Inc. from 2014 to 2016, Fidelity Investments from 2007 to 2016. | | |
David Berardi (Born 1975) | | Assistant Treasurer, since 2009 | | Vice President of Wells Fargo Funds Management, LLC since 2009. Vice President of Evergreen Investment Management Company, LLC from 2008 to 2010. Manager of Fund Reporting and Control for Evergreen Investment Management Company, LLC from 2004 to 2010. | | |
Jeremy DePalma1 (Born 1974) | | Assistant Treasurer, since 2009 | | Senior Vice President of Wells Fargo Funds Management, LLC since 2009. Senior Vice President of Evergreen Investment Management Company, LLC from 2008 to 2010 and head of the Fund Reporting and Control Team within Fund Administration from 2005 to 2010. | | |
| 1 | Nancy Wiser acts as Treasurer of 70 funds in the Fund Complex. Jeremy DePalma acts as Treasurer of 68 funds and Assistant Treasurer of 70 funds in the Fund Complex. |
| 2 | The Statement of Additional Information includes additional information about the Trustees and is available, without charge, upon request, by calling 1-800-222-8222 or by visiting the website at wellsfargofunds.com. |
| 3 | Michael Whitaker became Chief Compliance Officer effective May 16, 2016. |
| | | | | | |
| Other information (unaudited) | | Wells Fargo C&B Mid Cap Value Fund | | | 29 | |
BOARD CONSIDERATION OF INVESTMENT MANAGEMENT AND SUB-ADVISORY AGREEMENTS:
Under the Investment Company Act of 1940 (the “1940 Act”), the Board of Trustees (the “Board”) of Wells Fargo Funds Trust (the “Trust”) must determine annually whether to approve the continuation of the Trust’s investment management and sub-advisory agreements. In this regard, at an in-person meeting held on May 24-25, 2016 (the “Meeting”), the Board, all the members of which have no direct or indirect interest in the investment management and sub-advisory agreements and are not “interested persons” of the Trust, as defined in the 1940 Act (the “Independent Trustees”), reviewed and approved for Wells Fargo C&B Mid Cap Value Fund (the “Fund”): (i) an investment management agreement (the “Management Agreement”) with Wells Fargo Funds Management, LLC (“Funds Management”); and (ii) an investment sub-advisory agreement (the “Sub-Advisory Agreement”) with Cooke & Bieler, L.P. (the “Sub-Adviser”). The Management Agreement and the Sub-Advisory Agreement are collectively referred to as the “Advisory Agreements.”
At the Meeting, the Board considered the factors and reached the conclusions described below relating to the selection of Funds Management and the Sub-Adviser and the approval of the Advisory Agreements. Prior to the Meeting, including at an in-person meeting in April 2016, the Trustees conferred extensively among themselves and with representatives of Funds Management about these matters. Also, the Board has adopted a team-based approach, with each team consisting of a sub-set of Trustees, to assist the full Board in the discharge of its duties in reviewing performance and other matters throughout the year. The Independent Trustees were assisted in their evaluation of the Advisory Agreements by independent legal counsel, from whom they received separate legal advice and with whom they met separately.
In providing information to the Board, Funds Management and the Sub-Adviser were guided by a detailed set of requests for information submitted to them by independent legal counsel on behalf of the Independent Trustees at the start of the Board’s annual contract renewal process earlier in 2016. In considering and approving the Advisory Agreements, the Trustees considered the information they believed relevant, including but not limited to the information discussed below. The Board considered not only the specific information presented in connection with the Meeting, but also the knowledge gained over time through interaction with Funds Management and the Sub-Adviser about various topics. In this regard, the Board reviewed reports of Funds Management at each of its quarterly meetings, which included, among other things, portfolio reviews and performance reports. In addition, the Board and the teams mentioned above confer with portfolio managers at various times throughout the year. The Board did not identify any particular information or consideration that was all-important or controlling, and each individual Trustee may have attributed different weights to various factors.
After its deliberations, the Board unanimously approved the continuation of the Advisory Agreements for a one-year term and determined that the compensation payable to Funds Management and the Sub-Adviser under each of the Advisory Agreements was reasonable. The Board considered the approval of the Advisory Agreements for the Fund as part of its consideration of agreements for funds across the complex, but its approvals were made on a fund-by-fund basis. The following summarizes a number of important, but not necessarily all, factors considered by the Board in support of its approvals.
Nature, extent and quality of services
The Board received and considered various information regarding the nature, extent and quality of services provided to the Fund by Funds Management and the Sub-Adviser under the Advisory Agreements. This information included a description of the investment advisory services and Fund-level administrative services covered by the Management Agreement, as well as, among other things, a summary of the background and experience of senior management of Funds Management, and the qualifications, background, tenure and responsibilities of each of the portfolio managers primarily responsible for the day-to-day portfolio management of the Fund.
The Board evaluated the ability of Funds Management and the Sub-Adviser to attract and retain qualified investment professionals, including research, advisory and supervisory personnel. The Board further considered the compliance programs and compliance records of Funds Management and the Sub-Adviser. In addition, the Board took into account the full range of services provided to the Fund by Funds Management and its affiliates.
Fund performance and expenses
The Board considered the performance results for the Fund over various time periods ended December 31, 2015. The Board considered these results in comparison to the performance of funds in a universe that was determined by Broadridge Inc. (“Broadridge”) to be similar to the Fund (the “Universe”), and in comparison to the Fund’s benchmark index and to other comparative data. Broadridge is an independent provider of investment company data. The Board received a description of the methodology used by Broadridge to select the mutual funds in the performance Universe. The Board noted that the performance of the Fund (Administrator Class) was higher than the average performance of the Universe for all periods under review. The Board also noted that the performance of the Fund was lower than its benchmark, the Russell Midcap® Value Index, for all periods under review except for the one-year period.
| | | | |
| 30 | | Wells Fargo C&B Mid Cap Value Fund | | Other information (unaudited) |
The Board also received and considered information regarding the Fund’s net operating expense ratios and their various components, including actual management fees, custodian and other non-management fees, and Rule 12b-1 and non-Rule 12b-1 shareholder service fees. The Board considered these ratios in comparison to the median ratios of funds in class-specific expense groups that were determined by Broadridge to be similar to the Fund (the “Groups”). The Board received a description of the methodology used by Broadridge to select the mutual funds in the expense Groups and an explanation of how funds comprising expense groups and their expense ratios may vary from year-to-year. Based on the Broadridge reports, the Board noted that the net operating expense ratios of the Fund were lower than the median net operating expense ratios of the expense Groups.
The Board took into account the Fund performance and expense information provided to it among the factors considered in deciding to re-approve the Advisory Agreements.
Investment management and sub-advisory fee rates
The Board reviewed and considered the contractual fee rates payable by the Fund to Funds Management under the Management Agreement, as well as the contractual fee rates payable by the Fund to Funds Management for class-level administrative services under a Class-Level Administration Agreement, which include class-level transfer agency and sub-transfer agency costs (collectively, the “Management Rates”). The Board also reviewed and considered the contractual investment sub-advisory fee rates that are payable by Funds Management to the Sub-Adviser for investment sub-advisory services.
Among other information reviewed by the Board was a comparison of the Fund’s Management Rates with the average contractual investment management fee rates of funds in the expense Groups at a common asset level as well as transfer agency costs of the funds in the expense Groups. The Board noted that the Management Rates of the Fund were lower than or equal to the sum of these average rates for the Fund’s expense Groups for all share classes.
The Board also received and considered information about the portion of the total management fee that was retained by Funds Management after payment of the fee to the Sub-Adviser for sub-advisory services. The Board considered this amount in comparison to the median amount retained by advisers to funds in a sub-advised expense universe that was determined by Broadridge to be similar to the Fund. In assessing the reasonableness of this amount, the Board received and evaluated information about the nature and extent of responsibilities retained and risks assumed by Funds Management and not delegated to or assumed by the Sub-Adviser, and about Funds Management’s on-going oversight services. The Board also considered that the sub-advisory fees paid to the Sub-Adviser had been negotiated by Funds Management on an arm’s length basis.
The Board also received and considered information about the nature and extent of services offered and fee rates charged by Funds Management and the Sub-Adviser to other types of clients with investment strategies similar to those of the Fund. In this regard, the Board received information about the significantly greater scope of services, and compliance, reporting and other legal burdens and risks of managing mutual funds compared with those associated with managing assets of non-mutual fund clients such as collective funds or institutional separate accounts.
Based on its consideration of the factors and information it deemed relevant, including those described here, the Board determined that the compensation payable to Funds Management under the Management Agreement and to the Sub-Adviser under the Sub-Advisory Agreement was reasonable, in light of the services covered by the Advisory Agreements.
Profitability
The Board received and considered information concerning the profitability of Funds Management, as well as the profitability of Wells Fargo as a whole, from providing services to the Fund and the fund family as a whole. Funds Management reported on the methodologies and estimates used in calculating profitability. Among other things, the Board noted that the levels of profitability reported on a fund-by-fund basis varied widely, depending on factors such as the size and type of fund. The Board did not consider profitability with respect to the Sub-Adviser, as the sub-advisory fees paid to the Sub-Adviser had been negotiated by Funds Management on an arm’s-length basis.
Based on its review, the Board did not deem the profits reported by Funds Management to be at a level that would prevent it from approving the continuation of the Advisory Agreements.
Economies of scale
With respect to possible economies of scale, the Board noted the existence of breakpoints in the Fund’s management fee structure, which operate generally to reduce the Fund’s expense ratios as the Fund grows in size. It considered that, for a small fund or a fund that shrinks in size, breakpoints conversely can result in higher fee levels. The Board also considered that fee waiver and expense reimbursement arrangements and competitive fee rates at the outset are means of sharing
| | | | | | |
| Other information (unaudited) | | Wells Fargo C&B Mid Cap Value Fund | | | 31 | |
potential economies of scale with shareholders of the Fund and the fund family as a whole. The Board considered Funds Management’s view that any analyses of potential economies of scale in managing a particular fund are inherently limited in light of the joint and common costs and investments that Funds Management incurs across the fund family as a whole.
The Board concluded that the Fund’s fee and expense arrangements, including contractual breakpoints, constituted a reasonable approach to sharing potential economies of scale with the Fund and its shareholders.
Other benefits to Funds Management and the Sub-Adviser
The Board received and considered information regarding potential “fall-out” or ancillary benefits received by Funds Management, the Sub-Adviser, and their affiliates as a result of their relationships with the Fund. Ancillary benefits could include, among others, benefits directly attributable to other relationships with the Fund and benefits potentially derived from an increase in Funds Management’s and the Sub-Adviser’s business as a result of their relationships with the Fund. The Board noted that various affiliates of Funds Management may receive distribution-related fees, shareholder servicing payments and sub-transfer agency fees in respect of shares sold or held through them and services provided.
The Board also reviewed information about soft dollar credits earned and utilized by the Sub-Adviser, fees earned by Funds Management and its affiliate from managing a private investment vehicle for the fund family’s securities lending collateral and commissions earned by an affiliated broker from portfolio transactions.
Based on its consideration of the factors and information it deemed relevant, including those described here, the Board did not find that any ancillary benefits received by Funds Management, the Sub-Adviser, and their affiliates were unreasonable.
Conclusion
At the Meeting, after considering the above-described factors and based on its deliberations and its evaluation of the information described above, the Board unanimously approved the continuation of the Advisory Agreements for a one-year term and determined that the compensation payable to Funds Management and the Sub-Adviser under each of the Advisory Agreements was reasonable.
| | | | |
| 32 | | Wells Fargo C&B Mid Cap Value Fund | | List of abbreviations |
The following is a list of common abbreviations for terms and entities that may have appeared in this report.
| ACA | — ACA Financial Guaranty Corporation |
| ADR | — American depositary receipt |
| ADS | — American depositary shares |
| AGC | — Assured Guaranty Corporation |
| AGM | — Assured Guaranty Municipal |
| Ambac | — Ambac Financial Group Incorporated |
| AMT | — Alternative minimum tax |
| BAN | — Bond anticipation notes |
| BHAC | — Berkshire Hathaway Assurance Corporation |
| CAB | — Capital appreciation bond |
| CCAB | — Convertible capital appreciation bond |
| CDA | — Community Development Authority |
| CDO | — Collateralized debt obligation |
| DRIVER | — Derivative inverse tax-exempt receipts |
| DW&P | — Department of Water & Power |
| DWR | — Department of Water Resources |
| ECFA | — Educational & Cultural Facilities Authority |
| EDA | — Economic Development Authority |
| EDFA | — Economic Development Finance Authority |
| ETF | — Exchange-traded fund |
| FDIC | — Federal Deposit Insurance Corporation |
| FFCB | — Federal Farm Credit Banks |
| FGIC | — Financial Guaranty Insurance Corporation |
| FHA | — Federal Housing Administration |
| FHLB | — Federal Home Loan Bank |
| FHLMC | — Federal Home Loan Mortgage Corporation |
| FICO | — The Financing Corporation |
| FNMA | — Federal National Mortgage Association |
| GDR | — Global depositary receipt |
| GNMA | — Government National Mortgage Association |
| HCFR | — Healthcare facilities revenue |
| HEFA | — Health & Educational Facilities Authority |
| HEFAR | — Higher education facilities authority revenue |
| HFA | — Housing Finance Authority |
| HFFA | — Health Facilities Financing Authority |
| HUD | — Department of Housing and Urban Development |
| IDA | — Industrial Development Authority |
| IDAG | — Industrial Development Agency |
| KRW | — Republic of Korea won |
| LIBOR | — London Interbank Offered Rate |
| LIFER | — Long Inverse Floating Exempt Receipts |
| LLC | — Limited liability company |
| LLLP | — Limited liability limited partnership |
| LLP | — Limited liability partnership |
| MBIA | — Municipal Bond Insurance Association |
| MFHR | — Multifamily housing revenue |
| MSTR | — Municipal securities trust receipts |
| MUD | — Municipal Utility District |
| National | — National Public Finance Guarantee Corporation |
| PCFA | — Pollution Control Financing Authority |
| PCL | — Public Company Limited |
| PCR | — Pollution control revenue |
| PFA | — Public Finance Authority |
| PFFA | — Public Facilities Financing Authority |
| PFOTER | — Puttable floating option tax-exempt receipts |
| plc | — Public limited company |
| PUTTER | — Puttable tax-exempt receipts |
| R&D | — Research & development |
| Radian | — Radian Asset Assurance |
| RAN | — Revenue anticipation notes |
| RDA | — Redevelopment Authority |
| RDFA | — Redevelopment Finance Authority |
| REIT | — Real estate investment trust |
| ROC | — Reset option certificates |
| SAVRS | — Select auction variable rate securities |
| SBA | — Small Business Authority |
| SDR | — Swedish depositary receipt |
| SFHR | — Single-family housing revenue |
| SFMR | — Single-family mortgage revenue |
| SPA | — Standby purchase agreement |
| SPDR | — Standard & Poor’s Depositary Receipts |
| SPEAR | — Short Puttable Exempt Adjustable Receipts |
| STRIPS | — Separate trading of registered interest and |
| TAN | — Tax anticipation notes |
| TIPS | — Treasury inflation-protected securities |
| TRAN | — Tax revenue anticipation notes |
| TTFA | — Transportation Trust Fund Authority |
| TVA | — Tennessee Valley Authority |

For more information
More information about Wells Fargo Funds is available free upon request. To obtain literature, please write, email, visit the Fund’s website, or call:
Wells Fargo Funds
P.O. Box 8266
Boston, MA 02266-8266
Email: fundservice@wellsfargo.com
Website: wellsfargofunds.com
Individual investors: 1-800-222-8222
Retail investment professionals: 1-888-877-9275
Institutional investment professionals: 1-866-765-0778
This report and the financial statements contained herein are submitted for the general information of the shareholders of the Fund. If this report is used for promotional purposes, distribution of the report must be accompanied or preceded by a current prospectus. Before investing, please consider the investment objectives, risks, charges, and expenses of the investment. For a current prospectus and, if available, a summary prospectus, containing this information, call 1-800-222-8222 or visit the Fund’s website at wellsfargofunds.com. Read the prospectus carefully before you invest or send money.
Wells Fargo Asset Management (WFAM) is a trade name used by the asset management businesses of Wells Fargo & Company. Wells Fargo Funds Management, LLC, a wholly owned subsidiary of Wells Fargo & Company, provides investment advisory and administrative services for Wells Fargo Funds. Other affiliates of Wells Fargo & Company provide subadvisory and other services for the funds. The funds are distributed by Wells Fargo Funds Distributor, LLC, Member FINRA, an affiliate of Wells Fargo & Company. Neither Wells Fargo Funds Management nor Wells Fargo Funds Distributor has Fund customer accounts/assets, and neither provides investment advice/recommendations or acts as an investment advice fiduciary to any investor.
NOT FDIC INSURED ¡ NO BANK GUARANTEE ¡ MAY LOSE VALUE
© 2016 Wells Fargo Funds Management, LLC. All rights reserved.
| | |
 | | 246392 11-16 A228/AR228 09-16 |
Annual Report
September 30, 2016

Wells Fargo Common Stock Fund


Reduce clutter. Save trees.
Sign up for electronic delivery of prospectuses and shareholder reports at wellsfargo.com/advantagedelivery
Contents
The views expressed and any forward-looking statements are as of September 30, 2016, unless otherwise noted, and are those of the Fund managers and/or Wells Fargo Funds Management, LLC. Discussions of individual securities, or the markets generally, or any Wells Fargo Fund are not intended as individual recommendations. Future events or results may vary significantly from those expressed in any forward-looking statements. The views expressed are subject to change at any time in response to changing circumstances in the market. Wells Fargo Funds Management, LLC and the Fund disclaim any obligation to publicly update or revise any views expressed or forward-looking statements.
NOT FDIC INSURED ¡ NO BANK GUARANTEE ¡ MAY LOSE VALUE
| | | | |
| 2 | | Wells Fargo Common Stock Fund | | Letter to shareholders (unaudited) |

Karla M. Rabusch
President
Wells Fargo Funds
Dear Shareholder:
We are pleased to offer you this annual report for the Wells Fargo Common Stock Fund for the 12-month period that ended September 30, 2016. During this period, which began October 1, 2015, U.S. and international stock markets experienced bouts of heightened volatility, with intermittent sell-offs interspersed with rebounds. Despite market fluctuations throughout the year, U.S. small-, mid-, and large-cap stocks delivered double-digit positive results overall for the 12-month reporting period, as measured by the Russell 2000® Index,1 the Russell Midcap® Index,2 and the Russell 1000® Index,3 respectively. Small-cap U.S. stocks performed best, followed by large- and mid-cap stocks. International stocks overall also delivered positive results for the period.
Despite ongoing concerns, U.S. stocks generally rose in the fourth quarter of 2015; international markets lagged.
While U.S. stocks overall delivered favorable results in the quarter, stock markets outside the U.S. failed to keep pace as economic concerns, including China’s ongoing slowdown, continued to affect many countries. U.S. economic data released during the quarter indicated the economy remained solid, although the strong U.S. dollar and weakness in international economies remained headwinds. In December, the Federal Reserve (Fed), as expected, raised its target interest rate by 25 basis points (100 basis points equals 1.00%) after keeping it near zero for seven years. The move reflected confidence in the U.S. economy’s ability to stay healthy with less central-bank support. The Fed also clarified that future interest-rate increases would be gradual.
In the first quarter of 2016, market volatility increased globally amid ongoing concerns.
Stock markets worldwide fluctuated widely in the first quarter of 2016. Most sold off sharply in the first six weeks of the year on concerns such as weak global growth, falling commodity prices, and uncertainty over the timing and impact of the Fed’s interest-rate increases. As the quarter progressed, fears abated somewhat and global markets generally rallied. The U.S. economy ended the quarter on a positive note as much of the quarter’s data reflected resiliency. With ongoing uncertainties about global growth and financial markets, however, the Fed held off from raising the target interest rate during the quarter. Outside the U.S., the eurozone fell into deflation in February; in response, the European Central Bank (ECB) announced an expansion of its stimulus program. In China, the government in March set an anticipated growth rate of 6.5% to 7.0% for 2016, an acknowledgment of weakening growth. In emerging markets, although central-bank stimulus and improved prices for oil and other commodities led to stock-market rallies in the quarter, many of these countries’ economies face the potential of credit downgrades due to challenges such as the likelihood of a stronger U.S. dollar, which would make dollar-denominated debt more expensive.
Worries over interest rates and the U.K.’s Brexit vote largely drove markets during the second quarter of 2016.
U.S. stocks began the quarter in positive territory but started to lose steam in early May on worries that a possible June interest-rate increase by the Fed could hurt
| 1 | The Russell 2000® Index measures the performance of the 2,000 smallest companies in the Russell 3000® Index, which represents approximately 8% of the total market capitalization of the Russell 3000® Index. You cannot invest directly in an index. |
| 2 | The Russell Midcap® Index measures the performance of the 800 smallest companies in the Russell 1000® Index, which represent approximately 25% of the total market capitalization of the Russell 1000® Index. You cannot invest directly in an index. |
| 3 | The Russell 1000® Index measures the performance of the 1,000 largest companies in the Russell 3000® Index, which represents approximately 92% of the total market capitalization of the Russell 3000® Index. You cannot invest directly in an index. |
| | | | | | |
| Letter to shareholders (unaudited) | | Wells Fargo Common Stock Fund | | | 3 | |
the market. In mid-May, stocks briefly plunged following comments by Fed officials noting that a June interest-rate increase remained on the table. But once investors had processed this information, stocks again rallied, finishing up for the month. The first three weeks of June brought heightened volatility, spurred largely by a disappointing jobs report and uncertainty over whether the U.K. would remain in the E.U. The U.K.’s Brexit vote on June 23 shocked countries in Europe and much of the rest of the world. Stock markets fell as investors worried that the U.K.’s departure from the E.U. would slow global growth and prolong the low-interest-rate environment. Following the initial rout, however, U.S. stocks rallied as investors seemed to decide that any negative effects would be more localized and not create a serious risk for global growth. By quarter-end, the broad U.S. stock market had moved back into positive territory.
U.S. stocks delivered generally positive results in the third quarter of 2016.
The rally in U.S. stocks continued into early July 2016. U.S. stocks then generally continued to move upward at a more moderate pace, reaching a quarterly peak in August before the upward momentum started to lose some steam. Markets worldwide have been supported to varying degrees by accommodative policies from leading central banks, including the Fed, ECB, Bank of England, and Bank of Japan. As a result, investors have watched closely for any signs that global central banks might tighten their measures. Although many U.S. investors had doubted the Fed would increase interest rates in September, hawkish comments by several Fed officials in early September raised concerns, sending stock and bond prices downward. However, immediately following the Fed’s September 20 meeting, stocks surged on news that the Fed had decided to leave short-term interest rates unchanged for the time being and had signaled its intention to increase rates by year-end. The Fed also lowered its estimates for long-term economic growth and adjusted its anticipated pace of future rate increases. U.S. small-cap stocks in particular benefited from a renewed investor focus on fundamentals and from healthy merger and acquisition activity.
Don’t let short-term uncertainty derail long-term investment goals.
Periods of uncertainty can present challenges, but experience has taught us that maintaining long-term investment goals can be an effective way to plan for the future. To help you create a sound strategy based on your personal goals and risk tolerance, Wells Fargo Funds offers more than 100 mutual funds spanning a wide range of asset classes and investment styles. Although diversification cannot guarantee an investment profit or prevent losses, we believe it can be an effective way to manage investment risk and potentially smooth out overall portfolio performance. We encourage investors to know their investments and to understand that appropriate levels of risk-taking may unlock opportunities.
Thank you for choosing to invest in Wells Fargo Funds. We appreciate your confidence in us and remain committed to helping you meet your financial needs.
Sincerely,

Karla M. Rabusch
President
Wells Fargo Funds
Markets worldwide have been supported to varying degrees by accommodative policies from leading central banks, including the Fed, ECB, Bank of England, and Bank of Japan.
Although diversification cannot guarantee an investment profit or prevent losses, we believe it can be an effective way to manage investment risk and potentially smooth out overall portfolio performance.
For further information about your Fund, contact your investment professional, visit our website at wellsfargofunds.com, or call us directly at 1-800-222-8222. We are available 24 hours a day, 7 days a week.
| | | | |
| 4 | | Wells Fargo Common Stock Fund | | Performance highlights (unaudited) |
Investment objective
The Fund seeks long-term capital appreciation.
Manager
Wells Fargo Funds Management, LLC
Subadviser
Wells Capital Management Incorporated
Portfolio manager
Ann M. Miletti
Average annual total returns (%) as of September 30, 20161
| | | | | | | | | | | | | | | | | | | | | | | | | | | | | | | | | | |
| | | | | Including sales charge | | | Excluding sales charge | | | Expense ratios2 (%) | |
| | | Inception date | | 1 year | | | 5 year | | | 10 year | | | 1 year | | | 5 year | | | 10 year | | | Gross | | | Net3 | |
| Class A (SCSAX) | | 11-30-2000 | | | 5.96 | | | | 13.37 | | | | 7.92 | | | | 12.43 | | | | 14.72 | | | | 8.56 | | | | 1.24 | | | | 1.24 | |
| Class B (SCSKX)* | | 11-30-2000 | | | 6.75 | | | | 13.65 | | | | 7.98 | | | | 11.75 | | | | 13.89 | | | | 7.98 | | | | 1.99 | | | | 1.99 | |
| Class C (STSAX) | | 11-30-2000 | | | 10.52 | | | | 13.85 | | | | 7.74 | | | | 11.52 | | | | 13.85 | | | | 7.74 | | | | 1.99 | | | | 1.99 | |
| Class R6 (SCSRX) | | 6-28-2013 | | | – | | | | – | | | | – | | | | 12.91 | | | | 15.21 | | | | 8.85 | | | | 0.81 | | | | 0.81 | |
| Administrator Class (SCSDX) | | 7-30-2010 | | | – | | | | – | | | | – | | | | 12.59 | | | | 14.90 | | | | 8.67 | | | | 1.16 | | | | 1.11 | |
| Institutional Class (SCNSX) | | 7-30-2010 | | | – | | | | – | | | | – | | | | 12.88 | | | | 15.17 | | | | 8.83 | | | | 0.91 | | | | 0.86 | |
| Russell 2500TM Index4 | | – | | | – | | | | – | | | | – | | | | 14.44 | | | | 16.30 | | | | 7.95 | | | | – | | | | – | |
| * | | At the close of business on December 5, 2016, existing Class B shareholders were converted to Class A shareholders. Effective December 6, 2016, Class B shares are no longer offered by the Fund. |
Figures quoted represent past performance, which is no guarantee of future results, and do not reflect taxes that a shareholder may pay on fund distributions or the redemption of fund shares. Investment return and principal value of an investment will fluctuate so that an investor’s shares, when redeemed, may be worth more or less than their original cost. Performance shown without sales charges would be lower if sales charges were reflected. Current performance may be lower or higher than the performance data quoted, which assumes the reinvestment of dividends and capital gains. Current month-end performance is available on the Fund’s website, wellsfargofunds.com.
Index returns do not include transaction costs associated with buying and selling securities, any mutual fund fees or expenses, or any taxes. It is not possible to invest directly in an index.
For Class A shares, the maximum front-end sales charge is 5.75%. For Class B shares, the maximum contingent deferred sales charge is 5.00%. For Class C shares, the maximum contingent deferred sales charge is 1.00%. Performance including a contingent deferred sales charge assumes the sales charge for the corresponding time period. Class R6, Administrator Class, and Institutional Class shares are sold without a front-end sales charge or contingent deferred sales charge.
Stock values fluctuate in response to the activities of individual companies and general market and economic conditions. Smaller-company stocks tend to be more volatile and less liquid than those of larger companies. Certain investment strategies tend to increase the total risk of an investment (relative to the broader market). The Fund is exposed to foreign investment risk. Consult the Fund’s prospectus for additional information on these and other risks.
Please see footnotes on page 5.
| | | | | | |
| Performance highlights (unaudited) | | Wells Fargo Common Stock Fund | | | 5 | |
|
| Growth of $10,000 investment as of September 30, 20165 |
|
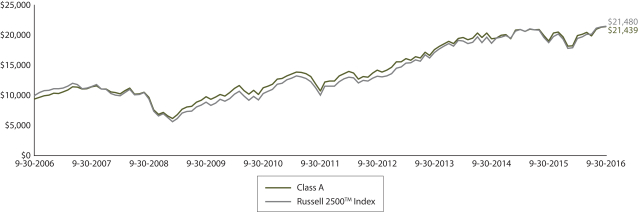 |
| 1 | Historical performance shown for Class R6 shares prior to their inception reflects the performance of Institutional Class shares, and includes the higher expenses applicable to Institutional Class shares. If these expenses had not been included, the returns would be higher. Historical performance shown for Administrator Class and Institutional Class shares prior to their inception reflects the performance of Class A shares, and includes the higher expenses applicable to Class A shares. If these expenses had not been included, the returns would be higher. |
| 2 | Reflects the expense ratios as stated in the most recent prospectuses, which include the impact of 0.01% in acquired fund fees and expenses. The expense ratios shown are subject to change and may differ from the annualized expense ratios shown in the financial highlights of this report, which do not include acquired fund fees and expenses. |
| 3 | The manager has contractually committed through January 31, 2017, to waive fees and/or reimburse expenses to the extent necessary to cap the Fund’s Total Annual Fund Operating Expenses After Fee Waiver at 1.26% for Class A, 2.01% for Class B, 2.01% for Class C, 0.85% for Class R6, 1.10% for Administrator Class, and 0.85% for Institutional Class. After this time, the cap may be increased or the commitment to maintain the cap may be terminated only with the approval of the Board of Trustees. Brokerage commissions, stamp duty fees, interest, taxes, acquired fund fees and expenses, and extraordinary expenses are excluded from the expense cap. Without this cap, the Fund’s returns would have been lower. |
| 4 | The Russell 2500TM Index measures the performance of the 2,500 smallest companies in the Russell 3000® Index, which represents approximately 16% of the total market capitalization of the Russell 3000® Index. You cannot invest directly in an index. |
| 5 | The chart compares the performance of Class A shares for the most recent ten years with the Russell 2500TM Index. The chart assumes a hypothetical investment of $10,000 in Class A shares and reflects all operating expenses and assumes the maximum initial sales charge of 5.75%. |
| 6 | The ten largest holdings, excluding cash and cash equivalents, are calculated based on the value of the investments divided by total net assets of the Fund. Holdings are subject to change and may have changed since the date specified. |
| 7 | Amounts are calculated based on the total long-term investments of the Fund. These amounts are subject to change and may have changed since the date specified. |
| | | | |
| 6 | | Wells Fargo Common Stock Fund | | Performance highlights (unaudited) |
MANAGER’S DISCUSSION
Fund highlights
| n | | The Fund underperformed its benchmark, the Russell 2500TM Index, for the 12-month period that ended September 30, 2016. |
| n | | Weak results from holdings in the industrials and financials sectors, lack of exposure to utilities, and an underweight to the real estate sector detracted from performance. |
| n | | Favorable results from holdings in the health care, energy, and materials sectors benefited performance. |
Despite a few down months and some short bursts of volatility, U.S. stocks overall generally ended higher in all four quarters of the period, and a number of U.S. stock market indexes reached new highs in August 2016. During the 12-month period, smaller-cap and value stocks generally performed better than larger-cap and growth stocks, respectively.
A number of factors influenced the stock market; we list a number of them here. First, the U.K. vote to leave the E.U. (Brexit) at the end of June caused a brief market disruption. Second, after keeping interest rates at near zero for seven years, the U.S. Federal Reserve (Fed) finally raised its target short-term rate to between 0.25% and 0.50% in December 2015, but then left it unchanged for the rest of the reporting period. Third, while the Fed action signaled further U.S. tightening to come, the European Central Bank and the Bank of Japan continued their accommodative policies. Fourth, interest rates stayed flat or decreased in most of the developed world outside the U.S., including countries with negative interest rates. Fifth, energy and most commodity prices fell during the period, bottoming out in February before recovering to prices near their opening levels. Sixth, the U.S. dollar remained stable against most major currencies, but it rose against the British pound and fell against the Japanese yen. Seventh, U.S. gross domestic product continued to grow but at a slower rate than the previous year, ending the second quarter of 2016 at an annualized growth rate of 1.4%. Eighth, the U.S. experienced favorable trends in unemployment, wages, disposal income, and inflation.
Throughout all of the market and economic events that occurred during the reporting period and with the expectation of tighter U.S. monetary policy going forward, we continued to seek companies with good business models, strong management teams, and healthy cash flows trading at attractive discounts to their private market valuations (PMV). The PMV represents the expected price an investor would pay for the entire company as a stand-alone private entity.
| | | | |
| Ten largest holdings (%) as of September 30, 20166 | |
E*TRADE Financial Corporation | | | 2.11 | |
Haemonetics Corporation | | | 2.06 | |
Raymond James Financial Incorporated | | | 1.87 | |
ON Semiconductor Corporation | | | 1.82 | |
Willis Towers Watson plc | | | 1.81 | |
Agilent Technologies Incorporated | | | 1.78 | |
Laboratory Corporation of America Holdings | | | 1.75 | |
SBA Communications Corporation Class A | | | 1.66 | |
Universal Health Services Incorporated Class B | | | 1.65 | |
Harman International Industries Incorporated | | | 1.63 | |
Stock selection within the industrials and financials sectors held back Fund performance.
Overall, the Fund’s industrials and financials holdings did not keep pace with their respective sectors within the Russell 2500TM Index. Hertz Global Holdings, Incorporated, and Ryder System, Incorporated—holdings in the road and rail industry—declined during the period. While Hertz has been focused on an internal restructuring, shares have been declining due to macroeconomic uncertainty. Ryder’s shares declined on lowered expectations for rental demand and used-vehicle sales, especially tractors. Steelcase Incorporated, a global office-furniture manufacturer, declined over macroeconomic concerns and a failure to benefit from the high level of end-of-calendar-year spending by
customers that the company typically sees. Within the real estate sector, performance was hurt by lack of exposure to real estate investment trusts (REITs), which have benefited from prolonged low interest rates. Life insurers were negatively impacted by the low-interest-rate environment. CNO Financial Group, Incorporated, faced that headwind and declined further on the news that one of its reinsurance partners has ties to a troubled hedge fund. Lack of exposure to the utilities sector also hurt performance as this sector benefited during the period from low interest rates and a flight to safety by investors.
Please see footnotes on page 5.
| | | | | | |
| Performance highlights (unaudited) | | Wells Fargo Common Stock Fund | | | 7 | |
Favorable stock selection drove relative outperformance within the Fund’s health care, energy, and materials sectors.
The Fund’s holdings within the health care, energy, and materials sectors significantly outperformed relative to the results posted by, respectively, the health care, energy, and materials sectors of the Russell 2500TM Index. The Fund’s outperformance in health care was due largely to positive stock selection in the health care providers/services industry and an underweight to biotechnology. Within the Fund’s energy sector, most of the gains came from exploration and production (E&P) holdings, which include some of the higher-quality E&P companies as defined by strong balance sheets, experienced management teams, and low-cost production in the richest shale zones of the Permian Basin. Top-performing energy holdings included Pioneer Natural Resources Company, Concho Resources Incorporated, and Cimarex Energy Company. The Fund’s holdings within the materials sector benefited from rising commodity prices in the second half of the period. In the metals and mining industry, Royal Gold, Incorporated, and Steel Dynamics, Incorporated, performed the best.
|
| Portfolio allocation as of September 30, 20167 |
|
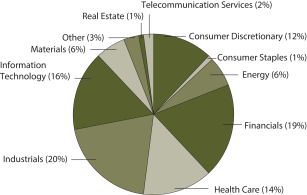 |
Our focus remains constant: to add value for shareholders through attractively priced, high-quality Fund holdings.
Our methodology includes buying stocks at a discount to their estimated PMV and selling stocks as they approach or exceed the upper end of their PMV range.
Our disciplined, bottom-up investment process leads us to be overweight or underweight certain sectors. This positioning changes over time based on macroeconomic and industry-specific factors. In recent years, our process has led us to hold overweights to the information technology and industrials sectors and underweights to the financials and utilities sectors. Through our disciplined investment process, we remain keenly
aware of both price and enterprise values on a company-by-company basis. Our proprietary database of company acquisitions across industries, sectors, and time frames enables us to maintain a steady foundation for assessing the PMV of companies compared with their public stock prices. We strive to take advantage of those price discrepancies for the benefit of Fund shareholders by purchasing stocks when we believe they are selling at a discount to their PMV.
An improving economy, low interest rates, and generally favorable investor sentiment helped to broadly lift the stock market and keep multiples high over most of the 12-month period. Certain sectors benefited from the quest for dividend yields and a flight to safety. We believe interest rates, the upcoming U.S. general election, and geopolitical events may have impacts on the market in the coming quarters. In our view, companies with attractive stock prices relative to their PMV may be brought to the forefront by our process, potentially allowing us to add value through our unique, bottom-up approach.
Please see footnotes on page 5.
| | | | |
| 8 | | Wells Fargo Common Stock Fund | | Fund expenses (unaudited) |
As a shareholder of the Fund, you incur two types of costs: (1) transaction costs, including sales charges (loads) on purchase payments and contingent deferred sales charges (if any) on redemptions and (2) ongoing costs, including management fees, distribution (12b-1) and/or shareholder servicing fees, and other Fund expenses. This example is intended to help you understand your ongoing costs (in dollars) of investing in the Fund and to compare these costs with the ongoing costs of investing in other mutual funds.
The example is based on an investment of $1,000 invested at the beginning of the six-month period and held for the entire period from April 1, 2016 to September 30, 2016.
Actual expenses
The “Actual” line of the table below provides information about actual account values and actual expenses. You may use the information in this line, together with the amount you invested, to estimate the expenses that you paid over the period. Simply divide your account value by $1,000 (for example, an $8,600 account value divided by $1,000 = 8.6), then multiply the result by the number in the “Actual” line under the heading entitled “Expenses paid during period” for your applicable class of shares to estimate the expenses you paid on your account during this period.
Hypothetical example for comparison purposes
The “Hypothetical” line of the table below provides information about hypothetical account values and hypothetical expenses based on the Fund’s actual expense ratio and an assumed rate of return of 5% per year before expenses, which is not the Fund’s actual return. The hypothetical account values and expenses may not be used to estimate the actual ending account balance or expenses you paid for the period. You may use this information to compare the ongoing costs of investing in the Fund and other funds. To do so, compare this 5% hypothetical example with the 5% hypothetical examples that appear in the shareholder reports of the other funds.
Please note that the expenses shown in the table are meant to highlight your ongoing costs only and do not reflect any transactional costs, such as sales charges (loads) and contingent deferred sales charges. Therefore, the “Hypothetical” line of the table is useful in comparing ongoing costs only and will not help you determine the relative total costs of owning different funds. In addition, if these transactional costs were included, your costs would have been higher.
| | | | | | | | | | | | | | | | |
| | | Beginning
account value
4-1-2016 | | | Ending
account value
9-30-2016 | | | Expenses
paid during
the period¹ | | | Annualized net
expense ratio | |
Class A | | | | | | | | | | | | | | | | |
Actual | | $ | 1,000.00 | | | $ | 1,073.93 | | | $ | 6.48 | | | | 1.25 | % |
Hypothetical (5% return before expenses) | | $ | 1,000.00 | | | $ | 1,018.75 | | | $ | 6.31 | | | | 1.25 | % |
Class B | | | | | | | | | | | | | | | | |
Actual | | $ | 1,000.00 | | | $ | 1,069.51 | | | $ | 10.35 | | | | 2.00 | % |
Hypothetical (5% return before expenses) | | $ | 1,000.00 | | | $ | 1,015.00 | | | $ | 10.08 | | | | 2.00 | % |
Class C | | | | | | | | | | | | | | | | |
Actual | | $ | 1,000.00 | | | $ | 1,069.68 | | | $ | 10.35 | | | | 2.00 | % |
Hypothetical (5% return before expenses) | | $ | 1,000.00 | | | $ | 1,015.00 | | | $ | 10.08 | | | | 2.00 | % |
Class R6 | | | | | | | | | | | | | | | | |
Actual | | $ | 1,000.00 | | | $ | 1,076.44 | | | $ | 4.26 | | | | 0.82 | % |
Hypothetical (5% return before expenses) | | $ | 1,000.00 | | | $ | 1,020.90 | | | $ | 4.15 | | | | 0.82 | % |
Administrator Class | | | | | | | | | | | | | | | | |
Actual | | $ | 1,000.00 | | | $ | 1,074.49 | | | $ | 5.70 | | | | 1.10 | % |
Hypothetical (5% return before expenses) | | $ | 1,000.00 | | | $ | 1,019.50 | | | $ | 5.55 | | | | 1.10 | % |
Institutional Class | | | | | | | | | | | | | | | | |
Actual | | $ | 1,000.00 | | | $ | 1,076.10 | | | $ | 4.41 | | | | 0.85 | % |
Hypothetical (5% return before expenses) | | $ | 1,000.00 | | | $ | 1,020.75 | | | $ | 4.29 | | | | 0.85 | % |
| 1 | Expenses paid is equal to the annualized net expense ratio of each class multiplied by the average account value over the period, multiplied by the number of days in the most recent fiscal half-year divided by the number of days in the fiscal year (to reflect the one-half-year period). |
| | | | | | |
| Portfolio of investments—September 30, 2016 | | Wells Fargo Common Stock Fund | | | 9 | |
| | | | | | | | | | | | | | | | |
| Security name | | | | | | | | Shares | | | Value | |
| | | | |
Common Stocks: 94.88% | | | | | | | | | | | | | | | | |
| | | | |
Consumer Discretionary: 11.36% | | | | | | | | | | | | | | | | |
| | | | |
| Diversified Consumer Services: 1.16% | | | | | | | | | | | | | | | | |
Houghton Mifflin Harcourt Company † | | | | | | | | | | | 1,070,359 | | | $ | 14,353,514 | |
| | | | | | | | | | | | | | | | |
| | | | |
| Hotels, Restaurants & Leisure: 1.80% | | | | | | | | | | | | | | | | |
Buffalo Wild Wings Incorporated † | | | | | | | | | | | 91,456 | | | | 12,871,517 | |
Norwegian Cruise Line Holdings Limited † | | | | | | | | | | | 250,919 | | | | 9,459,646 | |
| |
| | | | 22,331,163 | |
| | | | | | | | | | | | | | | | |
| | | | |
| Household Durables: 4.19% | | | | | | | | | | | | | | | | |
Harman International Industries Incorporated | | | | | | | | | | | 239,724 | | | | 20,244,692 | |
MDC Holdings Incorporated | | | | | | | | | | | 598,187 | | | | 15,433,225 | |
Mohawk Industries Incorporated † | | | | | | | | | | | 81,201 | | | | 16,267,808 | |
| |
| | | | 51,945,725 | |
| | | | | | | | | | | | | | | | |
| | | | |
| Media: 2.07% | | | | | | | | | | | | | | | | |
Interpublic Group of Companies Incorporated | | | | | | | | | | | 611,387 | | | | 13,664,499 | |
Scripps Networks Interactive Incorporated Class A | | | | | | | | | | | 187,291 | | | | 11,891,106 | |
| |
| | | | 25,555,605 | |
| | | | | | | | | | | | | | | | |
| | | | |
| Specialty Retail: 1.06% | | | | | | | | | | | | | | | | |
Tractor Supply Company | | | | | | | | | | | 195,351 | | | | 13,156,890 | |
| | | | | | | | | | | | | | | | |
| | | | |
| Textiles, Apparel & Luxury Goods: 1.08% | | | | | | | | | | | | | | | | |
PVH Corporation | | | | | | | | | | | 121,143 | | | | 13,386,302 | |
| | | | | | | | | | | | | | | | |
| | | | |
Consumer Staples: 1.09% | | | | | | | | | | | | | | | | |
| | | | |
| Household Products: 1.09% | | | | | | | | | | | | | | | | |
Church & Dwight Company Incorporated | | | | | | | | | | | 283,250 | | | | 13,573,340 | |
| | | | | | | | | | | | | | | | |
| | | | |
Energy: 6.08% | | | | | | | | | | | | | | | | |
| | | | |
| Energy Equipment & Services: 0.68% | | | | | | | | | | | | | | | | |
Weatherford International plc † | | | | | | | | | | | 1,509,308 | | | | 8,482,311 | |
| | | | | | | | | | | | | | | | |
| | | | |
| Oil, Gas & Consumable Fuels: 5.40% | | | | | | | | | | | | | | | | |
Cimarex Energy Company | | | | | | | | | | | 121,677 | | | | 16,349,738 | |
Concho Resources Incorporated † | | | | | | | | | | | 96,921 | | | | 13,312,099 | |
Matador Resources Company † | | | | | | | | | | | 471,472 | | | | 11,475,628 | |
Pioneer Natural Resources Company | | | | | | | | | | | 90,317 | | | | 16,767,351 | |
Range Resources Corporation | | | | | | | | | | | 232,824 | | | | 9,021,930 | |
| |
| | | | 66,926,746 | |
| | | | | | | | | | | | | | | | |
| | | | |
Financials: 18.34% | | | | | | | | | | | | | | | | |
| | | | |
| Banks: 5.77% | | | | | | | | | | | | | | | | |
Bank of the Ozarks Incorporated | | | | | | | | | | | 476,771 | | | | 18,308,006 | |
First Horizon National Corporation | | | | | | | | | | | 1,246,124 | | | | 18,978,469 | |
PacWest Bancorp | | | | | | | | | | | 405,087 | | | | 17,382,283 | |
Sterling BanCorp | | | | | | | | | | | 958,868 | | | | 16,780,190 | |
| |
| | | | 71,448,948 | |
| | | | | | | | | | | | | | | | |
The accompanying notes are an integral part of these financial statements.
| | | | |
| 10 | | Wells Fargo Common Stock Fund | | Portfolio of investments—September 30, 2016 |
| | | | | | | | | | | | | | | | |
| Security name | | | | | | | | Shares | | | Value | |
|
| Capital Markets: 3.99% | |
E*TRADE Financial Corporation † | | | | | | | | | | | 899,585 | | | $ | 26,195,915 | |
Raymond James Financial Incorporated | | | | | | | | | | | 398,852 | | | | 23,217,175 | |
| |
| | | | 49,413,090 | |
| | | | | | | | | | | | | | | | |
| | | | |
| Insurance: 8.58% | | | | | | | | | | | | | | | | |
Arch Capital Group Limited † | | | | | | | | | | | 164,769 | | | | 13,059,591 | |
CNO Financial Group Incorporated | | | | | | | | | | | 1,316,192 | | | | 20,098,252 | |
Reinsurance Group of America Incorporated | | | | | | | | | | | 179,110 | | | | 19,333,133 | |
RenaissanceRe Holdings Limited | | | | | | | | | | | 132,648 | | | | 15,938,984 | |
The Progressive Corporation | | | | | | | | | | | 493,641 | | | | 15,549,692 | |
Willis Towers Watson plc | | | | | | | | | | | 168,516 | | | | 22,373,869 | |
| |
| | | | 106,353,521 | |
| | | | | | | | | | | | | | | | |
| | | | |
Health Care: 13.48% | | | | | | | | | | | | | | | | |
| | | | |
| Biotechnology: 1.31% | | | | | | | | | | | | | | | | |
Alkermes plc † | | | | | | | | | | | 205,034 | | | | 9,642,749 | |
BioMarin Pharmaceutical Incorporated † | | | | | | | | | | | 71,556 | | | | 6,620,361 | |
| |
| | | | 16,263,110 | |
| | | | | | | | | | | | | | | | |
| | | | |
| Health Care Equipment & Supplies: 4.92% | | | | | | | | | | | | | | | | |
Haemonetics Corporation † | | | | | | | | | | | 705,970 | | | | 25,563,174 | |
Hologic Incorporated † | | | | | | | | | | | 434,882 | | | | 16,886,468 | |
LivaNova plc † | | | | | | | | | | | 308,436 | | | | 18,540,088 | |
| |
| | | | 60,989,730 | |
| | | | | | | | | | | | | | | | |
| | | | |
| Health Care Providers & Services: 4.08% | | | | | | | | | | | | | | | | |
Humana Incorporated | | | | | | | | | | | 47,616 | | | | 8,422,794 | |
Laboratory Corporation of America Holdings † | | | | | | | | | | | 157,335 | | | | 21,630,416 | |
Universal Health Services Incorporated Class B | | | | | | | | | | | 165,912 | | | | 20,443,677 | |
| |
| | | | 50,496,887 | |
| | | | | | | | | | | | | | | | |
| | | | |
| Life Sciences Tools & Services: 3.17% | | | | | | | | | | | | | | | | |
Agilent Technologies Incorporated | | | | | | | | | | | 468,699 | | | | 22,071,036 | |
PerkinElmer Incorporated | | | | | | | | | | | 306,280 | | | | 17,185,371 | |
| |
| | | | 39,256,407 | |
| | | | | | | | | | | | | | | | |
| | | | |
Industrials: 20.04% | | | | | | | | | | | | | | | | |
| | | | |
| Aerospace & Defense: 2.70% | | | | | | | | | | | | | | | | |
B/E Aerospace Incorporated | | | | | | | | | | | 387,686 | | | | 20,027,859 | |
BWX Technologies Incorporated | | | | | | | | | | | 349,677 | | | | 13,417,106 | |
| |
| | | | 33,444,965 | |
| | | | | | | | | | | | | | | | |
| | | | |
| Airlines: 1.41% | | | | | | | | | | | | | | | | |
United Continental Holdings Incorporated † | | | | | | | | | | | 332,718 | | | | 17,457,713 | |
| | | | | | | | | | | | | | | | |
| | | | |
| Commercial Services & Supplies: 2.99% | | | | | | | | | | | | | | | | |
Republic Services Incorporated | | | | | | | | | | | 343,601 | | | | 17,334,670 | |
The accompanying notes are an integral part of these financial statements.
| | | | | | |
| Portfolio of investments—September 30, 2016 | | Wells Fargo Common Stock Fund | | | 11 | |
| | | | | | | | | | | | | | | | |
| Security name | | | | | | | | Shares | | | Value | |
| | | | |
| Commercial Services & Supplies (continued) | | | | | | | | | | | | | | | | |
Steelcase Incorporated Class A | | | | | | | | | | | 1,097,239 | | | $ | 15,240,650 | |
Stericycle Incorporated † | | | | | | | | | | | 55,632 | | | | 4,458,348 | |
| |
| | | | 37,033,668 | |
| | | | | | | | | | | | | | | | |
| | | | |
| Electrical Equipment: 3.72% | | | | | | | | | | | | | | | | |
AMETEK Incorporated | | | | | | | | | | | 337,771 | | | | 16,138,698 | |
Babcock & Wilcox Enterprises Incorporated † | | | | | | | | | | | 789,199 | | | | 13,021,784 | |
Sensata Technologies Holding NV † | | | | | | | | | | | 437,892 | | | | 16,981,452 | |
| |
| | | | 46,141,934 | |
| | | | | | | | | | | | | | | | |
| | | | |
| Machinery: 4.05% | | | | | | | | | | | | | | | | |
Allison Transmission Holdings Incorporated | | | | | | | | | | | 631,417 | | | | 18,109,040 | |
Colfax Corporation † | | | | | | | | | | | 499,178 | | | | 15,689,165 | |
Wabtec Corporation | | | | | | | | | | | 200,076 | | | | 16,336,205 | |
| |
| | | | 50,134,410 | |
| | | | | | | | | | | | | | | | |
| | | | |
| Road & Rail: 2.78% | | | | | | | | | | | | | | | | |
Hertz Global Holdings Incorporated † | | | | | | | | | | | 395,156 | | | | 15,869,465 | |
Ryder System Incorporated | | | | | | | | | | | 282,160 | | | | 18,608,452 | |
| |
| | | | 34,477,917 | |
| | | | | | | | | | | | | | | | |
| | | | |
| Trading Companies & Distributors: 2.39% | | | | | | | | | | | | | | | | |
GATX Corporation « | | | | | | | | | | | 345,879 | | | | 15,408,909 | |
MRC Global Incorporated † | | | | | | | | | | | 867,457 | | | | 14,252,319 | |
| |
| | | | 29,661,228 | |
| | | | | | | | | | | | | | | | |
| | | | |
Information Technology: 16.18% | | | | | | | | | | | | | | | | |
| | | | |
| Internet Software & Services: 1.20% | | | | | | | | | | | | | | | | |
Cornerstone OnDemand Incorporated † | | | | | | | | | | | 323,125 | | | | 14,847,594 | |
| | | | | | | | | | | | | | | | |
| | | | |
| IT Services: 4.36% | | | | | | | | | | | | | | | | |
Amdocs Limited | | | | | | | | | | | 230,376 | | | | 13,327,252 | |
CoreLogic Incorporated † | | | | | | | | | | | 351,071 | | | | 13,769,005 | |
Gartner Incorporated † | | | | | | | | | | | 115,329 | | | | 10,200,850 | |
Global Payments Incorporated | | | | | | | | | | | 218,671 | | | | 16,785,186 | |
| |
| | | | 54,082,293 | |
| | | | | | | | | | | | | | | | |
| | | | |
| Semiconductors & Semiconductor Equipment: 5.39% | | | | | | | | | | | | | | | | |
Integrated Device Technology Incorporated † | | | | | | | | | | | 741,957 | | | | 17,139,207 | |
Maxim Integrated Products Incorporated | | | | | | | | | | | 212,129 | | | | 8,470,311 | |
ON Semiconductor Corporation † | | | | | | | | | | | 1,825,663 | | | | 22,492,168 | |
Skyworks Solutions Incorporated | | | | | | | | | | | 244,827 | | | | 18,641,128 | |
| |
| | | | 66,742,814 | |
| | | | | | | | | | | | | | | | |
| | | | |
| Software: 3.89% | | | | | | | | | | | | | | | | |
Nuance Communications Incorporated † | | | | | | | | | | | 964,074 | | | | 13,979,073 | |
Red Hat Incorporated † | | | | | | | | | | | 241,991 | | | | 19,560,133 | |
Zendesk Incorporated † | | | | | | | | | | | 477,843 | | | | 14,674,559 | |
| |
| | | | 48,213,765 | |
| | | | | | | | | | | | | | | | |
The accompanying notes are an integral part of these financial statements.
| | | | |
| 12 | | Wells Fargo Common Stock Fund | | Portfolio of investments—September 30, 2016 |
| | | | | | | | | | | | | | | | |
| Security name | | | | | | | | Shares | | | Value | |
| | | | |
| Technology Hardware, Storage & Peripherals: 1.34% | | | | | | | | | | | | | | | | |
Diebold Incorporated | | | | | | | | | | | 668,178 | | | $ | 16,564,133 | |
| | | | | | | | | | | | | | | | |
| | | | |
Materials: 5.74% | | | | | | | | | | | | | | | | |
| | | | |
| Chemicals: 2.25% | | | | | | | | | | | | | | | | |
Axalta Coating Systems Limited † | | | | | | | | | | | 483,001 | | | | 13,654,438 | |
International Flavors & Fragrances Incorporated | | | | | | | | | | | 99,050 | | | | 14,161,179 | |
| |
| | | | 27,815,617 | |
| | | | | | | | | | | | | | | | |
| | | | |
| Containers & Packaging: 1.57% | | | | | | | | | | | | | | | | |
Crown Holdings Incorporated † | | | | | | | | | | | 340,165 | | | | 19,420,020 | |
| | | | | | | | | | | | | | | | |
| | | | |
| Metals & Mining: 1.92% | | | | | | | | | | | | | | | | |
Royal Gold Incorporated | | | | | | | | | | | 180,581 | | | | 13,982,387 | |
Steel Dynamics Incorporated | | | | | | | | | | | 394,375 | | | | 9,855,431 | |
| |
| | | | 23,837,818 | |
| | | | | | | | | | | | | | | | |
|
Real Estate: 0.91% | |
| | | | |
| Equity REITs: 0.91% | | | | | | | | | | | | | | | | |
Camden Property Trust | | | | | | | | | | | 135,171 | | | | 11,319,220 | |
| | | | | | | | | | | | | | | | |
| | | | |
Telecommunication Services: 1.66% | | | | | | | | | | | | | | | | |
| | | | |
| Diversified Telecommunication Services: 1.66% | | | | | | | | | | | | | | | | |
SBA Communications Corporation Class A † | | | | | | | | | | | 183,156 | | | | 20,542,774 | |
| | | | | | | | | | | | | | | | |
| | | | |
Total Common Stocks (Cost $856,926,828) | | | | | | | | | | | | | | | 1,175,671,172 | |
| | | | | | | | | | | | | | | | |
| | | | |
Exchange-Traded Funds: 3.36% | | | | | | | | | | | | | | | | |
SPDR Dow Jones REIT ETF | | | | | | | | | | | 175,220 | | | | 17,061,171 | |
SPDR S&P Biotech ETF « | | | | | | | | | | | 257,306 | | | | 17,056,815 | |
SPDR Utilities Select Sector ETF « | | | | | | | | | | | 153,718 | | | | 7,530,645 | |
| |
Total Exchange-Traded Funds (Cost $35,374,540) | | | | 41,648,631 | |
| | | | | | | | | | | | | | | | |
| | | | |
| | | Yield | | | | | | | | | | |
| Short-Term Investments: 3.81% | | | | | | | | | | | | | | | | |
| | | | |
| Investment Companies: 3.81% | | | | | | | | | | | | | | | | |
Securities Lending Cash Investments LLC (l)(r)(u) | | | 0.65 | % | | | | | | | 23,242,150 | | | | 23,242,150 | |
Wells Fargo Government Money Market Fund Select Class (l)(u) | | | 0.34 | | | | | | | | 23,993,777 | | | | 23,993,777 | |
| | | | |
Total Short-Term Investments (Cost $47,235,927) | | | | | | | | | | | | | | | 47,235,927 | |
| | | | | | | | | | | | | | | | |
| | | | | | | | |
| Total investments in securities (Cost $939,537,295) * | | | 102.05 | % | | | 1,264,555,730 | |
Other assets and liabilities, net | | | (2.05 | ) | | | (25,426,591 | ) |
| | | | | | | | |
| Total net assets | | | 100.00 | % | | $ | 1,239,129,139 | |
| | | | | | | | |
The accompanying notes are an integral part of these financial statements.
| | | | | | |
| Portfolio of investments—September 30, 2016 | | Wells Fargo Common Stock Fund | | | 13 | |
| † | Non-income-earning security |
| « | All or a portion of this security is on loan. |
| (l) | The issuer of the security is an affiliated person of the Fund as defined in the Investment Company Act of 1940. |
| (r) | The investment is a non-registered investment vehicle purchased with cash collateral received from securities on loan. |
| (u) | The rate represents the 7-day annualized yield at period end. |
| * | Cost for federal income tax purposes is $947,070,302 and unrealized gains (losses) consists of: |
| | | | |
Gross unrealized gains | | $ | 361,293,088 | |
Gross unrealized losses | | | (43,807,660 | ) |
| | | | |
Net unrealized gains | | $ | 317,485,428 | |
The accompanying notes are an integral part of these financial statements.
| | | | |
| 14 | | Wells Fargo Common Stock Fund | | Statement of assets and liabilities—September 30, 2016 |
| | | | |
| | | | |
| |
Assets | | | | |
Investments | | | | |
In unaffiliated securities (including $23,163,288 of securities loaned), at value (cost $892,301,368) | | $ | 1,217,319,803 | |
In affiliated securities, at value (cost $47,235,927) | | | 47,235,927 | |
| | | | |
Total investments, at value (cost $939,537,295) | | | 1,264,555,730 | |
Cash | | | 5,360 | |
Receivable for investments sold | | | 1,929,215 | |
Receivable for Fund shares sold | | | 200,676 | |
Receivable for dividends | | | 870,710 | |
Receivable for securities lending income | | | 24,703 | |
Prepaid expenses and other assets | | | 16,490 | |
| | | | |
Total assets | | | 1,267,602,884 | |
| | | | |
| |
Liabilities | | | | |
Payable for investments purchased | | | 3,023,665 | |
Payable for Fund shares redeemed | | | 880,195 | |
Payable upon receipt of securities loaned | | | 23,242,150 | |
Management fee payable | | | 813,358 | |
Distribution fees payable | | | 15,245 | |
Administration fees payable | | | 198,629 | |
Accrued expenses and other liabilities | | | 300,503 | |
| | | | |
Total liabilities | | | 28,473,745 | |
| | | | |
Total net assets | | $ | 1,239,129,139 | |
| | | | |
| |
NET ASSETS CONSIST OF | | | | |
Paid-in capital | | $ | 880,537,541 | |
Accumulated net investment loss | | | (3,859 | ) |
Accumulated net realized gains on investments | | | 33,577,022 | |
Net unrealized gains on investments | | | 325,018,435 | |
| | | | |
Total net assets | | $ | 1,239,129,139 | |
| | | | |
| |
COMPUTATION OF NET ASSET VALUE AND OFFERING PRICE PER SHARE | | | | |
Net assets – Class A | | $ | 924,864,191 | |
Shares outstanding – Class A1 | | | 43,021,735 | |
Net asset value per share – Class A | | | $21.50 | |
Maximum offering price per share – Class A2 | | | $22.81 | |
Net assets – Class B | | $ | 31,973 | |
Shares outstanding – Class B1 | | | 1,872 | |
Net asset value per share – Class B | | | $17.08 | |
Net assets – Class C | | $ | 22,901,952 | |
Shares outstanding – Class C1 | | | 1,343,637 | |
Net asset value per share – Class C | | | $17.04 | |
Net assets – Class R6 | | $ | 101,436,136 | |
Shares outstanding – Class R61 | | | 4,559,834 | |
Net asset value per share – Class R6 | | | $22.25 | |
Net assets – Administrator Class | | $ | 16,720,050 | |
Shares outstanding – Administrator Class1 | | | 767,665 | |
Net asset value per share – Administrator Class | | | $21.78 | |
Net assets – Institutional Class | | $ | 173,174,837 | |
Shares outstanding – Institutional Class1 | | | 7,800,694 | |
Net asset value per share – Institutional Class | | | $22.20 | |
| 1 | The Fund has an unlimited number of authorized shares. |
| 2 | Maximum offering price is computed as 100/94.25 of net asset value. On investments of $50,000 or more, the offering price is reduced. |
The accompanying notes are an integral part of these financial statements.
| | | | | | |
| Statement of operations—year ended September 30, 2016 | | Wells Fargo Common Stock Fund | | | 15 | |
| | | | |
| | | | |
| |
Investment income | | | | |
Dividends | | $ | 14,066,033 | |
Securities lending income, net | | | 237,138 | |
Income from affiliated securities | | | 103,503 | |
| | | | |
Total investment income | | | 14,406,674 | |
| | | | |
| |
Expenses | | | | |
Management fee | | | 9,635,118 | |
Administration fees | | | | |
Class A | | | 1,836,051 | |
Class B | | | 140 | |
Class C | | | 50,644 | |
Class R6 | | | 29,111 | |
Administrator Class | | | 22,227 | |
Institutional Class | | | 256,090 | |
Investor Class | | | 189,110 | 1 |
Shareholder servicing fees | | | | |
Class A | | | 2,184,345 | |
Class C | | | 60,291 | |
Administrator Class | | | 42,744 | |
Investor Class | | | 145,535 | 1 |
Distribution fees | | | | |
Class B | | | 499 | |
Class C | | | 180,872 | |
Custody and accounting fees | | | 75,622 | |
Professional fees | | | 52,219 | |
Registration fees | | | 112,398 | |
Shareholder report expenses | | | 71,134 | |
Trustees’ fees and expenses | | | 25,175 | |
Other fees and expenses | | | 36,274 | |
| | | | |
Total expenses | | | 15,005,599 | |
Less: Fee waivers and/or expense reimbursements | | | (180,815 | ) |
| | | | |
Net expenses | | | 14,824,784 | |
| | | | |
Net investment loss | | | (418,110 | ) |
| | | | |
| |
REALIZED AND UNREALIZED GAINS (LOSSES) ON INVESTMENTS | | | | |
Net realized gains on investments | | | 58,412,227 | |
Net change in unrealized gains (losses) on investments | | | 87,367,906 | |
| | | | |
Net realized and unrealized gains (losses) on investments | | | 145,780,133 | |
| | | | |
Net increase in net assets resulting from operations | | $ | 145,362,023 | |
| | | | |
| 1 | For the period from October 1, 2015 to October 23, 2015. Effective at the close of business on October 23, 2015, Investor Class shares were converted to Class A shares and are no longer offered by the Fund. |
The accompanying notes are an integral part of these financial statements.
| | | | |
| 16 | | Wells Fargo Common Stock Fund | | Statement of changes in net assets |
| | | | | | | | | | | | | | | | |
| | | Year ended
September 30, 2016 | | | Year ended
September 30, 2015 | |
| | | |
Operations | | | | | | | | | | | | |
Net investment loss | | | | | | $ | (418,110 | ) | | | | | | $ | (1,857,047 | ) |
Net realized gains on investments | | | | | | | 58,412,227 | | | | | | | | 159,523,664 | |
Net change in unrealized gains (losses) on investments | | | | | | | 87,367,906 | | | | | | | | (167,912,693 | ) |
| | | | |
Net increase (decrease) in net assets resulting from operations | | | | | | | 145,362,023 | | | | | | | | (10,246,076 | ) |
| | | | |
| | | |
Distributions to shareholders from | | | | | | | | | | | | |
Net realized gains | | | | | | | | | | | | | | | | |
Class A | | | | | | | (110,146,894 | ) | | | | | | | (31,096,050 | ) |
Class B | | | | | | | (12,735 | ) | | | | | | | (33,224 | ) |
Class C | | | | | | | (3,575,460 | ) | | | | | | | (3,921,593 | ) |
Class R6 | | | | | | | (10,822,850 | ) | | | | | | | (10,389,501 | ) |
Administrator Class | | | | | | | (1,979,080 | ) | | | | | | | (4,624,038 | ) |
Institutional Class | | | | | | | (25,614,461 | ) | | | | | | | (24,118,158 | ) |
Investor Class | | | | | | | 0 | 1 | | | | | | | (103,908,119 | ) |
| | | | |
Total distributions to shareholders | | | | | | | (152,151,480 | ) | | | | | | | (178,090,683 | ) |
| | | | |
| | | | |
Capital share transactions | | | Shares | | | | | | | | Shares | | | | | |
Proceeds from shares sold | | | | | | | | | | | | | | | | |
Class A | | | 39,544,860 | | | | 906,361,116 | | | | 1,110,029 | | | | 26,112,093 | |
Class B | | | 0 | | | | 0 | | | | 706 | | | | 13,849 | |
Class C | | | 87,982 | | | | 1,399,266 | | | | 109,312 | | | | 2,111,040 | |
Class R6 | | | 727,868 | | | | 15,356,332 | | | | 812,069 | | | | 19,433,857 | |
Administrator Class | | | 93,356 | | | | 1,876,928 | | | | 182,887 | | | | 4,316,363 | |
Institutional Class | | | 1,569,307 | | | | 33,234,939 | | | | 2,720,584 | | | | 66,290,199 | |
Investor Class | | | 38,960 | 1 | | | 902,899 | 1 | | | 1,169,258 | | | | 28,309,355 | |
| | | | |
| | | | | | | 959,131,480 | | | | | | | | 146,586,756 | |
| | | | |
Reinvestment of distributions | | | | | | | | | | | | | | | | |
Class A | | | 5,376,198 | | | | 105,588,529 | | | | 1,388,863 | | | | 30,846,648 | |
Class B | | | 812 | | | | 12,735 | | | | 1,808 | | | | 33,224 | |
Class C | | | 193,065 | | | | 3,025,330 | | | | 180,879 | | | | 3,322,741 | |
Class R6 | | | 534,462 | | | | 10,822,850 | | | | 457,284 | | | | 10,389,501 | |
Administrator Class | | | 97,753 | | | | 1,942,357 | | | | 204,831 | | | | 4,590,258 | |
Institutional Class | | | 1,256,619 | | | | 25,408,844 | | | | 1,043,559 | | | | 23,678,356 | |
Investor Class | | | 0 | 1 | | | 0 | 1 | | | 4,384,158 | | | | 100,002,451 | |
| | | | |
| | | | | | | 146,800,645 | | | | | | | | 172,863,179 | |
| | | | |
Payment for shares redeemed | | | | | | | | | | | | | | | | |
Class A | | | (7,807,939 | ) | | | (160,174,152 | ) | | | (7,785,918 | ) | | | (180,271,804 | ) |
Class B | | | (5,487 | ) | | | (91,427 | ) | | | (10,025 | ) | | | (196,353 | ) |
Class C | | | (381,490 | ) | | | (6,231,682 | ) | | | (285,089 | ) | | | (5,585,432 | ) |
Class R6 | | | (984,239 | ) | | | (20,831,726 | ) | | | (754,917 | ) | | | (18,105,595 | ) |
Administrator Class | | | (249,908 | ) | | | (5,213,466 | ) | | | (1,376,984 | ) | | | (33,031,475 | ) |
Institutional Class | | | (5,255,616 | ) | | | (106,700,641 | ) | | | (2,385,778 | ) | | | (57,674,780 | ) |
Investor Class | | | (37,451,779 | )1 | | | (884,694,693 | )1 | | | (5,674,483 | ) | | | (137,556,202 | ) |
| | | | |
| | | | | | | (1,183,937,787 | ) | | | | | | | (432,421,641 | ) |
| | | | |
Net decrease in net assets resulting from capital share transactions | | | | | | | (78,005,662 | ) | | | | | | | (112,971,706 | ) |
| | | | |
Total decrease in net assets | | | | | | | (84,795,119 | ) | | | | | | | (301,308,465 | ) |
| | | | |
| | |
Net assets | | | | | | | | |
Beginning of period | | | | | | | 1,323,924,258 | | | | | | | | 1,625,232,723 | |
| | | | |
End of period | | | | | | $ | 1,239,129,139 | | | | | | | $ | 1,323,924,258 | |
| | | | |
Accumulated net investment loss | | | | | | $ | (3,859 | ) | | | | | | $ | (1,271,083 | ) |
| | | | |
| 1 | For the period from October 1, 2015 to October 23, 2015. Effective at the close of business on October 23, 2015, Investor Class shares were converted to Class A shares and are no longer offered by the Fund. |
The accompanying notes are an integral part of these financial statements.
| | | | | | |
| Financial highlights | | Wells Fargo Common Stock Fund | | | 17 | |
(For a share outstanding throughout each period)
| | | | | | | | | | | | | | | | | | | | |
| | | Year ended September 30 | |
| CLASS A | | 2016 | | | 2015 | | | 2014 | | | 2013 | | | 2012 | |
Net asset value, beginning of period | | | $21.62 | | | | $24.79 | | | | $24.45 | | | | $21.18 | | | | $17.15 | |
Net investment loss | | | (0.01 | )1 | | | (0.04 | )1 | | | (0.07 | ) | | | (0.02 | ) | | | (0.04 | ) |
Net realized and unrealized gains (losses) on investments | | | 2.45 | | | | (0.32 | ) | | | 2.48 | | | | 4.72 | | | | 5.33 | |
| | | | | | | | | | | | | | | | | | | | |
Total from investment operations | | | 2.44 | | | | (0.36 | ) | | | 2.41 | | | | 4.70 | | | | 5.29 | |
Distributions to shareholders from | | | | | | | | | | | | | | | | | | | | |
Net realized gains | | | (2.56 | ) | | | (2.81 | ) | | | (2.07 | ) | | | (1.43 | ) | | | (1.26 | ) |
Net asset value, end of period | | | $21.50 | | | | $21.62 | | | | $24.79 | | | | $24.45 | | | | $21.18 | |
Total return2 | | | 12.43 | % | | | (1.76 | )% | | | 10.26 | % | | | 23.72 | % | | | 31.90 | % |
Ratios to average net assets (annualized) | | | | | | | | | | | | | | | | | | | | |
Gross expenses | | | 1.25 | % | | | 1.27 | % | | | 1.28 | % | | | 1.30 | % | | | 1.31 | % |
Net expenses | | | 1.25 | % | | | 1.26 | % | | | 1.26 | % | | | 1.26 | % | | | 1.26 | % |
Net investment loss | | | (0.05 | )% | | | (0.19 | )% | | | (0.27 | )% | | | (0.05 | )% | | | (0.16 | )% |
Supplemental data | | | | | | | | | | | | | | | | | | | | |
Portfolio turnover rate | | | 32 | % | | | 51 | % | | | 38 | % | | | 40 | % | | | 30 | % |
Net assets, end of period (000s omitted) | | | $924,864 | | | | $127,732 | | | | $277,517 | | | | $292,806 | | | | $207,668 | |
| 1 | Calculated based upon average shares outstanding |
| 2 | Total return calculations do not include any sales charges. |
The accompanying notes are an integral part of these financial statements.
| | | | |
| 18 | | Wells Fargo Common Stock Fund | | Financial highlights |
(For a share outstanding throughout each period)
| | | | | | | | | | | | | | | | | | | | |
| | | Year ended September 30 | |
| CLASS B | | 2016 | | | 2015 | | | 2014 | | | 2013 | | | 2012 | |
Net asset value, beginning of period | | | $17.78 | | | | $21.02 | | | | $21.18 | | | | $18.67 | | | | $15.35 | |
Net investment loss | | | (0.10 | )1 | | | (0.18 | )1 | | | (0.22 | )1 | | | (0.15 | )1 | | | (0.17 | )1 |
Net realized and unrealized gains (losses) on investments | | | 1.96 | | | | (0.25 | ) | | | 2.13 | | | | 4.09 | | | | 4.75 | |
| | | | | | | | | | | | | | | | | | | | |
Total from investment operations | | | 1.86 | | | | (0.43 | ) | | | 1.91 | | | | 3.94 | | | | 4.58 | |
Distributions to shareholders from | | | | | | | | | | | | | | | | | | | | |
Net realized gains | | | (2.56 | ) | | | (2.81 | ) | | | (2.07 | ) | | | (1.43 | ) | | | (1.26 | ) |
Net asset value, end of period | | | $17.08 | | | | $17.78 | | | | $21.02 | | | | $21.18 | | | | $18.67 | |
Total return2 | | | 11.75 | % | | | (2.49 | )% | | | 9.42 | % | | | 22.78 | % | | | 30.87 | % |
Ratios to average net assets (annualized) | | | | | | | | | | | | | | | | | | | | |
Gross expenses | | | 1.69 | % | | | 2.02 | % | | | 2.03 | % | | | 2.05 | % | | | 2.05 | % |
Net expenses | | | 1.69 | % | | | 2.00 | % | | | 2.01 | % | | | 2.01 | % | | | 2.01 | % |
Net investment loss | | | (0.60 | )% | | | (0.94 | )% | | | (1.03 | )% | | | (0.78 | )% | | | (0.96 | )% |
Supplemental data | | | | | | | | | | | | | | | | | | | | |
Portfolio turnover rate | | | 32 | % | | | 51 | % | | | 38 | % | | | 40 | % | | | 30 | % |
Net assets, end of period (000s omitted) | | | $32 | | | | $116 | | | | $296 | | | | $521 | | | | $806 | |
| 1 | Calculated based upon average shares outstanding |
| 2 | Total return calculations do not include any sales charges. |
The accompanying notes are an integral part of these financial statements.
| | | | | | |
| Financial highlights | | Wells Fargo Common Stock Fund | | | 19 | |
(For a share outstanding throughout each period)
| | | | | | | | | | | | | | | | | | | | |
| | | Year ended September 30 | |
| CLASS C | | 2016 | | | 2015 | | | 2014 | | | 2013 | | | 2012 | |
Net asset value, beginning of period | | | $17.77 | | | | $21.02 | | | | $21.18 | | | | $18.67 | | | | $15.35 | |
Net investment loss | | | (0.14 | )1 | | | (0.18 | ) | | | (0.22 | )1 | | | (0.16 | )1 | | | (0.16 | )1 |
Net realized and unrealized gains (losses) on investments | | | 1.97 | | | | (0.26 | ) | | | 2.13 | | | | 4.10 | | | | 4.74 | |
| | | | | | | | | | | | | | | | | | | | |
Total from investment operations | | | 1.83 | | | | (0.44 | ) | | | 1.91 | | | | 3.94 | | | | 4.58 | |
Distributions to shareholders from | | | | | | | | | | | | | | | | | | | | |
Net realized gains | | | (2.56 | ) | | | (2.81 | ) | | | (2.07 | ) | | | (1.43 | ) | | | (1.26 | ) |
Net asset value, end of period | | | $17.04 | | | | $17.77 | | | | $21.02 | | | | $21.18 | | | | $18.67 | |
Total return2 | | | 11.52 | % | | | (2.49 | )% | | | 9.42 | % | | | 22.78 | % | | | 30.95 | % |
Ratios to average net assets (annualized) | | | | | | | | | | | | | | | | | | | | |
Gross expenses | | | 2.00 | % | | | 2.02 | % | | | 2.03 | % | | | 2.05 | % | | | 2.06 | % |
Net expenses | | | 2.00 | % | | | 2.00 | % | | | 2.01 | % | | | 2.01 | % | | | 2.01 | % |
Net investment loss | | | (0.87 | )% | | | (0.93 | )% | | | (1.01 | )% | | | (0.81 | )% | | | (0.92 | )% |
Supplemental data | | | | | | | | | | | | | | | | | | | | |
Portfolio turnover rate | | | 32 | % | | | 51 | % | | | 38 | % | | | 40 | % | | | 30 | % |
Net assets, end of period (000s omitted) | | | $22,902 | | | | $25,668 | | | | $30,245 | | | | $29,483 | | | | $20,080 | |
| 1 | Calculated based upon average shares outstanding |
| 2 | Total return calculations do not include any sales charges. |
The accompanying notes are an integral part of these financial statements.
| | | | |
| 20 | | Wells Fargo Common Stock Fund | | Financial highlights |
(For a share outstanding throughout each period)
| | | | | | | | | | | | | | | | |
| | | Year ended September 30 | |
| CLASS R6 | | 2016 | | | 2015 | | | 2014 | | | 20131 | |
Net asset value, beginning of period | | | $22.20 | | | | $25.27 | | | | $24.78 | | | | $22.83 | |
Net investment income | | | 0.07 | 2 | | | 0.05 | | | | 0.07 | 2 | | | 0.01 | |
Net realized and unrealized gains (losses) on investments | | | 2.54 | | | | (0.31 | ) | | | 2.49 | | | | 1.94 | |
| | | | | | | | | | | | | | | | |
Total from investment operations | | | 2.61 | | | | (0.26 | ) | | | 2.56 | | | | 1.95 | |
Distributions to shareholders from | | | | | | | | | | | | | | | | |
Net realized gains | | | (2.56 | ) | | | (2.81 | ) | | | (2.07 | ) | | | 0.00 | |
Net asset value, end of period | | | $22.25 | | | | $22.20 | | | | $25.27 | | | | $24.78 | |
Total return3 | | | 12.91 | % | | | (1.29 | )% | | | 10.76 | % | | | 8.54 | % |
Ratios to average net assets (annualized) | | | | | | | | | | | | | | | | |
Gross expenses | | | 0.82 | % | | | 0.80 | % | | | 0.80 | % | | | 0.81 | % |
Net expenses | | | 0.82 | % | | | 0.80 | % | | | 0.80 | % | | | 0.81 | % |
Net investment income | | | 0.32 | % | | | 0.28 | % | | | 0.27 | % | | | 0.18 | % |
Supplemental data | | | | | | | | | | | | | | | | |
Portfolio turnover rate | | | 32 | % | | | 51 | % | | | 38 | % | | | 40 | % |
Net assets, end of period (000s omitted) | | | $101,436 | | | | $95,037 | | | | $95,213 | | | | $27 | |
| 1 | For the period from June 28, 2013 (commencement of class operations) to September 30, 2013 |
| 2 | Calculated based upon average shares outstanding |
| 3 | Returns for periods of less than one year are not annualized. |
The accompanying notes are an integral part of these financial statements.
| | | | | | |
| Financial highlights | | Wells Fargo Common Stock Fund | | | 21 | |
(For a share outstanding throughout each period)
| | | | | | | | | | | | | | | | | | | | |
| | | Year ended September 30 | |
| ADMINISTRATOR CLASS | | 2016 | | | 2015 | | | 2014 | | | 2013 | | | 2012 | |
Net asset value, beginning of period | | | $21.84 | | | | $24.98 | | | | $24.59 | | | | $21.26 | | | | $17.18 | |
Net investment income (loss) | | | 0.02 | | | | (0.01 | )1 | | | (0.02 | )1 | | | 0.01 | | | | 0.01 | |
Net realized and unrealized gains (losses) on investments | | | 2.48 | | | | (0.32 | ) | | | 2.48 | | | | 4.75 | | | | 5.33 | |
| | | | | | | | | | | | | | | | | | | | |
Total from investment operations | | | 2.50 | | | | (0.33 | ) | | | 2.46 | | | | 4.76 | | | | 5.34 | |
Distributions to shareholders from | | | | | | | | | | | | | | | | | | | | |
Net realized gains | | | (2.56 | ) | | | (2.81 | ) | | | (2.07 | ) | | | (1.43 | ) | | | (1.26 | ) |
Net asset value, end of period | | | $21.78 | | | | $21.84 | | | | $24.98 | | | | $24.59 | | | | $21.26 | |
Total return | | | 12.59 | % | | | (1.62 | )% | | | 10.41 | % | | | 23.92 | % | | | 32.15 | % |
Ratios to average net assets (annualized) | | | | | | | | | | | | | | | | | | | | |
Gross expenses | | | 1.17 | % | | | 1.12 | % | | | 1.11 | % | | | 1.11 | % | | | 1.10 | % |
Net expenses | | | 1.10 | % | | | 1.10 | % | | | 1.09 | % | | | 1.09 | % | | | 1.07 | % |
Net investment income (loss) | | | 0.03 | % | | | (0.03 | )% | | | (0.07 | )% | | | 0.11 | % | | | 0.01 | % |
Supplemental data | | | | | | | | | | | | | | | | | | | | |
Portfolio turnover rate | | | 32 | % | | | 51 | % | | | 38 | % | | | 40 | % | | | 30 | % |
Net assets, end of period (000s omitted) | | | $16,720 | | | | $18,050 | | | | $45,364 | | | | $24,871 | | | | $19,428 | |
| 1 | Calculated based upon average shares outstanding |
The accompanying notes are an integral part of these financial statements.
| | | | |
| 22 | | Wells Fargo Common Stock Fund | | Financial highlights |
(For a share outstanding throughout each period)
| | | | | | | | | | | | | | | | | | | | |
| | | Year ended September 30 | |
| INSTITUTIONAL CLASS | | 2016 | | | 2015 | | | 2014 | | | 2013 | | | 2012 | |
Net asset value, beginning of period | | | $22.16 | | | | $25.25 | | | | $24.77 | | | | $21.37 | | | | $17.23 | |
Net investment income | | | 0.06 | 1 | | | 0.03 | | | | 0.03 | | | | 0.07 | 1 | | | 0.06 | 1 |
Net realized and unrealized gains (losses) on investments | | | 2.54 | | | | (0.31 | ) | | | 2.52 | | | | 4.76 | | | | 5.34 | |
| | | | | | | | | | | | | | | | | | | | |
Total from investment operations | | | 2.60 | | | | (0.28 | ) | | | 2.55 | | | | 4.83 | | | | 5.40 | |
Distributions to shareholders from | | | | | | | | | | | | | | | | | | | | |
Net realized gains | | | (2.56 | ) | | | (2.81 | ) | | | (2.07 | ) | | | (1.43 | ) | | | (1.26 | ) |
Net asset value, end of period | | | $22.20 | | | | $22.16 | | | | $25.25 | | | | $24.77 | | | | $21.37 | |
Total return | | | 12.88 | % | | | (1.38 | )% | | | 10.72 | % | | | 24.14 | % | | | 32.42 | % |
Ratios to average net assets (annualized) | | | | | | | | | | | | | | | | | | | | |
Gross expenses | | | 0.92 | % | | | 0.86 | % | | | 0.85 | % | | | 0.87 | % | | | 0.88 | % |
Net expenses | | | 0.85 | % | | | 0.85 | % | | | 0.85 | % | | | 0.87 | % | | | 0.88 | % |
Net investment income | | | 0.28 | % | | | 0.24 | % | | | 0.14 | % | | | 0.33 | % | | | 0.28 | % |
Supplemental data | | | | | | | | | | | | | | | | | | | | |
Portfolio turnover rate | | | 32 | % | | | 51 | % | | | 38 | % | | | 40 | % | | | 30 | % |
Net assets, end of period (000s omitted) | | | $173,175 | | | | $226,729 | | | | $223,525 | | | | $197,453 | | | | $86,645 | |
| 1 | Calculated based upon average shares outstanding |
The accompanying notes are an integral part of these financial statements.
| | | | | | |
| Notes to financial statements | | Wells Fargo Common Stock Fund | | | 23 | |
1. ORGANIZATION
Wells Fargo Funds Trust (the “Trust”), a Delaware statutory trust organized on March 10, 1999, is an open-end management investment company registered under the Investment Company Act of 1940, as amended (the “1940 Act”). As an investment company, the Trust follows the accounting and reporting guidance in Financial Accounting Standards Board (“FASB”) Accounting Standards Codification Topic 946, Financial Services – Investment Companies. These financial statements report on the Wells Fargo Common Stock Fund (the “Fund”) which is a diversified series of the Trust.
Effective at the close of business on October 23, 2015, Investor Class shares became Class A shares in a tax-free conversion. Shareholders of Investor Class received Class A shares at a value equal to the value of their Investor Class shares immediately prior to the conversion. Investor Class shares are no longer offered by the Fund.
2. SIGNIFICANT ACCOUNTING POLICIES
The following significant accounting policies, which are consistently followed in the preparation of the financial statements of the Fund, are in conformity with U.S. generally accepted accounting principles which require management to make estimates and assumptions that affect the reported amounts of assets and liabilities, disclosure of contingent assets and liabilities at the date of the financial statements, and the reported amounts of revenues and expenses during the reporting period. Actual results could differ from those estimates.
Securities valuation
All investments are valued each business day as of the close of regular trading on the New York Stock Exchange (generally 4 p.m. Eastern Time), although the Fund may deviate from this calculation time under unusual or unexpected circumstances.
Equity securities that are listed on a foreign or domestic exchange or market are valued at the official closing price or, if none, the last sales price. If no sale occurs on the principal exchange or market that day, the prior day’s price will be deemed “stale” and a fair value price will be determined in accordance with the Fund’s Valuation Procedures.
Investments in registered open-end investment companies are valued at net asset value. Interests in non-registered investment vehicles that are redeemable at net asset value are fair valued normally at net asset value.
Investments which are not valued using any of the methods discussed above are valued at their fair value, as determined in good faith by the Board of Trustees of the Fund. The Board of Trustees has established a Valuation Committee comprised of the Trustees and has delegated to it the authority to take any actions regarding the valuation of portfolio securities that the Valuation Committee deems necessary or appropriate, including determining the fair value of portfolio securities, unless the determination has been delegated to the Management Valuation Team of Wells Fargo Funds Management, LLC (“Funds Management”). The Board of Trustees retains the authority to make or ratify any valuation decisions or approve any changes to the Valuation Procedures as it deems appropriate. On a quarterly basis, the Board of Trustees receives reports on any valuation actions taken by the Valuation Committee or the Management Valuation Team which may include items for ratification.
Valuations of fair valued securities are compared to the next actual sales price when available, or other appropriate market values, to assess the continued appropriateness of the fair valuation methodologies used. These securities are fair valued on a day-to-day basis, taking into consideration changes to appropriate market information and any significant changes to the inputs considered in the valuation process until there is a readily available price provided on an exchange or by an independent pricing service. Valuations received from an independent pricing service or independent broker-dealer quotes are periodically validated by comparisons to most recent trades and valuations provided by other independent pricing services in addition to the review of prices by the manager and/or subadviser. Unobservable inputs used in determining fair valuations are identified based on the type of security, taking into consideration factors utilized by market participants in valuing the investment, knowledge about the issuer and the current market environment.
Security loans
The Fund may lend its securities from time to time in order to earn additional income in the form of fees or interest on securities received as collateral or the investment of any cash received as collateral. The Fund continues to receive interest or dividends on the securities loaned. The Fund receives collateral in the form of cash or securities with a value at least equal to the value of the securities on loan. The value of the loaned securities is determined at the close of each business day and any additional required collateral is delivered to the Fund on the next business day. In a securities lending transaction, the net asset value of the Fund will be affected by an increase or decrease in the value of the securities loaned and by an increase or decrease in the value of the instrument in which collateral is invested. The amount of securities lending activity undertaken by the Fund fluctuates from time to time. In the event of default or bankruptcy
| | | | |
| 24 | | Wells Fargo Common Stock Fund | | Notes to financial statements |
by the borrower, the Fund may be prevented from recovering the loaned securities or gaining access to the collateral or may experience delays or costs in doing so. In addition, the investment of any cash collateral received may lose all or part of its value. The Fund has the right under the lending agreement to recover the securities from the borrower on demand.
The Fund lends its securities through an unaffiliated securities lending agent. Cash collateral received in connection with its securities lending transactions is invested in Securities Lending Cash Investments, LLC (the “Securities Lending Fund”). The Securities Lending Fund is exempt from registration under Section 3(c)(7) of the 1940 Act and is managed by Funds Management and is subadvised by Wells Capital Management Incorporated (“WellsCap”), an affiliate of Funds Management and an indirect wholly owned subsidiary of Wells Fargo & Company (“Wells Fargo”). Funds Management receives an advisory fee starting at 0.05% and declining to 0.01% as the average daily net assets of the Securities Lending Fund increase. All of the fees received by Funds Management are paid to WellsCap for its services as subadviser. The Securities Lending Fund seeks to provide a positive return compared to the daily Fed Funds Open rate by investing in high-quality, U.S. dollar-denominated short-term money market instruments. Securities Lending Fund investments are fair valued based upon the amortized cost valuation technique. Income earned from investment in the Securities Lending Fund is included in securities lending income on the Statement of Operations.
Security transactions and income recognition
Securities transactions are recorded on a trade date basis. Realized gains or losses are recorded on the basis of identified cost.
Dividend income is recognized on the ex-dividend date. Dividend income is recorded net of foreign taxes withheld where recovery of such taxes is not assured.
Distributions to shareholders
Distributions to shareholders from net investment income and net realized gains, if any, are recorded on the ex-dividend date. Such distributions are determined in conformity with federal income tax regulations, which may differ in amount or character from net investment income and realized gains recognized for purposes of U.S. generally accepted accounting principles.
Federal and other taxes
The Fund intends to continue to qualify as a regulated investment company by distributing substantially all of its investment company taxable income and any net realized capital gains (after reduction for capital loss carryforwards) sufficient to relieve it from all, or substantially all, federal income taxes. Accordingly, no provision for federal income taxes was required.
The Fund’s income and federal excise tax returns and all financial records supporting those returns for the prior three fiscal years are subject to examination by the federal and Delaware revenue authorities. Management has analyzed the Fund’s tax positions taken on federal, state, and foreign tax returns for all open tax years and does not believe that there are any uncertain tax positions that require recognition of a tax liability.
Reclassifications are made to the Fund’s capital accounts for permanent tax differences to reflect income and gains available for distribution (or available capital loss carryforwards) under federal income tax regulations. U.S. generally accepted accounting principles require that certain components of net assets be adjusted to reflect permanent differences between financial and tax reporting. These reclassifications have no effect on net assets or net asset values per share. The primary permanent difference causing such reclassifications is due to net operating losses. At September 30, 2016, as a result of permanent book-to-tax differences, the following reclassification adjustments were made on the Statement of Assets and Liabilities:
| | |
Accumulated net investment loss | | Accumulated net realized gains on investments |
| $1,685,334 | | $(1,685,334) |
Class allocations
The separate classes of shares offered by the Fund differ principally in applicable sales charges, distribution, shareholder servicing, and administration fees. Class specific expenses are charged directly to that share class. Investment income, common expenses, and realized and unrealized gains (losses) on investments are allocated daily to each class of shares based on the relative proportion of net assets of each class.
| | | | | | |
| Notes to financial statements | | Wells Fargo Common Stock Fund | | | 25 | |
3. FAIR VALUATION MEASUREMENTS
Fair value measurements of investments are determined within a framework that has established a fair value hierarchy based upon the various data inputs utilized in determining the value of the Fund’s investments. The three-level hierarchy gives the highest priority to unadjusted quoted prices in active markets for identical assets or liabilities (Level 1) and the lowest priority to significant unobservable inputs (Level 3). The Fund’s investments are classified within the fair value hierarchy based on the lowest level of input that is significant to the fair value measurement. The inputs are summarized into three broad levels as follows:
| n | | Level 1 – quoted prices in active markets for identical securities |
| n | | Level 2 – other significant observable inputs (including quoted prices for similar securities, interest rates, prepayment speeds, credit risk, use of amortized cost, etc.) |
| n | | Level 3 – significant unobservable inputs (including the Fund’s own assumptions in determining the fair value of investments) |
The inputs or methodologies used for valuing investments in securities are not necessarily an indication of the risk associated with investing in those securities.
The following is a summary of the inputs used in valuing the Fund’s assets and liabilities as of September 30, 2016:
| | | | | | | | | | | | | | | | |
| | | Quoted prices
(Level 1) | | | Other significant
observable inputs
(Level 2) | | | Significant
unobservable inputs (Level 3) | | | Total | |
Assets | | | | | | | | | | | | | | | | |
Investments in: | | | | | | | | | | | | | | | | |
| | | | |
Common stocks | | | | | | | | | | | | | | | | |
Consumer discretionary | | $ | 140,729,199 | | | $ | 0 | | | $ | 0 | | | $ | 140,729,199 | |
Consumer staples | | | 13,573,340 | | | | 0 | | | | 0 | | | | 13,573,340 | |
Energy | | | 75,409,057 | | | | 0 | | | | 0 | | | | 75,409,057 | |
Financials | | | 227,215,559 | | | | 0 | | | | 0 | | | | 227,215,559 | |
Health care | | | 167,006,134 | | | | 0 | | | | 0 | | | | 167,006,134 | |
Industrials | | | 248,351,835 | | | | 0 | | | | 0 | | | | 248,351,835 | |
Information technology | | | 200,450,599 | | | | 0 | | | | 0 | | | | 200,450,599 | |
Materials | | | 71,073,455 | | | | 0 | | | | 0 | | | | 71,073,455 | |
Real estate | | | 11,319,220 | | | | 0 | | | | 0 | | | | 11,319,220 | |
Telecommunication services | | | 20,542,774 | | | | 0 | | | | 0 | | | | 20,542,774 | |
| | | | |
Exchange-traded funds | | | 41,648,631 | | | | 0 | | | | 0 | | | | 41,648,631 | |
| | | | |
Short-term investments | | | | | | | | | | | | | | | | |
Investment companies | | | 23,993,777 | | | | 0 | | | | 0 | | | | 23,993,777 | |
Investments measured at net asset value* | | | | | | | | | | | | | | | 23,242,150 | |
Total assets | | $ | 1,241,313,580 | | | $ | 0 | | | $ | 0 | | | $ | 1,264,555,730 | |
| * | Investments that are measured at fair value using the net asset value per share (or its equivalent) as a practical expedient have not been categorized in the fair value hierarchy. The fair value amount presented in the table is intended to permit reconciliation of the fair value hierarchy to the amounts presented in the Statement of Assets and Liabilities. The Fund’s investment in Securities Lending Cash Investments, LLC valued at $23,242,150 does not have a redemption period notice, can be redeemed daily and does not have any unfunded commitments. |
The Fund recognizes transfers between levels within the fair value hierarchy at the end of the reporting period. At September 30, 2016, the Fund did not have any transfers into/out of Level 1, Level 2, or Level 3.
4. TRANSACTIONS WITH AFFILIATES
Management fee
Funds Management, an indirect wholly owned subsidiary of Wells Fargo, is the manager of the Fund and provides advisory and fund-level administrative services under an investment management agreement. Under the investment management agreement, Funds Management is responsible for, among other services, implementing the investment objectives and strategies of the Fund, supervising the subadviser, providing fund-level administrative services in connection with the Fund’s operations, and providing any other fund-level administrative services reasonably necessary for the operation of the
| | | | |
| 26 | | Wells Fargo Common Stock Fund | | Notes to financial statements |
Fund. As compensation for its services under the investment management agreement, Funds Management is entitled to receive an annual management fee starting at 0.80% and declining to 0.63% as the average daily net assets of the Fund increase. For the year ended September 30, 2016, the management fee was equivalent to an annual rate of 0.76% of the Fund’s average daily net assets.
Funds Management has retained the services of a subadviser to provide daily portfolio management to the Fund. The fee for subadvisory services is borne by Funds Management. WellsCap is the subadviser to the Fund and is entitled to receive a fee from Funds Management at an annual rate starting at 0.45% and declining to 0.30% as the average daily net assets of the Fund increase.
Administration fees
Under a class-level administration agreement, Funds Management provides class-level administrative services to the Fund, which includes paying fees and expenses for services provided by the transfer agent, sub-transfer agents, omnibus account servicers and record-keepers. As compensation for its services under the class-level administration agreement, Funds Management receives an annual fee which is calculated based on the average daily net assets of each class as follows:
| | | | |
| | | Class-level
administration fee | |
Class A, Class B, Class C | | | 0.21 | % |
Class R6 | | | 0.03 | |
Administrator Class , Institutional Class | | | 0.13 | |
Investor Class | | | 0.32 | |
Funds Management has contractually waived and/or reimbursed management and administration fees to the extent necessary to maintain certain net operating expense ratios for the Fund. Waiver of fees and/or reimbursement of expenses by Funds Management were made first from fund level expenses on a proportionate basis and then from class specific expenses. Funds Management has committed through January 31, 2017 to waive fees and/or reimburse expenses to the extent necessary to cap the Fund’s expenses at 1.26% for Class A shares, 2.01% for Class B shares, 2.01% for Class C shares, 0.85% for Class R6 shares, 1.10% for Administrator Class shares, and 0.85% for Institutional Class shares. After this time, the cap may be increased or the commitment to maintain the cap may be terminated only with the approval of the Board of Trustees.
Distribution fees
The Trust has adopted a distribution plan for Class B and Class C shares of the Fund pursuant to Rule 12b-1 under the 1940 Act. Distribution fees are charged to Class B and Class C shares and paid to Wells Fargo Funds Distributor, LLC (“Funds Distributor”), the principal underwriter, at an annual rate of 0.75% of the average daily net assets of Class B and Class C shares.
In addition, Funds Distributor is entitled to receive the front-end sales charge from the purchase of Class A shares and a contingent deferred sales charge on the redemption of certain Class A shares. Funds Distributor is also entitled to receive the contingent deferred sales charges from redemptions of Class B and Class C shares. For the year ended September 30, 2016, Funds Distributor received $5,662 from the sale of Class A shares and $19 in contingent deferred sales charges from redemptions of Class C shares.
Shareholder servicing fees
The Trust has entered into contracts with one or more shareholder servicing agents, whereby Class A, Class B, Class C, Administrator Class, and Investor Class of the Fund are charged a fee at an annual rate of 0.25% of the average daily net assets of each respective class.
A portion of these total shareholder servicing fees were paid to affiliates of Wells Fargo.
5. INVESTMENT PORTFOLIO TRANSACTIONS
Purchases and sales of investments, excluding U.S. government obligations (if any) and short-term securities, for the year ended September 30, 2016 were $399,244,168 and $614,742,660, respectively.
The Fund may purchase or sell investment securities to other Wells Fargo funds under procedures adopted by the Board of Trustees. The procedures have been designed to ensure that these interfund transactions, which generally do not incur broker commissions, are effected at current market prices. Interfund trades are included within the respective purchases and sales amounts shown.
| | | | | | |
| Notes to financial statements | | Wells Fargo Common Stock Fund | | | 27 | |
6. BANK BORROWINGS
The Trust (excluding the money market funds and certain other funds) and Wells Fargo Variable Trust are parties to a $250,000,000 revolving credit agreement whereby the Fund is permitted to use bank borrowings for temporary or emergency purposes, such as to fund shareholder redemption requests. Interest under the credit agreement is charged to the Fund based on a borrowing rate equal to the higher of the Federal Funds rate in effect on that day plus 1.25% or the overnight LIBOR rate in effect on that day plus 1.25%. In addition, an annual commitment fee equal to 0.25% of the unused balance is allocated to each participating fund. Prior to August 30, 2016, the revolving credit agreement amount was $200,000,000 and the annual commitment fee was equal to 0.20% of the unused balance which was allocated to each participating fund.
For the year ended September 30, 2016, there were no borrowings by the Fund under the agreement.
7. DISTRIBUTIONS TO SHAREHOLDERS
The tax character of distributions paid during the years ended September 30, 2016 and September 30, 2015 were as follows:
| | | | | | | | |
| | | Year ended September 30 | |
| | | 2016 | | | 2015 | |
Ordinary income | | $ | 0 | | | $ | 8,684,768 | |
Long-term capital gain | | | 152,151,480 | | | | 169,405,915 | |
As of September 30, 2016, the components of distributable earnings on a tax basis were as follows:
| | | | |
Undistributed ordinary income | | Undistributed long-term gain | | Unrealized gains |
| $7,038,331 | | $34,071,698 | | $317,485,428 |
8. INDEMNIFICATION
Under the Trust’s organizational documents, the officers and Trustees have been granted certain indemnification rights against certain liabilities that may arise out of performance of their duties to the Trust. Additionally, in the normal course of business, the Trust may enter into contracts with service providers that contain a variety of indemnification clauses. The Trust’s maximum exposure under these arrangements is dependent on future claims that may be made against the Fund and, therefore, cannot be estimated.
| | | | |
| 28 | | Wells Fargo Common Stock Fund | | Report of independent registered public accounting firm |
BOARD OF TRUSTEES AND SHAREHOLDERS OF WELLS FARGO FUNDS TRUST:
We have audited the accompanying statement of assets and liabilities, including the portfolio of investments, of the Wells Fargo Common Stock Fund (formerly known as Wells Fargo Advantage Common Stock Fund) (the “Fund”), one of the funds constituting the Wells Fargo Funds Trust, as of September 30, 2016, and the related statement of operations for the year then ended, the statements of changes in net assets for each of the years in the two-year period then ended, and the financial highlights for each of the years or periods in the five-year period then ended. These financial statements and financial highlights are the responsibility of the Fund’s management. Our responsibility is to express an opinion on these financial statements and financial highlights based on our audits.
We conducted our audits in accordance with the standards of the Public Company Accounting Oversight Board (United States). Those standards require that we plan and perform the audit to obtain reasonable assurance about whether the financial statements and financial highlights are free of material misstatement. An audit includes examining, on a test basis, evidence supporting the amounts and disclosures in the financial statements. Our procedures included confirmation of securities owned as of September 30, 2016, by correspondence with the custodian and brokers, or by other appropriate auditing procedures. An audit also includes assessing the accounting principles used and significant estimates made by management, as well as evaluating the overall financial statement presentation. We believe that our audits provide a reasonable basis for our opinion.
In our opinion, the financial statements and financial highlights referred to above present fairly, in all material respects, the financial position of the Wells Fargo Common Stock Fund as of September 30, 2016, the results of its operations for the year then ended, the changes in its net assets for each of the years in the two-year period then ended, and the financial highlights for each of the years or periods in the five-year period then ended, in conformity with U.S. generally accepted accounting principles.

Boston, Massachusetts
November 23, 2016
| | | | | | |
| Other information (unaudited) | | Wells Fargo Common Stock Fund | | | 29 | |
TAX INFORMATION
Pursuant to Section 852 of the Internal Revenue Code, $152,151,480 was designated as a 20% rate gain distribution for the fiscal year ended September 30, 2016.
PROXY VOTING INFORMATION
A description of the policies and procedures that the Fund uses to determine how to vote proxies relating to portfolio securities is available, upon request, by calling 1-800-222-8222, visiting our website at wellsfargofunds.com, or visiting the SEC website at sec.gov. Information regarding how the Fund voted proxies relating to portfolio securities during the most recent 12-month period ended June 30 is available on the Fund’s website at wellsfargofunds.com or by visiting the SEC website at sec.gov.
PORTFOLIO HOLDINGS INFORMATION
The complete portfolio holdings for the Fund are publicly available monthly on the Fund’s website (wellsfargofunds.com), on a one-month delayed basis. In addition, top ten holdings information (excluding derivative positions) for the Fund is publicly available on the Fund’s website on a monthly, seven-day or more delayed basis. The Fund files its complete schedule of portfolio holdings with the SEC for the first and third quarters of each fiscal year on Form N-Q, which is available by visiting the SEC website at sec.gov. In addition, the Fund’s Form N-Q may be reviewed and copied at the SEC’s Public Reference Room in Washington, DC, and at regional offices in New York City, at 233 Broadway, and in Chicago, at 175 West Jackson Boulevard, Suite 900. Information about the Public Reference Room may be obtained by calling 1-800-SEC-0330.
| | | | |
| 30 | | Wells Fargo Common Stock Fund | | Other information (unaudited) |
BOARD OF TRUSTEES AND OFFICERS
Each of the Trustees and Officers1 listed in the table below acts in identical capacities for each fund in the Wells Fargo family of funds, which consists of 138 mutual funds comprising the Wells Fargo Funds Trust, Wells Fargo Variable Trust, Wells Fargo Master Trust and four closed-end funds (collectively the “Fund Complex”). This table should be read in conjunction with the Prospectus and the Statement of Additional Information2. The mailing address of each Trustee and Officer is 525 Market Street, 12th Floor, San Francisco, CA 94105. Each Trustee and Officer serves an indefinite term, however, each Trustee serves such term until reaching the mandatory retirement age established by the Trustees.
Independent Trustees
| | | | | | |
Name and year of birth | | Position held and length of service* | | Principal occupations during past five years or longer | | Current other
public company or
investment company
directorships |
William R. Ebsworth (Born 1957) | | Trustee, since 2015 | | Retired. From 1984 to 2013, equities analyst, portfolio manager, research director and chief financial officer at Fidelity Management and Research Company in Boston, Tokyo, and Hong Kong and retired in 2013 as Chief Investment Officer of Fidelity Strategic Advisers, Inc. where he lead a team of investment professionals managing client assets. Prior thereto, Board member of Hong Kong Securities Clearing Co., Hong Kong Options Clearing Corp., the Thailand International Fund, Ltd., Fidelity Investments Life Insurance Company, and Empire Fidelity Investments Life Insurance Company. Mr. Ebsworth is a CFA® charterholder and an Adjunct Lecturer, Finance, at Babson College. | | Asset Allocation Trust |
| Jane A. Freeman (Born 1953) | | Trustee, since 2015 | | Retired. From 2012 to 2014 and 1999 to 2008, Chief Financial Officer of Scientific Learning Corporation. From 2008 to 2012, Ms. Freeman provided consulting services related to strategic business projects. Prior to 1999, Portfolio Manager at Rockefeller & Co. and Scudder, Stevens & Clark. Board member of the Harding Loevner Funds from 1996 to 2014, serving as both Lead Independent Director and chair of the Audit Committee. Board member of the Russell Exchange Traded Funds Trust from 2011 to 2012 and the chair of the Audit Committee. Ms. Freeman is a Board Member of Ruth Bancroft Garden (non-profit organization) and an inactive chartered financial analyst. | | Asset Allocation Trust |
| Peter G. Gordon (Born 1942) | | Trustee, since 1998; Chairman, since 2005 | | Co-Founder, Retired Chairman, President and CEO of Crystal Geyser Water Company. Trustee Emeritus, Colby College. | | Asset Allocation Trust |
| Isaiah Harris, Jr. (Born 1952) | | Trustee, since 2009 | | Retired. Chairman of the Board of CIGNA Corporation since 2009, and Director since 2005. From 2003 to 2011, Director of Deluxe Corporation. Prior thereto, President and CEO of BellSouth Advertising and Publishing Corp. from 2005 to 2007, President and CEO of BellSouth Enterprises from 2004 to 2005 and President of BellSouth Consumer Services from 2000 to 2003. Emeritus member of the Iowa State University Foundation Board of Governors. Emeritus Member of the Advisory Board of Iowa State University School of Business. Advisory Board Member, Palm Harbor Academy (charter school). Advisory Board Member, Child Evangelism Fellowship (non-profit). Mr. Harris is a certified public accountant (inactive status). | | CIGNA Corporation; Asset Allocation Trust |
| Judith M. Johnson (Born 1949) | | Trustee, since 2008; Audit Committee Chairman, since 2008 | | Retired. Prior thereto, Chief Executive Officer and Chief Investment Officer of Minneapolis Employees Retirement Fund from 1996 to 2008. Ms. Johnson is an attorney, certified public accountant and a certified managerial accountant. | | Asset Allocation Trust |
| David F. Larcker (Born 1950) | | Trustee, since 2009 | | James Irvin Miller Professor of Accounting at the Graduate School of Business, Stanford University, Director of the Corporate Governance Research Initiative and Senior Faculty of The Rock Center for Corporate Governance since 2006. From 2005 to 2008, Professor of Accounting at the Graduate School of Business, Stanford University. Prior thereto, Ernst & Young Professor of Accounting at The Wharton School, University of Pennsylvania from 1985 to 2005. | | Asset Allocation Trust |
| | | | | | |
| Other information (unaudited) | | Wells Fargo Common Stock Fund | | | 31 | |
| | | | | | |
Name and year of birth | | Position held and length of service* | | Principal occupations during past five years or longer | | Current other
public company or
investment company
directorships |
| Olivia S. Mitchell (Born 1953) | | Trustee, since 2006 | | International Foundation of Employee Benefit Plans Professor, Wharton School of the University of Pennsylvania since 1993. Director of Wharton’s Pension Research Council and Boettner Center on Pensions & Retirement Research, and Research Associate at the National Bureau of Economic Research. Previously, Cornell University Professor from 1978 to 1993. | | Asset Allocation Trust |
| Timothy J. Penny (Born 1951) | | Trustee, since 1996 | | President and Chief Executive Officer of Southern Minnesota Initiative Foundation, a non-profit organization, since 2007 and Senior Fellow at the Humphrey Institute Policy Forum at the University of Minnesota since 1995. Member of the Board of Trustees of NorthStar Education Finance, Inc., a non-profit organization, since 2007. | | Asset Allocation Trust |
| Michael S. Scofield (Born 1943) | | Trustee, since 2010 | | Served on the Investment Company Institute’s Board of Governors and Executive Committee from 2008-2011 as well the Governing Council of the Independent Directors Council from 2006-2011 and the Independent Directors Council Executive Committee from 2008-2011. Chairman of the IDC from 2008-2010. Institutional Investor (Fund Directions) Trustee of Year in 2007. Trustee of the Evergreen Funds complex (and its predecessors) from 1984 to 2010. Chairman of the Evergreen Funds from 2000-2010. Former Trustee of the Mentor Funds. Retired Attorney, Law Offices of Michael S. Scofield. | | Asset Allocation Trust |
| * | Length of service dates reflect the Trustee’s commencement of service with the Trust’s predecessor entities, where applicable. |
Officers
| | | | | | |
Name and year of birth | | Position held and length of service | | Principal occupations during past five years or longer | | |
| Karla M. Rabusch (Born 1959) | | President, since 2003 | | Executive Vice President of Wells Fargo Bank, N.A. and President of Wells Fargo Funds Management, LLC since 2003. | | |
Nancy Wiser1 (Born 1967) | | Treasurer, since 2012 | | Executive Vice President of Wells Fargo Funds Management, LLC since 2011. Chief Operating Officer and Chief Compliance Officer at LightBox Capital Management LLC, from 2008 to 2011. | | |
| C. David Messman (Born 1960) | | Secretary, since 2000; Chief Legal Officer, since 2003 | | Senior Vice President and Secretary of Wells Fargo Funds Management, LLC since 2001. Assistant General Counsel of Wells Fargo Bank, N.A. since 2013 and Vice President and Managing Counsel of Wells Fargo Bank, N.A. from 1996 to 2013. | | |
| Michael Whitaker (Born 1967) | | Chief Compliance Officer, since 20163 | | Executive Vice President of Wells Fargo Funds Management, LLC since 2016. Chief Compliance Officer of Fidelity’s Fixed Income Funds and Asset Allocation Funds from 2008 to 2016, Compliance Officer of FMR Co., Inc. from 2014 to 2016, Fidelity Investments Money Management, Inc. from 2014 to 2016, Fidelity Investments from 2007 to 2016. | | |
David Berardi (Born 1975) | | Assistant Treasurer, since 2009 | | Vice President of Wells Fargo Funds Management, LLC since 2009. Vice President of Evergreen Investment Management Company, LLC from 2008 to 2010. Manager of Fund Reporting and Control for Evergreen Investment Management Company, LLC from 2004 to 2010. | | |
| Jeremy DePalma1 (Born 1974) | | Assistant Treasurer, since 2009 | | Senior Vice President of Wells Fargo Funds Management, LLC since 2009. Senior Vice President of Evergreen Investment Management Company, LLC from 2008 to 2010 and head of the Fund Reporting and Control Team within Fund Administration from 2005 to 2010. | | |
| 1 | Nancy Wiser acts as Treasurer of 70 funds in the Fund Complex. Jeremy DePalma acts as Treasurer of 68 funds and Assistant Treasurer of 70 funds in the Fund Complex. |
| 2 | The Statement of Additional Information includes additional information about the Trustees and is available, without charge, upon request, by calling
1-800-222-8222 or by visiting the website at wellsfargofunds.com. |
| 3 | Michael Whitaker became Chief Compliance Officer effective May 16, 2016. |
| | | | |
| 32 | | Wells Fargo Common Stock Fund | | Other information (unaudited) |
BOARD CONSIDERATION OF INVESTMENT MANAGEMENT AND SUB-ADVISORY AGREEMENTS:
Under the Investment Company Act of 1940 (the “1940 Act”), the Board of Trustees (the “Board”) of Wells Fargo Funds Trust (the “Trust”) must determine annually whether to approve the continuation of the Trust’s investment management and sub-advisory agreements. In this regard, at an in-person meeting held on May 24-25, 2016 (the “Meeting”), the Board, all the members of which have no direct or indirect interest in the investment management and sub-advisory agreements and are not “interested persons” of the Trust, as defined in the 1940 Act (the “Independent Trustees”), reviewed and approved for Wells Fargo Common Stock Fund (the “Fund”): (i) an investment management agreement (the “Management Agreement”) with Wells Fargo Funds Management, LLC (“Funds Management”); and (ii) an investment sub-advisory agreement (the “Sub-Advisory Agreement”) with Wells Capital Management Incorporated (the “Sub-Adviser”), an affiliate of Funds Management. The Management Agreement and the Sub-Advisory Agreement are collectively referred to as the “Advisory Agreements.”
At the Meeting, the Board considered the factors and reached the conclusions described below relating to the selection of Funds Management and the Sub-Adviser and the approval of the Advisory Agreements. Prior to the Meeting, including at an in-person meeting in April 2016, the Trustees conferred extensively among themselves and with representatives of Funds Management about these matters. Also, the Board has adopted a team-based approach, with each team consisting of a sub-set of Trustees, to assist the full Board in the discharge of its duties in reviewing performance and other matters throughout the year. The Independent Trustees were assisted in their evaluation of the Advisory Agreements by independent legal counsel, from whom they received separate legal advice and with whom they met separately.
In providing information to the Board, Funds Management and the Sub-Adviser were guided by a detailed set of requests for information submitted to them by independent legal counsel on behalf of the Independent Trustees at the start of the Board’s annual contract renewal process earlier in 2016. In considering and approving the Advisory Agreements, the Trustees considered the information they believed relevant, including but not limited to the information discussed below. The Board considered not only the specific information presented in connection with the Meeting, but also the knowledge gained over time through interaction with Funds Management and the Sub-Adviser about various topics. In this regard, the Board reviewed reports of Funds Management at each of its quarterly meetings, which included, among other things, portfolio reviews and performance reports. In addition, the Board and the teams mentioned above confer with portfolio managers at various times throughout the year. The Board did not identify any particular information or consideration that was all-important or controlling, and each individual Trustee may have attributed different weights to various factors.
After its deliberations, the Board unanimously approved the continuation of the Advisory Agreements for a one-year term and determined that the compensation payable to Funds Management and the Sub-Adviser under each of the Advisory Agreements was reasonable. The Board considered the approval of the Advisory Agreements for the Fund as part of its consideration of agreements for funds across the complex, but its approvals were made on a fund-by-fund basis. The following summarizes a number of important, but not necessarily all, factors considered by the Board in support of its approvals.
Nature, extent and quality of services
The Board received and considered various information regarding the nature, extent and quality of services provided to the Fund by Funds Management and the Sub-Adviser under the Advisory Agreements. This information included a description of the investment advisory services and Fund-level administrative services covered by the Management Agreement, as well as, among other things, a summary of the background and experience of senior management of Funds Management, and the qualifications, background, tenure and responsibilities of each of the portfolio managers primarily responsible for the day-to-day portfolio management of the Fund.
The Board evaluated the ability of Funds Management and the Sub-Adviser to attract and retain qualified investment professionals, including research, advisory and supervisory personnel. The Board further considered the compliance programs and compliance records of Funds Management and the Sub-Adviser. In addition, the Board took into account the full range of services provided to the Fund by Funds Management and its affiliates.
Fund performance and expenses
The Board considered the performance results for the Fund over various time periods ended December 31, 2015. The Board considered these results in comparison to the performance of funds in a universe that was determined by Broadridge Inc. (“Broadridge”) to be similar to the Fund (the “Universe”), and in comparison to the Fund’s benchmark index and to other comparative data. Broadridge is an independent provider of investment company data. The Board received a description of the methodology used by Broadridge to select the mutual funds in the performance Universe.
| | | | | | |
| Other information (unaudited) | | Wells Fargo Common Stock Fund | | | 33 | |
The Board noted that the performance of the Fund (Class A) was higher than the average performance of the Universe for all periods under review except the three-year period under review. The Board also noted that the performance of the Fund was higher than its benchmark, the Russell 2500TM Index, for all periods under review except the three- and five-year periods.
The Board received information concerning, and discussed factors contributing to, the underperformance of the Fund relative to the Universe and benchmark for the periods noted above. The Board took note of the explanations for the relative underperformance in these periods, including with respect to market factors and investment decisions that affected the Fund’s performance.
The Board also received and considered information regarding the Fund’s net operating expense ratios and their various components, including actual management fees, custodian and other non-management fees, and Rule 12b-1 and non-Rule 12b-1 shareholder service fees. The Board considered these ratios in comparison to the median ratios of funds in class-specific expense groups that were determined by Broadridge to be similar to the Fund (the “Groups”). The Board received a description of the methodology used by Broadridge to select the mutual funds in the expense Groups and an explanation of how funds comprising expense groups and their expense ratios may vary from year-to-year. Based on the Broadridge reports, the Board noted that the net operating expense ratios of the Fund were lower than or in range of the median net operating expense ratios of the expense Groups.
The Board took into account the Fund performance and expense information provided to it among the factors considered in deciding to re-approve the Advisory Agreements.
Investment management and sub-advisory fee rates
The Board reviewed and considered the contractual fee rates payable by the Fund to Funds Management under the Management Agreement, as well as the contractual fee rates payable by the Fund to Funds Management for class-level administrative services under a Class-Level Administration Agreement, which include class-level transfer agency and sub-transfer agency costs (collectively, the “Management Rates”). The Board also reviewed and considered the contractual investment sub-advisory fee rates that are payable by Funds Management to the Sub-Adviser for investment sub-advisory services.
Among other information reviewed by the Board was a comparison of the Fund’s Management Rates with the average contractual investment management fee rates of funds in the expense Groups at a common asset level as well as transfer agency costs of the funds in the expense Groups. The Board noted that the Management Rates of the Fund were lower than or in range of the sum of these average rates for the Fund’s expense Groups for all share classes.
The Board also received and considered information about the portion of the total management fee that was retained by Funds Management after payment of the fee to the Sub-Adviser for sub-advisory services. In assessing the reasonableness of this amount, the Board received and evaluated information about the nature and extent of responsibilities retained and risks assumed by Funds Management and not delegated to or assumed by the Sub-Adviser, and about Funds Management’s on-going oversight services. However, given the affiliation between Funds Management and the Sub-Adviser, the Board ascribed limited relevance to the allocation of fees between them.
The Board also received and considered information about the nature and extent of services offered and fee rates charged by Funds Management and the Sub-Adviser to other types of clients with investment strategies similar to those of the Fund. In this regard, the Board received information about the significantly greater scope of services, and compliance, reporting and other legal burdens and risks of managing mutual funds compared with those associated with managing assets of non-mutual fund clients such as collective funds or institutional separate accounts.
Based on its consideration of the factors and information it deemed relevant, including those described here, the Board determined that the compensation payable to Funds Management under the Management Agreement and to the Sub-Adviser under the Sub-Advisory Agreement was reasonable, in light of the services covered by the Advisory Agreements.
Profitability
The Board received and considered information concerning the profitability of Funds Management, as well as the profitability of Wells Fargo as a whole, from providing services to the Fund and the fund family as a whole. The Board also received and considered information concerning the profitability of the Sub-Adviser from providing services to the fund family as a whole, noting that the Sub-Adviser’s profitability information with respect to providing services to the Fund was subsumed in the Wells Fargo and Funds Management profitability analysis.
| | | | |
| 34 | | Wells Fargo Common Stock Fund | | Other information (unaudited) |
Funds Management reported on the methodologies and estimates used in calculating profitability. Among other things, the Board noted that the levels of profitability reported on a fund-by-fund basis varied widely, depending on factors such as the size and type of fund. Based on its review, the Board did not deem the profits reported by Funds Management or Wells Fargo from its services to the Fund to be at a level that would prevent it from approving the continuation of the Advisory Agreements.
Economies of scale
With respect to possible economies of scale, the Board noted the existence of breakpoints in the Fund’s management fee structure, which operate generally to reduce the Fund’s expense ratios as the Fund grows in size. It considered that, for a small fund or a fund that shrinks in size, breakpoints conversely can result in higher fee levels. The Board also considered that fee waiver and expense reimbursement arrangements and competitive fee rates at the outset are means of sharing potential economies of scale with shareholders of the Fund and the fund family as a whole. The Board considered Funds Management’s view that any analyses of potential economies of scale in managing a particular fund are inherently limited in light of the joint and common costs and investments that Funds Management incurs across the fund family as a whole.
The Board concluded that the Fund’s fee and expense arrangements, including contractual breakpoints, constituted a reasonable approach to sharing potential economies of scale with the Fund and its shareholders.
Other benefits to Funds Management and the Sub-Adviser
The Board received and considered information regarding potential “fall-out” or ancillary benefits received by Funds Management and its affiliates, including the Sub-Adviser, as a result of their relationships with the Fund. Ancillary benefits could include, among others, benefits directly attributable to other relationships with the Fund and benefits potentially derived from an increase in Funds Management’s and the Sub-Adviser’s business as a result of their relationships with the Fund. The Board noted that various affiliates of Funds Management may receive distribution-related fees, shareholder servicing payments and sub-transfer agency fees in respect of shares sold or held through them and services provided.
The Board also reviewed information about soft dollar credits earned and utilized by the Sub-Adviser, fees earned by Funds Management and the Sub-Adviser from managing a private investment vehicle for the fund family’s securities lending collateral and commissions earned by an affiliated broker from portfolio transactions.
Based on its consideration of the factors and information it deemed relevant, including those described here, the Board did not find that any ancillary benefits received by Funds Management and its affiliates, including the Sub-Adviser, were unreasonable.
Conclusion
At the Meeting, after considering the above-described factors and based on its deliberations and its evaluation of the information described above, the Board unanimously approved the continuation of the Advisory Agreements for a one-year term and determined that the compensation payable to Funds Management and the Sub-Adviser under each of the Advisory Agreements was reasonable.
| | | | | | |
| List of abbreviations | | Wells Fargo Common Stock Fund | | | 35 | |
The following is a list of common abbreviations for terms and entities that may have appeared in this report.
| ACA | — ACA Financial Guaranty Corporation |
| ADR | — American depositary receipt |
| ADS | — American depositary shares |
| AGC | — Assured Guaranty Corporation |
| AGM | — Assured Guaranty Municipal |
| Ambac | — Ambac Financial Group Incorporated |
| AMT | — Alternative minimum tax |
| BAN | — Bond anticipation notes |
| BHAC | — Berkshire Hathaway Assurance Corporation |
| CAB | — Capital appreciation bond |
| CCAB | — Convertible capital appreciation bond |
| CDA | — Community Development Authority |
| CDO | — Collateralized debt obligation |
| DRIVER | — Derivative inverse tax-exempt receipts |
| DW&P | — Department of Water & Power |
| DWR | — Department of Water Resources |
| ECFA | — Educational & Cultural Facilities Authority |
| EDA | — Economic Development Authority |
| EDFA | — Economic Development Finance Authority |
| ETF | — Exchange-traded fund |
| FDIC | — Federal Deposit Insurance Corporation |
| FFCB | — Federal Farm Credit Banks |
| FGIC | — Financial Guaranty Insurance Corporation |
| FHA | — Federal Housing Administration |
| FHLB | — Federal Home Loan Bank |
| FHLMC | — Federal Home Loan Mortgage Corporation |
| FICO | — The Financing Corporation |
| FNMA | — Federal National Mortgage Association |
| GDR | — Global depositary receipt |
| GNMA | — Government National Mortgage Association |
| HCFR | — Healthcare facilities revenue |
| HEFA | — Health & Educational Facilities Authority |
| HEFAR | — Higher education facilities authority revenue |
| HFA | — Housing Finance Authority |
| HFFA | — Health Facilities Financing Authority |
| HUD | — Department of Housing and Urban Development |
| IDA | — Industrial Development Authority |
| IDAG | — Industrial Development Agency |
| KRW | — Republic of Korea won |
| LIBOR | — London Interbank Offered Rate |
| LIFER | — Long Inverse Floating Exempt Receipts |
| LLC | — Limited liability company |
| LLLP | — Limited liability limited partnership |
| LLP | — Limited liability partnership |
| MBIA | — Municipal Bond Insurance Association |
| MFHR | — Multifamily housing revenue |
| MSTR | — Municipal securities trust receipts |
| MUD | — Municipal Utility District |
| National | — National Public Finance Guarantee Corporation |
| PCFA | — Pollution Control Financing Authority |
| PCL | — Public Company Limited |
| PCR | — Pollution control revenue |
| PFA | — Public Finance Authority |
| PFFA | — Public Facilities Financing Authority |
| PFOTER | — Puttable floating option tax-exempt receipts |
| plc | — Public limited company |
| PUTTER | — Puttable tax-exempt receipts |
| R&D | — Research & development |
| Radian | — Radian Asset Assurance |
| RAN | — Revenue anticipation notes |
| RDA | — Redevelopment Authority |
| RDFA | — Redevelopment Finance Authority |
| REIT | — Real estate investment trust |
| ROC | — Reset option certificates |
| SAVRS | — Select auction variable rate securities |
| SBA | — Small Business Authority |
| SDR | — Swedish depositary receipt |
| SFHR | — Single-family housing revenue |
| SFMR | — Single-family mortgage revenue |
| SPA | — Standby purchase agreement |
| SPDR | — Standard & Poor’s Depositary Receipts |
| SPEAR | — Short Puttable Exempt Adjustable Receipts |
| STRIPS | — Separate trading of registered interest and |
| TAN | — Tax anticipation notes |
| TIPS | — Treasury inflation-protected securities |
| TRAN | — Tax revenue anticipation notes |
| TTFA | — Transportation Trust Fund Authority |
| TVA | — Tennessee Valley Authority |
This page is intentionally left blank.

For more information
More information about Wells Fargo Funds is available free upon request. To obtain literature, please write, email, visit the Fund’s website, or call:
Wells Fargo Funds
P.O. Box 8266
Boston, MA 02266-8266
Email: fundservice@wellsfargo.com
Website: wellsfargofunds.com
Individual investors: 1-800-222-8222
Retail investment professionals: 1-888-877-9275
Institutional investment professionals: 1-866-765-0778
This report and the financial statements contained herein are submitted for the general information of the shareholders of the Fund. If this report is used for promotional purposes, distribution of the report must be accompanied or preceded by a current prospectus. Before investing, please consider the investment objectives, risks, charges, and expenses of the investment. For a current prospectus and, if available, a summary prospectus, containing this information, call
1-800-222-8222 or visit the Fund’s website at wellsfargofunds.com. Read the prospectus carefully before you invest or send money.
Wells Fargo Asset Management (WFAM) is a trade name used by the asset management businesses of Wells Fargo & Company. Wells Fargo Funds Management, LLC, a wholly owned subsidiary of Wells Fargo & Company, provides investment advisory and administrative services for Wells Fargo Funds. Other affiliates of Wells Fargo & Company provide subadvisory and other services for the funds. The funds are distributed by Wells Fargo Funds Distributor, LLC, Member FINRA, an affiliate of Wells Fargo & Company. Neither Wells Fargo Funds Management nor Wells Fargo Funds Distributor has Fund customer accounts/assets, and neither provides investment advice/recommendations or acts as an investment advice fiduciary to any investor.
NOT FDIC INSURED ¡ NO BANK GUARANTEE ¡ MAY LOSE VALUE
© 2016 Wells Fargo Funds Management, LLC. All rights reserved.
| | |
 | | 246393 11-16 A229/AR229 09-16 |
Annual Report
September 30, 2016

Wells Fargo Discovery Fund


Reduce clutter. Save trees.
Sign up for electronic delivery of prospectuses and shareholder reports at wellsfargo.com/advantagedelivery
Contents
The views expressed and any forward-looking statements are as of September 30, 2016, unless otherwise noted, and are those of the Fund managers and/or Wells Fargo Funds Management, LLC. Discussions of individual securities, or the markets generally, or any Wells Fargo Fund are not intended as individual recommendations. Future events or results may vary significantly from those expressed in any forward-looking statements. The views expressed are subject to change at any time in response to changing circumstances in the market. Wells Fargo Funds Management, LLC and the Fund disclaim any obligation to publicly update or revise any views expressed or forward-looking statements.
NOT FDIC INSURED ¡ NO BANK GUARANTEE ¡ MAY LOSE VALUE
| | | | |
| 2 | | Wells Fargo Discovery Fund | | Letter to shareholders (unaudited) |

Karla M. Rabusch
President
Wells Fargo Funds
Dear Shareholder:
We are pleased to offer you this annual report for the Wells Fargo Discovery Fund for the 12-month period that ended September 30, 2016. During this period, which began October 1, 2015, U.S. and international stock markets experienced bouts of heightened volatility, with intermittent sell-offs interspersed with rebounds. Despite market fluctuations throughout the year, U.S. small-, mid-, and large-cap stocks delivered double-digit positive results overall for the 12-month reporting period, as measured by the Russell 2000® Index,1 the Russell Midcap® Index,2 and the Russell 1000® Index,3 respectively. Small-cap U.S. stocks performed best, followed by large- and mid-cap stocks. International stocks overall also delivered positive results for the period.
Despite ongoing concerns, U.S. stocks generally rose in the fourth quarter of 2015; international markets lagged.
While U.S. stocks overall delivered favorable results in the quarter, stock markets outside the U.S. failed to keep pace as economic concerns, including China’s ongoing slowdown, continued to affect many countries. U.S. economic data released during the quarter indicated the economy remained solid, although the strong U.S. dollar and weakness in international economies remained headwinds. In December, the Federal Reserve (Fed), as expected, raised its target interest rate by 25 basis points (100 basis points equals 1.00%) after keeping it near zero for seven years. The move reflected confidence in the U.S. economy’s ability to stay healthy with less central-bank support. The Fed also clarified that future interest-rate increases would be gradual.
In the first quarter of 2016, market volatility increased globally amid ongoing concerns.
Stock markets worldwide fluctuated widely in the first quarter of 2016. Most sold off sharply in the first six weeks of the year on concerns such as weak global growth, falling commodity prices, and uncertainty over the timing and impact of the Fed’s interest-rate increases. As the quarter progressed, fears abated somewhat and global markets generally rallied. The U.S. economy ended the quarter on a positive note as much of the quarter’s data reflected resiliency. With ongoing uncertainties about global growth and financial markets, however, the Fed held off from raising the target interest rate during the quarter. Outside the U.S., the eurozone fell into deflation in February; in response, the European Central Bank (ECB) announced an expansion of its stimulus program. In China, the government in March set an anticipated growth rate of 6.5% to 7.0% for 2016, an acknowledgment of weakening growth. In emerging markets, although central-bank stimulus and improved prices for oil and other commodities led to stock-market rallies in the quarter, many of these countries’ economies face the potential of credit downgrades due to challenges such as the likelihood of a stronger U.S. dollar, which would make dollar-denominated debt more expensive.
Worries over interest rates and the U.K.’s Brexit vote largely drove markets during the second quarter of 2016.
U.S. stocks began the quarter in positive territory but started to lose steam in early May on worries that a possible June interest-rate increase by the Fed could hurt
| 1 | The Russell 2000® Index measures the performance of the 2,000 smallest companies in the Russell 3000® Index, which represents approximately 8% of the total market capitalization of the Russell 3000® Index. You cannot invest directly in an index. |
| 2 | The Russell Midcap® Index measures the performance of the 800 smallest companies in the Russell 1000® Index, which represent approximately 25% of the total market capitalization of the Russell 1000® Index. You cannot invest directly in an index. |
| 3 | The Russell 1000® Index measures the performance of the 1,000 largest companies in the Russell 3000® Index, which represents approximately 92% of the total market capitalization of the Russell 3000® Index. You cannot invest directly in an index. |
| | | | | | |
| Letter to shareholders (unaudited) | | Wells Fargo Discovery Fund | | | 3 | |
the market. In mid-May, stocks briefly plunged following comments by Fed officials noting that a June interest-rate increase remained on the table. But once investors had processed this information, stocks again rallied, finishing up for the month. The first three weeks of June brought heightened volatility, spurred largely by a disappointing jobs report and uncertainty over whether the U.K. would remain in the E.U. The U.K.’s Brexit vote on June 23 shocked countries in Europe and much of the rest of the world. Stock markets fell as investors worried that the U.K.’s departure from the E.U. would slow global growth and prolong the low-interest-rate environment. Following the initial rout, however, U.S. stocks rallied as investors seemed to decide that any negative effects would be more localized and not create a serious risk for global growth. By quarter-end, the broad U.S. stock market had moved back into positive territory.
U.S. stocks delivered generally positive results in the third quarter of 2016.
The rally in U.S. stocks continued into early July 2016. U.S. stocks then generally continued to move upward at a more moderate pace, reaching a quarterly peak in August before the upward momentum started to lose some steam. Markets worldwide have been supported to varying degrees by accommodative policies from leading central banks, including the Fed, ECB, Bank of England, and Bank of Japan. As a result, investors have watched closely for any signs that global central banks might tighten their measures. Although many U.S. investors had doubted the Fed would increase interest rates in September, hawkish comments by several Fed officials in early September raised concerns, sending stock and bond prices downward. However, immediately following the Fed’s September 20 meeting, stocks surged on news that the Fed had decided to leave short-term interest rates unchanged for the time being and had signaled its intention to increase rates by year-end. The Fed also lowered its estimates for long-term economic growth and adjusted its anticipated pace of future rate increases. U.S. small-cap stocks in particular benefited from a renewed investor focus on fundamentals and from healthy merger and acquisition activity.
Don’t let short-term uncertainty derail long-term investment goals.
Periods of uncertainty can present challenges, but experience has taught us that maintaining long-term investment goals can be an effective way to plan for the future. To help you create a sound strategy based on your personal goals and risk tolerance, Wells Fargo Funds offers more than 100 mutual funds spanning a wide range of asset classes and investment styles. Although diversification cannot guarantee an investment profit or prevent losses, we believe it can be an effective way to manage investment risk and potentially smooth out overall portfolio performance. We encourage investors to know their investments and to understand that appropriate levels of risk-taking may unlock opportunities.
Thank you for choosing to invest in Wells Fargo Funds. We appreciate your confidence in us and remain committed to helping you meet your financial needs.
Sincerely,

Karla M. Rabusch
President
Wells Fargo Funds
Markets worldwide have been supported to varying degrees by accommodative policies from leading central banks, including the Fed, ECB, Bank of England, and Bank of Japan.
Although diversification cannot guarantee an investment profit or prevent losses, we believe it can be an effective way to manage investment risk and potentially smooth out overall portfolio performance.
For further information about your Fund, contact your investment professional, visit our website at wellsfargofunds.com, or call us directly at 1-800-222-8222. We are available 24 hours a day, 7 days a week.
| | | | |
| 4 | | Wells Fargo Discovery Fund | | Performance highlights (unaudited) |
Investment objective
The Fund seeks long-term capital appreciation.
Manager
Wells Fargo Funds Management, LLC
Subadviser
Wells Capital Management Incorporated
Portfolio managers
Michael T. Smith, CFA®
Chris Warner, CFA®
Average annual total returns (%) as of September 30, 20161
| | | | | | | | | | | | | | | | | | | | | | | | | | | | | | | | | | |
| | | | | Including sales charge | | | Excluding sales charge | | | Expense ratios2 (%) | |
| | | Inception date | | 1 year | | | 5 year | | | 10 year | | | 1 year | | | 5 year | | | 10 year | | | Gross | | | Net3 | |
| Class A (WFDAX) | | 7-31-2007 | | | 1.16 | | | | 13.15 | | | | 8.56 | | | | 7.33 | | | | 14.50 | | | | 9.21 | | | | 1.19 | | | | 1.19 | |
| Class C (WDSCX) | | 7-31-2007 | | | 5.51 | | | | 13.64 | | | | 8.38 | | | | 6.51 | | | | 13.64 | | | | 8.38 | | | | 1.94 | | | | 1.94 | |
| Class R6 (WFDRX) | | 6-28-2013 | | | – | | | | – | | | | – | | | | 7.77 | | | | 14.96 | | | | 9.64 | | | | 0.76 | | | | 0.76 | |
| Administrator Class (WFDDX) | | 4-8-2005 | | | – | | | | – | | | | – | | | | 7.40 | | | | 14.61 | | | | 9.35 | | | | 1.11 | | | | 1.11 | |
| Institutional Class (WFDSX) | | 8-31-2006 | | | – | | | | – | | | | – | | | | 7.68 | | | | 14.91 | | | | 9.62 | | | | 0.86 | | | | 0.86 | |
| Russell 2500TM Growth Index4 | | – | | | – | | | | – | | | | – | | | | 11.02 | | | | 16.20 | | | | 8.82 | | | | – | | | | – | |
Figures quoted represent past performance, which is no guarantee of future results, and do not reflect taxes that a shareholder may pay on fund distributions or the redemption of fund shares. Investment return and principal value of an investment will fluctuate so that an investor’s shares, when redeemed, may be worth more or less than their original cost. Performance shown without sales charges would be lower if sales charges were reflected. Current performance may be lower or higher than the performance data quoted, which assumes the reinvestment of dividends and capital gains. Current month-end performance is available on the Fund’s website, wellsfargofunds.com.
Index returns do not include transaction costs associated with buying and selling securities, any mutual fund fees or expenses, or any taxes. It is not possible to invest directly in an index.
For Class A shares, the maximum front-end sales charge is 5.75%. For Class C shares, the maximum contingent deferred sales charge is 1.00%. Performance including a contingent deferred sales charge assumes the sales charge for the corresponding time period. Class R6, Administrator Class, and Institutional Class shares are sold without a front-end sales charge or contingent deferred sales charge.
Stock values fluctuate in response to the activities of individual companies and general market and economic conditions. Smaller-company stocks tend to be more volatile and less liquid than those of larger companies. Certain investment strategies tend to increase the total risk of an investment (relative to the broader market). The Fund is exposed to foreign investment risk. Consult the Fund’s prospectus for additional information on these and other risks.
Please see footnotes on page 5.
| | | | | | |
| Performance highlights (unaudited) | | Wells Fargo Discovery Fund | | | 5 | |
|
| Growth of $10,000 investment as of September 30, 20165 |
|
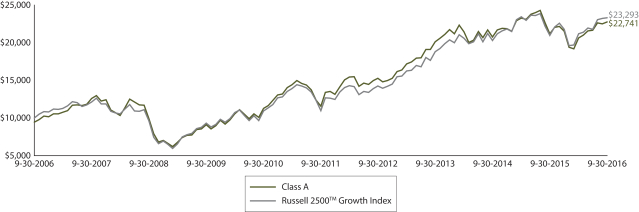 |
| 1 | Historical performance shown for Class A shares prior to their inception reflects the performance of the former Investor Class shares and includes the higher expenses applicable to the former Investor Class shares. If these expenses had not been included, returns would be higher. Historical performance shown for Class C shares prior to their inception reflects the performance of the former Investor Class shares and has been adjusted to reflect the higher expenses applicable to Class C shares. Historical performance shown for Class R6 shares prior to their inception reflects the performance of Institutional Class shares, and includes the higher expenses applicable to Institutional Class shares. If these expenses had not been included, the returns would be higher. |
| 2 | Reflects the expense ratios as stated in the most recent prospectuses. The expense ratios shown are subject to change and may differ from the annualized expense ratios shown in the financial highlights of this report. |
| 3 | The manager has contractually committed through January 31, 2017, to waive fees and/or reimburse expenses to the extent necessary to cap the Fund’s Total Annual Fund Operating Expenses After Fee Waiver at 1.22% for Class A, 1.97% for Class C, 0.84% for Class R6, 1.15% for Administrator Class, and 0.89% for Institutional Class. After this time, the cap may be increased or the commitment to maintain the cap may be terminated only with the approval of the Board of Trustees. Brokerage commissions, stamp duty fees, interest, taxes, acquired fund fees and expenses, and extraordinary expenses are excluded from the expense cap. Without this cap, the Fund’s returns would have been lower. |
| 4 | The Russell 2500™ Growth Index measures the performance of those Russell 2500 companies with higher price-to-book ratios and higher forecasted growth values. You cannot invest directly in an index. |
| 5 | The chart compares the performance of Class A shares for the most recent ten years with the Russell 2500™ Growth Index. The chart assumes a hypothetical investment of $10,000 in Class A shares and reflects all operating expenses and assumes the maximum initial sales charge of 5.75%. |
| 6 | The ten largest holdings, excluding cash and cash equivalents, are calculated based on the value of the investments divided by total net assets of the Fund. Holdings are subject to change and may have changed since the date specified. |
| 7 | Amounts are calculated based on the total long-term investments of the Fund. These amounts are subject to change and may have changed since the date specified. |
| | | | |
| 6 | | Wells Fargo Discovery Fund | | Performance highlights (unaudited) |
MANAGER’S DISCUSSION
Fund highlights
| n | | The Fund underperformed its benchmark, the Russell 2500TM Growth Index, for the 12-month period that ended September 30, 2016. |
| n | | Challenging stock selection in the information technology (IT) sector more than offset effective stock selection in the consumer discretionary sector. |
| n | | Although the U.S. economy generally displayed resiliency, global economic weakness and geopolitical risks led to high uncertainty, risk aversion, and occasional periods when stock prices appeared to undervalue the quality of company fundamentals. |
The environment for U.S. equities over the past 12 months vacillated frequently from a risk-averse market fueled by concern over geopolitical events and global economic issues to a more optimistic market in which company-specific data drove stock prices. This fluctuating investing landscape proved challenging for our bottom-up, fundamentally based investment process.
| | | | |
| Ten largest holdings (%) as of September 30, 20166 | |
Zayo Group Holdings Incorporated | | | 2.44 | |
KAR Auction Services Incorporated | | | 2.14 | |
Allegion plc | | | 2.12 | |
Waste Connections Incorporated | | | 2.07 | |
CoStar Group Incorporated | | | 2.05 | |
WEX Incorporated | | | 2.05 | |
Tyler Technologies Incorporated | | | 1.85 | |
Bright Horizons Family Solutions Incorporated | | | 1.80 | |
Aramark Corporation | | | 1.79 | |
ServiceNow Incorporated | | | 1.76 | |
Stock selection in the IT sector detracted the most from Fund performance.
Within the IT sector, positioning in the semiconductor and semiconductor equipment industry weighed on returns. Also, within the software industry, a combination of company-specific issues and concerns over enterprise spending pressured portfolio holdings. Tableau Software, Incorporated, a data-visualization software company, reported disappointing quarterly results driven by an unexpected decline in licensing revenue. Shares of Tableau declined sharply as a result. Concerns over increased competition and the company’s ability to transition its business model to large, enterprise-level customers also weighed on the stock. With the sharp increase in uncertainty, we determined our thesis was compromised and sold Tableau from the Fund.
Also within the IT sector, the mixed results delivered by Imperva, Incorporated—a leading provider of database security systems—weighed on its stock. While network security remains a priority for corporations, the industry has fallen victim to difficult earnings comparisons following the period of hypergrowth these companies experienced after several high-profile cyberattacks. Imperva was not immune to this weakness as the company guided revenue expectations lower during the second quarter of 2016. Although the company reported better-than-expected revenue and earnings, its management guided revenues lower due to softer demand from Europe and contract-timing issues. Due to considerable uncertainty in these end markets, we sold the stock from the Fund in favor of companies with higher visibility and growth potential.
Please see footnotes on page 5.
| | | | | | |
| Performance highlights (unaudited) | | Wells Fargo Discovery Fund | | | 7 | |
|
| Sector distribution as of September 30, 20167 |
|
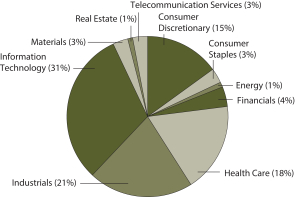 |
Stock selection in the consumer discretionary sector aided performance.
We observed specific strength in the hotel, restaurant, and leisure industry. Vail Resorts, Incorporated—a global operator of luxury resorts and world-class ski areas, including prominent properties in the western U.S.—enjoyed pristine conditions during the period. Vail Resorts has an expanding portfolio of properties, along with a sophisticated marketing system and a loyalty program to encourage repeat visits. The company displayed strength in the number of customer visits to properties as well as rising pricing metrics per visit. Vail Resorts also showed healthy progress on its acquisition of the Park City Mountain Resort in Park City, Utah, which is central to our investment thesis for Vail Resorts. We believe that under Vail’s management, Park City may experience significant future growth.
Also within the sector, Burlington Stores, Incorporated, stood out in a challenging retail environment. With many traditional department stores and mall-based operators experiencing store-traffic pressure, discount retailers like Burlington have been capitalizing on new opportunities. Robust quarterly results supported our thesis that Burlington is a strong growth operator within U.S. retail. The company reported better-than-expected same-stores sales and improved margins during the reporting period. Burlington has been benefiting from obtaining access to better-quality inventory from department-store competitors that have been struggling. The improved inventory is one of Burlington’s several initiatives in place to improve overall efficiency; other initiatives include reducing the size of its stores and improving its home-goods department. While we remain mindful of valuation, these potential catalysts coupled with the strength of the discount retail category give us confidence that our thesis may continue to be rewarded.
Recent market dynamics support our confidence in the Fund’s positioning.
Despite the lack of clarity on the macroeconomic front, there are some developments that we view as encouraging for our investing style. In contrast to worries that gripped investors early in 2016, investors more recently have been showing signs of embracing a muddle-through scenario for the U.S. economy. There appears to be a general sense that this slow-growth economy may lengthen the business cycle and avoid the boom-and-bust pattern the market frequently has followed in the past. The slow-growth scenario actually may be good for growth-equity investing.
We invest in companies with high organic growth, which tend to be scarce in a low-growth environment. With a decreasing number of companies capable of generating high levels of revenue growth, it stands to reason that growth stocks may command a premium valuation in the later stages of a business cycle. However, with just a few exceptions, that has not occurred broadly in this slow-growth market. Instead, slower-growing stocks that offer the perceived safety of high dividend yields have been rewarded with multiple expansion in recent years. However, this trend reversed in the last few months of the reporting period; stocks in traditional growth sectors, such as health care, outperformed, while high-dividend-yield stocks in sectors such as utilities and consumer staples lagged. Also, after languishing in a risk-averse environment, small- and mid-cap stocks—many of which are more exposed to strong U.S. end markets like housing—began to outperform. The most recent earnings season was the most rational that we have seen in a long time, where good news regarding company fundamentals led to good news for stock prices. This was a positive sign as equity correlations were able to normalize.
We remain upbeat regarding the fundamentals of companies within the Fund. Our internal projections for growth are high because many innovative companies are held within the Fund. In our view, these holdings are potentially capable of generating durable growth in a variety of economic environments. After years of a challenging environment, stock prices and returns may be moving back toward their average ranges. As we maintain a laser focus on the execution of our investment process, we believe our efforts may lead to strong performance for the benefit of Fund shareholders.
Please see footnotes on page 5.
| | | | |
| 8 | | Wells Fargo Discovery Fund | | Fund expenses (unaudited) |
As a shareholder of the Fund, you incur two types of costs: (1) transaction costs, including sales charges (loads) on purchase payments and contingent deferred sales charges (if any) on redemptions and (2) ongoing costs, including management fees, distribution (12b-1) and/or shareholder servicing fees, and other Fund expenses. This example is intended to help you understand your ongoing costs (in dollars) of investing in the Fund and to compare these costs with the ongoing costs of investing in other mutual funds.
The example is based on an investment of $1,000 invested at the beginning of the six-month period and held for the
entire period from April 1, 2016 to September 30, 2016.
Actual expenses
The “Actual” line of the table below provides information about actual account values and actual expenses. You may use the information in this line, together with the amount you invested, to estimate the expenses that you paid over the period. Simply divide your account value by $1,000 (for example, an $8,600 account value divided by $1,000 = 8.6), then multiply the result by the number in the “Actual” line under the heading entitled “Expenses paid during period” for your applicable class of shares to estimate the expenses you paid on your account during this period.
Hypothetical example for comparison purposes
The “Hypothetical” line of the table below provides information about hypothetical account values and hypothetical expenses based on the Fund’s actual expense ratio and an assumed rate of return of 5% per year before expenses, which is not the Fund’s actual return. The hypothetical account values and expenses may not be used to estimate the actual ending account balance or expenses you paid for the period. You may use this information to compare the ongoing costs of investing in the Fund and other funds. To do so, compare this 5% hypothetical example with the 5% hypothetical examples that appear in the shareholder reports of the other funds.
Please note that the expenses shown in the table are meant to highlight your ongoing costs only and do not reflect any transactional costs, such as sales charges (loads) and contingent deferred sales charges. Therefore, the “Hypothetical” line of the table is useful in comparing ongoing costs only and will not help you determine the relative total costs of owning different funds. In addition, if these transactional costs were included, your costs would have been higher.
| | | | | | | | | | | | | | | | |
| | | Beginning
account value
4-1-2016 | | | Ending
account value
9-30-2016 | | | Expenses
paid during
the period¹ | | | Annualized net
expense ratio | |
Class A | | | | | | | | | | | | | | | | |
Actual | | $ | 1,000.00 | | | $ | 1,101.95 | | | $ | 6.33 | | | | 1.21 | % |
Hypothetical (5% return before expenses) | | $ | 1,000.00 | | | $ | 1,018.97 | | | $ | 6.08 | | | | 1.21 | % |
Class C | | | | | | | | | | | | | | | | |
Actual | | $ | 1,000.00 | | | $ | 1,097.63 | | | $ | 10.28 | | | | 1.96 | % |
Hypothetical (5% return before expenses) | | $ | 1,000.00 | | | $ | 1,015.20 | | | $ | 9.87 | | | | 1.96 | % |
Class R6 | | | | | | | | | | | | | | | | |
Actual | | $ | 1,000.00 | | | $ | 1,104.20 | | | $ | 4.08 | | | | 0.78 | % |
Hypothetical (5% return before expenses) | | $ | 1,000.00 | | | $ | 1,021.12 | | | $ | 3.92 | | | | 0.78 | % |
Administrator Class | | | | | | | | | | | | | | | | |
Actual | | $ | 1,000.00 | | | $ | 1,102.33 | | | $ | 5.91 | | | | 1.12 | % |
Hypothetical (5% return before expenses) | | $ | 1,000.00 | | | $ | 1,019.38 | | | $ | 5.68 | | | | 1.12 | % |
Institutional Class | | | | | | | | | | | | | | | | |
Actual | | $ | 1,000.00 | | | $ | 1,103.34 | | | $ | 4.60 | | | | 0.88 | % |
Hypothetical (5% return before expenses) | | $ | 1,000.00 | | | $ | 1,020.62 | | | $ | 4.42 | | | | 0.88 | % |
| 1 | Expenses paid is equal to the annualized net expense ratio of each class multiplied by the average account value over the period, multiplied by the number of days in the most recent fiscal half-year divided by the number of days in the fiscal year (to reflect the one-half-year period). |
| | | | | | |
| Portfolio of investments—September 30, 2016 | | Wells Fargo Discovery Fund | | | 9 | |
| | | | | | | | | | | | | | | | |
| Security name | | | | | | | | Shares | | | Value | |
| | | | |
Common Stocks: 99.42% | | | | | | | | | | | | | | | | |
| | | | |
Consumer Discretionary: 15.15% | | | | | | | | | | | | | | | | |
| | | | |
| Automobiles: 1.21% | | | | | | | | | | | | | | | | |
Thor Industries Incorporated | | | | | | | | | | | 387,800 | | | $ | 32,846,660 | |
| | | | | | | | | | | | | | | | |
| | | | |
| Distributors: 1.22% | | | | | | | | | | | | | | | | |
Pool Corporation | | | | | | | | | | | 349,200 | | | | 33,006,384 | |
| | | | | | | | | | | | | | | | |
| | | | |
| Diversified Consumer Services: 1.80% | | | | | | | | | | | | | | | | |
Bright Horizons Family Solutions Incorporated † | | | | | | | | | | | 728,297 | | | | 48,715,786 | |
| | | | | | | | | | | | | | | | |
| | | | |
| Hotels, Restaurants & Leisure: 6.22% | | | | | | | | | | | | | | | | |
Aramark Corporation | | | | | | | | | | | 1,273,663 | | | | 48,437,404 | |
Dave & Buster’s Entertainment Incorporated † | | | | | | | | | | | 537,482 | | | | 21,058,545 | |
Six Flags Entertainment Corporation | | | | | | | | | | | 793,640 | | | | 42,547,040 | |
Vail Resorts Incorporated | | | | | | | | | | | 272,400 | | | | 42,734,112 | |
Wingstop Incorporated | | | | | | | | | | | 469,198 | | | | 13,747,501 | |
| | | | |
| | | | | | | | | | | | | | | 168,524,602 | |
| | | | | | | | | | | | | | | | |
| | | | |
| Media: 1.39% | | | | | | | | | | | | | | | | |
Cinemark Holdings Incorporated | | | | | | | | | | | 985,951 | | | | 37,742,204 | |
| | | | | | | | | | | | | | | | |
| | | | |
| Specialty Retail: 1.55% | | | | | | | | | | | | | | | | |
Burlington Stores Incorporated † | | | | | | | | | | | 518,565 | | | | 42,014,136 | |
| | | | | | | | | | | | | | | | |
| | | | |
| Textiles, Apparel & Luxury Goods: 1.76% | | | | | | | | | | | | | | | | |
Coach Incorporated | | | | | | | | | | | 763,400 | | | | 27,909,904 | |
Columbia Sportswear Company | | | | | | | | | | | 346,091 | | | | 19,637,203 | |
| | | | |
| | | | | | | | | | | | | | | 47,547,107 | |
| | | | | | | | | | | | | | | | |
| | | | |
Consumer Staples: 2.78% | | | | | | | | | | | | | | | | |
| | | | |
| Beverages: 1.33% | | | | | | | | | | | | | | | | |
Constellation Brands Incorporated Class A | | | | | | | | | | | 217,157 | | | | 36,154,469 | |
| | | | | | | | | | | | | | | | |
| | | | |
| Food Products: 1.45% | | | | | | | | | | | | | | | | |
TreeHouse Foods Incorporated † | | | | | | | | | | | 449,100 | | | | 39,157,029 | |
| | | | | | | | | | | | | | | | |
| | | | |
Energy: 0.94% | | | | | | | | | | | | | | | | |
| | | | |
| Oil, Gas & Consumable Fuels: 0.94% | | | | | | | | | | | | | | | | |
Diamondback Energy Incorporated † | | | | | | | | | | | 264,365 | | | | 25,521,797 | |
| | | | | | | | | | | | | | | | |
| | | | |
Financials: 4.41% | | | | | | | | | | | | | | | | |
| | | | |
| Capital Markets: 3.55% | | | | | | | | | | | | | | | | |
Evercore Partners Incorporated Class A | | | | | | | | | | | 624,500 | | | | 32,167,995 | |
Raymond James Financial Incorporated | | | | | | | | | | | 392,460 | | | | 22,845,097 | |
SEI Investments Company | | | | | | | | | | | 899,599 | | | | 41,030,710 | |
| | | | |
| | | | | | | | | | | | | | | 96,043,802 | |
| | | | | | | | | | | | | | | | |
| | | | |
| Thrifts & Mortgage Finance: 0.86% | | | | | | | | | | | | | | | | |
LendingTree Incorporated † | | | | | | | | | | | 239,802 | | | | 23,239,212 | |
| | | | | | | | | | | | | | | | |
The accompanying notes are an integral part of these financial statements.
| | | | |
| 10 | | Wells Fargo Discovery Fund | | Portfolio of investments—September 30, 2016 |
| | | | | | | | | | | | | | | | |
| Security name | | | | | | | | Shares | | | Value | |
| | | | |
Health Care: 17.63% | | | | | | | | | | | | | | | | |
| | | | |
| Biotechnology: 2.85% | | | | | | | | | | | | | | | | |
Alnylam Pharmaceuticals Incorporated † | | | | | | | | | | | 218,763 | | | $ | 14,827,756 | |
bluebird bio Incorporated †« | | | | | | | | | | | 211,700 | | | | 14,349,026 | |
Ligand Pharmaceuticals Incorporated †« | | | | | | | | | | | 292,101 | | | | 29,811,828 | |
Ophthotech Corporation † | | | | | | | | | | | 145,300 | | | | 6,702,689 | |
Prothena Corporation plc †« | | | | | | | | | | | 192,723 | | | | 11,557,599 | |
| | | | |
| | | | | | | | | | | | | | | 77,248,898 | |
| | | | | | | | | | | | | | | | |
| | | | |
| Health Care Equipment & Supplies: 4.15% | | | | | | | | | | | | | | | | |
Cantel Medical Corporation | | | | | | | | | | | 357,217 | | | | 27,855,782 | |
DexCom Incorporated † | | | | | | | | | | | 420,673 | | | | 36,876,195 | |
Integra LifeSciences Holdings Corporation † | | | | | | | | | | | 503,102 | | | | 41,531,070 | |
Nevro Corporation †« | | | | | | | | | | | 59,490 | | | | 6,210,161 | |
| | | | |
| | | | | | | | | | | | | | | 112,473,208 | |
| | | | | | | | | | | | | | | | |
| | | | |
| Health Care Providers & Services: 6.34% | | | | | | | | | | | | | | | | |
Amedisys Incorporated † | | | | | | | | | | | 635,288 | | | | 30,138,063 | |
HealthEquity Incorporated † | | | | | | | | | | | 1,000,202 | | | | 37,857,646 | |
Healthways Incorporated † | | | | | | | | | | | 918,500 | | | | 24,303,510 | |
Surgical Care Affiliates Incorporated † | | | | | | | | | | | 709,551 | | | | 34,597,707 | |
VCA Incorporated † | | | | | | | | | | | 640,613 | | | | 44,830,098 | |
| | | | |
| | | | | | | | | | | | | | | 171,727,024 | |
| | | | | | | | | | | | | | | | |
| | | | |
| Health Care Technology: 0.98% | | | | | | | | | | | | | | | | |
Veeva Systems Incorporated Class A † | | | | | | | | | | | 639,719 | | | | 26,407,600 | |
| | | | | | | | | | | | | | | | |
| | | | |
| Life Sciences Tools & Services: 2.69% | | | | | | | | | | | | | | | | |
Cambrex Corporation † | | | | | | | | | | | 890,417 | | | | 39,587,940 | |
VWR Corporation † | | | | | | | | | | | 1,168,700 | | | | 33,144,332 | |
| | | | |
| | | | | | | | | | | | | | | 72,732,272 | |
| | | | | | | | | | | | | | | | |
| | | | |
| Pharmaceuticals: 0.62% | | | | | | | | | | | | | | | | |
The Medicines Company †« | | | | | | | | | | | 448,084 | | | | 16,910,690 | |
| | | | | | | | | | | | | | | | |
| | | | |
Industrials: 20.90% | | | | | | | | | | | | | | | | |
| | | | |
| Aerospace & Defense: 1.05% | | | | | | | | | | | | | | | | |
Orbital ATK Incorporated | | | | | | | | | | | 372,200 | | | | 28,372,806 | |
| | | | | | | | | | | | | | | | |
| | | | |
| Airlines: 1.38% | | | | | | | | | | | | | | | | |
Spirit Airlines Incorporated † | | | | | | | | | | | 880,718 | | | | 37,456,937 | |
| | | | | | | | | | | | | | | | |
| | | | |
| Building Products: 4.91% | | | | | | | | | | | | | | | | |
A.O. Smith Corporation | | | | | | | | | | | 403,300 | | | | 39,842,007 | |
Allegion plc | | | | | | | | | | | 831,700 | | | | 57,312,447 | |
Masonite International Corporation † | | | | | | | | | | | 574,600 | | | | 35,722,882 | |
| | | | |
| | | | | | | | | | | | | | | 132,877,336 | |
| | | | | | | | | | | | | | | | |
The accompanying notes are an integral part of these financial statements.
| | | | | | |
| Portfolio of investments—September 30, 2016 | | Wells Fargo Discovery Fund | | | 11 | |
| | | | | | | | | | | | | | | | |
| Security name | | | | | | | | Shares | | | Value | |
| | | | |
| Commercial Services & Supplies: 4.20% | | | | | | | | | | | | | | | | |
KAR Auction Services Incorporated | | | | | | | | | | | 1,339,872 | | | $ | 57,828,876 | |
Waste Connections Incorporated | | | | | | | | | | | 749,500 | | | | 55,987,650 | |
| | | | |
| | | | | | | | | | | | | | | 113,816,526 | |
| | | | | | | | | | | | | | | | |
| | | | |
| Electrical Equipment: 1.12% | | | | | | | | | | | | | | | | |
Acuity Brands Incorporated | | | | | | | | | | | 114,296 | | | | 30,242,722 | |
| | | | | | | | | | | | | | | | |
| | | | |
| Industrial Conglomerates: 1.27% | | | | | | | | | | | | | | | | |
Carlisle Companies Incorporated | | | | | | | | | | | 335,779 | | | | 34,440,852 | |
| | | | | | | | | | | | | | | | |
| | | | |
| Machinery: 1.45% | | | | | | | | | | | | | | | | |
John Bean Technologies Corporation | | | | | | | | | | | 556,600 | | | | 39,268,130 | |
| | | | | | | | | | | | | | | | |
| | | | |
| Professional Services: 1.60% | | | | | | | | | | | | | | | | |
TransUnion † | | | | | | | | | | | 1,259,024 | | | | 43,436,328 | |
| | | | | | | | | | | | | | | | |
| | | | |
| Road & Rail: 2.21% | | | | | | | | | | | | | | | | |
J.B. Hunt Transport Services Incorporated | | | | | | | | | | | 252,500 | | | | 20,487,850 | |
Kansas City Southern | | | | | | | | | | | 423,500 | | | | 39,521,020 | |
| | | | |
| | | | | | | | | | | | | | | 60,008,870 | |
| | | | | | | | | | | | | | | | |
| | | | |
| Trading Companies & Distributors: 1.71% | | | | | | | | | | | | | | | | |
HD Supply Holdings Incorporated † | | | | | | | | | | | 1,446,677 | | | | 46,264,730 | |
| | | | | | | | | | | | | | | | |
| | | | |
Information Technology: 31.25% | | | | | | | | | | | | | | | | |
| | | | |
| Communications Equipment: 2.30% | | | | | | | | | | | | | | | | |
Finisar Corporation † | | | | | | | | | | | 949,114 | | | | 28,283,597 | |
Harris Corporation | | | | | | | | | | | 372,200 | | | | 34,097,242 | |
| | | | |
| | | | | | | | | | | | | | | 62,380,839 | |
| | | | | | | | | | | | | | | | |
| | | | |
| Electronic Equipment, Instruments & Components: 4.06% | | | | | | | | | | | | | | | | |
Cognex Corporation | | | | | | | | | | | 501,490 | | | | 26,508,761 | |
FLIR Systems Incorporated | | | | | | | | | | | 959,000 | | | | 30,131,780 | |
Littelfuse Incorporated | | | | | | | | | | | 231,293 | | | | 29,792,851 | |
Universal Display Corporation † | | | | | | | | | | | 423,500 | | | | 23,508,485 | |
| | | | |
| | | | | | | | | | | | | | | 109,941,877 | |
| | | | | | | | | | | | | | | | |
| | | | |
| Internet Software & Services: 4.89% | | | | | | | | | | | | | | | | |
CoStar Group Incorporated † | | | | | | | | | | | 256,349 | | | | 55,507,249 | |
MercadoLibre Incorporated | | | | | | | | | | | 115,600 | | | | 21,382,532 | |
Q2 Holdings Incorporated † | | | | | | | | | | | 793,100 | | | | 22,730,246 | |
Yandex NV Class A † | | | | | | | | | | | 1,565,900 | | | | 32,962,195 | |
| | | | |
| | | | | | | | | | | | | | | 132,582,222 | |
| | | | | | | | | | | | | | | | |
| | | | |
| IT Services: 9.01% | | | | | | | | | | | | | | | | |
Acxiom Corporation † | | | | | | | | | | | 1,402,205 | | | | 37,368,763 | |
EPAM Systems Incorporated † | | | | | | | | | | | 668,196 | | | | 46,312,665 | |
Euronet Worldwide Incorporated † | | | | | | | | | | | 557,150 | | | | 45,591,585 | |
Total System Services Incorporated | | | | | | | | | | | 713,500 | | | | 33,641,525 | |
Vantiv Incorporated Class A † | | | | | | | | | | | 455,685 | | | | 25,641,395 | |
The accompanying notes are an integral part of these financial statements.
| | | | |
| 12 | | Wells Fargo Discovery Fund | | Portfolio of investments—September 30, 2016 |
| | | | | | | | | | | | | | | | |
| Security name | | | | | | | | Shares | | | Value | |
| | | | |
| IT Services (continued) | | | | | | | | | | | | | | | | |
WEX Incorporated † | | | | | | | | | | | 512,700 | | | $ | 55,417,743 | |
| | | | |
| | | | | | | | | | | | | | | 243,973,676 | |
| | | | | | | | | | | | | | | | |
| | | | |
| Software: 10.99% | | | | | | | | | | | | | | | | |
Ellie Mae Incorporated † | | | | | | | | | | | 409,386 | | | | 43,108,346 | |
Guidewire Software Incorporated † | | | | | | | | | | | 664,966 | | | | 39,884,661 | |
HubSpot Incorporated † | | | | | | | | | | | 479,700 | | | | 27,640,314 | |
Paycom Software Incorporated † | | | | | | | | | | | 612,271 | | | | 30,693,145 | |
Secureworks Corporation Class A †« | | | | | | | | | | | 926,584 | | | | 11,591,566 | |
ServiceNow Incorporated † | | | | | | | | | | | 601,000 | | | | 47,569,150 | |
Take-Two Interactive Software Incorporated † | | | | | | | | | | | 1,042,600 | | | | 47,000,408 | |
Tyler Technologies Incorporated † | | | | | | | | | | | 292,267 | | | | 50,044,878 | |
| | | | |
| | | | | | | | | | | | | | | 297,532,468 | |
| | | | | | | | | | | | | | | | |
| | | | |
Materials: 2.74% | | | | | | | | | | | | | | | | |
| | | | |
| Construction Materials: 1.22% | | | | | | | | | | | | | | | | |
Vulcan Materials Company | | | | | | | | | | | 291,300 | | | | 33,129,549 | |
| | | | | | | | | | | | | | | | |
| | | | |
| Containers & Packaging: 1.52% | | | | | | | | | | | | | | | | |
Berry Plastics Group Incorporated † | | | | | | | | | | | 937,500 | | | | 41,109,375 | |
| | | | | | | | | | | | | | | | |
| | | | |
Real Estate: 1.18% | | | | | | | | | | | | | | | | |
| | | | |
| Real Estate Management & Development: 1.18% | | | | | | | | | | | | | | | | |
CBRE Group Incorporated Class A † | | | | | | | | | | | 1,143,800 | | | | 32,003,524 | |
| | | | | | | | | | | | | | | | |
| | | | |
Telecommunication Services: 2.44% | | | | | | | | | | | | | | | | |
| | | | |
| Diversified Telecommunication Services: 2.44% | | | | | | | | | | | | | | | | |
Zayo Group Holdings Incorporated † | | | | | | | | | | | 2,224,999 | | | | 66,104,720 | |
| | | | | | | | | | | | | | | | |
| | | | |
Total Common Stocks (Cost $2,240,361,084) | | | | | | | | | | | | | | | 2,692,956,367 | |
| | | | | | | | | | | | | | | | |
| | | | |
| | | Yield | | | | | | | | | | |
| Short-Term Investments: 2.89% | | | | | | | | | | | | | | | | |
| | | | |
| Investment Companies: 2.89% | | | | | | | | | | | | | | | | |
Securities Lending Cash Investments LLC (l)(r)(u) | | | 0.65 | % | | | | | | | 53,359,685 | | | | 53,359,685 | |
Wells Fargo Government Money Market Fund Select Class (l)(u) | | | 0.34 | | | | | | | | 24,767,941 | | | | 24,767,941 | |
| | | | |
Total Short-Term Investments (Cost $78,127,626) | | | | | | | | | | | | | | | 78,127,626 | |
| | | | | | | | | | | | | | | | |
| | | | | | | | |
| Total investments in securities (Cost $2,318,488,710) * | | | 102.31 | % | | | 2,771,083,993 | |
Other assets and liabilities, net | | | (2.31 | ) | | | (62,538,117 | ) |
| | | | | | | | |
| Total net assets | | | 100.00 | % | | $ | 2,708,545,876 | |
| | | | | | | | |
| † | Non-income-earning security |
| « | All or a portion of this security is on loan. |
| (l) | The issuer of the security is an affiliated person of the Fund as defined in the Investment Company Act of 1940. |
| (r) | The investment is a non-registered investment vehicle purchased with cash collateral received from securities on loan. |
| (u) | The rate represents the 7-day annualized yield at period end. |
| * | Cost for federal income tax purposes is $2,328,900,284 and unrealized gains (losses) consists of: |
| | | | |
Gross unrealized gains | | $ | 499,889,555 | |
Gross unrealized losses | | | (57,705,846 | ) |
| | | | |
Net unrealized gains | | $ | 442,183,709 | |
The accompanying notes are an integral part of these financial statements.
| | | | | | |
| Statement of assets and liabilities—September 30, 2016 | | Wells Fargo Discovery Fund | | | 13 | |
| | | | |
| | | | |
| |
Assets | | | | |
Investments | | | | |
In unaffiliated securities (including $52,724,883 of securities loaned), at value (cost $2,240,361,084) | | $ | 2,692,956,367 | |
In affiliated securities, at value (cost $78,127,626) | | | 78,127,626 | |
| | | | |
Total investments, at value (cost $2,318,488,710) | | | 2,771,083,993 | |
Cash | | | 99,804 | |
Receivable for investments sold | | | 15,285,368 | |
Receivable for Fund shares sold | | | 1,844,639 | |
Receivable for dividends | | | 960,712 | |
Receivable for securities lending income | | | 27,049 | |
| | | | |
Total assets | | | 2,789,301,565 | |
| | | | |
| |
Liabilities | | | | |
Payable for investments purchased | | | 20,830,091 | |
Payable for Fund shares redeemed | | | 4,071,794 | |
Payable upon receipt of securities loaned | | | 53,359,685 | |
Management fee payable | | | 1,716,161 | |
Distribution fee payable | | | 33,181 | |
Administration fees payable | | | 331,898 | |
Accrued expenses and other liabilities | | | 412,879 | |
| | | | |
Total liabilities | | | 80,755,689 | |
| | | | |
Total net assets | | $ | 2,708,545,876 | |
| | | | |
| |
NET ASSETS CONSIST OF | | | | |
Paid-in capital | | $ | 2,278,055,559 | |
Accumulated net investment loss | | | (9,174,872 | ) |
Accumulated net realized losses on investments | | | (12,930,094 | ) |
Net unrealized gains on investments | | | 452,595,283 | |
| | | | |
Total net assets | | $ | 2,708,545,876 | |
| | | | |
| |
COMPUTATION OF NET ASSET VALUE AND OFFERING PRICE PER SHARE | | | | |
Net assets – Class A | | $ | 641,786,083 | |
Shares outstanding – Class A1 | | | 21,438,434 | |
Net asset value per share – Class A | | | $29.94 | |
Maximum offering price per share – Class A2 | | | $31.77 | |
Net assets – Class C | | $ | 49,537,542 | |
Shares outstanding – Class C1 | | | 1,813,299 | |
Net asset value per share – Class C | | | $27.32 | |
Net assets – Class R6 | | $ | 300,118,447 | |
Shares outstanding – Class R61 | | | 9,439,043 | |
Net asset value per share – Class R6 | | | $31.80 | |
Net assets – Administrator Class | | $ | 400,996,754 | |
Shares outstanding – Administrator Class1 | | | 13,061,821 | |
Net asset value per share – Administrator Class | | | $30.70 | |
Net assets – Institutional Class | | $ | 1,316,107,050 | |
Shares outstanding – Institutional Class1 | | | 41,497,724 | |
Net asset value per share – Institutional Class | | | $31.72 | |
| 1 | The Fund has an unlimited number of authorized shares. |
| 2 | Maximum offering price is computed as 100/94.25 of net asset value. On investments of $50,000 or more, the offering price is reduced. |
The accompanying notes are an integral part of these financial statements.
| | | | |
| 14 | | Wells Fargo Discovery Fund | | Statement of operations—year ended September 30, 2016 |
| | | | |
| | | | |
| |
Investment income | | | | |
Dividends (net of foreign withholding taxes of $12,986) | | $ | 15,024,387 | |
Securities lending income, net | | | 794,299 | |
Income from affiliated securities | | | 157,573 | |
| | | | |
Total investment income | | | 15,976,259 | |
| | | | |
| |
Expenses | | | | |
Management fee | | | 20,897,204 | |
Administration fees | | | | |
Class A | | | 1,421,057 | |
Class C | | | 118,626 | |
Class R6 | | | 88,906 | |
Administrator Class | | | 636,286 | |
Institutional Class | | | 1,759,847 | |
Investor Class | | | 118,301 | 1 |
Shareholder servicing fees | | | | |
Class A | | | 1,689,960 | |
Class C | | | 141,221 | |
Administrator Class | | | 1,222,535 | |
Investor Class | | | 90,688 | 1 |
Distribution fee | | | | |
Class C | | | 423,664 | |
Custody and accounting fees | | | 167,688 | |
Professional fees | | | 43,752 | |
Registration fees | | | 215,552 | |
Shareholder report expenses | | | 195,408 | |
Trustees’ fees and expenses | | | 24,811 | |
Other fees and expenses | | | 69,525 | |
| | | | |
Total expenses | | | 29,325,031 | |
Less: Fee waivers and/or expense reimbursements | | | (7,060 | ) |
| | | | |
Net expenses | | | 29,317,971 | |
| | | | |
Net investment loss | | | (13,341,712 | ) |
| | | | |
| |
REALIZED AND UNREALIZED GAINS (LOSSES) ON INVESTMENTS | | | | |
Net realized losses on investments | | | (6,021,855 | ) |
Net change in unrealized gains (losses) on investments | | | 207,908,464 | |
| | | | |
Net realized and unrealized gains (losses) on investments | | | 201,886,609 | |
| | | | |
Net increase in net assets resulting from operations | | $ | 188,544,897 | |
| | | | |
| 1 | For the period from October 1, 2015 to October 23, 2015. Effective at the close of business on October 23, 2015, Investor Class shares were converted to Class A shares and are no longer offered by the Fund. |
The accompanying notes are an integral part of these financial statements.
| | | | | | |
| Statement of changes in net assets | | Wells Fargo Discovery Fund | | | 15 | |
| | | | | | | | | | | | | | | | |
| | | Year ended
September 30, 2016 | | | Year ended
September 30, 2015 | |
| | | | |
Operations | | | | | | | | | | | | | | | | |
Net investment loss | | | | | | $ | (13,341,712 | ) | | | | | | $ | (15,526,813 | ) |
Net realized gains (losses) on investments | | | | | | | (6,021,855 | ) | | | | | | | 275,982,733 | |
Net change in unrealized gains (losses) on investments | | | | | | | 207,908,464 | | | | | | | | (179,089,579 | ) |
| | | | |
Net increase in net assets resulting from operations | | | | | | | 188,544,897 | | | | | | | | 81,366,341 | |
| | | | |
| | | | |
Distributions to shareholders from | | | | | | | | | | | | | | | | |
Net realized gains | | | | | | | | | | | | | | | | |
Class A | | | | | | | (67,195,832 | ) | | | | | | | (25,776,649 | ) |
Class C | | | | | | | (5,778,904 | ) | | | | | | | (6,863,393 | ) |
Class R6 | | | | | | | (23,478,672 | ) | | | | | | | (17,262,427 | ) |
Administrator Class | | | | | | | (47,459,845 | ) | | | | | | | (50,657,190 | ) |
Institutional Class | | | | | | | (114,235,168 | ) | | | | | | | (106,198,751 | ) |
Investor Class | | | | | | | 0 | 1 | | | | | | | (47,364,646 | ) |
| | | | |
Total distributions to shareholders | | | | | | | (258,148,421 | ) | | | | | | | (254,123,056 | ) |
| | | | |
| | | | |
Capital share transactions | | | Shares | | | | | | | | Shares | | | | | |
Proceeds from shares sold | | | | | | | | | | | | | | | | |
Class A | | | 18,576,523 | | | | 573,833,981 | | | | 2,233,465 | | | | 73,592,537 | |
Class C | | | 85,248 | | | | 2,195,640 | | | | 138,248 | | | | 4,164,875 | |
Class R6 | | | 2,705,304 | | | | 81,981,174 | | | | 2,308,430 | | | | 80,634,658 | |
Administrator Class | | | 1,929,217 | | | | 57,133,826 | | | | 3,535,503 | | | | 118,624,154 | |
Institutional Class | | | 5,696,148 | | | | 169,010,558 | | | | 9,758,577 | | | | 338,209,673 | |
Investor Class | | | 55,579 | 1 | | | 1,728,387 | 1 | | | 1,282,386 | | | | 42,218,844 | |
| | | | |
| | | | | | | 885,883,566 | | | | | | | | 657,444,741 | |
| | | | |
Reinvestment of distributions | | | | | | | | | | | | | | | | |
Class A | | | 2,330,578 | | | | 65,162,949 | | | | 794,342 | | | | 24,513,393 | |
Class C | | | 183,951 | | | | 4,722,020 | | | | 192,115 | | | | 5,525,235 | |
Class R6 | | | 793,466 | | | | 23,478,672 | | | | 533,450 | | | | 17,262,427 | |
Administrator Class | | | 1,650,359 | | | | 47,282,773 | | | | 1,597,396 | | | | 50,349,928 | |
Institutional Class | | | 3,798,743 | | | | 112,214,868 | | | | 3,201,342 | | | | 103,499,406 | |
Investor Class | | | 0 | 1 | | | 0 | 1 | | | 1,517,879 | | | | 46,477,457 | |
| | | | |
| | | | | | | 252,861,282 | | | | | | | | 247,627,846 | |
| | | | |
Payment for shares redeemed | | | | | | | | | | | | | | | | |
Class A | | | (9,136,801 | ) | | | (255,432,871 | ) | | | (3,720,446 | ) | | | (122,265,640 | ) |
Class C | | | (820,726 | ) | | | (21,433,438 | ) | | | (750,393 | ) | | | (22,961,276 | ) |
Class R6 | | | (2,598,689 | ) | | | (77,229,246 | ) | | | (845,623 | ) | | | (29,124,505 | ) |
Administrator Class | | | (8,985,182 | ) | | | (255,827,949 | ) | | | (7,503,991 | ) | | | (251,365,044 | ) |
Institutional Class | | | (12,826,340 | ) | | | (384,667,531 | ) | | | (9,499,972 | ) | | | (326,555,506 | ) |
Investor Class | | | (17,797,151 | )1 | | | (549,387,039 | )1 | | | (4,251,475 | ) | | | (138,396,041 | ) |
| | | | |
| | | | | | | (1,543,978,074 | ) | | | | | | | (890,668,012 | ) |
| | | | |
Net increase (decrease) in net assets resulting from capital share transactions | | | | | | | (405,233,226 | ) | | | | | | | 14,404,575 | |
| | | | |
Total decrease in net assets | | | | | | | (474,836,750 | ) | | | | | | | (158,352,140 | ) |
| | | | |
| | | | |
Net assets | | | | | | | | | | | | | | | | |
Beginning of period | | | | | | | 3,183,382,626 | | | | | | | | 3,341,734,766 | |
| | | | |
End of period | | | | | | $ | 2,708,545,876 | | | | | | | $ | 3,183,382,626 | |
| | | | |
Accumulated net investment loss | | | | | | $ | (9,174,872 | ) | | | | | | $ | (15,952,398 | ) |
| | | | |
| 1 | For the period from October 1, 2015 to October 23, 2015. Effective at the close of business on October 23, 2015, Investor Class shares were converted to Class A shares and are no longer offered by the Fund. |
The accompanying notes are an integral part of these financial statements.
| | | | |
| 16 | | Wells Fargo Discovery Fund | | Financial highlights |
(For a share outstanding throughout each period)
| | | | | | | | | | | | | | | | | | | | |
| | | Year ended September 30 | |
| CLASS A | | 2016 | | | 2015 | | | 2014 | | | 2013 | | | 2012 | |
Net asset value, beginning of period | | | $30.48 | | | | $32.35 | | | | $33.50 | | | | $26.89 | | | | $21.20 | |
Net investment loss | | | (0.18 | )1 | | | (0.24 | ) | | | (0.30 | ) | | | (0.08 | )1 | | | (0.14 | )1 |
Net realized and unrealized gains (losses) on investments | | | 2.23 | | | | 0.96 | | | | 1.36 | | | | 8.14 | | | | 6.82 | |
| | | | | | | | | | | | | | | | | | | | |
Total from investment operations | | | 2.05 | | | | 0.72 | | | | 1.06 | | | | 8.06 | | | | 6.68 | |
Distributions to shareholders from | | | | | | | | | | | | | | | | | | | | |
Net realized gains | | | (2.59 | ) | | | (2.59 | ) | | | (2.21 | ) | | | (1.45 | ) | | | (0.99 | ) |
Net asset value, end of period | | | $29.94 | | | | $30.48 | | | | $32.35 | | | | $33.50 | | | | $26.89 | |
Total return2 | | | 7.33 | % | | | 2.09 | % | | | 3.15 | % | | | 31.86 | % | | | 32.05 | % |
Ratios to average net assets (annualized) | | | | | | | | | | | | | | | | | | | | |
Gross expenses | | | 1.20 | % | | | 1.23 | % | | | 1.25 | % | | | 1.27 | % | | | 1.29 | % |
Net expenses | | | 1.20 | % | | | 1.21 | % | | | 1.22 | % | | | 1.22 | % | | | 1.22 | % |
Net investment loss | | | (0.64 | )% | | | (0.64 | )% | | | (0.95 | )% | | | (0.29 | )% | | | (0.53 | )% |
Supplemental data | | | | | | | | | | | | | | | | | | | | |
Portfolio turnover rate | | | 78 | % | | | 87 | % | | | 84 | % | | | 86 | % | | | 104 | % |
Net assets, end of period (000s omitted) | | | $641,786 | | | | $294,661 | | | | $335,221 | | | | $239,506 | | | | $114,882 | |
| 1 | Calculated based upon average shares outstanding |
| 2 | Total return calculations do not include any sales charges. |
The accompanying notes are an integral part of these financial statements.
| | | | | | |
| Financial highlights | | Wells Fargo Discovery Fund | | | 17 | |
(For a share outstanding throughout each period)
| | | | | | | | | | | | | | | | | | | | |
| | | Year ended September 30 | |
| CLASS C | | 2016 | | | 2015 | | | 2014 | | | 2013 | | | 2012 | |
Net asset value, beginning of period | | | $28.24 | | | | $30.37 | | | | $31.81 | | | | $25.79 | | | | $20.51 | |
Net investment loss | | | (0.37 | )1 | | | (0.43 | )1 | | | (0.35 | ) | | | (0.30 | )1 | | | (0.31 | )1 |
Net realized and unrealized gains (losses) on investments | | | 2.04 | | | | 0.89 | | | | 1.12 | | | | 7.77 | | | | 6.58 | |
| | | | | | | | | | | | | | | | | | | | |
Total from investment operations | | | 1.67 | | | | 0.46 | | | | 0.77 | | | | 7.47 | | | | 6.27 | |
Distributions to shareholders from | | | | | | | | | | | | | | | | | | | | |
Net realized gains | | | (2.59 | ) | | | (2.59 | ) | | | (2.21 | ) | | | (1.45 | ) | | | (0.99 | ) |
Net asset value, end of period | | | $27.32 | | | | $28.24 | | | | $30.37 | | | | $31.81 | | | | $25.79 | |
Total return2 | | | 6.51 | % | | | 1.35 | % | | | 2.33 | % | | | 30.89 | % | | | 31.10 | % |
Ratios to average net assets (annualized) | | | | | | | | | | | | | | | | | | | | |
Gross expenses | | | 1.95 | % | | | 1.98 | % | | | 2.00 | % | | | 2.02 | % | | | 2.04 | % |
Net expenses | | | 1.95 | % | | | 1.96 | % | | | 1.97 | % | | | 1.97 | % | | | 1.97 | % |
Net investment loss | | | (1.41 | )% | | | (1.39 | )% | | | (1.70 | )% | | | (1.08 | )% | | | (1.28 | )% |
Supplemental data | | | | | | | | | | | | | | | | | | | | |
Portfolio turnover rate | | | 78 | % | | | 87 | % | | | 84 | % | | | 86 | % | | | 104 | % |
Net assets, end of period (000s omitted) | | | $49,538 | | | | $66,772 | | | | $84,585 | | | | $48,768 | | | | $16,803 | |
| 1 | Calculated based upon average shares outstanding |
| 2 | Total return calculations do not include any sales charges. |
The accompanying notes are an integral part of these financial statements.
| | | | |
| 18 | | Wells Fargo Discovery Fund | | Financial highlights |
(For a share outstanding throughout each period)
| | | | | | | | | | | | | | | | |
| | | Year ended September 30 | |
| CLASS R6 | | 2016 | | | 2015 | | | 2014 | | | 20131 | |
Net asset value, beginning of period | | | $32.08 | | | | $33.78 | | | | $34.73 | | | | $31.03 | |
Net investment income (loss) | | | (0.07 | ) | | | (0.07 | ) | | | (0.17 | ) | | | 0.02 | 2 |
Net realized and unrealized gains (losses) on investments | | | 2.38 | | | | 0.96 | | | | 1.43 | | | | 3.68 | |
| | | | | | | | | | | | | | | | |
Total from investment operations | | | 2.31 | | | | 0.89 | | | | 1.26 | | | | 3.70 | |
Distributions to shareholders from | | | | | | | | | | | | | | | | |
Net realized gains | | | (2.59 | ) | | | (2.59 | ) | | | (2.21 | ) | | | 0.00 | |
Net asset value, end of period | | | $31.80 | | | | $32.08 | | | | $33.78 | | | | $34.73 | |
Total return3 | | | 7.77 | % | | | 2.53 | % | | | 3.60 | % | | | 11.96 | % |
Ratios to average net assets (annualized) | | | | | | | | | | | | | | | | |
Gross expenses | | | 0.77 | % | | | 0.76 | % | | | 0.77 | % | | | 0.77 | % |
Net expenses | | | 0.77 | % | | | 0.76 | % | | | 0.77 | % | | | 0.77 | % |
Net investment income (loss) | | | (0.22 | )% | | | (0.21 | )% | | | (0.45 | )% | | | 0.30 | % |
Supplemental data | | | | | | | | | | | | | | | | |
Portfolio turnover rate | | | 78 | % | | | 87 | % | | | 84 | % | | | 86 | % |
Net assets, end of period (000s omitted) | | | $300,118 | | | | $273,941 | | | | $221,043 | | | | $28 | |
| 1 | For the period from June 28, 2013 (commencement of class operations) to September 30, 2013 |
| 2 | Calculated based upon average shares outstanding |
| 3 | Returns for periods of less than one year are not annualized. |
The accompanying notes are an integral part of these financial statements.
| | | | | | |
| Financial highlights | | Wells Fargo Discovery Fund | | | 19 | |
(For a share outstanding throughout each period)
| | | | | | | | | | | | | | | | | | | | |
| | | Year ended September 30 | |
| ADMINISTRATOR CLASS | | 2016 | | | 2015 | | | 2014 | | | 2013 | | | 2012 | |
Net asset value, beginning of period | | | $31.17 | | | | $32.99 | | | | $34.08 | | | | $27.30 | | | | $21.50 | |
Net investment loss | | | (0.17 | )1 | | | (0.20 | ) | | | (0.27 | )1 | | | (0.04 | ) | | | (0.12 | )1 |
Net realized and unrealized gains (losses) on investments | | | 2.29 | | | | 0.97 | | | | 1.39 | | | | 8.27 | | | | 6.91 | |
| | | | | | | | | | | | | | | | | | | | |
Total from investment operations | | | 2.12 | | | | 0.77 | | | | 1.12 | | | | 8.23 | | | | 6.79 | |
Distributions to shareholders from | | | | | | | | | | | | | | | | | | | | |
Net realized gains | | | (2.59 | ) | | | (2.59 | ) | | | (2.21 | ) | | | (1.45 | ) | | | (0.99 | ) |
Net asset value, end of period | | | $30.70 | | | | $31.17 | | | | $32.99 | | | | $34.08 | | | | $27.30 | |
Total return | | | 7.40 | % | | | 2.24 | % | | | 3.25 | % | | | 32.01 | % | | | 32.12 | % |
Ratios to average net assets (annualized) | | | | | | | | | | | | | | | | | | | | |
Gross expenses | | | 1.12 | % | | | 1.09 | % | | | 1.08 | % | | | 1.10 | % | | | 1.13 | % |
Net expenses | | | 1.12 | % | | | 1.09 | % | | | 1.08 | % | | | 1.10 | % | | | 1.13 | % |
Net investment loss | | | (0.58 | )% | | | (0.52 | )% | | | (0.81 | )% | | | (0.13 | )% | | | (0.45 | )% |
Supplemental data | | | | | | | | | | | | | | | | | | | | |
Portfolio turnover rate | | | 78 | % | | | 87 | % | | | 84 | % | | | 86 | % | | | 104 | % |
Net assets, end of period (000s omitted) | | | $400,997 | | | | $575,568 | | | | $687,537 | | | | $648,228 | | | | $478,673 | |
| 1 | Calculated based upon average shares outstanding |
The accompanying notes are an integral part of these financial statements.
| | | | |
| 20 | | Wells Fargo Discovery Fund | | Financial highlights |
(For a share outstanding throughout each period)
| | | | | | | | | | | | | | | | | | | | |
| | | Year ended September 30 | |
| INSTITUTIONAL CLASS | | 2016 | | | 2015 | | | 2014 | | | 2013 | | | 2012 | |
Net asset value, beginning of period | | | $32.04 | | | | $33.76 | | | | $34.74 | | | | $27.73 | | | | $21.76 | |
Net investment income (loss) | | | (0.10 | ) | | | (0.09 | ) | | | (0.20 | ) | | | 0.01 | | | | (0.07 | ) |
Net realized and unrealized gains (losses) on investments | | | 2.37 | | | | 0.96 | | | | 1.43 | | | | 8.45 | | | | 7.03 | |
| | | | | | | | | | | | | | | | | | | | |
Total from investment operations | | | 2.27 | | | | 0.87 | | | | 1.23 | | | | 8.46 | | | | 6.96 | |
Distributions to shareholders from | | | | | | | | | | | | | | | | | | | | |
Net realized gains | | | (2.59 | ) | | | (2.59 | ) | | | (2.21 | ) | | | (1.45 | ) | | | (0.99 | ) |
Net asset value, end of period | | | $31.72 | | | | $32.04 | | | | $33.76 | | | | $34.74 | | | | $27.73 | |
Total return | | | 7.68 | % | | | 2.47 | % | | | 3.51 | % | | | 32.36 | % | | | 32.53 | % |
Ratios to average net assets (annualized) | | | | | | | | | | | | | | | | | | | | |
Gross expenses | | | 0.87 | % | | | 0.82 | % | | | 0.82 | % | | | 0.84 | % | | | 0.86 | % |
Net expenses | | | 0.87 | % | | | 0.82 | % | | | 0.82 | % | | | 0.84 | % | | | 0.86 | % |
Net investment income (loss) | | | (0.32 | )% | | | (0.26 | )% | | | (0.54 | )% | | | 0.11 | % | | | (0.19 | )% |
Supplemental data | | | | | | | | | | | | | | | | | | | | |
Portfolio turnover rate | | | 78 | % | | | 87 | % | | | 84 | % | | | 86 | % | | | 104 | % |
Net assets, end of period (000s omitted) | | | $1,316,107 | | | | $1,436,125 | | | | $1,396,603 | | | | $988,615 | | | | $524,506 | |
The accompanying notes are an integral part of these financial statements.
| | | | | | |
| Notes to financial statements | | Wells Fargo Discovery Fund | | | 21 | |
1. ORGANIZATION
Wells Fargo Funds Trust (the “Trust”), a Delaware statutory trust organized on March 10, 1999, is an open-end management investment company registered under the Investment Company Act of 1940, as amended (the “1940 Act”). As an investment company, the Trust follows the accounting and reporting guidance in Financial Accounting Standards Board (“FASB”) Accounting Standards Codification Topic 946, Financial Services – Investment Companies. These financial statements report on the Wells Fargo Discovery Fund (the “Fund”) which is a diversified series of the Trust.
Effective at the close of business on October 23, 2015, Investor Class shares became Class A shares in a tax-free conversion. Shareholders of Investor Class received Class A shares at a value equal to the value of their Investor Class shares immediately prior to the conversion. Investor Class shares are no longer offered by the Fund.
2. SIGNIFICANT ACCOUNTING POLICIES
The following significant accounting policies, which are consistently followed in the preparation of the financial statements of the Fund, are in conformity with U.S. generally accepted accounting principles which require management to make estimates and assumptions that affect the reported amounts of assets and liabilities, disclosure of contingent assets and liabilities at the date of the financial statements, and the reported amounts of revenues and expenses during the reporting period. Actual results could differ from those estimates.
Securities valuation
All investments are valued each business day as of the close of regular trading on the New York Stock Exchange (generally 4 p.m. Eastern Time), although the Fund may deviate from this calculation time under unusual or unexpected circumstances.
Equity securities that are listed on a foreign or domestic exchange or market are valued at the official closing price or, if none, the last sales price. If no sale occurs on the principal exchange or market that day, the prior day’s price will be deemed “stale” and a fair value price will be determined in accordance with the Fund’s Valuation Procedures.
Investments in registered open-end investment companies are valued at net asset value. Interests in non-registered investment vehicles that are redeemable at net asset value are fair valued normally at net asset value.
Investments which are not valued using any of the methods discussed above are valued at their fair value, as determined in good faith by the Board of Trustees of the Fund. The Board of Trustees has established a Valuation Committee comprised of the Trustees and has delegated to it the authority to take any actions regarding the valuation of portfolio securities that the Valuation Committee deems necessary or appropriate, including determining the fair value of portfolio securities, unless the determination has been delegated to the Management Valuation Team of Wells Fargo Funds Management, LLC (“Funds Management”). The Board of Trustees retains the authority to make or ratify any valuation decisions or approve any changes to the Valuation Procedures as it deems appropriate. On a quarterly basis, the Board of Trustees receives reports on any valuation actions taken by the Valuation Committee or the Management Valuation Team which may include items for ratification.
Valuations of fair valued securities are compared to the next actual sales price when available, or other appropriate market values, to assess the continued appropriateness of the fair valuation methodologies used. These securities are fair valued on a day-to-day basis, taking into consideration changes to appropriate market information and any significant changes to the inputs considered in the valuation process until there is a readily available price provided on an exchange or by an independent pricing service. Valuations received from an independent pricing service or independent broker-dealer quotes are periodically validated by comparisons to most recent trades and valuations provided by other independent pricing services in addition to the review of prices by the manager and/or subadviser. Unobservable inputs used in determining fair valuations are identified based on the type of security, taking into consideration factors utilized by market participants in valuing the investment, knowledge about the issuer and the current market environment.
Security loans
The Fund may lend its securities from time to time in order to earn additional income in the form of fees or interest on securities received as collateral or the investment of any cash received as collateral. The Fund continues to receive interest or dividends on the securities loaned. The Fund receives collateral in the form of cash or securities with a value at least equal to the value of the securities on loan. The value of the loaned securities is determined at the close of each business day and any additional required collateral is delivered to the Fund on the next business day. In a securities lending transaction, the net asset value of the Fund will be affected by an increase or decrease in the value of the securities loaned and by an increase or decrease in the value of the instrument in which collateral is invested. The amount of securities lending activity undertaken by the Fund fluctuates from time to time. In the event of default or bankruptcy
| | | | |
| 22 | | Wells Fargo Discovery Fund | | Notes to financial statements |
by the borrower, the Fund may be prevented from recovering the loaned securities or gaining access to the collateral or may experience delays or costs in doing so. In addition, the investment of any cash collateral received may lose all or part of its value. The Fund has the right under the lending agreement to recover the securities from the borrower on demand.
The Fund lends its securities through an unaffiliated securities lending agent. Cash collateral received in connection with its securities lending transactions is invested in Securities Lending Cash Investments, LLC (the “Securities Lending Fund”). The Securities Lending Fund is exempt from registration under Section 3(c)(7) of the 1940 Act and is managed by Funds Management and is subadvised by Wells Capital Management Incorporated (“WellsCap”), an affiliate of Funds Management and an indirect wholly owned subsidiary of Wells Fargo & Company (“Wells Fargo”). Funds Management receives an advisory fee starting at 0.05% and declining to 0.01% as the average daily net assets of the Securities Lending Fund increase. All of the fees received by Funds Management are paid to WellsCap for its services as subadviser. The Securities Lending Fund seeks to provide a positive return compared to the daily Fed Funds Open rate by investing in high-quality, U.S. dollar-denominated short-term money market instruments. Securities Lending Fund investments are fair valued based upon the amortized cost valuation technique. Income earned from investment in the Securities Lending Fund is included in securities lending income on the Statement of Operations.
Security transactions and income recognition
Securities transactions are recorded on a trade date basis. Realized gains or losses are recorded on the basis of identified cost.
Dividend income is recognized on the ex-dividend date. Dividend income is recorded net of foreign taxes withheld where recovery of such taxes is not assured.
Distributions to shareholders
Distributions to shareholders from net investment income and net realized gains, if any, are recorded on the ex-dividend date. Such distributions are determined in conformity with federal income tax regulations, which may differ in amount or character from net investment income and realized gains recognized for purposes of U.S. generally accepted accounting principles.
Federal and other taxes
The Fund intends to continue to qualify as a regulated investment company by distributing substantially all of its investment company taxable income and any net realized capital gains (after reduction for capital loss carryforwards) sufficient to relieve it from all, or substantially all, federal income taxes. Accordingly, no provision for federal income taxes was required.
The Fund’s income and federal excise tax returns and all financial records supporting those returns for the prior three fiscal years are subject to examination by the federal and Delaware revenue authorities. Management has analyzed the Fund’s tax positions taken on federal, state, and foreign tax returns for all open tax years and does not believe that there are any uncertain tax positions that require recognition of a tax liability.
Reclassifications are made to the Fund’s capital accounts for permanent tax differences to reflect income and gains available for distribution (or available capital loss carryforwards) under federal income tax regulations. U.S. generally accepted accounting principles require that certain components of net assets be adjusted to reflect permanent differences between financial and tax reporting. These reclassifications have no effect on net assets or net asset values per share. The primary permanent difference causing such reclassifications is due to net operating losses. At September 30, 2016, as a result of permanent book-to-tax differences, the following reclassification adjustments were made on the Statement of Assets and Liabilities:
| | |
| Paid-in capital | | Accumulated net
investment loss |
| $(20,119,238) | | $20,119,238 |
As of September 30, 2016, the Fund had current year deferred post-October capital losses and a qualified late-year ordinary loss which will both be recognized on the first day of the following fiscal year in the following amounts:
| | |
Deferred post-October capital losses | | Late-year ordinary losses deferred |
| Short-term | |
| $(2,518,523) | | $(9,174,473) |
| | | | | | |
| Notes to financial statements | | Wells Fargo Discovery Fund | | | 23 | |
Class allocations
The separate classes of shares offered by the Fund differ principally in applicable sales charges, distribution, shareholder servicing, and administration fees. Class specific expenses are charged directly to that share class. Investment income, common expenses, and realized and unrealized gains (losses) on investments are allocated daily to each class of shares based on the relative proportion of net assets of each class.
3. FAIR VALUATION MEASUREMENTS
Fair value measurements of investments are determined within a framework that has established a fair value hierarchy based upon the various data inputs utilized in determining the value of the Fund’s investments. The three-level hierarchy gives the highest priority to unadjusted quoted prices in active markets for identical assets or liabilities (Level 1) and the lowest priority to significant unobservable inputs (Level 3). The Fund’s investments are classified within the fair value hierarchy based on the lowest level of input that is significant to the fair value measurement. The inputs are summarized into three broad levels as follows:
| n | | Level 1 – quoted prices in active markets for identical securities |
| n | | Level 2 – other significant observable inputs (including quoted prices for similar securities, interest rates, prepayment speeds, credit risk, use of amortized cost, etc.) |
| n | | Level 3 – significant unobservable inputs (including the Fund’s own assumptions in determining the fair value of investments) |
The inputs or methodologies used for valuing investments in securities are not necessarily an indication of the risk associated with investing in those securities.
The following is a summary of the inputs used in valuing the Fund’s assets and liabilities as of September 30, 2016:
| | | | | | | | | | | | | | | | |
| | | Quoted prices
(Level 1) | | | Other significant
observable inputs
(Level 2) | | | Significant
unobservable inputs (Level 3) | | | Total | |
Assets | | | | | | | | | | | | | | | | |
Investments in: | | | | | | | | | | | | | | | | |
| | | | |
Common stocks | | | | | | | | | | | | | | | | |
Consumer discretionary | | $ | 410,396,879 | | | $ | 0 | | | $ | 0 | | | $ | 410,396,879 | |
Consumer staples | | | 75,311,498 | | | | 0 | | | | 0 | | | | 75,311,498 | |
Energy | | | 25,521,797 | | | | 0 | | | | 0 | | | | 25,521,797 | |
Financials | | | 119,283,014 | | | | 0 | | | | 0 | | | | 119,283,014 | |
Health care | | | 477,499,692 | | | | 0 | | | | 0 | | | | 477,499,692 | |
Industrials | | | 566,185,237 | | | | 0 | | | | 0 | | | | 566,185,237 | |
Information technology | | | 846,411,082 | | | | 0 | | | | 0 | | | | 846,411,082 | |
Materials | | | 74,238,924 | | | | 0 | | | | 0 | | | | 74,238,924 | |
Real estate | | | 32,003,524 | | | | 0 | | | | 0 | | | | 32,003,524 | |
Telecommunication services | | | 66,104,720 | | | | 0 | | | | 0 | | | | 66,104,720 | |
| | | | |
Short-term investments | | | | | | | | | | | | | | | | |
Investment companies | | | 24,767,941 | | | | 0 | | | | 0 | | | | 24,767,941 | |
Investments measured at net asset value* | | | | | | | | | | | | | | | 53,359,685 | |
Total assets | | $ | 2,717,724,308 | | | $ | 0 | | | $ | 0 | | | $ | 2,771,083,993 | |
| * | Investments that are measured at fair value using the net asset value per share (or its equivalent) as a practical expedient have not been categorized in the fair value hierarchy. The fair value amount presented in the table is intended to permit reconciliation of the fair value hierarchy to the amounts presented in the Statement of Assets and Liabilities. The Fund’s investment in Securities Lending Cash Investments, LLC valued at $53,359,685 does not have a redemption period notice, can be redeemed daily and does not have any unfunded commitments. |
The Fund recognizes transfers between levels within the fair value hierarchy at the end of the reporting period. At September 30, 2016, the Fund did not have any transfers into/out of Level 1, Level 2, or Level 3.
| | | | |
| 24 | | Wells Fargo Discovery Fund | | Notes to financial statements |
4. TRANSACTIONS WITH AFFILIATES
Management fee
Funds Management, an indirect wholly owned subsidiary of Wells Fargo, is the manager of the Fund and provides advisory and fund-level administrative services under an investment management agreement. Under the investment management agreement, Funds Management is responsible for, among other services, implementing the investment objectives and strategies of the Fund, supervising the subadviser, providing fund-level administrative services in connection with the Fund’s operations, and providing any other fund-level administrative services reasonably necessary for the operation of the Fund. As compensation for its services under the investment management agreement, Funds Management is entitled to receive an annual management fee starting at 0.80% and declining to 0.63% as the average daily net assets of the Fund increase. For the year ended September 30, 2016, the management fee was equivalent to an annual rate of 0.72% of the Fund’s average daily net assets.
Funds Management has retained the services of a subadviser to provide daily portfolio management to the Fund. The fee for subadvisory services is borne by Funds Management. WellsCap is the subadviser to the Fund and is entitled to receive a fee from Funds Management at an annual rate starting at 0.45% and declining to 0.35% as the average daily net assets of the Fund increase.
Administration fees
Under a class-level administration agreement, Funds Management provides class-level administrative services to the Fund, which includes paying fees and expenses for services provided by the transfer agent, sub-transfer agents, omnibus account servicers and record-keepers. As compensation for its services under the class-level administration agreement, Funds Management receives an annual fee which is calculated based on the average daily net assets of each class as follows:
| | | | |
| | | Class-level
administration fee | |
Class A, Class C | | | 0.21 | % |
Class R6 | | | 0.03 | |
Administrator Class, Institutional Class | | | 0.13 | |
Investor Class | | | 0.32 | |
Funds Management has contractually waived and/or reimbursed management and administration fees to the extent necessary to maintain certain net operating expense ratios for the Fund. Waiver of fees and/or reimbursement of expenses by Funds Management were made first from fund level expenses on a proportionate basis and then from class specific expenses. Funds Management has committed through January 31, 2017 to waive fees and/or reimburse expenses to the extent necessary to cap the Fund’s expenses at 1.22% for Class A shares, 1.97% for Class C shares, 0.84% for Class R6 shares, 1.15% for Administrator Class shares, and 0.89% for Institutional Class shares. After this time, the cap may be increased or the commitment to maintain the cap may be terminated only with the approval of the Board of Trustees.
Distribution fee
The Trust has adopted a distribution plan for Class C shares of the Fund pursuant to Rule 12b-1 under the 1940 Act. A distribution fee is charged to Class C shares and paid to Wells Fargo Funds Distributor, LLC (“Funds Distributor”), the principal underwriter, at an annual rate of 0.75% of the average daily net assets of Class C shares.
In addition, Funds Distributor is entitled to receive the front-end sales charge from the purchase of Class A shares and a contingent deferred sales charge on the redemption of certain Class A shares. Funds Distributor is also entitled to receive the contingent deferred sales charges from redemptions of Class C shares. For the year ended September 30, 2016, Funds Distributor received $2,463 from the sale of Class A shares and $492 in contingent deferred sales charges from redemptions of Class C shares.
Shareholder servicing fees
The Trust has entered into contracts with one or more shareholder servicing agents, whereby Class A, Class C, Administrator Class, and Investor Class of the Fund are charged a fee at an annual rate of 0.25% of the average daily net assets of each respective class.
A portion of these total shareholder servicing fees were paid to affiliates of Wells Fargo.
| | | | | | |
| Notes to financial statements | | Wells Fargo Discovery Fund | | | 25 | |
5. INVESTMENT PORTFOLIO TRANSACTIONS
Purchases and sales of investments, excluding U.S. government obligations (if any) and short-term securities, for the year ended September 30, 2016 were $2,230,748,147 and $ 2,848,925,414, respectively.
The Fund may purchase or sell investment securities to other Wells Fargo funds under procedures adopted by the Board of Trustees. The procedures have been designed to ensure that these interfund transactions, which generally do not incur broker commissions, are effected at current market prices. Interfund trades are included within the respective purchases and sales amounts shown.
6. BANK BORROWINGS
The Trust (excluding the money market funds and certain other funds) and Wells Fargo Variable Trust are parties to a $250,000,000 revolving credit agreement whereby the Fund is permitted to use bank borrowings for temporary or emergency purposes, such as to fund shareholder redemption requests. Interest under the credit agreement is charged to the Fund based on a borrowing rate equal to the higher of the Federal Funds rate in effect on that day plus 1.25% or the overnight LIBOR rate in effect on that day plus 1.25%. In addition, an annual commitment fee equal to 0.25% of the unused balance is allocated to each participating fund. Prior to August 30, 2016, the revolving credit agreement amount was $200,000,000 and the annual commitment fee was equal to 0.20% of the unused balance which was allocated to each participating fund.
For the year ended September 30, 2016, there were no borrowings by the Fund under the agreement.
7. DISTRIBUTIONS TO SHAREHOLDERS
The tax character of distributions paid was $258,148,421 and $254,123,056 of long-term capital gain for the years ended September 30, 2016 and September 30, 2015, respectively.
As of September 30, 2016, the components of distributable earnings on a tax basis were as follows:
| | | | |
Unrealized gains | | Late-year ordinary losses deferred | | Post-October capital losses deferred |
| $442,183,709 | | $(9,174,473) | | $(2,518,523) |
8. CONCENTRATION RISK
Concentration risks result from exposure to a limited number of sectors. A fund that invests a substantial portion of its assets in any sector may be more affected by changes in that sector than would be a fund whose investments are not heavily weighted in any sector.
9. INDEMNIFICATION
Under the Trust’s organizational documents, the officers and Trustees have been granted certain indemnification rights against certain liabilities that may arise out of performance of their duties to the Trust. Additionally, in the normal course of business, the Trust may enter into contracts with service providers that contain a variety of indemnification clauses. The Trust’s maximum exposure under these arrangements is dependent on future claims that may be made against the Fund and, therefore, cannot be estimated.
| | | | |
| 26 | | Wells Fargo Discovery Fund | | Report of independent registered public accounting firm |
BOARD OF TRUSTEES AND SHAREHOLDERS OF WELLS FARGO FUNDS TRUST:
We have audited the accompanying statement of assets and liabilities, including the portfolio of investments, of the Wells Fargo Discovery Fund (formerly known as Wells Fargo Advantage Discovery Fund) (the “Fund”), one of the funds constituting the Wells Fargo Funds Trust, as of September 30, 2016, and the related statement of operations for the year then ended, the statements of changes in net assets for each of the years in the two-year period then ended, and the financial highlights for each of the years or periods in the five-year period then ended. These financial statements and financial highlights are the responsibility of the Fund’s management. Our responsibility is to express an opinion on these financial statements and financial highlights based on our audits.
We conducted our audits in accordance with the standards of the Public Company Accounting Oversight Board (United States). Those standards require that we plan and perform the audit to obtain reasonable assurance about whether the financial statements and financial highlights are free of material misstatement. An audit includes examining, on a test basis, evidence supporting the amounts and disclosures in the financial statements. Our procedures included confirmation of securities owned as of September 30, 2016, by correspondence with the custodian and brokers, or by other appropriate auditing procedures. An audit also includes assessing the accounting principles used and significant estimates made by management, as well as evaluating the overall financial statement presentation. We believe that our audits provide a reasonable basis for our opinion.
In our opinion, the financial statements and financial highlights referred to above present fairly, in all material respects, the financial position of the Wells Fargo Discovery Fund as of September 30, 2016, the results of its operations for the year then ended, the changes in its net assets for each of the years in the two-year period then ended, and the financial highlights for each of the years or periods in the five-year period then ended, in conformity with U.S. generally accepted accounting principles.

Boston, Massachusetts
November 23, 2016
| | | | | | |
| Other information (unaudited) | | Wells Fargo Discovery Fund | | | 27 | |
TAX INFORMATION
Pursuant to Section 852 of the Internal Revenue Code, $258,148,421 was designated as a 20% rate gain distribution for the fiscal year ended September 30, 2016.
PROXY VOTING INFORMATION
A description of the policies and procedures that the Fund uses to determine how to vote proxies relating to portfolio securities is available, upon request, by calling 1-800-222-8222, visiting our website at wellsfargofunds.com, or visiting the SEC website at sec.gov. Information regarding how the Fund voted proxies relating to portfolio securities during the most recent 12-month period ended June 30 is available on the Fund’s website at wellsfargofunds.com or by visiting the SEC website at sec.gov.
PORTFOLIO HOLDINGS INFORMATION
The complete portfolio holdings for the Fund are publicly available monthly on the Fund’s website (wellsfargofunds.com), on a one-month delayed basis. In addition, top ten holdings information (excluding derivative positions) for the Fund is publicly available on the Fund’s website on a monthly, seven-day or more delayed basis. The Fund files its complete schedule of portfolio holdings with the SEC for the first and third quarters of each fiscal year on Form N-Q, which is available by visiting the SEC website at sec.gov. In addition, the Fund’s Form N-Q may be reviewed and copied at the SEC’s Public Reference Room in Washington, DC, and at regional offices in New York City, at 233 Broadway, and in Chicago, at 175 West Jackson Boulevard, Suite 900. Information about the Public Reference Room may be obtained by calling 1-800-SEC-0330.
| | | | |
| 28 | | Wells Fargo Discovery Fund | | Other information (unaudited) |
BOARD OF TRUSTEES AND OFFICERS
Each of the Trustees and Officers1 listed in the table below acts in identical capacities for each fund in the Wells Fargo family of funds, which consists of 138 mutual funds comprising the Wells Fargo Funds Trust, Wells Fargo Variable Trust, Wells Fargo Master Trust and four closed-end funds (collectively the “Fund Complex”). This table should be read in conjunction with the Prospectus and the Statement of Additional Information2. The mailing address of each Trustee and Officer is 525 Market Street, 12th Floor, San Francisco, CA 94105. Each Trustee and Officer serves an indefinite term, however, each Trustee serves such term until reaching the mandatory retirement age established by the Trustees.
Independent Trustees
| | | | | | |
Name and year of birth | | Position held and length of service* | | Principal occupations during past five years or longer | | Current other public company or
investment company
directorships |
William R. Ebsworth
(Born 1957) | | Trustee, since 2015 | | Retired. From 1984 to 2013, equities analyst, portfolio manager, research director and chief financial officer at Fidelity Management and Research Company in Boston, Tokyo, and Hong Kong and retired in 2013 as Chief Investment Officer of Fidelity Strategic Advisers, Inc. where he lead a team of investment professionals managing client assets. Prior thereto, Board member of Hong Kong Securities Clearing Co., Hong Kong Options Clearing Corp., the Thailand International Fund, Ltd., Fidelity Investments Life Insurance Company, and Empire Fidelity Investments Life Insurance Company. Mr. Ebsworth is a CFA® charterholder and an Adjunct Lecturer, Finance, at Babson College. | | Asset Allocation Trust |
Jane A. Freeman
(Born 1953) | | Trustee, since 2015 | | Retired. From 2012 to 2014 and 1999 to 2008, Chief Financial Officer of Scientific Learning Corporation. From 2008 to 2012, Ms. Freeman provided consulting services related to strategic business projects. Prior to 1999, Portfolio Manager at Rockefeller & Co. and Scudder, Stevens & Clark. Board member of the Harding Loevner Funds from 1996 to 2014, serving as both Lead Independent Director and chair of the Audit Committee. Board member of the Russell Exchange Traded Funds Trust from 2011 to 2012 and the chair of the Audit Committee. Ms. Freeman is a Board Member of Ruth Bancroft Garden (non-profit organization) and an inactive chartered financial analyst. | | Asset Allocation Trust |
Peter G. Gordon
(Born 1942) | | Trustee, since 1998; Chairman, since 2005 | | Co-Founder, Retired Chairman, President and CEO of Crystal Geyser Water Company. Trustee Emeritus, Colby College. | | Asset Allocation Trust |
Isaiah Harris, Jr. (Born 1952) | | Trustee, since 2009 | | Retired. Chairman of the Board of CIGNA Corporation since 2009, and Director since 2005. From 2003 to 2011, Director of Deluxe Corporation. Prior thereto, President and CEO of BellSouth Advertising and Publishing Corp. from 2005 to 2007, President and CEO of BellSouth Enterprises from 2004 to 2005 and President of BellSouth Consumer Services from 2000 to 2003. Emeritus member of the Iowa State University Foundation Board of Governors. Emeritus Member of the Advisory Board of Iowa State University School of Business. Advisory Board Member, Palm Harbor Academy (charter school). Advisory Board Member, Child Evangelism Fellowship (non-profit). Mr. Harris is a certified public accountant (inactive status). | | CIGNA Corporation; Asset Allocation Trust |
Judith M. Johnson (Born 1949) | | Trustee, since 2008; Audit Committee Chairman, since 2008 | | Retired. Prior thereto, Chief Executive Officer and Chief Investment Officer of Minneapolis Employees Retirement Fund from 1996 to 2008. Ms. Johnson is an attorney, certified public accountant and a certified managerial accountant. | | Asset Allocation Trust |
David F. Larcker (Born 1950) | | Trustee, since 2009 | | James Irvin Miller Professor of Accounting at the Graduate School of Business, Stanford University, Director of the Corporate Governance Research Initiative and Senior Faculty of The Rock Center for Corporate Governance since 2006. From 2005 to 2008, Professor of Accounting at the Graduate School of Business, Stanford University. Prior thereto, Ernst & Young Professor of Accounting at The Wharton School, University of Pennsylvania from 1985 to 2005. | | Asset Allocation Trust |
| | | | | | |
| Other information (unaudited) | | Wells Fargo Discovery Fund | | | 29 | |
| | | | | | |
Name and year of birth | | Position held and length of service* | | Principal occupations during past five years or longer | | Current other public company or
investment company
directorships |
Olivia S. Mitchell (Born 1953) | | Trustee, since 2006 | | International Foundation of Employee Benefit Plans Professor, Wharton School of the University of Pennsylvania since 1993. Director of Wharton’s Pension Research Council and Boettner Center on Pensions & Retirement Research, and Research Associate at the National Bureau of Economic Research. Previously, Cornell University Professor from 1978 to 1993. | | Asset Allocation Trust |
Timothy J. Penny (Born 1951) | | Trustee, since 1996 | | President and Chief Executive Officer of Southern Minnesota Initiative Foundation, a non-profit organization, since 2007 and Senior Fellow at the Humphrey Institute Policy Forum at the University of Minnesota since 1995. Member of the Board of Trustees of NorthStar Education Finance, Inc., a non-profit organization, since 2007. | | Asset Allocation Trust |
Michael S. Scofield (Born 1943) | | Trustee, since 2010 | | Served on the Investment Company Institute’s Board of Governors and Executive Committee from 2008-2011 as well the Governing Council of the Independent Directors Council from 2006-2011 and the Independent Directors Council Executive Committee from 2008-2011. Chairman of the IDC from 2008-2010. Institutional Investor (Fund Directions) Trustee of Year in 2007. Trustee of the Evergreen Funds complex (and its predecessors) from 1984 to 2010. Chairman of the Evergreen Funds from 2000-2010. Former Trustee of the Mentor Funds. Retired Attorney, Law Offices of Michael S. Scofield. | | Asset Allocation Trust |
| * | Length of service dates reflect the Trustee’s commencement of service with the Trust’s predecessor entities, where applicable. |
Officers
| | | | | | |
Name and year of birth | | Position held and
length of service | | Principal occupations during past five years or longer | | |
Karla M. Rabusch (Born 1959) | | President, since 2003 | | Executive Vice President of Wells Fargo Bank, N.A. and President of Wells Fargo Funds Management, LLC since 2003. | | |
Nancy Wiser1 (Born 1967) | | Treasurer, since 2012 | | Executive Vice President of Wells Fargo Funds Management, LLC since 2011. Chief Operating Officer and Chief Compliance Officer at LightBox Capital Management LLC, from 2008 to 2011. | | |
C. David Messman (Born 1960) | | Secretary, since 2000; Chief Legal Officer, since 2003 | | Senior Vice President and Secretary of Wells Fargo Funds Management, LLC since 2001. Assistant General Counsel of Wells Fargo Bank, N.A. since 2013 and Vice President and Managing Counsel of Wells Fargo Bank, N.A. from 1996 to 2013. | | |
Michael Whitaker (Born 1967) | | Chief Compliance Officer, since 20163 | | Executive Vice President of Wells Fargo Funds Management, LLC since 2016. Chief Compliance Officer of Fidelity’s Fixed Income Funds and Asset Allocation Funds from 2008 to 2016, Compliance Officer of FMR Co., Inc. from 2014 to 2016, Fidelity Investments Money Management, Inc. from 2014 to 2016, Fidelity Investments from 2007 to 2016. | | |
David Berardi (Born 1975) | | Assistant Treasurer, since 2009 | | Vice President of Wells Fargo Funds Management, LLC since 2009. Vice President of Evergreen Investment Management Company, LLC from 2008 to 2010. Manager of Fund Reporting and Control for Evergreen Investment Management Company, LLC from 2004 to 2010. | | |
Jeremy DePalma1 (Born 1974) | | Assistant Treasurer, since 2009 | | Senior Vice President of Wells Fargo Funds Management, LLC since 2009. Senior Vice President of Evergreen Investment Management Company, LLC from 2008 to 2010 and head of the Fund Reporting and Control Team within Fund Administration from 2005 to 2010. | | |
| 1 | Nancy Wiser acts as Treasurer of 70 funds in the Fund Complex. Jeremy DePalma acts as Treasurer of 68 funds and Assistant Treasurer of 70 funds in the Fund Complex. |
| 2 | The Statement of Additional Information includes additional information about the Trustees and is available, without charge, upon request, by calling
1-800-222-8222 or by visiting the website at wellsfargofunds.com. |
| 3 | Michael Whitaker became Chief Compliance Officer effective May 16, 2016. |
| | | | |
| 30 | | Wells Fargo Discovery Fund | | Other information (unaudited) |
BOARD CONSIDERATION OF INVESTMENT MANAGEMENT AND SUB-ADVISORY AGREEMENTS:
Under the Investment Company Act of 1940 (the “1940 Act”), the Board of Trustees (the “Board”) of Wells Fargo Funds Trust (the “Trust”) must determine annually whether to approve the continuation of the Trust’s investment management and sub-advisory agreements. In this regard, at an in-person meeting held on May 24-25, 2016 (the “Meeting”), the Board, all the members of which have no direct or indirect interest in the investment management and sub-advisory agreements and are not “interested persons” of the Trust, as defined in the 1940 Act (the “Independent Trustees”), reviewed and approved for Wells Fargo Discovery Fund (the “Fund”): (i) an investment management agreement (the “Management Agreement”) with Wells Fargo Funds Management, LLC (“Funds Management”); and (ii) an investment sub-advisory agreement (the “Sub-Advisory Agreement”) with Wells Capital Management Incorporated (the “Sub-Adviser”), an affiliate of Funds Management. The Management Agreement and the Sub-Advisory Agreement are collectively referred to as the “Advisory Agreements.”
At the Meeting, the Board considered the factors and reached the conclusions described below relating to the selection of Funds Management and the Sub-Adviser and the approval of the Advisory Agreements. Prior to the Meeting, including at an in-person meeting in April 2016, the Trustees conferred extensively among themselves and with representatives of Funds Management about these matters. Also, the Board has adopted a team-based approach, with each team consisting of a sub-set of Trustees, to assist the full Board in the discharge of its duties in reviewing performance and other matters throughout the year. The Independent Trustees were assisted in their evaluation of the Advisory Agreements by independent legal counsel, from whom they received separate legal advice and with whom they met separately.
In providing information to the Board, Funds Management and the Sub-Adviser were guided by a detailed set of requests for information submitted to them by independent legal counsel on behalf of the Independent Trustees at the start of the Board’s annual contract renewal process earlier in 2016. In considering and approving the Advisory Agreements, the Trustees considered the information they believed relevant, including but not limited to the information discussed below. The Board considered not only the specific information presented in connection with the Meeting, but also the knowledge gained over time through interaction with Funds Management and the Sub-Adviser about various topics. In this regard, the Board reviewed reports of Funds Management at each of its quarterly meetings, which included, among other things, portfolio reviews and performance reports. In addition, the Board and the teams mentioned above confer with portfolio managers at various times throughout the year. The Board did not identify any particular information or consideration that was all-important or controlling, and each individual Trustee may have attributed different weights to various factors.
After its deliberations, the Board unanimously approved the continuation of the Advisory Agreements for a one-year term and determined that the compensation payable to Funds Management and the Sub-Adviser under each of the Advisory Agreements was reasonable. The Board considered the approval of the Advisory Agreements for the Fund as part of its consideration of agreements for funds across the complex, but its approvals were made on a fund-by-fund basis. The following summarizes a number of important, but not necessarily all, factors considered by the Board in support of its approvals.
Nature, extent and quality of services
The Board received and considered various information regarding the nature, extent and quality of services provided to the Fund by Funds Management and the Sub-Adviser under the Advisory Agreements. This information included a description of the investment advisory services and Fund-level administrative services covered by the Management Agreement, as well as, among other things, a summary of the background and experience of senior management of Funds Management, and the qualifications, background, tenure and responsibilities of each of the portfolio managers primarily responsible for the day-to-day portfolio management of the Fund.
The Board evaluated the ability of Funds Management and the Sub-Adviser to attract and retain qualified investment professionals, including research, advisory and supervisory personnel. The Board further considered the compliance programs and compliance records of Funds Management and the Sub-Adviser. In addition, the Board took into account the full range of services provided to the Fund by Funds Management and its affiliates.
Fund performance and expenses
The Board considered the performance results for the Fund over various time periods ended December 31, 2015. The Board considered these results in comparison to the performance of funds in a universe that was determined by Broadridge Inc. (“Broadridge”) to be similar to the Fund (the “Universe”), and in comparison to the Fund’s benchmark index and to other comparative data. Broadridge is an independent provider of investment company data. The Board received a description of the methodology used by Broadridge to select the mutual funds in the performance Universe.
| | | | | | |
| Other information (unaudited) | | Wells Fargo Discovery Fund | | | 31 | |
The Board noted that the performance of the Fund (Administrator Class A) was higher than or in range of the average performance of the Universe for all periods under review except the three-year period. The Board also noted that the performance of the Fund was lower than its benchmark, the Russell 2500TM Growth Index, for all periods under review except the ten-year period.
The Board also received and considered information regarding the Fund’s net operating expense ratios and their various components, including actual management fees, custodian and other non-management fees, and Rule 12b-1 and non-Rule 12b-1 shareholder service fees. The Board considered these ratios in comparison to the median ratios of funds in class-specific expense groups that were determined by Broadridge to be similar to the Fund (the “Groups”). The Board received a description of the methodology used by Broadridge to select the mutual funds in the expense Groups and an explanation of how funds comprising expense groups and their expense ratios may vary from year-to-year. Based on the Broadridge reports, the Board noted that the net operating expense ratios of the Fund were lower than the median net operating expense ratios of the expense Groups.
The Board took into account the Fund performance and expense information provided to it among the factors considered in deciding to re-approve the Advisory Agreements.
Investment management and sub-advisory fee rates
The Board reviewed and considered the contractual fee rates payable by the Fund to Funds Management under the Management Agreement, as well as the contractual fee rates payable by the Fund to Funds Management for class-level administrative services under a Class-Level Administration Agreement, which include class-level transfer agency and sub-transfer agency costs (collectively, the “Management Rates”). The Board also reviewed and considered the contractual investment sub-advisory fee rates that are payable by Funds Management to the Sub-Adviser for investment sub-advisory services.
Among other information reviewed by the Board was a comparison of the Fund’s Management Rates with the average contractual investment management fee rates of funds in the expense Groups at a common asset level as well as transfer agency costs of the funds in the expense Groups. The Board noted that the Management Rates of the Fund were lower than or in range of the sum of these average rates for the Fund’s expense Groups for all share classes.
The Board also received and considered information about the portion of the total advisory fee that was retained by Funds Management after payment of the fee to the Sub-Adviser for sub-advisory services. In assessing the reasonableness of this amount, the Board received and evaluated information about the nature and extent of responsibilities retained and risks assumed by Funds Management and not delegated to or assumed by the Sub-Adviser, and about Funds Management’s on-going oversight services. However, given the affiliation between Funds Management and the Sub-Adviser, the Board ascribed limited relevance to the allocation of fees between them.
The Board also received and considered information about the nature and extent of services offered and fee rates charged by Funds Management and the Sub-Adviser to other types of clients with investment strategies similar to those of the Fund. In this regard, the Board received information about the significantly greater scope of services, and compliance, reporting and other legal burdens and risks of managing mutual funds compared with those associated with managing assets of non-mutual fund clients such as collective funds or institutional separate accounts.
Based on its consideration of the factors and information it deemed relevant, including those described here, the Board determined that the compensation payable to Funds Management under the Management Agreement and to the Sub-Adviser under the Sub-Advisory Agreement was reasonable, in light of the services covered by the Advisory Agreements.
Profitability
The Board received and considered information concerning the profitability of Funds Management, as well as the profitability of Wells Fargo as a whole, from providing services to the Fund and the fund family as a whole. The Board also received and considered information concerning the profitability of the Sub-Adviser from providing services to the fund family as a whole, noting that the Sub-Adviser’s profitability information with respect to providing services to the Fund was subsumed in the Wells Fargo and Funds Management profitability analysis.
Funds Management reported on the methodologies and estimates used in calculating profitability. Among other things, the Board noted that the levels of profitability reported on a fund-by-fund basis varied widely, depending on factors such as the size and type of fund. Based on its review, the Board did not deem the profits reported by Funds Management or Wells Fargo from its services to the Fund to be at a level that would prevent it from approving the continuation of the Advisory Agreements.
| | | | |
| 32 | | Wells Fargo Discovery Fund | | Other information (unaudited) |
Economies of scale
With respect to possible economies of scale, the Board noted the existence of breakpoints in the Fund’s management fee structure, which operate generally to reduce the Fund’s expense ratios as the Fund grows in size. It considered that, for a small fund or a fund that shrinks in size, breakpoints conversely can result in higher fee levels. The Board also considered that fee waiver and expense reimbursement arrangements and competitive fee rates at the outset are means of sharing potential economies of scale with shareholders of the Fund and the fund family as a whole. The Board considered Funds Management’s view that any analyses of potential economies of scale in managing a particular fund are inherently limited in light of the joint and common costs and investments that Funds Management incurs across the fund family as a whole.
The Board concluded that the Fund’s fee and expense arrangements, including contractual breakpoints, constituted a reasonable approach to sharing potential economies of scale with the Fund and its shareholders.
Other benefits to Funds Management and the Sub-Adviser
The Board received and considered information regarding potential “fall-out” or ancillary benefits received by Funds Management and its affiliates, including the Sub-Adviser, as a result of their relationships with the Fund. Ancillary benefits could include, among others, benefits directly attributable to other relationships with the Fund and benefits potentially derived from an increase in Funds Management’s and the Sub-Adviser’s business as a result of their relationships with the Fund. The Board noted that various affiliates of Funds Management may receive distribution-related fees, shareholder servicing payments and sub-transfer agency fees in respect of shares sold or held through them and services provided.
The Board also reviewed information about soft dollar credits earned and utilized by the Sub-Adviser, fees earned by Funds Management and the Sub-Adviser from managing a private investment vehicle for the fund family’s securities lending collateral and commissions earned by an affiliated broker from portfolio transactions.
Based on its consideration of the factors and information it deemed relevant, including those described here, the Board did not find that any ancillary benefits received by Funds Management and its affiliates, including the Sub-Adviser, were unreasonable.
Conclusion
At the Meeting, after considering the above-described factors and based on its deliberations and its evaluation of the information described above, the Board unanimously approved the continuation of the Advisory Agreements for a one-year term and determined that the compensation payable to Funds Management and the Sub-Adviser under each of the Advisory Agreements was reasonable.
| | | | | | |
| List of abbreviations | | Wells Fargo Discovery Fund | | | 33 | |
The following is a list of common abbreviations for terms and entities that may have appeared in this report.
| ACA | — ACA Financial Guaranty Corporation |
| ADR | — American depositary receipt |
| ADS | — American depositary shares |
| AGC | — Assured Guaranty Corporation |
| AGM | — Assured Guaranty Municipal |
| Ambac | — Ambac Financial Group Incorporated |
| AMT | — Alternative minimum tax |
| BAN | — Bond anticipation notes |
| BHAC | — Berkshire Hathaway Assurance Corporation |
| CAB | — Capital appreciation bond |
| CCAB | — Convertible capital appreciation bond |
| CDA | — Community Development Authority |
| CDO | — Collateralized debt obligation |
| DRIVER | — Derivative inverse tax-exempt receipts |
| DW&P | — Department of Water & Power |
| DWR | — Department of Water Resources |
| ECFA | — Educational & Cultural Facilities Authority |
| EDA | — Economic Development Authority |
| EDFA | — Economic Development Finance Authority |
| ETF | — Exchange-traded fund |
| FDIC | — Federal Deposit Insurance Corporation |
| FFCB | — Federal Farm Credit Banks |
| FGIC | — Financial Guaranty Insurance Corporation |
| FHA | — Federal Housing Administration |
| FHLB | — Federal Home Loan Bank |
| FHLMC | — Federal Home Loan Mortgage Corporation |
| FICO | — The Financing Corporation |
| FNMA | — Federal National Mortgage Association |
| GDR | — Global depositary receipt |
| GNMA | — Government National Mortgage Association |
| HCFR | — Healthcare facilities revenue |
| HEFA | — Health & Educational Facilities Authority |
| HEFAR | — Higher education facilities authority revenue |
| HFA | — Housing Finance Authority |
| HFFA | — Health Facilities Financing Authority |
| HUD | — Department of Housing and Urban Development |
| IDA | — Industrial Development Authority |
| IDAG | — Industrial Development Agency |
| KRW | — Republic of Korea won |
| LIBOR | — London Interbank Offered Rate |
| LIFER | — Long Inverse Floating Exempt Receipts |
| LLC | — Limited liability company |
| LLLP | — Limited liability limited partnership |
| LLP | — Limited liability partnership |
| MBIA | — Municipal Bond Insurance Association |
| MFHR | — Multifamily housing revenue |
| MSTR | — Municipal securities trust receipts |
| MUD | — Municipal Utility District |
| National | — National Public Finance Guarantee Corporation |
| PCFA | — Pollution Control Financing Authority |
| PCL | — Public Company Limited |
| PCR | — Pollution control revenue |
| PFA | — Public Finance Authority |
| PFFA | — Public Facilities Financing Authority |
| PFOTER | — Puttable floating option tax-exempt receipts |
| plc | — Public limited company |
| PUTTER | — Puttable tax-exempt receipts |
| R&D | — Research & development |
| Radian | — Radian Asset Assurance |
| RAN | — Revenue anticipation notes |
| RDA | — Redevelopment Authority |
| RDFA | — Redevelopment Finance Authority |
| REIT | — Real estate investment trust |
| ROC | — Reset option certificates |
| SAVRS | — Select auction variable rate securities |
| SBA | — Small Business Authority |
| SDR | — Swedish depositary receipt |
| SFHR | — Single-family housing revenue |
| SFMR | — Single-family mortgage revenue |
| SPA | — Standby purchase agreement |
| SPDR | — Standard & Poor’s Depositary Receipts |
| SPEAR | — Short Puttable Exempt Adjustable Receipts |
| STRIPS | — Separate trading of registered interest and |
| TAN | — Tax anticipation notes |
| TIPS | — Treasury inflation-protected securities |
| TRAN | — Tax revenue anticipation notes |
| TTFA | — Transportation Trust Fund Authority |
| TVA | — Tennessee Valley Authority |
This page is intentionally left blank.
This page is intentionally left blank.
This page is intentionally left blank.

For more information
More information about Wells Fargo Funds is available free upon request. To obtain literature, please write, email, visit the Fund’s website, or call:
Wells Fargo Funds
P.O. Box 8266
Boston, MA 02266-8266
Email: fundservice@wellsfargo.com
Website: wellsfargofunds.com
Individual investors: 1-800-222-8222
Retail investment professionals: 1-888-877-9275
Institutional investment professionals: 1-866-765-0778
This report and the financial statements contained herein are submitted for the general information of the shareholders of the Fund. If this report is used for promotional purposes, distribution of the report must be accompanied or preceded by a current prospectus. Before investing, please consider the investment objectives, risks, charges, and expenses of the investment. For a current prospectus and, if available, a summary prospectus, containing this information, call 1-800-222-8222 or visit the Fund’s website at wellsfargofunds.com. Read the prospectus carefully before you invest or send money.
Wells Fargo Asset Management (WFAM) is a trade name used by the asset management businesses of Wells Fargo & Company. Wells Fargo Funds Management, LLC, a wholly owned subsidiary of Wells Fargo & Company, provides investment advisory and administrative services for Wells Fargo Funds. Other affiliates of Wells Fargo & Company provide subadvisory and other services for the funds. The funds are distributed by Wells Fargo Funds Distributor, LLC, Member FINRA, an affiliate of Wells Fargo & Company. Neither Wells Fargo Funds Management nor Wells Fargo Funds Distributor has Fund customer accounts/assets, and neither provides investment advice/recommendations or acts as an investment advice fiduciary to any investor.
NOT FDIC INSURED ¡ NO BANK GUARANTEE ¡ MAY LOSE VALUE
© 2016 Wells Fargo Funds Management, LLC. All rights reserved.
| | |
 | | 246394 11-16 A230/AR230 09-16 |
Annual Report
September 30, 2016

Wells Fargo Enterprise Fund


Reduce clutter. Save trees.
Sign up for electronic delivery of prospectuses and shareholder reports at wellsfargo.com/advantagedelivery
Contents
The views expressed and any forward-looking statements are as of September 30, 2016, unless otherwise noted, and are those of the Fund managers and/or Wells Fargo Funds Management, LLC. Discussions of individual securities, or the markets generally, or any Wells Fargo Fund are not intended as individual recommendations. Future events or results may vary significantly from those expressed in any forward-looking statements. The views expressed are subject to change at any time in response to changing circumstances in the market. Wells Fargo Funds Management, LLC and the Fund disclaim any obligation to publicly update or revise any views expressed or forward-looking statements.
NOT FDIC INSURED ¡ NO BANK GUARANTEE ¡ MAY LOSE VALUE
| | | | |
| 2 | | Wells Fargo Enterprise Fund | | Letter to shareholders (unaudited) |

Karla M. Rabusch
President
Wells Fargo Funds
Dear Shareholder:
We are pleased to offer you this annual report for the Wells Fargo Enterprise Fund for the 12-month period that ended September 30, 2016. During this period, which began October 1, 2015, U.S. and international stock markets experienced bouts of heightened volatility, with intermittent sell-offs interspersed with rebounds. Despite market fluctuations throughout the year, U.S. small-, mid-, and large-cap stocks delivered double-digit positive results overall for the 12-month reporting period, as measured by the Russell 2000® Index,1 the Russell Midcap® Index,2 and the Russell 1000® Index,3 respectively. Small-cap U.S. stocks performed best, followed by large- and mid-cap stocks. International stocks overall also delivered positive results for the period.
Despite ongoing concerns, U.S. stocks generally rose in the fourth quarter of 2015; international markets lagged.
While U.S. stocks overall delivered favorable results in the quarter, stock markets outside the U.S. failed to keep pace as economic concerns, including China’s ongoing slowdown, continued to affect many countries. U.S. economic data released during the quarter indicated the economy remained solid, although the strong U.S. dollar and weakness in international economies remained headwinds. In December, the Federal Reserve (Fed), as expected, raised its target interest rate by 25 basis points (100 basis points equals 1.00%) after keeping it near zero for seven years. The move reflected confidence in the U.S. economy’s ability to stay healthy with less central-bank support. The Fed also clarified that future interest-rate increases would be gradual.
In the first quarter of 2016, market volatility increased globally amid ongoing concerns.
Stock markets worldwide fluctuated widely in the first quarter of 2016. Most sold off sharply in the first six weeks of the year on concerns such as weak global growth, falling commodity prices, and uncertainty over the timing and impact of the Fed’s interest-rate increases. As the quarter progressed, fears abated somewhat and global markets generally rallied. The U.S. economy ended the quarter on a positive note as much of the quarter’s data reflected resiliency. With ongoing uncertainties about global growth and financial markets, however, the Fed held off from raising the target interest rate during the quarter. Outside the U.S., the eurozone fell into deflation in February; in response, the European Central Bank (ECB) announced an expansion of its stimulus program. In China, the government in March set an anticipated growth rate of 6.5% to 7.0% for 2016, an acknowledgment of weakening growth. In emerging markets, although central-bank stimulus and improved prices for oil and other commodities led to stock-market rallies in the quarter, many of these countries’ economies face the potential of credit downgrades due to challenges such as the likelihood of a stronger U.S. dollar, which would make dollar-denominated debt more expensive.
Worries over interest rates and the U.K.’s Brexit vote largely drove markets during the second quarter of 2016.
U.S. stocks began the quarter in positive territory but started to lose steam in early May on worries that a possible June interest-rate increase by the Fed could hurt
| 1 | The Russell 2000® Index measures the performance of the 2,000 smallest companies in the Russell 3000® Index, which represents approximately 8% of the total market capitalization of the Russell 3000® Index. You cannot invest directly in an index. |
| 2 | The Russell Midcap® Index measures the performance of the 800 smallest companies in the Russell 1000® Index, which represent approximately 25% of the total market capitalization of the Russell 1000® Index. You cannot invest directly in an index. |
| 3 | The Russell 1000® Index measures the performance of the 1,000 largest companies in the Russell 3000® Index, which represents approximately 92% of the total market capitalization of the Russell 3000® Index. You cannot invest directly in an index. |
| | | | | | |
| Letter to shareholders (unaudited) | | Wells Fargo Enterprise Fund | | | 3 | |
the market. In mid-May, stocks briefly plunged following comments by Fed officials noting that a June interest-rate increase remained on the table. But once investors had processed this information, stocks again rallied, finishing up for the month. The first three weeks of June brought heightened volatility, spurred largely by a disappointing jobs report and uncertainty over whether the U.K. would remain in the E.U. The U.K.’s Brexit vote on June 23 shocked countries in Europe and much of the rest of the world. Stock markets fell as investors worried that the U.K.’s departure from the E.U. would slow global growth and prolong the low-interest-rate environment. Following the initial rout, however, U.S. stocks rallied as investors seemed to decide that any negative effects would be more localized and not create a serious risk for global growth. By quarter-end, the broad U.S. stock market had moved back into positive territory.
U.S. stocks delivered generally positive results in the third quarter of 2016.
The rally in U.S. stocks continued into early July 2016. U.S. stocks then generally continued to move upward at a more moderate pace, reaching a quarterly peak in August before the upward momentum started to lose some steam. Markets worldwide have been supported to varying degrees by accommodative policies from leading central banks, including the Fed, ECB, Bank of England, and Bank of Japan. As a result, investors have watched closely for any signs that global central banks might tighten their measures. Although many U.S. investors had doubted the Fed would increase interest rates in September, hawkish comments by several Fed officials in early September raised concerns, sending stock and bond prices downward. However, immediately following the Fed’s September 20 meeting, stocks surged on news that the Fed had decided to leave short-term interest rates unchanged for the time being and had signaled its intention to increase rates by year-end. The Fed also lowered its estimates for long-term economic growth and adjusted its anticipated pace of future rate increases. U.S. small-cap stocks in particular benefited from a renewed investor focus on fundamentals and from healthy merger and acquisition activity.
Don’t let short-term uncertainty derail long-term investment goals.
Periods of uncertainty can present challenges, but experience has taught us that maintaining long-term investment goals can be an effective way to plan for the future. To help you create a sound strategy based on your personal goals and risk tolerance, Wells Fargo Funds offers more than 100 mutual funds spanning a wide range of asset classes and investment styles. Although diversification cannot guarantee an investment profit or prevent losses, we believe it can be an effective way to manage investment risk and potentially smooth out overall portfolio performance. We encourage investors to know their investments and to understand that appropriate levels of risk-taking may unlock opportunities.
Thank you for choosing to invest in Wells Fargo Funds. We appreciate your confidence in us and remain committed to helping you meet your financial needs.
Sincerely,

Karla M. Rabusch
President
Wells Fargo Funds
Markets worldwide have been supported to varying degrees by accommodative policies from leading central banks, including the Fed, ECB, Bank of England, and Bank of Japan.
Although diversification cannot guarantee an investment profit or prevent losses, we believe it can be an effective way to manage investment risk and potentially smooth out overall portfolio performance.
For further information about your Fund, contact your investment professional, visit our website at wellsfargofunds.com, or call us directly at 1-800-222-8222. We are available 24 hours a day, 7 days a week.
| | | | |
| 4 | | Wells Fargo Enterprise Fund | | Performance highlights (unaudited) |
Investment objective
The Fund seeks long-term capital appreciation.
Manager
Wells Fargo Funds Management, LLC
Subadviser
Wells Capital Management Incorporated
Portfolio managers
Michael T. Smith, CFA®
Chris Warner, CFA®
Average annual total returns (%) as of September 30, 20161
| | | | | | | | | | | | | | | | | | | | | | | | | | | | | | | | | | |
| | | | | Including sales charge | | | Excluding sales charge | | | Expense ratios2 (%) | |
| | | Inception date | | 1 year | | | 5 year | | | 10 year | | | 1 year | | | 5 year | | | 10 year | | | Gross | | | Net3 | |
| Class A (SENAX) | | 2-24-2000 | | | 2.37 | | | | 12.77 | | | | 6.46 | | | | 8.63 | | | | 14.11 | | | | 7.10 | | | | 1.25 | | | | 1.18 | |
| Class B (WENBX)* | | 8-26-2011 | | | 2.78 | | | | 13.00 | | | | 6.66 | | | | 7.78 | | | | 13.25 | | | | 6.66 | | | | 2.00 | | | | 1.93 | |
| Class C (WENCX) | | 3-31-2008 | | | 6.80 | | | | 13.25 | | | | 6.30 | | | | 7.80 | | | | 13.25 | | | | 6.30 | | | | 2.00 | | | | 1.93 | |
| Class R6 (WENRX) | | 10-31-2014 | | | – | | | | – | | | | – | | | | 9.06 | | | | 14.51 | | | | 7.54 | | | | 0.82 | | | | 0.80 | |
| Administrator Class (SEPKX) | | 8-30-2002 | | | – | | | | – | | | | – | | | | 8.74 | | | | 14.22 | | | | 7.27 | | | | 1.17 | | | | 1.10 | |
| Institutional Class (WFEIX) | | 6-30-2003 | | | – | | | | – | | | | – | | | | 8.97 | | | | 14.48 | | | | 7.53 | | | | 0.92 | | | | 0.85 | |
| Russell Midcap® Growth Index4 | | – | | | – | | | | – | | | | – | | | | 11.24 | | | | 15.85 | | | | 8.51 | | | | – | | | | – | |
| * | | At the close of business on December 5, 2016, existing Class B shareholders were converted to Class A shareholders. Effective December 6, 2016, Class B shares are no longer offered by the Fund. |
Figures quoted represent past performance, which is no guarantee of future results, and do not reflect taxes that a shareholder may pay on fund distributions or the redemption of fund shares. Investment return and principal value of an investment will fluctuate so that an investor’s shares, when redeemed, may be worth more or less than their original cost. Performance shown without sales charges would be lower if sales charges were reflected. Current performance may be lower or higher than the performance data quoted, which assumes the reinvestment of dividends and capital gains. Current month-end performance is available on the Fund’s website, wellsfargofunds.com.
Index returns do not include transaction costs associated with buying and selling securities, any mutual fund fees or expenses, or any taxes. It is not possible to invest directly in an index.
For Class A shares, the maximum front-end sales charge is 5.75%. For Class B shares, the maximum contingent deferred sales charge is 5.00%. For Class C shares, the maximum contingent deferred sales charge is 1.00%. Performance including a contingent deferred sales charge assumes the sales charge for the corresponding time period. Class R6, Administrator Class, and Institutional Class shares are sold without a front-end sales charge or contingent deferred sales charge.
Stock values fluctuate in response to the activities of individual companies and general market and economic conditions. Smaller-company stocks tend to be more volatile and less liquid than those of larger companies. Certain investment strategies tend to increase the total risk of an investment (relative to the broader market). The Fund is exposed to foreign investment risk. Consult the Fund’s prospectus for additional information on these and other risks.
Please see footnotes on page 5.
| | | | | | |
| Performance highlights (unaudited) | | Wells Fargo Enterprise Fund | | | 5 | |
|
| Growth of $10,000 investment as of September 30, 20165 |
|
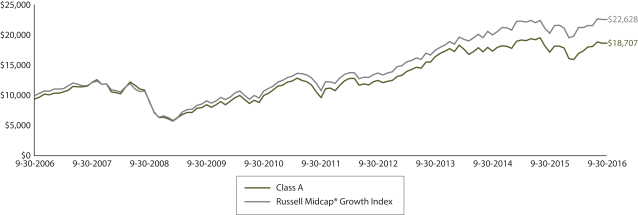 |
| 1 | Effective June 20, 2008, Advisor Class was renamed Class A and modified to assume the features and attributes of Class A. Historical performance shown for Class A shares through June 19, 2008, includes Advisor Class expenses. Historical performance shown for Class B shares prior to their inception reflects the performance of Class C shares. Historical performance shown for Class C shares prior to their inception reflects the performance of the former Investor Class shares and has been adjusted to reflect the higher expenses applicable to Class C shares. Historical performance shown for Class R6 shares prior to their inception reflects the performance of the Institutional Class shares, and is not adjusted to reflect Class R6 expenses. If these expenses had been included, returns for Class R6 would be higher. |
| 2 | Reflects the expense ratios as stated in the most recent prospectuses. The expense ratios shown are subject to change and may differ from the annualized expense ratios shown in the financial highlights of this report. |
| 3 | The manager has contractually committed through January 31, 2017, to waive fees and/or reimburse expenses to the extent necessary to cap the Fund’s Total Annual Fund Operating Expenses After Fee Waiver at the amounts shown. After this time, the cap may be increased or the commitment to maintain the cap may be terminated only with the approval of the Board of Trustees. Brokerage commissions, stamp duty fees, interest, taxes, acquired fund fees and expenses, and extraordinary expenses are excluded from the expense cap. Without this cap, the Fund’s returns would have been lower. |
| 4 | The Russell Midcap® Growth Index measures the performance of those Russell Midcap companies with higher price-to-book ratios and higher forecasted growth values. The stocks are also members of the Russell 1000® Growth Index. You cannot invest directly in an index. |
| 5 | The chart compares the performance of Class A shares for the most recent ten years with the Russell Midcap® Growth Index. The chart assumes a hypothetical investment of $10,000 in Class A shares and reflects all operating expenses and assumes the maximum initial sales charge of 5.75%. |
| 6 | The ten largest holdings, excluding cash and cash equivalents, are calculated based on the value of the investments divided by total net assets of the Fund. Holdings are subject to change and may have changed since the date specified. |
| 7 | Amounts are calculated based on the total long-term investments of the Fund. These amounts are subject to change and may have changed since the date specified. |
| * | The security was not held by the Fund at the end of the reporting period. |
| | | | |
| 6 | | Wells Fargo Enterprise Fund | | Performance highlights (unaudited) |
MANAGER’S DISCUSSION
Fund highlights
| n | | The Fund underperformed its benchmark, the Russell Midcap® Growth Index, for the 12-month period that ended September 30, 2016. |
| n | | Challenging stock selection in the information technology (IT) sector more than offset effective stock selection in the health care sector. |
| n | | Although the U.S. economy generally displayed resiliency, global economic weakness and geopolitical risks led to high uncertainty, risk aversion, and occasional periods when stock prices appeared to undervalue the quality of company fundamentals. |
The environment for U.S. equities over the past 12 months vacillated frequently from a risk-averse market fueled by concern over geopolitical events and global economic issues to a more optimistic market in which company-specific data drove stock prices. This fluctuating investing landscape proved challenging for our bottom-up, fundamentally based investment process.
| | | | |
| Ten largest holdings (%) as of September 30, 20166 | |
O’Reilly Automotive Incorporated | | | 2.83 | |
Electronic Arts Incorporated | | | 2.25 | |
Zayo Group Holdings Incorporated | | | 2.22 | |
Fidelity National Information Services Incorporated | | | 2.21 | |
ServiceNow Incorporated | | | 2.21 | |
KAR Auction Services Incorporated | | | 2.15 | |
Intuitive Surgical Incorporated | | | 2.11 | |
Waste Connections Incorporated | | | 2.10 | |
Intercontinental Exchange Incorporated | | | 2.02 | |
Constellation Brands Incorporated Class A | | | 1.99 | |
Stock selection in the IT sector detracted the most from Fund performance.
Within the IT sector, positioning in the semiconductor and semiconductor equipment industry weighed on returns. Also, within the software industry, a combination of company-specific issues and concerns over enterprise spending pressured portfolio holdings. Tableau Software, Incorporated, a data-visualization software company, reported disappointing quarterly results driven by an unexpected decline in licensing revenue. Shares of Tableau declined sharply as a result. Concerns over increased competition and the company’s ability to transition its business model to large, enterprise-level customers also weighed on the stock. With the sharp increase in uncertainty, we determined our thesis was compromised and sold Tableau from the Fund.
|
| Sector distribution as of September 30, 20167 |
|
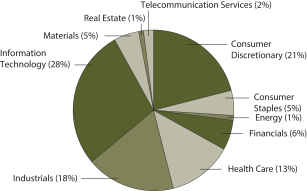 |
Stock selection in the health care sector aided performance.
We observed specific strength in the highly innovative medical equipment industry, which has been a point of emphasis in the Fund over the reporting period. Edwards Lifesciences Corporation, which focuses on technologies that treat heart disease and is a leader in the market for transcatheter heart valves (THV), benefited the Fund’s return. The $3 billion THV market is expected to grow because THV is a minimally invasive and more effective method of replacing heart valves. Edwards reported strong results driven by a significant increase in its THV sales, and the company is optimistic that it may receive approval for its products to be used in a broader group of
heart patients. Another health care company, Align Technology, Incorporated,* displayed considerable strength over the reporting period. The company, which manufactures the Invisalign® orthodontic treatment, posted consistently strong results driven by growth in both the U.S. and international markets. We believe Align Technology is still in the early stages of penetrating a large market.
Please see footnotes on page 5.
| | | | | | |
| Performance highlights (unaudited) | | Wells Fargo Enterprise Fund | | | 7 | |
Recent market dynamics support our confidence in the Fund’s positioning.
Despite the lack of clarity on the macroeconomic front, there are some developments that we view as encouraging for our investing style. In contrast to worries that gripped investors early in 2016, investors more recently have been showing signs of embracing a muddle-through scenario for the U.S. economy. There appears to be a general sense that this slow-growth economy may lengthen the business cycle and avoid the boom-and-bust pattern the market frequently has followed in the past. The slow-growth scenario actually may be good for growth-equity investing.
We invest in companies with high organic growth, which tend to be scarce in a low-growth environment. With a decreasing number of companies capable of generating high levels of revenue growth, it stands to reason that growth stocks may command a premium valuation in the later stages of a business cycle. However, with just a few exceptions, that has not occurred broadly in this slow-growth market. Instead, slower-growing stocks that offer the perceived safety of high dividend yields have been rewarded with multiple expansion in recent years. However, this trend reversed in the last few months of the reporting period; stocks in traditional growth sectors, such as health care, outperformed, while high-dividend-yield stocks in sectors such as utilities and consumer staples lagged. Also, after languishing in a risk-averse environment, small- and mid-cap stocks—many of which are more exposed to strong U.S. end markets like housing—began to outperform. The most recent earnings season was the most rational that we have seen in a long time, where good news regarding company fundamentals led to good news for stock prices. This was a positive sign as equity correlations were able to normalize.
We remain upbeat regarding the fundamentals of companies within the Fund. Our internal projections for growth are high because many innovative companies are held within the Fund. In our view, these holdings are potentially capable of generating durable growth in a variety of economic environments. After years of a challenging environment, stock prices and returns may be moving back toward their average ranges. As we maintain a laser focus on the execution of our investment process, we believe our efforts may lead to strong performance for the benefit of Fund shareholders.
Please see footnotes on page 5.
| | | | |
| 8 | | Wells Fargo Enterprise Fund | | Fund expenses (unaudited) |
As a shareholder of the Fund, you incur two types of costs: (1) transaction costs, including sales charges (loads) on purchase payments and contingent deferred sales charges (if any) on redemptions and (2) ongoing costs, including management fees, distribution (12b-1) and/or shareholder servicing fees, and other Fund expenses. This example is intended to help you understand your ongoing costs (in dollars) of investing in the Fund and to compare these costs with the ongoing costs of investing in other mutual funds.
The example is based on an investment of $1,000 invested at the beginning of the six-month period and held for the entire period from April 1, 2016 to September 30, 2016.
Actual expenses
The “Actual” line of the table below provides information about actual account values and actual expenses. You may use the information in this line, together with the amount you invested, to estimate the expenses that you paid over the period. Simply divide your account value by $1,000 (for example, an $8,600 account value divided by $1,000 = 8.6), then multiply the result by the number in the “Actual” line under the heading entitled “Expenses paid during period” for your applicable class of shares to estimate the expenses you paid on your account during this period.
Hypothetical example for comparison purposes
The “Hypothetical” line of the table below provides information about hypothetical account values and hypothetical expenses based on the Fund’s actual expense ratio and an assumed rate of return of 5% per year before expenses, which is not the Fund’s actual return. The hypothetical account values and expenses may not be used to estimate the actual ending account balance or expenses you paid for the period. You may use this information to compare the ongoing costs of investing in the Fund and other funds. To do so, compare this 5% hypothetical example with the 5% hypothetical examples that appear in the shareholder reports of the other funds.
Please note that the expenses shown in the table are meant to highlight your ongoing costs only and do not reflect any transactional costs, such as sales charges (loads) and contingent deferred sales charges. Therefore, the “Hypothetical” line of the table is useful in comparing ongoing costs only and will not help you determine the relative total costs of owning different funds. In addition, if these transactional costs were included, your costs would have been higher.
| | | | | | | | | | | | | | | | |
| | | Beginning
account value
4-1-2016 | | | Ending
account value
9-30-2016 | | | Expenses
paid during
the period¹ | | | Annualized net
expense ratio | |
Class A | | | | | | | | | | | | | | | | |
Actual | | $ | 1,000.00 | | | $ | 1,100.18 | | | $ | 6.20 | | | | 1.18 | % |
Hypothetical (5% return before expenses) | | $ | 1,000.00 | | | $ | 1,019.10 | | | $ | 5.96 | | | | 1.18 | % |
Class B | | | | | | | | | | | | | | | | |
Actual | | $ | 1,000.00 | | | $ | 1,095.76 | | | $ | 10.11 | | | | 1.93 | % |
Hypothetical (5% return before expenses) | | $ | 1,000.00 | | | $ | 1,015.35 | | | $ | 9.72 | | | | 1.93 | % |
Class C | | | | | | | | | | | | | | | | |
Actual | | $ | 1,000.00 | | | $ | 1,095.73 | | | $ | 10.11 | | | | 1.93 | % |
Hypothetical (5% return before expenses) | | $ | 1,000.00 | | | $ | 1,015.35 | | | $ | 9.72 | | | | 1.93 | % |
Class R6 | | | | | | | | | | | | | | | | |
Actual | | $ | 1,000.00 | | | $ | 1,102.26 | | | $ | 4.20 | | | | 0.80 | % |
Hypothetical (5% return before expenses) | | $ | 1,000.00 | | | $ | 1,021.00 | | | $ | 4.04 | | | | 0.80 | % |
Administrator Class | | | | | | | | | | | | | | | | |
Actual | | $ | 1,000.00 | | | $ | 1,100.45 | | | $ | 5.78 | | | | 1.10 | % |
Hypothetical (5% return before expenses) | | $ | 1,000.00 | | | $ | 1,019.50 | | | $ | 5.55 | | | | 1.10 | % |
Institutional Class | | | | | | | | | | | | | | | | |
Actual | | $ | 1,000.00 | | | $ | 1,101.87 | | | $ | 4.47 | | | | 0.85 | % |
Hypothetical (5% return before expenses) | | $ | 1,000.00 | | | $ | 1,020.75 | | | $ | 4.29 | | | | 0.85 | % |
| 1 | Expenses paid is equal to the annualized net expense ratio of each class multiplied by the average account value over the period, multiplied by the number of days in the most recent fiscal half-year divided by the number of days in the fiscal year (to reflect the one-half-year period). |
| | | | | | |
| Portfolio of investments—September 30, 2016 | | Wells Fargo Enterprise Fund | | | 9 | |
| | | | | | | | | | | | | | | | |
| Security name | | | | | | | | Shares | | | Value | |
| | | | |
Common Stocks: 99.94% | | | | | | | | | | | | | | | | |
| | | | |
Consumer Discretionary: 20.95% | | | | | | | | | | | | | | | | |
| | | | |
| Auto Components: 3.12% | | | | | | | | | | | | | | | | |
Delphi Automotive plc | | | | | | | | | | | 137,485 | | | $ | 9,805,430 | |
Johnson Controls International plc | | | | | | | | | | | 222,941 | | | | 10,373,445 | |
| | | | |
| | | | | | | | | | | | | | | 20,178,875 | |
| | | | | | | | | | | | | | | | |
| | | | |
| Automobiles: 1.14% | | | | | | | | | | | | | | | | |
Thor Industries Incorporated | | | | | | | | | | | 87,200 | | | | 7,385,840 | |
| | | | | | | | | | | | | | | | |
| | | | |
| Distributors: 1.00% | | | | | | | | | | | | | | | | |
Pool Corporation | | | | | | | | | | | 68,400 | | | | 6,465,168 | |
| | | | | | | | | | | | | | | | |
| | | | |
| Hotels, Restaurants & Leisure: 4.89% | | | | | | | | | | | | | | | | |
Aramark | | | | | | | | | | | 285,659 | | | | 10,863,612 | |
Dave & Buster’s Entertainment Incorporated † | | | | | | | | | | | 104,044 | | | | 4,076,444 | |
Six Flags Entertainment Corporation | | | | | | | | | | | 174,700 | | | | 9,365,667 | |
Vail Resorts Incorporated | | | | | | | | | | | 47,117 | | | | 7,391,715 | |
| | | | |
| | | | | | | | | | | | | | | 31,697,438 | |
| | | | | | | | | | | | | | | | |
| | | | |
| Media: 2.96% | | | | | | | | | | | | | | | | |
Cinemark Holdings Incorporated | | | | | | | | | | | 212,500 | | | | 8,134,500 | |
Liberty Broadband Corporation Class C † | | | | | | | | | | | 154,800 | | | | 11,065,104 | |
| | | | |
| | | | | | | | | | | | | | | 19,199,604 | |
| | | | | | | | | | | | | | | | |
| | | | |
| Multiline Retail: 1.68% | | | | | | | | | | | | | | | | |
Dollar General Corporation | | | | | | | | | | | 155,800 | | | | 10,904,442 | |
| | | | | | | | | | | | | | | | |
| | | | |
| Specialty Retail: 5.04% | | | | | | | | | | | | | | | | |
Burlington Stores Incorporated † | | | | | | | | | | | 120,200 | | | | 9,738,604 | |
L Brands Incorporated | | | | | | | | | | | 63,900 | | | | 4,522,203 | |
O’Reilly Automotive Incorporated † | | | | | | | | | | | 65,500 | | | | 18,347,205 | |
| | | | |
| | | | | | | | | | | | | | | 32,608,012 | |
| | | | | | | | | | | | | | | | |
| | | | |
| Textiles, Apparel & Luxury Goods: 1.12% | | | | | | | | | | | | | | | | |
Coach Incorporated | | | | | | | | | | | 198,400 | | | | 7,253,504 | |
| | | | | | | | | | | | | | | | |
| | | | |
Consumer Staples: 4.97% | | | | | | | | | | | | | | | | |
| | | | |
| Beverages: 3.54% | | | | | | | | | | | | | | | | |
Constellation Brands Incorporated Class A | | | | | | | | | | | 77,400 | | | | 12,886,326 | |
Monster Beverage Corporation † | | | | | | | | | | | 68,300 | | | | 10,027,123 | |
| | | | |
| | | | | | | | | | | | | | | 22,913,449 | |
| | | | | | | | | | | | | | | | |
| | | | |
| Food Products: 1.43% | | | | | | | | | | | | | | | | |
TreeHouse Foods Incorporated † | | | | | | | | | | | 106,400 | | | | 9,277,016 | |
| | | | | | | | | | | | | | | | |
| | | | |
Energy: 0.71% | | | | | | | | | | | | | | | | |
| | | | |
| Oil, Gas & Consumable Fuels: 0.71% | | | | | | | | | | | | | | | | |
Diamondback Energy Incorporated † | | | | | | | | | | | 48,000 | | | | 4,633,920 | |
| | | | | | | | | | | | | | | | |
The accompanying notes are an integral part of these financial statements.
| | | | |
| 10 | | Wells Fargo Enterprise Fund | | Portfolio of investments—September 30, 2016 |
| | | | | | | | | | | | | | | | |
| Security name | | | | | | | | Shares | | | Value | |
| | | | |
Financials: 6.14% | | | | | | | | | | | | | | | | |
| | | | |
| Capital Markets: 6.14% | | | | | | | | | | | | | | | | |
Intercontinental Exchange Incorporated | | | | | | | | | | | 48,505 | | | $ | 13,065,307 | |
Raymond James Financial Incorporated | | | | | | | | | | | 95,200 | | | | 5,541,592 | |
S&P Global Incorporated | | | | | | | | | | | 98,841 | | | | 12,509,317 | |
SEI Investments Company | | | | | | | | | | | 189,400 | | | | 8,638,534 | |
| | | | |
| | | | | | | | | | | | | | | 39,754,750 | |
| | | | | | | | | | | | | | | | |
| | | | |
Health Care: 13.05% | | | | | | | | | | | | | | | | |
| | | | |
| Biotechnology: 2.44% | | | | | | | | | | | | | | | | |
BioMarin Pharmaceutical Incorporated † | | | | | | | | | | | 82,293 | | | | 7,613,748 | |
Incyte Corporation † | | | | | | | | | | | 86,600 | | | | 8,165,514 | |
| | | | |
| | | | | | | | | | | | | | | 15,779,262 | |
| | | | | | | | | | | | | | | | |
| | | | |
| Health Care Equipment & Supplies: 7.89% | | | | | | | | | | | | | | | | |
Boston Scientific Corporation † | | | | | | | | | | | 401,900 | | | | 9,565,220 | |
DexCom Incorporated † | | | | | | | | | | | 90,900 | | | | 7,968,294 | |
Edwards Lifesciences Corporation † | | | | | | | | | | | 101,200 | | | | 12,200,672 | |
Integra LifeSciences Holdings Corporation † | | | | | | | | | | | 93,200 | | | | 7,693,660 | |
Intuitive Surgical Incorporated † | | | | | | | | | | | 18,900 | | | | 13,699,287 | |
| | | | |
| | | | | | | | | | | | | | | 51,127,133 | |
| | | | | | | | | | | | | | | | |
| | | | |
| Health Care Providers & Services: 2.72% | | | | | | | | | | | | | | | | |
Surgical Care Affiliates Incorporated † | | | | | | | | | | | 158,435 | | | | 7,725,291 | |
VCA Incorporated † | | | | | | | | | | | 141,400 | | | | 9,895,172 | |
| | | | |
| | | | | | | | | | | | | | | 17,620,463 | |
| | | | | | | | | | | | | | | | |
| | | | |
Industrials: 17.88% | | | | | | | | | | | | | | | | |
| | | | |
| Aerospace��& Defense: 1.04% | | | | | | | | | | | | | | | | |
Orbital ATK Incorporated | | | | | | | | | | | 88,500 | | | | 6,746,355 | |
| | | | | | | | | | | | | | | | |
| | | | |
| Airlines: 1.29% | | | | | | | | | | | | | | | | |
Spirit Airlines Incorporated † | | | | | | | | | | | 196,000 | | | | 8,335,880 | |
| | | | | | | | | | | | | | | | |
| | | | |
| Building Products: 3.19% | | | | | | | | | | | | | | | | |
Allegion plc | | | | | | | | | | | 184,600 | | | | 12,720,786 | |
Masonite International Corporation † | | | | | | | | | | | 127,800 | | | | 7,945,326 | |
| | | | |
| | | | | | | | | | | | | | | 20,666,112 | |
| | | | | | | | | | | | | | | | |
| | | | |
| Commercial Services & Supplies: 5.67% | | | | | | | | | | | | | | | | |
KAR Auction Services Incorporated | | | | | | | | | | | 322,379 | | | | 13,913,878 | |
Rollins Incorporated | | | | | | | | | | | 315,005 | | | | 9,223,346 | |
Waste Connections Incorporated | | | | | | | | | | | 182,100 | | | | 13,602,870 | |
| | | | |
| | | | | | | | | | | | | | | 36,740,094 | |
| | | | | | | | | | | | | | | | |
| | | | |
| Electrical Equipment: 0.85% | | | | | | | | | | | | | | | | |
Acuity Brands Incorporated | | | | | | | | | | | 20,834 | | | | 5,512,676 | |
| | | | | | | | | | | | | | | | |
The accompanying notes are an integral part of these financial statements.
| | | | | | |
| Portfolio of investments—September 30, 2016 | | Wells Fargo Enterprise Fund | | | 11 | |
| | | | | | | | | | | | | | | | |
| Security name | | | | | | | | Shares | | | Value | |
| | | | |
| Industrial Conglomerates: 1.22% | | | | | | | | | | | | | | | | |
Carlisle Companies Incorporated | | | | | | | | | | | 77,033 | | | $ | 7,901,275 | |
| | | | | | | | | | | | | | | | |
| | | | |
| Professional Services: 1.56% | | | | | | | | | | | | | | | | |
TransUnion † | | | | | | | | | | | 292,698 | | | | 10,098,081 | |
| | | | | | | | | | | | | | | | |
| | | | |
| Road & Rail: 1.46% | | | | | | | | | | | | | | | | |
Kansas City Southern | | | | | | | | | | | 101,500 | | | | 9,471,980 | |
| | | | | | | | | | | | | | | | |
| | | | |
| Trading Companies & Distributors: 1.60% | | | | | | | | | | | | | | | | |
HD Supply Holdings Incorporated † | | | | | | | | | | | 323,000 | | | | 10,329,540 | |
| | | | | | | | | | | | | | | | |
| | | | |
Information Technology: 28.02% | | | | | | | | | | | | | | | | |
| | | | |
| Communications Equipment: 1.33% | | | | | | | | | | | | | | | | |
Harris Corporation | | | | | | | | | | | 94,100 | | | | 8,620,501 | |
| | | | | | | | | | | | | | | | |
| | | | |
| Electronic Equipment, Instruments & Components: 1.57% | | | | | | | | | | | | | | | | |
FLIR Systems Incorporated | | | | | | | | | | | 221,000 | | | | 6,943,820 | |
Universal Display Corporation † | | | | | | | | | | | 58,300 | | | | 3,236,233 | |
| | | | |
| | | | | | | | | | | | | | | 10,180,053 | |
| | | | | | | | | | | | | | | | |
| | | | |
| Internet Software & Services: 3.03% | | | | | | | | | | | | | | | | |
CoStar Group Incorporated † | | | | | | | | | | | 54,443 | | | | 11,788,543 | |
Yandex NV Class A † | | | | | | | | | | | 370,900 | | | | 7,807,445 | |
| | | | |
| | | | | | | | | | | | | | | 19,595,988 | |
| | | | | | | | | | | | | | | | |
| | | | |
| IT Services: 9.42% | | | | | | | | | | | | | | | | |
Acxiom Corporation † | | | | | | | | | | | 322,800 | | | | 8,602,620 | |
EPAM Systems Incorporated † | | | | | | | | | | | 144,219 | | | | 9,995,819 | |
Fidelity National Information Services Incorporated | | | | | | | | | | | 186,200 | | | | 14,342,986 | |
Total System Services Incorporated | | | | | | | | | | | 209,900 | | | | 9,896,785 | |
Vantiv Incorporated Class A † | | | | | | | | | | | 117,281 | | | | 6,599,402 | |
WEX Incorporated † | | | | | | | | | | | 107,100 | | | | 11,576,439 | |
| | | | |
| | | | | | | | | | | | | | | 61,014,051 | |
| | | | | | | | | | | | | | | | |
| | | | |
| Semiconductors & Semiconductor Equipment: 2.69% | | | | | | | | | | | | | | | | |
Broadcom Limited | | | | | | | | | | | 37,400 | | | | 6,452,248 | |
Micron Technology Incorporated † | | | | | | | | | | | 334,200 | | | | 5,942,076 | |
NXP Semiconductors NV † | | | | | | | | | | | 50,300 | | | | 5,042,495 | |
| | | | |
| | | | | | | | | | | | | | | 17,436,819 | |
| | | | | | | | | | | | | | | | |
| | | | |
| Software: 9.98% | | | | | | | | | | | | | | | | |
Electronic Arts Incorporated † | | | | | | | | | | | 170,700 | | | | 14,577,780 | |
Guidewire Software Incorporated † | | | | | | | | | | | 128,000 | | | | 7,677,440 | |
Nintendo Company Limited « | | | | | | | | | | | 192,600 | | | | 6,351,948 | |
Paycom Software Incorporated † | | | | | | | | | | | 100,523 | | | | 5,039,218 | |
ServiceNow Incorporated † | | | | | | | | | | | 180,550 | | | | 14,290,533 | |
Symantec Corporation | | | | | | | | | | | 277,300 | | | | 6,960,230 | |
Tyler Technologies Incorporated † | | | | | | | | | | | 56,800 | | | | 9,725,864 | |
| | | | |
| | | | | | | | | | | | | | | 64,623,013 | |
| | | | | | | | | | | | | | | | |
The accompanying notes are an integral part of these financial statements.
| | | | |
| 12 | | Wells Fargo Enterprise Fund | | Portfolio of investments—September 30, 2016 |
| | | | | | | | | | | | | | | | |
| Security name | | | | | | | | Shares | | | Value | |
| | | | |
Materials: 4.53% | | | | | | | | | | | | | | | | |
| | | | |
| Chemicals: 1.40% | | | | | | | | | | | | | | | | |
The Sherwin-Williams Company | | | | | | | | | | | 32,900 | | | $ | 9,102,114 | |
| | | | | | | | | | | | | | | | |
| | | | |
| Construction Materials: 1.72% | | | | | | | | | | | | | | | | |
Vulcan Materials Company | | | | | | | | | | | 98,000 | | | | 11,145,540 | |
| | | | | | | | | | | | | | | | |
| | | | |
| Containers & Packaging: 1.41% | | | | | | | | | | | | | | | | |
Berry Plastics Group Incorporated † | | | | | | | | | | | 208,100 | | | | 9,125,183 | |
| | | | | | | | | | | | | | | | |
| | | | |
Real Estate: 1.47% | | | | | | | | | | | | | | | | |
| | | | |
| Real Estate Management & Development: 1.47% | | | | | | | | | | | | | | | | |
CBRE Group Incorporated Class A † | | | | | | | | | | | 340,015 | | | | 9,513,620 | |
| | | | | | | | | | | | | | | | |
| | | | |
Telecommunication Services: 2.22% | | | | | | | | | | | | | | | | |
| | | | |
| Diversified Telecommunication Services: 2.22% | | | | | | | | | | | | | | | | |
Zayo Group Holdings Incorporated † | | | | | | | | | | | 483,799 | | | | 14,373,668 | |
| | | | | | | | | | | | | | | | |
| | | | |
Total Common Stocks (Cost $552,477,728) | | | | | | | | | | | | | | | 647,331,419 | |
| | | | | | | | | | | | | | | | |
| | | | |
| | | Yield | | | | | | | | | | |
| Short-Term Investments: 0.88% | | | | | | | | | | | | | | | | |
| | | | |
| Investment Companies: 0.88% | | | | | | | | | | | | | | | | |
Securities Lending Cash Investments LLC (l)(r)(u) | | | 0.65 | % | | | | | | | 1,020,000 | | | | 1,020,000 | |
Wells Fargo Government Money Market Fund Select Class (l)(u) | | | 0.34 | | | | | | | | 4,723,179 | | | | 4,723,179 | |
| |
Total Short-Term Investments (Cost $5,743,179) | | | | 5,743,179 | |
| | | | | | | | | | | | | | | | |
| | | | | | | | |
| Total investments in securities (Cost $558,220,907) * | | | 100.82 | % | | | 653,074,598 | |
Other assets and liabilities, net | | | (0.82 | ) | | | (5,342,738 | ) |
| | | | | | | | |
| Total net assets | | | 100.00 | % | | $ | 647,731,860 | |
| | | | | | | | |
| † | Non-income-earning security |
| « | All or a portion of this security is on loan. |
| (l) | The issuer of the security is an affiliated person of the Fund as defined in the Investment Company Act of 1940. |
| (r) | The investment is a non-registered investment vehicle purchased with cash collateral received from securities on loan. |
| (u) | The rate represents the 7-day annualized yield at period end. |
| * | Cost for federal income tax purposes is $559,957,080 and unrealized gains (losses) consists of: |
| | | | |
Gross unrealized gains | | $ | 106,700,685 | |
Gross unrealized losses | | | (13,583,167 | ) |
| | | | |
Net unrealized gains | | $ | 93,117,518 | |
The accompanying notes are an integral part of these financial statements.
| | | | | | |
| Statement of assets and liabilities—September 30, 2016 | | Wells Fargo Enterprise Fund | | | 13 | |
| | | | |
| | | | |
| |
Assets | | | | |
Investments | | | | |
In unaffiliated securities (including $985,224 of securities loaned), at value (cost $552,477,728) | | $ | 647,331,419 | |
In affiliated securities, at value (cost $5,743,179) | | | 5,743,179 | |
| | | | |
Total investments, at value (cost $558,220,907) | | | 653,074,598 | |
Cash | | | 22,380 | |
Receivable for investments sold | | | 14,040,145 | |
Receivable for Fund shares sold | | | 92,751 | |
Receivable for dividends | | | 236,559 | |
Receivable for securities lending income | | | 1,613 | |
Prepaid expenses and other assets | | | 93,020 | |
| | | | |
Total assets | | | 667,561,066 | |
| | | | |
| |
Liabilities | | | | |
Payable for investments purchased | | | 17,460,386 | |
Payable for Fund shares redeemed | | | 633,572 | |
Payable upon receipt of securities loaned | | | 1,020,000 | |
Management fee payable | | | 379,851 | |
Distribution fees payable | | | 6,249 | |
Administration fees payable | | | 109,830 | |
Accrued expenses and other liabilities | | | 219,318 | |
| | | | |
Total liabilities | | | 19,829,206 | |
| | | | |
Total net assets | | $ | 647,731,860 | |
| | | | |
| |
NET ASSETS CONSIST OF | | | | |
Paid-in capital | | $ | 538,399,755 | |
Accumulated net investment loss | | | (2,200,728 | ) |
Accumulated net realized gains on investments | | | 16,679,142 | |
Net unrealized gains on investments | | | 94,853,691 | |
| | | | |
Total net assets | | $ | 647,731,860 | |
| | | | |
| |
COMPUTATION OF NET ASSET VALUE AND OFFERING PRICE PER SHARE | | | | |
Net assets – Class A | | $ | 542,077,000 | |
Shares outstanding – Class A1 | | | 12,925,205 | |
Net asset value per share – Class A | | | $41.94 | |
Maximum offering price per share – Class A2 | | | $44.50 | |
Net assets – Class B | | $ | 357,021 | |
Shares outstanding – Class B1 | | | 9,343 | |
Net asset value per share – Class B | | | $38.21 | |
Net assets – Class C | | $ | 9,180,730 | |
Shares outstanding – Class C1 | | | 240,175 | |
Net asset value per share – Class C | | | $38.23 | |
Net assets – Class R6 | | $ | 29,861,406 | |
Shares outstanding – Class R61 | | | 658,188 | |
Net asset value per share – Class R6 | | | $45.37 | |
Net assets – Administrator Class | | $ | 4,692,694 | |
Shares outstanding – Administrator Class1 | | | 107,106 | |
Net asset value per share – Administrator Class | | | $43.81 | |
Net assets – Institutional Class | | $ | 61,563,009 | |
Shares outstanding – Institutional Class1 | | | 1,358,508 | |
Net asset value per share – Institutional Class | | | $45.32 | |
| 1 | The Fund has an unlimited number of authorized shares. |
| 2 | Maximum offering price is computed as 100/94.25 of net asset value. On investments of $50,000 or more, the offering price is reduced. |
The accompanying notes are an integral part of these financial statements.
| | | | |
| 14 | | Wells Fargo Enterprise Fund | | Statement of operations—year ended September 30, 2016 |
| | | | |
| | | | |
| |
Investment income | | | | |
Dividends (net of foreign withholding taxes of $2,967) | | $ | 4,025,078 | |
Securities lending income, net | | | 84,477 | |
Income from affiliated securities | | | 21,650 | |
| | | | |
Total investment income | | | 4,131,205 | |
| | | | |
| |
Expenses | | | | |
Management fee | | | 4,748,032 | |
Administration fees | | | | |
Class A | | | 1,109,055 | |
Class B | | | 1,207 | |
Class C | | | 19,097 | |
Class R6 | | | 4,528 | |
Administrator Class | | | 5,254 | |
Institutional Class | | | 88,191 | |
Investor Class | | | 40,967 | 1 |
Shareholder servicing fees | | | | |
Class A | | | 1,320,088 | |
Class B | | | 1,437 | |
Class C | | | 22,734 | |
Administrator Class | | | 8,766 | |
Investor Class | | | 31,778 | 1 |
Distribution fees | | | | |
Class B | | | 4,311 | |
Class C | | | 68,202 | |
Custody and accounting fees | | | 62,427 | |
Professional fees | | | 42,618 | |
Registration fees | | | 108,159 | |
Shareholder report expenses | | | 97,259 | |
Trustees’ fees and expenses | | | 15,154 | |
Other fees and expenses | | | 19,742 | |
| | | | |
Total expenses | | | 7,819,006 | |
Less: Fee waivers and/or expense reimbursements | | | (501,119 | ) |
| | | | |
Net expenses | | | 7,317,887 | |
| | | | |
Net investment loss | | | (3,186,682 | ) |
| | | | |
| |
REALIZED AND UNREALIZED GAINS (LOSSES) ON INVESTMENTS | | | | |
Net realized gains on investments | | | 17,584,427 | |
Net change in unrealized gains (losses) on investments | | | 38,732,302 | |
| | | | |
Net realized and unrealized gains (losses) on investments | | | 56,316,729 | |
| | | | |
Net increase in net assets resulting from operations | | $ | 53,130,047 | |
| | | | |
| 1 | For the period from October 1, 2015 to October 23, 2015. Effective at the close of business on October 23, 2015, Investor Class shares were converted to Class A shares and are no longer offered by the Fund. |
The accompanying notes are an integral part of these financial statements.
| | | | | | |
| Statement of changes in net assets | | Wells Fargo Enterprise Fund | | | 15 | |
| | | | | | | | | | | | | | | | |
| | | Year ended
September 30, 2016 | | | Year ended
September 30, 2015 | |
| | | | |
Operations | | | | | | | | | | | | | | | | |
Net investment loss | | | | | | $ | (3,186,682 | ) | | | | | | $ | (4,456,476 | ) |
Net realized gains on investments | | | | | | | 17,584,427 | | | | | | | | 60,042,406 | |
Net change in unrealized gains (losses) on investments | | | | | | | 38,732,302 | | | | | | | | (53,364,165 | ) |
| | | | |
Net increase in net assets resulting from operations | | | | | | | 53,130,047 | | | | | | | | 2,221,765 | |
| | | | |
| | | | |
Distributions to shareholders from | | | | | | | | | | | | | | | | |
Net realized gains | | | | | | | | | | | | | | | | |
Class A | | | | | | | (43,636,386 | ) | | | | | | | (50,757,257 | ) |
Class B | | | | | | | (61,455 | ) | | | | | | | (181,113 | ) |
Class C | | | | | | | (809,467 | ) | | | | | | | (1,277,712 | ) |
Class R6 | | | | | | | (148,611 | ) | | | | | | | (2,811 | )1 |
Administrator Class | | | | | | | (262,668 | ) | | | | | | | (5,027,746 | ) |
Institutional Class | | | | | | | (5,679,281 | ) | | | | | | | (8,785,678 | ) |
Investor Class | | | | | | | 0 | 2 | | | | | | | (24,434,273 | ) |
| | | | |
Total distributions to shareholders | | | | | | | (50,597,868 | ) | | | | | | | (90,466,590 | ) |
| | | | |
| | | | |
Capital share transactions | | | Shares | | | | | | | | Shares | | | | | |
Proceeds from shares sold | | | | | | | | | | | | | | | | |
Class A | | | 4,522,822 | | | | 197,186,460 | | | | 125,100 | | | | 5,768,841 | |
Class B | | | 1 | | | | 16 | | | | 115 | | | | 5,022 | |
Class C | | | 23,985 | | | | 869,811 | | | | 29,071 | | | | 1,259,547 | |
Class R6 | | | 691,533 | | | | 29,003,966 | | | | 475 | 1 | | | 25,000 | 1 |
Administrator Class | | | 47,307 | | | | 1,846,716 | | | | 127,718 | | | | 6,003,464 | |
Institutional Class | | | 292,382 | | | | 12,703,511 | | | | 876,223 | | | | 41,657,557 | |
Investor Class | | | 4,864 | 2 | | | 207,062 | 2 | | | 229,245 | | | | 10,496,364 | |
| | | | |
| | | | | | | 241,817,542 | | | | | | | | 65,215,795 | |
| | | | |
Reinvestment of distributions | | | | | | | | | | | | | | | | |
Class A | | | 1,043,906 | | | | 41,244,748 | | | | 1,085,457 | | | | 47,076,276 | |
Class B | | | 1,651 | | | | 59,782 | | | | 4,370 | | | | 176,274 | |
Class C | | | 21,345 | | | | 773,309 | | | | 30,217 | | | | 1,219,238 | |
Class R6 | | | 3,488 | | | | 148,611 | | | | 61 | 1 | | | 2,811 | 1 |
Administrator Class | | | 6,238 | | | | 257,327 | | | | 111,310 | | | | 5,012,290 | |
Institutional Class | | | 120,020 | | | | 5,110,433 | | | | 126,526 | | | | 5,860,663 | |
Investor Class | | | 0 | 2 | | | 0 | 2 | | | 557,032 | | | | 23,740,725 | |
| | | | |
| | | | | | | 47,594,210 | | | | | | | | 83,088,277 | |
| | | | |
Payment for shares redeemed | | | | | | | | | | | | | | | | |
Class A | | | (1,489,094 | ) | | | (59,409,799 | ) | | | (1,083,157 | ) | | | (49,981,902 | ) |
Class B | | | (15,187 | ) | | | (564,158 | ) | | | (17,274 | ) | | | (754,198 | ) |
Class C | | | (47,670 | ) | | | (1,691,275 | ) | | | (31,076 | ) | | | (1,334,211 | ) |
Class R6 | | | (37,369 | ) | | | (1,612,164 | ) | | | 0 | 1 | | | 0 | 1 |
Administrator Class | | | (27,720 | ) | | | (1,163,795 | ) | | | (1,061,267 | ) | | | (49,413,536 | ) |
Institutional Class | | | (998,881 | ) | | | (43,244,941 | ) | | | (570,369 | ) | | | (28,005,911 | ) |
Investor Class | | | (4,428,901 | )2 | | | (190,508,618 | )2 | | | (559,225 | ) | | | (25,524,047 | ) |
| | | | |
| | | | | | | (298,194,750 | ) | | | | | | | (155,013,805 | ) |
| | | | |
Net decrease in net assets resulting from capital share transactions | | | | | | | (8,782,998 | ) | | | | | | | (6,709,733 | ) |
| | | | |
Total decrease in net assets | | | | | | | (6,250,819 | ) | | | | | | | (94,954,558 | ) |
| | | | |
| | | | |
Net assets | | | | | | | | | | | | | | | | |
Beginning of period | | | | | | | 653,982,679 | | | | | | | | 748,937,237 | |
| | | | |
End of period | | | | | | $ | 647,731,860 | | | | | | | $ | 653,982,679 | |
| | | | |
Accumulated net investment loss | | | | | | $ | (2,200,728 | ) | | | | | | $ | (4,295,244 | ) |
| | | | |
| 1 | For the period from October 31, 2014 (commencement of class operations) to September 30, 2015 |
| 2 | For the period from October 1, 2015 to October 23, 2015. Effective at the close of business on October 23, 2015, Investor Class shares were converted to Class A shares and are no longer offered by the Fund. |
The accompanying notes are an integral part of these financial statements.
| | | | |
| 16 | | Wells Fargo Enterprise Fund | | Financial highlights |
(For a share outstanding throughout each period)
| | | | | | | | | | | | | | | | | | | | |
| | | Year ended September 30 | |
| CLASS A | | 2016 | | | 2015 | | | 2014 | | | 2013 | | | 2012 | |
Net asset value, beginning of period | | | $41.90 | | | | $47.93 | | | | $49.54 | | | | $37.67 | | | | $29.10 | |
Net investment income (loss) | | | (0.21 | )1 | | | (0.29 | ) | | | (0.43 | )1 | | | 0.01 | 1 | | | (0.18 | ) |
Net realized and unrealized gains (losses) on investments | | | 3.61 | | | | 0.18 | | | | 3.00 | | | | 11.86 | | | | 8.75 | |
| | | | | | | | | | | | | | | | | | | | |
Total from investment operations | | | 3.40 | | | | (0.11 | ) | | | 2.57 | | | | 11.87 | | | | 8.57 | |
Distributions to shareholders from | | | | | | | | | | | | | | | | | | | | |
Net realized gains | | | (3.36 | ) | | | (5.92 | ) | | | (4.18 | ) | | | 0.00 | | | | 0.00 | |
Net asset value, end of period | | | $41.94 | | | | $41.90 | | | | $47.93 | | | | $49.54 | | | | $37.67 | |
Total return2 | | | 8.63 | % | | | (0.67 | )% | | | 5.27 | % | | | 31.55 | % | | | 29.46 | % |
Ratios to average net assets (annualized) | | | | | | | | | | | | | | | | | | | | |
Gross expenses | | | 1.26 | % | | | 1.29 | % | | | 1.29 | % | | | 1.30 | % | | | 1.29 | % |
Net expenses | | | 1.18 | % | | | 1.18 | % | | | 1.18 | % | | | 1.18 | % | | | 1.18 | % |
Net investment income (loss) | | | (0.52 | )% | | | (0.60 | )% | | | (0.87 | )% | | | 0.01 | % | | | (0.49 | )% |
Supplemental data | | | | | | | | | | | | | | | | | | | | |
Portfolio turnover rate | | | 99 | % | | | 101 | % | | | 98 | % | | | 91 | % | | | 102 | % |
Net assets, end of period (000s omitted) | | | $542,077 | | | | $370,743 | | | | $417,971 | | | | $427,860 | | | | $359,068 | |
| 1 | Calculated based upon average shares outstanding |
| 2 | Total return calculations do not include any sales charges. |
The accompanying notes are an integral part of these financial statements.
| | | | | | |
| Financial highlights | | Wells Fargo Enterprise Fund | | | 17 | |
(For a share outstanding throughout each period)
| | | | | | | | | | | | | | | | | | | | |
| | | Year ended September 30 | |
| CLASS B | | 2016 | | | 2015 | | | 2014 | | | 2013 | | | 2012 | |
Net asset value, beginning of period | | | $38.75 | | | | $45.06 | | | | $47.14 | | | | $36.11 | | | | $28.10 | |
Net investment loss | | | (0.48 | )1 | | | (0.58 | )1 | | | (0.76 | )1 | | | (0.27 | )1 | | | (0.42 | )1 |
Net realized and unrealized gains (losses) on investments | | | 3.30 | | | | 0.19 | | | | 2.86 | | | | 11.30 | | | | 8.43 | |
| | | | | | | | | | | | | | | | | | | | |
Total from investment operations | | | 2.82 | | | | (0.39 | ) | | | 2.10 | | | | 11.03 | | | | 8.01 | |
Distributions to shareholders from | | | | | | | | | | | | | | | | | | | | |
Net realized gains | | | (3.36 | ) | | | (5.92 | ) | | | (4.18 | ) | | | 0.00 | | | | 0.00 | |
Net asset value, end of period | | | $38.21 | | | | $38.75 | | | | $45.06 | | | | $47.14 | | | | $36.11 | |
Total return2 | | | 7.78 | % | | | (1.38 | )% | | | 4.46 | % | | | 30.55 | % | | | 28.51 | % |
Ratios to average net assets (annualized) | | | | | | | | | | | | | | | | | | | | |
Gross expenses | | | 2.01 | % | | | 2.04 | % | | | 2.04 | % | | | 2.05 | % | | | 2.04 | % |
Net expenses | | | 1.93 | % | | | 1.93 | % | | | 1.93 | % | | | 1.93 | % | | | 1.93 | % |
Net investment loss | | | (1.30 | )% | | | (1.34 | )% | | | (1.63 | )% | | | (0.68 | )% | | | (1.25 | )% |
Supplemental data | | | | | | | | | | | | | | | | | | | | |
Portfolio turnover rate | | | 99 | % | | | 101 | % | | | 98 | % | | | 91 | % | | | 102 | % |
Net assets, end of period (000s omitted) | | | $357 | | | | $886 | | | | $1,607 | | | | $2,723 | | | | $3,235 | |
| 1 | Calculated based upon average shares outstanding |
| 2 | Total return calculations do not include any sales charges. |
The accompanying notes are an integral part of these financial statements.
| | | | |
| 18 | | Wells Fargo Enterprise Fund | | Financial highlights |
(For a share outstanding throughout each period)
| | | | | | | | | | | | | | | | | | | | |
| | | Year ended September 30 | |
| CLASS C | | 2016 | | | 2015 | | | 2014 | | | 2013 | | | 2012 | |
Net asset value, beginning of period | | | $38.75 | | | | $45.07 | | | | $47.14 | | | | $36.11 | | | | $28.10 | |
Net investment loss | | | (0.47 | )1 | | | (0.59 | )1 | | | (0.75 | )1 | | | (0.29 | )1 | | | (0.42 | )1 |
Net realized and unrealized gains (losses) on investments | | | 3.31 | | | | 0.19 | | | | 2.86 | | | | 11.32 | | | | 8.43 | |
| | | | | | | | | | | | | | | | | | | | |
Total from investment operations | | | 2.84 | | | | (0.40 | ) | | | 2.11 | | | | 11.03 | | | | 8.01 | |
Distributions to shareholders from | | | | | | | | | | | | | | | | | | | | |
Net realized gains | | | (3.36 | ) | | | (5.92 | ) | | | (4.18 | ) | | | 0.00 | | | | 0.00 | |
Net asset value, end of period | | | $38.23 | | | | $38.75 | | | | $45.07 | | | | $47.14 | | | | $36.11 | |
Total return2 | | | 7.80 | % | | | (1.41 | )% | | | 4.49 | % | | | 30.55 | % | | | 28.51 | % |
Ratios to average net assets (annualized) | | | | | | | | | | | | | | | | | | | | |
Gross expenses | | | 2.01 | % | | | 2.04 | % | | | 2.04 | % | | | 2.05 | % | | | 2.04 | % |
Net expenses | | | 1.93 | % | | | 1.93 | % | | | 1.93 | % | | | 1.93 | % | | | 1.93 | % |
Net investment loss | | | (1.28 | )% | | | (1.36 | )% | | | (1.62 | )% | | | (0.72 | )% | | | (1.24 | )% |
Supplemental data | | | | | | | | | | | | | | | | | | | | |
Portfolio turnover rate | | | 99 | % | | | 101 | % | | | 98 | % | | | 91 | % | | | 102 | % |
Net assets, end of period (000s omitted) | | | $9,181 | | | | $9,399 | | | | $9,658 | | | | $8,483 | | | | $7,508 | |
| 1 | Calculated based upon average shares outstanding |
| 2 | Total return calculations do not include any sales charges. |
The accompanying notes are an integral part of these financial statements.
| | | | | | |
| Financial highlights | | Wells Fargo Enterprise Fund | | | 19 | |
(For a share outstanding throughout each period)
| | | | | | | | |
| | | Year ended September 30 | |
| CLASS R6 | | 2016 | | | 20151 | |
Net asset value, beginning of period | | | $44.89 | | | | $52.65 | |
Net investment loss | | | (0.06 | )2 | | | (0.08 | ) |
Net realized and unrealized gains (losses) on investments | | | 3.90 | | | | (1.76 | ) |
| | | | | | | | |
Total from investment operations | | | 3.84 | | | | (1.84 | ) |
Distributions to shareholders from | | | | | | | | |
Net realized gains | | | (3.36 | ) | | | (5.92 | ) |
Net asset value, end of period | | | $45.37 | | | | $44.89 | |
Total return3 | | | 9.06 | % | | | (3.84 | )% |
Ratios to average net assets (annualized) | | | | | | | | |
Gross expenses | | | 0.83 | % | | | 0.81 | % |
Net expenses | | | 0.80 | % | | | 0.80 | % |
Net investment loss | | | (0.14 | )% | | | (0.19 | )% |
Supplemental data | | | | | | | | |
Portfolio turnover rate | | | 99 | % | | | 101 | % |
Net assets, end of period (000s omitted) | | | $29,861 | | | | $24 | |
| 1 | For the period from October 31, 2014 (commencement of class operations) to September 30, 2015 |
| 2 | Calculated based upon average shares outstanding |
| 3 | Returns for periods of less than one year are not annualized. |
The accompanying notes are an integral part of these financial statements.
| | | | |
| 20 | | Wells Fargo Enterprise Fund | | Financial highlights |
(For a share outstanding throughout each period)
| | | | | | | | | | | | | | | | | | | | |
| | | Year ended September 30 | |
| ADMINISTRATOR CLASS | | 2016 | | | 2015 | | | 2014 | | | 2013 | | | 2012 | |
Net asset value, beginning of period | | | $43.58 | | | | $49.54 | | | | $51.03 | | | | $38.77 | | | | $29.93 | |
Net investment income (loss) | | | (0.18 | )1 | | | (0.23 | )1 | | | (0.37 | )1 | | | 0.02 | 1 | | | (0.16 | )1 |
Net realized and unrealized gains (losses) on investments | | | 3.77 | | | | 0.19 | | | | 3.06 | | | | 12.24 | | | | 9.00 | |
| | | | | | | | | | | | | | | | | | | | |
Total from investment operations | | | 3.59 | | | | (0.04 | ) | | | 2.69 | | | | 12.26 | | | | 8.84 | |
Distributions to shareholders from | | | | | | | | | | | | | | | | | | | | |
Net realized gains | | | (3.36 | ) | | | (5.92 | ) | | | (4.18 | ) | | | 0.00 | | | | 0.00 | |
Net asset value, end of period | | | $43.81 | | | | $43.58 | | | | $49.54 | | | | $51.03 | | | | $38.77 | |
Total return | | | 8.74 | % | | | (0.46 | )% | | | 5.33 | % | | | 31.62 | % | | | 29.54 | % |
Ratios to average net assets (annualized) | | | | | | | | | | | | | | | | | | | | |
Gross expenses | | | 1.15 | % | | | 1.09 | % | | | 1.12 | % | | | 1.13 | % | | | 1.12 | % |
Net expenses | | | 1.07 | % | | | 1.07 | % | | | 1.09 | % | | | 1.11 | % | | | 1.12 | % |
Net investment income (loss) | | | (0.41 | )% | | | (0.47 | )% | | | (0.74 | )% | | | 0.05 | % | | | (0.46 | )% |
Supplemental data | | | | | | | | | | | | | | | | | | | | |
Portfolio turnover rate | | | 99 | % | | | 101 | % | | | 98 | % | | | 91 | % | | | 102 | % |
Net assets, end of period (000s omitted) | | | $4,693 | | | | $3,542 | | | | $44,760 | | | | $10,046 | | | | $6,757 | |
| 1 | Calculated based upon average shares outstanding |
The accompanying notes are an integral part of these financial statements.
| | | | | | |
| Financial highlights | | Wells Fargo Enterprise Fund | | | 21 | |
(For a share outstanding throughout each period)
| | | | | | | | | | | | | | | | | | | | |
| | | Year ended September 30 | |
| INSTITUTIONAL CLASS | | 2016 | | | 2015 | | | 2014 | | | 2013 | | | 2012 | |
Net asset value, beginning of period | | | $44.87 | | | | $50.77 | | | | $52.07 | | | | $39.46 | | | | $30.38 | |
Net investment income (loss) | | | (0.09 | )1 | | | (0.13 | )1 | | | (0.28 | )1 | | | 0.18 | 1 | | | (0.06 | )1 |
Net realized and unrealized gains (losses) on investments | | | 3.90 | | | | 0.15 | | | | 3.16 | | | | 12.43 | | | | 9.14 | |
| | | | | | | | | | | | | | | | | | | | |
Total from investment operations | | | 3.81 | | | | 0.02 | | | | 2.88 | | | | 12.61 | | | | 9.08 | |
Distributions to shareholders from | | | | | | | | | | | | | | | | | | | | |
Net realized gains | | | (3.36 | ) | | | (5.92 | ) | | | (4.18 | ) | | | 0.00 | | | | 0.00 | |
Net asset value, end of period | | | $45.32 | | | | $44.87 | | | | $50.77 | | | | $52.07 | | | | $39.46 | |
Total return | | | 8.97 | % | | | (0.32 | )% | | | 5.61 | % | | | 31.96 | % | | | 29.89 | % |
Ratios to average net assets (annualized) | | | | | | | | | | | | | | | | | | | | |
Gross expenses | | | 0.93 | % | | | 0.88 | % | | | 0.86 | % | | | 0.87 | % | | | 0.86 | % |
Net expenses | | | 0.85 | % | | | 0.85 | % | | | 0.85 | % | | | 0.85 | % | | | 0.85 | % |
Net investment income (loss) | | | (0.21 | )% | | | (0.27 | )% | | | (0.54 | )% | | | 0.41 | % | | | (0.17 | )% |
Supplemental data | | | | | | | | | | | | | | | | | | | | |
Portfolio turnover rate | | | 99 | % | | | 101 | % | | | 98 | % | | | 91 | % | | | 102 | % |
Net assets, end of period (000s omitted) | | | $61,563 | | | | $87,279 | | | | $76,790 | | | | $81,021 | | | | $93,367 | |
| 1 | Calculated based upon average shares outstanding |
The accompanying notes are an integral part of these financial statements.
| | | | |
| 22 | | Wells Fargo Enterprise Fund | | Notes to financial statements |
1. ORGANIZATION
Wells Fargo Funds Trust (the “Trust”), a Delaware statutory trust organized on March 10, 1999, is an open-end management investment company registered under the Investment Company Act of 1940, as amended (the “1940 Act”). As an investment company, the Trust follows the accounting and reporting guidance in Financial Accounting Standards Board (“FASB”) Accounting Standards Codification Topic 946, Financial Services – Investment Companies. These financial statements report on the Wells Fargo Enterprise Fund (the “Fund”) which is a diversified series of the Trust.
Effective at the close of business on October 23, 2015, Investor Class shares became Class A shares in a tax-free conversion. Shareholders of Investor Class received Class A shares at a value equal to the value of their Investor Class shares immediately prior to the conversion. Investor Class shares are no longer offered by the Fund.
2. SIGNIFICANT ACCOUNTING POLICIES
The following significant accounting policies, which are consistently followed in the preparation of the financial statements of the Fund, are in conformity with U.S. generally accepted accounting principles which require management to make estimates and assumptions that affect the reported amounts of assets and liabilities, disclosure of contingent assets and liabilities at the date of the financial statements, and the reported amounts of revenues and expenses during the reporting period. Actual results could differ from those estimates.
Securities valuation
All investments are valued each business day as of the close of regular trading on the New York Stock Exchange (generally 4 p.m. Eastern Time), although the Fund may deviate from this calculation time under unusual or unexpected circumstances.
Equity securities that are listed on a foreign or domestic exchange or market are valued at the official closing price or, if none, the last sales price. If no sale occurs on the principal exchange or market that day, the prior day’s price will be deemed “stale” and a fair value price will be determined in accordance with the Fund’s Valuation Procedures.
Investments in registered open-end investment companies are valued at net asset value. Interests in non-registered investment vehicles that are redeemable at net asset value are fair valued normally at net asset value.
Investments which are not valued using any of the methods discussed above are valued at their fair value, as determined in good faith by the Board of Trustees of the Fund. The Board of Trustees has established a Valuation Committee comprised of the Trustees and has delegated to it the authority to take any actions regarding the valuation of portfolio securities that the Valuation Committee deems necessary or appropriate, including determining the fair value of portfolio securities, unless the determination has been delegated to the Management Valuation Team of Wells Fargo Funds Management, LLC (“Funds Management”). The Board of Trustees retains the authority to make or ratify any valuation decisions or approve any changes to the Valuation Procedures as it deems appropriate. On a quarterly basis, the Board of Trustees receives reports on any valuation actions taken by the Valuation Committee or the Management Valuation Team which may include items for ratification.
Valuations of fair valued securities are compared to the next actual sales price when available, or other appropriate market values, to assess the continued appropriateness of the fair valuation methodologies used. These securities are fair valued on a day-to-day basis, taking into consideration changes to appropriate market information and any significant changes to the inputs considered in the valuation process until there is a readily available price provided on an exchange or by an independent pricing service. Valuations received from an independent pricing service or independent broker-dealer quotes are periodically validated by comparisons to most recent trades and valuations provided by other independent pricing services in addition to the review of prices by the manager and/or subadviser. Unobservable inputs used in determining fair valuations are identified based on the type of security, taking into consideration factors utilized by market participants in valuing the investment, knowledge about the issuer and the current market environment.
Security loans
The Fund may lend its securities from time to time in order to earn additional income in the form of fees or interest on securities received as collateral or the investment of any cash received as collateral. The Fund continues to receive interest or dividends on the securities loaned. The Fund receives collateral in the form of cash or securities with a value at least equal to the value of the securities on loan. The value of the loaned securities is determined at the close of each business day and any additional required collateral is delivered to the Fund on the next business day. In a securities lending transaction, the net asset value of the Fund will be affected by an increase or decrease in the value of the securities loaned and by an increase or decrease in the value of the instrument in which collateral is invested. The amount of securities lending activity undertaken by the Fund fluctuates from time to time. In the event of default or bankruptcy
| | | | | | |
| Notes to financial statements | | Wells Fargo Enterprise Fund | | | 23 | |
by the borrower, the Fund may be prevented from recovering the loaned securities or gaining access to the collateral or may experience delays or costs in doing so. In addition, the investment of any cash collateral received may lose all or part of its value. The Fund has the right under the lending agreement to recover the securities from the borrower on demand.
The Fund lends its securities through an unaffiliated securities lending agent. Cash collateral received in connection with its securities lending transactions is invested in Securities Lending Cash Investments, LLC (the “Securities Lending Fund”). The Securities Lending Fund is exempt from registration under Section 3(c)(7) of the 1940 Act and is managed by Funds Management and is subadvised by Wells Capital Management Incorporated (“WellsCap”), an affiliate of Funds Management and an indirect wholly owned subsidiary of Wells Fargo & Company (“Wells Fargo”). Funds Management receives an advisory fee starting at 0.05% and declining to 0.01% as the average daily net assets of the Securities Lending Fund increase. All of the fees received by Funds Management are paid to WellsCap for its services as subadviser. The Securities Lending Fund seeks to provide a positive return compared to the daily Fed Funds Open rate by investing in high-quality, U.S. dollar-denominated short-term money market instruments. Securities Lending Fund investments are fair valued based upon the amortized cost valuation technique. Income earned from investment in the Securities Lending Fund is included in securities lending income on the Statement of Operations.
Security transactions and income recognition
Securities transactions are recorded on a trade date basis. Realized gains or losses are recorded on the basis of identified cost.
Dividend income is recognized on the ex-dividend date. Dividend income is recorded net of foreign taxes withheld where recovery of such taxes is not assured.
Distributions to shareholders
Distributions to shareholders from net investment income and net realized gains, if any, are recorded on the ex-dividend date. Such distributions are determined in conformity with federal income tax regulations, which may differ in amount or character from net investment income and realized gains recognized for purposes of U.S. generally accepted accounting principles.
Federal and other taxes
The Fund intends to continue to qualify as a regulated investment company by distributing substantially all of its investment company taxable income and any net realized capital gains (after reduction for capital loss carryforwards) sufficient to relieve it from all, or substantially all, federal income taxes. Accordingly, no provision for federal income taxes was required.
The Fund’s income and federal excise tax returns and all financial records supporting those returns for the prior three fiscal years are subject to examination by the federal and Delaware revenue authorities. Management has analyzed the Fund’s tax positions taken on federal, state, and foreign tax returns for all open tax years and does not believe that there are any uncertain tax positions that require recognition of a tax liability.
Reclassifications are made to the Fund’s capital accounts for permanent tax differences to reflect income and gains available for distribution (or available capital loss carryforwards) under federal income tax regulations. U.S. generally accepted accounting principles require that certain components of net assets be adjusted to reflect permanent differences between financial and tax reporting. These reclassifications have no effect on net assets or net asset values per share. The primary permanent difference causing such reclassifications is due to net operating losses. At September 30, 2016, as a result of permanent book-to-tax differences, the following reclassification adjustments were made on the Statement of Assets and Liabilities:
| | |
| Paid-in capital | | Accumulated net
investment loss |
| $(5,281,198) | | $5,281,198 |
As of September 30, 2016, the Fund had a qualified late-year ordinary loss of $2,178,411 which will be recognized on the first day of the following fiscal year.
Class allocations
The separate classes of shares offered by the Fund differ principally in applicable sales charges, distribution, shareholder servicing, and administration fees. Class specific expenses are charged directly to that share class. Investment income, common expenses, and realized and unrealized gains (losses) on investments are allocated daily to each class of shares based on the relative proportion of net assets of each class.
| | | | |
| 24 | | Wells Fargo Enterprise Fund | | Notes to financial statements |
3. FAIR VALUATION MEASUREMENTS
Fair value measurements of investments are determined within a framework that has established a fair value hierarchy based upon the various data inputs utilized in determining the value of the Fund’s investments. The three-level hierarchy gives the highest priority to unadjusted quoted prices in active markets for identical assets or liabilities (Level 1) and the lowest priority to significant unobservable inputs (Level 3). The Fund’s investments are classified within the fair value hierarchy based on the lowest level of input that is significant to the fair value measurement. The inputs are summarized into three broad levels as follows:
| n | | Level 1 – quoted prices in active markets for identical securities |
| n | | Level 2 – other significant observable inputs (including quoted prices for similar securities, interest rates, prepayment speeds, credit risk, use of amortized cost, etc.) |
| n | | Level 3 – significant unobservable inputs (including the Fund’s own assumptions in determining the fair value of investments) |
The inputs or methodologies used for valuing investments in securities are not necessarily an indication of the risk associated with investing in those securities.
The following is a summary of the inputs used in valuing the Fund’s assets and liabilities as of September 30, 2016:
| | | | | | | | | | | | | | | | |
| | | Quoted prices
(Level 1) | | | Other significant
observable inputs
(Level 2) | | | Significant
unobservable inputs (Level 3) | | | Total | |
Assets | | | | | | | | | | | | | | | | |
Investments in: | | | | | | | | | | | | | | | | |
| | | | |
Common stocks | | | | | | | | | | | | | | | | |
Consumer discretionary | | $ | 135,692,883 | | | $ | 0 | | | $ | 0 | | | $ | 135,692,883 | |
Consumer staples | | | 32,190,465 | | | | 0 | | | | 0 | | | | 32,190,465 | |
Energy | | | 4,633,920 | | | | 0 | | | | 0 | | | | 4,633,920 | |
Financials | | | 39,754,750 | | | | 0 | | | | 0 | | | | 39,754,750 | |
Health care | | | 84,526,858 | | | | 0 | | | | 0 | | | | 84,526,858 | |
Industrials | | | 115,801,993 | | | | 0 | | | | 0 | | | | 115,801,993 | |
Information technology | | | 181,470,425 | | | | 0 | | | | 0 | | | | 181,470,425 | |
Materials | | | 29,372,837 | | | | 0 | | | | 0 | | | | 29,372,837 | |
Real estate | | | 9,513,620 | | | | 0 | | | | 0 | | | | 9,513,620 | |
Telecommunication services | | | 14,373,668 | | | | 0 | | | | 0 | | | | 14,373,668 | |
| | | | |
Short-term investments | | | | | | | | | | | | | | | | |
Investment companies | | | 4,723,179 | | | | 0 | | | | 0 | | | | 4,723,179 | |
Investments measured at net asset value* | | | | | | | | | | | | | | | 1,020,000 | |
Total assets | | $ | 652,054,598 | | | $ | 0 | | | $ | 0 | | | $ | 653,074,598 | |
| * | Investments that are measured at fair value using the net asset value per share (or its equivalent) as a practical expedient have not been categorized in the fair value hierarchy. The fair value amount presented in the table is intended to permit reconciliation of the fair value hierarchy to the amounts presented in the Statement of Assets and Liabilities. The Fund’s investment in Securities Lending Cash Investments, LLC valued at $1,020,000 does not have a redemption period notice, can be redeemed daily and does not have any unfunded commitments. |
The Fund recognizes transfers between levels within the fair value hierarchy at the end of the reporting period. At September 30, 2016, the Fund did not have any transfers into/out of Level 1, Level 2, or Level 3.
4. TRANSACTIONS WITH AFFILIATES
Management fee
Funds Management, an indirect wholly owned subsidiary of Wells Fargo, is the manager of the Fund and provides advisory and fund-level administrative services under an investment management agreement. Under the investment management agreement, Funds Management is responsible for, among other services, implementing the investment objectives and strategies of the Fund, supervising the subadviser, providing fund-level administrative services in connection with the Fund’s operations, and providing any other fund-level administrative services reasonably necessary for the operation of the Fund. As compensation for its services under the investment management agreement, Funds
| | | | | | |
| Notes to financial statements | | Wells Fargo Enterprise Fund | | | 25 | |
Management is entitled to receive an annual management fee starting at 0.75% and declining to 0.63% as the average daily net assets of the Fund increase. For the year ended September 30, 2016, the management fee was equivalent to an annual rate of 0.74% of the Fund’s average daily net assets.
Funds Management has retained the services of a subadviser to provide daily portfolio management to the Fund. The fee for subadvisory services is borne by Funds Management. WellsCap is the subadviser to the Fund and is entitled to receive a fee from Funds Management at an annual rate starting at 0.45% and declining to 0.30% as the average daily net assets of the Fund increase.
Administration fees
Under a class-level administration agreement, Funds Management provides class-level administrative services to the Fund, which includes paying fees and expenses for services provided by the transfer agent, sub-transfer agents, omnibus account servicers and record-keepers. As compensation for its services under the class-level administration agreement, Funds Management receives an annual fee which is calculated based on the average daily net assets of each class as follows:
| | | | |
| | | Class-level
administration fee | |
Class A, Class B, Class C | | | 0.21 | % |
Class R6 | | | 0.03 | |
Administrator Class, Institutional Class | | | 0.13 | |
Investor Class | | | 0.32 | |
Funds Management has contractually waived and/or reimbursed management and administration fees to the extent necessary to maintain certain net operating expense ratios for the Fund. Waiver of fees and/or reimbursement of expenses by Funds Management were made first from fund level expenses on a proportionate basis and then from class specific expenses. Funds Management has committed through January 31, 2017 to waive fees and/or reimburse expenses to the extent necessary to cap the Fund’s expenses at 1.18% for Class A shares, 1.93% for Class B shares, 1.93% for Class C shares, 0.80% for Class R6 shares, 1.10% for Administrator Class shares, and 0.85% for Institutional Class shares. After this time, the cap may be increased or the commitment to maintain the cap may be terminated only with the approval of the Board of Trustees.
Distribution fees
The Trust has adopted a distribution plan for Class B and Class C shares of the Fund pursuant to Rule 12b-1 under the 1940 Act. Distribution fees are charged to Class B and Class C shares and paid to Wells Fargo Funds Distributor, LLC (“Funds Distributor”), the principal underwriter, at an annual rate of 0.75% of the average daily net assets of Class B and Class C shares.
In addition, Funds Distributor is entitled to receive the front-end sales charge from the purchase of Class A shares and a contingent deferred sales charge on the redemption of certain Class A shares. Funds Distributor is also entitled to receive the contingent deferred sales charges from redemptions of Class B and Class C shares. For the year ended September 30, 2016, Funds Distributor received $4,109 from the sale of Class A shares and $24, in contingent deferred sales charges from redemptions of Class A.
Shareholder servicing fees
The Trust has entered into contracts with one or more shareholder servicing agents, whereby Class A, Class B, Class C, Administrator Class, and Investor Class of the Fund are charged a fee at an annual rate of 0.25% of the average daily net assets of each respective class.
A portion of these total shareholder servicing fees were paid to affiliates of Wells Fargo.
5. INVESTMENT PORTFOLIO TRANSACTIONS
Purchases and sales of investments, excluding U.S. government obligations (if any) and short-term securities, for the year ended September 30, 2016 were $624,812,804 and $677,006,450, respectively.
The Fund may purchase or sell investment securities to other Wells Fargo funds under procedures adopted by the Board of Trustees. The procedures have been designed to ensure that these interfund transactions, which generally do not incur broker commissions, are effected at current market prices. Interfund trades are included within the respective purchases and sales amounts shown.
| | | | |
| 26 | | Wells Fargo Enterprise Fund | | Notes to financial statements |
6. BANK BORROWINGS
The Trust (excluding the money market funds and certain other funds) and Wells Fargo Variable Trust are parties to a $250,000,000 revolving credit agreement whereby the Fund is permitted to use bank borrowings for temporary or emergency purposes, such as to fund shareholder redemption requests. Interest under the credit agreement is charged to the Fund based on a borrowing rate equal to the higher of the Federal Funds rate in effect on that day plus 1.25% or the overnight LIBOR rate in effect on that day plus 1.25%. In addition, an annual commitment fee equal to 0.25% of the unused balance is allocated to each participating fund. Prior to August 30, 2016, the revolving credit agreement amount was $200,000,000 and the annual commitment fee was equal to 0.20% of the unused balance which was allocated to each participating fund.
For the year ended September 30, 2016, there were no borrowings by the Fund under the agreement.
7. DISTRIBUTIONS TO SHAREHOLDERS
The tax character of distributions paid was $50,597,868 and $90,466,590 of long-term capital gain for the years ended September 30, 2016 and September 30, 2015, respectively.
As of September 30, 2016, the components of distributable earnings on a tax basis were as follows:
| | | | |
Undistributed long-term gain | | Unrealized gains | | Late-year ordinary losses deferred |
| $18,415,315 | | $93,117,518 | | $(2,178,411) |
8. CONCENTRATION RISK
Concentration risks result from exposure to a limited number of sectors. A fund that invests a substantial portion of its assets in any sector may be more affected by changes in that sector than would be a fund whose investments are not heavily weighted in any sector.
9. INDEMNIFICATION
Under the Trust’s organizational documents, the officers and Trustees have been granted certain indemnification rights against certain liabilities that may arise out of performance of their duties to the Trust. Additionally, in the normal course of business, the Trust may enter into contracts with service providers that contain a variety of indemnification clauses. The Trust’s maximum exposure under these arrangements is dependent on future claims that may be made against the Fund and, therefore, cannot be estimated.
| | | | | | |
| Report of independent registered public accounting firm | | Wells Fargo Enterprise Fund | | | 27 | |
BOARD OF TRUSTEES AND SHAREHOLDERS OF WELLS FARGO FUNDS TRUST:
We have audited the accompanying statement of assets and liabilities, including the portfolio of investments, of the Wells Fargo Enterprise Fund (formerly known as Wells Fargo Advantage Enterprise Fund) (the “Fund”), one of the funds constituting the Wells Fargo Funds Trust, as of September 30, 2016, and the related statement of operations for the year then ended, the statements of changes in net assets for each of the years in the two-year period then ended, and the financial highlights for each of the years or periods in the five-year period then ended. These financial statements and financial highlights are the responsibility of the Fund’s management. Our responsibility is to express an opinion on these financial statements and financial highlights based on our audits.
We conducted our audits in accordance with the standards of the Public Company Accounting Oversight Board (United States). Those standards require that we plan and perform the audit to obtain reasonable assurance about whether the financial statements and financial highlights are free of material misstatement. An audit includes examining, on a test basis, evidence supporting the amounts and disclosures in the financial statements. Our procedures included confirmation of securities owned as of September 30, 2016, by correspondence with the custodian and brokers, or by other appropriate auditing procedures. An audit also includes assessing the accounting principles used and significant estimates made by management, as well as evaluating the overall financial statement presentation. We believe that our audits provide a reasonable basis for our opinion.
In our opinion, the financial statements and financial highlights referred to above present fairly, in all material respects, the financial position of the Wells Fargo Enterprise Fund as of September 30, 2016, the results of its operations for the year then ended, the changes in its net assets for each of the years in the two-year period then ended, and the financial highlights for each of the years or periods in the five-year period then ended, in conformity with U.S. generally accepted accounting principles.

Boston, Massachusetts
November 23, 2016
| | | | |
| 28 | | Wells Fargo Enterprise Fund | | Other information (unaudited) |
TAX INFORMATION
Pursuant to Section 852 of the Internal Revenue Code, $50,597,868 was designated as a 20% rate gain distribution for the fiscal year ended September 30, 2016.
PROXY VOTING INFORMATION
A description of the policies and procedures that the Fund uses to determine how to vote proxies relating to portfolio securities is available, upon request, by calling 1-800-222-8222, visiting our website at wellsfargofunds.com, or visiting the SEC website at sec.gov. Information regarding how the Fund voted proxies relating to portfolio securities during the most recent 12-month period ended June 30 is available on the Fund’s website at wellsfargofunds.com or by visiting the SEC website at sec.gov.
PORTFOLIO HOLDINGS INFORMATION
The complete portfolio holdings for the Fund are publicly available monthly on the Fund’s website (wellsfargofunds.com), on a one-month delayed basis. In addition, top ten holdings information (excluding derivative positions) for the Fund is publicly available on the Fund’s website on a monthly, seven-day or more delayed basis. The Fund files its complete schedule of portfolio holdings with the SEC for the first and third quarters of each fiscal year on Form N-Q, which is available by visiting the SEC website at sec.gov. In addition, the Fund’s Form N-Q may be reviewed and copied at the SEC’s Public Reference Room in Washington, DC, and at regional offices in New York City, at 233 Broadway, and in Chicago, at 175 West Jackson Boulevard, Suite 900. Information about the Public Reference Room may be obtained by calling 1-800-SEC-0330
| | | | | | |
| Other information (unaudited) | | Wells Fargo Enterprise Fund | | | 29 | |
BOARD OF TRUSTEES AND OFFICERS
Each of the Trustees and Officers1 listed in the table below acts in identical capacities for each fund in the Wells Fargo family of funds, which consists of 138 mutual funds comprising the Wells Fargo Funds Trust, Wells Fargo Variable Trust, Wells Fargo Master Trust and four closed-end funds (collectively the “Fund Complex”). This table should be read in conjunction with the Prospectus and the Statement of Additional Information2. The mailing address of each Trustee and Officer is 525 Market Street, 12th Floor, San Francisco, CA 94105. Each Trustee and Officer serves an indefinite term, however, each Trustee serves such term until reaching the mandatory retirement age established by the Trustees.
Independent Trustees
| | | | | | |
Name and year of birth | | Position held and length of service* | | Principal occupations during past five years or longer | | Current other
public company or
investment company
directorships |
William R. Ebsworth
(Born 1957) | | Trustee, since 2015 | | Retired. From 1984 to 2013, equities analyst, portfolio manager, research director and chief financial officer at Fidelity Management and Research Company in Boston, Tokyo, and Hong Kong and retired in 2013 as Chief Investment Officer of Fidelity Strategic Advisers, Inc. where he lead a team of investment professionals managing client assets. Prior thereto, Board member of Hong Kong Securities Clearing Co., Hong Kong Options Clearing Corp., the Thailand International Fund, Ltd., Fidelity Investments Life Insurance Company, and Empire Fidelity Investments Life Insurance Company. Mr. Ebsworth is a CFA® charterholder and an Adjunct Lecturer, Finance, at Babson College. | | Asset Allocation Trust |
Jane A. Freeman
(Born 1953) | | Trustee, since 2015 | | Retired. From 2012 to 2014 and 1999 to 2008, Chief Financial Officer of Scientific Learning Corporation. From 2008 to 2012, Ms. Freeman provided consulting services related to strategic business projects. Prior to 1999, Portfolio Manager at Rockefeller & Co. and Scudder, Stevens & Clark. Board member of the Harding Loevner Funds from 1996 to 2014, serving as both Lead Independent Director and chair of the Audit Committee. Board member of the Russell Exchange Traded Funds Trust from 2011 to 2012 and the chair of the Audit Committee. Ms. Freeman is a Board Member of Ruth Bancroft Garden (non-profit organization) and an inactive chartered financial analyst. | | Asset Allocation Trust |
Peter G. Gordon (Born 1942) | | Trustee, since 1998; Chairman, since 2005 | | Co-Founder, Retired Chairman, President and CEO of Crystal Geyser Water Company. Trustee Emeritus, Colby College. | | Asset Allocation Trust |
Isaiah Harris, Jr. (Born 1952) | | Trustee, since 2009 | | Retired. Chairman of the Board of CIGNA Corporation since 2009, and Director since 2005. From 2003 to 2011, Director of Deluxe Corporation. Prior thereto, President and CEO of BellSouth Advertising and Publishing Corp. from 2005 to 2007, President and CEO of BellSouth Enterprises from 2004 to 2005 and President of BellSouth Consumer Services from 2000 to 2003. Emeritus member of the Iowa State University Foundation Board of Governors. Emeritus Member of the Advisory Board of Iowa State University School of Business. Advisory Board Member, Palm Harbor Academy (charter school). Advisory Board Member, Child Evangelism Fellowship (non-profit). Mr. Harris is a certified public accountant (inactive status). | | CIGNA Corporation; Asset Allocation Trust |
Judith M. Johnson (Born 1949) | | Trustee, since 2008; Audit Committee Chairman, since 2008 | | Retired. Prior thereto, Chief Executive Officer and Chief Investment Officer of Minneapolis Employees Retirement Fund from 1996 to 2008. Ms. Johnson is an attorney, certified public accountant and a certified managerial accountant. | | Asset Allocation Trust |
David F. Larcker (Born 1950) | | Trustee, since 2009 | | James Irvin Miller Professor of Accounting at the Graduate School of Business, Stanford University, Director of the Corporate Governance Research Initiative and Senior Faculty of The Rock Center for Corporate Governance since 2006. From 2005 to 2008, Professor of Accounting at the Graduate School of Business, Stanford University. Prior thereto, Ernst & Young Professor of Accounting at The Wharton School, University of Pennsylvania from 1985 to 2005. | | Asset Allocation Trust |
| | | | |
| 30 | | Wells Fargo Enterprise Fund | | Other information (unaudited) |
| | | | | | |
Name and year of birth | | Position held and length of service* | | Principal occupations during past five years or longer | | Current other
public company or
investment company
directorships |
Olivia S. Mitchell (Born 1953) | | Trustee, since 2006 | | International Foundation of Employee Benefit Plans Professor, Wharton School of the University of Pennsylvania since 1993. Director of Wharton’s Pension Research Council and Boettner Center on Pensions & Retirement Research, and Research Associate at the National Bureau of Economic Research. Previously, Cornell University Professor from 1978 to 1993. | | Asset Allocation Trust |
Timothy J. Penny (Born 1951) | | Trustee, since 1996 | | President and Chief Executive Officer of Southern Minnesota Initiative Foundation, a non-profit organization, since 2007 and Senior Fellow at the Humphrey Institute Policy Forum at the University of Minnesota since 1995. Member of the Board of Trustees of NorthStar Education Finance, Inc., a non-profit organization, since 2007. | | Asset Allocation Trust |
Michael S. Scofield (Born 1943) | | Trustee, since 2010 | | Served on the Investment Company Institute’s Board of Governors and Executive Committee from 2008-2011 as well the Governing Council of the Independent Directors Council from 2006-2011 and the Independent Directors Council Executive Committee from 2008-2011. Chairman of the IDC from 2008-2010. Institutional Investor (Fund Directions) Trustee of Year in 2007. Trustee of the Evergreen Funds complex (and its predecessors) from 1984 to 2010. Chairman of the Evergreen Funds from 2000-2010. Former Trustee of the Mentor Funds. Retired Attorney, Law Offices of Michael S. Scofield. | | Asset Allocation Trust |
| * | Length of service dates reflect the Trustee’s commencement of service with the Trust’s predecessor entities, where applicable. |
Officers
| | | | | | |
Name and year of birth | | Position held and length of service | | Principal occupations during past five years or longer | | |
Karla M. Rabusch (Born 1959) | | President, since 2003 | | Executive Vice President of Wells Fargo Bank, N.A. and President of Wells Fargo Funds Management, LLC since 2003. | | |
Nancy Wiser1 (Born 1967) | | Treasurer, since 2012 | | Executive Vice President of Wells Fargo Funds Management, LLC since 2011. Chief Operating Officer and Chief Compliance Officer at LightBox Capital Management LLC, from 2008 to 2011. | | |
C. David Messman (Born 1960) | | Secretary, since 2000; Chief Legal Officer, since 2003 | | Senior Vice President and Secretary of Wells Fargo Funds Management, LLC since 2001. Assistant General Counsel of Wells Fargo Bank, N.A. since 2013 and Vice President and Managing Counsel of Wells Fargo Bank, N.A. from 1996 to 2013. | | |
Michael Whitaker (Born 1967) | | Chief Compliance Officer, since 20163 | | Executive Vice President of Wells Fargo Funds Management, LLC since 2016. Chief Compliance Officer of Fidelity’s Fixed Income Funds and Asset Allocation Funds from 2008 to 2016, Compliance Officer of FMR Co., Inc. from 2014 to 2016, Fidelity Investments Money Management, Inc. from 2014 to 2016, Fidelity Investments from 2007 to 2016. | | |
David Berardi (Born 1975) | | Assistant Treasurer, since 2009 | | Vice President of Wells Fargo Funds Management, LLC since 2009. Vice President of Evergreen Investment Management Company, LLC from 2008 to 2010. Manager of Fund Reporting and Control for Evergreen Investment Management Company, LLC from 2004 to 2010. | | |
Jeremy DePalma1 (Born 1974) | | Assistant Treasurer, since 2009 | | Senior Vice President of Wells Fargo Funds Management, LLC since 2009. Senior Vice President of Evergreen Investment Management Company, LLC from 2008 to 2010 and head of the Fund Reporting and Control Team within Fund Administration from 2005 to 2010. | | |
| 1 | Nancy Wiser acts as Treasurer of 70 funds in the Fund Complex. Jeremy DePalma acts as Treasurer of 68 funds and Assistant Treasurer of 70 funds in the Fund Complex. |
| 2 | The Statement of Additional Information includes additional information about the Trustees and is available, without charge, upon request, by calling 1-800-222-8222 or by visiting the website at wellsfargofunds.com. |
| 3 | Michael Whitaker became Chief Compliance Officer effective May 16, 2016. |
| | | | | | |
| Other information (unaudited) | | Wells Fargo Enterprise Fund | | | 31 | |
BOARD CONSIDERATION OF INVESTMENT MANAGEMENT AND SUB-ADVISORY AGREEMENTS:
Under the Investment Company Act of 1940 (the “1940 Act”), the Board of Trustees (the “Board”) of Wells Fargo Funds Trust (the “Trust”) must determine annually whether to approve the continuation of the Trust’s investment advisory and sub-advisory agreements. In this regard, at an in-person meeting held on May 24-25, 2016 (the “Meeting”), the Board, all the members of which have no direct or indirect interest in the investment advisory and sub-advisory agreements and are not “interested persons” of the Trust, as defined in the 1940 Act (the “Independent Trustees”), reviewed and approved for Wells Fargo Enterprise Fund (the “Fund”): (i) an investment management agreement (the “Management Agreement”) with Wells Fargo Funds Management, LLC (“Funds Management”); and (ii) an investment sub-advisory agreement (the “Sub-Advisory Agreement”) with Wells Capital Management Incorporated (the “Sub-Adviser”), an affiliate of Funds Management. The Management Agreement and the Sub-Advisory Agreement are collectively referred to as the “Advisory Agreements.”
At the Meeting, the Board considered the factors and reached the conclusions described below relating to the selection of Funds Management and the Sub-Adviser and the approval of the Advisory Agreements. Prior to the Meeting, including at an in-person meeting in April 2016, the Trustees conferred extensively among themselves and with representatives of Funds Management about these matters. Also, the Board has adopted a team-based approach, with each team consisting of a sub-set of Trustees, to assist the full Board in the discharge of its duties in reviewing performance and other matters throughout the year. The Independent Trustees were assisted in their evaluation of the Advisory Agreements by independent legal counsel, from whom they received separate legal advice and with whom they met separately.
In providing information to the Board, Funds Management and the Sub-Adviser were guided by a detailed set of requests for information submitted to them by independent legal counsel on behalf of the Independent Trustees at the start of the Board’s annual contract renewal process earlier in 2016. In considering and approving the Advisory Agreements, the Trustees considered the information they believed relevant, including but not limited to the information discussed below. The Board considered not only the specific information presented in connection with the Meeting, but also the knowledge gained over time through interaction with Funds Management and the Sub-Adviser about various topics. In this regard, the Board reviewed reports of Funds Management at each of its quarterly meetings, which included, among other things, portfolio reviews and performance reports. In addition, the Board and the teams mentioned above confer with portfolio managers at various times throughout the year. The Board did not identify any particular information or consideration that was all-important or controlling, and each individual Trustee may have attributed different weights to various factors.
After its deliberations, the Board unanimously approved the continuation of the Advisory Agreements for a one-year term and determined that the compensation payable to Funds Management and the Sub-Adviser under each of the Advisory Agreements was reasonable. The Board considered the approval of the Advisory Agreements for the Fund as part of its consideration of agreements for funds across the complex, but its approvals were made on a fund-by-fund basis. The following summarizes a number of important, but not necessarily all, factors considered by the Board in support of its approvals.
Nature, extent and quality of services
The Board received and considered various information regarding the nature, extent and quality of services provided to the Fund by Funds Management and the Sub-Adviser under the Advisory Agreements. This information included, among other things, a summary of the background and experience of senior management of Funds Management, and the qualifications, background, tenure and responsibilities of each of the portfolio managers primarily responsible for the day-to-day portfolio management of the Fund.
The Board evaluated the ability of Funds Management and the Sub-Adviser to attract and retain qualified investment professionals, including research, advisory and supervisory personnel. The Board further considered the compliance programs and compliance records of Funds Management and the Sub-Adviser. In addition, the Board took into account the full range of services provided to the Fund by Funds Management and its affiliates.
Fund performance and expenses
The Board considered the performance results for the Fund over various time periods ended December 31, 2015. The Board considered these results in comparison to the performance of funds in a universe that was determined by Broadridge Inc. (“Broadridge”) to be similar to the Fund (the “Universe”), and in comparison to the Fund’s benchmark index and to other comparative data. Broadridge is an independent provider of investment company data. The Board received a description of the methodology used by Broadridge to select the mutual funds in the performance Universe. The Board noted that the performance of the Fund (Administrator Class) was lower than the average performance of the Universe for all periods under
| | | | |
| 32 | | Wells Fargo Enterprise Fund | | Other information (unaudited) |
review except the ten-year period under review. The Board also noted that the performance of the Fund was lower than its benchmark, the Russell Midcap® Growth Index, for all periods under review.
The Board received information concerning, and discussed factors contributing to, the underperformance of the Fund relative to the Universe and benchmark for the periods noted above. The Board took note of the explanations for the relative underperformance in these periods, including with respect to market factors and investment decisions that affected the Fund’s performance.
The Board also received and considered information regarding the Fund’s net operating expense ratios and their various components, including actual management fees (which reflect fee waivers, if any, and include advisory, administration and transfer agent fees), custodian and other non-management fees, and Rule 12b-1 and non-Rule 12b-1 service fees. The Board considered these ratios in comparison to the median ratios of funds in class-specific expense groups that were determined by Broadridge to be similar to the Fund (the “Groups”). The Board received a description of the methodology used by Broadridge to select the mutual funds in the expense Groups and an explanation of how funds comprising expense groups and their expense ratios may vary from year-to-year. Based on the Broadridge reports, the Board noted that the net operating expense ratios of the Fund were lower than the median net operating expense ratios of the expense Groups.
The Board took into account the Fund performance and expense information provided to it among the factors considered in deciding to re-approve the Advisory Agreements.
Investment management and sub-advisory fee rates
The Board reviewed and considered the contractual investment advisory fee rates that are payable by the Fund to Funds Management for investment management services (the “Management Rates”). The Board noted that the Management Rates include transfer agency and sub-transfer agency costs. The Board also reviewed and considered the contractual investment sub-advisory fee rates that are payable by Funds Management to the Sub-Adviser for investment sub-advisory services.
Among other information reviewed by the Board was a comparison of the Management Rates of the Fund with those of other funds in the expense Groups at a common asset level. The Board noted that the Management Rates of the Fund were equal to or lower than the average rates for the Fund’s expense Groups for all share classes.
The Board also received and considered information about the portion of the total advisory fee that was retained by Funds Management after payment of the fee to the Sub-Adviser for sub-advisory services. In assessing the reasonableness of this amount, the Board received and evaluated information about the nature and extent of responsibilities retained and risks assumed by Funds Management and not delegated to or assumed by the Sub-Adviser, and about Funds Management’s on-going oversight services. However, given the affiliation between Funds Management and the Sub-Adviser, the Board ascribed limited relevance to the allocation of the advisory fee between them.
The Board also received and considered information about the nature and extent of services offered and fee rates charged by Funds Management and the Sub-Adviser to other types of clients with investment strategies similar to those of the Fund. In this regard, the Board received information about the significantly greater scope of services, and compliance, reporting and other legal burdens and risks of managing mutual funds compared with those associated with managing assets of non-mutual fund clients such as collective funds or institutional separate accounts.
Based on its consideration of the factors and information it deemed relevant, including those described here, the Board determined that the compensation payable to Funds Management under the Management Agreement and to the Sub-Adviser under the Sub-Advisory Agreement was reasonable, in light of the services covered by the Advisory Agreements.
Profitability
The Board received and considered information concerning the profitability of Funds Management, as well as the profitability of Wells Fargo as a whole, from providing services to the Fund and the fund family as a whole. The Board also received and considered information concerning the profitability of the Sub-Adviser from providing services to the fund family as a whole, noting that the Sub-Adviser’s profitability information with respect to providing services to the Fund was subsumed in the Wells Fargo profitability analysis.
Funds Management reported on the methodologies and estimates used in calculating profitability. Among other things, the Board noted that the levels of profitability reported on a fund-by-fund basis varied widely, depending on factors such as the size and type of fund. Based on its review, the Board did not deem the profits reported by Funds Management or Wells Fargo from its services to the Fund to be at a level that would prevent it from approving the continuation of the Advisory Agreements.
| | | | | | |
| Other information (unaudited) | | Wells Fargo Enterprise Fund | | | 33 | |
Economies of scale
With respect to possible economies of scale, the Board noted the existence of breakpoints in the Fund’s management fee structure, which operate generally to reduce the Fund’s expense ratios as the Fund grows in size. It considered that, for a small fund or a fund that shrinks in size, breakpoints conversely can result in higher fee levels. The Board also considered that fee waiver and expense reimbursement arrangements and competitive fee rates at the outset are means of sharing potential economies of scale with shareholders of the Fund and the fund family as a whole. The Board considered Funds Management’s view that any analyses of potential economies of scale in managing a particular fund are inherently limited in light of the joint and common costs and investments that Funds Management incurs across the fund family as a whole.
The Board concluded that the Fund’s fee and expense arrangements, including contractual breakpoints, constituted a reasonable approach to sharing potential economies of scale with the Fund and its shareholders.
Other benefits to Funds Management and the Sub-Adviser
The Board received and considered information regarding potential “fall-out” or ancillary benefits received by Funds Management and its affiliates, including the Sub-Adviser, as a result of their relationships with the Fund. Ancillary benefits could include, among others, benefits directly attributable to other relationships with the Fund and benefits potentially derived from an increase in Funds Management’s and the Sub-Adviser’s business as a result of their relationships with the Fund. The Board noted that various affiliates of Funds Management may receive distribution-related fees, shareholder servicing payments and sub-transfer agency fees in respect of shares sold or held through them and services provided.
The Board also reviewed information about soft dollar credits earned and utilized by the Sub-Adviser, fees earned by Funds Management and the Sub-Adviser from managing a private investment vehicle for the fund family’s securities lending collateral and commissions earned by an affiliated broker from portfolio transactions.
Based on its consideration of the factors and information it deemed relevant, including those described here, the Board did not find that any ancillary benefits received by Funds Management and its affiliates, including the Sub-Adviser, were unreasonable.
Conclusion
At the Meeting, after considering the above-described factors and based on its deliberations and its evaluation of the information described above, the Board unanimously approved the continuation of the Advisory Agreements for a one-year term and determined that the compensation payable to Funds Management and the Sub-Adviser under each of the Advisory Agreements was reasonable.
| | | | |
| 34 | | Wells Fargo Enterprise Fund | | List of abbreviations |
The following is a list of common abbreviations for terms and entities that may have appeared in this report.
| ACA | — ACA Financial Guaranty Corporation |
| ADR | — American depositary receipt |
| ADS | — American depositary shares |
| AGC | — Assured Guaranty Corporation |
| AGM | — Assured Guaranty Municipal |
| Ambac | — Ambac Financial Group Incorporated |
| AMT | — Alternative minimum tax |
| BAN | — Bond anticipation notes |
| BHAC | — Berkshire Hathaway Assurance Corporation |
| CAB | — Capital appreciation bond |
| CCAB | — Convertible capital appreciation bond |
| CDA | — Community Development Authority |
| CDO | — Collateralized debt obligation |
| DRIVER | — Derivative inverse tax-exempt receipts |
| DW&P | — Department of Water & Power |
| DWR | — Department of Water Resources |
| ECFA | — Educational & Cultural Facilities Authority |
| EDA | — Economic Development Authority |
| EDFA | — Economic Development Finance Authority |
| ETF | — Exchange-traded fund |
| FDIC | — Federal Deposit Insurance Corporation |
| FFCB | — Federal Farm Credit Banks |
| FGIC | — Financial Guaranty Insurance Corporation |
| FHA | — Federal Housing Administration |
| FHLB | — Federal Home Loan Bank |
| FHLMC | — Federal Home Loan Mortgage Corporation |
| FICO | — The Financing Corporation |
| FNMA | — Federal National Mortgage Association |
| GDR | — Global depositary receipt |
| GNMA | — Government National Mortgage Association |
| HCFR | — Healthcare facilities revenue |
| HEFA | — Health & Educational Facilities Authority |
| HEFAR | — Higher education facilities authority revenue |
| HFA | — Housing Finance Authority |
| HFFA | — Health Facilities Financing Authority |
| HUD | — Department of Housing and Urban Development |
| IDA | — Industrial Development Authority |
| IDAG | — Industrial Development Agency |
| KRW | — Republic of Korea won |
| LIBOR | — London Interbank Offered Rate |
| LIFER | — Long Inverse Floating Exempt Receipts |
| LLC | — Limited liability company |
| LLLP | — Limited liability limited partnership |
| LLP | — Limited liability partnership |
| MBIA | — Municipal Bond Insurance Association |
| MFHR | — Multifamily housing revenue |
| MSTR | — Municipal securities trust receipts |
| MUD | — Municipal Utility District |
| National | — National Public Finance Guarantee Corporation |
| PCFA | — Pollution Control Financing Authority |
| PCL | — Public Company Limited |
| PCR | — Pollution control revenue |
| PFA | — Public Finance Authority |
| PFFA | — Public Facilities Financing Authority |
| PFOTER | — Puttable floating option tax-exempt receipts |
| plc | — Public limited company |
| PUTTER | — Puttable tax-exempt receipts |
| R&D | — Research & development |
| Radian | — Radian Asset Assurance |
| RAN | — Revenue anticipation notes |
| RDA | — Redevelopment Authority |
| RDFA | — Redevelopment Finance Authority |
| REIT | — Real estate investment trust |
| ROC | — Reset option certificates |
| SAVRS | — Select auction variable rate securities |
| SBA | — Small Business Authority |
| SDR | — Swedish depositary receipt |
| SFHR | — Single-family housing revenue |
| SFMR | — Single-family mortgage revenue |
| SPA | — Standby purchase agreement |
| SPDR | — Standard & Poor’s Depositary Receipts |
| SPEAR | — Short Puttable Exempt Adjustable Receipts |
| STRIPS | — Separate trading of registered interest and |
| TAN | — Tax anticipation notes |
| TIPS | — Treasury inflation-protected securities |
| TRAN | — Tax revenue anticipation notes |
| TTFA | — Transportation Trust Fund Authority |
| TVA | — Tennessee Valley Authority |
This page is intentionally left blank.
This page is intentionally left blank.

For more information
More information about Wells Fargo Funds is available free upon request. To obtain literature, please write, email, visit the Fund’s website, or call:
Wells Fargo Funds
P.O. Box 8266
Boston, MA 02266-8266
Email: fundservice@wellsfargo.com
Website: wellsfargofunds.com
Individual investors: 1-800-222-8222
Retail investment professionals: 1-888-877-9275
Institutional investment professionals: 1-866-765-0778
This report and the financial statements contained herein are submitted for the general information of the shareholders of the Fund. If this report is used for promotional purposes, distribution of the report must be accompanied or preceded by a current prospectus. Before investing, please consider the investment objectives, risks, charges, and expenses of the investment. For a current prospectus and, if available, a summary prospectus, containing this information, call
1-800-222-8222 or visit the Fund’s website at wellsfargofunds.com. Read the prospectus carefully before you invest or send money.
Wells Fargo Asset Management (WFAM) is a trade name used by the asset management businesses of Wells Fargo & Company. Wells Fargo Funds Management, LLC, a wholly owned subsidiary of Wells Fargo & Company, provides investment advisory and administrative services for Wells Fargo Funds. Other affiliates of Wells Fargo & Company provide subadvisory and other services for the funds. The funds are distributed by Wells Fargo Funds Distributor, LLC, Member FINRA, an affiliate of Wells Fargo & Company. Neither Wells Fargo Funds Management nor Wells Fargo Funds Distributor has Fund customer accounts/assets, and neither provides investment advice/recommendations or acts as an investment advice fiduciary to any investor.
NOT FDIC INSURED ¡ NO BANK GUARANTEE ¡ MAY LOSE VALUE
© 2016 Wells Fargo Funds Management, LLC. All rights reserved.
| | |
 | | 246395 11-16 A231/AR231 09-16 |
Annual Report
September 30, 2016

Wells Fargo Opportunity Fund


Reduce clutter. Save trees.
Sign up for electronic delivery of prospectuses and shareholder reports at wellsfargo.com/advantagedelivery
Contents
The views expressed and any forward-looking statements are as of September 30, 2016, unless otherwise noted, and are those of the Fund managers and/or Wells Fargo Funds Management, LLC. Discussions of individual securities, or the markets generally, or any Wells Fargo Fund are not intended as individual recommendations. Future events or results may vary significantly from those expressed in any forward-looking statements. The views expressed are subject to change at any time in response to changing circumstances in the market. Wells Fargo Funds Management, LLC and the Fund disclaim any obligation to publicly update or revise any views expressed or forward-looking statements.
NOT FDIC INSURED ¡ NO BANK GUARANTEE ¡ MAY LOSE VALUE
| | | | |
| 2 | | Wells Fargo Opportunity Fund | | Letter to shareholders (unaudited) |

Karla M. Rabusch
President
Wells Fargo Funds
Dear Shareholder:
We are pleased to offer you this annual report for the Wells Fargo Opportunity Fund for the 12-month period that ended September 30, 2016. During this period, which began October 1, 2015, U.S. and international stock markets experienced bouts of heightened volatility, with intermittent sell-offs interspersed with rebounds. Despite market fluctuations throughout the year, U.S. small-, mid-, and large-cap stocks delivered double-digit positive results overall for the 12-month reporting period, as measured by the Russell 2000® Index,1 the Russell Midcap® Index,2 and the Russell 1000® Index,3 respectively. Small-cap U.S. stocks performed best, followed by large- and mid-cap stocks. International stocks overall also delivered positive results for the period.
Despite ongoing concerns, U.S. stocks generally rose in the fourth quarter of 2015; international markets lagged.
While U.S. stocks overall delivered favorable results in the quarter, stock markets outside the U.S. failed to keep pace as economic concerns, including China’s ongoing slowdown, continued to affect many countries. U.S. economic data released during the quarter indicated the economy remained solid, although the strong U.S. dollar and weakness in international economies remained headwinds. In December, the Federal Reserve (Fed), as expected, raised its target interest rate by 25 basis points (100 basis points equals 1.00%) after keeping it near zero for seven years. The move reflected confidence in the U.S. economy’s ability to stay healthy with less central-bank support. The Fed also clarified that future interest-rate increases would be gradual.
In the first quarter of 2016, market volatility increased globally amid ongoing concerns.
Stock markets worldwide fluctuated widely in the first quarter of 2016. Most sold off sharply in the first six weeks of the year on concerns such as weak global growth, falling commodity prices, and uncertainty over the timing and impact of the Fed’s interest-rate increases. As the quarter progressed, fears abated somewhat and global markets generally rallied. The U.S. economy ended the quarter on a positive note as much of the quarter’s data reflected resiliency. With ongoing uncertainties about global growth and financial markets, however, the Fed held off from raising the target interest rate during the quarter. Outside the U.S., the eurozone fell into deflation in February; in response, the European Central Bank (ECB) announced an expansion of its stimulus program. In China, the government in March set an anticipated growth rate of 6.5% to 7.0% for 2016, an acknowledgment of weakening growth. In emerging markets, although central-bank stimulus and improved prices for oil and other commodities led to stock-market rallies in the quarter, many of these countries’ economies face the potential of credit downgrades due to challenges such as the likelihood of a stronger U.S. dollar, which would make dollar-denominated debt more expensive.
Worries over interest rates and the U.K.’s Brexit vote largely drove markets during the second quarter of 2016.
U.S. stocks began the quarter in positive territory but started to lose steam in early May on worries that a possible June interest-rate increase by the Fed could hurt
| 1 | The Russell 2000® Index measures the performance of the 2,000 smallest companies in the Russell 3000® Index, which represents approximately 8% of the total market capitalization of the Russell 3000® Index. You cannot invest directly in an index. |
| 2 | The Russell Midcap® Index measures the performance of the 800 smallest companies in the Russell 1000® Index, which represent approximately 25% of the total market capitalization of the Russell 1000® Index. You cannot invest directly in an index. |
| 3 | The Russell 1000® Index measures the performance of the 1,000 largest companies in the Russell 3000® Index, which represents approximately 92% of the total market capitalization of the Russell 3000® Index. You cannot invest directly in an index. |
| | | | | | |
| Letter to shareholders (unaudited) | | Wells Fargo Opportunity Fund | | | 3 | |
the market. In mid-May, stocks briefly plunged following comments by Fed officials noting that a June interest-rate increase remained on the table. But once investors had processed this information, stocks again rallied, finishing up for the month. The first three weeks of June brought heightened volatility, spurred largely by a disappointing jobs report and uncertainty over whether the U.K. would remain in the E.U. The U.K.’s Brexit vote on June 23 shocked countries in Europe and much of the rest of the world. Stock markets fell as investors worried that the U.K.’s departure from the E.U. would slow global growth and prolong the low-interest-rate environment. Following the initial rout, however, U.S. stocks rallied as investors seemed to decide that any negative effects would be more localized and not create a serious risk for global growth. By quarter-end, the broad U.S. stock market had moved back into positive territory.
U.S. stocks delivered generally positive results in the third quarter of 2016.
The rally in U.S. stocks continued into early July 2016. U.S. stocks then generally continued to move upward at a more moderate pace, reaching a quarterly peak in August before the upward momentum started to lose some steam. Markets worldwide have been supported to varying degrees by accommodative policies from leading central banks, including the Fed, ECB, Bank of England, and Bank of Japan. As a result, investors have watched closely for any signs that global central banks might tighten their measures. Although many U.S. investors had doubted the Fed would increase interest rates in September, hawkish comments by several Fed officials in early September raised concerns, sending stock and bond prices downward. However, immediately following the Fed’s September 20 meeting, stocks surged on news that the Fed had decided to leave short-term interest rates unchanged for the time being and had signaled its intention to increase rates by year-end. The Fed also lowered its estimates for long-term economic growth and adjusted its anticipated pace of future rate increases. U.S. small-cap stocks in particular benefited from a renewed investor focus on fundamentals and from healthy merger and acquisition activity.
Don’t let short-term uncertainty derail long-term investment goals.
Periods of uncertainty can present challenges, but experience has taught us that maintaining long-term investment goals can be an effective way to plan for the future. To help you create a sound strategy based on your personal goals and risk tolerance, Wells Fargo Funds offers more than 100 mutual funds spanning a wide range of asset classes and investment styles. Although diversification cannot guarantee an investment profit or prevent losses, we believe it can be an effective way to manage investment risk and potentially smooth out overall portfolio performance. We encourage investors to know their investments and to understand that appropriate levels of risk-taking may unlock opportunities.
Thank you for choosing to invest in Wells Fargo Funds. We appreciate your confidence in us and remain committed to helping you meet your financial needs.
Sincerely,

Karla M. Rabusch
President
Wells Fargo Funds
Markets worldwide have been supported to varying degrees by accommodative policies from leading central banks, including the Fed, ECB, Bank of England, and Bank of Japan.
Although diversification cannot guarantee an investment profit or prevent losses, we believe it can be an effective way to manage investment risk and potentially smooth out overall portfolio performance.
For further information about your Fund, contact your investment professional, visit our website at wellsfargofunds.com, or call us directly at 1-800-222-8222. We are available 24 hours a day, 7 days a week.
| | | | |
| 4 | | Wells Fargo Opportunity Fund | | Performance highlights (unaudited) |
Investment objective
The Fund seeks long-term capital appreciation.
Manager
Wells Fargo Funds Management, LLC
Subadviser
Wells Capital Management Incorporated
Portfolio manager
Ann M. Miletti
Average annual total returns (%) as of September 30, 20161
| | | | | | | | | | | | | | | | | | | | | | | | | | | | | | | | | | |
| | | | | Including sales charge | | | Excluding sales charge | | | Expense ratios2 (%) | |
| | | Inception date | | 1 year | | | 5 year | | | 10 year | | | 1 year | | | 5 year | | | 10 year | | | Gross | | | Net3 | |
| Class A (SOPVX) | | 2-24-2000 | | | 6.00 | | | | 12.16 | | | | 5.93 | | | | 12.46 | | | | 13.50 | | | | 6.56 | | | | 1.20 | | | | 1.20 | |
| Class B (SOPBX)* | | 8-26-2011 | | | 6.61 | | | | 12.40 | | | | 5.88 | | | | 11.61 | | | | 12.65 | | | | 5.88 | | | | 1.95 | | | | 1.95 | |
| Class C (WFOPX) | | 3-31-2008 | | | 10.62 | | | | 12.65 | | | | 5.76 | | | | 11.62 | | | | 12.65 | | | | 5.76 | | | | 1.95 | | | | 1.95 | |
| Administrator Class (WOFDX) | | 8-30-2002 | | | – | | | | – | | | | – | | | | 12.68 | | | | 13.75 | | | | 6.81 | | | | 1.12 | | | | 1.00 | |
| Institutional Class (WOFNX) | | 7-30-2010 | | | – | | | | – | | | | – | | | | 12.97 | | | | 14.03 | | | | 6.96 | | | | 0.87 | | | | 0.75 | |
| Russell 3000® Index4 | | – | | | – | | | | – | | | | – | | | | 14.96 | | | | 16.36 | | | | 7.37 | | | | – | | | | – | |
| * | | Class B shares are closed to investment, except in connection with the reinvestment of any distributions and permitted exchanges. |
Figures quoted represent past performance, which is no guarantee of future results, and do not reflect taxes that a shareholder may pay on fund distributions or the redemption of fund shares. Investment return and principal value of an investment will fluctuate so that an investor’s shares, when redeemed, may be worth more or less than their original cost. Performance shown without sales charges would be lower if sales charges were reflected. Current performance may be lower or higher than the performance data quoted, which assumes the reinvestment of dividends and capital gains. Current month-end performance is available on the Fund’s website, wellsfargofunds.com.
Index returns do not include transaction costs associated with buying and selling securities, any mutual fund fees or expenses, or any taxes. It is not possible to invest directly in an index.
For Class A shares, the maximum front-end sales charge is 5.75%. For Class B shares, the maximum contingent deferred sales charge is 5.00%. For Class C shares, the maximum contingent deferred sales charge is 1.00%. Performance including a contingent deferred sales charge assumes the sales charge for the corresponding time period. Administrator Class and Institutional Class shares are sold without a front-end sales charge or contingent deferred sales charge.
Stock values fluctuate in response to the activities of individual companies and general market and economic conditions. Smaller-company stocks tend to be more volatile and less liquid than those of larger companies. Certain investment strategies tend to increase the total risk of an investment (relative to the broader market). The Fund is exposed to foreign investment risk. Consult the Fund’s prospectus for additional information on these and other risks.
Please see footnotes on page 5.
| | | | | | |
| Performance highlights (unaudited) | | Wells Fargo Opportunity Fund | | | 5 | |
|
| Growth of $10,000 investment as of September 30, 20165 |
|
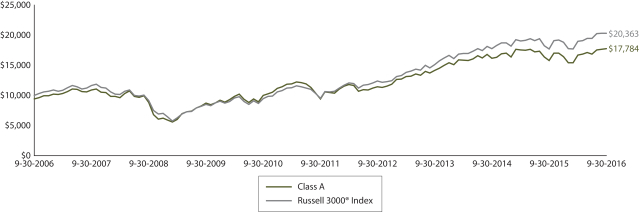 |
| 1 | Effective June 20, 2008, Advisor Class was renamed Class A and modified to assume the features and attributes of Class A. Historical performance shown for the Class A shares through June 19, 2008, includes Advisor Class expenses. Historical performance shown for Class B shares prior to their inception reflects the performance of Class C shares. Historical performance shown for Class C shares prior to their inception reflects the performance of Class A shares and has been adjusted to reflect the higher expenses applicable to Class C shares. Historical performance shown for Institutional Class prior to their inception reflects the performance of Administrator Class shares, and includes the higher expenses applicable to Administrator Class shares. If these expenses had not been included, returns would be higher |
| 2 | Reflects the expense ratios as stated in the most recent prospectuses. The expense ratios shown are subject to change and may differ from the annualized expense ratios shown in the financial highlights of this report. |
| 3 | The manager has contractually committed through January 31, 2017, to waive fees and/or reimburse expenses to the extent necessary to cap the Fund’s Total Annual Fund Operating Expenses After Fee Waiver at 1.21% for Class A, 1.96% for Class B, 1.96% for Class C, 1.00% for Administrator Class, and 0.75% for Institutional Class. After this time, the cap may be increased or the commitment to maintain the cap may be terminated only with the approval of the Board of Trustees. Brokerage commissions, stamp duty fees, interest, taxes, acquired fund fees and expenses, and extraordinary expenses are excluded from the expense cap. Without this cap, the Fund’s returns would have been lower. |
| 4 | The Russell 3000® Index measures the performance of the 3,000 largest U.S. companies based on total market capitalization, which represents approximately 98% of the investable U.S. equity market. You cannot invest directly in an index. |
| 5 | The chart compares the performance of Class A shares for the most recent ten years with the Russell 3000® Index . The chart assumes a hypothetical investment of $10,000 in Class A shares and reflects all operating expenses and assumes the maximum initial sales charge of 5.75%. |
| 6 | The ten largest holdings, excluding cash and cash equivalents, are calculated based on the value of the investments divided by total net assets of the Fund. Holdings are subject to change and may have changed since the date specified. |
| 7 | Amounts are calculated based on the total long-term investments of the Fund. These amounts are subject to change and may have changed since the date specified. |
| | | | |
| 6 | | Wells Fargo Opportunity Fund | | Performance highlights (unaudited) |
MANAGER’S DISCUSSION
Fund highlights
| n | | The Fund underperformed its benchmark, the Russell 3000® Index, for the 12-month period that ended September 30, 2016. |
| n | | Stock selection in the information technology (IT), consumer discretionary, and industrials sectors detracted the most from performance. |
| n | | Stock selection added significant value in the health care, energy, and financials sectors. |
Despite a few down months and some short bursts of volatility, U.S. stocks overall generally ended higher in all four quarters of the period, and a number of U.S. stock market indexes reached new highs in August 2016. During the 12-month period, smaller-cap and value stocks generally performed better than larger-cap and growth stocks, respectively.
A number of factors influenced the stock market; we list a number of them here. First, the Brexit vote at the end of June caused a brief market disruption. Second, after keeping interest rates at near zero for seven years, the U.S. Federal Reserve (Fed) finally raised its target short-term rate to between 0.25% and 0.50% in December 2015, but then left it unchanged for the rest of the reporting period. Third, while the Fed action signaled further U.S. tightening to come, the European Central Bank and the Bank of Japan continued their accommodative policies. Fourth, interest rates stayed flat or decreased in most of the developed world outside the U.S., including countries with negative interest rates. Fifth, energy and most commodity prices fell during the period, bottoming out in February before recovering to prices near their opening levels. Sixth, the U.S. dollar remained stable against most major currencies, but it rose against the British pound and fell against the Japanese yen. Seventh, U.S. gross domestic product continued to grow but at a slower rate than the previous year, ending the second quarter of 2016 at an annualized growth rate of 1.4%. Eighth, the U.S. experienced favorable trends in unemployment, wages, disposal income, and inflation.
Throughout all of the market and economic events that occurred during the reporting period and with the expectation of tighter U.S. monetary policy going forward, we continued to seek companies with good business models, strong management teams, and healthy cash flows trading at attractive discounts to their private market valuations (PMV). The PMV represents the expected price an investor would pay for the entire company as a stand-alone private entity.
| | | | |
| Ten largest holdings (%) as of September 30, 20166 | |
Johnson Controls International plc | | | 3.05 | |
Alphabet Incorporated Class C | | | 2.84 | |
Apple Incorporated | | | 2.82 | |
Medtronic plc | | | 2.49 | |
Bio-Rad Laboratories Incorporated Class A | | | 2.42 | |
PPG Industries Incorporated | | | 2.23 | |
American International Group Incorporated | | | 1.78 | |
Citigroup Incorporated | | | 1.74 | |
Broadcom Limited | | | 1.72 | |
MasterCard Incorporated Class A | | | 1.68 | |
Stock selection within the IT and consumer discretionary sectors held back Fund performance.
Overall, the Fund’s IT and consumer discretionary holdings did not keep pace with their respective sectors within the Russell 3000® Index. Within the IT sector, Alliance Data Systems Corporation and Cognizant Technology Solutions Corporation were among the largest detractors from performance. Alliance Data Systems, which offers marketing and customer loyalty solutions, underperformed due to missed revenue targets and fear over the impact of a possible negative shift in the credit cycle. Cognizant Technology was negatively affected by a spending slowdown in its two major vertical markets: financial services and health care. In the consumer discretionary sector, large department stores
and their suppliers were hurt by a mild winter, weaker tourist spending, overstocking, and subsequent discounting. Nordstrom, Incorporated; Target Corporation; Macy’s, Incorporated; and Ralph Lauren Corporation are some of the Fund holdings that were affected by these events.
Fund performance benefited from positive stock selection in the health care and energy sectors.
The Fund’s top-performing sector, health care, which benefited from positive stock selection, significantly outperformed the benchmark’s health care sector. Agilent Technologies Incorporated, a leading life-sciences and tools company, delivered better-than-expected revenue growth from robust demand for biopharmaceuticals; the company also demonstrated
Please see footnotes on page 5.
| | | | | | |
| Performance highlights (unaudited) | | Wells Fargo Opportunity Fund | | | 7 | |
ongoing margin improvement. Medtronic plc, a leading medical device company, rose on better-than-expected revenue growth and benefited from a rotation within health care out of biopharmaceuticals. Lack of exposure to biotechnology also helped, as the market corrected and reversed away from the lofty valuations in that industry.
The Fund’s energy sector delivered stronger results relative to the benchmark’s energy sector. Most of the Fund’s energy gains came from exploration and production (E&P) holdings. The Fund’s portfolio includes some of the higher-quality E&P companies as defined by strong balance sheets, experienced management teams, and low-cost producers in the richest shale zones of the Permian Basin. Top performers in this sector included Pioneer Natural Resources Company, Newfield Exploration Company, and Concho Resources Incorporated.
|
| Sector distribution as of September 30, 20167 |
|
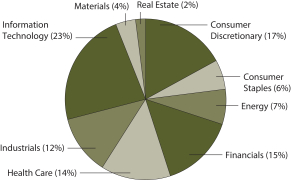 |
Our focus remains constant: to add value for shareholders through attractively priced, high quality Fund holdings.
Our methodology includes buying stocks at a discount to their estimated PMV and selling stocks as they approach the upper end of their PMV range.
Our disciplined, bottom-up investment process leads us to be overweight or underweight certain sectors. This positioning changes over time based on macroeconomic and industry-specific factors. In recent years, our process has led us to hold overweights to the IT and industrials sectors and underweights to the financials and utilities sectors. Through our disciplined investment process, we
remain keenly aware of both price and enterprise values on a company-by-company basis. Our proprietary database of company acquisitions across industries, sectors, and time frames enables us to maintain a steady foundation for assessing the PMV of companies compared with their public stock prices. We strive to take advantage of those price discrepancies for the benefit of Fund shareholders by purchasing stocks when we believe they are selling at a discount to their PMV.
An improving economy, low interest rates, and generally favorable investor sentiment helped to broadly lift the stock market and keep multiples high over most of the 12-month period. Certain sectors benefited from the quest for dividend yields and a flight to safety. We believe interest rates, the upcoming U.S. general election, and geopolitical events may have impacts on the market in the coming quarters. In our view, companies with attractive stock prices relative to their PMV may be brought to the forefront by our process, potentially allowing us to add value through our unique, bottom-up approach.
Please see footnotes on page 5.
| | | | |
| 8 | | Wells Fargo Opportunity Fund | | Fund expenses (unaudited) |
As a shareholder of the Fund, you incur two types of costs: (1) transaction costs, including sales charges (loads) on purchase payments and contingent deferred sales charges (if any) on redemptions and (2) ongoing costs, including management fees, distribution (12b-1) and/or shareholder servicing fees, and other Fund expenses. This example is intended to help you understand your ongoing costs (in dollars) of investing in the Fund and to compare these costs with the ongoing costs of investing in other mutual funds.
The example is based on an investment of $1,000 invested at the beginning of the six-month period and held for the entire period from April 1, 2016 to September 30, 2016.
Actual expenses
The “Actual” line of the table below provides information about actual account values and actual expenses. You may use the information in this line, together with the amount you invested, to estimate the expenses that you paid over the period. Simply divide your account value by $1,000 (for example, an $8,600 account value divided by $1,000 = 8.6), then multiply the result by the number in the “Actual” line under the heading entitled “Expenses paid during period” for your applicable class of shares to estimate the expenses you paid on your account during this period.
Hypothetical example for comparison purposes
The “Hypothetical” line of the table below provides information about hypothetical account values and hypothetical expenses based on the Fund’s actual expense ratio and an assumed rate of return of 5% per year before expenses, which is not the Fund’s actual return. The hypothetical account values and expenses may not be used to estimate the actual ending account balance or expenses you paid for the period. You may use this information to compare the ongoing costs of investing in the Fund and other funds. To do so, compare this 5% hypothetical example with the 5% hypothetical examples that appear in the shareholder reports of the other funds.
Please note that the expenses shown in the table are meant to highlight your ongoing costs only and do not reflect any transactional costs, such as sales charges (loads) and contingent deferred sales charges. Therefore, the “Hypothetical” line of the table is useful in comparing ongoing costs only and will not help you determine the relative total costs of owning different funds. In addition, if these transactional costs were included, your costs would have been higher.
| | | | | | | | | | | | | | | | |
| | | Beginning
account value
4-1-2016 | | | Ending
account value
9-30-2016 | | | Expenses
paid during
the period¹ | | | Annualized net
expense ratio | |
Class A | | | | | | | | | | | | | | | | |
Actual | | $ | 1,000.00 | | | $ | 1,062.17 | | | $ | 6.23 | | | | 1.21 | % |
Hypothetical (5% return before expenses) | | $ | 1,000.00 | | | $ | 1,018.96 | | | $ | 6.10 | | | | 1.21 | % |
Class B | | | | | | | | | | | | | | | | |
Actual | | $ | 1,000.00 | | | $ | 1,058.19 | | | $ | 10.06 | | | | 1.96 | % |
Hypothetical (5% return before expenses) | | $ | 1,000.00 | | | $ | 1,015.22 | | | $ | 9.85 | | | | 1.96 | % |
Class C | | | | | | | | | | | | | | | | |
Actual | | $ | 1,000.00 | | | $ | 1,058.22 | | | $ | 10.08 | | | | 1.96 | % |
Hypothetical (5% return before expenses) | | $ | 1,000.00 | | | $ | 1,015.21 | | | $ | 9.87 | | | | 1.96 | % |
Administrator Class | | | | | | | | | | | | | | | | |
Actual | | $ | 1,000.00 | | | $ | 1,063.43 | | | $ | 5.16 | | | | 1.00 | % |
Hypothetical (5% return before expenses) | | $ | 1,000.00 | | | $ | 1,020.00 | | | $ | 5.05 | | | | 1.00 | % |
Institutional Class | | | | | | | | | | | | | | | | |
Actual | | $ | 1,000.00 | | | $ | 1,064.88 | | | $ | 3.87 | | | | 0.75 | % |
Hypothetical (5% return before expenses) | | $ | 1,000.00 | | | $ | 1,021.25 | | | $ | 3.79 | | | | 0.75 | % |
| 1 | Expenses paid is equal to the annualized net expense ratio of each class multiplied by the average account value over the period, multiplied by the number of days in the most recent fiscal half-year divided by the number of days in the fiscal year (to reflect the one-half-year period). |
| | | | | | |
| Portfolio of investments—September 30, 2016 | | Wells Fargo Opportunity Fund | | | 9 | |
| | | | | | | | | | | | | | | | |
| Security name | | | | | | | | Shares | | | Value | |
| | | | |
Common Stocks: 98.40% | | | | | | | | | | | | | | | | |
| | | | |
Consumer Discretionary: 16.76% | | | | | | | | | | | | | | | | |
| | | | |
| Auto Components: 3.05% | | | | | | | | | | | | | | | | |
Johnson Controls International plc | | | | | | | | | | | 1,111,805 | | | $ | 51,732,287 | |
| | | | | | | | | | | | | | | | |
| | | | |
| Hotels, Restaurants & Leisure: 2.42% | | | | | | | | | | | | | | | | |
Royal Caribbean Cruises Limited | | | | | | | | | | | 282,043 | | | | 21,139,123 | |
Starbucks Corporation | | | | | | | | | | | 370,430 | | | | 20,055,080 | |
| | | | |
| | | | | | | | | | | | | | | 41,194,203 | |
| | | | | | | | | | | | | | | | |
| | | | |
| Household Durables: 1.36% | | | | | | | | | | | | | | | | |
Harman International Industries Incorporated | | | | | | | | | | | 273,172 | | | | 23,069,375 | |
| | | | | | | | | | | | | | | | |
| | | | |
| Media: 3.97% | | | | | | | | | | | | | | | | |
Comcast Corporation Class A | | | | | | | | | | | 392,985 | | | | 26,070,625 | |
Omnicom Group Incorporated | | | | | | | | | | | 180,467 | | | | 15,339,695 | |
Twenty-First Century Fox Incorporated Class B | | | | | | | | | | | 1,054,154 | | | | 26,079,770 | |
| | | | |
| | | | | | | | | | | | | | | 67,490,090 | |
| | | | | | | | | | | | | | | | |
| | | | |
| Multiline Retail: 3.51% | | | | | | | | | | | | | | | | |
Dollar General Corporation | | | | | | | | | | | 319,333 | | | | 22,350,117 | |
Nordstrom Incorporated « | | | | | | | | | | | 331,043 | | | | 17,174,511 | |
Target Corporation | | | | | | | | | | | 291,638 | | | | 20,029,698 | |
| | | | |
| | | | | | | | | | | | | | | 59,554,326 | |
| | | | | | | | | | | | | | | | |
| | | | |
| Specialty Retail: 1.27% | | | | | | | | | | | | | | | | |
Lowe’s Companies Incorporated | | | | | | | | | | | 299,385 | | | | 21,618,591 | |
| | | | | | | | | | | | | | | | |
| | | | |
| Textiles, Apparel & Luxury Goods: 1.18% | | | | | | | | | | | | | | | | |
Ralph Lauren Corporation | | | | | | | | | | | 198,179 | | | | 20,043,824 | |
| | | | | | | | | | | | | | | | |
| | | | |
Consumer Staples: 5.67% | | | | | | | | | | | | | | | | |
| | | | |
| Food & Staples Retailing: 1.20% | | | | | | | | | | | | | | | | |
The Kroger Company | | | | | | | | | | | 688,852 | | | | 20,445,127 | |
| | | | | | | | | | | | | | | | |
| | | | |
| Food Products: 2.17% | | | | | | | | | | | | | | | | |
Mead Johnson Nutrition Company | | | | | | | | | | | 247,389 | | | | 19,546,205 | |
The Hershey Company | | | | | | | | | | | 180,707 | | | | 17,275,589 | |
| | | | |
| | | | | | | | | | | | | | | 36,821,794 | |
| | | | | | | | | | | | | | | | |
| | | | |
| Household Products: 1.11% | | | | | | | | | | | | | | | | |
Church & Dwight Company Incorporated | | | | | | | | | | | 395,176 | | | | 18,936,834 | |
| | | | | | | | | | | | | | | | |
| | | | |
| Personal Products: 1.19% | | | | | | | | | | | | | | | | |
The Estee Lauder Companies Incorporated Class A | | | | | | | | | | | 227,268 | | | | 20,126,854 | |
| | | | | | | | | | | | | | | | |
| | | | |
Energy: 7.50% | | | | | | | | | | | | | | | | |
| | | | |
| Energy Equipment & Services: 1.73% | | | | | | | | | | | | | | | | |
Halliburton Company | | | | | | | | | | | 418,094 | | | | 18,764,059 | |
The accompanying notes are an integral part of these financial statements.
| | | | |
| 10 | | Wells Fargo Opportunity Fund | | Portfolio of investments—September 30, 2016 |
| | | | | | | | | | | | | | | | |
| Security name | | | | | | | | Shares | | | Value | |
| | | | |
| Energy Equipment & Services (continued) | | | | | | | | | | | | | | | | |
Weatherford International plc † | | | | | | | | | | | 1,904,748 | | | $ | 10,704,684 | |
| | | | |
| | | | | | | | | | | | | | | 29,468,743 | |
| | | | | | | | | | | | | | | | |
| | | | |
| Oil, Gas & Consumable Fuels: 5.77% | | | | | | | | | | | | | | | | |
Concho Resources Incorporated † | | | | | | | | | | | 147,828 | | | | 20,304,176 | |
EOG Resources Incorporated | | | | | | | | | | | 272,321 | | | | 26,336,164 | |
Newfield Exploration Company † | | | | | | | | | | | 363,082 | | | | 15,779,544 | |
Pioneer Natural Resources Company | | | | | | | | | | | 128,311 | | | | 23,820,937 | |
Range Resources Corporation | | | | | | | | | | | 302,620 | | | | 11,726,525 | |
| | | | |
| | | | | | | | | | | | | | | 97,967,346 | |
| | | | | | | | | | | | | | | | |
| | | | |
Financials: 14.50% | | | | | | | | | | | | | | | | |
| | | | |
| Banks: 5.43% | | | | | | | | | | | | | | | | |
Bank of the Ozarks Incorporated | | | | | | | | | | | 265,166 | | | | 10,182,374 | |
Citigroup Incorporated | | | | | | | | | | | 624,340 | | | | 29,487,578 | |
PNC Financial Services Group Incorporated | | | | | | | | | | | 283,359 | | | | 25,527,812 | |
Webster Financial Corporation | | | | | | | | | | | 713,284 | | | | 27,111,925 | |
| | | | |
| | | | | | | | | | | | | | | 92,309,689 | |
| | | | | | | | | | | | | | | | |
| | | | |
| Capital Markets: 1.92% | | | | | | | | | | | | | | | | |
E*TRADE Financial Corporation † | | | | | | | | | | | 415,242 | | | | 12,091,847 | |
TD Ameritrade Holding Corporation | | | | | | | | | | | 580,860 | | | | 20,469,506 | |
| | | | |
| | | | | | | | | | | | | | | 32,561,353 | |
| | | | | | | | | | | | | | | | |
| | | | |
| Insurance: 7.15% | | | | | | | | | | | | | | | | |
American International Group Incorporated | | | | | | | | | | | 508,212 | | | | 30,157,300 | |
Aon plc | | | | | | | | | | | 192,257 | | | | 21,626,990 | |
Chubb Limited | | | | | | | | | | | 222,202 | | | | 27,919,681 | |
The Progressive Corporation | | | | | | | | | | | 592,230 | | | | 18,655,245 | |
Willis Towers Watson plc | | | | | | | | | | | 174,186 | | | | 23,126,675 | |
| | | | |
| | | | | | | | | | | | | | | 121,485,891 | |
| | | | | | | | | | | | | | | | |
| | | | |
Health Care: 13.95% | | | | | | | | | | | | | | | | |
| | | | |
| Health Care Equipment & Supplies: 3.50% | | | | | | | | | | | | | | | | |
Medtronic plc | | | | | | | | | | | 489,274 | | | | 42,273,274 | |
Zimmer Holdings Incorporated | | | | | | | | | | | 131,843 | | | | 17,142,227 | |
| | | | |
| | | | | | | | | | | | | | | 59,415,501 | |
| | | | | | | | | | | | | | | | |
| | | | |
| Health Care Providers & Services: 2.30% | | | | | | | | | | | | | | | | |
Cigna Corporation | | | | | | | | | | | 188,668 | | | | 24,587,214 | |
Patterson Companies Incorporated | | | | | | | | | | | 314,723 | | | | 14,458,375 | |
| | | | |
| | | | | | | | | | | | | | | 39,045,589 | |
| | | | | | | | | | | | | | | | |
| | | | |
| Life Sciences Tools & Services: 5.35% | | | | | | | | | | | | | | | | |
Agilent Technologies Incorporated | | | | | | | | | | | 508,137 | | | | 23,928,171 | |
Bio-Rad Laboratories Incorporated Class A † | | | | | | | | | | | 250,948 | | | | 41,107,792 | |
Thermo Fisher Scientific Incorporated | | | | | | | | | | | 162,947 | | | | 25,918,350 | |
| | | | |
| | | | | | | | | | | | | | | 90,954,313 | |
| | | | | | | | | | | | | | | | |
The accompanying notes are an integral part of these financial statements.
| | | | | | |
| Portfolio of investments—September 30, 2016 | | Wells Fargo Opportunity Fund | | | 11 | |
| | | | | | | | | | | | | | | | |
| Security name | | | | | | | | Shares | | | Value | |
| | | | |
| Pharmaceuticals: 2.80% | | | | | | | | | | | | | | | | |
Merck & Company Incorporated | | | | | | | | | | | 424,581 | | | $ | 26,498,100 | |
Novartis AG ADR | | | | | | | | | | | 267,199 | | | | 21,098,033 | |
| | | | |
| | | | | | | | | | | | | | | 47,596,133 | |
| | | | | | | | | | | | | | | | |
| | | | |
Industrials: 11.48% | | | | | | | | | | | | | | | | |
| | | | |
| Aerospace & Defense: 3.56% | | | | | | | | | | | | | | | | |
B/E Aerospace Incorporated | | | | | | | | | | | 503,292 | | | | 26,000,065 | |
BWX Technologies Incorporated | | | | | | | | | | | 478,945 | | | | 18,377,120 | |
United Technologies Corporation | | | | | | | | | | | 157,481 | | | | 16,000,070 | |
| | | | |
| | | | | | | | | | | | | | | 60,377,255 | |
| | | | | | | | | | | | | | | | |
| | | | |
| Airlines: 1.34% | | | | | | | | | | | | | | | | |
United Continental Holdings Incorporated † | | | | | | | | | | | 434,881 | | | | 22,818,206 | |
| | | | | | | | | | | | | | | | |
| | | | |
| Commercial Services & Supplies: 1.41% | | | | | | | | | | | | | | | | |
Republic Services Incorporated | | | | | | | | | | | 473,887 | | | | 23,907,599 | |
| | | | | | | | | | | | | | | | |
| | | | |
| Electrical Equipment: 0.93% | | | | | | | | | | | | | | | | |
Babcock & Wilcox Enterprises Incorporated † | | | | | | | | | | | 959,502 | | | | 15,831,783 | |
| | | | | | | | | | | | | | | | |
| | | | |
| Machinery: 1.19% | | | | | | | | | | | | | | | | |
Colfax Corporation † | | | | | | | | | | | 640,237 | | | | 20,122,649 | |
| | | | | | | | | | | | | | | | |
| | | | |
| Road & Rail: 3.05% | | | | | | | | | | | | | | | | |
Canadian Pacific Railway Limited | | | | | | | | | | | 68,476 | | | | 10,456,285 | |
Hertz Global Holdings Incorporated † | | | | | | | | | | | 550,093 | | | | 22,091,735 | |
J.B. Hunt Transport Services Incorporated | | | | | | | | | | | 238,278 | | | | 19,333,877 | |
| | | | |
| | | | | | | | | | | | | | | 51,881,897 | |
| | | | | | | | | | | | | | | | |
| | | | |
Information Technology: 22.59% | | | | | | | | | | | | | | | | |
| | | | |
| Electronic Equipment, Instruments & Components: 2.98% | | | | | | | | | | | | | | | | |
Amphenol Corporation Class A | | | | | | | | | | | 375,968 | | | | 24,407,843 | |
TE Connectivity Limited | | | | | | | | | | | 407,055 | | | | 26,206,201 | |
| | | | |
| | | | | | | | | | | | | | | 50,614,044 | |
| | | | | | | | | | | | | | | | |
| | | | |
| Internet Software & Services: 2.84% | | | | | | | | | | | | | | | | |
Alphabet Incorporated Class C † | | | | | | | | | | | 62,020 | | | | 48,207,526 | |
| | | | | | | | | | | | | | | | |
| | | | |
| IT Services: 5.51% | | | | | | | | | | | | | | | | |
Alliance Data Systems Corporation † | | | | | | | | | | | 102,034 | | | | 21,889,354 | |
Fidelity National Information Services Incorporated | | | | | | | | | | | 277,122 | | | | 21,346,708 | |
Global Payments Incorporated | | | | | | | | | | | 283,320 | | | | 21,747,643 | |
MasterCard Incorporated Class A | | | | | | | | | | | 280,409 | | | | 28,537,224 | |
| | | | |
| | | | | | | | | | | | | | | 93,520,929 | |
| | | | | | | | | | | | | | | | |
| | | | |
| Semiconductors & Semiconductor Equipment: 3.07% | | | | | | | | | | | | | | | | |
Broadcom Limited | | | | | | | | | | | 169,725 | | | | 29,280,957 | |
Texas Instruments Incorporated | | | | | | | | | | | 325,265 | | | | 22,827,098 | |
| | | | |
| | | | | | | | | | | | | | | 52,108,055 | |
| | | | | | | | | | | | | | | | |
The accompanying notes are an integral part of these financial statements.
| | | | |
| 12 | | Wells Fargo Opportunity Fund | | Portfolio of investments—September 30, 2016 |
| | | | | | | | | | | | | | | | |
| Security name | | | | | | | | Shares | | | Value | |
| | | | |
| Software: 5.37% | | | | | | | | | | | | | | | | |
Check Point Software Technologies Limited † | | | | | | | | | | | 263,825 | | | $ | 20,475,458 | |
Oracle Corporation | | | | | | | | | | | 578,077 | | | | 22,706,863 | |
Red Hat Incorporated † | | | | | | | | | | | 316,382 | | | | 25,573,157 | |
Salesforce.com Incorporated † | | | | | | | | | | | 314,201 | | | | 22,411,957 | |
| | | | |
| | | | | | | | | | | | | | | 91,167,435 | |
| | | | | | | | | | | | | | | | |
| | | | |
| Technology Hardware, Storage & Peripherals: 2.82% | | | | | | | | | | | | | | | | |
Apple Incorporated | | | | | | | | | | | 424,413 | | | | 47,979,890 | |
| | | | | | | | | | | | | | | | |
| | | | |
Materials: 4.35% | | | | | | | | | | | | | | | | |
| | | | |
| Chemicals: 2.23% | | | | | | | | | | | | | | | | |
PPG Industries Incorporated | | | | | | | | | | | 365,992 | | | | 37,828,933 | |
| | | | | | | | | | | | | | | | |
| | | | |
| Containers & Packaging: 1.32% | | | | | | | | | | | | | | | | |
Crown Holdings Incorporated † | | | | | | | | | | | 394,020 | | | | 22,494,602 | |
| | | | | | | | | | | | | | | | |
| | | | |
| Metals & Mining: 0.80% | | | | | | | | | | | | | | | | |
Steel Dynamics Incorporated | | | | | | | | | | | 540,768 | | | | 13,513,792 | |
| | | | | | | | | | | | | | | | |
| | | | |
Real Estate: 1.60% | | | | | | | | | | | | | | | | |
| | | | |
| Equity REITs: 1.60% | | | | | | | | | | | | | | | | |
American Tower Corporation | | | | | | | | | | | 239,086 | | | | 27,095,616 | |
| | | | | | | | | | | | | | | | |
| | | | |
Total Common Stocks (Cost $1,246,373,747) | | | | | | | | | | | | | | | 1,671,308,074 | |
| | | | | | | | | | | | | | | | |
| | | | |
| | | Yield | | | | | | | | | | |
| Short-Term Investments: 2.50% | | | | | | | | | | | | | | | | |
| | | | |
| Investment Companies: 2.50% | | | | | | | | | | | | | | | | |
Securities Lending Cash Investments LLC (l)(r)(u) | | | 0.65 | % | | | | | | | 16,584,600 | | | | 16,584,600 | |
Wells Fargo Government Money Market Fund Select Class (l)(u) | | | 0.34 | | | | | | | | 25,778,872 | | | | 25,778,872 | |
| | | | |
Total Short-Term Investments (Cost $42,363,472) | | | | | | | | | | | | | | | 42,363,472 | |
| | | | | | | | | | | | | | | | |
| | | | | | | | |
| Total investments in securities (Cost $1,288,737,219) * | | | 100.90 | % | | | 1,713,671,546 | |
Other assets and liabilities, net | | | (0.90 | ) | | | (15,259,047 | ) |
| | | | | | | | |
| Total net assets | | | 100.00 | % | | $ | 1,698,412,499 | |
| | | | | | | | |
| † | Non-income-earning security |
| « | All or a portion of this security is on loan. |
| (l) | The issuer of the security is an affiliated person of the Fund as defined in the Investment Company Act of 1940. |
| (r) | The investment is a non-registered investment vehicle purchased with cash collateral received from securities on loan. |
| (u) | The rate represents the 7-day annualized yield at period end. |
| * | Cost for federal income tax purposes is $1,292,378,123 and unrealized gains (losses) consists of: |
| | | | |
Gross unrealized gains | | $ | 459,567,336 | |
Gross unrealized losses | | | (38,273,913 | ) |
| | | | |
Net unrealized gains | | $ | 421,293,423 | |
The accompanying notes are an integral part of these financial statements.
| | | | | | |
| Statement of assets and liabilities—September 30, 2016 | | Wells Fargo Opportunity Fund | | | 13 | |
| | | | |
| | | | |
| |
Assets | | | | |
Investments | | | | |
In unaffiliated securities (including $16,311,072 of securities loaned), at value (cost $1,246,373,747) | | $ | 1,671,308,074 | |
In affiliated securities, at value (cost $42,363,472) | | | 42,363,472 | |
| | | | |
Total investments, at value (cost $1,288,737,219) | | | 1,713,671,546 | |
Cash | | | 7,179 | |
Receivable for investments sold | | | 4,768,400 | |
Receivable for Fund shares sold | | | 112,186 | |
Receivable for dividends | | | 2,136,496 | |
Receivable for securities lending income | | | 24,512 | |
Prepaid expenses and other assets | | | 59,081 | |
| | | | |
Total assets | | | 1,720,779,400 | |
| | | | |
| |
Liabilities | | | | |
Payable for investments purchased | | | 1,834,922 | |
Payable for Fund shares redeemed | | | 1,970,427 | |
Payable upon receipt of securities loaned | | | 16,584,600 | |
Management fee payable | | | 1,042,435 | |
Distribution fees payable | | | 24,033 | |
Administration fees payable | | | 294,110 | |
Accrued expenses and other liabilities | | | 616,374 | |
| | | | |
Total liabilities | | | 22,366,901 | |
| | | | |
Total net assets | | $ | 1,698,412,499 | |
| | | | |
| |
NET ASSETS CONSIST OF | | | | |
Paid-in capital | | $ | 1,172,462,951 | |
Undistributed net investment income | | | 5,457,563 | |
Accumulated net realized gains on investments | | | 95,557,451 | |
Net unrealized gains on investments | | | 424,934,534 | |
| | | | |
Total net assets | | $ | 1,698,412,499 | |
| | | | |
| |
COMPUTATION OF NET ASSET VALUE AND OFFERING PRICE PER SHARE | | | | |
Net assets – Class A | | $ | 1,418,614,083 | |
Shares outstanding – Class A1 | | | 33,887,745 | |
Net asset value per share – Class A | | | $41.86 | |
Maximum offering price per share – Class A2 | | | $44.41 | |
Net assets – Class B | | $ | 1,715,053 | |
Shares outstanding – Class B1 | | | 42,676 | |
Net asset value per share – Class B | | | $40.19 | |
Net assets – Class C | | $ | 34,720,770 | |
Shares outstanding – Class C1 | | | 868,265 | |
Net asset value per share – Class C | | | $39.99 | |
Net assets – Administrator Class | | $ | 226,140,494 | |
Shares outstanding – Administrator Class1 | | | 5,033,278 | |
Net asset value per share – Administrator Class | | | $44.93 | |
Net assets – Institutional Class | | $ | 17,222,099 | |
Shares outstanding – Institutional Class1 | | | 377,437 | |
Net asset value per share – Institutional Class | | | $45.63 | |
| 1 | The Fund has an unlimited number of authorized shares. |
| 2 | Maximum offering price is computed as 100/94.25 of net asset value. On investments of $50,000 or more, the offering price is reduced. |
The accompanying notes are an integral part of these financial statements.
| | | | |
| 14 | | Wells Fargo Opportunity Fund | | Statement of operations—year ended September 30, 2016 |
| | | | |
| | | | |
| |
Investment income | | | | |
Dividends (net of foreign withholding taxes of $123,359) | | $ | 26,147,924 | |
Securities lending income, net | | | 216,872 | |
Income from affiliated securities | | | 59,280 | |
| | | | |
Total investment income | | | 26,424,076 | |
| | | | |
| |
Expenses | | | | |
Management fee | | | 12,259,027 | |
Administration fees | | | | |
Class A | | | 2,830,602 | |
Class B | | | 5,482 | |
Class C | | | 75,512 | |
Administrator Class | | | 291,573 | |
Institutional Class | | | 16,974 | |
Investor Class | | | 235,543 | 1 |
Shareholder servicing fees | | | | |
Class A | | | 3,369,230 | |
Class B | | | 6,326 | |
Class C | | | 89,896 | |
Administrator Class | | | 560,053 | |
Investor Class | | | 183,109 | 1 |
Distribution fees | | | | |
Class B | | | 19,579 | |
Class C | | | 269,687 | |
Custody and accounting fees | | | 93,480 | |
Professional fees | | | 52,245 | |
Registration fees | | | 90,436 | |
Shareholder report expenses | | | 158,571 | |
Trustees’ fees and expenses | | | 16,461 | |
Other fees and expenses | | | 34,497 | |
| | | | |
Total expenses | | | 20,658,283 | |
Less: Fee waivers and/or expense reimbursements | | | (372,318 | ) |
| | | | |
Net expenses | | | 20,285,965 | |
| | | | |
Net investment income | | | 6,138,111 | |
| | | | |
| |
REALIZED AND UNREALIZED GAINS (LOSSES) ON INVESTMENTS | | | | |
Net realized gains on investments | | | 105,020,650 | |
Net change in unrealized gains (losses) on investments | | | 87,822,225 | |
| | | | |
Net realized and unrealized gains (losses) on investments | | | 192,842,875 | |
| | | | |
Net increase in net assets resulting from operations | | $ | 198,980,986 | |
| | | | |
| 1 | For the period from October 1, 2015 to October 23, 2015. Effective at the close of business on October 23, 2015, Investor Class shares were converted to Class A shares and are no longer offered by the Fund. |
The accompanying notes are an integral part of these financial statements.
| | | | | | |
| Statement of changes in net assets | | Wells Fargo Opportunity Fund | | | 15 | |
| | | | | | | | | | | | | | | | |
| | | Year ended
September 30, 2016 | | | Year ended
September 30, 2015 | |
| | | | |
Operations | | | | | | | | | | | | | | | | |
Net investment income | | | | | | $ | 6,138,111 | | | | | | | $ | 24,934,411 | |
Net realized gains on investments | | | | | | | 105,020,650 | | | | | | | | 221,473,940 | |
Net change in unrealized gains (losses) on investments | | | | | | | 87,822,225 | | | | | | | | (257,879,486 | ) |
| | | | |
Net increase (decrease) in net assets resulting from operations | | | | | | | 198,980,986 | | | | | | | | (11,471,135 | ) |
| | | | |
| | | | |
Distributions to shareholders from | | | | | | | | | | | | | | | | |
Net investment income | | | | | | | | | | | | | | | | |
Class A | | | | | | | (20,934,141 | ) | | | | | | | 0 | |
Class C | | | | | | | (189,287 | ) | | | | | | | 0 | |
Administrator Class | | | | | | | (3,656,721 | ) | | | | | | | 0 | |
Institutional Class | | | | | | | (234,706 | ) | | | | | | | 0 | |
Net realized gains | | | | | | | | | | | | | | | | |
Class A | | | | | | | (185,395,064 | ) | | | | | | | (46,799,012 | ) |
Class B | | | | | | | (425,984 | ) | | | | | | | (617,936 | ) |
Class C | | | | | | | (4,995,377 | ) | | | | | | | (4,663,792 | ) |
Administrator Class | | | | | | | (27,497,135 | ) | | | | | | | (25,429,048 | ) |
Institutional Class | | | | | | | (1,456,485 | ) | | | | | | | (2,498,291 | ) |
Investor Class | | | | | | | 0 | 1 | | | | | | | (119,041,800 | ) |
| | | | |
Total distributions to shareholders | | | | | | | (244,784,900 | ) | | | | | | | (199,049,879 | ) |
| | | | |
| | | | |
Capital share transactions | | | Shares | | | | | | | | Shares | | | | | |
Proceeds from shares sold | | | | | | | | | | | | | | | | |
Class A | | | 24,061,660 | | | | 1,119,678,940 | | | | 160,357 | | | | 7,615,018 | |
Class B | | | 2 | | | | 80 | | | | 46 | | | | 2,206 | |
Class C | | | 13,720 | | | | 517,107 | | | | 19,132 | | | | 863,333 | |
Administrator Class | | | 129,304 | | | | 5,492,475 | | | | 127,668 | | | | 6,594,713 | |
Institutional Class | | | 198,222 | | | | 8,697,552 | | | | 270,104 | | | | 13,636,292 | |
Investor Class | | | 14,679 | 1 | | | 683,049 | 1 | | | 472,972 | | | | 22,990,522 | |
| | | | |
| | | | | | | 1,135,069,203 | | | | | | | | 51,702,084 | |
| | | | |
Reinvestment of distributions | | | | | | | | | | | | | | | | |
Class A | | | 5,133,573 | | | | 200,595,023 | | | | 998,030 | | | | 45,340,511 | |
Class B | | | 11,360 | | | | 422,382 | | | | 13,977 | | | | 612,904 | |
Class C | | | 129,505 | | | | 4,817,319 | | | | 97,150 | | | | 4,260,996 | |
Administrator Class | | | 701,312 | | | | 29,406,409 | | | | 497,170 | | | | 23,978,499 | |
Institutional Class | | | 33,469 | | | | 1,426,272 | | | | 46,857 | | | | 2,287,085 | |
Investor Class | | | 0 | 1 | | | 0 | 1 | | | 2,493,408 | | | | 115,943,517 | |
| | | | |
| | | | | | | 236,667,405 | | | | | | | | 192,423,512 | |
| | | | |
Payment for shares redeemed | | | | | | | | | | | | | | | | |
Class A | | | (4,306,621 | ) | | | (173,325,216 | ) | | | (1,094,612 | ) | | | (56,454,349 | ) |
Class B | | | (54,234 | ) | | | (2,123,946 | ) | | | (59,795 | ) | | | (2,828,077 | ) |
Class C | | | (169,002 | ) | | | (6,566,702 | ) | | | (114,995 | ) | | | (5,685,281 | ) |
Administrator Class | | | (640,144 | ) | | | (27,663,783 | ) | | | (624,551 | ) | | | (33,952,919 | ) |
Institutional Class | | | (108,868 | ) | | | (4,765,522 | ) | | | (617,715 | ) | | | (31,505,421 | ) |
Investor Class | | | (23,333,080 | )1 | | | (1,113,901,150 | )1 | | | (2,321,853 | ) | | | (124,633,589 | ) |
| | | | |
| | | | | | | (1,328,346,319 | ) | | | | | | | (255,059,636 | ) |
| | | | |
Net increase (decrease) in net assets resulting from capital share transactions | | | | | | | 43,390,289 | | | | | | | | (10,934,040 | ) |
| | | | |
Total decrease in net assets | | | | | | | (2,413,625 | ) | | | | | | | (221,455,054 | ) |
| | | | |
| | | | |
Net assets | | | | | | | | | | | | | | | | |
Beginning of period | | | | | | | 1,700,826,124 | | | | | | | | 1,922,281,178 | |
| | | | |
End of period | | | | | | $ | 1,698,412,499 | | | | | | | $ | 1,700,826,124 | |
| | | | |
Undistributed net investment income | | | | | | $ | 5,457,563 | | | | | | | $ | 24,803,981 | |
| | | | |
| 1 | For the period from October 1, 2015 to October 23, 2015. Effective at the close of business on October 23, 2015, Investor Class shares were converted to Class A shares and are no longer offered by the Fund. |
The accompanying notes are an integral part of these financial statements.
| | | | |
| 16 | | Wells Fargo Opportunity Fund | | Financial highlights |
(For a share outstanding throughout each period)
| | | | | | | | | | | | | | | | | | | | |
| | | Year ended September 30 | |
| CLASS A | | 2016 | | | 2015 | | | 2014 | | | 2013 | | | 2012 | |
Net asset value, beginning of period | | | $43.35 | | | | $49.56 | | | | $46.23 | | | | $38.99 | | | | $32.08 | |
Net investment income (loss) | | | 0.13 | 1 | | | 0.64 | | | | (0.07 | ) | | | (0.04 | ) | | | (0.03 | ) |
Net realized and unrealized gains (losses) on investments | | | 4.72 | | | | (1.52 | ) | | | 6.46 | | | | 8.80 | | | | 6.94 | |
| | | | | | | | | | | | | | | | | | | | |
Total from investment operations | | | 4.85 | | | | (0.88 | ) | | | 6.39 | | | | 8.76 | | | | 6.91 | |
Distributions to shareholders from | | | | | | | | | | | | | | | | | | | | |
Net investment income | | | (0.57 | ) | | | 0.00 | | | | 0.00 | | | | 0.00 | | | | 0.00 | |
Net realized gains | | | (5.77 | ) | | | (5.33 | ) | | | (3.06 | ) | | | (1.52 | ) | | | 0.00 | |
| | | | | | | | | | | | | | | | | | | | |
Total distributions to shareholders | | | (6.34 | ) | | | (5.33 | ) | | | (3.06 | ) | | | (1.52 | ) | | | 0.00 | |
Net asset value, end of period | | | $41.86 | | | | $43.35 | | | | $49.56 | | | | $46.23 | | | | $38.99 | |
Total return2 | | | 12.46 | % | | | (2.27 | )% | | | 14.35 | % | | | 23.31 | % | | | 21.54 | % |
Ratios to average net assets (annualized) | | | | | | | | | | | | | | | | | | | | |
Gross expenses | | | 1.21 | % | | | 1.24 | % | | | 1.26 | % | | | 1.26 | % | | | 1.25 | % |
Net expenses | | | 1.21 | % | | | 1.22 | % | | | 1.22 | % | | | 1.23 | % | | | 1.25 | % |
Net investment income (loss) | | | 0.33 | % | | | 1.30 | % | | | (0.13 | )% | | | (0.08 | )% | | | (0.08 | )% |
Supplemental data | | | | | | | | | | | | | | | | | | | | |
Portfolio turnover rate | | | 34 | % | | | 42 | % | | | 32 | % | | | 26 | % | | | 41 | % |
Net assets, end of period (000s omitted) | | | $1,418,614 | | | | $390,154 | | | | $442,840 | | | | $431,201 | | | | $399,828 | |
| 1 | Calculated based upon average shares outstanding |
| 2 | Total return calculations do not include any sales charges. |
The accompanying notes are an integral part of these financial statements.
| | | | | | |
| Financial highlights | | Wells Fargo Opportunity Fund | | | 17 | |
(For a share outstanding throughout each period)
| | | | | | | | | | | | | | | | | | | | |
| | | Year ended September 30 | |
| CLASS B | | 2016 | | | 2015 | | | 2014 | | | 2013 | | | 2012 | |
Net asset value, beginning of period | | | $41.60 | | | | $48.09 | | | | $45.27 | | | | $38.49 | | | | $31.91 | |
Net investment income (loss) | | | (0.14 | )1 | | | 0.30 | 1 | | | (0.43 | )1 | | | (0.35 | )1 | | | (0.31 | )1 |
Net realized and unrealized gains (losses) on investments | | | 4.50 | | | | (1.46 | ) | | | 6.31 | | | | 8.65 | | | | 6.89 | |
| | | | | | | | | | | | | | | | | | | | |
Total from investment operations | | | 4.36 | | | | (1.16 | ) | | | 5.88 | | | | 8.30 | | | | 6.58 | |
Distributions to shareholders from | | | | | | | | | | | | | | | | | | | | |
Net realized gains | | | (5.77 | ) | | | (5.33 | ) | | | (3.06 | ) | | | (1.52 | ) | | | 0.00 | |
Net asset value, end of period | | | $40.19 | | | | $41.60 | | | | $48.09 | | | | $45.27 | | | | $38.49 | |
Total return2 | | | 11.61 | % | | | (2.98 | )% | | | 13.48 | % | | | 22.39 | % | | | 20.62 | % |
Ratios to average net assets (annualized) | | | | | | | | | | | | | | | | | | | | |
Gross expenses | | | 1.95 | % | | | 1.99 | % | | | 2.01 | % | | | 2.01 | % | | | 2.00 | % |
Net expenses | | | 1.95 | % | | | 1.97 | % | | | 1.97 | % | | | 1.98 | % | | | 2.00 | % |
Net investment income (loss) | | | (0.36 | )% | | | 0.64 | % | | | (0.90 | )% | | | (0.83 | )% | | | (0.83 | )% |
Supplemental data | | | | | | | | | | | | | | | | | | | | |
Portfolio turnover rate | | | 34 | % | | | 42 | % | | | 32 | % | | | 26 | % | | | 41 | % |
Net assets, end of period (000s omitted) | | | $1,715 | | | | $3,559 | | | | $6,316 | | | | $9,020 | | | | $11,743 | |
| 1 | Calculated based upon average shares outstanding |
| 2 | Total return calculations do not include any sales charges. |
The accompanying notes are an integral part of these financial statements.
| | | | |
| 18 | | Wells Fargo Opportunity Fund | | Financial highlights |
(For a share outstanding throughout each period)
| | | | | | | | | | | | | | | | | | | | |
| | | Year ended September 30 | |
| CLASS C | | 2016 | | | 2015 | | | 2014 | | | 2013 | | | 2012 | |
Net asset value, beginning of period | | | $41.60 | | | | $48.10 | | | | $45.27 | | | | $38.49 | | | | $31.91 | |
Net investment income (loss) | | | (0.16 | )1 | | | 0.26 | | | | (0.42 | )1 | | | (0.35 | )1 | | | (0.31 | )1 |
Net realized and unrealized gains (losses) on investments | | | 4.51 | | | | (1.43 | ) | | | 6.31 | | | | 8.65 | | | | 6.89 | |
| | | | | | | | | | | | | | | | | | | | |
Total from investment operations | | | 4.35 | | | | (1.17 | ) | | | 5.89 | | | | 8.30 | | | | 6.58 | |
Distributions to shareholders from | | | | | | | | | | | | | | | | | | | | |
Net investment income | | | (0.19 | ) | | | 0.00 | | | | 0.00 | | | | 0.00 | | | | 0.00 | |
Net realized gains | | | (5.77 | ) | | | (5.33 | ) | | | (3.06 | ) | | | (1.52 | ) | | | 0.00 | |
| | | | | | | | | | | | | | | | | | | | |
Total distributions to shareholders | | | (5.96 | ) | | | (5.33 | ) | | | (3.06 | ) | | | (1.52 | ) | | | 0.00 | |
Net asset value, end of period | | | $39.99 | | | | $41.60 | | | | $48.10 | | | | $45.27 | | | | $38.49 | |
Total return2 | | | 11.62 | % | | | (3.01 | )% | | | 13.48 | % | | | 22.41 | % | | | 20.62 | % |
Ratios to average net assets (annualized) | | | | | | | | | | | | | | | | | | | | |
Gross expenses | | | 1.96 | % | | | 1.99 | % | | | 2.01 | % | | | 2.01 | % | | | 2.00 | % |
Net expenses | | | 1.96 | % | | | 1.97 | % | | | 1.97 | % | | | 1.98 | % | | | 2.00 | % |
Net investment income (loss) | | | (0.40 | )% | | | 0.55 | % | | | (0.88 | )% | | | (0.83 | )% | | | (0.83 | )% |
Supplemental data | | | | | | | | | | | | | | | | | | | | |
Portfolio turnover rate | | | 34 | % | | | 42 | % | | | 32 | % | | | 26 | % | | | 41 | % |
Net assets, end of period (000s omitted) | | | $34,721 | | | | $37,196 | | | | $42,940 | | | | $43,209 | | | | $42,720 | |
| 1 | Calculated based upon average shares outstanding |
| 2 | Total return calculations do not include any sales charges. |
The accompanying notes are an integral part of these financial statements.
| | | | | | |
| Financial highlights | | Wells Fargo Opportunity Fund | | | 19 | |
(For a share outstanding throughout each period)
| | | | | | | | | | | | | | | | | | | | |
| | | Year ended September 30 | |
| ADMINISTRATOR CLASS | | 2016 | | | 2015 | | | 2014 | | | 2013 | | | 2012 | |
Net asset value, beginning of period | | | $46.11 | | | | $52.27 | | | | $48.50 | | | | $40.74 | | | | $33.44 | |
Net investment income | | | 0.24 | 1 | | | 0.79 | | | | 0.08 | | | | 0.06 | 1 | | | 0.09 | |
Net realized and unrealized gains (losses) on investments | | | 5.04 | | | | (1.62 | ) | | | 6.75 | | | | 9.22 | | | | 7.21 | |
| | | | | | | | | | | | | | | | | | | | |
Total from investment operations | | | 5.28 | | | | (0.83 | ) | | | 6.83 | | | | 9.28 | | | | 7.30 | |
Distributions to shareholders from | | | | | | | | | | | | | | | | | | | | |
Net investment income | | | (0.69 | ) | | | 0.00 | | | | 0.00 | | | | 0.00 | | | | 0.00 | |
Net realized gains | | | (5.77 | ) | | | (5.33 | ) | | | (3.06 | ) | | | (1.52 | ) | | | 0.00 | |
| | | | | | | | | | | | | | | | | | | | |
Total distributions to shareholders | | | (6.46 | ) | | | (5.33 | ) | | | (3.06 | ) | | | (1.52 | ) | | | 0.00 | |
Net asset value, end of period | | | $44.93 | | | | $46.11 | | | | $52.27 | | | | $48.50 | | | | $40.74 | |
Total return | | | 12.68 | % | | | (2.04 | )% | | | 14.60 | % | | | 23.59 | % | | | 21.83 | % |
Ratios to average net assets (annualized) | | | | | | | | | | | | | | | | | | | | |
Gross expenses | | | 1.13 | % | | | 1.10 | % | | | 1.10 | % | | | 1.10 | % | | | 1.09 | % |
Net expenses | | | 1.00 | % | | | 1.00 | % | | | 1.00 | % | | | 1.00 | % | | | 1.00 | % |
Net investment income | | | 0.56 | % | | | 1.52 | % | | | 0.09 | % | | | 0.13 | % | | | 0.17 | % |
Supplemental data | | | | | | | | | | | | | | | | | | | | |
Portfolio turnover rate | | | 34 | % | | | 42 | % | | | 32 | % | | | 26 | % | | | 41 | % |
Net assets, end of period (000s omitted) | | | $226,140 | | | | $223,281 | | | | $253,121 | | | | $247,230 | | | | $395,493 | |
| 1 | Calculated based upon average shares outstanding |
The accompanying notes are an integral part of these financial statements.
| | | | |
| 20 | | Wells Fargo Opportunity Fund | | Financial highlights |
(For a share outstanding throughout each period)
| | | | | | | | | | | | | | | | | | | | |
| | | Year ended September 30 | |
| INSTITUTIONAL CLASS | | 2016 | | | 2015 | | | 2014 | | | 2013 | | | 2012 | |
Net asset value, beginning of period | | | $46.76 | | | | $52.82 | | | | $48.86 | | | | $40.93 | | | | $33.52 | |
Net investment income | | | 0.35 | 1 | | | 0.92 | 1 | | | 0.19 | 1 | | | 0.17 | | | | 0.21 | |
Net realized and unrealized gains (losses) on investments | | | 5.12 | | | | (1.65 | ) | | | 6.83 | | | | 9.28 | | | | 7.20 | |
| | | | | | | | | | | | | | | | | | | | |
Total from investment operations | | | 5.47 | | | | (0.73 | ) | | | 7.02 | | | | 9.45 | | | | 7.41 | |
Distributions to shareholders from | | | | | | | | | | | | | | | | | | | | |
Net investment income | | | (0.83 | ) | | | 0.00 | | | | 0.00 | | | | 0.00 | | | | 0.00 | |
Net realized gains | | | (5.77 | ) | | | (5.33 | ) | | | (3.06 | ) | | | (1.52 | ) | | | 0.00 | |
| | | | | | | | | | | | | | | | | | | | |
Total distributions to shareholders | | | (6.60 | ) | | | (5.33 | ) | | | (3.06 | ) | | | (1.52 | ) | | | 0.00 | |
Net asset value, end of period | | | $45.63 | | | | $46.76 | | | | $52.82 | | | | $48.86 | | | | $40.93 | |
Total return | | | 12.97 | % | | | (1.81 | )% | | | 14.89 | % | | | 23.91 | % | | | 22.11 | % |
Ratios to average net assets (annualized) | | | | | | | | | | | | | | | | | | | | |
Gross expenses | | | 0.88 | % | | | 0.83 | % | | | 0.83 | % | | | 0.83 | % | | | 0.82 | % |
Net expenses | | | 0.75 | % | | | 0.75 | % | | | 0.75 | % | | | 0.75 | % | | | 0.75 | % |
Net investment income | | | 0.79 | % | | | 1.79 | % | | | 0.36 | % | | | 0.41 | % | | | 0.39 | % |
Supplemental data | | | | | | | | | | | | | | | | | | | | |
Portfolio turnover rate | | | 34 | % | | | 42 | % | | | 32 | % | | | 26 | % | | | 41 | % |
Net assets, end of period (000s omitted) | | | $17,222 | | | | $11,906 | | | | $29,335 | | | | $14,030 | | | | $10,804 | |
| 1 | Calculated based upon average shares outstanding |
The accompanying notes are an integral part of these financial statements.
| | | | | | |
| Notes to financial statements | | Wells Fargo Opportunity Fund | | | 21 | |
1. ORGANIZATION
Wells Fargo Funds Trust (the “Trust”), a Delaware statutory trust organized on March 10, 1999, is an open-end management investment company registered under the Investment Company Act of 1940, as amended (the “1940 Act”). As an investment company, the Trust follows the accounting and reporting guidance in Financial Accounting Standards Board (“FASB”) Accounting Standards Codification Topic 946, Financial Services – Investment Companies. These financial statements report on the Wells Fargo Opportunity Fund (the “Fund”) which is a diversified series of the Trust.
Effective at the close of business on October 23, 2015, Investor Class shares became Class A shares in a tax-free conversion. Shareholders of Investor Class received Class A shares at a value equal to the value of their Investor Class shares immediately prior to the conversion. Investor Class shares are no longer offered by the Fund.
2. SIGNIFICANT ACCOUNTING POLICIES
The following significant accounting policies, which are consistently followed in the preparation of the financial statements of the Fund, are in conformity with U.S. generally accepted accounting principles which require management to make estimates and assumptions that affect the reported amounts of assets and liabilities, disclosure of contingent assets and liabilities at the date of the financial statements, and the reported amounts of revenues and expenses during the reporting period. Actual results could differ from those estimates.
Securities valuation
All investments are valued each business day as of the close of regular trading on the New York Stock Exchange (generally 4 p.m. Eastern Time), although the Fund may deviate from this calculation time under unusual or unexpected circumstances.
Equity securities that are listed on a foreign or domestic exchange or market are valued at the official closing price or, if none, the last sales price. If no sale occurs on the principal exchange or market that day, the prior day’s price will be deemed “stale” and a fair value price will be determined in accordance with the Fund’s Valuation Procedures.
The values of securities denominated in foreign currencies are translated into U.S. dollars at rates provided by an independent foreign currency pricing source at a time each business day specified by the Management Valuation Team of Wells Fargo Funds Management, LLC (“Funds Management”).
Many securities markets and exchanges outside the U.S. close prior to the close of the New York Stock Exchange and therefore may not fully reflect trading or events that occur after the close of the principal exchange in which the foreign securities are traded, but before the close of the New York Stock Exchange. If such trading or events are expected to materially affect the value of such securities, then fair value pricing procedures approved by the Board of Trustees of the Fund are applied. These procedures take into account multiple factors including movements in U.S. securities markets after foreign exchanges close. Foreign securities that are fair valued under these procedures are categorized as Level 2 and the application of these procedures may result in transfers between Level 1 and Level 2. Depending on market activity, such fair valuations may be frequent. Such fair value pricing may result in net asset values that are higher or lower than net asset values based on the last reported sales price or latest quoted bid price. On September 30, 2016, such fair value pricing was not used in pricing foreign securities.
Investments in registered open-end investment companies are valued at net asset value. Interests in non-registered investment vehicles that are redeemable at net asset value are fair valued normally at net asset value.
Investments which are not valued using any of the methods discussed above are valued at their fair value, as determined in good faith by the Board of Trustees. The Board of Trustees has established a Valuation Committee comprised of the Trustees and has delegated to it the authority to take any actions regarding the valuation of portfolio securities that the Valuation Committee deems necessary or appropriate, including determining the fair value of portfolio securities, unless the determination has been delegated to the Management Valuation Team. The Board of Trustees retains the authority to make or ratify any valuation decisions or approve any changes to the Valuation Procedures as it deems appropriate. On a quarterly basis, the Board of Trustees receives reports on any valuation actions taken by the Valuation Committee or the Management Valuation Team which may include items for ratification.
Valuations of fair valued securities are compared to the next actual sales price when available, or other appropriate market values, to assess the continued appropriateness of the fair valuation methodologies used. These securities are fair valued on a day-to-day basis, taking into consideration changes to appropriate market information and any significant changes to the inputs considered in the valuation process until there is a readily available price provided on an exchange or by an independent pricing service. Valuations received from an independent pricing service or independent
| | | | |
| 22 | | Wells Fargo Opportunity Fund | | Notes to financial statements |
broker-dealer quotes are periodically validated by comparisons to most recent trades and valuations provided by other independent pricing services in addition to the review of prices by the manager and/or subadviser. Unobservable inputs used in determining fair valuations are identified based on the type of security, taking into consideration factors utilized by market participants in valuing the investment, knowledge about the issuer and the current market environment.
Foreign currency translation
The accounting records of the Fund are maintained in U.S. dollars. The values of other assets and liabilities denominated in foreign currencies are translated into U.S. dollars at rates provided by an independent foreign currency pricing source at a time each business day specified by the Management Valuation Team. Purchases and sales of securities, and income and expenses are converted at the rate of exchange on the respective dates of such transactions. Net realized foreign exchange gains or losses arise from sales of foreign currencies, currency gains or losses realized between the trade and settlement dates on securities transactions, and the difference between the amounts of dividends, interest and foreign withholding taxes recorded and the U.S. dollar equivalent of the amounts actually paid or received. Net unrealized foreign exchange gains and losses arise from changes in the fair value of assets and liabilities other than investments in securities resulting from changes in exchange rates. The changes in net assets arising from changes in exchange rates and the changes in net assets resulting from changes in market prices of securities are not separately presented. Such changes are included in net realized and unrealized gains or losses from investments.
Security loans
The Fund may lend its securities from time to time in order to earn additional income in the form of fees or interest on securities received as collateral or the investment of any cash received as collateral. The Fund continues to receive interest or dividends on the securities loaned. The Fund receives collateral in the form of cash or securities with a value at least equal to the value of the securities on loan. The value of the loaned securities is determined at the close of each business day and any additional required collateral is delivered to the Fund on the next business day. In a securities lending transaction, the net asset value of the Fund will be affected by an increase or decrease in the value of the securities loaned and by an increase or decrease in the value of the instrument in which collateral is invested. The amount of securities lending activity undertaken by the Fund fluctuates from time to time. In the event of default or bankruptcy by the borrower, the Fund may be prevented from recovering the loaned securities or gaining access to the collateral or may experience delays or costs in doing so. In addition, the investment of any cash collateral received may lose all or part of its value. The Fund has the right under the lending agreement to recover the securities from the borrower on demand.
The Fund lends its securities through an unaffiliated securities lending agent. Cash collateral received in connection with its securities lending transactions is invested in Securities Lending Cash Investments, LLC (the “Securities Lending Fund”). The Securities Lending Fund is exempt from registration under Section 3(c)(7) of the 1940 Act and is managed by Funds Management and is subadvised by Wells Capital Management Incorporated (“WellsCap”), an affiliate of Funds Management and an indirect wholly owned subsidiary of Wells Fargo & Company (“Wells Fargo”). Funds Management receives an advisory fee starting at 0.05% and declining to 0.01% as the average daily net assets of the Securities Lending Fund increase. All of the fees received by Funds Management are paid to WellsCap for its services as subadviser. The Securities Lending Fund seeks to provide a positive return compared to the daily Fed Funds Open rate by investing in high-quality, U.S. dollar-denominated short-term money market instruments. Securities Lending Fund investments are fair valued based upon the amortized cost valuation technique. Income earned from investment in the Securities Lending Fund is included in securities lending income on the Statement of Operations.
Security transactions and income recognition
Securities transactions are recorded on a trade date basis. Realized gains or losses are recorded on the basis of identified cost.
Dividend income is recognized on the ex-dividend date, except for certain dividends from foreign securities, which are recorded as soon as the custodian verifies the ex-dividend date. Dividend income from foreign securities is recorded net of foreign taxes withheld where recovery of such taxes is not assured.
Distributions to shareholders
Distributions to shareholders from net investment income and net realized gains, if any, are recorded on the ex-dividend date. Such distributions are determined in conformity with federal income tax regulations, which may differ in amount or character from net investment income and realized gains recognized for purposes of U.S. generally accepted accounting principles.
| | | | | | |
| Notes to financial statements | | Wells Fargo Opportunity Fund | | | 23 | |
Federal and other taxes
The Fund intends to continue to qualify as a regulated investment company by distributing substantially all of its investment company taxable income and any net realized capital gains (after reduction for capital loss carryforwards) sufficient to relieve it from all, or substantially all, federal income taxes. Accordingly, no provision for federal income taxes was required.
The Fund’s income and federal excise tax returns and all financial records supporting those returns for the prior three fiscal years are subject to examination by the federal and Delaware revenue authorities. Management has analyzed the Fund’s tax positions taken on federal, state, and foreign tax returns for all open tax years and does not believe that there are any uncertain tax positions that require recognition of a tax liability.
Reclassifications are made to the Fund’s capital accounts for permanent tax differences to reflect income and gains available for distribution (or available capital loss carryforwards) under federal income tax regulations. U.S. generally accepted accounting principles require that certain components of net assets be adjusted to reflect permanent differences between financial and tax reporting. These reclassifications have no effect on net assets or net asset values per share. At September 30, 2016, as a result of permanent book-to-tax differences, the following reclassification adjustments were made on the Statement of Assets and Liabilities:
| | |
Undistributed net investment income | | Accumulated net
realized gains on investments |
| $(469,674) | | $469,674 |
Class allocations
The separate classes of shares offered by the Fund differ principally in applicable sales charges, distribution, shareholder servicing, and administration fees. Class specific expenses are charged directly to that share class. Investment income, common expenses, and realized and unrealized gains (losses) on investments are allocated daily to each class of shares based on the relative proportion of net assets of each class.
3. FAIR VALUATION MEASUREMENTS
Fair value measurements of investments are determined within a framework that has established a fair value hierarchy based upon the various data inputs utilized in determining the value of the Fund’s investments. The three-level hierarchy gives the highest priority to unadjusted quoted prices in active markets for identical assets or liabilities (Level 1) and the lowest priority to significant unobservable inputs (Level 3). The Fund’s investments are classified within the fair value hierarchy based on the lowest level of input that is significant to the fair value measurement. The inputs are summarized into three broad levels as follows:
| n | | Level 1 – quoted prices in active markets for identical securities |
| n | | Level 2 – other significant observable inputs (including quoted prices for similar securities, interest rates, prepayment speeds, credit risk, use of amortized cost, etc.) |
| n | | Level 3 – significant unobservable inputs (including the Fund’s own assumptions in determining the fair value of investments) |
The inputs or methodologies used for valuing investments in securities are not necessarily an indication of the risk associated with investing in those securities.
| | | | |
| 24 | | Wells Fargo Opportunity Fund | | Notes to financial statements |
The following is a summary of the inputs used in valuing the Fund’s assets and liabilities as of September 30, 2016:
| | | | | | | | | | | | | | | | |
| | | Quoted prices
(Level 1) | | | Other significant
observable inputs
(Level 2) | | | Significant
unobservable inputs (Level 3) | | | Total | |
Assets | | | | | | | | | | | | | | | | |
Investments in: | | | | | | | | | | | | | | | | |
| | | | |
Common stocks | | | | | | | | | | | | | | | | |
Consumer discretionary | | $ | 284,702,696 | | | $ | 0 | | | $ | 0 | | | $ | 284,702,696 | |
Consumer staples | | | 96,330,609 | | | | 0 | | | | 0 | | | | 96,330,609 | |
Energy | | | 127,436,089 | | | | 0 | | | | 0 | | | | 127,436,089 | |
Financials | | | 246,356,933 | | | | 0 | | | | 0 | | | | 246,356,933 | |
Health care | | | 237,011,536 | | | | 0 | | | | 0 | | | | 237,011,536 | |
Industrials | | | 194,939,389 | | | | 0 | | | | 0 | | | | 194,939,389 | |
Information technology | | | 383,597,879 | | | | 0 | | | | 0 | | | | 383,597,879 | |
Materials | | | 73,837,327 | | | | 0 | | | | 0 | | | | 73,837,327 | |
Real estate | | | 27,095,616 | | | | 0 | | | | 0 | | | | 27,095,616 | |
| | | | |
Short-term investments | | | | | | | | | | | | | | | | |
Investment companies | | | 25,778,872 | | | | 0 | | | | 0 | | | | 25,778,872 | |
Investments measured at net asset value* | | | | | | | | | | | | | | | 16,584,600 | |
Total assets | | $ | 1,697,086,946 | | | $ | 0 | | | $ | 0 | | | $ | 1,713,671,546 | |
| * | Investments that are measured at fair value using the net asset value per share (or its equivalent) as a practical expedient have not been categorized in the fair value hierarchy. The fair value amount presented in the table is intended to permit reconciliation of the fair value hierarchy to the amounts presented in the Statement of Assets and Liabilities. The Fund’s investment in Securities Lending Cash Investments, LLC valued at $16,584,600 does not have a redemption period notice, can be redeemed daily and does not have any unfunded commitments. |
The Fund recognizes transfers between levels within the fair value hierarchy at the end of the reporting period. At September 30, 2016, the Fund did not have any transfers into/out of Level 1, Level 2, or Level 3.
4. TRANSACTIONS WITH AFFILIATES
Management fee
Funds Management, an indirect wholly owned subsidiary of Wells Fargo, is the manager of the Fund and provides advisory and fund-level administrative services under an investment management agreement. Under the investment management agreement, Funds Management is responsible for, among other services, implementing the investment objectives and strategies of the Fund, supervising the subadviser, providing fund-level administrative services in connection with the Fund’s operations, and providing any other fund-level administrative services reasonably necessary for the operation of the Fund. As compensation for its services under the investment management agreement, Funds Management is entitled to receive an annual management fee starting at 0.75% and declining to 0.63% as the average daily net assets of the Fund increase. For the year ended September 30, 2016, the management fee was equivalent to an annual rate of 0.72% of the Fund’s average daily net assets.
Funds Management has retained the services of a subadviser to provide daily portfolio management to the Fund. The fee for subadvisory services is borne by Funds Management. WellsCap is the subadviser to the Fund and is entitled to receive a fee from Funds Management at an annual rate starting at 0.45% and declining to 0.30% as the average daily net assets of the Fund increase.
Administration fees
Under a class-level administration agreement, Funds Management provides class-level administrative services to the Fund, which includes paying fees and expenses for services provided by the transfer agent, sub-transfer agents, omnibus
| | | | | | |
| Notes to financial statements | | Wells Fargo Opportunity Fund | | | 25 | |
account servicers and record-keepers. As compensation for its services under the class-level administration agreement, Funds Management receives an annual fee which is calculated based on the average daily net assets of each class as follows:
| | | | |
| | | Class-level
administration fee | |
Class A, Class B, Class C | | | 0.21 | % |
Administrator Class, Institutional Class | | | 0.13 | |
Investor Class | | | 0.32 | |
Funds Management has contractually waived and/or reimbursed management and administration fees to the extent necessary to maintain certain net operating expense ratios for the Fund. Waiver of fees and/or reimbursement of expenses by Funds Management were made first from fund level expenses on a proportionate basis and then from class specific expenses. Funds Management has committed through January 31, 2017 to waive fees and/or reimburse expenses to the extent necessary to cap the Fund’s expenses at 1.21% for Class A shares, 1.96% for Class B shares, 1.96% for Class C shares, 1.00% for Administrator Class shares, and 0.75% for Institutional Class shares. After this time, the cap may be increased or the commitment to maintain the cap may be terminated only with the approval of the Board of Trustees.
Distribution fees
The Trust has adopted a distribution plan for Class B and Class C shares of the Fund pursuant to Rule 12b-1 under the 1940 Act. Distribution fees are charged to Class B and Class C shares and paid to Wells Fargo Funds Distributor, LLC (“Funds Distributor”), the principal underwriter, at an annual rate of 0.75% of the average daily net assets of Class B and Class C shares.
In addition, Funds Distributor is entitled to receive the front-end sales charge from the purchase of Class A shares and a contingent deferred sales charge on the redemption of certain Class A shares. Funds Distributor is also entitled to receive the contingent deferred sales charges from redemptions of Class B and Class C shares. For the year ended September 30, 2016, Funds Distributor received $7,740 from the sale of Class A shares and $344 and $132 in contingent deferred sales charges from redemptions of Class B and Class C shares, respectively.
Shareholder servicing fees
The Trust has entered into contracts with one or more shareholder servicing agents, whereby Class A, Class B, Class C, Administrator Class, and Investor Class of the Fund are charged a fee at an annual rate of 0.25% of the average daily net assets of each respective class
A portion of these total shareholder servicing fees were paid to affiliates of Wells Fargo.
5. INVESTMENT PORTFOLIO TRANSACTIONS
Purchases and sales of investments, excluding U.S. government obligations (if any) and short-term securities, for the year ended September 30, 2016 were $564,647,986 and $767,873,422, respectively.
The Fund may purchase or sell investment securities to other Wells Fargo funds under procedures adopted by the Board of Trustees. The procedures have been designed to ensure that these interfund transactions, which generally do not incur broker commissions, are effected at current market prices. Interfund trades are included within the respective purchases and sales amounts shown.
6. BANK BORROWINGS
The Trust (excluding the money market funds and certain other funds) and Wells Fargo Variable Trust are parties to a $250,000,000 revolving credit agreement whereby the Fund is permitted to use bank borrowings for temporary or emergency purposes, such as to fund shareholder redemption requests. Interest under the credit agreement is charged to the Fund based on a borrowing rate equal to the higher of the Federal Funds rate in effect on that day plus 1.25% or the overnight LIBOR rate in effect on that day plus 1.25%. In addition, an annual commitment fee equal to 0.25% of the unused balance is allocated to each participating fund. Prior to August 30, 2016, the revolving credit agreement amount was $200,000,000 and the annual commitment fee was equal to 0.20% of the unused balance which was allocated to each participating fund.
For the year ended September 30, 2016, there were no borrowings by the Fund under the agreement.
| | | | |
| 26 | | Wells Fargo Opportunity Fund | | Notes to financial statements |
7. DISTRIBUTIONS TO SHAREHOLDERS
The tax character of distributions paid during the years ended September 30, 2016 and September 30, 2015 were as follows:
| | | | | | | | |
| | | Year ended September 30 | |
| | | 2016 | | | 2015 | |
Ordinary income | | $ | 25,177,386 | | | $ | 15,991,178 | |
Long-term capital gain | | | 219,607,514 | | | | 183,058,701 | |
As of September 30, 2016, the components of distributable earnings on a tax basis were as follows:
| | | | |
Undistributed ordinary income | | Undistributed long-term gain | | Unrealized gains |
| $8,715,012 | | $96,376,994 | | $420,960,107 |
8. INDEMNIFICATION
Under the Trust’s organizational documents, the officers and Trustees have been granted certain indemnification rights against certain liabilities that may arise out of performance of their duties to the Trust. Additionally, in the normal course of business, the Trust may enter into contracts with service providers that contain a variety of indemnification clauses. The Trust’s maximum exposure under these arrangements is dependent on future claims that may be made against the Fund and, therefore, cannot be estimated.
| | | | | | |
| Report of independent registered public accounting firm | | Wells Fargo Opportunity Fund | | | 27 | |
BOARD OF TRUSTEES AND SHAREHOLDERS OF WELLS FARGO FUNDS TRUST:
We have audited the accompanying statement of assets and liabilities, including the portfolio of investments, of the Wells Fargo Opportunity Fund (formerly known as Wells Fargo Advantage Opportunity Fund) (the “Fund”), one of the funds constituting the Wells Fargo Funds Trust, as of September 30, 2016, and the related statement of operations for the year then ended, the statements of changes in net assets for each of the years in the two-year period then ended, and the financial highlights for each of the years in the five-year period then ended. These financial statements and financial highlights are the responsibility of the Fund’s management. Our responsibility is to express an opinion on these financial statements and financial highlights based on our audits.
We conducted our audits in accordance with the standards of the Public Company Accounting Oversight Board (United States). Those standards require that we plan and perform the audit to obtain reasonable assurance about whether the financial statements and financial highlights are free of material misstatement. An audit includes examining, on a test basis, evidence supporting the amounts and disclosures in the financial statements. Our procedures included confirmation of securities owned as of September 30, 2016, by correspondence with the custodian and brokers, or by other appropriate auditing procedures. An audit also includes assessing the accounting principles used and significant estimates made by management, as well as evaluating the overall financial statement presentation. We believe that our audits provide a reasonable basis for our opinion.
In our opinion, the financial statements and financial highlights referred to above present fairly, in all material respects, the financial position of the Wells Fargo Opportunity Fund as of September 30, 2016, the results of its operations for the year then ended, the changes in its net assets for each of the years in the two-year period then ended, and the financial highlights for each of the years or periods in the five-year period then ended, in conformity with U.S. generally accepted accounting principles.

Boston, Massachusetts
November 23, 2016
| | | | |
| 28 | | Wells Fargo Opportunity Fund | | Other information (unaudited) |
TAX INFORMATION
For corporate shareholders, pursuant to Section 854 of the Internal Revenue Code, 72.76% of ordinary income dividends qualify for the corporate dividends-received deduction for the fiscal year ended September 30, 2016.
Pursuant to Section 852 of the Internal Revenue Code, $219,607,514 was designated as a 20% rate gain distribution for the fiscal year ended September 30, 2016.
Pursuant to Section 854 of the Internal Revenue Code, $23,359,727 of income dividends paid during the fiscal year ended September 30, 2016 has been designated as qualified dividend income (QDI).
For the fiscal year ended September 30, 2016, $20,171 has been designated as interest-related dividends for nonresident alien shareholders pursuant to Section 871 of the Internal Revenue Code.
For the fiscal year ended September 30, 2016, $162,531 has been designated as short-term capital gain dividends for nonresident alien shareholders pursuant to Section 871 of the Internal Revenue Code.
PORTFOLIO HOLDINGS INFORMATION
The complete portfolio holdings for the Fund are publicly available monthly on the Fund’s website (wellsfargofunds.com), on a one-month delayed basis. In addition, top ten holdings information (excluding derivative positions) for the Fund is publicly available on the Fund’s website on a monthly, seven-day or more delayed basis. The Fund files its complete schedule of portfolio holdings with the SEC for the first and third quarters of each fiscal year on Form N-Q, which is available by visiting the SEC website at sec.gov. In addition, the Fund’s Form N-Q may be reviewed and copied at the SEC’s Public Reference Room in Washington, DC, and at regional offices in New York City, at 233 Broadway, and in Chicago, at 175 West Jackson Boulevard, Suite 900. Information about the Public Reference Room may be obtained by calling 1-800-SEC-0330.
PROXY VOTING INFORMATION
A description of the policies and procedures that the Fund uses to determine how to vote proxies relating to portfolio securities is available, upon request, by calling 1-800-222-8222, visiting our website at wellsfargofunds.com, or visiting the SEC website at sec.gov. Information regarding how the Fund voted proxies relating to portfolio securities during the most recent 12-month period ended June 30 is available on the Fund’s website at wellsfargofunds.com or by visiting the SEC website at sec.gov.
| | | | | | |
| Other information (unaudited) | | Wells Fargo Opportunity Fund | | | 29 | |
BOARD OF TRUSTEES AND OFFICERS
Each of the Trustees and Officers1 listed in the table below acts in identical capacities for each fund in the Wells Fargo family of funds, which consists of 138 mutual funds comprising the Wells Fargo Funds Trust, Wells Fargo Variable Trust, Wells Fargo Master Trust and four closed-end funds (collectively the “Fund Complex”). This table should be read in conjunction with the Prospectus and the Statement of Additional Information2. The mailing address of each Trustee and Officer is 525 Market Street, 12th Floor, San Francisco, CA 94105. Each Trustee and Officer serves an indefinite term, however, each Trustee serves such term until reaching the mandatory retirement age established by the Trustees.
Independent Trustees
| | | | | | |
Name and year of birth | | Position held and length of service* | | Principal occupations during past five years or longer | | Current other
public company or
investment company
directorships |
William R. Ebsworth
(Born 1957) | | Trustee, since 2015 | | Retired. From 1984 to 2013, equities analyst, portfolio manager, research director and chief financial officer at Fidelity Management and Research Company in Boston, Tokyo, and Hong Kong and retired in 2013 as Chief Investment Officer of Fidelity Strategic Advisers, Inc. where he lead a team of investment professionals managing client assets. Prior thereto, Board member of Hong Kong Securities Clearing Co., Hong Kong Options Clearing Corp., the Thailand International Fund, Ltd., Fidelity Investments Life Insurance Company, and Empire Fidelity Investments Life Insurance Company. Mr. Ebsworth is a CFA® charterholder and an Adjunct Lecturer, Finance, at Babson College. | | Asset Allocation Trust |
Jane A. Freeman
(Born 1953) | | Trustee, since 2015 | | Retired. From 2012 to 2014 and 1999 to 2008, Chief Financial Officer of Scientific Learning Corporation. From 2008 to 2012, Ms. Freeman provided consulting services related to strategic business projects. Prior to 1999, Portfolio Manager at Rockefeller & Co. and Scudder, Stevens & Clark. Board member of the Harding Loevner Funds from 1996 to 2014, serving as both Lead Independent Director and chair of the Audit Committee. Board member of the Russell Exchange Traded Funds Trust from 2011 to 2012 and the chair of the Audit Committee. Ms. Freeman is a Board Member of Ruth Bancroft Garden (non-profit organization) and an inactive chartered financial analyst. | | Asset Allocation Trust |
Peter G. Gordon
(Born 1942) | | Trustee, since 1998; Chairman, since 2005 | | Co-Founder, Retired Chairman, President and CEO of Crystal Geyser Water Company. Trustee Emeritus, Colby College. | | Asset Allocation Trust |
Isaiah Harris, Jr.
(Born 1952) | | Trustee, since 2009 | | Retired. Chairman of the Board of CIGNA Corporation since 2009, and Director since 2005. From 2003 to 2011, Director of Deluxe Corporation. Prior thereto, President and CEO of BellSouth Advertising and Publishing Corp. from 2005 to 2007, President and CEO of BellSouth Enterprises from 2004 to 2005 and President of BellSouth Consumer Services from 2000 to 2003. Emeritus member of the Iowa State University Foundation Board of Governors. Emeritus Member of the Advisory Board of Iowa State University School of Business. Advisory Board Member, Palm Harbor Academy (charter school). Advisory Board Member, Child Evangelism Fellowship (non-profit). Mr. Harris is a certified public accountant (inactive status). | | CIGNA Corporation; Asset Allocation Trust |
Judith M. Johnson
(Born 1949) | | Trustee, since 2008; Audit Committee Chairman, since 2008 | | Retired. Prior thereto, Chief Executive Officer and Chief Investment Officer of Minneapolis Employees Retirement Fund from 1996 to 2008. Ms. Johnson is an attorney, certified public accountant and a certified managerial accountant. | | Asset Allocation Trust |
David F. Larcker
(Born 1950) | | Trustee, since 2009 | | James Irvin Miller Professor of Accounting at the Graduate School of Business, Stanford University, Director of the Corporate Governance Research Initiative and Senior Faculty of The Rock Center for Corporate Governance since 2006. From 2005 to 2008, Professor of Accounting at the Graduate School of Business, Stanford University. Prior thereto, Ernst & Young Professor of Accounting at The Wharton School, University of Pennsylvania from 1985 to 2005. | | Asset Allocation Trust |
| | | | |
| 30 | | Wells Fargo Opportunity Fund | | Other information (unaudited) |
| | | | | | |
Name and year of birth | | Position held and length of service* | | Principal occupations during past five years or longer | | Current other
public company or
investment company
directorships |
| Olivia S. Mitchell (Born 1953) | | Trustee, since 2006 | | International Foundation of Employee Benefit Plans Professor, Wharton School of the University of Pennsylvania since 1993. Director of Wharton’s Pension Research Council and Boettner Center on Pensions & Retirement Research, and Research Associate at the National Bureau of Economic Research. Previously, Cornell University Professor from 1978 to 1993. | | Asset Allocation Trust |
| Timothy J. Penny (Born 1951) | | Trustee, since 1996 | | President and Chief Executive Officer of Southern Minnesota Initiative Foundation, a non-profit organization, since 2007 and Senior Fellow at the Humphrey Institute Policy Forum at the University of Minnesota since 1995. Member of the Board of Trustees of NorthStar Education Finance, Inc., a non-profit organization, since 2007. | | Asset Allocation Trust |
| Michael S. Scofield (Born 1943) | | Trustee, since 2010 | | Served on the Investment Company Institute’s Board of Governors and Executive Committee from 2008-2011 as well the Governing Council of the Independent Directors Council from 2006-2011 and the Independent Directors Council Executive Committee from 2008-2011. Chairman of the IDC from 2008-2010. Institutional Investor (Fund Directions) Trustee of Year in 2007. Trustee of the Evergreen Funds complex (and its predecessors) from 1984 to 2010. Chairman of the Evergreen Funds from 2000-2010. Former Trustee of the Mentor Funds. Retired Attorney, Law Offices of Michael S. Scofield. | | Asset Allocation Trust |
| * | Length of service dates reflect the Trustee’s commencement of service with the Trust’s predecessor entities, where applicable. |
Officers
| | | | | | |
Name and year of birth | | Position held and
length of service | | Principal occupations during past five years or longer | | |
Karla M. Rabusch
(Born 1959) | | President, since 2003 | | Executive Vice President of Wells Fargo Bank, N.A. and President of Wells Fargo Funds Management, LLC since 2003. | | |
Nancy Wiser1
(Born 1967) | | Treasurer, since 2012 | | Executive Vice President of Wells Fargo Funds Management, LLC since 2011. Chief Operating Officer and Chief Compliance Officer at LightBox Capital Management LLC, from 2008 to 2011. | | |
C. David Messman
(Born 1960) | | Secretary, since 2000; Chief Legal Officer, since 2003 | | Senior Vice President and Secretary of Wells Fargo Funds Management, LLC since 2001. Assistant General Counsel of Wells Fargo Bank, N.A. since 2013 and Vice President and Managing Counsel of Wells Fargo Bank, N.A. from 1996 to 2013. | | |
Michael Whitaker
(Born 1967) | | Chief Compliance Officer, since 20163 | | Executive Vice President of Wells Fargo Funds Management, LLC since 2016. Chief Compliance Officer of Fidelity’s Fixed Income Funds and Asset Allocation Funds from 2008 to 2016, Compliance Officer of FMR Co., Inc. from 2014 to 2016, Fidelity Investments Money Management, Inc. from 2014 to 2016, Fidelity Investments from 2007 to 2016. | | |
David Berardi
(Born 1975) | | Assistant Treasurer, since 2009 | | Vice President of Wells Fargo Funds Management, LLC since 2009. Vice President of Evergreen Investment Management Company, LLC from 2008 to 2010. Manager of Fund Reporting and Control for Evergreen Investment Management Company, LLC from 2004 to 2010. | | |
Jeremy DePalma1
(Born 1974) | | Assistant Treasurer, since 2009 | | Senior Vice President of Wells Fargo Funds Management, LLC since 2009. Senior Vice President of Evergreen Investment Management Company, LLC from 2008 to 2010 and head of the Fund Reporting and Control Team within Fund Administration from 2005 to 2010. | | |
| 1 | Nancy Wiser acts as Treasurer of 70 funds in the Fund Complex. Jeremy DePalma acts as Treasurer of 68 funds and Assistant Treasurer of 70 funds in the Fund Complex. |
| 2 | The Statement of Additional Information includes additional information about the Trustees and is available, without charge, upon request, by calling 1-800-222-8222 or by visiting the website at wellsfargofunds.com. |
| 3 | Michael Whitaker became Chief Compliance Officer effective May 16, 2016. |
| | | | | | |
| Other information (unaudited) | | Wells Fargo Opportunity Fund | | | 31 | |
BOARD CONSIDERATION OF INVESTMENT MANAGEMENT AND SUB-ADVISORY AGREEMENTS:
Under the Investment Company Act of 1940 (the “1940 Act”), the Board of Trustees (the “Board”) of Wells Fargo Funds Trust (the “Trust”) must determine annually whether to approve the continuation of the Trust’s investment management and sub-advisory agreements. In this regard, at an in-person meeting held on May 24-25, 2016 (the “Meeting”), the Board, all the members of which have no direct or indirect interest in the investment management and sub-advisory agreements and are not “interested persons” of the Trust, as defined in the 1940 Act (the “Independent Trustees”), reviewed and approved for Wells Fargo Opportunity Fund (the “Fund”): (i) an investment management agreement (the “Management Agreement”) with Wells Fargo Funds Management, LLC (“Funds Management”); and (ii) an investment sub-advisory agreement (the “Sub-Advisory Agreement”) with Wells Capital Management Incorporated (the “Sub-Adviser”), an affiliate of Funds Management. The Management Agreement and the Sub-Advisory Agreement are collectively referred to as the “Advisory Agreements.”
At the Meeting, the Board considered the factors and reached the conclusions described below relating to the selection of Funds Management and the Sub-Adviser and the approval of the Advisory Agreements. Prior to the Meeting, including at an in-person meeting in April 2016, the Trustees conferred extensively among themselves and with representatives of Funds Management about these matters. Also, the Board has adopted a team-based approach, with each team consisting of a sub-set of Trustees, to assist the full Board in the discharge of its duties in reviewing performance and other matters throughout the year. The Independent Trustees were assisted in their evaluation of the Advisory Agreements by independent legal counsel, from whom they received separate legal advice and with whom they met separately.
In providing information to the Board, Funds Management and the Sub-Adviser were guided by a detailed set of requests for information submitted to them by independent legal counsel on behalf of the Independent Trustees at the start of the Board’s annual contract renewal process earlier in 2016. In considering and approving the Advisory Agreements, the Trustees considered the information they believed relevant, including but not limited to the information discussed below. The Board considered not only the specific information presented in connection with the Meeting, but also the knowledge gained over time through interaction with Funds Management and the Sub-Adviser about various topics. In this regard, the Board reviewed reports of Funds Management at each of its quarterly meetings, which included, among other things, portfolio reviews and performance reports. In addition, the Board and the teams mentioned above confer with portfolio managers at various times throughout the year. The Board did not identify any particular information or consideration that was all-important or controlling, and each individual Trustee may have attributed different weights to various factors.
After its deliberations, the Board unanimously approved the continuation of the Advisory Agreements for a one-year term and determined that the compensation payable to Funds Management and the Sub-Adviser under each of the Advisory Agreements was reasonable. The Board considered the approval of the Advisory Agreements for the Fund as part of its consideration of agreements for funds across the complex, but its approvals were made on a fund-by-fund basis. The following summarizes a number of important, but not necessarily all, factors considered by the Board in support of its approvals.
Nature, extent and quality of services
The Board received and considered various information regarding the nature, extent and quality of services provided to the Fund by Funds Management and the Sub-Adviser under the Advisory Agreements. This information included a description of the investment advisory services and Fund-level administrative services covered by the Management Agreement, as well as, among other things, a summary of the background and experience of senior management of Funds Management, and the qualifications, background, tenure and responsibilities of each of the portfolio managers primarily responsible for the day-to-day portfolio management of the Fund.
The Board evaluated the ability of Funds Management and the Sub-Adviser to attract and retain qualified investment professionals, including research, advisory and supervisory personnel. The Board further considered the compliance programs and compliance records of Funds Management and the Sub-Adviser. In addition, the Board took into account the full range of services provided to the Fund by Funds Management and its affiliates.
Fund performance and expenses
The Board considered the performance results for the Fund over various time periods ended December 31, 2015. The Board considered these results in comparison to the performance of funds in a universe that was determined by Broadridge Inc. (“Broadridge”) to be similar to the Fund (the “Universe”), and in comparison to the Fund’s benchmark index and to other comparative data. Broadridge is an independent provider of investment company data. The Board received a description of the methodology used by Broadridge to select the mutual funds in the performance Universe.
| | | | |
| 32 | | Wells Fargo Opportunity Fund | | Other information (unaudited) |
The Board noted that the performance of the Fund (Administrator Class) was lower than the average performance of the Universe for all periods under review except the ten-year period under review. The Board also noted that the performance of the Fund was lower than its benchmark, the Russell 3000® Index, for all periods under review.
The Board received information concerning, and discussed factors contributing to, the underperformance of the Fund relative to the Universe and benchmark for the periods noted above. The Board took note of the explanations for the relative underperformance in these periods, including with respect to market factors and investment decisions that affected the Fund’s performance.
The Board also received and considered information regarding the Fund’s net operating expense ratios and their various components, including actual management fees, custodian and other non-management fees, and Rule 12b-1 and non-Rule 12b-1 shareholder service fees. The Board considered these ratios in comparison to the median ratios of funds in class-specific expense groups that were determined by Broadridge to be similar to the Fund (the “Groups”). The Board received a description of the methodology used by Broadridge to select the mutual funds in the expense Groups and an explanation of how funds comprising expense groups and their expense ratios may vary from year-to-year. Based on the Broadridge reports, the Board noted that the net operating expense ratios of the Fund were lower than or in range of the median net operating expense ratios of the expense Groups.
The Board took into account the Fund performance and expense information provided to it among the factors considered in deciding to re-approve the Advisory Agreements.
Investment management and sub-advisory fee rates
The Board reviewed and considered the contractual fee rates payable by the Fund to Funds Management under the Management Agreement, as well as the contractual fee rates payable by the Fund to Funds Management for class-level administrative services under a Class-Level Administration Agreement, which include class-level transfer agency and sub-transfer agency costs (collectively, the “Management Rates”). The Board also reviewed and considered the contractual investment sub-advisory fee rates that are payable by Funds Management to the Sub-Adviser for investment sub-advisory services.
Among other information reviewed by the Board was a comparison of the Fund’s Management Rates with the average contractual investment management fee rates of funds in the expense Groups at a common asset level as well as transfer agency costs of the funds in the expense Groups. The Board noted that the Management Rates of the Fund were in range of the sum of these average rates for the Fund’s expense Groups for all share classes.
The Board also received and considered information about the portion of the total management fee that was retained by Funds Management after payment of the fee to the Sub-Adviser for sub-advisory services. In assessing the reasonableness of this amount, the Board received and evaluated information about the nature and extent of responsibilities retained and risks assumed by Funds Management and not delegated to or assumed by the Sub-Adviser, and about Funds Management’s on-going oversight services. However, given the affiliation between Funds Management and the Sub-Adviser, the Board ascribed limited relevance to the allocation of fees between them.
The Board also received and considered information about the nature and extent of services offered and fee rates charged by Funds Management and the Sub-Adviser to other types of clients with investment strategies similar to those of the Fund. In this regard, the Board received information about the significantly greater scope of services, and compliance, reporting and other legal burdens and risks of managing mutual funds compared with those associated with managing assets of non-mutual fund clients such as collective funds or institutional separate accounts.
Based on its consideration of the factors and information it deemed relevant, including those described here, the Board determined that the compensation payable to Funds Management under the Management Agreement and to the Sub-Adviser under the Sub-Advisory Agreement was reasonable, in light of the services covered by the Advisory Agreements.
Profitability
The Board received and considered information concerning the profitability of Funds Management, as well as the profitability of Wells Fargo as a whole, from providing services to the Fund and the fund family as a whole. The Board also received and considered information concerning the profitability of the Sub-Adviser from providing services to the fund family as a whole, noting that the Sub-Adviser’s profitability information with respect to providing services to the Fund was subsumed in the Wells Fargo and Funds Management profitability analysis.
Funds Management reported on the methodologies and estimates used in calculating profitability. Among other things, the Board noted that the levels of profitability reported on a fund-by-fund basis varied widely, depending on factors such
| | | | | | |
| Other information (unaudited) | | Wells Fargo Opportunity Fund | | | 33 | |
as the size and type of fund. Based on its review, the Board did not deem the profits reported by Funds Management or Wells Fargo from its services to the Fund to be at a level that would prevent it from approving the continuation of the Advisory Agreements.
Economies of scale
With respect to possible economies of scale, the Board noted the existence of breakpoints in the Fund’s management fee structure, which operate generally to reduce the Fund’s expense ratios as the Fund grows in size. It considered that, for a small fund or a fund that shrinks in size, breakpoints conversely can result in higher fee levels. The Board also considered that fee waiver and expense reimbursement arrangements and competitive fee rates at the outset are means of sharing potential economies of scale with shareholders of the Fund and the fund family as a whole. The Board considered Funds Management’s view that any analyses of potential economies of scale in managing a particular fund are inherently limited in light of the joint and common costs and investments that Funds Management incurs across the fund family as a whole.
The Board concluded that the Fund’s fee and expense arrangements, including contractual breakpoints, constituted a reasonable approach to sharing potential economies of scale with the Fund and its shareholders.
Other benefits to funds Management and the Sub-Adviser
The Board received and considered information regarding potential “fall-out” or ancillary benefits received by Funds Management and its affiliates, including the Sub-Adviser, as a result of their relationships with the Fund. Ancillary benefits could include, among others, benefits directly attributable to other relationships with the Fund and benefits potentially derived from an increase in Funds Management’s and the Sub-Adviser’s business as a result of their relationships with the Fund. The Board noted that various affiliates of Funds Management may receive distribution-related fees, shareholder servicing payments and sub-transfer agency fees in respect of shares sold or held through them and services provided.
The Board also reviewed information about soft dollar credits earned and utilized by the Sub-Adviser, fees earned by Funds Management and the Sub-Adviser from managing a private investment vehicle for the fund family’s securities lending collateral and commissions earned by an affiliated broker from portfolio transactions.
Based on its consideration of the factors and information it deemed relevant, including those described here, the Board did not find that any ancillary benefits received by Funds Management and its affiliates, including the Sub-Adviser, were unreasonable.
Conclusion
At the Meeting, after considering the above-described factors and based on its deliberations and its evaluation of the information described above, the Board unanimously approved the continuation of the Advisory Agreements for a one-year term and determined that the compensation payable to Funds Management and the Sub-Adviser under each of the Advisory Agreements was reasonable.
| | | | |
| 34 | | Wells Fargo Opportunity Fund | | List of abbreviations |
The following is a list of common abbreviations for terms and entities that may have appeared in this report.
| ACA | — ACA Financial Guaranty Corporation |
| ADR | — American depositary receipt |
| ADS | — American depositary shares |
| AGC | — Assured Guaranty Corporation |
| AGM | — Assured Guaranty Municipal |
| Ambac | — Ambac Financial Group Incorporated |
| AMT | — Alternative minimum tax |
| BAN | — Bond anticipation notes |
| BHAC | — Berkshire Hathaway Assurance Corporation |
| CAB | — Capital appreciation bond |
| CCAB | — Convertible capital appreciation bond |
| CDA | — Community Development Authority |
| CDO | — Collateralized debt obligation |
| DRIVER | — Derivative inverse tax-exempt receipts |
| DW&P | — Department of Water & Power |
| DWR | — Department of Water Resources |
| ECFA | — Educational & Cultural Facilities Authority |
| EDA | — Economic Development Authority |
| EDFA | — Economic Development Finance Authority |
| ETF | — Exchange-traded fund |
| FDIC | — Federal Deposit Insurance Corporation |
| FFCB | — Federal Farm Credit Banks |
| FGIC | — Financial Guaranty Insurance Corporation |
| FHA | — Federal Housing Administration |
| FHLB | — Federal Home Loan Bank |
| FHLMC | — Federal Home Loan Mortgage Corporation |
| FICO | — The Financing Corporation |
| FNMA | — Federal National Mortgage Association |
| GDR | — Global depositary receipt |
| GNMA | — Government National Mortgage Association |
| HCFR | — Healthcare facilities revenue |
| HEFA | — Health & Educational Facilities Authority |
| HEFAR | — Higher education facilities authority revenue |
| HFA | — Housing Finance Authority |
| HFFA | — Health Facilities Financing Authority |
| HUD | — Department of Housing and Urban Development |
| IDA | — Industrial Development Authority |
| IDAG | — Industrial Development Agency |
| KRW | — Republic of Korea won |
| LIBOR | — London Interbank Offered Rate |
| LIFER | — Long Inverse Floating Exempt Receipts |
| LLC | — Limited liability company |
| LLLP | — Limited liability limited partnership |
| LLP | — Limited liability partnership |
| MBIA | — Municipal Bond Insurance Association |
| MFHR | — Multifamily housing revenue |
| MSTR | — Municipal securities trust receipts |
| MUD | — Municipal Utility District |
| National | — National Public Finance Guarantee Corporation |
| PCFA | — Pollution Control Financing Authority |
| PCL | — Public Company Limited |
| PCR | — Pollution control revenue |
| PFA | — Public Finance Authority |
| PFFA | — Public Facilities Financing Authority |
| PFOTER | — Puttable floating option tax-exempt receipts |
| plc | — Public limited company |
| PUTTER | — Puttable tax-exempt receipts |
| R&D | — Research & development |
| Radian | — Radian Asset Assurance |
| RAN | — Revenue anticipation notes |
| RDA | — Redevelopment Authority |
| RDFA | — Redevelopment Finance Authority |
| REIT | — Real estate investment trust |
| ROC | — Reset option certificates |
| SAVRS | — Select auction variable rate securities |
| SBA | — Small Business Authority |
| SDR | — Swedish depositary receipt |
| SFHR | — Single-family housing revenue |
| SFMR | — Single-family mortgage revenue |
| SPA | — Standby purchase agreement |
| SPDR | — Standard & Poor’s Depositary Receipts |
| SPEAR | — Short Puttable Exempt Adjustable Receipts |
| STRIPS | — Separate trading of registered interest and |
| TAN | — Tax anticipation notes |
| TIPS | — Treasury inflation-protected securities |
| TRAN | — Tax revenue anticipation notes |
| TTFA | — Transportation Trust Fund Authority |
| TVA | — Tennessee Valley Authority |
This page is intentionally left blank.
This page is intentionally left blank.

For more information
More information about Wells Fargo Funds is available free upon request. To obtain literature, please write, email, visit the Fund’s website, or call:
Wells Fargo Funds
P.O. Box 8266
Boston, MA 02266-8266
Email: fundservice@wellsfargo.com
Website: wellsfargofunds.com
Individual investors: 1-800-222-8222
Retail investment professionals: 1-888-877-9275
Institutional investment professionals: 1-866-765-0778
This report and the financial statements contained herein are submitted for the general information of the shareholders of the Fund. If this report is used for promotional purposes, distribution of the report must be accompanied or preceded by a current prospectus. Before investing, please consider the investment objectives, risks, charges, and expenses of the investment. For a current prospectus and, if available, a summary prospectus, containing this information, call 1-800-222-8222 or visit the Fund’s website at wellsfargofunds.com. Read the prospectus carefully before you invest or send money.
Wells Fargo Asset Management (WFAM) is a trade name used by the asset management businesses of Wells Fargo & Company. Wells Fargo Funds Management, LLC, a wholly owned subsidiary of Wells Fargo & Company, provides investment advisory and administrative services for Wells Fargo Funds. Other affiliates of Wells Fargo & Company provide subadvisory and other services for the funds. The funds are distributed by Wells Fargo Funds Distributor, LLC, Member FINRA, an affiliate of Wells Fargo & Company. Neither Wells Fargo Funds Management nor Wells Fargo Funds Distributor has Fund customer accounts/assets, and neither provides investment advice/recommendations or acts as an investment advice fiduciary to any investor.
NOT FDIC INSURED ¡ NO BANK GUARANTEE ¡ MAY LOSE VALUE
© 2016 Wells Fargo Funds Management, LLC. All rights reserved.
| | |
 | | 246396 11-16 A232/AR232 09-16 |
Annual Report
September 30, 2016

Wells Fargo Special Mid Cap Value Fund


Reduce clutter. Save trees.
Sign up for electronic delivery of prospectuses and shareholder reports at wellsfargo.com/advantagedelivery
Contents
The views expressed and any forward-looking statements are as of September 30, 2016, unless otherwise noted, and are those of the Fund managers and/or Wells Fargo Funds Management, LLC. Discussions of individual securities, or the markets generally, or any Wells Fargo Fund are not intended as individual recommendations. Future events or results may vary significantly from those expressed in any forward-looking statements. The views expressed are subject to change at any time in response to changing circumstances in the market. Wells Fargo Funds Management, LLC and the Fund disclaim any obligation to publicly update or revise any views expressed or forward-looking statements.
NOT FDIC INSURED ¡ NO BANK GUARANTEE ¡ MAY LOSE VALUE
| | | | |
| 2 | | Wells Fargo Special Mid Cap Value Fund | | Letter to shareholders (unaudited) |

Karla M. Rabusch
President
Wells Fargo Funds
Dear Shareholder:
We are pleased to offer you this annual report for the Wells Fargo Special Mid Cap Value Fund for the 12-month period that ended September 30, 2016. During this period, which began October 1, 2015, U.S. and international stock markets experienced bouts of heightened volatility, with intermittent sell-offs interspersed with rebounds. Despite market fluctuations throughout the year, U.S. small-, mid-, and large-cap stocks delivered double-digit positive results overall for the 12-month reporting period, as measured by the Russell 2000® Index,1 the Russell Midcap® Index,2 and the Russell 1000® Index,3 respectively. Small-cap U.S. stocks performed best, followed by large- and mid-cap stocks. International stocks overall also delivered positive results for the period.
Despite ongoing concerns, U.S. stocks generally rose in the fourth quarter of 2015; international markets lagged.
While U.S. stocks overall delivered favorable results in the quarter, stock markets outside the U.S. failed to keep pace as economic concerns, including China’s ongoing slowdown, continued to affect many countries. U.S. economic data released during the quarter indicated the economy remained solid, although the strong U.S. dollar and weakness in international economies remained headwinds. In December, the Federal Reserve (Fed), as expected, raised its target interest rate by 25 basis points (100 basis points equals 1.00%) after keeping it near zero for seven years. The move reflected confidence in the U.S. economy’s ability to stay healthy with less central-bank support. The Fed also clarified that future interest-rate increases would be gradual.
In the first quarter of 2016, market volatility increased globally amid ongoing concerns.
Stock markets worldwide fluctuated widely in the first quarter of 2016. Most sold off sharply in the first six weeks of the year on concerns such as weak global growth, falling commodity prices, and uncertainty over the timing and impact of the Fed’s interest-rate increases. As the quarter progressed, fears abated somewhat and global markets generally rallied. The U.S. economy ended the quarter on a positive note as much of the quarter’s data reflected resiliency. With ongoing uncertainties about global growth and financial markets, however, the Fed held off from raising the target interest rate during the quarter. Outside the U.S., the eurozone fell into deflation in February; in response, the European Central Bank (ECB) announced an expansion of its stimulus program. In China, the government in March set an anticipated growth rate of 6.5% to 7.0% for 2016, an acknowledgment of weakening growth. In emerging markets, although central-bank stimulus and improved prices for oil and other commodities led to stock-market rallies in the quarter, many of these countries’ economies face the potential of credit downgrades due to challenges such as the likelihood of a stronger U.S. dollar, which would make dollar-denominated debt more expensive.
Worries over interest rates and the U.K.’s Brexit vote largely drove markets during the second quarter of 2016.
U.S. stocks began the quarter in positive territory but started to lose steam in early May on worries that a possible June interest-rate increase by the Fed could hurt
| 1 | The Russell 2000® Index measures the performance of the 2,000 smallest companies in the Russell 3000® Index, which represents approximately 8% of the total market capitalization of the Russell 3000® Index. You cannot invest directly in an index. |
| 2 | The Russell Midcap® Index measures the performance of the 800 smallest companies in the Russell 1000® Index, which represent approximately 25% of the total market capitalization of the Russell 1000® Index. You cannot invest directly in an index. |
| 3 | The Russell 1000® Index measures the performance of the 1,000 largest companies in the Russell 3000® Index, which represents approximately 92% of the total market capitalization of the Russell 3000® Index. You cannot invest directly in an index. |
| | | | | | |
| Letter to shareholders (unaudited) | | Wells Fargo Special Mid Cap Value Fund | | | 3 | |
the market. In mid-May, stocks briefly plunged following comments by Fed officials noting that a June interest-rate increase remained on the table. But once investors had processed this information, stocks again rallied, finishing up for the month. The first three weeks of June brought heightened volatility, spurred largely by a disappointing jobs report and uncertainty over whether the U.K. would remain in the E.U. The U.K.’s Brexit vote on June 23 shocked countries in Europe and much of the rest of the world. Stock markets fell as investors worried that the U.K.’s departure from the E.U. would slow global growth and prolong the low-interest-rate environment. Following the initial rout, however, U.S. stocks rallied as investors seemed to decide that any negative effects would be more localized and not create a serious risk for global growth. By quarter-end, the broad U.S. stock market had moved back into positive territory.
U.S. stocks delivered generally positive results in the third quarter of 2016.
The rally in U.S. stocks continued into early July 2016. U.S. stocks then generally continued to move upward at a more moderate pace, reaching a quarterly peak in August before the upward momentum started to lose some steam. Markets worldwide have been supported to varying degrees by accommodative policies from leading central banks, including the Fed, ECB, Bank of England, and Bank of Japan. As a result, investors have watched closely for any signs that global central banks might tighten their measures. Although many U.S. investors had doubted the Fed would increase interest rates in September, hawkish comments by several Fed officials in early September raised concerns, sending stock and bond prices downward. However, immediately following the Fed’s September 20 meeting, stocks surged on news that the Fed had decided to leave short-term interest rates unchanged for the time being and had signaled its intention to increase rates by year-end. The Fed also lowered its estimates for long-term economic growth and adjusted its anticipated pace of future rate increases. U.S. small-cap stocks in particular benefited from a renewed investor focus on fundamentals and from healthy merger and acquisition activity.
Don’t let short-term uncertainty derail long-term investment goals.
Periods of uncertainty can present challenges, but experience has taught us that maintaining long-term investment goals can be an effective way to plan for the future. To help you create a sound strategy based on your personal goals and risk tolerance, Wells Fargo Funds offers more than 100 mutual funds spanning a wide range of asset classes and investment styles. Although diversification cannot guarantee an investment profit or prevent losses, we believe it can be an effective way to manage investment risk and potentially smooth out overall portfolio performance. We encourage investors to know their investments and to understand that appropriate levels of risk-taking may unlock opportunities.
Thank you for choosing to invest in Wells Fargo Funds. We appreciate your confidence in us and remain committed to helping you meet your financial needs.
Sincerely,

Karla M. Rabusch
President
Wells Fargo Funds
Markets worldwide have been supported to varying degrees by accommodative policies from leading central banks, including the Fed, ECB, Bank of England, and Bank of Japan.
Although diversification cannot guarantee an investment profit or prevent losses, we believe it can be an effective way to manage investment risk and potentially smooth out overall portfolio performance.
For further information about your Fund, contact your investment professional, visit our website at wellsfargofunds.com, or call us directly at 1-800-222-8222. We are available 24 hours a day, 7 days a week.
| | | | |
| 4 | | Wells Fargo Special Mid Cap Value Fund | | Performance highlights (unaudited) |
Investment objective
The Fund seeks long-term capital appreciation.
Manager
Wells Fargo Funds Management, LLC
Subadviser
Wells Capital Management Incorporated
Portfolio managers
James M. Tringas, CFA®, CPA
Bryant VanCronkhite, CFA®,CPA
Average annual total returns (%) as of September 30, 20161
| | | | | | | | | | | | | | | | | | | | | | | | | | | | | | | | | | |
| | | | | Including sales charge | | | Excluding sales charge | | | Expense ratios2 (%) | |
| | | Inception date | | 1 year | | | 5 year | | | 10 year | | | 1 year | | | 5 year | | | 10 year | | | Gross | | | Net3 | |
| Class A (WFPAX) | | 7-31-2007 | | | 8.73 | | | | 16.85 | | | | 7.71 | | | | 15.34 | | | | 18.25 | | | | 8.35 | | | | 1.22 | | | | 1.22 | |
| Class C (WFPCX) | | 7-31-2007 | | | 13.47 | | | | 17.36 | | | | 7.55 | | | | 14.47 | | | | 17.36 | | | | 7.55 | | | | 1.97 | | | | 1.97 | |
| Class R (WFHHX) | | 9-30-2015 | | | – | | | | – | | | | – | | | | 15.05 | | | | 17.98 | | | | 8.10 | | | | 1.47 | | | | 1.47 | |
| Class R6 (WFPRX) | | 6-28-2013 | | | – | | | | – | | | | – | | | | 15.84 | | | | 18.78 | | | | 8.79 | | | | 0.79 | | | | 0.79 | |
| Administrator Class (WFMDX) | | 4-8-2005 | | | – | | | | – | | | | – | | | | 15.42 | | | | 18.39 | | | | 8.48 | | | | 1.14 | | | | 1.14 | |
| Institutional Class (WFMIX) | | 4-8-2005 | | | – | | | | – | | | | – | | | | 15.73 | | | | 18.72 | | | | 8.77 | | | | 0.89 | | | | 0.88 | |
| Russell Midcap® Value Index4 | | – | | | – | | | | – | | | | – | | | | 17.26 | | | | 17.38 | | | | 7.89 | | | | – | | | | – | |
Figures quoted represent past performance, which is no guarantee of future results, and do not reflect taxes that a shareholder may pay on fund distributions or the redemption of fund shares. Investment return and principal value of an investment will fluctuate so that an investor’s shares, when redeemed, may be worth more or less than their original cost. Performance shown without sales charges would be lower if sales charges were reflected. Current performance may be lower or higher than the performance data quoted, which assumes the reinvestment of dividends and capital gains. Current month-end performance is available on the Fund’s website, wellsfargofunds.com.
Index returns do not include transaction costs associated with buying and selling securities, any mutual fund fees or expenses, or any taxes. It is not possible to invest directly in an index.
For Class A shares, the maximum front-end sales charge is 5.75%. For Class C shares, the maximum contingent deferred sales charge is 1.00%. Performance including a contingent deferred sales charge assumes the sales charge for the corresponding time period. Class R, Class R6, Administrator Class, and Institutional Class shares are sold without a front-end sales charge or contingent deferred sales charge.
Stock values fluctuate in response to the activities of individual companies and general market and economic conditions. Smaller-company stocks tend to be more volatile and less liquid than those of larger companies. Consult the Fund’s prospectus for additional information on these and other risks.
Please see footnotes on page 5.
| | | | | | |
| Performance highlights (unaudited) | | Wells Fargo Special Mid Cap Value Fund | | | 5 | |
|
| Growth of $10,000 investment as of September 30, 20165 |
|
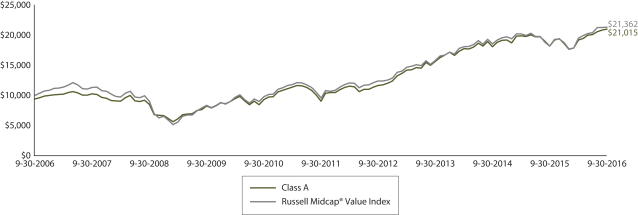 |
| 1 | Historical performance shown for Class A shares prior to their inception reflects the performance of the former Investor Class shares, and includes the higher expenses applicable to the former Investor Class shares. If these expenses had not been included, returns would be higher. Historical performance shown for Class C shares prior to their inception reflects the performance of the former Investor Class shares and has been adjusted to reflect the higher expenses applicable to Class C shares. Historical performance shown for the Class R shares prior to their inception reflects the performance of the Institutional Class shares, adjusted to reflect the higher expenses applicable to Class R shares. Historical performance shown for Class R6 shares prior to their inception reflects the performance of Institutional Class shares, and includes the higher expenses applicable to Institutional Class shares. If these expenses had not been included, the returns would be higher. |
| 2 | Reflects the expense ratios as stated in the most recent prospectuses, which include the impact of 0.01% in acquired fund fees and expenses. The expense ratios shown are subject to change and may differ from the annualized expense ratios shown in the financial highlights of this report, which do not include acquired fund fees and expenses. |
| 3 | The manager has contractually committed through January 31, 2017, to waive fees and/or reimburse expenses to the extent necessary to cap the Fund’s Total Annual Fund Operating Expenses After Fee Waiver at 1.25% for Class A, 2.00% for Class C, 1.50% for Class R, 0.82% for Class R6, 1.14% for Administrator Class, and 0.87% for Institutional Class. After this time, the cap may be increased or the commitment to maintain the cap may be terminated only with the approval of the Board of Trustees. Brokerage commissions, stamp duty fees, interest, taxes, acquired fund fees and expenses, and extraordinary expenses are excluded from the expense cap. Without this cap, the Fund’s returns would have been lower. |
| 4 | The Russell Midcap® Value Index measures the performance of those Russell Midcap companies with lower price-to-book ratios and lower forecasted growth values. The stocks are also members of the Russell 1000® Value Index. You cannot invest directly in an index. |
| 5 | The chart compares the performance of Class A shares for the most recent ten years with the Russell Midcap® Value Index. The chart assumes a hypothetical investment of $10,000 in Class A shares and reflects all operating expenses and assumes the maximum initial sales charge of 5.75%. |
| 6 | The ten largest holdings, excluding cash and cash equivalents, are calculated based on the value of the investments divided by total net assets of the Fund. Holdings are subject to change and may have changed since the date specified. |
| 7 | Amounts are calculated based on the total long-term investments of the Fund. These amounts are subject to change and may have changed since the date specified. |
| | | | |
| 6 | | Wells Fargo Special Mid Cap Value Fund | | Performance highlights (unaudited) |
MANAGER’S DISCUSSION
Fund highlights
| n | | The Fund underperformed its benchmark, the Russell Midcap® Value Index, for the 12-month period that ended September 30, 2016. |
| n | | Detractors from performance included stock selection in the information technology (IT) and industrials sectors and underweights to the real estate and utilities sectors. Contributors included stock selection in the energy, health care, and financials sectors; an overweight to the industrials and IT sectors benefited results as well. |
| n | | Our investment process is based on evaluating companies according to their relative risk and return profiles, a process that we believe has proven successful over time. |
Slower-than-expected interest-rate increases by the Federal Reserve (Fed), a surprising vote for the U.K. to exit the European Union, and accommodative central banks around the globe drove historically low interest rates and fueled U.S. mid-cap value indexes over the 12-month period.
The Fed did raise rates by 25 basis points (100 basis points equals 1.00%) in December 2015, and equity markets declined in anticipation of this increase and concerns about potential further increases in 2016. However, those fears reversed sharply in February 2016 as investors became increasingly confident that the Fed would remain accommodative and put further increases on hold. The market rallied, and the Russell Midcap Value Index experienced significant gains following the February lows. The 10-year Treasury yield dipped below 1.5% in 2016, and credit spreads tightened, providing a strong tailwind for mid-cap equities and an intensified search by investors for income-yielding investments. Economically sensitive companies within the materials and industrials sectors led the index, along with companies in the traditional high-dividend-yield utilities and real estate sectors.
Our process focuses on companies that control their own destinies via long-term competitive advantages, flexible balance sheets, and sustainable free cash flow. We believe this focus will continue to provide participation in up markets, such as we experienced over this reporting period, as well as mitigation in potential down markets.
| | | | |
| Ten largest holdings (%) as of September 30, 20166 | |
Fidelity National Information Services Incorporated | | | 2.90 | |
TreeHouse Foods Incorporated | | | 2.87 | |
Harris Corporation | | | 2.69 | |
Molson Coors Brewing Company Class B | | | 2.58 | |
Loews Corporation | | | 2.43 | |
Kohl’s Corporation | | | 2.24 | |
Ameren Corporation | | | 2.23 | |
Brown & Brown Incorporated | | | 2.20 | |
American Electric Power Company Incorporated | | | 2.19 | |
FNF Group | | | 2.14 | |
We made modest changes to sector weightings.
Our stock selection process led to modest changes to the Fund’s sector weightings during the period. We maintained overweights to the industrials, consumer staples, and IT sectors because they offer an eclectic set of companies that in our view create unique investment opportunities. Although we added several utilities companies to the Fund during the period, we still remained heavily underweight to the sector based on our valuation research. Within the energy sector, we reduced the underweight and added new positions in Baker Hughes Incorporated and National Oilwell Varco, Incorporated. Our overweight to industrials narrowed over the 12-month period, partly because we trimmed positions as valuations moved higher and individual
reward/risk ratios decreased; an increase in the Russell Midcap® Value Index’s industrials weighting during the period somewhat narrowed the overweight as well.
Underweights to the utilities and real estate sectors detracted from Fund performance.
During the pullback in early 2016, we identified several companies within the utilities sector that met our strict criteria and were added to the portfolio, reducing our underweight. However, we have maintained underweights to the real estate sector (composed mainly of real estate investment trusts, or REITs) and the utilities sector because our reward/risk valuation work has caused us to conclude that most REITs and utilities remain unattractive based on our reward/risk valuation framework, offering low potential returns relative to expected risk over our multiyear investment horizon.
Please see footnotes on page 5.
| | | | | | |
| Performance highlights (unaudited) | | Wells Fargo Special Mid Cap Value Fund | | | 7 | |
Stock selection in the IT and industrials sectors detracted from the Fund’s performance.
IT company Western Digital Corporation was the fund’s largest detractor as investors digested its SanDisk Corporation merger; the ongoing integration of its Hitachi Global Storage Technologies, Incorporated, acquisition; and potential integration risks. We continue to believe both acquisitions improve Western Digital’s competitive position through industry consolidation and vertical integration benefits; the company’s stock price currently appears to undervalue the long-term free cash flow that could be produced. In the industrials sector, Stericycle, Incorporated, which was added to the Fund during the period, detracted from results. Stericycle has been experiencing some pricing pressure in its core health care-services business at the same time that it is integrating its acquisition of paper-waste company Shred-It International Incorporated. While we recognize the near-term challenges and factor these risks into our reward/risk process, as long-term investors we believe Stericycle’s competitive advantage is still in place and that its strong free cash flows and flexible balance sheet may enable the company to manage through these near-term challenges.
Stock selection in energy equipment and services benefited the Fund’s performance.
Onshore contract-drilling-services provider Patterson-UTI Energy, Incorporated, was the fund’s largest contributor. We believe Patterson’s strong balance sheet has allowed the company to continue to invest through the economic downturn in high-end capital equipment that could enable Patterson to take market share as U.S. shale activity rebounds. This is a good example of how a strong, flexible balance sheet can enable a company to be offensive when others are forced to be defensive through cyclical downturns.
| | |
| Sector distribution as of September 30, 20167 |
|
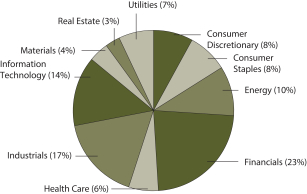 |
Our outlooks for the Fund and our process remain positive.
We will continue to invest in companies that we believe control their own destiny via distinct long-term competitive advantages, flexible balance sheets, and strong, sustainable free-cash-flow generation. We believe that using these desirable characteristics along with thoughtful portfolio construction when selecting stocks could enable us to progress toward our goal of consistent alpha generation with a low-risk profile.
As we look toward the end of 2016, we see numerous market forces at play that could bring further volatility. The upcoming U.S. general election will continue to make front-page news, and the market anxiety that usually
accompanies a significant leadership change could cause additional volatility. Perhaps the biggest question marks facing investors over the next 6–12 months are how and when the Fed will choose to raise rates. Central banks around the world are struggling with similar issues, and the recent attempt by the Bank of Japan to put a floor under long-term interest rates while remaining accommodating will be worth watching to see if the effort is successful. Predicting these moves is often difficult and better left for economists, which we are not.
We believe our fundamental analysis, risk management, and active investment process are well suited for taking advantage of new opportunities as the equity market evolves. While volatility may increase, the strong balance sheets and stable cash flows of the companies in our portfolio could support consistent long-term performance. We maintain a favorable outlook for the portfolio as we enter the calendar fourth quarter of 2016.
Please see footnotes on page 5.
| | | | |
| 8 | | Wells Fargo Special Mid Cap Value Fund | | Fund expenses (unaudited) |
As a shareholder of the Fund, you incur two types of costs: (1) transaction costs, including sales charges (loads) on purchase payments and contingent deferred sales charges (if any) on redemptions and (2) ongoing costs, including management fees, distribution (12b-1) and/or shareholder servicing fees, and other Fund expenses. This example is intended to help you understand your ongoing costs (in dollars) of investing in the Fund and to compare these costs with the ongoing costs of investing in other mutual funds.
The example is based on an investment of $1,000 invested at the beginning of the six-month period and held for the entire period from April 1, 2016 to September 30, 2016.
Actual expenses
The “Actual” line of the table below provides information about actual account values and actual expenses. You may use the information in this line, together with the amount you invested, to estimate the expenses that you paid over the period. Simply divide your account value by $1,000 (for example, an $8,600 account value divided by $1,000 = 8.6), then multiply the result by the number in the “Actual” line under the heading entitled “Expenses paid during period” for your applicable class of shares to estimate the expenses you paid on your account during this period.
Hypothetical example for comparison purposes
The “Hypothetical” line of the table below provides information about hypothetical account values and hypothetical expenses based on the Fund’s actual expense ratio and an assumed rate of return of 5% per year before expenses, which is not the Fund’s actual return. The hypothetical account values and expenses may not be used to estimate the actual ending account balance or expenses you paid for the period. You may use this information to compare the ongoing costs of investing in the Fund and other funds. To do so, compare this 5% hypothetical example with the 5% hypothetical examples that appear in the shareholder reports of the other funds.
Please note that the expenses shown in the table are meant to highlight your ongoing costs only and do not reflect any transactional costs, such as sales charges (loads) and contingent deferred sales charges. Therefore, the “Hypothetical” line of the table is useful in comparing ongoing costs only and will not help you determine the relative total costs of owning different funds. In addition, if these transactional costs were included, your costs would have been higher.
| | | | | | | | | | | | | | | | |
| | | Beginning
account value
4-1-2016 | | | Ending
account value
9-30-2016 | | | Expenses
paid during
the period¹ | | | Annualized net
expense ratio | |
Class A | | | | | | | | | | | | | | | | |
Actual | | $ | 1,000.00 | | | $ | 1,093.07 | | | $ | 6.20 | | | | 1.19 | % |
Hypothetical (5% return before expenses) | | $ | 1,000.00 | | | $ | 1,019.07 | | | $ | 5.98 | | | | 1.19 | % |
Class C | | | | | | | | | | | | | | | | |
Actual | | $ | 1,000.00 | | | $ | 1,088.71 | | | $ | 10.11 | | | | 1.94 | % |
Hypothetical (5% return before expenses) | | $ | 1,000.00 | | | $ | 1,015.32 | | | $ | 9.76 | | | | 1.94 | % |
Class R | | | | | | | | | | | | | | | | |
Actual | | $ | 1,000.00 | | | $ | 1,091.79 | | | $ | 7.53 | | | | 1.44 | % |
Hypothetical (5% return before expenses) | | $ | 1,000.00 | | | $ | 1,017.80 | | | $ | 7.26 | | | | 1.44 | % |
Class R6 | | | | | | | | | | | | | | | | |
Actual | | $ | 1,000.00 | | | $ | 1,095.62 | | | $ | 3.97 | | | | 0.76 | % |
Hypothetical (5% return before expenses) | | $ | 1,000.00 | | | $ | 1,021.21 | | | $ | 3.83 | | | | 0.76 | % |
Administrator Class | | | | | | | | | | | | | | | | |
Actual | | $ | 1,000.00 | | | $ | 1,093.54 | | | $ | 5.73 | | | | 1.09 | % |
Hypothetical (5% return before expenses) | | $ | 1,000.00 | | | $ | 1,019.53 | | | $ | 5.53 | | | | 1.09 | % |
Institutional Class | | | | | | | | | | | | | | | | |
Actual | | $ | 1,000.00 | | | $ | 1,095.01 | | | $ | 4.50 | | | | 0.86 | % |
Hypothetical (5% return before expenses) | | $ | 1,000.00 | | | $ | 1,020.71 | | | $ | 4.34 | | | | 0.86 | % |
| 1 | Expenses paid is equal to the annualized net expense ratio of each class multiplied by the average account value over the period, multiplied by the number of days in the most recent fiscal half-year divided by the number of days in the fiscal year (to reflect the one-half-year period). |
| | | | | | |
| Portfolio of investments—September 30, 2016 | | Wells Fargo Special Mid Cap Value Fund | | | 9 | |
| | | | | | | | | | | | | | | | |
| Security name | | | | | | | | Shares | | | Value | |
| | | | |
Common Stocks: 96.39% | | | | | | | | | | | | | | | | |
| | | | |
Consumer Discretionary: 8.01% | | | | | | | | | | | | | | | | |
| | | | |
| Auto Components: 0.48% | | | | | | | | | | | | | | | | |
Lear Corporation | | | | | | | | | | | 200,600 | | | $ | 24,316,732 | |
| | | | | | | | | | | | | | | | |
| | | | |
| Hotels, Restaurants & Leisure: 1.25% | | | | | | | | | | | | | | | | |
The Wendy’s Company | | | | | | | | | | | 5,795,100 | | | | 62,587,080 | |
| | | | | | | | | | | | | | | | |
| | | | |
| Household Durables: 0.99% | | | | | | | | | | | | | | | | |
Harman International Industries Incorporated | | | | | | | | | | | 591,500 | | | | 49,952,175 | |
| | | | | | | | | | | | | | | | |
| | | | |
| Media: 0.82% | | | | | | | | | | | | | | | | |
Tribune Media Company Class A | | | | | | | | | | | 1,123,937 | | | | 41,046,179 | |
| | | | | | | | | | | | | | | | |
| | | | |
| Multiline Retail: 2.24% | | | | | | | | | | | | | | | | |
Kohl’s Corporation | | | | | | | | | | | 2,569,600 | | | | 112,420,000 | |
| | | | | | | | | | | | | | | | |
| | | | |
| Specialty Retail: 1.25% | | | | | | | | | | | | | | | | |
Foot Locker Incorporated | | | | | | | | | | | 826,900 | | | | 55,997,668 | |
Signet Jewelers Limited | | | | | | | | | | | 88,300 | | | | 6,590,203 | |
| | | | |
| | | | | | | | | | | | | | | 62,587,871 | |
| | | | | | | | | | | | | | | | |
| | | | |
| Textiles, Apparel & Luxury Goods: 0.98% | | | | | | | | | | | | | | | | |
HanesBrands Incorporated | | | | | | | | | | | 1,940,300 | | | | 48,992,575 | |
| | | | | | | | | | | | | | | | |
| | | | |
Consumer Staples: 7.79% | | | | | | | | | | | | | | | | |
| | | | |
| Beverages: 2.58% | | | | | | | | | | | | | | | | |
Molson Coors Brewing Company Class B | | | | | | | | | | | 1,176,310 | | | | 129,158,838 | |
| | | | | | | | | | | | | | | | |
| | | | |
| Food Products: 4.62% | | | | | | | | | | | | | | | | |
Hain Celestial Group Incorporated † | | | | | | | | | | | 993,800 | | | | 35,359,404 | |
Pinnacle Foods Incorporated | | | | | | | | | | | 1,048,500 | | | | 52,603,245 | |
TreeHouse Foods Incorporated † | | | | | | | | | | | 1,650,709 | | | | 143,925,318 | |
| | | | |
| | | | | | | | | | | | | | | 231,887,967 | |
| | | | | | | | | | | | | | | | |
| | | | |
| Household Products: 0.59% | | | | | | | | | | | | | | | | |
Church & Dwight Company Incorporated | | | | | | | | | | | 612,400 | | | | 29,346,208 | |
| | | | | | | | | | | | | | | | |
| | | | |
Energy: 9.47% | | | | | | | | | | | | | | | | |
| | | | |
| Energy Equipment & Services: 4.87% | | | | | | | | | | | | | | | | |
Baker Hughes Incorporated | | | | | | | | | | | 1,782,100 | | | | 89,942,587 | |
National Oilwell Varco Incorporated | | | | | | | | | | | 1,982,600 | | | | 72,840,724 | |
Patterson-UTI Energy Incorporated | | | | | | | | | | | 3,637,900 | | | | 81,379,823 | |
| | | | |
| | | | | | | | | | | | | | | 244,163,134 | |
| | | | | | | | | | | | | | | | |
| | | | |
| Oil, Gas & Consumable Fuels: 4.60% | | | | | | | | | | | | | | | | |
Anadarko Petroleum Corporation | | | | | | | | | | | 1,065,100 | | | | 67,484,736 | |
Cimarex Energy Company | | | | | | | | | | | 569,410 | | | | 76,511,622 | |
Hess Corporation | | | | | | | | | | | 1,618,500 | | | | 86,783,970 | |
| | | | |
| | | | | | | | | | | | | | | 230,780,328 | |
| | | | | | | | | | | | | | | | |
The accompanying notes are an integral part of these financial statements.
| | | | |
| 10 | | Wells Fargo Special Mid Cap Value Fund | | Portfolio of investments—September 30, 2016 |
| | | | | | | | | | | | | | | | |
| Security name | | | | | | | | Shares | | | Value | |
| | | | |
Financials: 21.71% | | | | | | | | | | | | | | | | |
| | | | |
| Banks: 3.78% | | | | | | | | | | | | | | | | |
PacWest Bancorp | | | | | | | | | | | 1,852,907 | | | $ | 79,508,239 | |
Regions Financial Corporation | | | | | | | | | | | 6,963,600 | | | | 68,730,732 | |
Zions Bancorporation | | | | | | | | | | | 1,330,800 | | | | 41,281,416 | |
| | | | |
| | | | | | | | | | | | | | | 189,520,387 | |
| | | | | | | | | | | | | | | | |
| | | | |
| Capital Markets: 1.65% | | | | | | | | | | | | | | | | |
Northern Trust Corporation | | | | | | | | | | | 1,217,100 | | | | 82,750,629 | |
| | | | | | | | | | | | | | | | |
| | | | |
| Consumer Finance: 2.07% | | | | | | | | | | | | | | | | |
Ally Financial Incorporated | | | | | | | | | | | 5,335,361 | | | | 103,879,479 | |
| | | | | | | | | | | | | | | | |
| | | | |
| Insurance: 13.51% | | | | | | | | | | | | | | | | |
Arch Capital Group Limited † | | | | | | | | | | | 674,860 | | | | 53,489,404 | |
Brown & Brown Incorporated | | | | | | | | | | | 2,921,900 | | | | 110,184,849 | |
FNF Group | | | | | | | | | | | 2,903,714 | | | | 107,176,084 | |
Loews Corporation | | | | | | | | | | | 2,958,500 | | | | 121,742,275 | |
ProAssurance Corporation | | | | | | | | | | | 976,598 | | | | 51,251,863 | |
The Allstate Corporation | | | | | | | | | | | 1,415,100 | | | | 97,896,618 | |
Validus Holdings Limited | | | | | | | | | | | 860,769 | | | | 42,883,512 | |
Willis Towers Watson plc | | | | | | | | | | | 701,000 | | | | 93,071,770 | |
| | | | |
| | | | | | | | | | | | | | | 677,696,375 | |
| | | | | | | | | | | | | | | | |
| | | | |
| Mortgage REITs: 0.70% | | | | | | | | | | | | | | | | |
Annaly Capital Management Incorporated | | | | | | | | | | | 3,337,100 | | | | 35,039,550 | |
| | | | | | | | | | | | | | | | |
| | | | |
Health Care: 5.79% | | | | | | | | | | | | | | | | |
| | | | |
| Health Care Equipment & Supplies: 1.38% | | | | | | | | | | | | | | | | |
Steris Corporation | | | | | | | | | | | 949,500 | | | | 69,408,450 | |
| | | | | | | | | | | | | | | | |
| | | | |
| Health Care Providers & Services: 4.41% | | | | | | | | | | | | | | | | |
Humana Incorporated | | | | | | | | | | | 534,200 | | | | 94,494,638 | |
Patterson Companies Incorporated | | | | | | | | | | | 1,948,600 | | | | 89,518,684 | |
WellCare Health Plans Incorporated † | | | | | | | | | | | 317,100 | | | | 37,129,239 | |
| | | | |
| | | | | | | | | | | | | | | 221,142,561 | |
| | | | | | | | | | | | | | | | |
| | | | |
Industrials: 16.15% | | | | | | | | | | | | | | | | |
| | | | |
| Aerospace & Defense: 4.93% | | | | | | | | | | | | | | | | |
B/E Aerospace Incorporated | | | | | | | | | | | 1,738,400 | | | | 89,805,744 | |
General Dynamics Corporation | | | | | | | | | | | 556,100 | | | | 86,284,476 | |
Raytheon Company | | | | | | | | | | | 521,700 | | | | 71,019,021 | |
| | | | |
| | | | | | | | | | | | | | | 247,109,241 | |
| | | | | | | | | | | | | | | | |
| | | | |
| Commercial Services & Supplies: 4.65% | | | | | | | | | | | | | | | | |
Pitney Bowes Incorporated | | | | | | | | | | | 3,912,400 | | | | 71,049,184 | |
Republic Services Incorporated | | | | | | | | | | | 2,011,675 | | | | 101,489,004 | |
Stericycle Incorporated † | | | | | | | | | | | 759,700 | | | | 60,882,358 | |
| | | | |
| | | | | | | | | | | | | | | 233,420,546 | |
| | | | | | | | | | | | | | | | |
The accompanying notes are an integral part of these financial statements.
| | | | | | |
| Portfolio of investments—September 30, 2016 | | Wells Fargo Special Mid Cap Value Fund | | | 11 | |
| | | | | | | | | | | | | | | | |
| Security name | | | | | | | | Shares | | | Value | |
| | | | |
| Construction & Engineering: 2.55% | | | | | | | | | | | | | | | | |
EMCOR Group Incorporated | | | | | | | | | | | 1,277,109 | | | $ | 76,141,239 | |
Jacobs Engineering Group Incorporated † | | | | | | | | | | | 1,002,100 | | | | 51,828,612 | |
| | | | |
| | | | | | | | | | | | | | | 127,969,851 | |
| | | | | | | | | | | | | | | | |
| | | | |
| Marine: 1.48% | | | | | | | | | | | | | | | | |
Kirby Corporation † | | | | | | | | | | | 1,196,500 | | | | 74,374,440 | |
| | | | | | | | | | | | | | | | |
| | | | |
| Road & Rail: 1.15% | | | | | | | | | | | | | | | | |
Ryder System Incorporated | | | | | | | | | | | 874,500 | | | | 57,673,275 | |
| | | | | | | | | | | | | | | | |
| | | | |
| Transportation Infrastructure: 1.39% | | | | | | | | | | | | | | | | |
Macquarie Infrastructure Company LLC | | | | | | | | | | | 835,406 | | | | 69,539,195 | |
| | | | | | | | | | | | | | | | |
| | | | |
Information Technology: 13.94% | | | | | | | | | | | | | | | | |
| | | | |
| Communications Equipment: 4.60% | | | | | | | | | | | | | | | | |
ARRIS International plc † | | | | | | | | | | | 3,389,200 | | | | 96,016,036 | |
Harris Corporation | | | | | | | | | | | 1,472,100 | | | | 134,859,081 | |
| | | | |
| | | | | | | | | | | | | | | 230,875,117 | |
| | | | | | | | | | | | | | | | |
| | | | |
| IT Services: 7.32% | | | | | | | | | | | | | | | | |
Amdocs Limited | | | | | | | | | | | 1,570,600 | | | | 90,859,210 | |
DST Systems Incorporated | | | | | | | | | | | 550,220 | | | | 64,881,942 | |
Fidelity National Information Services Incorporated | | | | | | | | | | | 1,887,100 | | | | 145,363,313 | |
Leidos Holdings Incorporated | | | | | | | | | | | 1,526,500 | | | | 66,066,920 | |
| | | | |
| | | | | | | | | | | | | | | 367,171,385 | |
| | | | | | | | | | | | | | | | |
| | | | |
| Semiconductors & Semiconductor Equipment: 0.78% | | | | | | | | | | | | | | | | |
Lam Research Corporation | | | | | | | | | | | 413,400 | | | | 39,153,114 | |
| | | | | | | | | | | | | | | | |
| | | | |
| Technology Hardware, Storage & Peripherals: 1.24% | | | | | | | | | | | | | | | | |
Western Digital Corporation | | | | | | | | | | | 1,060,700 | | | | 62,019,129 | |
| | | | | | | | | | | | | | | | |
| | | | |
Materials: 4.07% | | | | | | | | | | | | | | | | |
| | | | |
| Construction Materials: 2.10% | | | | | | | | | | | | | | | | |
Eagle Materials Incorporated | | | | | | | | | | | 1,360,800 | | | | 105,189,840 | |
| | | | | | | | | | | | | | | | |
| | | | |
| Containers & Packaging: 1.97% | | | | | | | | | | | | | | | | |
Packaging Corporation of America | | | | | | | | | | | 1,216,000 | | | | 98,812,160 | |
| | | | | | | | | | | | | | | | |
| | | | |
Real Estate: 2.95% | | | | | | | | | | | | | | | | |
| | | | |
| Equity REITs: 1.51% | | | | | | | | | | | | | | | | |
American Campus Communities Incorporated | | | | | | | | | | | 1,489,985 | | | | 75,795,537 | |
| | | | | | | | | | | | | | | | |
| | | | |
| Real Estate Management & Development: 1.44% | | | | | | | | | | | | | | | | |
CBRE Group Incorporated Class A † | | | | | | | | | | | 2,577,200 | | | | 72,110,056 | |
| | | | | | | | | | | | | | | | |
| | | | |
Utilities: 6.51% | | | | | | | | | | | | | | | | |
| | | | |
| Electric Utilities: 2.19% | | | | | | | | | | | | | | | | |
American Electric Power Company Incorporated | | | | | | | | | | | 1,709,260 | | | | 109,751,585 | |
| | | | | | | | | | | | | | | | |
The accompanying notes are an integral part of these financial statements.
| | | | |
| 12 | | Wells Fargo Special Mid Cap Value Fund | | Portfolio of investments—September 30, 2016 |
| | | | | | | | | | | | | | | | |
| Security name | | | | | | | | Shares | | | Value | |
| | | | |
| Multi-Utilities: 2.23% | | | | | | | | | | | | | | | | |
Ameren Corporation | | | | | | | | | | | 2,277,550 | | | $ | 112,009,909 | |
| | | | | | | | | | | | | | | | |
| | | | |
| Water Utilities: 2.09% | | | | | | | | | | | | | | | | |
American Water Works Company Incorporated | | | | | | | | | | | 1,400,200 | | | | 104,790,966 | |
| | | | | | | | | | | | | | | | |
| | | | |
Total Common Stocks (Cost $4,295,321,792) | | | | | | | | | | | | | | | 4,834,441,864 | |
| | | | | | | | | | | | | | | | |
| | | | |
| | | Yield | | | | | | | | | | |
| Short-Term Investments: 3.19% | | | | | | | | | | | | | | | | |
| | | | |
| Investment Companies: 3.19% | | | | | | | | | | | | | | | | |
Wells Fargo Government Money Market Fund Select Class (l)(u) | | | 0.34 | % | | | | | | | 159,931,136 | | | | 159,931,136 | |
| | | | | | | | | | | | | | | | |
| | | | |
Total Short-Term Investments (Cost $159,931,136) | | | | | | | | | | | | | | | 159,931,136 | |
| | | | | | | | | | | | | | | | |
| | | | | | | | |
| Total investments in securities (Cost $4,455,252,928) * | | | 99.58 | % | | | 4,994,373,000 | |
Other assets and liabilities, net | | | 0.42 | | | | 21,107,606 | |
| | | | | | | | |
| Total net assets | | | 100.00 | % | | $ | 5,015,480,606 | |
| | | | | | | | |
| † | Non-income-earning security |
| (l) | The issuer of the security is an affiliated person of the Fund as defined in the Investment Company Act of 1940. |
| (u) | The rate represents the 7-day annualized yield at period end. |
| * | Cost for federal income tax purposes is $4,461,675,192 and unrealized gains (losses) consists of: |
| | | | |
Gross unrealized gains | | $ | 576,402,691 | |
Gross unrealized losses | | | (43,704,883 | ) |
| | | | |
Net unrealized gains | | $ | 532,697,808 | |
The accompanying notes are an integral part of these financial statements.
| | | | | | |
| Statement of assets and liabilities—September 30, 2016 | | Wells Fargo Special Mid Cap Value Fund | | | 13 | |
| | | | |
| | | | |
| |
Assets | | | | |
Investments | | | | |
In unaffiliated securities, at value (cost $4,295,321,792) | | $ | 4,834,441,864 | |
In affiliated securities, at value (cost $159,931,136) | | | 159,931,136 | |
| | | | |
Total investments, at value (cost $4,455,252,928) | | | 4,994,373,000 | |
Receivable for investments sold | | | 31,684,572 | |
Receivable for Fund shares sold | | | 33,325,111 | |
Receivable for dividends | | | 5,076,875 | |
Receivable for securities lending income | | | 2,650 | |
Prepaid expenses and other assets | | | 140,071 | |
| | | | |
Total assets | | | 5,064,602,279 | |
| | | | |
| |
Liabilities | | | | |
Payable for investments purchased | | | 36,023,087 | |
Payable for Fund shares redeemed | | | 8,827,532 | |
Management fee payable | | | 2,878,606 | |
Distribution fees payable | | | 74,390 | |
Administration fees payable | | | 615,321 | |
Accrued expenses and other liabilities | | | 702,737 | |
| | | | |
Total liabilities | | | 49,121,673 | |
| | | | |
Total net assets | | $ | 5,015,480,606 | |
| | | | |
| |
NET ASSETS CONSIST OF | | | | |
Paid-in capital | | $ | 4,448,646,376 | |
Undistributed net investment income | | | 29,219,042 | |
Accumulated net realized losses on investments | | | (1,504,884 | ) |
Net unrealized gains on investments | | | 539,120,072 | |
| | | | |
Total net assets | | $ | 5,015,480,606 | |
| | | | |
| |
COMPUTATION OF NET ASSET VALUE AND OFFERING PRICE PER SHARE | | | | |
Net assets – Class A | | $ | 1,363,213,060 | |
Shares outstanding – Class A1 | | | 41,159,628 | |
Net asset value per share – Class A | | | $33.12 | |
Maximum offering price per share – Class A2 | | | $35.14 | |
Net assets – Class C | | $ | 116,022,214 | |
Shares outstanding – Class C1 | | | 3,635,679 | |
Net asset value per share – Class C | | | $31.91 | |
Net assets – Class R | | $ | 1,777,673 | |
Shares outstanding – Class R1 | | | 52,628 | |
Net asset value per share – Class R | | | $33.78 | |
Net assets – Class R6 | | $ | 374,556,636 | |
Shares outstanding – Class R61 | | | 11,008,045 | |
Net asset value per share – Class R6 | | | $34.03 | |
Net assets – Administrator Class | | $ | 834,134,003 | |
Shares outstanding – Administrator Class1 | | | 24,775,198 | |
Net asset value per share – Administrator Class | | | $33.67 | |
Net assets – Institutional Class | | $ | 2,325,777,020 | |
Shares outstanding – Institutional Class1 | | | 68,410,970 | |
Net asset value per share – Institutional Class | | | $34.00 | |
| 1 | The Fund has an unlimited number of authorized shares. |
| 2 | Maximum offering price is computed as 100/94.25 of net asset value. On investments of $50,000 or more, the offering price is reduced. |
The accompanying notes are an integral part of these financial statements.
| | | | |
| 14 | | Wells Fargo Special Mid Cap Value Fund | | Statement of operations—year ended September 30, 2016 |
| | | | |
| | | | |
| |
Investment income | | | | |
Dividends (net of foreign withholding taxes of $13,847) | | $ | 63,936,677 | |
Income from affiliated securities | | | 640,046 | |
Securities lending income, net | | | 63,041 | |
| | | | |
Total investment income | | | 64,639,764 | |
| | | | |
| |
Expenses | | | | |
Management fee | | | 23,139,001 | |
Administration fees | | | | |
Class A | | | 2,377,678 | |
Class C | | | 183,750 | |
Class R | | | 1,096 | |
Class R6 | | | 67,098 | |
Administrator Class | | | 977,661 | |
Institutional Class | | | 1,390,356 | |
Investor Class | | | 116,458 | 1 |
Shareholder servicing fees | | | | |
Class A | | | 2,830,569 | |
Class C | | | 218,750 | |
Class R | | | 1,305 | |
Administrator Class | | | 1,803,577 | |
Investor Class | | | 90,680 | 1 |
Distribution fees | | | | |
Class C | | | 656,250 | |
Class R | | | 1,305 | |
Custody and accounting fees | | | 153,123 | |
Professional fees | | | 45,226 | |
Registration fees | | | 309,868 | |
Shareholder report expenses | | | 455,384 | |
Trustees’ fees and expenses | | | 19,394 | |
Other fees and expenses | | | 34,392 | |
| | | | |
Total expenses | | | 34,872,921 | |
Less: Fee waivers and/or expense reimbursements | | | (20,762 | ) |
| | | | |
Net expenses | | | 34,852,159 | |
| | | | |
Net investment income | | | 29,787,605 | |
| | | | |
| |
REALIZED AND UNREALIZED GAINS (LOSSES) ON INVESTMENTS | | | | |
Net realized gains on investments | | | 1,165,809 | |
Net change in unrealized gains (losses) on investments | | | 524,769,917 | |
| | | | |
Net realized and unrealized gains (losses) on investments | | | 525,935,726 | |
| | | | |
Net increase in net assets resulting from operations | | $ | 555,723,331 | |
| | | | |
| 1 | For the period from October 1, 2015 to October 23, 2015. Effective at the close of business on October 23, 2015, Investor Class shares were converted to Class A shares and are no longer offered by the Fund. |
The accompanying notes are an integral part of these financial statements.
| | | | | | |
| Statement of changes in net assets | | Wells Fargo Special Mid Cap Value Fund | | | 15 | |
| | | | | | | | | | | | | | | | |
| | | Year ended
September 30, 2016 | | | Year ended
September 30, 2015 | |
| | | | |
Operations | | | | | | | | | | | | | | | | |
Net investment income | | | | | | $ | 29,787,605 | | | | | | | $ | 14,760,683 | |
Net realized gains on investments | | | | | | | 1,165,809 | | | | | | | | 99,137,662 | |
Net change in unrealized gains (losses) on investments | | | | | | | 524,769,917 | | | | | | | | (138,463,872 | ) |
| | | | |
Net increase (decrease) in net assets resulting from operations | | | | | | | 555,723,331 | | | | | | | | (24,565,527 | ) |
| | | | |
| | | | |
Distributions to shareholders from | | | | | | | | | | | | | | | | |
Net investment income | | | | | | | | | | | | | | | | |
Class A | | | | | | | (3,106,870 | ) | | | | | | | (2,404,466 | ) |
Class C | | | | | | | (20,450 | ) | | | | | | | 0 | |
Class R | | | | | | | (195 | ) | | | | | | | 0 | 1 |
Class R6 | | | | | | | (1,171,323 | ) | | | | | | | (45,443 | ) |
Administrator Class | | | | | | | (2,729,427 | ) | | | | | | | (922,301 | ) |
Institutional Class | | | | | | | (3,574,594 | ) | | | | | | | (1,465,190 | ) |
Investor Class | | | | | | | 0 | 2 | | | | | | | (963,123 | ) |
Net realized gains | | | | | | | | | | | | | | | | |
Class A | | | | | | | (40,065,294 | ) | | | | | | | (36,145,688 | ) |
Class C | | | | | | | (2,776,111 | ) | | | | | | | (3,059,339 | ) |
Class R | | | | | | | (920 | ) | | | | | | | 0 | 1 |
Class R6 | | | | | | | (5,563,069 | ) | | | | | | | (527,423 | ) |
Administrator Class | | | | | | | (17,677,686 | ) | | | | | | | (17,119,649 | ) |
Institutional Class | | | | | | | (17,921,301 | ) | | | | | | | (17,898,031 | ) |
Investor Class | | | | | | | 0 | 2 | | | | | | | (47,391,502 | ) |
| | | | |
Total distributions to shareholders | | | | | | | (94,607,240 | ) | | | | | | | (127,942,155 | ) |
| | | | |
| | | | |
Capital share transactions | | | Shares | | | | | | | | Shares | | | | | |
Proceeds from shares sold | | | | | | | | | | | | | | | | |
Class A | | | 32,591,298 | | | | 1,012,650,670 | | | | 15,633,402 | | | | 498,183,836 | |
Class C | | | 2,098,801 | | | | 62,533,533 | | | | 1,444,914 | | | | 45,340,872 | |
Class R | | | 54,121 | | | | 1,738,947 | | | | 814 | 1 | | | 25,000 | 1 |
Class R6 | | | 8,542,115 | | | | 271,942,094 | | | | 3,639,150 | | | | 120,551,746 | |
Administrator Class | | | 36,577,283 | | | | 1,062,087,191 | | | | 12,563,219 | | | | 406,786,505 | |
Institutional Class | | | 64,727,505 | | | | 2,061,463,035 | | | | 9,959,577 | | | | 330,102,387 | |
Investor Class | | | 231,357 | 2 | | | 7,299,395 | 2 | | | 3,146,655 | | | | 104,038,226 | |
| | | | |
| | | | | | | 4,479,714,865 | | | | | | | | 1,505,028,572 | |
| | | | |
Reinvestment of distributions | | | | | | | | | | | | | | | | |
Class A | | | 1,432,793 | | | | 41,899,896 | | | | 1,195,510 | | | | 37,042,885 | |
Class C | | | 91,890 | | | | 2,596,151 | | | | 93,002 | | | | 2,799,357 | |
Class R | | | 37 | | | | 1,115 | | | | 0 | 1 | | | 0 | 1 |
Class R6 | | | 223,787 | | | | 6,734,392 | | | | 18,058 | | | | 572,866 | |
Administrator Class | | | 684,328 | | | | 20,395,161 | | | | 572,229 | | | | 18,011,446 | |
Institutional Class | | | 647,950 | | | | 19,486,743 | | | | 542,244 | | | | 17,199,534 | |
Investor Class | | | 0 | 2 | | | 0 | 2 | | | 1,519,579 | | | | 47,828,295 | |
| | | | |
| | | | | | | 91,113,458 | | | | | | | | 123,454,383 | |
| | | | |
Payment for shares redeemed | | | | | | | | | | | | | | | | |
Class A | | | (9,893,268 | ) | | | (302,160,382 | ) | | | (3,172,402 | ) | | | (102,128,564 | ) |
Class C | | | (742,121 | ) | | | (22,059,406 | ) | | | (268,920 | ) | | | (8,411,582 | ) |
Class R | | | (2,344 | ) | | | (77,354 | ) | | | 0 | 1 | | | 0 | 1 |
Class R6 | | | (1,208,673 | ) | | | (38,504,373 | ) | | | (326,593 | ) | | | (10,742,055 | ) |
Administrator Class | | | (25,433,290 | ) | | | (773,879,830 | ) | | | (5,860,843 | ) | | | (190,655,125 | ) |
Institutional Class | | | (10,381,138 | ) | | | (332,586,897 | ) | | | (2,327,220 | ) | | | (76,918,868 | ) |
Investor Class | | | (17,217,665 | )2 | | | (549,439,619 | )2 | | | (4,421,468 | ) | | | (145,795,400 | ) |
| | | | |
| | | | | | | (2,018,707,861 | ) | | | | | | | (534,651,594 | ) |
| | | | |
Net increase in net assets resulting from capital share transactions | | | | | | | 2,552,120,462 | | | | | | | | 1,093,831,361 | |
| | | | |
Total increase in net assets | | | | | | | 3,013,236,553 | | | | | | | | 941,323,679 | |
| | | | |
| | | | |
Net assets | | | | | | | | | | | | | | | | |
Beginning of period | | | | | | | 2,002,244,053 | | | | | | | | 1,060,920,374 | |
| | | | |
End of period | | | | | | $ | 5,015,480,606 | | | | | | | $ | 2,002,244,053 | |
| | | | |
Undistributed net investment income | | | | | | $ | 29,219,042 | | | | | | | $ | 10,602,293 | |
| | | | |
| 1 | The class commenced operations on September 30, 2015. Information represents activity for the one day of operation. |
| 2 | For the period from October 1, 2015 to October 23, 2015. Effective at the close of business on October 23, 2015, Investor Class shares were converted to Class A shares and are no longer offered by the Fund. |
The accompanying notes are an integral part of these financial statements.
| | | | |
| 16 | | Wells Fargo Special Mid Cap Value Fund | | Financial highlights |
(For a share outstanding throughout each period)
| | | | | | | | | | | | | | | | | | | | |
| | | Year ended September 30 | |
| CLASS A | | 2016 | | | 2015 | | | 2014 | | | 2013 | | | 2012 | |
Net asset value, beginning of period | | | $29.91 | | | | $32.68 | | | | $30.36 | | | | $22.83 | | | | $17.84 | |
Net investment income | | | 0.19 | | | | 0.25 | | | | 0.12 | 1 | | | 0.15 | 1 | | | 0.08 | 1 |
Net realized and unrealized gains (losses) on investments | | | 4.23 | | | | 0.07 | | | | 4.47 | | | | 7.60 | | | | 4.94 | |
| | | | | | | | | | | | | | | | | | | | |
Total from investment operations | | | 4.42 | | | | 0.32 | | | | 4.59 | | | | 7.75 | | | | 5.02 | |
Distributions to shareholders from | | | | | | | | | | | | | | | | | | | | |
Net investment income | | | (0.08 | ) | | | (0.18 | ) | | | (0.09 | ) | | | (0.22 | ) | | | (0.03 | ) |
Net realized gains | | | (1.13 | ) | | | (2.91 | ) | | | (2.18 | ) | | | 0.00 | | | | 0.00 | |
| | | | | | | | | | | | | | | | | | | | |
Total distributions to shareholders | | | (1.21 | ) | | | (3.09 | ) | | | (2.27 | ) | | | (0.22 | ) | | | (0.03 | ) |
Net asset value, end of period | | | $33.12 | | | | $29.91 | | | | $32.68 | | | | $30.36 | | | | $22.83 | |
Total return2 | | | 15.34 | % | | | 0.69 | % | | | 15.70 | % | | | 34.23 | % | | | 28.18 | % |
Ratios to average net assets (annualized) | | | | | | | | | | | | | | | | | | | | |
Gross expenses | | | 1.19 | % | | | 1.25 | % | | | 1.28 | % | | | 1.29 | % | | | 1.30 | % |
Net expenses | | | 1.19 | % | | | 1.24 | % | | | 1.25 | % | | | 1.25 | % | | | 1.25 | % |
Net investment income | | | 0.82 | % | | | 0.85 | % | | | 0.38 | % | | | 0.54 | % | | | 0.38 | % |
Supplemental data | | | | | | | | | | | | | | | | | | | | |
Portfolio turnover rate | | | 30 | % | | | 58 | % | | | 58 | % | | | 87 | % | | | 87 | % |
Net assets, end of period (000s omitted) | | | $1,363,213 | | | | $509,386 | | | | $110,219 | | | | $38,119 | | | | $9,545 | |
| 1 | Calculated based upon average shares outstanding |
| 2 | Total return calculations do not include any sales charges. |
The accompanying notes are an integral part of these financial statements.
| | | | | | |
| Financial highlights | | Wells Fargo Special Mid Cap Value Fund | | | 17 | |
(For a share outstanding throughout each period)
| | | | | | | | | | | | | | | | | | | | |
| | | Year ended September 30 | |
| CLASS C | | 2016 | | | 2015 | | | 2014 | | | 2013 | | | 2012 | |
Net asset value, beginning of period | | | $29.00 | | | | $31.82 | | | | $29.73 | | | | $22.38 | | | | $17.60 | |
Net investment income (loss) | | | 0.03 | | | | 0.02 | 1 | | | (0.04 | ) | | | (0.07 | )1 | | | (0.03 | ) |
Net realized and unrealized gains (losses) on investments | | | 4.02 | | | | 0.07 | | | | 4.31 | | | | 7.49 | | | | 4.81 | |
| | | | | | | | | | | | | | | | | | | | |
Total from investment operations | | | 4.05 | | | | 0.09 | | | | 4.27 | | | | 7.42 | | | | 4.78 | |
Distributions to shareholders from | | | | | | | | | | | | | | | | | | | | |
Net investment income | | | (0.01 | ) | | | 0.00 | | | | 0.00 | | | | (0.07 | ) | | | 0.00 | |
Net realized gains | | | (1.13 | ) | | | (2.91 | ) | | | (2.18 | ) | | | 0.00 | | | | 0.00 | |
| | | | | | | | | | | | | | | | | | | | |
Total distributions to shareholders | | | (1.14 | ) | | | (2.91 | ) | | | (2.18 | ) | | | (0.07 | ) | | | 0.00 | |
Net asset value, end of period | | | $31.91 | | | | $29.00 | | | | $31.82 | | | | $29.73 | | | | $22.38 | |
Total return2 | | | 14.47 | % | | | (0.05 | )% | | | 14.86 | % | | | 33.23 | % | | | 27.16 | % |
Ratios to average net assets (annualized) | | | | | | | | | | | | | | | | | | | | |
Gross expenses | | | 1.94 | % | | | 2.00 | % | | | 2.03 | % | | | 2.04 | % | | | 2.06 | % |
Net expenses | | | 1.94 | % | | | 1.99 | % | | | 2.00 | % | | | 2.00 | % | | | 2.00 | % |
Net investment income (loss) | | | 0.03 | % | | | 0.08 | % | | | (0.38 | )% | | | (0.25 | )% | | | (0.35 | )% |
Supplemental data | | | | | | | | | | | | | | | | | | | | |
Portfolio turnover rate | | | 30 | % | | | 58 | % | | | 58 | % | | | 87 | % | | | 87 | % |
Net assets, end of period (000s omitted) | | | $116,022 | | | | $63,431 | | | | $29,217 | | | | $14,913 | | | | $2,770 | |
| 1 | Calculated based upon average shares outstanding |
| 2 | Total return calculations do not include any sales charges. |
The accompanying notes are an integral part of these financial statements.
| | | | |
| 18 | | Wells Fargo Special Mid Cap Value Fund | | Financial highlights |
(For a share outstanding throughout each period)
| | | | | | | | |
| | | Year ended September 30 | |
| CLASS R | | 2016 | | | 20151 | |
Net asset value, beginning of period | | | $30.70 | | | | $30.70 | |
Net investment income | | | 0.12 | 2 | | | 0.00 | |
Net realized and unrealized gains (losses) on investments | | | 4.32 | | | | 0.00 | |
| | | | | | | | |
Total from investment operations | | | 4.44 | | | | 0.00 | |
Distributions to shareholders from | | | | | | | | |
Net investment income | | | (0.23 | ) | | | 0.00 | |
Net realized gains | | | (1.13 | ) | | | 0.00 | |
| | | | | | | | |
Total distributions to shareholders | | | (1.36 | ) | | | 0.00 | |
Net asset value, end of period | | | $33.78 | | | | $30.70 | |
Total return3 | | | 15.05 | % | | | 0.00 | % |
Ratios to average net assets (annualized) | | | | | | | | |
Gross expenses | | | 1.44 | % | | | 0.00 | % |
Net expenses | | | 1.44 | % | | | 0.00 | % |
Net investment income | | | 0.37 | % | | | 0.00 | % |
Supplemental data | | | | | | | | |
Portfolio turnover rate | | | 30 | % | | | 58 | % |
Net assets, end of period (000s omitted) | | | $1,778 | | | | $25 | |
| 1 | The class commenced operations on September 30, 2015. Information represents activity for the one day of operation. |
| 2 | Calculated based upon average shares outstanding |
| 3 | Returns for periods of less than one year are not annualized. |
The accompanying notes are an integral part of these financial statements.
| | | | | | |
| Financial highlights | | Wells Fargo Special Mid Cap Value Fund | | | 19 | |
(For a share outstanding throughout each period)
| | | | | | | | | | | | | | | | |
| | | Year ended September 30 | |
| CLASS R6 | | 2016 | | | 2015 | | | 2014 | | | 20131 | |
Net asset value, beginning of period | | | $30.71 | | | | $33.39 | | | | $30.90 | | | | $28.69 | |
Net investment income | | | 0.38 | 2 | | | 0.41 | 2 | | | 0.41 | 2 | | | 0.06 | 2 |
Net realized and unrealized gains (losses) on investments | | | 4.30 | | | | 0.05 | | | | 4.43 | | | | 2.15 | |
| | | | | | | | | | | | | | | | |
Total from investment operations | | | 4.68 | | | | 0.46 | | | | 4.84 | | | | 2.21 | |
Distributions to shareholders from | | | | | | | | | | | | | | | | |
Net investment income | | | (0.23 | ) | | | (0.23 | ) | | | (0.17 | ) | | | 0.00 | |
Net realized gains | | | (1.13 | ) | | | (2.91 | ) | | | (2.18 | ) | | | 0.00 | |
| | | | | | | | | | | | | | | | |
Total distributions to shareholders | | | (1.36 | ) | | | (3.14 | ) | | | (2.35 | ) | | | 0.00 | |
Net asset value, end of period | | | $34.03 | | | | $30.71 | | | | $33.39 | | | | $30.90 | |
Total return3 | | | 15.84 | % | | | 1.14 | % | | | 16.29 | % | | | 7.70 | % |
Ratios to average net assets (annualized) | | | | | | | | | | | | | | | | |
Gross expenses | | | 0.76 | % | | | 0.79 | % | | | 0.80 | % | | | 0.81 | % |
Net expenses | | | 0.76 | % | | | 0.79 | % | | | 0.80 | % | | | 0.81 | % |
Net investment income | | | 1.21 | % | | | 1.26 | % | | | 1.22 | % | | | 0.73 | % |
Supplemental data | | | | | | | | | | | | | | | | |
Portfolio turnover rate | | | 30 | % | | | 58 | % | | | 58 | % | | | 87 | % |
Net assets, end of period (000s omitted) | | | $374,557 | | | | $105,973 | | | | $4,013 | | | | $27 | |
| 1 | For the period from June 28, 2013 (commencement of class operations) to September 30, 2013 |
| 2 | Calculated based upon average shares outstanding |
| 3 | Returns for periods of less than one year are not annualized. |
The accompanying notes are an integral part of these financial statements.
| | | | |
| 20 | | Wells Fargo Special Mid Cap Value Fund | | Financial highlights |
(For a share outstanding throughout each period)
| | | | | | | | | | | | | | | | | | | | |
| | | Year ended September 30 | |
| ADMINISTRATOR CLASS | | 2016 | | | 2015 | | | 2014 | | | 2013 | | | 2012 | |
Net asset value, beginning of period | | | $30.45 | | | | $33.14 | | | | $30.71 | | | | $23.09 | | | | $18.04 | |
Net investment income | | | 0.26 | | | | 0.31 | 1 | | | 0.15 | | | | 0.20 | 1 | | | 0.11 | 1 |
Net realized and unrealized gains (losses) on investments | | | 4.26 | | | | 0.05 | | | | 4.55 | | | | 7.67 | | | | 4.99 | |
| | | | | | | | | | | | | | | | | | | | |
Total from investment operations | | | 4.52 | | | | 0.36 | | | | 4.70 | | | | 7.87 | | | | 5.10 | |
Distributions to shareholders from | | | | | | | | | | | | | | | | | | | | |
Net investment income | | | (0.17 | ) | | | (0.14 | ) | | | (0.09 | ) | | | (0.25 | ) | | | (0.05 | ) |
Net realized gains | | | (1.13 | ) | | | (2.91 | ) | | | (2.18 | ) | | | 0.00 | | | | 0.00 | |
| | | | | | | | | | | | | | | | | | | | |
Total distributions to shareholders | | | (1.30 | ) | | | (3.05 | ) | | | (2.27 | ) | | | (0.25 | ) | | | (0.05 | ) |
Net asset value, end of period | | | $33.67 | | | | $30.45 | | | | $33.14 | | | | $30.71 | | | | $23.09 | |
Total return | | | 15.42 | % | | | 0.84 | % | | | 15.89 | % | | | 34.41 | % | | | 28.30 | % |
Ratios to average net assets (annualized) | | | | | | | | | | | | | | | | | | | | |
Gross expenses | | | 1.10 | % | | | 1.12 | % | | | 1.12 | % | | | 1.13 | % | | | 1.14 | % |
Net expenses | | | 1.10 | % | | | 1.11 | % | | | 1.12 | % | | | 1.13 | % | | | 1.13 | % |
Net investment income | | | 0.88 | % | | | 0.95 | % | | | 0.48 | % | | | 0.71 | % | | | 0.50 | % |
Supplemental data | | | | | | | | | | | | | | | | | | | | |
Portfolio turnover rate | | | 30 | % | | | 58 | % | | | 58 | % | | | 87 | % | | | 87 | % |
Net assets, end of period (000s omitted) | | | $834,134 | | | | $394,188 | | | | $187,968 | | | | $117,087 | | | | $61,596 | |
| 1 | Calculated based upon average shares outstanding |
The accompanying notes are an integral part of these financial statements.
| | | | | | |
| Financial highlights | | Wells Fargo Special Mid Cap Value Fund | | | 21 | |
(For a share outstanding throughout each period)
| | | | | | | | | | | | | | | | | | | | |
| | | Year ended September 30 | |
| INSTITUTIONAL CLASS | | 2016 | | | 2015 | | | 2014 | | | 2013 | | | 2012 | |
Net asset value, beginning of period | | | $30.70 | | | | $33.38 | | | | $30.91 | | | | $23.15 | | | | $18.10 | |
Net investment income | | | 0.35 | 1 | | | 0.41 | 1 | | | 0.24 | | | | 0.20 | 1 | | | 0.16 | |
Net realized and unrealized gains (losses) on investments | | | 4.29 | | | | 0.04 | | | | 4.57 | | | | 7.81 | | | | 5.01 | |
| | | | | | | | | | | | | | | | | | | | |
Total from investment operations | | | 4.64 | | | | 0.45 | | | | 4.81 | | | | 8.01 | | | | 5.17 | |
Distributions to shareholders from | | | | | | | | | | | | | | | | | | | | |
Net investment income | | | (0.21 | ) | | | (0.22 | ) | | | (0.16 | ) | | | (0.25 | ) | | | (0.12 | ) |
Net realized gains | | | (1.13 | ) | | | (2.91 | ) | | | (2.18 | ) | | | 0.00 | | | | 0.00 | |
| | | | | | | | | | | | | | | | | | | | |
Total distributions to shareholders | | | (1.34 | ) | | | (3.13 | ) | | | (2.34 | ) | | | (0.25 | ) | | | (0.12 | ) |
Net asset value, end of period | | | $34.00 | | | | $30.70 | | | | $33.38 | | | | $30.91 | | | | $23.15 | |
Total return | | | 15.73 | % | | | 1.10 | % | | | 16.17 | % | | | 34.90 | % | | | 28.65 | % |
Ratios to average net assets (annualized) | | | | | | | | | | | | | | | | | | | | |
Gross expenses | | | 0.86 | % | | | 0.85 | % | | | 0.85 | % | | | 0.85 | % | | | 0.87 | % |
Net expenses | | | 0.86 | % | | | 0.85 | % | | | 0.85 | % | | | 0.85 | % | | | 0.87 | % |
Net investment income | | | 1.07 | % | | | 1.23 | % | | | 0.81 | % | | | 0.72 | % | | | 0.76 | % |
Supplemental data | | | | | | | | | | | | | | | | | | | | |
Portfolio turnover rate | | | 30 | % | | | 58 | % | | | 58 | % | | | 87 | % | | | 87 | % |
Net assets, end of period (000s omitted) | | | $2,325,777 | | | | $411,919 | | | | $174,989 | | | | $66,056 | | | | $125,623 | |
| 1 | Calculated based upon average shares outstanding |
The accompanying notes are an integral part of these financial statements.
| | | | |
| 22 | | Wells Fargo Special Mid Cap Value Fund | | Notes to financial statements |
1. ORGANIZATION
Wells Fargo Funds Trust (the “Trust”), a Delaware statutory trust organized on March 10, 1999, is an open-end management investment company registered under the Investment Company Act of 1940, as amended (the “1940 Act”). As an investment company, the Trust follows the accounting and reporting guidance in Financial Accounting Standards Board (“FASB”) Accounting Standards Codification Topic 946, Financial Services – Investment Companies. These financial statements report on the Wells Fargo Special Mid Cap Value Fund (the “Fund”) which is a diversified series of the Trust.
Effective at the close of business on October 23, 2015, Investor Class shares became Class A shares in a tax-free conversion. Shareholders of Investor Class received Class A shares at a value equal to the value of their Investor Class shares immediately prior to the conversion. Investor Class shares are no longer offered by the Fund.
2. SIGNIFICANT ACCOUNTING POLICIES
The following significant accounting policies, which are consistently followed in the preparation of the financial statements of the Fund, are in conformity with U.S. generally accepted accounting principles which require management to make estimates and assumptions that affect the reported amounts of assets and liabilities, disclosure of contingent assets and liabilities at the date of the financial statements, and the reported amounts of revenues and expenses during the reporting period. Actual results could differ from those estimates.
Securities valuation
All investments are valued each business day as of the close of regular trading on the New York Stock Exchange (generally 4 p.m. Eastern Time), although the Fund may deviate from this calculation time under unusual or unexpected circumstances.
Equity securities that are listed on a foreign or domestic exchange or market are valued at the official closing price or, if none, the last sales price. If no sale occurs on the principal exchange or market that day, the prior day’s price will be deemed “stale” and a fair value price will be determined in accordance with the Fund’s Valuation Procedures.
Investments in registered open-end investment companies are valued at net asset value. Interests in non-registered investment vehicles that are redeemable at net asset value are fair valued normally at net asset value.
Investments which are not valued using any of the methods discussed above are valued at their fair value, as determined in good faith by the Board of Trustees of the Fund. The Board of Trustees has established a Valuation Committee comprised of the Trustees and has delegated to it the authority to take any actions regarding the valuation of portfolio securities that the Valuation Committee deems necessary or appropriate, including determining the fair value of portfolio securities, unless the determination has been delegated to the Management Valuation Team of Wells Fargo Funds Management, LLC (“Funds Management”). The Board of Trustees retains the authority to make or ratify any valuation decisions or approve any changes to the Valuation Procedures as it deems appropriate. On a quarterly basis, the Board of Trustees receives reports on any valuation actions taken by the Valuation Committee or the Management Valuation Team which may include items for ratification.
Valuations of fair valued securities are compared to the next actual sales price when available, or other appropriate market values, to assess the continued appropriateness of the fair valuation methodologies used. These securities are fair valued on a day-to-day basis, taking into consideration changes to appropriate market information and any significant changes to the inputs considered in the valuation process until there is a readily available price provided on an exchange or by an independent pricing service. Valuations received from an independent pricing service or independent broker-dealer quotes are periodically validated by comparisons to most recent trades and valuations provided by other independent pricing services in addition to the review of prices by the manager and/or subadviser. Unobservable inputs used in determining fair valuations are identified based on the type of security, taking into consideration factors utilized by market participants in valuing the investment, knowledge about the issuer and the current market environment.
Security loans
The Fund may lend its securities from time to time in order to earn additional income in the form of fees or interest on securities received as collateral or the investment of any cash received as collateral. The Fund continues to receive interest or dividends on the securities loaned. The Fund receives collateral in the form of cash or securities with a value at least equal to the value of the securities on loan. The value of the loaned securities is determined at the close of each business day and any additional required collateral is delivered to the Fund on the next business day. In a securities lending transaction, the net asset value of the Fund will be affected by an increase or decrease in the value of the securities loaned and by an increase or decrease in the value of the instrument in which collateral is invested. The amount of securities lending activity undertaken by the Fund fluctuates from time to time. In the event of default or bankruptcy by the borrower, the Fund may be prevented from recovering the loaned securities or gaining access to the collateral or
| | | | | | |
| Notes to financial statements | | Wells Fargo Special Mid Cap Value Fund | | | 23 | |
may experience delays or costs in doing so. In addition, the investment of any cash collateral received may lose all or part of its value. The Fund has the right under the lending agreement to recover the securities from the borrower on demand.
The Fund lends its securities through an unaffiliated securities lending agent. Cash collateral received in connection with its securities lending transactions is invested in Securities Lending Cash Investments, LLC (the “Securities Lending Fund”). The Securities Lending Fund is exempt from registration under Section 3(c)(7) of the 1940 Act and is managed by Funds Management and is subadvised by Wells Capital Management Incorporated (“WellsCap”), an affiliate of Funds Management and an indirect wholly owned subsidiary of Wells Fargo & Company (“Wells Fargo”). Funds Management receives an advisory fee starting at 0.05% and declining to 0.01% as the average daily net assets of the Securities Lending Fund increase. All of the fees received by Funds Management are paid to WellsCap for its services as subadviser. The Securities Lending Fund seeks to provide a positive return compared to the daily Fed Funds Open rate by investing in high-quality, U.S. dollar-denominated short-term money market instruments. Securities Lending Fund investments are fair valued based upon the amortized cost valuation technique. Income earned from investment in the Securities Lending Fund is included in securities lending income on the Statement of Operations.
Security transactions and income recognition
Securities transactions are recorded on a trade date basis. Realized gains or losses are recorded on the basis of identified cost.
Dividend income is recognized on the ex-dividend date. Dividend income is recorded net of foreign taxes withheld where recovery of such taxes is not assured.
Distributions to shareholders
Distributions to shareholders from net investment income and net realized gains, if any, are recorded on the ex-dividend date. Such distributions are determined in conformity with federal income tax regulations, which may differ in amount or character from net investment income and realized gains recognized for purposes of U.S. generally accepted accounting principles.
Federal and other taxes
The Fund intends to continue to qualify as a regulated investment company by distributing substantially all of its investment company taxable income and any net realized capital gains (after reduction for capital loss carryforwards) sufficient to relieve it from all, or substantially all, federal income taxes. Accordingly, no provision for federal income taxes was required.
The Fund’s income and federal excise tax returns and all financial records supporting those returns for the prior three fiscal years are subject to examination by the federal and Delaware revenue authorities. Management has analyzed the Fund’s tax positions taken on federal, state, and foreign tax returns for all open tax years and does not believe that there are any uncertain tax positions that require recognition of a tax liability.
Reclassifications are made to the Fund’s capital accounts for permanent tax differences to reflect income and gains available for distribution (or available capital loss carryforwards) under federal income tax regulations. U.S. generally accepted accounting principles require that certain components of net assets be adjusted to reflect permanent differences between financial and tax reporting. These reclassifications have no effect on net assets or net asset values per share. At September 30, 2016, as a result of permanent book-to-tax differences, the following reclassification adjustments were made on the Statement of Assets and Liabilities:
| | | | |
| Paid-in capital | | Undistributed net investment income | | Accumulated net realized losses on investments |
| $5 | | $(567,997) | | $567,992 |
As of September 30, 2016, the Fund had capital loss carryforwards available to offset future net realized capital gains in the amount of $49,637 expiring in 2017.
Class allocations
The separate classes of shares offered by the Fund differ principally in applicable sales charges, distribution, shareholder servicing, and administration fees. Class specific expenses are charged directly to that share class. Investment income, common expenses, and realized and unrealized gains (losses) on investments are allocated daily to each class of shares based on the relative proportion of net assets of each class.
| | | | |
| 24 | | Wells Fargo Special Mid Cap Value Fund | | Notes to financial statements |
3. FAIR VALUATION MEASUREMENTS
Fair value measurements of investments are determined within a framework that has established a fair value hierarchy based upon the various data inputs utilized in determining the value of the Fund’s investments. The three-level hierarchy gives the highest priority to unadjusted quoted prices in active markets for identical assets or liabilities (Level 1) and the lowest priority to significant unobservable inputs (Level 3). The Fund’s investments are classified within the fair value hierarchy based on the lowest level of input that is significant to the fair value measurement. The inputs are summarized into three broad levels as follows:
| n | | Level 1 – quoted prices in active markets for identical securities |
| n | | Level 2 – other significant observable inputs (including quoted prices for similar securities, interest rates, prepayment speeds, credit risk, use of amortized cost, etc.) |
| n | | Level 3 – significant unobservable inputs (including the Fund’s own assumptions in determining the fair value of investments) |
The inputs or methodologies used for valuing investments in securities are not necessarily an indication of the risk associated with investing in those securities.
The following is a summary of the inputs used in valuing the Fund’s assets and liabilities as of September 30, 2016:
| | | | | | | | | | | | | | | | |
| | | Quoted prices
(Level 1) | | | Other significant
observable inputs
(Level 2) | | | Significant
unobservable inputs
(Level 3) | | | Total | |
Assets | | | | | | | | | | | | | | | | |
Investments in: | | | | | | | | | | | | | | | | |
| | | | |
Common stocks | | | | | | | | | | | | | | | | |
Consumer discretionary | | $ | 401,902,612 | | | $ | 0 | | | $ | 0 | | | $ | 401,902,612 | |
Consumer staples | | | 390,393,013 | | | | 0 | | | | 0 | | | | 390,393,013 | |
Energy | | | 474,943,462 | | | | 0 | | | | 0 | | | | 474,943,462 | |
Financials | | | 1,088,886,420 | | | | 0 | | | | 0 | | | | 1,088,886,420 | |
Health care | | | 290,551,011 | | | | 0 | | | | 0 | | | | 290,551,011 | |
Industrials | | | 810,086,548 | | | | 0 | | | | 0 | | | | 810,086,548 | |
Information technology | | | 699,218,745 | | | | 0 | | | | 0 | | | | 699,218,745 | |
Materials | | | 204,002,000 | | | | 0 | | | | 0 | | | | 204,002,000 | |
Real estate | | | 147,905,593 | | | | 0 | | | | 0 | | | | 147,905,593 | |
Utilities | | | 326,552,460 | | | | 0 | | | | 0 | | | | 326,552,460 | |
| | | | |
Short-term investments | | | | | | | | | | | | | | | | |
Investment companies | | | 159,931,136 | | | | 0 | | | | 0 | | | | 159,931,136 | |
Total assets | | $ | 4,994,373,000 | | | $ | 0 | | | $ | 0 | | | $ | 4,994,373,000 | |
The Fund recognizes transfers between levels within the fair value hierarchy at the end of the reporting period. At September 30, 2016, the Fund did not have any transfers into/out of Level 1, Level 2, or Level 3.
4. TRANSACTIONS WITH AFFILIATES
Management fee
Funds Management, an indirect wholly owned subsidiary of Wells Fargo, is the manager of the Fund and provides advisory and fund-level administrative services under an investment management agreement. Under the investment management agreement, Funds Management is responsible for, among other services, implementing the investment objectives and strategies of the Fund, supervising the subadviser, providing fund-level administrative services in connection with the Fund’s operations, and providing any other fund-level administrative services reasonably necessary for the operation of the Fund. As compensation for its services under the investment management agreement, Funds Management is entitled to receive an annual management fee starting at 0.75% and declining to 0.63% as the average daily net assets of the Fund increase. For the year ended September 30, 2016, the management fee was equivalent to an annual rate of 0.70% of the Fund’s average daily net assets.
| | | | | | |
| Notes to financial statements | | Wells Fargo Special Mid Cap Value Fund | | | 25 | |
Funds Management has retained the services of a subadviser to provide daily portfolio management to the Fund. The fee for subadvisory services is borne by Funds Management. WellsCap is the subadviser to the Fund and is entitled to receive a fee from Funds Management at an annual rate starting at 0.45% and declining to 0.30% as the average daily net assets of the Fund increase.
Administration fees
Under a class-level administration agreement, Funds Management provides class-level administrative services to the Fund, which includes paying fees and expenses for services provided by the transfer agent, sub-transfer agents, omnibus account servicers and record-keepers. As compensation for its services under the class-level administration agreement, Funds Management receives an annual fee which is calculated based on the average daily net assets of each class as follows:
| | | | |
| | | Class level
administration fee | |
Class A, Class C, Class R | | | 0.21 | % |
Class R6 | | | 0.03 | |
Administrator Class, Institutional Class | | | 0.13 | |
Investor Class | | | 0.32 | |
Funds Management has contractually waived and/or reimbursed management and administration fees to the extent necessary to maintain certain net operating expense ratios for the Fund. Waiver of fees and/or reimbursement of expenses by Funds Management were made first from fund level expenses on a proportionate basis and then from class specific expenses. Funds Management has committed through January 31, 2017 to waive fees and/or reimburse expenses to the extent necessary to cap the Fund’s expenses at 1.25% for Class A shares, 2.00% for Class C shares, 1.50% for Class R shares, 0.82% for Class R6 shares, 1.14% for Administration Class shares, and 0.87% for Institutional Class shares. After this time, the cap may be increased or the commitment to maintain the cap may be terminated only with the approval of the Board of Trustees.
Distribution fees
The Trust has adopted a Distribution Plan for Class C and Class R shares of the Fund pursuant to Rule 12b-1 under the 1940 Act. Distribution fees are charged to Class C and Class R shares and paid to Wells Fargo Funds Distributor, LLC (“Funds Distributor”), the principal underwriter, at an annual rate of 0.75% of the average daily net assets of Class C shares and 0.25% of the average daily net assets of Class R shares.
In addition, Funds Distributor is entitled to receive the front-end sales charge from the purchase of Class A shares and a contingent deferred sales charge on the redemption of certain shares. Funds Distributor is also entitled to receive the contingent deferred sales charges from redemptions of Class C shares. For the year ended September 30, 2016, Funds Distributor received $90,323 from the sale of Class A shares and $4,864 in contingent deferred sales charges from redemptions of Class C shares.
Shareholder servicing fees
The Trust has entered into contracts with one or more shareholder servicing agents, whereby Class A, Class C, Class R, Administrator Class, and Investor Class of the Fund are charged a fee at an annual rate of 0.25% of the average daily net assets of each respective class.
A portion of these total shareholder servicing fees were paid to affiliates of Wells Fargo.
5. INVESTMENT PORTFOLIO TRANSACTIONS
Purchases and sales of investments, excluding U.S. government obligations (if any) and short-term securities, for the year ended September 30, 2016 were $3,398,584,732 and $962,922,945, respectively.
The Fund may purchase or sell investment securities to other Wells Fargo funds under procedures adopted by the Board of Trustees. The procedures have been designed to ensure that these interfund transactions, which generally do not incur broker commissions, are effected at current market prices. Interfund trades are included within the respective purchases and sales amounts shown.
| | | | |
| 26 | | Wells Fargo Special Mid Cap Value Fund | | Notes to financial statements |
6. BANK BORROWINGS
The Trust (excluding the money market funds and certain other funds) and Wells Fargo Variable Trust are parties to a $250,000,000 revolving credit agreement whereby the Fund is permitted to use bank borrowings for temporary or emergency purposes, such as to fund shareholder redemption requests. Interest under the credit agreement is charged to the Fund based on a borrowing rate equal to the higher of the Federal Funds rate in effect on that day plus 1.25% or the overnight LIBOR rate in effect on that day plus 1.25%. In addition, an annual commitment fee equal to 0.25% of the unused balance is allocated to each participating fund. Prior to August 30, 2016, the revolving credit agreement amount was $200,000,000 and the annual commitment fee was equal to 0.20% of the unused balance which was allocated to each participating fund.
For the year ended September 30, 2016, there were no borrowings by the Fund under the agreement.
7. DISTRIBUTIONS TO SHAREHOLDERS
The tax character of distributions paid during the years ended September 30, 2016 and September 30, 2015 were as follows:
| | | | | | | | |
| | | Year ended September 30 | |
| | | 2016 | | | 2015 | |
Ordinary income | | $ | 30,591,334 | | | $ | 50,726,509 | |
Long-term capital gain | | | 64,015,906 | | | | 77,215,646 | |
As of September 30, 2016, the components of distributable earnings on a tax basis were as follows:
| | | | | | |
Undistributed
ordinary income
| | Undistributed
long-term
gain | | Unrealized
gains | | Capital loss
carryforward |
| $29,219,029 | | $4,967,018 | | $532,697,808 | | $(49,637) |
8. INDEMNIFICATION
Under the Trust’s organizational documents, the officers and Trustees have been granted certain indemnification rights against certain liabilities that may arise out of performance of their duties to the Trust. Additionally, in the normal course of business, the Trust may enter into contracts with service providers that contain a variety of indemnification clauses. The Trust’s maximum exposure under these arrangements is dependent on future claims that may be made against the Fund and, therefore, cannot be estimated.
| | | | | | |
| Report of independent registered public accounting firm | | Wells Fargo Special Mid Cap Value Fund | | | 27 | |
BOARD OF TRUSTEES AND SHAREHOLDERS OF WELLS FARGO FUNDS TRUST:
We have audited the accompanying statement of assets and liabilities, including the portfolio of investments, of the Wells Fargo Special Mid Cap Value Fund (formerly known as Wells Fargo Advantage Special Mid Cap Value Fund) (the “Fund”), one of the funds constituting the Wells Fargo Funds Trust, as of September 30, 2016, and the related statement of operations for the year then ended, the statements of changes in net assets for each of the years in the two-year period then ended, and the financial highlights for each of the years or periods in the five-year period then ended. These financial statements and financial highlights are the responsibility of the Fund’s management. Our responsibility is to express an opinion on these financial statements and financial highlights based on our audits.
We conducted our audits in accordance with the standards of the Public Company Accounting Oversight Board (United States). Those standards require that we plan and perform the audit to obtain reasonable assurance about whether the financial statements and financial highlights are free of material misstatement. An audit includes examining, on a test basis, evidence supporting the amounts and disclosures in the financial statements. Our procedures included confirmation of securities owned as of September 30, 2016, by correspondence with the custodian and brokers, or by other appropriate auditing procedures. An audit also includes assessing the accounting principles used and significant estimates made by management, as well as evaluating the overall financial statement presentation. We believe that our audits provide a reasonable basis for our opinion.
In our opinion, the financial statements and financial highlights referred to above present fairly, in all material respects, the financial position of the Wells Fargo Special Mid Cap Value Fund as of September 30, 2016, the results of its operations for the year then ended, the changes in its net assets for each of the years in the two-year period then ended, and the financial highlights for each of the years or periods in the five-year period then ended, in conformity with U.S. generally accepted accounting principles.

Boston, Massachusetts
November 23, 2016
| | | | |
| 28 | | Wells Fargo Special Mid Cap Value Fund | | Other information (unaudited) |
TAX INFORMATION
For corporate shareholders, pursuant to Section 854 of the Internal Revenue Code, 68.98% of ordinary income dividends qualify for the corporate dividends-received deduction for the fiscal year ended September 30, 2016.
Pursuant to Section 852 of the Internal Revenue Code, $64,015,906 was designated as a 20% rate gain distribution for the fiscal year ended September 30, 2016.
Pursuant to Section 854 of the Internal Revenue Code, $21,671,178 of income dividends paid during the fiscal year ended September 30, 2016 has been designated as qualified dividend income (QDI).
For the fiscal year ended September 30, 2016, $19,988,100 has been designated as short-term capital gain dividends for nonresident alien shareholders pursuant to Section 871 of the Internal Revenue Code.
PROXY VOTING INFORMATION
A description of the policies and procedures that the Fund uses to determine how to vote proxies relating to portfolio securities is available, upon request, by calling 1-800-222-8222, visiting our website at wellsfargofunds.com, or visiting the SEC website at sec.gov. Information regarding how the Fund voted proxies relating to portfolio securities during the most recent 12-month period ended June 30 is available on the Fund’s website at wellsfargofunds.com or by visiting the SEC website at sec.gov.
PORTFOLIO HOLDINGS INFORMATION
The complete portfolio holdings for the Fund are publicly available monthly on the Fund’s website (wellsfargofunds.com), on a one-month delayed basis. In addition, top ten holdings information (excluding derivative positions) for the Fund is publicly available on the Fund’s website on a monthly, seven-day or more delayed basis. The Fund files its complete schedule of portfolio holdings with the SEC for the first and third quarters of each fiscal year on Form N-Q, which is available by visiting the SEC website at sec.gov. In addition, the Fund’s Form N-Q may be reviewed and copied at the SEC’s Public Reference Room in Washington, DC, and at regional offices in New York City, at 233 Broadway, and in Chicago, at 175 West Jackson Boulevard, Suite 900. Information about the Public Reference Room may be obtained by calling 1-800-SEC-0330.
| | | | | | |
| Other information (unaudited) | | Wells Fargo Special Mid Cap Value Fund | | | 29 | |
BOARD OF TRUSTEES AND OFFICERS
Each of the Trustees and Officers1 listed in the table below acts in identical capacities for each fund in the Wells Fargo family of funds, which consists of 138 mutual funds comprising the Wells Fargo Funds Trust, Wells Fargo Variable Trust, Wells Fargo Master Trust and four closed-end funds (collectively the “Fund Complex”). This table should be read in conjunction with the Prospectus and the Statement of Additional Information2. The mailing address of each Trustee and Officer is 525 Market Street, 12th Floor, San Francisco, CA 94105. Each Trustee and Officer serves an indefinite term, however, each Trustee serves such term until reaching the mandatory retirement age established by the Trustees.
Independent Trustees
| | | | | | |
Name and
year of birth | | Position held and
length of service* | | Principal occupations during past five years or longer | | Current other
public company or
investment company
directorships |
| William R. Ebsworth (Born 1957) | | Trustee, since 2015 | | Retired. From 1984 to 2013, equities analyst, portfolio manager, research director and chief financial officer at Fidelity Management and Research Company in Boston, Tokyo, and Hong Kong and retired in 2013 as Chief Investment Officer of Fidelity Strategic Advisers, Inc. where he lead a team of investment professionals managing client assets. Prior thereto, Board member of Hong Kong Securities Clearing Co., Hong Kong Options Clearing Corp., the Thailand International Fund, Ltd., Fidelity Investments Life Insurance Company, and Empire Fidelity Investments Life Insurance Company. Mr. Ebsworth is a CFA® charterholder and an Adjunct Lecturer, Finance, at Babson College. | | Asset Allocation Trust |
| Jane A. Freeman (Born 1953) | | Trustee, since 2015 | | Retired. From 2012 to 2014 and 1999 to 2008, Chief Financial Officer of Scientific Learning Corporation. From 2008 to 2012, Ms. Freeman provided consulting services related to strategic business projects. Prior to 1999, Portfolio Manager at Rockefeller & Co. and Scudder, Stevens & Clark. Board member of the Harding Loevner Funds from 1996 to 2014, serving as both Lead Independent Director and chair of the Audit Committee. Board member of the Russell Exchange Traded Funds Trust from 2011 to 2012 and the chair of the Audit Committee. Ms. Freeman is a Board Member of Ruth Bancroft Garden (non-profit organization) and an inactive chartered financial analyst. | | Asset Allocation Trust |
| Peter G. Gordon (Born 1942) | | Trustee, since 1998; Chairman, since 2005 | | Co-Founder, Retired Chairman, President and CEO of Crystal Geyser Water Company. Trustee Emeritus, Colby College. | | Asset Allocation Trust |
| Isaiah Harris, Jr. (Born 1952) | | Trustee, since 2009 | | Retired. Chairman of the Board of CIGNA Corporation since 2009, and Director since 2005. From 2003 to 2011, Director of Deluxe Corporation. Prior thereto, President and CEO of BellSouth Advertising and Publishing Corp. from 2005 to 2007, President and CEO of BellSouth Enterprises from 2004 to 2005 and President of BellSouth Consumer Services from 2000 to 2003. Emeritus member of the Iowa State University Foundation Board of Governors. Emeritus Member of the Advisory Board of Iowa State University School of Business. Advisory Board Member, Palm Harbor Academy (charter school). Advisory Board Member, Child Evangelism Fellowship (non-profit). Mr. Harris is a certified public accountant (inactive status). | | CIGNA Corporation; Asset Allocation Trust |
| Judith M. Johnson (Born 1949) | | Trustee, since 2008; Audit Committee Chairman, since 2008 | | Retired. Prior thereto, Chief Executive Officer and Chief Investment Officer of Minneapolis Employees Retirement Fund from 1996 to 2008. Ms. Johnson is an attorney, certified public accountant and a certified managerial accountant. | | Asset Allocation Trust |
| David F. Larcker (Born 1950) | | Trustee, since 2009 | | James Irvin Miller Professor of Accounting at the Graduate School of Business, Stanford University, Director of the Corporate Governance Research Initiative and Senior Faculty of The Rock Center for Corporate Governance since 2006. From 2005 to 2008, Professor of Accounting at the Graduate School of Business, Stanford University. Prior thereto, Ernst & Young Professor of Accounting at The Wharton School, University of Pennsylvania from 1985 to 2005. | | Asset Allocation Trust |
| | | | |
| 30 | | Wells Fargo Special Mid Cap Value Fund | | Other information (unaudited) |
| | | | | | |
Name and
year of birth | | Position held and
length of service* | | Principal occupations during past five years or longer | | Current other
public company or
investment company
directorships |
| Olivia S. Mitchell (Born 1953) | | Trustee, since 2006 | | International Foundation of Employee Benefit Plans Professor, Wharton School of the University of Pennsylvania since 1993. Director of Wharton’s Pension Research Council and Boettner Center on Pensions & Retirement Research, and Research Associate at the National Bureau of Economic Research. Previously, Cornell University Professor from 1978 to 1993. | | Asset Allocation Trust |
| Timothy J. Penny (Born 1951) | | Trustee, since 1996 | | President and Chief Executive Officer of Southern Minnesota Initiative Foundation, a non-profit organization, since 2007 and Senior Fellow at the Humphrey Institute Policy Forum at the University of Minnesota since 1995. Member of the Board of Trustees of NorthStar Education Finance, Inc., a non-profit organization, since 2007. | | Asset Allocation Trust |
| Michael S. Scofield (Born 1943) | | Trustee, since 2010 | | Served on the Investment Company Institute’s Board of Governors and Executive Committee from 2008-2011 as well the Governing Council of the Independent Directors Council from 2006-2011 and the Independent Directors Council Executive Committee from 2008-2011. Chairman of the IDC from 2008-2010. Institutional Investor (Fund Directions) Trustee of Year in 2007. Trustee of the Evergreen Funds complex (and its predecessors) from 1984 to 2010. Chairman of the Evergreen Funds from 2000-2010. Former Trustee of the Mentor Funds. Retired Attorney, Law Offices of Michael S. Scofield. | | Asset Allocation Trust |
| * | Length of service dates reflect the Trustee’s commencement of service with the Trust’s predecessor entities, where applicable. |
Officers
| | | | | | |
Name and year of birth | | Position held and length of service | | Principal occupations during past five years or longer | | |
| Karla M. Rabusch (Born 1959) | | President, since 2003 | | Executive Vice President of Wells Fargo Bank, N.A. and President of Wells Fargo Funds Management, LLC since 2003. | | |
| Nancy Wiser1 (Born 1967) | | Treasurer, since 2012 | | Executive Vice President of Wells Fargo Funds Management, LLC since 2011. Chief Operating Officer and Chief Compliance Officer at LightBox Capital Management LLC, from 2008 to 2011. | | |
| C. David Messman (Born 1960) | | Secretary, since 2000; Chief Legal Officer, since 2003 | | Senior Vice President and Secretary of Wells Fargo Funds Management, LLC since 2001. Assistant General Counsel of Wells Fargo Bank, N.A. since 2013 and Vice President and Managing Counsel of Wells Fargo Bank, N.A. from 1996 to 2013. | | |
| Michael Whitaker (Born 1967) | | Chief Compliance Officer, since 20163 | | Executive Vice President of Wells Fargo Funds Management, LLC since 2016. Chief Compliance Officer of Fidelity’s Fixed Income Funds and Asset Allocation Funds from 2008 to 2016, Compliance Officer of FMR Co., Inc. from 2014 to 2016, Fidelity Investments Money Management, Inc. from 2014 to 2016, Fidelity Investments from 2007 to 2016. | | |
| David Berardi (Born 1975) | | Assistant Treasurer, since 2009 | | Vice President of Wells Fargo Funds Management, LLC since 2009. Vice President of Evergreen Investment Management Company, LLC from 2008 to 2010. Manager of Fund Reporting and Control for Evergreen Investment Management Company, LLC from 2004 to 2010. | | |
| Jeremy DePalma1 (Born 1974) | | Assistant Treasurer, since 2009 | | Senior Vice President of Wells Fargo Funds Management, LLC since 2009. Senior Vice President of Evergreen Investment Management Company, LLC from 2008 to 2010 and head of the Fund Reporting and Control Team within Fund Administration from 2005 to 2010. | | |
| 1 | Nancy Wiser acts as Treasurer of 70 funds in the Fund Complex. Jeremy DePalma acts as Treasurer of 68 funds and Assistant Treasurer of 70 funds in the Fund Complex. |
| 2 | The Statement of Additional Information includes additional information about the Trustees and is available, without charge, upon request, by calling 1-800-222-8222 or by visiting the website at wellsfargofunds.com. |
| 3 | Michael Whitaker became Chief Compliance Officer effective May 16, 2016. |
| | | | | | |
| Other information (unaudited) | | Wells Fargo Special Mid Cap Value Fund | | | 31 | |
BOARD CONSIDERATION OF INVESTMENT MANAGEMENT AND SUB-ADVISORY AGREEMENTS:
Under the Investment Company Act of 1940 (the “1940 Act”), the Board of Trustees (the “Board”) of Wells Fargo Funds Trust (the “Trust”) must determine annually whether to approve the continuation of the Trust’s investment management and sub-advisory agreements. In this regard, at an in-person meeting held on May 24-25, 2016 (the “Meeting”), the Board, all the members of which have no direct or indirect interest in the investment management and sub-advisory agreements and are not “interested persons” of the Trust, as defined in the 1940 Act (the “Independent Trustees”), reviewed and approved for Wells Fargo Special Mid Cap Value Fund (the “Fund”): (i) an investment management agreement (the “Management Agreement”) with Wells Fargo Funds Management, LLC (“Funds Management”); and (ii) an investment sub-advisory agreement (the “Sub-Advisory Agreement”) with Wells Capital Management Incorporated (the “Sub-Adviser”), an affiliate of Funds Management. The Management Agreement and the Sub-Advisory Agreement are collectively referred to as the “Advisory Agreements.”
At the Meeting, the Board considered the factors and reached the conclusions described below relating to the selection of Funds Management and the Sub-Adviser and the approval of the Advisory Agreements. Prior to the Meeting, including at an in-person meeting in April 2016, the Trustees conferred extensively among themselves and with representatives of Funds Management about these matters. Also, the Board has adopted a team-based approach, with each team consisting of a sub-set of Trustees, to assist the full Board in the discharge of its duties in reviewing performance and other matters throughout the year. The Independent Trustees were assisted in their evaluation of the Advisory Agreements by independent legal counsel, from whom they received separate legal advice and with whom they met separately.
In providing information to the Board, Funds Management and the Sub-Adviser were guided by a detailed set of requests for information submitted to them by independent legal counsel on behalf of the Independent Trustees at the start of the Board’s annual contract renewal process earlier in 2016. In considering and approving the Advisory Agreements, the Trustees considered the information they believed relevant, including but not limited to the information discussed below. The Board considered not only the specific information presented in connection with the Meeting, but also the knowledge gained over time through interaction with Funds Management and the Sub-Adviser about various topics. In this regard, the Board reviewed reports of Funds Management at each of its quarterly meetings, which included, among other things, portfolio reviews and performance reports. In addition, the Board and the teams mentioned above confer with portfolio managers at various times throughout the year. The Board did not identify any particular information or consideration that was all-important or controlling, and each individual Trustee may have attributed different weights to various factors.
After its deliberations, the Board unanimously approved the continuation of the Advisory Agreements for a one-year term and determined that the compensation payable to Funds Management and the Sub-Adviser under each of the Advisory Agreements was reasonable. The Board considered the approval of the Advisory Agreements for the Fund as part of its consideration of agreements for funds across the complex, but its approvals were made on a fund-by-fund basis. The following summarizes a number of important, but not necessarily all, factors considered by the Board in support of its approvals.
Nature, extent and quality of services
The Board received and considered various information regarding the nature, extent and quality of services provided to the Fund by Funds Management and the Sub-Adviser under the Advisory Agreements. This information included a description of the investment advisory services and Fund-level administrative services covered by the Management Agreement, as well as, among other things, a summary of the background and experience of senior management of Funds Management, and the qualifications, background, tenure and responsibilities of each of the portfolio managers primarily responsible for the day-to-day portfolio management of the Fund.
The Board evaluated the ability of Funds Management and the Sub-Adviser to attract and retain qualified investment professionals, including research, advisory and supervisory personnel. The Board further considered the compliance programs and compliance records of Funds Management and the Sub-Adviser. In addition, the Board took into account the full range of services provided to the Fund by Funds Management and its affiliates.
Fund performance and expenses
The Board considered the performance results for the Fund over various time periods ended December 31, 2015. The Board considered these results in comparison to the performance of funds in a universe that was determined by Broadridge Inc. (“Broadridge”) to be similar to the Fund (the “Universe”), and in comparison to the Fund’s benchmark index and to other comparative data. Broadridge is an independent provider of investment company data. The Board received a description of the methodology used by Broadridge to select the mutual funds in the performance Universe.
| | | | |
| 32 | | Wells Fargo Special Mid Cap Value Fund | | Other information (unaudited) |
The Board noted that the performance of the Fund (Administrator Class) was higher than the average performance of the Universe for all periods under review. The Board also noted that the performance of the Fund was higher than its benchmark, the Russell Midcap® Value Index, for all periods under review except the one-year period.
The Board also received and considered information regarding the Fund’s net operating expense ratios and their various components, including actual management fees, custodian and other non-management fees, and Rule 12b-1 and non-Rule 12b-1 shareholder service fees. The Board considered these ratios in comparison to the median ratios of funds in class-specific expense groups that were determined by Broadridge to be similar to the Fund (the “Groups”). The Board received a description of the methodology used by Broadridge to select the mutual funds in the expense Groups and an explanation of how funds comprising expense groups and their expense ratios may vary from year-to-year. Based on the Broadridge reports, the Board noted that the net operating expense ratios of the Fund were equal to or lower than the median net operating expense ratios of the expense Groups. The Board discussed and accepted Funds Management’s proposal to reduce the net operating expense ratio caps for the Class A, Class C, Class R and Class R6.
The Board took into account the Fund performance and expense information provided to it among the factors considered in deciding to re-approve the Advisory Agreements.
Investment management and sub-advisory fee rates
The Board reviewed and considered the contractual fee rates payable by the Fund to Funds Management under the Management Agreement, as well as the contractual fee rates payable by the Fund to Funds Management for class-level administrative services under a Class-Level Administration Agreement, which include class-level transfer agency and sub-transfer agency costs (collectively, the “Management Rates”). The Board also reviewed and considered the contractual investment sub-advisory fee rates that are payable by Funds Management to the Sub-Adviser for investment sub-advisory services.
Among other information reviewed by the Board was a comparison of the Fund’s Management Rates with the average contractual investment management fee rates of funds in the expense Groups at a common asset level as well as transfer agency costs of the funds in the expense Groups. The Board noted that the Management Rates of the Fund were lower than or in range of the sum of these average rates for the Fund’s expense Groups for all share classes except Class R. The Board noted that the net operating expense ratios of the Fund were equal to or lower than the median net operating expense ratios of the expense Groups, including Class R.
The Board also received and considered information about the portion of the total management fee that was retained by Funds Management after payment of the fee to the Sub-Adviser for sub-advisory services. In assessing the reasonableness of this amount, the Board received and evaluated information about the nature and extent of responsibilities retained and risks assumed by Funds Management and not delegated to or assumed by the Sub-Adviser, and about Funds Management’s on-going oversight services. However, given the affiliation between Funds Management and the Sub-Adviser, the Board ascribed limited relevance to the allocation of fees between them.
The Board also received and considered information about the nature and extent of services offered and fee rates charged by Funds Management and the Sub-Adviser to other types of clients with investment strategies similar to those of the Fund. In this regard, the Board received information about the significantly greater scope of services, and compliance, reporting and other legal burdens and risks of managing mutual funds compared with those associated with managing assets of non-mutual fund clients such as collective funds or institutional separate accounts.
Based on its consideration of the factors and information it deemed relevant, including those described here, the Board determined that the compensation payable to Funds Management under the Management Agreement and to the Sub-Adviser under the Sub-Advisory Agreement was reasonable, in light of the services covered by the Advisory Agreements.
Profitability
The Board received and considered information concerning the profitability of Funds Management, as well as the profitability of Wells Fargo as a whole, from providing services to the Fund and the fund family as a whole. The Board also received and considered information concerning the profitability of the Sub-Adviser from providing services to the fund family as a whole, noting that the Sub-Adviser’s profitability information with respect to providing services to the Fund was subsumed in the Wells Fargo and Funds Management profitability analysis.
Funds Management reported on the methodologies and estimates used in calculating profitability. Among other things, the Board noted that the levels of profitability reported on a fund-by-fund basis varied widely, depending on factors such
| | | | | | |
| Other information (unaudited) | | Wells Fargo Special Mid Cap Value Fund | | | 33 | |
as the size and type of fund. Based on its review, the Board did not deem the profits reported by Funds Management or Wells Fargo from its services to the Fund to be at a level that would prevent it from approving the continuation of the Advisory Agreements.
Economies of scale
With respect to possible economies of scale, the Board noted the existence of breakpoints in the Fund’s management fee structure, which operate generally to reduce the Fund’s expense ratios as the Fund grows in size. It considered that, for a small fund or a fund that shrinks in size, breakpoints conversely can result in higher fee levels. The Board also considered that fee waiver and expense reimbursement arrangements and competitive fee rates at the outset are means of sharing potential economies of scale with shareholders of the Fund and the fund family as a whole. The Board discussed and accepted Funds Management’s proposal to reduce the net operating expense ratio caps for the Class A, Class C, Class R and Class R6. The Board considered Funds Management’s view that any analyses of potential economies of scale in managing a particular fund are inherently limited in light of the joint and common costs and investments that Funds Management incurs across the fund family as a whole.
The Board concluded that the Fund’s fee and expense arrangements, including contractual breakpoints, constituted a reasonable approach to sharing potential economies of scale with the Fund and its shareholders.
Other benefits to Funds Management and the Sub-Adviser
The Board received and considered information regarding potential “fall-out” or ancillary benefits received by Funds Management and its affiliates, including the Sub-Adviser, as a result of their relationships with the Fund. Ancillary benefits could include, among others, benefits directly attributable to other relationships with the Fund and benefits potentially derived from an increase in Funds Management’s and the Sub-Adviser’s business as a result of their relationships with the Fund. The Board noted that various affiliates of Funds Management may receive distribution-related fees, shareholder servicing payments and sub-transfer agency fees in respect of shares sold or held through them and services provided.
The Board also reviewed information about soft dollar credits earned and utilized by the Sub-Adviser, fees earned by Funds Management and the Sub-Adviser from managing a private investment vehicle for the fund family’s securities lending collateral and commissions earned by an affiliated broker from portfolio transactions.
Based on its consideration of the factors and information it deemed relevant, including those described here, the Board did not find that any ancillary benefits received by Funds Management and its affiliates, including the Sub-Adviser, were unreasonable.
Conclusion
At the Meeting, after considering the above-described factors and based on its deliberations and its evaluation of the information described above, the Board unanimously approved the continuation of the Advisory Agreements for a one-year term and determined that the compensation payable to Funds Management and the Sub-Adviser under each of the Advisory Agreements was reasonable.
| | | | |
| 34 | | Wells Fargo Special Mid Cap Value Fund | | List of abbreviations |
The following is a list of common abbreviations for terms and entities that may have appeared in this report.
| ACA | — ACA Financial Guaranty Corporation |
| ADR | — American depositary receipt |
| ADS | — American depositary shares |
| AGC | — Assured Guaranty Corporation |
| AGM | — Assured Guaranty Municipal |
| Ambac | — Ambac Financial Group Incorporated |
| AMT | — Alternative minimum tax |
| BAN | — Bond anticipation notes |
| BHAC | — Berkshire Hathaway Assurance Corporation |
| CAB | — Capital appreciation bond |
| CCAB | — Convertible capital appreciation bond |
| CDA | — Community Development Authority |
| CDO | — Collateralized debt obligation |
| DRIVER | — Derivative inverse tax-exempt receipts |
| DW&P | — Department of Water & Power |
| DWR | — Department of Water Resources |
| ECFA | — Educational & Cultural Facilities Authority |
| EDA | — Economic Development Authority |
| EDFA | — Economic Development Finance Authority |
| ETF | — Exchange-traded fund |
| FDIC | — Federal Deposit Insurance Corporation |
| FFCB | — Federal Farm Credit Banks |
| FGIC | — Financial Guaranty Insurance Corporation |
| FHA | — Federal Housing Administration |
| FHLB | — Federal Home Loan Bank |
| FHLMC | — Federal Home Loan Mortgage Corporation |
| FICO | — The Financing Corporation |
| FNMA | — Federal National Mortgage Association |
| GDR | — Global depositary receipt |
| GNMA | — Government National Mortgage Association |
| HCFR | — Healthcare facilities revenue |
| HEFA | — Health & Educational Facilities Authority |
| HEFAR | — Higher education facilities authority revenue |
| HFA | — Housing Finance Authority |
| HFFA | — Health Facilities Financing Authority |
| HUD | — Department of Housing and Urban Development |
| IDA | — Industrial Development Authority |
| IDAG | — Industrial Development Agency |
| KRW | — Republic of Korea won |
| LIBOR | — London Interbank Offered Rate |
| LIFER | — Long Inverse Floating Exempt Receipts |
| LLC | — Limited liability company |
| LLLP | — Limited liability limited partnership |
| LLP | — Limited liability partnership |
| MBIA | — Municipal Bond Insurance Association |
| MFHR | — Multifamily housing revenue |
| MSTR | — Municipal securities trust receipts |
| MUD | — Municipal Utility District |
| National | — National Public Finance Guarantee Corporation |
| PCFA | — Pollution Control Financing Authority |
| PCL | — Public Company Limited |
| PCR | — Pollution control revenue |
| PFA | — Public Finance Authority |
| PFFA | — Public Facilities Financing Authority |
| PFOTER | — Puttable floating option tax-exempt receipts |
| plc | — Public limited company |
| PUTTER | — Puttable tax-exempt receipts |
| R&D | — Research & development |
| Radian | — Radian Asset Assurance |
| RAN | — Revenue anticipation notes |
| RDA | — Redevelopment Authority |
| RDFA | — Redevelopment Finance Authority |
| REIT | — Real estate investment trust |
| ROC | — Reset option certificates |
| SAVRS | — Select auction variable rate securities |
| SBA | — Small Business Authority |
| SDR | — Swedish depositary receipt |
| SFHR | — Single-family housing revenue |
| SFMR | — Single-family mortgage revenue |
| SPA | — Standby purchase agreement |
| SPDR | — Standard & Poor’s Depositary Receipts |
| SPEAR | — Short Puttable Exempt Adjustable Receipts |
| STRIPS | — Separate trading of registered interest and |
| TAN | — Tax anticipation notes |
| TIPS | — Treasury inflation-protected securities |
| TRAN | — Tax revenue anticipation notes |
| TTFA | — Transportation Trust Fund Authority |
| TVA | — Tennessee Valley Authority |
This page is intentionally left blank.
This page is intentionally left blank.

For more information
More information about Wells Fargo Funds is available free upon request. To obtain literature, please write, email, visit the Fund’s website, or call:
Wells Fargo Funds
P.O. Box 8266
Boston, MA 02266-8266
Email: fundservice@wellsfargo.com
Website: wellsfargofunds.com
Individual investors: 1-800-222-8222
Retail investment professionals: 1-888-877-9275
Institutional investment professionals: 1-866-765-0778
This report and the financial statements contained herein are submitted for the general information of the shareholders of the Fund. If this report is used for promotional purposes, distribution of the report must be accompanied or preceded by a current prospectus. Before investing, please consider the investment objectives, risks, charges, and expenses of the investment. For a current prospectus and, if available, a summary prospectus, containing this information, call 1-800-222-8222 or visit the Fund’s website at wellsfargofunds.com. Read the prospectus carefully before you invest or send money.
Wells Fargo Asset Management (WFAM) is a trade name used by the asset management businesses of Wells Fargo & Company. Wells Fargo Funds Management, LLC, a wholly owned subsidiary of Wells Fargo & Company, provides investment advisory and administrative services for Wells Fargo Funds. Other affiliates of Wells Fargo & Company provide subadvisory and other services for the funds. The funds are distributed by Wells Fargo Funds Distributor, LLC, Member FINRA, an affiliate of Wells Fargo & Company. Neither Wells Fargo Funds Management nor Wells Fargo Funds Distributor has Fund customer accounts/assets, and neither provides investment advice/recommendations or acts as an investment advice fiduciary to any investor.
NOT FDIC INSURED ¡ NO BANK GUARANTEE ¡ MAY LOSE VALUE
© 2016 Wells Fargo Funds Management, LLC. All rights reserved.
| | |
 | | 246397 11-16 A234/AR234 09-16 |
ITEM 2. CODE OF ETHICS
(a) As of the end of the period covered by the report, Wells Fargo Funds Trust has adopted a code of ethics that applies to its President and Treasurer. A copy of the code of ethics is filed as an exhibit to this Form N-CSR.
(c) During the period covered by this report, there were no amendments to the provisions of the code of ethics adopted in Item 2(a) above.
(d) During the period covered by this report, there were no implicit or explicit waivers to the provisions of the code of ethics adopted in Item 2(a) above.
ITEM 3. AUDIT COMMITTEE FINANCIAL EXPERT
The Board of Trustees of Wells Fargo Funds Trust has determined that Judith Johnson is an audit committee financial expert, as defined in Item 3 of Form N-CSR. Mrs. Johnson is independent for purposes of Item 3 of Form N-CSR.
ITEM 4. PRINCIPAL ACCOUNTANT FEES AND SERVICES
(a), (b), (c), (d) The following table presents aggregate fees billed in each of the last two fiscal years for services rendered to the Registrant by the Registrant’s principal accountant. These fees were billed to the registrant and were approved by the Registrant’s audit committee.
| | | | | | | | |
| | | Fiscal year
ended
September 30,
2016 | | | Fiscal year
ended
September 30,
2015 | |
Audit fees | | $ | 344,493 | | | $ | 270,080 | (2) |
Audit-related fees | | | — | | | | — | |
Tax fees (1) | | | 45,130 | | | | 36,770 | (3) |
All other fees | | | — | | | | — | |
| | | | | | | | |
| | $ | 389,623 | | | $ | 306,850 | |
| | | | | | | | |
| (1) | Tax fees consist of fees for tax compliance, tax advice, tax planning and excise tax. |
| (2) | Amount includes $71,270 related to prior fiscal year ended October 31, 2015 for Wells Fargo International Bond Fund and Wells Fargo Strategic Income Fund. |
| (3) | Amount includes $8,560 related to prior fiscal year ended October 31, 2015 for Wells Fargo International Bond Fund and Wells Fargo Strategic Income Fund. |
(e) The Chairman of the Audit Committees is authorized to pre-approve: (1) audit services for the mutual funds of Wells Fargo Funds Trust; (2) non-audit tax or compliance consulting or training services provided to the Funds by the independent auditors (“Auditors”) if the fees for any particular engagement are not anticipated to exceed $50,000; and (3) non-audit tax or compliance consulting or training services provided by the Auditors to a Fund’s investment adviser and its controlling entities (where pre-approval is required because the engagement relates directly to the operations and financial reporting of the Fund) if the fee to the Auditors for any particular engagement is not anticipated to exceed $50,000. For any such pre-approval sought from the Chairman, Management shall prepare a brief description of the proposed services. If the Chairman approves of such service, he or she shall sign the statement prepared by Management. Such written statement shall be presented to the full Committees at their next regularly scheduled meetings.
(f) Not applicable
(g) Not applicable
(h) Not applicable
ITEM 5. AUDIT COMMITTEE OF LISTED REGISTRANTS
Not applicable.
ITEM 6. INVESTMENTS
A Portfolio of Investments for each series of Wells Fargo Funds Trust is included as part of the report to shareholders filed under Item 1 of this Form.
ITEM 7. DISCLOSURE OF PROXY VOTING POLICIES AND PROCEDURES FOR CLOSED-END MANAGEMENT INVESTMENT COMPANIES
Not applicable.
ITEM 8. PORTFOLIO MANAGERS OF CLOSED-END MANAGEMENT INVESTMENT COMPANIES
Not applicable.
ITEM 9. PURCHASES OF EQUITY SECURITIES BY CLOSED-END MANAGEMENT INVESTMENT COMPANY AND AFFILIATED PURCHASERS
Not applicable.
ITEM 10. SUBMISSION OF MATTERS TO A VOTE OF SECURITY HOLDERS
There have been no material changes to the procedures by which shareholders may recommend nominees to the registrant’s Board of Trustees that have been implemented since the registrant’s last provided disclosure in response to the requirements of this Item.
ITEM 11. CONTROLS AND PROCEDURES
(a) The President and Treasurer have concluded that the Wells Fargo Funds Trust (the “Trust”) disclosure controls and procedures (as defined in Rule 30a-3(c) under the Investment Company Act of 1940) provide reasonable assurances that material information relating to the Trust is made known to them by the appropriate persons based on their evaluation of these controls and procedures as of a date within 90 days of the filing of this report.
(b) There were no significant changes in the Trust’s internal controls over financial reporting (as defined in Rule 30a-3(d) under the Investment Company Act of 1940) that occurred during the second fiscal quarter of the period covered by this report that materially affected, or is reasonably likely to materially affect, the registrant’s internal control over financial reporting.
ITEM 12. EXHIBITS
(a)(1) Code of Ethics pursuant to Item 2 of Form N-CSR is filed and attached hereto as Exhibit COE.
(a)(2) Certification pursuant to Rule 30a-2(a) under the Investment Company Act of 1940 (17 CFR 270.30a-2(a)) is filed and attached hereto as Exhibit 99.CERT.
(a)(3) Not applicable.
(b) Certification pursuant to Rule 30a-2(b) under the Investment Company Act of 1940 (17 CFR 270.30a-2(b)) is filed and attached hereto as Exhibit 99.906CERT.
SIGNATURES
Pursuant to the requirements of the Securities Exchange Act of 1934 and the Investment Company Act of 1940, the registrant has duly caused this report to be signed on its behalf by the undersigned, thereunto duly authorized.
| | |
| Wells Fargo Funds Trust |
| |
| By: | | /s/ Karla M. Rabusch |
| |
| | Karla M. Rabusch |
| | President |
| |
| Date: | | November 23, 2016 |
Pursuant to the requirements of the Securities Exchange Act of 1934 and the Investment Company Act of 1940, this report has been signed below by the following persons on behalf of the registrant and in the capacities and on the date indicated.
| | |
| Wells Fargo Funds Trust |
| |
| By: | | /s/ Karla M. Rabusch |
| |
| | Karla M. Rabusch |
| | President |
| |
| Date: | | November 23, 2016 |
| |
| By: | | /s/ Nancy Wiser |
| |
| | Nancy Wiser |
| | Treasurer |
| |
| Date: | | November 23, 2016 |
| |
| By: | | /s/ Jeremy DePalma |
| |
| | Jeremy DePalma |
| | Treasurer |
| |
| Date: | | November 23, 2016 |